Crime in a planned city: The case of Brasília
15
1 Crime in a planned city: the case of Brasília João Ricardo Faria MPA Program, University of Texas at El Paso, USA Laudo M. Ogura Economics Department, Grand Valley State University, USA Adolfo Sachsida IPEA - Instituto de Pesquisa Econômica Aplicada, Brasília, Brazil Working paper version: there might still be typos and incorrect references. Published version contain additional material (http://dx.doi.org/10.1016/j.cities.2013.03.002). Abstract: Brasília, the capital of Brazil, offers an interesting ground to study crime factors. The central area (Plano Piloto) is characterized by greater concentration of economic activities and stricter planning, which leads to lower population density and higher income than most places in the periphery. Using an econometric model to analyze two years of crime data for 27 divisions of the Brasília region, we find that higher overall crime rates in the Plano Piloto are related to the concentration of commercial activities, vertical housing, lower density and greater population size, while lower burglary rates reflect the predominance of vertical housing. Keywords: Crime; Land zoning; Planning. JEL Codes: R52; K42 2 Crime in a planned city: the case of Brasília Introduction Brasília was a central planner dream, a Cartesian city with iron-clad zoning built to be the new capital of Brazil. The core of Brasília is the Plano Piloto (Pilot Plan), conceptualized by two architects influenced by the modernism of Le Corbusier: Lúcio Costa, responsible for the urban plan, and Oscar Niemeyer, responsible for building designs. The Plano Piloto was designed to be a complete city, with workplaces and housing located within its area. It is a peculiar urban place, characterized by 1) a strict code of use that restricts land functions, separating housing from other activities; 2) large superblocks, with straight streets with few corners; 3) high-rise apartment buildings located in residential superblocks, with homogeneous height, built around the same time (mostly from 1960 to 1980) and sharing a reinforced concrete style; and 4) a population that is also homogeneous, mostly middle class service workers with similar educational background and income, distributed uniformly in moderately dense residential zones. By contrast, places in the periphery developed in a much more spontaneous way, often through squatter settlements, with flexible zoning (frequently ignored), mixed land use and a more diverse population in terms of income, human capital, race and regional origins. As a result, households in the periphery earn on average less than half of the income of residents in the Plano Piloto (there are few places with high income residents in the periphery). On the other hand, population density is higher in the periphery, which is the opposite pattern compared to other large urban areas in the world.
-
Upload
independent -
Category
Documents
-
view
0 -
download
0
Transcript of Crime in a planned city: The case of Brasília

1
Crime in a planned city: the case of Brasília
João Ricardo Faria
MPA Program, University of Texas at El Paso, USA
Laudo M. Ogura
Economics Department, Grand Valley State University, USA
Adolfo Sachsida
IPEA - Instituto de Pesquisa Econômica Aplicada, Brasília, Brazil
Working paper version: there might still be typos and incorrect references. Published version contain additional material (http://dx.doi.org/10.1016/j.cities.2013.03.002).
Abstract: Brasília, the capital of Brazil, offers an interesting ground to study crime factors. The
central area (Plano Piloto) is characterized by greater concentration of economic activities and
stricter planning, which leads to lower population density and higher income than most places in
the periphery. Using an econometric model to analyze two years of crime data for 27 divisions of
the Brasília region, we find that higher overall crime rates in the Plano Piloto are related to the
concentration of commercial activities, vertical housing, lower density and greater population
size, while lower burglary rates reflect the predominance of vertical housing.
Keywords: Crime; Land zoning; Planning.
JEL Codes: R52; K42
2
Crime in a planned city: the case of Brasília
Introduction
Brasília was a central planner dream, a Cartesian city with iron-clad zoning built to be the
new capital of Brazil. The core of Brasília is the Plano Piloto (Pilot Plan), conceptualized by two
architects influenced by the modernism of Le Corbusier: Lúcio Costa, responsible for the urban
plan, and Oscar Niemeyer, responsible for building designs. The Plano Piloto was designed to be
a complete city, with workplaces and housing located within its area. It is a peculiar urban place,
characterized by 1) a strict code of use that restricts land functions, separating housing from
other activities; 2) large superblocks, with straight streets with few corners; 3) high-rise
apartment buildings located in residential superblocks, with homogeneous height, built around
the same time (mostly from 1960 to 1980) and sharing a reinforced concrete style; and 4) a
population that is also homogeneous, mostly middle class service workers with similar
educational background and income, distributed uniformly in moderately dense residential zones.
By contrast, places in the periphery developed in a much more spontaneous way, often through
squatter settlements, with flexible zoning (frequently ignored), mixed land use and a more
diverse population in terms of income, human capital, race and regional origins. As a result,
households in the periphery earn on average less than half of the income of residents in the Plano
Piloto (there are few places with high income residents in the periphery). On the other hand,
population density is higher in the periphery, which is the opposite pattern compared to other
large urban areas in the world.

3
Most studies find that crime rates are highly correlated to socio-economic, demographic
and/or policy variables, e.g., income, education, unemployment, family structure, race, age,
police effort and/or prison population (Fajnzylber et al., 2000, presented a cross-country study
based on these factors; Levitt, 2004, discussed the role of such factors in the 1990s U.S. crime
decline). Spatial variables (e.g., density and proximity to travel paths, retail stores and transit
stops) have also been studied as crime factors based on how potential criminals and other people
interact. Among others, the literature on spatial factors includes works by Jacobs (1961),
Newman (1972), Brantingham and Brantingham (1981), Wilson and Kelling (1982), Kelling and
Coles (1986) and Zelinka and Brennan (2001). Recent empirical studies include Hillier (2004),
Ackerman and Murray (2004), Ceccato and Oberwittler (2008) and Bernasco and Block (2011).
The peculiar features of the Plano Piloto make Brasília an interesting ground to study crime
determinants, especially factors related to the use of space. In fact, the Plano Piloto’s
characteristics are the opposite of Jacobs’ (1961) indispensable conditions for urban diversity,
liveliness and vitality (the conditions are mixed land use, small blocks, diversity of buildings and
high density). According to Jacobs, urban buoyancy is the crucial determinant of neighborhood
safety because it increases the number of eyes on streets (see also Palen, 2005, and Thomas and
Grigsby III, 2008). One application of this view is the livable communities project (Meck, 1997),
which advocates walkable neighborhoods (see also Daniere, 2000). The SafeScape community
design program (Zelinka and Brennan, 2001) is another variation of this approach, based on the
principle of seeing and being seen,1 advocating high-density mixed land use along common areas
1 This principle advocates intervisibility and enhanced surveillance opportunities, which can be achieved by more permeable layouts and housing types that are supported by studies on mapping and monitoring of pedestrian movement (Hillier and Shu, 1999; Hillier and Shu, 2000).
4
like parks and community centers.2 In contrast, Newman’s (1972) Defensible Space advocates
closed and impermeable environments that better allow residents to recognize intruders and
challenge them.3 This view is consistent with a patchwork of inward-looking defensible enclaves,
such as modern American suburbia. In crowded travel paths, the absence of capable guardians
offers favorable conditions for criminal activities (Brantingham and Brantingham, 1981).
In short, density and mixed land use can help prevent crime because they increase the
number of eyes on streets, but on the other hand they reduce private control of space. In our
paper, we present a study of crime in the Brasília area motivated by anecdotal perception that the
richer residents in the homogeneous and less dense Plano Piloto enjoy greater safety than
residents in the heterogeneous periphery. While this perception is supported by burglary rate data
and the negative correlation between crime and income (to be presented later), overall crime
rates in the Plano Piloto are actually higher. These differences in crime rates seem to be related
to some of the characteristics of the Plano Piloto, like the concentration of commercial activities,
predominance of vertical housing, lower density and greater population size. Regression results
indicate that these features are associated with higher overall crime rates. However, vertical
housing lessens burglary rates, which explain why they are lower in the Plano Piloto.
The relationship between the development patterns of cities and crime rates in Brazil has
been discussed by a few scholars. Among others, Caldeira (2000) studied the dynamics and
interrelations between crime, urban violence, gated communities, segregation and the
development of the city of Sao Paulo. Coy and Pöhler (2002) analyzed the development of gated
2 Town and O’Toole (2005) remind us that Jacobs (1961) was not referring to suburban settings, only to certain American central cities. Aware of that, we consider Jacobs’ views as only one of the possible explanations for crime in Brasília, where densities are comparable to those in many American central areas. 3 Newman is one of the prominent authors in the literature on Crime Prevention Through Environmental Design (CPTED), which studies spatial design features that help preventing crime (see Crowe, 2000, and Cozens et al., 2005, for literature reviews).

5
communities in Sao Paulo and Rio de Janeiro as a response to high crime rates. Souza (1996)
extended his study on the impact of drug trafficking on the development of poor communities in
the periphery of major Brazilian cities. In our paper, we study how the planned nature of the
Plano Piloto created differences in the use of space relative to the periphery and how crime rates
respond to these differences.
The remainder of this paper is structured as follows. In the next section, we present an
overview of Brasília’s history, geography, society and politics to explain the origins of the
differences between the Plano Piloto and the periphery. The following section describes the data
used in the empirical analysis. The last two sections present results and conclusions, respectively.
Brasília: History, Urban Design, Geography, Politics, Society and Economy
The core of Brasília was built in three years, from the approval of Lucio Costa’s city plan in
early 1957 to its inauguration in April 21st, 1960. The rapid pace of construction was a result of
political constraints: since President Juscelino Kubitschek could not run for reelection, the new
capital had to be inaugurated before the end of his five-year term. It represented a huge political
capital for Kubitschek (Kubitschek, 1975), who intended to run for president again in the future.
In fact, the construction of Brasília had widely popular appeal (Santos, 1964, p.398). The urban
plan, the Plano Piloto, is often considered to resemble the shape of an airplane, where
employment is concentrated in the body of the plane and housing is placed in the wings (see
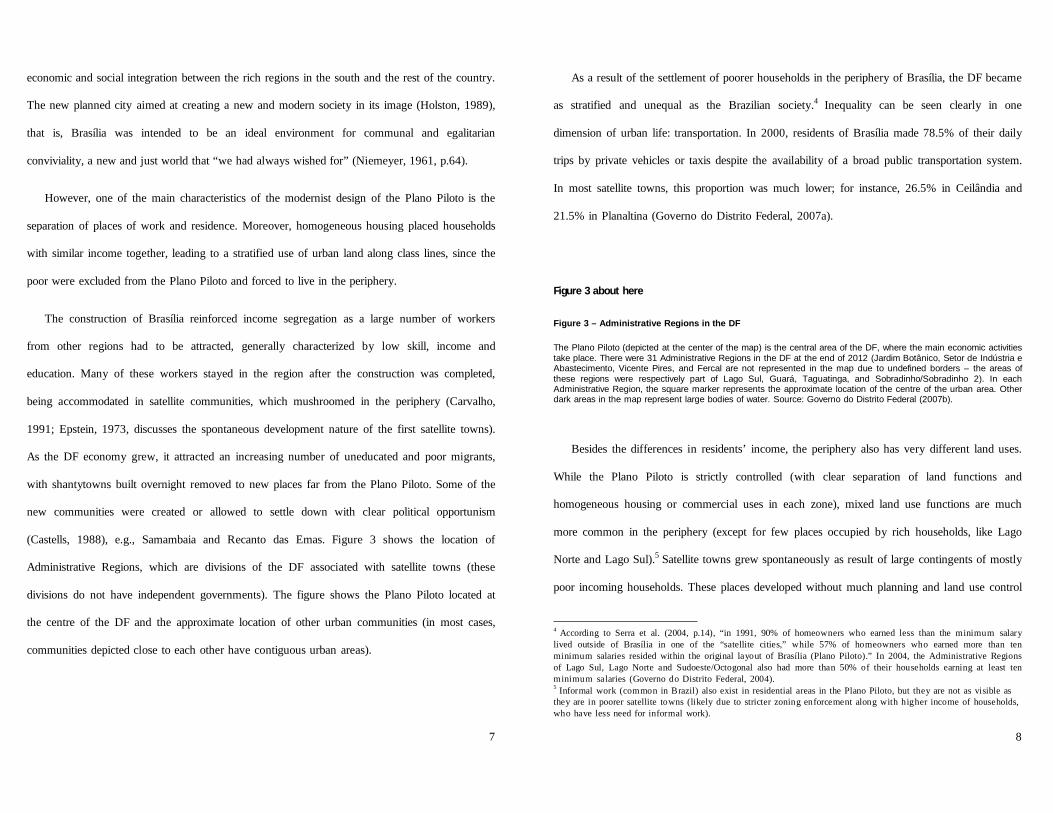
Figure 1 for a map, showing the many zones that separate land uses). Zoning regulations are
rigid and strictly enforced. For instance, economic activities are segregated, with separated zones
for civil and military government buildings, retail stores, hotels, banks, recreational clubs, etc.
6
The wings of the Plano Piloto are divided into superblocks, each containing a limited number of
apartment buildings, no taller than six floors and with ample space between buildings. Areas for
local shopping are located between superblocks (see Figure 2 for a representation of typical
superblocks). Other facilities such as schools and churches might exist between superblocks.
Transportation in the Plano Piloto takes place mainly through two perpendicular expressways
(the east-west Eixo Monumental and the north-south Eixão) and two medium-speed avenues (the
L2 and the W3, which are parallel to the Eixão). This design avoids the mixing of pedestrians
and vehicle traffic (Madaleno, 1996).
Figure 1 about here Figure 1: Plano Piloto The map shows the urban area of Brasília (Plano Piloto), divided in its many zones. The city was planned around two expressways, with main economic activities located along the Eixo Monumental and housing located around the Eixão, between the W2 and L2 avenues and west of the W2 avenue. Source: Governo do Distrito Federal (n.d.).
Figure 2 about here Figure 2: Typical superblock plan in the Plano Piloto In the Plano Piloto, residential superblocks (shown as Super Quadra Norte – SQNs) are located around the north-south expressway (Eixão). Local retail areas are located between superblocks (shown as Comércio Local Norte – CLNs). Darkened areas in the figure represent buildings (six floor apartment buildings in the superblocks and three floor buildings in the retail areas). Source: Governo do Distrito Federal (n.d.).
One of the goals behind the creation of Brasília was to change the Brazilian society at a time
when it was considered to be inward-looking, backward, and traditional, divided by a rigid and
unequal class system. A new unit of the Brazilian federation was created, called Distrito Federal
(DF), with an area of 5,802 km2 (2,240 sq mi), located in the central region of Brazil to boost
7
economic and social integration between the rich regions in the south and the rest of the country.
The new planned city aimed at creating a new and modern society in its image (Holston, 1989),
that is, Brasília was intended to be an ideal environment for communal and egalitarian
conviviality, a new and just world that “we had always wished for” (Niemeyer, 1961, p.64).
However, one of the main characteristics of the modernist design of the Plano Piloto is the
separation of places of work and residence. Moreover, homogeneous housing placed households
with similar income together, leading to a stratified use of urban land along class lines, since the
poor were excluded from the Plano Piloto and forced to live in the periphery.
The construction of Brasília reinforced income segregation as a large number of workers
from other regions had to be attracted, generally characterized by low skill, income and
education. Many of these workers stayed in the region after the construction was completed,
being accommodated in satellite communities, which mushroomed in the periphery (Carvalho,
1991; Epstein, 1973, discusses the spontaneous development nature of the first satellite towns).
As the DF economy grew, it attracted an increasing number of uneducated and poor migrants,
with shantytowns built overnight removed to new places far from the Plano Piloto. Some of the
new communities were created or allowed to settle down with clear political opportunism
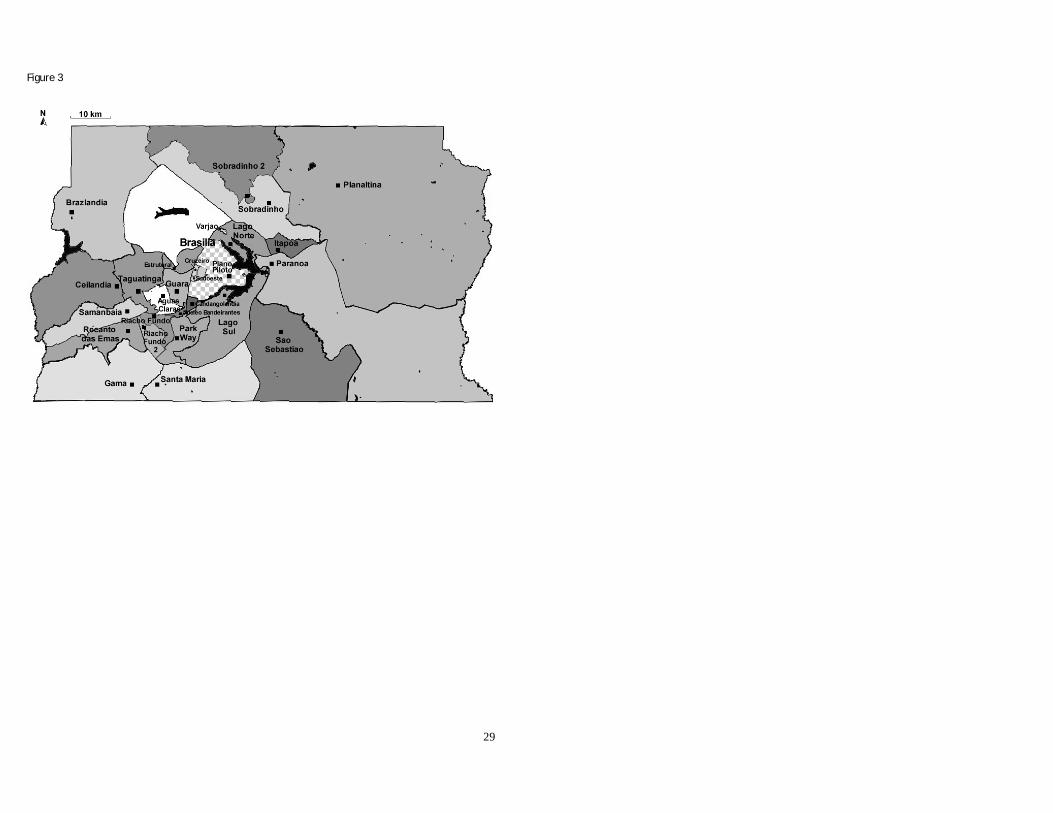
(Castells, 1988), e.g., Samambaia and Recanto das Emas. Figure 3 shows the location of
Administrative Regions, which are divisions of the DF associated with satellite towns (these
divisions do not have independent governments). The figure shows the Plano Piloto located at
the centre of the DF and the approximate location of other urban communities (in most cases,
communities depicted close to each other have contiguous urban areas).
8
As a result of the settlement of poorer households in the periphery of Brasília, the DF became
as stratified and unequal as the Brazilian society.4 Inequality can be seen clearly in one
dimension of urban life: transportation. In 2000, residents of Brasília made 78.5% of their daily
trips by private vehicles or taxis despite the availability of a broad public transportation system.
In most satellite towns, this proportion was much lower; for instance, 26.5% in Ceilândia and
21.5% in Planaltina (Governo do Distrito Federal, 2007a).
Figure 3 about here Figure 3 – Administrative Regions in the DF The Plano Piloto (depicted at the center of the map) is the central area of the DF, where the main economic activities take place. There were 31 Administrative Regions in the DF at the end of 2012 (Jardim Botânico, Setor de Indústria e Abastecimento, Vicente Pires, and Fercal are not represented in the map due to undefined borders – the areas of these regions were respectively part of Lago Sul, Guará, Taguatinga, and Sobradinho/Sobradinho 2). In each Administrative Region, the square marker represents the approximate location of the centre of the urban area. Other dark areas in the map represent large bodies of water. Source: Governo do Distrito Federal (2007b).
Besides the differences in residents’ income, the periphery also has very different land uses.
While the Plano Piloto is strictly controlled (with clear separation of land functions and
homogeneous housing or commercial uses in each zone), mixed land use functions are much
more common in the periphery (except for few places occupied by rich households, like Lago
Norte and Lago Sul).5 Satellite towns grew spontaneously as result of large contingents of mostly
poor incoming households. These places developed without much planning and land use control
4 According to Serra et al. (2004, p.14), “in 1991, 90% of homeowners who earned less than the minimum salary lived outside of Brasília in one of the “satellite cities,” while 57% of homeowners who earned more than ten minimum salaries resided within the original layout of Brasília (Plano Piloto).” In 2004, the Administrative Regions of Lago Sul, Lago Norte and Sudoeste/Octogonal also had more than 50% of their households earning at least ten minimum salaries (Governo do Distrito Federal, 2004). 5 Informal work (common in Brazil) also exist in residential areas in the Plano Piloto, but they are not as visible as they are in poorer satellite towns (likely due to stricter zoning enforcement along with higher income of households, who have less need for informal work).

9
and, although planning was later adopted, the initial spontaneous development remained.
Moreover, enforcement of construction regulations in Brazil is generally loose, especially in less
organized areas, which allowed for squatter settlements and illegal land development in fringe
areas (political pressure has led to the concession of property rights to settlers in many cases). As
a result, compared to the Plano Piloto, satellite towns are generally much more heterogeneous,
with greater density, variety, and mixing of economic activities, housing and population.6
The higher income and lower density of residents in the central area together with the large
variation in the characteristics of Administrative Regions in the DF create an interesting ground
to study crime factors. While the spatial scale of the data available does not allow for identifying
the impact of specific spatial features, our analysis (presented next) shows that crime rates are
related to the presence of economic activities, type of housing, and residential density.
Data
For government purposes, the DF area is divided into Administrative Regions (there were 31
at the end of 2012). The sample used in our work includes the 27 regions that had observations
available for the variables employed in the analysis.7 Crime data is available for the years 2006
6 Brasília (Plano Piloto) was inscribed as a World Heritage site by the United Nations in 1987 (UNESCO, n.d.), which strengthened the preservation of the original urban plan. The satellite towns of Planaltina and Brazlândia, which are the farthest from the Plano Piloto, were founded without planning before Brasília was built; others (Varjão, Itapoã and Riacho Fundo II) originated from squatter settlements. Most satellite towns have experienced large expansions through illegal land development or settlements. Despite the unintended consequences of how the city was planned and how it developed, Spencer (2010) suggests that the success of Brasilia should not be measured by merely assessing its reality in relation to its original intentions because there are ways for users to transform the city through urban redevelopment. 7 The 27 Administrative Regions included in our sample are: Brasília, Gama, Taguatinga, Brazlândia, Sobradinho, Planaltina, Paranoá, Núcleo Bandeirante, Ceilândia, Guará, Cruzeiro, Samambaia, Santa Maria, São Sebastião, Recanto das Emas, Lago Sul, Riacho Fundo, Lago Norte, Candangolândia, Águas Claras, Riacho Fundo 2, Sudoeste/Octogonal, Park Way, Sobradinho 2, Varjão do Torto, Estrutural and Itapoã. The others have limited data
10
and 2007, while data for explanatory variables are estimated for the previous years (2005 and
2006, respectively).8 The variables used are listed in Table 1, which presents statistical
summaries. Table 2 presents the correlation matrix of the variables (notice that coefficients of
correlation between independent variables are not high).
Table 1 – Data summary Variable Obs. Mean Std. Dev. Minimum MaximumCRIME 54 3,788.61 1,830.26 1,314.58 11,997.33PROPERTY 54 2,360.41 1,673.50 778.54 9,796.28VIOLENT 54 1,428.21 598.19 319.91 2,710.79STREETTHEFT 54 1,876.25 1,181.81 592.90 7,335.37BURGLARY 54 469.58 216.16 71.50 1,013.71BANK 54 10.80 18.86 0.00 85.95SINGLEHOUSE 54 0.82 0.27 0.00 1.00DENSITY 54 5,631.57 3,722.27 433.13 13,425.24POPULATION 54 82,048.12 79,116.01 5,781.00 354,428.00INCOME 54 2,794.20 2,650.87 471.97 11,510.99POLICE 54 612.02 456.65 81.27 1,660.42GOV 54 0.85 0.23 0.14 1.00Rates are computed per 100,000. Except for crime rates, all other variables are estimated for 2005 and 2006. Details on how variables are estimated and sources used are discussed in the text.
Table 2 - Correlation matrix (1) (2) (3) (4) (5) (6) (7) (8) (9) (10) (11) (12) (1) CRIME 1.00 (2) PROPERTY 0.95 1.00 (3) VIOLENT 0.41 0.10 1.00 (4) STREETTHEFT 0.96 0.92 0.39 1.00 (5) BURGLARY -0.01 -0.06 0.15 -0.15 1.00 (6) BANK 0.85 0.93 -0.01 0.87 -0.15 1.00 (7) SINGLEHOUSE -0.44 -0.56 0.22 -0.48 0.58 -0.54 1.00 (8) DENSITY -0.39 -0.40 -0.08 -0.33 -0.32 -0.30 -0.01 1.00 (9) POPULATION 0.25 0.16 0.32 0.38 -0.29 0.14 -0.09 0.11 1.00 (10) INCOME 0.28 0.50 -0.54 0.29 0.09 0.60 -0.31 -0.43 -0.15 1.00 (11) POLICE 0.32 0.37 -0.08 0.25 0.09 0.45 -0.06 -0.16 -0.32 0.26 1.00 (12) GOV 0.19 0.28 -0.19 0.25 -0.43 0.33 -0.33 -0.06 0.20 0.38 0.30 1.00
availability; they are Jardim Botânico (created in 2004), Setor de Indústria e Abastecimento (created in 2005, zoned exclusively for non-residential use), Vicente Pires (created in 2009) and Fercal (created in 2012). 8 Previous year data for explanatory variables are considered to control for possible endogeneity with crime (e.g., crime is affected by population size, but population might be affected by the occurrence of crimes).

11
Crime data is obtained from the DF Civil Police (Policia Civil do Distrito Federal, 2011). In
Table 1, crime rate refers to the number of crimes per 100,000 people, based on the estimated
population for the respective year. The variable CRIME corresponds to the total rate of crimes
against people (businesses are excluded, since we are only interested in how people are affected
by land use in this study). Following the usual categorization of crimes, PROPERTY represents
the rate of non-violent thefts and burglaries. VIOLENT is the rate of crimes involving violence
or threat, including robberies, homicides, attempted homicides, assaults and rapes.9
In addition, because we are also interested in how spatial factors affect crime activities, we
created the following subcategories:
a) STREETTHEFT, representing the rate of stealing of non-vehicle property from people
on streets (by either violent or non-violent means), and
b) BURGLARY, representing the rate of stealing property from homes (forcibly or not).
Demographic, socio-economic and housing data used in this work comes mostly from a
household survey (Pesquisa Distrital por Amostra de Domicilios), which was assembled first in
2004 and more recently in 2010-2012 by the DF Government (Governo do Distrito Federal,
2004, 2012). When needed, data for 2005, 2006, and 2007 are estimated by linear interpolation.
The following are the explanatory variables used in the analysis.10
9 The variable CRIME is the sum of PROPERTY and VIOLENT. The variable PROPERTY includes thefts on streets and inside houses or vehicles (bus, train, etc.). Note that our work focuses on the victimization of people by crime rather than on the existence of criminal activities. Because the crime data used is based on crime reports by the victims or the police, it is likely that there is severe underreporting especially for less severe types of crime like street theft. The crime data used ignores illegal activities like drug trafficking and sales tax evasion, which are common, especially in poor areas, but are hardly documented. 10 Because of the small sample size, we left only explanatory variables that were justifiable and statistically significant in the final regressions. Age, race, proportion of female household heads, unemployment rate and high school education were also considered, but the coefficients in the regressions were insignificant at the 0.05 probability level and had little effect on the results for the other independent variables.
12
BANK is the rate of bank branches per 100,000 people and it is used to measure the presence
of commercial activities.11 The number of bank branches is obtained from the Brazilian Central
Bank (Banco Central do Brasil, 2007). Commercial activities attract traffic of people on streets,
which could help prevent crimes if perpetrators shy away in the presence of passers (Jacobs,
1961). On the other hand, greater density of targets on streets can attract criminals if there are no
capable guardians (Brantingham and Brantingham, 1981; Hillier, 2004; Bowes, 2007; Bernasco
and Block, 2011).
SINGLEHOUSE is the proportion of single family housing (defined as either detached
houses or slum shelters) and it is employed as a measure of the degree of horizontal residential
land use. On one hand, horizontal housing can make it easier for residents to monitor activities in
their neighborhood, thus preventing crime (Jacobs, 1961). On the other hand, horizontal houses
have easier accessibility, which might lead to higher burglary rates (as found by Budd, 1999, in a
study of burglaries in the United Kingdom).
DENSITY is computed by dividing the estimated population of each Administrative Region
by its urban area in square kilometers.12 Greater residential density should help increase
monitoring of streets by residents (Jacobs, 1961). In the same line of reasoning, several authors
have argued that larger area makes it harder for the police to monitor crime activities (Wheaton,
2005).
11 Because commercial activities depend on financial intermediaries, we expect BANK to be a good proxy for the existence of economic activities. The rates for 2005 and 2006 are estimated using population in the respective years, but the number of branches is for 2007 (geographical distribution of branches was not available for earlier years). 12 The area of most Administrative Regions is available from the DF government, but in most cases the urban portion represents only a very small share of the total area. As a better alternative, we estimated the approximate urban areas using satellite images from Google Maps (2012).

13
POP (population size) is taken into account because larger urban agglomerations typically
offer greater pecuniary benefits and lower probability of arrest (Glaeser and Sacerdote, 1999).
INCOME refers to monthly average household income measured in 2004 inflation-adjusted
Brazilian currency (real). Higher income should reduce the supply of crimes due to less need for
residents to commit crime. On the demand side, higher income attracts criminals looking for
valuable properties, but also leads to greater spending in private security (see Lee and Pinto,
2009, for a recent paper on private crime prevention).13 Police efforts are also likely to be higher
in richer areas due to greater urbanization or political influence of the rich (however, these
effects should be captured by the control variables POLICE and GOV, which are discussed
next). Hence, violent crime rates are likely to be lower in high income areas, although property
crime rates could be higher.
POLICE is the rate of military police officers per 100,000 people in 2008 (based on data
from Cardoso, 2008; data for earlier years was unavailable).14 Policing should prevent crime
(Levitt, 1997, estimates the impact of exogenous police hiring on crime, finding a negative effect
of policing), but greater policing is typically a response to higher crime rates in the area, so it is
not uncommon to uncover a positive relationship between the two. Moreover, greater access to
government services (including police) facilitates crime reporting, thus making crime rates
appear higher (this possibility is also discussed by Levitt, 1997). Indeed, anecdotal evidence
suggests that crime victimization is severely underreported in Brazil in areas of weak
13 Studies on crime in Brazil (e.g., Souza, 1996, Caldeira, 2000, and Coy and Pöhler, 2002) often highlight the role of fear of crime and urban violence in the development of neighborhoods, especially richer ones, where households protect themselves with high walls, private security apparatus or street patrol, or the creation of gated communities. 14 The police officer rate is computed based on the distribution of officers across Administrative Regions reported by Cardoso (2008), who obtained data from the DF Military Police (Polícia Militar do DF) and the DF Planning Agency (CODEPLAN). In Brazil, states and the DF have their own Military Police forces, which deal primarily with crime prevention, while the Civil Police forces are responsible mostly for crime investigation.
14
government presence. To better control for underreporting, we include a proxy for government
presence (GOV), which is the proportion of residences served by paved roads.15
Empirical Analysis
In Table 3, crime rates in the Administrative Region of Brasília (Plano Piloto) are compared
with the rates in the periphery. Brasília exhibits greater overall rates of reported crime (see
CRIME in Table 3). However, the higher rates pertain mostly to street crimes, while burglary
rates are much lower. Looking at the other variables, it is clear that Brasília has greater economic
activities (higher BANK), greater proportion of vertical housing (lower SINGLEHOUSE),
lower density, bigger population size, higher income, and stronger presence of the police and
government. These differences can help explain the higher street crime rates and lower burglary
rates observed in Brasília. For instance, Hillier (2004) proposes that types of crimes are affected
differently by spatial accessibility. Accordingly, street criminals can find targets and hide or run
away more easily in crowded places, which are common in the proximity of commercial
activities, while home burglars need accessibility, which is restricted by vertical housing.
15 Paved road was selected as the proxy for government presence because it seems to be the most evident type of missing infrastructure in areas neglected by the government in the DF. Other public services with data available (e.g., transportation, garbage collection, sewage collection and water supply) are often provided by private parties.

15
Table 3 – Comparison of characteristics Variable Brasília mean Periphery meanCRIME 11,209.40 3,513.55PROPERTY 9,198.00 1,946.22VIOLENT 2,011.39 1,567.33STREETTHEFT 6,895.62 1,836.79BURGLARY 223.27 429.66SINGLEHOUSE 0.11 0.87BANK 85.95 6.11DENSITY 3,364.00 6,290.13POPULATION 201,840.00 152,421.50INCOME 5,364.13 2,110.84POLICE 1,039.58 417.14GOV 0.99 0.88Means weighted by POP. Sources are listed in the text.
To better understand what affect crime rates in the Brasília region, we resort to regression
analysis. The independent variables are BANK, SINGLEHOUSE, DENSITY POP, INCOME,
POLICE, GOV and a dummy variable for year. An OLS regression model is used, with
variables expressed in natural logarithm form, except for SINGLEHOUSE and GOV, which are
percentage rates. Results are presented in Table 4, where each column refers to a different crime
rate taken as dependent variable (for instance, results for CRIME are shown in column (1),
results for PROPERTY are in column (2), and so on).
16
Table 4 – OLS regression results (1) (2) (3) (4) (5) CRIME PROPERTY VIOLENT STHEFT BURGLARY
coeff. t-stat coeff. t-stat coeff. t-stat coeff. t-stat coeff. t-stat SINGLEHOUSE -0.470 * -2.18 -0.494 * -2.04 -0.096 -0.44 -0.732 ** -3.01 1.272 ** 6.38 (0.216) (0.243) (0.216) (0.243) (0.199) ln(BANK) 0.213 ** 5.08 0.285 ** 5.97 0.181 ** 4.07 0.210 ** 4.02 0.027 0.48 (0.042) (0.048) (0.045) (0.052) (0.056) ln(DENSITY) -0.266 ** -4.75 -0.198 ** -2.99 -0.293 ** -5.11 -0.342 ** -5.91 -0.276 ** -3.57 (0.056) (0.066) (0.057) (0.058) (0.077) ln(POP) 0.151 ** 3.09 0.092 1.87 0.201 ** 3.58 0.254 ** 4.61 0.081 1.72 (0.049) (0.049) (0.056) (0.055) (0.047) ln(INCOME) -0.308 ** -3.64 0.027 0.28 -0.814 ** -9.29 -0.418 ** -3.99 -0.025 -0.21 (0.084) (0.096) (0.088) (0.105) (0.121) ln(POLICE) 0.094 1.65 0.049 0.83 0.060 0.98 0.091 1.30 0.128 * 2.32 (0.057) (0.059) (0.061) (0.070) (0.055) GOV 0.449 1.75 -0.066 -0.22 1.075 ** 5.11 0.761 * 2.62 -0.439 -1.33 (0.256) (0.306) (0.210) (0.290) (0.331) D2007 -0.112 -1.78 -0.129 -1.90 -0.080 -1.13 -0.092 -1.30 -0.124 -1.80 (0.063) (0.068) (0.070) (0.071) (0.069) constant 10.179 ** 7.06 7.803 ** 5.59 12.110 ** 7.68 9.753 ** 5.38 6.169 ** 3.95
(1.441) (1.395) (1.577) (1.813) (1.564) Observations 54 54 54 54 54 R2 0.81 0.88 0.76 0.83 0.70 F-test 26.16 ** 47.89 ** 44.89 ** 45.49 ** 21.96 ** Dependent variable: ln(crime rate per 100,000 people). Robust standard errors (to correct for potential heteroskedasticity) are reported inside the parentheses. Variance is weighted by the inverse of the population. Statistical significance levels: * p<0.05, ** p<0.01.
The regressions indicate that BANK (a measure of the intensity of commercial activities) is
positively related to crime rates, except for burglaries, suggesting that higher traffic of people on
streets caused by the presence of business activities turn streets into crime hot spots.
Horizontal housing (SINGLEHOUSE) is associated with less crime in general (especially
property crimes and street theft), but more burglaries. The correlation is particularly large for
burglaries (a one percentage point higher SINGLEHOUSE is associated with a 1.3 percent
increase in burglary rate, holding other variables constant). Lower street crime rates might be a
result of the greater ability of residents to monitor streets made possible by horizontal housing.
On the other hand, higher burglary rates are justified by easier accessibility to houses compared
to apartment buildings in the DF.

17
Residential density (DENSITY) also seems to lower crime rates, perhaps because it is easier
to monitor streets in denser places (the effect of density is stronger for violent crimes than for
property crimes and is especially larger for street crimes).
As expected, bigger urban agglomerations (places with greater POP) have higher crime rates,
while INCOME is negatively related to crime rates, with an especially large and statistically
significant effect on violent crimes.16
Last, the presence of the police (POLICE) and accessibility to government services (GOV)
are found to be positively related to certain types of crimes (burglaries in the case of police and
violent and street crimes in the case of government), results that might reflect higher crime
reporting rates in places where the presence of police and government are felt more strongly (as
non-serious crimes tend to be largely underreported in Brazil). The greater presence of police can
also indicate the existence of crime hot spots caused by unobserved factors.
Considering the factors analyzed above, it seems that higher overall crime rates in the Plano
Piloto (shown in Table 3) reflect the predominance of vertical housing, concentration of
commercial activities, lower density, larger population size and stronger presence of the
government and the police (the existence of crime hot spots might be a reason for greater police
efforts in the Plano Piloto). On the other hand, lower home burglary rates in Brasília are
explained by the predominance of vertical housing.
16 The relationships between crime and income might also be reflecting the correlation between crime and variables like unemployment, education and race, which were not included in the final regressions, but are highly correlated to income. When included, those variables were not statistically significant, but they did reduce the significance of INCOME, a likely result of multicolinearity. The negative relationship between IN COME and VIOLENT is likely much stronger in reality since underreporting tends to be severe among the poor (either because they feel unsafe to report violent crimes or they have little trust in the effectiveness of the justice system in Brazil).
18
The implications of our results are limited by the scale of analysis, which ignores differences
in crime distribution within Administrative Regions, thus restricting the ability to disentangle
spatial factors from other determinants of crime. For instance, the existence of crime hot spots
can only be tested with a fine scale of analysis.17 If data becomes available, it would be
interesting to study crime in the DF at the neighborhood or street level. For now, our study
identifies some of the most important determinants of crime at the city level in the DF, which can
be helpful in designing better crime prevention policies.
Conclusion
Criminal behavior is influenced by a multitude of factors, including demographic, socio-
economic, policy and spatial variables. In this paper, we study the case of the capital of Brazil,
Brasília (Distrito Federal – DF), motivated by its peculiar planned characteristics. The central
area (Plano Piloto) is the place where most economic activities occur, with strict zoning laws that
separate land uses and promote vertical housing with moderate residential density. The
population is highly homogenous, mostly middle class service sector workers. The periphery
(satellite towns) has more relaxed land use, leading to greater heterogeneity, density and mixing
of population, housing and businesses. Income is generally lower in the periphery, while density
is higher.
Public policies regarding planning and police efforts should take into account how spatial
and socio-economic features of each community play a role in the safety of residents and people
17 Hillier (2004, 2007) suggests the use of computer-based techniques (e.g., Space Syntax) for spatial modelling of crime, allowing to better identify spatial factors. Johnson and Bowers (2004) find spatial clustering of burglaries over time. Bowers et al. (2004) suggest that crime hot spots can emerge as an epidemic, with a recent crime causing “infection” (that is, future crimes). See also Buchanan (2008).

19
on streets. Our work attempts to provide evidence on the impacts of some important crime
factors. The sample used in the analysis includes 27 Administrative Regions in the DF, with
crime data available for the years 2006 and 2007. An OLS regression model is used for the
empirical analysis. The independent variables included are the presence of commercial activities,
type of housing buildings, population size and density, income level, presence of police and
government services, and a dummy variable for year. Other socio-economic variables were also
considered, but they are highly correlated to income in the sample and result in statistically
insignificant relationships).
We find that overall reported crime rates were greater in the central area than in the rest of
the DF in 2006 and 2007 (despite the higher income of the residents of the Plano Piloto),
However, burglary rates were lower in the central area. Further analysis based on regression
results suggests that the higher overall crime rates reflect the greater presence of commercial
activities, predominance of vertical housing, lower density and larger population size, while
lower burglary rates reflect the predominance of apartment buildings. These findings indicate
that urban features such as the types of housing and the presence of economic activities affect
crime rates and the types of crime committed. Moreover, an important lesson is that crime is
pervasive even in a carefully planned city.
Future research can focus on the use of multi-year data, when it becomes available, to
provide more robust econometric results. In addition, it would be helpful to gather neighborhood
or street level data to identify the location of crime hot spots in the DF and more specific spatial
factors that lead to higher crime rates in the central area. The findings uncovered in this work and
future analyses should help policymakers to better understand the tradeoffs between different
types of urban space. For instance, as shown in this paper, horizontal housing helps curtail street
20
crimes, but gives easier access to burglars. On the other hand, traffic of people due to
commercial activities seems to correlate with greater criminal activities, while greater population
density helps curtail them.

21
References
Ackerman, W V and Murray, A T (2004) Assessing spatial patterns of crime in Lima, Ohio.
Cities 21, 423–437.
Banco Central do Brasil (2007) Agências de instituições bancárias sob a supervisão do BACEN,
em funcionamento no país, posição: 30/11/2007, retrieved from
http://www.bcb.gov.br/?RELINST.
Bernasco, W and Block, R (2011) Crime Generators, Crime Attractors, and Offender Anchor
Points, Journal of Research in Crime and Delinquency 48, 33-57.
Bowes, D R (2007) A two-stage model of the simultaneous relationship between retail
development and crime, Economic Development Quarterly 21, 79-90.
Bowers, K J, Johnson, S and Pease, K (2004) Prospective hotspotting: the future of crime
mapping? British Journal of Criminology 44, 641-658.
Brantingham, P J and Brantingham, P L (1981) Environmental criminology, Sage Publications,
Beverly Hills, CA.
Buchanan, M (2008) Sin cities: the geometry of crime, New Scientist 2564, 36-39.
Budd, T (1999) Burglary of domestic dwellings: findings of the British crime survey, Home
Office Statistical Bulletin 4/99, London.
Caldeira, T P R (2000) The city of walls: Crime, segregation, and citizenship in São Paulo,
University of California Press, Berkeley, CA.
22
Cardoso, A M (2008) Relatório sobre a situação do efetivo da PMDF. Policiamento Inteligente
Consultoria Segura, retrieved from http://aderivaldo23.wordpress.com.
Carvalho, J J (1991) Review: Brasília, from utopia to reality, Current Anthropology 32, 359-362.
Castells, M (1988) Squatters and the state in Latin America, in Joseph Gugler (Ed.) The
Urbanization of the Third World, Oxford University Press, Oxford.
Ceccato, V and Oberwittler, D (2008) Comparing spatial patterns of robbery: Evidence from a
Western and an Eastern European city, Cities 25, 185–196.
Cozens, P M, Saville, C and Hillier, D (2005) Crime prevention through environmental design
(CPTED): A review and modern bibliography, Property Management 23, 328-356.
Coy, M and Pöhler, M (2002) Gated communities in Latin American megacities: case studies in
Brazil and Argentina Environment and Planning B: Planning and Design 29, 355-370.
Crowe, T (2000) Crime Prevention through Environmental Design: Applications of
Architectural Design and Space Management Concepts, 2nd Ed., Butterworth-Heinemann,
Oxford.
Daniere, A (2000) Canadian urbanism and Jane Jacobs, Journal of Urban Affairs 22, 459-461.
Epstein, D G (1973) Brasilia, Plan and Reality, University of California Press, Berkeley.
Fajnzylber, P, Lederman, D, Loayza, N, Reuter, P, Roman, J and Gaviria, A (2000) Crime and
victimization: an economic perspective [with comments], Economia, 219-302.
Glaeser, E and Sacerdote, B (1999) Why is there more crime in cities?, Journal of Political
Economy 107, 225-258.

23
Google Maps (2012) Distrito Federal, Brasil. Google, retrieved August 1, 2012 from
http://www.daftlogic.com/projects-google-maps-area-calculator-tool.htm.
Governo do Distrito Federal (2004) Pesquisa distrital por amostra de domicílios (PDAD).
Secretaria de Estado de Planejamento, Coordenação e Parcerias do Distrito Federal
(SEPLAN) and Companhia do Desenvolvimento do Planalto Central (CODEPLAN),
Brasília, retrieved from http://www.codeplan.df.gov.br/sites/200/216/download/
PDAD_2004.pdf.
Governo do Distrito Federal (2007a) Coletânea de Informações Socioeconômicas, Informações
Estatísticas. Secretaria de Estado de Habitação, Regularização e Desenvolvimento Urbano
(SEDHAB) and Companhia do Desenvolvimento do Planalto Central (CODEPLAN),
Brasília, available from http://www.codeplan.df.gov.br.
Governo do Distrito Federal (2007b) Mapa do Distrito Federal – 2007. Secretaria de Estado de
Planejamento, Coordenação e Parcerias do Distrito Federal (SEPLAN) and Companhia do
Desenvolvimento do Planalto Central (CODEPLAN), Brasília, retrieved from
http://www.codeplan.df.gov.br/sites/200/216/00000275.pdf.
Governo do Distrito Federal (n.d.) Mapas: Plantas urbanas – Brasília. Secretaria de Estado de
Habitação, Regularização e Desenvolvimento Urbano (SEDHAB), Brasília, available from
http://www.sedhab.df.gov.br.
Hillier, B (2004) Can streets be made safe? Urban Design International 9, 31-45.
Hillier, B (2007) Space is the machine – A configurational theory of architecture, Space Syntax,
available from http://www.spacesyntax.com.
24
Hillier, B and Shu, S (1999) Do burglars understand defensible space? New evidence on the
relation between crime and space, Planning in London 29, 36-39.
Hillier, B and Shu, S (2000) Crime and urban layout: the need for evidence, in McLaren, V.
Ballantyne, S. and Pease, K. (Eds), Secure Foundations: Key Issues in Crime Prevention,
Crime Reduction and Community Safety, Institute of Public Policy Research, London, 224-
248.
Holston, J (1989) The Modernist City, University of Chicago Press, Chicago.
Jacobs, J (1961) The Death and Life of Great American Cities, Random House, New York.
Johnson, S D and Bowers, K J (2004) The burglary as a clue to the future: the beginnings of
prospective hot-spotting, European Journal of Criminology 1, 237-255.
Kelling, G L and Coles, C M (1996) Fixing Broken Windows: Restoring Order and Reducing
Crime in Our Communities. New York, NY: The Free Press.
Kubitschek, J (1975) Por que construi Brasília, Bloch, Rio de Janeiro.
Lee, K and Pinto, S M (2009) Crime in a multi-jurisdictional model with private and public
prevention. Journal of Regional Science 49, 977–996.
Levitt, S D (1997) Using electoral cycles in police hiring to estimate the effect of police on
crime, American Economic Review 87, 270-290.
Levitt, S D (2004) Understanding why crime fell in the 1990s: four factors that explain the
decline and six that do not, Journal of Economic Perspectives 18, 163–190
Madaleno, I M (1996) Brasília: the frontier capital, Cities 13, 273-280.

25
Meck, S (1997) Local government commission: Building livable communities, Planning 63, 6.
Newman, O (1972) Defensible Space, Architectural Press, London.
Niemeyer, O (1961) Minha Experiência em Brasília, Editora Vitoria, Rio de Janeiro.
Palen, J J (2005) The Urban World, 7th Ed., McGraw-Hill, New York.
Santos, M (1964) Brasília, a nova capital brasileira, Caravelle 3, 369-385.
Serra, M V, Dowall, D E, Motta, D and Donovan, M (2004) Urban land markets and urban land
development: An examination of three Brazilian cities: Brasília, Curitiba and Recife, IURD
Working Paper Series, retrieved from http://escholarship.org/uc/item/88548197.
Souza, M.L. (1996) As drogas e a "questão urbana" no Brasil. A dinâmica sócio-espacial nas
cidades brasileiras sob a influência do tráfico de tóxicos, in Iná Elias de Castro, Paulo Cesar
da Costa Comes e Roberto Lobato Corrêa (Ed.) Brasil: questões atuais da reorganização do
território, 5th edition, Bertrand Brasil, Rio de Janeiro.
Spencer, Annalisa (2010) The informal architecture of Brasília: An analysis of the contemporary
urban role of its satellite settlements. In Felipe Hernandez (ed.) Rethinking the informal city:
Critical perspectives from Latin America. Berghahn, New York.
Thomas, J M and Grigsby III, J E (2008) Community development, in Charles J. Hoch (Ed.) The
Practice of Local Government, ICMA, Washington.
Town, S. and O’Toole, R (2005) How “new urbanist” planners sacrifice safety in the name of
“openness” and “accessibility”, Reason 36, 30-36, retrieved from
http://reason.com/archives/2005/02/01/crime-friendly-neighborhoods.
26
UNESCO – United Nations Educational, Scientific and Cultural Organization (n.d.) Brasília –
Long Description. World Heritage List, United Nations, retrieved from
http://whc.unesco.org/en/list/445/, accessed on May 31, 2012.
Wheaton, W C (2006) Metropolitan fragmentation, law enforcement effort and urban crime,
Journal of Urban Economics 60, 1-14.
Wilson, J Q and Kelling, G L (1982) Broken windows: the police and neighborhood safety. The
Atlantic Monthly, March, 29-38.
Zelinka, A and Brennan, D (2001) SafeScape: Creating Safer, More Livable Communities
Through Planning and Design, Planners Press, Chicago.
27
Figure 1:
28
Figure 2
29
Figure 3