Double Agents: Gendered Organizational Culture, Control and Resistance.
Upload
khangminh22Category
view
1download
0
Eindhoven University of Technology
MASTER
Organizational culture and the activity-based office
Kos, V.
Award date:2017
Link to publication
DisclaimerThis document contains a student thesis (bachelor's or master's), as authored by a student at Eindhoven University of Technology. Studenttheses are made available in the TU/e repository upon obtaining the required degree. The grade received is not published on the documentas presented in the repository. The required complexity or quality of research of student theses may vary by program, and the requiredminimum study period may vary in duration.
General rightsCopyright and moral rights for the publications made accessible in the public portal are retained by the authors and/or other copyright ownersand it is a condition of accessing publications that users recognise and abide by the legal requirements associated with these rights.
• Users may download and print one copy of any publication from the public portal for the purpose of private study or research. • You may not further distribute the material or use it for any profit-making activity or commercial gain


1
Organizational culture and the activity-based office
Colophon Author: V. Kos Student ID: 0753367 Document: Master thesis Version: Final Course code: 7CC30 Chair: Construction Management & Engineering Faculty: Architecture, Building & Planning University: University of Technology Eindhoven Committee: dr.ir. A.D.A.M (Astrid) Kemperman, TU/e, US&RE dr. P.M. (Pascale) Le Blanc, TU/e, HPM prof.dr.ir. B. (Bauke) de Vries, TU/e, CME Date: July 2017 Place: Eindhoven Cover photo: http://pngimg.com/uploads/feather/feather_PNG12983.png

2
PREFACE This master thesis is the final product of my graduation project of the master Construction Management and Engineering at the University of Technology Eindhoven. It is the result of five months of research into activity-based working during an internship at Twynstra Gudde. In the modern society, satisfaction of the employee is increasingly important and the effect of the physical work environment is studied in this report. I find this subject very interesting as it affects the people around me regarding their office and their work. And it will probably affect me after my graduation. First of all, I wish to thank my supervisors Astrid Kemperman and Pascale Le Blanc. With their positive support and constructive feedback, the meetings were always a pleasure and it gave me confidence in my abilities. Also, I want to thank Sjoerd Memelink and Marloes Huuskes from Twynstra Gudde, Ilya Devèrs from innvire and Ton Steenhuis from Municipality Deventer for their practical knowledge and the opportunities they gave me to enhance the practical relevance of my study. Finally, I would like to express my deep gratitude to my boyfriend, family and dear friends for their unconditional support. Vera Kos, Eindhoven, July 2017

3

4
TABLE OF CONTENTS Preface ........................................................................................................................................ 2
Table of contents ........................................................................................................................ 4
Summary .................................................................................................................................... 8
Introduction ............................................................................................................................ 8
Theoretical framework ........................................................................................................... 8
Methodology ........................................................................................................................ 10
Results ................................................................................................................................... 10
Conclusion and discussion .................................................................................................... 10
Samenvatting ............................................................................................................................ 12
Introductie ............................................................................................................................ 12
Theoretisch kader ................................................................................................................. 12
Methodiek ............................................................................................................................ 14
Resultaten ............................................................................................................................. 14
Conclusies ............................................................................................................................. 14
Abstract .................................................................................................................................... 16
Keywords .............................................................................................................................. 16
1. Introduction .......................................................................................................................... 17
1.1 Problem definition .......................................................................................................... 17
1.2 Problem outline .............................................................................................................. 18
1.2.1 Research model ........................................................................................................ 18
1.2.2 Research questions .................................................................................................. 19
1.2.3 Research objectives ................................................................................................. 19
1.3 Methodology .................................................................................................................. 19
1.4 Scientific and practical relevance ................................................................................... 20
1.5 Reading guide ................................................................................................................. 20
2. The workspace ...................................................................................................................... 22
2.1 Introduction .................................................................................................................... 22
2.2 Office concepts ............................................................................................................... 22
2.2.1. History of office concepts ....................................................................................... 22
2.2.2 The New Ways of Working....................................................................................... 25
2.3 Workspace Characteristics ............................................................................................. 26
2.4 Workspace Use ............................................................................................................... 27
2.5 Conclusion....................................................................................................................... 28
3. The employee ....................................................................................................................... 29

5
3.1 Introduction .................................................................................................................... 29
3.2 Employee characteristics ................................................................................................ 29
3.3 Employee satisfaction ..................................................................................................... 31
3.3.1 Job satisfaction ......................................................................................................... 32
3.3.2 Physical environment satisfaction ........................................................................... 32
3.3.3 Organizational culture satisfaction .......................................................................... 33
3.3.4 Satisfaction and productivity ................................................................................... 33
3.4 Employee needs .............................................................................................................. 33
3.4.1 Physical comfort ....................................................................................................... 34
3.4.2 Functional comfort ................................................................................................... 34
3.4.3 Psychological comfort .............................................................................................. 36
3.5 Conclusion....................................................................................................................... 37
4. Organizational culture .......................................................................................................... 39
4.1 Introduction .................................................................................................................... 39
4.2 Culture ............................................................................................................................ 39
4.3 Organizational culture .................................................................................................... 41
4.4 Organizational culture frameworks ................................................................................ 42
4.4.1 Schein’s Levels of culture ......................................................................................... 42
4.4.2 Hofstede’s organizational dimensions .................................................................... 43
4.4.3 Goffee and Jones matrix .......................................................................................... 44
4.4.4 Cameron and Quinn’s Competing Values Framework ............................................. 46
4.5 Conclusion....................................................................................................................... 47
5. Research model .................................................................................................................... 49
5.1 Conceptual model ........................................................................................................... 49
5.2 Hypotheses ..................................................................................................................... 49
6. Methodology ........................................................................................................................ 53
6.1 Operationalizations ........................................................................................................ 53
6.1.1 Workspace use ......................................................................................................... 53
6.1.2 Organizational culture ............................................................................................. 53
6.1.3 Personal characteristics ........................................................................................... 54
6.1.4 Employee needs ....................................................................................................... 55
6.1.5 Satisfaction ............................................................................................................... 56
6.2 Data preparation ............................................................................................................ 56
6.3 Statistical analyses .......................................................................................................... 57
6.3.1 Methodological justification .................................................................................... 57

6
6.4 Conclusion....................................................................................................................... 57
7. Data description ................................................................................................................... 58
7.1 Definitive sample ............................................................................................................ 58
7.2 Demographic data .......................................................................................................... 58
7.2.1 External validity ........................................................................................................ 59
7.2.2 Education ................................................................................................................. 60
7.2.3 Job rank .................................................................................................................... 60
7.2.4 Working hours .......................................................................................................... 60
7.2.5 Personality ............................................................................................................... 61
7.3 Workspace use ................................................................................................................ 62
7.4 Organizational culture .................................................................................................... 64
7.5 Employee needs .............................................................................................................. 67
7.5.1 Factor analysis .......................................................................................................... 68
7.6 Employee satisfaction ..................................................................................................... 69
7.6.1 Factor analysis .......................................................................................................... 70
7.7 Conclusion....................................................................................................................... 71
8. Bivariate analyses ................................................................................................................. 74
8.1 Workspace use ................................................................................................................ 74
8.1.1 Personal characteristics ........................................................................................... 75
8.1.2 Organizational culture ............................................................................................. 79
8.1.3 Employee needs ....................................................................................................... 82
8.2 Employee needs .............................................................................................................. 84
8.2.1 Organizational culture ............................................................................................. 85
8.2.2 Personal characteristics ........................................................................................... 86
8.3 Employee satisfaction ..................................................................................................... 88
8.3.1 Organizational culture ............................................................................................. 89
8.3.2 Personal characteristics ........................................................................................... 90
8.3.3 Workspace use ......................................................................................................... 92
8.3.4 Employee needs ....................................................................................................... 94
8.4 Overall satisfaction ......................................................................................................... 94
8.5 Conclusion....................................................................................................................... 96
9. Path analysis ......................................................................................................................... 97
9.1 Path model ...................................................................................................................... 97
9.1.1 Selection of variables ............................................................................................... 97
9.2 Results ........................................................................................................................... 100

7
9.2.1 Effects on importance of needs ............................................................................. 100
9.2.2 Effects on satisfaction with support of needs ....................................................... 101
9.2.3 Effects on overall satisfaction work environment ................................................. 105
9.3 Conclusion..................................................................................................................... 106
10. Conclusion and discussion ................................................................................................ 110
10.1 Conclusion .................................................................................................................. 110
10.2 Theoretical implications ............................................................................................. 112
10.3 Practical implications .................................................................................................. 113
10.4 Limitations and recommendations for future research ............................................. 114
References .............................................................................................................................. 115
Appendix 1 Survey .................................................................................................................. 122
Deel 1: Over je werkweek ................................................................................................... 122
Deel 2: Over je werkomgeving ........................................................................................... 122
Deel 3: Cultuur van de organisatie ..................................................................................... 125
Appendix 2 Factor analysis importance ................................................................................. 130
Appendix 3 Factor analysis satisfaction ................................................................................. 132
Appendix 4 Comparison importance...................................................................................... 134
Appendix 5 Comparison satisfaction ...................................................................................... 136
Appendix 6 Comparison frequency ........................................................................................ 138
Appendix 7 Comparison education ........................................................................................ 139
Appendix 8 Normal distributions ........................................................................................... 141
Appendix 9 Table significant relationships............................................................................. 142

8
SUMMARY
INTRODUCTION In recent years, a growing number of companies have introduced activity-based workplaces in their physical work environment (Appel-Meulenbroek et al, 2015). Activity-based working means that employees can work at any available workplace and switch workplaces depending on the task they are performing. Among other factors, culture affects how employees use and experience workspaces (Liebregts, 2013; Steelcase, 2009). This research studies the combined effect of the physical and behavioral work environment, organizational culture and personal characteristics of the employee on overall satisfaction with the work environment. Human assets are increasingly important for organizations to support productivity and as an objective in itself. Therefore, employee satisfaction currently receives much attention from Corporate Real Estate Management, and significance is placed on catering to the needs of the employee. Understanding the cultural influence on the workspace is essential to optimally utilize the work environment. Considering the above observations, the aim of this study is to provide answers to the following problem statement: To what extent do differences in organizational culture, employee needs and workspace use, mediated by personal characteristics, affect employee satisfaction with the support of their needs and work environment in the activity-based office?
THEORETICAL FRAMEWORK To answer the problem statement, eight research questions were formulated and a preliminary research model was constructed. The first three research questions were answered with the use of a literature study. The concept of the activity-based office was analyzed first, wherein the guiding principle is that employees change workspaces depending on their activities. Six types of workspaces were identified which are used in activity-based offices, namely: the open, closed, meeting and other workspaces, as well as the workspaces at sister organizations or clients and at home. Next, the characteristics and needs of employees were explored. The personal characteristics of age, gender, job rank, education level and work hours were included. The big five personality characteristics were also found to affect satisfaction with the work environment, and thus extraversion, agreeableness, conscientiousness, emotional stability and openness were included in the conceptual research model. Furthermore, a link was found between satisfaction with the work environment and the needs of the employee based on the Person-Environment Fit model. Thus, the work environment related needs were investigated, resulting in the needs for comfort, workspace, personalization and privacy. Finally, a literature study was conducted into organizational culture. Four organizational culture types were determined: the clan, adhocracy, market and hierarchy cultures, which can be distinguished in terms of flexibility and focus. Both the currently perceived culture and the preferred culture are included in the model.

9
Open
Meeting
Sister org.
Workspace
Clan
Adhocracy
Market
Hierarchy
Now
Hierarchy
Preferred
Age
Characteristic
Extraversion
Agreeable.
Conscient.
Emo. Stability
Openness
Personality
Comfort
Workplace
Personaliz.
Privacy
Importance
Privacy
Workplace
Comfort
Personaliz.
Satisfaction
Satisfaction
Overall
FIGURE 1. PATH MODEL

10
METHODOLOGY
The preliminary conceptual model was expanded using the findings of the literature study. To test the model, field research was required. Therefore, data was collected by means of an online survey at three companies. A total of 501 respondents completed the questionnaire between May 9th and May 29th 2017, of which 489 cases were suitable for use in the analyses. To model and test the combined effect of the different aspects simultaneously, a path model analysis was conducted. To reduce the complexity of the path model, bivariate analyses were carried out beforehand so that the relevant variables with significant relationships could be selected. It was expected that workspace use, importance of needs and satisfaction with needs had mediating roles in the path model. Because the variables relating to workspace use had to be recoded, its mediating role could not be tested in the path analysis. This means that workspace use, organizational culture and personal characteristics were included as exogenous variables, while importance of needs, satisfaction with support of needs and the overall satisfaction with the work environment were included as endogenous variables.
RESULTS The final path model can be seen in Figure 1. With a RMSEA=0.041, goodness of fit index of 0.962 and a Chi-Square/Degrees of Freedom ratio of 1.818, the path model has an adequate goodness of fit. Both direct and indirect effects were found. Organizational culture and personal characteristics have indirect effects on the overall satisfaction, both through the importance of needs and through the satisfaction with needs. The significant relationships found in the path model confirm the notion that the overall satisfaction with the work environment is affected by differences in organizational culture, employee needs, workspace use and personal characteristics. Here, employee satisfaction with the support of needs has a mediating role. It is notable that satisfaction with personalization is only affected by the use of meeting workspaces. Furthermore, current clan and adhocracy cultures have positive effects on the satisfaction with privacy and comfort, while current market, and preferred hierarchy, culture types have negative effects on these two satisfaction variables. A hierarchy culture, both current and preferred, positively affects satisfaction with the work environment. Since little research has previously been done on the effect of organizational culture on satisfaction with the physical aspects of activity-based offices, these results suggest that organizational culture plays a significant role in employee satisfaction with activity-based offices.
CONCLUSION AND DISCUSSION The theoretical implications of this study are twofold. First, this study contributes to the understanding of effects of organizational culture on employees within the context of the activity-based office. The results of the bivariate analyses demonstrate that organizational culture has significant relationships with the use of different types of workspaces. Furthermore, the path model shows that organizational culture significantly affects the importance of needs, the satisfaction with needs and the overall satisfaction with the work environment. Second, this study shows that the activity-based office concept can be assessed using the complex path model developed by Budie (2016). It confirms that satisfaction with the overall work environment is influenced by personal characteristics, employee needs and workspace use. Additionally, the research model was tested with overall satisfaction in the path model, ensuring that indirect effects on the overall satisfaction could be assessed too.

11
The results of this study are practically relevant for offices that have implemented activity-based working, or are considering to implement it. First, open workspaces should be designed in such a way that the satisfaction with support of privacy for the employee is as high as possible. For companies that are considering to implement activity-based working, a short study can be conducted to assess the organizational culture. Furthermore, the personal characteristics of the employees should be taken into account when implementing activity-based offices. In particular, for employees who are introvert and conscientious, the work environment should sufficiently support the need for privacy and comfort. In conclusion, the results of this study show that when implementing an activity-based office, the organizational culture should be assessed, the employees needs must be taken into account, and the open workplaces should support privacy and comfort. This will help to ensure that the activity-based office contributes optimally to employees’ satisfaction with support of needs and the overall satisfaction with the work environment.

12
SAMENVATTING
INTRODUCTIE In de afgelopen jaren introduceren steeds meer bedrijven activiteit gebaseerde werkplekken in hun fysieke werkomgeving (Appel-Meulenbroek et al., 2015). Activiteit gebaseerd werken betekent dat medewerkers op alle beschikbare werkplekken kunnen werken en dat zij van werkplek wisselen afhankelijk van de taak die ze uitvoeren. Ook is de laatste jaren uit onderzoek naar voren gekomen dat cultuur invloed heeft op hoe medewerkers werkplekken gebruiken en ervaren (Liebregts, 2013; Steelcase, 2009). Om de werkomgeving optimaal aan te kunnen sluiten op de werk gerelateerde activiteiten is inzicht in de culturele invloed op gebruik van de werkruimte essentieel bij activiteit gebaseerde kantoren. Dit onderzoek bestudeert het gecombineerde effect van de werkomgeving, de organisatiecultuur en de persoonlijke kenmerken van de medewerker op de algemene tevredenheid met de werkomgeving. Aangezien het menselijk kapitaal steeds belangrijker wordt, krijgt de medewerker tevredenheid momenteel veel aandacht van Corporate Real Estate Management. Het is dus van belang om zo goed mogelijk rekening te houden met de behoeftes van de medewerkers. Daarnaast is ook het begrijpen van de culturele invloed op het gebruik en waarneming van de werkruimte belangrijk om de werkomgeving optimaal te kunnen benutten. Het doel van deze studie is dus om antwoord te geven op de volgende probleemstelling: In hoeverre beïnvloeden verschillen in organisatiecultuur, medewerker behoeftes en werkplekgebruik, daarbij persoonlijke karakteristieken meegenomen, de medewerker tevredenheid met de ondersteuning van hun behoeftes en werkomgeving in het activiteit gebaseerde kantoor?
THEORETISCH KADER Om deze probleemstelling te beantwoorden, zijn acht onderzoeksvragen geformuleerd en is een voorlopig conceptueel model opgesteld. De eerste drie onderzoeksvragen zijn beantwoord met behulp van literatuuronderzoek. Als eerste werd het concept van het activiteit gebaseerde kantoor geanalyseerd. Het basisprincipe van dit kantoorconcept is dat medewerkers, afhankelijk van hun activiteit, van werkplek veranderen. Er zijn zes soorten werkplekken geïdentificeerd die worden gebruikt in activiteit gebaseerde kantoren. Dit zijn de open-, gesloten-, vergader- en andersoortige werkplekken, evenals de werkplekken bij zusterorganisaties of klanten en thuis. Vervolgens werden de kenmerken en behoeftes van medewerkers onderzocht. De persoonlijke karakteristieken, leeftijd, geslacht, beroepsklasse, opleidingsniveau en werkuren zijn inbegrepen. Ook de vijf persoonlijkheidskenmerken bleken gevolgen te hebben voor tevredenheid met de werkomgeving, en daarom zijn extraversie, service gerichtheid, zorgvuldigheid, stabiliteit en openheid opgenomen in het conceptueel onderzoekmodel. Verder werd op basis van het Person-Environment Fit model een koppeling gevonden tussen tevredenheid met de werkomgeving en de behoeftes van de medewerker. Hiervoor zijn de werkomgeving gerelateerde behoeftes onderzocht en dit zijn: comfort, werkplek, personalisatie en privacy. Tenslotte werd de organisatiecultuur besproken op basis van de literatuurstudie. Vier organisatiecultuurtypes zijn bepaald, de clan, adhocratie, markt en hiërarchie cultuur. Deze kunnen worden onderscheiden in termen van flexibiliteit en focus. Zowel de huidige als de gewenste organisatiecultuurtypes zijn in het model opgenomen.

13
Open
Meeting
Sister org.
Workspace
Clan
Adhocracy
Market
Hierarchy
Now
Hierarchy
Preferred
Age
Characteristic
Extraversion
Agreeable.
Conscient.
Emo. Stability
Openness
Personality
Comfort
Workplace
Personaliz.
Privacy
Importance
Privacy
Workplace
Comfort
Personaliz.
Satisfaction
Satisfaction
Overall
FIGURE 2. PAD MODEL

14
METHODIEK
Op basis van deze literatuurstudie is het voorlopige conceptuele model uitgebreid. Om dit conceptuele model te testen is veldonderzoek gedaan en via een online enquête werden gegevens verzameld bij drie bedrijven. In totaal hebben 501 respondenten de vragenlijst ingevuld tussen 9 mei en 29 mei 2017. Van de ingevulde vragenlijsten kunnen 489 in de analyses worden gebruikt. Om de gecombineerde effecten van de verschillende aspecten tegelijkertijd te modeleren en te testen, is een pad analyse uitgevoerd. Voor dit pad model zijn vooraf bivariate analyses uitgevoerd om ervoor te zorgen dat dit pad model niet te complex zou worden. Alleen de relevante variabelen met significante relaties werden toegevoegd in de pad model. Er werd verwacht dat zowel werkplekgebruik, belang van behoeftes en tevredenheid met behoeftes, bemiddelende rollen in het pad model zouden hebben. Aangezien de variabelen van het werkruimtegebruik anders gecodeerd moest worden vanwege de ontbrekende normaal verdeling, kon de bemiddelende rol hiervan niet worden getoetst in de pad model analyse. Dit betekende dat het gebruik van werkruimte, organisatiecultuur en persoonlijke kenmerken als onafhankelijk variabelen werden opgenomen. En het belang van behoeftes, voldoening aan behoeftes en de algemene tevredenheid met de werkomgeving werden als afhankelijke variabelen opgenomen.
RESULTATEN Het pad model is te zien in Figure 2. Met een RMSEA = 0,041, fit index van 0.962 en een chi-kwadraat/vrijheidsgraden ratio van 1.818, is het pad model goed passend. Zowel directe als indirecte effecten werden gevonden. Organisatiecultuur en persoonlijke kenmerken hebben indirecte effecten, zowel door het belang van behoeftes als door de tevredenheid met behoeftes, op de algemene tevredenheid. De significante relaties die in de pad analyse zijn gevonden, impliceren dat de algemene tevredenheid met de werkomgeving inderdaad wordt beïnvloed door verschillen in organisatiecultuur, werkbehoeftes, werkruimtegebruik, persoonlijke kenmerken en de tevredenheid van de medewerker met de ondersteuning van behoeftes. Het is opmerkelijk dat de tevredenheid met personalisatie alleen wordt beïnvloed door het gebruik van vergaderruimten. Bovendien heeft de huidige clan- en adhocratie cultuur positieve effecten op de tevredenheid met privacy en comfort, terwijl de huidige markt en de geprefereerde hiërarchische cultuur negatieve effecten hebben op deze twee tevredenheidvariabelen. Zowel de huidige hiërarchie als de geprefereerde hiërarchie cultuur heeft positieve invloed op de tevredenheid met de werkomgeving. Aangezien er nog weinig onderzoek is gedaan naar het effect van de organisatiecultuur op de tevredenheid van de werkomgeving van activiteit gebaseerde kantoren, tonen deze resultaten aan dat ook de organisatiecultuur een belangrijke rol speelt.
CONCLUSIES De theoretische implicaties van deze studie zijn tweevoudig. Ten eerste blijkt dat het op activiteit gebaseerd kantoorconcept kan worden geëvalueerd met het complexe pad model van Budie (2016). Het bevestigt dat tevredenheid met de algemene werkomgeving wordt beïnvloed door persoonlijke kenmerken, werkbehoeftes en werkruimtegebruik. Ook werd het onderzoekmodel getest met de algemene tevredenheid in het pad model. Dit zorgde ervoor dat indirecte effecten op de algemene tevredenheid geanalyseerd konden worden. Ten tweede draagt deze studie bij tot het begrijpen van effecten van de organisatiecultuur op het op activiteit gebaseerde kantoor. De resultaten van de bivariate analyses laten zien dat de organisatiecultuur significante relaties heeft met het gebruik van verschillende soorten werkplekken. Bovendien blijkt uit de pad analyse dat de organisatiecultuur het belang van

15
behoeftes, de tevredenheid met de behoeftes en de algemene tevredenheid met de werkomgeving significant beïnvloedt. De resultaten van deze studie zijn praktisch relevant voor kantoren die activiteit gebaseerd werken hebben geïmplementeerd of overwegen. Ten eerste is het van belang open werkruimten zodanig te ontwerpen dat de tevredenheid met de ondersteuning van de privacy zo hoog mogelijk is voor de medewerker. Voor bedrijven die nog geen activiteit gebaseerd kantoor hebben, kan een korte test worden uitgevoerd om de organisatiecultuur te beoordelen. Ook moet er rekening gehouden worden met de persoonlijke kenmerken van de medewerkers bij het implementeren van activiteit gebaseerde kantoren. Voor medewerkers die introvert en zorgvuldig zijn, zou de werkomgeving hun behoefte aan privacy en comfort meer kunnen ondersteunen. Samenvattend blijkt uit de resultaten van deze studie dat het helpt om de organisatiecultuur bij het implementeren van een activiteit gebaseerd kantoor, vooraf te onderzoeken/ beoordelen. Ook kan het ontwerp van het activiteit gebaseerde kantoor verbeterd worden wanneer de behoeftes van de medewerkers geanalyseerd worden en meegenomen worden in het ontwerp. Daarnaast is het van belang dat de open werkplekken de behoeftes privacy en comfort ondersteunen. Dit zal ervoor zorgen dat het op activiteit gebaseerde kantoor optimaal bijdraagt aan de medewerkers tevredenheid met de ondersteuning van de behoeftes en de algemene tevredenheid met de werkomgeving.

16
ABSTRACT This study investigates the combined effect of the physical and behavioral work environment, organizational culture, personal characteristics and the needs of the employee on the satisfaction with the work environment in activity-based offices, see Figure 3. By means of a literature review, the workspaces, and personal characteristics and needs of employees are analyzed. To assess satisfaction with the work environment, the Person-Environment Fit model is used, in which satisfaction is linked to the needs of the employee. Finally, four organizational culture types are determined. Using bivariate analyses and a path analysis, the research model based on the literature review is tested. The results show both direct and indirect effects of workspace use, organizational culture, personal characteristics and employee needs on the overall satisfaction with the work environment. Practically, when implementing an activity-based office, the organizational culture should be assessed, the needs of employees should be taken into account, and the open workplaces should support privacy and comfort. This helps to ensure that the activity-based office contributes optimally to employees’ satisfaction with support of needs and the overall satisfaction with the work environment.
KEYWORDS Activity-based office, organizational culture, path analysis, satisfaction work environment
Satisfaction with work
environment Personal
characteristics
Employee needs
Workspace use
Organizational culture
FIGURE 3. CONCEPTUAL MODEL

17
1. INTRODUCTION
1.1 PROBLEM DEFINITION In recent years, a growing number of companies have introduced activity-based workplaces in their physical work environment (Appel-Meulenbroek et al, 2015). Activity-based working means that employees can work at all available workplaces and switch according to the task they are performing. This approach means a shift from the productivity focus, that was formed in the early 20th century, to a human asset focus, that aims to increase both employee productivity and satisfaction. This shift in focus can be seen in the different office concepts that have emerged throughout the years. The most recent office concept is the New Ways of Working. Due to the new possibilities that ICT offers, employees can work independent of time and place (Van der Voordt & d'Ancona, 2013). ICT, together with the aim to improve occupancy rates in offices, provided the foundation from which the concept of desk-sharing emerged (Appel-Meulenbroek, Groenen & Janssen, 2011). This formed the basis for the activity-based workspaces, which is particularly associated with the New Ways of Working. The activity-based office concept has been analyzed in various studies. These studies focused on the satisfaction of the employee with the work environment. For Corporate Real Estate Management (CREM), satisfaction is a highly prioritized value (Van der Voordt et al., 2016), as satisfied employees can be an objective in itself or to support productivity, for which the assumption is made that satisfaction increases productivity. In these studies, it was found for instance that employees of activity-based offices are more satisfied with closed and meeting workspaces, climate and décor, and less satisfied with privacy, ergonomics and facilities (Van der Voordt et al., 2016). Budie (2016) found that in activity-based offices, satisfaction with pleasantness and functionality was higher, while satisfaction with influence and the indoor climate was lower. The possibility of a relationship between dissatisfaction and an inadequate workspace in activity-based offices came forward in a study by Appel-Meulenbroek et al. (2015). Important needs for employees in activity-based workspaces were found to be the comfort of the workplace and support of concentration (Van der Voordt et al., 2016). Research done by Rothe et al. (2011) shows that personal characteristics and activity patterns could influence the needs that the employee has with regard to the workspace. Additionally, the study of Joy & Haynes (2011) concluded that age affects how the employee uses the workspace. These studies show that many different aspects play a role in the level of employees’ satisfaction with the work environment. The previously mentioned studies examined the relationships that personal characteristics, employee needs and workspace use have on satisfaction with the work environment. Additionally, the effect of cultural differences between employees on satisfaction has been closely examined in the last few years as companies are globalizing (Plijters, 2012). How employees use and perceive workspaces is a culturally dependent dimension (Liebregts, 2013; Steelcase, 2009). This means that understanding the cultural influence on the workspace is essential to be able to utilize the work environment. As was said by Bell, research director of Steelcase: “Trying to decrypt the complexity of the interrelations between culture and space can be overwhelming, but when companies fail to understand and consider this equation, their

18
workplaces are often dysfunctional, stressful, and unappealing to workers” (Steelcase, 2009, p. 111). Research has previously been carried out into the effect of national culture on the New Ways of Working. Steelcase (2009) concluded that the design of the work environment is influenced by national culture. Additionally, a study done by Plijters (2012) determined that of the six dimensions of culture by Hofstede (2001), which will be explored in the literature review, the dimensions power distance, femininity versus masculinity and uncertainty avoidance had significant influence on the design of the work environment. Finally, a study of the influence of national culture on the preferences of the employees regarding the design of the modern work environment was conducted by Liebregts (2013). She concluded that national culture influences the importance of needs of the work environment and how the workplace is used. The difference between national culture and organizational culture is that national culture is mostly based on values, while organizational culture is mostly based on practices (Karahanna et al., 2005). As practices often relate to current environmental conditions and are easier to change than values, it would be interesting to analyze how the organizational culture influences the preferences, and how it affects the employees use and perception of the work environment of the activity-based office. The goal of the research of Budie (2016) was to make a research model that contains all these aspects, to contribute to the understanding of the complex relationship between the employee and the work environment. This research model will be used, adjusted for only activity-based offices and expanded with organizational culture. Currently, to the best of the author’s knowledge, the effect of organizational culture on satisfaction with the work environment of an activity-based office has not yet been assessed.
1.2 PROBLEM OUTLINE This research studies the combined effect of the physical and behavioral work environment, organizational culture and personal characteristics of the employee on the overall satisfaction with the work environment. Human assets are increasingly important for organizations to support productivity and as an objective in itself. Therefore, employee satisfaction currently receives much attention from Corporate Real Estate Management, and significance is placed on catering to the needs of the employee. Thus, the needs of the employee are also important to take into account. Also, an understanding of the cultural influence on the workspace is essential to be able to utilize the work environment. The aim of this study is thus to provide answers to the following problem statement: To what extent do differences in organizational culture, employee needs and workspace use, mediated by personal characteristics, affect employee satisfaction with the support of their needs and work environment in the activity-based office?
1.2.1 RESEARCH MODEL The aspects that are assumed to have an influence on satisfaction with the physical work environment can be seen in the conceptual model of Figure 4. In this preliminary conceptual model, it is shown that satisfaction with the work environment is influenced by organizational culture, personal characteristics, workspace use and employee needs. Organizational culture and personal characteristics are seen as exogenous variables, meaning that they are not influenced by the other variables in the preliminary conceptual model. Workspace use,

19
employee needs and satisfaction with the work environment are endogenous variables, which means that they can be influenced by other variables in the model.
1.2.2 RESEARCH QUESTIONS In order to answer the problem statement, eight research questions are formulated that each investigate one aspect of the problem statement. They are:
1. What is the activity-based office concept of the New Ways of Working? 2. What are the characteristics and needs of the employee? 3. What are the different organizational culture types? 4. What are the effects of organizational culture and personal characteristics on
employee needs? 5. What are the effects of organizational culture, personal characteristics and employee
needs on workspace use? 6. What are the effects of organizational culture, personal characteristics, employee
needs and workspace use on satisfaction with support of needs? 7. What are the effects of satisfaction with support of needs on the overall satisfaction
with the work environment? 8. What is the combined effect of organizational culture, personal characteristics,
employee needs, workspace use and satisfaction with support of needs on satisfaction with the work environment?
1.2.3 RESEARCH OBJECTIVES The research objective of this study is to provide a clear understanding of which factors of the organization culture influence employee satisfaction with a modern, flexible workspace. Thus, it is expected that data collection, preparation and analysis yield useable results from which statements can be made. To be able to do this, a literature review is carried out which gives adequate background and information on the factors in such a way that the research model covers all the factors addressed in the research questions.
1.3 METHODOLOGY This graduation project will make use of multiple research methods to answer the research questions. Both qualitative and quantitative methods will be used to improve the conceptual model and to collect all the data that is needed for statistical analysis. In this section, an
Satisfaction with work
environment Personal
characteristics
Employee needs
Workspace use
Organizational culture
FIGURE 4. PRELIMINARY CONCEPTUAL MODEL

20
overview of the study will be given, as well as a description of the methods that are going to be used along with an explanation. First, the problem statement and research questions were defined. The relationships between the research questions are illustrated in the conceptual model, so that there is a clear overview of what exactly will be researched. The research objective was formulated to state the aim of the study. Secondly, a literature review will be conducted to expand the conceptual model with the relevant factors of each aspect that influences satisfaction of the workspace. Thus, research will be done on workspace characteristics and use, employee characteristics and needs, organizational culture and user satisfaction with the workspace. Attention is given to other possible factors that can influence the relationships between the aspects (Baarda & Goede, 2006, p.17). Thirdly, the results of the literature review will be used to expand and clarify the hypotheses implied in the research questions. To test the conceptual model, a survey will be conducted. This provides data on a large number of research units in a specific time period. The population from which the sample will be taken will be from three companies. For the survey, the computer program Workplace Analytics (WPA) from survey software company innvire will be used. WPA is a survey program which can be used to display data graphically. Since innvire studies the same subjects, workplaces and organizational culture, there is a high match between the survey and WPA.
1.4 SCIENTIFIC AND PRACTICAL RELEVANCE The objective of this research project is to gain knowledge regarding the relationships between organizational culture and satisfaction with an activity-based office. Of importance is to identify the factors that have an influence on satisfaction with the workplace, and what their relationship is. This allows companies to adjust the activity-based workspace to their organizational culture, in order to enhance employee satisfaction with the workspace, thus giving practical advice. By understanding which factors of the organization culture have influence on the satisfaction of activity-based offices, this research also merits scientific relevance. Little research has been carried out on this subject, and an holistic approach will add value to the scientific knowledge.
1.5 READING GUIDE The outline of this study can be seen in Figure 5. First, an introduction with an exploration of the problem is discussed. In this introduction, a description of the motivation, problem outline, methodology, and of the scientific and practical relevance is given. Next, a literature review of the three topics in the problem statement will be conducted. These are the workspace of the activity-based office, the employee, and organizational culture. Based on this literature review, hypotheses will be drawn and a research approach is determined in the research model. In the data description that follows, data will be collected at the three companies and prepared for statistical analyses. These data analyses consist of bivariate analyses, to assess the significant relationships, and on which the path model will be based. The results of these analyses will be described. Finally, a conclusion will be drawn, with theoretical and practical implications of this study, as well as limitations and future recommendations.

21
Problem exploration Introduction
Workspace Employee Organizational culture
Literature review
Hypotheses Research approach
Research model
Data collection Data preparation
Data description
Conclusion Conclusion and discussion
Bivariate analyses Path model Results
Data analyses
FIGURE 5. RESEARCH PLAN

22
2. THE WORKSPACE
2.1 INTRODUCTION In this chapter, the concept of the workspace will be explored in order to answer the first research question: What is the activity-based office concept of the New Ways of Working? In Figure 6, the aspect of the research model that we will zoom in on this chapter can be seen. First, the history of office concepts, from the industrial revolution to today, is explored to examine how the office concept New Ways of Working came into existence. New Ways of Working will be further referred to as NewWoW. The concept of NewWoW is then analyzed to identify its main characteristics. Next, we will zoom in on the physical aspects of NewWoW, which are the main aspects that are studied in this master thesis. Here, literature on how workspaces are used will be analyzed to expand the conceptual model. Finally, conclusions are drawn with all the relevant aspects of the workspace added to the conceptual model.
2.2 OFFICE CONCEPTS Recent literature mentions NewWoW as an important office concept of today when examining the workspace (Beijer, Van der Voordt, & Hanekamp, 2011). Before exploring what NewWoW entails, the office concepts that preceded NewWoW are examined first.
2.2.1. HISTORY OF OFFICE CONCEPTS In this section, the emergence of new office concepts throughout history is presented. These concepts can be distinguished by office location, office layout and office use (Croon et al., 2005). The goal of this presentation is to provide some understanding of how office concepts evolved over the years into the current concept of NewWoW. The timeline can be seen in Figure 8, while the floorplans of the office concepts can be seen in Figure 7.
Satisfaction with work
environment Personal
characteristics
Employee needs
Workspace use
Organizational culture
FIGURE 6. CONCEPTUAL MODEL WORKSPACE USE

23
Before the industrial revolution, farm work was predominant and small work was done at home (Bell et al., 2001). The industrial revolution changed work radically and together with upscaling of factories, upscaling of administrative work occurred (Frankema, 2003). Workspace for office people was modeled after the large open spaces in factories, resulting in uniform workspaces in a big open office (Kleijn, 2011). The theory was that by standardizing work, fewer people failed, with importance placed on hierarchy and supervision. Productivity and efficiency are of great importance. This is the industrial office concept. In the 1930’s, the movement of Human Relations arose, reflecting the importance of management for increasing productivity (Berlee, 2012). For office concepts, this meant a shift from physical aspects to social aspects (Haynes, 2007). The importance of hierarchy became visible in the cell office concept from 1945. The large open space of the industrial office was transformed into an opposite, in which many enclosed workspaces are connected by a corridor. Depending on their status in the hierarchy, employees were appointed a certain workplace, with more space appointed to more senior employees. This change occurred mainly in Europe (Duffy, 1997); in the United States, the open industrial office remained a dominant office concept. Then, in the 1970’s the group office concept emerged. Based on the theory of Human Relations and to improve the industrial open office, this concept is an open-plan office with enclosed areas for between four and twelve employees (Berlee, 2012; Duffy, 1997). The goal was to encourage teamwork and enable communication between employees. Next, the CoCon office concept was developed. It is a way of combining the cell office with the industrial open office. The focus lies on Concentration and Communication. It emerged in the 1980’s and the office plan literally is a combination of the two concepts. There are cell offices for employees who want to concentrate and open offices for people who want to communicate (Berlee, 2012). Every employee has a designated workspace in one of the offices
Industrial office
Cell office Group office
Legend: Desk
Workspace Closed room
CoCon office Flexible office
FIGURE 7. OFFICE CONCEPTS

24
and there are additional workspaces in both offices so people can temporarily switch when needed. Then, the idea of the CoCon office was further developed into the New Ways of Working. Because of the inefficiency caused by unused desks in the CoCon office, improvement was needed (Appel-Meulenbroek et al., 2011). With the fast improvement of Information and Communication Technologies (ICT) in the 1990’s, office concepts that were previously too futuristic to be feasible, now became possible (Van Meel, 2011). Activity-based offices emerged thanks to developments in the areas of technology, demography, organization and economics (Budie, 2016). When analyzing the timeline of office concepts, an important change of focus from process to employee can be noticed. Productivity and efficiency are still important terms, but the way they are achieved is completely different. Instead of viewing the employee as another link in the chain of production, as a machine was in earlier days, nowadays the employee is someone who must be motivated, encouraged and inspired (Bijl, 2009). This makes a stark contrast with the strict supervision, replaceability and the demand to be flawless that prevailed in the time of the industrial office.
FIGURE 8. TIMELINE WORKPLACE CONCEPTS

25
2.2.2 THE NEW WAYS OF WORKING The activity-based office is part of the NewWoW. It represents the physical aspect of the NewWoW office concept. There are many definitions of NewWoW, to mention a few: “New ways of working is not a specific approach but rather a philosophy for challenging the dominant ways of working and organizing work in the knowledge economy.” (Ruostela, 2013, p.154). “New ways of working refers to non-traditional work practices, settings and locations with information and communication technologies (ICT) to supplement or replace traditional ways of working” (Springer, 2011, p.29). “We define NWW as a work design in which employees can control the timing and place of their work, while being supported by electronic communication” (Demerouti, 2014, p.2) The first definition of Ruostela emphasizes the difference between work before the 1990’s and there-after. This requires knowledge on what dominant ways of working were challenged. The second definition by Springer also makes this distinction by the word non-traditional. It further explains in what areas differences are made and that ICT is the driving factor behind this. This is also mentioned in the third definition of Demerouti, stating that ICT supports NewWoW. She does not mention the change in work over the years, but sees NewWoW as a work design. This last definition gives a short and clear understanding of NewWoW. The definition of NewWoW by Demerouti corresponds with the dimensions given by Baane et al. (2011), see Figure 9:
• Time- and location-independent working
• Employee’s own responsibility for results
• Unlimited accessibility of information online
• Flexible work relations These dimensions highlight the physical, social and virtual aspects of the NewWoW (Aaltonen et al., 2012), where ICT falls under the umbrella of virtual aspects. The difference between the other office concepts and the NewWoW is the added dimension of the virtual aspects. This dimension only existed from the 1980’s onwards and enabled NewWoW due to rapid developments. Another difference is mentioned by Budie (2016), who mentions the high contrast with conventional offices, where workspaces can symbolize the status and hierarchy of the owner.
New Ways of Working
Anytime, anywhere
Manage your own
work
Unlimited access and connect-
ivity
My size
fits me
FIGURE 9. CHARACTERISTICS OF NEWWOW, ADAPTED FROM BAANE ET AL. (2011)

26
A company that implements NewWoW hopes to enhance the organizational performance by increasing efficiency and effectiveness (Van Ree, 2002). Efficiency can be seen as reduced costs for example and effectiveness increased employee performance. Additional goals can be increasing employee satisfaction and stimulating innovation (Pouwelse, 2013). When looking at the results of studies into the effects of implementing NewWoW, the following effects stand to notice. First, the office work environment changes from standardized and allocated workplaces to a variety of non-allocated workplaces when activity based working is implemented. The sharing of workplaces has as effect that often the floorplans need less m2 than traditional office concepts. This can generate cost savings up to 30% on accommodation (Pouwelse, 2013). Furthermore, office climate provides more satisfaction in a NewWoW environment, as well as office décor, leisure facilities and cleanliness (Appel-Meulenbroek et al., 2011). Budie (2016) found positive effects of NewWoW on satisfaction with pleasantness. However, his study showed also a negative effect on the satisfaction with influence. Other negative effects that were found in studies on NewWoW were the satisfaction with general facilities, privacy and desk/chair (Appel-Meulenbroek et al., 2011). Another disadvantage of NewWoW is that employees who work after hours with the provided ICT possibilities may outperform employees who do not, but the former mentioned employees experience feelings of isolation and difficulties with the new office concept (Demerouti, 2014). Finally, NewWoW can blur the lines between work and private life in a negative way (Derks & Bakker, 2011).
2.3 WORKSPACE CHARACTERISTICS In this research, the term activity-based office concept is used to describe the physical part of NewWoW in companies. Activity Based Working is an umbrella term that refers to different office concepts that support NewWoW (Appel-Meulenbroek et al., 2011). In Figure 10 the activity-based office floorplan concept, previously found in Figure 7, can be seen. The floorplan shown here is one example of a floorplan that can be generated when employees work location-independent and in non-traditional places. According to Budie (2016, p. 31) and Vos & Van der Voordt (2001) the essence of the activity-based office is: “Aesthetically and ergonomically designed combination offices with flexible, shared and activity-based workspaces, supported by highly qualitative IT”. Since employees don’t necessarily work at the office, CBRE, an American commercial real estate company, conducted research on how much time employees spend working in the office (CBRE, 2011). In traditional offices, most employees are present on Tuesdays, with a peak load of 70%. On Fridays, the smallest number of employees are present in the office, and the average occupancy is 50%. In comparison, activity-based offices achieve higher occupancy rates. They have a peak load of 80% and an average occupancy of 65%. Furthermore, the occupancy of workplaces is spread more equally through the week. The challenge for companies that implement NewWoW is to ensure that all employees have access to the activity-based workspaces they need. There are different types of workspaces, the most common being (innvire, 2017):
- Open workspace - Closed workspace
FIGURE 10. ACTIVITY-BASED
OFFICE

27
- Meeting workspace - Other workspace - Sister organization - Home
In Figure 11, examples of these different types of workplaces can be seen. These workplace types are often applied in companies with NewWoW, and are not assigned to specific employees (Budie, 2016). To compare workspace types, one can look at the basic facilities, accessibility, and attractiveness, according to Meulensteen (2017). Appel-Meulenbroek et al. also mentions the location of the workspace, control of indoor climate and comfort (2011). In a preliminary interview with Municipality Deventer, this also was mentioned as an important characteristic of the workspace. Therefore, the characteristics of the workspace are basic facilities, accessibility, and control of indoor climate. These will be measured by employees as part of the employee needs, which will be further explored in the next chapter.
2.4 WORKSPACE USE In an activity-based office, employees can make use of the different workspace types depending on the activity they want to perform (Appel-Meulenbroek et al., 2015). This does not always go as intended (Appel-Meulenbroek, Groenen, & Janssen, 2011; Hoendervanger, et al., 2015; Gorgievski, et al., 2010). These articles mention that employees do not often switch workspaces according to the activity they are performing and employees keep claiming workspaces even when they are absent. These are examples of workspace misuse, which was found to have a relationship with loss of productivity and dissatisfaction, according to Appel-Meulenbroek et al. (2011). This was also mentioned in the interview with Municipality Deventer. Therefore, it is interesting to measure how often employees use the same workspace in the activity-based office. In terms of job satisfaction and the physical workspace, Lee and Brand have conducted a study into the effects of control over office workspace (2005). They concluded that job satisfaction increases with the amount of perceived personal control employees have over their workspace. Additionally, easy accessibility positively influences job satisfaction. Furthermore, they found that job satisfaction positively affects perceived performance. The research of Hartog concluded that work environment and workspace type have a significant effect on the user satisfaction with the physical characteristics (2015, p.88). For example, employees working at a flexible workspace are more satisfied with office exterior and décor.
Open workspace Closed workspace
Meeting workspace Other workspace
FIGURE 11. TYPES OF WORKPLACES, ADAPTED FROM OFFICE PRINCIPLES
(N.D.)

28
2.5 CONCLUSION In this chapter, a literature review was presented on how The New Ways of Working can be seen in the context of office concepts over the years. With the fast development of ICT, NewWoW became possible and now companies are exploring ways to make sure their office work environment corresponds with the use and needs of the employees. The literature review presented here can be used to answer the research question that was asked at the beginning of this chapter: What is the activity-based office concept of the New Ways of Working? Activity-based offices consist of six types of workspaces: open workspace, closed workspace, meeting workspace, other workspace, sister organization and home. The goal of the activity-based office concept is that employees change workspaces depending on their activities. Therefore, no employee has their own workspace, but can use any workspace that is available. The workspace types can be seen in the updated conceptual model, shown in Figure 12.
Satisfaction with work
environment Personal
characteristics
Employee needs
Workspace use
Organizational culture
Open workspace Closed workspace Meeting workspace Other workspace Sister organization Home Frequency
FIGURE 12. CONCEPTUAL MODEL WORKSPACE USE EXPANDED

29
3. THE EMPLOYEE
3.1 INTRODUCTION In this chapter, the employee in the activity-based office will be explored to answer the second research question: What are the characteristics and needs of the employee? First, the characteristics of the employee are addressed. Next, different kinds of employee satisfaction are addressed. Finally, the needs of employees are explored, logically grouped into three types of environmental comfort: physical comfort, functional comfort and psychological comfort.
3.2 EMPLOYEE CHARACTERISTICS When considering the relationship between activity-based workspaces and the organizational culture, the employee itself cannot be forgotten. Employees can be examined from multiple angles. In this section, the basic employee characteristics are explored first, after which an in-depth look will be taken at personality. Finally, the different generations of employees will be considered. Research has indicated that there is a relationship between employee characteristics and needs, and the satisfaction of the workspace. The research of Hartog found a significant effect of gender on office climate and privacy. Age had a significant effect on the satisfaction with the physical aspects of the multi-tenant offices that were studied (2015, p. 87). Also, education and job level have shown significant effect on office climate. The research of Budie confirmed the significance of the employee characteristics age, gender and education (2016, p.120). However, in his research these were mostly linked to employee needs. In addition to age, gender, education and job level, studies into employee satisfaction often examine the significance of personality characteristics. Hartog (2015) reviewed five ways of categorizing personality: the Myer’s-Briggs Type Indicator, Keirsey Temperament Sorter, Marcus Paul Placement Profile, Eysenck’s (1967) classification of people and the Big Five
Satisfaction with work
environment
Personal characteristics
Employee needs
Workspace use
Organizational culture
FIGURE 13. CONCEPTUAL MODEL EMPLOYEE

30
taxonomy. Of these, Hartog concluded that only the ‘Big Five’ taxonomy has been validated by research (2015, p.30). The Big Five taxonomy identifies, as reflected by its name, five personality traits: extraversion, emotional stability (neuroticism), agreeableness, conscientiousness, and openness (see Figure 14). These traits are examined in more detail next. The first dimension of the Big Five taxonomy is Eysenck’s extraversion/introversion (Barrick & Mount, 1991). Adjectives associated with extraversion are, for example, assertive, talkative and active. The second dimension is emotional stability or neuroticism. Associated adjectives are anxious, depressed and insecure. These two dimensions are described by Eysenck in the 1950’s as the Big Two. The third dimension is agreeableness, with adjectives like good-natured, forgiving, trusting and tolerant. The fourth dimension is called conscientiousness. Adjectives associated with conscientiousness are responsible, organized and hardworking. The final dimension of the big five is openness, previously also called intellect (Barrick & Mount, 1991). Commonly associated adjectives are curious, imaginative and broad-minded. The Big Five taxonomy has been used in a large number of researches in relation to job performance. For example, it was used to study the effect of personality on job satisfaction (Judge et al., 2000), which was found to be significant. Additionally, Barrick and Mount (1991; 2005) have done extensive research on the relation between personality and job performance. They found that the combination of conscientiousness and emotional stability affects job performance as generalizable predictors. The other three dimensions were found to be valid predictors of performance in specific niches, such as extraversion in occupations like management and sales. In their study, it is noted that when studying personality, it is important that the personality is considered in its entirety when used for prediction (Barrick & Mount, 2005, p. 362). Overall, they stress the importance of personality on many work-related behaviors and outcomes, and thus that personality plays a meaningful role in nearly all facets of work.
Practical, conventional,
prefers routine
Impulsive, careless,
disorganized
Quiet, reserved,
withdrawn
Calm, even-tempered,
secure
Critical, uncooperative,
suspicious
Curious, range of interests, independent
Hardworking, dependable,
organized
Outgoing, warm, seeks adventure
Anxious, prone to negative emotions
Helpful, trusting,
empathetic
Openness
Conscientious ness
Extroversion
Neuroticism
Agreeable ness
FIGURE 14. P-E FIT MODEL, ADAPTED FROM BOUNDLESS (N.D.)

31
In addition to personality, employees can be categorized into generations. Currently, there are three generations at work:
- Baby Boomers, born between 1946 and 1964. Generically, these are optimistic, team players and service-driven, but also technologically challenged and with a high need for personal space (Joy & Haynes, 2011).
- Generation X, born between 1965 and 1978. Generalized, they are independent, self-reliant and entrepreneurial, but also impatient and quick to criticize (Joy & Haynes, 2011).
- Generation Y, born between 1979 and 2000. This generation is generally confident, knowledge-thirsty and technology savvy, but in need of constant guidance and instant feedback (Joy & Haynes, 2011).
Different generations have different preferences and needs in their work. It is important to create a work environment in which the multi-generational workforce is happy and productive (Smith, 2008). Finally, activity patterns of employees have been studied in previous research. However, the link between the activities, such as formal communication or concentrated work, and satisfaction is insignificant (Budie, 2016). Furthermore, some correlations between activity and workspace use were found, but they were less strong than expected. Thus, for this research the activities of employees will not be included.
3.3 EMPLOYEE SATISFACTION Throughout the years, employee satisfaction has become a common concern for companies (Spector, 1997; Alegre et al., 2016). Employee satisfaction is a very broad term that requires further specification for this study. For example, subjects linked to employee satisfaction include (Alegre et al., 2016; Diskienė & Goštautas, 2013; Deci & Ryan, 2000; De Been & Beijer, 2014):
• Job satisfaction
• Work environment satisfaction
• Satisfaction with support of employee needs
• Organizational satisfaction These different types of satisfaction all influence the employee’s overall satisfaction, but can also be viewed separately depending on what researchers want to measure (Alegre et al., 2016). Furthermore, certain literature suggests that there is a connection with employee satisfaction and (perceived) productivity (De Been & Beijer, 2014). The effects of activity-based working on satisfaction have been studied since 2004 (Van der Voordt, 2004). De Been & Beijer (2014) found that activity-based offices have positive results on employee satisfaction. However, according to Van der Voordt (2004), not all employees are satisfied with the new office concept and would prefer the original situation. This was also found in research done by Gorgievski, et al. (2010). Van der Voordt (2004) argues that when applying the activity-based office concept, a proper balance must be found between open and closed workspaces. This would prevent the drawbacks associated with open-plan and activity-based office concepts, which arise when they are not implemented properly. In this section, the different types of satisfaction are examined first., Subsequently, a selection is made of which types of satisfaction will be measured in the current study.

32
3.3.1 JOB SATISFACTION Two definitions of job satisfaction are: “Job satisfaction is a pleasurable or positive emotional state resulting from the appraisal of one's job or job experiences” (Locke, 1976). “Job satisfaction expresses the employees’ attitude: job satisfaction shows how people feel about their jobs and different aspects of their jobs” (Spector, 1997). From these definitions, it can be concluded that job satisfaction mainly concerns the attitude or emotional state of employees in relation to their work. According to Ostroff (1992) job satisfaction relates to individual needs like equitable rewards and a supportive work environment. For this study into activity-based workspaces, job satisfaction is not of importance, however it could be influenced positively with a supportive or satisfactory work environment (Diskienė & Goštautas, 2013).
3.3.2 PHYSICAL ENVIRONMENT SATISFACTION According to various studies, the physical work environment has an influence on the satisfaction of the employee (Hoendervanger, 2015; De Been & Beijer, 2014; Batenburg & Van der Voordt, 2008). Both the features and the facilities of the physical work environment are of importance. Features, such as desks or the indoor climate, are part of the workspace. Facilities are services that are provided, such as cleanliness or quietness. This can be found in the definition of employee satisfaction according to Van der Voordt: “Employee satisfaction refers to the degree to which the working environment meets the wishes and the needs of the employees” (2004, p. 139). This definition focuses on the degree to which the working environment is adapted to the wishes and needs of the employees. This is supported by Van Den Broeck et al. (2008), who state that human needs are fundamental for the functioning of an employee. Earlier research done by De Been & Beijer (2014) follows this definition and compares the satisfaction of office types with the needs of employees. Furthermore, a link can be placed between this definition and the Person-Environment fit theory. According to Heijs (2006) the Person-Environment fit theory (P-E fit) describes that there needs to be a match between the needs of the person and the resources of the environment, as well as a match between the demands of the environment and the abilities of the person. The satisfaction and the productivity of the employee are influenced by how well these factors match. This can be seen in Figure 15. The P-E fit model distinguishes
Outcome Environment Person
Desires
Abilities
Supplies
Demands
Satisfaction
Performance
FIGURE 15. P-E FIT MODEL, ADAPTED FROM TINSLEY (2000)

33
between satisfaction and productivity. Ideally, the needs of the person match the supplies of the environment for employee satisfaction. A mismatch between needs and supply causes psychological strain that affects the well-being and behavior of employees (Heijs, 2006). It should be taken into account that sometimes employees are not aware of all their needs or wants (Rother et al., 2011). Also, job satisfaction is influenced by the P-E fit (Hardin & Donaldson, 2014).
3.3.3 ORGANIZATIONAL CULTURE SATISFACTION Job satisfaction has been related to organizational values (Diskienė & Goštautas, 2013). The employee-organization relationship has also shown to affect employee satisfaction (Alegre et al., 2016). This works both ways: employee job satisfaction is also found to improve the attitude towards the organization (Shah et al., 2017). The employee-organization relationship stresses the importance of employee identification and commitment to the organizational goals and mission (Alegre et al., 2016). The organizational culture will be studied in this research, but since the focus is on the physical aspects of employee satisfaction, the identification and commitment of the employee with the organization will not be studied.
3.3.4 SATISFACTION AND PRODUCTIVITY Often, companies try to improve productivity by improving job satisfaction. The relationship between employee satisfaction and productivity has not been without discussion. According to De Been & Beijer (2014), a significant correlation was found between perceived productivity and satisfaction. A study by Lee & Brand (2005, p.331) also found a strong, direct relationship. Batenburg & Van der Voordt (2008) state that an attractive work environment can increase productivity by 10% to 20%. However, the research of Diskienė & Goštautas (2013) concludes that no correlation can be found between productivity and satisfaction. They stress that productivity and satisfaction should be analyzed independently. Because of the contradicting conclusions reached in the existing literature, and to limit the scope of this study, (perceived) productivity will not be measured.
3.4 EMPLOYEE NEEDS In the previous section, it was stated that employee satisfaction depends on the match between the needs of the employee and the resources offered by the environment. The definition that will be used for needs is: “A vital goal or condition one is trying to reach” (Heijs, 2003, p. 362). According to Vischer (2008), there are three types of environmental comfort. These can be seen in Figure 16. Physical comfort describes the basic human needs, like safety and hygiene. These are assured by building codes and standards. Functional comfort is the degree to which the environment supports the employee’s tasks. These can be seen as work-related needs. Psychological FIGURE 16. ENVIRONMENTAL COMFORT MODEL OF
WORKSPACE QUALITY, ADAPTED FROM VISCHER
(2008)
Psychological comfort
Functional comfort
Physical comfort
Discomfort
Habitability threshold
Occupant satisfaction and
well-being

34
comfort, finally, relates to more abstract needs, like feelings of belonging and control over the workspace. Budie (2016) has done an extensive research on the needs of employees, which can all be categorized in these three types of environmental comfort. He concluded that there are sixteen needs of employees which describe the environmental comfort. In Figure 17, an overview of these needs can be seen. In the next sections, all the needs will be discussed.
3.4.1 PHYSICAL COMFORT The first physical comfort need that will be discussed is climate comfort. The indoor climate of an office affects both productivity and comfort (Haynes, 2008). Indoor climate concerns the temperature, air quality and acoustics of the environment. Normally, lighting could also be considered a part of indoor climate, but this is considered as a distinct need. Maarleveld, Volker & Van der Voordt (2009) found that employees rank indoor climate as the second-most important aspect of the work environment, only 4% less important than concentration. Veldhoen (2005) stated that both sound and acoustics are critical factors in an open work environment. The second physical comfort need is lighting. This is seen as the visual comfort of the work environment. In a research done by Fleming (2005), lighting scored high on importance. According to Veldhoen (2005), it should be adjusted depending on the activities and desired atmosphere. As employees age, lighting also increases in importance (Haynes, 2011). As mentioned in the previous chapter, location is an important characteristic of the workspace. The location is part of the office layout and can be seen as a form of accessibility (Appel-Meulenbroek et al., 2011). Since this can be considered distinctly for each employee, and is different for every workspace, this characteristic is added as a need and will be measured as such.
3.4.2 FUNCTIONAL COMFORT Functional comfort concerns work-related needs. The first one is concentration. As mentioned earlier, concentration was ranked as the most important aspect by employees in the research of Maarleveld, Volker & Van der Voordt (2009). Many researches address the importance of concentration (Gorgievski, et al., 2010; De Been & Beijer, 2014; Joy & Haynes, 2011). According to Oseland (2009), after a distraction in concentration, it takes employees 15 minutes to be able to concentrate again, and another 15 minutes to get back into optimal productivity. Therefore, it is of importance that employees can concentrate in order not to increase the workload (De Croon et al., 2005) The second need related to functional comfort is communication. For collaboration, it was found that communication is an important aspect (Greene & Myerson, 2011). This is confirmed in the research done by Gorgievski, et al. (2010). Social interaction is seen as a part of communication. As social beings, people want to come together and interact (Oseland, 2009). It is also one of the needs of Maslow’s need hierarchy and therefore a basic human need (Van der Voordt & Van Meel, 2002). This makes communication an important work-related need.

35
The third need of functional comfort is the proximity of coworkers. This need is related to communication. Employees find it important to be located near team members (Appel-Meulenbroek, Groenen, & Janssen, 2011). This increases communication and collaboration. With the New Ways of Working, IT enables work to become location-independent. Because IT is part of the virtual work environment, it will not be considered in this study. Ergonomics is the fourth need of functional comfort. The study of Appel-Meulenbroek, Groenen & Janssen (2011) named ergonomics as the most important need for employees. It is the interaction between humans and furniture and machines (Budie, 2016). In the research of Kim & de Dear (2013), furniture comfort had a high effect on satisfaction with the work environment. In addition to furniture comfort, dimensioning of the space is important. Employees need enough space to be able to work adequately. Kim & de Dear (2013) found that desk size had the strongest effect on satisfaction with the work environment. The research of Appel-
Physical comfort
Climate comfort
Lighting
Aesthetics
Psychological comfort
Privacy
Relaxation
Territoriality
Status expression
Control over climate
Autonomy
Concentra-tion
Communica-tion
Functional comfort
Proximity of coworkers
Ergonomics
Space needs
Facilities
Environmental comfort
Location
FIGURE 17. ENVIRONMENTAL COMFORT NEEDS

36
Meulenbroek, Groenen & Janssen (2011) showed a similar effect. Here, it was found that desk size was moderately important. Finally, facilities are the sixth functional comfort work-related need. This was mentioned in the previous chapter as a workspace characteristic. Facilities include the number of power outlets, Wi-Fi connection and other environmental services (Meulensteen, 2017).
3.4.3 PSYCHOLOGICAL COMFORT The first psychological comfort need is privacy. In short, privacy concerns the amount of control employees have on social interaction (Oseland, 2009). Too little privacy causes a feeling of overcrowding, and too much privacy causes social isolation. Furthermore, privacy can be considered in combination with communication, for example with confidential conversations (Van der Voordt & Van Meel, 2002). Oseland (2009) stated that depending on the personality of the employee and the task at hand, the importance of privacy can fluctuate. This would explain the different results of studies, in which privacy was concluded to be very important (Appel-Meulenbroek, Groenen & Janssen, 2011), or not important (Fleming, 2005). The second psychological need is relaxation. Employees need to rest occasionally, so a relaxed atmosphere is seen as important (Fleming, 2005). With the New Ways of Working, informal areas are provided to ensure employees can relax (Van der Voordt, 2004). Related to privacy and space is the need for personalization. It is a part of territoriality, which stands for the ownership or control over space by employees (Budie, 2016), or the personal space that an employee wants and is able to maintain. Since this also depends on the employee and the task he/she wants to perform, employees like to create their own territory (Van der Voordt, & Van Meel, 2002). Personalization is the ability to adjust furniture, and display objects in the workspace. Since employees have a high perceived ownership in offices, the need for personalization is also high (Budie, 2016). Somewhat similar to personalization is the psychological need of status expression. Van der Voordt & Van Meel (2002) found that employees have the need to visualize their status. They explain it according to the Maslow’s needs hierarchy, in which status expression lets people show their accomplishments. Furthermore, the needs status expression, privacy and personalization have a symbolic function which often improves when an employee is promoted (Budie, 2016). The fifth psychological comfort-related need is the control employees have over climate. Of importance is the perceived control, which can cause learned helplessness when it is lacking (Bell, et al., 2001). The importance of this need is confirmed by research done by Vischer (2008) and Van der Voordt & Van Meel (2002). Another need related to control, is autonomy. This entails the freedom of choices, which is generally higher in the activity-based office concept. Autonomy improves the balance between private life and work (Budie, 2016). Aesthetics is the last psychological comfort-related need. According to Van der Voordt & Van Meel (2002), this need is included in the Maslow’s need hierarchy and therefore important for employees. Oseland (2009) confirms this and explains that employees prefer stimulating

37
environments. However, other studies found that aesthetics is one of the least important needs (Fleming, 2005; Appel-Meulenbroek, Groenen, & Janssen, 2011).
3.5 CONCLUSION In this chapter, the employee and satisfaction with the work environment is explored, to answer the research question: What are the characteristics and needs of the employee? The different aspects of the employee are age, gender, education and job level. Personality traits can be categorized into extraversion, agreeableness, conscientiousness, emotional stability (neuroticism) and openness. Furthermore, the workforce is multi-generational, consisting of the Baby Boomers, Generation X and Generation Y. Employee satisfaction will be measured according to the match between the work environment and the needs of the employee. This is done according to the Person-Environment Fit theory. The needs of employees are based grouped by three environmental comfort types. The first is physical comfort, which has the needs of indoor climate and lighting. The second environmental comfort type is functional comfort, which includes concentration, communication, proximity of coworkers, ergonomics, space and storage space. The final environmental comfort type is psychological comfort, consisting of the related needs of privacy, relaxation, territoriality, status expression, control over climate, autonomy and aesthetics. In Figure 18, the overview of the model can be seen, as adjusted to the literature research in this chapter.

38
Satisfaction with support
of needs Personal
characteristics
Employee needs
Age Gender Job level Education Work hours Extraversion Agreeableness Conscientiousness Neuroticism Openness
Ergonomics Climate comfort Control over climate Lighting Personalization Status expression Location Facilities Space Aesthetics Relaxation Autonomy Communication Proximity of coworkers Concentration Privacy
Workspace use
Organizational culture
Satisfaction with: Ergonomics Climate comfort Control over climate Lighting Personalization Status expression Location Facilities Space Aesthetics Relaxation Autonomy Communication Proximity of coworkers Concentration Privacy
Satisfaction with work
environment
FIGURE 18. CONCEPTUAL MODEL
EMPLOYEE EXPANDED

39
4. ORGANIZATIONAL CULTURE
4.1 INTRODUCTION In this chapter, the concept of organizational culture will be explored to answer the third research question: What are the different organizational culture types? First, the different levels of culture are described, and the interaction between the levels is explained. Next, the organizational culture is explored by means of four frameworks to analyze organizational culture. Finally, an organizational culture framework will be chosen.
4.2 CULTURE According to Schein, culture is: “A pattern of basic assumptions – invented, discovered or developed by a given group as it learns to cope with its problems of external adaptation and internal integration – that has worked well enough to be considered valid and, therefore, to be taught to new members as the correct way to perceive, think and feel in relation to those problems” (1985, p. 9). Another definition of culture is given by Hofstede: “The collective programming of the mind which distinguishes the members of one human group from another” (1984, p. 260). Both definitions revolve around the group as a basic level of culture. This group can be very large, for example national culture, or very small, such as a group of friends or a small team in a company. According to Karahanna et al. “an individual’s culture is the product of several levels of culture” (2005, p. 5). In Figure 20, the different levels of culture can be seen from the most general level to the least general level, with the individual nested in all of them (Ali &
Satisfaction with support
of needs Personal
characteristics
Employee needs
Workspace use
Organizational culture
Satisfaction with work
environment
FIGURE 19. CONCEPTUAL MODEL ORGANIZATIONAL CULTURE

40
Brooks, 2008). The different levels as well as the interaction between them will be explained in the following paragraphs. Starting at the most general level, supranational culture is e.g. ethnic or religious. Leung calls this level the global culture, however this term does not clearly indicate what is included, and can be interpreted as the aggregate of all cultures around the world (2005, p.362). National culture is broadly defined as “values, beliefs, norms, and behavioral patterns of a national group”, by Leung (2005, p. 357). It is shared by a society, in which it shapes the individuals and the society as a whole (Adler 1997; Bagchi et al., 2003). Hofstede measures national culture with five dimensions: power distance, uncertainty avoidance, individualism vs. collectivism, masculinity vs. femininity and long-term vs. short-term orientation (2005). The difference between professional and organizational culture, the third and fourth levels, is that professional culture is the culture of an industry and not just of one organization (Karahanna et al., 2005; Gouldner, 1957). Organizational culture is the culture that employees of an organization share and are influenced by (Adler 1997; Bagchi et al., 2003). In other definitions, the organizational culture can also be seen as that which directs the actions of all its employees towards the same purpose (Karahanna et al., 2005). This will be explored in depth in the next section. Group culture is the cultural coherence that is contained within a single group below the level of organization culture (Karahanna et al., 2005). Group culture can also be seen as the sub-culture level (Ali & Brooks, 2008). Within one nation or organization, there can be sub-cultures present which influence the individuals their behavior (Triandis, 1972; Karahanna et al., 2005). One example could be a group of expats from the same national culture in an international company. Sub-cultures form when there is a stable social unit (Schein, 1993). A stable social unit depends, among other factors, on the stability of membership, the length of time the group exists and the smallness of the group (Schein, 1993, p. 49). Finally, the individual’s culture is formed by all the different levels, which interact and dominate depending on the situation (Karahanna et al., 2005). The individual culture consists of an outer layer of behavior, which arises from the values and practices of a deeper level. These values and practices are based on assumptions of the invisible inner layer and taken for granted (Schein,
Individual 1-Behavior 2-Values, practices 3-Assumptions
Group culture
Organizational culture
National culture
Supranational culture
Professional culture
Supranational
National
Professional
Organizational
Group
Values
Practices
FIGURE 20. LEVELS OF CULTURE, ADAPTED FROM LEUNG ET
AL. (2005) & KARAHANNA ET AL. (2005)
FIGURE 21. VALUES AND PRACTICES (KARAHANNA ET
AL., 2005)

41
1992). The values of an individual have more influence on the higher levels of culture, the supranational and national cultures (Hofstede, 1991; Karahanna et al., 2005; Leung et al., 2005). Values are beliefs or principles and thus fundamental assumptions on how things are and how things work (Karahanna et al., 2005; Cheng, 2010). They are formed during the formative years, or younger years, of an individuals’ life (Ali & Brooks, 2008). Values are hard to change, but when migrating and especially during extreme circumstances such as war, they can change. Practices are mostly influenced by the lower levels of culture, like professional and organizational cultures, as seen in Figure 21 (Hofstede, 1991; Karahanna et al., 2005). They are learned later on in life, when values have already been formed (Ali & Brooks, 2008). Practices can change more easily than values and are often related to current environmental conditions. As a result, they are always evolving (Karahanna et al., 2005). Ideally, values and practices are in harmony, but according to Karahanna et al., values and practices can be at odds with each other, for example when practices on organizational level conflict with values on national level (2005). According to Hofstede (1991), national cultures are about value differences, while organizational cultures about differences in practices. This theory can be seen in Figure 22, which shows the Union model. Concluding, behaviors of an individual are dependent on whether they involve practices or values, and thus on which culture level is dominant.
4.3 ORGANIZATIONAL CULTURE This study focuses on the influence of organizational culture on satisfaction of the employee with his/her workspace. Of the different levels of culture, only the organizational culture will be studied, and not the professional culture. In the 1980s, organizational culture emerged as a concept for studying companies (Ax & Greve, 2017). The definitions of organizational culture all have in common the focus on shared beliefs, values and assumptions between the employees of an organization, which make it distinct from other organizations (Schein, 1985; Ax & Grave, 2017; Detert et al., 2000; Jung et al., 2009; Özçelik et al, 2016). An organizational culture arises when a group is created by its founders (Schein, 2015). It evolves depending on the leaders, who can set new examples, and can slowly change when new behavior leads to more desirable results. In mature organizational cultures, often the smaller sub-units of the organization change, which over the course of years affects the organizational culture as a whole (Schein, 2015).
Organizational culture
National culture
Heroes
Rituals
Symbols
Practices Values
FIGURE 22. UNION MODEL, ADAPTED FROM HOFSTEDE (1991)

42
It is generally assumed that the organizational culture has a large influence on the behavior of employees (Jung et al., 2009; Ax & Greve, 2017; Singh, 2013). The importance of organizational culture for a company is explained further by Kotler et al. (1990). He states that behind every successful corporation, there is an organizational culture that fits the overall strategy. Furthermore, organizational culture is seen as an important element for organizational innovativeness (Tushman & O’Reilly, 1997). This is confirmed in the research of Matinaro & Liu, which names organizational culture as a key aspect of innovativeness and sustainability (2017). Therefore, organizational culture is considered a form of organizational capital (Barney, 1985). The values of an individual and the organization he/she works for can differ. However, which values of the individual are dominant depends on the situation and are chosen by assigning a worth, or pecking order, to the values (Dudley, 1995). These individual values are stable (Karahanna et al., 2005), but according to James, values can be re-ordered and therefore aligned with the values of the organization (2014, p. 97). This means that organizations can create value congruence, meaning that the individual values are consistent with the organizational values. Consistency between employees’ values helps to achieve higher organizational and employee performance (Sadri, 2014), as well as increased job satisfaction (Diskienė & Goštautas, 2013), as seen in Figure 23.
4.4 ORGANIZATIONAL CULTURE FRAMEWORKS Organizational culture can be analyzed by different methods, or frameworks. In the following paragraphs, the methods of Schein (2004), Hofstede (1998), Goffee & Jones (1998) and Cameron & Quinn (2005) are explored. They are explained from the makers’ viewpoint and reviewed by researchers that have used their method. Furthermore, similarities and differences between the frameworks are analyzed.
4.4.1 SCHEIN’S LEVELS OF CULTURE Schein (2004) analyzes organizational culture on different levels, ranging from very explicit levels such as a visible organizational structure or dress code, to a deeply embedded level that is felt unconsciously. Schein (2015) argues that shared values give employees operating principles and guides the behavior of the top management, see Figure 24. He focuses on the values, since they are more easily studied (Wiewiora et al., 2013). A culture is studied with this framework by conducting in-depth interviews and observations, often in a group context (Schein, 1993; Schein, 2015). It can be concluded that Schein’s levels of culture can be best applied in studies that have the resources to do in-depth interviews and observations. For time-
Organizational values
Individual values
Job satisfaction
Artifacts
Shared Values
Underlying assumptions
Levels of Culture Schein
FIGURE 23. MODEL IMPACT OF INDIVIDUAL AND ORGANIZATIONAL VALUES, ADAPTED FROM DISKIENĖ & GOŠTAUTAS (2013)
FIGURE 24. THREE LEVELS OF
CULTURE, ADAPTED FROM SCHEIN
(2015)

43
constrained studies, this would take too long. Also, this method focuses on single organizations. When studying multiple organizations, every organization is thoroughly analyzed, but the results are difficult to compare because of the method by which the three levels are constructed. The values of each company can differ and Schein provides no method for categorizing them or for comparing individual values.
4.4.2 HOFSTEDE’S ORGANIZATIONAL DIMENSIONS Another framework was developed by Hofstede in 1984 to measure national culture on four dimensions, with a fifth dimension added in 1991. These dimensions are: power distance, uncertainty avoidance, individualism vs. collectivism, masculinity vs. femininity and long-term vs. short-term orientation. These dimensions of national culture have been used to describe organizational cultures (Hofstede, 2001). In 1998, Hofstede developed a framework for organizational culture, the dimensions of which are seen in Figure 25. Short descriptions of the dimensions in Hofstede’s framework for organizational culture are:
- Process oriented vs. results oriented This is about whether employees are more concerned with means, or with goals. In process oriented cultures, importance is placed on avoiding risks, time-efficiency and routine. In contrast, results oriented cultures focus on optimal performance, stress resistance and seeking new challenges (Hofstede, 1998).
- Employee oriented vs. job oriented This dimension differentiates between a concern for people, and for getting the job done. An employee oriented culture takes into account the individual problems of employees, with emphasis on group decisions, and look after employee welfare. On the other hand, in a job oriented culture employees feel pressure to get the job done and it is perceived that the organization is only interested in the work they do (Hofstede, 1998).
- Parochial vs. professional In this dimension, organizational cultures are compared on how they derive their identity. The identity can arise from the company, or from the jobs themselves. In a parochial culture, employees feel that the norms of the company are the same as their own. Social conventions play an important role when hiring new employees. Furthermore, employees trust the company to guide them. Employees in a professional culture try to separate their work life from their personal life. Job competence is most important when hiring, and employees plan their own future (Hofstede, 1998).
- Open system vs. closed system
Employee oriented vs. Job oriented
Process oriented vs. Results oriented
Parochial vs. Professional
Open system vs. Closed system
Loose vs. Tight control
Normative vs. Pragmatic
Organizational Cultural
Dimensions
FIGURE 25. ORGANIZATIONAL CULTURAL, ADAPTED FROM HOFSTEDE (2001)

44
The organizational culture is classified as open or closed. In an open system culture, the company and its employees welcome newcomers to the organization. The time which it takes for new employees feel included in the organization is often no more than a few days. In a closed system culture, the employees are seen as secretive and closed by outsiders as well as insiders. Only a select few can join the organization and frequently need more than a year to feel included in the organization (Hofstede, 1998).
- Loose vs. tight control This dimension is about the internal structure of the company. In a loose culture, cost is not of importance, deadlines are flexible and it is fine to make jokes about the organization or jobs. A tight control culture is the opposite: meeting times are kept punctually, and there are severe consequences for not meeting deadlines (Hofstede, 1998).
- Normative vs pragmatic The final dimension concerns how customer orientated the organizational culture is. In a normative culture, the organizational procedures must be followed correctly even if the results suffer because of it. There are high business ethics and honesty standards. In a pragmatic culture, employees are market-driven. The results for the customer are of the highest importance and bending of the companies’ procedures is allowed if this better fits the needs of the customer (Hofstede, 1998).
Hofstede’s organizational dimensions have been used in research by Madanchian & Taherdoost (2015). They state that: “The Hofstede’s theory of organizational culture can be a great theory for use when it comes to analyzing a country’s culture. On the other hand, Hofstede himself (1997) pointed out that the averages of a country do not relate to individuals of that country. Even though, this model has proven to be quite often accurate when applied to the general population” (2015, p. 1082). In a bibliometric study into culture, the conclusion from Ferreira et al, was: “It is a fact that Hofstede’s cultural dimensions hold highest notoriety and are the most cited. Moreover, alternative cultural taxonomies have resorted to Hofstede’s taxonomy and several studies have noted high correlation among cultural dimensions. Therefore, we are reasonably confident that we have a sample that is also representative of the work on culture and international business” (2014, p. 393). It can be concluded that Hofstede’s organizational dimensions are recommended for studies into international companies and national culture. The framework has less use for studies that want to research employees’ satisfaction with the work environment.
4.4.3 GOFFEE AND JONES MATRIX The third method of analyzing an organizational culture was developed by Goffee & Jones in 1996. Their method looks at organizational culture through the lens of sociology, in which two types of distinct human relations are visible, namely sociability and solidarity (Goffee & Jones, 1996). Their definitions of sociability and solidarity are:

45
“Briefly, sociability is a measure of sincere friendliness among members of a community. Solidarity is a measure of a community’s ability to pursue shared objectives quickly and effectively, regardless of personal ties” (Goffee & Jones, 1996, p. 134). These two dimensions can be plotted in a matrix, as seen in Figure 26. Four types of organizational cultures are the result: networked, communal, mercenary and fragmented cultures. Short descriptions of these cultures are:
- Networked organization High Sociability – Low Solidarity This organizational culture can be seen as a family in which connections are the way to move forward in the company. Their key competencies are collecting and selectively spreading soft information, and to acquire sponsors or allies for the company who support the organization formally and informally (Goffee & Jones, 1996).
- Communal organization High Sociability – High Solidarity In this organizational culture, employees mix work and private life together. Risks and rewards are equally distributed between employees, with fairness and justice as important values. Winning is an important organizational goal (Goffee & Jones, 1996).
- Mercenary organization Low Sociability – High Solidarity For employees of a mercenary organization, work and private life are separated. Job competence and results are highly valued. This causes companies with a mercenary organizational culture to be very productive. However, only when goals between units in the company correspond, the units or employees will cooperate (Goffee & Jones, 1996).
- Fragmented organization Low Sociability – Low Solidarity This organizational culture is characterized by a low consciousness of organizational membership. It is a closed system in which employees are secretive to each other. Companies with this culture often fail to come to an agreement when it comes to organizational objectives. Companies which rely heavily on outsourcing or have become virtual can have this culture (Goffee & Jones, 1996).
The method of Goffee and Jones to analyze organizational culture has been applied in studies by Malagas et al. (2016) and by Calzada et al. (2011). Both their conclusions point to a desirable
High Sociability
Low Sociability
High
Solid
arity Low
So
lidar
ity
Networked Communal
Fragmented Mercenary
Two Dimensions, Four Cultures
FIGURE 26. ORGANIZATIONAL CULTURE MATRIX, ADAPTED FROM
GOFFEE & JONES (1996)

46
organizational culture with high sociability (Malagas et al., 2016) and/or solidarity (Calzada et al., 2011). This implies that a ranking can be made for the most desirable out of the four organizational cultures, independent of the type of company. Goffee and Jones (1996) suggest that a fragmented organizational culture may be beneficial depending on the situation, but most often is not beneficial. This would mean that the matrix of Goffee and Jones can be best applied to companies who want to research their organizational culture on sociability and solidarity.
4.4.4 CAMERON AND QUINN’S COMPETING VALUES FRAMEWORK The final method to analyze the organizational culture is the Competing Values Framework (CVF) of Cameron and Quinn. They focus on explaining the value orientations of different types of organizational culture (Cameron & Quinn 2006). The six key characteristics of the organizational culture are: dominant characteristics, organizational leadership, management of employees, organizational glue, strategic emphasis and criteria of success. Furthermore, the framework is based on two dimensions of organizational effectiveness: the organizational focus and the preference for structure (Holloway, 2014). In a matrix, they define four organizational cultures that “represent opposite or competing assumptions” (Cameron & Quinn, 2006, p. 35); see Figure 27. Thus, each end of the continuum has two core company values that contrast with the two core company values on the other end. These values are:
Flexibility & Discretion vs. Stability & Control Internal focus & Integration vs. External focus & Differentiation
These dimensions form four organization cultures: clan, adhocracy, hierarchy and market culture. Each culture consists of basic assumptions, orientations and values. The CVF is mostly used to determine the dominant culture of an organization at a specific time (Cameron & Quinn, 2006). The four cultures can be characterized and exemplified as follows:
- Clan culture Flexible – Internal In a clan culture, employees consider themselves part of an extended family. Teams are of great importance, rather than the individual. Participation, commitment and loyalty are highly regarded values. Employees stimulate each other to grow and see customers as partners. The company makes sure that it remains a humane work environment. An example company with this clan culture is Tom’s of Maine, an all-natural hygiene producer.
- Adhocracy culture Flexible – External The adhocracy culture is based on quickly adapting, being flexible and being creative when the situation is uncertain or ambiguous. Teams arise when the task needs it, and disband when finished. This means that the power of the company flows from individual to individual depending on what is needed. Individuality, risk taking and future anticipation are important values. An example is the Apollo 13 space mission, where when different problems arose, leadership changed to adapt to the situation (Cameron & Quinn, 2006).
- Hierarchy culture Stable – Internal

47
An organization with a hierarchy culture can be seen as a formalized and structured place. The company optimizes its operation by the use of procedures, formal rules and policies. Long-term goals are stability, predictability and efficiency. Examples of this organizational culture include McDonald’s, Ford Motor Company and the U.S. Justice Department (Cameron & Quinn, 2006).
- Market culture Stable – External In this culture, transactions with external constituencies (e.g. suppliers, customers, contractors) are of importance. The objectives of an organization with this culture include profitability, bottom-line results and strength in market niches. Therefore, the core values of the market culture are competitiveness and productivity. Examples of companies with this culture are Philips Electronics from early 1990s to mid-1990s, and General Electric under ex-CEO Welch. Both companies focused on being the best in their market and selling sub-businesses when they were not (Cameron & Quinn, 2006).
The CVF framework of Cameron & Quinn has been validated in different international contexts (Lamond, 2003; Wiewiora et al., 2013; Fong & Kwok, 2009; Naoum et al., 2015; Jaeger & Adair, 2013). CVF has, according to Arditi et al., “an excellent track record in studying the organizational culture profiles of construction organizations in several studies” (Arditi et al., 2016, p.140). In comparison to the matrix of Goffee and Jones, the CVF provides four equal organizational cultures that cannot be categorized in positive or negative cultures.
4.5 CONCLUSION In this chapter, multiple theories, definitions and methods to analyze organizational culture have been discussed. The goal of the literature study into organizational culture was to find the best suited method for this research. The Three levels of Culture from Schein would be a good model if the timeframe of the present study would allow it. However, this method of analyzing organizational culture would better be suited for studying one company, since it allows no easy comparison. Hofstede’s framework is best suited for international companies and studies that aim for average results of the entire company, instead of individual results. Goffee and Jones’ matrix categories provide mainly information on what areas the organizational culture should improve on or excels in. Of the four analyzed frameworks, Cameron and Quinn’s Competing Values Framework emerges as the best suited for the present study, on the grounds that it has been validated in numerous research papers, can be conducted in a short period of time and allows for comparison between multiple companies.
Flexibility and Discretion
Stability and Control
External Fo
cus an
d D
ifferentiatio
n
Inte
rnal
Fo
cus
and
Inte
grat
ion
Clan Adhocracy
Hierarchy Market
Competing Values Framework
FIGURE 27. THE COMPETING VALUES FRAMEWORK, ADAPTED FROM
CAMERON & QUINN (2006)

48
To conclude, the research question this chapter set out to answer is: What are the different organizational culture types? There are four different organizational culture types: Clan, Adhocracy, Hierarchy and Market culture. They differ from each other by their levels of flexibility and focus. In Figure 28, the research model is shown, expanded with the four organizational culture types of the Cameron & Quinn framework as current and preferred.
Satisfaction with support
of needs
Personal characteristics
Employee needs
Workspace use
Organizational culture
Satisfaction with work
environment
Now: Clan Adhocracy Market Hierarchy Preferred: Clan Adhocracy Market Hierarchy
FIGURE 28. CONCEPTUAL MODEL ORGANIZATIONAL CULTURE EXPANDED

49
5. RESEARCH MODEL In this chapter, the literature review in Chapter 2, 3 and 4 of this study are discussed. First, the definitive conceptual model is presented, based on the findings of the literature review from the previous chapters. The model is then used to formulate the hypotheses which will be tested in the remainder of this study.
5.1 CONCEPTUAL MODEL A preliminary conceptual model was developed in Chapter 1, which was subsequently expanded using the conclusions from the literature reviews of Chapters 2, 3 and 4. In Chapter 2, workspace characteristics were identified and different workspace concepts were explored. Chapter 3 examined personal characteristics, employee needs and satisfaction with support of those needs. Different methods of analyzing organizational cultures were evaluated in Chapter 4. Together, Chapters 1 through 4 form the basis for the definitive conceptual model, which is shown in Figure 29. Organizational culture and personal characteristics are independent variables, which influences the dependent variables; workspace use, employee needs and satisfaction with support of needs. These dependent variables have mediating roles for the independent variables with the overall satisfaction with the work environment, which is also a dependent variable. In the next section, hypotheses for each relationship in the conceptual model are formulated, based on the literature review.
5.2 HYPOTHESES The hypotheses are based on the relationships between the different aspects of the conceptual model, as shown in Figure 29 on the next page. Relationships may exist between all the variables of each aspect, but to keep it concise only the hypotheses of the arrows in the model are formulated. Hypotheses for the employee needs will be formulated first, followed by hypotheses relating to the workspace use. Finally, hypotheses about the satisfaction with the support of needs are formulated. Employee needs Various studies have indicated that personal characteristics have an effect on the employee needs. For example, a positive relationship exists between extraversion and communication (Oseland, 2009), while openness affects the extent of personalization (Wells & Thelen, 2002). Moreover, the research of Hartog (2015) found a significant effect of gender on office climate and privacy. Based on these findings, the first hypothesis is:
H1. Personal characteristics relate to employee needs. When analyzing the four organizational cultures in Chapter 4, it can be assumed that certain cultures have an increased emphasis on certain needs. For instance, communication is important for a clan culture, while for a hierarchy culture, the need of status expression is of importance. Therefore, the following hypothesis is formulated:
H2. Organizational culture relates to employee needs.
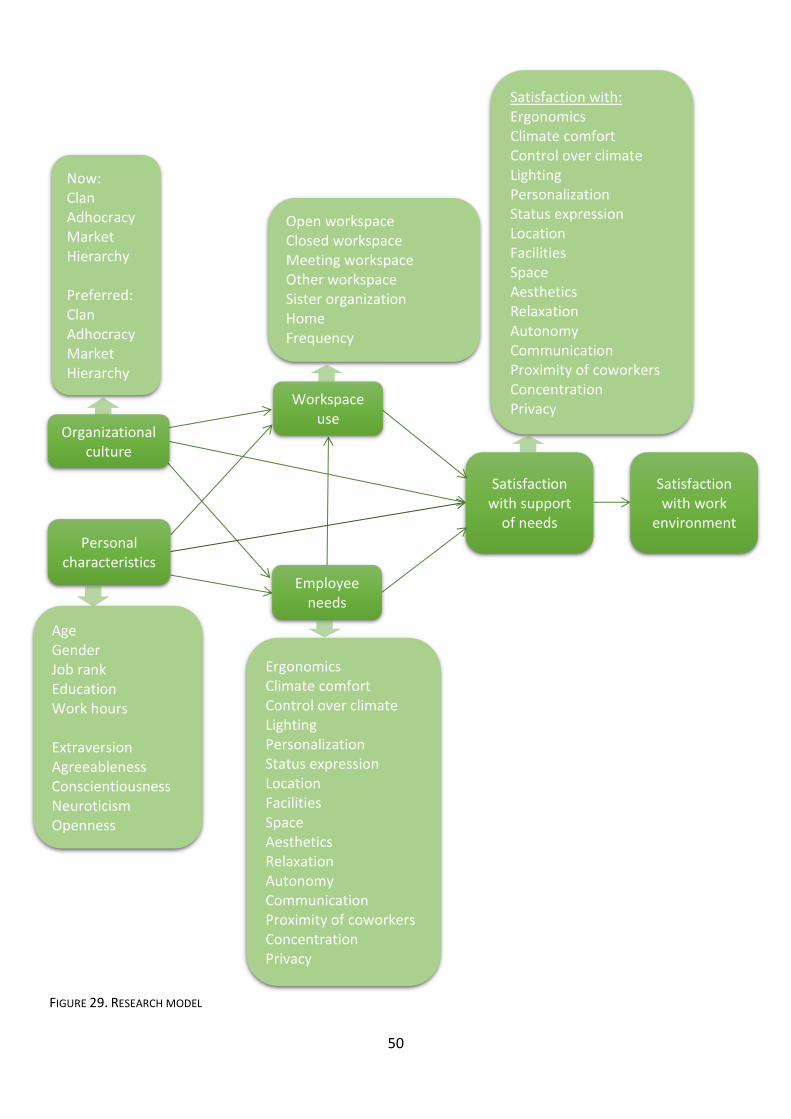
50
Satisfaction with support
of needs Personal
characteristics
Employee needs
Age Gender Job rank Education Work hours Extraversion Agreeableness Conscientiousness Neuroticism Openness
Ergonomics Climate comfort Control over climate Lighting Personalization Status expression Location Facilities Space Aesthetics Relaxation Autonomy Communication Proximity of coworkers Concentration Privacy
Workspace use
Organizational culture
Open workspace Closed workspace Meeting workspace Other workspace Sister organization Home Frequency
Satisfaction with: Ergonomics Climate comfort Control over climate Lighting Personalization Status expression Location Facilities Space Aesthetics Relaxation Autonomy Communication Proximity of coworkers Concentration Privacy
Satisfaction with work
environment
Now: Clan Adhocracy Market Hierarchy Preferred: Clan Adhocracy Market Hierarchy
FIGURE 29. RESEARCH MODEL

51
Workspace use According to the research of Appel-Meulenbroek et al (2011), personal preferences of needs have a substantial effect on workspace use. An employee with a strong need for communication would most likely use different workspaces than an employee with a need for privacy. This leads to the following hypothesis:
H3. Employee needs relate to workspace use of employees. In Chapter 3, the literature review supports the influence of personal characteristics on workspace use. For example, Joy & Haynes (2011) found that the personal characteristic age influences how employees use workspaces. Additionally, job rank has shown a significant effect on satisfaction with the activity-based workspace (Hartog, 2015). This leads to the hypothesis:
H4. Personal characteristics relate to workspace use of employees. Similar to the effects of organizational culture on employee needs, employees in different organizational culture types may use workspaces differently. For instance, employees in an organization with the adhocracy culture, focused on being creative, probably use brainstorm workspaces more often than those in a hierarchy culture, which values predictability. Therefore, the following hypothesis is formulated:
H5. Organizational culture relates to workspace use of employees. Satisfaction with needs For the satisfaction with the work environment, needs are of importance. For example, when needs for privacy are higher, employees are dissatisfied more easily. This has proven to have a significant effect, according to the studies of Budie (2016) and Hartog (2015). For the conceptual model, the hypothesis is:
H6. Employee needs relate to employee satisfaction with the support of needs. Earlier research done by De Been & Beijer (2014) has found significant relationships between satisfaction and personal characteristics. This has been confirmed by the research of Budie (2016), as well as the research of Hartog (2015), who found that age had a significant effect on satisfaction with the physical aspects of multi-tenants offices. Therefore, the following hypothesis is formed:
H7. Personal characteristics relate to employee satisfaction with the support of needs. Organizational culture has a direct influence on employee satisfaction through the employee-organization relationship, according to Alegre et al. (2016). When employees share the organization’s mission, their satisfaction increases (Bart et al., 2001). Thus, the following hypothesis can be formulated:
H8. Organizational culture relates to employee satisfaction with the support of needs.

52
The research of Hartog concluded that work environment and workspace type have significant effects on user satisfaction with the physical characteristics (2015, p.88). Other studies agree with these findings, such as De Been & Beijer (2014), in which a significant relationship is found between workspace types and satisfaction. This is supported by Appel-Meulenbroek et al. (2011), who concluded that a relationship exists between workspace misuse and loss of productivity and dissatisfaction. This was also supported by research by Hoendervanger et al. (2015). Therefore, the following hypothesis is formulated:
H9. Workspace use relates to employee satisfaction with the support of needs. Satisfaction with the work environment According to the literature review of Chapter 4, satisfaction with the support of needs contributes to the overall satisfaction with the work environment, as was confirmed by research by Budie (2016) and Kim & de Dear (2013). In accordance with the Person-Environment fit theory (Heijs, 2006), a relationship exists between satisfaction with the work environment and the needs of the employee. This leads to the final hypothesis:
H10. Satisfaction with the support of needs relates to overall satisfaction with the work environment.

53
6. METHODOLOGY The hypotheses formulated in the previous chapter give a preliminary indication of the cohesion between the different aspects of the research question. In this chapter, the methodology is discussed. First, the survey method is explained by operationalization of the aspects of the research model. This is followed by a description of the way in which data are prepared, and concluded by an explanation of the statistical analyses that will be conducted on the collected data.
6.1 OPERATIONALIZATIONS To study the previously formulated hypotheses, a quantitative research method survey will be held. This allows the collection of data on a large number of research units in a specific time period. The survey will be based on the previously formulated hypotheses by operationalization of the aspects and values and can be seen in Appendix 1. The data types are analyzed to make sure that they are of a high enough measurement level. This means it should be at least on ordinal level and preferably on continuous level.
6.1.1 WORKSPACE USE In Chapter 2, six different types of workspaces have been identified. These variables are the workspace types that employees can use. Workspace usage will be measured by asking the employees how much time they spend per week using a certain type of workspace. Also, how frequent employees use the same workspace will be asked with a five-point Likert-scale. In Table 1, the operationalization of workspace use can be seen.
TABLE 1. OPERATIONALIZATION OF WORKSPACE USE
Variable Level of measurement
Items
% Time spent at open workspace Ratio
Open question
% Time spent at closed workspace Ratio
% Time spent at meeting workspace Ratio
% Time spent at other workspace Ratio
% Time spent at sister organization Ratio
% Time spent at home Ratio
Frequency of workspace use Ordinal Scale (5): 1=very dissatisfied
5=very satisfied
6.1.2 ORGANIZATIONAL CULTURE Of the four analyzed frameworks for organizational culture, Cameron and Quinn’s Competing Values Framework emerged as the best suited. The variables of the organizational culture for this study have therefore been based on the key characteristics by Cameron and Quinn (2006). To measure these variables, the questionnaire of Cameron and Quinn (2006) will be used, for both the current situation and the preferred situation. These two situations could provide an useful insight when satisfaction is low (innvire, 2017). In Table 2, the operationalization of organizational culture can be seen. The questionnaire of Cameron and Quinn can be viewed in Appendix 1, part 3.

54
TABLE 2. OPERATIONALIZATION OF THE ORGANIZATIONAL CULTURE
Variable Level of measurement
Items
Current Clan Ordinal
Scale (100): Divide 100
points between four
statements
Current Adhocracy Ordinal
Current Market Ordinal
Current Hierarchy Ordinal
Preferred Clan Ordinal
Preferred Adhocracy Ordinal
Preferred Market Ordinal
Preferred Hierarchy Ordinal
6.1.3 PERSONAL CHARACTERISTICS Studies into employee satisfaction often include personal characteristics (Oseland, 2009; Rothe et al., 2012; Kim & de Dear, 2013; De Been & Beijer, 2014). In Table 3, the characteristics that have a proven effect on satisfaction with the work environment or employee needs can be seen, based on the literature review of Chapter 3.
TABLE 3. OPERATIONALIZATION OF PERSONAL CHARACTERISTICS
Variable Level of measurement Items
Age Ratio Open question
Gender Nominal 1=male 2=female
Job rank Nominal 1=intern 2=supporting staff 3=regular employee 4=manager 5=board member
Work hours Ratio Open question
Education Ordinal 1=secondary 2=vocational 3=undergraduate 4=postgraduate
Additionally, personality traits have proven to have an effect on satisfaction. In order to determine the personality of employees, the Big Five taxonomy will be used in this study. It was concluded previously that this method of categorizing personality has been validated by research (Hartog, 2015). The Big Five personality traits will be measured with the Ten-Item Personality Indicator (TIPI) by Gosling et al. (2003). This method has been applied in previous studies (Budie, 2016; Hartog, 2015) and has proven to be sufficiently accurate for studies whose main subject is not personality. The operationalization of the TIPI can be seen in Table 4. To make sure that the translation from English to Dutch does not transform critical in a positive word, a translation of combative is used instead.

55
TABLE 4. OPERATIONALIZATION OF BIG FIVE PERSONALITY
Variable Level of measurement
Items
Extraversion: Extraverted, enthusiastic Reserved, quiet
Ordinal Ordinal
Scale (7): 1=strongly disagree
7=strongly agree
Agreeableness: Sympathetic, warm Critical, quarrelsome
Ordinal Ordinal
Conscientiousness: Dependable, self-disciplined Disorganized, careless
Ordinal Ordinal
Neuroticism: Calm, emotionally stable Anxious, easily upset
Ordinal Ordinal
Openness: Open to new experience, complex Conventional, uncreative
Ordinal Ordinal
6.1.4 EMPLOYEE NEEDS In Chapter 3, an extensive look was taken at the possible employee needs. With the help of an extensive study done by Budie (2016), the variables of employee needs have been determined and can be seen in Table 5. To measure these variables, direct questions will be asked to identify the importance of these needs for each employee. This was also done previously by Fleming (2005).
TABLE 5. OPERATIONALIZATION OF EMPLOYEE NEEDS
Variable Level of measurement
Items
Ergonomics Ordinal
Scale (5): 1=not important
at all 5=very important
Climate comfort Ordinal
Control over climate Ordinal
Lighting Ordinal
Personalization Ordinal
Status expression Ordinal
Facilities Ordinal
Location Ordinal
Space Ordinal
Aesthetics Ordinal
Relaxation Ordinal
Autonomy Ordinal
Communication Ordinal
Proximity of coworkers Ordinal
Concentration Ordinal
Privacy Ordinal

56
6.1.5 SATISFACTION The variables of satisfaction with the support of needs and overall satisfaction with the work environment can be seen in Table 6. To measure these variables, direct questions will be asked in the questionnaire to score the satisfaction with each indicator. This has previously been done by, among others, Van Susante (2014) and De Been & Beijer (2014). The questions will be slightly different from those for employee needs, since the work environment should offer the possibility to fulfill the needs. Also, overall satisfaction with the work environment will be asked directly, as the literature review has concluded this is generally done in other studies.
TABLE 6. OPERATIONALIZATION OF SATISFACTION
Variable Level of measurement
Items
Ergonomics Ordinal
Scale (5): 1=very
dissatisfied 5=very
satisfied
Climate comfort Ordinal
Control over climate Ordinal
Lighting Ordinal
Personalization Ordinal
Status expression Ordinal
Facilities Ordinal
Location Ordinal
Space Ordinal
Aesthetics Ordinal
Relaxation Ordinal
Autonomy Ordinal
Communication Ordinal
Proximity of coworkers Ordinal
Concentration Ordinal
Privacy Ordinal
Overall satisfaction with work environment
Ordinal Grade (10): 1 lowest 10 highest
6.2 DATA PREPARATION For a cohesion research question, the correlation between the terms is calculated in order to determine the precise relationship between the variables (Baarda & Goede, 2006, p.50). To calculate the correlation, the collected data first needs to be prepared. It must be determined that the questions which measure a factor point in the same direction (Baarda & Goede, 2006, p.262). In other words, a high score on a question should point to a high factor for all questions on the that factor. The collected data will also be checked to determine if they show a common distribution, and whether there is incomplete data or data that should be excluded. First, a frequency calculation will be done to check for coding and typographical errors. To check for a distribution, a histogram is made which should resemble a normal distribution. To combine data from different questions for one factor, the Cronbach’s Alpha or Inter-Item correlation is calculated to verify that the questions measure the same thing (Baarda & Goede, 2006, p.275). Then, a factor analysis can be conducted to compute the new factors of the combined variables. These methods will generate a database on which a statistical data analysis can be conducted.

57
6.3 STATISTICAL ANALYSES Correlation between factors can be determined with a regression analysis. However, since the conceptual model is likely to contain direct and indirect relationships between the factors, a path analysis is more suited (Budie, 2016). A path analysis is based on multiple regression analyses with the addition that the effect of independent variables on dependent variables can also be determined through third variables. This analysis can be conducted with the computer program LISREL. The path analysis will test the research model. To ensure that this model does not become overly complex, bivariate analyses using SPSS will be carried out first. This ensures that only the significant relationships between the variables are added to the path model.
6.3.1 METHODOLOGICAL JUSTIFICATION To test the previously formulated hypotheses, an experiment can be conducted or a survey can be held. The hypotheses imply causality between the factors, and thus ideally an experiment should be held. This would allow the researcher to control all the factors that influence the hypotheses, which means that the collected data will not be influenced by unknown factors that can have a large impact on the cohesion between factors. However, setting up an experiment to study this would require both significantly more time and resources than those available within the scope of the present study. To meet the time constraints of this graduation project, the choice is therefore made to perform a survey to collect data to test the hypotheses (Baarda & Goede, 2006).
6.4 CONCLUSION In this master thesis, the combined effect of organizational culture, personal characteristics, workspace use and the importance of needs on satisfaction with needs and with the overall work environment is assessed. In order to determine these effects, field research will be conducted. The data sample used in this study will consist of the survey results from employees of consultancy firm Twynstra Gudde, the municipality of Deventer and housing corporation Zayaz. Since these organizations all have an activity-based office, it can be justified that the data from the three organizations can be combined into one database. The questionnaire will be distributed by email, with the use of the program WPA. In the next chapter, the collected data will be prepared for analysis with the use of the statistical program SPSS Statistics. During the preparation, the distributions are checked, outliers are analyzed and data reduction is conducted. Data reduction will be done with the use of factor analyses. In Chapter 8, bivariate analyses will be conducted to identify the relevant variables, showing significant relationships, which will subsequently be used in the path analysis in Chapter 9.

58
7. DATA DESCRIPTION In the previous chapter, the research approach was presented and the variables and analysis methods that will be used were discussed. In this chapter, the data that is collected in this study will be described. Since no suitable data involving all four aspects of the research model was already available, new data was collected from three organizations that have implemented activity-based offices. To this end, a survey was held which encompassed the workspace use, organizational culture, personal characteristics, employee needs and employee satisfaction with the support of needs, as well as the overall work environment. In the following sections, first a definitive sample is determined, after which the demographic data will be explored. External validity, education, job rank, working hours and personality are described. Additionally, the distribution of the workspace use is explained. The organizational culture of the three organizations and of the total sample are subsequently explored and visualized with radar charts. Finally, the employee needs are discussed on how important they are perceived by the employees and how satisfied they are with the support of needs.
7.1 DEFINITIVE SAMPLE The quantitative data which is used in the present study was collected with the use of a questionnaire by WPA. The questionnaire was filled in by 501 employees from three organizations. Out of this total, 12 cases are disregarded. In these cases, each statement regarding the organizational culture was filled in identically, giving the same answer to each of the twelve questions. This data was removed from the sample to ensure that the information on organizational culture is not contaminated. Two of the cases filled in a year of birth of 1990. These cases are included in the data sample, but with the value for age omitted. In total, year of birth was not filled in in twenty cases. Furthermore, three cases had missing values on work hours. These cases are included in the data sample. The total number of usable cases is 489.
7.2 DEMOGRAPHIC DATA In this section, the demographic data will be discussed. A short overview is given first, followed by an assessment of the external validity of the data sample. The demographic data of the sample can be found in Table 7. Respondents of the questionnaire are from three different organizations: Organization 1 (n=328), Organization 2 (n=112) and Organization 3 (n=49). Of the total sample of n=489, 50.1% is male and 49.9% is female. The mean age is 46.7 (std. dev. = 10.8) for n = 469. For analysis in the next chapter, the cases with missing age will be supplemented with random ages based on the normal distribution of the total sample, drawn randomly for each case. On average, respondents to the questionnaire work 33.2 hours per week (std. dev. = 6.2). In Organization 1 the mean is 31.9 hours (std. dev. = 6.2), at Organization 3 32.4 hours (std. dev. = 5.5), while the highest mean is found at Organization 2, at 37.4 hours per week (std. dev. = 4.8). The level of education is relatively high, with 22.5% having completed MBO, 38.9% having completed HBO, and 34.2% with a university degree. Only 4.5% completed high school as their highest education. Employees are the group with the largest representation in the questionnaire, at 73.6% of all respondents. Here, employees are defined as respondents who are neither supporting staff members nor managers. 12.9% of the respondents are managers, 10.8% are supporting staff, 1.6% are interns and 1.0% are board members.

59
TABLE 7. DEMOGRAPHIC DATA OF THE SAMPLE
Location Organization 1 Organization 2 Organization 3 Total
Age
Mean 48.9 39.4 46.0 46.7
Work hours per week
Mean 31.9 37.4 32.4 33.2
Count Percent Count Percent Count Percent Count Percent
Respondents 328 67.1% 112 22.9% 49 10.0% 489 100%
Gender
Male 164 50.0% 62 55.4% 19 38.8% 245 50.1%
Female 164 50.0% 50 44.6% 30 61.2% 244 49.9%
Level of education
High School 18 5.5% 0 0% 4 8.2% 22 4.5%
MBO 92 28.0% 10 8.9% 8 16.3% 110 22.5%
HBO 152 46.3% 14 12.5% 24 49.0% 190 38.9%
WO 66 20.1% 88 78.6% 13 26.5% 167 34.2%
Function
Intern 4 1.2% 4 3.6% 0 0.0% 8 1.6%
Supporting staff 43 13.1% 9 8.0% 1 2.0% 53 10.8%
Employee 246 75.0% 78 69.6% 36 73.5% 360 73.6%
Manager 32 9.8% 20 17.9% 11 22.4% 63 12.9%
Board member 3 0.9% 1 0.9% 1 2.0% 5 1.0%
7.2.1 EXTERNAL VALIDITY The external validity of the sample is checked using the demographic data. Since the research is performed with respondents from three different types of companies in the Netherlands, the distribution of the demographic data is compared to the working population of the Netherlands. In addition, information from a similar study by De Been & Beijer (2014) is added. In Table 8, the comparison is made between the total working population of the Netherlands in the first quarter of 2017 (CBS, 2017), the sample of the present study, and the research of De Been & Beijer (2014). It can be seen that a slightly higher percentage of the current sample is female, when compared to the average Dutch working population. Furthermore, the first two age groups are underrepresented, while the age groups from 35-64 are overrepresented. In order to compare education levels, the original variables are recoded according to the statistics of the CBS (2017). The CBS lumps HBO and WO together to form the category high education level. When comparing to the similar study of Budie (2016), HBO, WO, as well as the MBO education level show similar percentages. The companies from which the current sample was taken have a higher average education level compared the total working population. This means that the external validation is higher for similar companies. Thus, conclusions should be applied cautiously to the whole working population.

60
TABLE 8. COMPARISON FOR EXTERNAL VALIDATION
Sample N = 486
Budie (2016) N = 322
Total working population (CBS)
Gender
Male 50.0% 60.6% 53.4%
Female 50.0% 39.4% 46.6%
Age
15-24 9 (1.9%) 3.1% 15.5%
25-34 60 (12.8%) 16.6% 20.6%
35-44 119 (25.4%) 31.6% 20.1%
45-54 148 (31.6%) 24.4% 24.3%
55-64 126 (26.9%) 24.4%
17.2%
65-74 7 (1.5%) 2.2%
Education
High School 22 (4.5%) 0.6% 21.6%
MBO 110 (22.5%) 28.0% 42.4%
HBO & WO 357 (73.0%) 71.4% 36.0%
7.2.2 EDUCATION Education is recoded into three new categories, as seen in Table 9. Here, High School together with MBO forms one category, while the categories HBO and WO remain distinct for reasons of clarity. The education level is distributed reasonably normal, with a mean of 2.07, std. dev. = 0.78 over the total sample of N = 489.
TABLE 9. RECODING EDUCATION
Original categories New categories, after recoding
High School 22 (4.5%) High School & MBO
132 (27.0%) MBO 110 (22.5%)
HBO 190 (38.9%) HBO 190 (38.9%)
WO 167 (34.2%) WO 167 (34.2%)
7.2.3 JOB RANK Job ranks are recorded into similar categories as education level, as can be found in Table 10. Intern and supporting staff form the low job rank, employee forms the moderate job rank, while manager and board member forms the high job rank. As can be seen, almost 74% of the sample has a moderate job rank. The lower and higher job ranks are of comparable size.
TABLE 10. RECODING JOB RANK
Original categories New categories, after recoding
Intern 8 (1.6%) Low 61 (12.5%)
Supporting staff 53 (10.8%)
Employee 360 (73.6%) Moderate 360 (73.6%)
Manager 63 (12.9%) High 68 (13.9%)
Board member 5 (1.0%)
7.2.4 WORKING HOURS The mean number of workings hours is 33.2 hour per week (std. dev. = 6.2), with a minimum of 8 hours per week and a maximum of 40. The median is 36. This implies that on average, a

61
large part of the sample works fulltime. Similar studies show an average of 35.1 hours per week (Batenburg & Van der Voordt, 2008). In the data sample, working hours were not filled in three times, whose values were replaced by the mean of the total sample.
TABLE 11. DESCRIPTION WORKING HOURS
Organization
1 Organization
2 Organization
3 Total
Study (Batenburg & Van der
Voordt)
FTE
Mean 31.9 37.4 32.4 32.2 35.1
Std. dev
6.2 4.8 5.5 6.2
N 325 112 49 486
7.2.5 PERSONALITY Personality is measured using the Ten Items Personality Indicator test by Gosling et al. (2003). Extra care was taken when translating the reversed aspects of agreeableness. Earlier research has shown that in the Dutch language, critical can be considered positive instead of the opposite of sympathetic. To combine the positive and reversed variables of each pair of the five personality traits, the Inter-Item correlation is checked. For this, the values of the reversed variable is recoded. The recoding is used to reverse the values, since the variable is the opposite of the positive variable. The personality traits with the TIPI indicators and the inter-item correlation can be seen in Table 12.
TABLE 12. PERSONALITY AND INTER-ITEM CORRELATION
Positive Reversed
Inter-Item Correlation
Extraversion Extraverted, enthusiastic Reserved, quiet 0.342
Agreeableness Sympathetic, warm Critical, quarrelsome 0.057
Conscientiousness Dependable, self-disciplined
Disorganized, careless 0.399
Emotional stability Calm, emotionally stable Anxious, easily upset 0.398
Openness Open to new experiences Conventional, uncreative 0.410
When analyzing the Inter-Item correlation of the different personality traits, it can be noticed that the Inter-Item correlation for agreeableness is very low. This means that despite the different translation, quarrelsome is not seen as the opposite of sympathetic. For this personality trait, the two variables will therefore not be combined. To make sure its values are of a similar magnitude to the other combined variables, the values of the agreeableness variable are doubled. This was also done in previous studies (Budie, 2016; Hartog, 2015). The Inter-Item correlation of the other four variables are all above 0.30, which means they are acceptable (Fields, 2009). Therefore, the items are combined, see Table 13. It can be seen that the employees in the sample are only slightly more extravert than introvert. The remaining four personality traits are on average above neutral.

62
TABLE 13. DESCRIPTIONS OF THE PERSONALITY VARIABLES
Mean Std. Deviation Similar research (Budie, 2016)
Extraversion 8.8 2.5 8.3
Agreeableness 11.2 2.0 11.2
Conscientiousness 12.3 1.9 11.6
Emotional stability 11.2 2.2 11.2
Openness 11.1 2.0 11.0
7.3 WORKSPACE USE The fraction of time spent at the workspaces can be seen in Table 14. The open workspace is by far the most used workspace. However, it is striking to see that Organization 2 has a comparatively very low mean percentage of 22%, compared to 61% at Organization 1 and 56% at Organization 3. The closed workspace, meeting workspace, with clients or sister companies and at home all have an average value of around 10%. When zooming in on Organization 2, it stands to notice that the workspace with clients is the most used workspace. Meeting workspace, other workspace and home have similar means across the companies. Other and other workspaces are recoded to the variable other workspaces, which has the lowest mean of the total sample.
TABLE 14. DESCRIPTIONS WORKSPACE USE VARIABLES
Organization 1
Organization 2
Organization 3
Total
Mean Mean Mean Mean Std. Dev.
Open workspace 61.0% 22.2% 55.9% 51.6% 31.3%
Closed workspace 8.8% 11.4% 4.7% 9.0% 19.2%
Meeting workspace 12.2% 9.5% 14.1% 11.8% 12.5%
Other workspace 5.8% 6.1% 9.3% 6.2% 10.7%
With clients or sister companies
3.5% 38.7% 3.1% 11.5% 21.1%
Home 8.7% 12.1% 13.0% 9.9% 10.6%
When looking at the distributions of these variables, it is found that they are not normally distributed, as seen in figures 30-35. Every workspace except the open workspace is not used by a large number of the respondents. This means that they cannot be used as interval variables. Therefore, these variables are recoded into nominal dummy variables. These dummy variables will indicate if the workspace is used or not, as found in Table 15. Even though a loss of information occurs when recoding, these variables still maintain the information of which workspaces are used. Also, since no longer is relied on correct estimates of employees on how much percentage per week they spend at a work space, they are in that regard more accurate.

63
FIGURE 30. DISTRIBUTION OPEN WORKSPACE FIGURE 31. DISTRIBUTION CLOSED WORKSPACE
FIGURE 32. DISTRIBUTION MEETING WORKSPACE FIGURE 33. DISTRIBUTION OTHER WORKSPACE
FIGURE 34. DISTRIBUTION SISTER ORGANIZATION FIGURE 35. DISTRIBUTION HOME

64
TABLE 15. RECODED WORKSPACE USE VARIABLES
Yes No
Open workspace 458 (93.7%) 31 (6.3%)
Closed workspace 200 (40.9%) 289 (59.1%)
Meeting workspace 349 (71.4%) 140 (28.6%)
Other workspace 218 (44.6%) 271 (55.4%)
With clients or sister companies 178 (36.4%) 311 (63.6%)
Home 315 (64.4%) 174 (35.6%)
Finally, frequency of workspace use was asked on a five-point Likert scale. This variable has a mean of 3.9, with 4 standing for regularly, and a standard deviation of 1.0. The description of the frequency can be seen in Table 16. Respondents sit regularly at one workspace, particularly so at Organization 1. An One-Way ANOVA with a Post Hoc Tukey test showed that there is a significant difference between Organization 1 and Organization 2, as well as Organization 1 and Organization 3. These results can be found in Appendix 6.
TABLE 16. DESCRIPTION FREQUENCY USE OF WORKSPACE PER COMPANY
Organization 1
Organization 2
Organization 3
Total
FTE Mean 4.01 3.62 3.61 3.88
Std. dev. 0.98 0.98 1.04 1.00
7.4 ORGANIZATIONAL CULTURE In Table 17, the geometric mean of every dimension per culture can be seen. This was measured with two questions per dimension. Each question has four statement, between which the respondent must divide 100 points. This means it is ipsative data and therefore the geometric mean is used instead of the harmonic mean. In order to obtain one variable per culture type, the variables are recoded. According to Cameron & Quinn (2006), the four statements of the question each correspond to a culture. To calculate the average score that each culture type has been given, the geometric mean of the four statements, divided over six questions, is calculated and subsequently rescaled to add up to 100. This is done according to the method of Holloway (2014). For the geometric mean, the value 0 is replaced by the lowest possible value 1, since the geometric mean of any set containing 0 is also 0 by its definition. Using this data, the organizational culture profile is generated for each company as well as for the total sample, which can be seen in Figure 36, Figure 37 and Figure 38.

65
FIGURE 36. ORGANIZATIONAL CULTURE PROFILE ORGANIZATION 1
FIGURE 37. ORGANIZATIONAL CULTURE PROFILE ORGANIZATION 2
FIGURE 38. ORGANIZATIONAL CULTURE PROFILE ORGANIZATION 3
0
10
20
30
40
50Clan
Adhocracy
Market
Hierarchy
Organization 1
Now
Preferred
0
10
20
30
40
50Clan
Adhocracy
Market
Hierarchy
Organization 2
Now
Preferred
0
10
20
30
40
50Clan
Adhocracy
Market
Hierarchy
Organization 3
Now
Preferred

66
For Organization 1, the current organizational culture is dominated by hierarchy and market types. However, the respondents from this company would prefer a stronger clan and adhocracy organizational culture. Organization 2 currently has mostly a clan and market organizational culture. The preferred culture has less market, more adhocracy and a similar amount of clan culture than is currently present. Organization 3 has a very dominant clan culture, which would be preferred to be even stronger. Conversely, hierarchy culture is also present in the organizational culture, while the respondents from this company would prefer it to become less prominent.
TABLE 17. ORGANIZATIONAL CULTURE VALUES PER COMPANY
Organization 1 Organization 2 Organization 3
Now Pref. Now Pref. Now Pref.
Clan 21.2 33.1 31.2 31.4 44.9 50.2
Adhocracy 17.4 27.8 22.6 36.2 19.1 22.3
Market 29.7 17.8 28.1 21.2 13.5 12.0
Hierarchy 31.8 21.2 18.1 11.2 22.5 15.5
The organizational culture of the total sample can be seen in Table 18 and Figure 39. Organizational culture profile total. Considered this way, there are large differences between the current organizational culture and the preferred organizational culture. The two most prevalent types of current organizational culture, Market and Hierarchy, are preferred to be much less prominent, while the two organizational culture types which received the lowest current scores, Clan and Adhocracy, are preferred by employees to be a lot more dominant.
TABLE 18. ORGANIZATIONAL CULTURE VALUES TOTAL
Total
Now Std. Dev. Pref. Std. Dev.
Clan 25.9 15.6 34.5 14.4
Adhocracy 18.8 9.7 29.2 12.1
Market 27.7 17.4 18.0 9.2
Hierarchy 27.7 15.7 18.3 11.3
0
10
20
30
40
50Clan
Adhocracy
Market
Hierarchy
Total
Now
Preferred
FIGURE 39. ORGANIZATIONAL CULTURE PROFILE TOTAL

67
7.5 EMPLOYEE NEEDS In the questionnaire, the importance of employee needs was asked using a five-point Likert scale. In the data that was provided, the scores ranged from -2 to 2. This was recoded into scores ranging from 1 to 5. In Table 19, the means of the needs are shown, ranked according to importance. In Appendix 8, the histograms of the variables can be seen. The four most important needs have a normal distribution that is somewhat skewed negatively. The most important need is the comfort of the indoor climate, which also has the second lowest standard deviation. This indicates that the climate comfort is generally important for most employees. Lighting, concentration and facilities also score high on importance, with a somewhat higher standard deviation. Concentration and privacy score very differently on importance, which supports the premise that they are different needs. Status expression is ranked lowest, with a mean value that stands for not important. Personalization is also low ranked, with a mean value of 3.34, when a value of 3.00 is neutral. Comparing this sample with the sample from the research done by Budie (2016), it stands to notice that similar results were found. The only significant differences are with autonomy and personalization, which were both perceived considerably more important in this sample compared to Budie’s. In Appendix 4, a one-way ANOVA test can be found, in which the needs of proximity of coworkers, control over climate, personalization, status expression, aesthetics, location and facilities proved to be significantly different across the companies.
TABLE 19. DESCRIPTION EMPLOYEE NEEDS IMPORTANCE
Organization
1 Organization
2 Organization
3 Total
Study Budie (2016)
Mean Mean Mean Mean S.d. Mean
Comfort climate 4.39 4.31 4.49 4.38 0.72 4.17
Lighting 4.30 4.39 4.27 4.32 0.76 4.19
Concentration 4.25 4.31 4.08 4.25 0.78 4.22
Facilities 4.06 4.56 4.18 4.19 0.77 -
Ergonomics 4.15 4.25 4.14 4.17 0.82 4.05
Communication 4.06 4.17 3.98 4.07 0.71 4.04
Space 4.03 4.10 3.96 4.04 0.80 3.75
Autonomy 3.95 3.82 4.10 3.93 0.80 3.52
Proximity of coworkers
3.87 4.15 3.82 3.92 0.81 3.63
Control climate 4.03 3.39 3.96 3.88 0.98 3.72
Location 3.55 4.38 3.41 3.73 0.91 -
Privacy 3.50 3.31 3.37 3.44 0.86 3.25
Aesthetics 3.20 3.77 3.35 3.35 0.93 3.01
Relaxation 3.37 3.31 3.33 3.35 0.88 3.01
Personalization 3.62 2.49 3.51 3.34 1.21 2.91
Status expression
2.11 1.79 1.88 2.01 0.98 2.16

68
7.5.1 FACTOR ANALYSIS To determine the underlaying dimensions of the needs, a factor analysis is conducted. For this, SPSS is used with a principal component analysis, using a varimax rotation to give orthogonal components. The number of dimensions is based on the eigenvalues, which should be higher than 1 (Fields, 2009). Table 20 shows the results of this analysis, while the full factor analysis can be found in Appendix 2 and in Appendix 7 the differences between companies. The components can be interpreted as:
- Component 1 covers the comfort of the workspace. The variables comfort indoor climate and control over climate and lighting are high on this component. These variables have an obvious link to the climate comfort of the workspace. Ergonomics and space are mediocre on the component, and both relate to how the comfort of workspace is experienced. Sufficient space ensures no perceived discomfort of the workspace or the feeling that it is overcrowded.
- Component 2 is the most diverse component and will be named workplace. The two highest needs in this component are location and aesthetics. The location and appearance of the workspace have a high influence on how well the workplace of the workspace is received. Other needs that are relatively high into this component are facilities, communication and proximity of coworkers. The first need is a relatively high scoring variable, that influences everything employees could require from objects in their workplace. The second need refers to importance of being able to communicate well in the workspace. This is also influenced by the proximity of coworkers.
- Component 3 covers the personalization of the workspace. The needs status expression and personalization are high on this component. These needs consider how the employee would like to have their workspace adjusted to their wishes. The needs relaxation and autonomy are mediocre on the pleasantness component. These needs relate to how the work environment allows them to choose their activities and to have time off from work.
- Component 4 is the privacy dimension. Only two needs, concentration and privacy, are represented in this component, which both are very high. These are related, as a higher privacy improves the concentration.
TABLE 20. RESULTS OF PRINCIPAL COMPONENT ANALYSIS IMPORTANCE NEEDS
Component
1. Comfort 2. Workplace 3. Personalization 4. Privacy
Concentration .769
Privacy .795
Communication .610
Proximity of coworkers .546
Ergonomics .633
Space .596
Comfort indoor climate .840
Control over climate .745
Lighting .732
Personalization .616
Status expression .690
Relaxation .502
Autonomy .454

69
Aesthetics .697
Location .702
Facilities .620
Eigenvalue 4.125 2.006 1.437 1.123
% of variance explained 25.8% 12.5% 9.0% 7.0% Extraction Method: Principal Component Analysis. Rotation Method: Varimax with Kaiser Normalization.
a. Rotation converged in 5 iterations.
The four components cover 54% of the variance of the original variables. These new variables will be used in the bivariate analyses and path analysis.
7.6 EMPLOYEE SATISFACTION In the questionnaire, satisfaction with the work environment related needs is investigated, whose needs are the ones covered in the previous section. Similarly, the five point Likert scale is used. In addition to the individual needs, the level of overall satisfaction with the work environment is asked. With this variable, both the five-point Likert scale as well as a scale from 1 to 10 were used. The questions regarding overall satisfaction were not placed together. In Table 21, the description of the data can be seen. A comparison is made with the research of Budie (2016). In Appendix 5, a one-way ANOVA was conducted, with the result that only the needs of proximity of coworkers and comfort climate did not significantly differ between the companies. As can be seen, the respondents are generally slightly more positive on the overall satisfaction with their work environment. There is a difference between the five-point Likert scale and the score from 1 to 10. The satisfaction measured with the Likert scale leans towards neutral on overall satisfaction, while the score from 1 to 10 is more positive, with an average of 6.9. A difference between the companies is also noticeable. Organization 2 scores much lower compared to Organization 3, with neutral satisfaction compared to positive satisfaction at Organization 3. When looking at the whole satisfaction of needs with all the activity-based offices, employees are most satisfied with location, proximity of coworkers, ergonomics and facilities. Both ergonomics and facilities are scored as important needs. Respondents are least satisfied with control over climate, comfort indoor climate and concentration. Comfort over indoor climate and concentration both scored very high on importance. In similar research by Budie (2016), satisfaction of proximity of coworkers and ergonomics scored high, while both comfort indoor climate and control over climate scored low.

70
TABLE 21. DESCRIPTION SATISFACTION WITH NEEDS
Organization 1
Organization 2
Organization 3
Total Study Budie (2016)
N = 328 N = 112 N = 49 N = 493 N = 322
Mean Mean Mean Mean Std. Dev.
Mean
Location 3.89 4.12 4.10 3.97 0.87 -
Proximity of coworkers
3.77 3.88 4.00 3.82 0.80 3.93
Ergonomics 3.87 3.12 3.86 3.70 0.87 3.72
Facilities 3.73 3.34 3.80 3.65 0.88 -
Space 3.63 3.33 3.66 3.56 0.91 3.82
Aesthetics 3.86 2.46 4.00 3.55 1.02 3.51
Communication 3.46 3.63 3.84 3.54 0.80 3.67
Autonomy 3.48 3.38 3.96 3.51 0.85 3.48
Personalization 3.37 3.31 3.68 3.39 0.74 3.33
Status expression
3.31 3.16 3.48 3.29 0.66 3.27
Relaxation 3.33 2.99 3.48 3.27 0.73 3.32
Lighting 2.93 3.68 3.82 3.19 1.10 3.70
Privacy 3.04 3.13 3.40 3.10 0.88 3.42
Concentration 2.81 2.96 3.24 2.89 0.99 3.39
Comfort climate 2.69 2.74 2.82 2.71 1.07 3.07
Control over climate
2.42 2.70 2.70 2.52 1.00 2.93
Overall satisfaction Likert
3.31 3.06 4.12 3.33 1.18 3.72
Overall satisfaction grade
6.85 6.65 7.80 6.90 1.33 -
7.6.1 FACTOR ANALYSIS To determine the underlying dimensions of the satisfaction with needs, a factor analysis is conducted. Similar to the previous analysis of importance of needs, SPSS is used with a principal component analysis, while a varimax rotation is used to give orthogonal components. A factor analysis restricted to four components gives the following results, seen in Table 22 and Appendix 3. The components can be interpreted as:
- Component 1 is the privacy dimension. Concentration and privacy are very high in this dimension. They are related, since a higher privacy improves the concentration. Communication as well as proximity of coworkers and autonomy are loaded mediocre on the privacy dimension. These are variables that have a less direct connection with privacy, but each of the variables affect the perception of privacy and the ability to concentrate.
- Component 2 is the workplace. The two highest needs in this component are ergonomics and aesthetics. These are related to the furniture and interior design of

71
the workplace. Space and facilities also relatively high on the component workplace. These two variables have a direct link with the workplace.
- Component 3 covers the comfort of the workspace. The variables comfort indoor climate and control over climate and lighting are high on this component. These variables have a direct link to the climate comfort of the workspace.
- Component 4 covers the personalization of the workspace, which is high on status expression. This variable describes how well employees can express their rank in the company and is logically a part of personalization. The variables personalization and relaxation are relatively high. Of these two, personalization is self-explanatory, while relaxation could be present because with greater personalization, employees can choose which activities they conduct, even if it is just to relax between tasks.
TABLE 22. RESULTS OF PRINCIPAL COMPONENT ANALYSIS SATISFACTION WITH SUPPORT OF NEEDS
Component
1 Privacy 2 Workplace 3 Comfort 4 Personalization
Concentration .801
Privacy .825
Communication .572
Proximity of coworkers .437
Ergonomics .759
Space .615
Comfort indoor climate .842
Control over climate .853
Lighting .712
Personalization .616
Status expression .839
Relaxation .627
Autonomy .459
Aesthetics .701
Location .364
Facilities .641
Eigenvalue 4.82 1.70 1.35 1.13
% of variance explained 30.1 10.6 8.4 7.1 Extraction Method: Principal Component Analysis. Rotation Method: Varimax with Kaiser Normalization.
a. Rotation converged in 6 iterations.
Total variance explained is 56%. These new variables will be used in the bivariate analyses and path analysis.
7.7 CONCLUSION In this chapter, the data gathered with the questionnaire is described and prepared to be analyzed to answer the problem statement:
To what extent do differences in organizational culture, employee needs and workspace use, mediated by personal characteristics, affect employee satisfaction with the support of their needs and work environment in the activity-based office?

72
For this, data is collected regarding the four types of organizational culture, which was recoded from 48 variables to 8 variables. In these variables, the types of organizational culture are measured on current situation and preferred situation. The employee satisfaction is measured with 18 variables, which are reduced to 5 variables with a principal component analysis. The resulting variables are privacy, workplace, comfort, personalization and overall satisfaction with the work environment. The personal characteristics are measured with 15 variables, which are recoded into 10 variables. These variables are age, gender, job rank, education level, work hours and the personality variables: extraversion, agreeableness, conscientiousness, neuroticism and openness. The variables age and work hours occasionally contained missing data, which was filled in by drawing values randomly from the normal distribution of age, and by using the mean value for work hours. Agreeableness is the only variable that is recoded from a single variable instead of from two, because the Inter-Item correlation was not sufficiently high. Workspace use is measured with two variables: percentage of use of the different workspace types and work hours. Employee needs are measured with 16 variables, which are recoded into four variables using a principal component analysis. These variables are comfort, workplace, personalization and privacy. In Figure 40. Final research model, the research model can be seen with the adjustments of the variables. In the next chapter, bivariate analyses are conducted using the recoded data.

73
Satisfaction with support
of needs Personal
characteristics
Employee needs
Age Gender Job rank Education Work hours Extraversion Agreeableness Conscientiousness Neuroticism Openness
Comfort Workplace Personalization Privacy
Now: Clan Adhocracy Market Hierarchy Preferred: Clan Adhocracy Market Hierarchy
Workspace use
Organizational culture
Open workspace Closed workspace Meeting workspace Other workspace Sister organization Home Frequency Satisfaction with:
Privacy Workplace Comfort Personalization
Satisfaction with work
environment
FIGURE 40. FINAL RESEARCH MODEL

74
8. BIVARIATE ANALYSES In this chapter, the hypotheses discussed in chapter 5 are tested. In addition, research questions 4 through 7 are partly answered, regarding the relationships between organizational culture and personal characteristics with workspace use, importance of needs, satisfaction with needs and the overall satisfaction. As the bivariate analyses do not take into account the combined effects, these results offer support to the path analysis which is given in the next chapter. The bivariate analyses are performed on the collected data from the previous chapter, concerning the organizational culture, personal characteristics, workspace use, employee need and satisfaction. The variables will be related using different types of bivariate analysis, depending on the measurement level of the variable, to determine the significant relationships. The significant relationships (and related variables) will be included in the next chapter, the path analysis. Each section of this chapter covers an aspect that could be influenced by other variables, and only noteworthy results are discussed to keep the analysis concise. To this end, the complete research model is divided into four sections, which cover the relationships with workspace use, employee needs, satisfaction with needs, and with the overall satisfaction with the work environment respectively. To indicate significance in the tables, the asterisk symbol * is used. Here, a single asterisk * means that correlation is significant at the 0.05 level, and a double asterisk ** means that correlation is significant at the 0.01 level.
8.1 WORKSPACE USE In this section, the aspects that could influence workspace use are discussed to answer the research question: What are the effects of organizational culture, personal characteristics and employee needs on workspace use? These aspects can be seen in Figure 41. Using the Chi Square test and the independent sample t-test, relationships between the nominal variables concerning workspace use are tested.
Satisfaction with support
of needs Personal
characteristics
Employee needs
Workspace use
Organizational culture
Satisfaction with work
environment
FIGURE 41. ASPECTS THAT COULD AFFECT WORKSPACE USE

75
8.1.1 PERSONAL CHARACTERISTICS The personal characteristics variables which the significance of their relationship with workspace use will be tested are gender, job rank, education level, age, work hours and the five personality trait variables. In Figure 42. Significant relationships between personal characteristics and workspace use, an overview of the significant relationships can be seen and the results will be discussed with the aid of this figure. The first personal characteristic that will be tested is gender. Gender is a nominal variable; the Chi Square test will thus be used for the relationship with use of the workspace. An independent t-test will be conducted for the frequency of workspace use. In Table 23, the results of the analysis can be seen. Only one significant relationship is found, between gender and the use of workspaces at home.
TABLE 23. CHI SQUARE TEST GENDER AND WORKSPACE USE
Workspace use Gender Chi Square test
Male (n=245) Female (n=244) X2 Sig.
Open workspace Yes 93,9% 93,4%
0.039 .844 No 6,1% 6,6%
Closed workspace Yes 43,3% 38,5%
1.137 .286 No 56,7% 61,5%
Meeting workspace
Yes 73,9% 68,9% 1.511 .219
No 26,1% 31,1%
Other workspace Yes 47,3% 41,8%
1.521 .218 No 52,7% 58,2%
Sister organization or client
Yes 40,4% 32,4% 3.406 .065
No 59,6% 67,6%
Home Yes 69,8% 59,0%
6.197* .013 No 30,2% 41,0%
Independent t-test Mean Std. dev. Mean Std. dev. t Sig.
Frequency workspace 3.86 1.031 3.90 0.978 -0.400 .690
The second personal characteristic is the job rank of employees. This nominal variable is divided into three groups: low, moderate and high. For each group it is calculated if they use the workspace significantly differently compared to the other two groups. This was done with the Chi Square test and a one-way ANOVA. When the expected frequency of one group is small (smaller than 5 cases), the likelihood ratio is stated (Fields, 2009). It was found that only the closed workspace is not used differently depending on job rank, see Table 24.
TABLE 24. BIVARIATE ANALYSES JOB RANK AND WORKSPACE USE & FREQUENCY
Workspace use
Job Rank Chi Square test
Low (n=61)
Moderate (n=360)
High (n=68) X2 Sig.
Open workspace
Yes 85,2% 95,6% 91,2% LR: 8.466* .015
No 14,8% 4,4% 8,8%
Closed workspace
Yes 49,2% 38,1% 48,5% 4.573 .102
No 50,8% 61,9% 51,5%
Meeting workspace
Yes 62,3% 69,7% 88,2% 12.403** .002
No 37,7% 30,3% 11,8%

76
Other workspace
Yes 32,8% 44,7% 54,4% 6.097* .047
No 67,2% 55,3% 45,6%
Sister organization
Yes 18,0% 36,1% 54,4% 18.431** .000
No 82,0% 63,9% 45,6%
Home
Yes 54,1% 62,2% 85,3% 16.520** .000
No 45,9% 37,8% 14,7%
One-Way ANOVA Mean S.d. Mean S.d. Mean S.d. F Sig.
Frequency worksp. 4.31 0.807 3.89 0.982 3.41 1.096 13.749** .000
Third, the ordinal education level variable is related to workspace use, with the Chi Square test and one-way ANOVA, whose results can be seen in Table 25. All but the open workspace are used significantly differently depending on education level.
TABLE 25. CHI SQUARE TEST EDUCATION LEVEL AND WORKSPACE USE
Workspace use Education level Chi Square test
MBO (n=137) HBO (n=190) WO (n=167) X2 Sig.
Open workspace Yes 92,4% 93,2% 95,2%
1.096 .578 No 7,6% 6,8% 4,8%
Closed workspace
Yes 30,3% 44,2% 45,5% 8.461* .015
No 69,7% 55,8% 54,5%
Meeting workspace
Yes 47,7% 75,3% 85,6% 54.136** .000
No 52,3% 24,7% 14,4%
Other workspace Yes 26,5% 47,4% 55,7%
26.375** .000 No 73,5% 52,6% 44,3%
Sister organization
Yes 14,4% 27,4% 64,1% 89.543** .000
No 85,6% 72,6% 35,9%
Home Yes 43,2% 67,9% 77,2%
38.961** .000 No 56,8% 32,1% 22,8%
One-Way ANOVA Mean S.d. Mean S.d. Mean S.d. F Sig.
Frequency worksp. 4.33 0.904 3.91 0.932 3.50 1.011 28.015 .000
To test the relationships of the continuous variables with workspace use, independent sample t-tests are used. In Table 26 and the results can be seen of this bivariate analysis with age and work hours. To ensure that the test produced easily interpretable results, the answer yes to the use of the workspace was set as group one, and no as group two. Consequently, a negative relationship between age and workspace use means that older employees use the specific workspace less frequently. In Table 26, it can be seen that age had a significant negative effect on the use of workspaces at sister organizations. Furthermore, the amount of work hours of employees positively affects the use of other workspaces, workspaces at sister organizations or at clients, and working from home.
TABLE 26. RESULTS OF INDEPENDENT SAMPLE T-TEST BETWEEN AGE, WORK HOURS AND WORKSPACE USE
Age Work hours
Workspace use Mean Std. dev. t Sig. Mean Std. dev. t Sig.
Open workspace
Yes 46.44 10.727 -1.562 .119
33.18 6.144 -0.259 .770
No 49.55 10.658 33.52 7.066

77
Closed workspace
Yes 46.78 10.605 0.234 .815
33.45 6.136 0.726 .468
No 46.54 10.847 33.03 6.247
Meeting workspace
Yes 46.18 10.543 -1.480 .140
33.48 5.941 1.569 .117
No 47.77 11.169 32.51 6.772
Other workspace
Yes 46.23 10.530 -0.746 .456
34.07 5.754 2.833** .005
No 46.96 10.911 32.50 6.461
Sister orga. or client
Yes 43.35 11.205 -5.104** .000
35.47 5.310 6.677** .000
No 48.52 10.003 31.90 6.303
Home
Yes 45.95 10.278 -1.923 .055
34.08 5.469 3.975** .000
No 47.89 11.449 31.61 7.084
Finally, to test the five personality traits, the independent sample t-test is used. As these ordinal variables are normally distributed and measured with a five-point Likert scale, they can be treated as interval variables. In Table 27, Table 28 and Table 29, the results can be seen. When Levene’s test for equality of variance is significant (p<0.05), variances are not assumed to be equal (Fields, 2009). The relationships of the personality traits with the use of workspace are quite limited. Only seven significant relationships were found, which will be explained with Figure 42. Significant relationships between personal characteristics and workspace use
TABLE 27. RESULTS OF INDEPENDENT SAMPLE T-TEST BETWEEN PERSONALITY AND WORKSPACE USE, PART 1
Extraversion Agreeableness
Workspace use Mean Std. dev. t Sig. Mean Std. dev. t Sig.
Open workspace
Yes 8.79 2.501 0.095 .924
11.21 1.975 32.539 .512
No 8.74 2.556 10.90 2.521
Closed workspace
Yes 9.02 2.670 1.707 .088
11.31 1.991 1.096 .274
No 8.62 2.370 11.11 2.026
Meeting workspace
Yes 8.87 2.536 1.186 .236
11.21 1.986 0.429 .668
No 8.57 2.411 11.13 2.081
Other workspace
Yes 9.12 2.496 2.718** .007
11.24 1.917 0.476 .634
No 8.51 2.478 11.15 2.088
Sister orga. or client
Yes 8.91 2.567 0.848 .397
11.20 1.870 0.103 .918
No 8.71 2.465 11.18 2.092
Home
Yes 8.94 2.582 1.865 .063
11.21 1.991 0.333 .740
No 8.50 2.330 11.15 2.054
TABLE 28. RESULTS OF INDEPENDENT SAMPLE T-TEST BETWEEN PERSONALITY AND WORKSPACE USE, PART 2
Conscientiousness Emotional stability
Workspace use Mean Std. dev. t Sig. Mean Std. dev. t Sig.
Open workspace
Yes 12.24 1.875 -1.155 .249
11.23 2.176 -0.235 .815
No 12.65 1.780 11.32 2.441
Closed workspace
Yes 12.13 1.898 -1.378 .169
11.20 2.169 -0.278 .781
No 12.37 1.848 11.26 2.210
Meeting workspace
Yes 12.28 1.877 0.096 .924
11.39 2.107 2.393* .018
No 12.26 1.860 10.84 2.351
Other workspace
Yes 12.07 2.012 -2.059* .040
11.28 2.064 0.464 .643
No 12.43 1.735 11.19 2.292

78
Sister orga. or client
Yes 12.40 1.827 1.154 .249
11.40 2.223 1.309 .191
No 12.20 1.893 11.14 2.170
Home
Yes 12.08 2.046 -3.372** .001
11.30 2.139 0.973 .331
No 12.61 1.441 11.10 2.284
TABLE 29. RESULTS OF INDEPENDENT SAMPLE T-TEST BETWEEN PERSONALITY AND WORKSPACE USE, PART 3
Openness
Workspace use Mean Std. dev. t Sig.
Open workspace
Yes 11.13 2.036 -1.027 .306
No 11.52 2.234
Closed workspace
Yes 11.25 2.200 0.886 .387
No 11.08 1.938
Meeting workspace
Yes 11.28 1.998 2.116* .035
No 10.84 2.147
Other workspace
Yes 11.52 1.977 3.596** .000
No 10.86 2.061
Sister orga. or client
Yes 11.19 2.130 0.278 .781
No 11.13 2.005
Home
Yes 11.34 2.038 2.706** .007
No 10.82 2.032
TABLE 30. RESULTS OF PEARSON CORRELATION TEST BETWEEN AGE, WORK HOURS, PERSONALITY AND FREQUENCY
Frequency workspace
Pearson correlation r Sig.
Age 0.122** .007
Work hours -0.030 .512
Extraversion -0.127** .005
Agreeableness -0.016 .724
Conscientious. 0.091* .045
Emo. Stability -0.056 .215
Openness -0.176** .000
Figure 42 shows an overview of the results. For categorical variables with more than two groups, the relationships are displayed in yellow as there is no direction of the relationship. It is noteworthy that only age and conscientiousness have negative relationships with the use of certain workspaces, which means that the older and more conscientious employees are, the less they use a certain type of workspace. Moreover, only job rank has a significant effect on the use of open workspace, with moderate job ranks using this type of workspace more than expected, and low job ranks using it less than expected. In another study, the link between extraversion and the use of open workspaces was made (Oseland, 2009). This relationship was however not found here. For the use of closed workspaces, only the MBO education level uses this type of workspace significantly less than expected. The relationship between an increase of work hours and the use of workspace at home is in line with the expectation that additional work is done at home. For the types of workspace meeting, other, at sister organizations and home, differences in use exist between job rank groups and educational level groups . All these types of workspaces are used more by employees with a higher job rank and higher education.

79
It could be that the higher rank job requires more activities that are conducted in meeting rooms, at sister organizations or other types of workspaces. It is also possible that with a higher job rank, more work is done at home. The relationship with meeting rooms was also found by Budie (2016). Finally, in line with expectations, employees use the same workspace more frequently when they are older, introvert, closed and conscientious employees. A lower job rank and education level are also related to an increased use of the same workspace.
8.1.2 ORGANIZATIONAL CULTURE The organizational culture variables are measured at ordinal measurement level, but, similar to the personality traits, they can be treated as interval variables. To test the relationships of organizational culture with workspace use, independent sample t-tests are conducted. The results with the currently experienced organizational culture can be seen in Table 31 & Table 32, and the results of the preferred organizational culture can be seen in Table 33 & Table 34. Also, the results of the Pearson correlation test with frequency can be seen in Table 35.
FIGURE 42. SIGNIFICANT RELATIONSHIPS BETWEEN PERSONAL CHARACTERISTICS AND WORKSPACE USE
Age
Gender (m)
Job rank
Education
Characteristics
Closed
Meeting
Other
Sister organ.
Home
Open
Workspace
Extraversion
Agreeable.
Conscient.
Emo. Stability
Personality
Work hours
Openness
Frequency

80
TABLE 31. RESULTS INDEPENDENT SAMPLE T-TEST ORGANIZATIONAL CULTURE CURRENT AND WORKSPACE USE, PART 1
Current
Workspace use
Clan Adhocracy
Mean Std. dev. t Sig. Mean
Std. dev. t Sig.
Open Yes 25.87 15.830 0.050 .960
18.83 9.611 0.665 .506
No 25.73 11.606 17.63 10.842
Closed Yes 26.52 14.311 0.777 .438
18.81 9.167 0.115 .909
No 25.40 16.421 18.71 10.046
Meeting Yes 26.31 15.737 1.018 .309
18.93 9.310 0.641 .522
No 24.73 15.205 18.31 10.588
Other Yes 26.89 14.316 1.308 .192
19.40 8.584 1.368 .172
No 25.03 16.519 18.23 10.475
Sister org. Yes 28.42 15.618 2.769** .006
20.03 10.159 2.225* .027
No 24.39 15.404 18.02 9.343
Home Yes 27.17 15.024 2.513* .012
19.02 9.029 0.794 .428
No 23.49 16.337 18.26 10.785
TABLE 32. RESULTS INDEPENDENT SAMPLE T-TEST ORGANIZATIONAL CULTURE CURRENT AND WORKSPACE USE, PART 2
Current
Workspace use
Market Hierarchy
Mean Std. dev. t Sig. Mean
Std. dev. t Sig.
Open Yes 27.67 17.319 0.042 .967
27.63 15.633 -0.506 .613
No 27.54 18.787 29.11 16.781
Closed Yes 25.83 15.636 -2.005* .046
28.84 15.881 1.309 .191
No 28.93 18.434 26.95 15.543
Meeting Yes 26.42 15.737 -2.242* .026
28.34 15.894 1.367 .172
No 30.77 20.704 26.20 15.131
Other Yes 25.74 14.786 -2.138* .033
27.86 14.303 0.175 .862
No 29.13 19.141 27.61 16.754
Sister org. Yes 26.64 16.882 -0.983 .326
24.90 16.240 -3.035**
.003 No 28.25 17.682 29.34 15.164
Home Yes 25.38 14.938 -3.618**
.000 28.42 15.605
1.322 .187 No 31.79 20.540 26.46 15.820
TABLE 33. RESULTS INDEPENDENT SAMPLE T-TEST ORG. CULTURE PREFERRED AND WORKSPACE USE, PART 1
Preferred
Workspace use
Clan Adhocracy
Mean Std. dev. t Sig. Mean
Std. dev. t Sig.
Open Yes 34.84 14.363 2.296* .022
29.04 11.811 -0.866 .393
No 28.73 13.919 31.57 15.967
Closed Yes 33.28 12.867 -1.547 .123
30.38 11.678 1.797 .073
No 35.26 15.339 28.38 12.356

81
Meeting Yes 34.28 13.699 -0.403 .687
30.10 11.317 2.410* .017
No 34.90 16.054 26.96 13.682
Other Yes 33.84 12.940 -0.850 .395
31.63 11.630 4.039** .000
No 34.95 15.479 27.25 12.158
Sister org. Yes 32.25 11.788 -2.778**
.006 33.88 11.955
6.748** .000 No 35.72 15.577 26.52 11.383
Home Yes 34.09 13.026 -0.699 .485
30.94 10.989 4.123** .000
No 35.11 16.619 26.04 13.380
TABLE 34. RESULTS INDEPENDENT SAMPLE T-TEST ORG. CULTURE PREFERRED AND WORKSPACE USE, PART 2
Preferred
Workspace use
Market Hierarchy
Mean Std. dev. t Sig. Mean
Std. dev. t Sig.
Open Yes 17.92 9.191 -1.082 .280
18.20 11.236 -0.830 .407
No 19.76 9.084 19.94 11.604
Closed Yes 18.57 8.164 1.107 .269
17.77 9.542 -0.887 .375
No 17.66 9.828 18.68 12.304
Meeting Yes 18.18 8.810 0.434 .665
17.48 9.928 -2.273* .024
No 17.75 10.090 20.40 13.851
Other Yes 17.97 8.725 -0.139 .890
16.57 8.110 -3.259**
.001 No 18.09 9.555 19.72 13.102
Sister org. Yes 19.18 8.896 2.095* .037
14.70 8.888 -5.536**
.000 No 17.38 9.298 20.38 11.937
Home Yes 18.52 8.743 1.532 .126
16.44 8.670 -4.434**
.000 No 17.15 9.902 21.70 14.247
TABLE 35. RESULTS OF PEARSON CORRELATION TEST BETWEEN ORGANIZATIONAL CULTURE AND FREQUENCY
Frequency workspace
Pearson correlation r Sig.
Now
Clan -0.108* .017
Adhocracy -0.009 .850
Market 0.108* .017
Hierarchy -0.007 .878
Preferred
Clan 0.059 .194
Adhocracy -0.239** .000
Market -0.005 .910
Hierarchy 0.186** .000
In Figure 43, an overview of the results can be seen. Noticeable are the negative relationships of the current market culture and preferred hierarchy culture with workspace use. Employees who perceive a market culture, make significantly less use of closed, meeting, other and workspaces at home. Employees who prefer a hierarchy culture, make less use of the workspace types meeting, other, at sister organization or clients and at home. This can be

82
explained by the positive correlations that a current market culture and a preferred hierarchy culture have with the frequency of use of the same workspaces. This is confirmed by the current clan culture and a preferred culture of adhocracy, which both have a negative relationship with the frequency of use of the same workspace. Furthermore, the preferred organizational culture type clan positively affects the use of the open workspace. It was expected that a current clan culture also has a positive relationship, but this was not found. Also, the closed workspace only has a relationship with the current culture market. It was anticipated that the hierarchy culture, both currently and preferred, would also have a positive relationship with the use of closed workspaces, as these workspaces could express their status.
8.1.3 EMPLOYEE NEEDS The relationships of the employee needs with the use of different types of workspaces has been analyzed with an independent sample t-test, as these are interval and nominal variables. In Table 36 and Table 37 the results of tests can be seen. In Table 38 the results of the Pearson correlation test with the frequency can be seen. The relationships of the importance of needs with the use of workspaces is quite substantial. In Figure 44, an overview of all significant relationships is shown, which will be discussed next.
Clan
Adhocracy
Market
Hierarchy
Now
Clan
Adhocracy
Market
Hierarchy
Preferred
Closed
Meeting
Other
Sister organ.
Home
Open
Workspace
Frequency
FIGURE 43. SIGNIFICANT RELATIONSHIPS BETWEEN ORGANIZATIONAL CULTURE AND WORKSPACE USE

83
TABLE 36. RESULTS INDEPENDENT SAMPLE T-TEST EMPLOYEE NEEDS AND WORKSPACE USE, PART 1
Workspace use
Comfort Workplace
Mean Std. dev. t Sig. Mean
Std. dev. t Sig.
Open Yes 0.000 0.978 0.016 .987
0.013 0.964 0.758 .454
No -0.003 1.300 -0.187 1.444
Closed Yes -0.149 0.892 -2.847**
.005 0.061 0.988
1.118 .264 No 0.103 1.058 -0.042 1.008
Meeting Yes -0.069 0.970 -2.411* .016
0.069 0.994 2.422* .026
No 0.171 1.056 -0.172 0.997
Other Yes -0,053 0,919 -1.061 .289
0,112 1,041 2.227* .026
No 0,042 1,061 -0,090 0,959
Sister org. Yes -0,140 0,913 -2.359* .019
0,337 0,995 5.817** .000
No 0,080 1,039 -0,193 0,952
Home Yes -0,073 0,906 -2.049* .041
0,115 0,964 3.469** .001
No 0,133 1,142 -0,209 1,032
TABLE 37. RESULTS INDEPENDENT SAMPLE T-TEST EMPLOYEE NEEDS AND WORKSPACE USE, PART 2
Workspace use
Personalization Privacy
Mean Std. dev. t Sig. Mean
Std. dev. t Sig.
Open Yes 0.020 0.993 1.671 .095
-0.022 0.992 -1.849 .065
No -0.290 1.069 0.321 1.084
Closed Yes -0.053 1.033 -0.981 .327
0.165 0.965 3.058** .002
No 0.037 0.976 -0.114 1.009
Meeting Yes -0.088 1.003 -3.092**
.002 -0.015 1.003
-0.511 .610 No 0.219 0.961 0.036 0.996
Other Yes -0,029 1,044 -0.584 .560
-0,174 1,000 -3.495**
.001 No 0,024 0,964 0,140 0,979
Sister org. Yes -0,197 0,961 -3.324**
.001 0,052 0,974
0.868 .386 No 0,113 1,006 -0,030 1,015
Home Yes -0,022 0,966 -0.657 .512
0,008 0,949 0.231 .817
No 0,040 1,060 -0,014 1,089
TABLE 38. RESULTS OF PEARSON CORRELATION TEST BETWEEN IMPORTANCE OF NEEDS AND FREQUENCY
Frequency workspace
Pearson correlation r Sig.
Comfort 0.158** .000
Workplace -0.154** .001
Personalization 0.016 .725
Privacy -0.026 .572
It is noteworthy that none of the needs have a significant relationship with the use of the open
workspace. It was expected that employees who find privacy important, would use the open
workspace less. However, in Chapter 7 it was found that 94% of the respondents use the open

84
workspace. Therefore, it is probably used by employees as their regular workspace in the
activity-based office. Furthermore, the importance of comfort and personalization have
negative relationships with the use of workspaces. This means that when employees find
climate and status expression important, they use significantly fewer different types of
workspace. Correspondingly, the importance of comfort has a positive relationship with the
frequency of workspace use, meaning the more important employees find comfort, the less
they use workspaces that are closed, meeting, at sister organizations or at home.
Furthermore, the importance of the workplace (e.g. communication and the proximity of
coworkers) increases the use of workspaces. Similarly, the importance of the workplace has a
negative relationship with the frequency of workspace use, meaning that employees use more
types of workspace and make less use of a single workspace. Finally, when employees find
privacy important, the use of closed workspaces increases, as is in line with the expectations.
8.2 EMPLOYEE NEEDS In this section, the aspects that could influence employee needs and their importance are discussed to answer the research question: What are the effects of organizational culture and personal characteristics on employee needs? These aspects can be seen in Figure 45. Using an independent sample t-test, a one-way ANOVA and Pearson correlations, relationships between the variables concerning employee needs are tested.
Comfort
Workplace
Personal.
Privacy
Importance
Closed
Meeting
Other
Sister organ.
Home
Open
Workspace
Frequency
FIGURE 44. SIGNIFICANT RELATIONSHIPS OF IMPORTANCE OF NEEDS WITH WORKSPACE USE

85
8.2.1 ORGANIZATIONAL CULTURE The organizational culture is an interval variable; therefore, the Pearson correlation analysis is conducted. The results of this bivariate analysis can be seen in Table 39. There are 11 significant correlations in total between organizational culture and employee needs. A negative relationship means, for instance, that with a higher current adhocracy culture, the importance of comfort decreases for employees.
TABLE 39. RESULTS PEARSON CORRELATIONS ORGANIZATION CULTURE AND EMPLOYEE NEEDS
Comfort Workplace Personalization Privacy
Current r Sig. r Sig. r Sig. r Sig.
Clan -0.062 .172 0.167** .000 -0.119** .009 -0.087 .054
Adhocracy -0.138** .002 0.098* .031 -0.041 .364 -0.007 .877
Market 0.100* .027 -0.094* .037 0.065 .153 0.097* .031
Hierarchy 0.036 .427 -0.121** .007 0.072 .114 -0.017 .705
Preferred
Clan 0.071 .118 0.000 .994 0.067 .138 -0.008 .864
Adhocracy -0.063 .167 0.242** .000 -0.075 .099 -0.048 .285
Market -0.061 .178 0.050 .272 -0.095* .035 0.016 .725
Hierarchy 0.027 .557 -0.301** .000 0.072 .111 0.049 .279
In Figure 46, an overview of the effects of organizational culture on the importance of employee needs can be found. It is striking that the importance of the workplace (e.g. communication and location) has relationships with all current organizational cultures, and two preferred organizational cultures. The clan and adhocracy cultures show positive relationships with the importance of these needs for employees, while the market and hierarchy cultures affect it negatively. As communication is of importance for the flexible and team-based clan and adhocracy cultures, this is in line with the expectations. The importance of comfort (e.g. indoor climate and control over climate) has a negative relationship with adhocracy, but is positively affected by the current market culture type. This could be explained by the flexible nature of the adhocracy culture, in which employees are used to adapting quickly, while in the more stable market culture, employees do not want to be distracted by discomfort in order to be as productive as possible (Oseland, 2009; Cameron &
Satisfaction with support
of needs Personal
characteristics
Employee needs
Workspace use
Organizational culture
Satisfaction with work
environment
FIGURE 45. ASPECTS THAT COULD AFFECT EMPLOYEE NEEDS

86
Quinn, 2006). There is a negative relationship between personalization and the current organizational culture clan and the preferred culture market. As employees in a clan culture see each other almost like an extended family (Cameron & Quinn, 2006), it could be that status expression and autonomy, part of personalization, are less important. However, the relationship with the preferred culture market is unexpected, as an increase of the importance of status expression was anticipated. Finally, privacy has a positive relationship only with the current market culture. This was in line with expectations, as no interruptions in concentration increases productivity (Oseland, 2009). More relationships with privacy from the organizations were expected, especially negative relationships with the clan and adhocracy culture, since they work mostly team-based (Cameron & Quinn, 2006).
8.2.2 PERSONAL CHARACTERISTICS The personal characteristics that are included are age, gender, job rank, educational level, work hours and the five personality variables of extraversion, agreeableness, conscientiousness, emotional stability and openness. The measurements levels of these 10 variables differ. Age and work hours are ratio variables, gender and job rank are nominal variables, while education level is an ordinal variable. The employee needs and the five personality variables can be treated as interval variables, because they are roughly normally distributed and measured on the five-point Likert scale. To test the relationships of variables with employee needs, a number of bivariate analyses are conducted. For interval variables, the Pearson correlations is used. For interval variables and nominal/ordinal variables the independent sample t-test and one-way ANOVA are used, the choice between which depends on the groups that each variable has. The results of these tests are found in Table 40 and Table 41.
Clan
Adhocracy
Market
Hierarchy
Now
Clan
Adhocracy
Market
Hierarchy
Preferred
Comfort
Workplace
Personaliz.
Privacy
Importance
FIGURE 46. SIGNIFICANT RELATIONSHIPS ORGANIZATIONAL CULTURE WITH
IMPORTANCE NEEDS

87
TABLE 40. RESULTS BIVARIATE ANALYSES OF ASPECTS INFLUENCING EMPLOYEE NEEDS
Comfort Workplace Personalization Privacy
t-test t Sig. t Sig. t Sig. t Sig.
Gender -5,228** .000 -0.688 .492 0.013 .990 -0.946 .345
ANOVA F Sig. F Sig. F Sig. F Sig.
Job rank 1.429 .241 0.927 .397 0.692 .501 0.550 .577
Education level 4.527* .011 36.351** .000 17.069** .000 0.463 .630
TABLE 41. RESULTS PEARSON CORRELATION TEST WITH ASPECTS INFLUENCING EMPLOYEE NEEDS
Comfort Workplace Personalization Privacy
r Sig. r Sig. r Sig. r Sig.
Age 0.039 .385 -0.303** .000 0.235** .000 -0.013 .780
Work hours -0.190** .000 0.180** .000 -.068 .132 -0.046 .308
Extraversion 0.003 .956 0.181** .000 0.069 .128 -0.111* .014
Agreeableness 0.041 .371 0.053 .238 0.105* .020 -0.038 .400
Conscientious. 0.105* .020 -0.054 .237 -0.40 .382 0.101* .026
Emo. stability -0.092* .042 0.043 .348 0.020 .653 -0.023 .606
Openness -0.023 .611 0.142** .002 0.062 .173 -0.037 .412
Furthermore, in Table 42, the descriptions of the categorical variables are shown. Here can also be found the different groups that have a significant relationship, which is calculated with a Post Hoc Tukey test.
TABLE 42. DESCRIPTIONS GENDER AND EDUCATION LEVEL ON IMPORTANCE OF NEEDS
Comfort Workplace Personalization Privacy
Gender N Mean S.D. Mean S.D. Mean S.D. Mean S.D
Male 245 -0.230 0.986 -0.031 1.029 0.001 1.023 -0.043 1.000
Female 244 0.231 0.962 0.031 0.971 -0.001 0.978 0.043 1.000
Education level
High School & MBO
132 0.157 1.133 -0.296 0.923 0.392 0.916 0.045 1.012
HBO 190 0.047 0.953 -0.233 0.949 -0.043 0.946 0.021 0.955
WO 167 -0.177 0.916 0.499 0.927 -0.261 1.033 -0.059 1.043
In Figure 47, the results of the bivariate analyses can be seen. In total, 15 significant relationships can be found between personal characteristics and employee needs. On the importance of comfort, personal characteristics mostly have negative relationships, which means that a higher score on the respective personal characteristic is related to a lower importance of comfort. The negative effect of gender (male) was found as well in previous research (Karjalainen, 2007) and implies that female employees place more importance on the comfort and control over climate. Interesting to see is that employees find comfort less important when they work more or have a WO education level. When it comes to personality, diligent employees value comfort significantly, while emotional stability is related to a lower importance of comfort. Furthermore, the importance of the workplace (e.g. communication and location) is positively influenced by openness, extraversion and work hours, and negatively by age. The relationship between communication and extraversion was also found

88
by Oseland (2009). The relationships of age, extraversion and openness are expected, as younger employees collaborate more, while open and extravert employees communicate more (Rothe et al., 2011). The need for personalization is less important for employees with HBO and WO education level, and more important for agreeable and older employees. The positive correlation between agreeableness and importance of personalization is unexpected, as a negative correlation would be more logical. Finally, privacy is less important for extravert employees and more important for organized employees, which is supported by the literature (Barrick & Mount, 1991; Oseland, 2009).
8.3 EMPLOYEE SATISFACTION In this section, the aspects that could influence satisfaction with support of needs are discussed to answer the research question: What are the effects of organizational culture, personal characteristics, employee needs and workspace use on satisfaction with support of needs? These aspects can be seen in Figure 48. Using an independent sample t-test, one-way ANOVA and Pearson correlations, relationships between the variables concerning satisfaction with support of needs are tested.
Age
Gender (m)
Job rank
Education
Characteristics
Comfort
Workplace
Personaliz.
Privacy
Importance
Extraversion
Agreeable.
Conscient.
Emo. Stability
Personality
Work hours
Openness
FIGURE 47. SIGNIFICANT RELATIONSHIPS PERSONAL CHARACTERISTICS AND IMPORTANCE
OF NEEDS

89
8.3.1 ORGANIZATIONAL CULTURE As the organizational culture variables are of the interval measurement level, the Pearson correlation test is conducted to test for significant correlations between organizational culture and satisfaction with the support of needs. In Table 43 and Table 44, the results can be seen.
TABLE 43. RESULTS PEARSON CORRELATION CURRENT ORGANIZATIONAL CULTURE AND SATISFACTION NEEDS
Privacy Workplace Comfort Personalization
Now r Sig. r Sig. r Sig. R Sig.
Clan 0.218** .000 -0.102* .024 0.188** .000 0.081 .072
Adhocracy 0.057 .206 -0.034 .451 0.205** .000 -0.005 .919
Market -0.205** .000 -0.046 .309 -0.163** .000 -0.052 .248
Hierarchy -0.024 .592 0.174** .000 -0.132** .003 -0.020 .660
TABLE 44. RESULTS PEARSON CORRELATION PREFERRED ORGANIZATIONAL CULTURE AND SATISFACTION NEEDS
Privacy Workplace Comfort Personalization
r Sig. r Sig. r Sig. R Sig.
Clan 0.067 .137 -0.004 .934 -0.008 .868 0.083 .066
Adhocracy 0.053 .246 -0.062 .170 0.120** .008 0.031 .490
Market -0.004 .933 -0.106* .019 0.041 .361 -0.081 .074
Hierarchy -0.140** .002 0.158** .000 -0.153** .001 -0.074 .102
First, it is found that satisfaction with personalization is not influenced by the organizational culture. Negative relationships between the hierarchy culture type and personalization were expected, as status expression is part of this culture type (Cameron & Quinn, 2006). It is also found that satisfaction with comfort is significantly correlated with all four organizational culture types. However, while clan and adhocracy have a positive correlation, market and hierarchy have a negative correlation, meaning that the former two are more satisfied whereas the latter two are less satisfied with the support of comfort. These differences can be explained by the flexible nature of the former two organization cultures, and the stability of the latter two. Finally, satisfaction with the workplace (e.g. ergonomics and aesthetics) is positively affected by a current and preferred hierarchy culture, and negatively affected by a current clan and a preferred market culture. This means that employees with a current culture
Satisfaction with support
of needs Personal
characteristics
Employee needs
Workspace use
Organizational culture
Satisfaction with work
environment
FIGURE 48. ASPECTS THAT COULD AFFECT SATISFACTION WITH SUPPORT OF NEEDS

90
clan or a preferred culture market are less satisfied with facilities and space, while employees who perceive, or prefer, the culture as hierarchy are more satisfied with the workplace.
8.3.2 PERSONAL CHARACTERISTICS To test for the relationships between personal characteristics variables and satisfaction with support of needs, a number of bivariate analyses are conducted. For interval variables, the Pearson correlation is used. For interval variables and nominal/ordinal variables, the independent sample t-test and one-way ANOVA is used, choosing each as suited to the groups the variables have. In Table 45, the results of these first two analyses can be seen with the variables gender, job rank and education level. Additionally, in Table 46 the descriptions of the group variables can be seen. Furthermore, in Table 47 the results of the Pearson correlation test are shown. In total, 15 significant correlations are found between personal characteristics and satisfaction with the support of needs.
TABLE 45. BIVARIATE ANALYSES WITH ASPECTS THAT INFLUENCE SATISFACTION WITH NEEDS
Privacy Workplace Comfort Personalization
t-test t Sig. t Sig. t Sig. t Sig.
Gender -0.703 .482 -1.672 .095 4.992** .000 -1.434 .152
ANOVA F Sig. F Sig. F Sig. F Sig.
Job rank 0.349 .706 1.758 .173 1.742 .176 2.313 .100
Clan
Adhocracy
Market
Hierarchy
Now
Clan
Adhocracy
Market
Hierarchy
Preferred
Privacy
Workplace
Comfort
Personaliz.
Satisfaction
FIGURE 49. SIGNIFICANT RELATIONSHIPS ORGANIZATIONAL CULTURE WITH SATISFACTION

91
Education level 5.743** .003 13.379** .000 12.065** .000 0.883 .414
TABLE 46. DESCRIPTION GROUP VARIABLES
Privacy Workplace Comfort Personalization
Gender N Mean S.D. Mean S.D. Mean S.D. Mean S.D
Male 245 -0.032 1.036 -0.075 1.016 0.220 0.898 -0.065 1.044
Female 244 0.032 0.963 0.076 0.980 -0.221 1.049 0.065 0.952
Education level
High School & MBO
132 -0.189 0.904 0.133 0.760 -0.262 1.049 -0.199 0.839
HBO 190 -0.038 1.053 0.185 0.928 -0.065 1.003 0.033 0.922
WO 167 0.193 0.981 -0.316 1.162 0.281 0.886 0.041 1.185
TABLE 47. RESULTS PEARSON CORRELATION TEST PERSONAL CHARACTERISTICS AND SATISFACTION WITH NEEDS.
Privacy Workplace Comfort Personalization
Pearson r Sig. r Sig. r Sig. r Sig.
Age -0.134** .003 0.195** .000 -0.030 .509 0.042 .352
Work hours -0.020 .683 -0.247** .000 0.147** .001 -0.119** .009
Extraversion 0.118** .009 -0.013 .767 0.018 .691 .037 .414
Agreeable. 0.110* .015 -0.011 .801 0.004 .925 0.013 .774
Conscient. -0.046 .310 0.026 .570 -0.070 .123 0.031 .490
Emotional stability
0.110* .015 0.016 .726 0.117** .009 -0.009 .842
Openness 0.143** .002 0.118** .009 0.029 .519 0.026 .561
In Figure 50, an overview can be seen of all the significant relationships between personal characteristics and satisfaction with the support of needs. Satisfaction with privacy increases for extravert, agreeable, emotionally stable and open employees, while it decreases for older employees. These relationships were expected, as older employees value communication less (Oseland, 2009). Also, employees with these personality traits are expected to be more forgiving in terms of privacy and therefore more easily satisfied. Furthermore, satisfaction with the workplace has a positive relationship with age and openness, while longer working hours decrease satisfaction. An explanation for this would be that, as employees are older, they place less importance in their workplace and are thus more easily satisfied with the workplace. Employees with higher weekly work hours, on the other hand, have higher expectations of the facilities, ergonomics and personalization of their workspace, which is supported by the positive significant correlations. Satisfaction with comfort is only affected by the personal characteristics, where gender (male), work hours and emotional stability have positive relationships. As was found in earlier research, male employees are more satisfied with the office climate than female employees (Karjalainen, 2007). The positive relationship with work hours is unexpected, while the relationship with emotional stability could be attributed to the fact that calm employees are less easily upset over the lack of control over climate. Finally, the last variable of satisfaction with support, personalization, is only affected by work hours. As employees work more, they are less satisfied with the personalization their workplace offers. This could be related to the negative relationship of work hours with

92
satisfaction with the workplace, which means that employees who make more hours prefer to adjust their workspace to their needs.
8.3.3 WORKSPACE USE To test the relationship between workspace use and employee satisfaction with the support of needs, an independent sample t-test is conducted. In Table 48, the results can be seen, while Figure 51. Significant relationships personal characteristics with satisfaction shows an overview of the significant variables.
TABLE 48. RESULTS INDEPENDENT SAMPLE T-TEST WITH WORKSPACE USE AND SATISFACTION WITH NEEDS
Privacy Workplace Comfort Personalization
Workspace use t Sig. t Sig. t Sig. t Sig.
Open -0.458 .650 2.669** .008 -1.607 .109 0.007 .994
Age
Gender (m)
Job rank
Education
Characteristics
Privacy
Workplace
Comfort
Personaliz.
Satisfaction
Extraversion
Agreeable.
Conscient.
Emo. Stability
Personality
Work hours
Openness
FIGURE 50. SIGNIFICANT RELATIONSHIPS PERSONAL CHARACTERISTICS WITH SATISFACTION

93
Closed 1.857 .064 0.628 .530 2.848** .005 2.166* .031
Meeting 2.092* .037 0.238 .812 3.088** .002 2.279* .023
Other 2.911** .004 0.752 .453 2.881** .004 0.629 .529
Sister organisation 1.466 .143 -5.120** .000 4.955** .000 -0.548 .584
Home 1.510 .132 1.034 .302 3.046** .002 1.562 .119
Pearson correlation r Sig r Sig r Sig r Sig
Frequency -0.044 .334 0.035 .442 -0.155** .001 -0.116* .010
It is striking that five of the six types of workspaces have positive significant relationships with satisfaction with comfort. Only when employees use open workspaces, no significant relationship is found with satisfaction with the support of comfort. This suggests that the comfort of indoor climate is arranged differently for this type of workspace. Satisfaction with privacy is positively affected by the use of meeting and other workspaces. It was expected that the use of closed workspaces would affect this variable, since the goal of the closed workspace is to offer more privacy. However, as can be seen in Table 48, the relationship is just shy of significant. Furthermore, satisfaction with the workplace is positively affected by the use of open workspaces and negatively affected by the use of workspaces at sister organizations or at clients. An explanation for the relationship with workspaces at other companies could be that employees have little to say about which workspace are assigned to them there. Also, satisfaction with personalization is positively affected by the use of closed workspaces and meeting workspaces. This suggests that employees use closed and meeting workspaces as fixed workspaces, which are therefore easier to personalize. Finally, when employees use the same workspace more often, the satisfaction with comfort and personalization decreases. Earlier, it was found that the importance of comfort positively affects the frequency of usage, thus the reversed negative relationship with satisfaction with comfort is in line with the expectations (Lee, 2006). The fact that using the same workspace more frequently has a negative effect on personalization, might be explained by the fact that whilst employees frequently use a single workplace, it may be taken by someone else the next morning, and the workspace must be cleared every evening.
Privacy
Workplace
Comfort
Personaliz.
Satisfaction
Closed
Meeting
Other
Sister organ.
Home
Open
Workspace
Frequency
FIGURE 51. SIGNIFICANT RELATIONSHIPS PERSONAL CHARACTERISTICS WITH
SATISFACTION

94
8.3.4 EMPLOYEE NEEDS Both the importance of needs variables and the satisfaction with the support of needs variables can be treated as interval variables, given their normal distribution. Thus, the Pearson correlation analysis is used, of which the results can be seen in Table 49. Eight significant correlations were found in total.
TABLE 49. RESULTS PEARSON CORRELATION WITH IMPORTANCE AND SATISFACTION WITH NEEDS
Privacy Workplace Comfort Personalization
Importance r Sig. r Sig. r Sig. R Sig.
Comfort -0.007 .880 -0.004 .921 -0.375** .000 0.040 .374
Workplace 0.327** .000 -0.093* .040 0.156** .001 0.006 .890
Personalization -0.052 .255 0.112* .013 -0.095* .037 -0.053 .242
Privacy -0.315** .000 0.109* .016 0.074 .102 0.050 .272
First, it can be noticed that satisfaction with personalization is not affected by the importance of needs. A negative relationship with the importance of personalization was expected as, according to Lee (2006), higher needs are more difficult to fulfil. This has been found in the satisfaction with privacy, which is negatively affected by the importance of privacy and positively by the importance of the workplace. As the workplace contains the needs for communication and proximity of coworkers, these two correlations can be explained by the lower standards for privacy of employees who value communication, and vice versa. Furthermore, satisfaction with the workplace has a negative significant correlation with the importance of the workplace, and positive significant correlations with the importance of personalization and privacy. Employees who find their workplace more important are generally harder to satisfy with it. Conversely, when they place more importance on personalization and privacy, this can be satisfied more easily because the activity-based office has workspaces suited to each activity that employees conduct. Finally, satisfaction with comfort is negatively significantly correlated with the importance of comfort and personalization, while it is positively significantly correlated with the importance of the workplace needs. The negative correlation with the importance of comfort is in line with expectations. Also, as comfort is not adjustable to each individual in the activity-based office, this could explain the negative relationship.
8.4 OVERALL SATISFACTION In this section, the aspects that could influence satisfaction with the work environment and their importance are discussed to answer the research question:
Privacy
Workplace
Comfort
Personaliz.
Satisfaction
Comfort
Workplace
Personaliz.
Privacy
Importance
FIGURE 52. OVERVIEW SIGNIFICANT RELATIONSHIPS IMPORTANCE OF NEEDS WITH
SATISFACTION

95
What are the effects of satisfaction with support of needs on satisfaction with the work environment? These aspects can be seen in Figure 53. Using Pearson correlations, relationships between the variables concerning employee satisfaction with the work environment are tested.
The only aspect that could influence the overall satisfaction, is satisfaction with the support of needs. Both variables are of the interval measurement level, therefore the Pearson correlation is used. In Table 50, the results of the bivariate analysis can be seen.
TABLE 50. PEARSON CORRELATION TEST SATISFACTION WITH NEEDS AND OVERALL SATISFACTION
Overall satisfaction with the work environment
r Sig.
Privacy 0.546** .000
Workplace 0.403** .000
Comfort 0.376** .000
Personalization 0.171** .000
In Figure 54, it can be seen that every variable of the satisfaction with the support of needs has a positive significant correlation with the satisfaction of the work environment. This means that the more satisfied employees are with the comfort, workplace, personalization and privacy of the office, the more satisfied they are with the work environment in total. This confirms the P-E Fit model (Heijs, 2006), since the
Satisfaction with support
of needs Personal
characteristics
Employee needs
Workspace use
Organizational culture
Satisfaction with work
environment
FIGURE 53. ASPECTS THAT COULD AFFECT SATISFACTION WITH THE WORK ENVIRONMENT
Work environment
Satisfaction
Privacy
Workplace
Comfort
Personaliz.
Satisfaction
FIGURE 54. SIGNIFICANT RELATIONSHIPS OF SATISFACTION WITH SUPPORT
OF NEEDS ON OVERALL SATISFACTION

96
match between desires of the person and the supplies the environment offers, influences the satisfaction.
8.5 CONCLUSION In this chapter, the relationships of the organizational culture and personal characteristics, with workspace use, importance of needs, satisfaction with needs and overall satisfaction was discussed. Since the bivariate analyses that were conducted do not simultaneously test the direct and indirect effects, the results of the current chapter will be used as a starting point to the path model. This is because the bivariate analyses show which relationships are relevant for the path model. In total, 127 significant correlations and relationships between the aspects of the research model were found. An overview of the hypotheses can be seen in Table 51, while in Appendix 9, a complete overview of all the significant relationships is given. The personal characteristics have relationships with the use of workspaces, the importance of needs and the satisfaction with the support of needs. This is in line with the expectations. Furthermore, the current and preferred organizational culture types have relationships with the use of workspaces, the importance of needs and satisfaction with needs. Moreover, the use of workspaces affects satisfaction with the support of needs. Finally, in line with the P-E fit model, satisfaction with the support of needs has significant relationships with satisfaction with the work environment. The variables satisfaction with personalization and use of closed workspaces were least affected by other variables. Furthermore, the two personality traits agreeableness and conscientiousness had only a few significant correlations with other aspects. The use of open workspace and at clients or sister organisations was significantly related to many variables, as well as the three satisfactions with privacy, workplace and comfort.
TABLE 51. HYPOTHESES
H1 Personal characteristics relates to employee needs. Accepted
H2 Organizational culture relates to employee needs. Accepted
H3 Employee needs relates to the workspace use of employees. Accepted
H4 Personal characteristics relate to the workspace use of employees. Accepted
H5 Organizational culture relates to the workspace use of employees. Accepted
H6 Employee needs relate to the satisfaction with support of needs. Accepted
H7 Personal characteristics relate to the employee satisfaction with support of needs.
Accepted
H8 Organizational culture relates to the employee satisfaction with support of needs.
Accepted
H9 Workspace use relates to the employee satisfaction with support of needs.
Accepted
H10 Satisfaction with the support of needs relates to overall satisfaction with the work environment.
Accepted

97
9. PATH ANALYSIS The problem statement of this study is: To what extent do differences in organizational culture, employee needs and workspace use, mediated by personal characteristics, affect employee satisfaction with the support of their needs and work environment in the activity-based office? To answer this question, a path model will be constructed, as mentioned previously in chapter 6. In the previous chapter, the results of the bivariate analyses concerning the research questions were discussed. The results of these analyses have shown which relationships are relevant for the path model. Since bivariate analyses take only two variables into account, a path analysis is conducted to simultaneously analyze both the indirect effects and the direct effects of the organizational culture, workspace use, personal characteristics and employee needs on satisfaction. This will provide insight in the complex relationship between organizational culture, work environment and the employee. First, the path model is discussed in 9.1, along with the selection of variables. Next, the results of the path analysis are discussed, including the direct and indirect effects. Finally, the research questions 4 through 8 will be answered in the conclusion.
9.1 PATH MODEL The software package LISREL is used for the path analysis. The definitive sample of the research consists of 489 cases. All missing values of age are replaced with values picked from a random distribution of ages according to the percentages of the normal distribution. This ensures that all cases of the sample can be used for the path analysis. To make sure that the path model does not become too complex, a selection of the variables is made.
9.1.1 SELECTION OF VARIABLES First, the path model will focus on the research model that addresses the indirect and direct relationships. Personal characteristics and organizational culture types are included as exogenous variables. They are thus seen as independent variables that affect the path model, but are not themselves affected by the model. Workspace use, employee needs and employee satisfaction are included as endogenous (dependent) variables. Second, a closer look is taken at the exogenous variables. In the previous chapter, it can be seen that all personal characteristics have significant effects. To include only the most relevant variables, a selection is made based on the literature review. Age, gender and personality traits are assumed to affect the importance of employee needs (Rothe et al., 2011; Oseland, 2009). Job rank, education level and work hours are not included to keep the model concise, as these are generally only included in satisfaction studies. Also, how frequently employees use the same workspace is not included. Furthermore, for the endogenous variables, the new variables that were derived from the factor analyses are used. This applies to the variables concerning the importance of needs, as well as satisfaction with the support of needs. In Figure 55, the research model with relevant variables can be seen. This research model will be assessed in the path analysis.

98
Finally, relevant relationships are included to construct the path model. Here, the results of the bivariate analyses are used. First, the endogenous variables importance of needs and satisfaction with needs were added along with the relevant relationships. Next, the exogenous variables were gradually added. Using the t-values, non-significant relationships were removed. This leads to a path model containing only the significant relationships. The final path model can be seen in Figure 56. The use of closed, other and home workspaces had no significant relationships in the path model and were excluded. Of the preferred organizational culture types, the clan, adhocracy and market variables had no significant effects. These were removed, as was the not-significant variable gender from personal characteristics. All remaining significant relationships can be seen in Figure 56, with red and green meaning negative and positive relationships respectively. Some relationships that were found insignificant with bivariate analyses, were found to be significant in the path analyses by the
Satisfaction with support
of needs
Personal characteristics
Employee needs
Age Gender Extraversion Agreeableness Conscientiousness Neuroticism Openness
Comfort Workplace Personalization Privacy
Now: Clan Adhocracy Market Hierarchy Preferred: Clan Adhocracy Market Hierarchy
Workspace use
Organizational culture
Open workspace Closed workspace Meeting workspace Other workspace Sister organization Home Satisfaction with:
Privacy Workplace Comfort Personalization
Satisfaction with work
environment
FIGURE 55. RESEARCH MODEL WITH VARIABLES THAT ARE USED IN THE PATH MODEL

99
influence of other direct and indirect paths. The significant relationships shown in the path model will be further discussed in-depth in the next section.
Open
Meeting
Sister org.
Workspace
Clan
Adhocracy
Market
Hierarchy
Now
Hierarchy
Preferred
Age
Characteristic
Extraversion
Agreeable.
Conscient.
Emo. Stability
Openness
Personality
Comfort
Workplace
Personaliz.
Privacy
Importance
Privacy
Workplace
Comfort
Personaliz.
Satisfaction
Satisfaction
Overall
Figure 56. Final path model, with all the significant relationships

100
In order to make sure that the path model is accurate, the goodness of fit is determined. In Table 52, the relevant measures are shown to determine this. First, the ratio between the Chi-Square and degrees of freedom should be less than 2, which is met with a ratio of 1.818. Furthermore, the RMSEA should be below 0.05 for an accurate fit, which is also met with a value of 0.041. Finally, the goodness of fit index should be as close to 1 as possible and at least above 0.90. This condition for an adequate model is also met with a goodness of fit index of 0.962.
TABLE 52. GOODNESS OF FIT DESCRIPTIVE
Degrees of freedom 130
Chi-Square 236.34
RMSEA 0.041
Goodness of Fit Index 0.962
9.2 RESULTS In total, 32 significant relationships were found in the path analysis. These are significant at a 0.05 level, with a corresponding t-value of 1.96. First, the effects on the importance of needs will be discussed, followed by the effects on satisfaction with the support of needs. Finally, direct and indirect effects on the overall satisfaction with the work environment are discussed.
9.2.1 EFFECTS ON IMPORTANCE OF NEEDS In Table 53, an overview of the effects of organizational culture on the importance of needs can be seen, while Table 54 shows the effects of personal characteristics on importance of needs. The total unstandardized effects are shown, which are direct effects.
Effects of organizational culture Organization culture has only few effects on the importance of needs. The significant effect of the current organizational culture variables are reduced to the negative effect of the adhocracy culture on the importance of comfort, and the positive effect of market culture on the importance of privacy. Thus, when the adhocracy culture is dominant in the organization, employees find comfort less important. Possibly, as adhocracy culture can be characterized as quickly adapting and being flexible, employees adjust more easily to the climate, ergonomics and space of the office and therefore pay less attention to it. The importance of privacy increases for employees who experience their organizational culture as a market culture. This culture is result orientated and with distractions, productivity decreases (Oseland, 2009). Employees who prefer a hierarchy culture find the workplace less important. As the hierarchy organizational culture prefers control and structure (Cameron & Quinn, 2006), it could be argued that the aesthetics, location and communication are considered less important.
TABLE 53. EFFECTS OF ORGANIZATIONAL CULTURE ON IMPORTANCE OF NEEDS
Comfort Workplace Personalization Privacy
Now Adhocracy effect -0.015
t-value -3.209
Now Market
effect 0.005
t-value 2.016
Pref Hierarchy effect -0.021
t-value -5.509

101
Effects of personal characteristics In Table 54, the direct effects of personal characteristics on the importance of needs can be seen. The significant effects on the importance of comfort are the negative relationship with current emotional stability, and the positive relationship with conscientiousness. Possibly, employees who see themselves as calm and even-tempered find comfort less important. Furthermore, employees that are hardworking and organized do not want to be distracted by discomfort and place more value on comfort. It was expected that gender had a significant effect on the importance of comfort (Karjalainen, 2007). The importance of the workplace has a negative relationship with age, and a positive relationship with extraversion. The negative effect of age on the importance of the needs proximity of coworkers and communication are in line with the expectations (Rothe et al., 2011). Also, the positive effect of extraversion on the importance of these needs was expected. Furthermore, personalization is positively affected by age and agreeableness. Older employees could be more used to the idea of having their own workspace and therefore value it more (Budie, 2016). The positive relationship between agreeableness and the importance of personalization was also found in earlier research (Anagnostopoulou et al., 2017). Extraversion has a negative relationship with the importance of privacy. Since introvert employees possibly value their privacy more, this is in line with expectations (Buchanan & Harting, 2015).
TABLE 54. EFFECTS OF PERSONAL CHARACTERISTICS ON IMPORTANCE OF NEEDS
Comfort Workplace Personalization Privacy
Age effect -0.024 0.022
t-value -6.029 5.373
Extraversion effect 0.044 -0.042
t-value 2.621 -2.349
Agreeableness effect 0.052
t-value 2.388
Conscientiousness effect 0.061
t-value 2.546
Emotional stability effect -0.053
t-value -2.586
9.2.2 EFFECTS ON SATISFACTION WITH SUPPORT OF NEEDS In this section, the direct and indirect effects on satisfaction with the support of needs are discussed. First, the effects of workspace use are examined, followed by the effects of the organizational culture types. The effect of personal characteristics on satisfaction with the support of needs are discussed next. Finally, the effects of the importance of needs on satisfaction with support of needs are examined. For each table, it is made clear if they concern direct effects, or both direct and indirect effects. Only the relevant variables are included in the tables. Effects of use of workspaces on satisfaction with support of needs In Table 55, the direct effects of workspace use on the satisfaction with the support of needs can be seen. The use of the open workspace has significant relationships with the satisfaction with privacy, workplace and comfort. As employees make more use of the open workspace, they are less satisfied with privacy. This is in line with previous studies (Appel-Meulenbroek et al., 2015; De Been & Beijer, 2014; Kim & de Dear, 2013). Furthermore, there is a positive relationship between use of open workspace and satisfaction with the workplace. The open

102
workspace has more space and facilities for employees, which could account for this relationship. There is a negative significant relationship between open workspace and the satisfaction with comfort. In earlier research, indoor climate related aspects such as noise level were found as a common drawback to open workspaces (Kim & de Dear, 2013). The use of meeting workspaces positively affects the satisfaction with personalization. This is an unexpected effect, as meeting workspaces are not customizable. The use of workspaces at sister organizations or clients has a negative effect on satisfaction with the workplace, and a positive effect on comfort. If other organizations do not have an activity-based working office, it could be that the space and facilities offered do not meet the employee’s expectations. However, the advantage of a conventional office is the indoor climate and control over climate (Kim & de Dear, 2013). This explains the positive relationship between using workspaces at sister organizations or clients and the satisfaction with comfort.
TABLE 55. DIRECT EFFECTS OF USE OF WORKSPACE ON THE SATISFACTION WITH SUPPORT OF NEEDS
Privacy Workplace Comfort Personalization
Open workspace effect -0.126 0.314 -0.162
t-value -3.179 7.722 -4.106
Meeting workspace effect 0.227
t-value 2.282
Sister organization effect -0.362 0.253
t-value -4.132 3.032
Effects of organizational culture on satisfaction with support of needs In Table 56, the indirect and total effects of organizational culture on the satisfaction with needs can be seen. The satisfaction with the support of privacy is positively and directly affected by the current clan culture, and negatively indirectly affected by the current market culture. For employees who experience a clan culture, the satisfaction with privacy is positively affected. This could be explained by the reduced need that a clan culture has for privacy, and by the mediocre effect the need communication has on this variable. The current market culture and the preferred hierarchy culture have negative indirect effects on the satisfaction with privacy. The current market culture directly affects the importance of privacy positively, which in turn lowers the satisfaction with privacy. The satisfaction with the workplace is directly influenced by the current hierarchy culture. This positive relationship could be explained with the need for control and stability, and the wish to express their rank by the ergonomics, space and aesthetics of the workspace that employees choose to use. The satisfaction with comfort is directly positively affected by the current clan culture, and directly and indirectly positively affected by the current adhocracy culture. These organizational cultures are flexible and employees find comfort less important, in turn increasing the satisfaction. Adhocracy affects the satisfaction indirectly through the importance of comfort.

103
TABLE 56. INDIRECT AND TOTAL EFFECTS OF ORGANIZATIONAL CULTURE ON THE SATISFACTION WITH SUPPORT OF NEEDS
Privacy Workplace Comfort Personalization
Now Clan indirect
t-value
total 0.009 0.008
t-value 3.479 2.990
Now Adhocracy
indirect 0.005
t-value 2.999
total 0.019
t-value 4.206
Now Hierarchy
indirect
t-value
total 0.007
t-value 2.197
Preferred Hierarchy
indirect -0.007 -0.002
t-value -4.522 -2.384
total -0.007 0.008 -0.002
t-value -4.522 2.197 -2.384
Effects of personal characteristics on satisfaction with support of needs In Table 57, the indirect and total effects of personal characteristics on the satisfaction with needs can be seen. Many indirect relationships were found. However, there is no effect on satisfaction with personalization. The satisfaction with privacy is indirectly negatively affected by age, and positively by extraversion. Since older and/or introvert employees find communication less important, they are harder to satisfy with the support of privacy of the workspace. Extraverted employees are more easily satisfied. This is in line with the expectations (Rothe et al., 2011). The satisfaction with the workplace is directly positive affected by age, which means that employees are more easily satisfied with ergonomics, facilities and aesthetics. Since age decreases the importance of the need for workplace, these needs may be easier to fulfil (Lee, 2006). Extraversion negatively affects the satisfaction with workplace indirectly, as extravert employees find the workplace more important, and are in turn less satisfied. Openness directly influences satisfaction with the workplace positively, which might be explained by the curious and independent nature of these employees, who adjust more easily to the workplace. The satisfaction with comfort is only indirectly affected by personal characteristics. Age increases the importance of the workplace, which in turn lowers the satisfaction with comfort. Conscientiousness increases the importance of comfort, which decreases the satisfaction with comfort, as higher needs are more difficult to fulfil (Lee, 2006). Conversely, emotional stability increases satisfaction with comfort, by decreasing the importance of comfort.
TABLE 57. INDIRECT AND TOTAL EFFECTS OF PERSONAL CHARACTERISTICS ON THE SATISFACTION WITH SUPPORT OF NEEDS
Privacy Workplace Comfort Personalization
Age indirect -0.007 -0.002
t-value -4.796 -2.422
total -0.007 0.017 -0.002
t-value -4.796 4.267 -2.422
Extraversion indirect 0.028 -0.007

104
t-value 3.350 -2.058
total 0.028 -0.007
t-value 3.350 -2.058
Conscientious-ness
indirect -0.020
t-value -2.437
total -0.020
t-value -2.437
Emotional stability
indirect 0.018
t-value 2.473
total 0.018
t-value 2.473
Openness indirect
t-value
total 0.078
t-value 3.890
Effects of importance of needs on satisfaction with support of needs In Table 58, the direct effects of the importance of needs can be seen. As was expected, these variables have a major effect on satisfaction with the support of needs. The satisfaction with needs are directly influenced by three variables of importance of needs. The importance of personalization has no significant relationship, which was also found in the study of Budie (2016). The satisfaction with privacy is positively influenced by the importance of the workplace, which means that when employees find communication and proximity of coworkers of importance, the satisfaction with privacy is fulfilled more easily. This was expected and in line with earlier research (Budie, 2016; Lee, 2006). The same applies to the negative relationship between the importance of privacy and the satisfaction with privacy. The more important privacy is, the more difficult the privacy needs are to fulfil (Lee, 2006). Satisfaction with the workplace is positively affected by the importance of privacy. This is an unexpected relationship. It could be that because employees who find privacy important use closed workspaces more often, as was found in Chapter 8, they are more satisfied with the space they have. The satisfaction with comfort is negatively affected by the importance of comfort, and positively affected by the importance of the workplace. The first relationship is a logical relationship. The second relationship could be explained by the fact that employees who value location, communication and proximity of coworkers, are more easily satisfied with the climate of an open office.
TABLE 58. DIRECT EFFECTS OF IMPORTANCE OF NEEDS ON THE SATISFACTION WITH SUPPORT OF NEEDS
Privacy Workplace Comfort Personalization
Comfort effect -0.336
t-value -8.437
Workplace effect 0.314 0.106
t-value 7.913 2.645
Privacy effect -0.323 0.171
t-value -8.170 4.267

105
9.2.3 EFFECTS ON OVERALL SATISFACTION WORK ENVIRONMENT In this section, the direct effects on the overall satisfaction with the work environment are discussed first, followed by the indirect effects.
Direct effects on the overall satisfaction As expected, all the variables of the satisfaction with the support of needs have direct positive relationships with the overall satisfaction with the work environment. These are all highly significant with t-values > 6.00, as can be seen in Table 59. Privacy in particular has a strong effect on the overall satisfaction.
TABLE 59. DIRECT EFFECTS OF SATISFACTION WITH SUPPORT OF NEEDS ON OVERALL SATISFACTION
Satisfaction with overall work environment
Privacy effect 0.725
t-value 19.720
Workplace effect 0.536
t-value 14.605
Comfort effect 0.500
t-value 13.436
Personalization effect 0.228
t-value 6.228
Indirect effects on the overall satisfaction In Table 60, the indirect effects of the exogenous variables on the overall satisfaction can be seen. Of the use of workspace, only meeting workspace has a positive indirect effect on the overall satisfaction. The use of meeting workspaces increases the satisfaction with personalization, which increases the overall satisfaction. The current organizational cultures clan, adhocracy and hierarchy indirectly positively affect the satisfaction with privacy, comfort and workplace, and in turn positively affect the overall satisfaction. Extraversion lowers the importance of privacy, which increases the satisfaction with the workplace and subsequently the overall satisfaction. Conscientiousness increases the importance of comfort, which lowers the satisfaction with comfort and consequently lowers the overall satisfaction with the work environment. Emotional stability lowers the importance of comfort, which in turn increases the satisfaction with comfort and therefore the overall satisfaction. And finally, openness (e.g. curious, independent employees) directly positively affects the satisfaction with the workplace, which in turn positively affects the overall satisfaction.
TABLE 60. INDIRECT EFFECTS OF EXOGENOUS VARIABLES ON OVERALL SATISFACTION
Satisfaction with overall work environment
Meeting workspace
indirect 0.052
t-value 2.142
Now Clan indirect 0.010
t-value 4.487
Now Adhocracy
indirect 0.009
t-value 4.014
Now Hierarchy
indirect 0.004
t-value 2.500

106
Extraversion indirect 0.018
t-value 3.132
Conscient-iousness
indirect -0.010
t-value -2.398
Emotional stability
indirect 0.009
t-value 2.432
Openness indirect 0.042
t-value 3.759
The indirect effects of the importance of needs can be found in Table 61. The importance of comfort has a highly significant and negative relationship with the overall satisfaction. This suggests that employees who find comfort of high importance, are dissatisfied with the overall work environment. This implies that these employees are not satisfied with the comfort and control over climate that an activity-based office offers. Furthermore, the importance of privacy also has a negative indirect effect on the overall satisfaction. Similarly, the work environment of activity-based offices does not offer support for employees who value privacy. When employees place importance on communication and proximity with coworkers, they are more satisfied with the overall work environment. As activity-based working better supports these needs, this is in line with the expectations.
TABLE 61. INDIRECT EFFECTS OF IMPORTANCE OF NEEDS ON OVERALL SATISFACTION
Satisfaction with overall work environment
Comfort indirect -0.168
t-value -7.146
Workplace indirect 0.281
t-value 7.583
Privacy indirect -0.143
t-value -3.756
9.3 CONCLUSION The results of the path analysis presented in this chapter provide answers to the problem statement: To what extent do differences in organizational culture, employee needs and workspace use, mediated by personal characteristics, affect employee satisfaction with the support of their needs and work environment in the activity-based office? The path analysis provides insight in the complex relationships between organizational culture, work environment and employee characteristics and (need) satisfaction and therefore provide an answer to the problem statement. The path analysis is used to assess the effects of all variables on satisfaction simultaneously, both indirect and direct effects. Based on the significant relationships in the research model, which were determined by bivariate analyses and on theoretical grounds, only the most relevant variables were added to the path model. As the workspace use was recoded in chapter 7, these variables could not be used as endogenous variables. This had as result that the mediating effect of workspace use could not be tested in the path analysis. This is a limitation of the current study. However, the path

107
model confirms that the overall satisfaction with the work environment is a function of a complex set of environmental, organizational and personal factors, in which the needs of employees have a mediating role. Research question 4 through 8 can be answered with the path analysis and the results of the bivariate analyses from chapter 8. In the next chapter, the practical and theoretical implications of these results are discussed. 4. What are the effects of organizational culture and personal characteristics on employee needs? The effect of organizational culture on the importance of needs is limited. A currently experienced adhocracy culture negatively affects the importance of comfort and a market culture positively affects the importance of privacy. Moreover, a preferred hierarchy culture has a direct negative effect on the importance of workplace. The importance of needs are all influenced by personal characteristics. Age affects the importance of the workplace negatively, and the importance of personalization positively. Extraversion has a positive effect on the importance of the workplace, and a negative effect on the importance of privacy. Furthermore, agreeableness affects the importance of personalization positively. Conscientiousness has a direct positive effect on the importance of comfort. Emotional stability negatively affects the importance of comfort. The personal characteristics that were not included in the path analysis (job rank, education level and work hours) were found to have a limited effect in the bivariate analyses (Chapter 8). 5. What are the effects of organizational culture, personal characteristics and employee needs on workspace use? As the workspace use variables were recoded, they could not be used as endogenous variables in the path analysis. The bivariate analyses from the previous chapter do offer some support for the effects of organizational culture, personal characteristics and employee needs on workspace use. The clan and adhocracy types had largely positive effects on workspace use, while market and hierarchy had mostly negative effects on all types of workspaces except the open workspace. This can be explained by the high frequency with which employees in market and hierarchy cultures make use of the same workspace, while for clan and adhocracy this effect is significantly lower. Personal characteristics have many positive effects on the use of workspaces. Some results from the bivariate analyses are that employees with a higher level of education use more different types of workspaces. In addition, a higher job rank results in more frequent use of meeting workspaces and working at home, the latter of which is also used more by male employees. Conscientious employees use other and home workspaces less, while curious employees use meeting, other and home workspaces more. Furthermore, when employees find comfort important, less use is made of closed, meeting, sister organizations and workspaces at home. For employees who find the workplace important, opposite effects were found. Finally, when employees find privacy important, more use is made of the closed workspace. 6. What are the effects of organizational culture, personal characteristics, employee needs and workspace use on satisfaction with support of needs?

108
Some direct effects of organizational culture on satisfaction with needs are found. The organizational cultures clan, adhocracy and hierarchy that are currently experienced and the preferred hierarchy culture all had positive effects. Indirectly, the current adhocracy culture positively affects satisfaction with comfort, while the preferred culture hierarchy negatively affects the satisfaction with privacy and comfort through the importance of needs. Only the personal characteristics age and openness directly influence satisfaction with the workplace positively. Privacy is indirectly negatively affected by older age and positively affected by extraversion, through the mediating role of the importance of needs. Also, satisfaction with the workplace is negatively indirectly affected by extraversion. For satisfaction with comfort, both a higher age and conscientiousness have a negative indirect effect. The importance of needs directly affect the satisfaction with needs. However, the importance of personalization has no effect, and the satisfaction with personalization is not influenced by the importance of needs. As was to be expected, the importance of comfort negatively affects the satisfaction with comfort, and likewise does the importance of privacy which negatively affect satisfaction with privacy. The importance of the workplace increases the satisfaction with privacy and comfort. Finally, the importance of privacy increases satisfaction with the workplace. Taking workspace use as exogenous variables had some effect on the satisfaction with the support of needs. When employees use open workspaces more often, their satisfaction with privacy decreases, as does their satisfaction with comfort. However, their satisfaction with the workplace increases. Furthermore, employees using meeting workspaces have a positive effect on the satisfaction with personalization. Finally, the use of workspaces at sister organizations or clients negatively affects satisfaction with the workplace and positively affects the satisfaction with comfort. 7. What are the effects of satisfaction with support of needs on the overall satisfaction with the work environment? The effects of the satisfaction with the support of needs on the overall satisfaction with the work environment are considerable. All four satisfactions affect the overall satisfaction directly and positively. Especially the satisfaction with privacy has a highly significant effect. This is in line with the findings from the bivariate analyses. 8. What is the combined effect of organizational culture, personal characteristics, employee needs, workspace use and satisfaction with support of needs on satisfaction with the work environment? The path model showed that the overall satisfaction is a complex combination of all aspects that influence the overall satisfaction with the work environment, both directly and indirectly. The direct effects were discussed in the answer to the previous research question, leaving the indirect effects on the overall satisfaction to this answer. The importance of needs affects the overall satisfaction negatively when employees find comfort and privacy important. When the workplace is found important, the overall satisfaction increases. The use of meeting workspaces positively affects the overall satisfaction

109
through the satisfaction with personalization. Furthermore, the three current organizational cultures clan, adhocracy and hierarchy positively affect the overall satisfaction, with the satisfaction with the support of needs playing a mediating role. Of the personal characteristics, extraversion, emotional stability and openness have positive effects, while conscientiousness has a negative effect on the overall satisfaction, through both the importance of needs and the satisfaction with needs.

110
10. CONCLUSION AND DISCUSSION In this chapter, the final conclusions of this master thesis are presented. All the results are summarized and discussed on theoretical and practical implications. Furthermore, the limitations of this study are discussed, and recommendations for future research are given.
10.1 CONCLUSION This research studied the combined effect of the physical and behavioral work environment, organizational culture and personal characteristics of the employee on the overall satisfaction with the work environment. Human assets are increasingly important for organizations to support productivity and as an objective in itself. Therefore, employee satisfaction currently receives much attention from Corporate Real Estate Management. Employee needs are therefore important to take into account. In addition, understanding the cultural significance of the workspace is essential to be able to utilize the work environment. The aim of this study has thus been to provide answers to the following problem statement: To what extent do differences in organizational culture, employee needs and workspace use, mediated by personal characteristics, affect employee satisfaction with the support of their needs and work environment in the activity-based office? To answer this problem statement, eight research questions were formulated and a preliminary research model was constructed. The first three research questions were answered with the use of literature research. The activity-based office was analyzed first. The guiding principle of this office concept is that employees change workspace depending on their activity. Six types of workspaces were identified that are used in activity-based offices. These are the open, closed, meeting and other workspaces, as well as the workspaces at sister organizations or clients, and at home. Next, the characteristics and needs of employees were explored. The personal characteristics of age, gender, job rank, education level and work hours were included. The big five personality characteristics were also found to have effects on satisfaction with the work environment, therefore extraversion, agreeableness, conscientiousness, emotional stability and openness were included in the conceptual research model. Furthermore, a link was found between satisfaction with the work environment and the needs of the employee based on the Person-Environment Fit model. Therefore, work environment related needs were specified and reduced to four basic needs: comfort, workplace, personalization and privacy. Finally, a literature study was conducted into organizational culture. Four organizational culture types were determined, the clan, adhocracy, market and hierarchy culture. These can be distinguished in terms of flexibility and focus. Both current and preferred organizational cultures are included in the model. Based on the literature study, the preliminary conceptual model was expanded. To test the model, field research was required. Therefore, data was collected by means of an online survey at three companies. A total of 501 respondents completed the questionnaire between May 9th and May 29th 2017, of which 489 cases were suitable for use in the analyses. To model and test the combined effects of the different aspects simultaneously, a path model analysis was conducted. In order to make sure this path model would not be too complex, bivariate analyses were carried out beforehand. Only the relevant variables with significant relationships were added to the path model. It was expected that workspace use, importance of needs and satisfaction with needs had mediating roles in the path model. Since the variables

111
relating to workspace use had to be recoded, their mediating role could not be tested in the path analysis. This meant that workspace use, organizational culture and personal characteristics were included as exogenous variables, while importance of needs, satisfaction with support of needs and the overall satisfaction with the work environment were included as endogenous variables.
Open
Meeting
Sister org.
Workspace
Clan
Adhocracy
Market
Hierarchy
Now
Hierarchy
Preferred
Age
Characteristic
Extraversion
Agreeable.
Conscient.
Emo. Stability
Openness
Personality
Comfort
Workplace
Personaliz.
Privacy
Importance
Privacy
Workplace
Comfort
Personaliz.
Satisfaction
Satisfaction
Overall
FIGURE 57. FINAL PATH MODEL

112
The final path model can be seen in Figure 57. With a RMSEA=0.041, goodness of fit index of 0.962 and a Chi-Square/Degrees of Freedom ratio of 1.818, the path model has an adequate goodness of fit. Both direct and indirect effects were found. Organizational culture and personal characteristics have indirect effects on the overall satisfaction, both through the importance of needs and through the satisfaction with needs. The significant relationships found in the path model imply that the overall satisfaction with the work environment is indeed affected by differences in organizational culture, employee needs, workspace use and personal characteristics. This effect takes place through the employee satisfaction with the support of needs, which has a mediating role. It is notable that the satisfaction with personalization is only affected by the use of meeting workspaces. Furthermore, current clan and adhocracy cultures have a positive effect on satisfaction with privacy and comfort, while current market and preferred hierarchy culture types have a negative effect on these two satisfaction variables. The hierarchy culture type, both current and preferred, positively affects satisfaction with the workplace. Since little research is done on the effect of organizational culture on satisfaction with the physical aspects of activity-based offices, these results suggest that organizational culture is of importance. Based on both the bivariate analyses and the path model, all hypotheses (discussed in Chapter 5) are accepted. Hypotheses 3, 4 and 5 could not be tested in the path model, but sufficient support was found in the bivariate analyses. It should be taken into account that not all possible effects were found to be significant.
TABLE 62. OVERVIEW OF THE HYPOTHESES
H1 Personal characteristics relates to employee needs. Accepted
H2 Organizational culture relates to employee needs. Accepted
H3 Employee needs relates to the workspace use of employees. Accepted
H4 Personal characteristics relates to the workspace use of employees. Accepted
H5 Organizational culture relates to the workspace use of employees. Accepted
H6 Employee needs relate to the satisfaction with support of needs. Accepted
H7 Personal characteristics relates to the employee satisfaction with support of needs.
Accepted
H8 Organizational culture relates to the employee satisfaction with support of needs.
Accepted
H9 Workspace use relates to the employee satisfaction with support of needs.
Accepted
H10 Satisfaction with the support of needs relates to overall satisfaction with the work environment.
Accepted
10.2 THEORETICAL IMPLICATIONS The theoretical implications of this study are twofold. First, this study contributes to the theory on satisfaction with the work environment. Second, this study also contributes to the link between the fields of organization culture and work environment. This study shows that the activity-based office concept can be assessed with the complex path model generated by Budie (2016). The model was slightly adjusted for office concept studied here, as well as because the workspace use variables could not be used as endogenous variables. It confirms that satisfaction with the overall work environment is influenced by personal characteristics, employee needs and workspace use. Furthermore, the research model was also tested with the overall satisfaction using the path model. This ensured that

113
indirect effects could be assessed on the overall satisfaction too. Eleven significant indirect effects were found, divided over all four exogenous aspects of the model. This confirms that satisfaction is a result of the P-E fit. Additionally, this study contributes to the understanding of effects of culture on employees within the context of the activity-based office. Organizational culture is seen as the culture that employees of an organization share and are influenced by. Currently, to the best of the author’s knowledge, the effects of organizational culture on the satisfaction with the work environment of an activity-based office have not yet been assessed. Previous research did not take into account what effect the organizational culture could have, even when the effect of national culture has been analyzed previously. Studies have also shown that the perception and use of space is a culturally variable dimension (Steelcase, 2009; Liebregts, 2013). Therefore, the results related to these two aspects contribute to the understanding of how these organizational cultures affect the employee’s use, needs and satisfaction with the work environment. The results of the bivariate analyses demonstrate that organizational culture has significant relationships with the use of different types of workspaces. Furthermore, the path model shows that organizational culture significantly affect the importance of needs, the satisfaction with needs and the overall satisfaction with the work environment.
10.3 PRACTICAL IMPLICATIONS The results of this study have a practical relevance for offices that have implemented activity-based working or are considering to implement it. As employee satisfaction gains more importance in the last few years, the results can be used to increase satisfaction with the work environment. To increase satisfaction with the activity-based work environment, advice will be given for each aspect of the research model. First, open workspaces should be designed in a way that satisfaction with support of privacy is as high as possible for the employee. Indoor climate should also be adjusted to the needs of the employees, by taking into account the noise levels and temperature of the open workspaces. As meeting workspaces increase the satisfaction with personalization, an adequate balance between open workspaces and meeting workspaces should be offered. This will decrease dissatisfaction with privacy and comfort, and increase overall satisfaction with the work environment. For organizations that have not yet implemented activity-based working, a short study can be conducted to assess the organizational culture. Based on that study, a company can judge how well suited their organizational culture is to activity-based working. Furthermore, they can make sure that with a market or hierarchy culture, attention is paid to the support of privacy and comfort and to adjust the workspaces accordingly. Furthermore, the personal characteristics of employees should be taken into account when implementing activity-based offices. For employees who are introvert and conscientious, the work environment should support the need for privacy and comfort more strongly. On the other hand, extravert, emotionally stable and open employees are more easily satisfied with comfort and the workplace. Since the importance of comfort and privacy both have negative effects on satisfaction with comfort and privacy, these needs should be met. This could be achieved by conducting a small Ten Item Personality Inventory (TIPI) and by making sure that the workspaces accommodate the employees adequately (Gosling et al., 2003).

114
To conclude, the results of this study show that for an optimal implementation of an activity-based office, the organizational culture should be assessed, employees needs should be taken into account, and the open workplaces should support privacy and comfort. This helps to ensure that the activity-based office contributes optimally to the employees’ satisfaction with support of needs and the overall satisfaction with the work environment.
10.4 LIMITATIONS AND RECOMMENDATIONS FOR FUTURE RESEARCH The most obvious limitation of this research is that workspace use could not be used as endogenous variables in the path analysis. This meant that the effects of organizational culture, personal characteristics and the importance of employee needs on workspace use could not be tested simultaneously. It was hoped that by considering only activity-based offices, the variables concerning workspace use would be close to normally distributed. Unfortunately, this was not the case, which resulted in a loss of information on how much the respondents use the different types of workspaces. Additionally, the unexpected positive effect of meeting rooms on personalization could be examined more closely. Testing of the accuracy of workspace use by employees can be taken into account in future research. Furthermore, some respondents considered the statements regarding organizational culture as difficult to answer, because they were deemed too theoretical and some respondents did not see how the statement applied to their organization in practical terms. The cases that were not useable in this research were all linked to difficulty with the organizational culture questions. As the same questionnaire was used for all three organizations, no adaptions could be made to the statements. For future research, the questionnaire of Cameron and Quinn (2006) could be adjusted to the company in which the study is conducted. The current study was conducted with three organizations which are all located in the Netherlands, making it difficult to generalize the results for other countries. Therefore, a recommendation for future research is to conduct the same study in multiple countries. This allows the results to be compared cross-nationally, increasing generalizability. Similarly, the study can be conducted for different types of organizations. This might result in a more even distribution of the organizational culture types, which possibly yields more effects of organizational culture on satisfaction. Finally, how long ago activity-based working was implemented is not taken into account in this study. Contacts of the organizations suggested that satisfaction with the work environment of the new office concept could also be based on how well the change from a previous to the new office was prepared for and well this transition was guided. Furthermore, how long employees have been working using the new office concept could impact satisfaction, as they get more accustomed to it. In future research, these time-related variables could be added to the research model.

115
REFERENCES
Aaltonen, I., Ala-Kotila, P., Järnström, H., Laarni, J., Määttä, H. N., Schembri, I., ..., & Nagy, G. (2012). New Ways of Working: State-of-the-Art Report on Knowledge Work. Espoo: VTT
Adler, N. J. (1997). International Dimensions of Organizational Behaviour. 3rd edition. Cincinnati, OH: Shout-Western College Publishing
Ali, M. & Brooks, L. (2008). Culture and IS: National cultural dimensions within IS discipline. Conference paper, 13th Annual Conference of the UK Academy for Information Systems (UKAIS), Bournemouth University, 10-11 April 2008
Anagnostopoulou, E. et al. (2017). Exploring the Links Between Persuasion, Personality and Mobility Types in Personalized Mobility Applications. PERSUASIVE 2017, LNCS 10171, pp. 107–118.
Appel-Meulenbroek, R., Groenen, P., & Janssen, I. (2011). An end-user's perspective on activity-based office concepts. Journal of Corporate Real Estate, 13(2), 122-135
Appel-Meulenbroek, R., Kemperman, A., Kleijn, M., & Hendriks, E. (2015). To use or not to use: which type of property should you choose?: Predicting the use of activity based offices. Journal of Property Investment & Finance, 33(4), 320-336
Arditi, D. Nayak, S. & Damci, A. (2016). Effect of organizational culture on delay in construction. International Journal of Project Management 35 (2017) 136–147
Ax, C. & Greve, J. (2017). Adoption of management accounting innovations: Organizational culture compatibility and perceived outcomes. Management Accounting Research 34 (2017) 59–74
Baane, R., Houtkamp, P. & Knotter, M. (2011). Het nieuwe werken ontrafeld: over Bricks, Bytes & Behavior. Assen: Van Gorcum
Baarda, D.B. & De Goede, M.P.M. (2006). Basisboek Methoden en Technieken: Handleiding voor het opzetten en uitvoeren van kwantitatief onderzoek. Groningen: Noordhoff Uitgevers, 4th edition
Bagchi, K., Cerveny, R., Paul, H. & Petserson, M. (2003). The Influence of National Culture in Information Technology Product Adoption. Proceedings of the Ninth Americas Conference on Information Systems (AMCIS) 2003, Tampa, USA (CD Proceedings)
Barney, J.B. (1985). Organizational culture: Can it be a source of sustained competitive advantage? Academy of management review, 11(3): 656–65
Barrick, M. R. & Mount, M. K. (1991). The big five personality dimensions and job performance: a meta-analysis. Department of Management and Organizations. University if Iowa
Batenburg, R., & Van der Voordt, T. (2008). Effecten van facility beleving op de gepercipieerde arbeidsproductiviteit. Delft: Center for People and Buildings
Beijer, M., Van der Voordt, D. J., & Hanekamp, J. (2011). Het Nieuwe Werken onder het ontleedmes: Zijn de werkelijke effecten wel te meten? Facility Management Magazine, 24(187), 18-22

116
Bell, P. A., Greene, T. C., Fisher, J. D., & Baum, A. (2001). Environmental Psychology. Orlando: Harcourt College Publishers
Berlee, M. A. (2012). De geschiktheid van bestaand kantoorvastgoed voor een nieuwe, opkomende manier van werken. Master thesis, Eindhoven: Eindhoven University of Technology
Blok, M., Groenesteijn, L., Schelvis, R. & Vink, P. (2012). New ways of working: does flexibility in time and location of work change work behavior and effect business outcomes? Work, 41
Boundless (n.d.). The Five-Factor Model. Boundless Psychology Boundless. Retrieved 27 June 2017 from https://www.boundless.com/psychology/textbooks/boundless-psychology-textbook/personality-16/trait-perspectives-on-personality-79/the-five-factor-model-311-12846/
Buchanan, A. M. & Harting, E. (2015). De kracht van introvert leiderschap. O&O / NR 1 2015, 12-16
Budie, L.E. (2016). The employee in the modern work environment: A need-based approach to determine the effect of personal characteristics on satisfaction with the physical work environment in conventional and activity-based offices. Eindhoven University of Technology
California State University Northridge (CSUN). When to use a particular statistical test. Retrieved on 14 December 2016 from: http://www.csun.edu/~amarenco/Fcs%20682/When%20to%20use%20what%20test.pdf
Cameron, K. S. & Quinn, R. E. (1999). Diagnosing and changing organizational culture: Based on the competing values framework. San Francisco: Jossey-Bass, 1st edition
Cameron, K. S., & Quinn, R. E. (2006). Diagnosing and changing organizational culture: Based on the competing values framework. San Francisco: Jossey-Bass, 2nd edition
CBRE. (2011). What users want: De invloed van Het Nieuwe Werken op de kantooromgeving. Amsterdam: CB Richard Ellis Nederland
Cheng, A.S. & Fleischmann, K.R. (2010). Developing a meta-inventory of human values. Proc. ASIST, October 22–27, Pittsburg, P.A, USA, Vol. 47, issue 1, p. 1–10
De Been, I., & Beijer, M. (2014). The influence of office type on satisfaction and perceived productivity. Journal of Facilities Management, 12(2), 142-157
De Croon, E., Sluiter, J., Kuijer, P. P., & Frings-Dresen, M. (2005). The effect of office concepts on worker health and performance: a systematic review of the literature. Ergonomics, 48(2), 119-134
Denison, D.R., Spreitzer, G.M. (1991). Organizational culture and organizational development: a competing values approach. Research in Organizational Change and Development 5 (1), 1–21
Detert, J.R., Schroeder, R.G.& Maruiel, J.J. (2000). A framework for linking culture and improvement initiatives in organizations. Acad. Manage. Rev. 25 (4), 850–863
Diskienė, D. & Goštautas, V. (2013). A fit between individual and organizational values and its implications for employees’ job satisfaction and performance. Vilnius University, Lithuania
Dudley, Roger L. (1995). Anatomy of Value: The 1995 Book Health and Home. National Journal for Better Living, Vol. 36, No. 2. pp. 12; 33; 35-36

117
Duffy, F. (1997). The new office. London: Conran Octopus
Ferreira, M.P., Serra, F.A.R. & Pinto, C.S.F. (2014). Culture and Hofstede (1980) in international business studies: a bibliometric study in top management journals. REGE , São Paulo – SP, Brasil, v. 21, n. 3, p. 379-399, jul./se t. 2014
Fields, A. (2009). Discovering Statistics Using IBM SPSS Statistics. Sage Publications Ltd. London, United Kingdom
Fleming, D. (2005). The application of a behavioural approach to building evaluation. Facilities, 23(9/10), 393-415
Fong, P.S.W. & Kwok, C.W.C. (2009). Organizational culture and knowledge management success at project and organizational levels in contracting firms. Journal Construction Engineering Management, 135 (12):1348–1356
Frankema, E.H.P. (2003). Kantoorinnovatie in economisch perspectief. Delft: Center for People and Buildings
Goffee, R. & Jones, G. (1996). What holds the modern company together? Harvard Business Review, nov-dec 1996 issue, 133-148
Gorgievski, M. J., Van der Voordt, T. J., Van Herpen, S. G., & Van Akkeren, S. (2010). After the fire: New ways of working in an academic setting. Facilities, 28(3/4), 206-224
Gosling, S. D., Rentfrow, P. J., & Swann, W. B. (2003). A very brief measure of the Big-Five personality domains. Journal of Research in Personality, 37, 504-528
Gouldner, A.W. (1957). Cosmopolitans and locals: Toward an analysis of latent social roles. Administrative Science Quarterly, 2, 281-306
Greene, C., & Myerson, J. (2011). Space for thought: designing for knowledge workers. Facilities, 29(1/2), 19-30
Groenen, P. (2010). Bouwstenen voor productief huisvesten: Een evaluatieonderzoek naar de succesfactoren van het activiteitgerelateerde huisvestingsconcept vanuit het perspectief van de eindgebruiker. Master thesis, Eindhoven University of Technology
Hardin, E. E., & Donaldson, J. R. (2014). Predicting job satisfaction: a new perspective on Person-Environment fit. Journal of Counseling Psychology, 61(4), 634–640
Hartog, L. (2015). User satisfaction in multi-tenant offices: The relation between personality and demographic characteristics of users and their satisfaction with physical characteristics of multi-tenant offices. Master thesis, Eindhoven: Eindhoven University of Technology.
Haynes, B. P. (2007). Office productivity: a shift from cost reduction to human contribution. Facilities, 25(11/12), 452-462
Haynes, B. P. (2008). The impact of office comfort on productivity. Journal of Facilities Management, 6(1), 37-51
Haynes, B. P. (2011). The impact of generational differences on the workplace. Journal of Corporate Real Estate, 13(2), 98-108
Heijs, W. (2003). Founding houses for the elderly: on housing needs or dwelling needs? In R. Garcia Mira, J. Sabucedo, & J. Romay, Culture, Environmental Action and Sustainability (pp. 367-384). Göttingen: Hogrefe & Huber

118
Heijs, W. (2006). Technology and behaviour: contributuins from environmental psychology. In P. Verbeek, & A. Slob, User Behaviour and Technology Development: Shaping Sustainable Relations Between Consumers and Technologies (pp. 43-52). Dordrecht: Springer
Hoendervanger, J.G., Appel-Meulenbroek, H.A.J.A., Kemperman, A.D.A.M. & Susante, van P. (2015). Differences in Employee satisfaction in new versus traditional work environments. Eindhoven University of Technology & Hanze University of Applied Sciences
Hofstede, G. (1991). Cultures and organizations: Software of the mind. McGraw-Hill, New York, NY
Hofstede, G. (1997). Cultures and organizations: Software of the mind. McGraw-Hill, New York, NY
Hofstede, G. (1998). Attitudes, Values and Organizational Culture: Disentangling the Concepts. Organization Studies 1998, 19/3, 477-492
Hofstede, G. (2001). Culture’s Consequences. second ed. Sage, Thousand Oaks, CA
Hofstede, G. & Hofstede, G. J. (2005). Cultures and organizations: software of the mind, [Revised and expanded 2nd edition], New York: McGraw-Hill
Hogan, S. J. & Coote, L. V. (2014). Organizational culture, innovation, and performance: A test of Schein’s model. Journal of Business Research 67 (2014) 1609–1621
Holloway, S.S. (2014). Value crafting: Using organizational values for the development of sustainable work organizations. Eindhoven University of Technology
innvire (2017). I. Devèrs, personal communication, 18 April 2017
Jaeger, M. & Adair, D. (2013). Organizational culture of construction project managers in the GCC countries. Engineering Construction Architecture Management 20 (5): 461–473
James, P. S. (2014). Aligning and Propagating Organizational Values. Procedia Economics and Finance 11 ( 2014 ) 95 – 109. Symbiosis Institute of Management Studies Annual Research Conference (SIMSARC13)
Joy, A., & Haynes, B. P. (2011). Office design for the multi-generational knowledge workforce. Journal of Corporate Real Estate, 13(4)
Judge, T. A., Bono, J. E., & Locke, E. A. (2000). Personality and job satisfaction: the mediating role of job characteristics. Journal of Applied Satisfaction, 85, 237-249
Jung, T., Scott, T., Davies, H.T.O., Bower, P., Whalley, D., McNally, R. & Mannion, R. (2009). Instruments for exploring organizational culture: a review of the literature. Public Adm. Rev. 69, 1087–1096
Karahanna, E., Evaristo, J., and Srite, M. (2005). Levels of Culture and Individual Behavior: An Integrative Perspective. Journal of Global Information Management, 13(2), 1-20
Karjalainen, S. (2007). Gender differences in thermal comfort and use of thermostats in everyday thermal environments. Building and Environment, 42, 1594-1603
Kim, J., & de Dear, R. (2013). Workspace satisfaction: The privacy-communication trade-off in open-plan offices. Journal of Environmental Psychology, 36, 18-26

119
Kleijn, M. (2011). Activiteit op de moderne werkplek: Een studie naar de invloedsfactoren op het gebruik van faciliteiten in een activiteitgerelateerd huisvestingconcept. Master thesis, Eindhoven: Eindhoven University of Technology
Kotler, P., Ainamo, A. & Ranta, H. (1990). Marketing Handbook: Analysis, Planning, Implementation and Monitoring, 6th revised edition. Rastor publications, Helsinki. ISBN: 951941553X
Lamond, D. (2003). The value of Quinn's competing values model in an Australian context. Journal of Managerial Psychology 18 (1/2), 46–59
Lee, S. Y. (2006). Expectations of employees toward the workplace and environmental satisfaction. Facilities, 24(9/10), 343-353
Leung, K., Bhagat, R. S., Buchan, N.R., Erez, M. and Gibson, C.B. (2005). Culture and international business: recent advances and their implications for future research’. Journal of international Business Studies, 36 (4), 357 – 378
Liebregts, M.M.M. (2013). The modern work environment in different countries: How do employee preferences differ with regard to the modern work environment between countries? Eindhoven University of Technology
Locke, E. A. (1976). The nature and causes of job satisfaction. In M. D. Dunnette (Ed.), Handbook of industrial and organizational psychology. Chicago, IL: Rand McNally.
Maarleveld, M., Volker, L., & Van der Voordt, T. J. (2009). Measuring employee satisfaction in new offices – the WODI toolkit. Journal of Facilities Management, 7(3), 181-197
Madanchian, M. & Taherdoost, H. (2015). Perusing of Organizational Culture Effects on E-Mail Communication. Procedia Technology 22 ( 2016 ) 1076 – 1083
Matinaro, V. and Liu, Y. (2017). Towards increased innovativeness and sustainability through organizational culture: A case study of a Finnish construction business. Journal of Cleaner Production 142 (2017) 3184-3193
Meeuwesen, L., Brink-Muinen, A. van der, Hofstede, G. (2009). Can dimensions of national culture predict cross-national differences in medical communication? Patient Education and Counseling 75 (2009) 58–66
Naoum, S.G., Alyousif, A.R.T. & Atkinson, A.R. (2015). Impact of national culture on the management practices of construction projects in the United Arab Emirates. Journal Management Engineering, 31 (4)
Office Principles (n.d.). Agile Working Office Spaces. Retrieved on 22 March from: http://officeprinciples.com/agile-working/agile-working-office-spaces/
Open Uni (n.d.). Cronbach’s Alpha. Retrieved on 1 June from: http://www.open.ac.uk/socialsciences/spsstutorial/files/tutorials/cronbachs-alpha.pdf.
Oseland, N. (2009). The impact of psychological needs on office design. Journal of Corporate Real Estate, 11(4), 244-254
Ostroff, C. (1992). The relationship between satisfaction, attitudes, and performance: an organizational level analysis. Journal of Applied Psychology, Vol. 77, Issue 6, p. 963–974

120
Özçelika, G., Aybasb, M., Uyargil, C., (2016). High Performance Work Systems and Organizational Values: Resource-based View Considerations. Procedia - Social and Behavioral Sciences 235 ( 2016 ) 332 – 341
Plijters, E. B. (2012). Managing the Workplace in a Globalized World. Delft: Delft University of Technology
Pouwelse, F. J. (2013). Werken aan Het Nieuwe Werken. Master thesis, Eindhoven: Technische Universiteit Eindhoven
Profiles in Diversity Journal (2012). Culture, values and the impact at work. Retrieved on 4 January 2017 from: http://www.diversityjournal.com/9823-culture-values-and-the-impact-at-work/
Rashid, M., Kampschroer, K., Wineman, J., & Zimring, C. (2006). Spatial layout and face-to-face interaction in offices: a study of the mechanisms of spatial effects on face-to-face interaction. Environment and Planning B: Planning and Design, 33, 825-844
Razak, N. A., Ma’amor, H. & Hassan, N. (2016). Measuring Reliability and Validity Instruments of Work Environment Towards Quality Work Life. Procedia Economics and Finance, Volume 37, 2016, Pages 520-528
Rothe, P., Lindholm, A.-L., Hyvönen, A., & Nenonen, S. (2011). User preferences of office occupiers: investigating the differences. Journal of Corporate, 13(2)
Sadri, G. (2014). High-Performance Corporate Culture. Industrial Management, 56 (16), 16-21
Schein, E. H. (1985). Organizational Culture and Leadership. Jossey-Bass: San Francisco
Schein, E. H. (1992). Organizational Culture and Leadership. Jossey-Bass: San Francisco
Schein, E. H. (1993). On dialogue, culture, and organizational learning. Organizational Dynamics, Volume 22, Issue 2, Pages 40-51
Schein, E. H. (2015). Corporate Culture. International Encyclopedia of the Social & Behavioral Sciences (Second Edition), 2015, Pages 923-926
Singh, M. R. (2013). Cultural Paradigm of High Performing Organizations: An Ethnographic Study in India Context. International Journal of Business Anthropology, 4(1), 92-107
Smith, J. (2008). Welcoming Workplace: Designing office space for an ageing workforce in the 21st century knowledge economy. The Helen Hamlyn Research Centre
Spector, P. E. (1997). Job satisfaction: Application, assessment, causes, and consequences. Solid Action on Globalization and Environment, 3, (London, UK)
Springer, T. (2011). Measuring Work and Work Performance. White Paper, New Ways of Working LLC. p. 29
Tinsley, H. E. A. (2000). The Congruence Myth: An Analysis of the Efficacy of the Person–Environment Fit Model. Journal of Vocational Behavior 56, 147–179
Triandis, H. C. (1972). The Analysis Of Subjective Culture. New York: John Wiley & Sons
Tushman, M.L. & O'Reilly III, C.A. (1997). Winning through Innovation: A Practical Guide to Leading Organizational Change and Renewal. Boston, MA. Harvard Business School Press

121
Van Meel, J. (2011). The origins of new ways of working: Office concepts in the 1970s. Facilities, 29(9/10), 357-363
Van Den Broeck, A., Vansteenkiste, M., De Witte, H., & Lens, W. (2008). Explaining the relationships between job characteristics, burnout, and engagement: The role of basic psychological need satisfaction. Work & Stress, 22(3), 277-294
Van der Voordt, D. J., & d'Ancona, M. (2013). Het Nieuwe Werken vanuit het perspectief van de eindgebruiker. Boss magazine (48) 16-21
Van der Voordt, T., Brunia, S., & Appel-Meulenbroek, R. (2016). Satisfaction. Facilities management and Corporate Real Estate management as value drivers: how to manage and measure added value, pp. 67-82
Van der Voordt, T. J. (2004). Productivity and employee satisfaction in flexible workplaces. Journal of Corporate Real Estate, 6(2)
Van Ree, H. J. (2002). The added value of office accommodation to organizational performance. Work study, 51(7) 357-363
Veldhoen, E. (2005). The Art of Working. Academic Service: Den Haag
Vischer, J. C. (2008). Towards an environmental psychology of workspace: how people are affected by environments for work. Architectural Science Review, 51(2), 97-108
Vos, P., & Van der Voordt, T. (2001). Tomorrow’s offices through today’s eyes: Effects of innovation in the working environment. Journal of Corporate Real Estate, 48-65
Wiewiora. A., Trigunarsyah, B., Murphy, G. & Coffey, V. (2013). Organizational culture and willingness to share knowledge: A competing values perspective in Australian context. International Journal of Project Management 31 (2013) 1163–1174

122
APPENDIX 1 SURVEY
DEEL 1: OVER JE WERKWEEK Dit deel van het onderzoek gaat over waar we werken, welke activiteiten we uitvoeren en hoe we deze activiteiten ervaren. Om deze vragen goed te beantwoorden helpt het om even na te denken over jouw functieomschrijving, waar ben jij verantwoordelijk voor. Hoeveel procent van je werktijd besteed je op de volgende plekken in een gewone week: Als je parttime werkt is 100% het aantal uur dat jij werkt.
Open bureau plek
Gesloten bureau plek
Vergader of overleg ruimte
Andersoortige werkplek (bijvoorbeeld brainstorm, projectruimte, aanland plek, werklounge, restaurant)
Bij andere organisaties
Thuis
Elders
100 Resterende waarde
Hoe frequent zit je op dezelfde werkplek?
• (bijna) Altijd
• Regelmatig
• Soms
• Zelden
• Nooit
DEEL 2: OVER JE WERKOMGEVING Dit deel gaat over de locatie- en gebouwaspecten die jij belangrijk vindt. Ook willen we weten
wat je vindt van de huidige karakteristieken van je werkomgeving.
Hoe tevreden ben je over je huidige werkomgeving?
• Zeer tevreden
• Tevreden
• Neutraal
• Niet tevreden
• Helemaal niet tevreden
Hoe belangrijk zijn de volgende aspecten voor je werk omgeving?

123
Erg
onbelangrijk
Onbelangrijk Neutraal Belangrijk Erg
belangrijk
Concentratie
Privacy
Communicatie
Nabijheid van
collega's
Ergonomie en
comfort (meubels)
(Voldoende)
ruimte om te
werken
Comfortabel
binnenklimaat
Controle over
binnenklimaat
Voldoende
daglicht/verlichting
Personalisatie
Uitdrukken status
Ontspanning
Autonomie en
vrijheid in de keuze
Mooie uitstraling
Locatie
Ondersteunende
faciliteiten (Bv.
WiFi,
stekkerdozen)
Ander, gelieve te
specificeren

124
Hoe tevreden ben je met de volgende aspecten in je werk omgeving?
Erg
onbelangrijk
Onbelangrijk Neutraal Belangrijk Erg
belangrijk
Concentratie
Privacy
Communicatie
Nabijheid van
collega's
Ergonomie en
comfort (meubels)
(Voldoende)
ruimte om te
werken
Comfortabel
binnenklimaat
Controle over
binnenklimaat
Voldoende
daglicht/verlichting
Personalisatie
Uitdrukken status
Ontspanning
Autonomie en
vrijheid in de keuze
Mooie uitstraling
Locatie
Ondersteunende
faciliteiten (Bv.
WiFi,
stekkerdozen)
Ander, gelieve te
specificeren

125
Welk rapportcijfer geef je de huidige werkomgeving over het algemeen?
Schaal 1 tot en met 10
DEEL 3: CULTUUR VAN DE ORGANISATIE De volgende vragen gaan over de cultuur binnen onze organisatie en wordt alleen gerelateerd
aan dit onderzoek naar werkplekken. Voor elke vraag mag je 100 punten verdelen over vier
opties. Een optie kan leeggelaten worden wat gelijk staat aan nul punten.
Iedere vraag beantwoord je vanuit twee perspectieven. Eerst gebaseerd op de huidige situatie
en daarna zoals jij wilt dat de organisatie er over 5 jaar uitziet. Met andere woorden, hoe zou
de cultuur er uit moeten zien.
Kenmerken van de organisatie
Op dit moment is de organisatie een behoorlijk:
persoonlijke omgeving. Het is als een grote familie. Mensen lijken veel van zichzelf
te delen met anderen.
dynamische en ondernemende omgeving. Mensen nemen risico en lijken hun nek
uit te willen steken.
op resultaat gerichte omgeving. Het gaat met name om de klus geklaard te krijgen.
Mensen zijn erg competitief en gericht op prestaties.
gecontroleerde en gestructureerde omgeving. Formele procedures bepalen over
het algemeen wat mensen doen.
100 Resterende waarde
Om de doelstellingen van de organisatie ontwikkeling tot een succes te maken moet over 5
jaar de organisatie een:
persoonlijke omgeving. Het is als een grote familie. Mensen lijken veel van zichzelf
te delen met anderen.
dynamische en ondernemende omgeving. Mensen nemen risico en lijken hun nek
uit te willen steken.
op resultaat gerichte omgeving. Het gaat met name om de klus geklaard te krijgen.
Mensen zijn erg competitief en gericht op prestaties.
gecontroleerde en gestructureerde omgeving. Formele procedures bepalen over
het algemeen wat mensen doen.
100 Resterende waarde

126
Op dit moment is het leiderschap in de organisatie over het algemeen een voorbeeld van:
mentoring, faciliteren of verzorgen.
ondernemerschap, innovatie en het nemen van risico.
een no-nonsense, strijdlustige, resultaatgerichte focus.
coördinatie, organiseren en vlot verlopende efficiëntie.
100 Resterende waarde
Om in de toekomst succesvol te zijn als organisatie moet de focus van de leidinggevenden
liggen op:
mentoring, faciliteren of verzorgen.
ondernemerschap, innovatie en het nemen van risico.
een no-nonsense, strijdlustige, resultaatgerichte focus.
coördinatie, organiseren en vlot verlopende efficiëntie.
100 Resterende waarde
Datgene dat de organisatie momenteel verbindt is:
Loyaliteit en onderling vertrouwen. Betrokkenheid bij de organisatie staat hoog.
Betrokkenheid bij innovatie en ontwikkeling. Het is belangrijk om voorop te lopen.
De nadruk op prestaties en het bereiken van doelstellingen.
De formele regels en het beleid. Het in stand houden van een soepel draaiende
organisatie is belangrijk.
100 Resterende waarde
Wat ons als medewerkers van de organisatie in de toekomst bindt ...
Loyaliteit en onderling vertrouwen. Betrokkenheid bij de organisatie staat hoog.
Betrokkenheid bij innovatie en ontwikkeling. Het is belangrijk om voorop te lopen.
De nadruk op prestaties en het bereiken van doelstellingen.
De formele regels en het beleid. Het in stand houden van een soepel draaiende
organisatie is belangrijk.
100 Resterende waarde

127
De strategische nadruk ligt op dit moment vooral op:
de medewerker centraal, veel vertrouwen, openheid en participatie.
innovatie/vernieuwing en kansen grijpen.
resultaatgerichtheid en prestaties. Het bereiken van ambitieuze doelstellingen en
resultaten zijn belangrijk.
duidelijke regels. Efficiëntie, beheersbaarheid en soepele uitvoering zijn belangrijk.
100 Resterende waarde
Om de organisatie ontwikkeling succesvol te laten zijn ligt de nadruk binnen onze
organisatie in de toekomst vooral op ...
de medewerker centraal, veel vertrouwen, openheid en participatie.
innovatie/vernieuwing en kansen grijpen.
resultaatgerichtheid en prestaties. Het bereiken van ambitieuze doelstellingen en
resultaten zijn belangrijk.
duidelijke regels. Efficiëntie, beheersbaarheid en soepele uitvoering zijn belangrijk.
100 Resterende waarde
Momenteel meet de organisatie succes af op basis van...
De ontwikkeling van de medewerker, teamwerk, de betrokkenheid en zorg voor
mensen.
De meest unieke of beste dienstverlening hebben.
Sneller, succesvoller en groter zijn dan de concurrenten in de markt. Competitief
marktleiderschap is essentieel.
Betrouwbaarheid. Soepele dienstverlening en goedkope productie zijn van cruciaal
belang.
100 Resterende waarde
Om als organisatie in de toekomst succesvol te zijn, zal de organisatie haar succes meten op
basis van...
De ontwikkeling van de medewerker, teamwerk, de betrokkenheid en zorg voor
mensen.
De meest unieke of beste dienstverlening hebben.

128
Sneller, succesvoller en groter zijn dan de concurrenten in de markt. Competitief
marktleiderschap is essentieel.
Betrouwbaarheid. Soepele dienstverlening en goedkope productie zijn van cruciaal
belang.
100 Resterende waarde
Hieronder staat een aantal eigenschappen die al dan niet op jou van toepassing kunnen zijn.
Noteer alsjeblieft naast elke bewering in hoeverre het met de bewering eens bent.
Beoordeel steeds in hoeverre beide eigenschappen op jou van toepassing zijn, zelfs wanneer
één eigenschap meer van toepassing is dan de andere eigenschap.
Sterk
oneens
Enigszins
oneens
Klein
beetje
oneens
Niet
oneens,
niet
eens
Klein
beetje
eens
Enigszins
eens
Sterk
eens
Extravert,
enthousiast
Strijdvaardig,
streng
Betrouwbaar,
zelfgedisciplineerd
Angstig, snel van
slag
Openstaand voor
nieuwe ervaringen
Gereserveerd,
rustig
Sympathiek, warm
Ongeorganiseerd,
achteloos
Kalm, emotioneel
stabiel
Traditioneel, niet-
creatief

129
Geslacht:
• Man
• Vrouw Geboortejaar:
Hoogst afgeronde opleiding: • Middelbare school • MBO • HBO • WO
Je functie wordt het beste omschreven als:
• Stagiaire • Ondersteuning • Medewerker • Management • Directie
Hoeveel uren werk je totaal per week? Heb je naar aanleiding van deze vragenlijst nog tips of opmerkingen voor een betere werkomgeving?

130
APPENDIX 2 FACTOR ANALYSIS IMPORTANCE
The factor analysis with sixteen variables concerning the importance of needs, was conducted
using SPSS. With the use of Extraction Method: Principal Component Analysis and Rotation
Method: Varimax with Kaiser Normalization, four components were created. In Table 63,
Table 64 and Table 65 the factor analysis can be seen.
TABLE 63. KMO AND BARTLETT'S TEST
KMO and Bartlett's Test
Kaiser-Meyer-Olkin Measure of Sampling
Adequacy.
,808
Bartlett's Test of
Sphericity
Approx. Chi-Square 1919,30
4
df 120
Sig. ,000
TABLE 64. COMPONENTS AND EIGENVALUES
Total Variance Explained
Compon
ent
Initial Eigenvalues Extraction Sums of
Squared Loadings
Rotation Sums of
Squared Loadings
Tot
al
% of
Varian
ce
Cumulati
ve %
Tot
al
% of
Varian
ce
Cumulati
ve %
Tot
al
% of
Varian
ce
Cumulati
ve %
1 4,12
5
25,779 25,779 4,12
5
25,779 25,779 2,95
8
18,487 18,487
2 2,00
6
12,535 38,313 2,00
6
12,535 38,313 2,63
8
16,486 34,973
3 1,43
7
8,984 47,297 1,43
7
8,984 47,297 1,68
0
10,497 45,470
4 1,12
3
7,021 54,318 1,12
3
7,021 54,318 1,41
6
8,848 54,318
5 ,922 5,763 60,081
6 ,897 5,609 65,690
7 ,794 4,965 70,656
8 ,714 4,459 75,115

131
9 ,670 4,185 79,300
10 ,611 3,817 83,117
11 ,586 3,663 86,780
12 ,562 3,513 90,294
13 ,444 2,776 93,069
14 ,416 2,598 95,667
15 ,372 2,325 97,992
16 ,321 2,008 100,000
Extraction Method: Principal Component Analysis.
TABLE 65. COMPONENT TRANSFORMATION MATRIX
Component Transformation Matrix
Componen
t
1 2 3 4
1 ,721 ,551 ,330 ,260
2 -,491 ,826 -,104 -,258
3 -,447 -,063 ,836 ,312
4 -,199 ,102 -,426 ,877
Extraction Method: Principal Component Analysis.
Rotation Method: Varimax with Kaiser
Normalization.

132
APPENDIX 3 FACTOR ANALYSIS SATISFACTION The factor analysis with sixteen variables concerning the satisfaction with the support of
needs, was conducted using SPSS. With the use of Extraction Method: Principal Component
Analysis, Rotation Method: Varimax with Kaiser Normalization and a maximum of four
components, these components were created. In Table 66, Table 67 and Table 68 the factor
analysis can be seen.
TABLE 66 KMO AND BARLETT’S TEST RESULTS
KMO and Bartlett's Test
Kaiser-Meyer-Olkin Measure of Sampling Adequacy.
,823
Bartlett's Test of Sphericity
Approx. Chi-Square 2323,052
df 120
Sig. ,000
TABLE 67. COMPONENTS AND EIGENVALUES
Total Variance Explained
Component
Initial Eigenvalues Extraction Sums of Squared Loadings
Rotation Sums of Squared Loadings
Total
% of Variance
Cumulative %
Total
% of Variance
Cumulative %
Total
% of Variance
Cumulative %
1 4,822
30,137 30,137 4,822
30,137 30,137 2,608
16,299 16,299
2 1,695
10,592 40,729 1,695
10,592 40,729 2,258
14,111 30,410
3 1,345
8,409 49,138 1,345
8,409 49,138 2,200
13,750 44,160
4 1,130
7,063 56,201 1,130
7,063 56,201 1,927
12,041 56,201
5 1,089
6,809 63,010
6 ,830 5,189 68,199
7 ,742 4,640 72,839
8 ,708 4,426 77,266
9 ,658 4,110 81,376
10 ,562 3,512 84,888
11 ,535 3,342 88,229
12 ,461 2,882 91,111
13 ,442 2,761 93,873
14 ,383 2,395 96,267
15 ,326 2,039 98,307
16 ,271 1,693 100,000
Extraction Method: Principal Component Analysis.

133
TABLE 68. COMPONENT TRANSFORMATION MATRIX
Component Transformation Matrix
Component
1 2 3 4
1 ,602 ,508 ,445 ,427
2 -,215 ,483 -,709 ,467
3 -,731 ,455 ,506 -,038
4 -,239 -,549 ,208 ,773
Extraction Method: Principal Component Analysis. Rotation Method: Varimax with Kaiser Normalization.

134
APPENDIX 4 COMPARISON IMPORTANCE For the variables concerning the importance of needs, a one-way ANOVA was conducted to see the differences between the organizations. In Table 69 the results of this bivariate analysis can be seen. TABLE 69. IMPORTANCE OF NEEDS, ONE-WAY ANOVA
ANOVA
Sum of Squares df Mean Square F Sig.
Concentration
Between Groups 1,829 2 ,915 1,513 ,221
Within Groups 293,733 486 ,604
Total 295,562 488
Privacy
Between Groups 3,253 2 1,627 2,212 ,111
Within Groups 357,450 486 ,735
Total 360,703 488
Communication
Between Groups 1,510 2 ,755 1,519 ,220
Within Groups 241,537 486 ,497
Total 243,047 488
Proximity of coworkers
Between Groups 7,366 2 3,683 5,680 ,004
Within Groups 315,129 486 ,648
Total 322,495 488
Ergonomics
Between Groups ,891 2 ,445 ,667 ,514
Within Groups 324,680 486 ,668
Total 325,571 488
Space
Between Groups ,746 2 ,373 ,584 ,558
Within Groups 310,591 486 ,639
Total 311,337 488
Comfort indoor climate
Between Groups 1,133 2 ,566 1,074 ,343
Within Groups 256,356 486 ,527
Total 257,489 488
Control over climate
Between Groups 34,005 2 17,002 18,892 ,000
Within Groups 437,386 486 ,900
Total 471,391 488
Lighting
Between Groups ,816 2 ,408 ,703 ,495
Within Groups 281,778 486 ,580
Total 282,593 488
Personalization
Between Groups 107,066 2 53,533 42,247 ,000
Within Groups 615,834 486 1,267
Total 722,900 488
Status expression
Between Groups 9,119 2 4,560 4,788 ,009
Within Groups 462,807 486 ,952
Total 471,926 488
Relaxation
Between Groups ,300 2 ,150 ,192 ,825
Within Groups 379,201 486 ,780
Total 379,501 488
Autonomy
Between Groups 2,897 2 1,448 2,285 ,103
Within Groups 308,138 486 ,634
Total 311,035 488
Aesthetics Between Groups 26,519 2 13,260 16,258 ,000
Within Groups 396,380 486 ,816

135
Total 422,900 488
Location
Between Groups 63,379 2 31,690 45,372 ,000
Within Groups 339,447 486 ,698
Total 402,826 488
Facilities
Between Groups 20,748 2 10,374 18,497 ,000
Within Groups 272,565 486 ,561
Total 293,313 488

136
APPENDIX 5 COMPARISON SATISFACTION
For the variables concerning the satisfaction with the support of needs, a one-way ANOVA was conducted to see the differences between the organizations. In Table 70 the results of this bivariate analysis can be seen. TABLE 70 SATISFACTION WITH NEEDS, ONE-WAY ANOVA
ANOVA
Sum of Squares
df Mean Square F Sig.
Concentration Between Groups 8,567 2 4,283 4,382 ,013
Within Groups 475,020 486 ,977
Total 483,587 488
Privacy Between Groups 6,025 2 3,013 3,877 ,021
Within Groups 377,648 486 ,777
Total 383,673 488
Communication Between Groups 8,157 2 4,078 6,448 ,002
Within Groups 307,394 486 ,632
Total 315,550 488
Proximity Between Groups 2,726 2 1,363 2,145 ,118
Within Groups 308,796 486 ,635
Total 311,521 488
Ergonomics Between Groups 49,444 2 24,722 37,387 ,000
Within Groups 321,366 486 ,661
Total 370,810 488
Space Between Groups 7,390 2 3,695 4,502 ,012
Within Groups 398,831 486 ,821
Total 406,221 488
Comfort Climate Between Groups ,613 2 ,306 ,266 ,767
Within Groups 559,731 486 1,152
Total 560,344 488
Control Climate Between Groups 8,017 2 4,008 4,024 ,018
Within Groups 484,147 486 ,996
Total 492,164 488
Lighting Between Groups 67,631 2 33,815 31,226 ,000
Within Groups 526,300 486 1,083
Total 593,930 488
Personalization Between Groups 5,304 2 2,652 4,826 ,008
Within Groups 267,093 486 ,550
Total 272,397 488
Status Between Groups 4,843 2 2,422 5,827 ,003
Within Groups 201,967 486 ,416
Total 206,810 488
Relaxation Between Groups 12,231 2 6,115 11,809 ,000
Within Groups 251,675 486 ,518
Total 263,906 488
Autonomy Between Groups 11,925 2 5,963 8,417 ,000
Within Groups 344,300 486 ,708
Total 356,225 488
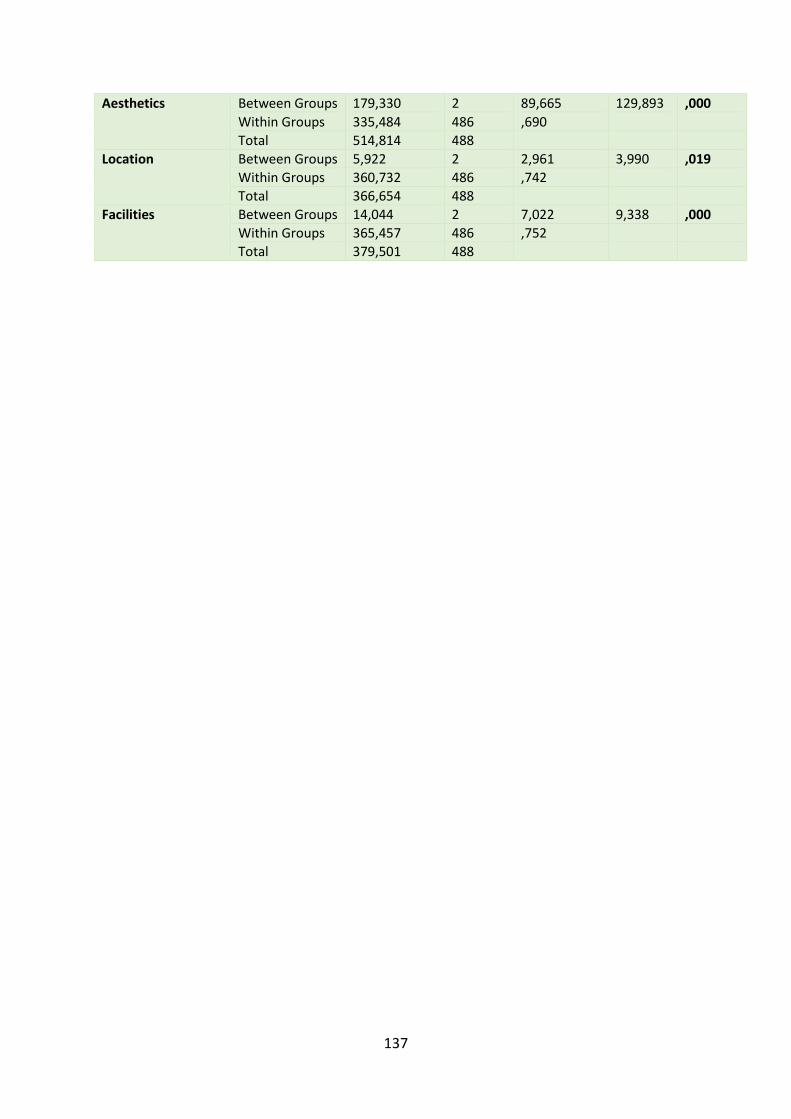
137
Aesthetics Between Groups 179,330 2 89,665 129,893 ,000
Within Groups 335,484 486 ,690
Total 514,814 488
Location Between Groups 5,922 2 2,961 3,990 ,019
Within Groups 360,732 486 ,742
Total 366,654 488
Facilities Between Groups 14,044 2 7,022 9,338 ,000
Within Groups 365,457 486 ,752
Total 379,501 488

138
APPENDIX 6 COMPARISON FREQUENCY TABLE 71. RESULTS ONE-WAY ANOVA FREQUENCY WORKSPACE
ANOVA
Frequency_Workspace
Sum of Squares
df Mean Square F Sig.
Between Groups
16,785 2 8,393 8,585 ,000
Within Groups 475,096 486 ,978
Total 491,881 488
TABLE 72. COMPARISON FREQUENCY WORKSPACE USE AND ORGANIZATIONS
Multiple Comparisons
Dependent Variable: Frequency_Workspace
Tukey HSD
(I) Bedrijf (J) Bedrijf Mean Difference (I-J)
Std. Error
Sig. 95% Confidence Interval
Lower Bound
Upper Bound
Organization 2
Organization 1
-,393* ,108 ,001 -,65 -,14
Organization 3
,004 ,169 1,000 -,39 ,40
Organization 1
Organization 2
,393* ,108 ,001 ,14 ,65
Organization 3
,397* ,151 ,024 ,04 ,75
Organization 3
Organization 2
-,004 ,169 1,000 -,40 ,39
Organization 1
-,397* ,151 ,024 -,75 -,04
*. The mean difference is significant at the 0.05 level.

139
APPENDIX 7 COMPARISON EDUCATION TABLE 73. COMPARISON FOUR COMPONENTS IMPORTANCE NEEDS AND EDUCATION
Multiple Comparisons
Tukey HSD
Dependent Variable
(I) Education
(J) Education
Mean Difference (I-J)
Std. Error Sig. 95% Confidence Interval
Lower Bound
Upper Bound
Imp_Comfort
1 2 ,11004983 ,11249885 ,591 -,1544254
,3745250
3 ,33433714* ,11563100 ,011 ,0624985 ,6061758
2 1 -,11004983 ,11249885 ,591 -,3745250
,1544254
3 ,22428731 ,10531324 ,085 -,0232951
,4718697
3 1 -,33433714* ,11563100 ,011 -,6061758
-,0624985
2 -,22428731 ,10531324 ,085 -,4718697
,0232951
Imp_Work_Environment
1 2 -,06206318 ,10589708 ,828 -,3110182
,1868918
3 -,79473211* ,10884543 ,000 -1,0506184
-,5388458
2 1 ,06206318 ,10589708 ,828 -,1868918
,3110182
3 -,73266893* ,09913315 ,000 -,9657225
-,4996154
3 1 ,79473211* ,10884543 ,000 ,5388458 1,0506184
2 ,73266893* ,09913315 ,000 ,4996154 ,9657225
Imp_Personalization
1 2 ,43484362* ,10975265 ,000 ,1768245 ,6928627
3 ,65322510* ,11280835 ,000 ,3880223 ,9184279
2 1 -,43484362* ,10975265 ,000 -,6928627
-,1768245
3 ,21838149 ,10274245 ,086 -,0231572
,4599202
3 1 -,65322510* ,11280835 ,000 -,9184279
-,3880223
2 -,21838149 ,10274245 ,086 -,4599202
,0231572
Imp_Privacy 1 2 ,02369265 ,11343390 ,976 -,2429808
,2903661
3 ,10362605 ,11659209 ,648 -,1704720
,3777241
2 1 -,02369265 ,11343390 ,976 -,2903661
,2429808

140
3 ,07993339 ,10618857 ,732 -,1697069
,3295737
3 1 -,10362605 ,11659209 ,648 -,3777241
,1704720
2 -,07993339 ,10618857 ,732 -,3295737
,1697069
*. The mean difference is significant at the 0.05 level.

141
APPENDIX 8 NORMAL DISTRIBUTIONS

142
APPENDIX 9 TABLE SIGNIFICANT RELATIONSHIPS O
pen
wo
rk.
Clo
sed
wo
rk.
Mee
tin
g w
ork
.
Oth
er w
ork
.
Sist
er
Ho
me
Imp
_Co
mfo
rt
Imp
_Wo
rkp
lace
Imp
_Per
son
al.
Imp
_Pri
vacy
Sat_
Pri
vacy
Sat_
Wo
rkp
lace
Sat_
Co
mfo
rt
Sat_
Per
son
.
Ove
rall
Sat.
Gender
Job rank
Education
Age - - - +
Work hours + + + - + - + -
Extraver. + + - +
Agreeable + +
Conscientio - - + +
Emo. sta. + - + +
Openness + + + + +
Now_Clan + + + - + - +
Now_Adh. + - + +
Now_Mar. - - - - + - + - -
Now_Hier. - - + -
Pref_Clan + -
Pref_Adh. + + + + + +
Pref_Mark. + - -
Pref_Hier. - - - - - - + -
Imp_Comf. - - - - -
Imp_Work-place
+ + + + + - +
Imp_Pers. - - + -
Imp_Priv. + - - +
Open work. +
Closed work.
+ +
Meeting work.
+ + +
Other work.
+ +
Client - +
Home +
Sat_Privacy +
Sat_Workpl
+
Sat_Comf. +
Sat_Pers. +
Copyright © 2022 FDOKUMEN