Organizational culture and good governance in the public sector
Upload
khangminh22Category
view
3download
0
International Journal of Advanced and Applied Sciences, 5(12) 2018, Pages: 59-66
Contents lists available at Science-Gate
International Journal of Advanced and Applied Sciences Journal homepage: http://www.science-gate.com/IJAAS.html
59
Organizational culture and performance of Malaysian manufacturing firms
Wee Loong Lee 1, *, Aik Lee Chong 1, Thurasamy Ramayah 2
1Faculty of Business and Law, International University of Malaya-Wales, Kuala Lumpur, Malaysia 2School of Management, Universiti Sains Malaysia, Pulau Pinang, Malaysia
A R T I C L E I N F O A B S T R A C T
Article history: Received 4 July 2018 Received in revised form 27 September 2018 Accepted 30 September 2018
The purpose of this paper is to examine the effects of organizational culture on firm performance. Data for the study was collected through a survey of 223 companies registered with the Federation of Malaysian manufacturers. Responses were analyzed using PLS-SEM to assess the relationships between organizational culture and firm performance. The findings that amongst Malaysian manufacturers, organizational culture has a medium effect on firm performance. Helpful insights may be gleaned for organizations, particularly in the Malaysian manufacturing sector, which seek to introduce organizational culture in order to successfully increase competitiveness and responsivity to environmental changes. Organizational culture has been studied in great detail in recent literature. Many new researchers have explored various composition factors of transformational leadership and how this will have an effect on firm performance. However, there is few research in the area of transformational leadership amongst Malaysian manufacturing companies. This research contributes to existing literature through empirical examination of the relationship between organizational culture and firm performance, particularly in the Malaysian manufacturing sector. The conclusions of this research strongly suggest that implementing means to encourage and foster organizational culture are likely to result in the achievement of superior firm performance. Our study shows inter-functional cooperation, openness and flexibility and the basic values of success are supported.
Keywords: Organizational culture Firm performance Manufacturing sector Company leadership
© 2018 The Authors. Published by IASE. This is an open access article under the CC BY-NC-ND license (http://creativecommons.org/licenses/by-nc-nd/4.0/).
1. Introduction
*All organizations strive to improve firm performance. Organizational culture itself is an important driver for better firm performance (Morone, 1989; Porter, 1985; Stacey and Ashton, 1990). Prior research has indicated organizational culture plays a significant role in various parameters related to firm performance, e.g. job satisfaction and productivity. Innovation of organizational culture has positively impacted firm performance, which in turn improves national economy, industrial competitiveness and standards of living (Gopalakrishnan and Damanpour, 1997).
An organization's culture drives the behaviour and actions of an organization. Hence, it is a critical factor in a firm's operations (Chang and Lin, 2007). Organizational culture itself has been defined differently by different sources. It is most commonly
* Corresponding Author. Email Address: [email protected] (W. L. Lee)
https://doi.org/10.21833/ijaas.2018.12.008 2313-626X/© 2018 The Authors. Published by IASE. This is an open access article under the CC BY-NC-ND license (http://creativecommons.org/licenses/by-nc-nd/4.0/)
stated that the culture of an organization represents the type of activities which occur naturally within it, as per Lundy and Cowling (1996). More in-depth studies involving sociological and anthropological perspectives have suggested that organization culture be described as shared norms in terms of values, beliefs and behaviors, which serve as an insight into how an organization functions (Deshpande and Webster, 1989). Yet a different description of organizational culture is where it is portrayed as a sum of assumptions; assumptions which have had positive effects for the organization and then spread and adopted amongst its employees (Martins and Terblanche, 2003).
The importance of organizational culture can be attributed to its influence in achieving an organization's desired outcomes. Objectives such as innovation, productivity and financial performance can all be shaped by organizational culture, as it provides a solution to integrating and adapting an organization's members under a common culture, and thus improves the smooth operations of the firm (Blackwell, 2006; Furnham and Gunter, 1993).
Organizational culture can be classified into several categories (Blackwell, 2006; Martins and
Lee et al /International Journal of Advanced and Applied Sciences, 5(12) 2018, Pages: 59-66
60
Terblanche, 2003; Schein, 1992). Some of the more commonly proposed categories are clan, hierarchy, adhocracy and market, and these categories segregate organizational culture through leadership styles, bonding, and the dominant attributes present as well as how the organization is strategically emphasized (Deshpande et al., 1993). In a clan culture, for example, dominant attributes would be participation and teamwork, whereas competitiveness and goal achievement would be the primary traits in a market culture. Market culture was found to have the most effect on organizational performance, with hierarchy the least (Deshpande et al., 1993). Culture can also be categorized under four cultures: group culture, developmental culture, hierarchical culture and rational culture (Quinn and Spreitzer, 1991), or four constructs: cooperativeness, innovativeness, consistency and effectiveness (Chang and Lin, 2007) as well as a division into bureaucratic, innovative and supportive (Wallach, 1993). Culture in this perspective could have a restrictive and a directive impact on the strategies of organizations.
Organizational culture involves the interaction of people in the workplace and how the basic assumptions, values, beliefs, and various philosophies as well as ideologies shape the workplace environment (Lund, 2003; Schein, 2009). It is pared down to the fundaments by Deal and Kennedy (1982), who refer to organizational culture as the way things are done in the organization. Although the culture's core set of assumptions is created within the organization, it is further developed by influences from social and historical forces. Organizational culture begins from the top, with the leadership, before being strengthened and affirmed by the accumulated experiences from the members (Rashid et al., 2003), and in the process it influences how the members of an organization behave (O’Reilly, 1989). In an academic setting, a supportive institution can improve staff innovation and student academic achievement (Hofman et al., 2002). It is important to consider the various characteristics of organizational culture so that its members may participate in a common vision to build a greater sense of purpose (Zhu et al., 2009). This is supported by Denison and Mishra (1995), who identified a sense of mission as one of four cultural traits prominent in organizational culture.
While studying culture, we have encountered issues in dividing the ethnically diverse sample set in Malaysia, a country populated by Malays, Chinese, Indians as well as other races. Instead, we focused solely on organizational culture. This is in line with the Theory of Planned Behaviour where the area of planned behaviour is represented in our model by organizational culture that supports innovation.
The Malaysian Manufacturing sector has been a pillar of growth for Malaysia. From an agrarian community, during the 1970s, Malaysia has propelled its economic growth by focusing on building a manufacturing base. The Malaysian Government invited multi-national companies and
entrepreneurs by providing various incentives to manufacture products in Malaysia. The aim was to create employment and spur exports.
The Malaysian manufacturing sector has performed well between January and November 2014, demonstrating an increase in sales value by 6.1% to reach RM600.1 billion, while also showing an increase in employee number by 1.5% to 1,030,383 persons. In that same time, productivity increased by 4.6% to RM582,421, with the overall manufacturing index expanding at 5.9% over the previous year and growing by 3.7% in November 2014 in particular. Thus our aim in this study is to measure the effect of organizational culture on firm performance of Malaysian manufacturing firms.
2. Literature review and model development
2.1. Firm performance
Subjective measures adapted from Kellermanns and Eddleston (2006), were chosen to measure firm performance, as objective data of private firms are not easily obtainable. Kellermanns and Eddleston (2006) have demonstrated a high correlation of subjective measures of firm performance with objective performance data, indicating the reliability of their method. Four performance related questions referred to growth in sales, market share, number of employees, and profitability; and two performance related questions referred to profit margin on sales and ability to fund growth from profits. We can see that Kellermanns and Eddleston (2006) model on FP to be suitable because the measurements encompasses to top line performance, margins, profitability, market share, size of firm and ability to grow market share. Our model where we identify EO (Hughes and Morgan, 2007) on FP will find that the Kellermanns and Eddleston (2006) as a suitable performance measurement given the metrics measured by this performance measurement.
2.2. Organizational culture
It has been found that organizational culture has a significant relationship with FP. It has also been observed that the organization's innovation has acted positively as a moderator between organizational culture and FP. This has resulted in our choice on Hogan and Coote (2014) concept of an organizational culture that supports innovation. Hogan and Coote (2014) have proposed a set of organizational culture that supports innovation, where the qualities in organizational culture and organizational innovation were combined.
An organizational culture which successfully influences employee behaviour can be constructed by placing an emphasis on particular values, while reinforcing the corresponding norms for the desired behaviour (Tellis et al., 2009).

Lee et al /International Journal of Advanced and Applied Sciences, 5(12) 2018, Pages: 59-66
61
2.3. Research model
A recent study that is well cited in Google Scholar on organizational culture is Hogan and Coote (2014). They focused on organizational culture values that support innovation. The eight dimensions that were highlighted by Hogan and Coote (2014) are: basic values of success, openness and flexibility, internal communication, competence and professionalism, inter-functional co-operation, responsibility of employees, appreciation of employees and risk-taking. Our study has removed the dimension of risk-taking and responsibility of employees. The rationale for this is because this journal is part of a larger study which excludes the effects of risk-taking and responsibility of employees.
The first dimension is success. This value emphasizes the importance of achieving success in the firm, how important it is to ensure the firm has good governance, high level of encouragement to motivate employees to succeed, the importance of achieving high standards of performance and also, to ensure that employees know the importance of achieving the firm's goals for the survival of the firm.
The second dimension is openness and flexibility. This dimension highlights how open, flexible and responsive is the organization to change in the business dynamics, new ideas and how it is going to take advantage to come out ahead in the marketplace. Openness and flexibility aims to provide a safe workplace for employees to be creative, innovative and take responsibility on their work. The top management needs to be receptive to new ideas and to build processes where employees can try different things in a logical and safe manner while implementing these new ideas.
The third dimension is internal communication. Internal communication looks at how a firm communicates within itself internally. This organization culture upholds respect and trust within colleagues and management. The firm aims to create an environment where employees can communicate effectively and share ideas, which are important to be competitive in the workplace. Firms need to be able to have access to information and knowledge from the different levels of employees. This gathering of knowledge will help the firm to analyze and come up with better business ideas, strategies and processes that will allow the firm to leap ahead in the marketplace.
The fourth dimension is competence and professionalism. Competence and professionalism shows the prominence of having competent skills, knowledge and experience of the employees in performing the task-at-hand. Having and appropriate skills, knowledge and experience would allow the task-at-hand to be carried out properly. The employee will be able to provide feedback on the task and how to improve our approach, to either improve the efficiency on the product or come up with a new idea or strategy.
The fifth dimension is inter-functional cooperation. This organizational culture aims at
ensuring the coordination between different departments in a firm is successful although at times, this can be a complex challenge. The different departments need to ensure they are well coordinated in terms of timeline, communication between the relevant members are effective and miscommunication does not arise and conflict situations are properly resolved through a transparent process. Achieving inter-functional cooperation will allow a firm to be more likely successful in developing a new business process or a new product or service in the marketplace.
The sixth dimension is appreciation. Appreciation places values on how a firm outlines the key performance indicators of a firm, set market driven and appropriate reward mechanisms and then, when the employees achieve these goals, the firm will then reward them. It is important for this organization culture to be effective, the firm needs to quantitatively place the tangible results of the firm into the key performance indicator of the employees. Appreciation is an important component of organizational culture because it will ensure the employee is motivated in carrying out the other dimensions defined in this study. A motivated employee is likely to ensure that he achieves success in the firm, being open and flexible, communicate internally effectively, study and learn new skills to ensure he is competent and professional, coordinate properly with different departments, being responsible for their work and also, risk-taking with the aim of adding value to the firm.
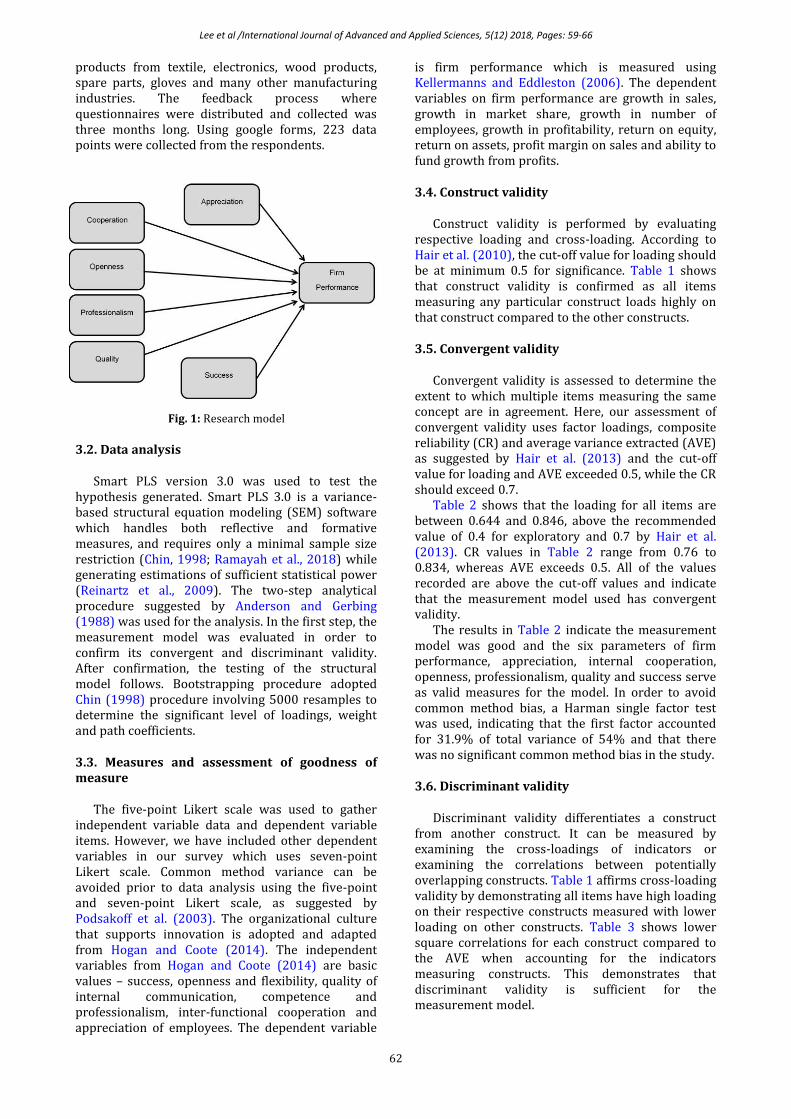
The research model is shown in Fig. 1 and the following hypotheses are developed for this study:
H1: Appreciation has a positive effect on Firm
Performance H2: Cooperation has a positive effect on Firm
Performance H3: Openness has a positive effect on Firm
Performance H4: Professionalism has a positive effect on Firm
Performance H5: Quality has a positive effect on Firm
Performance H6: Success has a positive effect on Firm
Performance
3. Results and discussion
This study analyses its subjects at the organizational level. The respondents of the study hold managerial positions in companies under the umbrella of the Federation of Malaysian Manufacturers (FMM). The FMM is the largest private sector economic organization in Malaysia and represents over 3000 manufacturing and industrial service companies.
3.1. Data collection
All respondents are from the Malaysian manufacturing industry involved in a variety of
Lee et al /International Journal of Advanced and Applied Sciences, 5(12) 2018, Pages: 59-66
62
products from textile, electronics, wood products, spare parts, gloves and many other manufacturing industries. The feedback process where questionnaires were distributed and collected was three months long. Using google forms, 223 data points were collected from the respondents.
Fig. 1: Research model
3.2. Data analysis
Smart PLS version 3.0 was used to test the hypothesis generated. Smart PLS 3.0 is a variance-based structural equation modeling (SEM) software which handles both reflective and formative measures, and requires only a minimal sample size restriction (Chin, 1998; Ramayah et al., 2018) while generating estimations of sufficient statistical power (Reinartz et al., 2009). The two-step analytical procedure suggested by Anderson and Gerbing (1988) was used for the analysis. In the first step, the measurement model was evaluated in order to confirm its convergent and discriminant validity. After confirmation, the testing of the structural model follows. Bootstrapping procedure adopted Chin (1998) procedure involving 5000 resamples to determine the significant level of loadings, weight and path coefficients.
3.3. Measures and assessment of goodness of measure
The five-point Likert scale was used to gather independent variable data and dependent variable items. However, we have included other dependent variables in our survey which uses seven-point Likert scale. Common method variance can be avoided prior to data analysis using the five-point and seven-point Likert scale, as suggested by Podsakoff et al. (2003). The organizational culture that supports innovation is adopted and adapted from Hogan and Coote (2014). The independent variables from Hogan and Coote (2014) are basic values – success, openness and flexibility, quality of internal communication, competence and professionalism, inter-functional cooperation and appreciation of employees. The dependent variable
is firm performance which is measured using Kellermanns and Eddleston (2006). The dependent variables on firm performance are growth in sales, growth in market share, growth in number of employees, growth in profitability, return on equity, return on assets, profit margin on sales and ability to fund growth from profits.
3.4. Construct validity
Construct validity is performed by evaluating respective loading and cross-loading. According to Hair et al. (2010), the cut-off value for loading should be at minimum 0.5 for significance. Table 1 shows that construct validity is confirmed as all items measuring any particular construct loads highly on that construct compared to the other constructs.
3.5. Convergent validity
Convergent validity is assessed to determine the extent to which multiple items measuring the same concept are in agreement. Here, our assessment of convergent validity uses factor loadings, composite reliability (CR) and average variance extracted (AVE) as suggested by Hair et al. (2013) and the cut-off value for loading and AVE exceeded 0.5, while the CR should exceed 0.7.
Table 2 shows that the loading for all items are between 0.644 and 0.846, above the recommended value of 0.4 for exploratory and 0.7 by Hair et al. (2013). CR values in Table 2 range from 0.76 to 0.834, whereas AVE exceeds 0.5. All of the values recorded are above the cut-off values and indicate that the measurement model used has convergent validity.
The results in Table 2 indicate the measurement model was good and the six parameters of firm performance, appreciation, internal cooperation, openness, professionalism, quality and success serve as valid measures for the model. In order to avoid common method bias, a Harman single factor test was used, indicating that the first factor accounted for 31.9% of total variance of 54% and that there was no significant common method bias in the study.
3.6. Discriminant validity
Discriminant validity differentiates a construct from another construct. It can be measured by examining the cross-loadings of indicators or examining the correlations between potentially overlapping constructs. Table 1 affirms cross-loading validity by demonstrating all items have high loading on their respective constructs measured with lower loading on other constructs. Table 3 shows lower square correlations for each construct compared to the AVE when accounting for the indicators measuring constructs. This demonstrates that discriminant validity is sufficient for the measurement model.

Lee et al /International Journal of Advanced and Applied Sciences, 5(12) 2018, Pages: 59-66
63
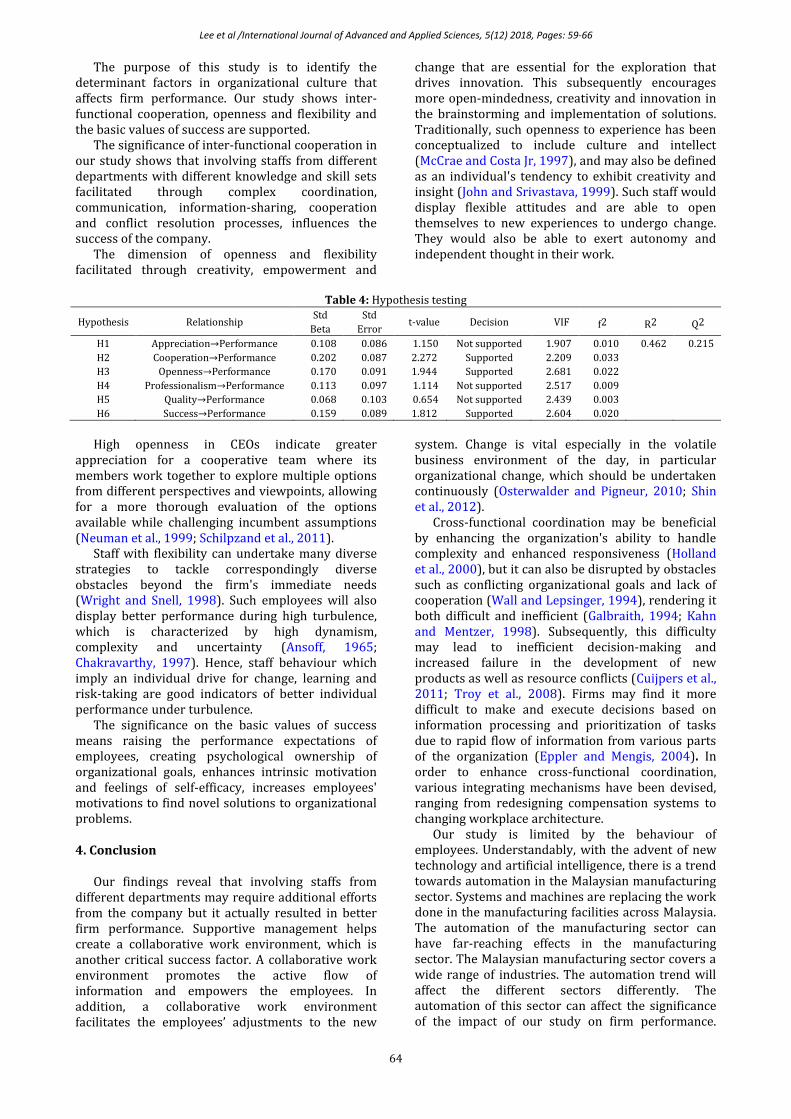
3.7. Hypothesis testing
Six hypotheses were tested using path analysis. The results are depicted in Table 4. An R2 value of 0.462 was obtained, indicating that 46.2% of the variance observed can be explained by the
parameters laid forth. The results in Table 4 indicate three (H2, H3 and H6) out of six hypotheses were significant with a p-value of < 0.05. Beta-values for the significant hypotheses are 0.20 (H2), 0.17 (H3) and 0.16 (H6) while H1, H4 and H5 were not supported.
Table 1: Construct validity
Performance Appreciation Cooperation Openness Professionalism Quality Success FP1 0.702 0.363 0.404 0.374 0.382 0.347 0.391 FP4 0.721 0.393 0.422 0.45 0.482 0.423 0.406 FP6 0.776 0.373 0.429 0.447 0.374 0.393 0.46 FP8 0.682 0.356 0.413 0.431 0.376 0.404 0.429 OA1 0.276 0.644 0.335 0.478 0.456 0.451 0.424 OA2 0.443 0.757 0.406 0.418 0.376 0.312 0.411 OA3 0.361 0.746 0.473 0.456 0.486 0.440 0.444 OT1 0.422 0.378 0.721 0.432 0.427 0.448 0.414 OT2 0.424 0.526 0.731 0.551 0.561 0.531 0.576 OT3 0.440 0.357 0.769 0.433 0.388 0.462 0.424 OO1 0.517 0.527 0.520 0.843 0.531 0.567 0.569 OO2 0.45 0.503 0.539 0.758 0.550 0.541 0.563 OO3 0.434 0.431 0.454 0.771 0.478 0.516 0.514 OP1 0.484 0.428 0.485 0.457 0.805 0.513 0.539 OP2 0.400 0.473 0.429 0.516 0.72 0.444 0.556 OP3 0.38 0.468 0.49 0.532 0.741 0.548 0.481 OQ1 0.511 0.405 0.598 0.585 0.548 0.846 0.497 OQ2 0.384 0.442 0.428 0.471 0.496 0.721 0.461 OQ3 0.280 0.375 0.392 0.471 0.43 0.661 0.515 OS1 0.499 0.384 0.465 0.487 0.565 0.538 0.812 OS2 0.397 0.439 0.438 0.497 0.42 0.449 0.706 OS3 0.404 0.511 0.528 0.581 0.562 0.443 0.714
Table 2: Convergent validity
Construct Item Loading CR AVE
Firm Performance
FP1 0.702 0.812 0.52 FP4 0.721 FP6 0.776 FP8 0.682
Appreciation of Employees OA1 0.644 0.760 0.514 OA2 0.757 OA3 0.746
Openness and Flexibility OO1 0.843 0.834 0.627 OO2 0.758 OO3 0.771
Competence and Professionalism OP1 0.805 0.800 0.572 OP2 0.720 OP3 0.741
Quality of Internal Communication OQ1 0.846 0.789 0.557 OQ2 0.721 OQ3 0.661
Basic Values - Success OS1 0.812 0.789 0.555 OS2 0.706 OS3 0.714
Inter-functional Cooperation OT1 0.721 0.785 0.549 OT2 0.731 OT3 0.769
Table 3: Discriminant validity
1 2 3 4 5 6 7 1. Performance 0.721 2. Appreciation 0.515 0.717
3. Internal Cooperation 0.579 0.566 0.741 4. Openness 0.592 0.616 0.637 0.792
5. Professionalism 0.561 0.598 0.618 0.656 0.756 6. Quality 0.545 0.539 0.648 0.684 0.661 0.747 7. Success 0.585 0.587 0.636 0.693 0.694 0.643 0.745
A blindfolding procedure was used to test predictive relevance (Q2) at an omission distance of 7 (Chin, 1998). Q2 was found to be 0.215, which indicates that the model has predictive relevance (Fornell, 1994; Hair et al. 2013). Cross-validated redundancy measures as displayed in Table 4 support the predictive relevance of the structural
model for this study. Furthermore, Table 4 indicates that the f2 for Organisational culture on openness, organisational culture on basic values of success and organisational culture on inter-functional cooperation have a small impact on firm performance.
Lee et al /International Journal of Advanced and Applied Sciences, 5(12) 2018, Pages: 59-66
64
The purpose of this study is to identify the determinant factors in organizational culture that affects firm performance. Our study shows inter-functional cooperation, openness and flexibility and the basic values of success are supported.
The significance of inter-functional cooperation in our study shows that involving staffs from different departments with different knowledge and skill sets facilitated through complex coordination, communication, information-sharing, cooperation and conflict resolution processes, influences the success of the company.
The dimension of openness and flexibility facilitated through creativity, empowerment and
change that are essential for the exploration that drives innovation. This subsequently encourages more open-mindedness, creativity and innovation in the brainstorming and implementation of solutions. Traditionally, such openness to experience has been conceptualized to include culture and intellect (McCrae and Costa Jr, 1997), and may also be defined as an individual's tendency to exhibit creativity and insight (John and Srivastava, 1999). Such staff would display flexible attitudes and are able to open themselves to new experiences to undergo change. They would also be able to exert autonomy and independent thought in their work.
Table 4: Hypothesis testing
Hypothesis Relationship Std
Beta
Std
Error t-value Decision VIF f2 R2 Q2
H1 Appreciation→Performance 0.108 0.086 1.150 Not supported 1.907 0.010 0.462 0.215
H2 Cooperation→Performance 0.202 0.087 2.272 Supported 2.209 0.033
H3 Openness→Performance 0.170 0.091 1.944 Supported 2.681 0.022
H4 Professionalism→Performance 0.113 0.097 1.114 Not supported 2.517 0.009
H5 Quality→Performance 0.068 0.103 0.654 Not supported 2.439 0.003
H6 Success→Performance 0.159 0.089 1.812 Supported 2.604 0.020
High openness in CEOs indicate greater
appreciation for a cooperative team where its members work together to explore multiple options from different perspectives and viewpoints, allowing for a more thorough evaluation of the options available while challenging incumbent assumptions (Neuman et al., 1999; Schilpzand et al., 2011).
Staff with flexibility can undertake many diverse strategies to tackle correspondingly diverse obstacles beyond the firm's immediate needs (Wright and Snell, 1998). Such employees will also display better performance during high turbulence, which is characterized by high dynamism, complexity and uncertainty (Ansoff, 1965; Chakravarthy, 1997). Hence, staff behaviour which imply an individual drive for change, learning and risk-taking are good indicators of better individual performance under turbulence.
The significance on the basic values of success means raising the performance expectations of employees, creating psychological ownership of organizational goals, enhances intrinsic motivation and feelings of self-efficacy, increases employees' motivations to find novel solutions to organizational problems.
4. Conclusion
Our findings reveal that involving staffs from different departments may require additional efforts from the company but it actually resulted in better firm performance. Supportive management helps create a collaborative work environment, which is another critical success factor. A collaborative work environment promotes the active flow of information and empowers the employees. In addition, a collaborative work environment facilitates the employees’ adjustments to the new
system. Change is vital especially in the volatile business environment of the day, in particular organizational change, which should be undertaken continuously (Osterwalder and Pigneur, 2010; Shin et al., 2012).
Cross-functional coordination may be beneficial by enhancing the organization's ability to handle complexity and enhanced responsiveness (Holland et al., 2000), but it can also be disrupted by obstacles such as conflicting organizational goals and lack of cooperation (Wall and Lepsinger, 1994), rendering it both difficult and inefficient (Galbraith, 1994; Kahn and Mentzer, 1998). Subsequently, this difficulty may lead to inefficient decision-making and increased failure in the development of new products as well as resource conflicts (Cuijpers et al., 2011; Troy et al., 2008). Firms may find it more difficult to make and execute decisions based on information processing and prioritization of tasks due to rapid flow of information from various parts of the organization (Eppler and Mengis, 2004). In order to enhance cross-functional coordination, various integrating mechanisms have been devised, ranging from redesigning compensation systems to changing workplace architecture.
Our study is limited by the behaviour of employees. Understandably, with the advent of new technology and artificial intelligence, there is a trend towards automation in the Malaysian manufacturing sector. Systems and machines are replacing the work done in the manufacturing facilities across Malaysia. The automation of the manufacturing sector can have far-reaching effects in the manufacturing sector. The Malaysian manufacturing sector covers a wide range of industries. The automation trend will affect the different sectors differently. The automation of this sector can affect the significance of the impact of our study on firm performance.
Lee et al /International Journal of Advanced and Applied Sciences, 5(12) 2018, Pages: 59-66
65
Information technology strengthens the effectiveness of critical success factors (Carr, 2003; Abdolvand et al., 2008). Successful BPR results in efficient business processes and can be ensured by reducing the time and cost of the processes (Hammer and Champy, 1993).
References
Abdolvand N, Albadvi A, and Ferdowsi Z (2008). Assessing readiness for business process reengineering. Business Process Management Journal, 14(4): 497-511.
Anderson JC and Gerbing DW (1988). Structural equation modeling in practice: A review and recommended two-step approach. Psychological Bulletin, 103(3): 411-423.
Ansoff HI (1965). Corporate strategy: An analytic approach to business policy for growth and expansion. McGraw‐Hill, New York, USA.
Blackwell SS (2006). The influence of perceptions of organizational structure and culture on leadership role requirements: The moderating impact of locus of control and self-monitoring. Journal of Leadership and Organizational Studies, 12(4): 27-49.
Carr NG (2003). IT doesn't matter. Educause Review, 38: 24-38.
Chakravarthy B (1997). A new strategy framework for coping with turbulence. MIT Sloan Management Review, 38(2): 69-82.
Chang ES and Lin CS (2007). Exploring organizational culture for information security management. Industrial Management and Data Systems, 107(3): 438-458.
Chin WW (1998). The partial least squares approach to structural equation modeling. Modern Methods for Business Research, 295(2): 295-336.
Cuijpers M, Guenter H, and Hussinger K (2011). Costs and benefits of inter-departmental innovation collaboration. Research Policy, 40(4): 565-575.
Deal TE and Kennedy AA (1982). Corporate cultures: The rites and rituals of organizational life. Addison-Wesley, Reading, USA.
Denison DR and Mishra AK (1995). Toward a theory of organizational culture and effectiveness. Organization Science, 6(2): 204-223.
Deshpande R and Webster Jr FE (1989). Organizational culture and marketing: defining the research agenda. The Journal of Marketing, 53(2): 3-15.
Deshpande R, Farley JU, and Webster Jr FE (1993). Corporate culture, customer orientation, and innovativeness in Japanese firms: A quadrad analysis. The Journal of Marketing, 57(1): 23-37.
Eppler MJ and Mengis J (2004). The concept of information overload: A review of literature from organization science, accounting, marketing, MIS, and related disciplines. The Information Society, 20(5): 325-344.
Fornell C (1994). Partial least squares. In: Bagozzi RP (Ed.), Advanced methods of marketing research. Blackwell Business, Oxford, UK.
Furnham A and Gunter B (1993). Corporate culture: Definition, diagnosis and change. International Review of Organizational Psychology, 8: 233-61.
Galbraith JR (1994). Competing with flexible lateral organizations. Addison-Wesley, Reading, USA.
Gopalakrishnan S and Damanpour F (1997). A review of innovation research in economics, sociology and technology management. Omega, 25(1): 15-28.
Hair JF, Black WC, Babin BJ, and Anderson RE (2010). Advanced diagnostics for multiple regression: A supplement to
multivariate data analysis. Prentice-Hall, Upper Saddle River, New Jersey, USA.
Hair JF, Hult GTM, Ringle CM, and Sarstedt M (2013). A Primer on partial least squares structural equation modeling (PLS-SEM). Sage, Los Angeles, USA.
Hammer M and Champy J (1993). Reengineering the corporation. Harper, New York, USA.
Hofman RH, Hofman WA, and Guldemond H (2002). School governance, culture, and student achievement. International Journal of Leadership in Education, 5(3): 249-272.
Hogan SJ and Coote LV (2014). Organizational culture, innovation, and performance: A test of Schein's model. Journal of Business Research, 67(8): 1609-1621.
Holland S, Gaston K, and Gomes J (2000). Critical success factors for cross‐functional teamwork in new product development. International Journal of Management Reviews, 2(3): 231-259.
Hughes M and Morgan RE (2007). Deconstructing the relationship between entrepreneurial orientation and business performance at the embryonic stage of firm growth. Industrial Marketing Management, 36(5): 651-661.
John OP and Srivastava S (1999). The big five trait taxonomy: History, measurement, and theoretical perspectives. Handbook of Personality: Theory and Research, 2(1999): 102-138.
Kahn KB and Mentzer JT (1998). Marketing’s integration with other departments. Journal of Business Research, 42(1): 53-62.
Kellermanns FW and Eddleston KA (2006). Corporate entrepreneurship in family firms: A family perspective. Entrepreneurship Theory and Practice, 30(6): 809-830.
Lund DB (2003). Organizational culture and job satisfaction. Journal of Business and Industrial Marketing, 18(3): 219-236.
Lundy O and Cowling A (1996). Strategic human resource management. Routledge, London, UK.
Martins EC and Terblanche F (2003). Building organisational culture that stimulates creativity and innovation. European Journal of Innovation Management, 6(1): 64-74.
McCrae RR and Costa Jr PT (1997). Personality trait structure as a human universal. American Psychologist, 52(5): 509-516.
Morone J (1989). Strategic use of technology. California Management Review, 31(4): 91-110.
Neuman GA, Wagner SH, and Christiansen ND (1999). The relationship between work-team personality composition and the job performance of teams. Group and Organization Management, 24(1): 28-45.
O'Reilly C (1989). Corporations, culture, and commitment: Motivation and social control in organizations. California Management Review, 31(4): 9-25.
Osterwalder A and Pigneur Y (2010). Business model generation: A handbook for visionaries, game changers, and challengers. John Wiley and Sons, Hoboken, New Jersey, USA.
Podsakoff PM, MacKenzie SB, Lee JY, and Podsakoff NP (2003). Common method biases in behavioral research: A critical review of the literature and recommended remedies. Journal of Applied Psychology, 88(5): 879-903.
Porter ME (1985). Competitive advantage: Creating and sustaining superior performance. FreePress, New York, USA.
Quinn RE and Spreitzer GM (1991). The psychometrics of the competing values culture instrument and an analysis of the impact of organizational culture on quality of life. Research in Organizational Change and Development, 5: 115–142.
Ramayah T, Cheah J, Chuah F, Ting H, and Memon MA (2018). Partial least squares structural equation modeling (PLS-SEM) using SmartPLS 3.0: An updated guide and practical guide to

Lee et al /International Journal of Advanced and Applied Sciences, 5(12) 2018, Pages: 59-66
66
statistical analysis. 2nd Edition, Pearson, Kuala Lumpur, Malaysia.
Rashid AZ, Sambasivan M, and Johari J (2003). The influence of corporate culture and organisational commitment on performance. Journal of Management Development, 22(8): 708-728.
Reinartz W, Haenlein M, and Henseler J (2009). An empirical comparison of the efficacy of covariance-based and variance-based SEM. International Journal of research in Marketing, 26(4): 332-344.
Schein E (1992). Organisational culture and leadership. Jossey Bass Publishers, San Francisco, USA.
Schein EH (2009). The corporate culture survival guide. Vol. 158, John Wiley and Sons, Hoboken, New Jersey, USA.
Schilpzand MC, Herold DM, and Shalley CE (2011). Members’ openness to experience and teams’ creative performance. Small Group Research, 42(1): 55-76.
Shin J, Taylor MS, and Seo MG (2012). Resources for change: The relationships of organizational inducements and psychological resilience to employees' attitudes and behaviors toward organizational change. Academy of Management Journal, 55(3): 727-748.
Stacey GS and Ashton WB (1990). A structured approach to corporate technology strategy. International Journal of Technology Management, 5(4): 389-407.
Tellis GJ, Prabhu JC, and Chandy RK (2009). Radical innovation across nations: The preeminence of corporate culture. Journal of Marketing, 73(1): 3-23.
Troy LC, Hirunyawipada T, and Paswan AK (2008). Cross-functional integration and new product success: an empirical investigation of the findings. Journal of Marketing, 72(6): 132-146.
Wall S and Lepsinger R (1994). Cross-functional obstacles. Training, 5(2): 125-126.
Wallach EJ (1993). Individuals and organizations: the cultural match. Training and Development Journal, 37: 28‐36.
Wright PM and Snell SA (1998). Toward a unifying framework for exploring fit and flexibility in strategic human resource management. Academy of Management Review, 23(4): 756-772.
Zhu C, Valcke M, and Schellens T (2009). A cross-cultural study of online collaborative learning. Multicultural Education and Technology Journal, 3(1): 33-46.
Copyright © 2022 FDOKUMEN