Impact of Organizational Culture Values on ... - MDPI
23
sustainability Article Impact of Organizational Culture Values on Organizational Agility Carmen M. Felipe *, José L. Roldán* ID and Antonio L. Leal-Rodríguez Department of Business Administration and Marketing, Universidad de Sevilla, Seville 41018, Spain; [email protected] * Correspondence: [email protected] (C.M.F.); [email protected] (J.L.R.) Received: 20 October 2017; Accepted: 13 December 2017; Published: 17 December 2017 Abstract: To remain competitive within the current, uncertain business scenario, it is vital for firms to develop capabilities that lead them to adapt and offer quick responses to market changes. Under the dynamic capabilities view of the firm, this paper proposes a model that presents an exhaustive analysis of two relevant research gaps: (i) the underlying relationships that determine the impact exerted by each of the four organizational culture typologies, comprised in Cameron and Quinn’s Competing Values Framework on organizational agility and, (ii) the contingency effect exerted by a key environmental factor, the industry’s technology intensity. An empirical study is performed to test the relationships proposed, using data collected from 172 Spain-based companies. To examine the contingency effect of technology intensity, the sample is divided into two subsamples, high and medium tech companies. This work uses partial least squares path-modeling, a variance-based structural equations modeling technique, in order to test and validate the research model and hypotheses posited. In addition, thorough analyses are carried out to assess the predictive performance of our model. Keywords: organizational culture; organizational agility; competing values framework; technology intensity; partial least squares 1. Introduction Nowadays, firms must face extremely turbulent environments whose main characteristics are high levels of uncertainty, complexity and dynamism. If firms aim to survive in such volatile environments, they must develop capabilities to detect environmental changes early and to offer accurate responses to them, gaining new business opportunities and competitive advantages to exploit. In this context, the concept of organizational agility (OA) appears as one of the key issues that are attracting the attention of researchers and practitioners [1]. OA has been defined as an organization’s capability to sense environmental changes and to respond efficiently and effectively to them [2]. Assuming the dynamic capabilities view (DCV) as the theoretical framework [3], OA is a critical dynamic capability that influences firms’ competitive actions and therefore it becomes a significant antecedent of their performance [4]. In this vein, this paper approaches OA as a dynamic capability that organizations can deliberately use to reach and sustain competitive advantages [5] and to survive crises and changing environments [6]. Following Vinodh [7] in the current business scenario, OA needs to be coupled with sustainability. OA is a paradigm that enables firms to survive within the current hypercompetitive and dynamic business environment. Simultaneously, companies are nowadays incrementally required to become more respectful towards the environment. Concretely, fostering sustainability implies seeking the minimization of the firm’s environmental impact. Thus, numerous firms have turned to the design and development of eco-friendly products and services and the deployment of more eco-efficient Sustainability 2017, 9, 2354; doi:10.3390/su9122354 www.mdpi.com/journal/sustainability
-
Upload
khangminh22 -
Category
Documents
-
view
1 -
download
0
Transcript of Impact of Organizational Culture Values on ... - MDPI
sustainability
Article
Impact of Organizational Culture Values onOrganizational Agility
Carmen M. Felipe *, José L. Roldán * ID and Antonio L. Leal-Rodríguez
Department of Business Administration and Marketing, Universidad de Sevilla, Seville 41018, Spain;[email protected]* Correspondence: [email protected] (C.M.F.); [email protected] (J.L.R.)
Received: 20 October 2017; Accepted: 13 December 2017; Published: 17 December 2017
Abstract: To remain competitive within the current, uncertain business scenario, it is vital forfirms to develop capabilities that lead them to adapt and offer quick responses to market changes.Under the dynamic capabilities view of the firm, this paper proposes a model that presents anexhaustive analysis of two relevant research gaps: (i) the underlying relationships that determinethe impact exerted by each of the four organizational culture typologies, comprised in Cameronand Quinn’s Competing Values Framework on organizational agility and, (ii) the contingencyeffect exerted by a key environmental factor, the industry’s technology intensity. An empiricalstudy is performed to test the relationships proposed, using data collected from 172 Spain-basedcompanies. To examine the contingency effect of technology intensity, the sample is divided into twosubsamples, high and medium tech companies. This work uses partial least squares path-modeling,a variance-based structural equations modeling technique, in order to test and validate the researchmodel and hypotheses posited. In addition, thorough analyses are carried out to assess the predictiveperformance of our model.
Keywords: organizational culture; organizational agility; competing values framework; technologyintensity; partial least squares
1. Introduction
Nowadays, firms must face extremely turbulent environments whose main characteristics are highlevels of uncertainty, complexity and dynamism. If firms aim to survive in such volatile environments,they must develop capabilities to detect environmental changes early and to offer accurate responsesto them, gaining new business opportunities and competitive advantages to exploit. In this context,the concept of organizational agility (OA) appears as one of the key issues that are attracting theattention of researchers and practitioners [1].
OA has been defined as an organization’s capability to sense environmental changes and torespond efficiently and effectively to them [2]. Assuming the dynamic capabilities view (DCV) asthe theoretical framework [3], OA is a critical dynamic capability that influences firms’ competitiveactions and therefore it becomes a significant antecedent of their performance [4]. In this vein, thispaper approaches OA as a dynamic capability that organizations can deliberately use to reach andsustain competitive advantages [5] and to survive crises and changing environments [6].
Following Vinodh [7] in the current business scenario, OA needs to be coupled with sustainability.OA is a paradigm that enables firms to survive within the current hypercompetitive and dynamicbusiness environment. Simultaneously, companies are nowadays incrementally required to becomemore respectful towards the environment. Concretely, fostering sustainability implies seeking theminimization of the firm’s environmental impact. Thus, numerous firms have turned to the designand development of eco-friendly products and services and the deployment of more eco-efficient
Sustainability 2017, 9, 2354; doi:10.3390/su9122354 www.mdpi.com/journal/sustainability
Sustainability 2017, 9, 2354 2 of 23
processes [8]. Therefore, sustainability also stands out as a central concept for organizational survival.This implies that in the current scenario, OA and sustainability are both considered as performanceindicators for modern firms [7]. Moreover, several studies have recently posited that OA exertsa positive impact on corporate sustainability [9,10].
OA has been approached from a wide variety of academic disciplines since the mid-1990s,the information systems (IS) field being the one that has been most developed. This field has mainlyaddressed the influence of IS and their related capabilities (ISC) in the achievement of high levels ofOA in firms [4,11].
The focus on the technological aspects that may affect the OA level in an organization has led tosome relevant organizational and contextual factors [12] and their influence on OA being forgotten.This fact has been identified as an important research gap: technology is only one piece of a complexpuzzle, where other relevant aspects might play an important role in developing the mechanismsthat allow firms to become agile through a more inclusive social-technical approach [13]. One of themost commonly ignored variables that may affect OA is organizational culture (OC) [2]. The previousliterature has developed few attempts to study the effects of OC on OA, people and organizations’characteristics are understudied dimensions if they are compared with technological and operationalfactors [12].
The purpose of this paper is hence to go deeper into the study of the antecedents of OA byapproaching another relevant gap, the influence that might be exerted by diverse cultural values inachieving a higher level of OA. Following Cameron and Quinn’s [14] four major cultural typologies(Hierarchy, Market, Clan and Adhocracy Cultures), this paper builds up a model that posits thesefour cultural values as drivers of a firms’ OA levels. This theoretical model will not only serve forexplanatory purposes but will also be a predictive model. This fact is a significant novelty in theOA literature.
Moreover, researchers tend to focus on internal organizational mechanisms to improve OA, whilethey ignore the external aspects of organizations [15]. The impact of cultural values and principles inthe OA level is influenced by a complex set of factors that includes not only internal but environmentalfactors [11]. This paper proposes that the impact of the different types of OC values on OA maybe moderated by one of these environmental variables, the technology intensity of the industry.This factor has traditionally been considered as one of the primary contingent variables in terms oforganizational conditions [16]. Technology intensity at industry level can moderate the impact thatOC values have on different organizational attributes that are linked to OA, such as adaptability tochange, knowledge-based work and decentralization of authority, among others.
This work means to answer the following research questions:RQ1: Could the presence of certain OC values become an antecedent of OA?RQ2: Are the aforementioned relationships contingent on the technology intensity level of
the industry?RQ3: Are the four OC values able to generate accurate predictions of OA?This paper carries out an empirical study to test the research hypotheses and the predictive
performance of the research model. Sectors classified as innovative are the population selected for thisstudy, as these industries can be considered as the most suitable, due to their hypercompetitive marketsthat require a flexible and quick response from organizations. This selection represents a populationof 2360 firms. An off-line survey is the data collection instrument, the outcome being 172 usablesurveys (a 7.3% response rate). The sample is split into two different groups (the high-tech and themedium-tech companies) to assess the contingency effect of the technology intensity of the industry.
The study proceeds as follows. The next section presents the theoretical background together withthe research model and hypotheses. The third section gives a description of the research methodology.The fourth section presents the results of the different data analyses carried out. Finally, the fifthsection brings together the discussion and implications.

Sustainability 2017, 9, 2354 3 of 23
This paper will bring new contributions to prior literature, as the results will shed light on thequestion of how firms can gain agility. As this remains unclear, new insights and lines of research arebrought to the academic community as well as important implications for practitioners and executives,enabling a more effective management of companies’ resources and capabilities, in order to preparethem to survive and succeed in such hypercompetitive environments.
2. Literature Review and Research Hypotheses
2.1. The Competing Values Framework
This paper uses OC taxonomies following the Competing Values Framework (CVF) theorizedby Cameron and Quinn [14]. The ‘competing values framework’ is among the most recognized andwidely applied frameworks within organizational culture research. The search for this term leads to1,900,000 results in Google Scholar. This same search yields a total of 1630 document results withinthe Scopus database. Hence, CVF has served as a guideline and source of theoretical inspiration andmanagerial insights for many scholars and practitioners [17].
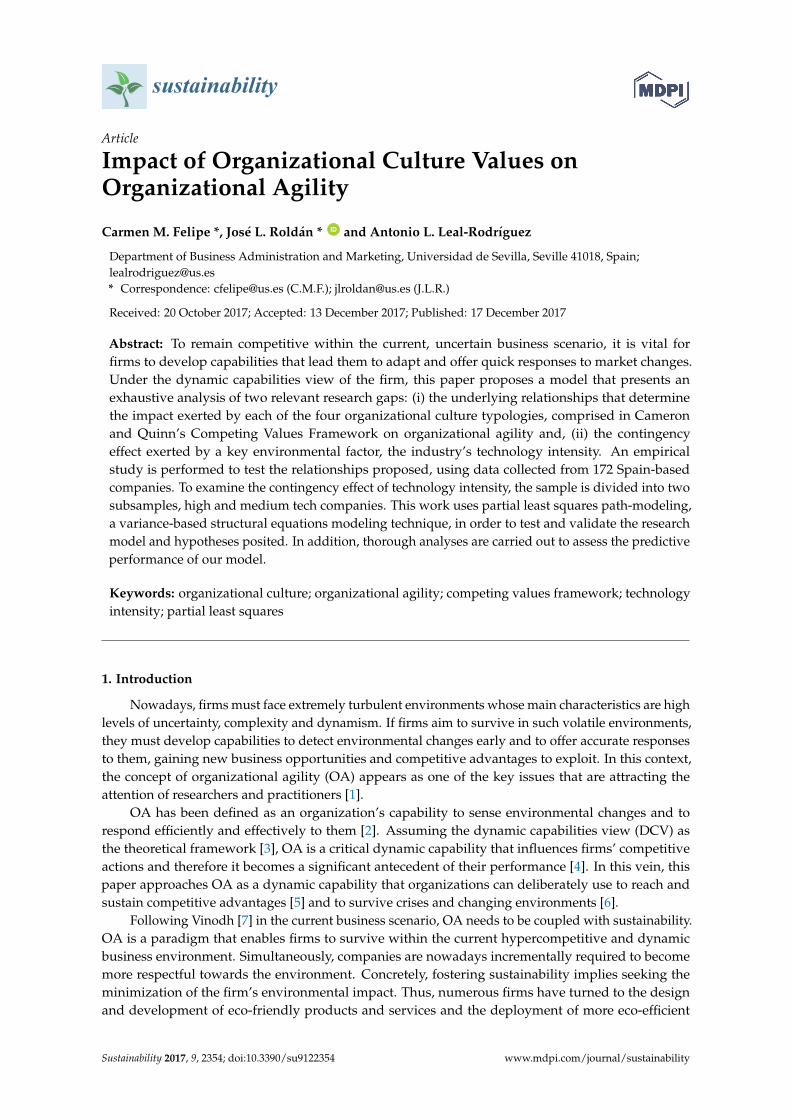
The CVF model comprises two dimensions. One dimension opposes an emphasis on flexibility,adaptability and dynamism to an emphasis on stability, order and control, while the second dimensionconfronts an internal orientation with a focus on integration, collaboration and unity, with an externalorientation with a focus on differentiation, competition and rivalry. These dimensions, combinedjointly against each other, lead to the identification of four distinctive culture types (i.e., clan culture,market culture, adhocracy culture and hierarchy culture) that involve particular and idiosyncraticcharacteristics. A brief conceptual delimitation of the four cultural archetypes is given below (Figure 1).
Sustainability 2017, 9, 2354 3 of 22
brought to the academic community as well as important implications for practitioners and
executives, enabling a more effective management of companies’ resources and capabilities, in order
to prepare them to survive and succeed in such hypercompetitive environments.
2. Literature Review and Research Hypotheses
2.1. The Competing Values Framework
This paper uses OC taxonomies following the Competing Values Framework (CVF) theorized
by Cameron and Quinn [14]. The ‘competing values framework’ is among the most recognized and
widely applied frameworks within organizational culture research. The search for this term leads to
1,900,000 results in Google Scholar. This same search yields a total of 1630 document results within
the Scopus database. Hence, CVF has served as a guideline and source of theoretical inspiration and
managerial insights for many scholars and practitioners [17].
The CVF model comprises two dimensions. One dimension opposes an emphasis on flexibility,
adaptability and dynamism to an emphasis on stability, order and control, while the second
dimension confronts an internal orientation with a focus on integration, collaboration and unity, with
an external orientation with a focus on differentiation, competition and rivalry. These dimensions,
combined jointly against each other, lead to the identification of four distinctive culture types (i.e.,
clan culture, market culture, adhocracy culture and hierarchy culture) that involve particular and
idiosyncratic characteristics. A brief conceptual delimitation of the four cultural archetypes is given
below (Figure 1).
Figure 1. The Competing Values Framework.
Clan culture is often categorized with the following features: family-oriented, trustworthiness,
closeness, empowerment and community [14]. This culture type is primarily oriented to its human
capital, emphasizes individuals’ level of wellbeing and fosters a positive working atmosphere over
optimizing financial ratios and market goals [18]. Clan organizations combine a lower concern for
structure and control and a greater focus on flexibility. Hence, instead of strict rules and procedures,
the firm’s members are driven through vision, shared goals, outputs and outcomes.
Market culture is recognized as being clearly concerned with a goal (or objective)
accomplishment culture type. Hence, the predominant corporate values inherent to this culture are
productivity, effectiveness, competitiveness and results optimization. These organizations normally
stress gaining prestige, status and profitability and their main purpose is to end in transactions (i.e.,
exchanges, sales, contracts), with other parties, in the hope of achieving competitive advantages [19].
In market organizations, both internal and external transactions (exchanges of value) are viewed in
market terms. In effective market organizations, value flows between their different members and
stakeholders, with minimal cost and delay.
Adhocracy culture is regularly labelled as original, dynamic, entrepreneurial, innovative, risk-
taking, prepared for changes, aggressive and flexible [20]. Firms possessing this culture type often
Clan
Culture
Adhocracy
Culture
Hierarchy
Culture
Market
Culture
Internal
Focus
External
Focus
Flexibility and discretion
Stability and control
Figure 1. The Competing Values Framework.
Clan culture is often categorized with the following features: family-oriented, trustworthiness,closeness, empowerment and community [14]. This culture type is primarily oriented to its humancapital, emphasizes individuals’ level of wellbeing and fosters a positive working atmosphere overoptimizing financial ratios and market goals [18]. Clan organizations combine a lower concern forstructure and control and a greater focus on flexibility. Hence, instead of strict rules and procedures,the firm’s members are driven through vision, shared goals, outputs and outcomes.
Market culture is recognized as being clearly concerned with a goal (or objective) accomplishmentculture type. Hence, the predominant corporate values inherent to this culture are productivity,effectiveness, competitiveness and results optimization. These organizations normally stress gainingprestige, status and profitability and their main purpose is to end in transactions (i.e., exchanges,sales, contracts), with other parties, in the hope of achieving competitive advantages [19]. In marketorganizations, both internal and external transactions (exchanges of value) are viewed in market terms.In effective market organizations, value flows between their different members and stakeholders, withminimal cost and delay.
Sustainability 2017, 9, 2354 4 of 23
Adhocracy culture is regularly labelled as original, dynamic, entrepreneurial, innovative,risk-taking, prepared for changes, aggressive and flexible [20]. Firms possessing this culture type oftenpursue success while focusing on innovation development, sustained in the development of innovativeproducts, services and processes. Therefore, this is the most innovation-oriented culture, whose maintarget deals with fostering adaptability, flexibility and creativity, in order to face uncertainty, ambiguityand information overload [21].
Finally, Hierarchy culture is normally described as extremely bureaucratic, rule-driven,by-the-book and top-down directed [22]. This archetype traditionally embraces an approach thathighlights structure and control that emanates from a strict chain of command, as in Max Weber’soriginal theory of bureaucracy. This culture stresses the minimization of ambiguity levels and thepromotion of an intense sense of security, certainty, predictability, effectiveness, stability, formalizationand standardization. This culture type endorses a long-lasting concern for order and controlmechanisms, embodied in an explicit and very precise range of norms, rules, instructions andprocedures. In summation, this culture is mainly focused on efficiency and internal control.
2.2. Organizational Agility
The notion of organizational agility (OA), as proposed by Sherehiy et al. [23], is rooted intwo previously developed, related concepts (i.e., organizational adaptability, a reactive facet andorganizational flexibility, a proactive facet). Concretely, OA encompasses companies’ capabilityof sensing environmental changes and responding readily to them, by reconfiguring their set ofresources, business processes and strategies [24]. In addition, Sambamurthy et al. [4] postulate thatthree interrelated dimensions shape OA: (i) customer agility, which involves leveraging customers’opinions to gain enhanced market intelligence; (ii) partnering agility, which comprises absorbingknowledge from the distinct business partners to enhance the firm’s response to market requests; and,(iii) operational agility, which entails quick process redesign to exploit dynamic environmental andmarket conditions [25]. Consequently, following the inclusive approach proposed by previous works,such as that by Charbonnier-Voirin [26], this paper conceptualizes OA as the organization’s deliberateresponse capability, aimed at enabling more efficient behavior, within highly turbulent and complexenvironments. This behavior not only involves reacting rapidly to change but also the firm’s capabilityto anticipate and seize opportunities, especially through innovation and learning.
2.3. Linking OC Typologies to OA
In the words of Cameron and Quinn [14] (p. 1) “No organization in the twenty-first century wouldboast about its constancy, sameness or status quo compared to ten years ago. [ . . . ] The frighteninguncertainty that traditionally accompanied major organizational change has been superseded by thefrightening uncertainty now associated with staying the same.” These authors point out in their seminalwork ‘Diagnosing and changing organizational culture based on the competing values framework,’that most organizations frequently fail in their attempt to manage change effectively, due to theirinability to implement cultural change accurately. The CVF has been effectively applied to distinct keyaspects of organizational performance (i.e., total quality management, human resource managementroles and cultural change, among others) [14]. Hence, the application of the CVF might also stand asa powerful tool to analyze the influence of OC on OA.
The linkages between OC and diverse forms of OA have been suggested, to a certain extent butuntil now there has been a scarcity of empirical works aimed at providing explanatory or predictiveevidence for these relationships [12]. This paper posits that the four OC typologies shaping the CVFinvolve idiosyncratic features and particularities that might exert different effects on OA. Moreover,it is intended to explore which cultures actually exert a stronger influence on the endogenous construct.
Organizations’ awareness and struggle toward the development and wellbeing of their humancapital, distinctive of clan culture, may be a good predictor of OA, since it may contribute tostrengthening collaboration ties and the dissemination of knowledge [27]. Precisely, a key feature
Sustainability 2017, 9, 2354 5 of 23
of agile companies is their ability to continuously manage the creation, adaptation, distribution andapplication of knowledge, throughout the organization [6], clan culture being a relevant breedingground for these activities. Furthermore, clan culture is characterized by flat hierarchies based onautonomous individuals and teams, with leaders acting as facilitators, mentors and supporters [28],which may also enhance the OA level. However, its clear emphasis on individual issues might alsohinder the implementation of new IS developments, which entail a certain degree of formalizationand standardized procedures [29]. Nevertheless, the flexible organizational structure that supportsthe clan culture, in conjunction with open communication and employee commitment can overcomethis limitation. A positive relationship between the clan culture and the OA level in an organization istherefore hypothesized (Figure 2):
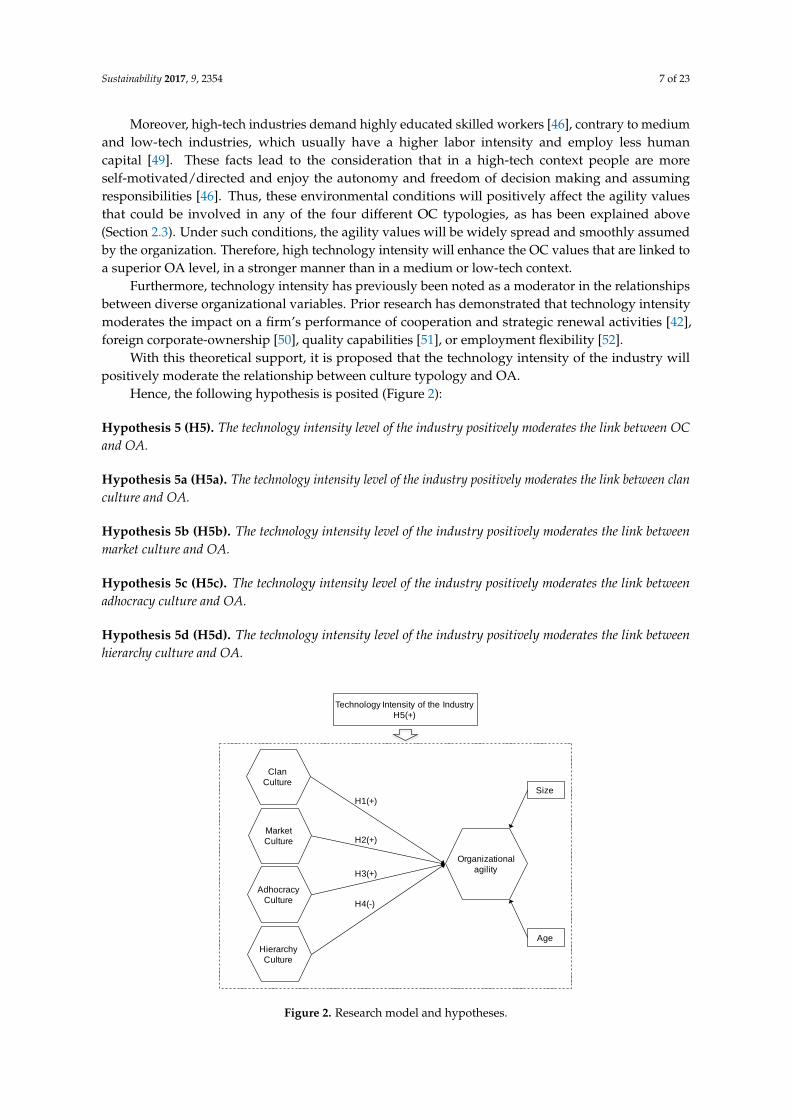
Hypothesis 1 (H1). Clan culture is positively related to OA.
Market culture may lead to positive outcomes for OA. Its external focus and commitmenttoward predicting, understanding and reacting to market needs, trends and competitive changesmay enable access to an extensive set of valuable external knowledge. Moreover, the market culturewould maximize what Worley and Lawyer [30] call the “surface area,” typical of agile organizations:the external orientation encourages the continuous contact of employees with regulators, suppliers,customers and any other key stakeholders. This fact will provide the firm with valuable informationfor the decision making and will prepare it for properly sensing and responding to unexpectedenvironmental changes [30]. Besides, market culture decisively supports the managerial processes ofstrategic planning, directing and objective setting. Such a clear emphasis on uncertainty reductionmight also enable OA. This is in line with previous works that argue that elements, such as strictdeadlines and team effectiveness, reflect values inherent to market culture [31]. Moreover, OA oftenbenefits from a business context that stresses values linked to productivity and goals attainment. Thus,it is hypothesized that market culture will positively influence on OA (Figure 2):
Hypothesis 2 (H2). Market culture is positively related to OA.
Due to its values, the adhocracy culture represents the most suitable cultural type to leadan organization in its way to becoming agile. Agile organizations work on potential alternative futuresand they must be able to design and implement innovative responses to those foreseen scenarios,in a timely manner and with ease [32]. Therefore, given the tremendously uncertain, changing andcomplex business context where firms compete nowadays, an adhocratic culture that proactivelyemphasizes change, adaptability and innovativeness may be an effective driver of OA. In this line,Iivari and Iivari [31] (p. 513) argue that “enterprise agility is usually associated with adaptability andflexibility, i.e., an organizations’ ability to adjust in response to changes in the environment, implyingexternal focus and change.” Indeed, change is the foundation of OA, which is defined as the capabilitythat enables the firm to continuously reconfigure its resources to create responses to emerging futures,in the form of new products, services or business models [33]. Thus, as adhocracy cultures understandchange as a positive phenomenon and a real source of opportunities, it is hypothesized that this culturetype is positively related to OA (Figure 2):
Hypothesis 3 (H3). Adhocracy culture is positively related to OA.
Finally, hierarchy culture, in short, is viewed as a culture type that is primarily focused onefficiency and internal control. Likewise, this culture is internally focused and consequently, stressespreserving a stagnant and rigid hierarchical structure over seeking market opportunities. Moreover,an evident and unambiguous outcome of this culture is the methodical gathering and dissemination ofextremely accurate, highly detailed, punctual, quantified, reliable and objective data [34]. The hierarchyculture hinders knowledge management, as it is strongly formalized and dependent on operating
Sustainability 2017, 9, 2354 6 of 23
procedures, rules and regulations, as standard guides for decision making [35]. This excess ofstandardization in the hierarchy culture may lead to efficiency but it is just the opposite to the ideaof agility. Managers used to working in a perfect bureaucratic system will find it difficult to adapt toa challenging market competition that demands continuous reconfiguration to meet environmentalrequirements [12]. In brief, this typology appears to be quite the opposite to what an agile organizationshould be, to sense and respond to continuous environmental changes. Hence, it is hypothesized thatthe hierarchy culture leads to lower levels of OA in organizations (Figure 2):
Hypothesis 4 (H4). Hierarchy culture is negatively related to OA.
2.4. The Contingent Effect of the Technology Intensity of the Industry
From the Dynamic Capabilities View (DCV) approach, OA has been identified as a dynamiccapability by researchers [4,36]. The DCV is an extension of the Barney’s [37] and Peteraf’s [38]resource-based view (RBV) of the firm, in response to highly dynamic environments. A dynamiccapability can be defined as the firm’s ability to integrate, build and reconfigure internal and externalcompetences, to address rapidly changing environments [3].
A traditional RBV approach tends to focus on the internal mechanism of organizations butdynamic capabilities are influenced by external environmental factors [15]. In this vein, the greaterthe uncertainty and the dynamism in the business environment, the more critical strong dynamiccapabilities become for the firm’s growth [39]. Therefore, the effectiveness of dynamic capabilities incompanies is context dependent, although limited information is available on the joint effect of theinternal and external mechanisms of organizations [15].
This paper has considered OC to be an antecedent of OA but the acceptance of agile values andprinciples can also be strongly influenced by environmental factors [11]. Considering technologyintensity as one of the most relevant contingent variables in terms of organizational conditions [16],it is proposed as one of these external variables that may moderate the effects between OC in the firmand the OA level.
Technology intensity at industrial level refers to cross-sectional differences in the innovationpotential of industries, which are derived from investments in knowledge and creative activities andits use in new applications [40]. In practice, this means that intensive technology industries investa relatively high proportion of output in internal R&D [41]. Prior literature [42–44] operationalizesthe environmental technological intensity following the OECD’s technology-based classification ofindustries [45]. The OECD proposes to distinguish four technology groups (high, medium-high,medium-low and low-technology industries), according to two indicators of technology intensity, R&Dexpenditure divided by value added and R&D expenditure divided by production. The INE’s (SpanishNational Statistical Institute) classification of industries by their technological intensity, which adaptsthe OECD’s to the Spanish economy, is used in this paper. Attention is focused on two different industrygroups: high-tech and medium-tech industries. It can be assumed that these industries show ratherdifferent organizational characteristics derived from different sectorial and environmental features,such as accelerating and complex technologies, operational dynamics, continuous innovation, etc. [46].Therefore, it is interesting to test whether this fact has any impact on the culture type that is mosteffective in order to improve OA.
Technology-intense industries are dynamic environments in which companies must be highlyflexible and quick to implement changes [47]. High technology environments will require knowledgeintensity and sophistication from firms, pushing them to adopt alternative organizational designsand new management techniques. Technologically driven industries need to be more creative andinnovative than any others, if they want to survive [48]. The value of these companies lies increasinglyin the creation and sharing of knowledge, rather than in any other type of assets or resources. Thus,the presumption can be made that OC values that improve the OA level in an organization will findmore favorable conditions in this type of environmental context to exert its positive influence.
Sustainability 2017, 9, 2354 7 of 23
Moreover, high-tech industries demand highly educated skilled workers [46], contrary to mediumand low-tech industries, which usually have a higher labor intensity and employ less humancapital [49]. These facts lead to the consideration that in a high-tech context people are moreself-motivated/directed and enjoy the autonomy and freedom of decision making and assumingresponsibilities [46]. Thus, these environmental conditions will positively affect the agility valuesthat could be involved in any of the four different OC typologies, as has been explained above(Section 2.3). Under such conditions, the agility values will be widely spread and smoothly assumedby the organization. Therefore, high technology intensity will enhance the OC values that are linked toa superior OA level, in a stronger manner than in a medium or low-tech context.
Furthermore, technology intensity has previously been noted as a moderator in the relationshipsbetween diverse organizational variables. Prior research has demonstrated that technology intensitymoderates the impact on a firm’s performance of cooperation and strategic renewal activities [42],foreign corporate-ownership [50], quality capabilities [51], or employment flexibility [52].
With this theoretical support, it is proposed that the technology intensity of the industry willpositively moderate the relationship between culture typology and OA.
Hence, the following hypothesis is posited (Figure 2):
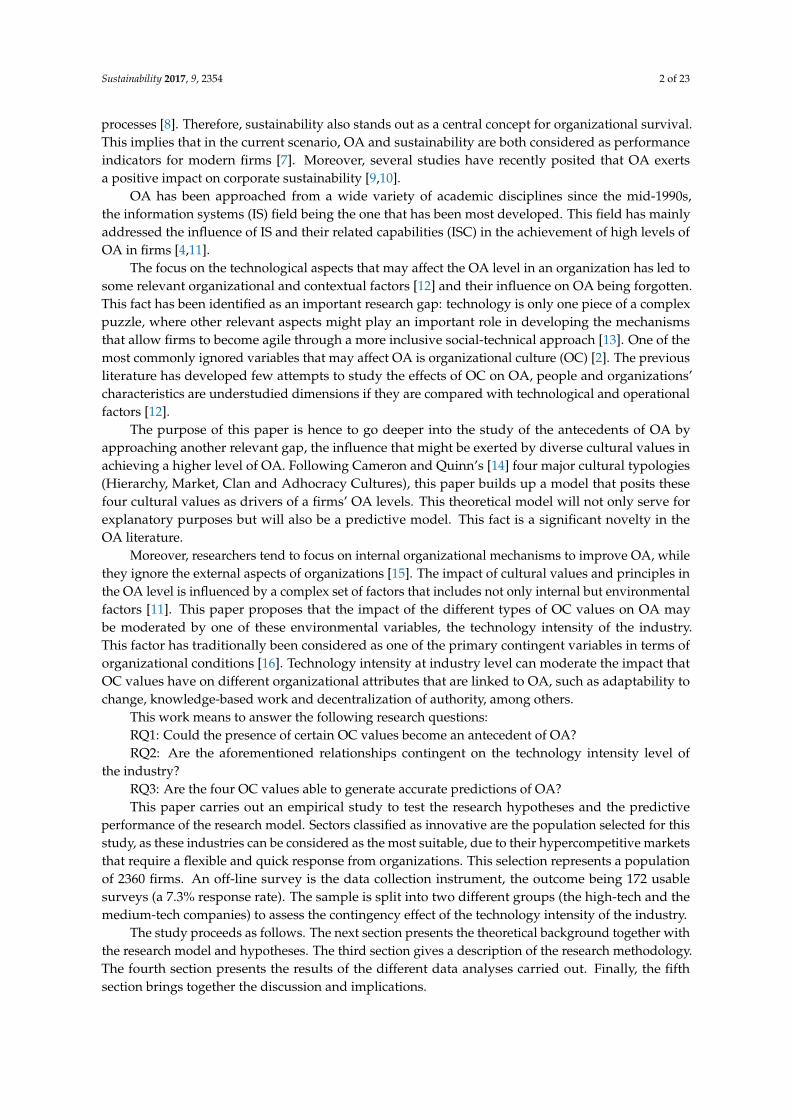
Hypothesis 5 (H5). The technology intensity level of the industry positively moderates the link between OCand OA.
Hypothesis 5a (H5a). The technology intensity level of the industry positively moderates the link between clanculture and OA.
Hypothesis 5b (H5b). The technology intensity level of the industry positively moderates the link betweenmarket culture and OA.
Hypothesis 5c (H5c). The technology intensity level of the industry positively moderates the link betweenadhocracy culture and OA.
Hypothesis 5d (H5d). The technology intensity level of the industry positively moderates the link betweenhierarchy culture and OA.
Sustainability 2017, 9, 2354 7 of 22
organization. Therefore, high technology intensity will enhance the OC values that are linked to a
superior OA level, in a stronger manner than in a medium or low-tech context.
Furthermore, technology intensity has previously been noted as a moderator in the relationships
between diverse organizational variables. Prior research has demonstrated that technology intensity
moderates the impact on a firm’s performance of cooperation and strategic renewal activities [42],
foreign corporate-ownership [50], quality capabilities [51], or employment flexibility [52].
With this theoretical support, it is proposed that the technology intensity of the industry will
positively moderate the relationship between culture typology and OA.
Hence, the following hypothesis is posited (Figure 2):
Hypothesis 5 (H5). The technology intensity level of the industry positively moderates the link between OC
and OA.
Hypothesis 5a (H5a). The technology intensity level of the industry positively moderates the link between
clan culture and OA.
Hypothesis 5b (H5b). The technology intensity level of the industry positively moderates the link between
market culture and OA.
Hypothesis 5c (H5c). The technology intensity level of the industry positively moderates the link between
adhocracy culture and OA.
Hypothesis 5d (H5d). The technology intensity level of the industry positively moderates the link between
hierarchy culture and OA.
Figure 2. Research model and hypotheses.
3. Methods
3.1. Sample and Data Collection
Innovative sectors shape the population for this research. Both scholars and practitioners
catalogue these industries as hypercompetitive, requiring a flexible and quick response from firms.
This sector was chosen on the basis of the taxonomy developed by the Spanish National Institute of
Statistics [53], which distinguishes between high and medium-high technology industries. This
selection yields a population of 2360 companies. The data collection instrument consists of an off-line
survey. Since the level of analysis is the organization, the survey respondents are senior managers.
H1(+)
Clan
CultureSize
Age
Organizational
agility
Technology Intensity of the Industry
H5(+)
Market
Culture
Adhocracy
Culture
Hierarchy
Culture
H2(+)
H3(+)
H4(-)
Figure 2. Research model and hypotheses.
Sustainability 2017, 9, 2354 8 of 23
3. Methods
3.1. Sample and Data Collection
Innovative sectors shape the population for this research. Both scholars and practitionerscatalogue these industries as hypercompetitive, requiring a flexible and quick response from firms.This sector was chosen on the basis of the taxonomy developed by the Spanish National Instituteof Statistics [53], which distinguishes between high and medium-high technology industries. Thisselection yields a population of 2360 companies. The data collection instrument consists of an off-linesurvey. Since the level of analysis is the organization, the survey respondents are senior managers.After one mailing effort, 189 questionnaires were initially received. Once those observations that did notsatisfy the criteria suggested by Hair et al. [54] to handle missing data were removed, 172 valid surveys(a 7.3% response rate) were selected. This lower-than expected response rate might be explained bythe fact that respondents (mostly executive managers) might possibly be overwhelmed by surveys.Nonetheless, this lower than expected response rate is not a severe source of bias, as we examined thegeneralizability through two different non-response bias tests. We assessed the potential non-responsebias by means of a series of t-tests that compared early (responses to the initial mailing) with late(responses to the follow-up mailing) respondents, in terms of all the key constructs. Responding firmswere compared with those that did not respond in terms of size and performance. No significantdifferences were found between these two groups, thus suggesting that non-response bias is nota serious concern. Finally, considering a statistical power of 0.8 at an alpha level of 0.05, our sample(n = 172) permits detecting an effect size (f 2) up to 0.036 [55], a figure very close to 0.02, a smallinfluence according to Cohen [56].
The firms involved belong largely to the following industries: computer systems design (26.7%);machinery manufacturing (18%), chemical (17.4%); transportation equipment manufacturing sectors(8.1%); electrical equipment (7.6%); and, computer and electronic products (7%). Consistent withthe European Union classification, 23.8% of the firms participating are large enterprises, more than250 employees. Concerning the respondents’ area of specialization, 23.8% of the respondents belongto the R&D department, followed by the marketing department (20.9%), general management (14%)and the engineering department (9.3%). Regarding the respondents’ gender, 66% are male, whereaswomen represent 34%.
To analyze the industry contingency effect, the sample is split into two subsamples: (i) thehigh-tech; and, (ii) the medium-tech companies, following the classification established by the SpanishNational Institute of Statistics [53] mentioned above. Results from the split are: 88 high-tech firms(51%) and 84 medium-tech firms (49%).
3.2. Measures
The variables included in our study have been modeled as composites. These variables canbe described as design constructs or artifacts that consist of more elementary components, such asdimensions or facts. In this manner, composites are formed as linear combinations of their respectiveindicators or dimensions [57]. Consequently, dropping an indicator (or dimension) usually altersthe meaning of the composite [58], since they represent different facets, whilst high correlations arecommon among indicators and dimensions but not required [59]. To measure the OC variables,this study adapts the OC Assessment Instrument proposed by Cameron and Quinn [19], which isbased on the Competing Values Framework and encompasses six items that measure each of the fourculture typologies as unidimensional constructs. Besides, following Sambamurthy et al. [4], OA ismeasured as a multidimensional composite shaped by three dimensions: customer agility, partneringagility and operational agility and a total of eleven items. This work adapts the scales proposed by Luand Ramamurthy [60] for customer and operational agility and from Yang and Liu [61], Bradley, Pratt,Byrd, Outlay and Wynn [62] and Tallon and Pinsonneault [63] for partnering agility. All the constructsare measured through a seven-point Likert scale, with the exception of the control variables. In this
Sustainability 2017, 9, 2354 9 of 23
case, using archival data from the SABI NEO database (Sistema de Análisis de Balances Ibéricos), sizewas measured as the number of employees and age as the number of years since its founding.
3.3. Data Analysis
Partial Least Squares (PLS), a variance-based structural equation modeling approach [64], wasthe technique chosen to test the research model. This decision is firstly based on the characteristicsof the constructs included in our research model. These are composites. Therefore, as theoreticalcontributions [57,65] and empirical simulation studies [66,67] have demonstrated, the use of PLS issuitable when a composite measurement model is supported. In this case, the PLS path modelingestimates are consistent [68] and there is no bias [67]. Secondly, following Chin [69]. PLS is usedbecause component scores are used in a subsequent analysis for modeling a multidimensional constructapplying the two-stage approach [70]. Lastly, this study is mainly oriented to identifying key drivercultural constructs in order to predict a company’s OA level [71].
The four culture variables have been modeled as composites and estimated in Mode B (regressionweights). Given the original instrument used, an additive operation in order to generate scores by eachtype of culture and where the existence of correlated items or internal consistency was not presupposed,it was decided to apply Mode B as the estimation method for the culture variables. On the other hand,Mode A was selected for the OA variable, both at the dimension and the second-order construct level.Mode A used correlation weights, which is advisable for the estimation of standardized regressioncoefficients in small to medium samples and when the indicators are correlated [66]. Finally, SmartPLS3.2.7 software was used [72].
3.4. Common Method Bias
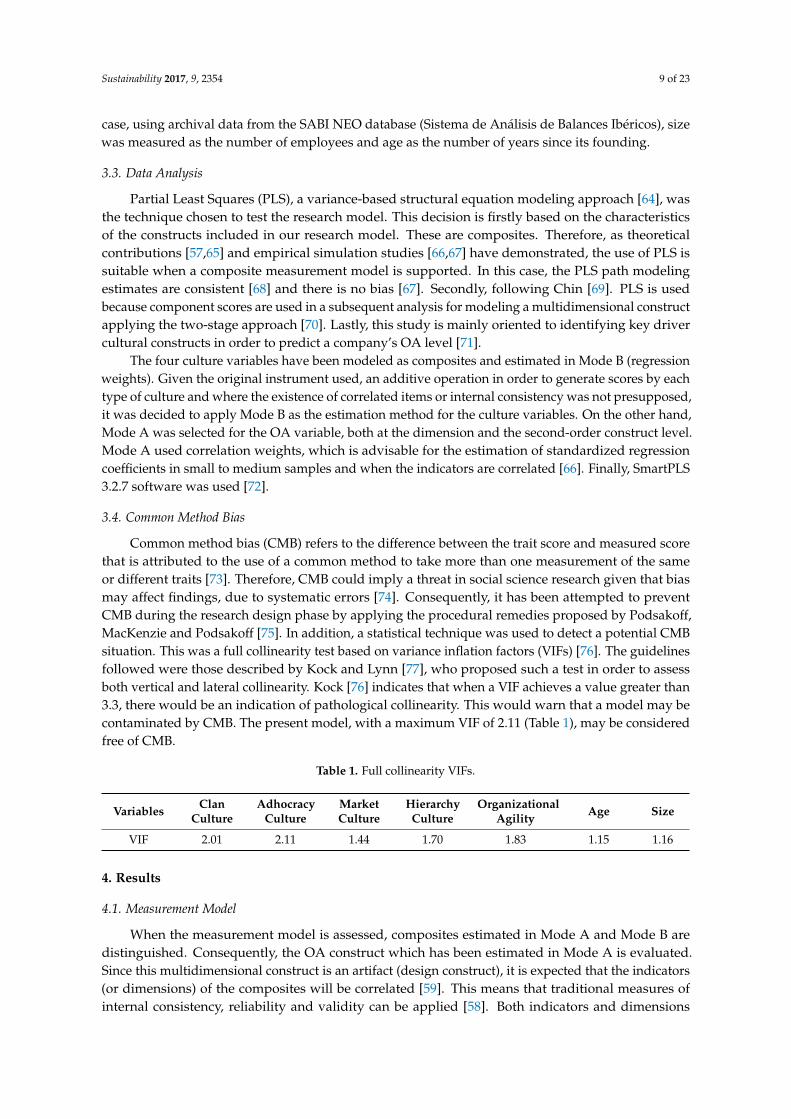
Common method bias (CMB) refers to the difference between the trait score and measured scorethat is attributed to the use of a common method to take more than one measurement of the sameor different traits [73]. Therefore, CMB could imply a threat in social science research given that biasmay affect findings, due to systematic errors [74]. Consequently, it has been attempted to preventCMB during the research design phase by applying the procedural remedies proposed by Podsakoff,MacKenzie and Podsakoff [75]. In addition, a statistical technique was used to detect a potential CMBsituation. This was a full collinearity test based on variance inflation factors (VIFs) [76]. The guidelinesfollowed were those described by Kock and Lynn [77], who proposed such a test in order to assessboth vertical and lateral collinearity. Kock [76] indicates that when a VIF achieves a value greater than3.3, there would be an indication of pathological collinearity. This would warn that a model may becontaminated by CMB. The present model, with a maximum VIF of 2.11 (Table 1), may be consideredfree of CMB.
Table 1. Full collinearity VIFs.
Variables ClanCulture
AdhocracyCulture
MarketCulture
HierarchyCulture
OrganizationalAgility Age Size
VIF 2.01 2.11 1.44 1.70 1.83 1.15 1.16
4. Results
4.1. Measurement Model
When the measurement model is assessed, composites estimated in Mode A and Mode B aredistinguished. Consequently, the OA construct which has been estimated in Mode A is evaluated.Since this multidimensional construct is an artifact (design construct), it is expected that the indicators(or dimensions) of the composites will be correlated [59]. This means that traditional measures ofinternal consistency, reliability and validity can be applied [58]. Both indicators and dimensions
Sustainability 2017, 9, 2354 10 of 23
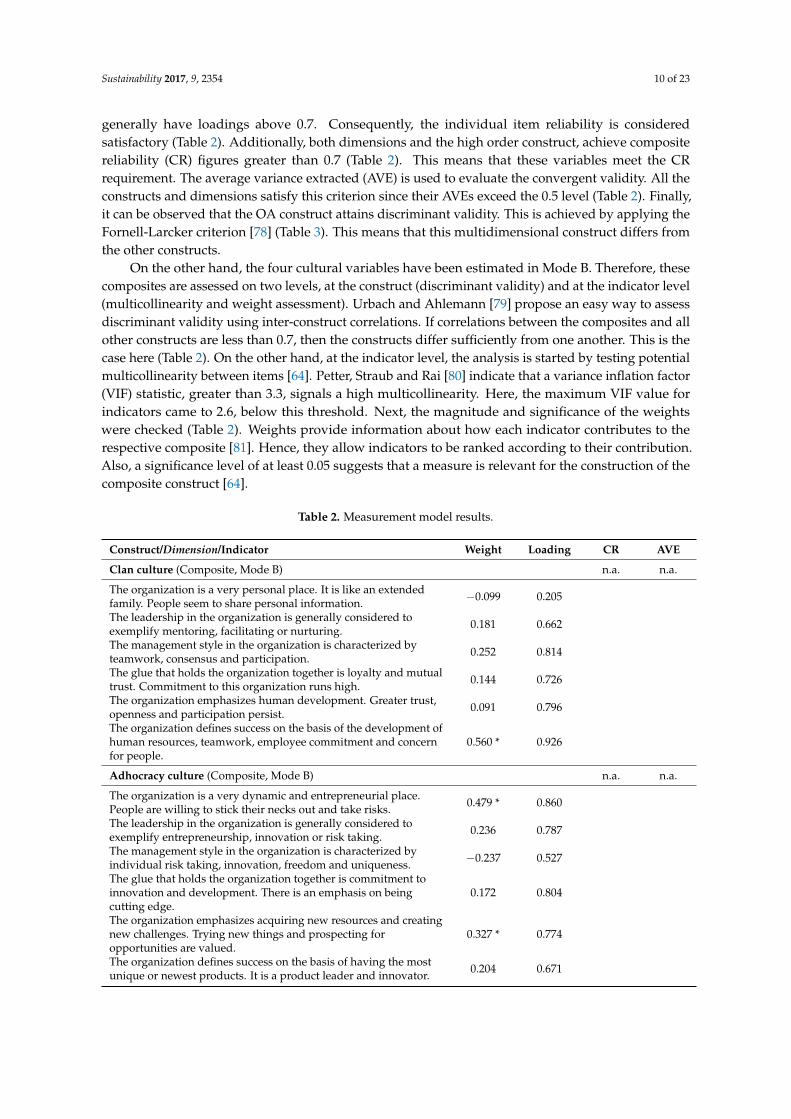
generally have loadings above 0.7. Consequently, the individual item reliability is consideredsatisfactory (Table 2). Additionally, both dimensions and the high order construct, achieve compositereliability (CR) figures greater than 0.7 (Table 2). This means that these variables meet the CRrequirement. The average variance extracted (AVE) is used to evaluate the convergent validity. All theconstructs and dimensions satisfy this criterion since their AVEs exceed the 0.5 level (Table 2). Finally,it can be observed that the OA construct attains discriminant validity. This is achieved by applying theFornell-Larcker criterion [78] (Table 3). This means that this multidimensional construct differs fromthe other constructs.
On the other hand, the four cultural variables have been estimated in Mode B. Therefore, thesecomposites are assessed on two levels, at the construct (discriminant validity) and at the indicator level(multicollinearity and weight assessment). Urbach and Ahlemann [79] propose an easy way to assessdiscriminant validity using inter-construct correlations. If correlations between the composites and allother constructs are less than 0.7, then the constructs differ sufficiently from one another. This is thecase here (Table 2). On the other hand, at the indicator level, the analysis is started by testing potentialmulticollinearity between items [64]. Petter, Straub and Rai [80] indicate that a variance inflation factor(VIF) statistic, greater than 3.3, signals a high multicollinearity. Here, the maximum VIF value forindicators came to 2.6, below this threshold. Next, the magnitude and significance of the weightswere checked (Table 2). Weights provide information about how each indicator contributes to therespective composite [81]. Hence, they allow indicators to be ranked according to their contribution.Also, a significance level of at least 0.05 suggests that a measure is relevant for the construction of thecomposite construct [64].
Table 2. Measurement model results.
Construct/Dimension/Indicator Weight Loading CR AVE
Clan culture (Composite, Mode B) n.a. n.a.
The organization is a very personal place. It is like an extendedfamily. People seem to share personal information. −0.099 0.205
The leadership in the organization is generally considered toexemplify mentoring, facilitating or nurturing. 0.181 0.662
The management style in the organization is characterized byteamwork, consensus and participation. 0.252 0.814
The glue that holds the organization together is loyalty and mutualtrust. Commitment to this organization runs high. 0.144 0.726
The organization emphasizes human development. Greater trust,openness and participation persist. 0.091 0.796
The organization defines success on the basis of the development ofhuman resources, teamwork, employee commitment and concernfor people.
0.560 * 0.926
Adhocracy culture (Composite, Mode B) n.a. n.a.
The organization is a very dynamic and entrepreneurial place.People are willing to stick their necks out and take risks. 0.479 * 0.860
The leadership in the organization is generally considered toexemplify entrepreneurship, innovation or risk taking. 0.236 0.787
The management style in the organization is characterized byindividual risk taking, innovation, freedom and uniqueness. −0.237 0.527
The glue that holds the organization together is commitment toinnovation and development. There is an emphasis on beingcutting edge.
0.172 0.804
The organization emphasizes acquiring new resources and creatingnew challenges. Trying new things and prospecting foropportunities are valued.
0.327 * 0.774
The organization defines success on the basis of having the mostunique or newest products. It is a product leader and innovator. 0.204 0.671
Sustainability 2017, 9, 2354 11 of 23
Table 2. Cont.
Construct/Dimension/Indicator Weight Loading CR AVE
Market culture (Composite, Mode B) n.a. n.a.
The organization is very results-oriented. A major concern is withgetting the job done. People are very competitive andachievement-oriented.
0.532 * 0.750
The leadership in the organization is generally considered toexemplify a no−nonsense, aggressive, results-oriented focus. −0.082 0.455
The management style in the organization is characterized byhard-driving competitiveness, high demands and achievement. −0.304 0.444
The glue that holds the organization together is the emphasis onachievement and goal accomplishment. 0.711 * 0.867
The organization emphasizes competitive actions and achievements.Hitting stretch targets and winning in the marketplace are dominant. −0.072 0.503
The organization defines success on the basis of winning in themarketplace and outpacing the competition. Competitive marketleadership is key.
0.310 0.622
Hierarchy culture (Composite, Mode B) n.a. n.a.
The organization is a very controlled and structured place. Formalprocedures generally govern what people do. −0.296 * 0.251
The leadership in the organization is generally considered toexemplify coordination, organization or smooth-running efficiency. 0.634 * 0.849
The management style in the organization is characterized by securityof employment, conformity, predictability and stability inrelationships.
0.018 0.421
The glue that holds the organization together is formal rules andpolicies. Maintaining a smooth-running organization is important. 0.261 0.649
The organization emphasizes permanence and stability. Efficiency,control and smooth operations are important. −0.009 0.498
The organization defines success on the basis of efficiency.Dependable delivery, smooth scheduling and low-cost production arecritical.
0.468 * 0.776
Organizational agility (Multidimensional construct, Mode A)Relative to our competitors . . . 0.922 0.797
Operational agility (Composite, Mode A) 0.337 * 0.869 0.911 0.773
We fulfill demands for rapid-response, special requests of ourcustomers whenever such demands arise. Our customers haveconfidence in our ability.
0.356 * 0.859
We can quickly scale up or scale down our production/service levelsto support fluctuations in demand from the market. 0.364 * 0.885
Whenever there is a disruption in supply from our suppliers we canquickly make necessary alternative arrangements and internaladjustments.
0.416 * 0.894
Customer agility (Composite, Mode A) 0.420 * 0.951 0.912 0.776
We are quick to make and implement appropriate decisions in theface of market/customer changes. 0.353 * 0.857
We constantly look for ways to reinvent/reengineer our organizationto better serve our market place. 0.401 * 0.904
We treat market-related changes and apparent chaos as opportunitiesto capitalize quickly. 0.380 * 0.881
Partnering agility (Composite, Mode A) 0.360 * 0.856 0.884 0.610
We collect detailed information about our suppliers and serviceproviders. 0.303 * 0.856
We are able to exploit the resources and capabilities of suppliers toenhance the quality and quantity of products and services. 0.293 * 0.888
We work with external suppliers to create high-value products andservices. 0.254 * 0.832
We are able to manage relationships with outsourcing partners. 0.270 * 0.761We can switch suppliers to avail ourselves of lower costs, betterquality or improved delivery times. 0.125 * 0.510
Notes: CR: Composite reliability. AVE: Average variance extracted. n.a.: non-applicable. *: significant at p < 0.05(2 tails).
Sustainability 2017, 9, 2354 12 of 23
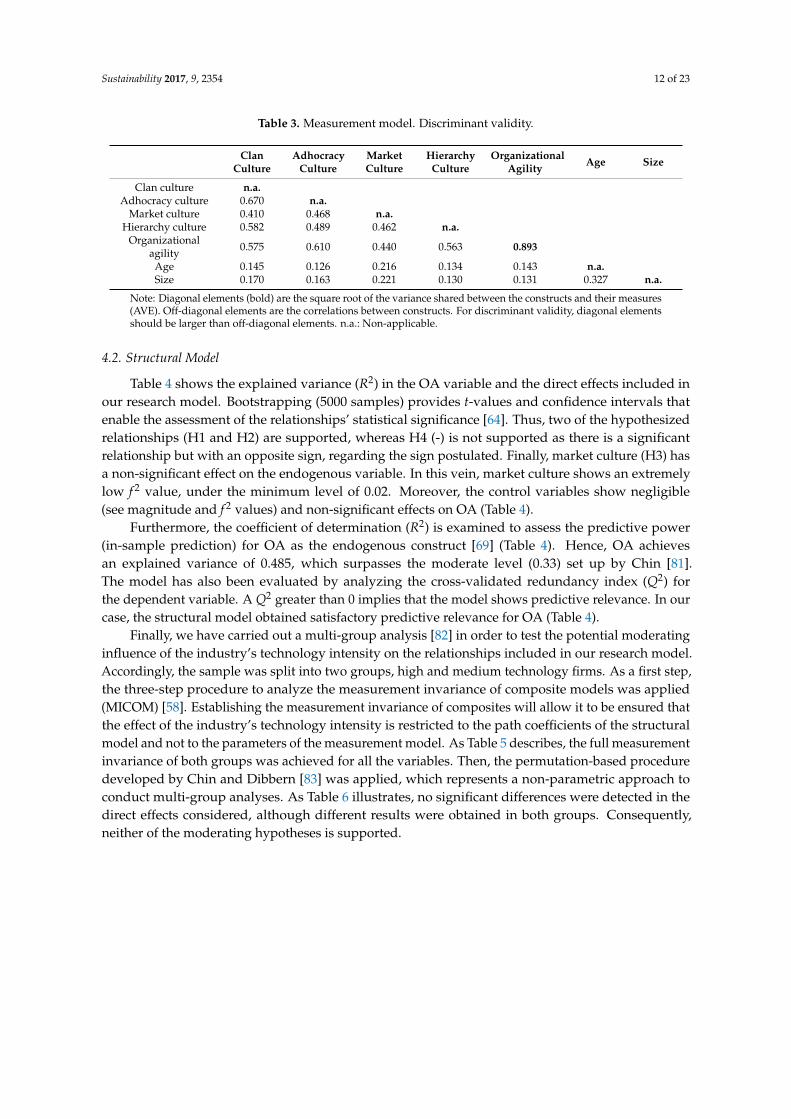
Table 3. Measurement model. Discriminant validity.
ClanCulture
AdhocracyCulture
MarketCulture
HierarchyCulture
OrganizationalAgility Age Size
Clan culture n.a.Adhocracy culture 0.670 n.a.
Market culture 0.410 0.468 n.a.Hierarchy culture 0.582 0.489 0.462 n.a.
Organizationalagility 0.575 0.610 0.440 0.563 0.893
Age 0.145 0.126 0.216 0.134 0.143 n.a.Size 0.170 0.163 0.221 0.130 0.131 0.327 n.a.
Note: Diagonal elements (bold) are the square root of the variance shared between the constructs and their measures(AVE). Off-diagonal elements are the correlations between constructs. For discriminant validity, diagonal elementsshould be larger than off-diagonal elements. n.a.: Non-applicable.
4.2. Structural Model
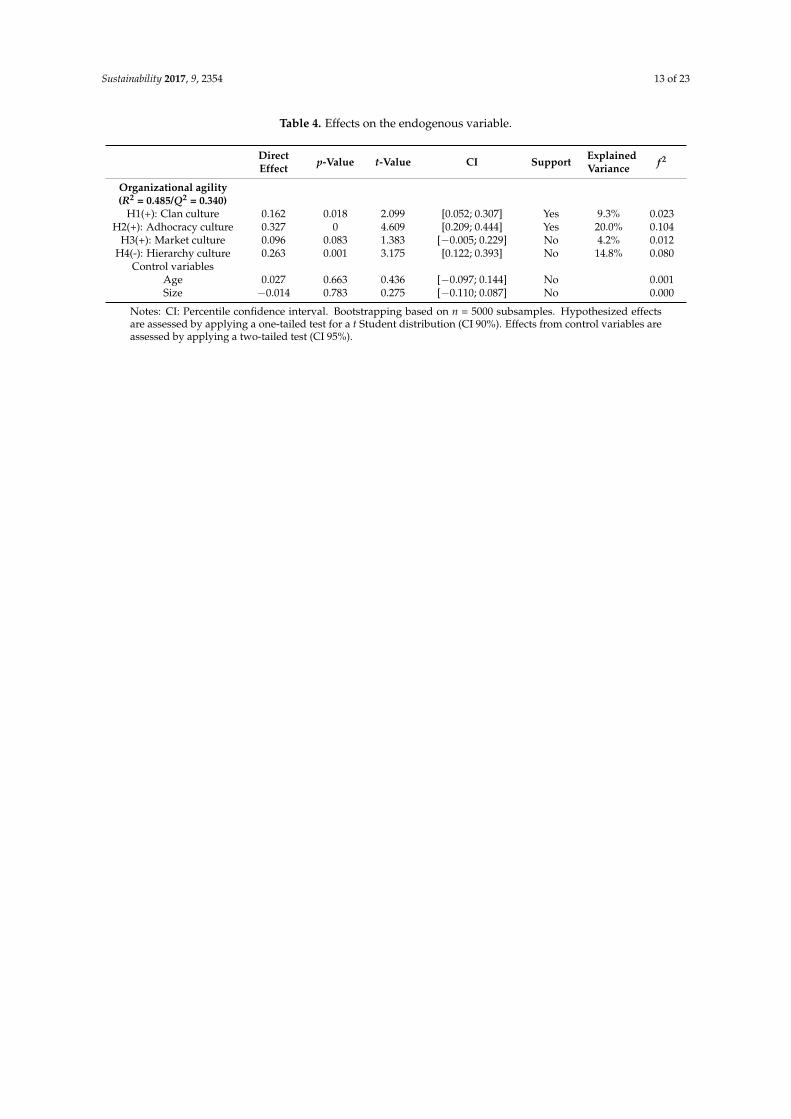
Table 4 shows the explained variance (R2) in the OA variable and the direct effects included inour research model. Bootstrapping (5000 samples) provides t-values and confidence intervals thatenable the assessment of the relationships’ statistical significance [64]. Thus, two of the hypothesizedrelationships (H1 and H2) are supported, whereas H4 (-) is not supported as there is a significantrelationship but with an opposite sign, regarding the sign postulated. Finally, market culture (H3) hasa non-significant effect on the endogenous variable. In this vein, market culture shows an extremelylow f 2 value, under the minimum level of 0.02. Moreover, the control variables show negligible(see magnitude and f 2 values) and non-significant effects on OA (Table 4).
Furthermore, the coefficient of determination (R2) is examined to assess the predictive power(in-sample prediction) for OA as the endogenous construct [69] (Table 4). Hence, OA achievesan explained variance of 0.485, which surpasses the moderate level (0.33) set up by Chin [81].The model has also been evaluated by analyzing the cross-validated redundancy index (Q2) forthe dependent variable. A Q2 greater than 0 implies that the model shows predictive relevance. In ourcase, the structural model obtained satisfactory predictive relevance for OA (Table 4).
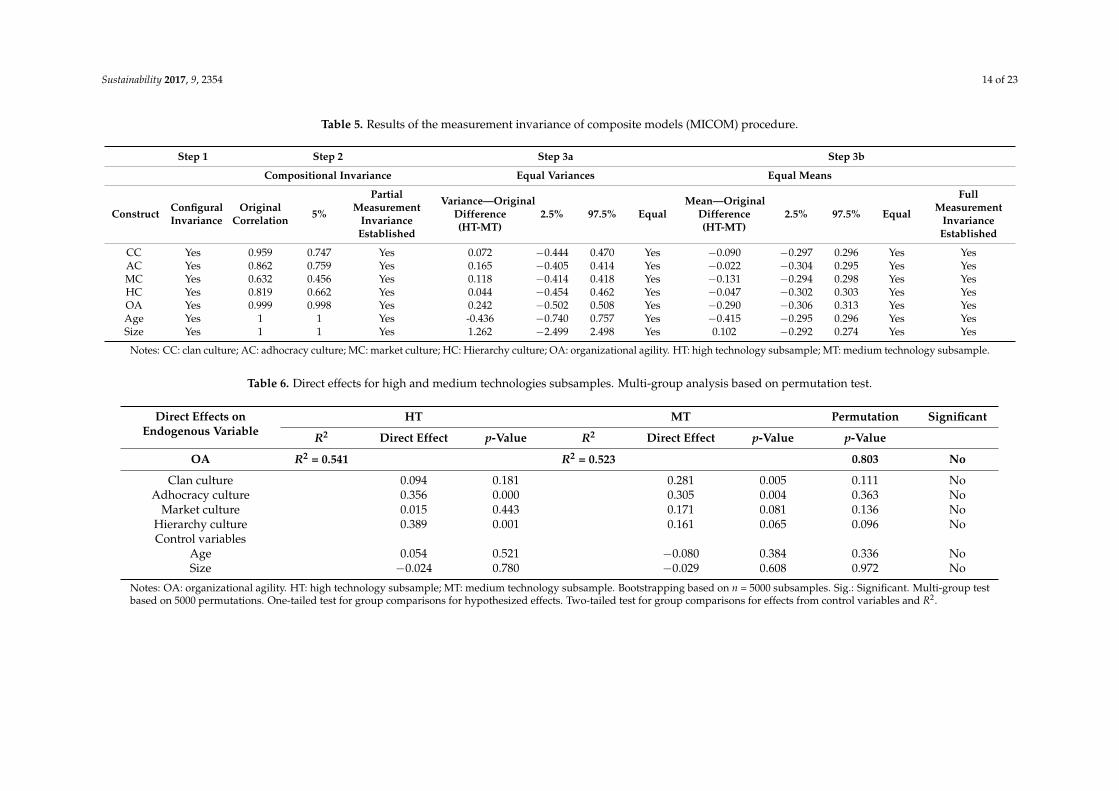
Finally, we have carried out a multi-group analysis [82] in order to test the potential moderatinginfluence of the industry’s technology intensity on the relationships included in our research model.Accordingly, the sample was split into two groups, high and medium technology firms. As a first step,the three-step procedure to analyze the measurement invariance of composite models was applied(MICOM) [58]. Establishing the measurement invariance of composites will allow it to be ensured thatthe effect of the industry’s technology intensity is restricted to the path coefficients of the structuralmodel and not to the parameters of the measurement model. As Table 5 describes, the full measurementinvariance of both groups was achieved for all the variables. Then, the permutation-based proceduredeveloped by Chin and Dibbern [83] was applied, which represents a non-parametric approach toconduct multi-group analyses. As Table 6 illustrates, no significant differences were detected in thedirect effects considered, although different results were obtained in both groups. Consequently,neither of the moderating hypotheses is supported.
Sustainability 2017, 9, 2354 13 of 23
Table 4. Effects on the endogenous variable.
DirectEffect p-Value t-Value CI Support Explained
Variance f 2
Organizational agility(R2 = 0.485/Q2 = 0.340)
H1(+): Clan culture 0.162 0.018 2.099 [0.052; 0.307] Yes 9.3% 0.023H2(+): Adhocracy culture 0.327 0 4.609 [0.209; 0.444] Yes 20.0% 0.104
H3(+): Market culture 0.096 0.083 1.383 [−0.005; 0.229] No 4.2% 0.012H4(-): Hierarchy culture 0.263 0.001 3.175 [0.122; 0.393] No 14.8% 0.080
Control variablesAge 0.027 0.663 0.436 [−0.097; 0.144] No 0.001Size −0.014 0.783 0.275 [−0.110; 0.087] No 0.000
Notes: CI: Percentile confidence interval. Bootstrapping based on n = 5000 subsamples. Hypothesized effectsare assessed by applying a one-tailed test for a t Student distribution (CI 90%). Effects from control variables areassessed by applying a two-tailed test (CI 95%).
Sustainability 2017, 9, 2354 14 of 23
Table 5. Results of the measurement invariance of composite models (MICOM) procedure.
Step 1 Step 2 Step 3a Step 3b
Compositional Invariance Equal Variances Equal Means
Construct ConfiguralInvariance
OriginalCorrelation 5%
PartialMeasurement
InvarianceEstablished
Variance—OriginalDifference(HT-MT)
2.5% 97.5% EqualMean—Original
Difference(HT-MT)
2.5% 97.5% Equal
FullMeasurement
InvarianceEstablished
CC Yes 0.959 0.747 Yes 0.072 −0.444 0.470 Yes −0.090 −0.297 0.296 Yes YesAC Yes 0.862 0.759 Yes 0.165 −0.405 0.414 Yes −0.022 −0.304 0.295 Yes YesMC Yes 0.632 0.456 Yes 0.118 −0.414 0.418 Yes −0.131 −0.294 0.298 Yes YesHC Yes 0.819 0.662 Yes 0.044 −0.454 0.462 Yes −0.047 −0.302 0.303 Yes YesOA Yes 0.999 0.998 Yes 0.242 −0.502 0.508 Yes −0.290 −0.306 0.313 Yes YesAge Yes 1 1 Yes -0.436 −0.740 0.757 Yes −0.415 −0.295 0.296 Yes YesSize Yes 1 1 Yes 1.262 −2.499 2.498 Yes 0.102 −0.292 0.274 Yes Yes
Notes: CC: clan culture; AC: adhocracy culture; MC: market culture; HC: Hierarchy culture; OA: organizational agility. HT: high technology subsample; MT: medium technology subsample.
Table 6. Direct effects for high and medium technologies subsamples. Multi-group analysis based on permutation test.
Direct Effects onEndogenous Variable
HT MT Permutation Significant
R2 Direct Effect p-Value R2 Direct Effect p-Value p-Value
OA R2 = 0.541 R2 = 0.523 0.803 No
Clan culture 0.094 0.181 0.281 0.005 0.111 NoAdhocracy culture 0.356 0.000 0.305 0.004 0.363 No
Market culture 0.015 0.443 0.171 0.081 0.136 NoHierarchy culture 0.389 0.001 0.161 0.065 0.096 NoControl variables
Age 0.054 0.521 −0.080 0.384 0.336 NoSize −0.024 0.780 −0.029 0.608 0.972 No
Notes: OA: organizational agility. HT: high technology subsample; MT: medium technology subsample. Bootstrapping based on n = 5000 subsamples. Sig.: Significant. Multi-group testbased on 5000 permutations. One-tailed test for group comparisons for hypothesized effects. Two-tailed test for group comparisons for effects from control variables and R2.
Sustainability 2017, 9, 2354 15 of 23
4.3. Assessment of the Predictive Validity Using Holdout Samples
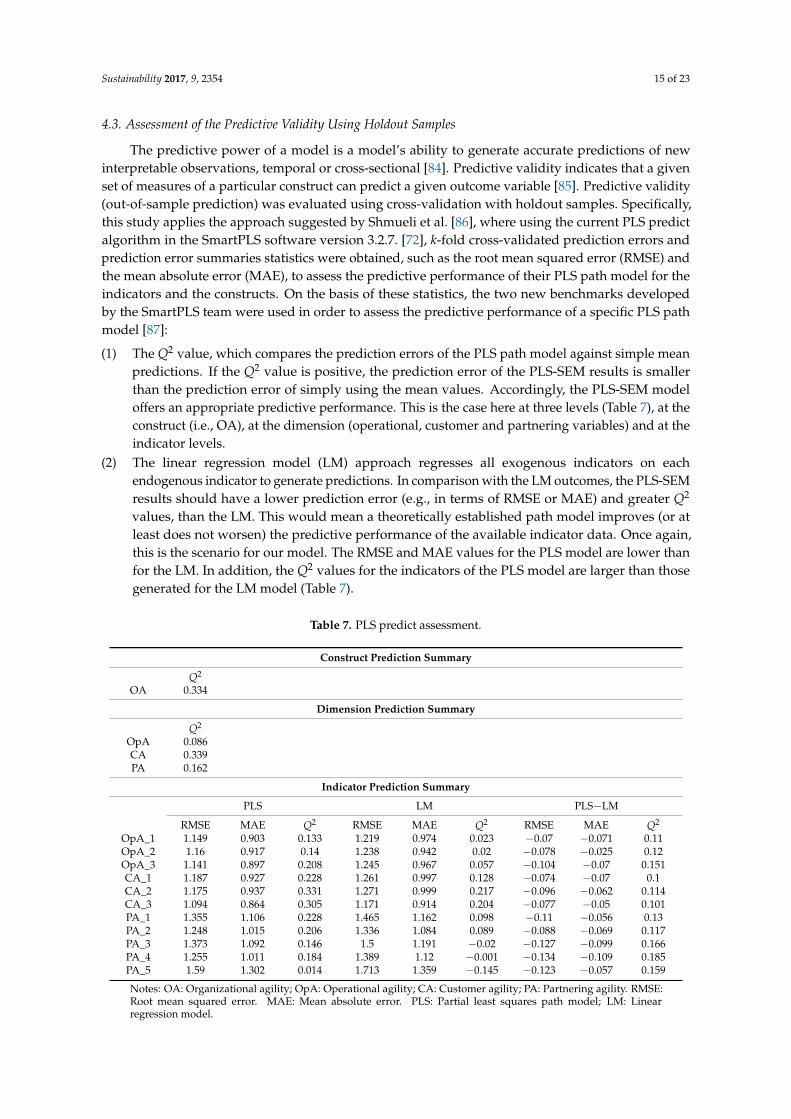
The predictive power of a model is a model’s ability to generate accurate predictions of newinterpretable observations, temporal or cross-sectional [84]. Predictive validity indicates that a givenset of measures of a particular construct can predict a given outcome variable [85]. Predictive validity(out-of-sample prediction) was evaluated using cross-validation with holdout samples. Specifically,this study applies the approach suggested by Shmueli et al. [86], where using the current PLS predictalgorithm in the SmartPLS software version 3.2.7. [72], k-fold cross-validated prediction errors andprediction error summaries statistics were obtained, such as the root mean squared error (RMSE) andthe mean absolute error (MAE), to assess the predictive performance of their PLS path model for theindicators and the constructs. On the basis of these statistics, the two new benchmarks developedby the SmartPLS team were used in order to assess the predictive performance of a specific PLS pathmodel [87]:
(1) The Q2 value, which compares the prediction errors of the PLS path model against simple meanpredictions. If the Q2 value is positive, the prediction error of the PLS-SEM results is smallerthan the prediction error of simply using the mean values. Accordingly, the PLS-SEM modeloffers an appropriate predictive performance. This is the case here at three levels (Table 7), at theconstruct (i.e., OA), at the dimension (operational, customer and partnering variables) and at theindicator levels.
(2) The linear regression model (LM) approach regresses all exogenous indicators on eachendogenous indicator to generate predictions. In comparison with the LM outcomes, the PLS-SEMresults should have a lower prediction error (e.g., in terms of RMSE or MAE) and greater Q2
values, than the LM. This would mean a theoretically established path model improves (or atleast does not worsen) the predictive performance of the available indicator data. Once again,this is the scenario for our model. The RMSE and MAE values for the PLS model are lower thanfor the LM. In addition, the Q2 values for the indicators of the PLS model are larger than thosegenerated for the LM model (Table 7).
Table 7. PLS predict assessment.
Construct Prediction Summary
Q2
OA 0.334
Dimension Prediction Summary
Q2
OpA 0.086CA 0.339PA 0.162
Indicator Prediction Summary
PLS LM PLS−LM
RMSE MAE Q2 RMSE MAE Q2 RMSE MAE Q2
OpA_1 1.149 0.903 0.133 1.219 0.974 0.023 −0.07 −0.071 0.11OpA_2 1.16 0.917 0.14 1.238 0.942 0.02 −0.078 −0.025 0.12OpA_3 1.141 0.897 0.208 1.245 0.967 0.057 −0.104 −0.07 0.151CA_1 1.187 0.927 0.228 1.261 0.997 0.128 −0.074 −0.07 0.1CA_2 1.175 0.937 0.331 1.271 0.999 0.217 −0.096 −0.062 0.114CA_3 1.094 0.864 0.305 1.171 0.914 0.204 −0.077 −0.05 0.101PA_1 1.355 1.106 0.228 1.465 1.162 0.098 −0.11 −0.056 0.13PA_2 1.248 1.015 0.206 1.336 1.084 0.089 −0.088 −0.069 0.117PA_3 1.373 1.092 0.146 1.5 1.191 −0.02 −0.127 −0.099 0.166PA_4 1.255 1.011 0.184 1.389 1.12 −0.001 −0.134 −0.109 0.185PA_5 1.59 1.302 0.014 1.713 1.359 −0.145 −0.123 −0.057 0.159
Notes: OA: Organizational agility; OpA: Operational agility; CA: Customer agility; PA: Partnering agility. RMSE:Root mean squared error. MAE: Mean absolute error. PLS: Partial least squares path model; LM: Linearregression model.
Sustainability 2017, 9, 2354 16 of 23
Next, with the invaluable help of the research team led by Galit Shmuelit at the National Tsing HuaUniversity (Taiwan), it was attempted to assess the predictive validity of our model focusing on the“overfit” issue. Is the model fit too specifically to training data or will the model perform comparablywith new data? In order to offer a response, in-sample versus out-of-sample predictions were comparedto actual composite scores. With this aim in mind, the following steps were followed [88]:
(1) The actual composite scores for organizational agility (OA) were estimated for all cases,by estimating the model on the whole sample (n = 172).
(2) In-sample predictions for OA composite scores were calculated using a k-fold (k = 10)cross-validation procedure. The in-sample RMSE was than calculated by comparing each case’sin-sample predicted OA score, versus its actual OA score.
(3) Out-of-sample predictions for OA composite scores were obtained using a k-fold cross-validationprocedure (where k = 10). The out-of-sample RMSE was then calculated by comparing each case’sout-of-sample predicted OA score, versus its actual OA score.
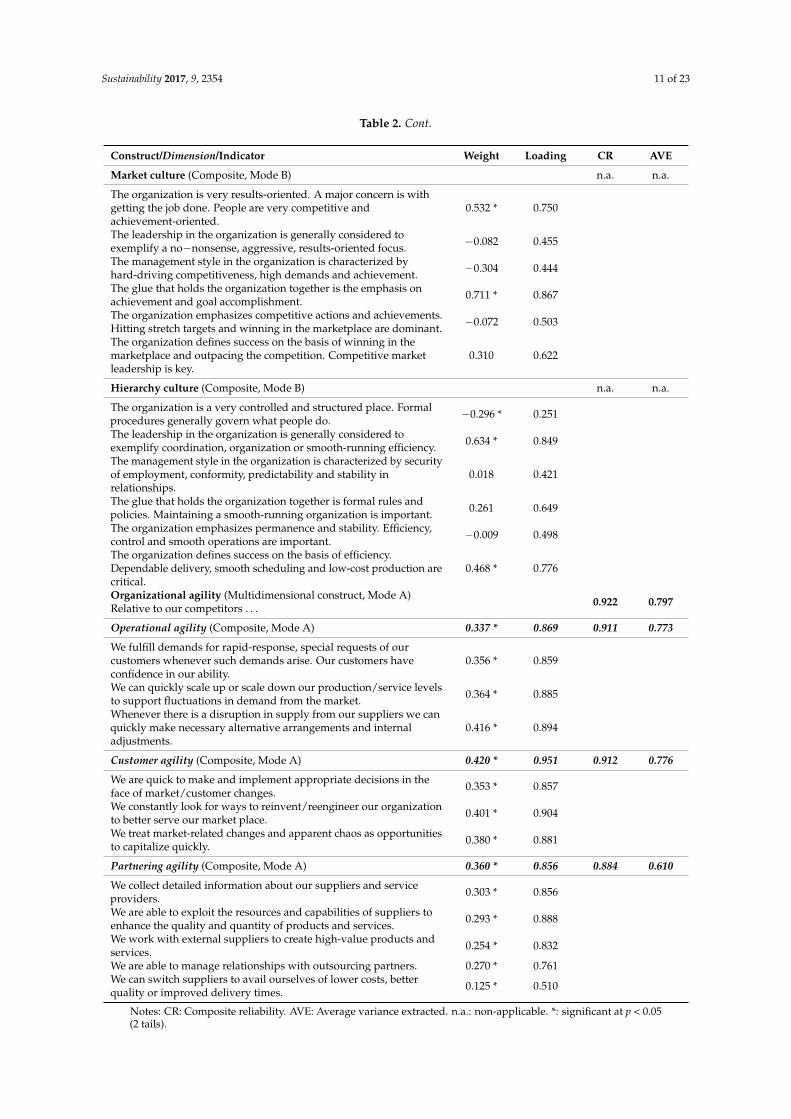
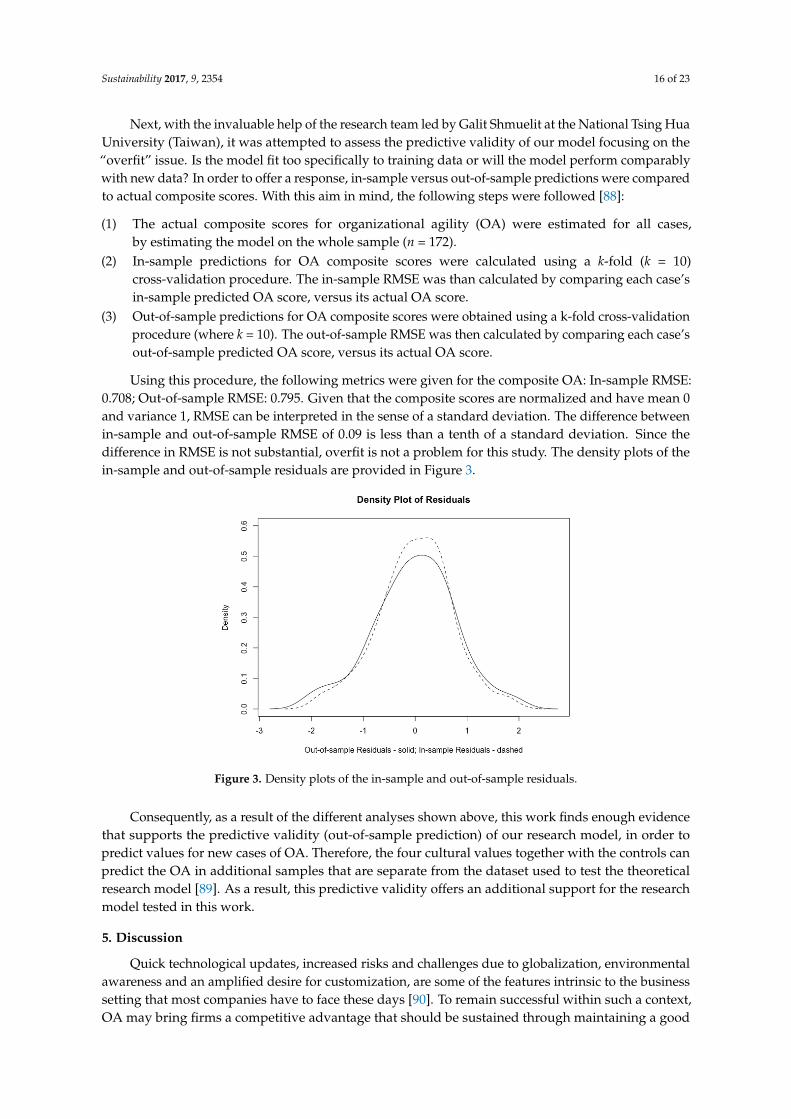
Using this procedure, the following metrics were given for the composite OA: In-sample RMSE:0.708; Out-of-sample RMSE: 0.795. Given that the composite scores are normalized and have mean 0and variance 1, RMSE can be interpreted in the sense of a standard deviation. The difference betweenin-sample and out-of-sample RMSE of 0.09 is less than a tenth of a standard deviation. Since thedifference in RMSE is not substantial, overfit is not a problem for this study. The density plots of thein-sample and out-of-sample residuals are provided in Figure 3.
Sustainability 2017, 9, 2354 15 of 22
Next, with the invaluable help of the research team led by Galit Shmuelit at the National Tsing
Hua University (Taiwan), it was attempted to assess the predictive validity of our model focusing on
the “overfit” issue. Is the model fit too specifically to training data or will the model perform
comparably with new data? In order to offer a response, in-sample versus out-of-sample predictions
were compared to actual composite scores. With this aim in mind, the following steps were followed
[88]:
(1) The actual composite scores for organizational agility (OA) were estimated for all cases, by
estimating the model on the whole sample (n = 172).
(2) In-sample predictions for OA composite scores were calculated using a k-fold (k = 10) cross-
validation procedure. The in-sample RMSE was than calculated by comparing each case’s in-
sample predicted OA score, versus its actual OA score.
(3) Out-of-sample predictions for OA composite scores were obtained using a k-fold cross-
validation procedure (where k = 10). The out-of-sample RMSE was then calculated by comparing
each case’s out-of-sample predicted OA score, versus its actual OA score.
Using this procedure, the following metrics were given for the composite OA: In-sample RMSE:
0.708; Out-of-sample RMSE: 0.795. Given that the composite scores are normalized and have mean 0
and variance 1, RMSE can be interpreted in the sense of a standard deviation. The difference between
in-sample and out-of-sample RMSE of 0.09 is less than a tenth of a standard deviation. Since the
difference in RMSE is not substantial, overfit is not a problem for this study. The density plots of the
in-sample and out-of-sample residuals are provided in Figure 3.
Figure 3. Density plots of the in-sample and out-of-sample residuals.
Consequently, as a result of the different analyses shown above, this work finds enough
evidence that supports the predictive validity (out-of-sample prediction) of our research model, in
order to predict values for new cases of OA. Therefore, the four cultural values together with the
controls can predict the OA in additional samples that are separate from the dataset used to test the
theoretical research model [89]. As a result, this predictive validity offers an additional support for
the research model tested in this work.
5. Discussion
Quick technological updates, increased risks and challenges due to globalization, environmental
awareness and an amplified desire for customization, are some of the features intrinsic to the business
setting that most companies have to face these days [90]. To remain successful within such a context,
OA may bring firms a competitive advantage that should be sustained through maintaining a good
reputation for innovation, excellence and sustainability [12]. In this way, agile organizations combine
Figure 3. Density plots of the in-sample and out-of-sample residuals.
Consequently, as a result of the different analyses shown above, this work finds enough evidencethat supports the predictive validity (out-of-sample prediction) of our research model, in order topredict values for new cases of OA. Therefore, the four cultural values together with the controls canpredict the OA in additional samples that are separate from the dataset used to test the theoreticalresearch model [89]. As a result, this predictive validity offers an additional support for the researchmodel tested in this work.
5. Discussion
Quick technological updates, increased risks and challenges due to globalization, environmentalawareness and an amplified desire for customization, are some of the features intrinsic to the businesssetting that most companies have to face these days [90]. To remain successful within such a context,OA may bring firms a competitive advantage that should be sustained through maintaining a good

Sustainability 2017, 9, 2354 17 of 23
reputation for innovation, excellence and sustainability [12]. In this way, agile organizations combinetheir business processes and human capital with advanced technology, to satisfy clients’ demands forcustomized, excellent and more sustainable products and services in a rather short time frame [91].
It can therefore be assumed that OA facilitates the firm’s adaptation and quick response andis currently related to business success. In fact, OA has turned out to be more an imperative fororganizational subsistence than a choice in itself [1]. Nevertheless, the academic sphere is askingfor a more exhaustive assessment of this phenomenon. According to Chan et al. [92], due to thehigh complexity underlying the OA concept, its main drivers or antecedent variables require a muchdeeper research and supplementary empirical evidence. In this vein, our findings enable a richerunderstanding of the underlying effects that the distinct CVF OC typologies exert on OA.
An important finding deals with the positive effect found between adhocracy culture and OA.This is in line with prior related studies that have labelled agile organizations as highly adaptive andflexible. Actually, Sherehiy et al. [23] describe OA as a firm’s ability to adjust and respond to changes inthe environment, entailing a prevalence of external focus and change. This finding also fits with priorstudies’ empirical support of the adhocracy culture being an important precondition for innovationsuccess [28]. The adhocracy culture, due to its lack of bureaucratization and complexity, enables theorganization to be flexible and to rapidly reconfigure resources and processes. This fact providesa strong success basis for companies operating in dynamic environments.
This paper has also supported the clan culture’s positive relationship with OA, though it is notas strong as that of the adhocratic type. An explanation of this result can be found in the clan’s deepfocus on internal aspects (loyalty, teamwork, shared goals and values) that would lead to relaxingthe vigilance of environmental dynamics. However, this clan culture gathers together managementpractices and values that are intrinsically linked to what an agile organization must be: managerswho enable self-organizing teams, different ways of coordinating work (dynamic linking), continuousimprovement, radical transparency and communication awareness [93].
On the other hand, contrary to expectations, this study did not find a negative link betweenhierarchy culture and OA but a positive significant effect. This finding was certainly unexpectedand suggests that certain features inherent to hierarchy culture lead to more agile organizations. Webelieve that this is an interesting finding, since it denotes that although adaptability and flexibility arefundamental features that shape agile organizations, these firms may also benefit from a certain degreeof stability, control and order, especially in a scenario of crisis and uncertainty, such as that in whichthe empirical study was conducted. Precisely, in a time of crisis, an upper-level decision providesa faster response to any threat or critical situation than a lower-level decision, which would requiretoo much time [1]. In this sense, some of the characteristic values that shape hierarchy culture are inline with some of the requirements that customers and stakeholders are demanding from firms withinthe environment described above. On occasions, in these circumstances, a company has performedbetter than its industry competitors over a sustained period of time on the basis of a strong culturefocused on keeping their customers satisfied, while remaining efficient and controlling their costs [94].Consequently, the presence of a solid and developed array of formalized structures and procedures,along with precise coordination mechanisms, may also become critical aspects when attempting toboost OA in such circumstances. Accordingly, certain aspects inherent to the attainment of OA willbenefit from a certain degree of formalization, standardization and stability, typical of this culturaltypology. Nevertheless, it must not be forgotten that although hierarchy culture may lead to short-termsuccess, it may also hinder an organization’s long-term capability to change, adapt, or innovate [94].
No evidence was found for the positive effect of the market culture on OA, contrary to whathad been hypothesized. A priori, its external focus on markets and customers’ needs could lead toimprovement of the company’s capability to capture external information and leverage it in order tooffer agile responses and seize emerging opportunities. Yet, its emphasis on control and stability ratherthan flexibility would limit this effect. This result is in line with previous studies that have empiricallytested that market culture has no significant effect on innovation [95].
Sustainability 2017, 9, 2354 18 of 23
Moreover, the results have confirmed none of the environmental contingency hypotheses relatedto the technology intensity of the industry, in the CVF typologies—OA relationship. Although thereare slight differences between the two industries considered (high-tech and medium-tech), the effectis not statistically significant. This fact may indicate that the impact of the internal organizationalfactors regarding culture on OA is sound. Every effort that the organization makes to promote culturalvalues which enhance OA will be effective, regardless of the R&D intensity of the sector. To preparethe organization internally and the people who integrate it to better face environmental challenges,become key points in organizational strategy. It is clear that “change is much easier if a culture existsthat embraces change” [31] (p. 26). Another reason that could sustain this result is that, currently,differences between the two groups (high tech and medium tech industries) are not so significant, asnew technology developments have narrowed the gap between them. As the ODCE’s scale shows fourdifferent groups (high, medium-high, medium-low and low), results could have differed if the samplehad been selected according to more technologically separate groups (high and medium-high versusmedium-low and low).
Finally, the model has shown a predictive power for the sample used in the study. In addition,enough evidence was found that supports the predictive validity (out-of-sample) of our model.The model of four cultural typologies is an adequate predictor of OA. This means that our modelprovides much more information than noise [89]. Therefore, those four cultural types are ableto accurately predict the OA variable in new interpretable observations, both in a temporal andcross-sectional manner. As a result, the satisfactory level of predictive power achieved helps to supportthe research model proposed [85].
6. Conclusions
In brief, this work is among the scant empirical studies that aim to clarify the links betweenOC typologies and OA. Hence, a theoretical model was developed which combines Cameron andQuinn’s [14] CVF of OC typologies with literature on OA. Our results stress the positive influencethat adhocracy, clan and hierarchy culture exert on OA. These findings provide some support for theconceptual premise that the four cultural typologies are just ideal categories, meaning that a companyis rather unlikely to, in isolation, reflect one single typology [96,97]. Indeed, the CVF theoristssuggest a reasonable equilibrium between reverse focuses, although certain cultural aspects maybe predominant. Agile methods illustrate this need for a reasonable balance between different butcomplementary cultural approaches, successful firms usually concentrate on a diversified mix ofvalues and cultures [19].
These findings may help managers to understand the importance of adapting their firms’ corporateculture to the aspiration of becoming more effective and agile organizations. Therefore, although weare aware of the significance of contextual factors [98] and accept that the promotion of an ideal culturetypology that could be endorsed and effective in a particular context is certainly utopian, our findingsadvocate that certain foundations intrinsic to adhocracy and hierarchy culture are actual drivers ofOA. Consequently, we praise those managers who aim to improve their companies’ level of agility tocombine the empowerment and knowledge sharing inclination, intrinsic to adhocracy culture, with therigorous formalization and coordination mechanisms that characterize hierarchy culture.
The generalizability of these results is subject to certain limitations. For instance, we acknowledgethat we only relied on managers’ perceptions and failed to collect data from other groups withinthe company. Hence, we are unable to check the possible presence of different subcultures. Second,this paper only contemplates companies operating within a single geographical context (Spain).Therefore, extrapolating these results to different contexts must be approached with some caution.Third, this is a cross-sectional study that only analyzes the relationships at a static moment and fourth,the moderation effects of technology intensity need to be assessed from different industry groupingsthat will reflect more diverse technological contexts.
Sustainability 2017, 9, 2354 19 of 23
In conclusion, contemporary, non-peaceful and uncertain business contexts, are increasinglyleading companies to face huge challenges, not only to remain successful but also to subsist. In thesesettings, scholars and managers are starting to internalize the central role of OA. Nevertheless, furtherresearch should be undertaken to investigate the main drivers or antecedents of OA and much needsto be explored with regard to the concrete actions and internal mechanisms underlying agility.
Acknowledgments: The authors acknowledge and are grateful for the cooperation and financial support providedby the Junta de Andalucía (Consejería de Economía, Innovación y Ciencia), Spain (P10-SEJ-6081), through the“Proyecto de Investigación de Excelencia P10-SEJ-6081.” The authors also express their gratitude to Galit Shmueli,Soumya Ray and Nicholas Danks (College of Technology Management, National Tsing Hua University, Taiwan)for their invaluable help in carrying out the assessment of the predictive validity of this research model.
Author Contributions: Carmen M. Felipe developed the theoretical approach to organizational agility and thecontingent effect of the technology intensity of the industry. Antonio L. Leal-Rodríguez developed the theoreticalapproach to organizational culture. Both of them jointly developed and supported the research model and therelationships hypothesized. José L. Roldán conducted the empirical analysis. All authors contributed to theconclusions, as well as writing, reading and improving the final manuscript.
Conflicts of Interest: The authors declare no conflict of interest.
References
1. Harraf, A.; Wanasika, I.; Tate, K.; Talbott, K. Organizational agility. J. Appl. Bus. Res. 2015, 31, 675–686.[CrossRef]
2. Ashrafi, N.; Xu, P.; Sathasivam, M.; Kuilboer, J.P.; Koelher, W.; Heimann, D.; Waage, F. A framework forimplementing business agility through knowledge management systems. In Proceedings of the SeventhIEEE International Conference on E-Commerce Technology Workshops, CEC 2005 Workshops, Munich, Germany,19 July 2005; IEEE: New York, NY, USA, 2005; pp. 116–121.
3. Teece, D.J.; Pisano, G.; Shuen, A. Dynamic capabilities and strategic management. Strateg. Manag. J. 1997, 18,509–533. [CrossRef]
4. Sambamurthy, V.; Bharadwaj, A.; Grover, V. Shaping agility through digital options: Reconceptualizing therole of information technology in contemporary firms. MIS Q. 2003, 27, 237–263. [CrossRef]
5. Dunlop-Hinkler, D.; Parente, R.; Marion, T.J.; Friar, J.H. The role of technology agility on business processesand organizational agilities. In Proceedings of the IEEE International Technology Management Conference, San Jose,CA, USA, 27–30 June 2011; IEEE: New York, NY, USA, 2011; pp. 67–75.
6. Nijssen, M.; Paauwe, J. HRM in turbulent times: How to achieve organizational agility? Int. J. Hum.Resour. Manag. 2012, 23, 3315–3335. [CrossRef]
7. Vinodh, S. Improvement of agility and sustainability: A case study in an Indian rotary switchesmanufacturing organisation. J. Clean. Prod. 2010, 18, 1015–1020. [CrossRef]
8. Leal-Rodríguez, A.L.; Ariza-Montes, A.J.; Morales-Fernández, E.; Albort-Morant, G. Green innovation,indeed a cornerstone in linking market requests and business performance. Evidence from the Spanishautomotive components industry. Technol. Forecast. Soc. Chang. 2017, in press. [CrossRef]
9. Pham, D.T.; Thomas, A.J. Fit manufacturing: A framework for sustainability. J. Manuf. Technol. Manag. 2011,23, 103–123. [CrossRef]
10. Ivory, S.B.; Brooks, S.B. Managing Corporate Sustainability with a paradoxical lens: Lessons from strategicagility. J. Bus. Ethics 2017, 1–15. [CrossRef]
11. Wendler, R. Dimensions of Organizational Agility in the Software and IT Service Industry—Insights froman Empirical Investigation. Commun. Assoc. Inf. Syst. 2016, 39, 439–482.
12. Crocitto, M.; Youssef, M. The human side of organizational agility. Ind. Manag. Data Syst. 2003, 103, 388–397.[CrossRef]
13. Bi, R.; Davidson, R.; Kam, B.; Smyrnios, K. Developing Organizational Agility through IT and Supply ChainCapability. J. Glob. Inf. Manag. 2013, 21, 38–55. [CrossRef]
14. Cameron, K.S.; Quinn, R.E. Diagnosing and Changing Organizational Culture: Based on the Competing ValuesFramework, 1st ed.; Addison-Wesley: Reading, MA, USA, 1999.
15. Mao, H.; Liu, S.; Zhang, J. How the effects of IT and knowledge capability on organizational agility arecontingent on environmental uncertainty and information intensity. Inf. Dev. 2015, 31, 358–382. [CrossRef]
Sustainability 2017, 9, 2354 20 of 23
16. Mintzberg, H. The Structuring of Organizations; Prentice-Hall: Upper Saddle River, NJ, USA, 1979.17. Leidner, D.E.; Kayworth, T. A review of culture in information systems research: Toward a theory of
information technology culture conflict. MIS Q. 2006, 30, 357–399. [CrossRef]18. Keskin, H.; Akgün, A.E.; Günsel, A.; Imamoglu, S.Z. The relationships between adhocracy and clan cultures
and tacit oriented KM strategy. J. Transnatl. Manag. 2005, 10, 39–53. [CrossRef]19. Cameron, K.; Quinn, R. Diagnosing and Changing Organizational Culture: Based on the Competing Values
Framework, 3rd ed.; John Wiley & Sons: San Francisco, CA, USA, 2011.20. Leal-Rodríguez, A.L.; Ariza-Montes, J.A.; Morales-Fernández, E.J.; Eldridge, S. Assessing the links between
organisational cultures and unlearning capability: Evidence from the Spanish automotive componentsindustry. Int. J. Innov. Learn. 2016, 20, 422–436. [CrossRef]
21. Deshpandé, R.; Farley, J.U.; Webster, F.E., Jr. Corporate culture, customer orientation, and innovativeness inJapanese firms: A quadrad analysis. J. Market. 1993, 57, 23–37. [CrossRef]
22. Zammuto, R.F.; Gifford, B.; Goodman, E.A. Managerial ideologies, organization culture and the outcomesof innovation: A competing values perspective. In Handbook of Organizational Culture and Climate;Askhanasy, N.H., Wilderom, C.P.M., Peterson, M.F., Eds.; Sage Publications: Thousand Oaks, CA, USA, 2000.
23. Sherehiy, B.; Karwowski, W.; Layer, J.K. A review of enterprise agility: Concepts, frameworks, and attributes.Int. J. Ind. Ergon. 2007, 37, 445–460. [CrossRef]
24. Overby, E.; Bharadwaj, A.; Sambamurthy, V. Enterprise agility and the enabling role of informationtechnology. Eur. J. Inf. Syst. 2006, 15, 120–131. [CrossRef]
25. Felipe, C.M.; Roldán, J.L.; Leal-Rodríguez, A.L. An explanatory and predictive model for organizationalagility. J. Bus. Res. 2016, 69, 4624–4631. [CrossRef]
26. Charbonnier-Voirin, A. The development and partial testing of the psychometric properties of a measurementscale of organizational agility. Management 2011, 14, 119–156.
27. Boothby, D.; Dufour, A.; Tang, J. Technology adoption, training and productivity performance. Res. Policy2010, 39, 650–661. [CrossRef]
28. Matzler, K.; Abfalter, D.E.; Mooradian, T.A.; Bailom, F. Corporate Culture as an Antecedent of SuccessfulExploration and Exploitation. Int. J. Innov. Manag. 2013, 17, 1350025. [CrossRef]
29. Büschgens, T.; Bausch, A.; Balkin, D.B. Organizational culture and innovation: A meta-analytic review.J. Prod. Innov. Manag. 2013, 30, 763–781. [CrossRef]
30. Worley, C.G.; Lawler, E.E. Agility and Organization Design: A Diagnostic Framework. Org. Dyn. 2010, 39,194–204. [CrossRef]
31. Iivari, J.; Iivari, N. The relationship between organizational culture and the deployment of agile methods.Inf. Softw. Technol. 2011, 53, 509–520. [CrossRef]
32. Van Oosterhout, M.; Waarts, E.; van Hillegersberg, J. Change factors requiring agility and implications for IT.Eur. J. Inf. Syst. 2006, 15, 132–145. [CrossRef]
33. Teece, D.; Peteraf, M.; Leih, S. Dynamic Capabilities and Organizational Agility: Risk, Uncertainty,and Strategy in the Innovation Economy. Calif. Manag. Rev. 2016, 58, 13–35. [CrossRef]
34. Buckley, J.W.; Lightner, K.M. Accounting: An Information Systems Approach; Dickenson Publishing Company:Encino, LA, USA, 1973.
35. Becerra-Fernandez, I.; Leidner, D.E. Knowledge Management and Organizational Culture. In KnowledgeManagement: An Evolutionary View. Advances in Management Information System; Becerra-Fernandez, I.,Leidner, D., Eds.; M.E. Sharpe, Inc.: Amonk, NY, USA, 2008; Volume 12, pp. 40–60.
36. Cai, Z.; Huang, Q.; Liu, H.; Davison, R.M.; Liang, L. Developing Organizational Agility through IT Capabilityand KM Capability: The Moderating Effects of Organizational Climate. In Proceedings of the 17th PacificAsia Conference on Information Systems (PACIS), Jeju Island, Korea, 18–22 June 2013.
37. Barney, J. Firm Resources and Sustained Competitive Advantage. J. Manag. 1991, 17, 99–120. [CrossRef]38. Peteraf, M.A. The corner-stones of competitive advantage: A resource-based view. Strateg. Manag. J. 1993,
14, 179–191. [CrossRef]39. Wilden, R.; Gudergan, S.P.; Nielsen, B.B.; Lings, I. Dynamic Capabilities and Performance: Strategy, Structure
and Environment. Long Range Plan. 2013, 46, 72–96. [CrossRef]40. Sarkar, M.B.; Echambadi, R.; Agarwal, R.; Sen, B. The effect of the innovative environment on exit of
entrepreneurial firms. Strateg. Manag. J. 2006, 27, 519–539. [CrossRef]
Sustainability 2017, 9, 2354 21 of 23
41. Smith, K. Industrial structure, technology intensity and growth: Issues for policy. In Proceedings of theDRUID Conference on National Innovation Systems, Industrial Dynamics and Innovation Policy, Rebild,Denmark, 9–12 June 1999.
42. Sáez-Martínez, F.J.; González-Moreno, Á. Strategic Renewal, Cooperation, and Performance: A ContingencyApproach. J. Manag. Strategy 2011, 2, 43–55. [CrossRef]
43. Xiao, Y.; Tylecote, A.; Liu, J. Why not greater catch-up by Chinese firms? The impact of IPR, corporategovernance and technology intensity on late-comer strategies. Res. Policy 2013, 42, 749–764. [CrossRef]
44. Sandven, T.; Smith, K.; Kaloudis, A. Structural change, growth and innovation: The roles of mediumand low tech industries, 1980–2000. In Low-Tech Innovation in the Knowledge Economy; Hirsch-Kreinsen, H.,Jacobson, D., Laestadius, S., Eds.; Peter Lang: Frankfurt, Germany, 2005; pp. 31–59.
45. OECD. Science, Technology and Industry Scoreboard—Towards a Knowledge Based Economy; OECD: Paris,France, 2001.
46. Thamhain, H.J. Management of Technology: Managing Effectively in Technology-Intensive Organizations; JohnWiley & Sons: Hoboken, NJ, USA, 2013.
47. Garcés-Galdeano, L.; Larraza-Kintana, M.; García-Olaverri, C.; Makri, M. Entrepreneurial orientation infamily firms: The moderating role of technological intensity and performance. Int. Entrep. Manag. J. 2016, 12,27–45. [CrossRef]
48. Sadegh Sharifirad, M.; Ataei, V. Organizational culture and innovation culture: Exploring the relationshipsbetween constructs. Leadersh. Org. Dev. J. 2012, 33, 494–517. [CrossRef]
49. Neirotti, P.; Paolucci, E. Industry and firm effects on IT diffusion processes: Firm-level evidence in Italianenterprises. Ind. Corp. Chang. 2014, 23, 717–757. [CrossRef]
50. He, X.; Chakrabarty, S.; Eden, L. The global emergence of Chinese multinationals: A resource-based view ofownership and performance. Asian Bus. Manag. 2016, 15, 1–31. [CrossRef]
51. Prajogo, D.; McDermott, C.; Jayaram, J. The role of technological intensity in services on the capability toperformance relationships—An examination in the Australian context. J. Eng. Technol. Manag. 2014, 31,58–72. [CrossRef]
52. Lepak, D.; Takeuchi, R.; Snell, S. Employment flexibility and firm performance: Examining the interactioneffects of employment mode, environmental dynamism, and technological intensity. J. Manag. 2003, 29,681–703.
53. Cotec. Tecnología e innovación en España. Informe COTEC 2009; Fundación Cotec: Madrid, Spain, 2009.54. Hair, J.F.; Hult, G.T.M.; Ringle, C.M.; Sarstedt, M. A Primer on Partial Least Squares Structural Equation Modeling
(PLS-SEM), 2nd ed.; SAGE Publications: Thousand Oaks, CA, USA, 2017.55. Faul, F.; Erdfelder, A.; Buchner, A.; Lang, A.G. Statistical Power Analyses Using G*Power 3.1: Tests for
Correlation and Regression Analyses. Behav. Res. Methods 2009, 41, 1149–1160. [CrossRef] [PubMed]56. Cohen, J. Statistical Power Analysis for the Behavioral Sciences, 2nd ed.; Lawrence Erlbaum Associated: Hillsdale,
NJ, USA, 1998.57. Henseler, J.; Dijkstra, T.K.; Sarstedt, M.; Ringle, C.M.; Diamantopoulos, A.; Straub, D.W.; Ketchen, D.J.;
Hair, J.F.; Hult, G.T.M.; Calantone, R.J. Common Beliefs and Reality About PLS: Comments on Ronkko andEvermann (2013). Org. Res. Methods 2014, 17, 182–209. [CrossRef]
58. Henseler, J.; Ringle, C.M.; Sarstedt, M. Testing measurement invariance of composites using partial leastsquares. Int. Market. Rev. 2016, 33, 405–431. [CrossRef]
59. Henseler, J. Bridging design and behavioral research with variance-based structural equation modeling.J. Advert. 2017, 46, 178–192. [CrossRef]
60. Lu, Y.; Ramamurthy, K. Understanding the link between information technology capability andorganizational agility: An empirical examination. MIS Q. 2011, 35, 931–954. [CrossRef]
61. Yang, C.; Liu, H.M. Boosting firm performance via enterprise agility and network structure. Manag. Decis.2012, 50, 1022–1044. [CrossRef]
62. Bradley, R.V.; Pratt, R.M.; Byrd, T.A.; Outlay, C.N.; Wynn, D.E., Jr. Enterprise architecture, IT effectivenessand the mediating role of IT alignment in US hospitals. Inf. Syst. J. 2012, 22, 97–127. [CrossRef]
63. Tallon, P.P.; Pinsonneault, A. Competing perspectives on the link between strategic information technologyalignment and organizational agility: Insights from a mediation model. MIS Q. 2011, 35, 463–486. [CrossRef]

Sustainability 2017, 9, 2354 22 of 23
64. Roldán, J.L.; Sánchez-Franco, M.J. Variance-based structural equation modelling: Guidelines for using partialleast squares in information systems research. In Research Methodologies, Innovations and philosophies in SoftwareSystems Engineering and Information Systems; Mora, M., Steenkamp, A.L., Gelman, O., Raisinghani, M.S., Eds.;IGI Global: Hershey, PA, USA, 2012; pp. 193–221.
65. Rigdon, E.E. Rethinking Partial Least Squares Path Modeling: In Praise of Simple Methods. Long Range Plan.2012, 45, 341–358. [CrossRef]
66. Becker, J.-M.; Rai, A.; Rigdon, E. Predictive validity and formative measurement in structural equationmodeling: Embracing practical relevance. In Proceedings of the Thirty Fourth International Conference onInformation Systems, Milan, Italy, 15–18 December 2013.
67. Sarstedt, M.; Hair, J.F.; Ringle, C.M.; Thiele, K.O.; Gudergan, S.P. Estimation issues with PLS and CBSEM:Where the bias lies! J. Bus. Res. 2016, 69, 3998–4010. [CrossRef]
68. Rigdon, E.E. Choosing PLS path modeling as analytical method in European management research: A realistperspective. Eur. Manag. J. 2016, 34, 598–605. [CrossRef]
69. Chin, W.W. How to write up and report PLS analyses. In Handbook of Partial Least Squares; Springer:Berlin/Heidelberg, Germany, 2010; pp. 655–690.
70. Wright, R.T.; Campbell, D.E.; Thatcher, J.B.; Roberts, N. Operationalizing multidimensional constructs instructural equation modeling: Recommendations for IS research. Commun. Assoc. Inf. Syst. 2012, 30, 367–412.
71. Hair, J.F.; Ringle, C.M.; Sarstedt, M. PLS-SEM: Indeed a silver bullet. J. Market. Theory Pract. 2011, 19, 139–152.[CrossRef]
72. Ringle, C.M.; Wende, S.; Becker, J.-M. SmartPLS 3; SmartPLS GmbH: Boenningstedt, Germany, 2015.73. Podsakoff, P.M.; MacKenzie, S.B.; Lee, J.-Y.; Podsakoff, N.P. Common method biases in behavioral research:
A critical review of the literature and recommended remedies. J. Appl. Psychol. 2003, 88, 879–903. [CrossRef][PubMed]
74. Schwarz, A.; Rizzuto, T.; Carraher-Wolverton, C.; Roldán, J.L.; Barrera-Barrera, R. Examining the Impact andDetection of the “Urban Legend” of Common Method Bias. DATA BASE Adv. Inf. Syst. 2017, 48, 93–119.[CrossRef]
75. Podsakoff, P.M.; MacKenzie, S.B.; Podsakoff, N.P. Sources of Method Bias in Social Science Research andRecommendations on How to Control It. Annu. Rev. Psychol. 2012, 63, 539–569. [CrossRef] [PubMed]
76. Kock, N. Common method bias in PLS-SEM: A full collinearity assessment approach. Int. J. E-Collab. 2015,11, 1–10. [CrossRef]
77. Kock, N.; Lynn, G.S. Lateral Collinearity and Misleading Results in Variance-Based SEM: An Illustration andRecommendations. J. Assoc. Inf. Syst. 2012, 13, 546–580.
78. Henseler, J.; Ringle, C.M.; Sarstedt, M. A new criterion for assessing discriminant validity in variance-basedstructural equation modeling. J. Acad. Market. Sci. 2015, 43, 115–135. [CrossRef]
79. Urbach, N.; Ahlemann, F. Structural equation modeling in information systems research using partial leastsquares. JITTA J. Inf. Technol. Theory Appl. 2010, 11, 5.
80. Petter, S.; Straub, D.; Rai, A. Specifying formative constructs in information systems research. MIS Q. 2007,31, 623–656. [CrossRef]
81. Chin, W.W. The partial least squares approach to structural equation modeling. Mod. Methods Bus. Res. 1998,295, 295–336.
82. Henseler, J.; Fassott, G. Testing moderating effects in PLS path models: An illustration of available procedures.In Handbook of Partial Least Squares; Springer: Berlin/Heidelberg, Germany, 2010; pp. 713–735.
83. Chin, W.W.; Dibbern, J. An introduction to a permutation based procedure for multi-group PLS analysis:Results of tests of differences on simulated data and a cross cultural analysis of the sourcing ofinformation system services between Germany and the USA. In Handbook of Partial Least Squares; Springer:Berlin/Heidelberg, Germany, 2010; pp. 171–193.
84. Shmueli, G.; Koppius, O. Predictive Analytics in Information Systems Research. MIS Q. 2011, 35, 553–572.[CrossRef]
85. Straub, D.; Boudreau, M.C.; Gefen, D. Validation Guidelines for IS Positivist Research. Commun. Assoc.Inf. Syst. 2004, 13, 380–427.
86. Shmueli, G.; Ray, S.; Velasquez Estrada, J.M.; Chatla, S.B. The elephant in the room: Predictive performanceof PLS models. J. Bus. Res. 2016, 69, 4552–4564. [CrossRef]
Sustainability 2017, 9, 2354 23 of 23
87. SmartPLS. PLS Predict SmartPLS. 2017. Available online: https://www.smartpls.com/documentation/algorithms-and-techniques/predict (accessed on 10 October 2017).
88. Danks, N.; Ray, S.; Shmueli, G. Evaluating the Predictive Performance of Constructs in PLS Path Modeling(Working Paper October 18, 2017). Available online: https://papers.ssrn.com/sol3/papers.cfm?abstract_id=3055222 (accessed on 19 October 2017).
89. Woodside, A.G. Moving beyond multiple regression analysis to algorithms: Calling for adoption ofa paradigm shift from symmetric to asymmetric thinking in data analysis and crafting theory. J. Bus. Res.2013, 66, 463–472. [CrossRef]
90. Narasimhan, R.; Das, A. Manufacturing agility and supply chain management practices. Prod. InventoryManag. J. 1999, 40, 4.
91. Kidd, P.T. Agile Manufacturing: A Strategy for the 21st Century. In Proceedings of the IEE Colloquium onAgile Manufacturing (Digest No. 1995/179), Coventry, UK, 26 October 1995; pp. 1/1–1/6.
92. Chan, Y.; Denford, J.; Wang, J. The Influence of IT and Knowledge on Firm Agility and Performance.In Proceedings of the 21st Americas Conference on Information Systems (AMCIS), Fajardo, Puerto Rico,13–15 August 2015; pp. 1–14.
93. Denning, S. Why Agile can be a game changer for managing continuous innovation in many industries.Strategy Leadersh. 2013, 41, 5–11. [CrossRef]
94. Boisnier, A.; Chatman, J.A. The role of subcultures in the agile organization. In Leading and Managing Peoplein the Dynamic Organization; Peterson, R.S., Mannix, E.A., Eds.; Lawrence Erlbaum Associates, Publishers:Mahwah, NJ, USA, 2003; pp. 87–112.
95. Sanz-Valle, R.; Naranjo-Valencia, J.C.; Jiménez-Jiménez, D.; Perez-Caballero, L. Linking organizationallearning with technical innovation and organizational culture. J. Knowl. Manag. 2011, 15, 997–1015.[CrossRef]
96. Denison, D.R.; Spreitzer, G.M. Organizational culture and organizational development: A competing valuesapproach. Res. Org. Chang. Dev. 1991, 5, 1–21.
97. Roldán, J.L.; Leal-Rodríguez, A.L.; Leal, A.G. The influence of organizational culture on the Total QualityManagement programme performance. Investigaciones Europeas de Dirección y Economía de la Empresa 2012, 18,183–189. [CrossRef]
98. Lawrence, P.R.; Lorsch, J.W. Differentiation and integration in complex organizations. Adm. Sci. Q. 1967, 12,1–47. [CrossRef]
© 2017 by the authors. Licensee MDPI, Basel, Switzerland. This article is an open accessarticle distributed under the terms and conditions of the Creative Commons Attribution(CC BY) license (http://creativecommons.org/licenses/by/4.0/).