Organizational culture and academic staff job satisfaction
106
ADDIS ABABA UNIVERSITY SCHOOL OF GRADUATE STUDIES ORGANIZATIONAL CULTURE AND ACADEMIC STAFF JOB SATISFACTION AT St. MARY’S UNIVERSITY COLLEGE BY HENOCK BEYENE TESFATSION APRIL 2011 ADDIS ABABA
-
Upload
independent -
Category
Documents
-
view
5 -
download
0
Transcript of Organizational culture and academic staff job satisfaction
ADDIS ABABA UNIVERSITY SCHOOL OF GRADUATE STUDIES
ORGANIZATIONAL CULTURE AND ACADEMIC STAFF JOB SATISFACTION AT St. MARY’S UNIVERSITY COLLEGE
BY HENOCK BEYENE TESFATSION
APRIL 2011 ADDIS ABABA
ORGANIZATIONAL CULTURE AND ACADEMIC STAFF JOB
SATISFACTION AT St. MARY’S UNIVERSITY COLLEGE
BY HENOCK BEYENE TESFATSION
A THESIS SUBMITTED TO THE SCHOOL OF GRADUATE STUDIES OF ADDIS ABABA UNIVERSITY IN PARTIAL FULFILLMENT OF THE REQUIREMENTS FOR THE DEGREE OF MASTER OF ARTS IN
EDUCATIONAL PLANNING AND MANAGEMEMENT: HUMAN RESOURCE AND ORGANIZATIONAL DEVELOPMENT
ADDIS ABABA UNIVERSITY SCHOOL OF GRADUATE STUDIES
APRIL 2011 ADDIS ABABA
ORGANIZATIONAL CULTURE AND ACADEMIC STAFF JOB
SATISFACTION AT St. MARY’S UNIVERSITY COLLEGE
BY HENOCK BEYENE TESFATSION
ADDIS ABABA UNIVERSITY SCHOOL OF GRADUATE STUDIES
Approved by Board of Examiners:
1._________________________________ _____________ ___________
Department Chairperson Signature Date
2. Befekadu Zeleke (Asst.prof) _____________ ___________
Advisor, Chairperson Graduate Committee Signature Date
3._________________________________ _____________ ___________
Examiner Signature Date

i
ACKNOWLEDGEMENTS
First, I would like to express my appreciation to my homie and best friend GOD, the Most
Merciful and, the Most Compassionate who has granted me the ability, opportunity and willing to
start and complete my study. Although, my pipedream seems to fade away, he turned my life
around and gives me hope in unthinkable and most miraculous way. Without his permission, for
sure I cannot make it possible.
I would like to thank everyone who has been involved and supported me through the writing of
this study. I express my heartfelt appreciation to my advisor Ato Befekadu Zeleke, for his
guidance, leadership, and patience throughout the conceptualization, implementation, and writing
of this research paper. Under his direction, I have grown professionally and personally. I am truly
humbled by his example. Without him, I would not be able to recognize the value of research.
I would also like to thank my best friend, Yamalaksira Shewangzaw, for the recommendations
and time he devoted to my educational growth. He had provided a professional example of
academic success and encouraged my academic growth toward this goal. His weekly support and
encouragement enabled me to stay focused and carry on. I owe him more than he know.
I am also grateful to my family and friends who have been so encouraging during the past five
years. I especially thank and dedicate this paper for my deceased father Beyene Tesfasion and my
sweet mother Genet Abreha who had always supported me, in some way or another, and any
success I have obtained I owe to their love and support. They always believe in me and being
their son is my greatest success.
I would also like to thank my heart, liver, blood vessel and all in all my everything sister
Samrawit Beyene for always being their for me. Words cannot express my appreciation for her.
Finally, I could not have accomplished this research without the participation of all St Mary’s
University College staff, and I deeply appreciate those who completed the survey.
ii
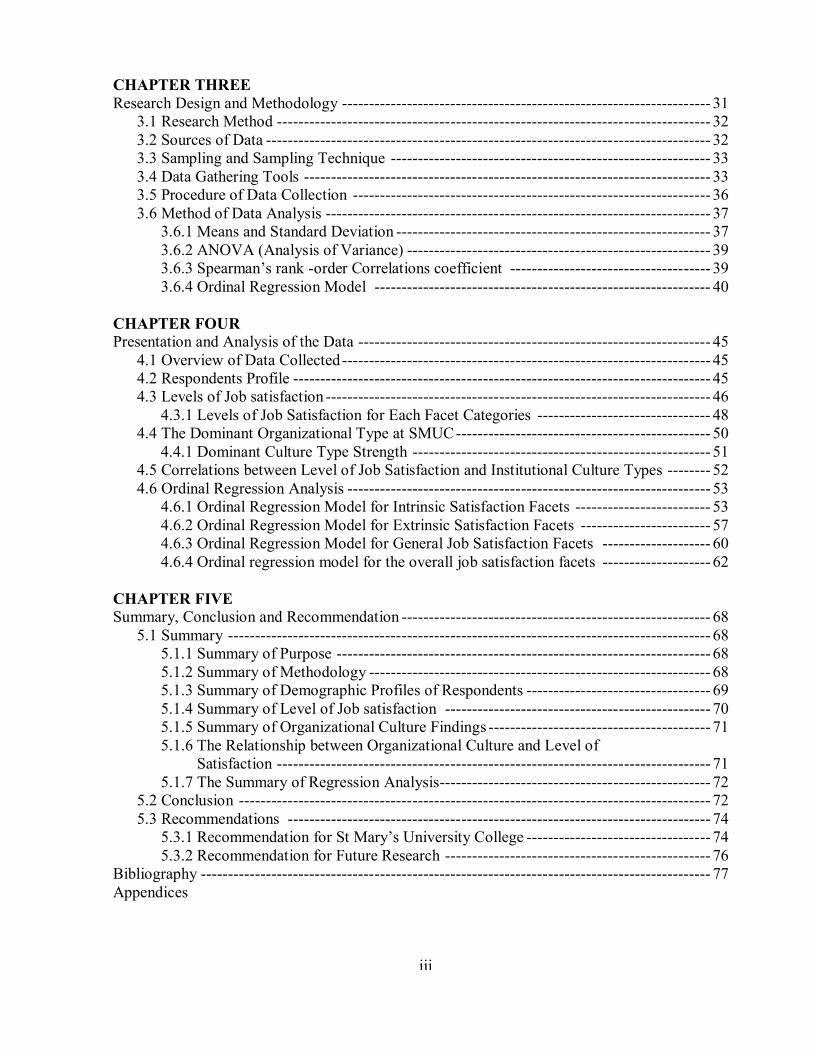
TABLE OF CONTENTS
Contents Page Acknowledgements -------------------------------------------------------------------------------------- i Table of Contents ----------------------------------------------------------------------------------------- ii List of Tables --------------------------------------------------------------------------------------------- iv List of Figures -------------------------------------------------------------------------------------------- v Abbreviations and/or Acronyms ------------------------------------------------------------------------ vi Abstract ---------------------------------------------------------------------------------------------------- vii CHAPTER ONE Introduction ----------------------------------------------------------------------------------------------- 1
1.1 Background of the Study ----------------------------------------------------------------------- 1 1.2 Statement of the Problem ----------------------------------------------------------------------- 3 1.3 Objectives of the Study ------------------------------------------------------------------------- 5 1.4 Significance of the Study ----------------------------------------------------------------------- 5 1.5 Delimitation/Scope of the Study --------------------------------------------------------------- 5 1.6 Limitation of the Study ------------------------------------------------------------------------- 6 1.7 Definition of Terms ----------------------------------------------------------------------------- 6 1.8 Organization of the Study ---------------------------------------------------------------------- 7
CHAPTER TWO Review of Related Literature --------------------------------------------------------------------------- 8
2.1 Organizational Culture ------------------------------------------------------------------------- 8 2.1.1 The Concept of Organizational Culture ------------------------------------------------ 8 2.1.2 The Functions of Culture ----------------------------------------------------------------- 9 2.1.3 Person-Organizational Culture Fit ------------------------------------------------------ 10 2.1.4 Typologies of Organizational Culture -------------------------------------------------- 11 2.1.5 Assessing Organizational Culture ------------------------------------------------------- 14 2.1.6 Culture as a Descriptive Term ----------------------------------------------------------- 15 2.1.7 Do Organizations have Uniform Culture? --------------------------------------------- 16 2.1.8 Strong versus Weak Cultures ------------------------------------------------------------ 16 2.1.9 University Culture ------------------------------------------------------------------------ 17
2.2 Job Satisfaction --------------------------------------------------------------------------------- 18 2.2.1 Meaning of Job Satisfaction ------------------------------------------------------------ 18 2.2.2 Importance of Job Satisfaction ---------------------------------------------------------- 19 2.2.3 Theories of Job Satisfaction ------------------------------------------------------------- 19 2.2.4 Measurement of Job Satisfaction -------------------------------------------------------- 22 2.2.5 Teachers Job Satisfaction ---------------------------------------------------------------- 24
2.3 Organizational Culture and Job Satisfaction ------------------------------------------------- 26 2.4 Theoretical Framework ------------------------------------------------------------------------- 28
iii
CHAPTER THREE Research Design and Methodology -------------------------------------------------------------------- 31
3.1 Research Method -------------------------------------------------------------------------------- 32 3.2 Sources of Data ---------------------------------------------------------------------------------- 32 3.3 Sampling and Sampling Technique ----------------------------------------------------------- 33 3.4 Data Gathering Tools --------------------------------------------------------------------------- 33 3.5 Procedure of Data Collection ------------------------------------------------------------------ 36 3.6 Method of Data Analysis ----------------------------------------------------------------------- 37
3.6.1 Means and Standard Deviation ---------------------------------------------------------- 37 3.6.2 ANOVA (Analysis of Variance) -------------------------------------------------------- 39 3.6.3 Spearman’s rank -order Correlations coefficient ------------------------------------- 39 3.6.4 Ordinal Regression Model -------------------------------------------------------------- 40
CHAPTER FOUR Presentation and Analysis of the Data ----------------------------------------------------------------- 45
4.1 Overview of Data Collected -------------------------------------------------------------------- 45 4.2 Respondents Profile ----------------------------------------------------------------------------- 45 4.3 Levels of Job satisfaction ----------------------------------------------------------------------- 46
4.3.1 Levels of Job Satisfaction for Each Facet Categories -------------------------------- 48 4.4 The Dominant Organizational Type at SMUC ----------------------------------------------- 50
4.4.1 Dominant Culture Type Strength ------------------------------------------------------- 51 4.5 Correlations between Level of Job Satisfaction and Institutional Culture Types -------- 52 4.6 Ordinal Regression Analysis ------------------------------------------------------------------- 53
4.6.1 Ordinal Regression Model for Intrinsic Satisfaction Facets ------------------------- 53 4.6.2 Ordinal Regression Model for Extrinsic Satisfaction Facets ------------------------ 57 4.6.3 Ordinal Regression Model for General Job Satisfaction Facets -------------------- 60 4.6.4 Ordinal regression model for the overall job satisfaction facets -------------------- 62
CHAPTER FIVE Summary, Conclusion and Recommendation --------------------------------------------------------- 68
5.1 Summary ----------------------------------------------------------------------------------------- 68 5.1.1 Summary of Purpose --------------------------------------------------------------------- 68 5.1.2 Summary of Methodology --------------------------------------------------------------- 68 5.1.3 Summary of Demographic Profiles of Respondents ---------------------------------- 69 5.1.4 Summary of Level of Job satisfaction ------------------------------------------------- 70 5.1.5 Summary of Organizational Culture Findings ----------------------------------------- 71 5.1.6 The Relationship between Organizational Culture and Level of Satisfaction -------------------------------------------------------------------------------- 71 5.1.7 The Summary of Regression Analysis-------------------------------------------------- 72
5.2 Conclusion --------------------------------------------------------------------------------------- 72 5.3 Recommendations ------------------------------------------------------------------------------ 74
5.3.1 Recommendation for St Mary’s University College ---------------------------------- 74 5.3.2 Recommendation for Future Research ------------------------------------------------- 76
Bibliography ---------------------------------------------------------------------------------------------- 77 Appendices
iv
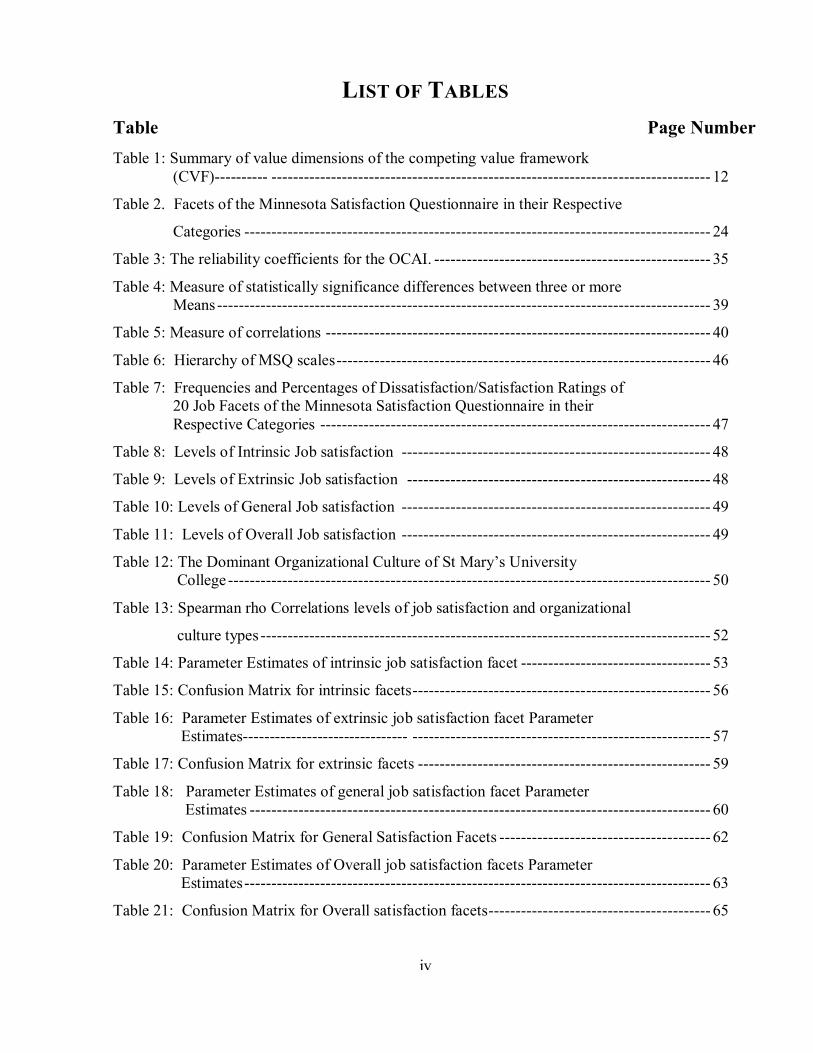
LIST OF TABLES Table Page Number Table 1: Summary of value dimensions of the competing value framework (CVF)---------- --------------------------------------------------------------------------------- 12
Table 2. Facets of the Minnesota Satisfaction Questionnaire in their Respective
Categories -------------------------------------------------------------------------------------- 24
Table 3: The reliability coefficients for the OCAI. --------------------------------------------------- 35
Table 4: Measure of statistically significance differences between three or more Means ------------------------------------------------------------------------------------------- 39
Table 5: Measure of correlations ----------------------------------------------------------------------- 40
Table 6: Hierarchy of MSQ scales --------------------------------------------------------------------- 46
Table 7: Frequencies and Percentages of Dissatisfaction/Satisfaction Ratings of 20 Job Facets of the Minnesota Satisfaction Questionnaire in their Respective Categories ------------------------------------------------------------------------ 47
Table 8: Levels of Intrinsic Job satisfaction --------------------------------------------------------- 48
Table 9: Levels of Extrinsic Job satisfaction -------------------------------------------------------- 48
Table 10: Levels of General Job satisfaction --------------------------------------------------------- 49
Table 11: Levels of Overall Job satisfaction --------------------------------------------------------- 49
Table 12: The Dominant Organizational Culture of St Mary’s University College ----------------------------------------------------------------------------------------- 50
Table 13: Spearman rho Correlations levels of job satisfaction and organizational
culture types ----------------------------------------------------------------------------------- 52
Table 14: Parameter Estimates of intrinsic job satisfaction facet ----------------------------------- 53
Table 15: Confusion Matrix for intrinsic facets ------------------------------------------------------- 56
Table 16: Parameter Estimates of extrinsic job satisfaction facet Parameter Estimates------------------------------- ------------------------------------------------------- 57
Table 17: Confusion Matrix for extrinsic facets ------------------------------------------------------ 59
Table 18: Parameter Estimates of general job satisfaction facet Parameter Estimates ------------------------------------------------------------------------------------- 60
Table 19: Confusion Matrix for General Satisfaction Facets --------------------------------------- 62
Table 20: Parameter Estimates of Overall job satisfaction facets Parameter Estimates -------------------------------------------------------------------------------------- 63
Table 21: Confusion Matrix for Overall satisfaction facets ----------------------------------------- 65
v
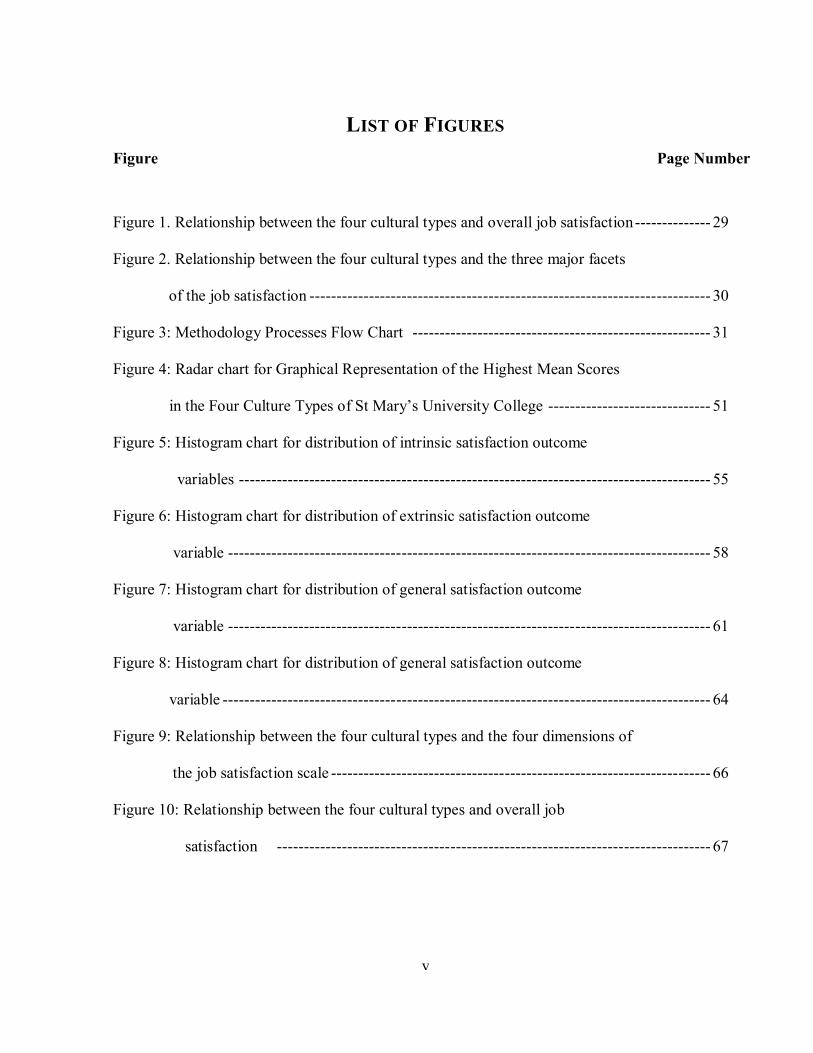
LIST OF FIGURES Figure Page Number
Figure 1. Relationship between the four cultural types and overall job satisfaction -------------- 29
Figure 2. Relationship between the four cultural types and the three major facets
of the job satisfaction -------------------------------------------------------------------------- 30
Figure 3: Methodology Processes Flow Chart ------------------------------------------------------- 31
Figure 4: Radar chart for Graphical Representation of the Highest Mean Scores
in the Four Culture Types of St Mary’s University College ------------------------------ 51
Figure 5: Histogram chart for distribution of intrinsic satisfaction outcome
variables --------------------------------------------------------------------------------------- 55
Figure 6: Histogram chart for distribution of extrinsic satisfaction outcome
variable ----------------------------------------------------------------------------------------- 58
Figure 7: Histogram chart for distribution of general satisfaction outcome
variable ----------------------------------------------------------------------------------------- 61
Figure 8: Histogram chart for distribution of general satisfaction outcome
variable ------------------------------------------------------------------------------------------ 64
Figure 9: Relationship between the four cultural types and the four dimensions of
the job satisfaction scale ---------------------------------------------------------------------- 66
Figure 10: Relationship between the four cultural types and overall job
satisfaction -------------------------------------------------------------------------------- 67
vi
ABBRIVATIONS AND/OR ACRONYMS
ANOVA = Analysis of Variance
ASHE = Association for Study of Higher Education
CVF = Competing Values Framework
MSQ = Minnesota Satisfaction Questionnaire
OCAI = Organizational Culture Assessment Instrument
P-O = Person Organization Fit
SMUC = St Mary’s University College
SPSS = Statistical Package for the Social Sciences
vii
ABSTRACT
The main purpose of this study was to examine and gain a better appreciation of the relationships between the pattern of organizational culture and employees’ job satisfaction among academic staffs in a private higher educational institution context. A census of all academic staffs, who were working in the 2010-2011 academic year, were taken for the study from the study organization−St. Mary’s University College. Data regarding organizational culture and job satisfaction was collected using the OCAI (Cameron & Quinn, 1999), and Minnesota Job Satisfaction Questionnaire (Weiss, Davis, England & Lofquist, 1967), respectively. The Data was then analyzed by using the latest version of statistical package for the social sciences (SPSS) software. Two types of statistics, namely descriptive and inferential statistic was employed. While the research was expected to leverage on such descriptive statistical tools as frequency, mean, percentile and standard deviation, it also applied inferential statistics through anova, spearman rho correlations and ordinal regression model analysis. The findings of the present study revealed SMUC tended to emphasize hierarchy culture. The results of this study also suggest that the hierarchy culture has a negative significant influence on overall teacher’s job satisfaction and satisfaction with intrinsic, extrinsic and general satisfaction facets. Thus, since hierarchy culture negatively affects morale of instructors, it is then recommended that the university college should diagnose and change its organizational culture as it is desired by its staff. The desired culture type in most universities is clan culture which is characterized by people-orientation, encouragement, equitability, trust, and allowing of greater academic freedom. Underpinned by a model adapted to the research purpose, the study complemented not only to the existing knowledge in the area, but it also contributed to the fact that there was no research made in non-western countries like Ethiopia over this interesting and potentially rich area.
1
CHAPTER ONE
INTRODUCTION 1.1 Background of the Study Job satisfaction of faculty is an important issue for institutions of higher education aiming for
excellence and diversity. However, an essential first step in understanding this phenomenon is to
examine what contributes to career satisfaction for academicians. Universities attempt to hire the
highest quality faculty they can, but they are not always successful at retaining them.
Furthermore, many organizations in Africa are plagued by poor performance, high turnover rates,
and low productivity, largely due to the negative work attitudes of the workforce (Okpara, 2010).
It is believed that organizational culture could some how affect the level of Job satisfaction. As a
result of the importance of organizational culture and its effects on organizational outcomes (such
as organizational commitment, job satisfaction and employee performance), it is currently one of
the newest research topics in both academic research and the reputable business journals.
Research has confirmed, Yusof & Ali (2000), as cited in Bashayreh (2009), that organizational
culture is not only able to change, guide and display but also give significant contributions by
influencing the thought, feeling, interacting and performance in the organization. Although
ongoing research is still required, employee attitudes have been found to interact with
environmental factors that influence job satisfaction. Job satisfaction is important to investigate
because it is related to employee turnover, and time missed.
Organizational culture stands as the center from which all other factors of human resource
management derive (Bashayreh, 2009). It is believed that culture influences individuals’ attitudes
concerning outcomes, such as commitment, motivation, morale, and satisfaction. Moreover,
Cameroon and Quinn (2006) indicated that clan-type cultures are most effective in domains of
performance relating to morale, satisfaction and internal communication and supportiveness.
Lund (2003), had found that job satisfaction was positively related to clan and adhocracy cultures
and negatively related to market and hierarchy cultures. In addition, Choi, Martin, and Park
(2008), found that the clan culture is the most desired cultural type to increase employees’ job
satisfaction as well as motivation for achieving organizational success.
2
Despite the existence of considerable body of organizational literature that has been conducted to
examine the relationship between corporate culture and employees satisfaction in various
countries as well as industries (for example, Lund, 2003; Bashayreh,2009; Choi and others,2008),
there is no literature that recognizes organizational culture studies within the context of either
private or public higher learning institutions in Ethiopia, particularly on how job satisfaction
amongst employees is affected by organizational culture patterns.
Background of the Organization
Brief History
St. Mary’s University College (SMCU) is an outgrowth of St. Mary’s Language School and
established in 1998 under St. Mary’s General Education Development PLC with its head office in
Awassa and a branch in Addis Ababa. Then, the College moved its head office to Addis Ababa,
Lideta Campus, in 1999 and opened the Department of Secretarial Science and Office
Management (SSOM). In September 2002, the institution made stride by employing new staff
members and renting a new building at Maichew Square, beside the Wabe-Shebelle Hotel, where
its head office is located at present. The Mexico (Main) Campus, which houses the various
academic and administrative offices of the University College, including the Office of the
President, the Academic Vice President, and the Administrative Vice President, is located
adjacent to Wabe-Shebelle Hotel. SMUC is constructing its own building in the compound of the
Distance Education Division and this is among the activities to be carried out in the coming five
years.
Vision, Mission, and Goals
The vision of St. Mary’s University College (SMUC) is to become among the leading higher
education centers of academic excellence in teaching-learning, research, publications and
community services, and in effect, contribute to Ethiopia’s development. Its Mission is to offer
regular, continuing and distance education accessible to the society with reasonable tuition and
scholarships, and with optimal focus on quality and standards in teaching, research, and services
that contribute to Ethiopia’s human resource development. It also aims at offering quality higher
education, training, and services, conducting research and publications that exceed the
requirements of students and stakeholders, and nurturing sustained and mutually beneficial
relationship with them.

3
Programs in SMUC
SMUC offers undergraduate and joint graduate programmes in many fields of studies. Excluding
the Distance Education Division, the University College offers courses in ten departments
organized under four faculties comprising the Faculties of Business, Law, Informatics and
Education. These courses are run under two categories of programs i.e. the Regular Program and
the Extension Program. Students are trained in the specified levels: the certificate (10+1 and
10+2), the diploma (10+3) and the degree programs. In its College of Open and Distance
Learning (CODL), SMUC runs both undergraduate and graduate programs in more than 20 fields
of studies in sixty Coordinating Centers in different regions. The CODL trains students at both
the undergraduate level (10+1 and 10+2) Certificate, 10+3 Diploma, and BA Degree) and post-
graduate level (MA Degree). The post-graduate program is given in partnership with the Indira
Gandhi National Open University (IGNOU).
1.2 Statement of the Problem There has been a long debate amongst researchers regarding the relationship between
organizational culture and job satisfaction. Many researchers have found supporting evidence
about the relationship between these two concepts (Odom and others, 1990; McKinnon and
others, 2003; Lund, 2003; Sempane and others, (2002); Bashayreh, 2009; Choi and others, 2008;
Yiing, 2008; Shing, 2008). With costs of human resource development is still skyrocketing,
erosion of employee loyalty to firms costing a lot in replacement and retraining. In addition to
this, organizational secrets lost due to sabotage , defections, lawsuits and other forms of
retribution by disaffected employees is affecting organizational performance (Cameron& Quinn,
1999).furthermore, culture change, at its root, is intimately tied to individual change. Unless
managers are willing to commit to personal change, the organization’s culture will remain
recalcitrant. As a result, without another kind of fundamental change, namely, a change in
organizational culture, there is little hope of enduring improvement in organizational
performance. while the tools and techniques may be at hand and the change strategy implemented
with vigor, many efforts to improve organizational performance fail because the fundamental
culture of the organization—values, ways of thinking, managerial styles, paradigms, approaches
to problem solving— remains the same (Cameron& Quinn, 1999).
4
During the last two decades, universities worldwide have come under increasing pressures to
adapt to rapidly changing social, technological, economic and political forces emanating from the
immediate as well as from the broader postindustrial external environment. As noted by
wondosen Tamrat (2003), the Ethiopian higher education system has witnessed a remarkable
change unprecedented in its history in the form of the unanticipated emergence and expansion of
private higher education institutions (PHEIs).St Mary’s University College is one of those
institutions which are found abreast of these changes. One way of embracing these changes is
through the change of its rooted culture by the application of important suggestions from research
findings in the area.
Previous studies attempting to link organizational culture and employees work outcomes,
Chapman & Al-Khawaldeh ,( 2002) as cited in Bashayreh (2009), have limited outcome in scope
and were often affected by methodological constraints .In order to address the aforesaid
limitations, this study contributes to the literature by attempting to fill the gap between the clear
need for an analytical study that examines recognizable organizational culture pattern and job
satisfaction facets by using appropriate ordinal regression model and statistical methods. It is
noted that even with the literature found from various databases, to much lesser degree there are
no pertinent research findings that focuses on the African setting, and there are no research
findings that are relevant or specific to Ethiopian higher learning educational institutions. Hence,
this study intends to contribute to the existing knowledge base, in particular, from an Ethiopian
perspective within Private higher learning institution setting, namely St Mary’s University
College (SMUC). Therefore, the study aims at addressing the following basic research questions:
1. What is the dominant organizational culture of SMUC as it is measured by OCAI?
2. What level of job satisfaction do teachers perceive with each of the twenty job facets as
measured by the Minnesota Satisfaction Questionnaire, short Form (MSQ)?
3. Is there statistically significant relationship between Job Satisfaction and Organizational
culture scores at SMUC?
4. Which cultural type/s contributes most to employee satisfaction at SMUC?
5
1.3 Objectives of the Study In order to bridge the gap and provide organizations with practical assistance in dealing with this
issue, this research is aimed towards:
i) To identify the dominant organizational culture profile of SMUC as it is measured by
OCAI.
ii) To determine the job satisfaction level of teachers with each of the twenty job facets as
measured by the Minnesota Satisfaction Questionnaire, short Form (MSQ).
iii) To identify whether there is statistically significant relationship between Job Satisfaction
and Organizational culture scores at SMUC.
iv) To identify the cultural profile/s that contributes most to employee satisfaction at SMUC.
1.4 Significance of the Study This study aims to make a contribution to extant research on organizational culture and job
satisfaction:
Firstly, to identify patterns of organizational culture that would provide evidence to be significant
aspects in determining employee’s job satisfaction.
Secondly, to present a model as a systematic way to measure the extent of impact employees
perceptions have in relation to the organizational cultural types on employees job satisfaction,
which have become an integral component of an organization where job satisfaction is vital.
Thirdly, it is to explore the effects of organizational cultural types on job satisfaction and to
assess which organizational culture dimensions have greater marginal impact on job satisfaction.
Lastly, to suggest to practicing managers on how to improve organizational Cultural types that
may have critical impact on employees’ satisfaction.
1.5 Delimitation/Scope of the Study In addition to organizational culture and job satisfaction factors, there are a number of other
antecedents, moderators, mediators and consequents. This includes, person-organization fit
(Silverthorne, 2004), leadership behavior, employee performance (Yiing, 2008), commitment,
cohesion (Odom, Boxx, Dunn, 1990), national culture, organizational commitment (Okpara,
2007), cultural self identity (Shing, 2008).However, this study was limited to only identifying the
relationship between organizational culture and employee Job satisfaction factors. This is because
there are a large number of past researches which had demonstrated the relationship between
6
organizational culture and job satisfaction, as reported by Lund (2003), Sempane others, (2002),
Choi others, (2008) and Bashayreh, 2009.furthermore, This study is limited to identifying those
organizational culture types that may have effects on employee satisfaction among academic
staffs at SMUC. These include Clan, Adhocracy, Market, and Hierarchy. Also this study doesn’t
encompass the preferred culture of SMUC as it is recommended by the competing value
framework.
1.6 Limitation of the Study Unlike that of Lund (2003) and Choi others, (2008), this study was not conducted on cross-
sectional firms. As a result, the study was limited only in identifying the impact of one dominant
organizational culture type over job satisfaction. Since it was constrained to depict the impact of
different dominant organizational culture types over job satisfaction of employees, the non cross-
sectional nature of the study was the major limitation of the study. Furthermore, unlike the
competing value framework which the study is limited to identifying the prevalent culture of
SMUC.
1.7 Definition of Terms Competing Values Framework or CVF – is the framework compiled by Quinn and
Rohrbaugh in 1983 and later perfected by Cameron and Quinn 1999, 2006, to understand
and organize the four organizational culture types.
Culture Types – refer to the four categories identified from extensive research on
effective organizations by Cameron and Quinn within the Competing Values Framework:
clan, adhocracy, hierarchy, and market.
Extrinsic job satisfaction is measured by the following facets of the MSQ: advancement,
compensation, policies and practices, recognition, supervision-human relations and
supervision-technical.
General Job satisfaction is measured by the following two facets of the MSQ:
coworkers and working conditions.
Intrinsic job satisfaction is measured by the following facets of the MSQ: ability
utilization, achievement, activity, creativity, independence, moral values, responsibility,
security, social service, social status, and variety.
7
Job satisfaction is a function of the perceived relationship between what one wants from
one’s job and what one perceives it as offering (Locke, 1969).
Minnesota Satisfaction Questionnaire (MSQ) - is a likert-scale type instrument which
was designed by Weiss, Dawis, England, & Lofquist (1967) for measuring job satisfaction
for 20 facets of job.
Organizational culture – is defined as “a pattern of shared basic assumptions that the
group learned as it solved its problems of external adaptation and internal integration, that
has worked well enough to be considered valid and therefore, to be taught to new
members as the correct way to perceive, think, and feel in relation to those problems”
(Schein, 1993).
Organizational Culture Assessment Instrument (OCAI) – is an instrument based on
the Competing Values Framework used to identify the organizational culture profile based
on the core values, assumptions, interpretations, and approaches that characterize
organizations (Cameron & Quinn, 1999, 2006).
Overall job satisfaction is an overall indicator and is measured by the following facets of
the MSQ: ability utilization, achievement, activity, advancement, authority,
compensation, coworkers, creativity, independence, moral values, policies and practices,
recognition, responsibility, security, social service, social status, supervision-human
relations, supervision-technical, variety, and working conditions.
Teacher-– is any position of academic staff at St Mary’s University College including all
individuals holding the title of graduate assistance, assistant lecturer, lecturer, assistant
professor or professor.
1.8 Organization of the Study This study is structured into five chapters. Chapter one presents the introduction, statement of the
problem, research questions, objective of the study, significance of the study, delimitations of the
study, limitation of the study and definition of terms. The literature review in Chapter 2 addresses
first organizational culture and next job satisfaction and finally discusses the relationship between
organizational culture and job satisfaction. Chapter 3 explains the research methodology applied.
It includes a description of the instrumentation used, data collection procedures, and data
analysis. Chapter 4 contains the presentation and analysis of data and summary, conclusion and
recommendation follows in Chapter 5.
8
CHAPTER TWO
REVIEW OF RELATED LITERATURE In this chapter, a literature review on organizational culture will be presented first, followed by
that of Job satisfaction. In addition, a review of past research findings on the relationships
between organizational culture and job satisfaction is included. Finally, the theoretical framework
for this study is presented at the end of the chapter.
2.1 Organizational Culture
2.1.1 The Concept of Organizational Culture The word organizational culture has been defined in a variety of ways by management authors.
Most of the definitions include element such as shared values, beliefs, assumptions, patterns of
relationships, and behaviors that guide the members of an organization. The term itself
‘organizational culture’ is used to differentiate the culture of the overall organization from the
values, preferences, or inclinations of individuals (personal culture) or from the language, norms,
or philosophies of a nation or civilization (societal culture) (Vogds, 2004).
Kroeber & Kluckhohn (1952) (as cited in Cameron, 2004) states that there are over 150
definitions of culture that have been identified (p.3).However, the two main disciplinary
foundations of organizational culture are the so called sociological (e.g., organizations have
cultures) and anthropological (e.g., organizations are cultures). In each of these disciplines, there
are two different approaches to culture that were developed: a functional approach (e.g., culture
comes out of collective behavior) and a semiotic approach (e.g., culture dwells in individual
interpretations and cognitions). The main differences are found between cultures as an attribute
possessed by organizations versus culture as a metaphor for describing what organizations are.
The former approach presumes that researchers and managers can identify differences among
organizational cultures, can change cultures, and can empirically measure cultures. Conversely,
the latter one assumes that nothing exists in organizations except culture, and one encounters
culture anytime one rubs up against any organizational phenomena. In addition to this, Culture is
a potential predictor of other organizational outcomes (e.g., effectiveness) in the former
perspective, whereas in the latter perspective it is a concept to be explained independent of any
other phenomenon (Cameron, 2004, p.3). In general Yiing (2008) explains:
9
The organizational culture is likened to a double-edged sword. A culture creates distinctions between one organization and others, conveys a sense of identity for its members, facilitates commitment towards the organization’s goals, enhances the stability of the social system, reduces ambiguity, and serves as a control mechanism that guides and shapes the attitudes and behavior of employees. However, a culture can also become a liability when it becomes too strongly entrenched within the norms, values and mindsets of the employees and resist changes – a culture can become a barrier to change, diversity and other transformations required for the organization to adapt in today’s dynamic, globalized business environment.(p.11-12)
According to Cameron &Quinn (1999), it was not until the beginning of the 1980s that
organizational scholars began paying attention to the concept of culture. Further they expound the
reason why culture is one of the few areas, in fact, where organizational scholars led practicing
managers in identifying a crucial factor affecting organizational performance. They have stated
organizational culture was ignored as an important factor in accounting for organizational
performance because;
First, it encompasses the taken-for-granted values, underlying assumptions, expectations,
collective memories, and definitions present in an organization. Second, it represents “how things
are around here.” It reflects the prevailing ideology that people carry inside their heads as well as
it conveys a sense of identity to employees by providing unwritten and often unspoken guidelines
for how to gothersong in the organization to enhance the stability of the social system that they
experience. Third, people are unaware of their culture until it is challenged, until they experience
a new culture, or until it is made overt and explicit through, for example, a framework or model.
Therefore the above factors make it difficult to be detectable, (Cameron &Quinn, 1999).
Conversely, since the aforesaid period for some two decades, Organizational culture has been an
important theme in management and business research. One rationale for this is that
organizational culture has the potential to affect a range of organizationally and individually
desired outcomes (Chow, Graeme, and McKinnon, and Wu, 2001).
2.1.2 The Functions of Culture Bashayreh (2009) contends that Culture performs a number of functions within an organization
primarily, it has a boundary-defining role; that is, it creates distinctions between one organization
and others. Next, it conveys a sense of identity for organization members. Then, it facilitates the
10
generation of commitment to something larger than one’s individual self-interest. Again, it enhances
the stability of the social system. Since it is the social glue that helps hold the organization together
by providing appropriate standards for what employees should say and do. Finally, culture serves as
a sense-making and control mechanism that guides and shapes the attitudes and behavior of
employees, (Bashayreh, 2009) .In a review of her past literature Mullins (2007) had justified that
Culture is increasingly developing as a valuable resource related to the understanding of
organizational systems and It is among the organizational variables thought to contribute to the
quality of work and success within organizations. Furthermore, it emphasizes the importance of
analyzing the work group in order to discover aspects of organizational life.
2.1.3 Person-Organizational Culture Fit Different researches had discussed the congruence or fit between employees’ preferred
organizational culture and the actual organization culture will be associated with positive
outcomes (Chow et al. 2001; Bashayreh, 2009; Silverthorne, 2004). Likewise, matching
individuals to organizations is a crucial part of success for any company (Bashayreh, 2009).
This, in turn, will be determined by the kind of organizational culture that exists.
According to Bashayreh (2009), Culture shapes the foundation how individuals operate within
the context of the organization. In addition, it defines the way a group or individual behaves,
defines what is “normal” and sanctions what is not normal is determined by his or her
culture..While the culture may provide a framework within which the influence of the P -O fit
occurs, a good fit is important in all organizational cultures implying that sharing information
about the culture before hiring employees and using culture to guide the selection process and
criteria will result in a better P-O fit and hence higher job satisfaction and organizational
commitment (Silverthorne, 2004).This implies that if there is a good person and organization fit
between both parties ,employees and employers, will operate in harmony. Organizational culture
plays an important role in attracting or keeping employees and the maintenance of the good fit is
essential for job satisfaction.
11
2.1.4 Typologies of Organizational Culture Since culture is extremely broad and inclusive in scope there are so many dimensions
(typologies) that have been proposed in organizational culture studies. According to Cameron
&Quinn (1999), culture comprises a complex, interrelated, comprehensive, and ambiguous set of
factors. Consequently, that makes it impossible to ever include every relevant factor in
diagnosing and assessing organizational culture. Furthermore the authors point out that there is
one more element which can always be argued to be relevant. This is to determine the most
important dimensions on which to focus, therefore, it is important to use an underlying
framework, a theoretical foundation that can narrow and focus the search for key cultural
dimensions (Cameron & Quinn, 1999).
Yiing (2008) has proposed a number of typologies for analyzing organizational culture in his
review of a number of past research literatures. His study was based on Wallach’s (1983) three
types of culture identifications namely: bureaucratic, innovative and supportive cultures. He has
also cited another typology example by Goffee and Jones (1998) who had categorized
organizational culture into four main types based on two dimensions: sociability and solidarity.
The four types of culture identified by Goffee and Jones are communal, fragmented, networked
and mercenary culture types. Furthermore, Bass (1991) and Bass and Avolio (1993), (as cited in
Mullins, 2007, p.65), identified cultural theory by describing culture as transformational or
transactional.
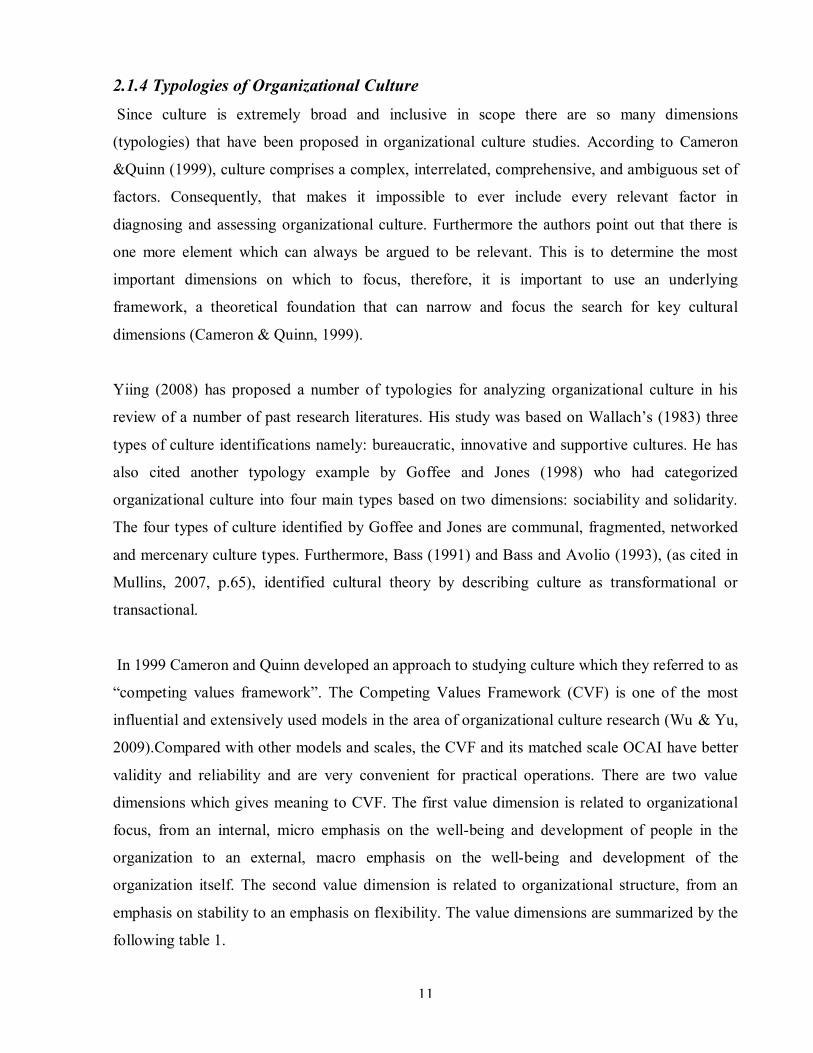
In 1999 Cameron and Quinn developed an approach to studying culture which they referred to as
“competing values framework”. The Competing Values Framework (CVF) is one of the most
influential and extensively used models in the area of organizational culture research (Wu & Yu,
2009).Compared with other models and scales, the CVF and its matched scale OCAI have better
validity and reliability and are very convenient for practical operations. There are two value
dimensions which gives meaning to CVF. The first value dimension is related to organizational
focus, from an internal, micro emphasis on the well-being and development of people in the
organization to an external, macro emphasis on the well-being and development of the
organization itself. The second value dimension is related to organizational structure, from an
emphasis on stability to an emphasis on flexibility. The value dimensions are summarized by the
following table 1.
12
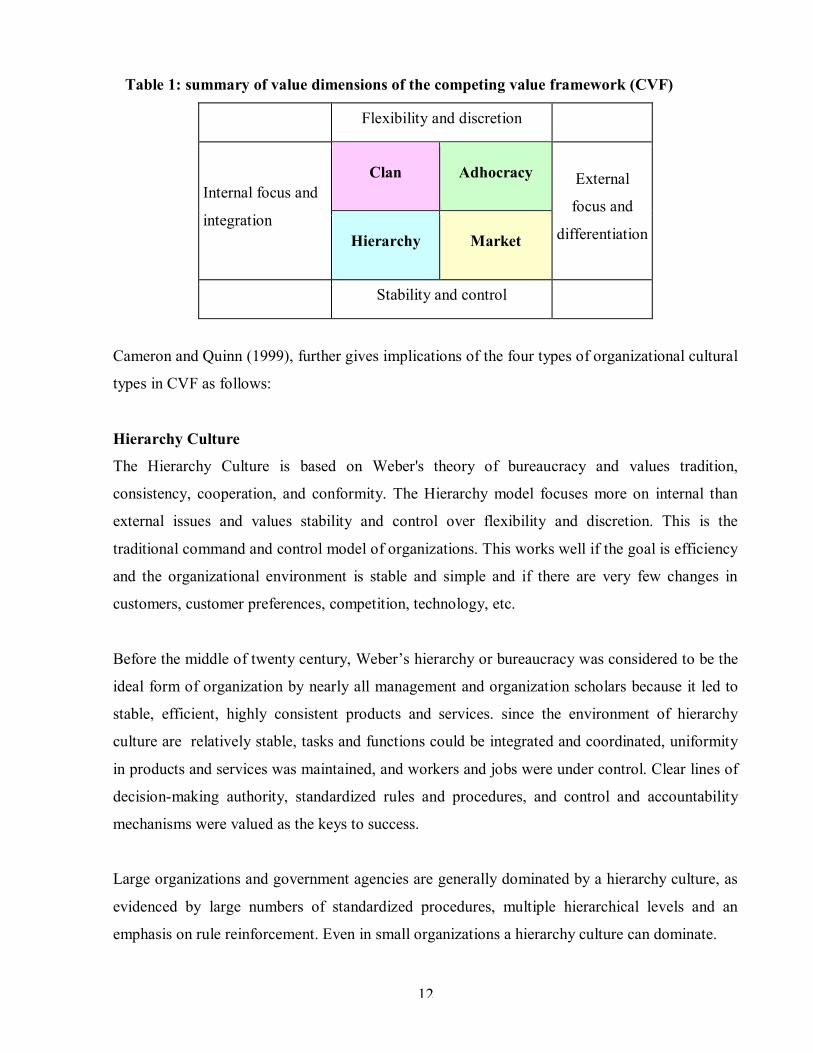
Table 1: summary of value dimensions of the competing value framework (CVF)
Flexibility and discretion
Internal focus and
integration
Clan Adhocracy External
focus and
differentiation Hierarchy Market
Stability and control
Cameron and Quinn (1999), further gives implications of the four types of organizational cultural
types in CVF as follows:
Hierarchy Culture
The Hierarchy Culture is based on Weber's theory of bureaucracy and values tradition,
consistency, cooperation, and conformity. The Hierarchy model focuses more on internal than
external issues and values stability and control over flexibility and discretion. This is the
traditional command and control model of organizations. This works well if the goal is efficiency
and the organizational environment is stable and simple and if there are very few changes in
customers, customer preferences, competition, technology, etc.
Before the middle of twenty century, Weber’s hierarchy or bureaucracy was considered to be the
ideal form of organization by nearly all management and organization scholars because it led to
stable, efficient, highly consistent products and services. since the environment of hierarchy
culture are relatively stable, tasks and functions could be integrated and coordinated, uniformity
in products and services was maintained, and workers and jobs were under control. Clear lines of
decision-making authority, standardized rules and procedures, and control and accountability
mechanisms were valued as the keys to success.
Large organizations and government agencies are generally dominated by a hierarchy culture, as
evidenced by large numbers of standardized procedures, multiple hierarchical levels and an
emphasis on rule reinforcement. Even in small organizations a hierarchy culture can dominate.
13
Market Culture
The Market Culture also values stability and control but focuses more on external (market) rather
than internal issues. This culture tends to view the external environment as threatening, and seeks
to identify threats and opportunities as it seeks competitive advantage and profits.
It is important to keep in my mind that the term market is not synonymous with the marketing
function or with consumers in the marketplace. Rather, it refers to a type of organization that
functions as a market itself. It is oriented toward the external environment instead of internal
affairs. It is focused on transactions with (mainly) external constituencies such as suppliers,
customers, contractors, licensees, unions, and regulators.
A market culture, as assessed in the OCAI, is a results-oriented workplace. Leaders are hard-
driving producers and competitors. They are tough and demanding. The glue that holds the
organization together is an emphasis on winning. The long-term concern is on competitive
actions and achieving stretch goals and targets. Success is defined in terms of market share and
penetration. Outpacing the competition and market leadership are important.
Clan Culture
The Clan Culture focuses on internal issues and values flexibility and discretion rather than
seeking stability and control. The goal is to manage the environment through teamwork,
participation, and consensus.
Shared values and goals, cohesion, participation, individuality, and a sense of “we-ness”
permeated clan-type firms. They seemed more like extended families than economic entities.
Instead of the rules and procedures of hierarchies or the competitive profit centers of markets,
typical characteristics of clan-type firms were teamwork, employee involvement programs, and
corporate commitment to employees. These characteristics were evidenced by semiautonomous
work teams that received rewards on the basis of team (not individual) accomplishment and that
hired and fired their own members, quality circles that encouraged workers to voice suggestions
regarding how to improve their own work and the performance of the company, and an
empowering environment for employees.
14
Adhocracy Culture
The Adhocracy Culture focuses on external issues and values flexibility and discretion rather than
seeking stability and control; key values are creativity and risk taking. Organizational charts are
temporary or nonexistence; roles and physical space are also temporary.
Adhocracy is an organizational form that is most responsive to the hyper turbulent, ever-
accelerating conditions that increasingly typify the organizational world of the twenty-first
century. The root of the word adhocracy is ad hoc—implying something temporary, specialized,
and dynamic. Most people have served on an ad hoc task force or committee, which disbands as
soon as its task is completed.
The adhocracy organization may frequently be found in industries such as aerospace, software
development, think-tank consulting, and filmmaking. An important challenge for these
organizations is to produce innovative products and services and to adapt quickly to new
opportunities. Unlike markets or hierarchies, adhocracies do not have centralized power or
authority relationships. Instead, power flows from individual to individual or from task team to
task team, depending on what problem is being addressed at the time. Emphasis on individuality,
risk taking, and anticipating the future is high as almost everyone in an adhocracy becomes
involved with production, clients, research and development, and other matters.
Moreover, Cameron and Quinn (1999) identified the six key dimensions of organizational
culture, which are Dominant Characteristics, Organizational Leadership, Management of
Employees, Organizational Glue Strategic Emphasis, and Criteria for (judging) Success. Further
description of the OCAI will be revealed during methodology description in chapter 3 of this
research paper.
2.1.5 Assessing Organizational Culture Whilst the visible and audible manifestations of culture, ‘artifacts’ and ‘espoused values’ are
readily apparent, not all attributes are directly observable and instead must be inferred from what
can be seen and heard in organizations. From observation, survey and investigation, researchers
have shown that a form that a specific culture exhibits can be expressed by developing a
summary profile to show the relative balance between validated indicators. Rousseau (1990), (as
cited in Bashayreh, 2009), indicated that there is an argument among organizational scientists
15
with regard to assessing organizational culture with either quantitative or qualitative methods.
Both are valuable because, quantitative methods, such as questionnaires, are valuable because of
their precision, comparability, and objectivity .In addition, qualitative methods, such as
interviews and observations, are valuable because of their detail, descriptiveness, and uniqueness
(Bashayreh, 2009, p.18).
There are four widely used quantitative assessment instruments for measuring organizational
culture. The first one is by Kilmann (1984, 1988) (as cited in Mullins, 2007 p.64), who proposed
a five-step model for managing and changing OC. He developed the Kilmann-Saxton Culture-
Gap. The second one is by Avolio and Bass (1994), (as cited in Mullins, 2007 p.77), developed
the Organizational Description Questionnaire (ODQ) which is a 28-item survey questionnaire. It
explores elements of a culture related to assumptions, processes and expectations. The third is the
popular Organizational Culture Index (OCI) by Wallach (1983(as cited in Yiing, 2007, p. 27),
which measures OC by using 24 items questionnaire. This instrument classified organizational
culture profiles as bureaucratic, innovative and supportive, and each of the three profiles is
assigned 8 items in the OCI questionnaire. The last commonly used tool is organizational culture
assessment instrument (OCAI).It is in the form of a questionnaire that requires individuals to
respond to just six items i.e. Dominant characteristics, Organizational leadership, Management of
employees, Organizational glue, Strategic emphasis and criteria of success. The OCAI is
developed by Cameron &Quinn based on the CVF (Cameron & Quinn, 1999).
2.1.6 Culture as a Descriptive Term According to Bashayreh (2009), culture is descriptive term, in that it is concerned with how
employees perceive the characteristics of an organization’s culture, not with whether they like
them or not. He further expound this fact by citing another researchers work that describing
organizational culture as descriptive term is important since it can differentiate it’s concept
from job satisfaction (Bashayreh, 2009, p.14).
Mullins (2007) proposes that the concept of culture is an important tool for understanding the
beliefs and behavior of individuals in organizations or systems. However it is difficult to define
and operationalize it. She further expounds, since the early 1980s, knowledge about
organizational culture has gained momentum as a predictive and explanatory construct in
organizational behavior.
16
2.1.7 Do Organizations have Uniform Culture? Since Organizational culture stands for a common perception held by the organization’s
members. It was unequivocally stated when we defined culture as a system of shared meaning
(Bashayreh, 2009). As mentioned above, The term organizational culture by itself helps us to
differentiate the culture of the overall organization from the values, preferences, or inclinations of
individuals (personal culture) (Vogds, 2004,).By implication, we should expect different
members of the organization have a common understanding, value and meaning that they share
among each other.
Conversely, inside an organization, subunits such as functional departments, product groups,
hierarchical levels, or even teams may also reflect their own unique cultures (Cameron & Quinn,
1999). This is possible because there is a possibility of each unique unit often can develop its
own perspective, its own set of values, and its own culture. Nevertheless, emphasizing subunit
cultural differences, in other words, can foster alienation and conflict.
According to Alpert and Whetten (1985) (as cited in, Cameron & Quinn, 1999, p.18), it is
essential to keep in mind that each subunit in an organization also contains common elements
typical of the entire organization. This is because similar to a hologram each unique element in
the image contains the characteristics of the entire image in addition to its own identifying
characteristics, subunit cultures also contain core elements of the entire organization’s culture in
addition to their own unique elements (Alpert and Whetten,1985). Nonetheless, in an
organization there is always underlying glue that binds it together. Therefore, in assessing an
organization’s culture, we can focus on the entire organization as the unit of analysis, or one can
assess different subunit cultures, identify the common dominant attributes of the subunit cultures,
and aggregate them. This combination can provide an approximation of the overall organizational
culture (Cameron & Quinn, 1999).
2.1.8 Strong versus Weak Cultures The strength of the culture refers to the power or preeminence of the culture (Cameron, 2004). It
is determined by the number of points awarded to a specific culture type. The higher the score,
the stronger or more dominant is that particular culture. Likewise, a strong culture is one which
core values are both intensely held and widely shared, and hence have greater impact on
17
employee behavior (Yiing, 2008). Therefore, the more the members of the organization accept
the core values and the greater will be the commitment to those values, the stronger will be the
culture of the organization (Bashayreh, 2009).
Research has revealed that strong cultures are associated with homogeneity of effort, clear focus,
and higher performance in environments where unity and common vision are required (Cameron
& Quinn, 1999). According to Calhoun (1989) (as cited in Mullins, 2007, p.64), a strong,
cohesive culture promotes good performance and high job satisfaction. He also proposes that
when organizations find ways of articulating shared values, norms, and beliefs, employees are
guided in similar directions. Furthermore, Yiing (2008), indicated that a strong culture is linked
to high agreement among members, increases behavioral consistency, builds cohesiveness,
loyalty and organizational commitment, and more importantly, reduces turnover.
2.1.9 University Culture Many researchers have studied the organizational culture issues and the concept of
organizational culture in higher education (Folch & Ion, 2009; Smart & St. John, 1996; Tierney,
1988) .Organizational culture is a prime element of functional decision making in universities.
Folch and Ion by citing different authors had defined university culture as the values and beliefs
of university stakeholders (i.e., administrators, faculty, students, board members and support
staff), based on tradition and communicated verbally and nonverbally (Folch & Ion, 2009).
University culture can also be considered as the personality of an organization. The architecture
of the building, the way how facilities are maintained, and the relationship of students and
academic staff attire, can tell us a great deal about the university culture (Folch & Ion, 2009).The
researchers had also accentuated the analysis of a university’s organizational culture is important
since the university as an organization is interested in the adaptation of its culture to the values
and the behavior of its members, so as to maintain a healthy state of mind and foster permanent
improvement.
According to the 2003 Higher Education Report, the university culture can be seen as a great
tapestry, where the beliefs and practices of trustees, senior administrators, faculty members,
campus community members, competitors, and society come together to fundamentally shape the
effectiveness of that university. A strong and deep understanding of tradition and history is
18
necessary for an academic social system to thrive; once accomplished, university hierarchies can
comprise a shared mental model that allows all faculty and staff to give meaning to external and
internal occurrences. By and large, this mental model is communicated to faculty, staff, and
students either verbally or in the form of written communication forms (ASHE, 2003).
Moreover, the Report states that an effective strategy and culture must be integrated before a
functional organizational mission can be defined. It further notes that the most successful
university or college cultures appear to be those that sustain both group cooperation and
individual achievement (ASHE, 2003). Alternatively, those university cultures that encourage
competition rather than internal cooperation tend to exhibit dysfunctional behavior. This type of
behavior often leads to conflict between the university culture and the actions of the hierarchies,
resulting in alienation, disorganization, and confusion (ASHE, 2003).
2.2 Job Satisfaction
2.2.1 Meaning of Job Satisfaction To understand the meaning of job satisfaction, it seems reasonable to look at how it is defined in
the literature. Even though many researchers define job satisfaction, the search for a universal
definition of job satisfaction is an impossible one and the definitions vary. Nevertheless, different
authors had defined job satisfaction from different angles. for example , according to Green
(2000), Job satisfaction refers to those positive emotions that arise when the individual
experiences positive emotions as a result of the individual’s job meets or exceeds his/her
expectation. Job satisfaction thus, has to do with an individual’s perception and evaluation of his
job, and this perception is influenced by the person’s unique circumstances like needs, values and
expectations. People will therefore evaluate their jobs on the basis of factors, which they regard
as being important to them.
In other definition, job satisfaction as a global construct can be defined as the feelings an
employee has about the job in general as well as satisfaction with specific aspects, such as
supervision, pay, opportunity for advancement, and morale (park &Kim, 2009).
The dimensions of Job satisfaction includes job design, supervision, rewards, degree of influence,
and opportunity for growth, communication, evaluation, and relationships with co-workers(Choi,
Martin, Park, 2008).Therefore, Individuals respond to, and their lives are affected by, common

19
facets (factors) in the job setting such as the task environment and the nature of supervision. It is
the perceptions of those common multiple factors that are most salient in influencing the level of
job satisfaction.
2.2.2 Importance of Job Satisfaction In a review of past literature, Green (2000) justified the significance of job satisfaction by
presenting three reasons .These are firstly, if organizations wants to satisfy the interest of their
employees as their own: they can be shaped by humanitarian values since they will attempt to
treat their employees with honor and respect by abiding humanitarian values. Secondly,
organizations can take on a practical position in which employees’ behavior would be expected to
influence organizational operations according to the employees’ degree of job
satisfaction/dissatisfaction. Thirdly, job satisfaction can be a sign of organizational operations
which is helpful in pinning down areas that need improvement by identifying various levels of
satisfaction among organizational departments through assessment of job satisfaction.
2.2.3 Theories of Job Satisfaction Green (2000), had categorized the theories of job satisfaction in his review of literature into three
categories, namely content theories, process theories as well as situational models of job
satisfaction.
A. Content Theories
I. Maslow’s Need Hierarchy Theory.
According to Green (2000), Maslow’s view of individual needs, job satisfaction is said to exist
when an individual’s needs are met by the job and its environment. He expounds that the
hierarchy of needs are based on five categories of needs arranged in ascending order of
importance. These are the so called: Physiological, safety, belongingness and love (lower-level
needs in the hierarchy) and esteem and self-actualization (higher-level needs). When one need is
satisfied, another higher-level need emerges and motivates the person to do something to satisfy
it. According to Maslow’s need hierarchy theory satisfied need is no longer a motivator.
II. Herzberg’s Motivator-Hygiene Theory.
In his review of past literature, Green (2000) also indicated Herzberg motivator-hygiene theory
which focuses attention upon the work itself as a principal source of job satisfaction. According
20
to this theory, the concept of job satisfaction has two dimensions, namely intrinsic and extrinsic
factors. Intrinsic factors are also known as motivators or satisfiers, and extrinsic factors as
hygiene’s, dissatifiers, or maintenance factors. The intrinsic (motivators) relate to job content
(work itself) and consist of achievement, recognition, work itself, responsibility and
advancement. The hygiene’s related to job context (work environment) and involve, for example,
company policy and administration, supervision, salary, interpersonal relations, and working
conditions. Motivators are related to job satisfaction when present but not to dissatisfaction when
absent. Hygiene’s are associated with job dissatisfaction when absent but not with satisfaction
when present.
B. Process Theories
I. Vroom’s Expectancy Theory.
Green (2000) goes on to explain further Vroom’s expectancy theory which suggests that people
not only are driven by needs but also make choices about what they will or will not do. Thus, the
theory proposes that individuals make work-related decisions on the basis of their perceived
abilities to perform tasks and receive rewards. The theory is based on an equation with three
variables to explain this decision process. The three variables are expectancy, instrumentality,
and valence. Expectancy is the degree of confidence a person has in his or her ability to perform a
task successfully. Instrumentality is the degree of confidence a person has that if the task is
performed successfully, he or she will be rewarded appropriately. Valence is the value a person
places on expected rewards.
Expectancy, instrumentality, and valence are given probability values. Because the model is
multiplicative, all three variables must have high positive values to imply motivated performance
choices. If any of the variables approaches zero, the probability of motivated performance also
approaches zero. When all three values are high, motivation to perform is also high.
II. Adams’ Equity Theory
Another review that was undertaken by Green (2000) is on equity theory which was done by
Adams. Equity theory proposes that workers compare their own outcome/input ratio (the ratio of
the outcomes they receive from their jobs and from the organization to the inputs they contribute)
to the outcome/input ratio of another person. According to the author of the theory it is called this
other person “referent.” The referent is simply another worker or group of workers perceived to
21
be similar to oneself. Unequal ratios create job dissatisfaction and motivate the worker to restore
equity. When ratios are equal, workers experience job satisfaction and are motivated to maintain
their current ratio of outcomes and inputs or raise their inputs if they want their outcomes to
increase.
The outcomes identified by Adam’s include pay, fringe benefits, status, opportunities for
advancement, job security, and anything else that workers desire and receive from an
organization. Inputs include special skills, training, education, and work experience, effort on the
job, time, and anything else that workers perceive that they contribute to an organization.
C. Situational Models
I. Situational Occurrences Theory.
According to Green’s (2000) theoretical framework, the situational occurrences theory of job
satisfaction was proposed by Quarstein, McAfee, and Glassman. The two main components of
the theory are situational characteristics and situational occurrences. Examples of situational
characteristics are pay, promotional opportunities, working conditions, company policies, and
supervision. Individuals tend to evaluate situational characteristics before they accept a job.
Situational occurrences tend to be evaluated after accepting a job. Situational occurrences can be
positive or negative. Positive occurrences include, for example, giving employees some time off
because of exceptional work or placing a microwave in the work place. Negative occurrences
include, for example, confusing email messages, rude remarks from coworkers, and copiers
which seem to break down a great deal. This theory hypothesized that overall job satisfaction is a
function of a combination of situational characteristics and situational occurrences.
II. Predictors of Job Satisfaction.
Finally, Green (2000), in his review of literature had indicated the work of Glisson and Durick
who have examined simultaneously the ability of multiple variables from three categories
(worker, job, and organizational characteristics) to predict both job satisfaction and
organizational commitment. The authors proposed that job tasks would be excellent predictors of
job satisfaction, characteristics of workers poor predictors, and characteristics of the organization
moderate predictors. Their findings supported the traditional emphasis on job characteristics as

22
determinants of job satisfaction, and to a lesser extent, the more recent examinations of
organizational determinants.
2.2.4 Measurement of Job Satisfaction Many instruments are available to measure Job satisfaction nowadays. Unlike productivity,
absenteeism, and turnover, job satisfaction is present only inside an individual’s mind and cannot
be measured directly (Shing, 2008). According to Green (2000), however there are methods for
indirectly measuring job satisfaction like observing employees, interviewing them, and asking
them to complete a questionnaire. He further explains that Job satisfaction can be measured using
either single-item, general, or facet measures and they are summarized as follows:
I. Single-Item Job Satisfaction Measure
A description of a single-item measure was given by Green (2000) citing another author Robbins
(1998) who has described the item as all things considered how satisfied is an individual with his
job (as cited in Green, 2000, p. 10). Then the response alternatives can range from very
dissatisfied to very satisfied. Green further presents evidence of other researchers who criticized
the use of a single-item based on the measures’ assumption that job satisfaction is one-
dimensional, when in fact it appears to be multidimensional. Furthermore, he proposes evidence
that points toward an overestimation of job satisfaction when the construct is measured using a
single-item measure.
II. General Job Satisfaction Measure
According to Green (2000), General Job satisfaction scales, like single-item measures, are used to
determine the overall level of job satisfaction. An instrument available to measure overall job
satisfaction, for example, is the Job in General Scale (JIG) (Ironson, Smith, Brannick, Gibson, &
Paul, 1989) ( as cited in Green,2000,p.10).The JIG is consist of a list of descriptive phrases (i.e.,
“Better than most”) or adjectives (i.e., “Rotten”) In addition which the respondents are asked to
mark “Y” for “YES” if it describes their job in general, “N” for “NO” if it does not describe it, or
“?” if they cannot decide whether or not the word or phrase describes their job.
III. Facet-Specific Job Satisfaction Measure
In time, when it is necessary to identify areas of dissatisfaction of employees, facet-specific
levels of job satisfaction should be assessed (Green, 2000).There are numerous, standardized,

23
reliable and valid instruments which are available for this type of approach. The Instruments are
analyzed by Green (2000) and they are explained as follows:
The Job Satisfaction Survey (JSS) (Spector, 1997) yields an overall satisfaction score and
9 facet-specific scores. The facet-specific scales include pay, promotion, supervision, fringe
benefits, contingent rewards, operating conditions, coworkers, nature of work, and
communication.
The Job Descriptive Index (JDI) (Smith, Kendall, & Hulin, 1969) measures satisfaction
levels of work, pay, promotion, supervision, and coworkers. Participants in studies utilizing
the JDI are asked to indicate whether each statement does or does not describe their jobs.
“YES” responses are scored +1, “NO” responses -1, and “?” responses 0, indicating the
participant cannot decide.
The Minnesota Satisfaction Questionnaire (MSQ) (Weiss, Dawis, England, & Lofquist,
1967) generates satisfaction scores for 20 facets. The facets are ability, achievement,
activity, advancement, authority, company policies and practices, compensation, co-workers,
creativity, independence, moral values, recognition, responsibility, security, social service,
supervision ,human relations, supervision-technical, variety, and working conditions.
Various combinations of facets generate intrinsic, extrinsic, and general job satisfaction
scores. The MSQ is available in a long and a short version. The long-form MSQ asks
participants to respond to 100 items using a Likert response format. The 100 items represent
20 five-item scales. The short-form MSQ asks participants to respond to only 20 items.
These 20 items are the items from the long form MSQ that best represent each of the 20
scales (p.10-11).
For the purpose of this research study the Minnesota Job satisfaction Questionnaire is applied
because it is found to be a standardized, reliable and valid instrument by many researchers
(Green, 2000; Feinestien, 2006, Weiss and others, 1967). According to Weiss and others (1967),
the MSQ short form consists of 20 questions focusing on intrinsic and extrinsic reinforcement
factors of employee attitude (Table 1). This form can be scored on three scales: intrinsic
satisfaction, extrinsic satisfaction and general satisfaction”. The MSQ short form utilizes a
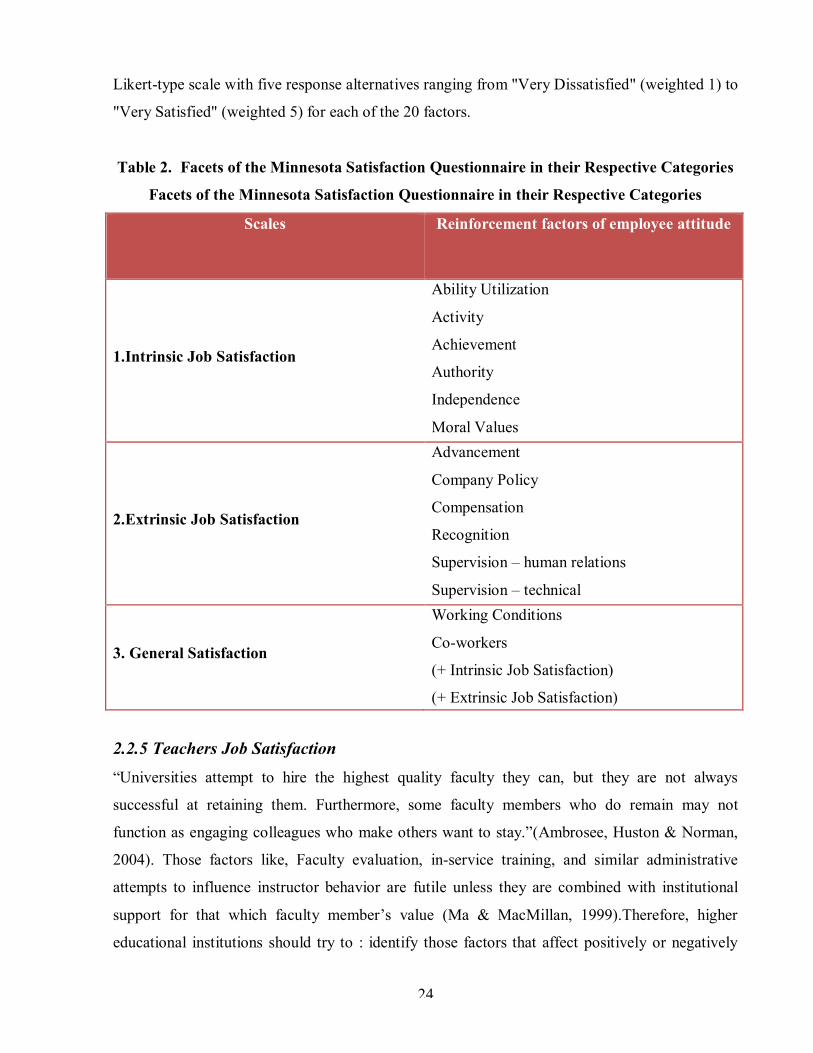
24
Likert-type scale with five response alternatives ranging from "Very Dissatisfied" (weighted 1) to
"Very Satisfied" (weighted 5) for each of the 20 factors.
Table 2. Facets of the Minnesota Satisfaction Questionnaire in their Respective Categories
Facets of the Minnesota Satisfaction Questionnaire in their Respective Categories
Scales Reinforcement factors of employee attitude
1.Intrinsic Job Satisfaction
Ability Utilization
Activity
Achievement
Authority
Independence
Moral Values
2.Extrinsic Job Satisfaction
Advancement
Company Policy
Compensation
Recognition
Supervision – human relations
Supervision – technical
3. General Satisfaction
Working Conditions
Co-workers
(+ Intrinsic Job Satisfaction)
(+ Extrinsic Job Satisfaction)
2.2.5 Teachers Job Satisfaction “Universities attempt to hire the highest quality faculty they can, but they are not always
successful at retaining them. Furthermore, some faculty members who do remain may not
function as engaging colleagues who make others want to stay.”(Ambrosee, Huston & Norman,
2004). Those factors like, Faculty evaluation, in-service training, and similar administrative
attempts to influence instructor behavior are futile unless they are combined with institutional
support for that which faculty member’s value (Ma & MacMillan, 1999).Therefore, higher
educational institutions should try to : identify those factors that affect positively or negatively
25
teachers job satisfaction, and take the necessary action to lower those factors that affect teachers
job satisfaction as well as create and maintain those factors which boosts the moral of teachers in
the workplace.
According to August and Waltman (2004), the concept of teachers work life is very broad,
encompassing a great number of variables. They have identified three key aspects of faculty
career satisfaction as first the work itself: the research, teaching, and service commitments which
is explained by the degree of autonomy, academic freedom and the challenge they take from their
work .The other one concerns with how well faculty members or teachers perceive they are
valued and recognized by their peers and by the institution. This value takes many forms,
including receiving rewards, as well as perceiving an adequate and equitable allocation of such
resources as research support, clerical and graduate student support, technology and comparable
salary compensation package. Finally, the authors had identified teachers value the opportunity to
have input and influence in decisions.
Ambrosee, Huston & Norman (2004), note that sources of satisfaction or dissatisfaction are
categorized into seven general clusters. Five of these are salaries, collegiality, mentoring, the
reappointment, promotion and tenure process, and department heads. However, they justified that
salary alone is rarely the prime mover in faculty job satisfaction & decisions to leave. Their study
finding, moreover, did not point out on salary as primary motivational factor but rather on issues
such as collegiality and departmental leadership.
Ma & Macmillan (1999) explain that teacher’s professional role, tenure, work place conditions,
administration control, teaching competence and organizational culture positively affects
teacher’s satisfaction. They further explain:
Cultures with characteristics expressed in terms of collegiality and collaboration generally are those types that promote satisfaction and feelings of professional involvement of teachers (Hargreaves, 1994; Leithwood, Leonard, & Sharratt, 1998). Other types of cultures that create, maintain, and reinforce isolation do little to help teachers resolve issues or to learn new techniques to help them teach. These cultures of isolation and balkanization (Hargreaves, 1994) actually contribute to teacher dissatisfaction and to a loss of certainty about their professional competence (Rosenholtz, 1989) (p.40).
Therefore, we can infer that in relation to the competing value framework model of Cameron and
Quinn, university culture should be more of clan and adhocracy types so as to support the
teaching and learning activity with smooth collegial relationships.

26
2.3 Organizational Culture and Job Satisfaction Many researchers have investigated the relationship between job satisfaction and various
organizational variables such as leadership, organizational climate, and commitment. For
instance, several researchers have examined the relationship between Job satisfaction and
organizational commitment with organizational culture (Yiing,2008; Silverthorne, 2004; Odom,
Boxx & Dunn,1990; McKinnon, Harrison, Chow & Wu; Okpara,2007 ).Others have examined
the link between organizational culture, job satisfaction and leadership (Mullins,2007; Aydin &
Ceylan, 2009), Cohesion (Odom others,1990), Notwithstanding with the preceding literature
review, fewer studies have investigated the link between organizational culture and job
satisfaction specifically in higher educational setting.
Lund (2003) conducted an empirical study to investigate the impact of the types of
organizational culture on job satisfaction in a survey of marketing professionals in a cross-section
of firms in the USA. Out of the 1,800 respondent questionnaires mailed, 360 usable
questionnaires were received, representing a 21% response rate. The results indicated that job
satisfaction levels varied across organizational culture typology and job satisfaction is positively
related to clan and adhocracy cultures and negatively related to market and hierarchy culture.
Mc Kinnon and others, (2003) conducts a research to explore the association between
organizational cultural values and employees response in a major diversified manufacturing
company in Taiwan. They found out that there is strong positive association between
organizational cultural values of respect for people; innovation, stability and aggressiveness, and
employee response of organizational commitment, job satisfaction, propensity to remain with
organization and information sharing behavior.
Choi, Martin and Park (2008), examined the pattern of organizational culture and investigated the
link between organizational culture and job satisfaction in the Korean Professional Baseball
League (KPBL). The results of the study suggested that the clan culture has a significant
influence on overall employee job satisfaction and satisfaction with co-workers, supervision and
personal growth.
27
In 2008, Yiing investigated the association between different types of organizational culture and
leadership behaviors and organizational commitment, job satisfaction and employee performance
in the Malaysian setting. Data was gathered from 238 Malaysian UM MBA part-time students
and the researcher’s working peers. The finding of the study was only supportive culture
influenced the relationship between commitment and satisfaction. Sempane, Rieger& Roodt
(2002), conducted a study to establish whether a relationship existed between the variables of job
satisfaction and organizational culture in service industry. The Culture and Minnesota Job
Satisfaction Questionnaires were administered to the sample of 160 employees and 121 usable
responses were received. The findings of the study indicated that there was a positive relationship
between organizational culture and job satisfaction.
Silverthorne (2004) examined the interaction of Person organization fit and organizational culture
with such concepts as job satisfaction and organizational commitment and the application of this
concept in non-western cultures like Taiwan. The results of this study indicate that P-O fit is a
key element in both the level of job satisfaction .furthermore, the impact of specific types of
organizational culture was also assessed. Involvement in an organization that had a bureaucratic
organizational culture resulted in the lowest levels of job satisfaction and organizational
commitment. An innovative culture was next highest and a supportive culture had the highest
level of employee job satisfaction and organizational commitment.
Bashayareh (2009) conducted whether there is a significant relationship between the dimensions
of organizational culture and employees’ job satisfaction among academic staff at UUM in
Malaysia. The result showed that there is no significant relationship between emphasis of reward
and performance oriented dimensions and job satisfaction. However, the study also found that,
there is significant relationship between organizational supportiveness, innovation and stability
and communication dimensions and job satisfaction of academic staff employees.
Summary As the literature review indicates, there has been a wealth of data that has attempted to define
and describe the relationship between organizational culture and job satisfaction. The emphasis
has been, for the most part, on the existence of significant relationship between the two constructs
as well as other variables like Person organization fit, leadership, and organizational
28
commitment. The purpose of this study is to attempt to expand the scope of these studies and
extend it beyond the relationship to include what type of culture typology affect job satisfaction
of higher educational institution teachers in Ethiopian setting.
Within the context of this chapter, the theories of job satisfaction and organizational culture have
been presented. The results of the Job satisfaction and organizational culture empirical studies
have been applied to a variety of settings including professional basketball league, business,
service industry, and to a more limited degree, higher education. The literature review indicates
the possibilities of relationships between job satisfaction and organizational culture. The
competing value framework (CVF) by Cameron & Quinn (1999) and shortened version of
Minnesota job satisfaction questionnaire by Weiss others, (1967) are the basis for the theoretical
and empirical reasoning for further investigation of job satisfaction and organizational culture of
this study.
2.4 Theoretical Framework The conceptual framework of this study focuses on the development of a theoretical
organizational cultural model as a systematic way in measuring the employee’s job satisfaction.
Examining the relationship between the organizational culture and job satisfaction should
contribute to our knowledge of the relationship that exists between them as well as the particular
organizational culture pattern type that affect academic staff job satisfaction. The link between
the Patterns of organizational culture and employees’ job satisfaction is illustrated in Figure 2. In
this theoretical framework, organizational cultural patterns are independent variables and
employee’s job satisfaction is a dependent variable. The present study thus attempts to bridge the
gap by providing a basis for a through and insightful judgment of organizational culture and job
satisfaction.
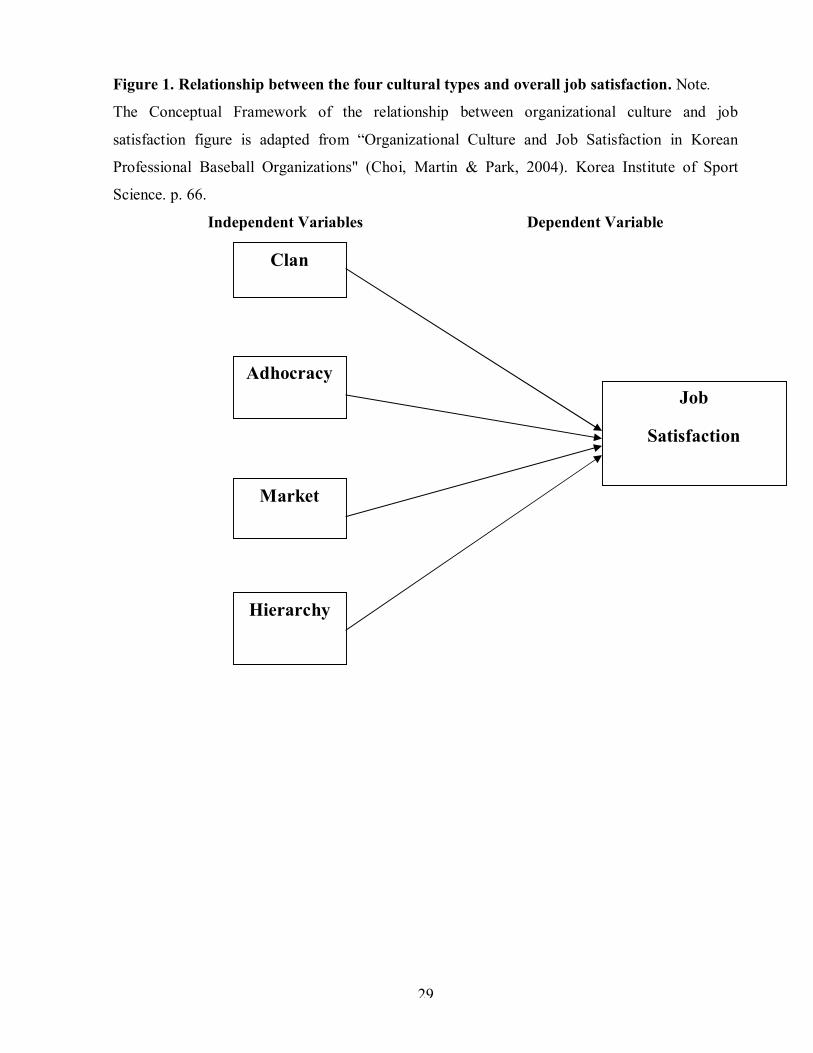
29
Figure 1. Relationship between the four cultural types and overall job satisfaction. Note.
The Conceptual Framework of the relationship between organizational culture and job
satisfaction figure is adapted from “Organizational Culture and Job Satisfaction in Korean
Professional Baseball Organizations" (Choi, Martin & Park, 2004). Korea Institute of Sport
Science. p. 66.
Independent Variables Dependent Variable
Clan
Adhocracy
Market
Hierarchy
Job
Satisfaction
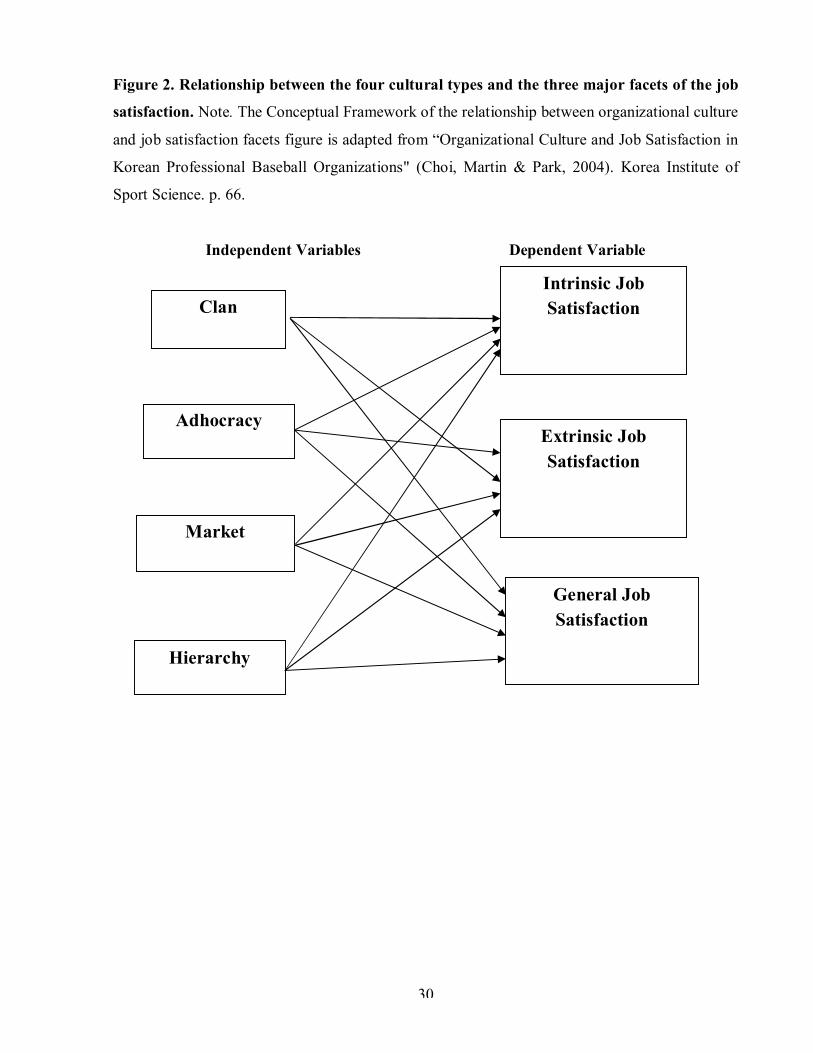
30
Figure 2. Relationship between the four cultural types and the three major facets of the job
satisfaction. Note. The Conceptual Framework of the relationship between organizational culture
and job satisfaction facets figure is adapted from “Organizational Culture and Job Satisfaction in
Korean Professional Baseball Organizations" (Choi, Martin & Park, 2004). Korea Institute of
Sport Science. p. 66.
Independent Variables Dependent Variable
Clan
Adhocracy
Market
Hierarchy
Intrinsic Job Satisfaction
Extrinsic Job Satisfaction
General Job Satisfaction

31
CHAPTER THREE
RESEARCH DESIGN AND METHODOLOGY Figure 3: Methodology Processes Flow Chart
Divide academic staff in
faculties based on
CENSUS Take a census of all academic staff from
Each faculty
SELECT PURPOSEFULLY ALL FACULTIES
BUSINESS INFORMATICS LAW EDUCATION
Conduct Code and Analyze Survey Group and Analyze
Demographics
Group and Analyze job satisfaction
Values
Calculate, Plot, and Analyze Scores
Correlate satisfaction and organizational culture scores
Construct ordinal
regression model
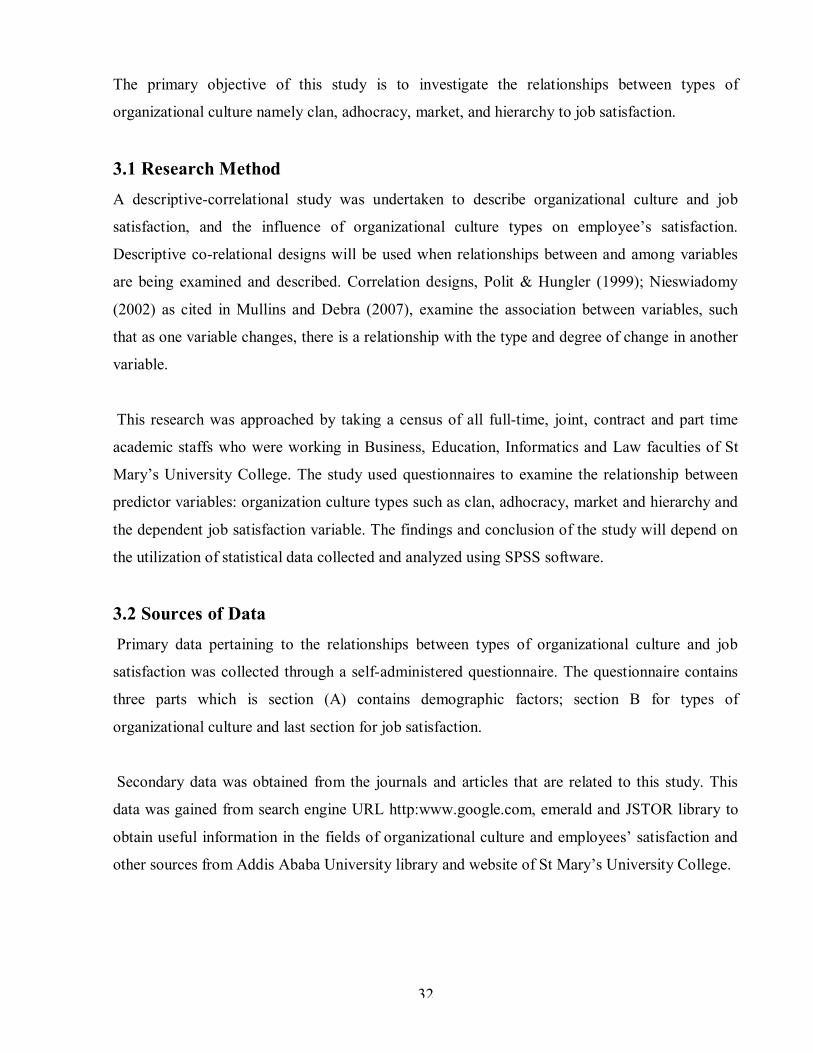
32
The primary objective of this study is to investigate the relationships between types of
organizational culture namely clan, adhocracy, market, and hierarchy to job satisfaction.
3.1 Research Method A descriptive-correlational study was undertaken to describe organizational culture and job
satisfaction, and the influence of organizational culture types on employee’s satisfaction.
Descriptive co-relational designs will be used when relationships between and among variables
are being examined and described. Correlation designs, Polit & Hungler (1999); Nieswiadomy
(2002) as cited in Mullins and Debra (2007), examine the association between variables, such
that as one variable changes, there is a relationship with the type and degree of change in another
variable.
This research was approached by taking a census of all full-time, joint, contract and part time
academic staffs who were working in Business, Education, Informatics and Law faculties of St
Mary’s University College. The study used questionnaires to examine the relationship between
predictor variables: organization culture types such as clan, adhocracy, market and hierarchy and
the dependent job satisfaction variable. The findings and conclusion of the study will depend on
the utilization of statistical data collected and analyzed using SPSS software.
3.2 Sources of Data Primary data pertaining to the relationships between types of organizational culture and job
satisfaction was collected through a self-administered questionnaire. The questionnaire contains
three parts which is section (A) contains demographic factors; section B for types of
organizational culture and last section for job satisfaction.
Secondary data was obtained from the journals and articles that are related to this study. This
data was gained from search engine URL http:www.google.com, emerald and JSTOR library to
obtain useful information in the fields of organizational culture and employees’ satisfaction and
other sources from Addis Ababa University library and website of St Mary’s University College.
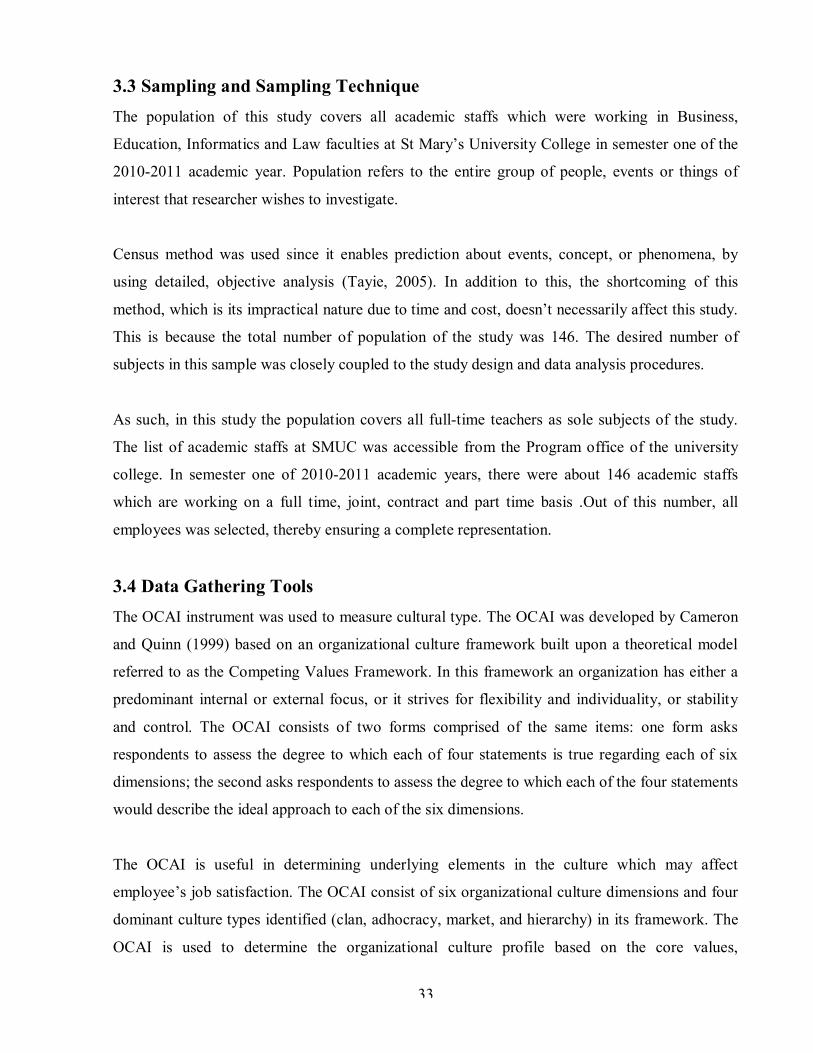
33
3.3 Sampling and Sampling Technique The population of this study covers all academic staffs which were working in Business,
Education, Informatics and Law faculties at St Mary’s University College in semester one of the
2010-2011 academic year. Population refers to the entire group of people, events or things of
interest that researcher wishes to investigate.
Census method was used since it enables prediction about events, concept, or phenomena, by
using detailed, objective analysis (Tayie, 2005). In addition to this, the shortcoming of this
method, which is its impractical nature due to time and cost, doesn’t necessarily affect this study.
This is because the total number of population of the study was 146. The desired number of
subjects in this sample was closely coupled to the study design and data analysis procedures.
As such, in this study the population covers all full-time teachers as sole subjects of the study.
The list of academic staffs at SMUC was accessible from the Program office of the university
college. In semester one of 2010-2011 academic years, there were about 146 academic staffs
which are working on a full time, joint, contract and part time basis .Out of this number, all
employees was selected, thereby ensuring a complete representation.
3.4 Data Gathering Tools The OCAI instrument was used to measure cultural type. The OCAI was developed by Cameron
and Quinn (1999) based on an organizational culture framework built upon a theoretical model
referred to as the Competing Values Framework. In this framework an organization has either a
predominant internal or external focus, or it strives for flexibility and individuality, or stability
and control. The OCAI consists of two forms comprised of the same items: one form asks
respondents to assess the degree to which each of four statements is true regarding each of six
dimensions; the second asks respondents to assess the degree to which each of the four statements
would describe the ideal approach to each of the six dimensions.
The OCAI is useful in determining underlying elements in the culture which may affect
employee’s job satisfaction. The OCAI consist of six organizational culture dimensions and four
dominant culture types identified (clan, adhocracy, market, and hierarchy) in its framework. The
OCAI is used to determine the organizational culture profile based on the core values,
34
assumptions, interpretations, and approaches that characterize organizations (Cameron & Quinn,
1999). A cultural profile can be constructed using the competing values framework Through the
use of the OCAI, an organizational culture profile can be drawn by establishing the
organization’s dominant culture type characteristics. Using this framework, the overall culture
profile of an organization can be identified as:
Clan: an organization that concentrates on internal maintenance with flexibility, concern
for people, and sensitivity for customers.
Hierarchy: an organization that focuses on internal maintenance with a need for stability
and control.
Adhocracy: an organization that concentrates on external positioning with a high degree
of flexibility and individuality.
Market: an organization that focuses on external maintenance with a need for stability and
control
The reason why OCAI was employed for this study is discussed as follows:
I. The instrument has been used by numerous researchers because it is a reliable and valid
instrument. Here reliability refers to the extent to which the instrument measures culture
types consistently and validity refers to the extent to which phenomena that are supposed
to be measured are actually measured. Instrument validity and reliability for the OCAI
have been established by Cameron & Quinn in public and business organizations(1999),
Pierce in military organization (2010), Quinn & Spreitzer in public organizations (1991) ,
Berrio (2003) as well as Zammuto & Krakower ( 1991) both in higher educational
institutions and Yeung , Brockbank & Ulrich in Business organizations (1991).
II. The OCAI uses a response scale in which individuals divide 100 points among
alternatives. This is known as an ipsative rating scale. The OCAI scale has advantages of
highlighting and differentiating the cultural uniqueness that actually exist in organizations
(Cameron & Quinn, 1999). This is because, the OCAI provides a 100-point scale for
rating instead of a 5- or 7-point scale using a Likert format. That results in more
differentiation in ratings.
III. By using ipsative scale respondents are forced to identify the trade-offs that actually exist
in the organization. When the Likert scale is used, respondents tend to rate all quadrants
high or all quadrants low. Therefore Less differentiation occurs.
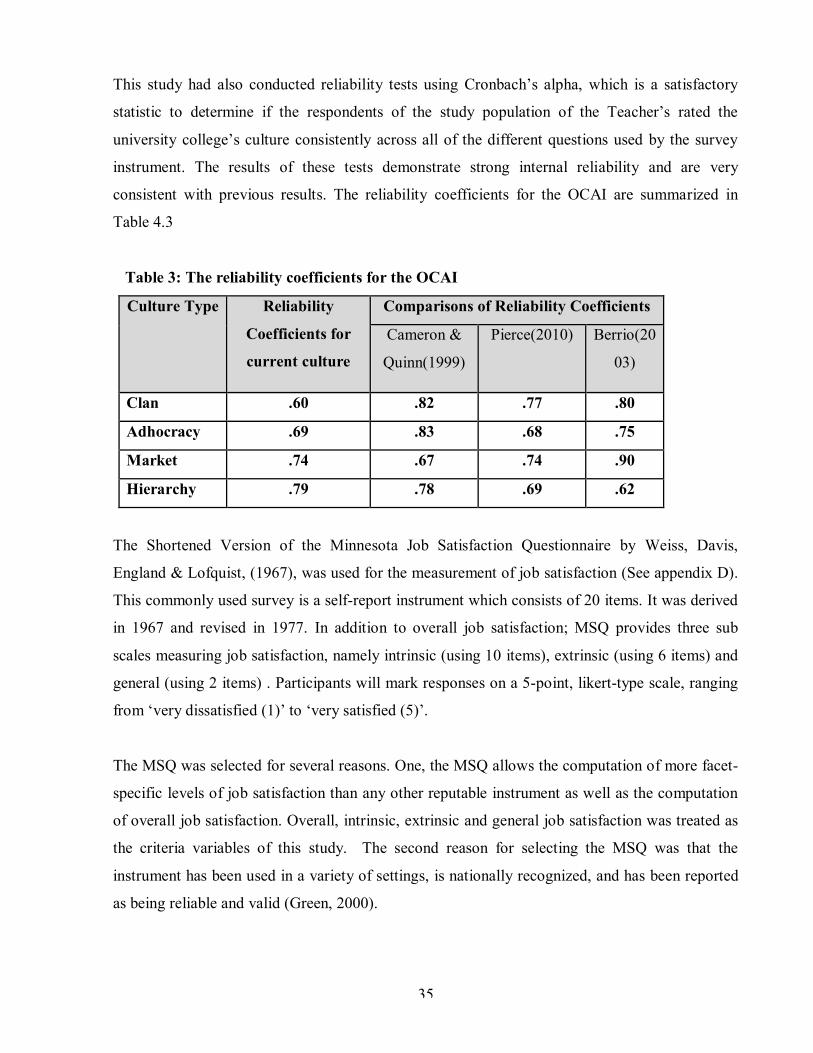
35
This study had also conducted reliability tests using Cronbach’s alpha, which is a satisfactory
statistic to determine if the respondents of the study population of the Teacher’s rated the
university college’s culture consistently across all of the different questions used by the survey
instrument. The results of these tests demonstrate strong internal reliability and are very
consistent with previous results. The reliability coefficients for the OCAI are summarized in
Table 4.3
Table 3: The reliability coefficients for the OCAI
Culture Type Reliability
Coefficients for
current culture
Comparisons of Reliability Coefficients
Cameron &
Quinn(1999)
Pierce(2010) Berrio(20
03)
Clan .60 .82 .77 .80
Adhocracy .69 .83 .68 .75
Market .74 .67 .74 .90
Hierarchy .79 .78 .69 .62
The Shortened Version of the Minnesota Job Satisfaction Questionnaire by Weiss, Davis,
England & Lofquist, (1967), was used for the measurement of job satisfaction (See appendix D).
This commonly used survey is a self-report instrument which consists of 20 items. It was derived
in 1967 and revised in 1977. In addition to overall job satisfaction; MSQ provides three sub
scales measuring job satisfaction, namely intrinsic (using 10 items), extrinsic (using 6 items) and
general (using 2 items) . Participants will mark responses on a 5-point, likert-type scale, ranging
from ‘very dissatisfied (1)’ to ‘very satisfied (5)’.
The MSQ was selected for several reasons. One, the MSQ allows the computation of more facet-
specific levels of job satisfaction than any other reputable instrument as well as the computation
of overall job satisfaction. Overall, intrinsic, extrinsic and general job satisfaction was treated as
the criteria variables of this study. The second reason for selecting the MSQ was that the
instrument has been used in a variety of settings, is nationally recognized, and has been reported
as being reliable and valid (Green, 2000).
36
Cronbach’s alpha was computed to measure the internal consistency of the 20 MSQ scales used
in this study. The reliability coefficients ranged from .907 to .920 (see Appendix A). The Overall
job satisfaction scale reflected a reliability coefficient of .91. Given these results, one can infer
that the lowest reliable variance of the total scores was at least 90%. Green (2000) advise that
check the alpha reliability noting that you are looking for at least a .70 but would be most pleased
with a value greater than .80. The findings indicate that each of the 20 MSQ scale scores has
adequate internal consistency reliability.
3.5 Procedure of Data Collection In this study, the data will be collected by using a structured questionnaire which consisted three
sections with a total number of 48 items (see appendix D). Below are the illustrations for each
section:
Section A: deals with gathering information relating to the demographic and personal data of the
respondents and organizational characteristics of the respondent’s organizations.
Section B: indicates how much number of points that are given to the alternative that is most
similar to cultural dimension of the organization in question.
Section C: indicates how much the degree of agreement or disagreement that the respondents
perceived on job satisfaction.
In line with the advice of Tayie (2005) clear instructions were given at the beginning of each
section as well as clear explanation on interpretation of the instruments. The questionnaire was
accompanied by a cover letter explaining the purpose of the study to prospective participants, the
importance of completing the questionnaire, the confidentiality of respondents answer and
general instructions on how to complete the questionnaire. The questionnaire will be distributed
to 146 respondents from academic staff. The respondents are given a three weeks time to
complete and return the questionnaire by hand to their respective department secretaries.
During the process of data gathering the researcher had adhered to the following research ethical
principles:
Freedom from coercion- No participant was forced or pressured to participate in the study.
Confidentiality-the data from the study is published in a way that protects the anonymity
of the research participants.
37
3.6 Method of Data Analysis The purpose of the study is to test empirically whether there is relationship between
organizational culture and job satisfaction level of academic staff. The study examined the
relationship of a set of predictor cultural type variables: clan, adhocracy, market and hierarchy
with job satisfaction level of academic staff at St Mary’s University College. In order to achieve
the above research objective the study was relied on the following descriptive and inferential
statistics procedures:
Descriptive statistics (mean standard deviations, percentage, percentile, frequencies,
tables and graphs) – to describe the characteristics of respondents and to compare results.
Parametric statistics (ANOVAs) - to test for statistically significance differences between
the two groups (Dominant culture difference among highest degree held categories of
respondents).
Non- parametric statistics (Spearman’s rho) – to determine the correlation between
organizational culture type scores and job satisfaction scores.
Ordinal regression- to identify the predictor variables that are responsible for the most
significance variance in job satisfaction level of academic staff of SMUC.
3.6.1 Means and Standard Deviation Means and standard deviation are techniques used to describe characteristics of study participants
and compare results (Kerr, Hall and Kozub, 2002). The mean is measure of central tendency that
measures what sets of measures are like on average. The standard deviation (SD) is a measure of
the extent to which the values in a distribution cluster around the mean (Mujis, 2004). The mean
and standard deviation were used to calculate and plot the result of OCAI instrument and
frequency of MSQ facets. The OCAI scores from each of the participants were entered onto
SPSS software. Based on the provided formulae by the competing value framework the
calculation of cultural type mean scores was as follows:
Clan Culture = Mean ( Mean score of Clan for the first respondent + Mean score of Clan for the
second respondent + Mean score of Clan for the third respondent+,,,,,,,,,, +
Mean score of Clan for the one hundred seventh respondent).
38
In which mean score of clan for the respondents= mean (Dominant characteristics dimension A+
Organizational leadership dimension A+ Management of Employees dimension A
+ Organizational glue dimension A+ strategic emphasis dimension A+ Criteria
for success dimension A)
Adhocracy Culture = Mean ( Mean score of Adhocracy for the first respondent + Mean score of
Adhocracy for the second respondent + Mean score of Adhocracy for the third
respondent+,,,,,,,,,, + Mean score of Adhocracy for the one hundred seventh
respondent).
In which mean score of Adhocracy for the respondents= mean (Dominant characteristics
dimension B+ Organizational leadership dimension B+ Management of
Employees dimension B + Organizational glue dimension B+ strategic emphasis
dimension B+ Criteria for success dimension B)
Market Culture = Mean ( Mean score of Market for the first respondent + Mean score of Market
for the second respondent + Mean score of Market for the third
respondent+,,,,,,,,,, + Mean score of Market for the one hundred seventh
respondent).
In which mean score of Market for the respondents= mean (Dominant characteristics dimension
C+ Organizational leadership dimension C+ Management of Employees
dimension C + Organizational glue dimension C+ strategic emphasis dimension
C+ Criteria for success dimension C)
Hierarchy Culture = Mean ( Mean score of Hierarchy for the first respondent + Mean score of
Hierarchy for the second respondent + Mean score of Hierarchy for the third
respondent+,,,,,,,,,, + Mean score of Hierarchy for the one hundred seventh
respondent).
In which mean score of Hierarchy for the respondents= mean (Dominant characteristics
dimension D+ Organizational leadership dimension D+ Management of
Employees dimension D + Organizational glue dimension D+ strategic emphasis
dimension D+ Criteria for success dimension D)
Then, the next step was to plot the combined mean scores on a quadrant using a radar chart to
depict the profile of culture of St Mary’s University College.
The scores of Overall, general, intrinsic and extrinsic job satisfaction levels were computed by
summing the response weights across the appropriate 20 items for each participant. The results
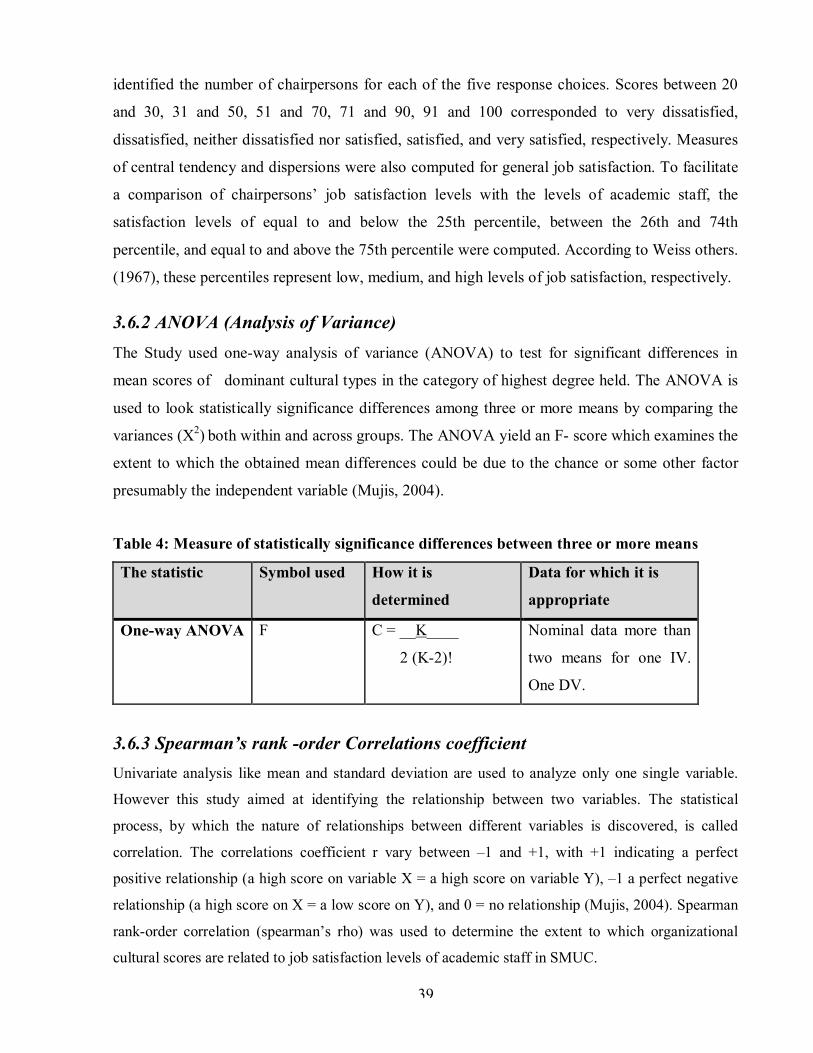
39
identified the number of chairpersons for each of the five response choices. Scores between 20
and 30, 31 and 50, 51 and 70, 71 and 90, 91 and 100 corresponded to very dissatisfied,
dissatisfied, neither dissatisfied nor satisfied, satisfied, and very satisfied, respectively. Measures
of central tendency and dispersions were also computed for general job satisfaction. To facilitate
a comparison of chairpersons’ job satisfaction levels with the levels of academic staff, the
satisfaction levels of equal to and below the 25th percentile, between the 26th and 74th
percentile, and equal to and above the 75th percentile were computed. According to Weiss others.
(1967), these percentiles represent low, medium, and high levels of job satisfaction, respectively.
3.6.2 ANOVA (Analysis of Variance) The Study used one-way analysis of variance (ANOVA) to test for significant differences in
mean scores of dominant cultural types in the category of highest degree held. The ANOVA is
used to look statistically significance differences among three or more means by comparing the
variances (X2) both within and across groups. The ANOVA yield an F- score which examines the
extent to which the obtained mean differences could be due to the chance or some other factor
presumably the independent variable (Mujis, 2004).
Table 4: Measure of statistically significance differences between three or more means
The statistic Symbol used How it is
determined
Data for which it is
appropriate
One-way ANOVA F C = __K____
2 (K-2)!
Nominal data more than
two means for one IV.
One DV.
3.6.3 Spearman’s rank -order Correlations coefficient Univariate analysis like mean and standard deviation are used to analyze only one single variable.
However this study aimed at identifying the relationship between two variables. The statistical
process, by which the nature of relationships between different variables is discovered, is called
correlation. The correlations coefficient r vary between –1 and +1, with +1 indicating a perfect
positive relationship (a high score on variable X = a high score on variable Y), –1 a perfect negative
relationship (a high score on X = a low score on Y), and 0 = no relationship (Mujis, 2004). Spearman
rank-order correlation (spearman’s rho) was used to determine the extent to which organizational
cultural scores are related to job satisfaction levels of academic staff in SMUC.
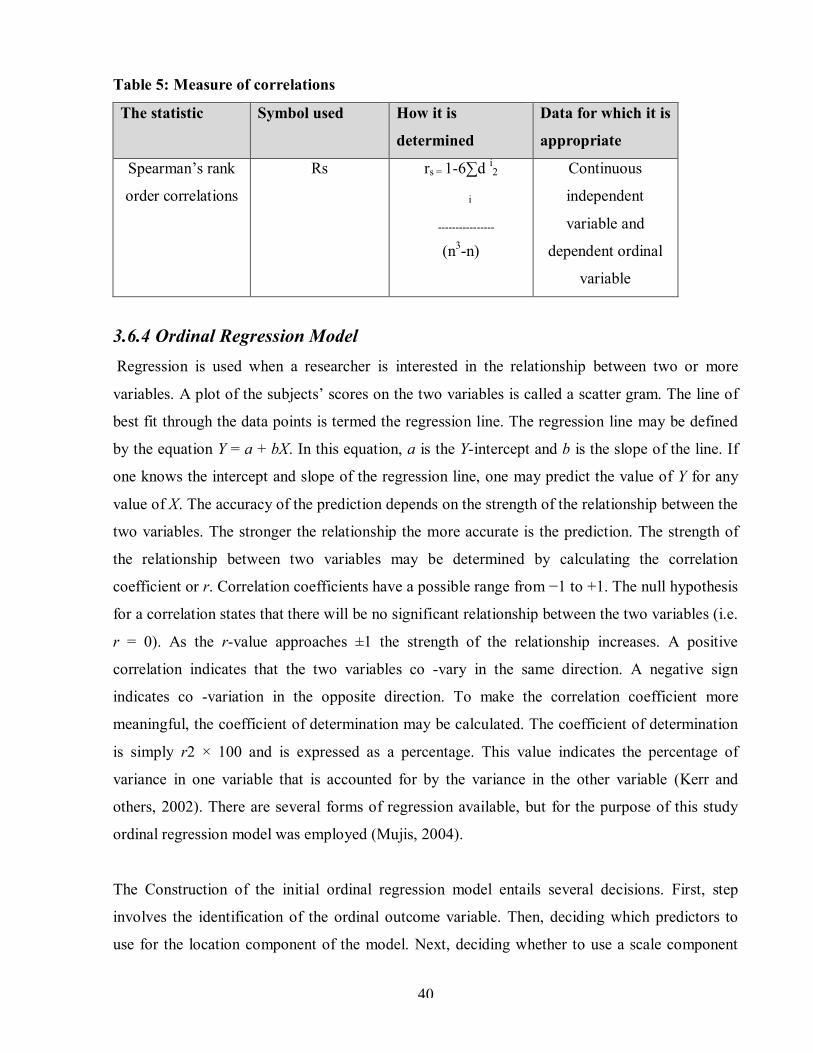
40
Table 5: Measure of correlations
The statistic Symbol used How it is
determined
Data for which it is
appropriate
Spearman’s rank
order correlations
Rs rs = 1-6∑d i2
i
----------------
(n3-n)
Continuous
independent
variable and
dependent ordinal
variable
3.6.4 Ordinal Regression Model Regression is used when a researcher is interested in the relationship between two or more
variables. A plot of the subjects’ scores on the two variables is called a scatter gram. The line of
best fit through the data points is termed the regression line. The regression line may be defined
by the equation Y = a + bX. In this equation, a is the Y-intercept and b is the slope of the line. If
one knows the intercept and slope of the regression line, one may predict the value of Y for any
value of X. The accuracy of the prediction depends on the strength of the relationship between the
two variables. The stronger the relationship the more accurate is the prediction. The strength of
the relationship between two variables may be determined by calculating the correlation
coefficient or r. Correlation coefficients have a possible range from −1 to +1. The null hypothesis
for a correlation states that there will be no significant relationship between the two variables (i.e.
r = 0). As the r-value approaches ±1 the strength of the relationship increases. A positive
correlation indicates that the two variables co -vary in the same direction. A negative sign
indicates co -variation in the opposite direction. To make the correlation coefficient more
meaningful, the coefficient of determination may be calculated. The coefficient of determination
is simply r2 × 100 and is expressed as a percentage. This value indicates the percentage of
variance in one variable that is accounted for by the variance in the other variable (Kerr and
others, 2002). There are several forms of regression available, but for the purpose of this study
ordinal regression model was employed (Mujis, 2004).
The Construction of the initial ordinal regression model entails several decisions. First, step
involves the identification of the ordinal outcome variable. Then, deciding which predictors to
use for the location component of the model. Next, deciding whether to use a scale component
41
and, if it is needed, what predictors to use for it. Finally, deciding which link function best fits the
research questions and the structure of the data.
I. Identification of the outcome variable
The identification of the dependent outcome variable was made based on the percentile scores of
respondents on the four categories of job satisfaction namely intrinsic, extrinsic, general and
overall satisfaction scores of teachers which are suggested for analyzing the Minnesota job
satisfaction questionnaire by Weiss and others (1967). Percentile satisfaction scores of
respondents less than 25 were considered as low satisfaction category and they are coded one.
Percentile scores which range from 26-74 were regarded as medium satisfaction category and
coded as 2.furethermore, percentile scores greater or equal to 75 were considered to be as high
satisfaction category and they were coded as 3.Finally , those questionnaires with missing values
were coded as 9 and excluded from the model. Therefore, out of the total 107 population of the
study 8, 1,1and 9 questionnaires were discarded respectively for intrinsic, extrinsic, general and
overall satisfaction facets.
II. Choosing Predictor for the location model
Similar to linear regression model both theoretical and empirical considerations were taken into
account in selecting predictors. Initially, All organizational cultural types; clan, adhocracy,
market and hierarchy were considered as important predictor variables in the model. However,
when some of those predictors seem not to be helpful in the model, they were removed and the
model was re-estimated .This was made possible based on the output of spearman rho correlation
analysis. Therefore, those cultural types with no statistically significant outcome (clan and
adhocracy) were removed.
III. The decision to use a scale component This decision had involved two stages. The first decision was whether to include a scale component in
the model at all. The scale component was found to be unnecessary; as a result the location-only
model was selected at the second stage since it provides a good summary of the data.

42
IV. Choosing the link function that best fit the research question
Two commonly used link functions, e.g., Negative log- log and logit link were chosen to build
the ordinal regression model. When the frequency distribution of the ordered categorical outcome
exhibited that the data points were evenly distributed in various categories, the logit link function
was used. However, when the frequency distribution of the ordered categorical outcome showed
that a large percent of Teacher respondents were in lower categories such as low satisfaction
category, and then the Negative log-log link function was used. In fact, there was no clear-cut
choice of link functions. This is because, when one link function did not provide a good fit to the
data, then the other link function might be a viable alternative (Chen & Hughes, 2004).
As a result the alternative link functions were tested to see if the model turned out to be the better
one. In addition, the model assumption of parallel lines across the corresponding response
categories in the link functions was carefully examined to determine the model adequacy.
Because the link functions were used to form the ordinal regression models under a strong
assumption of parallel lines, any departures from this assumption might result in the incorrect
analysis and conclusion (Mc Cullagh, 1980). Furthermore, the contingency or confusion table
showing the accuracy of the classification for the ordered categorical outcome was evaluated to
determine which link function was superior.
In order to interpret the ordinal regression model, we first look at the signs of the regression
coefficients. These signs give a great deal of insight into the effects of the predictor variables on
the ordinal outcome. The positive regression coefficient indicated that there was a positive
relationship between the predictor variable and the ordinal outcome. For the opposite direction,
the negative regression coefficient indicated that there was a negative relationship between the
explanatory variable and ordinal outcome. If the logit link (or Negative log-log link) was a choice
of the modeling equation, the magnitude (e.g., odds or eβ) of the effect of a specific predictor
variable would be used to indicate that an average of one unit change on a specific predictor
variable (Cultural score) affects on the change of the odds (or relative risk) of the event
occurrence by a factor of eβ, holding other predictor variables as constant.
The model construction generally involves the use of the reduced models along with Negative
log- log and logit link functions to create a pool of the candidate models. By examining one
candidate model at a time, the test of parallel lines was used as the fundamental step to assess the
43
validity of the model assumption. Certain candidate models in a pool were discarded if they
failed to provide the evidence of satisfying the model assumption. Additionally, the model fitting
statistics, e.g., pseudo R squares, and the accuracy of classification results was used as criteria to
screen the candidate models and choose the appropriate ones. When these sound appropriate
models were chosen, a few observations or insignificant Predictor variables (say, one or two) on
the questionnaire was eliminated to investigate the stability of the modified models (e.g., model
parameters slightly changed after the temporary elimination). When the modified models
exhibited instability, they needed to be discarded immediately.
The model-fitting statistic, namely the pseudo R square, measured the success of the model in
explaining the variations in the data. The pseudo R square was calculated depending upon the
likelihood ratio. For example, the McFadden’s R square compared the likelihood for the intercept
only model to the likelihood for the model with the explanatory variables in order to assess the
model goodness of fit. The interpretation of pseudo R square in the ordinal regression model was
similar to that of the R square (e.g., Coefficient of the Determination) in the linear regression
model. The pseudo R square indicated that the proportion of variations in the outcome variable
was accounted for by culture variable. The larger the pseudo R square was, the better the model
fitting was.

44
The Generalized formula using location model for the ordinal regression model was indicated as
follows:
For the logit link:
For Negative log-log link:
Link (γj) = θj – [β1x1 β2x2 … βkxk]
Where:
γj is the cumulative probability for the jth Job
satisfaction category,
θ is the threshold for the jth category,
β1 … βk are the regression coefficients,
X1…xk are the predictor cultural score variables,
And k is the number of predictors.
Ln (γ/1-γ) = β0 β1x1 β2x2 … βkxk
–ln (–ln (γ)) = β0 β1x1 β2x2 … βkxk
45
CHAPTER FOUR
PRESENTATION AND ANALYSIS OF THE DATA This chapter discusses the results of data analysis collected from respondents. The main purpose
of this study is to study the relationship between organizational culture types as the predictor
(independent) variable, and job satisfaction as the dependent variable. This study aims to achieve
the research objectives as well as answers the research questions highlighted in chapter one.
4.1 Overview of Data Collected In this research, as mentioned, census of all instructors working in 2010-2011 academic year was
taken and 146 questionnaires were distributed among teachers. Out of the 146 instructors, 123
teachers have made response. However, since some of the respondents didn’t fill properly the
questionnaire as per its instruction, only 107 of the questionnaires were found to be useful.
Therefore, finally a total of 107 teachers’ results were analyzed and discussed.
4.2 Respondents Profile Frequency analysis was used to examine the demographic characteristics of the respondents from
academic staff at St Mary’s University College. Nominal data like gender, age, and education
level, years of experience and terms of employment presented below. The frequency distribution,
percentages, and summary statistics of the participants’ are shown in appendix E. The majority of
the teachers, 54.2%, fell within the category of 31-40 years. The second majority 36.4 % of the
teachers were found within the category of 21-30 years. The oldest participants, 2.8% fell within
the category of 51-60 and finally 6.5% of respondents fell within the category of 41-50 years. In
addition to this, Of the 107 participants in this study, 91.6 % ( n = 93) were male and 3.7 % ( n =
3) were female. Five participants did not respond to the gender item of the questionnaire.
Moreover, the majority of the teachers, 68.2% (n = 73), had obtained a master’s degree and 1.9 %
(n = 2) a doctorate, 26.2%, (n = 28) earned bachelor’s and 3.7% (n= 4) earned other like
advanced diploma. Overall, the Teachers appear to be moderately highly educated with 70.1%
holding a second degree and above. These imply that there were only few highly educated staff
(only 2 PHD holders) as far as academic of certification are concern. Also 54.2% (n = 58)
respondents were permanent full time employees, 25.2 % (n=14) were part timers, also 13.1%
(n=14) were joint staff and finally 7.5% (n=8) were contract employees.
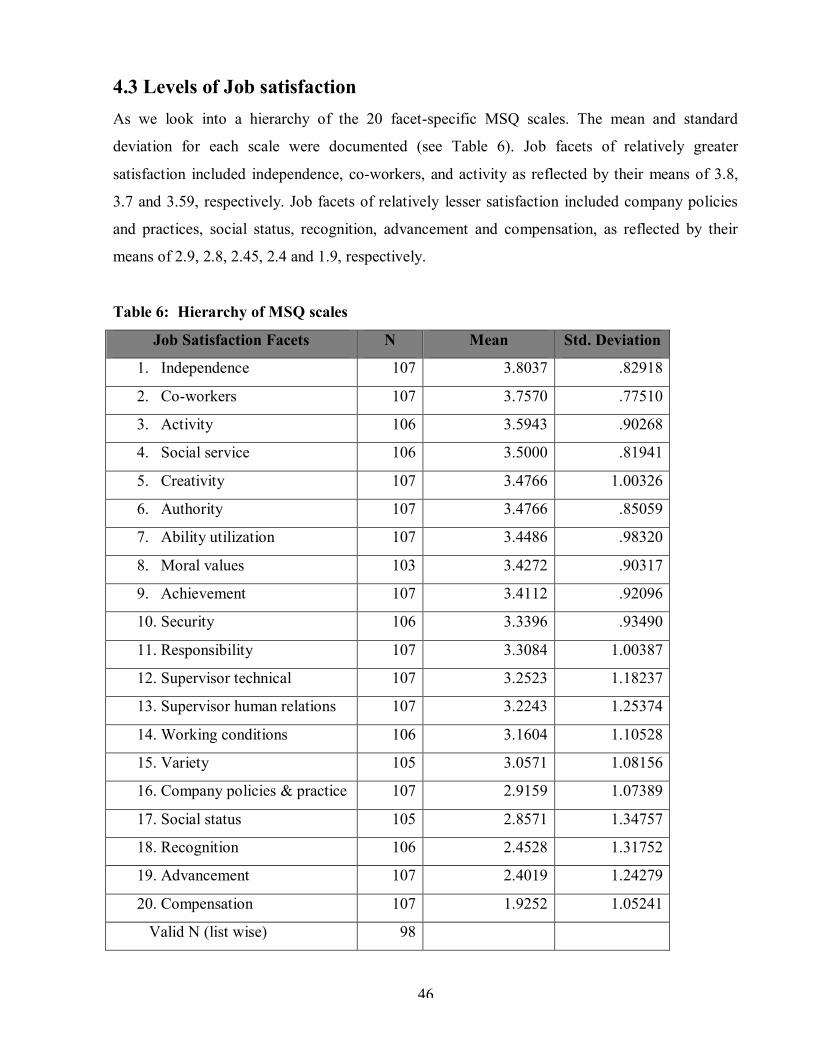
46
4.3 Levels of Job satisfaction As we look into a hierarchy of the 20 facet-specific MSQ scales. The mean and standard
deviation for each scale were documented (see Table 6). Job facets of relatively greater
satisfaction included independence, co-workers, and activity as reflected by their means of 3.8,
3.7 and 3.59, respectively. Job facets of relatively lesser satisfaction included company policies
and practices, social status, recognition, advancement and compensation, as reflected by their
means of 2.9, 2.8, 2.45, 2.4 and 1.9, respectively.
Table 6: Hierarchy of MSQ scales
Job Satisfaction Facets N Mean Std. Deviation
1. Independence 107 3.8037 .82918
2. Co-workers 107 3.7570 .77510
3. Activity 106 3.5943 .90268
4. Social service 106 3.5000 .81941
5. Creativity 107 3.4766 1.00326
6. Authority 107 3.4766 .85059
7. Ability utilization 107 3.4486 .98320
8. Moral values 103 3.4272 .90317
9. Achievement 107 3.4112 .92096
10. Security 106 3.3396 .93490
11. Responsibility 107 3.3084 1.00387
12. Supervisor technical 107 3.2523 1.18237
13. Supervisor human relations 107 3.2243 1.25374
14. Working conditions 106 3.1604 1.10528
15. Variety 105 3.0571 1.08156
16. Company policies & practice 107 2.9159 1.07389
17. Social status 105 2.8571 1.34757
18. Recognition 106 2.4528 1.31752
19. Advancement 107 2.4019 1.24279
20. Compensation 107 1.9252 1.05241
Valid N (list wise) 98

47
The above results were explored further using frequencies to see the distribution of lesser
satisfaction facets that are mentioned above. Considering the job facets of relatively lesser
satisfaction (see Table 7), 42.1 % of the respondents were dissatisfied with company policies and
practices. Over 26.2% of the respondents were very dissatisfied on social status of teaching
profession. Moreover, 33.6% and 17.8 % of respondents were very dissatisfied and dissatisfied
respectively over the recognition they received from the university college. Furthermore,
33.6%and 19.6% of teachers expressed their very dissatisfaction and dissatisfaction over
advancement .Finally, 45.8% and 28% of the respondents were very dissatisfied and dissatisfied
respectively with compensation package of the university college.
Table 7: Frequencies and Percentages of Dissatisfaction/Satisfaction Ratings of 20 Job
Facets as Measured by the MSQ (N = 107)
Job facets Very dissatisfied
dissatisfied neutral Satisfied Very satisfied
n % n % n % n % n % 1.Ability utilization 4 3.7 9 8.4 46 43 31 29.0 17 15.9
2.Achievement 4 3.7 9 8.4 44 41.4 39 36.4 11 10.3 3.Activity 3 2.8 10 9.3 25 23.4 57 53.3 11 10.3 4.Advancement 36 33.6 21 19.6 25 23.4 21 19.6 4 3.7 5.Authority 0 0 11 10.3 48 44.9 34 31.8 14 13.1 6.Company policies 4 3.7 45 42.1 23 21.5 26 24.3 9 8.4 7.Compensation 49 45.8 30 28 16 15 11 10.3 1 .9 8.Co-workers 0 0 9 8.4 21 19.6 64 59.8 13 12.1 9.Creativity 5 4.7 8 7.5 42 39.3 35 32.7 17 15.9 10.Independence 2 1.9 6 5.6 19 17.8 64 59.8 16 15 11.Moral values 3 2.8 8 7.5 46 43 34 31.8 12 11.2 12.Recognition 36 33.6 19 17.8 27 25.2 15 14 9 8.4 13.Responsibility 5 4.7 15 14 41 38.3 34 31.8 12 11.2 14.Security 5 4.7 14 13.1 32 29.9 50 46.7 5 4.7 15.Social service 0 0 9 8.4 48 44.9 36 33.6 13 12.1 16.Social status 28 26.2 9 8.4 28 26.2 30 28 10 9.3 17.Supervision Relation
6 5.6 36 33.6 13 12.1 32 29.9 20 18.7
18.Supervision-technical
4 3.7 34 31.8 18 16.8 33 30.8 18 16.8
19.Variety 5 4.7 32 29.9 31 29 26 24.3 11 10.3 20.Working conditions
3 2.8 35 32.7 23 21.5 32 29.9 13 12.1
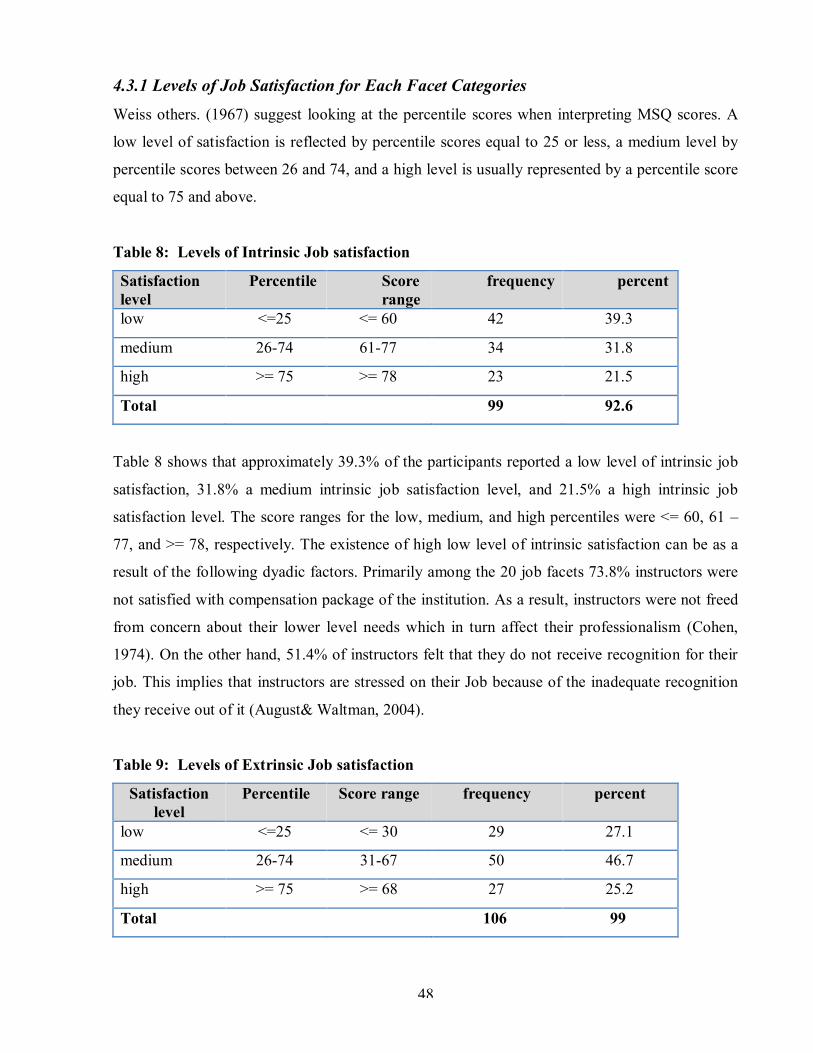
48
4.3.1 Levels of Job Satisfaction for Each Facet Categories Weiss others. (1967) suggest looking at the percentile scores when interpreting MSQ scores. A
low level of satisfaction is reflected by percentile scores equal to 25 or less, a medium level by
percentile scores between 26 and 74, and a high level is usually represented by a percentile score
equal to 75 and above.
Table 8: Levels of Intrinsic Job satisfaction
Satisfaction level
Percentile Score range
frequency percent
low <=25 <= 60 42 39.3
medium 26-74 61-77 34 31.8
high >= 75 >= 78 23 21.5
Total 99 92.6
Table 8 shows that approximately 39.3% of the participants reported a low level of intrinsic job
satisfaction, 31.8% a medium intrinsic job satisfaction level, and 21.5% a high intrinsic job
satisfaction level. The score ranges for the low, medium, and high percentiles were <= 60, 61 –
77, and >= 78, respectively. The existence of high low level of intrinsic satisfaction can be as a
result of the following dyadic factors. Primarily among the 20 job facets 73.8% instructors were
not satisfied with compensation package of the institution. As a result, instructors were not freed
from concern about their lower level needs which in turn affect their professionalism (Cohen,
1974). On the other hand, 51.4% of instructors felt that they do not receive recognition for their
job. This implies that instructors are stressed on their Job because of the inadequate recognition
they receive out of it (August& Waltman, 2004).
Table 9: Levels of Extrinsic Job satisfaction
Satisfaction level
Percentile Score range frequency percent
low <=25 <= 30 29 27.1
medium 26-74 31-67 50 46.7
high >= 75 >= 68 27 25.2
Total 106 99
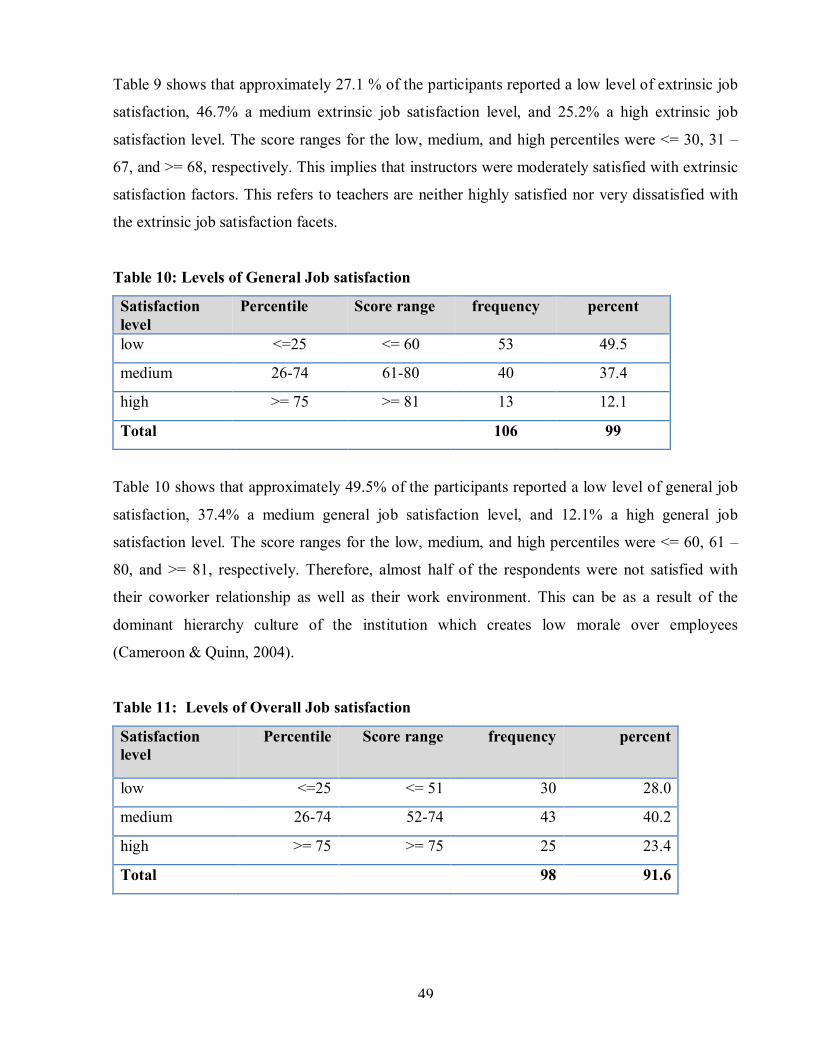
49
Table 9 shows that approximately 27.1 % of the participants reported a low level of extrinsic job
satisfaction, 46.7% a medium extrinsic job satisfaction level, and 25.2% a high extrinsic job
satisfaction level. The score ranges for the low, medium, and high percentiles were <= 30, 31 –
67, and >= 68, respectively. This implies that instructors were moderately satisfied with extrinsic
satisfaction factors. This refers to teachers are neither highly satisfied nor very dissatisfied with
the extrinsic job satisfaction facets.
Table 10: Levels of General Job satisfaction
Satisfaction level
Percentile Score range frequency percent
low <=25 <= 60 53 49.5
medium 26-74 61-80 40 37.4
high >= 75 >= 81 13 12.1
Total 106 99
Table 10 shows that approximately 49.5% of the participants reported a low level of general job
satisfaction, 37.4% a medium general job satisfaction level, and 12.1% a high general job
satisfaction level. The score ranges for the low, medium, and high percentiles were <= 60, 61 –
80, and >= 81, respectively. Therefore, almost half of the respondents were not satisfied with
their coworker relationship as well as their work environment. This can be as a result of the
dominant hierarchy culture of the institution which creates low morale over employees
(Cameroon & Quinn, 2004).
Table 11: Levels of Overall Job satisfaction
Satisfaction level
Percentile Score range frequency percent
low <=25 <= 51 30 28.0
medium 26-74 52-74 43 40.2
high >= 75 >= 75 25 23.4
Total 98 91.6
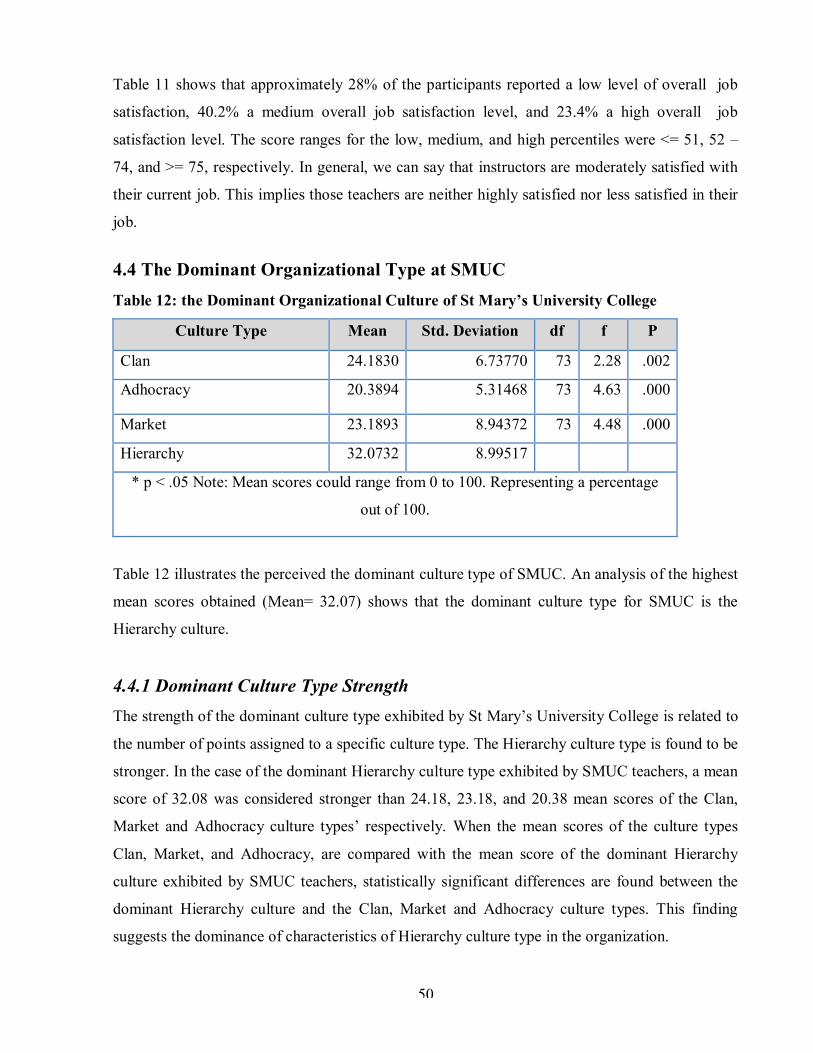
50
Table 11 shows that approximately 28% of the participants reported a low level of overall job
satisfaction, 40.2% a medium overall job satisfaction level, and 23.4% a high overall job
satisfaction level. The score ranges for the low, medium, and high percentiles were <= 51, 52 –
74, and >= 75, respectively. In general, we can say that instructors are moderately satisfied with
their current job. This implies those teachers are neither highly satisfied nor less satisfied in their
job.
4.4 The Dominant Organizational Type at SMUC Table 12: the Dominant Organizational Culture of St Mary’s University College
Culture Type Mean Std. Deviation df f P
Clan 24.1830 6.73770 73 2.28 .002
Adhocracy 20.3894 5.31468 73 4.63 .000
Market 23.1893 8.94372 73 4.48 .000
Hierarchy 32.0732 8.99517
* p < .05 Note: Mean scores could range from 0 to 100. Representing a percentage
out of 100.
Table 12 illustrates the perceived the dominant culture type of SMUC. An analysis of the highest
mean scores obtained (Mean= 32.07) shows that the dominant culture type for SMUC is the
Hierarchy culture.
4.4.1 Dominant Culture Type Strength The strength of the dominant culture type exhibited by St Mary’s University College is related to
the number of points assigned to a specific culture type. The Hierarchy culture type is found to be
stronger. In the case of the dominant Hierarchy culture type exhibited by SMUC teachers, a mean
score of 32.08 was considered stronger than 24.18, 23.18, and 20.38 mean scores of the Clan,
Market and Adhocracy culture types’ respectively. When the mean scores of the culture types
Clan, Market, and Adhocracy, are compared with the mean score of the dominant Hierarchy
culture exhibited by SMUC teachers, statistically significant differences are found between the
dominant Hierarchy culture and the Clan, Market and Adhocracy culture types. This finding
suggests the dominance of characteristics of Hierarchy culture type in the organization.
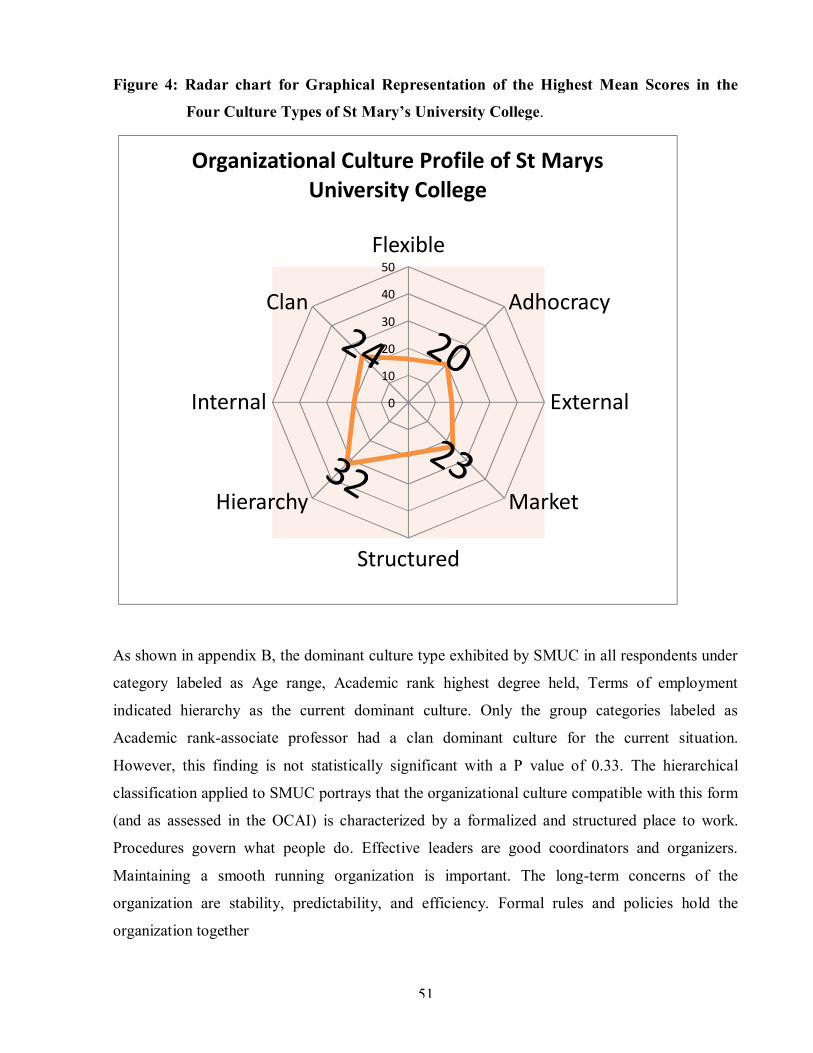
51
Figure 4: Radar chart for Graphical Representation of the Highest Mean Scores in the
Four Culture Types of St Mary’s University College.
0
10
20
30
40
50Flexible
Adhocracy
External
Market
Structured
Hierarchy
Internal
Clan
Organizational Culture Profile of St Marys University College
As shown in appendix B, the dominant culture type exhibited by SMUC in all respondents under
category labeled as Age range, Academic rank highest degree held, Terms of employment
indicated hierarchy as the current dominant culture. Only the group categories labeled as
Academic rank-associate professor had a clan dominant culture for the current situation.
However, this finding is not statistically significant with a P value of 0.33. The hierarchical
classification applied to SMUC portrays that the organizational culture compatible with this form
(and as assessed in the OCAI) is characterized by a formalized and structured place to work.
Procedures govern what people do. Effective leaders are good coordinators and organizers.
Maintaining a smooth running organization is important. The long-term concerns of the
organization are stability, predictability, and efficiency. Formal rules and policies hold the
organization together
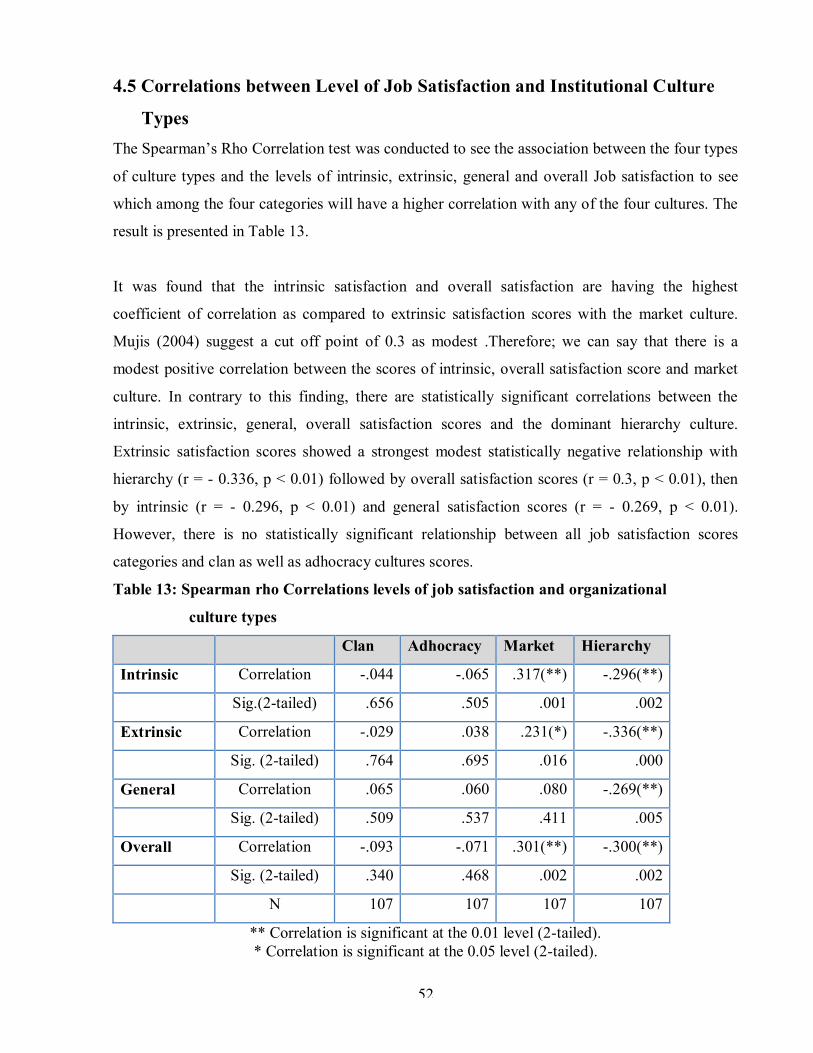
52
4.5 Correlations between Level of Job Satisfaction and Institutional Culture
Types The Spearman’s Rho Correlation test was conducted to see the association between the four types
of culture types and the levels of intrinsic, extrinsic, general and overall Job satisfaction to see
which among the four categories will have a higher correlation with any of the four cultures. The
result is presented in Table 13.
It was found that the intrinsic satisfaction and overall satisfaction are having the highest
coefficient of correlation as compared to extrinsic satisfaction scores with the market culture.
Mujis (2004) suggest a cut off point of 0.3 as modest .Therefore; we can say that there is a
modest positive correlation between the scores of intrinsic, overall satisfaction score and market
culture. In contrary to this finding, there are statistically significant correlations between the
intrinsic, extrinsic, general, overall satisfaction scores and the dominant hierarchy culture.
Extrinsic satisfaction scores showed a strongest modest statistically negative relationship with
hierarchy (r = - 0.336, p < 0.01) followed by overall satisfaction scores (r = 0.3, p < 0.01), then
by intrinsic (r = - 0.296, p < 0.01) and general satisfaction scores (r = - 0.269, p < 0.01).
However, there is no statistically significant relationship between all job satisfaction scores
categories and clan as well as adhocracy cultures scores.
Table 13: Spearman rho Correlations levels of job satisfaction and organizational
culture types
Clan Adhocracy Market Hierarchy
Intrinsic Correlation -.044 -.065 .317(**) -.296(**)
Sig.(2-tailed) .656 .505 .001 .002
Extrinsic Correlation -.029 .038 .231(*) -.336(**)
Sig. (2-tailed) .764 .695 .016 .000
General Correlation .065 .060 .080 -.269(**)
Sig. (2-tailed) .509 .537 .411 .005
Overall Correlation -.093 -.071 .301(**) -.300(**)
Sig. (2-tailed) .340 .468 .002 .002
N 107 107 107 107
** Correlation is significant at the 0.01 level (2-tailed). * Correlation is significant at the 0.05 level (2-tailed).

53
4.6 Ordinal Regression Analysis
4.6.1 Ordinal Regression Model for Intrinsic Satisfaction Facets Based on the assumptions made on chapter 3, the study results for the reduced model containing
all satisfaction facets categories revealed the following findings. Within the reduced models, the
negative log-log link was the better choice because of its satisfying ‘parallel lines’ assumption
and larger model fitting statistics, which will be discussed later.
Table 14: Parameter Estimates of intrinsic job satisfaction facet
Estimate Std. Error
Wald df Sig.
Threshold [intrinsic= 1.00] -1.194 .503 5.639 1 .018
[intrinsic= 2.00] .028 .511 .003 1 .956
Location hierarchy -.042 .016 7.127 1 .008
Link function: Negative Log-log.
Using the reduced model with the negative log-log link, Table 14 shows that the first threshold of
the model equation was significantly different from zero and substantially contributed to the
values of the response probability in low satisfaction category. In addition, the satisfaction of the
intrinsic satisfaction facet was significantly associated with the hierarchy culture. The hierarchy
culture exhibited negative regression coefficients, indicating that teachers who rated higher
scores for hierarchy culture was likely to rate a lower satisfaction scores for intrinsic job
satisfaction facet. Furthermore, using the reduced model with the logit link and clog log link to
build the ordinal regression model, the intrinsic job satisfaction facet was found to be
significantly associated with hierarchy culture. However, since both reduced models with the
logit link and clog log link failed to provide the evidence of superior satisfying ‘parallel Lines’
assumption and model fitting statistics , they were discarded and it is also unnecessary to prepare
a table that contains item name, regression coefficient, and p value in this paper.
As shown in appendix C, The pseudo R squares for McFadden (.40), Cox and Snell (.081), and
Nagelkerke (.092) in the complete model with the negative log -log link were larger than those
for McFadden (.031), Cox and Snell (.065), and Nagelkerke (.074) in the complete model with
the clog log link and McFadden (.038), Cox and Snell (.078), and Nagelkerke (.089) in the
complete model with the logit link. The additional model fitting statistic, the Pearson’s chi
54
square, (X2 = 8.2 with d.f. of 1 and p = .004) for the complete model with the negative log log
link had indicated that the observed data were not consistent with the estimated values in the
fitted model. However, this chi-squared goodness of fit statistics may not be appropriate for this
data since cultural scores are continuous in this study (SPSS 15, 2006; Chen & Hughes, 2004).
The continuous nature of the predictor variable will result in large percent of cells with zero value
which leads to inaccurate chi-square test for the model fitting. Therefore the study is not
dependent on the model fitting interpretations.
The test of parallel lines was designed to make judgment concerning the model adequacy. The
null hypothesis stated that the corresponding regression coefficients were equal across all levels
of the outcome variable. The alternative hypothesis stated that the corresponding regression
coefficients were different across all levels of the outcome variable. The chi-square test result X2
=.200 with d.f. of 1, and p = .655( see appendix C) indicated that there was no significant
difference for the corresponding regression coefficients across the response categories,
suggesting that the model assumption of parallel lines was not violated in the complete model
with the negative log log link. Also principle of parsimony, Similar to linear and logistic
regression modeling techniques, the principle of parsimony was applicable to the construction of
this ordinal regression model. As a result, if the complete models containing all organizational
culture variables were too complex, it could result in inaccurate estimation of the parameters and
instability of the model structure (Chen & Hughes, 2004). Based on the above modeling strategy,
the reduced model with the negative log log links was constructed to include only the dominant
hierarchy and the bottom low satisfaction category variables.
Evaluating the Model
In order to evaluate the model, we need to examine the predictions generated by the model.
Recall that the model is based on predicting cumulative probabilities. However, the main interest
in this study was to determine how often the model can produce correct predicted categories
based on the values of the predictor variables. To see how well the model does, we first analyze
the distribution of the actual response categories of the intrinsic satisfaction level. The histogram
chart below displays distribution of values for the outcome intrinsic satisfaction variable.
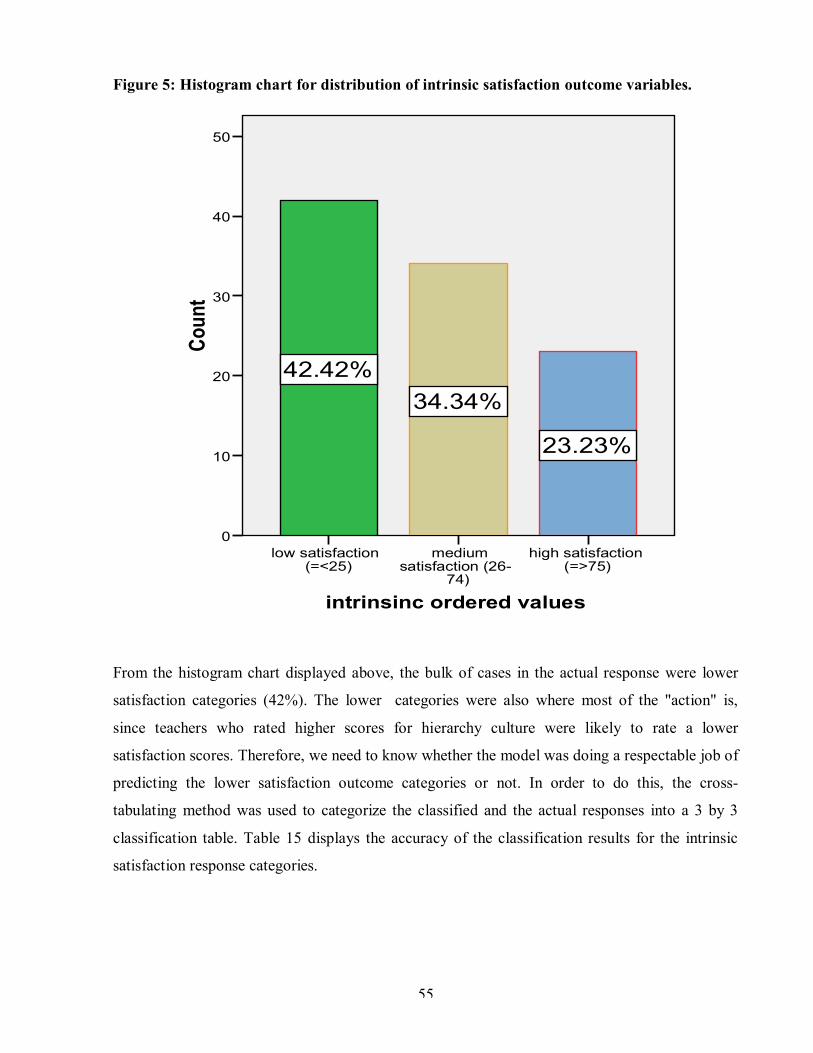
55
Figure 5: Histogram chart for distribution of intrinsic satisfaction outcome variables.
intrinsinc ordered values
high satisfaction (=>75)
medium satisfaction (26-
74)
low satisfaction (=<25)
Coun
t
50
40
30
20
10
0
23.23%
34.34%42.42%
From the histogram chart displayed above, the bulk of cases in the actual response were lower
satisfaction categories (42%). The lower categories were also where most of the "action" is,
since teachers who rated higher scores for hierarchy culture were likely to rate a lower
satisfaction scores. Therefore, we need to know whether the model was doing a respectable job of
predicting the lower satisfaction outcome categories or not. In order to do this, the cross-
tabulating method was used to categorize the classified and the actual responses into a 3 by 3
classification table. Table 15 displays the accuracy of the classification results for the intrinsic
satisfaction response categories.
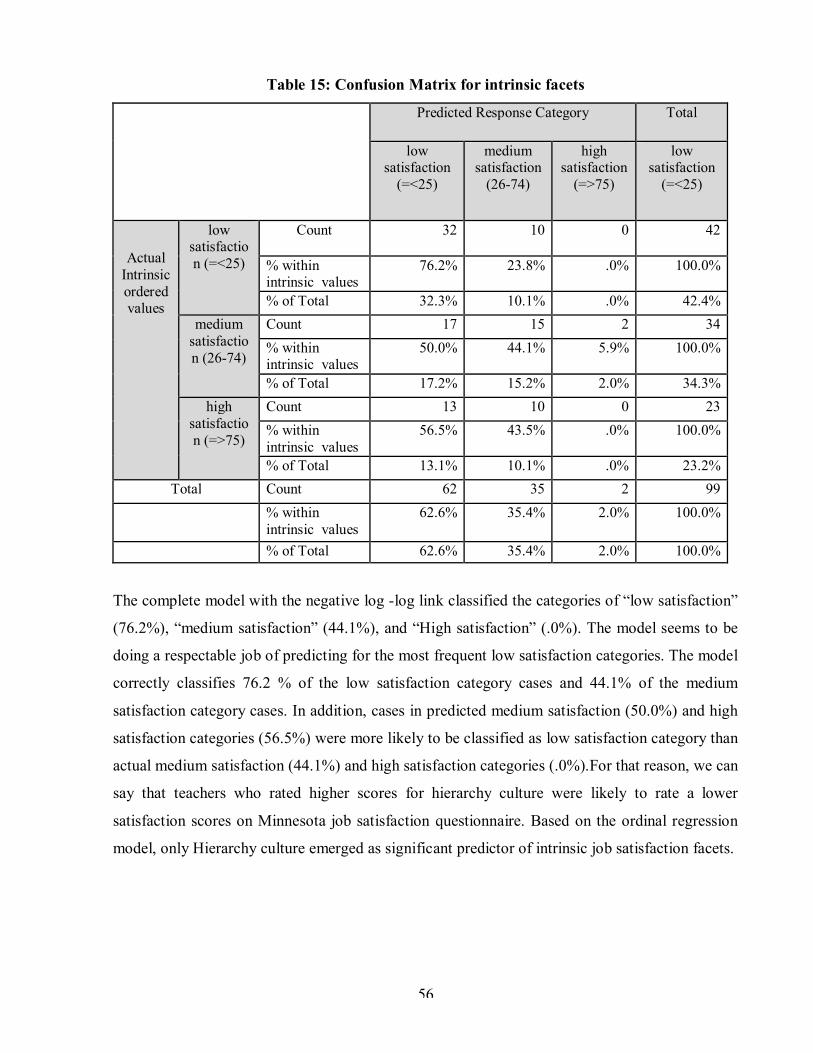
56
Table 15: Confusion Matrix for intrinsic facets
Predicted Response Category Total
low satisfaction
(=<25)
medium satisfaction
(26-74)
high satisfaction
(=>75)
low satisfaction
(=<25)
Actual Intrinsic ordered values
low satisfaction (=<25)
Count 32 10 0 42
% within intrinsic values
76.2% 23.8% .0% 100.0%
% of Total 32.3% 10.1% .0% 42.4% medium
satisfaction (26-74)
Count 17 15 2 34 % within intrinsic values
50.0% 44.1% 5.9% 100.0%
% of Total 17.2% 15.2% 2.0% 34.3% high
satisfaction (=>75)
Count 13 10 0 23 % within intrinsic values
56.5% 43.5% .0% 100.0%
% of Total 13.1% 10.1% .0% 23.2% Total Count 62 35 2 99
% within intrinsic values
62.6% 35.4% 2.0% 100.0%
% of Total 62.6% 35.4% 2.0% 100.0%
The complete model with the negative log -log link classified the categories of “low satisfaction”
(76.2%), “medium satisfaction” (44.1%), and “High satisfaction” (.0%). The model seems to be
doing a respectable job of predicting for the most frequent low satisfaction categories. The model
correctly classifies 76.2 % of the low satisfaction category cases and 44.1% of the medium
satisfaction category cases. In addition, cases in predicted medium satisfaction (50.0%) and high
satisfaction categories (56.5%) were more likely to be classified as low satisfaction category than
actual medium satisfaction (44.1%) and high satisfaction categories (.0%).For that reason, we can
say that teachers who rated higher scores for hierarchy culture were likely to rate a lower
satisfaction scores on Minnesota job satisfaction questionnaire. Based on the ordinal regression
model, only Hierarchy culture emerged as significant predictor of intrinsic job satisfaction facets.
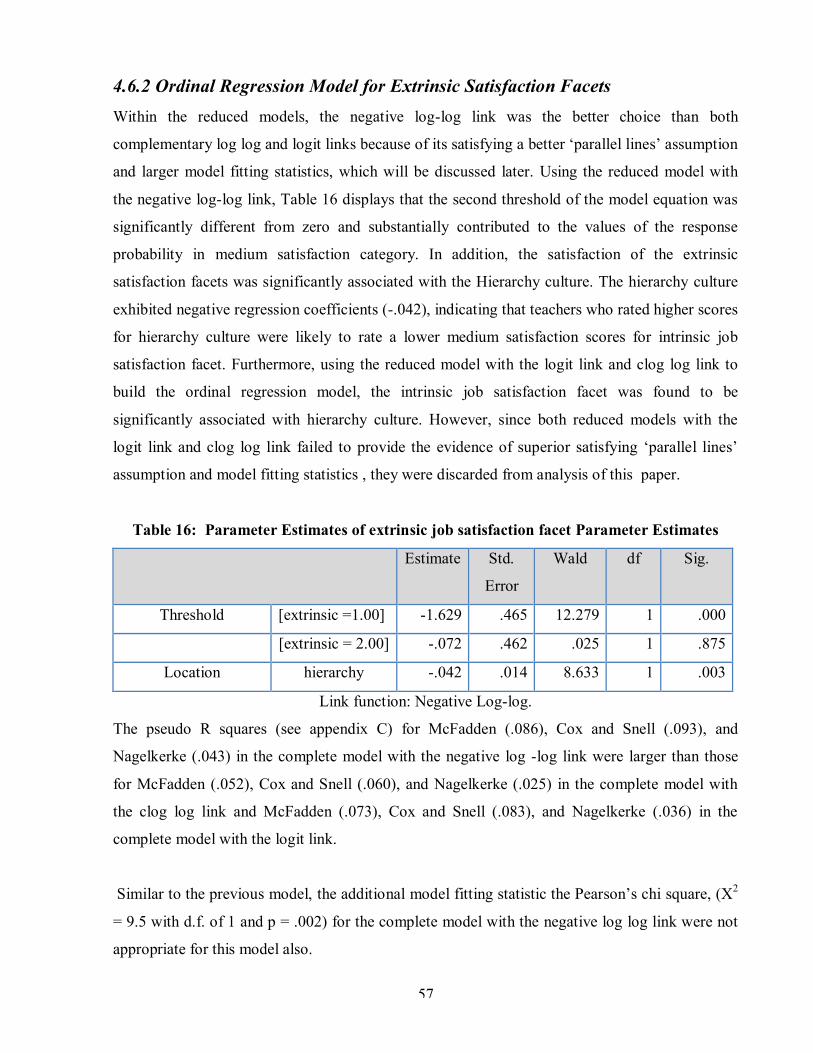
57
4.6.2 Ordinal Regression Model for Extrinsic Satisfaction Facets Within the reduced models, the negative log-log link was the better choice than both
complementary log log and logit links because of its satisfying a better ‘parallel lines’ assumption
and larger model fitting statistics, which will be discussed later. Using the reduced model with
the negative log-log link, Table 16 displays that the second threshold of the model equation was
significantly different from zero and substantially contributed to the values of the response
probability in medium satisfaction category. In addition, the satisfaction of the extrinsic
satisfaction facets was significantly associated with the Hierarchy culture. The hierarchy culture
exhibited negative regression coefficients (-.042), indicating that teachers who rated higher scores
for hierarchy culture were likely to rate a lower medium satisfaction scores for intrinsic job
satisfaction facet. Furthermore, using the reduced model with the logit link and clog log link to
build the ordinal regression model, the intrinsic job satisfaction facet was found to be
significantly associated with hierarchy culture. However, since both reduced models with the
logit link and clog log link failed to provide the evidence of superior satisfying ‘parallel lines’
assumption and model fitting statistics , they were discarded from analysis of this paper.
Table 16: Parameter Estimates of extrinsic job satisfaction facet Parameter Estimates
Estimate Std.
Error
Wald df Sig.
Threshold [extrinsic =1.00] -1.629 .465 12.279 1 .000
[extrinsic = 2.00] -.072 .462 .025 1 .875
Location hierarchy -.042 .014 8.633 1 .003
Link function: Negative Log-log.
The pseudo R squares (see appendix C) for McFadden (.086), Cox and Snell (.093), and
Nagelkerke (.043) in the complete model with the negative log -log link were larger than those
for McFadden (.052), Cox and Snell (.060), and Nagelkerke (.025) in the complete model with
the clog log link and McFadden (.073), Cox and Snell (.083), and Nagelkerke (.036) in the
complete model with the logit link.
Similar to the previous model, the additional model fitting statistic the Pearson’s chi square, (X2
= 9.5 with d.f. of 1 and p = .002) for the complete model with the negative log log link were not
appropriate for this model also.
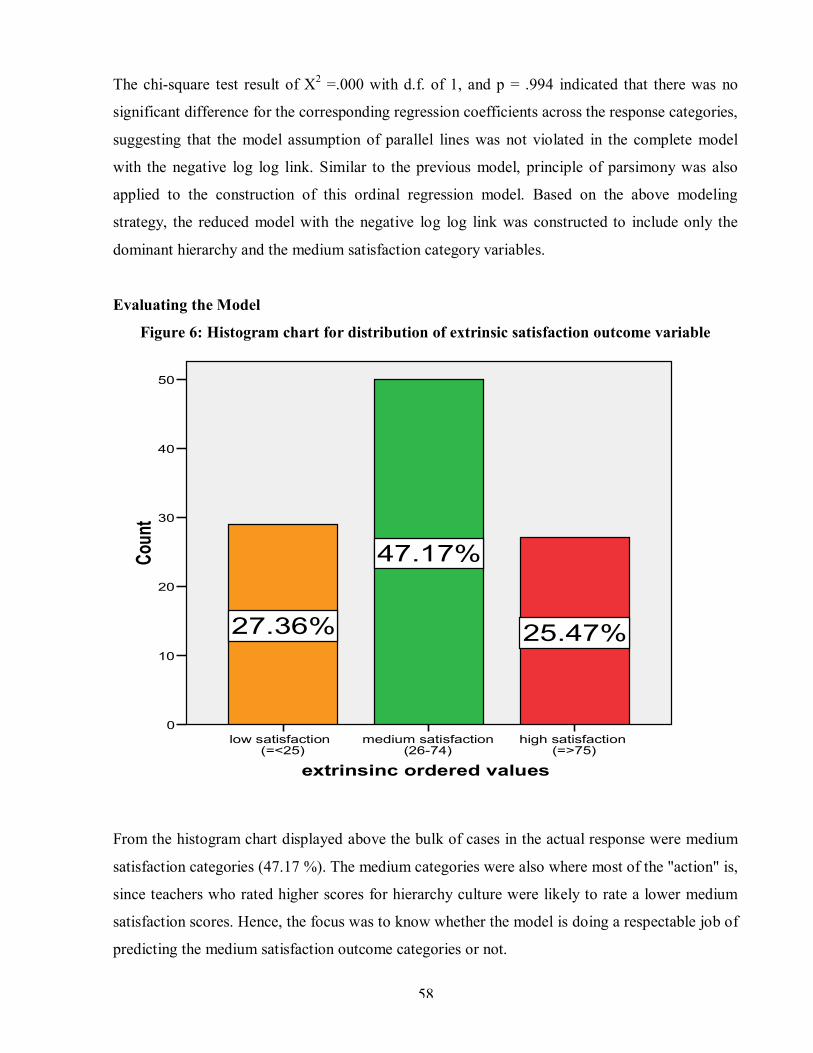
58
The chi-square test result of X2 =.000 with d.f. of 1, and p = .994 indicated that there was no
significant difference for the corresponding regression coefficients across the response categories,
suggesting that the model assumption of parallel lines was not violated in the complete model
with the negative log log link. Similar to the previous model, principle of parsimony was also
applied to the construction of this ordinal regression model. Based on the above modeling
strategy, the reduced model with the negative log log link was constructed to include only the
dominant hierarchy and the medium satisfaction category variables.
Evaluating the Model
Figure 6: Histogram chart for distribution of extrinsic satisfaction outcome variable
extrinsinc ordered values
high satisfaction (=>75)
medium satisfaction (26-74)
low satisfaction (=<25)
Coun
t
50
40
30
20
10
0
47.17%
27.36% 25.47%
From the histogram chart displayed above the bulk of cases in the actual response were medium
satisfaction categories (47.17 %). The medium categories were also where most of the "action" is,
since teachers who rated higher scores for hierarchy culture were likely to rate a lower medium
satisfaction scores. Hence, the focus was to know whether the model is doing a respectable job of
predicting the medium satisfaction outcome categories or not.
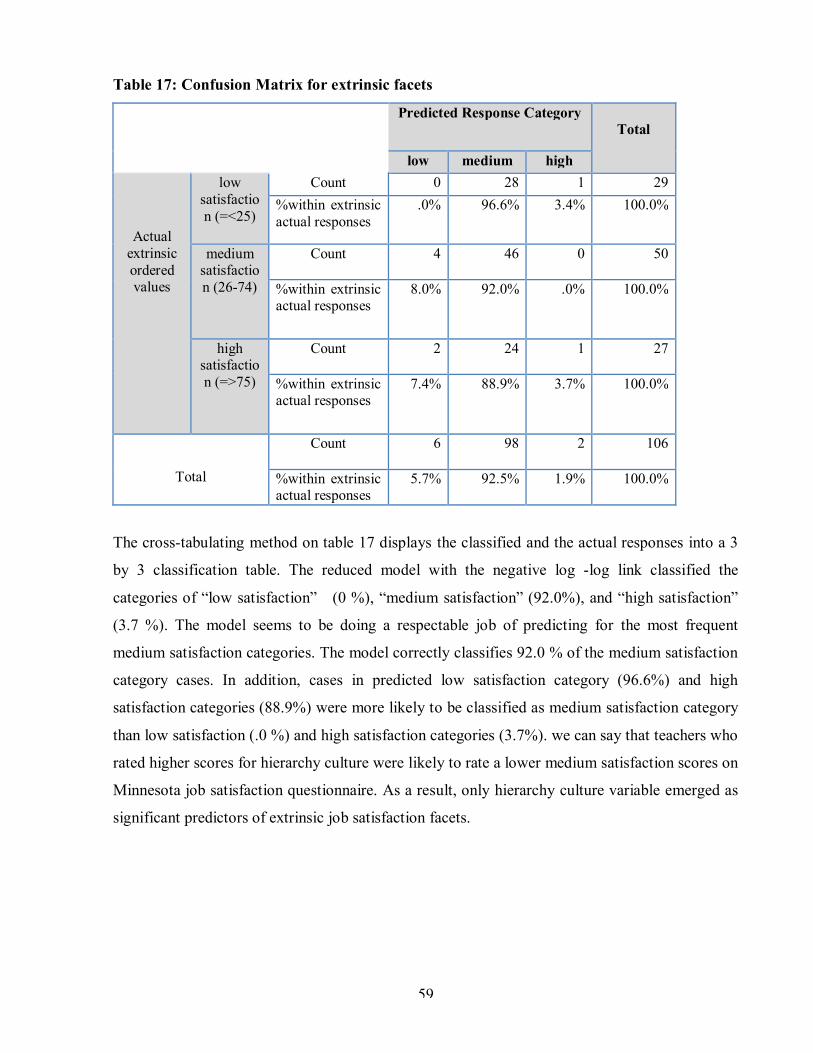
59
Table 17: Confusion Matrix for extrinsic facets
Predicted Response Category Total
low medium high
Actual extrinsic ordered values
low satisfaction (=<25)
Count 0 28 1 29 %within extrinsic actual responses
.0% 96.6% 3.4% 100.0%
medium satisfaction (26-74)
Count 4 46 0 50
%within extrinsic actual responses
8.0% 92.0% .0% 100.0%
high satisfaction (=>75)
Count 2 24 1 27
%within extrinsic actual responses
7.4% 88.9% 3.7% 100.0%
Total
Count 6 98 2 106
%within extrinsic actual responses
5.7% 92.5% 1.9% 100.0%
The cross-tabulating method on table 17 displays the classified and the actual responses into a 3
by 3 classification table. The reduced model with the negative log -log link classified the
categories of “low satisfaction” (0 %), “medium satisfaction” (92.0%), and “high satisfaction”
(3.7 %). The model seems to be doing a respectable job of predicting for the most frequent
medium satisfaction categories. The model correctly classifies 92.0 % of the medium satisfaction
category cases. In addition, cases in predicted low satisfaction category (96.6%) and high
satisfaction categories (88.9%) were more likely to be classified as medium satisfaction category
than low satisfaction (.0 %) and high satisfaction categories (3.7%). we can say that teachers who
rated higher scores for hierarchy culture were likely to rate a lower medium satisfaction scores on
Minnesota job satisfaction questionnaire. As a result, only hierarchy culture variable emerged as
significant predictors of extrinsic job satisfaction facets.

60
4.6.3 Ordinal Regression Model for General Job Satisfaction Facets The logit link was found to be superior to complementary log- log and negative log -log links
with better ‘parallel lines’ assumption and larger model fitting statistics. Using the reduced model
with the logit link, Table 18 displays that both the first and second thresholds of the model
equation were significantly different from zero and substantially contributed to the values of the
response probability in low satisfaction category. In addition, the satisfaction level of the general
job satisfaction facets was significantly associated with the hierarchy culture. The hierarchy
culture exhibited negative regression coefficients (-.071), indicating that teachers who rated
higher scores for hierarchy culture were likely to rate a lower satisfaction scores for general job
satisfaction facet. Furthermore, using the reduced model with the negative log-log link and clog
log link to build the ordinal regression model, the general job satisfaction facet was found to be
significantly associated with hierarchy culture. However, both models failed to provide a better
‘parallel lines’ assumption and model fitting statistics. Therefore they were discarded from
analysis on this paper.
Table 18: Parameter Estimates of general job satisfaction facet Parameter Estimates
Estimate Std. Error Wald df Sig.
Threshold [general=1.00] -2.253 .790 8.128 1 .004
[general = 2.00] -.163 .763 .046 1 .830
Location hierarchy -.071 .024 8.571 1 .003
Link function: Logit.
The pseudo R squares (see appendix C) for McFadden (.043), Cox and Snell (.081), and
Nagelkerke (.094) in the complete model with the logit link were larger than those for McFadden
(.037), Cox and Snell (.080), and Nagelkerke (.069) in the complete model with the clog log link
and McFadden (.039), Cox and Snell (.083), and Nagelkerke (.073) in the complete model with
the negative log-log link. Similar to the previous two models, the additional model fitting statistic
for the Pearson’s chi square, (X2 = 8.904 with d.f. of 1 and p = .003) reduced model with the logit
link were not appropriate for this model.
The chi-square test result of (X2 =.005 with d.f. of 1, and p = .945) indicated that there was no
significant difference for the corresponding regression coefficients across the response categories,
suggesting that the model assumption of parallel lines was not violated in the reduced model with
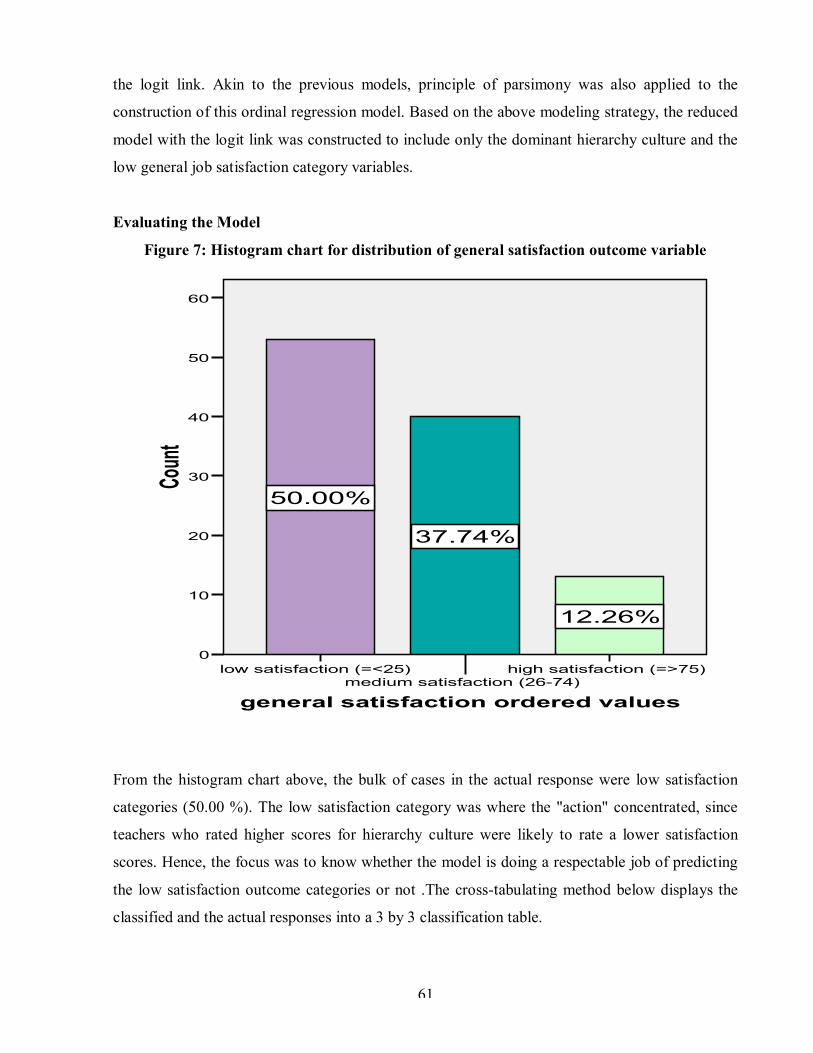
61
the logit link. Akin to the previous models, principle of parsimony was also applied to the
construction of this ordinal regression model. Based on the above modeling strategy, the reduced
model with the logit link was constructed to include only the dominant hierarchy culture and the
low general job satisfaction category variables.
Evaluating the Model
Figure 7: Histogram chart for distribution of general satisfaction outcome variable
general satisfaction ordered values
high satisfaction (=>75)medium satisfaction (26-74)
low satisfaction (=<25)
Coun
t
60
50
40
30
20
10
0
37.74%
12.26%
50.00%
From the histogram chart above, the bulk of cases in the actual response were low satisfaction
categories (50.00 %). The low satisfaction category was where the "action" concentrated, since
teachers who rated higher scores for hierarchy culture were likely to rate a lower satisfaction
scores. Hence, the focus was to know whether the model is doing a respectable job of predicting
the low satisfaction outcome categories or not .The cross-tabulating method below displays the
classified and the actual responses into a 3 by 3 classification table.

62
Table 19: Confusion Matrix for General Satisfaction Facets.
Predicted Response Category
Total
low medium
Actual Response Category general satisfaction levels
low satisfaction
(=<25)
Count 41 12 53
% within general satisfaction ordered
values 77.4% 22.6% 100.0%
medium satisfaction
(26-74)
Count 20 20 40 % within general
satisfaction ordered values
50.0% 50.0% 100.0%
high satisfaction
(=>75)
Count 6 7 13 % within general
satisfaction ordered values
46.2% 53.8% 100.0%
Total
Count 67 39 106 % within general
satisfaction ordered values
63.2% 36.8% 100.0%
The complete model with the logit link classified the categories of “low satisfaction” (77.4 %)
and “medium satisfaction” (50.0%). The model seems to be doing a good job of predicting for the
most frequent low satisfaction level categories. The model correctly classified 77.4 % of the low
satisfaction category cases. Hence, teachers who rated higher scores for hierarchy culture were
likely to rate a lower satisfaction scores levels on the general job satisfaction facets. As a result,
only hierarchy culture emerged as significant predictor of general job satisfaction facets (see table
18).
4.6.4 Ordinal regression model for the overall job satisfaction facets The Negative log-log link was more better than complementary log- log and logit links with
healthier ‘parallel lines’ assumption and larger model fitting statistics.
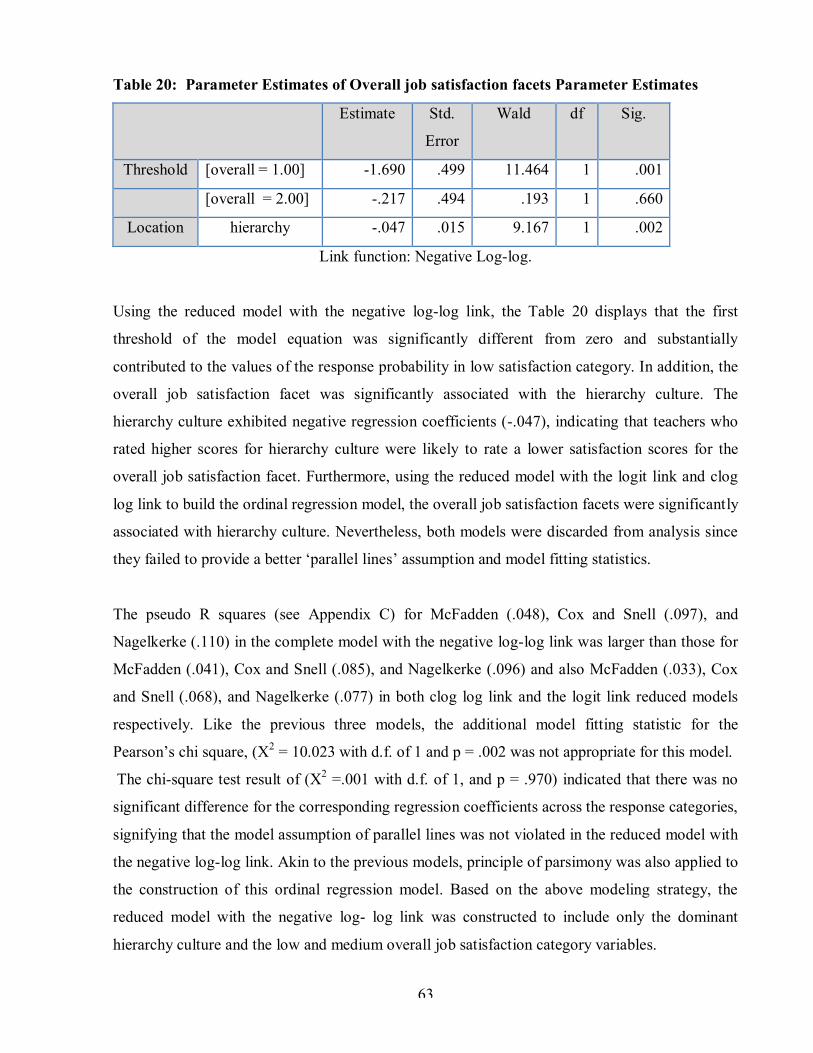
63
Table 20: Parameter Estimates of Overall job satisfaction facets Parameter Estimates
Estimate Std.
Error
Wald df Sig.
Threshold [overall = 1.00] -1.690 .499 11.464 1 .001
[overall = 2.00] -.217 .494 .193 1 .660
Location hierarchy -.047 .015 9.167 1 .002
Link function: Negative Log-log.
Using the reduced model with the negative log-log link, the Table 20 displays that the first
threshold of the model equation was significantly different from zero and substantially
contributed to the values of the response probability in low satisfaction category. In addition, the
overall job satisfaction facet was significantly associated with the hierarchy culture. The
hierarchy culture exhibited negative regression coefficients (-.047), indicating that teachers who
rated higher scores for hierarchy culture were likely to rate a lower satisfaction scores for the
overall job satisfaction facet. Furthermore, using the reduced model with the logit link and clog
log link to build the ordinal regression model, the overall job satisfaction facets were significantly
associated with hierarchy culture. Nevertheless, both models were discarded from analysis since
they failed to provide a better ‘parallel lines’ assumption and model fitting statistics.
The pseudo R squares (see Appendix C) for McFadden (.048), Cox and Snell (.097), and
Nagelkerke (.110) in the complete model with the negative log-log link was larger than those for
McFadden (.041), Cox and Snell (.085), and Nagelkerke (.096) and also McFadden (.033), Cox
and Snell (.068), and Nagelkerke (.077) in both clog log link and the logit link reduced models
respectively. Like the previous three models, the additional model fitting statistic for the
Pearson’s chi square, (X2 = 10.023 with d.f. of 1 and p = .002 was not appropriate for this model.
The chi-square test result of (X2 =.001 with d.f. of 1, and p = .970) indicated that there was no
significant difference for the corresponding regression coefficients across the response categories,
signifying that the model assumption of parallel lines was not violated in the reduced model with
the negative log-log link. Akin to the previous models, principle of parsimony was also applied to
the construction of this ordinal regression model. Based on the above modeling strategy, the
reduced model with the negative log- log link was constructed to include only the dominant
hierarchy culture and the low and medium overall job satisfaction category variables.
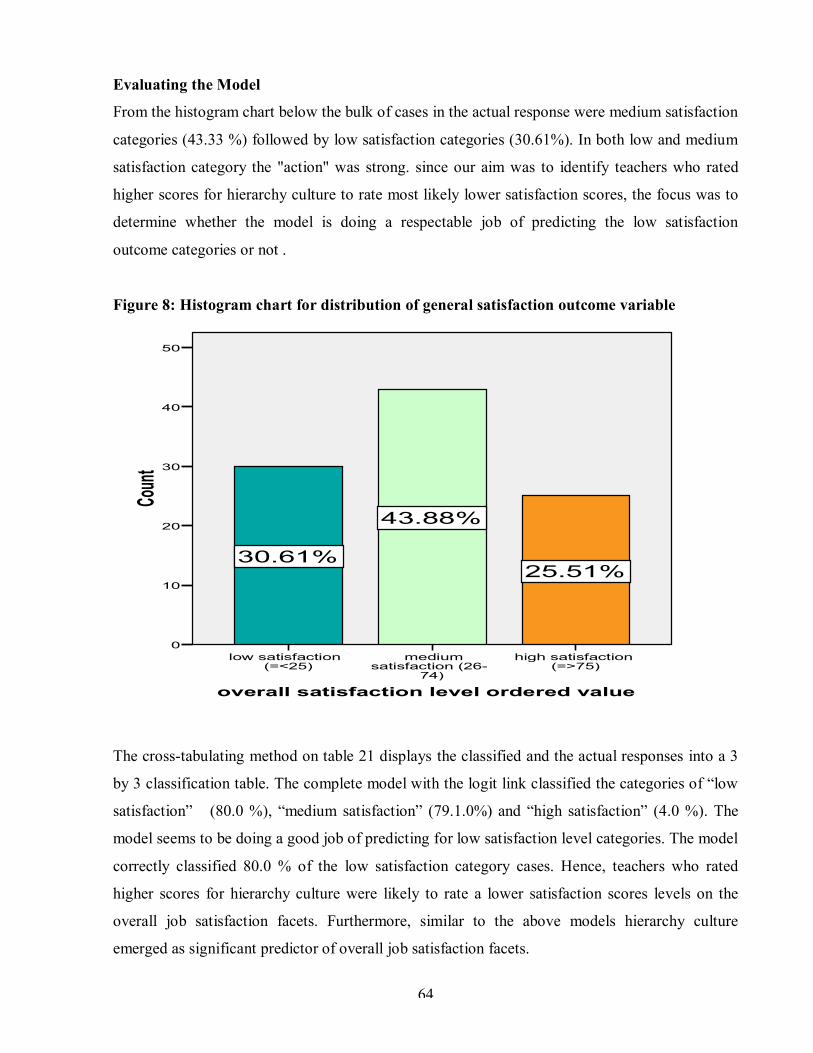
64
Evaluating the Model
From the histogram chart below the bulk of cases in the actual response were medium satisfaction
categories (43.33 %) followed by low satisfaction categories (30.61%). In both low and medium
satisfaction category the "action" was strong. since our aim was to identify teachers who rated
higher scores for hierarchy culture to rate most likely lower satisfaction scores, the focus was to
determine whether the model is doing a respectable job of predicting the low satisfaction
outcome categories or not .
Figure 8: Histogram chart for distribution of general satisfaction outcome variable
overall satisfaction level ordered value
high satisfaction (=>75)
medium satisfaction (26-
74)
low satisfaction (=<25)
Count
50
40
30
20
10
0
30.61%25.51%
43.88%
The cross-tabulating method on table 21 displays the classified and the actual responses into a 3
by 3 classification table. The complete model with the logit link classified the categories of “low
satisfaction” (80.0 %), “medium satisfaction” (79.1.0%) and “high satisfaction” (4.0 %). The
model seems to be doing a good job of predicting for low satisfaction level categories. The model
correctly classified 80.0 % of the low satisfaction category cases. Hence, teachers who rated
higher scores for hierarchy culture were likely to rate a lower satisfaction scores levels on the
overall job satisfaction facets. Furthermore, similar to the above models hierarchy culture
emerged as significant predictor of overall job satisfaction facets.
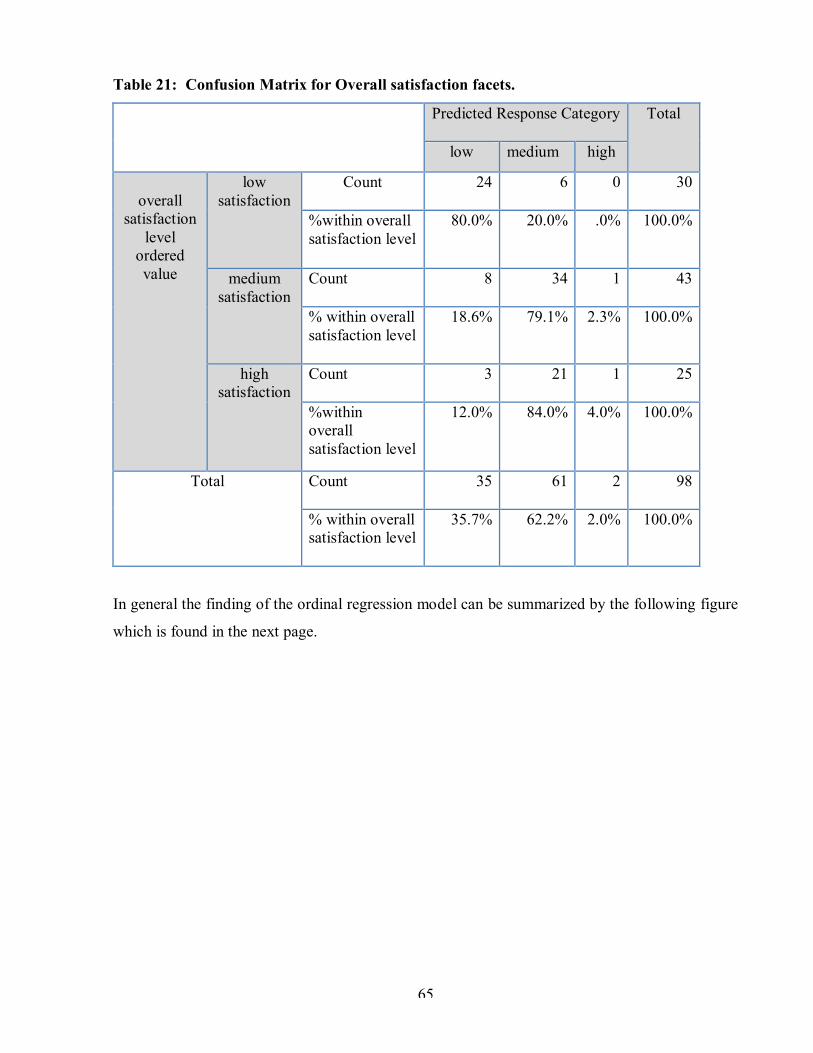
65
Table 21: Confusion Matrix for Overall satisfaction facets.
Predicted Response Category Total
low
medium high
overall
satisfaction level
ordered value
low satisfaction
Count 24 6 0 30
%within overall satisfaction level
80.0% 20.0% .0% 100.0%
medium satisfaction
Count 8 34 1 43
% within overall satisfaction level
18.6% 79.1% 2.3% 100.0%
high satisfaction
Count 3 21 1 25
%within overall satisfaction level
12.0% 84.0% 4.0% 100.0%
Total
Count 35 61 2 98
% within overall satisfaction level
35.7% 62.2% 2.0% 100.0%
In general the finding of the ordinal regression model can be summarized by the following figure
which is found in the next page.

66
Figure 9: Relationship between the four cultural types and the four dimensions of the job
satisfaction scale
-.042
-.042
-.071
The red lines represent significant relationship between variables.
The green lines represent no significant relationship between variables
Clan
Adhocracy
Market
Hierarchy
Intrinsic Job Satisfaction
Extrinsic Job Satisfaction
General Job Satisfaction
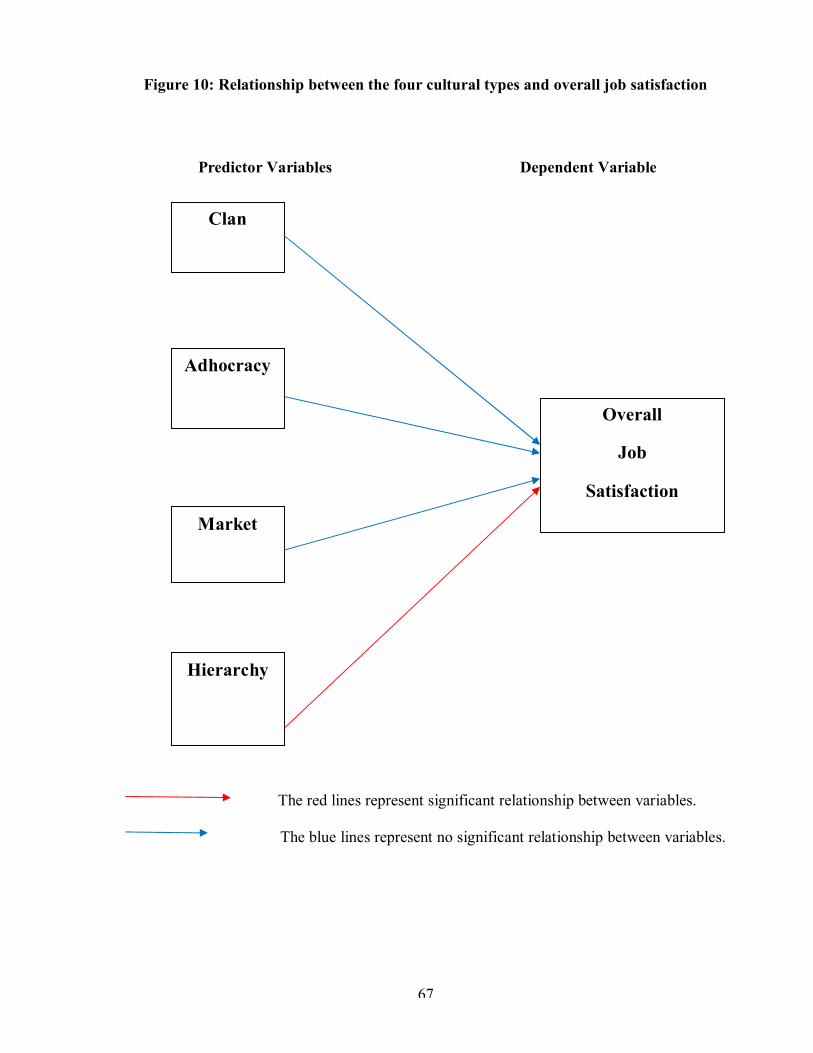
67
Figure 10: Relationship between the four cultural types and overall job satisfaction
Predictor Variables Dependent Variable
The red lines represent significant relationship between variables.
The blue lines represent no significant relationship between variables.
Clan
Adhocracy
Market
Hierarchy
Overall
Job
Satisfaction
68
CHAPTER FIVE
SUMMARY, CONCLUSION AND RECOMMENDATION This chapter addresses the summary, conclusions and recommendations of the study. It contains a
summary of the purpose, summary of the procedures, descriptive data and major findings. The
chapter ends with conclusions, implications, and recommendations for future research.
5.1 Summary 5.1.1 Summary of Purpose The general purpose of this study was to investigate whether a relationship existed between
organizational culture and job satisfaction of teachers in St Mary’s University College. The
following questions were addressed:
i) What level of job satisfaction do teachers perceive with each of the twenty job facets as
measured by the Minnesota Satisfaction Questionnaire, short Form (MSQ)?
ii) What is the dominant organizational culture of SMUC as it is measured by OCAI?
iii) Is there statistically significant relationship between the four cultural types and overall job
satisfaction as well as the facets of job satisfaction at SMUC?
iv) Which cultural type/s contributes most to employee satisfaction at SMUC?
5.1.2 Summary of Methodology A census of 146 teachers was taken and 107 questionnaires were found to be useful for the study.
The Minnesota Satisfaction Questionnaire, short Form (Weiss others., 1967) was chosen to
measure satisfaction levels of teachers and the Organizational Culture Assessment Instrument by
Cameron and Quinn (1999) was used to measure the cultural type of St Mary’s University
College. Furthermore, a data form was used to collect information about Teachers background
characteristics. Data collection was conducted from December 16, 2010 up to January 15, 2011.
The student version 15.0 of the Statistical Package for the Social Sciences (SPSS, 1999) was used
for statistical analyses. Reliability coefficients were computed for both the 20 MSQ job facet
scales and the Organizational culture assessment instruments.
Descriptive statistics like Frequencies, percentages, and summary statistics were computed for
personal characteristics of teachers. The mean and standard deviation were computed for each

69
job-facet scale. The scores of intrinsic, extrinsic general and overall job satisfaction levels were
computed by calculating the mean of each response category for each participant. To facilitate a
comparison of teachers’ each job satisfaction category levels the satisfaction levels of equal to
and below the 25th percentile, between 26th and 74th percentile, and equal to and above the 75th
percentile were computed. For the organizational culture instrument using an Ipsative rating
scale, the respondents were invited to think about their workplace culture and assign a numerical
value that described their current organizational culture. They were told to “divide” one hundred
points in any way they wished by assigning value to alternative statements they reviewed. These
statements are designed to identify the culture type as values and are averaged for six content
areas: dominant characteristics, organizational leadership, management of employees,
organizational glue, strategic emphasis, and, criteria for success (Cameron & Quinn, 2006). The
content areas or characteristics ultimately generate the independent variables of the following
culture types: clan, adhocracy, market, and hierarchy. A spearman rho correlation analysis was
made to determine the relationship between job satisfaction and organizational culture scores and
finally ordinal multiple regression analysis was conducted to determine which cultural type will
describe most the job satisfaction of teachers in St Mary’s University College.
5.1.3 Summary of Demographic Profiles of Respondents A summary of descriptive statistics yielded the following composite picture of St Mary’s
University college academic staff. The personal demographic profiles showed that the majority of
the teachers, 54.2%, fell within the category of 31-40 years of age. The second majority 36.4 %
of the teachers were found within the category of 21-30 years. The oldest participants, 2.8% fell
within the category of 51-60 and finally 6.5% of respondents fell within the category of 41-50
years of age. Almost 91.6 % of the respondents were male, 3.7 % were female and the rest 4.7%
didn’t specify their gender. The majority of the teachers, 68.2% obtained a master’s degree and
1.9 % a doctorate, 26.2%, earned bachelor’s degree and 3.7% earned an advanced diploma.
Overall, the Teachers appear to be moderately educated with 70.1% holding a second degree and
above.
The findings for the demographic profiles with respect to academic rank showed that the majority
of teachers, 70.1 % hold an academic rank of lecturer .26.2% of teachers were graduate assistants
and assistant lecturers. Furthermore, the remaining 2.8% and 0.9% of the respondents were

70
professors and assistant professors respectively. In addition to this, 54.2% of respondents were
permanent full time employees, 25.2 % were part timers, also 13.1% were joint staff and finally
7.5% were contract employees.
5.1.4 Summary of Level of Job satisfaction Job facets of relatively greater satisfaction included independence, co-workers, and activity as
reflected by their means of 3.8, 3.7 and 3.59, respectively. As reflected by their means of 2.9, 2.8,
2.45, 2.4 and 1.9, respectively, Job facets of relatively lesser satisfaction included company
policies and practices, social status, recognition, advancement and compensation. Considering the
job facets of relatively lesser satisfaction and expressing the results using frequencies (see Table
8), 42.1 % of the respondents were dissatisfied with company policies and practices. Over 26.2%
of the respondents were very dissatisfied on social status of teaching profession.33.6% and 17.8
% of respondents were very dissatisfied and dissatisfied respectively over the recognition they
received from the university college. Furthermore, 33.6%and 19.6% of teachers expressed their
very dissatisfaction and dissatisfaction over advancement .Finally, 45.8% and 28% of the
respondents were very dissatisfied and dissatisfied respectively with compensation package of the
university college.
The participants reported low (39.3%), Medium (31.8%) and High (21.5%) level of intrinsic job
satisfaction respectively. The existence of high low level of intrinsic satisfaction can be as a
result of the following dyadic factors. Primarily among the 20 job facets 73.8% instructors were
not satisfied with compensation package of the institution. As a result, instructors were not freed
from concern about their lower level needs which in turn affect their intrinsic satisfaction level
(Cohen, 1974).On the other hand, 51.4% of instructors felt that they do not receive proper
recognition for their effort on the job. This implies that instructors are stressed on their Job
because of the inadequate recognition they receive out of it. (August& Waltman, 2004).
The majority of participants (46.7%) reported a medium extrinsic job satisfaction level whereas
the rest of the participants reported a low (27.1 %) and high (25.2%) level of extrinsic job
satisfaction respectively. This implies that instructors were moderately satisfied with extrinsic
satisfaction factors. Furthermore, 49.5% of the participants reported a low level of general job
satisfaction .Whereas 37.4% and 12.1% of participants reported a medium and a high general job
satisfaction level respectively. Therefore, almost half of the respondents were not satisfied with
71
their coworker relationship as well as their work environment. This can be as a result of the
existence of dominant hierarchy culture in the institution which is far from collegiality and
creates low morale over employees (Cameroon& Quinn, 2004).finally,28% , 40.2% and 23.4%
of the participants reported a low, medium and high level of overall job satisfaction. In general,
we can say that instructors are moderately satisfied with their current job.
5.1.5 Summary of Organizational Culture Findings The highest mean scores (Mean= 32.07) had showed that the dominant culture type for SMUC in the
current situation is the hierarchy culture followed by clan (Mean= 24.18), Market (Mean= 23.18) and
adhocracy (Mean= 20.38) culture types respectively. The hierarchical classification applied to SMUC
portrays that the organizational culture compatible with this form (and as assessed in the OCAI) is
characterized by a formalized and structured place to work. Procedures govern what people do.
Effective leaders are good coordinators and organizers. Maintaining a smooth running organization is
important. The long-term concerns of the organization are stability, predictability, and efficiency.
Formal rules and policies hold the organization together. The strength of the culture is determined by
the number of points coincide to a specific culture type. In the current situation, the hierarchical
culture type exhibited by SMUC is moderately strong indicating that the dominant hierarchy culture
in SMUC is Hierarchy. This finding is in harmony with what research has revealed about
organizations that possess strong cultures, they are associated with having homogeneity of effort,
clear focus, and higher performance in environments where unity and common vision are required
(Cameron & Quinn, 1999).
Only one demographic group considered in this study displayed a different culture type from the
overall dominant hierarchy culture of SMUC. The demographic group labeled as academic rank-
associate professor had a clan dominant culture for the current situation. However, this finding is
not statistically significant with a P value of 0.33.
5.1.6 The Relationship between Organizational Culture and Level of Satisfaction There is a statistically significant negative correlation between the intrinsic, extrinsic, general,
overall satisfaction scores and the dominant hierarchy culture. Also, there is a modest positive
correlation between the scores of intrinsic, overall satisfaction score and market culture.
However, there is no statistically significant relationship between all job satisfaction scores
categories and clan as well as adhocracy cultures scores.
72
5.1.7 The Summary of Regression Analysis Only hierarchy culture with all satisfaction categories related to the satisfaction of instructors
(i.e., intrinsic, extrinsic, general and overall satisfaction levels) was identified in the residual
ordinal regression model. Hierarchy culture significantly contributes to the probability of
instructors expressing satisfaction with the intrinsic, extrinsic, general and overall satisfaction
scores. The satisfaction of the intrinsic satisfaction facet was significantly associated with the
hierarchy culture. The hierarchy culture exhibited negative regression coefficients (-0.042),
indicating that teachers who rated higher scores for hierarchy culture was likely to rate a lower
satisfaction scores for intrinsic job satisfaction facet. Furthermore, the satisfaction of the extrinsic
satisfaction facets was significantly associated with the Hierarchy culture. The hierarchy culture
exhibited negative regression coefficients (-.042), indicating that teachers who rated higher scores
for hierarchy culture were likely to rate a lower medium satisfaction scores for intrinsic job
satisfaction facet. In addition, the satisfaction level of the general job satisfaction facets was
significantly associated with the hierarchy culture. The hierarchy culture exhibited negative
regression coefficients (-.071), indicating that teachers who rated higher scores for hierarchy
culture were likely to rate a lower satisfaction scores for general job satisfaction facet. Finally,
the overall job satisfaction facet was also significantly associated with the hierarchy culture. The
hierarchy culture exhibited negative regression coefficients (-.047), indicating that teachers who
rated higher scores for hierarchy culture were likely to rate a lower satisfaction scores for the
overall job satisfaction facet.
5.2 Conclusion The findings of this study show that teachers are moderately satisfied with their overall job
satisfaction. According to Shing (2008), Intrinsic job satisfaction facets are concerned more with
how people feel about the nature of their job and extrinsic as well as general job satisfaction
facets which are how they feel about elements of work situations that are external to the job tasks
itself. Thus, the impact of job satisfaction is more intrinsic one than extrinsic or general ones.
Therefore we can say that St Mary’s university college instructors are less satisfied with their
jobs .A close view of specific job facets indicates the highest satisfaction levels to occur in the
areas of independence, co-workers, and activity. Company policies and practices, social status,
recognition, advancement and compensation are the facets reflecting the lowest satisfaction
levels.

73
Even though studies which are made on administrators, students and department chair persons of
universities of developed countries had concluded that the clan culture as the most effective
culture type for colleges and universities (Berrio, 2005 and Smart & St. John, 1996). The findings
of this study were not in agreement with the above studies since the dominant culture type was
hierarchy in SMUC. Hierarchy cultures, like clan cultures, have an internal emphasis, a short-
term orientation, and an emphasis on smoothing activities, but differ in their emphasis on
stability, control, and predictability (as opposed to the emphasis on flexibility, individuality, and
spontaneity in clan cultures). The dominant leadership style in hierarchy cultures is that of the
coordinator or organizer, rules and policies are the primary bonding mechanisms, and the
strategic emphasis is on permanence and stability (Cameroon& Quinn, 2004). This more
Weberian image of organizations was also once a common framework for viewing the
organizational patterns and administrative activities of colleges and universities, but was never an
image of organizations that was highly compatible with the basic instincts of many faculties who
frequently emphasize collegiality over standardized rules and procedures (Smart & St. John,
1996).
The main purpose of the study was to determine whether a relationship existed between
organizational culture types and job satisfaction. There was found a significant negative
correlation between the hierarchy culture type and intrinsic, extrinsic, general and overall
satisfaction facets. These result also correlate with the study conducted by Lund (2003).Also,
there was found a significant positive correlation between the market culture type and intrinsic,
extrinsic, and overall satisfaction facets. However, there was not found significant correlation
between clan as well as adhocracy culture types and all facets of job satisfaction.
The study tested a conceptual model of the effect of organizational culture types on academic
staff job satisfaction using an ordinal regression model. The results suggest that hierarchy culture
has a significant influence on overall teacher’s job satisfaction as it predicted overall job
satisfaction and three distinct categories of job satisfaction facets namely intrinsic, extrinsic and
general satisfaction. These imply that teachers who rated higher scores for hierarchy culture were
likely to rate a lower satisfaction scores for each of job satisfaction facets namely intrinsic,
extrinsic, general and overall satisfaction. These results were consistent with those of the study
by Lund (2003) which found that there was a negative relationship between job satisfaction and
hierarchy culture. Given that the hierarchy culture is primarily associated with low employee
74
morale the finding is anticipated one. The negative impact of the hierarchy culture on employee
job satisfaction can be explained by the fact that hierarchy culture was strongly associated with
formalization, resistance to change, stability, a reactive orientation toward change, and low
morale of employees at colleges (Cameroon& Quinn, 2004). However, the lower level of
satisfaction scores as a result of hierarchy culture does not imply neither higher nor lower
employee performance (Lund, 2003). Moreover, Odom, Boxx and Dunn (1990) had found that
dominant bureaucratic (hierarchy) culture is not most conducive to the creation of employee
commitment, job satisfaction, and work-group cohesion.
It is also interesting to note that the findings on culture types and job satisfaction are also
theoretically consistent with the competing values model from which the study conceptual
framework was derived (Cameroon & Quinn, 2004). For example, firstly, Institutions that had
clan-type cultures were most effective in domains of performance relating to morale, satisfaction,
internal communication, and supportiveness. Secondly, adhocracy-type cultures were most
effective in domains of performance relating to adaptation, system openness, innovation, and
cutting-edge knowledge. Thirdly, institutions that had a market-type culture were most effective
in domains of performance relating to their ability to acquire needed resources such as revenues,
good faculty, institutional visibility, and so forth. Finally, Institutions with hierarchy cultures did
not excel in any of the performance domains.
5.3 Recommendations
5.3.1 Recommendation for St Mary’s University College 1. St Mary’s University College Administrators should be concerned about the impact of
organizational culture on academic staff’s satisfaction because of its impact on variables
such as turnover, commitment, morale, development and strength of academic staff’s
solidarity and cohesion, grievances and performance. Therefore, if the management
desires to create greater levels of satisfaction over their employees should begin a
concerted effort to diagnose and change the prevalent hierarchy culture. The new culture
should be clan which is characterized by people-orientation, encouragement, equitability,
trust, and allowing of greater academic freedom. Removing bureaucratic barriers may
contribute somewhat to creating satisfaction but significant improvement will occur only
when positive action to increase the collegiality dimension is taken. Cultures with

75
characteristics expressed in terms of collegiality and collaboration generally are those
types that promote satisfaction and feelings of professional involvement of teachers. Other
types of cultures that create, maintain, and reinforce isolation do little to help teachers
resolve issues or to learn new techniques to help them teach. These cultures of isolation
and balkanization (Ma & Macmillan, 1999) actually contribute to teacher dissatisfaction
and to a loss of certainty about their professional competence.
2. The current study is a warning to SMUC management that taking for granted the
organizational culture phenomenon could lead to a lesser job satisfaction level on
academic staff. Alternatively this could mean that management should work towards in
implementing those cultural types which boost the morale of employees in the work
place. The negative significant relationship between the prevalent hierarchy culture and
job satisfaction level of academic staffs in SMUC is confirmed by different previous
studies (for example, Lund, 2003; Choi and others, 2008).
3. St Mary’s University College proclaims itself as an institution which stands for quality of
education. A low moral of teachers will mitigate the success of the aforesaid motto since
it results on low level of student’s achievement (Endaweke, 2008). Therefore,
management should stress the need to monitor organizational culture and to evolve better
management practices so that employees' satisfaction is maintained at a high level.
4. “Counting the hours instructors spend on the job or' "evaluating" them by observing them
in the classroom may satisfy the external auditors, but it does not directly affect instructor
motivation” (Cohen, 1974). Therefore, the question should be what can be done to
enhance satisfaction? If the variables leading to dissatisfaction in SMUC are intrinsic,
then satisfaction can best be enhanced by removing obstacles on these facets of job
satisfaction. This can be accomplished most readily by providing better compensation
package so that they are freed from concern about lower-order needs and boosting their
social status in the community. However, Compensation Package is not the only factor
which makes employee satisfy in the job in fact it is the overall organizational culture
which makes employee satisfy and retain them with organization.
76
5.3.2 Recommendation for Future Research 1. Although the findings of this study can be deemed as informative, it provides only a small
glimpse of the impact of organizational culture over job satisfaction of teachers in
Ethiopian higher educational setting. Hence, a cross-organizational study, which
incorporates both private and public higher educational institutions, should be made in
order to find the culture type that most contribute to teacher’s job satisfaction.
2. In association with job satisfaction, future research should attempt to examine the impact
of culture over turnover, commitment and performance variables.
3. The MSQ is a standardized instrument that ranks, for example, how well one is satisfied
in terms of one’s feeling of achievement. The MSQ does not identify the reason of an
individual’s feeling of achievement. Future research should attempt to incorporate a
qualitative study method like interview in order to gain an insightful knowledge about the
reason why instructors are dissatisfied with each job satisfaction facets of instrument.
77
BIBILOGRAPHY Ambrose,S. Huston,T.,& Norman ,M.A. (2005). Qualitative Method for Assessing Faculty
Satisfaction : Research in Higher Education, 46( 7), 803-830.
August,.L & Waltman .J. (2004). Culture, Climate, and Contribution: Career Satisfaction among
Female Faculty: Research in Higher Education, 45(2), 177- 192.
Aydin,Bulent & Ceylan, Adnan (2009). A Research Analysis on Employee Satisfaction in terms
of Organizational Culture and Spiritual Leadership.International Journal of Business
Management,4:3,159-168.
Bartell,M.(2003). Internationalization of Universities: A University Culture-Based Framework:
Higher Education, 45(1), 43-70.
Bashayreh, A.M. (2009).Organizational Culture and Job Satisfaction: A case of Academic Staffs
at University Utara Malaysia. Published Masters Thesis University of Malaysia ,Kedah.
Berrio, A. A., (2003).An Organizational Culture Assessment Using the Competing Values
Framework: A Profile of Ohio State University Extension: Journal of Extension, 41( 2),
available from www.joe.org/joe/2003april/a3.shtml.
Cameron, K.,(2004).A process of Changing Organizational Culture: The Handbook of
Organizational Development,25(4), 78-96.
Cameron, K.S. & Quinn,R.E. (1999). Diagnosing and Changing Organizational Culture Based
on the Competing Values Framework. Addison-Wesley Publishing Company,
Inc.London.
Chen,C.K .,&Hughes, J.J.(2004).Using Ordinal Regression Model to Analyze Student
Satisfaction Questionnaires:Association for Institutional Research,1,1-13.
Choi, Y, S, Jeffery j. Martin & Meungukk Park (2008).Organizational Culture and Job
Satisfaction in Korean Professional Baseball Organizations.International Journal of
Applied Sports Sciences,20(2),59-77.
Cohen,A.M.(1974). Community College Faculty Job Satisfaction: Research in Higher Education,
2(4), 369-376.
Folch, M.T & Ion, G.(2009) . Analyzing the Organizational Culture of Universities: Two Models:
Higher Education in Europe, 34: 1, 143 — 154.
Governance in the Twenty-First-Century University. (2003). ASHE-ERIC Higher Education
Report, 30(1), 1-153.

78
Green,J.,(2000).Job Satisfaction of Community College Chairpersons: Published PHD Thesis of
Virginia Polytechnic Institute and State University ,Blacksburg, Virginia.
Kerr, A.W, Hall, H.K.,&Kozub,S.A.(2002).Doing Statistics with SPSS. Sage Publications
London.
Lund, D. B. (2003), Organizational culture and job satisfaction. Journal of Business
and Industrial Marketing, 18(3), 219-231.
Ma , X. & MacMillan , R.B. ( 1999). Influences of Workplace Conditions on Teachers' Job
Satisfaction: The Journal of Educational Research, 93 (1), 39-47.
McCullagh, P. (1980). Regression Models for Ordinal Data (with Discussion), Journal of the
Royal Statistical Society – B 42, 109 – 142.
McKinnon, J.L., Harrison, G.I., Chow, C.W. and Wu, A. (2003). Organizational culture:
Association with commitment, job satisfaction, propensity to remain, and information
sharing in Taiwan. International Journal of Business Studies.
Muijs, R. D. (2004). Doing Qualitative Research in Education. Sage Publications London.
Mullins, D.k.(2007).The Relationship between Leadership Style and Organizational Culture in
School of Nursing. Published PHD Thesis, Huntington, West Virginia.
Odom, R. Y, Boxx, W. R., & Dunn, M. G. (1990). Organizational culture, commitment,
satisfaction, and cohesion. Public Productivity & Management Review, 149(2), 157 –
179.
Okpara, John O (2007). The Effect of Culture on Job Satisfaction and Organizational
Commitment. Journal of African Business, 8: 1, 113 — 130.
Park,J.S, & Kim, T.H.(2009).Do Types of Organizational Culture Matters in Nurse Job
Satisfaction & Turnover Intentions?: Leadership in Health Services,22(1),20-38.
Sempane,M.E., Rieger,.H.S, & Rood,G.(2002). Job Satisfaction in Relation to Organizational
Culture: SA Journal of Industrial Psychology, 28(2), 23-30.
Shing,K.T.(2008). Predicting Job Satisfaction with Cultural Self Identity and Organizational
Culture among Chinese Employees in Hong Kong: Published Masters Thesis University
of HongKong ,Hong Kong.
Silverthorne, C. (2004).The impact of organizational culture and person-organization fit on
organizational commitment and job satisfaction in Taiwan: The Leadership &
Organization Development Journal, 25 (7), 592-9.
79
Smart, J. C., & St. John, E. P. (1996). Organizational culture and effectiveness in higher
education: A test of the "Culture Type" and "Strong Culture" hypotheses. Educational
Evaluation and Policy Analysis, 16(3), 219-241.
SPSS 15.0 [Computer Software]. (2001). Chicago, IL: SPSS, Inc.
SPSS Base 15.0 User’s Guide. (2001). Chicago, IL: SPSS, Inc.
Tayie, S., (2005), Research methods and writing research proposals. Cairo: Pathways to Higher
Education.
Tierney, W.G. (1988). Organizational culture in higher education: defining the essentials. Journal
of Higher Education, 95, 2-21.
Vogds,J.C.,(2001).Perceptions of Organizational Values and Culture at Various Levels of an
Organization: Published Masters Thesis University of Wisconsin-Stout ,Wisconsin.
Weiss, D. J., Davis, R. V., England, G. W., & Lofquist, L. H. (1967). Manual for the Minnesota
Satisfaction Questionnaire. Minneapolis, MN: The University of Minnesota Press.
Wondwosen Tamirat (2003). A Glimpse of Private Higher Educational Institutions around the
World:Proceedings of the First National Conference on Private Higher Education
Institutions (PHEIs)In Ethiopia,1,1-27.
Yalew Endawoke (2003). Problems of Teacher-Made Tests: A Prime Concern for Quality of
Education:Proceedings of the Sixth National Conference on Private Higher Education
Institutions (PHEIs)In Ethiopia,6,119-154.
Yiing, L.H.(2008). The Association between Organizational Culture and Leadership Behaviour
and Organizational Commitment, Job Satisfaction and Employee Performance - A
Malaysian Perspective: Published Masters Thesis University of Malaysia ,Kedah.
Yu,T.,&W,N.(2009).A Review of Study on the Competing Values Framework: International
Journal of Business and Management,4(7),37-42.
80
APPENDIX A
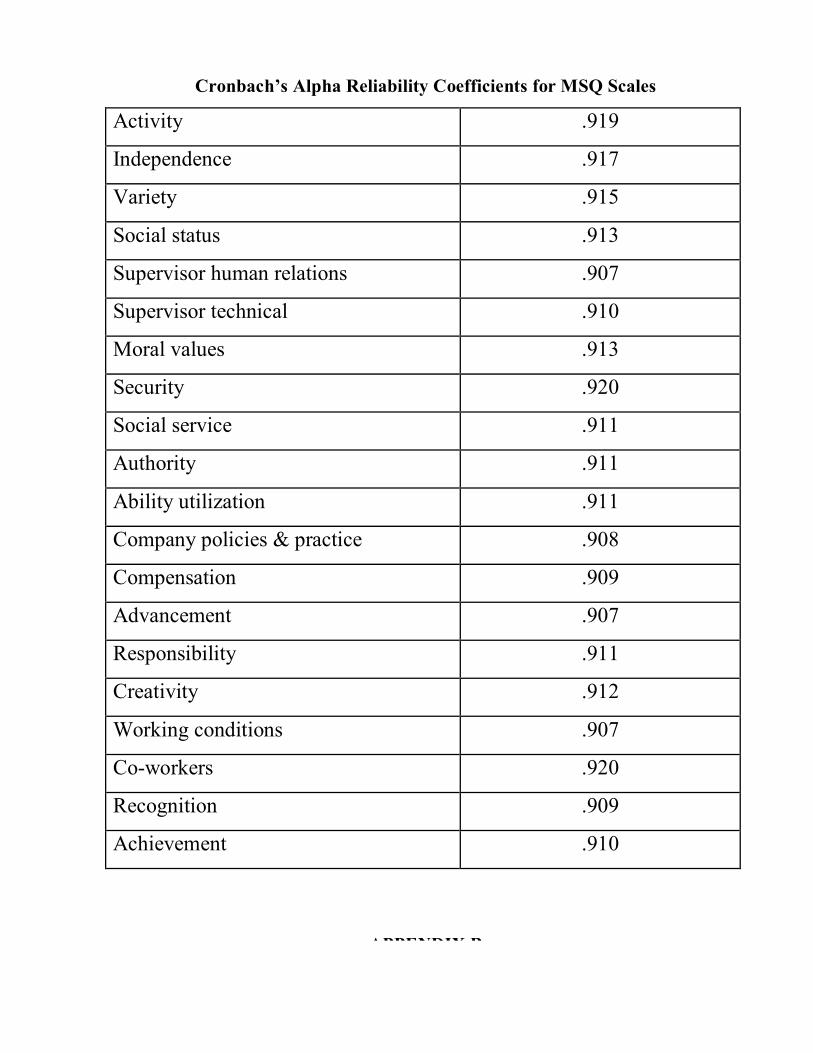
81
Cronbach’s Alpha Reliability Coefficients for MSQ Scales
Activity .919
Independence .917
Variety .915
Social status .913
Supervisor human relations .907
Supervisor technical .910
Moral values .913
Security .920
Social service .911
Authority .911
Ability utilization .911
Company policies & practice .908
Compensation .909
Advancement .907
Responsibility .911
Creativity .912
Working conditions .907
Co-workers .920
Recognition .909
Achievement .910
APPENDIX B
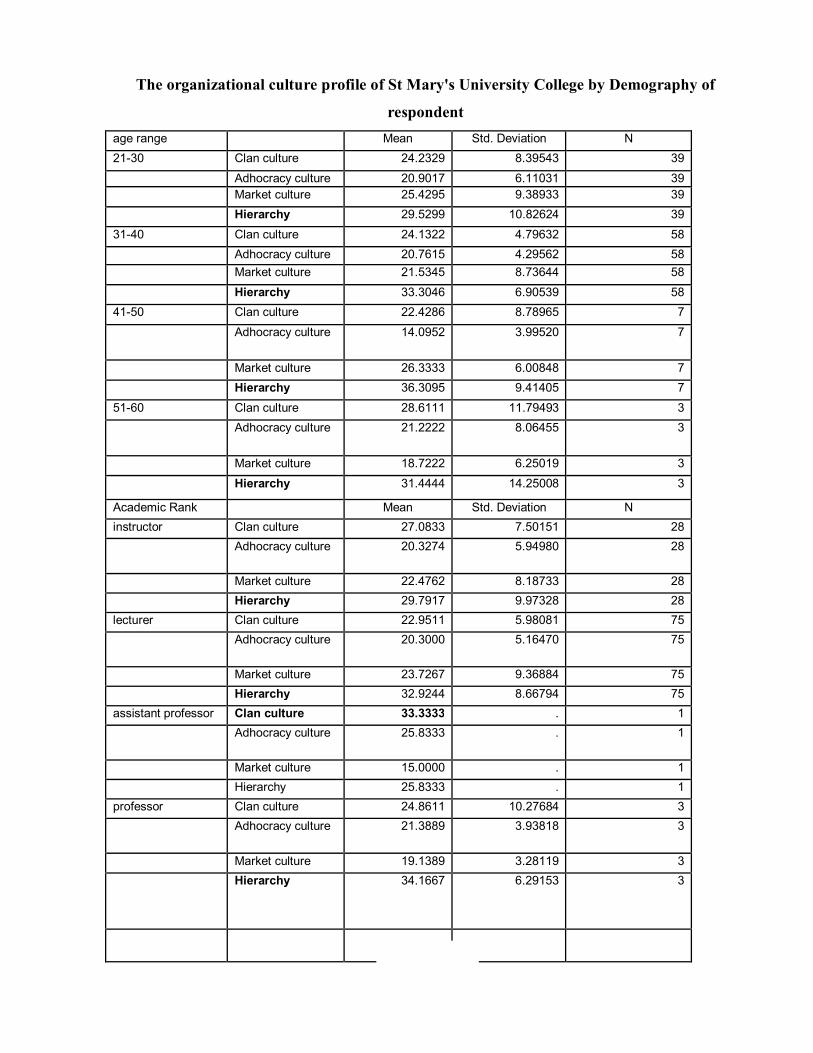
82
The organizational culture profile of St Mary's University College by Demography of
respondent age range Mean Std. Deviation N 21-30 Clan culture 24.2329 8.39543 39 Adhocracy culture 20.9017 6.11031 39 Market culture 25.4295 9.38933 39 Hierarchy 29.5299 10.82624 39 31-40 Clan culture 24.1322 4.79632 58 Adhocracy culture 20.7615 4.29562 58 Market culture 21.5345 8.73644 58 Hierarchy 33.3046 6.90539 58 41-50 Clan culture 22.4286 8.78965 7 Adhocracy culture 14.0952 3.99520 7
Market culture 26.3333 6.00848 7 Hierarchy 36.3095 9.41405 7 51-60 Clan culture 28.6111 11.79493 3 Adhocracy culture 21.2222 8.06455 3
Market culture 18.7222 6.25019 3 Hierarchy 31.4444 14.25008 3
Academic Rank Mean Std. Deviation N instructor Clan culture 27.0833 7.50151 28 Adhocracy culture 20.3274 5.94980 28
Market culture 22.4762 8.18733 28 Hierarchy 29.7917 9.97328 28 lecturer Clan culture 22.9511 5.98081 75 Adhocracy culture 20.3000 5.16470 75
Market culture 23.7267 9.36884 75 Hierarchy 32.9244 8.66794 75 assistant professor Clan culture 33.3333 . 1 Adhocracy culture 25.8333 . 1
Market culture 15.0000 . 1 Hierarchy 25.8333 . 1 professor Clan culture 24.8611 10.27684 3 Adhocracy culture 21.3889 3.93818 3
Market culture 19.1389 3.28119 3 Hierarchy 34.1667 6.29153 3
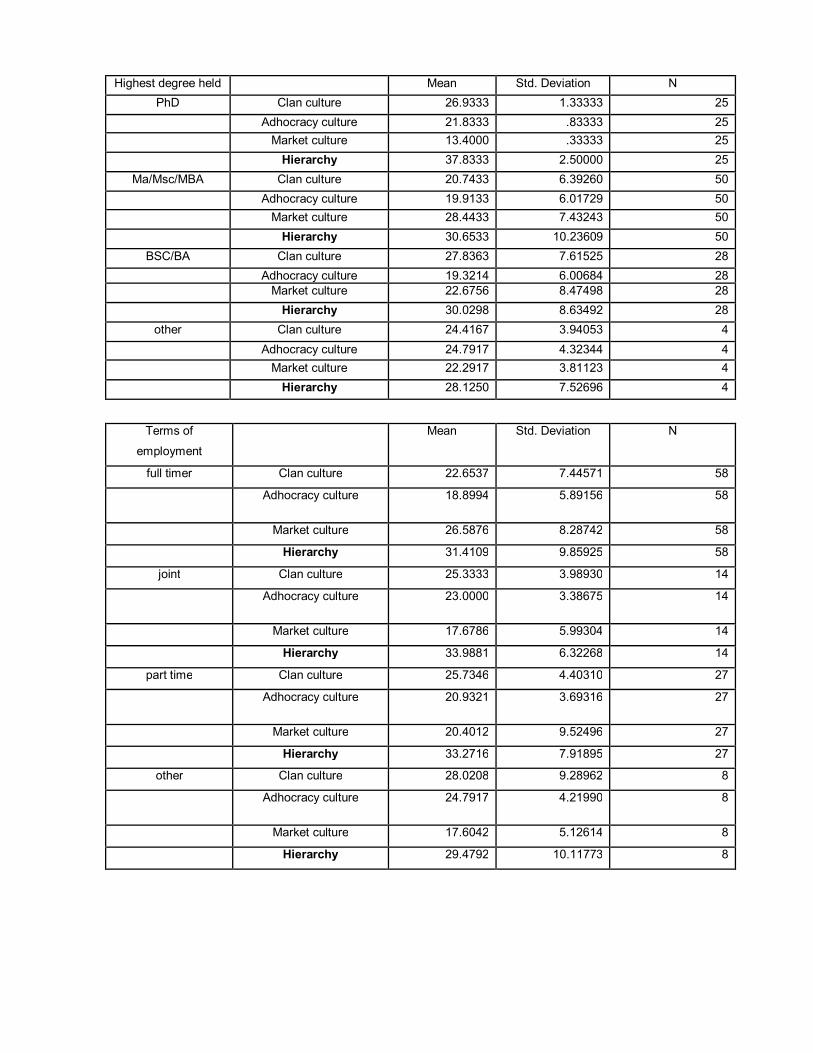
83
Highest degree held Mean Std. Deviation N PhD Clan culture 26.9333 1.33333 25
Adhocracy culture 21.8333 .83333 25 Market culture 13.4000 .33333 25 Hierarchy 37.8333 2.50000 25
Ma/Msc/MBA Clan culture 20.7433 6.39260 50 Adhocracy culture 19.9133 6.01729 50 Market culture 28.4433 7.43243 50 Hierarchy 30.6533 10.23609 50
BSC/BA Clan culture 27.8363 7.61525 28 Adhocracy culture 19.3214 6.00684 28 Market culture 22.6756 8.47498 28 Hierarchy 30.0298 8.63492 28
other Clan culture 24.4167 3.94053 4 Adhocracy culture 24.7917 4.32344 4 Market culture 22.2917 3.81123 4 Hierarchy 28.1250 7.52696 4
Terms of
employment
Mean Std. Deviation N
full timer Clan culture 22.6537 7.44571 58
Adhocracy culture 18.8994 5.89156 58
Market culture 26.5876 8.28742 58
Hierarchy 31.4109 9.85925 58
joint Clan culture 25.3333 3.98930 14
Adhocracy culture 23.0000 3.38675 14
Market culture 17.6786 5.99304 14
Hierarchy 33.9881 6.32268 14
part time Clan culture 25.7346 4.40310 27
Adhocracy culture 20.9321 3.69316 27
Market culture 20.4012 9.52496 27
Hierarchy 33.2716 7.91895 27
other Clan culture 28.0208 9.28962 8
Adhocracy culture 24.7917 4.21990 8
Market culture 17.6042 5.12614 8
Hierarchy 29.4792 10.11773 8
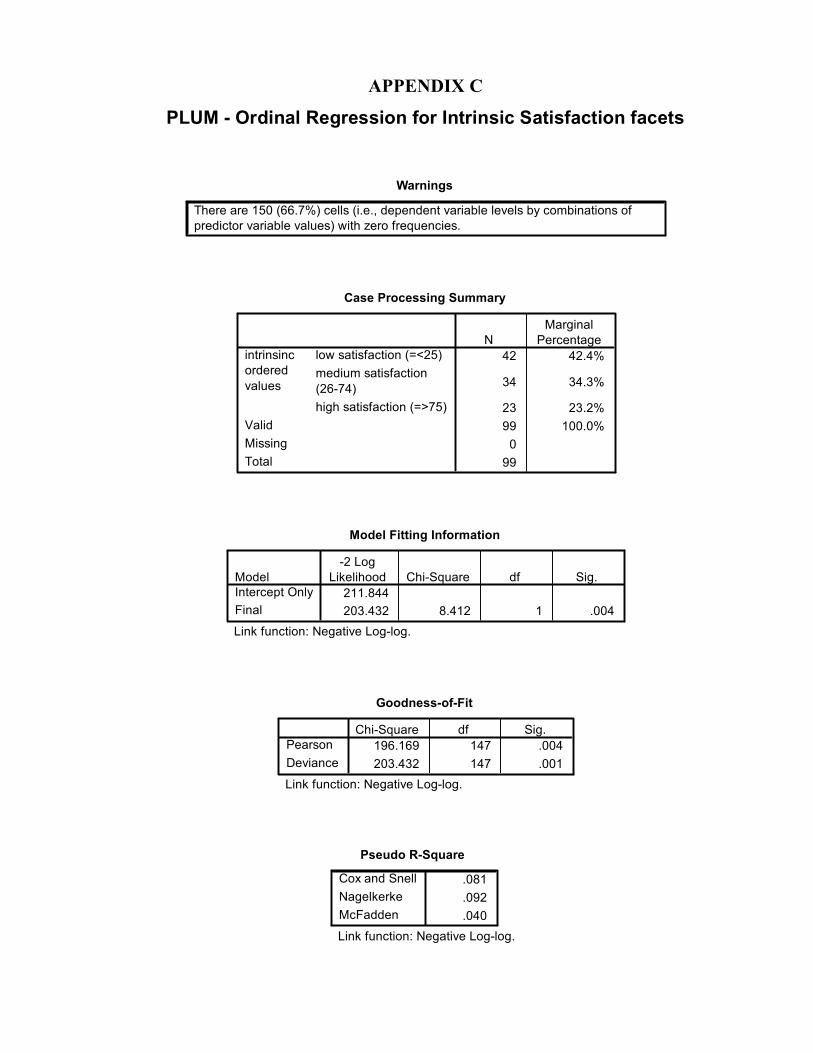
84
APPENDIX C
PLUM - Ordinal Regression for Intrinsic Satisfaction facets
Warnings
There are 150 (66.7%) cells (i.e., dependent variable levels by combinations ofpredictor variable values) with zero frequencies.
Case Processing Summary
42 42.4%
34 34.3%
23 23.2%99 100.0%
099
low satisfaction (=<25)medium satisfaction(26-74)high satisfaction (=>75)
intrinsincorderedvalues
ValidMissingTotal
NMarginal
Percentage
Model Fitting Information
211.844203.432 8.412 1 .004
ModelIntercept OnlyFinal
-2 LogLikelihood Chi-Square df Sig.
Link function: Negative Log-log.
Goodness-of-Fit
196.169 147 .004203.432 147 .001
PearsonDeviance
Chi-Square df Sig.
Link function: Negative Log-log.
Pseudo R-Square
.081
.092
.040
Cox and SnellNagelkerkeMcFadden
Link function: Negative Log-log.
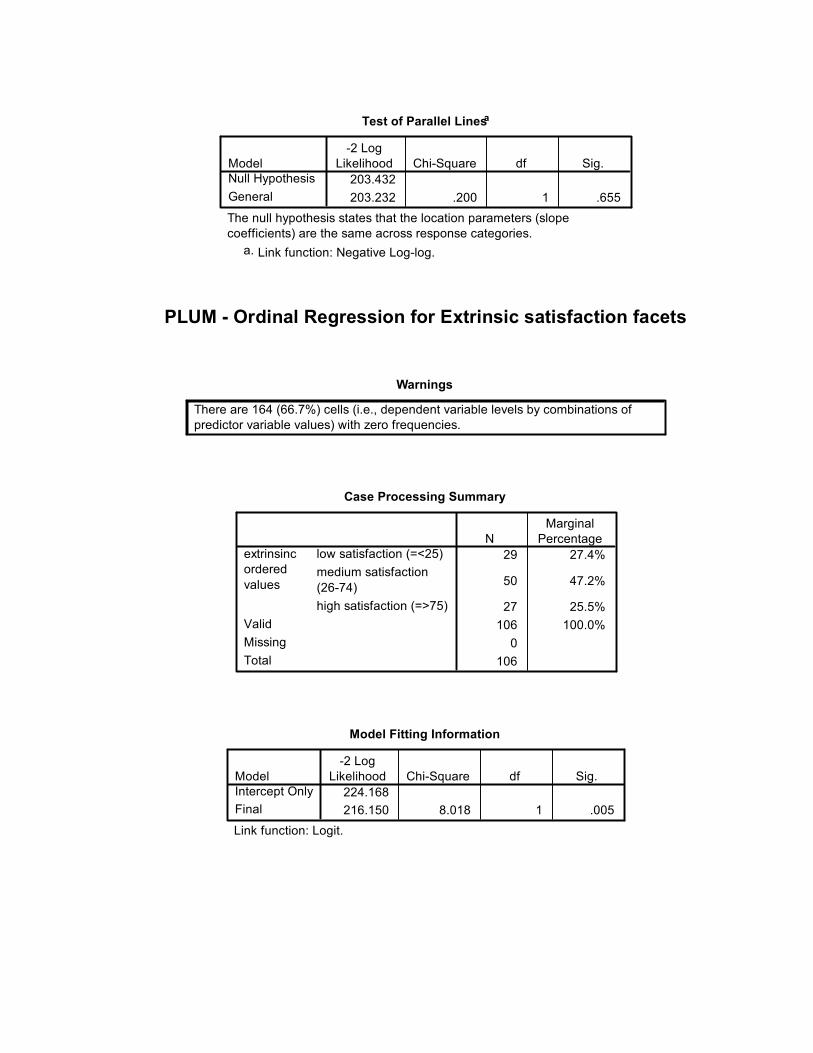
85
Test of Parallel Linesa
203.432203.232 .200 1 .655
ModelNull HypothesisGeneral
-2 LogLikelihood Chi-Square df Sig.
The null hypothesis states that the location parameters (slopecoefficients) are the same across response categories.
Link function: Negative Log-log.a.
PLUM - Ordinal Regression for Extrinsic satisfaction facets
Warnings
There are 164 (66.7%) cells (i.e., dependent variable levels by combinations ofpredictor variable values) with zero frequencies.
Case Processing Summary
29 27.4%
50 47.2%
27 25.5%106 100.0%
0106
low satisfaction (=<25)medium satisfaction(26-74)high satisfaction (=>75)
extrinsincorderedvalues
ValidMissingTotal
NMarginal
Percentage
Model Fitting Information
224.168216.150 8.018 1 .005
ModelIntercept OnlyFinal
-2 LogLikelihood Chi-Square df Sig.
Link function: Logit.
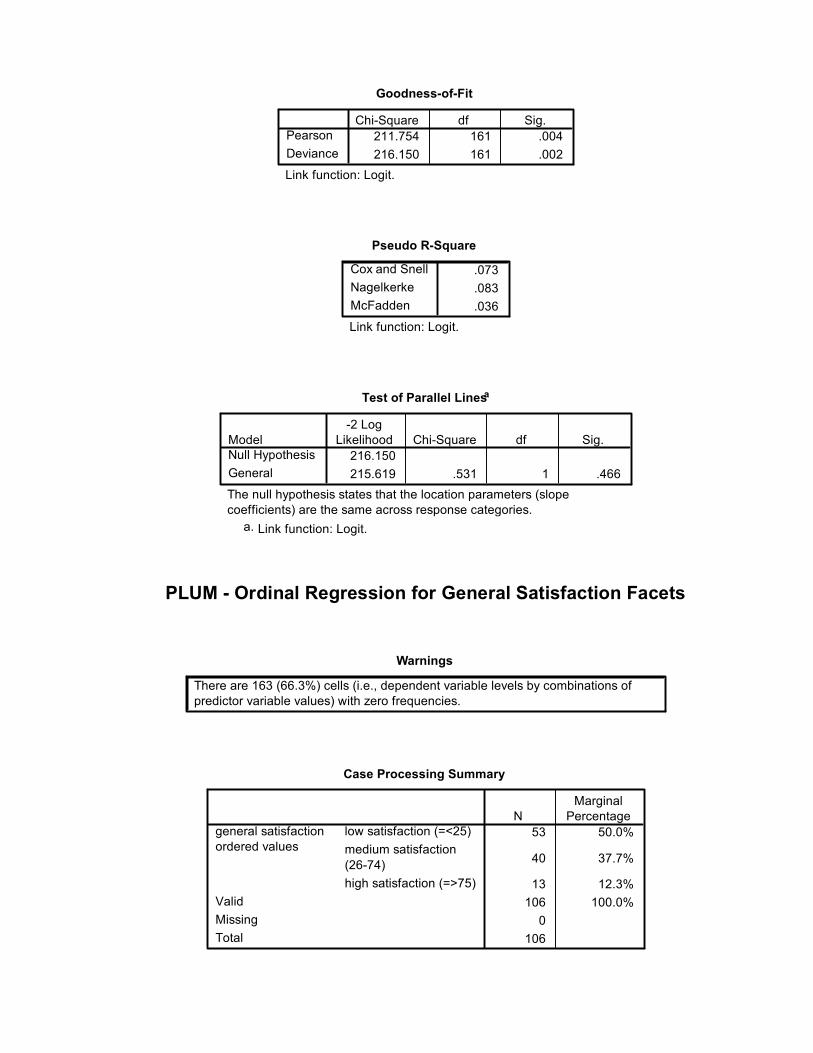
86
Goodness-of-Fit
211.754 161 .004216.150 161 .002
PearsonDeviance
Chi-Square df Sig.
Link function: Logit.
Pseudo R-Square
.073
.083
.036
Cox and SnellNagelkerkeMcFadden
Link function: Logit.
Test of Parallel Linesa
216.150215.619 .531 1 .466
ModelNull HypothesisGeneral
-2 LogLikelihood Chi-Square df Sig.
The null hypothesis states that the location parameters (slopecoefficients) are the same across response categories.
Link function: Logit.a.
PLUM - Ordinal Regression for General Satisfaction Facets
Warnings
There are 163 (66.3%) cells (i.e., dependent variable levels by combinations ofpredictor variable values) with zero frequencies.
Case Processing Summary
53 50.0%
40 37.7%
13 12.3%106 100.0%
0106
low satisfaction (=<25)medium satisfaction(26-74)high satisfaction (=>75)
general satisfactionordered values
ValidMissingTotal
NMarginal
Percentage
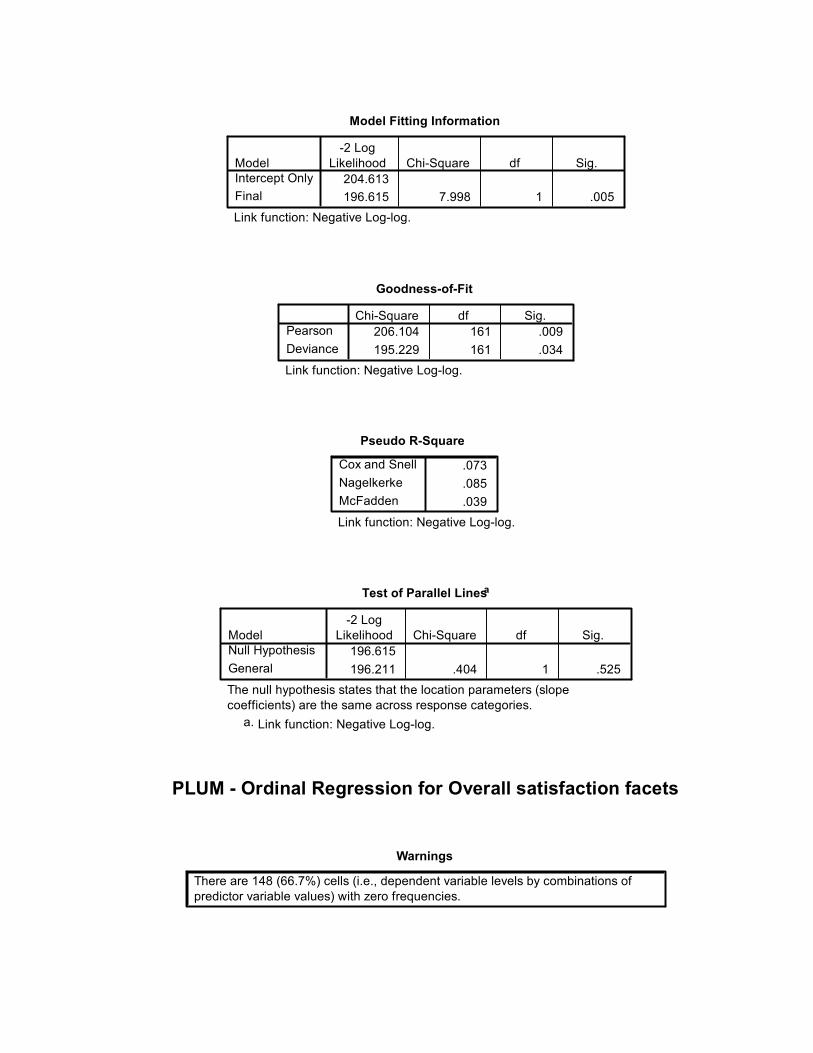
87
Model Fitting Information
204.613196.615 7.998 1 .005
ModelIntercept OnlyFinal
-2 LogLikelihood Chi-Square df Sig.
Link function: Negative Log-log.
Goodness-of-Fit
206.104 161 .009195.229 161 .034
PearsonDeviance
Chi-Square df Sig.
Link function: Negative Log-log.
Pseudo R-Square
.073
.085
.039
Cox and SnellNagelkerkeMcFadden
Link function: Negative Log-log.
Test of Parallel Linesa
196.615196.211 .404 1 .525
ModelNull HypothesisGeneral
-2 LogLikelihood Chi-Square df Sig.
The null hypothesis states that the location parameters (slopecoefficients) are the same across response categories.
Link function: Negative Log-log.a.
PLUM - Ordinal Regression for Overall satisfaction facets
Warnings
There are 148 (66.7%) cells (i.e., dependent variable levels by combinations ofpredictor variable values) with zero frequencies.

88
Case Processing Summary
30 30.6%
43 43.9%
25 25.5%98 100.0%
098
low satisfaction (=<25)medium satisfaction(26-74)high satisfaction (=>75)
overall satisfactionlevel ordered value
ValidMissingTotal
NMarginal
Percentage
Model Fitting Information
210.175201.473 8.701 1 .003
ModelIntercept OnlyFinal
-2 LogLikelihood Chi-Square df Sig.
Link function: Logit.
Goodness-of-Fit
193.759 145 .004201.473 145 .001
PearsonDeviance
Chi-Square df Sig.
Link function: Logit.
Pseudo R-Square
.085
.096
.041
Cox and SnellNagelkerkeMcFadden
Link function: Logit.
Test of Parallel Linesa
201.473201.108 .365 1 .546
ModelNull HypothesisGeneral
-2 LogLikelihood Chi-Square df Sig.
The null hypothesis states that the location parameters (slopecoefficients) are the same across response categories.
Link function: Logit.a.
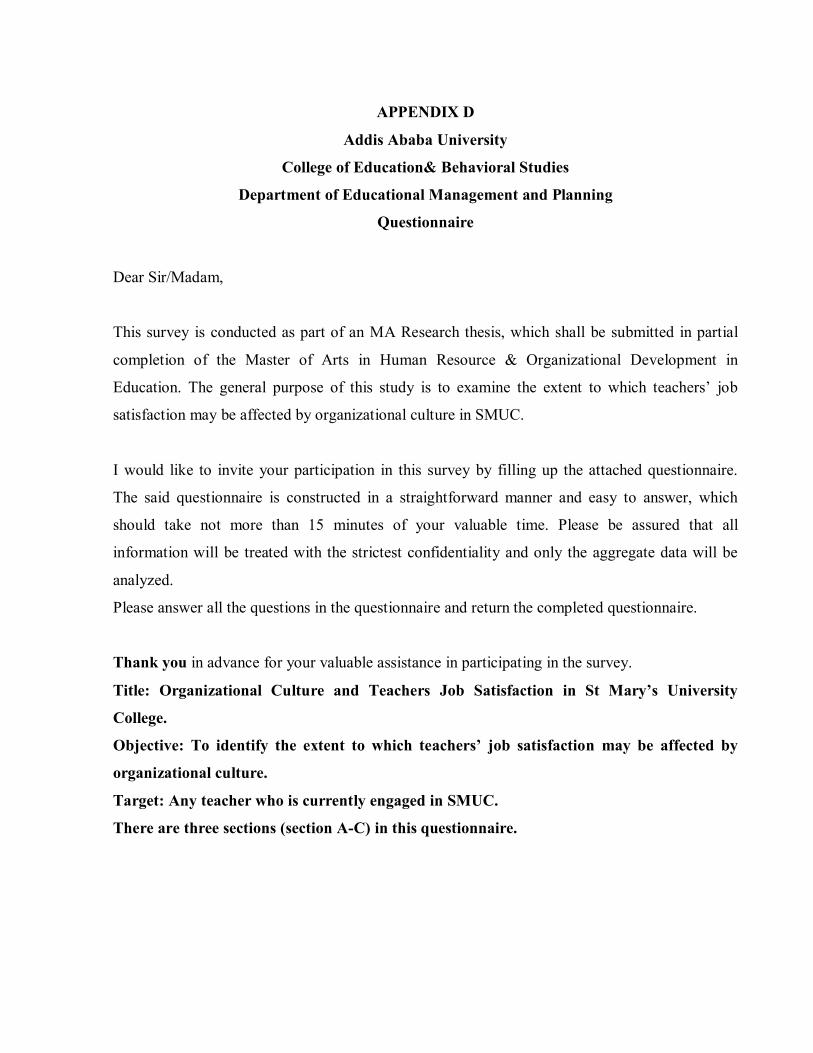
89
APPENDIX D
Addis Ababa University
College of Education& Behavioral Studies
Department of Educational Management and Planning
Questionnaire
Dear Sir/Madam,
This survey is conducted as part of an MA Research thesis, which shall be submitted in partial
completion of the Master of Arts in Human Resource & Organizational Development in
Education. The general purpose of this study is to examine the extent to which teachers’ job
satisfaction may be affected by organizational culture in SMUC.
I would like to invite your participation in this survey by filling up the attached questionnaire.
The said questionnaire is constructed in a straightforward manner and easy to answer, which
should take not more than 15 minutes of your valuable time. Please be assured that all
information will be treated with the strictest confidentiality and only the aggregate data will be
analyzed.
Please answer all the questions in the questionnaire and return the completed questionnaire.
Thank you in advance for your valuable assistance in participating in the survey.
Title: Organizational Culture and Teachers Job Satisfaction in St Mary’s University
College.
Objective: To identify the extent to which teachers’ job satisfaction may be affected by
organizational culture.
Target: Any teacher who is currently engaged in SMUC.
There are three sections (section A-C) in this questionnaire.
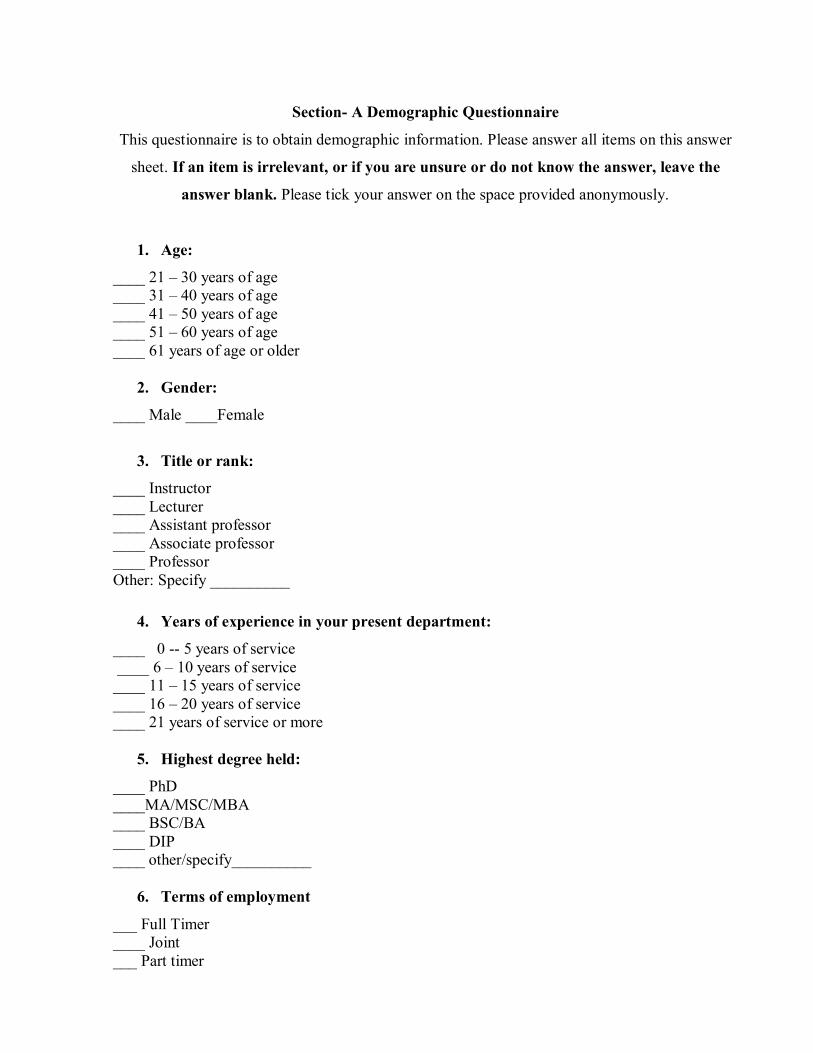
90
Section- A Demographic Questionnaire
This questionnaire is to obtain demographic information. Please answer all items on this answer
sheet. If an item is irrelevant, or if you are unsure or do not know the answer, leave the
answer blank. Please tick your answer on the space provided anonymously.
1. Age:
____ 21 – 30 years of age ____ 31 – 40 years of age ____ 41 – 50 years of age ____ 51 – 60 years of age ____ 61 years of age or older
2. Gender:
____ Male ____Female
3. Title or rank:
____ Instructor ____ Lecturer ____ Assistant professor ____ Associate professor ____ Professor Other: Specify __________
4. Years of experience in your present department:
____ 0 -- 5 years of service ____ 6 – 10 years of service ____ 11 – 15 years of service ____ 16 – 20 years of service ____ 21 years of service or more
5. Highest degree held:
____ PhD ____MA/MSC/MBA ____ BSC/BA ____ DIP ____ other/specify__________
6. Terms of employment
___ Full Timer ____ Joint ___ Part timer

91
other /specify ___________ Section-B Organizational Culture Assessment Instrument
Instructions
The OCAI consists of six questions. Each question has four alternatives. Divide 100 points
among these four alternatives depending on the extent to which each alternative is similar to your
own organization. Give a higher number of points to the alternative that is most similar to your
organization. For example, in question one, if you think alternative A is very similar to your
organization, alternative B and C are somewhat similar, and alternative D is hardly similar at all,
you might give 55 points to A, 20 points to B and C, and 5 points to D. Just be sure your total
equals 100 points for each question.
Organizational Culture Assessment Instrument Please attempt all questions carefully.
1. Dominant Characteristics Current A The organization is a very personal place. It is like an extended family. People
seem to share a lot of themselves.
B The organization is a very dynamic entrepreneurial place. People are willing to stick their necks out and take risks.
C The organization is very results oriented. A major concern is with getting the job done. People are very competitive and achievement oriented.
D The organization is a very controlled and structured place. Formal procedures generally govern what people do.
Total 100 2. Organizational Leadership Current
A The leadership in the organization is generally considered to exemplify mentoring, facilitating, or nurturing.
B The leadership in the organization is generally considered to exemplify entrepreneurship, innovating, or risk taking.
C The leadership in the organization is generally considered to exemplify a no-nonsense, aggressive, results-oriented focus.
D The leadership in the organization is generally considered to exemplify coordinating, organizing, or smooth-running efficiency.
Total 100 3. Management of Employees Current
A The management style in the organization is characterized by teamwork, consensus, and participation.
B The management style in the organization is characterized by individual risk-taking, innovation, freedom, and uniqueness.
C The management style in the organization is characterized by hard driving competitiveness, high demands, and achievement.
D The management style in the organization is characterized by security of employment, conformity, predictability, and stability in relationships.
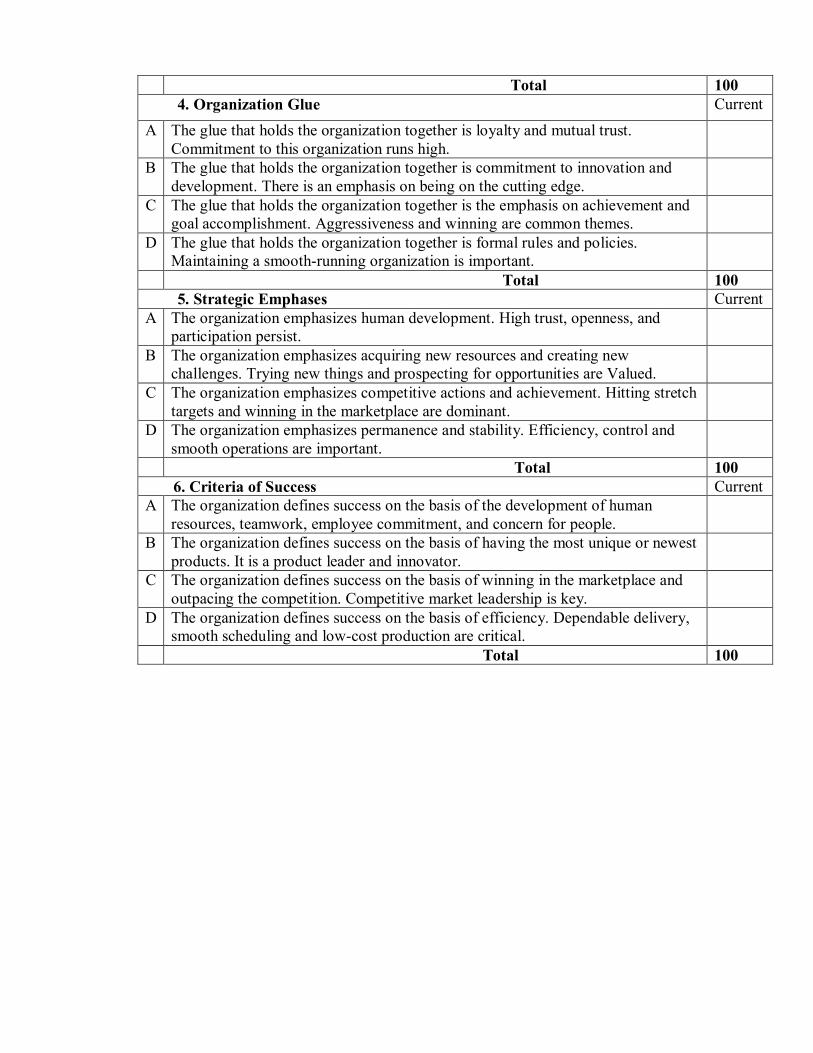
92
Total 100 4. Organization Glue Current A The glue that holds the organization together is loyalty and mutual trust.
Commitment to this organization runs high.
B The glue that holds the organization together is commitment to innovation and development. There is an emphasis on being on the cutting edge.
C The glue that holds the organization together is the emphasis on achievement and goal accomplishment. Aggressiveness and winning are common themes.
D The glue that holds the organization together is formal rules and policies. Maintaining a smooth-running organization is important.
Total 100 5. Strategic Emphases Current A The organization emphasizes human development. High trust, openness, and
participation persist.
B The organization emphasizes acquiring new resources and creating new challenges. Trying new things and prospecting for opportunities are Valued.
C The organization emphasizes competitive actions and achievement. Hitting stretch targets and winning in the marketplace are dominant.
D The organization emphasizes permanence and stability. Efficiency, control and smooth operations are important.
Total 100 6. Criteria of Success Current
A The organization defines success on the basis of the development of human resources, teamwork, employee commitment, and concern for people.
B The organization defines success on the basis of having the most unique or newest products. It is a product leader and innovator.
C The organization defines success on the basis of winning in the marketplace and outpacing the competition. Competitive market leadership is key.
D The organization defines success on the basis of efficiency. Dependable delivery, smooth scheduling and low-cost production are critical.
Total 100
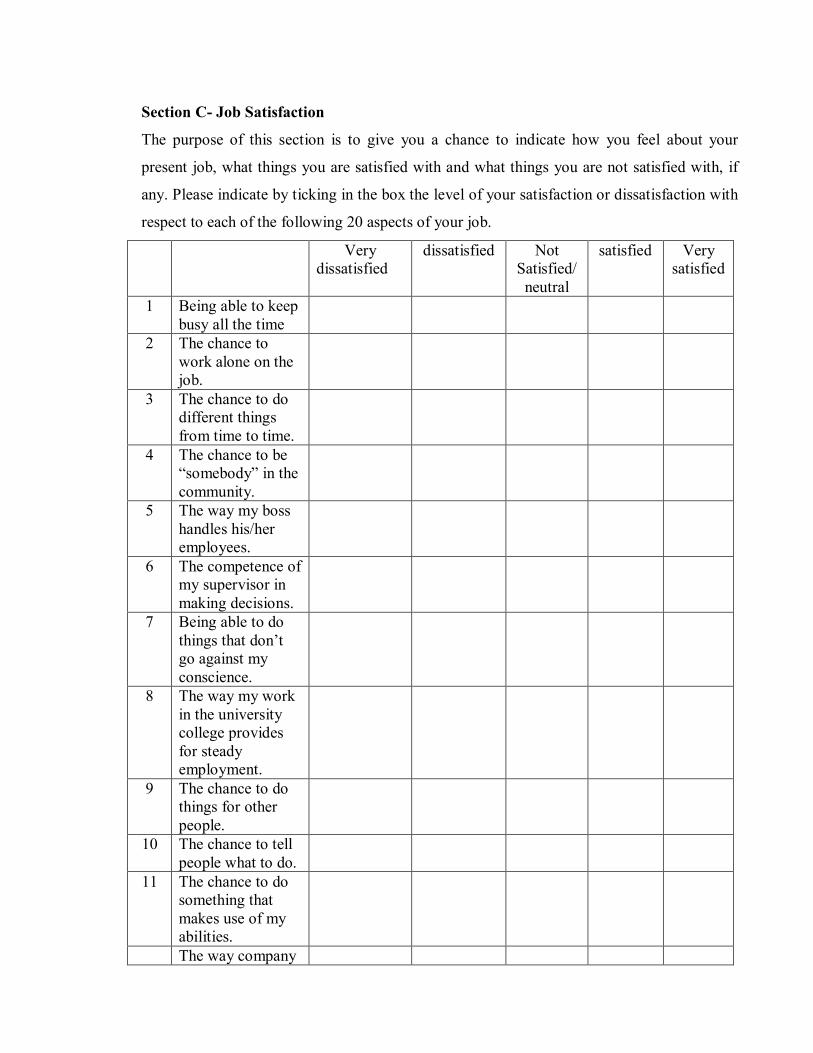
93
Section C- Job Satisfaction
The purpose of this section is to give you a chance to indicate how you feel about your
present job, what things you are satisfied with and what things you are not satisfied with, if
any. Please indicate by ticking in the box the level of your satisfaction or dissatisfaction with
respect to each of the following 20 aspects of your job.
Very dissatisfied
dissatisfied Not Satisfied/
neutral
satisfied Very satisfied
1 Being able to keep busy all the time
2 The chance to work alone on the job.
3 The chance to do different things from time to time.
4 The chance to be “somebody” in the community.
5 The way my boss handles his/her employees.
6 The competence of my supervisor in making decisions.
7 Being able to do things that don’t go against my conscience.
8 The way my work in the university college provides for steady employment.
9 The chance to do things for other people.
10 The chance to tell people what to do.
11 The chance to do something that makes use of my abilities.
The way company
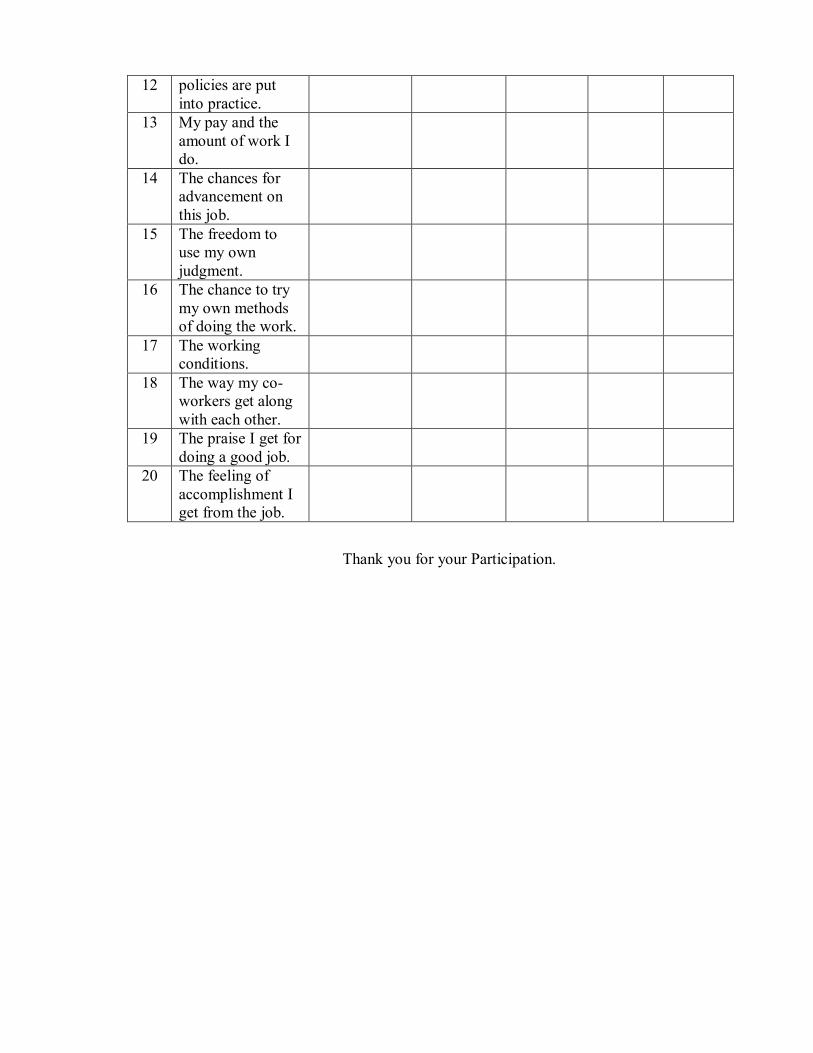
94
12 policies are put into practice.
13 My pay and the amount of work I do.
14 The chances for advancement on this job.
15 The freedom to use my own judgment.
16 The chance to try my own methods of doing the work.
17 The working conditions.
18 The way my co-workers get along with each other.
19 The praise I get for doing a good job.
20 The feeling of accomplishment I get from the job.
Thank you for your Participation.

95
APPENDIX E PERSONAL CHARACTERISTICS OF RESPONDENTS
Variable Category Frequency Percent Valid Percent Cumulative
Percent
1.Age
21-30 39 36.4 36.4 36.4
31-40 58 54.2 54.2 90.7
41-50 7 6.5 6.5 97.2
51-60 3 2.8 2.8 100.0
2. Gender
female 4 3.7 3.7 3.7
male 98 91.6 91.6 95.3
missing 5 4.7 4.7 100.0
3. Highest degree held
PhD 2 1.9 1.9 1.9
Ma/Msc/MBA 73 68.2 68.2 70.1
BSC/BA 28 26.2 26.2 96.3
other 4 3.7 3.7 100.0
4. Academic Rank
instructor 29 26.2 26.2 26.2
lecturer 75 70.1 70.1 96.3
assistant professor 1 .9 .9 97.2
professor 2 2.8 2.8 100.0
5.Terms of employment
full timer 58 54.2 54.2 54.2
joint 14 13.1 13.1 67.3
part time 27 25.2 25.2 92.5
other 8 7.5 7.5 100.0
Total 107 100.0 100.0
96
Declaration I, hereby, declare that this thesis is my original work and has not been presented in any other
university. All the materials used in this thesis have been duly acknowledged.
Name: Henock Beyene Tesfatsion
Signature.____________________________________
Date. ____________________________________
Place ____________________________________
This thesis has been submitted for the examination with my approval as a university advisor.
Name: Befekadu Zeleke (Asso. Prof.)
Signature.________________________
Date. _____________________