organisational politics and employee retention in selected
127
ORGANISATIONAL POLITICS AND EMPLOYEE RETENTION IN SELECTED DISABLED PEOPLE’S ORGANISATIONS IN UGANDA BY JULIET NAMAGULU REG: 11/MMSHRM/26/027 A DISSERTATION SUBMITTED TO THE HIGHER DEGREES DEPARTMENT IN PARTIAL FULFILLMENT OF THE REQUIREMENTS FOR THE AWARD OF MASTER’S DEGREE IN MANAGEMENT STUDIES (HUMAN RESOURCE MANAGEMENT) OF UGANDA MANAGEMENT INSTITUTE OCTOBER, 2013
-
Upload
khangminh22 -
Category
Documents
-
view
0 -
download
0
Transcript of organisational politics and employee retention in selected
ORGANISATIONAL POLITICS AND EMPLOYEE RETENTION IN SELECTED
DISABLED PEOPLE’S ORGANISATIONS IN UGANDA
BY
JULIET NAMAGULU
REG: 11/MMSHRM/26/027
A DISSERTATION SUBMITTED TO THE HIGHER DEGREES DEPARTMENT IN
PARTIAL FULFILLMENT OF THE REQUIREMENTS FOR THE AWARD OF
MASTER’S DEGREE IN MANAGEMENT STUDIES (HUMAN RESOURCE
MANAGEMENT) OF UGANDA MANAGEMENT INSTITUTE
OCTOBER, 2013
i
DECLARATION
I, Juliet Namagulu declare that this research report is my original work and has to the best of my
knowledge, never been submitted for the award of a degree or any other award in a University or
other institutions of higher learning. All the work is original unless otherwise stated.
Signature …………………………………..
Date ……………………………………….
ii
APPROVAL
This report has been submitted to Uganda Management Institute for examination with our approval
as supervisors
DR.MARIA .K. BARIFAIJO
Sign …………………………………
Uganda Management Institute
Date ……………………………………
MR. FRED WAHITU
Sign………………………………
Uganda Management Institute
Date ……………………………..
iii
DEDICATION
This book is dedicated to my dear parents Mr. & Mrs. Naddumba who laid a foundation for my
education, without it, I would not have been what I am today. I am grateful for their mentorship;
encouragement and financial support which has enabled me accomplish my studies. I cannot find
a gift perfect enough to thank my parents but only pray that God abundantly blesses and rewards
them.
iv
ACKNOWLEDGEMENT
Indeed, producing this academic work has been a collective effort of many people with whom I
have interacted during this course and have been instrumental in assisting me accomplish my
studies.
First of all, I wish to acknowledge my supervisors Dr. Maria Barifaijo and Mr. Fred Wahitu who
despite their busy schedule always dedicated their time, expertise, knowledge and moral support.
Without them I do not think I would have completed my degree.
I further wish to recognize and extend my sincere gratitude to my family especially Mr. & Mrs.
Naddumba who fully sponsored this course. My Son Gabriel for his prayers, sister Mrs. Wakhata
and brothers Dr. Malagala and Dr. Kironde for their words of wisdom and encouragement. My
wonderful classmates in the 26th intake that helped me time and again and for the encouragement
they extended to ensure that we complete our studies in time. Thank you. God bless you all.
I would also like to acknowledge my mentors most especially Mr. Frederick Bwire who has always
been my academic mentor, encouraged and offered his words of wisdom and knowledge.
Special thanks go to my respondents for the support and cooperation extended to me in different
capacities even when it seemed too hard. Your generosity in accepting to participate in the study
is acknowledged and highly appreciated. In fact, without their participation I would not have been
able to have the findings to present in my book, notwithstanding the Grace of God.

v
TABLE OF CONTENT
DECLARATION ........................................................................................................................ i
APPROVAL ............................................................................................................................... ii
DEDICATION .......................................................................................................................... iii
ACKNOWLEDGEMENT ....................................................................................................... iv
ABSRTACT ................................................................................................................................ xiv
CHAPTER ONE: INTRODUCTION ......................................................................................... 1
1.1 Introduction ...................................................................................................................... 1
1.2 Background to the Study .................................................................................................. 1
1.3 Statement of the Problem ................................................................................................. 7
1.4 General Objectives of the Study....................................................................................... 8
1.5 Specific Objectives of the Study ...................................................................................... 8
1.6 Research Questions .......................................................................................................... 9
1.7 Hypotheses of the study ................................................................................................... 9
1.8 Conceptual Framework .................................................................................................... 9
1.9 Significance of the Study ............................................................................................... 11
1.10 Justification of the study ................................................................................................ 11
1.11 Scope of the Study.......................................................................................................... 12
1.12 Operational Definitions .................................................................................................. 13
CHAPTER TWO: LITERATURE REVIEW .......................................................................... 14
2.0 Introduction .................................................................................................................... 14
2.1 Theoretical Review ........................................................................................................ 15
vi
2.2 Related Literature ........................................................................................................... 17
2.2.1 Organizational Politics and Employee Retention........................................................... 17
2.2.1.1 Influence and Employee Retention ............................................................................... 19
2.2.1.1.1 Supervisor-Employee Relations ................................................................................. 20
2.2.1.1.2 Co-worker Relations .................................................................................................. 21
2.2.2 Power and Employee Retention ..................................................................................... 22
2.2.2.1 Coercive Power ............................................................................................................. 25
2.2.2.2 Reward Power ............................................................................................................... 26
2.2.2.3 Legitimate Power .......................................................................................................... 28
2.2.2.4 Expert Power ................................................................................................................. 29
2.2.2.5 Referent power .............................................................................................................. 30
2.2.3 Employee Retention ....................................................................................................... 31
2.3 Summary of the Literature Review ................................................................................ 32
CHAPTER THREE: METHODOLOGY ................................................................................ 33
3.0 Introduction .................................................................................................................... 33
3.1 Research Design ............................................................................................................. 33
3.2 Area of Study ................................................................................................................. 34
3.3 Study Population ............................................................................................................ 34
3.4 Sample Size and Selection ............................................................................................. 35
3.5 Sampling Techniques ..................................................................................................... 36
3.6 Data Collection Methods ................................................................................................ 37
3.7 Data collecting Instruments ............................................................................................ 37
3.7.1 Questionnaires ................................................................................................................ 37
vii
3.7.2 Interview Guide .............................................................................................................. 37
3.8 Quality Control of Data Collection Instruments: ........................................................... 38
3.8.1 Validity of Data Collection. ........................................................................................... 38
3.8.2 Reliability of Data Collection ........................................................................................ 38
3.9 Procedures for Data Collection ...................................................................................... 39
3.10 Data Management and Analysis ..................................................................................... 40
3.10.1 Qualitative Data Analysis............................................................................................... 40
3.10.2 Quantitative Data Analysis............................................................................................. 41
3.11 Measurement of Variables ............................................................................................. 42
CHAPTER FOUR: PRESENTATION, ANALYSIS AND INTERPRETATION OF
RESULTS .................................................................................................................................... 43
4.0 Introduction ................................................................................................................... 43
4.1 Response Rate ............................................................................................................... 43
4.2 Demographic Characteristics of Respondents................................................................ 45
4.2.1 Respondents Longevity of Work and Number of Years in the Current Organization ... 45
4.2.2 Respondents by section/department ............................................................................... 46
4.2.3 Respondents’ Level of Education .................................................................................. 48
4.2.4 Respondents by Gender .................................................................................................. 48
4.2.5 Respondents by Terms of Employment ......................................................................... 49
4.3 Influence and Employee Retention in Selected Disabled People’s Organizations ........ 50
4.3.1 Descriptive Results about Influence in Selected Disabled People’s Organizations ....... 50
4.3.2 Findings about Employee Retention in Disabled People’s Organizations ..................... 54
4.3.3 Testing the First Hypothesis ........................................................................................... 57
viii
4.4 Power and Employee Retention in Selected Disabled People’s Organizations. ............ 62
4.4.1 Descriptive Results about Power in Selected Disabled People’s Organizations .......... 62
4.4.2 Testing Hypothesis Two................................................................................................. 69
4.5 SUMMARY ................................................................................................................... 78
CHAPTER FIVE: SUMMARY, DISCUSSION, CONCLUSIONS AND
RECOMMENDATIONS ........................................................................................................ 79
5.1 Introduction .................................................................................................................... 79
5.2 Summary of Major Findings .......................................................................................... 79
5.2.1 Effect of Influence on Employee Retention in Selected Disabled People’s
Organizations. ........................................................................................................................... 79
5.2.2 Effect of Power on Employee Retention in Disabled People’s Organizations in
Uganda… .................................................................................................................................. 80
5.3 Discussion ...................................................................................................................... 80
5.3.1 Effect of Influence on Employee Retention in Disabled People’s Organizations in
Uganda ...................................................................................................................................... 81
5.3.2 Effect of Power on Employee Retention in Disabled People’s Organizations in
Uganda… .................................................................................................................................. 82
5.4 Conclusions .................................................................................................................... 84
5.4.1 Influence and Employee Retention in Disabled People’s Organizations in Uganda ..... 84
5.4.2 Power and Employee Retention in Disabled People’s Organizations in Uganda .......... 84
5.5 RECOMMENDATIONS ............................................................................................. 85
5.5.1 Influence and Employee Retention in Disabled People’s Organizations in Uganda ..... 85
5.5.2 Power and Employee Retention in Disabled People’s Organizations in Uganda .......... 86

ix
5.6 Area for Further Research .............................................................................................. 86
REFERENCE .......................................................................................................................... 87
x
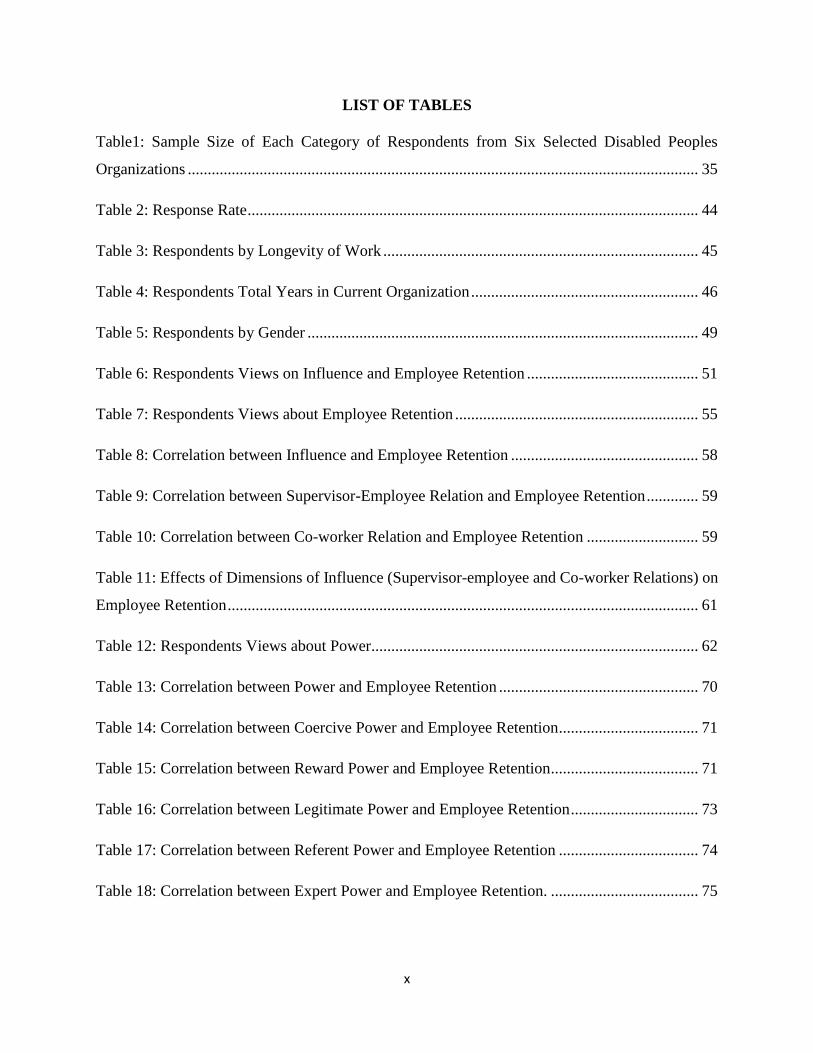
LIST OF TABLES
Table1: Sample Size of Each Category of Respondents from Six Selected Disabled Peoples
Organizations ................................................................................................................................ 35
Table 2: Response Rate ................................................................................................................. 44
Table 3: Respondents by Longevity of Work ............................................................................... 45
Table 4: Respondents Total Years in Current Organization ......................................................... 46
Table 5: Respondents by Gender .................................................................................................. 49
Table 6: Respondents Views on Influence and Employee Retention ........................................... 51
Table 7: Respondents Views about Employee Retention ............................................................. 55
Table 8: Correlation between Influence and Employee Retention ............................................... 58
Table 9: Correlation between Supervisor-Employee Relation and Employee Retention ............. 59
Table 10: Correlation between Co-worker Relation and Employee Retention ............................ 59
Table 11: Effects of Dimensions of Influence (Supervisor-employee and Co-worker Relations) on
Employee Retention ...................................................................................................................... 61
Table 12: Respondents Views about Power.................................................................................. 62
Table 13: Correlation between Power and Employee Retention .................................................. 70
Table 14: Correlation between Coercive Power and Employee Retention ................................... 71
Table 15: Correlation between Reward Power and Employee Retention ..................................... 71
Table 16: Correlation between Legitimate Power and Employee Retention ................................ 73
Table 17: Correlation between Referent Power and Employee Retention ................................... 74
Table 18: Correlation between Expert Power and Employee Retention. ..................................... 75

xi
Table 19: Effect of Dimensions of Power (Coercive, Reward, Legitimate, Referent and Expert
Power) on Employee Retention .................................................................................................... 76

xii
LIST OF FIGURES
Figure 1: Conceptual Framework: Effect of Organizational Politics on Employee Retention in
Disabled people’s Organizations in Uganda. ................................................................................ 10
Figure 2: Respondents Section/Department.................................................................................. 47
Figure 3: Respondents Level of Education ................................................................................... 48
Figure 4: Respondents Terms of Employment ............................................................................. 49
xiii
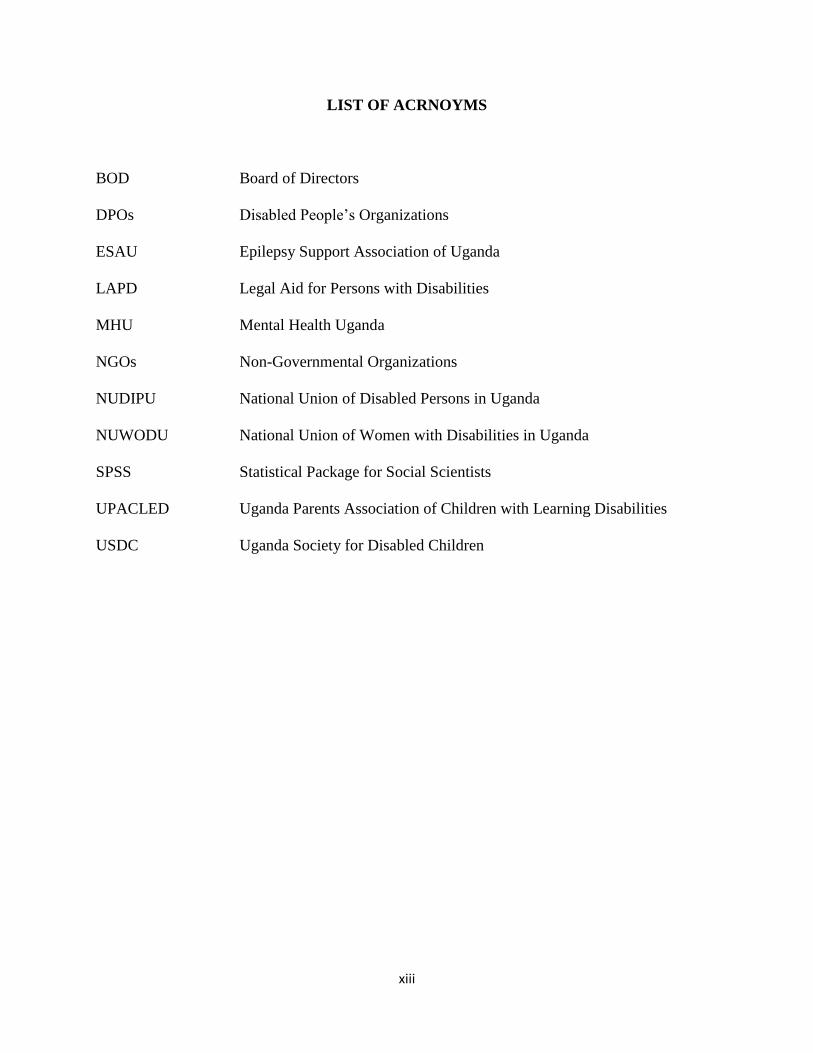
LIST OF ACRNOYMS
BOD Board of Directors
DPOs Disabled People’s Organizations
ESAU Epilepsy Support Association of Uganda
LAPD Legal Aid for Persons with Disabilities
MHU Mental Health Uganda
NGOs Non-Governmental Organizations
NUDIPU National Union of Disabled Persons in Uganda
NUWODU National Union of Women with Disabilities in Uganda
SPSS Statistical Package for Social Scientists
UPACLED Uganda Parents Association of Children with Learning Disabilities
USDC Uganda Society for Disabled Children

xiv
ABSRTACT
The purpose of the study was to investigate the effects of organizational politics on employee
retention in selected Disabled People’s Organizations in Uganda. The problem of the study was
low employee retention as a result of organizational politics in Disabled People’s Organizations in
Uganda. Disabled People’s Organizations were faced with rampant labour turnover, leading to a
loss of competent and committed human resource. In response, Disabled People’s Organizations
decided to improve salary packages offered to their employees. Regardless of the efforts, labour
turnover persisted thus threatening the performance and survival of Disabled People’s
Organizations in Uganda (NUDIPU, 2011). The following specific objectives guided the study: i)
to find out the effects of influence on employee retention in Disabled People’s Organizations in
Uganda and ii) to assess the effects of power on employee retention in selected Disabled People’s
Organizations in Uganda. The study used a cross-sectional survey research design in six selected
Disabled People’s Organizations. A sample of 76 respondents was selected using simple random
sampling, purposive sampling for key informants and snow ball sampling for former workers of
these organizations out of which a 53% response rate was received. The methods used to collect
the data were questionnaire survey method and interviewing method. Content analysis was used
to edit qualitative data and reorganize it into meaningful shorter sentences. Quantitative analysis
mainly consisted of descriptive statistics (frequencies and percentages) and inferential statistics
(spearman correlation coefficient of determination). The study findings indicated that influence
had a negative and insignificant effect on employee retention with a correlation coefficient of r= -
0.013 with a significance p=.945 while power had a positive and insignificant effect on employee
retention as indicated by the correlation coefficient of r= .209 with p=.255. Thus, it is concluded
that both influence and power did not significantly affect employee retention in Disabled People’s
Organizations in Uganda. Basing on the study findings, it was recommended that the management
of Disabled People’s Organizations should focus on boosting salary and non-monetary benefits
such as setting up opportunities for promotions on merit to give staff a clear path for career growth,
management should design or move towards a programme based structure instead of a project
based. In addition, board members should trust staff in top management to lead Disabled People’s
Organizations, since they have the experience and have been recruited to manage the
organizations. This will thus enhance retention in the organizations.

1
CHAPTER ONE: INTRODUCTION
1.1 Introduction
Employee retention is at the center of long term survival of all organizations especially in this era
of stiff competition. Consequently, all organizations are looking for ways in which to enhance the
stability of their employees. This study was intended to investigate the effects of organizational
politics on employee retention in selected Disabled People’s Organizations (DPOs).
Organizational politics was perceived as the independent variable. The dimensions of
organizational politics were influence and power. The dependent variable was employee retention
and its dimensions were average length of service and number of employees leaving per year. The
six DPOs selected for this study included; NUDIPU, NUWODU, LAPD, MHU, USDC and
UPACLED. These were selected because they had a moderately bigger workforce to participate
in the study. This chapter presents the background to the study, statement of the problem, the
general objective, specific objectives, research questions, research hypothesis, the scope of the
study, the significance, justification and operational definition of the terms.
1.2 Background to the Study
In the background to the study, there are a number of approaches that have been developed. Amin
(2005), contends that the researcher will develop the background of the study based on four
perspectives namely the historical, theoretical, conceptual and contextual perspectives (as cited in
Barifaijo, Basheka, and Oonyo, 2010). Therefore for purposes of this study, the researcher decided
to use Amin’s approach.
2
Historical perspective
In the last decade, the growth of Non-Governmental Organizations and Civil Society
Organizations has rocketed. Non-Governmental Organizations have increasingly come to play a
significant role in providing essential services for the development of society (Ya-anan and
Bunchapattansukda, 2011). These organizations are one type of institutions that provide
employment opportunities in addition to the private sector and government institutions. Yared
(2007), asserts that one of the major factors that determine the success of NGOs is the availability
of committed, efficient and effective human resource. For that matter, any organization to achieve
its goal needs staff that are competent enough to execute their responsibilities in a professional
manner and are dedicated to the organizational objectives.
The origin and extent of organizational politics are not known, but surely the ancient Greeks and
Romans were masters of political intrigue before Machiavelli’s The Prince (1537/1952)
(Vredenburgh and Fossen, 2010). Dale (1936), recognized office politics as a reason for success
in business and more recently suggested that politics is not only a natural and pervasive part of life
but also an activity important to success within many organizations (as cited in Vredenburgh and
Fossen, 2010). For over four decades, managerial theory and practice have been preoccupied with
issues related to power, influence and politics in organizations (Drory andVigoda-Gadot, 2009).
Drory and Vigoda-Gadot (2009), also argue that the politics of management and management of
politics in the workplace have received a great deal of attention due to their image of pervasiveness,
mystery and potential benefits for those who know how to use them in the struggle over resources.
Thus, organizational politics is basically used to meet individual interests and out compete others
3
in the work arena. In his earlier write up on organizational politics, Vigoda (2003), described
organizational politics as the unique domain of interpersonal relations in the workplace. Its main
characteristics are the readiness of people in their effort to influence others and secure personal or
collective interests or alternatively, to avoid negative outcomes within the organization (Drory and
Vigoda-Gadot, 2009). Thus implying that organizational politics in organizations is intended to
fulfill personal interests and use it to gain advantage over competitors.
The issue of retention dates back from the early 1900s when industrial engineers and industrial
psychologists attempted to ascertain the major reason behind employees’ level of interest in
various jobs (Ferris, 1989 as cited in Kyohairwe, 2012). In the early 20th century, businesses were
founded and greatly survived on their ability to access financial capital. By mid-20th century, there
was growing awareness that it is the people and inspiration, knowledge and creativity they bring
that creates competitive advantage. In the 21st century, retention of human resource is a concern in
most organizations. It has moved to a strategic level to address new methods of attraction and
retention in light of the global trends. Companies today are facing a high turnover rate of their
valuable employees (Wayne, 1998). While others leave for competitive rewards, others may leave
for job security, career developments and others find it impossible to deal with the political
behavior in their organizations. All this imposes costs of recruitment, training, loss of trade secrets,
corporate image and poor succession planning (Wayne 1998 as cited in Kyohairwe, 2012).
Theoretical Perspective
The assumptions of French and Raven (1959) theory on power formed the basis of this study. This
theory is one of the most influential theories on power. French and Raven attempted to determine

4
the bases of power leaders use to influence others. The bases included: coercive, reward,
legitimate, referent and expert power (Lunenburg, 2012). This theory deals with the perception of
power and how to use all five bases of power to enhance willingness to perform and bring about
compliance. In this theory, power is the capacity to influence others (Turner, 2005). Therefore
power is attained when someone has the ability to control resources such as rewards, control,
negative and positive outcomes and information that are desired, valued and needed by others and
which makes them dependent on the influencing agent for satisfaction of their needs or reaching
their goals.
According to Lunenburg (2012), expert and referent power are more strongly related to
organisational commitment, job satisfaction and job performance unlike coercive, reward and
legitimate power. However, the various sources of power should not be thought of as completely
separate. Hence all the five bases of power according to this theory should be possessed by a
manager to enhance efficiency and effectiveness in the organisations. This theory therefore, deals
with the perception of power and how to use all five bases of power to enhance willingness to
perform and bring about compliance. Power theory is therefore meant to explain the existing
organisational politics and how it hinders employee retention in Disabled People’s Organisations.
Conceptual Perspective
Organizational politics is an inescapable and intrinsic reality (Ram and Prabhakar, 2010). The
struggle for resources, the conflict that arises when critical decisions need to be made and the need
to get over one another for one’s survival in a competitive market has made the existence of politics
5
very common in the work arena. Kacmar et al (1999), defines organisational politics, as that which
involves actions by individuals, which are directed towards the goal of furthering their own self-
interests without regard for the wellbeing of others or their organization (Sowmya and
Panachanatham, 2011). For purposes of this study, organizational politics was operationalized as
intentional use of power to influence decisions in an organization to achieve individual or
organizational goal. Organizational politics was therefore assumed to manifest through power and
influence.
Vigoda (2003), argues that both politics and power are a significant part of human behavior as they
affect the ability to secure one’s goals and interests in the social system. Hence is often the reason
organizational politics affects retention of employees in organizations since it entitles use of both
power and influence to attain a personal goal. Managers will always use their power and influence
to ensure that staff comply and this is always accompanied by a reward or punishment to
employees for complying or defying instructions given. Depending on the circumstances in which
the reward is given, it may create tension between managers and workers which could result in
increased turnover.
Quick and Nelson, (2009), refers to influence as the process of affecting the thoughts, behavior
and feelings of another person. That other person could be the boss (upward influence), an
employee (downward influence) or co worker (lateral infleunce). Therefore for purposes of this
study, influence referred to relationships directed towards achieving personal or organizational
goals. Relations at work are key to promoting organizational politics and could as well promote or
distort employee retention. In an attempt to attract and retain key employees, every organization
6
has its own retention strategies to ensure that there is job satisfaction and motivation of staff which
creates competition with other organizations. The existence of organizational politics and the use
of power to steer organizational politics in Disabled People’s Organizations, were presumed to
affect retention of employees.
Worldwide retention of employees has been of serious concern to managers in the face of the ever
increasing high rate of employee turnover (Samuel and Chipunza, 2009). Employee retention was
operationalized as average length of service and number of employees leaving per year. Power for
purposes of this study, referred to the ability to influence others to work for you with the intention
of meeting a goal by controlling, providing or denying the other a reward for their actions. Quick
and Nelson (2009), comment that power is an exchange relationship and occurs in transactions
between an agent and target. Thus involves a give and take situation. When an individual has
power h/she is in position to influence as well as authorise other people with the intention of
attaining whatever h/she desires to have.
Contextual Perspective
National Union of Disabled Persons in Uganda (NUDIPU) was formed in 1987 to unite the
membership of National Association of the Blind (NAB) and National Association of the Deaf
(NAD) the two DPOs that existed at that time. In the last ten years, the number of organizations
has continued to soar with eight currently registered with NUDIPU and several district level
community based organizations (ADD, 2009).
7
Majority of their human resources comprise of disabled employees with a variety of academic
backgrounds and who have received on job training which has enabled them attain their
professional and work experience from these organizations. This is because most of the staff with
disability were not in position to access employment in the mainstream labor market due to
stereotypes bone by both public and private employers on the potential of PWDs (ADD, 2009). As
a result, PWDS have been left to struggle for employment within their own organizations a
tendency that has created ground for political behavior exhibited in Disabled People’s
organizations as a strategy by staff to retain their positions (NUDIPU, 2011).
Further still resistance to change (NUDIPU, 2011), has also escalated political behavior such as
gossip, formation of cliques which has distorted the progress of change in these organizations
resulting in job dissatisfaction and emotional fatigue thus has forced these organizations to wrestle
with retention challenges. Most of these organizations derive their financial sustainability from a
few donor organizations and their desire to acquire funds to implement project activities and
sustain donor relationships has made them more competitive escalating into inter DPO politics
(NUDIPU, 2011). It was on this basis that the study investigated the effects of organizational
politics on employee retention in selected Disabled People’s Organizations.
1.3 Statement of the Problem
In today’s work era, many organizations are facing a challenge of competition characterized by
high turnover rate of employees. Yared (2007), asserts that one of the major factors that determine
the success of NGOs is the availability of competent and committed human resources. Disabled

8
People’s Organizations in Uganda were faced with rampant turnover rates thus affected staff
performance (NUDIPU, 2011).
In an effort to enhance employee retention, Disabled People’s Organizations decided to focus at
improving remunerations to employees through provision of attractive salary packages, offered
on-monetary rewards like health insurance, provided training and development opportunities to
improve knowledge base (NUDIPU, 2007). Regardless of their efforts, labour turnover persisted
as evidenced by the increased work load and low commitment of employees which adversely
affected their quality of work (NUDIPU, 2007). Organizational politics also affected employees’
commitment to work as evidenced by the continued abuse of power by leaders in the organizations.
Some leaders used their power to misuse organizational resources which affected implementation
of activities, hindered employee performance which resulted into frustration of employees (Annual
Report, 2009). However, the influence of organizational politics on employee retention in Disabled
People’s Organizations had apparently not been studied and documented. Hence, this study was
meant to assess the effects of organizational politics on employee retention in Disabled People’s
Organizations in Uganda.
1.4 General Objectives of the Study
The objective of the study was to investigate the effects of organizational politics on employee
retention in selected Disabled People’s Organizations in Uganda.
1.5 Specific Objectives of the Study

9
1.5.1 To find out the effects of influence on employee retention in selected Disabled People’s
Organizations in Uganda.
1.5.2 To assess the effects of power on employee retention in selected Disabled People’s
Organizations in Uganda.
1.6 Research Questions
1.6.1 What is the effect of influence on employee retention in selected Disabled People’s
Organizations in Uganda?
1.6.2 What is the effect of power on employee retention in selected Disabled People’s
Organizations in Uganda?
1.7 Hypotheses of the study
1.7.1.1 Influence has a significant effect on employee retention in selected Disabled People’s
Organizations in Uganda.
1.7.2 Power has a significant effect on employee retention in selected Disabled People’s
Organizations in Uganda.
1.8 Conceptual Framework
Figure 1 below is a conceptual framework highlighting factors that affect employee retention in
selected Disabled People’s Organizations in Uganda, having organizational politics as the major
cause. The independent variable was organizational politics and its dimensions were influence and
power. Employee retention was the dependent variable and its dimensions included; average length
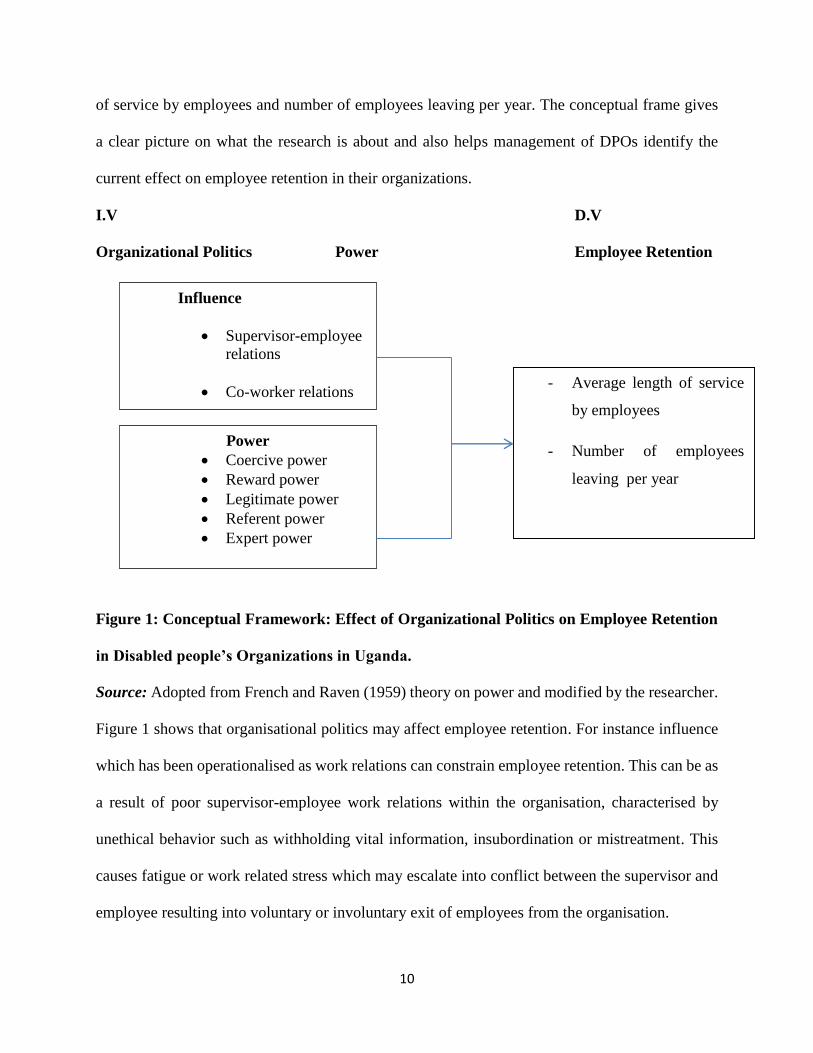
10
of service by employees and number of employees leaving per year. The conceptual frame gives
a clear picture on what the research is about and also helps management of DPOs identify the
current effect on employee retention in their organizations.
I.V D.V
Organizational Politics Power Employee Retention
Figure 1: Conceptual Framework: Effect of Organizational Politics on Employee Retention
in Disabled people’s Organizations in Uganda.
Source: Adopted from French and Raven (1959) theory on power and modified by the researcher.
Figure 1 shows that organisational politics may affect employee retention. For instance influence
which has been operationalised as work relations can constrain employee retention. This can be as
a result of poor supervisor-employee work relations within the organisation, characterised by
unethical behavior such as withholding vital information, insubordination or mistreatment. This
causes fatigue or work related stress which may escalate into conflict between the supervisor and
employee resulting into voluntary or involuntary exit of employees from the organisation.
Power
Coercive power
Reward power
Legitimate power
Referent power
Expert power
Influence
Supervisor-employee
relations
Co-worker relations - Average length of service
by employees
- Number of employees
leaving per year
11
The above figure, also shows how power may affect employee retention. For instance reward
power if used unfairly, whereby employees are denied pay or are not recognised for their
comptence, will steer tension among employees which will force them to act in a way they deem
appropirate such as leaving the organisation for another organisation offering competitive pay as
well as non montery rewards such as recognition, transport, health insurance just to mention but
a few. Thus the desire to have motivating factors such as those mentioned above influence an
employee’s length of service in an organisation.
1.9 Significance of the Study
Organizational politics has become a major hindrance on employee retention in DPOs. Therefore,
the study findings may help Disabled People’s Organizations understand the effects of
organizational politics on employee retention and thus guide the managers in influencing
appropriate and productive organizational politics as well as strategies that will enhance retention
of employees in the organizations. The findings of the study will also add to the existing body of
knowledge on organizational politics retention of employees which will be used by academicians,
scholars and researchers to identify gaps for future research.
1.10 Justification of the study
Employee retention especially for competent employees is a key challenge in most organizations
today. Many organizations take various strategies to ensure their employees do not leave them.
However, despite all this effort, labor turnover persists. This research was therefore aimed at
assessing whether organizational politics affect employee retention. The study was also useful to

12
the researcher because it was carried out with the intention of acquiring a masters degree in
management studies from Uganda Management Institute.
1.11 Scope of the Study
Geographical Scope
The research was conducted in six Disabled people’s Organizations within Kampala and Wakiso
districts. The study involved the top management, middle managers and support staff from the
administrative and programme departments. Former employees who worked with these
organizations during the period under study (2008-2011) were also included since they were
deemed resourceful in providing information that affected employee retention during the period
under review.
Time Scope
The study covered five year (2008 - 2011) period because it was the period during which Disabled
People’s Organizations in Uganda experienced a high labor turnover (NUDIPU Evaluation
REPORT, 2011).
Content Scope
The study limited its scope to assessing the effect of organizational politics on employee retention
in selected Disabled People’s Organizations. The study focused on organizational politics as the
independent variable with emphasis on two dimensions that is; influence and bases of power
13
namely; coercive, reward, legitimate, expert and referent power. The dependent variable was
employee retention.
1.12 Operational Definitions
Organizational Politics referred to the intentional use of power to influence decisions to achieve
individual or organizational goals.
Influence: influence in the study, referred to relationships directed towards achieving personal or
organizational goals.
Supervisor-employee relations referred to the work relationship between the manager and
employee.
Co-worker relations referred to the work relationship among the employees of the organizations.
Power: Power for purposes of this study referred to the ability to influence others to work with
the intention of meeting a goal by controlling, providing or denying the other rewards for their
actions.
Coercive power referred to the ability to use power to influence people using threats and
punishments.
Reward Power referred to the ability of a manager to reward an employee in exchange for
compliance.
Legitimate Power referred to the ability of a manager to use position of power to influence
employees.
Expert Power referred to an individual’s ability to use expertise and knowledge to influence a
target.
14
Referent Power referred to influence based on possession by an individual of desirable personal
traits.
Employee Retention in the study, referred to practices put in place by management to ensure that
competent employees are kept in the organization for a long time.
CHAPTER TWO: LITERATURE REVIEW
2.0 Introduction
15
Staff retention is a managerial challenge every manager in an organization experiences. In most
cases, staff members override importance of other factors. This is because staff members are
flexible and hard to find. This makes it necessary that once found, efforts should be made to retain
them (Porter, 1973 as cited in Acayo, 2012). This chapter is a review of literature on the effects of
organizational politics and power on employee retention in selected Disabled People’s
Organizations in Uganda. The chapter covers theoretical review, related literature review on the
study and finally the summary of the literature review. Related literature is discussed based on two
specific objectives of the study.
2.1 Theoretical Review
Several scholars have developed a number of theories on power but the current researcher decided
to choose on one theory that is; French and Raven (1959) theory on power, which was considered
suitable and relevant for this study. French and Raven theory on power defines power as the
potential to influence and influence is power (Turner, 2005). The basic idea with this theory is that
power is attained through control of resources, (positive and negative outcomes, rewards, costs
and information etc) that are desired, valued or needed by others. This makes the target dependent
on the influencing agent for the satisfaction of their needs or reaching their goals.
In the theory, French and Raven developed five bases of power which were used in describing why
organizations work as they do (Stichman, 2002). It describes and explains how people, usually
supervisors, use influence and power effectively in numerous organisational setting. For example;
teachers influencing students, doctors influencing patients and managers influencing workers. The
theorists claim that people will exert more effort at work if they believe that they have power and
16
if another person perceives them as having it. Therefore, doing so will help them achieve rewards
which will motivate employees to remain committed to their jobs.
The five bases of power developed by French and Raven were; coercive and reward power which
were originally defined by using tangible rewards and physical punishments or threats of
punishments. The authors noted however, that personal rewards and punishments, such as
expressions of approval or rejection, can be a source for great reward or coercive power. The third
base of power is legitimate power which was explained as an obligation power in which people
comply because they have the obligation to do so. Hence, legitimate power focuses on reciprocity,
equity and responsibility. The fourth and fifth power, French and Raven, elucidates are expert and
referent power. These two bases of power were defined in only a positive form. For the case of
expert and referent power, people do what they are told to do if they acknowledge the expertise of
the influencing agent or if they respect him or her. However sometimes people do the opposite
even if they recognize the influencing agent’s expertise or if the person is unattractive (Raven,
1993 as cited in Stichman, 2002). Such a theory is a clear explanation of how power is used by
managers or leaders in an organizational setting to influence subordinates.
Therefore, People view power as achieving some degree of control over others or resources or may
see the power as a reward and informational, henceforth, fortify feelings of competence and self-
determination. The researcher appreciates the authors’ contribution but this theory may not apply
to every person. Some people may possess only one or two of the five types mentioned which are
used to ensure compliance from their target but certainly not all five powers.

17
2.2 Related Literature
Related literature covered organizational politics, power and how they affect employee retention.
2.2.1 Organizational Politics and Employee Retention
There is too much wrangling and maneuvering going on in today’s workplace and whether you
hate it, practice it or avoid it, office politics is a fact of life in any organization (Kabuye, 2012).
Ferris and Kacmar (1992), acknowledge that behaviour in and of organizations is often political in
nature. There are different interpretations and definitions of politics that have been cited by several
writers (e.g.Drory, Romm, 1993; Ferris, Kacmar 1992 as cited in Vigoda, 2000). However, recent
literature has a distinguished approach to define organizational politics. Daft (2007), defines
organizational politics as a self-serving behavior. This definition emphasizes the self-serving
behavior of politics and the involvement in activities that are not sanctioned by the organization.
Similarly, Greenberg and Baron (1997), describe organisational politics as those actions not
officially approved by an organisation taken to influence others to meet one’s personal goals (as
cited in Curtis, 2003). Some of these personal benefits may be access to tangible assets like
company vehicles, computers and non tanginable benefits like status or pseudo authority that
influences behavior of others. Hence, members of the organization use power to swing decisions
to their favour (Drory and Romm, 1990). Therefore, why would employees percieve their work
evrinoment to be political charged?
Employees will perecive their work environment to be politically charged if they believe that they
lack information about organisational objectives, job responsibilities, outcomes of job
18
performance, resources are limited in their workplace such as pay rise and promotions, and trust
levels are low among organisational members (Poon, 2003 as cited in Curtis, 2003). In such
situations, managers usually try to influence decisions by using power in order to protect or further
their own interest (Tonn, 1978; Daft, 2007). To be effective at managing organisational politics,
managers need to know and understand the dynamics of organisational politics. Of all the functions
a manager performs, handling politics within an organisation is complex. This is due in part, to the
fact that organisational politics is not about acquiring better pay or promotion but rather attain
greater power or control for its own end or disrepudiate a competitor (retrieved from wikipedia,
2013). For example, Pfeffer (1992), suggests that organisational politics is carried out to acquire,
enhance, and use power and other resources to obtain preferred outcomes in a sitution where there
is uncertainity and disagreement.
Also, politics creates a balance between those who have the power and those who lack it, improves
organization’s flexibility and ability to deal with a changing environment, prevents stagnation of
the organizational units, sometimes promotes growth and rejuvenation, prevents group-thinking
and may enrich decision making processes (retrieved from Wikipedia, 2013). This therefore
implies that organizational politics is not only looked at as dysfunction but can also be considered
functional since it assists organizations to attain their goal.
Organizational politics is mainly known to be a demotivating factor at the workplace. For instance
employees feel demotivated if a non-performer can be the apple of his boss’s eye simply due to
politics. Employees playing politics always look for an opportunity to tarnish the image of their
fellow workers. Employees feel demotivated when they are not rewarded suitably or someone who
19
has not worked hard gets the benefits due to mere politics. Demotivation of employees is an
outcome of labor turnover. Losing employees is costly in terms of the impact it has on
organizational morale because those that remain behind, may also feel demotivated and follow
suit. It is therefore, unquestionable that organizational politics has an effect on employee retention.
The soaring retention levels are proving to be a challenge for disabled people’s organizations and
should be addressed by management through provision of appropriate strategies to enable
employees enjoy their work.
2.2.1.1 Influence and Employee Retention
Influence refers to the ability to use social forces to affect the behavior of others. According to
Quick and Nelson (2009), influence involves the process of affecting the thoughts, behaviors or
feelings of another person. The other person could be the boss (upward influence), an employee
(downward influence) or coworker (lateral influence). Influence tactics are strategies that workers
can use to achieve certain outcomes (Robbins, 2009). These tactics are basically used for several
reasons such as; requesting for help, approval, resources, political support, favor in performance
evaluation and being rewarded say with a promotion. To attain the above mentioned reasons, good
work relations are required between the employer and employee. Hence, in this study, influence
was looked at as supervisor-employee relation and co-worker relation. Gebremedhin (1999),
claims that best performance is realized when workers are motivated and working under
appropriate work relations with both supervisors and coworkers (as cited in Acayo, 2012).
Corpuz (2002), argues that influence resembles power however, tends to be more subtle and
indirect. Influence is a major factor in organizational politics since it is mainly concerned with
20
building relationship between two parties. Interpersonal relation is frequently used as a general
term to describe the ways in which managers and employees interact with each other. When
employee management stimulates more and better work, the organization has effective human
relations (Greenberg, 2005 as cited in Kyohairwe, 2012). Ferris and King (1991), agree with
Greenberg’s argument and predicated that the use of influence in organizations is positively related
to the manager’s positive attitude towards his/her employees. (i.e. the more an employee uses
influence in an organization, the more his/her performance is appreciated). The relationship
between direct supervisors and workers is a key factor in employee satisfaction (Putman, 2002 as
cited in Kyohairwe, 2012). Therefore good interpersonal relations are important for staff retention
to which we now turn.
2.2.1.1.1 Supervisor-Employee Relations
Organisational relationships between supervisors and employees are key to organisational success
(Campbell and Derrick, 2013). Ontario (2004), stated that supervisor support is so essential to
retention that it can be said that employees leave bosses not jobs (as cited in Fatima, 2011). Many
scholars like Fatima (2011), agree with Ontario that association between workers and the boss is
a significant factor that influences employee retention as supervisors are the “human face” of the
organizations. Positive supervisor-employee workplace relationships increase organizational
success by decreasing cost related to employee retention. If bosses are supportive, encouraging
and let employees learn from mistakes, the employees feel a sense of pride in their jobs (Fatima,
2011). Also providing a challenging and meaningful work climate, having aspects of sound control
and increased level of privacy, drives the workers to feel self-accomplished and committed to their
job.
21
On the other hand, Ferris (1996), and co authors, looked at the impact abusive supervisors have on
employee relation and they found that abusive supervision has a detrimental effect on a number of
organizational outcomes, including an increase in anti-social behavior among subordinates hence
highlighting that supervisor-employee relation is influential on employee retention. Workers
desire trustworthy bosses who recognize them, appreciate them and behave fairly with them. A
supervisor’s support is thus an essential factor to change the worker’s inclination to quit and
establishes strong relationship through free interaction with the supervisor.
2.2.1.1.2 Co-worker Relations
Ramjee (2013), noted that going to work every day can be stressful when there is an employer or
colleague with whom you struggle to get along. It can leave you feeling unsatisfied at the end of
each workday and for that matter at the start of it. Eventually you may start looking for another
job. This implies that individuals need to get along with their fellow workers for a positive
ambience at the workplace and also for a healthy interpersonal relationship. Interpersonal
relationships refer to a strong association among individuals working togather in an organisation
(retrieved from wikipedia, 2013) . Employees working togather need to share a special bond for
them to deliver their level best. Ramjee (2013), also acknowledges that workplace relationships
and interaction have an impact on employee satisfaction and retention. Negative attitudes can lead
to isolation and loneliness, which may instigate an employee's desire to resign from the job.
Like other authors of co-worker relationships, Raabe and Beehr (2003), in their study about formal
mentoring versus supervisor coworker relationship, agree with Ramjee’s view regarding the
22
impact of co-worker relationship on retention. They argue that co-worker effects on colleagues or
peers can be strong and are effected through multiple means (e.g., through both discretionary and
ambient stimuli: Hackman, 1992 as cited in Raabe and Beehr, 2003). For example, Peers can
directly offer advice and information on how to accomplish goals, inform each other of potential
chances for advancement, and socially reinforce either good or bad work behaviors. As a result
good work environment is created which brings about collboration and team work among workers.
The above literature attest that individuals can not work in a vaccum. Therefore, influence as a
dimension of organisational politics, can lead to formation of a strong bond between employees
and its impact on retention can be alarming since human beings are influenced by what their
colleagues say or do.
2.2.2 Power and Employee Retention
Power, although differently defined by different scholars (e.g. Cangemi, 1992; Krausz, 1986;
Verderber and Verderber, 1992; Folger, Poole and Stutman, 1993; and Guinole, 2007), relates with
the ability or capacity of one person to move, persuade, entice or encourage others to attain specific
goals or engage in specific activities (as cited in Ogunleye and Aluko, 2012).
Power and politics play a huge role in managing organizations from governing how decisions are
made to how employees interact with one another. According to Armstrong (2009), organisations
exist to get things done and in the process people or groups exercise power. The concept of power
often evokes negative impression. For example, referring to the use of power can infer that people
are being dominated, manipulated or coerced. However, like conflict, power has a good side as
well. Armstrong (2009), defines power as the capacity to secure dominance of one’s goals or

23
values over others. Having power means having advantage over one’s legitimate authority since,
it derives from the organizational positions that people occupy and as Elliott and Smith (2004),
concluded rather than from the people themselves. These advantages may include; access to
tangible assets like vehicles, computers, buildings, and money as well as intangible assets such as
status that influences behavior of others. Therefore, to have or possess power is possible.
Nonetheless, a pertinent issue that should be addressed, is how exactly is power acquired and how
is it used to manage organizations?
Stichman (2002), also argues just like other authors, that power has many definitions and
dimensions; some view only the coercive dimension of it (i.e, people have power by getting
someone to do something he or she otherwise would not do), while others define it as the product
of exchange relationships in organisations (Klofas et al, 1990 as cited in Stichman, 2002).
However, French and Raven (1959), looked at power in five bases and later, Raven (1965)
expanded this to six by including information power. The sources of power identified by French
and Raven (1959) are: reward power, coercive power, expert power, legitimate power and referent
power (as cited in Ogunleye and Aluko, 2012). Ogunleye and Aluko (2012), refer to reward power
as the ability to recognise, give or promise reward to individuals for adhering to standards or
expectations; coercive power as the ability to give or threaten punishment for non-compliance;
expert power as the influence that comes from developing and communicating specialized
knowledge or the perception of knowledge; legitimate power, otherwise known as power of
poaition, as the formal authority that derives from a person’s position in a group or an organisation;
and referent power means identification with, attraction to, or respect for the source of influence.
24
This study therefore, will seek to use the different dimensions of power proposed by French and
Raven and assess their effect on employee retention in Disabled People’s Organisations.
In relation to the above argument, Stichman (2002), also argued that French and Raven constructed
the five bases of power and attempted to define them systematically to be able to make
comparisons according to the changes they produced. Stichman (2002), further argued that each
of these bases of power relies on the perception of a person who has the influence applied against
him. In otherwards, someone has one of the bases of power if another person percieves him or
her as having that power.
However, there has been criticism on the lack of clarity in defining these power bases (Bacharach
and Lawler 1980; Hinkin and Schriesheim 1989; Rahim 1989; Rahim and Buntzman 1991). For
instance, Rahim, Antonioni, Krumov and Ilieva (2000), critiqued that early studies on French and
Raven’s power typology frequently touched upon subordinates’ effectiveness in relation to the
superior’s power bases. The consensus among these studies is that subordinates perceive coercive
power base as a weak reason for job performance. Reward and legitimate power bases show no
clear relationship with performance. Expert power base and in most cases referent power base
consistently correlated with performance. Further still, other authors also established that negative
power such as coercive, reward and legitimate power contribute to low retention while positive
power like referent and expert contribute to high employee retention.
Zeiger (2013), for example, established that when leaders in an organization do not have the
respect of the employees under them, they have negative power. This type of leader motivates

25
employees to perform by threatening them with job loss and other punishments or shows
favoritism to certain employees rather than recognizing the hard work of multiple employees. Not
only does the quality of work produced decrease under this type of power, but it leads to higher
turnover rates in an organization. Therefore, Rahim, Antonioni, Krumov and Ilieva (2000),
analyzed that this lack of consistently correlated relationship between position power bases and
performance may be partly attributed to the measurement and sampling deficiencies of the earlier
field studies.
As a result this typology is the most widely used of all the power definitions. These bases of power
have a wide application to organizations and have been applied to numerous organizations and
situations, including supervisor and subordinate interactions in businesses (e.g., Bachman, Smith,
and Slesinger 1968; Bachman, Bowers, & Marcus 1968; Hinkin and Schriesheim 1990, 1994;
Rahim 1989; Rahim & Buntzman 1991), salesperson and customer satisfaction (Zemanek 1995),
doctor and patient interactions (Raven 1988), and teacher and student relationships (Aquinis,
Nesler, Quigley, Lee, and Tedeschi 1996; Robyak, Goodyear, Prange, and Donham 1986). For
purposes of this study therefore, the bases of power were applied to the Disabled People’s
organizations as a way of understanding the effect of power on employee retention in these
organizations.
2.2.2.1 Coercive Power
Coercive power as defined by Ledbrook (2012), refers to the ability to influence people with threats
and punishment. This kind of power typically may be used to incite physical threats like demotion,
termination (Raven, 2008) or managers or supervisors use this power to manipulate others.
26
According to French and Raven (1959), coercive power lies in the perception that another can give
punishments to induce behavior. McCleery (1961c, p. 376), describes coercive power as the most
primitive basis of power in interpersonal relations. This shows that coercive power is a strong
factor that hinders emloyee commitment as well as employee retention.
Coercive power from an employer’s point of view has the overiding aim of ensuring employees
are forced to comply to improve efforts in work and improve staff performance. However,
Ledbrook (2012), claims that employees’ compliance to coercive power is based on fear and in the
long run leads to dysfunctional behaviour, reduced output, lowers job satisfaction, alienates team
members and ultimately leads to turnover. Similarly, Turner (2013), also emphasizes that coercion
reduces employees' satisfaction with their jobs, leading to lack of commitment and general
employee withdrawal. Lunenburg (2012), also predicted that coercive power may lead to
temporary compliance by subordinates, as well as produce the undesirable side effects of
frustration, fear, revenge, and alienation. This in turn may lead to poor performance,
dissatisfaction, and turnover. Rahim, Antonioni, Krumov and Ilieva (2000), agrees with Lebrook’s
argument and states that subordinates perceive coercive power base as a weak reason for job
performance. Fortunately, there are other power bases that can positively influence employees and
benefit the well being of an organization.
2.2.2.2 Reward Power
Reward power depends on the ability of a leader to give employees a reward or benefit in exchange
for compliance. These rewards include; bonuses, money, performance appraisals, training
opportunities, promotions, and preferable working conditions. French and Raven (1959) observed

27
that reward power is based on a person’s belief that another can give rewards (as cited in Rahim,
Antonioni, Krumov and Ilieva, 2000). According to Ledbrook (2012), reward power can be used
to motivate team members to improve their performance. This enables workers to work diligently
and effectively. Rahim, Antonioni, Krumov and Ilieva (2000), noted that in order for the agent to
grant the reward or punishment, he or she must observe the target performing a behavior. Stichman
(2002), notes that surveillance is easier with reward power as people are less likely to hide behavior
if they are to be rewarded than if they are to be punished. However, reward power tends to divert
employee’s attention from the task at hand and focus more on the rewarding result. This can lead
to inefficiency and reduced potential of an organization. Besides that a manager may not have
much control over rewards such promotions or salary increments and even a CEO may first require
approval from the Board of Directors for some actions.
Furtherstill, Rashid and Zhao (2009), investigated the role of Power of involvement over rewards
for retention likelihood in IT Professionals and noted that fairness of rewards has very little impact
on retention likelihood, instead, findings revealed that it is far more important to actively involve
employees in organisational activities. For instance involving emloyees in decision making
processes would boost their commitment to work which indicates that the power of involving
employees in the activities of the organusation is more likely to enhance employee retention than
offering compensation and rewards to employees. In relation to the previous authors, Carson, et
al (1993), observed that French and Raven did not specifically address the use of illegitimate
rewards, therefore its implicit in their discussion that reward power would be most useful if the
reward were seen as justifiably given or earned (as cited in Stichman, 2002). For example, if the
28
target thinks that the influencing agent is not approximtely using rewards this perception can lead
to resentment or feelings of favoritism of others
2.2.2.3 Legitimate Power
Robbins (2003), asserts that legitimate power is much broader than coercive or reward. This power
represents the belief that a person has the ability to influence others as a result of their position of
authority.According to French and Raven (1959) theory, legitimate power is based on a person’s
perception that another has a legitimate right to order him to act a certain way. Weber (1961),
clearly pointed out that it is important to recognize that the obedience to authority lies in the office
or position rather than in the person himself or herself (as cited in Rahim, Antonioni, Krumov and
Ilieva, 2000). People obey because they feel some moral obligation to obey. Employees comply
with orders of a manager who relies on legitimate power based on the position in the organizational
hierarchy that the manager holds.
Ledbrook (2012), points out that legitimate power can be used in the event of an emergency in
order to make employees function at their optimal and their compliance to the manager is
essentially dependent on the way people behave towards the person in power. Legitimate power
according to Bachman, Smith and Slesinger’s (1968), in a study about the relationships among the
bases of power, sales performance, satisfaction with the office manager and manager’s control
over the office and over their subordinates, was viewed by respondents as the most important base
of power (as cited in Ledbrook, 2012). However, the authors noted that respondents had less job
satisfaction and their performance level was lower. The literature thus shows a close negative
relationship between legitimate power and employee retention. However, Bachman, Smith and
29
Slesinger’s (1968), did not find out how legitimate power could effectively yield employees job
commitment creating the need to undertake this study.
2.2.2.4 Expert Power
Another power base is expert power which is influence based on expertise, and knowledge.
Robbins (2003), comments that expertise has become a powerful source of influence as the world
has become more technological. Expert power is based on the belief that an individual with
particularly high level of knowledge will have the power to influence others. Rahim, Antonioni,
Krumov and Ilieva (2000), comment that expert power originates from a person’s perception that
the influencing agent has special knowledge or expertise. Individuals that possess expert power
are those individuals whose occupation requires exceptional knowledge and expertise (retrieved
from UKessays, 2013). For example, an IT officer in Disabled People’s Organisations is able to
use several software programs proficiently and can navigate the internet with ease. As a result,
those who do not have the expert knowledge or experience need the expert's help and, therefore,
are willing to be influenced by the expert's power.
Expert power relies on trust that all relevant information is given honestly and completely thus
allows for full commitment from all positions in the hierarchy of an organization. Nevertheless,
similar to every power base, expert power of a person diminishes when knowledge is shared. As a
result, expert power can lead to manager’s authority diminishing or the manager intentionally
decides not to share knowledgeable skill sets with their employees. This can weaken an
organization’s effectiveness in the long run. However researchers like Bachman, Smith and
Slesinger’s (1968), concluded, that results from their study, on the relationship between bases of
30
power and organisational setting showed that expert power had the most positive relationship with
job performance and job satisfaction (as cited in Stichman, 2002), compared to the four other bases
of power hence expert power enhances employee retention.
2.2.2.5 Referent power
In addition to the above mentioned bases of power, a similar concept is the power of referent
which is influence based on possession by an individual of desirable resources or personal traits
(Ledbrook, 2012). Employees tend to be motivated if they have desire to model themselves in
same way of their leaders. With referent power, leaders must develop trust and lead by example.
By doing so, leaders are able to develop an influential aspect that employees potentially may
desire. Rahim (2000), on the other hand, argues that referent power is based on a person’s
identification with and respect for the influencing agent. As Ledbrook (2012), clearly pointed out,
a manager with referent power can build a strong relationship with the employees and can use it
to to bring the best out of them. This confirms argument that bringing the best out of employees
is key as organisations strive to retain talented workers (as retrieved from Drake International,
n/d).
The above literature shows that understanding the significance of power in management is not
enough but managing it well is also critical. The whole process should be well organized to receive
full support from employees who will clearly see the advantages (retrieved from UKessays, 2013).
Overall, power is a process of implementation in organisations. Its possible to wield power and
influence without necessarily having or using formal authority (Pfeffer, 1992). Ogunleye and
Aluko (2012), in their study about influence of leaders as a perceived source on Nigeria’s
31
subordinate employees’ commitment and work attitude, found that leaders’ perceived power
source, significantly influence employees’ organizational commitment and work attitude among
Nigerian workers. However, Pfeffer (1992), observes that the process of implementation through
power and influence is not without problems but argues that what is important is to see power and
influence as one set of strategy used to get things done. Furtherstill, each type of power comes
with a responsibility, and if used unduly it affects the overall performance of the organisation in
the long run as well as retaining its most talented might become a momentous challenge.
Stichman (2002), observed that each of these bases of power is socially dependent. In otherwords,
there must be a social relationship between the influencing agent and the target. They do, however,
vary on the importance of surveillance. For coercive power and reward power, surveillance is vital.
Legitimate, referent, and expert powers do not require surveillance to induce behavioral
compliance. People perform the behavior because they feel they must, they want to please an
individual or mimic his or her behavior, or they think the influencing agent knows best (Raven
1988). Hence, the later bases of power are likely to have a positive effect on employee retention.
2.2.3 Employee Retention
Retention is a complex concept and there is no single recipe for keeping employees within a
company (Sinha, 2012). Chaminade (2007), defined employee retention as a voluntary move by
an organisation to create an evironment which engage employees for a long term (as cited in
Samuel and Chipunza, 2009). The sudden escalation of competition for competent workers in
organisations has put pressure on HR managers to engage more professionals by attracting them
with competitive reward package making the job market very competitive. The main purpose of

32
retention is to prevent the loss of competent employees from the organisation as this could have
adverse effect on organisational performance (Brideg, 1991 as cited in Sinha, 2012). Due to the
above argument, HR managers often invest time and money to hire and train their workforce to
become better competent force with the intention of reducing turnover costs and prevent loss of
talented employees to other competitive organisations. Unfortunately, this is not the case.
Fatima (2011), in her study, about the factors that affect employee retention and analyisis of the
relationship between factors of employee retention and organisational competence, stated that
management can no more influence the decision of employees to leave or to stay. Employee
retention has become a critical factor of influence for performance of the larger organisations.
She also mentioned that several factors generate a siginificant influence on employee retention
either increasing it or not and the factors she mentioned included; reward systems, career and
growth opportunities for individuals to keep pace with the skills and knowledge, superior support
and particularly the work environment provided to workers. However, Fatima neither mentions
organizational politics nor power as one of those factors that affect employee retention which was
the area of interest for this study.
2.3 Summary of the Literature Review
The study reviewed literature from different authors. Overall, the literature indicated that some
previous researchers dealt with organizational politics but did not align organizational politics with
employee retention but with leadership, turnover, job burnout and many other aspects. For
example; Sowmya and Panachanatham (2011), focused on job burnout as an outcome of
organisational politics, Ram and Prabhakar (2010), focused on leadership styles and perceived
33
organisational politics as predicators of work related outcomes. The outcomes in these studies
included; job satisfaction, job stress, turnover intentions, and job involvement. This leaves a gap
in that little has been said on employee retention and actually not much has been written on NGOs.
Infact none of the studies has aligned organisational politics on employee retention in Disabled
People’s Organisations. This study therefore invetsigated the effects of organisational politics on
employe retention in selected Disabled People’s Organisations in Uganda.
CHAPTER THREE: METHODOLOGY
3.0 Introduction
This chapter provided a road map which guided the research study. The study sought to assess the
effect of organizational politics on employee retention in selected Disabled People’s Organizations
in Uganda. This chapter presents the research design, study population, sample size, sampling
techniques and procedures, data collection methods, data collection tools, validity and reliability
of the instruments to collect data, procedure of data collection and data analysis, measurements of
variables and policy issues.
3.1 Research Design

34
The study used a cross sectional survey research design because the researcher intended to study
a specific subset of the study population, collected and analyzed data on effects of organizational
politics and power on employee retention in selected Disabled People’s Organizations-DPOs. This
design was appropriate because it involved collecting data from a relatively large number of
respondents in its natural setting, cheaply and in a short time (Creswell, 2003). This survey design
was chosen because of its flexibility in data collection as it allows collection of both qualitative
and quantitative data at the same time (Ahuja, 2005). Both qualitative and quantitative approaches
were used as a means of triangulation with the intention of getting quality and unbiased findings.
Barifaijo, Basheka and Oonyon (2010), refer to triangulation as the process of mixing up
methodologies to exploit the synergies offered by the different methodologies. Being an academic
research therefore, it was suitable to apply the mixed methods approach because it minimized on
the inadequacies of a single method since the two methods complemented and verified each other,
reduced biasness and provided more comprehensive information.
3.2 Area of Study
The study was conducted in six Disabled People’s Organizations situated in Kampala and Wakiso
districts. These included; NUDIPU, UPACLED, NUWODU, MHU, LAPD and USDC. These
organizations were formed with the sole purpose of advocating for disability rights and inclusion.
The management of these organizations is the secretariat which is made up of the Finance and
Administration department and Programme department. The study was conducted in the two
departments of the mentioned organizations.
3.3 Study Population
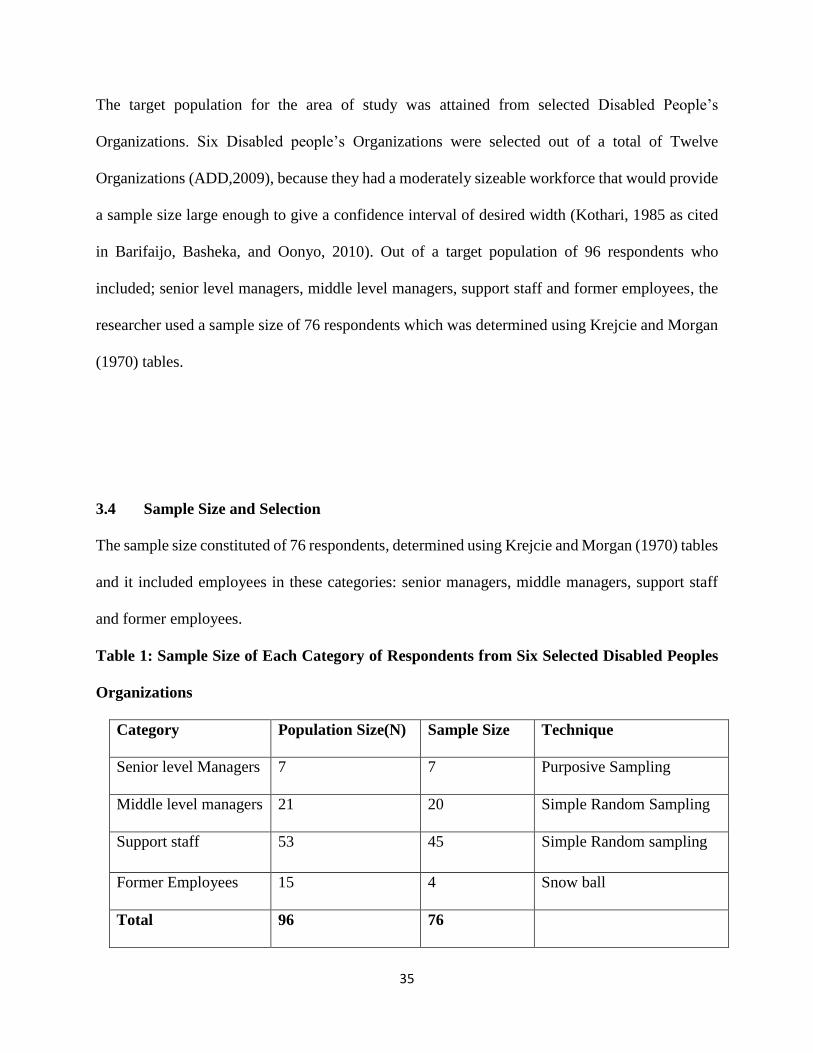
35
The target population for the area of study was attained from selected Disabled People’s
Organizations. Six Disabled people’s Organizations were selected out of a total of Twelve
Organizations (ADD,2009), because they had a moderately sizeable workforce that would provide
a sample size large enough to give a confidence interval of desired width (Kothari, 1985 as cited
in Barifaijo, Basheka, and Oonyo, 2010). Out of a target population of 96 respondents who
included; senior level managers, middle level managers, support staff and former employees, the
researcher used a sample size of 76 respondents which was determined using Krejcie and Morgan
(1970) tables.
3.4 Sample Size and Selection
The sample size constituted of 76 respondents, determined using Krejcie and Morgan (1970) tables
and it included employees in these categories: senior managers, middle managers, support staff
and former employees.
Table 1: Sample Size of Each Category of Respondents from Six Selected Disabled Peoples
Organizations
Category Population Size(N) Sample Size Technique
Senior level Managers 7 7 Purposive Sampling
Middle level managers 21 20 Simple Random Sampling
Support staff 53 45 Simple Random sampling
Former Employees 15 4 Snow ball
Total 96 76
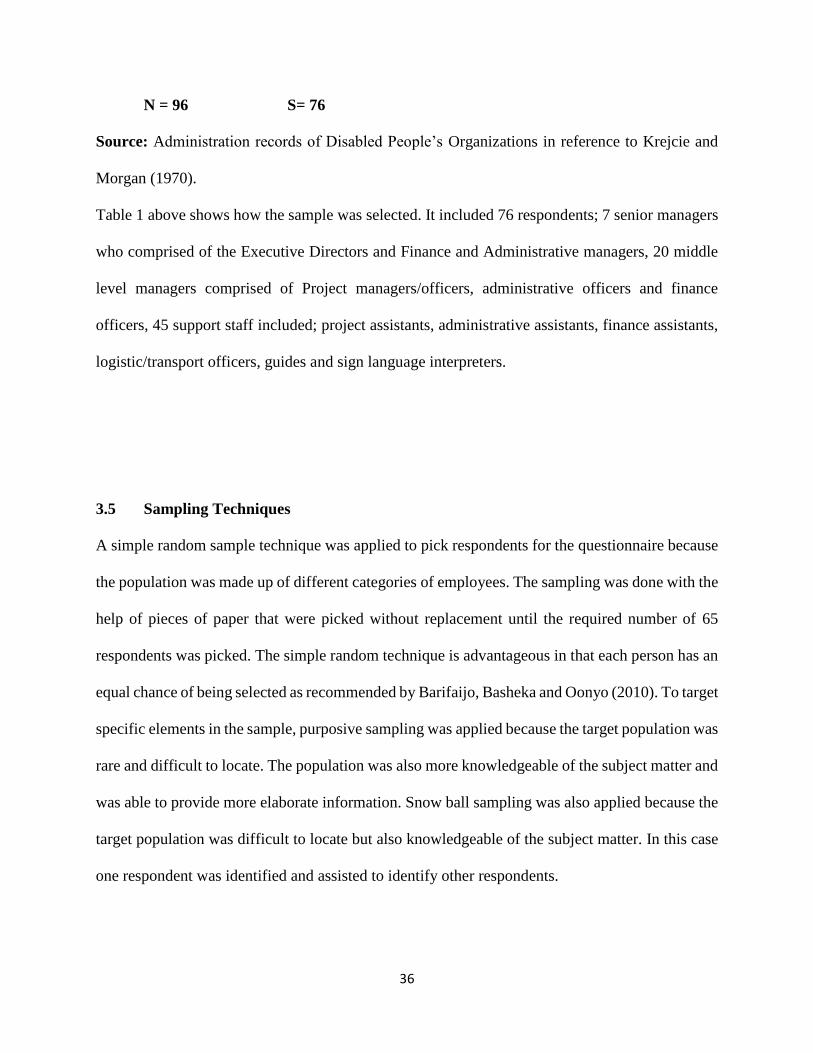
36
N = 96 S= 76
Source: Administration records of Disabled People’s Organizations in reference to Krejcie and
Morgan (1970).
Table 1 above shows how the sample was selected. It included 76 respondents; 7 senior managers
who comprised of the Executive Directors and Finance and Administrative managers, 20 middle
level managers comprised of Project managers/officers, administrative officers and finance
officers, 45 support staff included; project assistants, administrative assistants, finance assistants,
logistic/transport officers, guides and sign language interpreters.
3.5 Sampling Techniques
A simple random sample technique was applied to pick respondents for the questionnaire because
the population was made up of different categories of employees. The sampling was done with the
help of pieces of paper that were picked without replacement until the required number of 65
respondents was picked. The simple random technique is advantageous in that each person has an
equal chance of being selected as recommended by Barifaijo, Basheka and Oonyo (2010). To target
specific elements in the sample, purposive sampling was applied because the target population was
rare and difficult to locate. The population was also more knowledgeable of the subject matter and
was able to provide more elaborate information. Snow ball sampling was also applied because the
target population was difficult to locate but also knowledgeable of the subject matter. In this case
one respondent was identified and assisted to identify other respondents.
37
3.6 Data Collection Methods
The research was conducted with the use of interview schedules and questionnaire survey methods.
These methods were used to collect primary data.
3.7 Data collecting Instruments
Interview guides and questionnaires were the instruments used to collect and gather data.
3.7.1 Questionnaires
A questionnaire (see appendix 1), was designed and used to gather information from 20 middle
managers and 45 lower staff. A questionnaire was preferred because the respondents were literate
and able to respond to them appropriately. The questionnaire also allowed the respondents to feel
free to express their views without fear. Each question in the questionnaire was developed in order
to address specific objectives in the study.
3.7.2 Interview Guide
In addition, an interview guide (see Appendix II) was used to solicit information from the senior
managers and former employees because they were busier and had no time to attend to the
questionnaires. Interviews are flexible since the interviewer is able to probe for more specific
answers thus is a reliable method for data collection (Barifaijo, Basheka and Oonyo, 2010).
Interview guide therefore, enabled the researcher to obtain in-depth information through probing
during the face-to-face interview. The researcher presented questions to the senior managers and
former employees and their views were written down by the researcher. Data obtained during the
interview supplemented the data from the questionnaires.
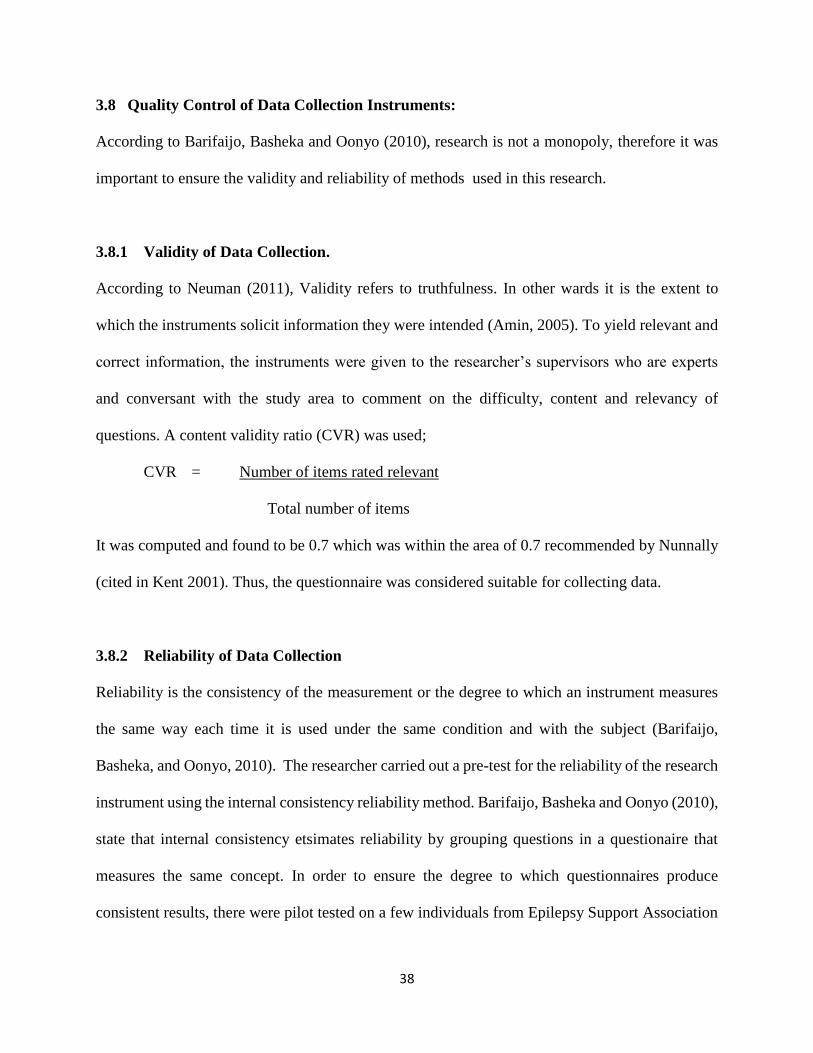
38
3.8 Quality Control of Data Collection Instruments:
According to Barifaijo, Basheka and Oonyo (2010), research is not a monopoly, therefore it was
important to ensure the validity and reliability of methods used in this research.
3.8.1 Validity of Data Collection.
According to Neuman (2011), Validity refers to truthfulness. In other wards it is the extent to
which the instruments solicit information they were intended (Amin, 2005). To yield relevant and
correct information, the instruments were given to the researcher’s supervisors who are experts
and conversant with the study area to comment on the difficulty, content and relevancy of
questions. A content validity ratio (CVR) was used;
CVR = Number of items rated relevant
Total number of items
It was computed and found to be 0.7 which was within the area of 0.7 recommended by Nunnally
(cited in Kent 2001). Thus, the questionnaire was considered suitable for collecting data.
3.8.2 Reliability of Data Collection
Reliability is the consistency of the measurement or the degree to which an instrument measures
the same way each time it is used under the same condition and with the subject (Barifaijo,
Basheka, and Oonyo, 2010). The researcher carried out a pre-test for the reliability of the research
instrument using the internal consistency reliability method. Barifaijo, Basheka and Oonyo (2010),
state that internal consistency etsimates reliability by grouping questions in a questionaire that
measures the same concept. In order to ensure the degree to which questionnaires produce
consistent results, there were pilot tested on a few individuals from Epilepsy Support Association
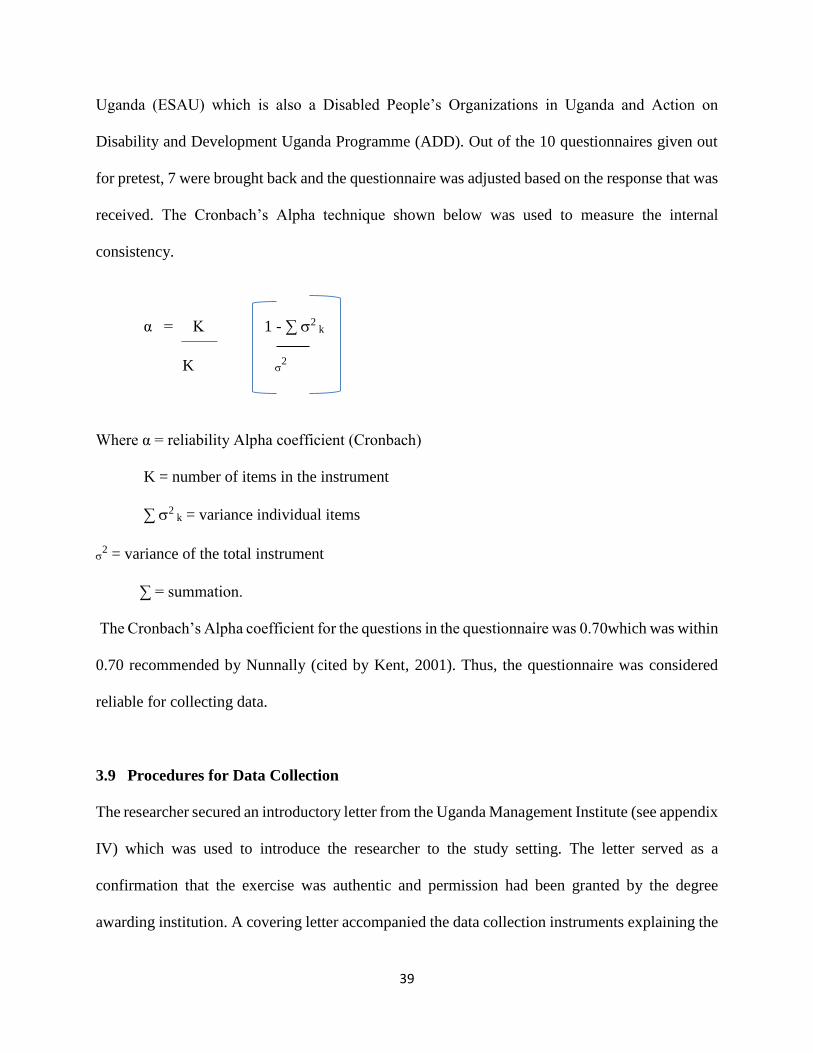
39
Uganda (ESAU) which is also a Disabled People’s Organizations in Uganda and Action on
Disability and Development Uganda Programme (ADD). Out of the 10 questionnaires given out
for pretest, 7 were brought back and the questionnaire was adjusted based on the response that was
received. The Cronbach’s Alpha technique shown below was used to measure the internal
consistency.
α = K 1 - ∑ 2 k
K 2
Where α = reliability Alpha coefficient (Cronbach)
K = number of items in the instrument
∑ 2 k = variance individual items
2 = variance of the total instrument
∑ = summation.
The Cronbach’s Alpha coefficient for the questions in the questionnaire was 0.70which was within
0.70 recommended by Nunnally (cited by Kent, 2001). Thus, the questionnaire was considered
reliable for collecting data.
3.9 Procedures for Data Collection
The researcher secured an introductory letter from the Uganda Management Institute (see appendix
IV) which was used to introduce the researcher to the study setting. The letter served as a
confirmation that the exercise was authentic and permission had been granted by the degree
awarding institution. A covering letter accompanied the data collection instruments explaining the
40
purpose of the study. Once permission to conduct the study was given, the questionnaires were
administered directly to staff at the six selected Disabled People’s Organizations (NUDIPU,
NUWODU, LAPD, MHU, USDC and UPACLED) for filling and were collected once they were
completed for analysis. A covering letter was also be used to provide access to the interview
processes, which was done on appointment.
3.10 Data Management and Analysis
Data analysis is the process of bringing order, structure and meaning to the mass of data collected
(Barifaijo, Basheka and Oonyo, 2010). The sole purpose of data analysis was to obtain usable and
useful information. Data collected from the field we reanalyzed based on the objectives of the
study and themes. Qualitative data were analyzed using the content analysis while the quantitative
data entry and analysis was done with the help of the SPSS package to organize data into
frequencies and percentages. Tables, pie charts were used to present data as shown in the next
chapter. Data were then presented and interpreted in chapter four. The analysis was thereafter used
to draw conclusions and recommendations.
3.10.1 Qualitative Data Analysis
Qualitative data analysis involves simultaneous activities of collecting, analyzing and writing up
results (Amin, 2005). It also involved the use of words in order to describe the patterns, trends and
relationships that existed in the information gathered. Qualitative research is subjective, rich and
in depth of information presented in forms of words that were derived from the respondents’ open
ended questions and interviews. The qualitative data were analyzed for content used through
review of the scripts looking for similarities and differences based on the themes identified and

41
the study objectives. Content analysis was used to edit qualitative data and reorganize it into
meaningful shorter sentences. These were then presented as quotations to supplement the
quantitative data in order to enhance interpretation of the results. Editing was done to ensure that
there was no missing information. Hypothesis testing was also done at this point in the research.
3.10.2 Quantitative Data Analysis
The researcher carried out a careful scrutiny of the data captured to ensure consistency, accuracy
and completeness of the questionnaire. The qualitative data were sorted and edited with the view
of checking the completeness and accuracy during data collection. Questionnaires were then coded
and assigned numbers before entry. Numerical coding is important because it includes as much
information as possible. Data was then entered into the computer using the SPSS software which
generated descriptive statistics (frequencies and percentages) and inferential statistics (Pearson
correlation and coefficient of determination). The frequencies and percentages were used to
determine the respondents’ views on study variables. Spearman correlation and coefficient of
determination were used to test the hypotheses. The correlation coefficient (rho) was used to
determine the strength of the relationship between the variables. The sign of the correlation
coefficient (+ or -) was used to determine the direction of the relationship between the variables.
The variables of the study were correlated using Pearson’s Correlation Coefficient technique;
rxy = n(∑xy)-(∑x)(∑y)
√[n(∑x2)-(∑x)2][n∑y2)-(∑y)2]
Where;
r= correlation of the variables,
∑ = summation
42
X= independent variable
Y= dependent variable
3.11 Measurement of Variables
The sub variables of the study were power and influence. These sub variables were measured as
follows. Influence was measured as supervisor-employee relations and co-worker relations while
Power was looked at in terms of the different categories of power which included coercive, reward,
legitimate, expert and referent power. Measurement of variables is done using various scales.
However for purposes of this study the likert scale was used. A5point likert scale of strongly agree,
agree, not sure, disagree and strongly disagree was used to measure variables. The data was
collected using a questionnaire and statements were placed on the likert scale with responses of
the above mentioned scale out of which a final and appropriate conclusion was made.
43
CHAPTER FOUR: PRESENTATION, ANALYSIS AND INTERPRETATION OF
RESULTS
4.0 Introduction
This chapter presents and discusses the analysis and interpretation of data arising from the study
which sort to investigate the effects of organizational politics on employee retention in selected
Disabled People’s Organizations in Uganda. This chapter is divided into two sections. The first
section presents the demographic data of the respondents and the second section presents the
findings according to the objectives that the study sought to achieve, namely:
1.5.1. To find out the effect of influence on employee retention in selected Disabled
People’s Organizations in Uganda.
1.5.2. To assess the effect of power on employee retention in selected Disabled People’s
Organizations in Uganda.
4.1 Response Rate
Response rate also known as completion rate or return rate in survey research refers to the number
of people who participated in the survey divided by the number of people in the sample. It is
usually expressed in the form of a percentage. A low response rate can give rise to sampling bias
if the non-response is unequal among the participants regarding exposure and/or outcome.
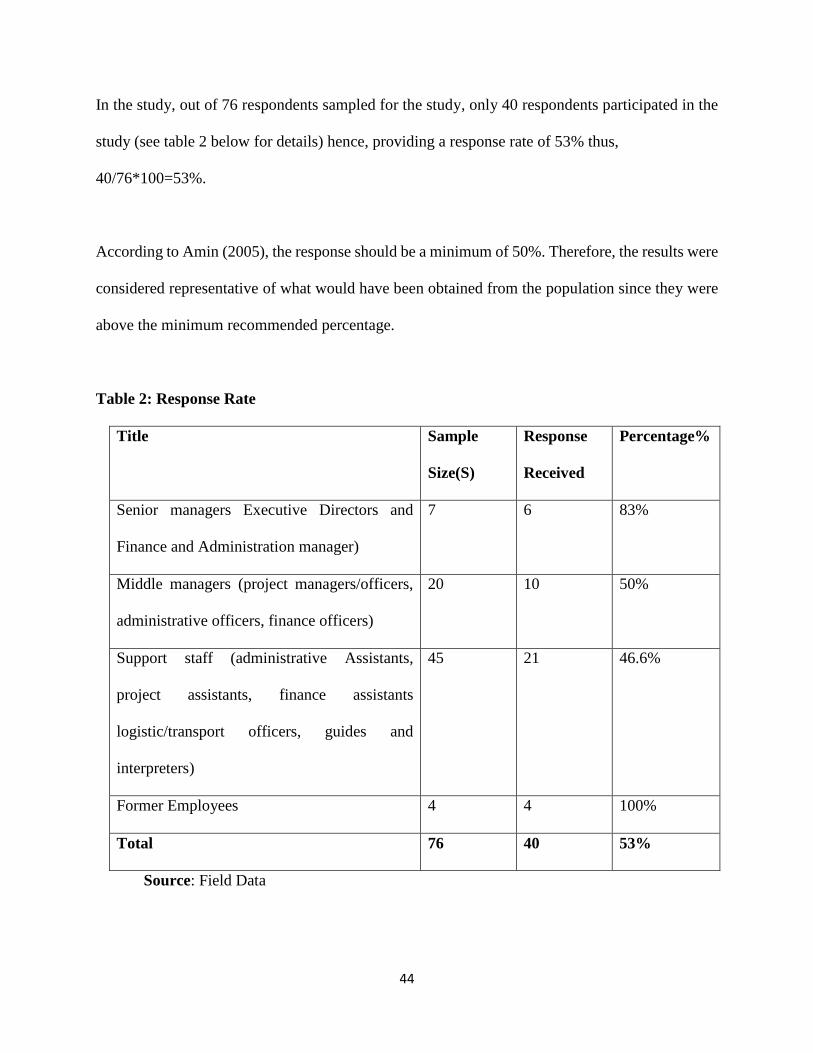
44
In the study, out of 76 respondents sampled for the study, only 40 respondents participated in the
study (see table 2 below for details) hence, providing a response rate of 53% thus,
40/76*100=53%.
According to Amin (2005), the response should be a minimum of 50%. Therefore, the results were
considered representative of what would have been obtained from the population since they were
above the minimum recommended percentage.
Table 2: Response Rate
Title Sample
Size(S)
Response
Received
Percentage%
Senior managers Executive Directors and
Finance and Administration manager)
7 6 83%
Middle managers (project managers/officers,
administrative officers, finance officers)
20 10 50%
Support staff (administrative Assistants,
project assistants, finance assistants
logistic/transport officers, guides and
interpreters)
45
21 46.6%
Former Employees 4 4 100%
Total 76 40 53%
Source: Field Data
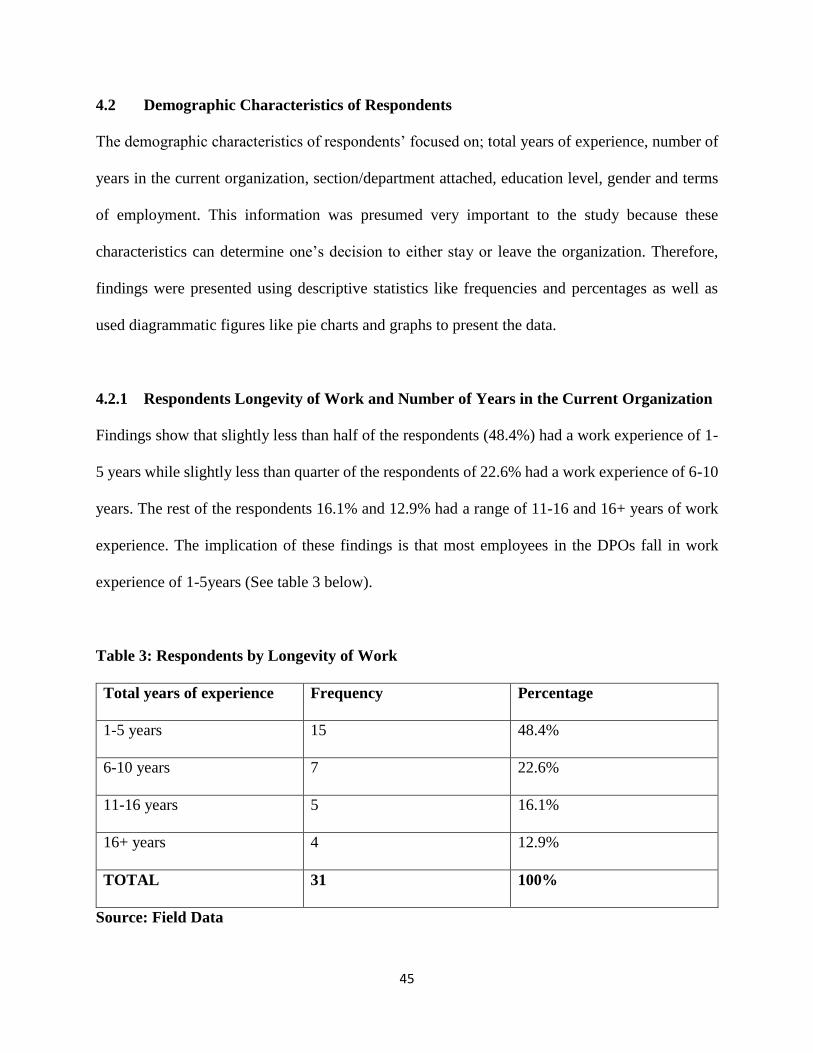
45
4.2 Demographic Characteristics of Respondents
The demographic characteristics of respondents’ focused on; total years of experience, number of
years in the current organization, section/department attached, education level, gender and terms
of employment. This information was presumed very important to the study because these
characteristics can determine one’s decision to either stay or leave the organization. Therefore,
findings were presented using descriptive statistics like frequencies and percentages as well as
used diagrammatic figures like pie charts and graphs to present the data.
4.2.1 Respondents Longevity of Work and Number of Years in the Current Organization
Findings show that slightly less than half of the respondents (48.4%) had a work experience of 1-
5 years while slightly less than quarter of the respondents of 22.6% had a work experience of 6-10
years. The rest of the respondents 16.1% and 12.9% had a range of 11-16 and 16+ years of work
experience. The implication of these findings is that most employees in the DPOs fall in work
experience of 1-5years (See table 3 below).
Table 3: Respondents by Longevity of Work
Total years of experience Frequency Percentage
1-5 years 15 48.4%
6-10 years 7 22.6%
11-16 years 5 16.1%
16+ years 4 12.9%
TOTAL 31 100%
Source: Field Data
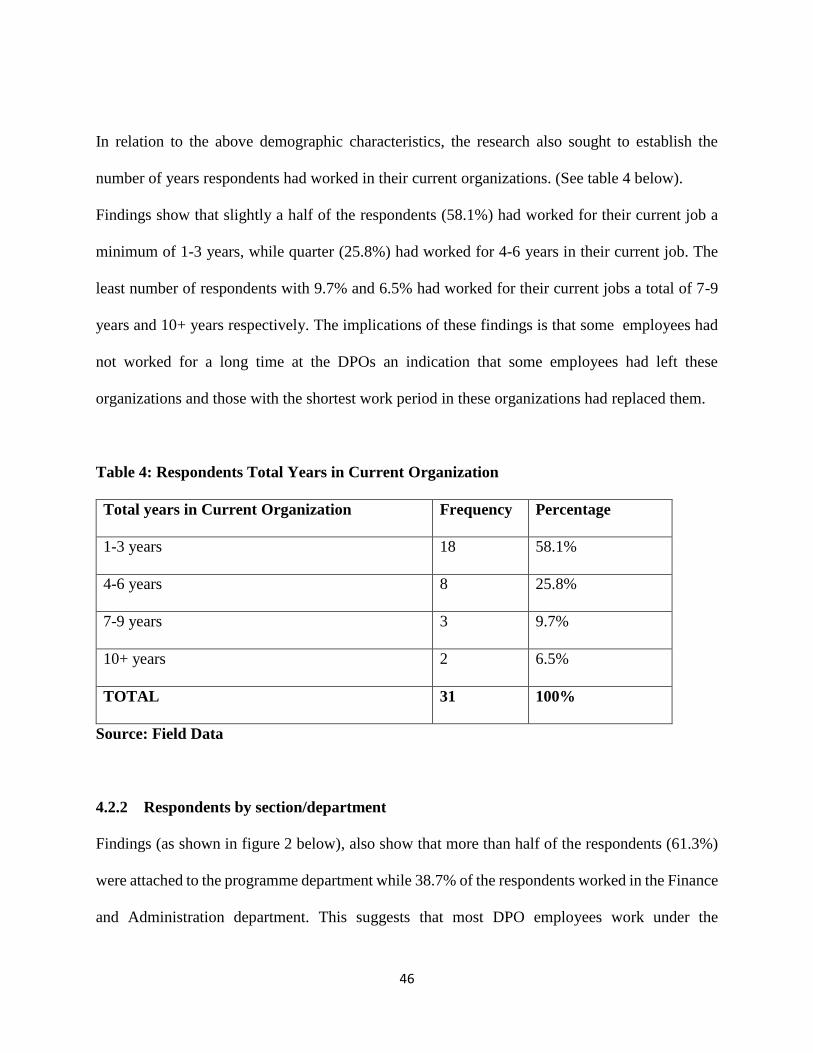
46
In relation to the above demographic characteristics, the research also sought to establish the
number of years respondents had worked in their current organizations. (See table 4 below).
Findings show that slightly a half of the respondents (58.1%) had worked for their current job a
minimum of 1-3 years, while quarter (25.8%) had worked for 4-6 years in their current job. The
least number of respondents with 9.7% and 6.5% had worked for their current jobs a total of 7-9
years and 10+ years respectively. The implications of these findings is that some employees had
not worked for a long time at the DPOs an indication that some employees had left these
organizations and those with the shortest work period in these organizations had replaced them.
Table 4: Respondents Total Years in Current Organization
Total years in Current Organization Frequency Percentage
1-3 years 18 58.1%
4-6 years 8 25.8%
7-9 years 3 9.7%
10+ years 2 6.5%
TOTAL 31 100%
Source: Field Data
4.2.2 Respondents by section/department
Findings (as shown in figure 2 below), also show that more than half of the respondents (61.3%)
were attached to the programme department while 38.7% of the respondents worked in the Finance
and Administration department. This suggests that most DPO employees work under the

47
programme department because DPOs focus on promoting the human rights of persons with
disability and promote development amongst them.
However an organization cannot be managed minus the Finance and Administrative department
hence explaining the 38.7% work force in the finance department. Having a lower work force in
this department implies that there is high exit rate of staff working in the finance department due
to mismanagement, career development and low pay.
Figure 2: Respondents Section/Department
Source: Field Data
In relation to the above agreement, most key informant revealed that the high exit rate of staff
working in the Finance and Administration departments was mainly as a result of either
mismanagement or low pay. Indeed, emphasizing the inadequacy of the salary, one key informant
said,
…the contract of the first accountant was terminated, then the one that followed did not
complete the probation period she said she was going for farther studies, the third recruit
38.7%
61.3%
Respondents Department/Section
Finance&Admin
Programme
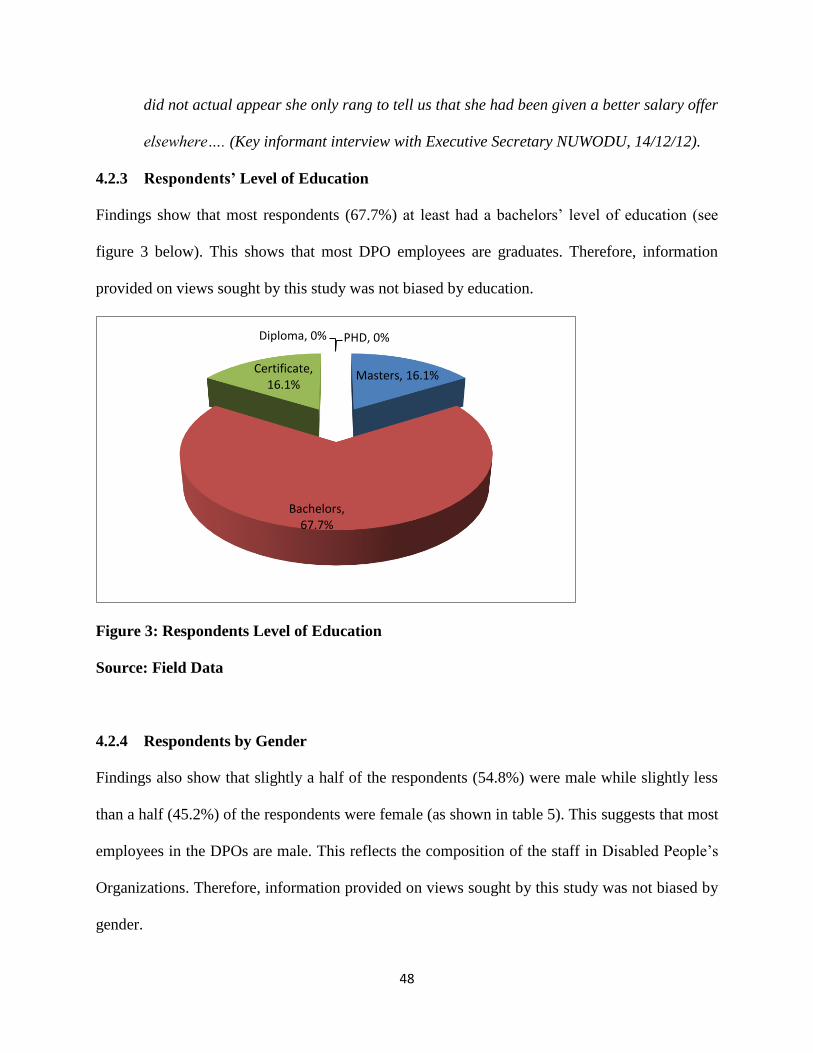
48
did not actual appear she only rang to tell us that she had been given a better salary offer
elsewhere…. (Key informant interview with Executive Secretary NUWODU, 14/12/12).
4.2.3 Respondents’ Level of Education
Findings show that most respondents (67.7%) at least had a bachelors’ level of education (see
figure 3 below). This shows that most DPO employees are graduates. Therefore, information
provided on views sought by this study was not biased by education.
Figure 3: Respondents Level of Education
Source: Field Data
4.2.4 Respondents by Gender
Findings also show that slightly a half of the respondents (54.8%) were male while slightly less
than a half (45.2%) of the respondents were female (as shown in table 5). This suggests that most
employees in the DPOs are male. This reflects the composition of the staff in Disabled People’s
Organizations. Therefore, information provided on views sought by this study was not biased by
gender.
Masters, 16.1%
Bachelors, 67.7%
Certificate, 16.1%
Diploma, 0% PHD, 0%
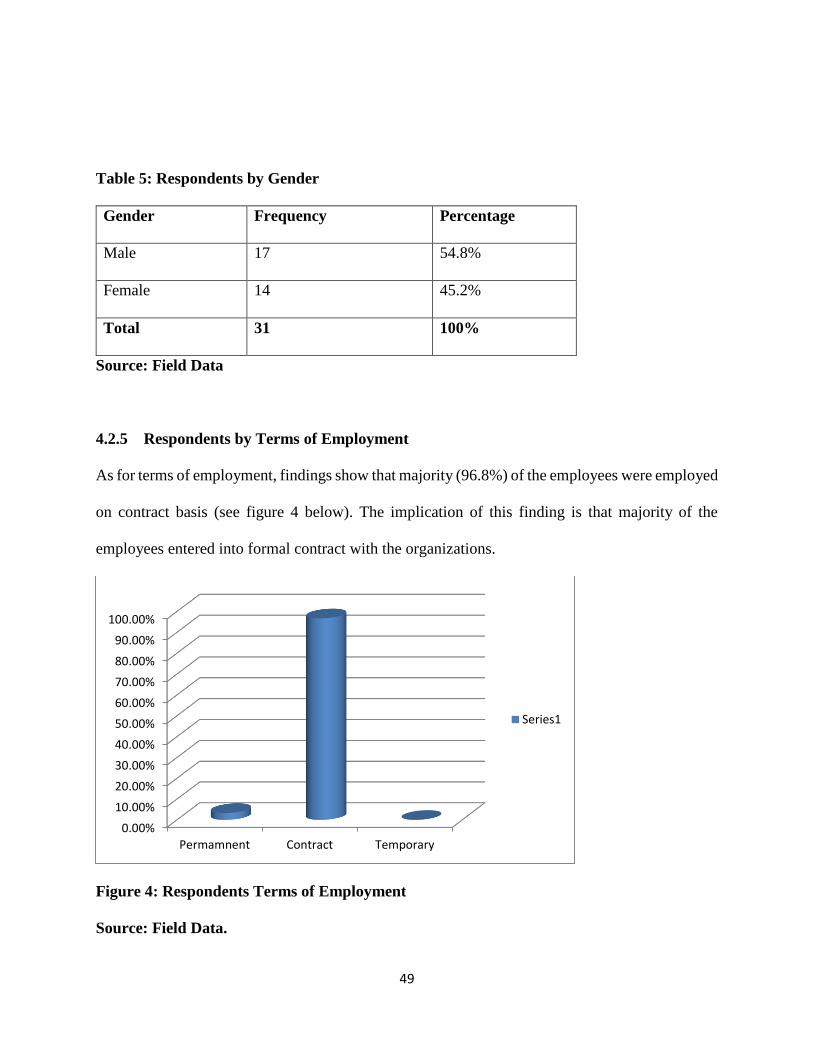
49
Table 5: Respondents by Gender
Gender Frequency Percentage
Male 17 54.8%
Female 14 45.2%
Total 31 100%
Source: Field Data
4.2.5 Respondents by Terms of Employment
As for terms of employment, findings show that majority (96.8%) of the employees were employed
on contract basis (see figure 4 below). The implication of this finding is that majority of the
employees entered into formal contract with the organizations.
Figure 4: Respondents Terms of Employment
Source: Field Data.
0.00%
10.00%
20.00%
30.00%
40.00%
50.00%
60.00%
70.00%
80.00%
90.00%
100.00%
Permamnent Contract Temporary
Series1
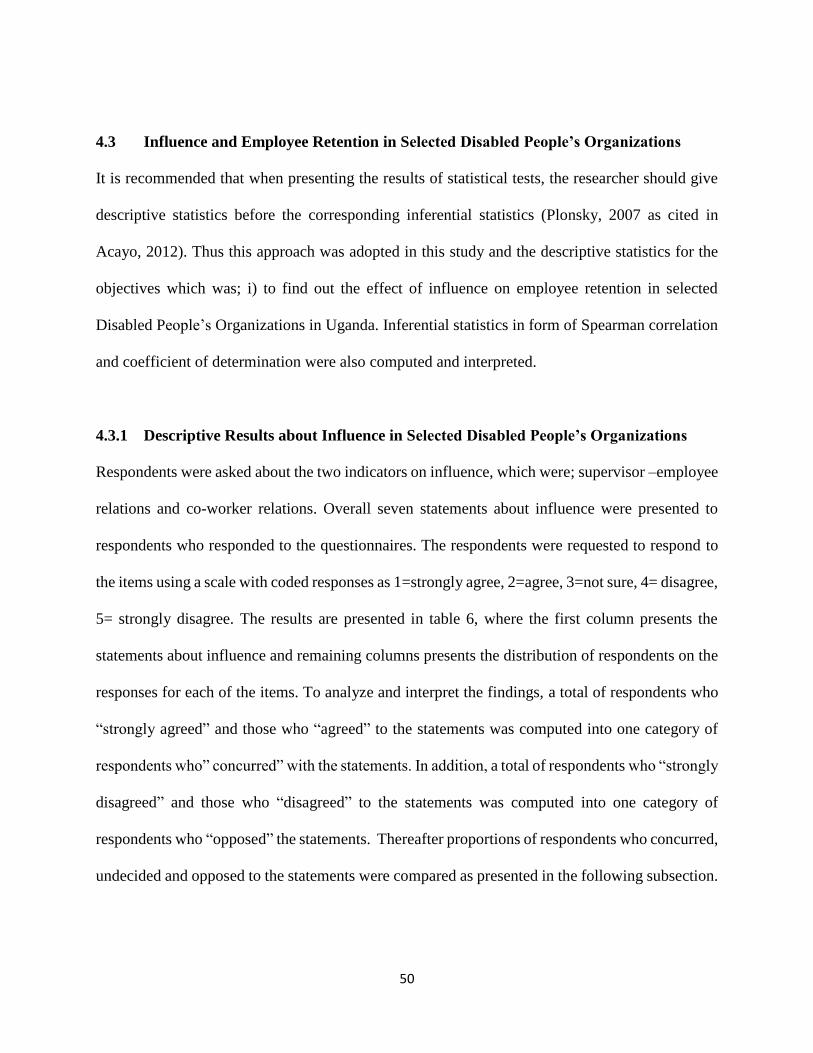
50
4.3 Influence and Employee Retention in Selected Disabled People’s Organizations
It is recommended that when presenting the results of statistical tests, the researcher should give
descriptive statistics before the corresponding inferential statistics (Plonsky, 2007 as cited in
Acayo, 2012). Thus this approach was adopted in this study and the descriptive statistics for the
objectives which was; i) to find out the effect of influence on employee retention in selected
Disabled People’s Organizations in Uganda. Inferential statistics in form of Spearman correlation
and coefficient of determination were also computed and interpreted.
4.3.1 Descriptive Results about Influence in Selected Disabled People’s Organizations
Respondents were asked about the two indicators on influence, which were; supervisor –employee
relations and co-worker relations. Overall seven statements about influence were presented to
respondents who responded to the questionnaires. The respondents were requested to respond to
the items using a scale with coded responses as 1=strongly agree, 2=agree, 3=not sure, 4= disagree,
5= strongly disagree. The results are presented in table 6, where the first column presents the
statements about influence and remaining columns presents the distribution of respondents on the
responses for each of the items. To analyze and interpret the findings, a total of respondents who
“strongly agreed” and those who “agreed” to the statements was computed into one category of
respondents who” concurred” with the statements. In addition, a total of respondents who “strongly
disagreed” and those who “disagreed” to the statements was computed into one category of
respondents who “opposed” the statements. Thereafter proportions of respondents who concurred,
undecided and opposed to the statements were compared as presented in the following subsection.
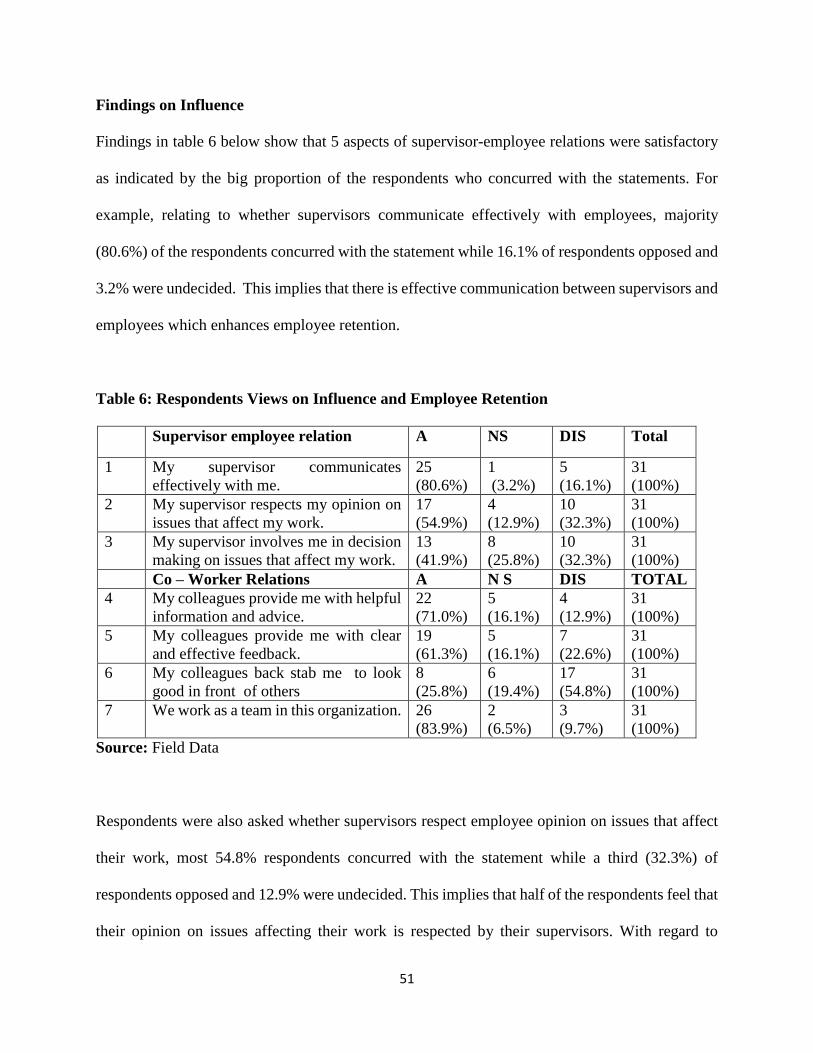
51
Findings on Influence
Findings in table 6 below show that 5 aspects of supervisor-employee relations were satisfactory
as indicated by the big proportion of the respondents who concurred with the statements. For
example, relating to whether supervisors communicate effectively with employees, majority
(80.6%) of the respondents concurred with the statement while 16.1% of respondents opposed and
3.2% were undecided. This implies that there is effective communication between supervisors and
employees which enhances employee retention.
Table 6: Respondents Views on Influence and Employee Retention
Supervisor employee relation A NS DIS Total
1 My supervisor communicates
effectively with me.
25
(80.6%)
1
(3.2%)
5
(16.1%)
31
(100%)
2 My supervisor respects my opinion on
issues that affect my work.
17
(54.9%)
4
(12.9%)
10
(32.3%)
31
(100%)
3 My supervisor involves me in decision
making on issues that affect my work.
13
(41.9%)
8
(25.8%)
10
(32.3%)
31
(100%)
Co – Worker Relations A N S DIS TOTAL
4 My colleagues provide me with helpful
information and advice.
22
(71.0%)
5
(16.1%)
4
(12.9%)
31
(100%)
5 My colleagues provide me with clear
and effective feedback.
19
(61.3%)
5
(16.1%)
7
(22.6%)
31
(100%)
6 My colleagues back stab me to look
good in front of others
8
(25.8%)
6
(19.4%)
17
(54.8%)
31
(100%)
7 We work as a team in this organization. 26
(83.9%)
2
(6.5%)
3
(9.7%)
31
(100%)
Source: Field Data
Respondents were also asked whether supervisors respect employee opinion on issues that affect
their work, most 54.8% respondents concurred with the statement while a third (32.3%) of
respondents opposed and 12.9% were undecided. This implies that half of the respondents feel that
their opinion on issues affecting their work is respected by their supervisors. With regard to
52
whether supervisors involve employees in decision making on issues that affect employees’ work,
most (41.9%) concurred while 32.3% respondents opposed and quarter (25.8%) of the respondents
were not decided. This shows that participation of employees in decision making is encouraged in
Disabled People’s Organizations. The findings generally imply that supervisor-employee relations
in Disabled People’s Organizations are good and hence do not hinder employee retention.
Interview findings also attest to the questionnaire findings and shade some light on work relations.
For example key informants were asked to comment on their relationship with their employees or
workers and this is what they had to say;
As a supervisor, my relationship with my employees is a combination of personal relation
that is my workers are my friends and professional I guide them to do their work
professionally. (Key informant interview with Executive Director MHU, 7/12/12).
Similarly,
At my former work place, I worked well with my supervisor. There was a lot of feedback
and monitoring. (Key informant interview with former employee 9/12/12).
However the quotations below voiced a different view;
My relationship with my supervisor was not always good we treated each other with
sceptism. Communication between us was always labored. (key informant interview with
former employee 14/12/12).
53
The above quote implies that poor supervisor employee relations are a threat to employee retention
in organizations. However in general, the findings demonstrate that the supervisor-employee
relation in DPOs is fairly good which means that it enhances employee retention in these
organizations.
In relation to co-worker relations, findings in table 6 above show that majority (71.0%) of
respondents concurred with the statement that employees provide each other with helpful
information and advice, 12.9% respondents opposed and 16.1% were undecided. This implied that
majority of the employees in DPOs assist one another and effectively share information amongst
themselves. Regarding whether employees provide each other with clear and effective feedback,
slightly more than half (61.3%) of respondents concurred with the statement while 22.6% opposed
and 16.1% respondents were undecided. This implied that there is effective communication
between the workers. In addition to this, slightly more than half (54.8%) of respondents opposed
the statement that colleagues back stab each other to look good in front of others. A quarter
(25.8) of respondents agreed while 19.4% were undecided. This implies that more than half of
respondents believe that the level of trust with their colleagues is high which creates a favorable
working environment that encourages employee retention.
As to whether employees work as a team in their organizations, majority (80.6%) of the
respondents concurred while a similar percentage (9.7%) either opposed or were undecided on
what to state. This implies that majority of employees in DPOs feel that there is team spirit and
team work that exists among employees in DPOs. The above findings on co-worker relations
evidently show that good work relations exist among co-workers. Interview findings also attest to

54
the questionnaire findings and shade some light on work relations. For example key informants
were asked to comment on their relationship with fellow workers and this is what they had to say;
My work relation with colleagues was cordial and collaborative. (Key informant interview
with former employee, 12/12/12).
The above quote attest to the fact that co-worker relations in DPOs are good however, the findings
also revealed that there are always situations that are bond to cause negative work relations. One
of the key informants had this to say;
…employees often back stabbed each other because opportunities and resources were
always scanty and the only option employees saw viable was to win over directors by
whatever means. (Key informant interview with former worker 12/12/12).
All in all, majority agree that positive work relations exist within the DPOs hence good co-worker
relations motivate staff which enhances employee retention.
4.3.2 Findings about Employee Retention in Disabled People’s Organizations
Respondents were asked about employee retention and overall four statements about employee
retention were presented to respondents who responded to the questionnaire. The respondents were
requested to respond to the items using a scale with coded responses. Results are presented in table
7 where the first column presents the statements about employee retention and remaining columns
presents the distribution of respondents on the responses for each of the items. Table 7 below
shows the analysis and interpretation of results.
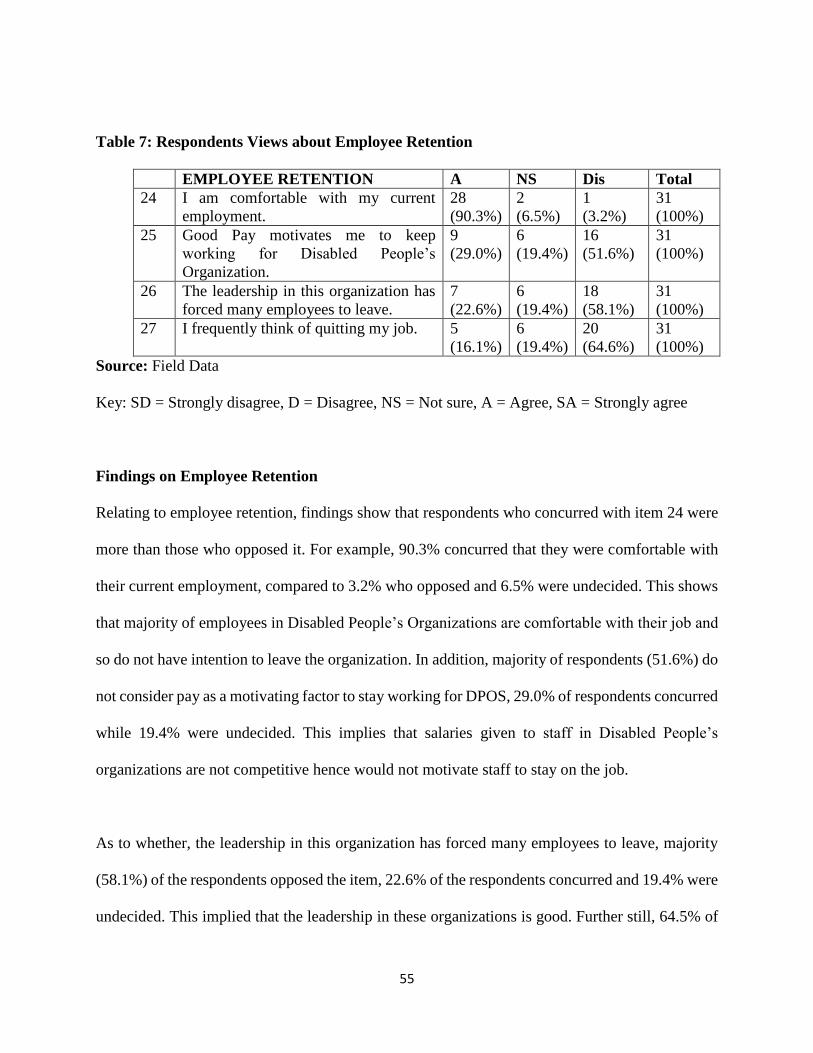
55
Table 7: Respondents Views about Employee Retention
EMPLOYEE RETENTION A NS Dis Total
24 I am comfortable with my current
employment.
28
(90.3%)
2
(6.5%)
1
(3.2%)
31
(100%)
25 Good Pay motivates me to keep
working for Disabled People’s
Organization.
9
(29.0%)
6
(19.4%)
16
(51.6%)
31
(100%)
26 The leadership in this organization has
forced many employees to leave.
7
(22.6%)
6
(19.4%)
18
(58.1%)
31
(100%)
27 I frequently think of quitting my job. 5
(16.1%)
6
(19.4%)
20
(64.6%)
31
(100%)
Source: Field Data
Key: SD = Strongly disagree, D = Disagree, NS = Not sure, A = Agree, SA = Strongly agree
Findings on Employee Retention
Relating to employee retention, findings show that respondents who concurred with item 24 were
more than those who opposed it. For example, 90.3% concurred that they were comfortable with
their current employment, compared to 3.2% who opposed and 6.5% were undecided. This shows
that majority of employees in Disabled People’s Organizations are comfortable with their job and
so do not have intention to leave the organization. In addition, majority of respondents (51.6%) do
not consider pay as a motivating factor to stay working for DPOS, 29.0% of respondents concurred
while 19.4% were undecided. This implies that salaries given to staff in Disabled People’s
organizations are not competitive hence would not motivate staff to stay on the job.
As to whether, the leadership in this organization has forced many employees to leave, majority
(58.1%) of the respondents opposed the item, 22.6% of the respondents concurred and 19.4% were
undecided. This implied that the leadership in these organizations is good. Further still, 64.5% of
56
respondents opposed the item that employees frequently think of quitting their job, 19.4% were
undecided and 16.1% concurred with the item. This implied that employees in Disabled People’s
Organizations do not have the intention of leaving their jobs. Thus, findings from the questionnaire
generally show that employee retention in Disabled People’s Organizations has not been affected
by power and influence, hence implying that there are other factors that affect employee retention
in Disabled People’s Organizations in Uganda.
Interview findings shade some light on employee retention in DPOs. For example, when
respondents were asked to state whether there were other contributory factors to turnover in DPOs,
a number of factors were stated however, the major factors highlighted included; non-renewal of
contracts at the end of a project, inadequate pay, inadequate motivation of staff in terms of
appreciation and poor appraisal system. One of the key informants had this to say about the
appraisal system;
…. appraisers look for faults which demotivate staff; also the relationship between the
Board and staff is not very friendly. Board members always look for faults and enlarge a
mistake as if you have killed a person. (Key Informant Interview with Executive Secretary
NUWODU 14/12/12).
Similarly another key informant had this to say;
Disability politics is likely to cause poor retention among disability organizations: for
instance one of the top managers was tagged by other members as a blue eyed daughter of
one of the founder members of the organization she was managing so some board members
wanted her to leave the job.(Key Informant Interview with ED, MHU 07/12/12).

57
The above quotations attest that organizational politics exists in Disabled People’s Organizations
and that politics in DPOs stems from the ‘Board’ which is the governing body of these
organizations and not necessarily from management. Therefore those in management are more
likely to face the wrath of politics than their subordinates since managers are directly answerable
to the Board members thus demotivates employees especially those in management.
4.3.3 Testing the First Hypothesis
The first hypothesis stated, “Influence has a significant effect on employee retention in selected
Disabled People’s Organizations in Uganda”. Spearman rank order correlation coefficient ( )
was used to determine the strength of the relationship between influence and employee retention.
The Spearman rank order correlation was used because the scale (that is strongly agree, agree, not
sure, disagree and strongly disagree) that accompanied the questionnaire was ordinal. The
responses were merely arranged in order whereby one could not exactly determine how much one
disagreed or agreed and as such adding or subtracting the responses such as strongly disagree from
disagree does not make sense. It is recommended that with an ordinal scale, Spearman rank order
correlation is suitable for determining relationships because it does not involve means and standard
deviations, which are meaningless with ordinal data.
In addition, the sign of the coefficient (positive or negative sign) was used to determine the change
in direction in the relationship between influence and employee retention. The coefficient of
determination was used to determine the effect of influence on employee retention. The
significance of the coefficient (p) was used to test the findings by comparing (p) to the critical
rho
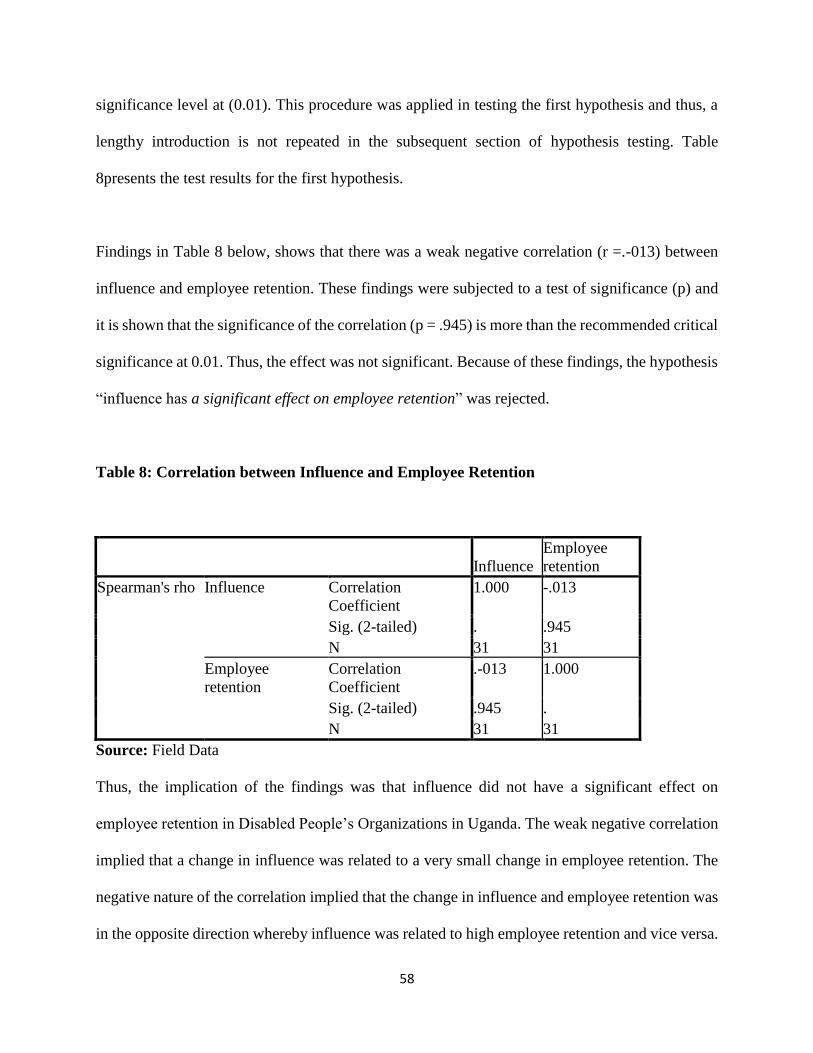
58
significance level at (0.01). This procedure was applied in testing the first hypothesis and thus, a
lengthy introduction is not repeated in the subsequent section of hypothesis testing. Table
8presents the test results for the first hypothesis.
Findings in Table 8 below, shows that there was a weak negative correlation (r =.-013) between
influence and employee retention. These findings were subjected to a test of significance (p) and
it is shown that the significance of the correlation (p = .945) is more than the recommended critical
significance at 0.01. Thus, the effect was not significant. Because of these findings, the hypothesis
“influence has a significant effect on employee retention” was rejected.
Table 8: Correlation between Influence and Employee Retention
Influence
Employee
retention
Spearman's rho Influence Correlation
Coefficient
1.000 -.013
Sig. (2-tailed) . .945
N 31 31
Employee
retention
Correlation
Coefficient
.-013 1.000
Sig. (2-tailed) .945 .
N 31 31
Source: Field Data
Thus, the implication of the findings was that influence did not have a significant effect on
employee retention in Disabled People’s Organizations in Uganda. The weak negative correlation
implied that a change in influence was related to a very small change in employee retention. The
negative nature of the correlation implied that the change in influence and employee retention was
in the opposite direction whereby influence was related to high employee retention and vice versa.
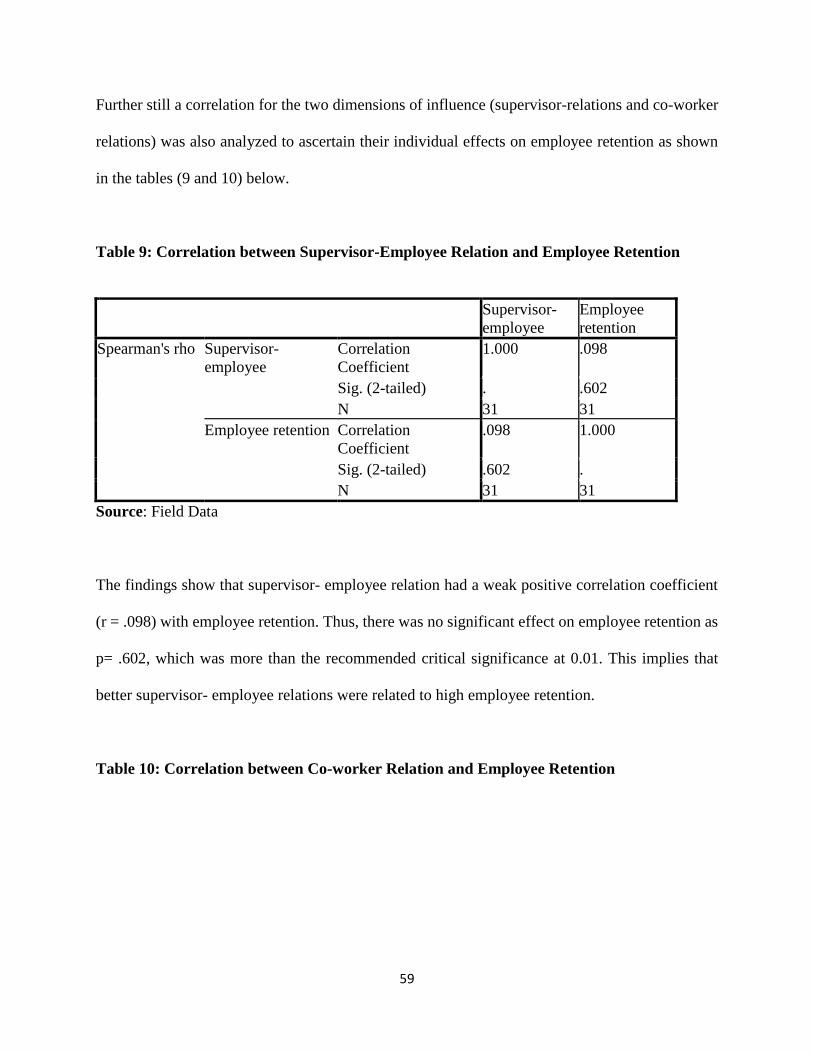
59
Further still a correlation for the two dimensions of influence (supervisor-relations and co-worker
relations) was also analyzed to ascertain their individual effects on employee retention as shown
in the tables (9 and 10) below.
Table 9: Correlation between Supervisor-Employee Relation and Employee Retention
Supervisor-
employee
Employee
retention
Spearman's rho Supervisor-
employee
Correlation
Coefficient
1.000 .098
Sig. (2-tailed) . .602
N 31 31
Employee retention Correlation
Coefficient
.098 1.000
Sig. (2-tailed) .602 .
N 31 31
Source: Field Data
The findings show that supervisor- employee relation had a weak positive correlation coefficient
(r = .098) with employee retention. Thus, there was no significant effect on employee retention as
p= .602, which was more than the recommended critical significance at 0.01. This implies that
better supervisor- employee relations were related to high employee retention.
Table 10: Correlation between Co-worker Relation and Employee Retention
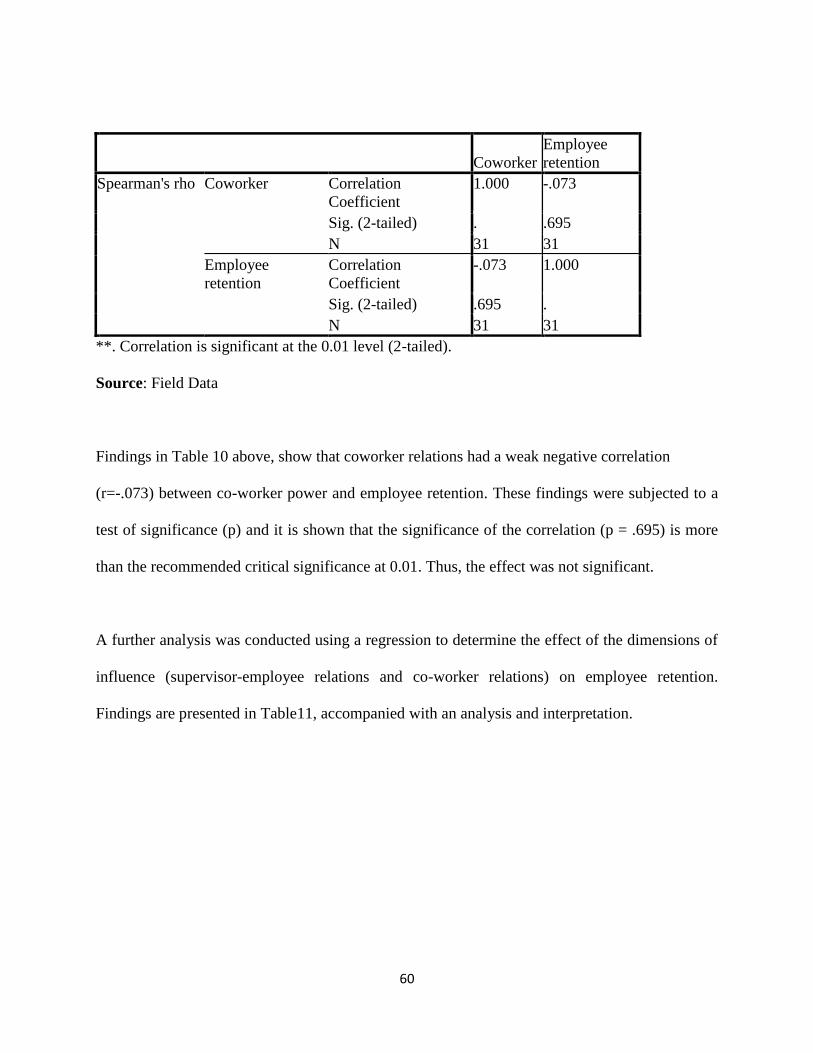
60
Coworker
Employee
retention
Spearman's rho Coworker Correlation
Coefficient
1.000 -.073
Sig. (2-tailed) . .695
N 31 31
Employee
retention
Correlation
Coefficient
-.073 1.000
Sig. (2-tailed) .695 .
N 31 31
**. Correlation is significant at the 0.01 level (2-tailed).
Source: Field Data
Findings in Table 10 above, show that coworker relations had a weak negative correlation
(r=-.073) between co-worker power and employee retention. These findings were subjected to a
test of significance (p) and it is shown that the significance of the correlation (p = .695) is more
than the recommended critical significance at 0.01. Thus, the effect was not significant.
A further analysis was conducted using a regression to determine the effect of the dimensions of
influence (supervisor-employee relations and co-worker relations) on employee retention.
Findings are presented in Table11, accompanied with an analysis and interpretation.
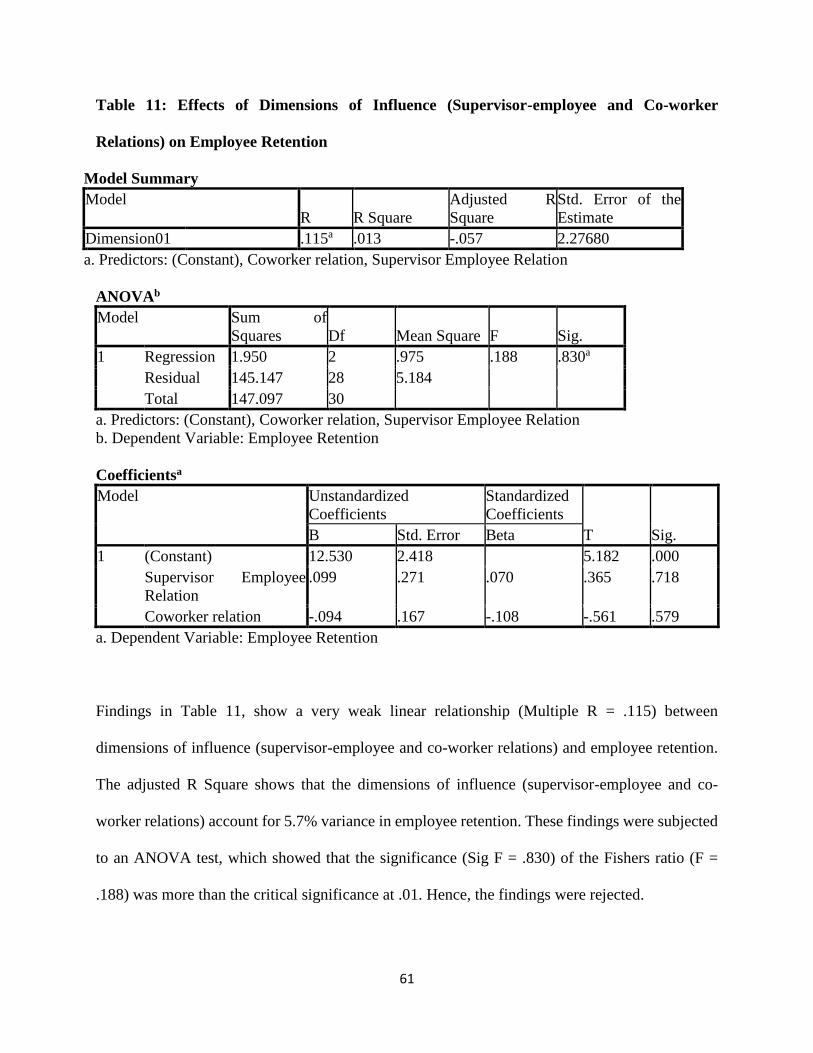
61
Table 11: Effects of Dimensions of Influence (Supervisor-employee and Co-worker
Relations) on Employee Retention
Model Summary
Model
R R Square
Adjusted R
Square
Std. Error of the
Estimate
Dimension01 .115a .013 -.057 2.27680
a. Predictors: (Constant), Coworker relation, Supervisor Employee Relation
ANOVAb
Model Sum of
Squares Df Mean Square F Sig.
1 Regression 1.950 2 .975 .188 .830a
Residual 145.147 28 5.184
Total 147.097 30
a. Predictors: (Constant), Coworker relation, Supervisor Employee Relation
b. Dependent Variable: Employee Retention
Coefficientsa
Model Unstandardized
Coefficients
Standardized
Coefficients
T Sig. B Std. Error Beta
1 (Constant) 12.530 2.418 5.182 .000
Supervisor Employee
Relation
.099 .271 .070 .365 .718
Coworker relation -.094 .167 -.108 -.561 .579
a. Dependent Variable: Employee Retention
Findings in Table 11, show a very weak linear relationship (Multiple R = .115) between
dimensions of influence (supervisor-employee and co-worker relations) and employee retention.
The adjusted R Square shows that the dimensions of influence (supervisor-employee and co-
worker relations) account for 5.7% variance in employee retention. These findings were subjected
to an ANOVA test, which showed that the significance (Sig F = .830) of the Fishers ratio (F =
.188) was more than the critical significance at .01. Hence, the findings were rejected.

62
The coefficients findings show that all dimensions of influence (supervisor-employee and co-
worker employee) varied. Supervisor relation did not significantly affect employee retention
because the significant p-value was more than the critical significance at .01 (p < .718). In addition
co-worker relation did not significantly affect employee retention because their significant p-value
was more than the critical significance at .01 (p=.579). The higher t-values show the dimensions
of influence (supervisor-employee and co-worker relations) least affected employee retention.
4.4 Power and Employee Retention in Selected Disabled People’s Organizations.
Before testing the second hypothesis, descriptive results (percentages) relating to power were
presented, analyzed and interpreted. Findings are presented in the following subsections.
4.4.1 Descriptive Results about Power in Selected Disabled People’s Organizations
Respondents were requested to respond to the five indicators of power (coercive, reward,
legitimate, referent and expert power), using a five-point Likert scale: “Strongly Agree”, “Agree”,
“Not sure”, “Disagree”, “Strongly Disagree”. The indicators of power were presented in 18
statements as shown in Table 12. The items are presented in the first column of Table 12 and the
proportion of respondents to the responses on each of the items is presented in form of percentages
in columns 2 to 5. The last column presents the total percentage of respondents on each of the
items. The analysis and interpretation of power follows the presentation of findings in Table 12.
Table 12: Respondents Views about Power
No Statements on coercive power A NS DIS TOTAL
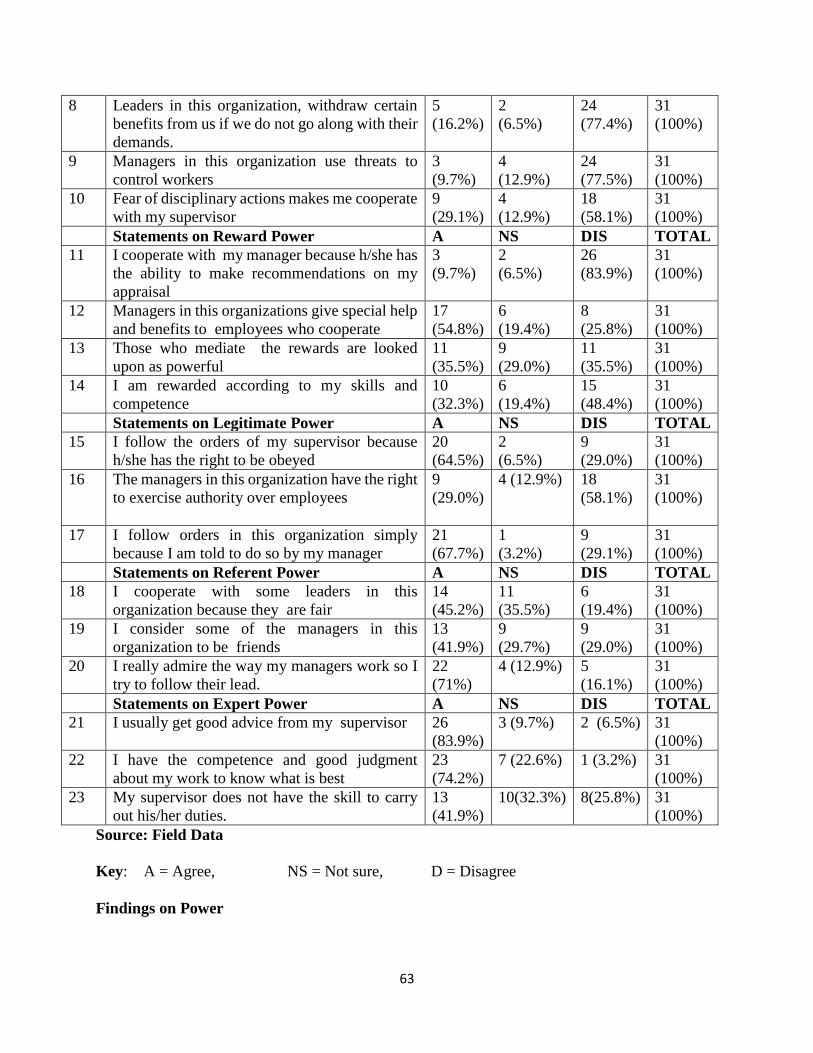
63
8 Leaders in this organization, withdraw certain
benefits from us if we do not go along with their
demands.
5
(16.2%)
2
(6.5%)
24
(77.4%)
31
(100%)
9 Managers in this organization use threats to
control workers
3
(9.7%)
4
(12.9%)
24
(77.5%)
31
(100%)
10 Fear of disciplinary actions makes me cooperate
with my supervisor
9
(29.1%)
4
(12.9%)
18
(58.1%)
31
(100%)
Statements on Reward Power A NS DIS TOTAL
11 I cooperate with my manager because h/she has
the ability to make recommendations on my
appraisal
3
(9.7%)
2
(6.5%)
26
(83.9%)
31
(100%)
12 Managers in this organizations give special help
and benefits to employees who cooperate
17
(54.8%)
6
(19.4%)
8
(25.8%)
31
(100%)
13 Those who mediate the rewards are looked
upon as powerful
11
(35.5%)
9
(29.0%)
11
(35.5%)
31
(100%)
14 I am rewarded according to my skills and
competence
10
(32.3%)
6
(19.4%)
15
(48.4%)
31
(100%)
Statements on Legitimate Power A NS DIS TOTAL
15 I follow the orders of my supervisor because
h/she has the right to be obeyed
20
(64.5%)
2
(6.5%)
9
(29.0%)
31
(100%)
16 The managers in this organization have the right
to exercise authority over employees
9
(29.0%)
4 (12.9%) 18
(58.1%)
31
(100%)
17 I follow orders in this organization simply
because I am told to do so by my manager
21
(67.7%)
1
(3.2%)
9
(29.1%)
31
(100%)
Statements on Referent Power A NS DIS TOTAL
18 I cooperate with some leaders in this
organization because they are fair
14
(45.2%)
11
(35.5%)
6
(19.4%)
31
(100%)
19 I consider some of the managers in this
organization to be friends
13
(41.9%)
9
(29.7%)
9
(29.0%)
31
(100%)
20 I really admire the way my managers work so I
try to follow their lead.
22
(71%)
4 (12.9%) 5
(16.1%)
31
(100%)
Statements on Expert Power A NS DIS TOTAL
21 I usually get good advice from my supervisor 26
(83.9%)
3 (9.7%) 2 (6.5%) 31
(100%)
22 I have the competence and good judgment
about my work to know what is best
23
(74.2%)
7 (22.6%) 1 (3.2%) 31
(100%)
23 My supervisor does not have the skill to carry
out his/her duties.
13
(41.9%)
10(32.3%) 8(25.8%) 31
(100%)
Source: Field Data
Key: A = Agree, NS = Not sure, D = Disagree
Findings on Power
64
Findings in Table 12 about coercive power show that most respondents opposed items on coercive
power (8 to10) compared to respondents who concurred to these items while few respondents were
not sure of these items. For example, it is shown that most respondents (77.4%) opposed that
leaders in Disabled People’s Organizations, withdraw certain benefits from employees if they do
not go along with their demands compared to 16.2% of the respondents who concurred while 6.5%
of the respondents were not sure. In addition, most respondents (77.5%) opposed that Managers in
Disabled People’s Organizations use threats to control workers compared to 9.7% of the
respondents who concurred while 12.9% of the respondents were not sure.
Further still, findings show that 58.1% of the respondents opposed that Fear of disciplinary actions
makes them cooperate with their supervisor compared to 12.9%of the respondents who were not
sure and 29.1% of the respondents who concurred. From the analysis, it can be interpreted that in
Disabled People’s Organizations, leaders donot withdraw benefits from staff as a measure to force
staff to comply with their demands, managers do not use threats to control employees and staff
cooperate with their supervisors without fear of disciplinary actions. Therefore managers in
Disabled People’s organizations do not necessarily use force or threats to control employees but
may use other disciplinary actions within their policies to take action on staff that may be defiant.
Relating to reward power, findings in table 12 above, show that most respondents concurred with
the items (11, 12 and 14) while majority opposed items (13). For example about three quarters
(83.9%) of the respondents opposed that they cooperate with their manager because h/she has the
ability to make recommendations on their appraisal compared to9.7% who concurred and 6.5%
were undecided. This shows that half of the respondents do not necessarily cooperate with their
65
managers for the sake of writing them a good appraisal report. As to whether, managers in DPOs
give special help and benefits to employees who cooperate, about a half of the respondents (54.8%)
concurred while a similar percentage 25.8% of the respondents opposed and 19.4% were
undecided. This means that half of the respondents believe that special help and benefits are only
given to employees who cooperate with their supervisors and yet another third donot think that
special benefits are only meant for employees who cooperate.
In addition, 35.5% of the respondents opposed that those who mediate the rewards are looked upon
as powerful and a similar percentage of the respondents (35.5%) concurred and 29.0% were
undecided. This implied that a number of employees do not view managers as having reward power
thus their reward power is limited. Lastly, majority (48.4%) of the respondents opposed that they
are rewarded according to their skills and competence, about a third of the respondents (32.3%)
concurred and 19.4% were not decided. This implies that rewards given to employees are not
entirely dependent on the skills and competence hence employees in Disabled People’s
Organizations receive low salary. These findings, thus show that employees know that their
managers have little say on rewarding employees because their reward power is limited.
Findings from Key informant interviews with former workers and Executive Directors also shade
more light on reward power and to some extent were supportive of the findings from the
questionnaires. The Key informants revealed that most pay and promotion decisions were applied
based on the policies in place although at time politics was applied. Emphasizing the aspect of
politics in pay and promotion decisions, a responding former employee said;
66
….. yes to a certain extent politics affected employee retention. Some people felt they were
being passed over for projects and salary increment in favour of others as a result of
favoritism. (Key informant interview with former employee, 09th December 2012).
Similarly, another former employee had this to say;
…Policies were in place to base on when increment could be made, with a 5 % every year.
However, this would sometimes not be the case depending on Fund availability from the
donors. (Key informant interview with former employee, 12th December 2012).
Still in relation to the above this is what one of the Executive Directors said;
…there set policies that have to be followed. Our organization has a flat structure. If one
joins as a field officer then you leave it as a field officer. The policy has no room for
promotions since the policy calls for recruitment for any new position. (Key informant
interview with USDC Executive Director, 12th December 2012).
The above quotations also indicate that policies in these organizations do not provide opportunity
for promotion which demotivates employees. Besides that managers of these organizations do not
possess full reward powers to reverse salary pay or a ward bonuses since the salary structure is
entirely dependent on donor funding meaning the organizations are unsustainable.
Unsustainability of an organization brings about job insecurity and job dissatisfaction which
affects staff commitment and thus employees are forced to look for better opportunities elsewhere.
67
Relating to legitimate power, table 12 shows that most respondents concurred with all the three
items (that is 15, 16 and 17) compared to those who were undecided and opposed to the item. For
instance more than half (64.5%) of the respondents concurred that they follow orders of their
supervisors because supervisors have the right to be obeyed, slightly more than a quarter (29.0%)
opposed and 6.5% were undecided. As to whether managers in Disabled People’s Organizations
have the right to exercise authority over employees more than half (58.1%) of the respondents
opposed, 12.9% were undecided and slightly more than a quarter (29.0%) of the respondents
concurred with the item. In addition, about two thirds (67.7%) of the respondents concurred that
they follow orders in Disabled People’s Organizations simply because they are told to do so by
their manager. About a quarter (29.0%) respondents opposed the item and another 3.2% were un-
decided. The implication from the analysis is that majority of the employees in Disabled People’s
Organizations, recognize that their managers have legitimate power by virtual of their positions in
the organization thus legitimate power was not a contributory fact to low employee retention in
Disabled People’s Organizations.
Regarding referent power, findings (see table 12 above) show that all the 3 aspects of referent
power were satisfactory because majority of the respondents concurred with all the items. For
example, relating to whether employees cooperate with some leaders in DPOs because they are
fair, majority of the respondents (45.1%) concurred compared to 19.4% who opposed and 35.5%
were undecided. This shows that slightly less than a half of DPO employees feel comfortable
working with leaders who treat their employees equally and are exemplary. As to whether
employees consider some of their managers in these organization to be friends, majority of the

68
respondents (41.9%) concurred compared to 29.0% who opposed and 29.0% were undecided. This
implies that majority of employees of Disabled People’s Organizations believe their managers are
not only their bosses but friends too and this provides a conducive work environment characterized
by free interaction between managers and employees. In addition to this, majority (71.0%) of the
respondents concurred that they really admire the way their managers work and so try to follow
their lead, 12.9% were undecided and 16.1% opposed. These findings imply that majority of the
respondents believe that their managers have good leadership qualities that are admirable and
encourage commitment from employees hence the above findings on referent power enhance
employee retention hence do not contribute to low employee retention in Disabled People’s
Organizations.
Relating to expert power, findings as shown in table 12 above show that the 2 aspects of expert
power were satisfactory since majority of the respondents concurred with the items. For example
most of the respondents (83.9%) concurred that they usually get good advice from their supervisor
(9.7%) of the respondents were undecided and only a few (6.5%) opposed. This implies that most
employees in Disabled People’s Organizations have confidence in their supervisor hence seek their
advice. As to whether employees have the competence and good judgment about their work to
know what is best, more than half (74.2%) of the respondents concurred with the item and slightly
less than a quarter (22.6%) were undecided while only (3.2%) opposed. This finding implies that
two thirds believe that their supervisors put in effort to ensure that their employees are equipped
with the necessary skills as well as take it upon themselves to listen to the challenges of their
subordinates and provide advice while another two thirds of the respondents are not sure.
69
Further still, 45.2% of the respondents opposed the item that their supervisors do not have the skill
to carry out their duties, 29.0% of the respondents concurred and 25.8% were undecided. This
implies majority of employees believe that their managers have the skill and competence to do
their job. Thus findings from the questionnaires generally show some evidence that expert and
referent power is not detrimental to employee retention in Disabled People’s Organizations.
Interview findings shade some light on performance evaluation of employees and the findings
were to some extent in support of findings from the questionnaires. For example majority of the
key informants attest that staff appraisals were conducted however the manner in which most of
these appraisals were conducted was unprofessional since it seemed like more of a blame game
than a dialogue between the appraiser and appraise. One of the former employees had this to say;
…..a performance appraisal reflected more of the supervisors likes and dislikes, I even
experienced a scenario where someone would bribe the would-be “appraiser” to be kept
in a position that s/he was not qualified for. But also, some of the people carrying out the
appraisals were not qualified themselves. (Key informant with former employee 12/12/12).
Similarly another key informant had this to say;
The Organization assessment recommended changes in management that advised that staff
be appraised by their supervisors and not the Human Resource and Programmes
committee of the Board. This led to professionalism and improved relationship between
supervisors and other staff. (Key informant interview with former employee, 12/12/12).
4.4.2 Testing Hypothesis Two
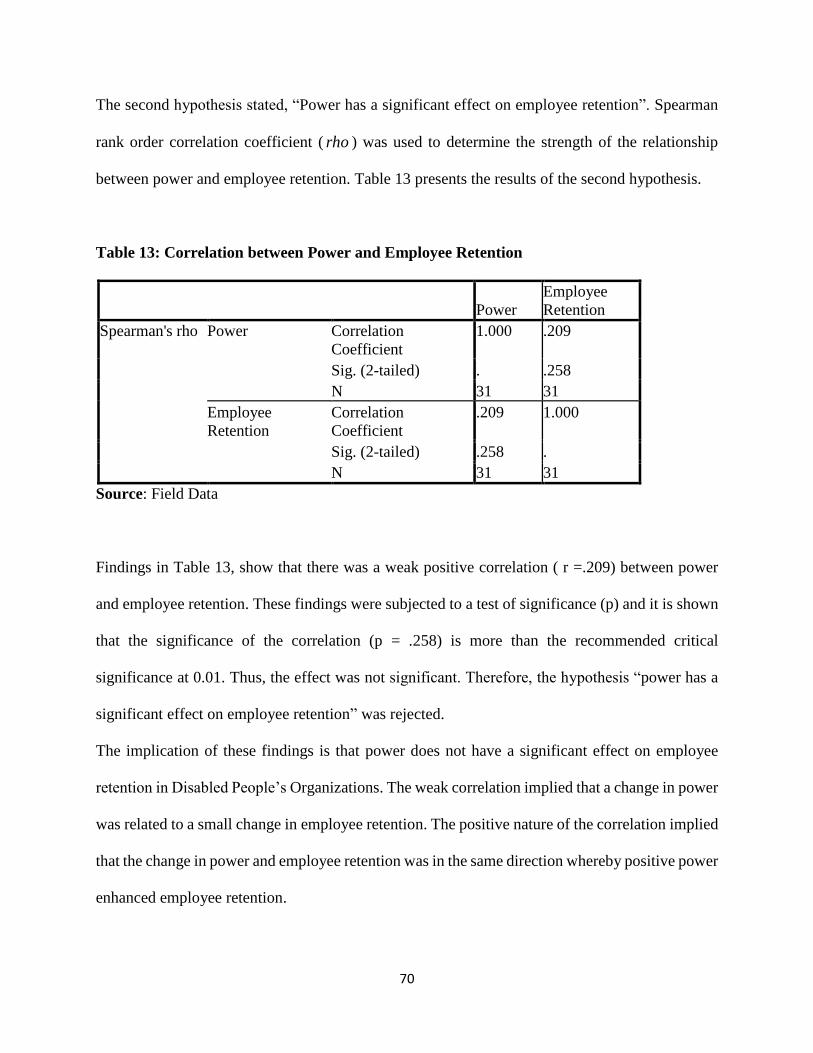
70
The second hypothesis stated, “Power has a significant effect on employee retention”. Spearman
rank order correlation coefficient ( ) was used to determine the strength of the relationship
between power and employee retention. Table 13 presents the results of the second hypothesis.
Table 13: Correlation between Power and Employee Retention
Power
Employee
Retention
Spearman's rho Power Correlation
Coefficient
1.000 .209
Sig. (2-tailed) . .258
N 31 31
Employee
Retention
Correlation
Coefficient
.209 1.000
Sig. (2-tailed) .258 .
N 31 31
Source: Field Data
Findings in Table 13, show that there was a weak positive correlation ( r =.209) between power
and employee retention. These findings were subjected to a test of significance (p) and it is shown
that the significance of the correlation (p = .258) is more than the recommended critical
significance at 0.01. Thus, the effect was not significant. Therefore, the hypothesis “power has a
significant effect on employee retention” was rejected.
The implication of these findings is that power does not have a significant effect on employee
retention in Disabled People’s Organizations. The weak correlation implied that a change in power
was related to a small change in employee retention. The positive nature of the correlation implied
that the change in power and employee retention was in the same direction whereby positive power
enhanced employee retention.
rho
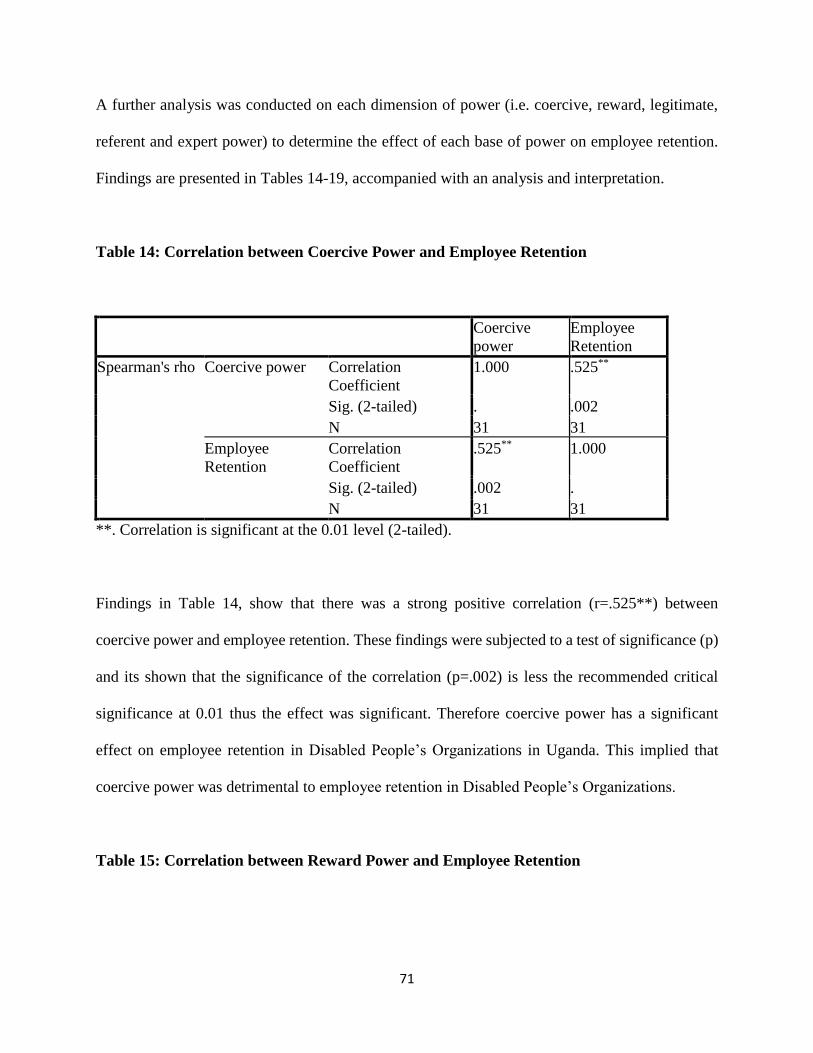
71
A further analysis was conducted on each dimension of power (i.e. coercive, reward, legitimate,
referent and expert power) to determine the effect of each base of power on employee retention.
Findings are presented in Tables 14-19, accompanied with an analysis and interpretation.
Table 14: Correlation between Coercive Power and Employee Retention
Coercive
power
Employee
Retention
Spearman's rho Coercive power Correlation
Coefficient
1.000 .525**
Sig. (2-tailed) . .002
N 31 31
Employee
Retention
Correlation
Coefficient
.525** 1.000
Sig. (2-tailed) .002 .
N 31 31
**. Correlation is significant at the 0.01 level (2-tailed).
Findings in Table 14, show that there was a strong positive correlation (r=.525**) between
coercive power and employee retention. These findings were subjected to a test of significance (p)
and its shown that the significance of the correlation (p=.002) is less the recommended critical
significance at 0.01 thus the effect was significant. Therefore coercive power has a significant
effect on employee retention in Disabled People’s Organizations in Uganda. This implied that
coercive power was detrimental to employee retention in Disabled People’s Organizations.
Table 15: Correlation between Reward Power and Employee Retention
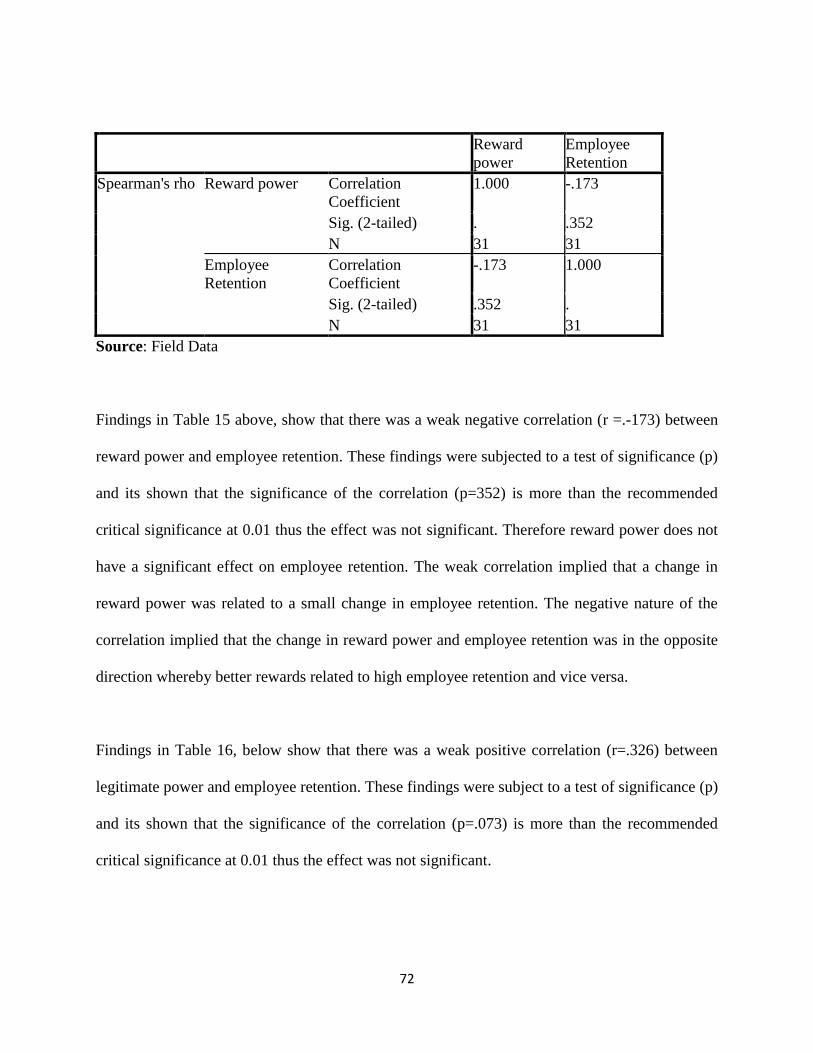
72
Reward
power
Employee
Retention
Spearman's rho Reward power Correlation
Coefficient
1.000 -.173
Sig. (2-tailed) . .352
N 31 31
Employee
Retention
Correlation
Coefficient
-.173 1.000
Sig. (2-tailed) .352 .
N 31 31
Source: Field Data
Findings in Table 15 above, show that there was a weak negative correlation (r =.-173) between
reward power and employee retention. These findings were subjected to a test of significance (p)
and its shown that the significance of the correlation (p=352) is more than the recommended
critical significance at 0.01 thus the effect was not significant. Therefore reward power does not
have a significant effect on employee retention. The weak correlation implied that a change in
reward power was related to a small change in employee retention. The negative nature of the
correlation implied that the change in reward power and employee retention was in the opposite
direction whereby better rewards related to high employee retention and vice versa.
Findings in Table 16, below show that there was a weak positive correlation (r=.326) between
legitimate power and employee retention. These findings were subject to a test of significance (p)
and its shown that the significance of the correlation (p=.073) is more than the recommended
critical significance at 0.01 thus the effect was not significant.
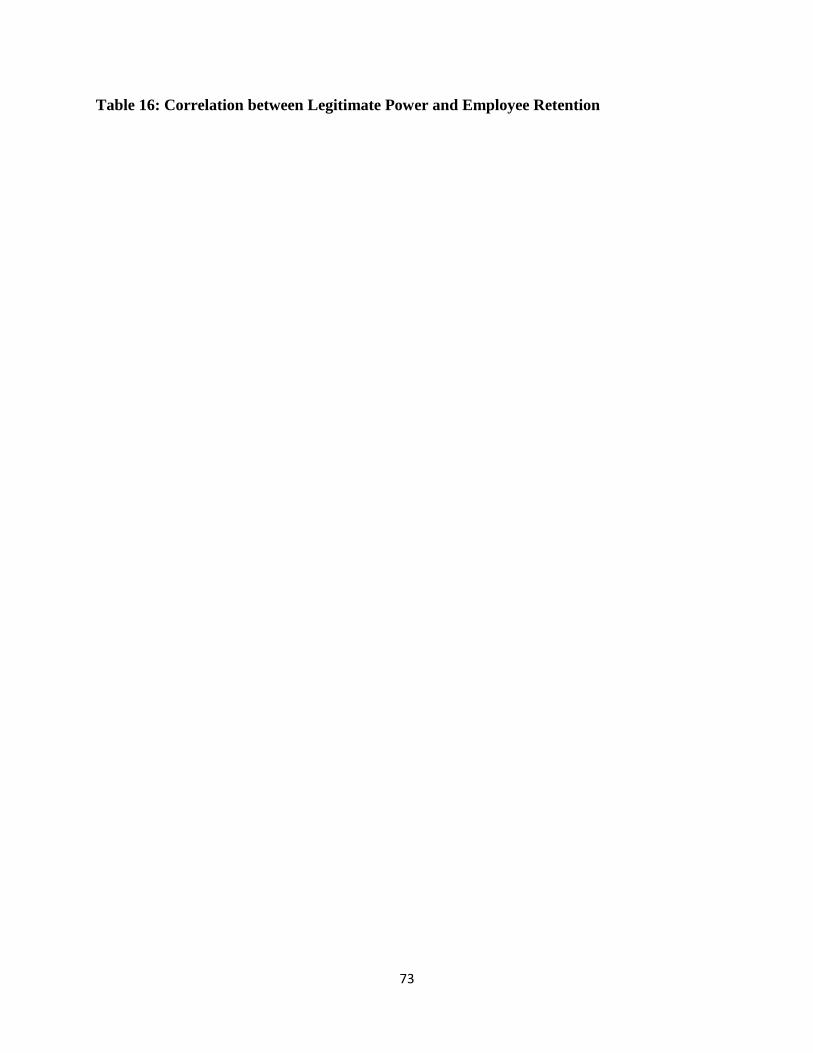
73
Table 16: Correlation between Legitimate Power and Employee Retention
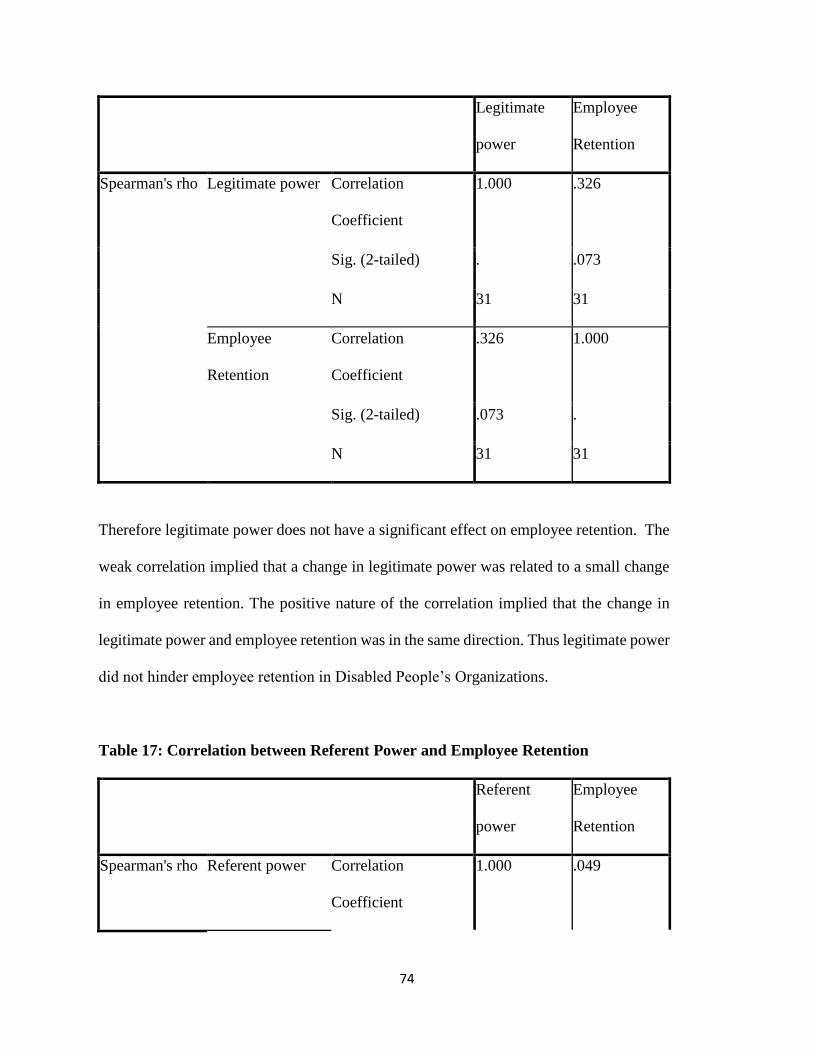
74
Legitimate
power
Employee
Retention
Spearman's rho Legitimate power Correlation
Coefficient
1.000 .326
Sig. (2-tailed) . .073
N 31 31
Employee
Retention
Correlation
Coefficient
.326 1.000
Sig. (2-tailed) .073 .
N 31 31
Therefore legitimate power does not have a significant effect on employee retention. The
weak correlation implied that a change in legitimate power was related to a small change
in employee retention. The positive nature of the correlation implied that the change in
legitimate power and employee retention was in the same direction. Thus legitimate power
did not hinder employee retention in Disabled People’s Organizations.
Table 17: Correlation between Referent Power and Employee Retention
Referent
power
Employee
Retention
Spearman's rho
Referent power Correlation
Coefficient
1.000 .049
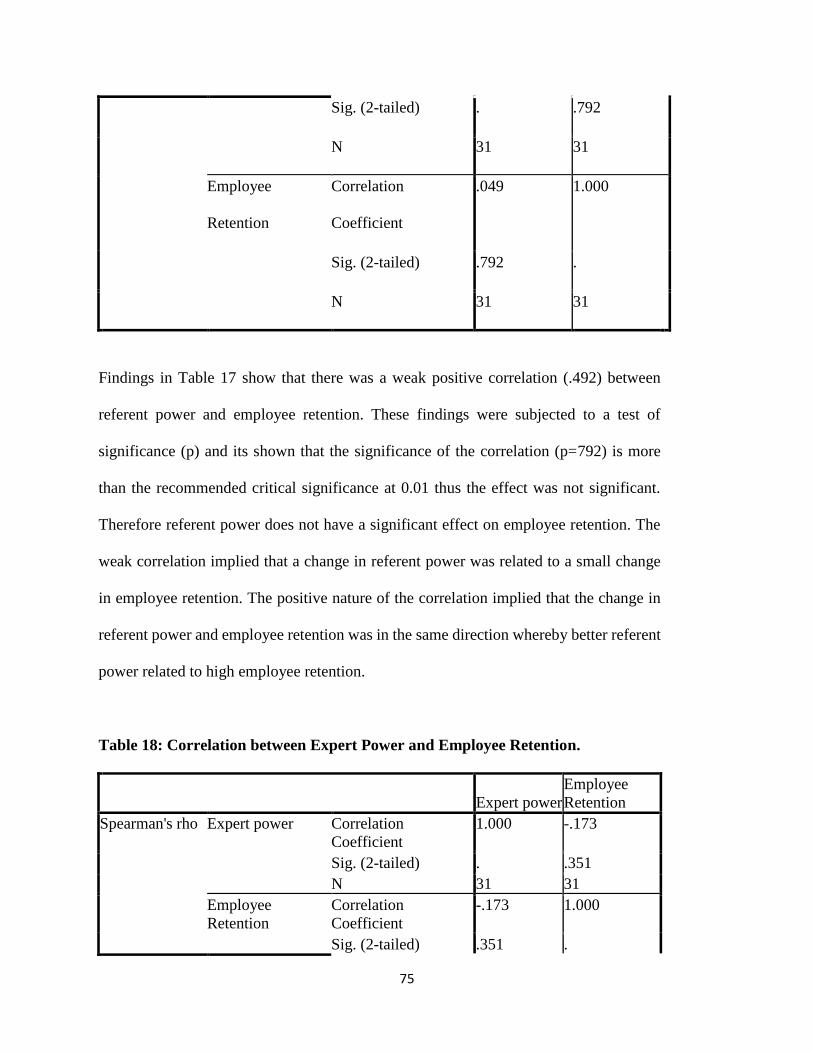
75
Sig. (2-tailed) . .792
N 31 31
Employee
Retention
Correlation
Coefficient
.049 1.000
Sig. (2-tailed) .792 .
N 31 31
Findings in Table 17 show that there was a weak positive correlation (.492) between
referent power and employee retention. These findings were subjected to a test of
significance (p) and its shown that the significance of the correlation (p=792) is more
than the recommended critical significance at 0.01 thus the effect was not significant.
Therefore referent power does not have a significant effect on employee retention. The
weak correlation implied that a change in referent power was related to a small change
in employee retention. The positive nature of the correlation implied that the change in
referent power and employee retention was in the same direction whereby better referent
power related to high employee retention.
Table 18: Correlation between Expert Power and Employee Retention.
Expert power
Employee
Retention
Spearman's rho Expert power Correlation
Coefficient
1.000 -.173
Sig. (2-tailed) . .351
N 31 31
Employee
Retention
Correlation
Coefficient
-.173 1.000
Sig. (2-tailed) .351 .
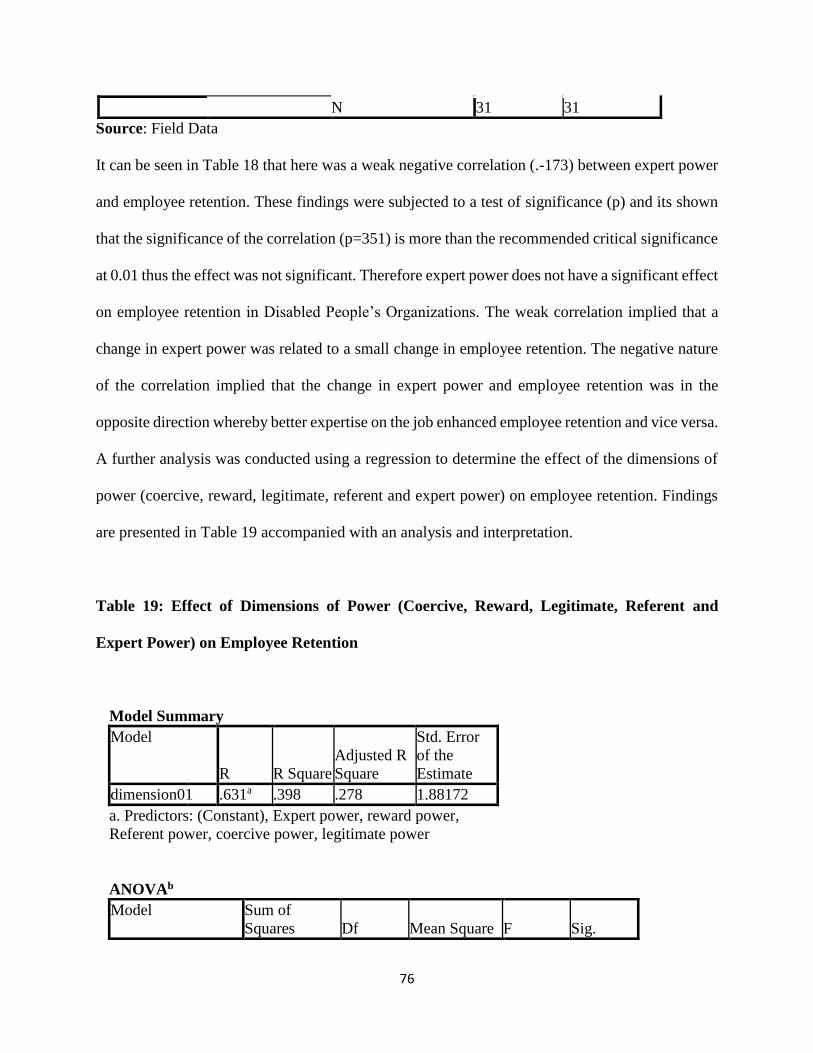
76
N 31 31
Source: Field Data
It can be seen in Table 18 that here was a weak negative correlation (.-173) between expert power
and employee retention. These findings were subjected to a test of significance (p) and its shown
that the significance of the correlation (p=351) is more than the recommended critical significance
at 0.01 thus the effect was not significant. Therefore expert power does not have a significant effect
on employee retention in Disabled People’s Organizations. The weak correlation implied that a
change in expert power was related to a small change in employee retention. The negative nature
of the correlation implied that the change in expert power and employee retention was in the
opposite direction whereby better expertise on the job enhanced employee retention and vice versa.
A further analysis was conducted using a regression to determine the effect of the dimensions of
power (coercive, reward, legitimate, referent and expert power) on employee retention. Findings
are presented in Table 19 accompanied with an analysis and interpretation.
Table 19: Effect of Dimensions of Power (Coercive, Reward, Legitimate, Referent and
Expert Power) on Employee Retention
Model Summary
Model
R R Square
Adjusted R
Square
Std. Error
of the
Estimate
dimension0 1 .631a .398 .278 1.88172
a. Predictors: (Constant), Expert power, reward power,
Referent power, coercive power, legitimate power
ANOVAb
Model Sum of
Squares Df Mean Square F Sig.
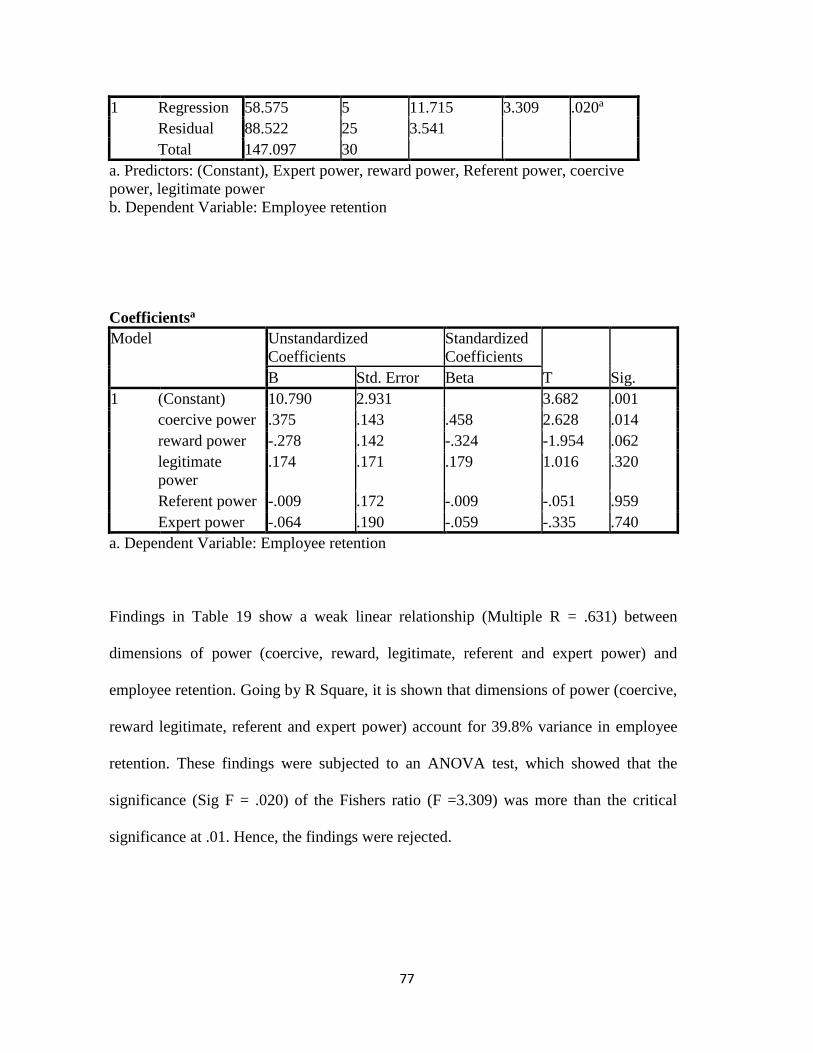
77
1 Regression 58.575 5 11.715 3.309 .020a
Residual 88.522 25 3.541
Total 147.097 30
a. Predictors: (Constant), Expert power, reward power, Referent power, coercive
power, legitimate power
b. Dependent Variable: Employee retention
Coefficientsa
Model Unstandardized
Coefficients
Standardized
Coefficients
T Sig. B Std. Error Beta
1 (Constant) 10.790 2.931 3.682 .001
coercive power .375 .143 .458 2.628 .014
reward power -.278 .142 -.324 -1.954 .062
legitimate
power
.174 .171 .179 1.016 .320
Referent power -.009 .172 -.009 -.051 .959
Expert power -.064 .190 -.059 -.335 .740
a. Dependent Variable: Employee retention
Findings in Table 19 show a weak linear relationship (Multiple R = .631) between
dimensions of power (coercive, reward, legitimate, referent and expert power) and
employee retention. Going by R Square, it is shown that dimensions of power (coercive,
reward legitimate, referent and expert power) account for 39.8% variance in employee
retention. These findings were subjected to an ANOVA test, which showed that the
significance (Sig F = .020) of the Fishers ratio (F =3.309) was more than the critical
significance at .01. Hence, the findings were rejected.
78
The coefficients findings show that only coercive power significantly affected employee
retention because it had least significant p-value (p = .014), which was equal to the critical
significance at 0.01. Other bases of power namely; reward power (p= .062), legitimate
power (p=. 320), referent power (p=.959) and expert power (p=.740) did not have a
significant effect on employee retention given that they had significant p-value which
were greater than the critical significance at 0.01. This clearly showed that although power
did not affect employee retention as a whole, the above P values show that only coercive
power greatly affected employee retention unlike the other four bases of power.
4.5 SUMMARY
In this chapter, analysis was done objective by objective; i) To find out the effect of influence on
employee retention in selected Disabled People’s Organizations in Uganda. ii) To assess the effect
of power on employee retention in selected Disabled People’s Organizations in Uganda.
Quantitative data analysis was done with the help of SPSS and qualitative analysis was done by
content analysis furthermore the findings were also explained in detail.
Influence and Power did not have a significant effect on employee retention in Disabled People’s
Organizations. This is evidenced by the findings in the tables (6 and 19) as well as the quotations
from the various key informants which were in agreement with the questionnaire respondents.
Issues highlighted as major factors affecting employee retention in Disabled people’s
Organizations include; career development, lack of promotion opportunities, project based
structure system, donor policy and dependency and low salary.

79
CHAPTER FIVE: SUMMARY, DISCUSSION, CONCLUSIONS AND
RECOMMENDATIONS
5.1 Introduction
This chapter presents the summary, discussion, conclusions and recommendations. It is divided
into four major sections. The first section presents the summary. The second section presents the
discussion. The third section presents the conclusions. The fourth section presents the
recommendations.
5.2 Summary of Major Findings
The purpose of the study was to investigate the effects of organizational politics on employee
retention in selected Disabled People’s Organizations in Uganda. A summary of the study findings
is presented below.
5.2.1 Effect of Influence on Employee Retention in Selected Disabled People’s
Organizations
Influence had an insignificant effect on employee retention in Disabled People’s Organizations in
Uganda whereby better work relations which were the dimension of influence fortified employee
retention in DPOs and vice versa. Therefore supervisor-employee and co-worker relations did not
80
affect employee retention. They had a weak and insignificant correlation respectively
(p=0.001<.718, p=0.01<.579) which implied that both supervisor-employee and co-worker
relations did not have a significant effect on employee retention in Disabled People’s
Organizations.
5.2.2 Effect of Power on Employee Retention in Disabled People’s Organizations in
Uganda.
Power had a positive but insignificant effect on employee retention in Disabled People’s
Organizations in Uganda. That is power does not significantly affect employee retention. The
results indicated that r=0.258 p=0.209>0.01. Out of the five types of power, four types (legitimate,
reward, referent and expert power) did not have a significant effect on employee retention in DPOs
except coercive power. Hence there is a strong effect of coercive power on employee retention as
opposed to other types of power (reward, legitimate, referent and expert power). This implied that
use of coercive power may bring about compliance among workers however leads to physical and
psychological withdraw of the employees hence lowers employee retention.
5.3 Discussion
Under this section the results of the study are interpreted and implications of the findings provided
as per each objective.
81
5.3.1 Effect of Influence on Employee Retention in Disabled People’s Organizations in
Uganda
The first hypothesis stated, “Influence has a significant effect on employee retention”. Influence
was conceptualized as supervisor-employee relations and co-worker relations. Spearman
correlation index indicated a weak negative and insignificant correlation between influence and
employee. The findings are supported by Gebremedhin (1999), who argues that best performance
is realized when workers are motivated and working under appropriate work relations with both
supervisors and co-workers (as cited in Acayo, 2012). In addition, the findings were also in direct
agreement with Putman (2002), who stated that good work relationship between supervisors and
workers is a key factor in employee satisfaction (as cited in Kyohairwe, 2012), hence intentions
to stay working for an organization with favorable work place relationship increase.
According to Raabe and Beehr (2003), comment that good supervisor- employee relations and co-
worker relations can be very motivating and help to build feelings of confidence and satisfaction.
Co-worker effects on colleagues or peers can be strong and are affected through multiple means
(for example, peers can directly offer advice and information on how to accomplish goals, inform
each other of potential chances for advancement and socially reinforce good or bad behaviors.
Ontario (2004) stated that, the supervisor support is so essential to retention that it can be said that
employees leave bosses not jobs (as cited in Fatima, 2011).
Fatima (2011), agrees with Ontario that association between workers and the boss is a significant
factor that influences employee retention as supervisors are the “human face” of the organizations.
Positive supervisor-employee workplace relationships increase organizational success by
82
decreasing cost related to employee retention. If bosses are supportive, encouraging and let
employees learn from mistakes, the employees feel a sense of pride in their jobs. Fatima (2011),
further argues that better work relations enhances employee retention hence good work relations
can be part of a comprehensive retention improvement strategy. In addition, it was established that
work relations were good in Disabled People’s Organizations. This explains therefore, that strong
work relations among employees and with their supervisors, contributed to retention of staff in
Disabled People’s Organizations in Uganda.
5.3.2 Effect of Power on Employee Retention in Disabled People’s Organizations in
Uganda.
The second hypothesis stated, “Power has a significant effect on employee retention”. Types of
Power studied in this hypothesis included; coercive, reward, legitimate, referent and expert power.
Spearman correlation index indicated an insignificant positive correlation between Power and
employee retention. This implied employee retention in Disabled People’s Organizations was not
hindered by power.
Findings of this study support other findings that also established that negative power such as
coercive, reward and legitimate power, contribute to low retention while positive power like
referent and expert contribute to high employee retention. Zeiger (2013), for example, established
that when leaders in an organization do not have the respect of the employees under them, they
use negative power. This type of leader forces employees to perform by threatening them with job
loss and other punishments or shows favoritism to certain employees rather than recognizing the
83
hard work of multiple employees. Not only does the quality of work produced decrease under this
type of power, but it leads to higher turnover rates in an organization.
Similarly, Rashid and Zhao (2009), established that fairness of rewards has very little impact on
retention likelihood but instead it is far more important to actively involve employees in
organisational activities, offering compenasation and rewards to employees.
In this study, coercive power significantly affected employee retention while reward, legitimate,
referent and expert power did not. The findings of this study revealed that coercive power had a
significant effect (r=.525**, P=.002<0.01) on employee retention in Disabled people’s
Organizations. This study finding, is therefore in support with Turner (2013), who emphasized that
coercion reduces employees' satisfaction with their jobs, leading to lack of commitment and
general employee withdrawal. Dissatisfaction with coercive power in this study was found to
contribute to low employee retention. In agreement, Lunenburg (2012), cited that although
coercive power may lead to temporary compliance by subordinates, it produces the undesirable
side effects of frustration, fear, revenge, and alienation. This in turn may lead to poor performance,
dissatisfaction, and turnover.
However, the findings of this study differed with other studies and authorities, which indicated
that power significantly affects employee retention. For example, findings of this study did not
support Ogunleye and Aluko (2012), who in their study, “Influence of Leaders’ perceived Source
on Nigeria Subordinate Employees’ Commitment and Work Attitude”, found that leaders
perceived power source significantly influence employees’ organizational commitment and work
attitude among Nigerian workers hence the desire to continue working for their organizations.
84
Furtherstill, Ogunleye and Aluko (2012), found that referent and expert power did not have
significant effect on employees’ commitment whereas reward power, coercive power and
legitimate power influenced commitment. Yet the findings of this research showed that only
coercive power had a significant effect on employee retention.
5.4 Conclusions
Basing on the study findings, a number of conclusions were made;
5.4.1 Influence and Employee Retention in Disabled People’s Organizations in Uganda
The findings of this study showed that influence played an important role in enhancing employee
retention in Disabled People’s Organization. According to the findings, work relations in Disabled
people’s organizations did not have a significant effect on employee retention and according to the
findings were generally good among the employees but were weak among board members and
their employees. Hence the need for Disabled People’s Organizations to maintain the existing good
work relations among staff and boost the relation between employees and the governing board of
these organizations.
5.4.2 Power and Employee Retention in Disabled People’s Organizations in Uganda
The findings of this study showed that power did not have a significant effect on employee
retention in Disabled People’s Organizations in Uganda. However, coercive power was the only
type of power that significantly affected employee retention while reward, legitimate, referent and
expert power did not influence employee retention that much. Thus these findings are in line with
85
the theory on power by French and Raven in chapter two that power is conferred by the control of
resources that are desired by others and the use of force ensures compliance based on fear which
in the long run results in dysfunctional behavior. However, factors that were highlighted as
contributing to low employee retention in Disabled People’s Organization included; low pay,
dependency on donor support and having a project based structure characterized with short term
contracts which are non-renewable. These factors have continuously contributed to labor turnover
in DPOs. This therefore implies that employees in DPOs have become accustomed to the existing
politics in their organizations as a result they have developed ways of dealing with it and hence
donot consider politics as a contributory factor to low employee retention.
5.5 RECOMMENDATIONS
In light of the foregoing conclusions, several recommendations were made.
5.5.1 Influence and Employee Retention in Disabled People’s Organizations in Uganda
The management of Disabled People’s Organizations should encourage friendly interactions
between Board members of the organizations and staff as a strategy towards improving the work
relation between the governing board and employees because good work relations is a motivating
factor which enhances employee retention.
Board members should trust the management team that they recruited to manage their
organizations because those in management have the knowledge, skill and experience to do their
job. As well as promote systematic and effective communication between staff and senior
management which will promote a better work place and team work.
86
5.5.2 Power and Employee Retention in Disabled People’s Organizations in Uganda
Leaders of Disabled People’s Organizations should use their power to develop better fundraising
strategies aimed at raising more funds for the organizations to improve salaries and wages.
Fundraising will also enable the organization become more sustainable and reduce donor
dependency. DPOs should also resort to having a programme based structure rather than a project
base. This will enable these organizations to run long term activities and offer long term work
contracts which will boost the impact of their work as well as staff commitment to the
organizations thus will enhance employee retention in Disabled People’s Organizations.
5.6 Area for Further Research
Although the study was primarily based on organizational politics and Employee retention many
other variables such as leadership styles, motivation, recruitment and selection that affect
employee retention need to be researched on by future researchers. A similar research in the same
organizations targeting the board as one of the respondents could be done so as to forge a way
forward to improve employee retention in Disabled People’s Organizations because the board
seems to be highly involved in the overall management of these organizations.
87
REFERENCE
(2009). Annual Report . Kampala: DWNRO.
Acayo, E. (2012). Factors Affecting Employee Retention in Telecommunication Service Sector in Uganda;
A case of MTN Uganda. Kampala: Uganda Management Institute.
ADD. (2009). The Journey of Action on Disability and Development (ADD) in Uganda. Kampala: ADD.
Ahuja, R. (2005). Research Methodology. New Deli: Rawat Publications.
Amin, E. (2005). Social Science research: Concept, Methodology & Analysis. Kampala: Makerere
University.
Armstrong , M. (2009). Human Resource Management Practices, . London: Kogan Page.
Barifaijo, M. K., Basheka, B., & Oonyo, J. (2010). How to Write a Good Dissertation/Thesis. Kampala:
The New Vision.
Campbell, & Derrick, L. (2013). Relationships: The key to Organisational Success. Retrieved March 26th,
2013, from Evancarmicheal.com: www.evancarmichael.com/productivity/3234/Relationships-
The-Key-to-organisational -success.html
Corpuz, R. R. (2002). Power, Politics and Influence. Fundamentals of Organisational Behavior, 1-16.
Creswell, J. W. (2003). Design Qualitative, Quantitative and Mixed Approach (2nd ed ed.). Sage
Publications.
88
Curtis, S. (2003). Industrial and Commerical Training. Industrial and commercial Training ; Emerald
Articles, 293-297.
Daft, R. L. (2007). Organisational Theory and Design. South Western Educational Publishing.
Drake International. (n/d). Employee Retention:Reducing recruitment by increasing retention. Retrieved
April 24, 2013, from Drake International.com: www.drakeint.co.uk/Publication/Employee-
Retention.pdf
Drory , A., & Romm, T. (1990). Organisational Behavior. Human Relations, 1133-58.
Drory , A., & vigoda-Gadot, E. (2009). Organisational Politics and Human Resource Management: A
typology and the Israeli Experience. Human Resource Management review, 194-202.
Elliott, J. R., & Smith, R. A. (2004, n/m n/d). Race, Gender and workplace Power. Americian Sociological
Review, pp. 365-386.
Fatima, H. (2011). Does Employee Retention Affect Organisational Competence. Industrial engineering
Letters, 24-40.
Ferris, G. R., & Kacmar, J. M. (1992). Perception of organisational Politics. Journal of Management, 93-
116.
Ferris, L. (1996). How Abusive Supervisors impact on Employe Relations. Retrieved April 25th, 2013,
from Smeal PSU.edu: research.smeal.psu.ed/news/how-abusive-supervisor-impact-on-employee-
relation
Kabuye, J. (2012, August 20). Deal with Office Politics. The New Vision, p. 45.
Kyohairwe, M. (2012). Organisational Factors and Employee Retention in Uganda: A case of National
Forest Authority. Uganda Management Institute: Kampala.
89
Ledbrook, L. (2012, April 19). The Different Types of Power in Management and How to use Them.
Retrieved March 24, 2013, from Project Community: projectcommunityonline.com/the-different-
types-of-power-in-management-and-how-to-use-them.ht
Lunenburg, F. C. (2012). Power and Leadership. International Journal of Management, Buisness and
Administration, 15(1), 1-9.
Neuman, L. W. (2011). Social Research methods: Quantitaive and Qualitative approaches (6th ed.).
Boston: Pearson Education Inc.
NUDIPU. (2007). Human Resource Management Manual for NUDIPU. Kampala: NUDIPU.
NUDIPU. (2007). NUDIPU Strategic Plan 2008-2013. Kampala: NUDIPU.
NUDIPU. (2011). NUDIPU Evaluation REPORT. KAMPALA: NUDIPU.
Ogunleye, A. A., & Aluko, A. M. (2012, June 10). Influence of Leaders' percieved Power Source on
Nigeria Surbodinate Employees' Committment and Work Attitude. Global Journal of Human
Social Science, Arts and Humanities, 12(9), 31-37.
Pfeffer, J. (1992). managing with Power: Politics & Influence in Organisations. Hardcover: Harvard
Business School Press.
Quick, J. C., & Nelson, D. L. (2009). Principles of Organisational Behavior; Realities and challenges
(6th ed.). USA: South- Western Cengagae Learning.
Raabe, B., & Beehr, T. A. (2003). Formal Mentoring Versus Supervisor Coworker relationship:
Difference in Perception and Impact. Journal of Organisational Behavior, 24, 271-293.
Rahim, M. A., Antonioni, D., Krumov, K., & Ilieva, S. (2000). Power, Conflict and Effectivness: A cross-
Cultural Study in Unites States and Bulgaria. European Psychologist, 28-33.
Ram, P., & Prabhakar, G. V. (2010). Leadership Styles and Pereceived Organisational Politics as
Predicators of Work. European Journal of Social Science, 40-55.
90
Ramjee, P. (2013). The impact of Workplace relationship to employee satisfaction. Retrieved April 25,
2013, from smallbusibess chron.com: smallbusiness.chron.com/impact-workplace-relation-
employee-satisfaction-20306.html
Rashid, H., & Zhao, L. (2009). Power of Involvement Over Rewards for Retention Liklihood in IT
professionals. World Science of Engineering and Technology, 818-823.
Raven, B. H. (2008). The bases of power and power/interaction Model of Interpersonal influence.
Analyses of Social issues and public policy, 1-22.
Robbins, S. P. (2003). Organisational Behavior. New Delhi: Prentice.
Robbins, S. P. (2009). Organisational Behavior. New Delhi: Prentice.
Samuel, M. O., & Chipunza, C. (2009, September). Employee Retention and Turnover: Using
Motivational Variables as a Panacea. African Journal of Business Management, 8(3), 410-415.
Sinha, C. (2012). factors Affecting Employee Retention: A comparative Analysis of two organisations
from Heavy engeering Industry. European Journal of Business and Management, 145-163.
Sowmya , K. R., & Panachanatham, N. (2011). Job Burn out: An outcome of Organisational Politics in
Banking Sector. Far East Journay Of Psychology and Business, 49-58.
Stichman, A. J. (2002). The Sources and Impact of Inmate Perceptions of correctional Officers' Bases of
Power. University of Cincinnati.
Turner, J. C. (2005). Explaining the nature of power : A three Process theory. European Journal of Social
Psychology, 1-22.
Turner, M. C. (2013). Leadership Styles and Bases of Power. Retrieved August 09th, 2013, from
Reference for Business: www.referenceforbusines.com/management/Int-Loc/Leadershi-Styles-
Bases-of-Power.html

91
UKessays. (2013). Study of Power and Politics in the Workplace management Essay. Retrieved April
24th, 2013, from UK Essays: www.ukessays.com
Vigoda, E. (2000). Organisational politics, Job Attitudes and Work Outcomes: Exploration and
Implications for Public Sector. Far East Journal of Psychological and Business, 326-347.
Vigoda, E. (2003). Developments in Organsiational Politics. Cheltenham: MPG Books Ltd.
Vredenburgh, D., & Fossen, R. S. (2010). Human Nature, Organisational Politics and Human Resource
Development. Human Resource Development review, 26-47.
wikipedia. (2013). Interperson relationship. Retrieved April 24th, 2012, from Wikipedia:
en.wikepedia.org/wiki/interpersonal-relationship
wikipedia. (2013, March 13th). Work Place Politics. Retrieved March 24, 2013, from wikipedia.org:
en.wikipedia.org/wik/workplace_politics
Ya-anan, M., & Bunchapattansukda, C. (2011). Leaders' Vision to Retaiing Employees to Owrk for
Nongovernmental(NGOS) in Thailand. International Conference on Finance Management and
Economics, 109-113.
Yared, D. (2007). Staff Turnover in International Non Governmental Organsiations: A case of
International rescue Committee. Adidis Ababa: Adidis Ababa University.
Zeiger, S. (2013). Chron. Retrieved August 08th , 2013, from small business.com:
www.smallbusiness.chron.com/inpact_power-politics-organisational-productivity35942.html
92
APPENDENCES
APPENDIX 1: QUESTIONAIRE FOR RESPONDENTS***
EFFECTS OF ORGANISATIONAL POLITICS ON EMPLOYEE RETENTION IN
SELECTED DISABLED PEOPLE’S ORGANISATIONS
Introduction
I am Juliet Namagulu a student of Uganda Management Institute pursuing a Masters degree in
management Studies at Uganda Management Institute.
The purpose of this questionnaire is exclusively for academic purposes as a requirement for
Masters in Management Studies. Its administered to assess your views on the effect of
organizational politics on employee retention based on your working condition and experience
related with your profession, relation with your supervisors and fellow workmates and in general
your observation about your current work place. I assure you that all your responses will be kept
in absolute confidentiality and you will not be held responsible for the research outcome.
Therefore your genuine, frank and timely responses are vital to determine the success of this study.
I kindly request you to fill in this questionnaire honestly.
NB: No need of writing your name
93
SECTION A: Personal Profile
1. Total years of experience
a) 1-5 years
b) 6-10 years
c) 11-15 years
d) 16+ years
3. Number of Years in the current organization
a) 1-3 years
b) 4-6 years
c) 7-9years
d) 10+ years
4. Name of Section / Department: ……………………………………………………………….
5. Educational Level:
a) PHD: b) Masters: c) Bachelors: d) Diploma: e) Certificate:
6. Gender:
a) Male b) Female
7. Terms of employment:
a) Permanent b) contract c) Temporary
SECTION B: INDEPENDENT VARIABLES (Organizational Politics and Power)
From question 1-34, tick (√) on the scales of 1-5 how strongly you agree or strongly disagree with
the statements given.
1 2 3 4 5
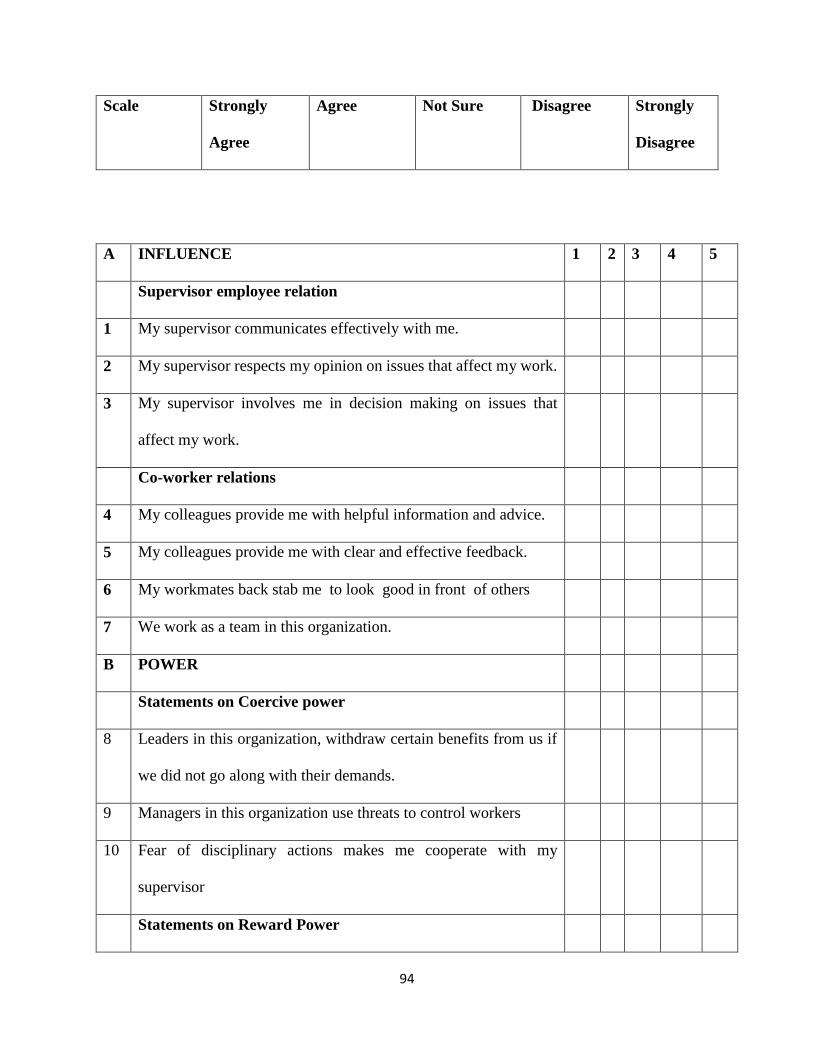
94
Scale Strongly
Agree
Agree Not Sure Disagree Strongly
Disagree
A INFLUENCE 1 2 3 4 5
Supervisor employee relation
1 My supervisor communicates effectively with me.
2 My supervisor respects my opinion on issues that affect my work.
3 My supervisor involves me in decision making on issues that
affect my work.
Co-worker relations
4 My colleagues provide me with helpful information and advice.
5 My colleagues provide me with clear and effective feedback.
6 My workmates back stab me to look good in front of others
7 We work as a team in this organization.
B POWER
Statements on Coercive power
8 Leaders in this organization, withdraw certain benefits from us if
we did not go along with their demands.
9 Managers in this organization use threats to control workers
10 Fear of disciplinary actions makes me cooperate with my
supervisor
Statements on Reward Power
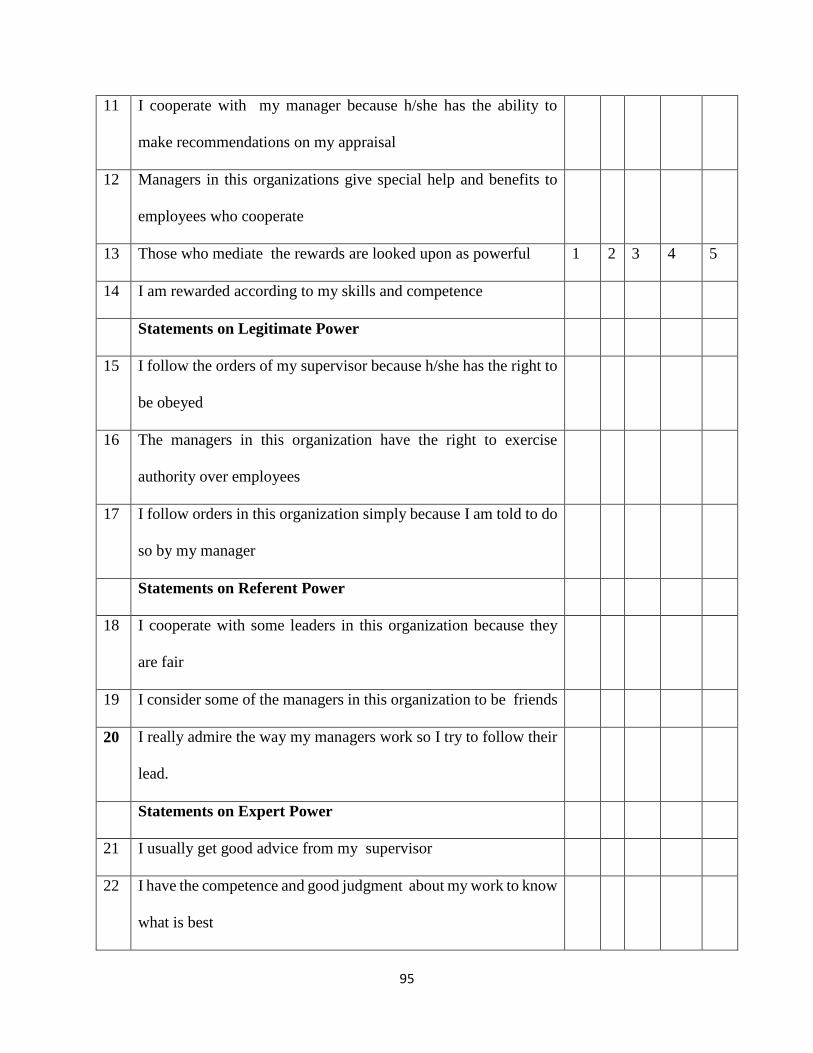
95
11 I cooperate with my manager because h/she has the ability to
make recommendations on my appraisal
12 Managers in this organizations give special help and benefits to
employees who cooperate
13 Those who mediate the rewards are looked upon as powerful 1 2 3 4 5
14 I am rewarded according to my skills and competence
Statements on Legitimate Power
15 I follow the orders of my supervisor because h/she has the right to
be obeyed
16 The managers in this organization have the right to exercise
authority over employees
17 I follow orders in this organization simply because I am told to do
so by my manager
Statements on Referent Power
18 I cooperate with some leaders in this organization because they
are fair
19 I consider some of the managers in this organization to be friends
20 I really admire the way my managers work so I try to follow their
lead.
Statements on Expert Power
21 I usually get good advice from my supervisor
22 I have the competence and good judgment about my work to know
what is best
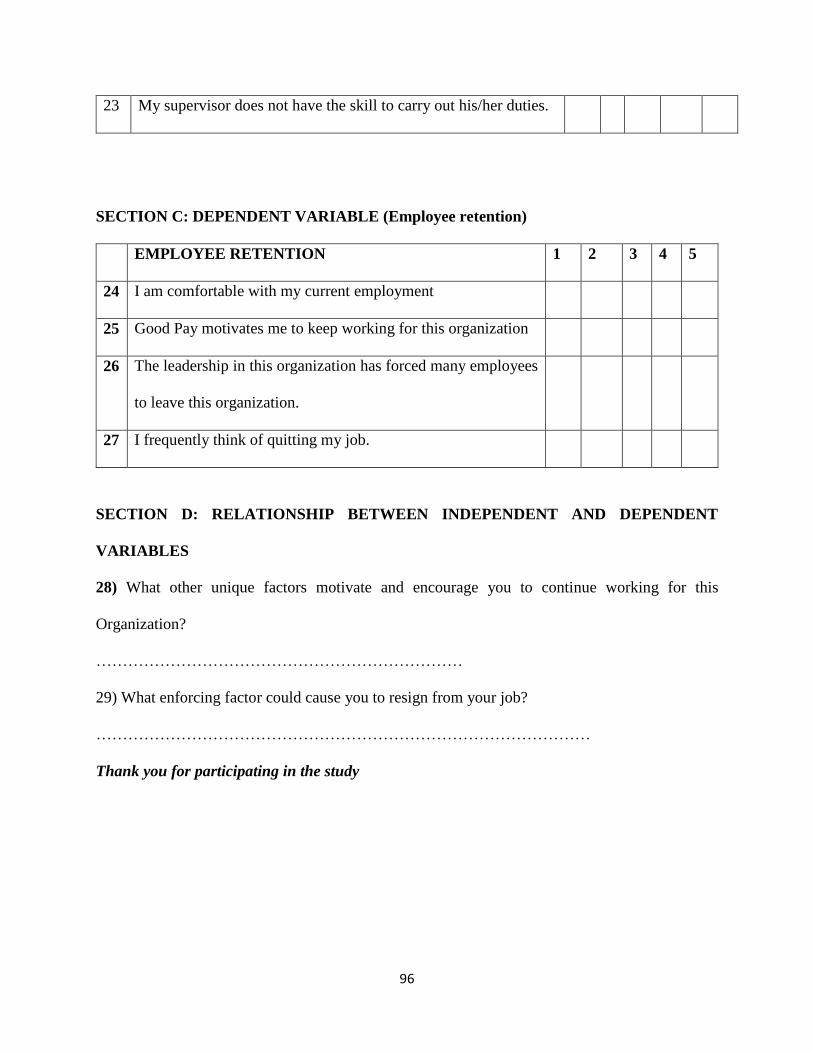
96
23 My supervisor does not have the skill to carry out his/her duties.
SECTION C: DEPENDENT VARIABLE (Employee retention)
EMPLOYEE RETENTION 1 2 3 4 5
24 I am comfortable with my current employment
25 Good Pay motivates me to keep working for this organization
26 The leadership in this organization has forced many employees
to leave this organization.
27 I frequently think of quitting my job.
SECTION D: RELATIONSHIP BETWEEN INDEPENDENT AND DEPENDENT
VARIABLES
28) What other unique factors motivate and encourage you to continue working for this
Organization?
……………………………………………………………
29) What enforcing factor could cause you to resign from your job?
…………………………………………………………………………………
Thank you for participating in the study

i
APPENDIX II
INTERVIEW GUIDE FOR TOP MANAGERS
1. Position held:……………………………………………
2. How long have you been working with this organization?.................................................
3. How long have you been in top management?................................................................
4. Were you promoted to this current job?.................................................
5. In your opinion what are the causes of labour turnover in your organization?
………………………………. …………………………….. ………………………………….
6. How does organizational politics affect employee retention in your organization?
……………………………………………………………………………………..
………………………………………………………………………………………..
7. Is there a struggle for power among your employees? If yes please elaborate
……………………………………………………………………………………….
……………………………………………………………………………………….
8. As a supervisor are you open to criticism and disagreement from your subordinates? Elaborate
please.
…………………………………………………………………………………………….
……………………………………………………………………………………………..
9. How would you describe your relationship with the people who are under your supervision?
………………………………………………………………………………………………………
………………………………………………………………………………………
10. Are employees encouraged to speak out critically when they are critical of well-established ideas?
………………………………………………………………………………...
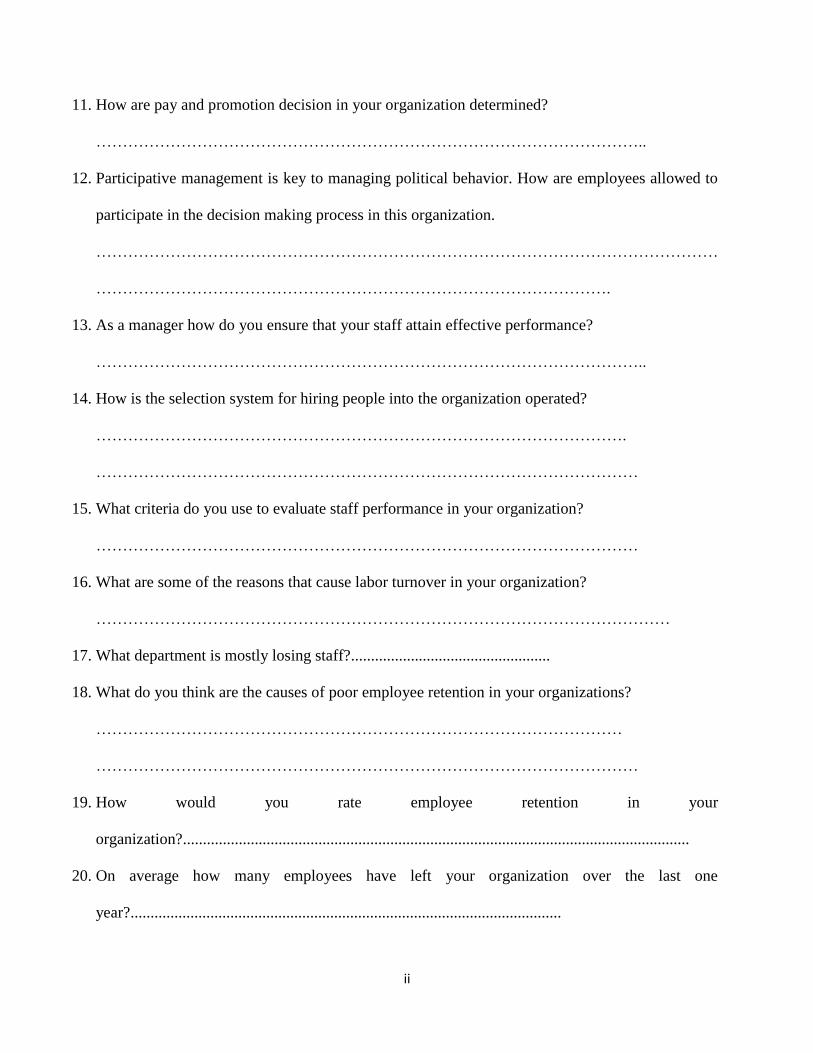
ii
11. How are pay and promotion decision in your organization determined?
…………………………………………………………………………………………..
12. Participative management is key to managing political behavior. How are employees allowed to
participate in the decision making process in this organization.
………………………………………………………………………………………………………
…………………………………………………………………………………….
13. As a manager how do you ensure that your staff attain effective performance?
…………………………………………………………………………………………..
14. How is the selection system for hiring people into the organization operated?
……………………………………………………………………………………….
…………………………………………………………………………………………
15. What criteria do you use to evaluate staff performance in your organization?
…………………………………………………………………………………………
16. What are some of the reasons that cause labor turnover in your organization?
………………………………………………………………………………………………
17. What department is mostly losing staff?..................................................
18. What do you think are the causes of poor employee retention in your organizations?
………………………………………………………………………………………
…………………………………………………………………………………………
19. How would you rate employee retention in your
organization?...............................................................................................................................
20. On average how many employees have left your organization over the last one
year?............................................................................................................
iii
21. What steps (if any) is management taking to retain employees in your organization?
………………………………………………………………………………………………………
………………………………………………………………………………………………………
Thank you for participating
APPENDIX III
INTERVIEW GUIDE FOR FORMER EMPLOYEES
iv
The purpose of this Interview is exclusively for academic purposes as a requirement for MMS. Its
administered to assess your views on the effect of organizational politics on employee retention
based on your working condition and experience related with your profession, relation with your
supervisors and fellow workmates and in general your observation about your previous work place.
I assure that all your responses will be kept in absolute confidentiality and you will not be held
responsible for the research outcome.
Therefore your genuine, frank and timely responses are vital to determine the success of this study,
so I kindly request you to fill in this questionnaire honestly.
NB: No need of writing your name
A) Background
i. Current job……………………
ii. Work experience.
a) 1-3 years
b) 4-6years
c) 7-9 years
d) 10+ years
iii. Period you worked at your former work place
a. 1-3 years
b. 4-6years
c. 7-9 years
d. 10+ years
iv. Department you were attached
v. Position held
v
vi. Terms of Employment
Section B: Power, Influence and Retention
1. In your opinion what were the causes of labour turnover in your organization?
2. Do you think organizational politics affected employee retention in your organization?
3. Where your former managers open to criticism and disagreement?. If no why?
4. Where employees stabbing each other to look good in the face of their employers?
5. In your former workplace, where the pay and promotion decisions applied politically or they were
applied based on the policies in place?
6. To what extent did you have the opportunity to take part in making job related decisions that affect
you?
7. Where the actions of your supervisor in your former work place (e.g. communicating, giving
feedback etc) appear to be directed at helping others yet in the actual sense it was meant to protect
himself or herself?
8. Did the performance appraisals/ratings people received from their supervisors reflect more of the
supervisor’s agenda (e.g. likes and dislikes, giving high or low rates in make themselves look good
etc) than the actual performance of the employees?
9. What were your expectations when you joined a disabled people’s Organization? Tick any one
below
a) High pay and better facilitation
b) Career progression and personal development
c) Good human resource policies
d) Others:……………………………………

vi
10. Describe your work environment between you and your supervisor.
11. Did you ever work under a lot of tension?
12. How was your working relation between you and your colleagues?
13. What prompted you to leave your former work place?
14. How would you rate employee retention at your former work place?
15. What do you think were the causes of poor employee retention in your previous work place?
16. What is your advise on how best to ensure employee retention in this organization?
Thank you for participating.
APPENDIX IV
PRE-TEST QUESTIONAIRE FOR RESPONDENTS
vii
ORGANISATIONAL POLITICS AND EMPLOYEE RETENTION IN SELECTED
DISABLED PEOPLE’S ORGANISATIONS
Introduction
I am a student of Uganda Management Institute pursuing a Masters degree in management Studies
at Uganda Management Institute.
The purpose of this questionnaire is exclusively for academic purposes as a requirement for
Masters in Management Studies. Its administered to assess your views on the effect of
organizational politics on employee retention based on your working condition and experience
related with your profession, relation with your supervisors and fellow workmates and in general
your observation about your current work place. I assure you that all your responses will be kept
in absolute confidentiality and you will not be held responsible for the research outcome.
Therefore your genuine, frank and timely responses are vital to determine the success of this study.
I kindly request you to fill in this questionnaire honestly and responsibly.
NB: No need of writing your name
SECTION A: Personal Profile
1. Position Held: …………………………
2. Total years of experience
e) 1-3 years
f) 4-6years
g) 7-9 years
h) 10+ years
3. Number of Years in the current organization

viii
a) 1-5 years
b) 6-10years
c) 11-15years
d) 16+ years
4. Name of Section / Department: ……………………………………………………………….
5. Educational Level:
a) PHD: b) Masters: c) Bachelors: d) Diploma: e) Certificate:
6. Gender:
a) Male b) Female
7. Terms of employment:
) Permanent b) contract c) Temporary
SECTION B: INDEPENDENT VARIABLE
INDIVIDUAL ATTRIBUTES
From question 1-37, tick (√) on the scales of 1-5 how strongly you agree or strongly disagree with
the statements given.
Scale
1 2 3 4 5
Strongly
Agree
Agree Not Sure Disagree Strongly
Disagree
ix
5 4 3 2 1
A POWER
Coercive power
1 If my boss tells me to do something that I think is wrong, I do it
anyway, telling myself he or she is the “boss”
2 Our supervisors do what is best for them and not the organization
3 It seems that individuals who are able to come through in times
of crisis or uncertainty are the ones who get a head in this
organization
4 Some people in this organization deliberately distort information
requested by others for purposes of personal gain either by
distorting it or selectively reporting it
5 There is a group of people in my department who always get things
their way because no one wants to challenge them.
Reward Power
6 My supervisor rewards performance when his/her expectations are
fulfilled.
7 Rewards come only to those who work hard in this organization
8 My supervisor provides rewards and sanctions for worthwhile
contribution of subordinates
9 When it comes to pay rise and promotion decisions, policies are
irrelevant
x
10 I have ample opportunity of growth in my organization
11 Favoritism rather than merit determines who gets a head around
here
Legitimate power
12 Sometimes it’s easier to remain quiet than to fight the system
13 My supervisor goes out of his way to help subordinates
14 My supervisor pursues the goal of the organization with a single
minded devotion.
Referent Power
15 People who voice their opinion seem to do better than those who
don’t
16 My supervisor speaks enthusiastically about our goals as a team
17 My supervisor goes beyond self-interest for the good of the
organization
18 My supervisor protects his subordinates from external criticism
Expert Power
19 There is no room for yes men good ideas are desired even if it
means disagreeing with supervisors
20 My supervisor coaches and counsels subordinates whenever
required
B INFLUENCE
Supervisor employee relation
21 My Supervisor is not present when he/she is needed
xi
22 Employees are encouraged to speak out frankly even when they
are critical of well-established ideas
23 I confide in my supervisors without fear that they will misuse the
trust
24 There is respect for workers from top management
25 Employee appraisals are affected by the employees ability to
inspire enthusiasm in the supervisors who appraise them in
performance
Co-worker relations
26 Telling others what they want to her is sometimes better than
telling the truth
27 As long as the actions of others do not directly affect me I do not
care what they do.
28 Agreeing with powerful employees is the best alternative at this
organization.
29 Employees are back stabbing each other to look good in front of
others
30 There are cliques in this organization which hinder effectiveness
in performance
31 People in this organization build themselves by tearing others
down
32 We work as a team in this organization.
EMPLOYEE RETENTION
xii
33 I Feel I am part of this organization and ready to continue working
with it.
34 I prefer continuing to work for this organization because of the
good pay and benefits that I receive
35 The leadership in this organization has forced many employees to
leave this organization
36 I plan to look for another job because I see no opportunity for me
to grow in this organization
DEPENDENT VARIABLE
37) Why have you preferred to continue working for this Organization? Tick the appropriate option
a) Good pay?
b) Competitive salary and benefits?
c) Hope for a promotion?
d) Have not yet got a better job?
e) Good work relations with my workmates
f) Satisfied with my work environment
g) Others specify. ……………………………………………………………
38) Why do employees leave this organization?,,,,,,,,,,,,,,,,,,,,,,,,,,,,,,,,,,,,,,,,,,,,,,,,,,,,,,,,,,,,,,,,,,,
39) What are the effects of employee turnover on this organization?
………………………………………………………………………………………….
40) What enforcing factor could cause you to resign from your job?
a) Leadership problems
xiii
b) Due to family
c) Follow my career path
d) Job Security
e) Dissatisfaction with the job
f) Better opportunity in other organization
g) Others, please specify:
…………………………………………………………………………………
41) Are there any retention policies in this organization?
42) In your view how can employees be retained in your organization.
…………………………………………………………………………………
Thank you for participating in the study
APPENDIX V
MORGAN & KREJCIE (1970) TABLE
Table for Determining Sample Size from a Given Population
N S N S N S
10 10 220 140 1200 291

xiv
15 14 230 144 1300 291
20 19 240 148 1400 302
25 24 250 152 1500 306
30 28 260 155 1600 310
35 32 270 159 1700 313
40 36 280 162 1800 317
45 40 290 165 1900 320
50 44 300 169 2000 322
55 48 320 175 2200 327
60 52 340 181 2400 331
65 56 360 186 2600 335
70 59 380 191 2800 338
75 63 400 196 3000 341
80 66 420 201 3500 346
85 70 440 205 4000 351
90 73 460 210 4500 354
95 76 480 214 5000 357
100 80 500 217 6000 361
110 86 550 226 7000 364
120 92 600 234 8000 367
130 97 650 242 9000 368
140 103 700 248 10000 370
150 108 750 254 15000 375
160 113 800 260 20000 377
170 118 850 265 30000 379
180 123 900 269 40000 380
190 127 950 274 50000 381
200 132 1000 278 75000 382
210 136 1100 285 1000000 384
Note- N is Population Size
S is sample size

xv

16