Organic nitrogen deposition in precipitation in metropolitan Guangzhou city of southern China
11
Organic nitrogen deposition in precipitation in metropolitan Guangzhou city of southern China Jiong Li a , Yunting Fang a, b, ⁎, Muneoki Yoh c , Xuemei Wang d , Zhiyong Wu d , Yuanwen Kuang a , Dazhi Wen a, ⁎ a Key Laboratory of Vegetation Restoration and Management of Degraded Ecosystems, South China Botanical Garden, Chinese Academy of Sciences, Guangzhou 510650, China b State Key Laboratory of Forest and Soil Ecology, Institute of Applied Ecology, Chinese Academy of Sciences, Shenyang 110164, China c Tokyo University of Agriculture and Technology, Tokyo 183 8509, Japan d School of Environmental Science and Engineering, Sun Yat-Sen University, Guangzhou 501275, China article info abstract Article history: Received 13 October 2011 Received in revised form 27 April 2012 Accepted 30 April 2012 Organic nitrogen (N) has been shown to be an important component of atmospheric N deposition. However, its contribution to total N deposition and its sources have not been well investigated under severe air N pollution. We quantified dissolved inorganic and organic N deposition in bulk precipitation over two years in Guangzhou, a city suffering from long-term acid rain in southern China, and linked organic N to other atmospheric components to explore the potential sources. We found that dissolved organic N (DON) in precipitation contributed a considerable amount of N (8.1 and 8.4 kg N ha -1 yr -1 in 2008 and 2009, respectively) to total N deposition in the study city, although the percentage to total dissolved N (17–21%) was lower than often reported (approximately 30%). Including DON, precipitation N deposition in the study city reached 39–49 kg N ha -1 yr -1 , suggesting an important N source to natural ecosystems. We also found that DON concentration was positively correlated with both ammonium and nitrate concentra- tions, indicating their anthropogenic sources. The anthropogenic source of DON was further supported by close correlations of DON with precipitation non-sea-salt sulfate concentration and with air concentration of nitrogen and sulfur oxides. Our results suggest that atmospheric DON deposition may also be considerable in many other cities. © 2012 Elsevier B.V. All rights reserved. Keywords: Atmospheric deposition Organic N Inorganic N N pollution southern China 1. Introduction Elevated emissions into the atmosphere of reactive nitrogen (N) associated with human activities have dramatically in- creased atmospheric N deposition onto the Earth (Galloway et al., 2008). Increased N deposition can lead to N saturation of terrestrial ecosystems and eutrophication of aquatic systems (Vitousek et al., 1997; Aber et al., 1998; Gundersen et al., 1998). Ammonium (NH 4 + ) and nitrate (NO 3 - ) are the main N forms that are readily available for organisms to be incorporated into their bodies. In this context, most N budgets have focused on inorganic N (NH 4 + plus NO 3 - ). And NH 4 + and NO 3 - atmospheric deposition budgets have been studied extensively on local and regional scales. For example, a number of networks, including National Atmospheric Deposition Program, the European Cooperative Programme for Monitoring and Evaluation of Pollutants, the World Meteorological Organisation's Global Atmosphere Watch and Acid Deposition Monitoring Network in East Asia, have been designed to assess the long-range transportation of air pollutants and the effects on acid-sensitive terrestrial and aquatic ecosys- tems. As a result, the emission rates and chemistry of their gas- eous precursors have been reasonably well constrained. Atmospheric Research 113 (2012) 57–67 ⁎ Corresponding authors. Y. Fang is to be contacted at State Key Laboratory of Forest and Soil Ecology, Institute of Applied Ecology, Chinese Academy of Sciences, Shenyang 110164, China. Tel.: +86 24 83970541. D. Wen, Key Laboratory of Vegetation Restoration and Management of Degraded Ecosystems, South China Botanical Garden, Chinese Academy of Sciences, Guangzhou 510650, China. Tel.: +86 20 37082272; fax: +86 20 37252615. E-mail addresses: [email protected] (Y. Fang), [email protected] (D. Wen). 0169-8095/$ – see front matter © 2012 Elsevier B.V. All rights reserved. doi:10.1016/j.atmosres.2012.04.019 Contents lists available at SciVerse ScienceDirect Atmospheric Research journal homepage: www.elsevier.com/locate/atmos
-
Upload
independent -
Category
Documents
-
view
4 -
download
0
Transcript of Organic nitrogen deposition in precipitation in metropolitan Guangzhou city of southern China

Atmospheric Research 113 (2012) 57–67
Contents lists available at SciVerse ScienceDirect
Atmospheric Research
j ourna l homepage: www.e lsev ie r .com/ locate /atmos
Organic nitrogen deposition in precipitation in metropolitan Guangzhou cityof southern China
Jiong Li a, Yunting Fang a,b,⁎, Muneoki Yoh c, Xuemei Wang d, Zhiyong Wu d,Yuanwen Kuang a, Dazhi Wen a,⁎a Key Laboratory of Vegetation Restoration and Management of Degraded Ecosystems, South China Botanical Garden, Chinese Academy of Sciences,Guangzhou 510650, Chinab State Key Laboratory of Forest and Soil Ecology, Institute of Applied Ecology, Chinese Academy of Sciences, Shenyang 110164, Chinac Tokyo University of Agriculture and Technology, Tokyo 183 8509, Japand School of Environmental Science and Engineering, Sun Yat-Sen University, Guangzhou 501275, China
a r t i c l e i n f o
⁎ Corresponding authors. Y. Fang is to be contacted atForest and Soil Ecology, Institute of Applied EcologySciences, Shenyang 110164, China. Tel.: +86 24 83Laboratory of Vegetation Restoration andManagement oSouth China Botanical Garden, Chinese Academy of510650, China. Tel.: +86 20 37082272; fax: +86 20 372
E-mail addresses: [email protected] (Y. Fang), dzwe
0169-8095/$ – see front matter © 2012 Elsevier B.V. Adoi:10.1016/j.atmosres.2012.04.019
a b s t r a c t
Article history:Received 13 October 2011Received in revised form 27 April 2012Accepted 30 April 2012
Organic nitrogen (N) has been shown to be an important component of atmospheric Ndeposition.However, its contribution to total N deposition and its sources have not been well investigatedunder severe air N pollution. We quantified dissolved inorganic and organic N deposition in bulkprecipitation over two years in Guangzhou, a city suffering from long-term acid rain in southernChina, and linked organic N to other atmospheric components to explore the potential sources.We found that dissolved organic N (DON) in precipitation contributed a considerable amount of N(8.1 and 8.4 kg N ha−1 yr−1 in 2008 and 2009, respectively) to total N deposition in the studycity, although the percentage to total dissolved N (17–21%) was lower than often reported(approximately 30%). Including DON, precipitation N deposition in the study city reached39–49 kg N ha−1 yr−1, suggesting an important N source to natural ecosystems. We also foundthat DON concentration was positively correlated with both ammonium and nitrate concentra-tions, indicating their anthropogenic sources. The anthropogenic source of DON was furthersupported by close correlations of DONwith precipitation non-sea-salt sulfate concentration andwith air concentration of nitrogen and sulfur oxides. Our results suggest that atmospheric DONdeposition may also be considerable in many other cities.
© 2012 Elsevier B.V. All rights reserved.
Keywords:Atmospheric depositionOrganic NInorganic NN pollutionsouthern China
1. Introduction
Elevated emissions into the atmosphere of reactive nitrogen(N) associated with human activities have dramatically in-creased atmospheric N deposition onto the Earth (Galloway etal., 2008). Increased N deposition can lead to N saturation ofterrestrial ecosystems and eutrophication of aquatic systems
State Key Laboratory of, Chinese Academy of970541. D. Wen, Keyf Degraded Ecosystems,Sciences, [email protected] (D.Wen).
ll rights reserved.
(Vitousek et al., 1997; Aber et al., 1998; Gundersen et al., 1998).Ammonium (NH4
+) and nitrate (NO3−) are themainN forms that
are readily available for organisms to be incorporated into theirbodies. In this context,mostNbudgets have focused on inorganicN (NH4
+ plus NO3−). And NH4
+ and NO3− atmospheric deposition
budgets have been studied extensively on local and regionalscales. For example, a number of networks, including NationalAtmospheric Deposition Program, the European CooperativeProgramme for Monitoring and Evaluation of Pollutants, theWorld Meteorological Organisation's Global Atmosphere Watchand Acid DepositionMonitoring Network in East Asia, have beendesigned to assess the long-range transportation of air pollutantsand the effects on acid-sensitive terrestrial and aquatic ecosys-tems. As a result, the emission rates and chemistry of their gas-eous precursors have been reasonably well constrained.

58 J. Li et al. / Atmospheric Research 113 (2012) 57–67
The relative importance of organic N species in N cycling hasnow been recognized (Cape et al., 2011; Cornell, 2011). And it isclear that organic N is a ubiquitous component in atmosphericdry andwet deposition,making up 11 to 56% of total dissolved N(TDN) in all regions of the world where they have been mea-sured (Cornell et al., 2003; Cape et al., 2004, 2011; Cornell, 2011).Atmospheric organic N probably comprises a wide range ofcompounds from volatile gases to aerosols (Cape et al., 2011).The growingdatabase ofmarine rainwater and aerosols indicatesthat the organic N found in the remote atmosphere originatesfrom significant land-based and anthropogenic sources (Russellet al., 1998; Cornell et al., 2001).
Many studies have been conducted to quantify the fluxesof dissolved organic N (DON) and its contribution to total Ndeposition through both dry and wet forms (Jassby et al.,1994; Russell et al., 1998; Cornell et al., 2003; Cape et al.,2004; Neff et al., 2002; Ham and Tamiya, 2006), but studiesfrom China are still comparatively few. A recent survey onDON fluxes in precipitation at 15 sites during 2005 and 2006(Zhang et al., 2008) reported that DON deposition averaged8.6 kg N ha−1 yr−1, much higher than the average deposi-tion in other regions of the world. High DON deposition acrossChina was further confirmed by a later survey over 32 sites(Zhang et al., 2012). These results reflected the very high total Ndeposition in these study areas, with DON making a similarmean contribution to TDN as reported in the literature. As inthat survey all sites were located in suburban farmland or re-mote areas (Zhang et al., 2008, 2012), the flux and contributionof DON in precipitation remain poorly quantified under urbanconditions with complex pollutions in China (Yang et al., 2010).
Currently, in China there are 494 cities (counties) undermonitoring for acid rain (Ministry of Environmental Protection,2010). In this monitoring network, major cations and anionsincluding NH4
+ and NO3− have been routinely measured, but
DON concentration has rarely been addressed (Yang et al.,2010). It is necessary to assess the contribution of DON underdifferent environments. Excluding DONwill underestimate the
Fig. 1. Location of sampling site in Guangzhou city, southern Chi
overall N deposition budget. This is a particular problem in theseverely polluted regions with rapid urbanization and indus-trialization, like the Pearl River Delta (PRD) of southern China.
In the PRD, long-term acid deposition and severe air pollut-ion have been reported due to rapid economic growth (Xu et al.,2001; Wang et al., 2005, 2007, 2009; Cao et al., 2009; Huang etal., 2009, 2010; Zheng et al., 2009; Fang et al., 2011a). In thisstudy, we quantified dissolved inorganic and organic N depo-sition in bulk precipitation in the Guangzhou city, the biggestcity of the PRD and characterized the sources of DON usingcorrelation analysis with other ion components (e.g., nss-Ca2+
and nss-SO42−) and with major air pollutants (SO2, NO2, O3 and
PM10). In addition, we examined the influence of air masstransportation on precipitationN composition byusing air-massbackward trajectories. The outcomes of our investigation maybe of value to planners and decision-makers in their attempts tocurb N emissions to the atmosphere, and to evaluate the effectsof consequent N deposition on ecosystems within the studyregion.
2. Methods
2.1. Site description
This study was carried out in Guangzhou city (23° 16′ N,113° 23′ E), which is in the central region of the Pearl RiverDelta of southern China (Fig. 1). The PRD covers an area of2.4×104 km2, with a population of 42.8 million as of 2010(Guangdong Provincial Statistical Bureau, 2011). It has expe-rienced rapid industrialization and subsequent environmentalchanges since 1978,when the Chinese Economic Reform Policystarted. The climate is characterized by a subtropical monsoonclimate with southwest prevailing wind in summer andnorth wind in winter. The mean annual temperature is 22 °Cand ranges from 13 °C in January (midwinter) to 28 °C in July(midsummer). The annual precipitation fluctuates between1500 and 1800 mm, of which about 80% falls in the wet
na. The maps were derived from http://maps.google.com/.

59J. Li et al. / Atmospheric Research 113 (2012) 57–67
season from April to September (Editorial Committee ofForests of Guangdong, 2005).
2.2. Sampling
From 2008 to 2009, bulk precipitation was collected onthe roof of a five-storey building in the South China BotanicalGarden on a daily basis (Fig. 1; Fang et al., 2011a). There wereno buildings or big trees higher than our sampling buildingwithin 500 m. In a fewmonths inwinter, the prolonged droughtmeant that no viable precipitation samples were collected foranalysis, owing to the very tiny precipitation volumes obtained.This might have resulted in a slight underestimation of theannual precipitation N input (see the Results section). Precip-itation was collected with an open funnel (23 cm in diameter)connected to a 5 L sampling bottle via a black polypropylenetube. The collector was washed with distilled water immedi-ately after each collection. The precipitation collected waschecked carefully for visible evidence of contamination (e.g., bybirdwaste), and later by chemical analysis. No samples showedevidence of contamination during the study period. Sampleswere filtered within 24 h of collection through 0.45 μm glassfiber filters in the laboratory, and then were stored in plasticbottles at 4 °C until chemical analysis.
2.3. Chemical analyses
Ion chromatography (Dionex DX-120, Osaka, Japan) wasused to determine concentrations of inorganic N species(NH4
+, NO2−, and NO3
−) in all precipitation samples, since it issubject to less interference from organic materials such asamino compounds (Cape et al., 2001, 2011). In addition to Nspecies concentration, other major ions (F−, Cl−, SO4
2−, K+,Na+, Ca2+, and Mg2+) were simultaneously determined. Fanget al. (2011a) reported on NO3
− input in precipitation togetherwith stable nitrogen and oxygen isotopes of NO3
−, to reveal theN sources and formation pathways of NO3
− in the study city.In this study, precipitation samples were stored for about
half years before analysis. Since degradation and alternation ofDON in atmospheric samples could happen during storage,even under low temperature (Scudlark et al., 1998; Zhang andAnastasio, 2001), note that the delayed analysis might have ledto an underestimation of DON contribution and an overesti-mated DIN concentration.
Dissolved organic N in precipitation consists of a variety ofcompounds, for example, peptides and dissolved free aminoacids, urea, amines, aliphatic oxygenated N-containing com-pounds, and some aromatic (cyclic) compounds (Cape et al.,2011; Cornell, 2011;Ge et al., 2011). In this study,wedid not aimto identify the specific composition of DON, rather to quantifythe importance of DON in TDN present in precipitation collectedin an air-polluted city. Thus we determined only the bulk DONconcentration in our precipitation samples. However, it has beena long-standing challenge to analyze the DON concentrationwith confidence. Measuring total dissolved nitrogen (TDN)involves releasing theN from the organicmolecules, by chemicaloxidation to NO3
−, thermal/catalytic oxidation to NO; Kjeldahlconversion to NH3, or by photolysis, with or without additionalchemical oxidants (Scudlark et al., 1998; Zhang and Anastasio,2001; Cornell et al., 2003; Bronk et al., 2000). The resultant totalN is measured and DON is then calculated by the difference
between TDN andDIN. In the present study, TDN in precipitationsamples was analyzed using alkaline persulfate oxidation toNO3
− (Bronk et al., 2000). Briefly, persulfate oxidizing reagentwas made up daily with NaOH (1.52 g, certified ACS-grade) anddissolved in 100 mL deionized water, followed by addition of3 g boric acid (ACS-grade) and 5 g of K2S2O8 (ACS-grade). Thesamples (5 mL) were added to 14-mL borosilicate glass testtubes (Iwaki, 71-063-006) with Teflon-lined caps (Iwaki,71-028-004). Immediately after adding 0.5 mL of persulfateoxidizing reagent to the tube, the screw cap was tightly closedand the test tubes were autoclaved for 1 h at 121 °C. Theresultant NO3
− was measured by ion chromatography (DionexDX-120, Osaka, Japan).
We used IAEA (International Atomic Energy Agency)—NO3−
(at concentrations of 0.14, 0.7, 1.4, 3.5 and 7.0 mg N L−1) tocheck the recovery of NO3
− during the oxidation process andfound that the concentration after oxidation was 1 to 4% (onaverage 2%) higher than their initial concentrations, suggestingthat therewas no loss of N during the treatment.We used threedifferent amino acids (alanine, histidine and glycine) in differentconcentrations (0.7, 1.05, 1.4, 2.8, 3.5 and 7.0 mg N L−1) to checkoxidation efficiency. The efficiency of oxidation variedwith initialconcentrations, with relatively lower oxidation (83%) whenconcentrationwas higher than 3.5 mg N L−1. Below the concen-tration of 3.5 mg N L−1, the oxidation efficiencywas satisfactory,averaging 98%, 96% and 98% for alanine, histidine and glycine,respectively. The chemical composition of DON remained un-known for our samples, but if the recoveries of N from the aminoacid standards are assumed to be representative of the rainwaterDON, then DON might have been underestimated by ~2 to 4%,potentially more for the samples with high N concentration.However, almost all samples in this study had DON concentra-tions lower than 3.5 mg N L−1. Thus we did not correct the datafor DON concentration using recovery efficiency.
2.4. Source characterization
Attempts can be made to identify sources of DON based oncorrelations with species of known source, for example, NO3
−,NH4
+, non-sea-salt (nss) sulfate (SO42−), over the study period
for a given sampling site or across multiple sites over a studyregion (Cape et al., 2011). Atmospheric organic N exists in gas-eous, particulate and aqueous phases. In the present study, thebulk precipitation we collected was likely to have integratedorganicN compounds originally in different phases. In this study,we linked DON to concentrations of both other ion components(such as nss-Ca2+ and nss-SO4
2− in precipitation and ofmajor airpollutants (SO2, NO2, O3 and PM10) to explore the potentialsimilarities with other known sources.
Dissolved organic N has both natural and anthropogenicsources. Dust can provide an efficient adsorptive surface notonly for nitrogenous compounds but also for living biologicalorganisms (Violaki and Mihalopoulos, 2010). Nss-Ca2+ can beused as an indicator of dust, whereas nss-SO4
2− is an anthropo-genic tracer (Violaki and Mihalopoulos, 2010). Na and Cl arecommonly taken as the best reference elements for a sea saltsource (Keene et al., 1986). In the study city, we can observe agood relationship between Na+ and Cl− concentrations formost of samples. However, some samples contained notablyhigher Cl− concentrations than calculated according to thetheoretical ratio of Cl− and Na+, presumably chloride is present

Table 1Seasonal contribution of precipitation (mm) and N deposition (kg N ha−1 yr−1)in precipitation in Guangzhou.
Years Seasons Precipitation NH4+ NO3
− DON DIN TDN
2008 Dry 491 3.1 4.1 2.0 7.2 9.2Wet 1670 11.8 12.0 6.1 23.8 29.9Total 2161 14.9 16.1 8.1 31.0 39.1
2009 Dry 411 4.2 3.8 2.0 8.0 10.0Wet 1520 17.6 15.2 6.4 32.8 39.1Total 1931 21.8 18.9 8.4 40.8 49.2
60 J. Li et al. / Atmospheric Research 113 (2012) 57–67
as HCl emitted from coal burning (Evans et al., 2011). Thus weused Na as a conservative reference element for sea salt sourceto calculate nss-Ca2+ and nss-SO4
2− contributions. Consistentwith previous reports in the study city (Cao et al., 2009),nss-Ca2+ and nss-SO4
2− accounted for 99% and 97% of totalinputs, suggesting a minor contribution of sea source.
Data onmonthlymean concentrations ofmajor air pollutants(SO2, NO2, PM10 and O3) were obtained from three monitoringsites in Guangzhou, whichwere included in the Pearl River DeltaRegional Air Quality Monitoring Network (http://www-app.gdepb.gov.cn/EQPublish/raqi.aspx) since 2006.
2.5. Air-mass transportation
Using meteorological analysis such as air-parcel backtrajectories, i.e. working backwards from measurement pointto inferred source, is a promising tool for identifying the influ-ence of air-mass transportation (Cape et al., 2011). Due to itscoastal position, the study citymay be subject to an influence oflong-range transportation of air masses over the seas. These airmasses may contain lower N concentrations, probably withdifferent N compositions from the continental source. To sepa-rate the origins of air mass sources, 72-hour backward trajecto-ries were computed for all sample days using NOAA's HybridSingle-Particle Lagrangian Integrated Trajectory (HYSPLIT)(http://ready.arl.noaa.gov/HYSPLIT traj.php; Draxler and Rolph,2010) at an altitude of 500 m a.g.l. The air mass sectors werecategorized to be of continental origin (i.e., the mainland of
0
1
2
3
4
N in
put (
kg N
ha-1
mon
th-1)
NH4
+
NO3
-
DON
J F M A M J J A S O N D J
Precipitatio
2008 2
Fig. 2. Monthly rates of N deposition (a) and monthly precip
China) or marine origin (e.g., from the South China Sea or thePhilippine Sea), according to the starting point of air masstransportation (72 h before arrival at Guangzhou). The airmasses starting over southern Asian countries like Thailandand Vietnam were considered to be of marine origin in thisstudy because they passed through the South China Sea (Fanget al., 2011a).
2.6. Calculations and statistical analysis
The data on daily precipitation and daily mean temper-ature were from a nearby meteorological station (Wushan),about 2 km away from the sampling site. The annual N loadfrom precipitation was determined as the sum of the productof concentration and precipitation amount for each samplingperiod. In this paper, both arithmetic and volume-weightedmeans are presented for N concentrations. One-way Analysisof Variance (ANOVA) was performed on the N concentrationdata, in order to identify the differences between seasons orbetween air mass sources for each year. In this study, theperiod from April to September was designated as the wetand warm seasons, and October to March as the dry and coldseasons. Two-way ANOVA was used to identify the signifi-cance between years, seasons, and air mass sources for theinvestigated variables across the study period. Correlationanalysis with a two-tail significance test was used to examinethe relationships between variables over the study period orin the individual year. All analyses were conducted usingPASW Statistics 18.0 for Windows. Statistically significant dif-ferences were set at P valuesb0.05 unless otherwise stated.
3. Results
Total dissolved N deposition in precipitation was 39.1 kg Nha−1 yr−1 in 2008 and 49.2 kg N ha−1 yr−1 in 2009 (Table 1).The absence ofwinter data (due to limited precipitation volume)in 2009 could result in an underestimation of 3.4 kg N ha−1
yr−1 for annual total N deposition; TDN deposition was 0.8 and2.6 in January and February of 2008, respectively, Fig. 2).
F M A M J J A S O N0
200
400
600
800
n
Pre
cipi
tatio
n (m
m m
onth
-1)
009
itation amounts (b) during 2008–2009 in Guangzhou.

0 200 400 600 8000
1
2
3
4
5
0 200 400 600 8000
1
2
3
4
5
0 200 400 600 8000
1
2
3
4
5
NH
4+ (
kg N
ha-1
mon
th-1)
y = 0.004x +0.99,R2 = 0.25, P = 0.014, n = 20
y = 0.003x +1.06,R2 = 0.21, P = 0.024, n = 20
NO
3- (kg
N h
a-1 m
onth
-1)
Precipitation (mm month-1)
a b cy = 0.002x +0.46,R2 = 0.30, P = 0.007, n = 20
DO
N (
kg N
ha-1
mon
th-1)
Fig. 3. Correlations between monthly N inputs and monthly precipitation amounts during 2008–2009 in Guangzhou.
61J. Li et al. / Atmospheric Research 113 (2012) 57–67
NH4+, NO3
− and DON contributed 38%, 41% and 21% of TDNin 2008, respectively, and 44%, 38% and 17% in 2009 (Table 1).From 77% to 79% of annual precipitation fell in wet seasons,and 75% to 81% of annual N wet deposition occurred in thoseseasons (Fig. 2, Table 1), showing the importance of precipita-tion distribution in regulating seasonal patterns of N deposition.This is further evidenced by the close correlations betweenmonthly precipitation amount and monthly N deposition overthe study course (Fig. 3).
Ammonium concentration ranged from 0.01 to 4.84 mgN L−1 and NO3
− ranged from 0.08 to 5.68 mg N L−1 (Table 2).Averaged NH4
+ concentration was 0.81 and 1.23 mg N L−1 in2008 and 2009, respectively, while averaged NO3
− concentra-tion was 0.88 and 1.10 mg N L−1 (Table 2). Volume-weightedmean concentrations were 16–20% lower than arithmeticmeans except for DON in 2009 (Table 2). DON concentrationwas between 0.01 and 3.70 mg N L−1 and averaged 0.45 and0.53 mg N L−1 in 2008 and 2009, respectively (Table 2). TDNconcentration ranged from 0.28 to 11.63, with averages of 2.14and 2.85 mg N L−1 in 2008 and 2009, respectively.
Both inorganic and organic N concentrations displayedlarge seasonal fluctuations in the course of the study (Fig. 4b).In 2008, concentrations increased when the rainy seasonstarted and peaked in April, then decreased and reached thelowest level in late June. Concentrations were relatively low inthe later half of 2008, except for two small peaks in lateSeptember and early November. In 2009, the seasonal variationwas somewhat different from that in 2008; concentrationsremained relatively high throughout the year except in late
Table 2Ranges and means of N concentrations (mg N L−1) in precipitation in Guangzhou.
Years NH4+ NO3
−
Range Meana Meanb Range
2008 0.01–3.74 0.81 0.69 0.08–5.682009 0.01–4.84 1.23 1.01 0.15–3.65
a Arithmetic mean.b Volume-weighted mean.
April, and high concentrations were also found in August andSeptember (Fig. 4b). The differences in concentrations betweenwet (April to September) and dry seasons (October to March)were not significant in either 2008 or 2009 (Fig. 5). Two-wayANOVA (using year and season as main factors) also indicatedno significant differences between seasons.
During the study period, the contributions of each Ncomponent to TDN varied greatly with seasons (Fig. 4c). NH4
+
made up 3% to 71% of TDN, with an average of 42% over theobservation period. NO3
− constituted 15% to 65% of TDN (onaverage 39%). The contribution of DON was usually lower thanthose of NH4
+ and NO3−, ranging from 1% to 54% (on average
19%). Seasonal differences in contributions of each N compo-nent were more distinct in 2008, with a higher contributionobserved in summer (JJA) than in the rest of the year for NH4
+,while a lower contribution was seen in summer for NO3
−
(Fig. 4c). DON contributed relatively more N to TDN in latersummer and autumn when inorganic N concentrations werelow (Fig. 4c).
Precipitation amount was marginally correlated with Nconcentrations across the study period for NO3
− and DON (bothR2=0.03, P=0.09, n=113), with no significant relationshipseen for NH4
+. DON concentration was highly correlated withboth NH4
+ and NO3−, and the latter two N species were also
correlated (Fig. 6). Concentrations of all three N species inprecipitation were significantly correlated with both nss-Ca2+
and nss-SO42− concentrations, with a stronger relationship seen
with SO42− concentration (Fig. 7). There were significant re-
lationships between precipitationNO3− and SO4
2− concentrations
DON
Meana Meanb Range Meana Meanb
0.88 0.74 0.03–3.70 0.45 0.381.10 0.88 0.01–2.03 0.53 0.76
0
10
20
30
40
J F M A M J J A S O N D J F M A M J J A S O N D0
1
2
3
4
5
6
J F M A M J J A S O N D J F M A M J J A S O N D0
20
40
60
80
Air
mea
n te
mpe
ratu
re (
o C)
Temperature
J F M A M J J A S O N D J F M A M J J A S O N D0
30
60
90
120
150
Dai
ly p
reci
pita
tion
(mm
)
Precipitation
20092008
Con
cent
ratio
n (m
g N
L-1)
NH4
+
NO3
-
DON
a
b
c
Per
cent
ages
(%
)
NH4
+
NO3
-
DON
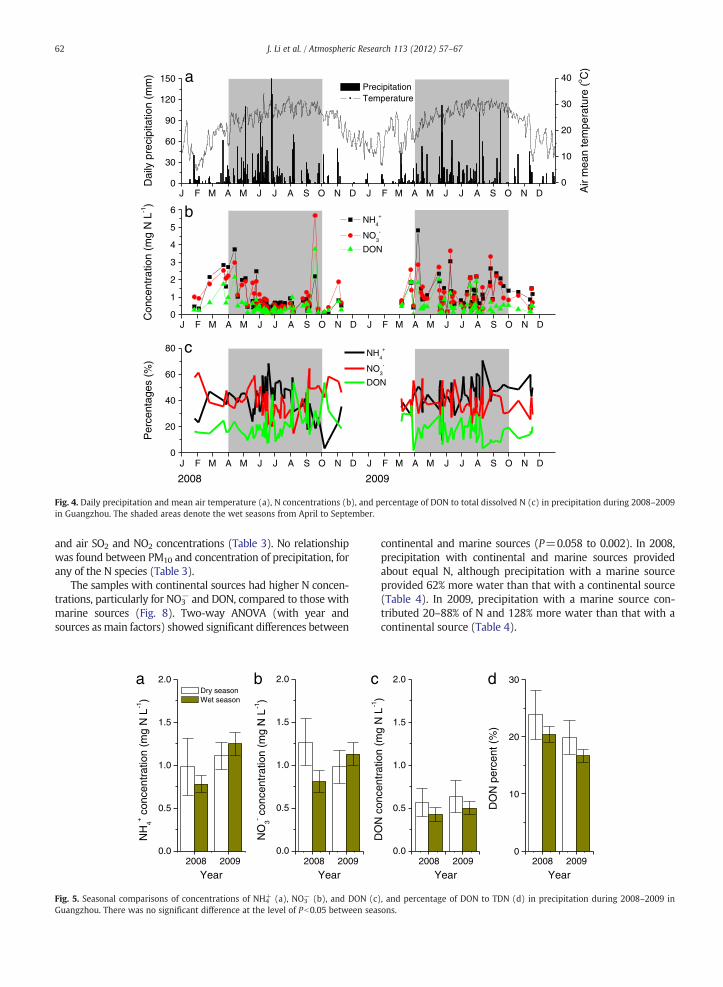
Fig. 4. Daily precipitation and mean air temperature (a), N concentrations (b), and percentage of DON to total dissolved N (c) in precipitation during 2008–2009in Guangzhou. The shaded areas denote the wet seasons from April to September.
62 J. Li et al. / Atmospheric Research 113 (2012) 57–67
and air SO2 and NO2 concentrations (Table 3). No relationshipwas found between PM10 and concentration of precipitation, forany of the N species (Table 3).
The samples with continental sources had higher N concen-trations, particularly for NO3
− and DON, compared to those withmarine sources (Fig. 8). Two-way ANOVA (with year andsources asmain factors) showed significant differences between
2008 20090.0
0.5
1.0
1.5
2.0
NH
4+ c
once
ntra
tion
(mg
N L
-1)
Year
Dry season Wet season
2008 20090.0
0.5
1.0
1.5
2.0
NO
3- con
cent
ratio
n (m
g N
L-1)
Year
a b c
-1
Fig. 5. Seasonal comparisons of concentrations of NH4+ (a), NO3
− (b), and DON (cGuangzhou. There was no significant difference at the level of Pb0.05 between sea
continental and marine sources (P=0.058 to 0.002). In 2008,precipitation with continental and marine sources providedabout equal N, although precipitation with a marine sourceprovided 62% more water than that with a continental source(Table 4). In 2009, precipitation with a marine source con-tributed 20–88% of N and 128% more water than that with acontinental source (Table 4).
d
2008 20090.0
0.5
1.0
1.5
2.0
DO
N c
once
ntra
tion
(mg
N L
)
Year2008 2009
0
10
20
30
DO
N p
erce
nt (
%)
Year
), and percentage of DON to TDN (d) in precipitation during 2008–2009 insons.
0.1 1 10
0.01
0.1
1
10
0.01 0.1 1 10
0.01
0.1
1
10
0.01 0.1 1 10
0.01
0.1
1
10
NO
3- (m
g N
L-1)
NH4
+ (mg N L-1)
a b c
y = 0.87x + 0.10
R2 = 0.66, P < 0.001, n = 113
y = 0.52x - 0.03
R2 = 0.69, P < 0.001,n = 113
DO
N (
mg
N L
-1)
NO3
- (mg N L-1)
y = 0.48x - 0.01
R2 = 0.51, P < 0.001, n = 113
DO
N (
mg
N L
-1)
NH4
+ (mg N L-1)
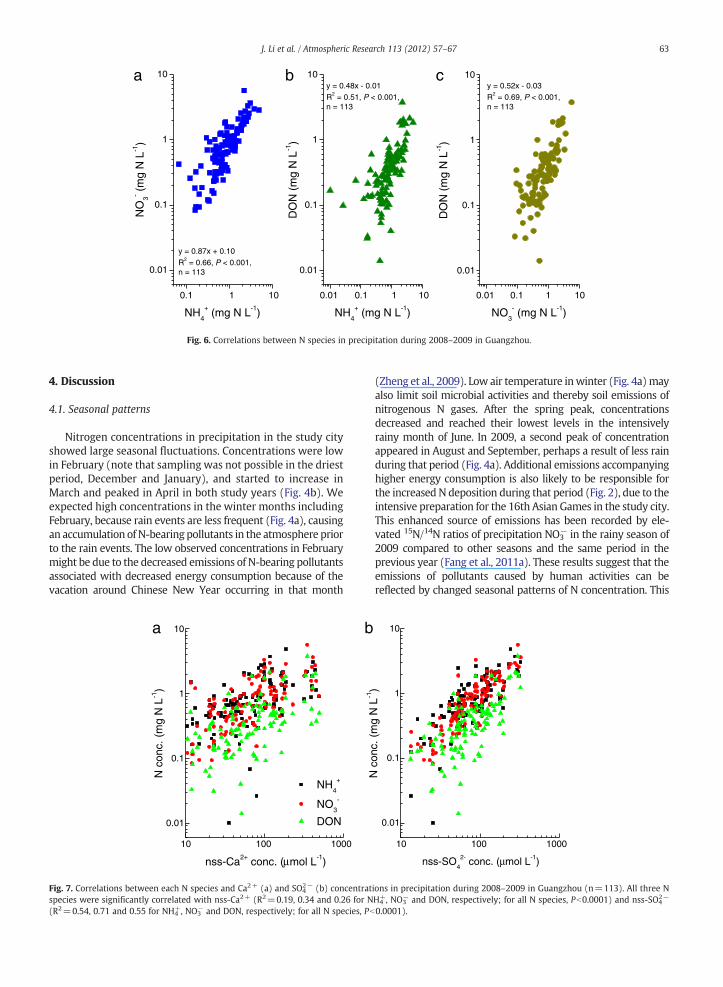
Fig. 6. Correlations between N species in precipitation during 2008–2009 in Guangzhou.
63J. Li et al. / Atmospheric Research 113 (2012) 57–67
4. Discussion
4.1. Seasonal patterns
Nitrogen concentrations in precipitation in the study cityshowed large seasonal fluctuations. Concentrations were lowin February (note that sampling was not possible in the driestperiod, December and January), and started to increase inMarch and peaked in April in both study years (Fig. 4b). Weexpected high concentrations in the winter months includingFebruary, because rain events are less frequent (Fig. 4a), causingan accumulation of N-bearing pollutants in the atmosphere priorto the rain events. The low observed concentrations in Februarymight be due to the decreased emissions of N-bearing pollutantsassociated with decreased energy consumption because of thevacation around Chinese New Year occurring in that month
10 100 1000
0.01
0.1
1
10
nss-Ca2+ conc. ( mol L-1)
NH4
+
NO3
-
DON
a b
N c
onc.
(m
g N
L-1)
µ
Fig. 7. Correlations between each N species and Ca2+ (a) and SO42− (b) concentrat
species were significantly correlated with nss-Ca2+ (R2=0.19, 0.34 and 0.26 for N(R2=0.54, 0.71 and 0.55 for NH4
+, NO3− and DON, respectively; for all N species, Pb
(Zheng et al., 2009). Low air temperature inwinter (Fig. 4a)mayalso limit soil microbial activities and thereby soil emissions ofnitrogenous N gases. After the spring peak, concentrationsdecreased and reached their lowest levels in the intensivelyrainy month of June. In 2009, a second peak of concentrationappeared in August and September, perhaps a result of less rainduring that period (Fig. 4a). Additional emissions accompanyinghigher energy consumption is also likely to be responsible forthe increased N deposition during that period (Fig. 2), due to theintensive preparation for the 16th Asian Games in the study city.This enhanced source of emissions has been recorded by ele-vated 15N/14N ratios of precipitation NO3
− in the rainy season of2009 compared to other seasons and the same period in theprevious year (Fang et al., 2011a). These results suggest that theemissions of pollutants caused by human activities can bereflected by changed seasonal patterns of N concentration. This
10 100 1000
0.01
0.1
1
10
nss-SO4
2- conc. ( mol L-1)
N c
onc.
(m
g N
L-1)
µ
ions in precipitation during 2008–2009 in Guangzhou (n=113). All three NH4+, NO3
− and DON, respectively; for all N species, Pb0.0001) and nss-SO42−
0.0001).

Table 3Pearson correlation coefficients between variables over the two-year study period.
Precipitation NH4+ Precipitation NO3
− Precipitation DON Air SO2 Air NO2 Air PM10
Precipitation NO3− 0.91**
Precipitation DON 0.73** 0.82**Air SO2 0.51* 0.68** 0.68**Air NO2 0.33 0.50* 0.45* 0.82**Air PM10 0.08 0.07 −0.06 −0.17 −0.04Air O3 0.44 0.55* 0.44 0.55** 0.62** 0.44*
* and ** indicate significance at Pb0.05 and 0.01, respectively. Monthly VWM concentrations of precipitation N and monthly mean concentrations of air pollutantswere used. N=20, because of no precipitation collection in a few winter months (see the Method).
64 J. Li et al. / Atmospheric Research 113 (2012) 57–67
also provides an explanation for weak or no significant corre-lations between precipitation amount and N concentrations inthe study city; precipitation is expected to exert a strong dilutioneffect on N concentration under natural conditions.
The contributions of each N species to total N deposition alsofluctuated with seasons. The seasonal patterns of contributionswere clear in 2008, with NH4
+ contributing more N to TDN insummer (Fig. 4c). This may be caused by stimulated NH3
volatilization favored by high temperature and by fertilizerutilization in that season. It is worthy to note, that high DONcontribution observed in the second half year of 2008, coincideswith relatively low inorganic N concentrations during the sameperiod (Fig. 4c). The organic N percentages decreased through-out 2009, when both NH4
+ and NO3− concentrations were high
(Fig. 4). These results imply that DON does not increase withincreasing DIN in a fixed ratio although DON seems to haveanthropogenic sources just like DIN. Besides, we observed alower DON contribution to TDN in 2009 than in 2008. Wesuspect it might result from the elevated presence of PAN(Peroxyacetyl Nitrate) and alkyl nitrates in DON, because PANand alkyl nitrates are less soluble (Cornell et al., 2003).
4.2. Contribution of organic N to N deposition, in comparisonwith other studies in China
Deposition of DIN in precipitation was 31 to 41 kg N ha−1
yr−1 in this study, closely comparable to the previous report of41 kg N ha−1 yr−1 during the period from March 2005 toFebruary 2006 at the same sampling site (Huang et al., 2010).
2008 20090.0
0.5
1.0
1.5
2.0
NH
4+ c
once
ntra
tion
(mg
N L
-1)
Year
Continental Marine
**
2008 20090.0
0.5
1.0
1.5
2.0
NO
3- con
cent
ratio
n (m
g N
L-1)
Year
a b c
-1
Fig. 8. Source comparisons of concentrations of NH4+ (a), NO3
− (b), and DON (c)Guangzhou. *, ** indicate significant differences between air sources at the level of
DIN deposition in Guangzhou is among the highest in China(Table 5), three to four times the mean DIN depositionthroughout China (9.9 kg N ha−1 yr−1, Lü and Tian, 2007),and about twice the average rate (16.6 kg N ha−1 yr−1)across 31 forest sites in the past two decades compiled byFang et al. (2011b). DON contributed an additional 8.1 to8.4 kg N ha−1 yr−1 to precipitation N input, making TDNdeposition reach 39 to 49 kg N ha−1 yr−1 (Table 1). This Ninput is much higher than the threshold of 25 kg N ha−1 yr−1
over which elevated N leaching occurs in European temperateforests (Gundersen et al., 2006). Such high N input in the longterm can cause N saturation in any given natural ecosystemunder warm and humid conditions (Fang et al., 2008).
DON deposition observed in the study city is very close tothe average of 8.2 kg N ha−1 yr−1 across 23 sites throughoutChina covering a variety of land-use types and locations(Table 5). The contribution of DON to TDN (19%) in this studylies within the wide range, from 2% to 78%, observed in China(Table 5) and the range in other reports in the world (Cape etal., 2011; Cornell, 2011). The DON fluxes in precipitation havebeen reported to be 0.6–10.9 kg N ha−1 yr−1 in a globalsynthesis, with a median of 2.2 kg N ha−1 yr−1 (Neff et al.,2002). Thus, DON deposition in our study site – and most otherChinese sites (Table 5) – is higher than the global average level.DON concentration in the study site was 0.49 mg L−1, some-what lower than the average DON concentration across allChinese sites of 1.20 mg L−1. But the DON concentration in ourstudy city, as for most Chinese sites, is much higher than theaverage level in other regions of the world (e.g., 0.2 mg L−1
d
2008 20090.0
0.5
1.0
1.5
2.0
**
DO
N c
once
ntra
tion
(mg
N L
)
Year2008 2009
0
10
20
30
DO
N p
erce
nt (
%)
Year
, and percentage of DON to TDN (d) in precipitation during 2008–2009 inPb0.05 and 0.01, respectively.

Table 4Source contributions of precipitation (mm) andNdeposition (kg N ha−1 yr−1)in precipitation in Guangzhou.
Years Sources Precipitation NH4+ NO3
− DON DIN TDN
2008 Continental 824 6.5 8.4 4.0 15.0 19.0Marine 1337 8.4 7.6 4.1 16.0 20.1Total 2161 14.9 16.1 8.1 31.0 39.1
2009 Continental 589 8.1 6.6 3.8 14.6 18.5Marine 1342 13.7 12.4 4.6 26.1 30.7Total 1931 21.8 18.9 8.4 40.8 49.2
65J. Li et al. / Atmospheric Research 113 (2012) 57–67
averaged for 37 sites, Zhang et al., 2008; 0.3 mg L−1 averagedfor 12 continental sites, Cornell et al., 2003). However, the DONcontribution to TDN across China of about 30% is comparable tomany reports for other regions in theworld (Cornell et al., 2003;Cornell, 2011).
4.3. Sources of DON
Conceptually, atmospheric organic N (AON), which wemeasured as DON in precipitation, can be divided into threetypes of nitrogen: organic nitrates, reduced AON andbiological/terrestrial AON (Neff et al., 2002). The biological/terrestrial AON refers to biological and particulate forms oforganic N including bacteria, dust particles and pollens (Neffet al., 2002). The contribution of bacteria and pollens is likelyto be minor in the study city, compared to other DON sources.A small amount ofDON, 0.4 to 1.4 kg N ha−1 yr−1,was observedin remote areas like Inner Mongolia and Heilongjiang (Table 5).DON deposition was estimated to be 0.1 kg N ha−1 yr−1 in aHawaiian island (Carrillo et al., 2002). The slightly higher DONinput in remote sites on the China landmass than in Hawaiimay be due to a greater dust contribution. These studies in
Table 5Concentrations (mg N L−1) and inputs of N (kg N ha−1 yr−1) and the contribution
Provinces Sites Location Land-use Samplingperiods
Guangdong Guangzhou Urban Residential 2008–2009Dinghushan Sub-urban Forest 2005
Fujian Zhangzhou Multiple sites Various 2004–2005Jiangxi Fenyi Rural Forest 1985–1987Jiangsu Jurong Rural Farmland 2007–2008
Urban ResidentialZhejiang Fenghua Rural Farmland 2004–2006Hunan Huitong Rural Forest 1995–2000Sichuan Gonggashan Remote Forest 2005–2006Beijing Changping Sub-urban Farmland 2005–2006
Dongbeiwang Sub-urban Farmland 2005–2006Campus Farm Sub-urban Farmland 2005–2006Baoding Rural Farmland 2005–2006
Hebei Shunyi Rural Farmland 2005–2006Quzhou Rural Farmland 2005–2006Wuqiao Rural Farmland 2005–2006
Shandong Huimin Rural Farmland 2005–2006Qingdao Rural Farmland 2005–2006
Liaoning Dalian Rural Farmland 2006Xinjiang Urumchi Rural Farmland 2006Tibet Linzhi Remote Farmland 2005–2006Inner Mongolia Duolun Remote Grassland 2006Heilongjiang Liangshui Remote Forest 2006
combination also suggest that background DON input viaprecipitation is low.
A close relationship between NH4+ and DON concentra-
tions in precipitation (Fig. 6b) indicates that reduced AONcompounds (e.g. from intensive agricultural activities) maybe a significant contributor to DON deposition at our site. Asimilar relationship was observed at one site in central Japanunder intensive agriculture activities (Ham and Tamiya, 2006).Close relationships betweenDON andNH4
+ in precipitation havealso been reported across 6 sites in theUK (Cape et al., 2004) and17 sites in the Jiulong River watershed in southeastern China(Chen et al., 2008), although not across 15 sites throughoutChina (Zhang et al., 2008).
We also suggest that organic nitrates must be anotherimportant component in precipitation DON at our study site.We observed that DON concentration was highly related withNO3
− concentration in precipitation (Fig. 6c) and with air NO2
concentration (Table 3), suggesting that organic nitrates mighthave been produced from combustion and vehicle exhaust.Organic nitrates are the oxidized end products of reactions ofhydrocarbons with NOx (NO+NO2) in polluted air masses(Neff et al., 2002). It was estimated by Guangzhou Transpor-tation Commission Statistics that Guangzhou city has reachedup to about two million motor vehicles in 2010.
Dust is considered as an efficient adsorptive surface notonly for nitrogenous compounds but also for living biologicalorganisms. We found that nss-Ca2+, as an indicator of dust,was significantly correlated with DON, suggesting that dustplays an important role in capturing N compounds at ourstudy city. However, we did not find PM10 was related to DONor inorganic N (Table 3), although PM10 is often used as ameasure of dust inmany regions. This discrepancy indicates thatfine particulates may be more important in carrying N-bearingcompounds in the study city, which is further supported by a
s of DON to TDN in precipitation in Chinese sites.
DINconc.
DONconc.
DINinput
DONinput
TDNinput
DON/TDN(%)
References
2.00 0.49 35.9 8.3 44.1 19 This study1.22 0.85 31.6 17.8 49.5 36 Fang et al., 20081.80 1.00 6.4 3.5 9.9 36 Chen et al., 20084.74 1.23 48.2 12.5 60.7 21 Ma, 19892.60 0.60 26.9 5.3 32.2 16 Yang et al., 20102.60 0.30 24.5 3.2 27.7 122.48 1.92 30.2 23.4 53.6 44 Zhang et al., 20080.45 0.58 5.3 6.7 12 58 Tian et al., 20020.54 1.94 7.3 26.3 33.6 78 Zhang et al., 20087.43 0.97 33.5 4.4 37.9 127.11 1.72 39.1 9.5 48.6 205.28 2.05 27.3 10.6 37.9 284.68 0.59 24.4 3.1 27.5 114.90 1.02 22.5 4.7 27.1 175.71 1.94 16.1 5.5 21.6 254.95 2.18 15.4 6.8 22.2 315.22 1.51 29.9 8.6 38.6 222.82 1.70 12.9 7.8 20.7 384.01 2.56 17.9 11.4 29.3 393.98 1.08 4.6 1.2 5.9 200.27 0.70 2.2 5.7 7.9 724.31 0.11 16.7 0.4 17.1 20.88 0.38 3.3 1.4 4.7 30 Wu et al., 2008

66 J. Li et al. / Atmospheric Research 113 (2012) 57–67
stronger correlation of DON with nss-SO42− (Fig. 7; SO4
2− isknown to be a predominant component of fine aerosols) and isin a good agreement with the report of Nakamura et al. (2006)over the East China Sea where particulate DON was found tomainly exist in fine particle mode.
Together with the correlation of nss-SO42− (as an anthropo-
genic tracer) and DON concentrations in precipitation (Fig. 6b),the analysis above points to the importance of anthropogenicsources in DON deposition in Guangzhou city. The anthropo-genic contribution would account for 88% of total DON depo-sition, if we assume that natural contribution (such as bacteriaand pollen) contributes to 1 kg N ha−1 yr−1 (the mean of tworemote sites with natural vegetation, Table 5).
The deposition rate was exceptionally high for DON whilerelatively low for DIN at the site Gonggashan in Sichuan(Zhang et al., 2008, Table 5). The reasons for such a high DONdeposition were not specified (Zhang et al., 2008). Across the allsites in China but the site Gongga Shan, we find that annual DONdeposition is also significantly correlated to annual DIN deposi-tion (DON deposition=0.22×DIN deposition+2.7, R2=0.25,P=0.01, n=22, Table 5). This correlation suggests that DONoriginates from the anthropogenic sources that are similar to thesources for NH4
+ andNO3−, consistentwith the observation in the
study city (Fig. 5).
4.4. Influence of air-mass transport
Precipitation of marine origin had consistently lower con-centrations of all N species (Fig. 8) than samples of continentalorigin. The difference between land andmarine air masses wassignificant for DON concentration in both 2008 and 2009. LowN concentration in precipitation of marine origin suggests thatthe air mass was polluted to a lesser degree. However, the Nconcentration in precipitation of marine origin was still consid-erable, being far higher than that in precipitation at Hawaiianisland (b0.03 mg N L−1 for all three N species; Carrillo et al.,2002). This observation indicates that the airmasseswithmarineorigin were polluted by local emissions before rain events(consistent with little contribution of Ca2+ and SO4
2− in precip-itation of marine origin to total inputs as mentioned in theMethod section) and/or that the air mass designated as marineaccording to the back-trajectory analysis was originally conti-nental, at least in part.
The percentage contribution ofDON to totalNdepositionwasalso slightly smaller in precipitation of marine origin comparedto that of continental origin (Fig. 8). This is consistent with otherstudies. A survey at 15 continental sites throughout China foundan average DON contribution to total N in precipitation of 30%(Zhang et al., 2008). DON contributionwas shown to be lower inmarine aerosols over the East China Sea (24% and 10% in theautumn and the spring, respectively; Nakamura et al., 2006) andin rain and fog in Hawaii (16 and 12% of total N, respectively;Carrillo et al., 2002). Similarly, Zhang et al. (2011) reported astrong gradient of DON contribution in wet and dry depositionfrom East Asia to the interior of the North Pacific Ocean.
5. Concluding remarks
This present study indicates high DON deposition rates inGuangzhou city. This elevated DON deposition was associatedwith increased DIN deposition, consistent with observations at
other Chinese sites. We also found that the precipitation withcontinental origins contains higher N for both inorganic N andorganic N components, suggesting that long-range air masstransportation can affect precipitation N speciation in this airN-polluted city. We speculate that the DON may be producedthrough atmospheric processes, e.g., the reaction of atmo-spheric oxidized (e.g., nitric acid) and reduced (e.g., NH3) N gasphase species with gas or aerosol organic matter, all of whichare present in high concentrations in the atmosphere in thestudy city (Wang et al., 2005).
Our estimates of atmospheric N deposition via precipitationare as high as 39–49 kg N ha−1 yr−1 in the study city. This Ninput is much higher than the threshold of 25 kg N ha−1 yr−1
over which elevated N leaching occurs in European temperateforests. SuchhighN input in the long termcan causeN saturationin any given natural ecosystem under warm and humid con-ditions, calling for stringent reduction in active N emissions.
Acknowledgments
This study was jointly supported by the Knowledge Innova-tion Program of the Chinese Academy of Sciences (CAS)(No.KSCX2-EW-J-28), the National Natural Science Foundationof China (Nos. 31070409, U0833001 and 40875076), State KeyLaboratory of Forest and Soil Ecology, Institute of AppliedEcology, CAS (Y1SRC211S1), the National Program on Key BasicResearch Project of China (No. 2010CB428504), and Grant-in-Aid for Scientific Research of Japan Society for Promotion ofScience (No. 21310008).We are grateful to the three anonymousreviewers for their critical and constructive comments thatgreatly improved the quality of the manuscript. We also thankKeisuke Koba and Yu Takebayashi for their helps in laboratoryanalysis.
Appendix A. Supplementary data
Supplementary data associated with this article can befound, in the online version, at http://dx.doi.org/10.1016/j.atmosres.2012.04.019. These data include Google map of themost important areas described in this article.
Appendix A. Supplementary data
Supplementary data to this article can be found online athttp://dx.doi.org/10.1016/j.atmosres.2012.04.019.
References
Aber, J., McDowell, W., Nadelhoffer, K., Magill, A., Berntson, G., Kamakea, M.,McNulty, S., Currie, W., Rustad, L., 1998. Nitrogen saturation in temperateforest ecosystems — hypotheses revisited. Bioscience 48, 921–934.
Bronk, D.A., Lomas, M.W., Glibert, P.M., Schukert, K.J., Sanderson, M.P., 2000.Total dissolved nitrogen analysis: comparisons between the persulfate,UV and high temperature oxidation methods. Mar. Chem. 69, 163–178.
Cao, Y.Z., Wang, S.Y., Zhang, G., Luo, J.Y., Lu, S.Y., 2009. Chemical characteristicsof wet precipitation at an urban site of Guangzhou, South China. Atmos.Res. 94, 462–469.
Cape, J.N., Kirika, A., Rowland, A.P., Wilson, D.S., Jickells, T.D., Cornell, S., 2001.Organic nitrogen in precipitation: real problem or sampling artefact? Sci.World 1 (S2), 230–237.
Cape, J.N., Anderson, M., Rowland, A.P., Wilson, D., 2004. Organic nitrogen inprecipitation across the United Kingdom. Water Air Soil Pollut. Focus 4,25–35.

67J. Li et al. / Atmospheric Research 113 (2012) 57–67
Cape, J.N., Cornell, S.E., Jickells, T.D., Nemitz, E., 2011. Organic nitrogen in theatmosphere-Where does it come from? A review of sources and methods.Atmos. Res. 102, 30–48.
Carrillo, H.J., Hastings, M.G., Sigman, D.M., Huebert, B.J., 2002. Atmosphericdeposition of inorganic and organic nitrogen and base cations in Hawaii.Global Biogeochem. Cycles 16, 1076.
Chen, N.W., Hong, H.S., Zhang, L.P., 2008. Wet deposition of atmosphericnitrogen in Jiulong river aatershed. Environ. Sci. 29, 38–46.
Cornell, S.E., 2011. Atmospheric nitrogen deposition: revisiting the question ofthe importance of the organic component. Environ. Pollut. 159, 2214–2222.
Cornell, S., Mace, K., Coeppicus, S., Duce, R., Huebert, B., Jickells, T., Zhuang, L.Z.,2001. Organic nitrogen in Hawaiian rain and aerosol. J. Geophys. Res. 106,7973–7983, http://dx.doi.org/10.1029/2000JD900655.
Cornell, S.E., Jickells, T.D., Cape, J.N., Rowland, A.P., Duce, R.A., 2003. Organicnitrogen deposition on land and coastal environments: a review ofmethods and data. Atmos. Environ. 37, 2173–2191.
Draxler, R.R., Rolph, G.D., 2010. HYSPLIT (HYbrid Single-Particle LagrangianIntegrated Trajectory) Model access via NOAA ARL READY Website.available at: http://ready.arl.noaa.gov/HYSPLIT.php NOAA Air ResourcesLaboratory, Silver Spring, MD.
Editorial Committee of Forests of Guangdong, 2005. Guangdong Yearbook.Guangdong Yearbook Publishing House, Guangzhou. (in Chinese).
Evans, C.D., Monteith, D.T., Fowler, D., Cape, J.N., Brayshaw, S., 2011. Hydrochloricacid: an overlooked driver of environmental change. Environ. Sci. Technol. 45(5), 1887–1894.
Fang, Y.T., Gundersen, P., Zhu, W.X., Mo, J.M., 2008. Input and output ofdissolved organic and inorganic nitrogen in subtropical forests of SouthChina under high air pollution. Biogeosciences 5, 339–352.
Fang, Y.T., Koba, K., Wang, X.M., Wen, D.Z., Li, J., Takebayashi, Y., Liu, X.Y.,Yoh, M., 2011a. Anthropogenic imprints on nitrogen and oxygen isotopiccomposition of precipitation nitrate in a nitrogen-polluted city in southernChina. Atmos. Chem. Phys. 11, 1313–1325.
Fang, Y.T., Gundersen, P., Vogt, R.D., Koba, K., Chen, F.S., Chen, X.Y., Yoh, M.,2011b. Atmospheric deposition and leaching of nitrogen in Chineseforest ecosystems. J. For. Res. 16, 341–350.
Galloway, J.N., Townsend, A.R., Erisman, J.W., Bekunda, M., Cai, Z.C., Freney,J.R., Martinelli, L.A., Seitzinger, S.P., Sutton, M.A., 2008. Transformation ofthe nitrogen cycle: recent trends, questions, and potential solutions.Science 320, 889–892.
Ge, X., Wexler, A.S., Clegg, S.L., 2011. Atmospheric amines — part I. A review.Atmos. Environ. 45, 524–546.
Guangdong Provincial Statistical Bureau, 2011. Guangdong's Provincial Census—Major Statistical Data (No.1). Guangdong Provincial Government, China. (inChinese).
Gundersen, P., Emmett, B.A., Kjønaas, O.J., Koopmans, C.J., Tietema, A., 1998.Impact of nitrogen deposition on nitrogen cycling in forests: a synthesisof NITREX data. Forest Ecol. Manage. 101, 37–55.
Gundersen, P., Schmidt, I.K., Raulund-Rasmussen, K., 2006. Leaching of nitratefrom temperate forests—effects of air pollution and forest management.Environ. Rev. 14, 1–57.
Ham, Y.S., Tamiya, S., 2006. Contribution of dissolved organic nitrogen depositionto total dissolved nitrogen deposition under intensive agricultural activities.Water Air Soil Pollut. 178, 5–13.
Huang, D.Y., Xu, Y.G., Peng, P.A., Zhang, H.H., Lan, J.B., 2009. Chemical compositionand seasonal variation of acid deposition in Guangzhou, South China:comparison with precipitation in other major Chinese cities. Environ. Pollut.157, 35–41.
Huang, D.Y., Xu, Y.G., Zhou, B., Zhang, H.H., Lan, J.B., 2010. Wet deposition ofnitrogen and sulfur in Guangzhou, a subtropical area in South China.Environ. Monit. Assess. 171, 429–439.
Jassby, A.D., Reuter, J.E., Axler, R.P., Goldman, C.R., Hackley, S.H., 1994. Atmosphericdeposition of nitrogen and phosphorus in the annual nutrient load of LakeTahoe (California Nevada). Water Resour. Res. 30 (7), 2207–2216.
Keene, W.C., Pszenny, A.P., Galloway, J.N., Hawley, M.E., 1986. Sea salt correctionand interpretation of constituent ratios in marine precipitation. J. Geophys.Res. 91, 6647–6658.
Lü, C., Tian, H., 2007. Spatial and temporal patterns of nitrogen deposition inChina: synthesis of observational data. J. Geophys. Res.-Atmos. 112,D22S05, http://dx.doi.org/10.1029/2006JD007990.
Ma, X.H., 1989. Effects of rainfall on the nutrient cycling in man-made forestsof Cunninghamia lanceolata and Pinus massoniana. Acta Ecol. Sin. 9,15–20 (written in Chinese with English summary).
Ministry of Environmental Protection, 2010. Report on the State of theEnvironment of China. http://jcs.mep.gov.cn/hjzl/zkgb/2010zkgb/201106/t20110602_211579.htm 2010(in Chinese).
Nakamura, T., Ogawa, H., Maripi, D.K., Uematsu, M., 2006. Contribution ofwater soluble organic nitrogen to total nitrogen inmarine aerosols over theEast China Sea and western North Pacific. Atmos. Environ. 40, 7259–7264,http://dx.doi.org/10.1016/j.atmosenv.2006.06.026.
Neff, J.C., Holland, E.A., Dentener, F.J., McDowell, W.H., Russell, K.M., 2002. Theorigin, composition and rates of organic nitrogen deposition: a missingpiece of the nitrogen cycle? Biogeochemistry 57/58, 99–136.
Russell, K.M., Galloway, J.N., Macko, S.A., Moody, J.L., Scudlark, J.R., 1998.Sources of nitrogen in wet deposition to the Chesapeake Bay region.Atmos. Environ. 32, 2453–2465.
Scudlark, J.R., Russell, K.M., Galloway, J.N., Church, T.M., Keene, W.C., 1998.Organic nitrogen in precipitation at the mid-Atlantic US coast — methodsevaluation and preliminary measurements. Atmos. Environ. 32 (10),1719–1728.
Tian, D.L., Xiang, W.H., Yang, W.H., 2002. Nutrient characteristics of hydrolog-ical process in young second rotation Chinese fir plantations. Acta Ecol. Sin.22, 859–865 (written in Chinese with English summary).
Violaki, K., Mihalopoulos, N., 2010. Water-soluble organic nitrogen (WSON)in size-segregated atmospheric particles over the Eastern Mediterra-nean. Atmos. Environ. 44, 4339–4345.
Vitousek, P.M., Aber, J.D., Howarth, R.W., Likens, G.E.,Matson, P.A., Schindler, D.W.,Schlesinger, W.H., Tilman, D.G., 1997. Human alteration of the globalnitrogen cycle: sources and consequences. Ecol. Appl. 7, 737–750.
Wang, X.M., Carmichael, G., Chen, D.L., Tang, Y.H., Wang, T.J., 2005. Impactsof different emission sources on air quality during March 2001 in thePearl River Delta (PRD) region. Atmos. Environ. 39, 5227–5241.
Wang, X.M., Lin, W.S., Yang, L.M., Deng, R.R., Lin, H., 2007. A Numerical Studyof Influences of urban land-use change on ozone distribution over thePearl River Delta Region, China. Tellus B 59B, 633–641.
Wang, X.M., Chen, F., Wu, Z.Y., Zhang, M.G., Tewari, M., Guenther, A.,Wiedinmyer, C., 2009. Impacts of weather conditions modified by urbanexpansion on surface ozone: comparison between the Pearl River Deltaand Yangtze River Delta regions. Adv. Atmos. Sci. 26 (5), 962–972.
Wu, X.J., Cai, T.J., Zhu, H., Sheng, H.C., 2008. Precipitation hydrochemicalcharacteristic in virgin Pinus koraiensis forest and artificial Larix gmeliniiforest in Liangshui national nature reserve. Sci. Soil Water Conserv. 6,37–42 (written in Chinese with English summary).
Xu, Y.G., Zhou, G.Y., Wu, Z.M., Luo, T.S., He, Z.C., 2001. Chemical compositionof precipitation, throughfall and soil solutions at two forested sites inGuangzhou, south China. Water Air Soil Pollut. 130, 1079–1084.
Yang, R., Hayashi, K., Zhu, B., Li, F., Yan, X., 2010. Atmospheric NH3 and NO2
concentration and nitrogen deposition in an agricultural catchment ofEastern China. Sci. Total. Environ. 408, 4624–4632.
Zhang, Q., Anastasio, C., 2001. Chemistry of fog waters in California's CentralValley — part 3: concentrations and speciation of organic and inorganicnitrogen. Atmos. Environ. 35 (32), 5629–5643.
Zhang, Y., Zheng, L.X., Liu, X.J., Jickells, T., Cape, J.N., Goulding, K., 2008.Evidence for organic N deposition and its anthropogenic sources inChina. Atmos. Environ. 42, 1035–1041.
Zhang, J., Zhang, G.S., Bi, Y.F., Liu, S.M., 2011. Nitrogen species in rainwater andaerosols of the Yellow and East China seas: effects of the East Asianmonsoon and anthropogenic emissions and relevance for the NW PacificOcean. Global Biogeochem. Cycles 25, GB3020, http://dx.doi.org/10.1029/2010GB003896.
Zhang, Y., Song, L., Liu, X.J., Li, W.Q., Lü, S.H., Zheng, L.X., Bai, Z.C., Cai, G.Y.,Zhang, F.S., 2012. Atmospheric organic nitrogen deposition in China.Atmos. Environ. 46, 195–204.
Zheng, J.Y., Zhang, L.J., Che, W.W., Zheng, Z.Y., Yin, S.S., 2009. A highlyresolved temporal and spatial air pollutant emission inventory for thePearl River Delta region, China and its uncertainty assessment. Atmos.Environ. 43, 5112–5122.