Optimum protein level for growth in juvenile bullfrog ( Rana catesbeiana Shaw, 1802
9
Optimum protein level for growth in juvenile bullfrog (Rana catesbeiana Shaw, 1802) Miguel A. Olvera-Novoa a, ⁎ , Víctor M. Ontiveros-Escutia a , Alejandro Flores-Nava a,b a Centro de Investigación y de Estudios Avanzados del IPN, Unidad Mérida (CINVESTAV), Km. 6 antigua carretera a Progreso, 97310 Mérida, Yucatan, Mexico b Universidad Marista de Mérida, Mexico Received 14 September 2006; received in revised form 6 February 2007; accepted 7 February 2007 Abstract An estimate was made of the optimum protein level in growth diets for bullfrog Rana catesbeiana. A nested design of six treatments with three replicates per treatment was used. Juvenile bullfrogs (8.84 ± 1.42 g average initial weight) were fed in lots at 6% body weight per day with six practical diets containing 20, 28, 34, 42 50 or 58% crude protein from fish meal. Each batch contained 12 frogs placed randomly in plastic cages with an automatic water sprinkler system to keep the animals wet and the cages clean. Cages were installed under a controlled environment: 28 °C temperature; 100% relative humidity; and 14L:10D photoperiod. The diets were assigned randomly to the cages. Results were evaluated in terms of survival, growth and feed efficiency. All the treatments showed 83% survival except the 28% protein diet, which had 60.44%. Productive performance tended to improve as protein level increased. The greatest growth was observed in the 58% protein diet, although this was not statistically different from the 42 and 50% protein diets. Feed conversion ratio (FCR) also improved as dietary protein level increased, with the best FCR in the 58% protein diet, although this was not significantly different from the 42 and 50% protein diets. Optimum protein level was estimated using a second-order quadratic regression using weight gain (%) and established as 39.21% crude protein at a protein: energy ratio of 81.34 mg P/kcal. Under the experimental conditions applied, a 40% crude protein level is recommended for growth in juvenile R. catesbeiana. © 2007 Elsevier B.V. All rights reserved. Keywords: Protein requirement; Bullfrog nutrition; Frog culture; Frog feeding 1. Introduction The market for anurans, mainly frogs, has grown substantially in response to rising demand for frog products in high purchasing power markets, both in the food industry and as live laboratory material. Bullfrog (Rana catesbeiana Shaw, 1802) is the most commer- cially important anuran species. Its biological attributes, such as size and muscle mass, have increased demand for it in international markets and lead to its cultivation in many Asian and Latin American countries (Pasteris et al., 2006). Of total worldwide bullfrog production, however, only an estimated 15% comes from culture, while the remaining proportion is from capture of wild stocks (Oza, 1990; Flores-Nava, 2005). The latter poses Aquaculture 266 (2007) 191 – 199 www.elsevier.com/locate/aqua-online ⁎ Corresponding author. Tel.: +52 999 124 2164; fax: +52 999 981 2334. E-mail addresses: [email protected] (M.A. Olvera-Novoa), [email protected] (A. Flores-Nava). 0044-8486/$ - see front matter © 2007 Elsevier B.V. All rights reserved. doi:10.1016/j.aquaculture.2007.02.013
Transcript of Optimum protein level for growth in juvenile bullfrog ( Rana catesbeiana Shaw, 1802
2007) 191–199www.elsevier.com/locate/aqua-online
Aquaculture 266 (
Optimum protein level for growth in juvenile bullfrog(Rana catesbeiana Shaw, 1802)
Miguel A. Olvera-Novoa a,⁎, Víctor M. Ontiveros-Escutia a, Alejandro Flores-Nava a,b
a Centro de Investigación y de Estudios Avanzados del IPN, Unidad Mérida (CINVESTAV), Km. 6 antigua carretera a Progreso,97310 Mérida, Yucatan, Mexico
b Universidad Marista de Mérida, Mexico
Received 14 September 2006; received in revised form 6 February 2007; accepted 7 February 2007
Abstract
An estimate was made of the optimum protein level in growth diets for bullfrog Rana catesbeiana. A nested design of sixtreatments with three replicates per treatment was used. Juvenile bullfrogs (8.84 ± 1.42 g average initial weight) were fed in lots at6% body weight per day with six practical diets containing 20, 28, 34, 42 50 or 58% crude protein from fish meal. Each batchcontained 12 frogs placed randomly in plastic cages with an automatic water sprinkler system to keep the animals wet and the cagesclean. Cages were installed under a controlled environment: 28 °C temperature; 100% relative humidity; and 14L:10D photoperiod.The diets were assigned randomly to the cages. Results were evaluated in terms of survival, growth and feed efficiency. All thetreatments showed 83% survival except the 28% protein diet, which had 60.44%. Productive performance tended to improve asprotein level increased. The greatest growth was observed in the 58% protein diet, although this was not statistically different fromthe 42 and 50% protein diets. Feed conversion ratio (FCR) also improved as dietary protein level increased, with the best FCR inthe 58% protein diet, although this was not significantly different from the 42 and 50% protein diets. Optimum protein level wasestimated using a second-order quadratic regression using weight gain (%) and established as 39.21% crude protein at a protein:energy ratio of 81.34 mg P/kcal. Under the experimental conditions applied, a 40% crude protein level is recommended for growthin juvenile R. catesbeiana.© 2007 Elsevier B.V. All rights reserved.
Keywords: Protein requirement; Bullfrog nutrition; Frog culture; Frog feeding
1. Introduction
The market for anurans, mainly frogs, has grownsubstantially in response to rising demand for frogproducts in high purchasing power markets, both in the
⁎ Corresponding author. Tel.: +52 999 124 2164; fax: +52 999 9812334.
E-mail addresses: [email protected](M.A. Olvera-Novoa), [email protected] (A. Flores-Nava).
0044-8486/$ - see front matter © 2007 Elsevier B.V. All rights reserved.doi:10.1016/j.aquaculture.2007.02.013
food industry and as live laboratory material. Bullfrog(Rana catesbeiana Shaw, 1802) is the most commer-cially important anuran species. Its biological attributes,such as size and muscle mass, have increased demandfor it in international markets and lead to its cultivationin many Asian and Latin American countries (Pasteriset al., 2006). Of total worldwide bullfrog production,however, only an estimated 15% comes from culture,while the remaining proportion is from capture of wildstocks (Oza, 1990; Flores-Nava, 2005). The latter poses
192 M.A. Olvera-Novoa et al. / Aquaculture 266 (2007) 191–199
significant ecological risks, including decreasing naturalpopulations and consequent predator–prey imbalances(Cooper, 1995; Allford and Richards, 1999).
Culture of frogs, principally bullfrog, has experiencednotable technological advances over the last 20 years,that have allowed for intensification of production undercontrolled conditions (Lopes-Lima and Agostinho,1998; Rodríguez et al., 1996; Flores-Nava, 1995, 1999,2001, 2005). Despite increasing culture of bullfrog, re-search is still needed on how to optimize productionparameters. Particularly urgent is research on nutritionand specifically this species’ protein requirement inthe juvenile stage, since the few studies in this areahave utilized commercial diets not formulated for frogs(Fontanello et al., 1984; Lopes Lima et al., 2003) or haveused animals in the terminal growth stages (Mazzoniet al., 1992). In addition, the specific protein require-ments of juvenile bullfrogs have not been studied undercontrolled conditions. In response, the present studyaimed to estimate the protein requirement for optimumgrowth of juvenile R. catesbeiana under controlled, lab-oratory conditions to help in formulating specific diets.
2. Materials and methods
2.1. Biological materials
The experiment used 250 juvenile bullfrogs (R. ca-tesbeiana; 8.84 ± 1.42 g mean weight) from the samecohort provided by a commercial farm. Of these, 216were used in the protein requirement trial and 25 weretaken for the initial proximate analysis.
2.2. Experimental diets
Six experimental diets were formulated using fishmeal as the sole protein source, each with a differentprotein level: 20 (P20), 28 (P28), 34 (P34), 42 (P42), 50(P50) and 58% (P58). These were made by first mixingthe dry ingredients finely ground (300 μm), until forminga uniform flour. Oil was then added while still mixinguntil completely incorporated, and then pre-cookedstarch and water were added to provide the properpaste texture for processing. This paste was runthrough a meat grinder to form granules, which weredried at <38 °C for 24 h in a forced air dryer. Oncecompletely moisture-free the granulated diets were packedin dark-colored containers and refrigerated until use.
Diet formulation and calculation of the amino acidprofile is included in Table 1. Diet caloric content(average = 481.26 kcal/100 g−1) was calculated as afunction of gross energy content in the carcasses of frogs
of a similar age, and determined by combustion using anadiabatic calorimeter.
2.3. Experimental procedure
The trial was done at CINVESTAV in Mérida,Yucatán, México, using an isolated laboratory withcontrolled environment: 28 °C ambient temperature;100% relative humidity; 14L:10D photoperiod. Experi-mental units were 18 plastic cages (44 cm long × 31 cmwide × 22 cm high) with 0.12 m2 of individual space,arranged in six modules of three cages each (Fig. 1).Every one was equipped with a water sprinkler to keepthe animals wet and to maintain the cage clean of feces.The automatic sprinkler system delivered water for 1minevery 15 min over a 24 h period during the seven-weekstudy period. An acrylic plastic tube feeder was placed ineach cage, and protected from the water spray to preventthe feed from becoming wet.
Twelve frogs were placed randomly in each cage,resulting in an overall density of 100 animals per squaremeter to resemble commercial conditions. The animalswere allowed to adjust to laboratory and handlingconditions for 15 days before being fed the experimentaldiets. During this period they received a pelleted troutfeed (45% crude protein) at a rate of 6% biomass perday, with a ration of 75% feed and 25% fly (Muscadomestica) larvae. The latter were provided to stimulatefeed intake by their movement, and were producedaseptically in the CINVESTAVAquaculture Laboratory.
Prior the feeding with the experimental diets, a trialwas done to determine the protein contribution of thelarvae to the daily ration. Larva protein digestibility wasdetermined using the method suggested by Hepher(1988), using the chitin of the larva exoskeleton as anexternal marker since frogs cannot digest this carbohy-drate (Duellman and Trueb, 1994). For this trial a groupof frogs was placed in fiberglass tanks and fed under thesame regimen described for the experiment. Their feceswere collected daily, the larval remains separated bywashing and screening, then dried and analyzed to makethe corresponding calculations.
The experimental diets were assigned to the cagesusing a completely random design with replications.Feed was administered manually twice daily, 50% at0800 h and 50% at 1700 h, 7 days a week. Daily rationper cage was adjusted weekly after the animals wereweighed or when an animal died. Remaining feed wascollected daily, dried at 105 °C for 12 h and weighed todetermine feed intake.
All the experimental animals were weighed indivi-dually at the beginning of the study period and weekly
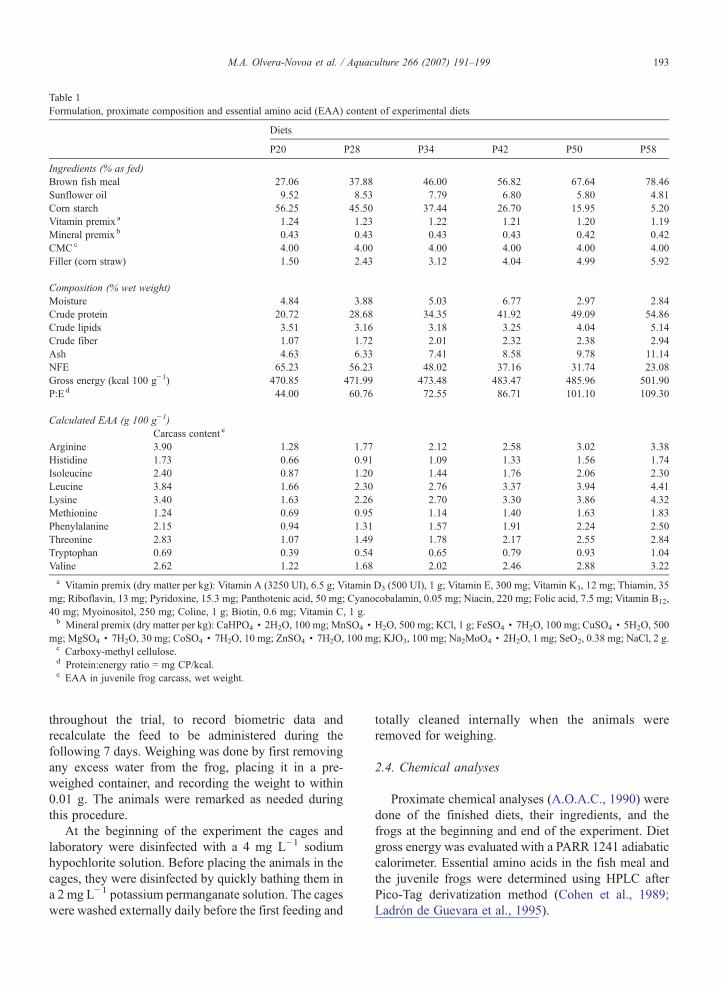
Table 1Formulation, proximate composition and essential amino acid (EAA) content of experimental diets
Diets
P20 P28 P34 P42 P50 P58
Ingredients (% as fed)Brown fish meal 27.06 37.88 46.00 56.82 67.64 78.46Sunflower oil 9.52 8.53 7.79 6.80 5.80 4.81Corn starch 56.25 45.50 37.44 26.70 15.95 5.20Vitamin premix a 1.24 1.23 1.22 1.21 1.20 1.19Mineral premix b 0.43 0.43 0.43 0.43 0.42 0.42CMCc 4.00 4.00 4.00 4.00 4.00 4.00Filler (corn straw) 1.50 2.43 3.12 4.04 4.99 5.92
Composition (% wet weight)Moisture 4.84 3.88 5.03 6.77 2.97 2.84Crude protein 20.72 28.68 34.35 41.92 49.09 54.86Crude lipids 3.51 3.16 3.18 3.25 4.04 5.14Crude fiber 1.07 1.72 2.01 2.32 2.38 2.94Ash 4.63 6.33 7.41 8.58 9.78 11.14NFE 65.23 56.23 48.02 37.16 31.74 23.08Gross energy (kcal 100 g−1) 470.85 471.99 473.48 483.47 485.96 501.90P:E d 44.00 60.76 72.55 86.71 101.10 109.30
Calculated EAA (g 100 g−1)Carcass content e
Arginine 3.90 1.28 1.77 2.12 2.58 3.02 3.38Histidine 1.73 0.66 0.91 1.09 1.33 1.56 1.74Isoleucine 2.40 0.87 1.20 1.44 1.76 2.06 2.30Leucine 3.84 1.66 2.30 2.76 3.37 3.94 4.41Lysine 3.40 1.63 2.26 2.70 3.30 3.86 4.32Methionine 1.24 0.69 0.95 1.14 1.40 1.63 1.83Phenylalanine 2.15 0.94 1.31 1.57 1.91 2.24 2.50Threonine 2.83 1.07 1.49 1.78 2.17 2.55 2.84Tryptophan 0.69 0.39 0.54 0.65 0.79 0.93 1.04Valine 2.62 1.22 1.68 2.02 2.46 2.88 3.22
a Vitamin premix (dry matter per kg): Vitamin A (3250 UI), 6.5 g; Vitamin D3 (500 UI), 1 g; Vitamin E, 300 mg; Vitamin K3, 12 mg; Thiamin, 35mg; Riboflavin, 13 mg; Pyridoxine, 15.3 mg; Panthotenic acid, 50 mg; Cyanocobalamin, 0.05 mg; Niacin, 220 mg; Folic acid, 7.5 mg; Vitamin B12,40 mg; Myoinositol, 250 mg; Coline, 1 g; Biotin, 0.6 mg; Vitamin C, 1 g.b Mineral premix (dry matter per kg): CaHPO4 · 2H2O, 100 mg; MnSO4 · H2O, 500 mg; KCl, 1 g; FeSO4 · 7H2O, 100 mg; CuSO4 · 5H2O, 500
mg; MgSO4 · 7H2O, 30 mg; CoSO4 · 7H2O, 10 mg; ZnSO4 · 7H2O, 100 mg; KJO3, 100 mg; Na2MoO4 · 2H2O, 1 mg; SeO2, 0.38 mg; NaCl, 2 g.c Carboxy-methyl cellulose.d Protein:energy ratio = mg CP/kcal.e EAA in juvenile frog carcass, wet weight.
193M.A. Olvera-Novoa et al. / Aquaculture 266 (2007) 191–199
throughout the trial, to record biometric data andrecalculate the feed to be administered during thefollowing 7 days. Weighing was done by first removingany excess water from the frog, placing it in a pre-weighed container, and recording the weight to within0.01 g. The animals were remarked as needed duringthis procedure.
At the beginning of the experiment the cages andlaboratory were disinfected with a 4 mg L−1 sodiumhypochlorite solution. Before placing the animals in thecages, they were disinfected by quickly bathing them ina 2 mg L−1 potassium permanganate solution. The cageswere washed externally daily before the first feeding and
totally cleaned internally when the animals wereremoved for weighing.
2.4. Chemical analyses
Proximate chemical analyses (A.O.A.C., 1990) weredone of the finished diets, their ingredients, and thefrogs at the beginning and end of the experiment. Dietgross energy was evaluated with a PARR 1241 adiabaticcalorimeter. Essential amino acids in the fish meal andthe juvenile frogs were determined using HPLC afterPico-Tag derivatization method (Cohen et al., 1989;Ladrón de Guevara et al., 1995).
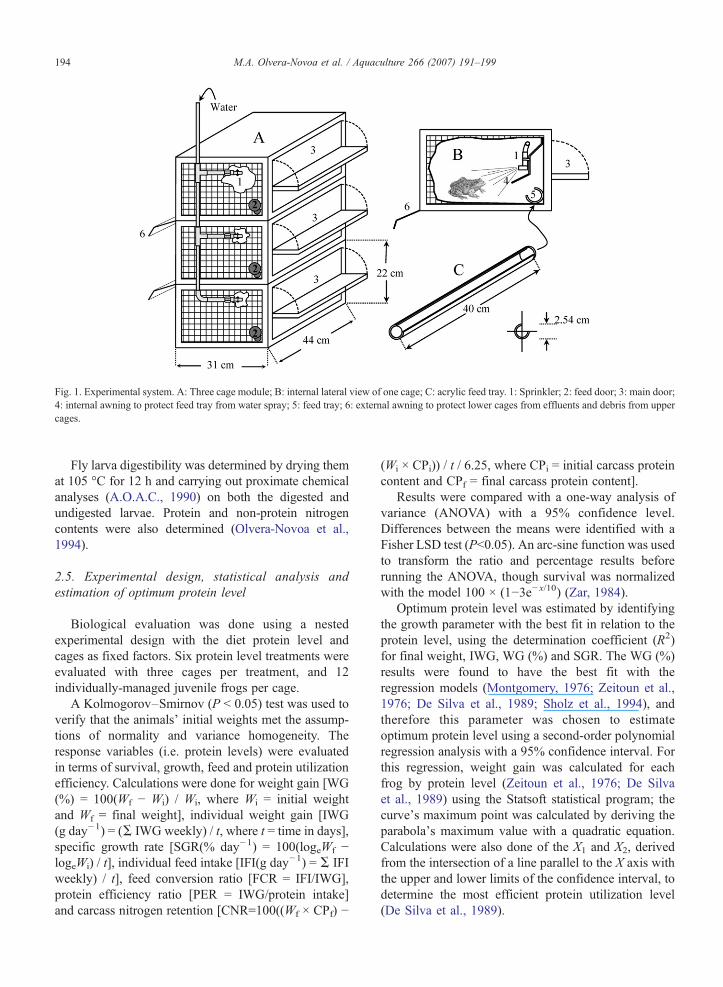
Fig. 1. Experimental system. A: Three cage module; B: internal lateral view of one cage; C: acrylic feed tray. 1: Sprinkler; 2: feed door; 3: main door;4: internal awning to protect feed tray from water spray; 5: feed tray; 6: external awning to protect lower cages from effluents and debris from uppercages.
194 M.A. Olvera-Novoa et al. / Aquaculture 266 (2007) 191–199
Fly larva digestibility was determined by drying themat 105 °C for 12 h and carrying out proximate chemicalanalyses (A.O.A.C., 1990) on both the digested andundigested larvae. Protein and non-protein nitrogencontents were also determined (Olvera-Novoa et al.,1994).
2.5. Experimental design, statistical analysis andestimation of optimum protein level
Biological evaluation was done using a nestedexperimental design with the diet protein level andcages as fixed factors. Six protein level treatments wereevaluated with three cages per treatment, and 12individually-managed juvenile frogs per cage.
A Kolmogorov–Smirnov (P < 0.05) test was used toverify that the animals’ initial weights met the assump-tions of normality and variance homogeneity. Theresponse variables (i.e. protein levels) were evaluatedin terms of survival, growth, feed and protein utilizationefficiency. Calculations were done for weight gain [WG(%) = 100(Wf − Wi) / Wi, where Wi = initial weightand Wf = final weight], individual weight gain [IWG(g day−1) = (Σ IWG weekly) / t, where t = time in days],specific growth rate [SGR(% day−1) = 100(logeWf −logeWi) / t], individual feed intake [IFI(g day
−1) = Σ IFIweekly) / t], feed conversion ratio [FCR = IFI/IWG],protein efficiency ratio [PER = IWG/protein intake]and carcass nitrogen retention [CNR=100((Wf × CPf) −
(Wi × CPi)) / t / 6.25, where CPi = initial carcass proteincontent and CPf = final carcass protein content].
Results were compared with a one-way analysis ofvariance (ANOVA) with a 95% confidence level.Differences between the means were identified with aFisher LSD test (P<0.05). An arc-sine function was usedto transform the ratio and percentage results beforerunning the ANOVA, though survival was normalizedwith the model 100 × (1−3e− x/10) (Zar, 1984).
Optimum protein level was estimated by identifyingthe growth parameter with the best fit in relation to theprotein level, using the determination coefficient (R2)for final weight, IWG, WG (%) and SGR. The WG (%)results were found to have the best fit with theregression models (Montgomery, 1976; Zeitoun et al.,1976; De Silva et al., 1989; Sholz et al., 1994), andtherefore this parameter was chosen to estimateoptimum protein level using a second-order polynomialregression analysis with a 95% confidence interval. Forthis regression, weight gain was calculated for eachfrog by protein level (Zeitoun et al., 1976; De Silvaet al., 1989) using the Statsoft statistical program; thecurve's maximum point was calculated by deriving theparabola's maximum value with a quadratic equation.Calculations were also done of the X1 and X2, derivedfrom the intersection of a line parallel to the X axis withthe upper and lower limits of the confidence interval, todetermine the most efficient protein utilization level(De Silva et al., 1989).

Table 2Protein and non-protein nitrogen content, proximate composition anddigestibility of domestic fly larva carcass (dry basis)
Composition
Undigestedlarvae
Digestedlarvae
Difference Digestibility
Content (%)Total nitrogen a 7.70 7.43 0.27Non-protein
nitrogen1.26 3.01 −1.75
Proteinnitrogen
6.43 4.42 2.01
Gross protein b 48.11 46.45 1.66
Proximate compositionMoisture 73.13 – –Crude protein c 40.21 27.63 12.58 82.97Ether extract 7.18 8.09 72.12Crude fiber 5.58 22.51 0.00Ash 11.51 12.61 72.84NFE 27.62 10.34 –a Total nitrogen = non-protein nitrogen + protein nitrogen.b Gross protein = total nitrogen × 6.25.c Crude protein = protein nitrogen × 6.25.
195M.A. Olvera-Novoa et al. / Aquaculture 266 (2007) 191–199
The optimum protein:energy ratio was calculatedusing a linear regression between the experimental diets’energy and protein levels (Ricker, 1973) and thencalculating the predictive value of the dependantvariable for the estimated optimum protein value.
3. Results
3.1. Production performance
The fly larvae used as an intake stimulant provided3.38% (wet basis) of the dietary protein. Given that therations included 25% larvae, their protein contribution
Table 3Mean growth and feeding efficiency of bullfrogs fed experimental diets
Mean values1 Diets
P20 P28 P40
Survival (%) 88.89ab 60.44b 83.33ab
Initial weight (g) 8.52a 8.97a 8.12a
Final weight (g) 32.71d 45.29c 51.03bc
Weight gain (%) 283.66e 404.90d 459.60c
IWG (g day−1) 0.48d 0.73c 0.84b
SGR (% day−1) 2.69e 3.24d 3.44c
MFI (g day−1) 0.74b 0.94ab 1.09a
FCR 1.52a 1.29ab 1.30ab
PER 3.28a 2.71ab 2.27bc
CNR (mg day−1) 1.21e 1.72d 1.88cd
1Values with the same superscripts are not significantly different (P < 0.05).2SE=SD/√n /k, where n = number of observations, and k = number of leve
to daily intake was estimated at 0.85% with 82.97%digestibility (Table 2). Because of their low-proteincontribution the larvae were not included in dailyprotein intake calculations.
Table 3 shows the survival, growth and feedutilization efficiency results for juvenile frogs after 49days of feeding at different dietary protein levels.Mortality was highest in those diets with less than 42%protein, with significantly higher (P < 0.05) mortality intreatment P28, and no mortality in treatments P42, P50and P58.
Average final weight was directly related to dietaryprotein level, with higher average body weight in thoseanimals fed the highest protein levels. Animals in theP42, P50 and P58 treatments were significantly heavierthan animals in the other treatments, while those intreatments with lower protein levels had significantlylower weights (Table 3). Animals in the P58 and P42treatments had higher growth performance, withsignificantly higher WG (%), IWG (mg day−1) andSGR (% day−1) values.
No notable relationship was observed betweenprotein level and feed intake since animals given dietscontaining 28% or more protein did not have signifi-cantly different feed consumption, although they all hadintakes significantly higher than animals in the P20treatment. The best FCR was observed in the treatmentswith protein levels greater than 42%, in which theanimals had significantly lower values than those in dietswith less protein. The FCR in the P20 treatment wassignificantly higher than in the other treatments. Frogs inthe lower protein level diets also had higher (P < 0.05)PER values, although CNR was significantly higher inthe frogs given diets containing 42% or more protein.
Dietary protein level had a variable effect on carcasscomposition (Table 4). Carcass water content was
P42 P50 P58 ± SE2
97.22a 100.00a 100.00a 6.808.83a 8.74a 8.81a 0.2455.71ab 51.71abc 58.74a 2.72530.83ab 491.67bc 566.26a 18.110.94ab 0.86b 1.00a 0.033.68ab 3.56bc 3.79a 0.061.17a 1.05a 1.00a 0.081.25abc 1.22bc 0.99c 0.091.93c 1.68c 1.85c 0.202.22ab 2.05bc 2.40a 0.76
ls.
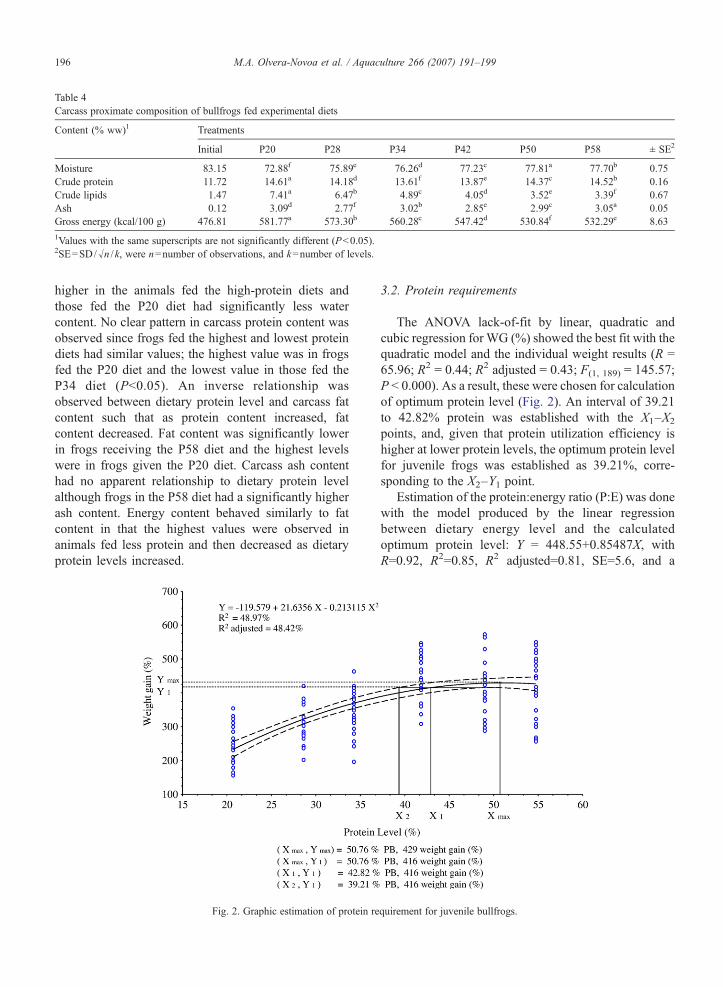
Table 4Carcass proximate composition of bullfrogs fed experimental diets
Content (% ww)1 Treatments
Initial P20 P28 P34 P42 P50 P58 ± SE2
Moisture 83.15 72.88f 75.89e 76.26d 77.23c 77.81a 77.70b 0.75Crude protein 11.72 14.61a 14.18d 13.61f 13.87e 14.37c 14.52b 0.16Crude lipids 1.47 7.41a 6.47b 4.89c 4.05d 3.52e 3.39f 0.67Ash 0.12 3.09d 2.77f 3.02b 2.85e 2.99c 3.05a 0.05Gross energy (kcal/100 g) 476.81 581.77a 573.30b 560.28c 547.42d 530.84f 532.29e 8.63
1Values with the same superscripts are not significantly different (P<0.05).2SE=SD/√n /k, were n=number of observations, and k=number of levels.
196 M.A. Olvera-Novoa et al. / Aquaculture 266 (2007) 191–199
higher in the animals fed the high-protein diets andthose fed the P20 diet had significantly less watercontent. No clear pattern in carcass protein content wasobserved since frogs fed the highest and lowest proteindiets had similar values; the highest value was in frogsfed the P20 diet and the lowest value in those fed theP34 diet (P<0.05). An inverse relationship wasobserved between dietary protein level and carcass fatcontent such that as protein content increased, fatcontent decreased. Fat content was significantly lowerin frogs receiving the P58 diet and the highest levelswere in frogs given the P20 diet. Carcass ash contenthad no apparent relationship to dietary protein levelalthough frogs in the P58 diet had a significantly higherash content. Energy content behaved similarly to fatcontent in that the highest values were observed inanimals fed less protein and then decreased as dietaryprotein levels increased.
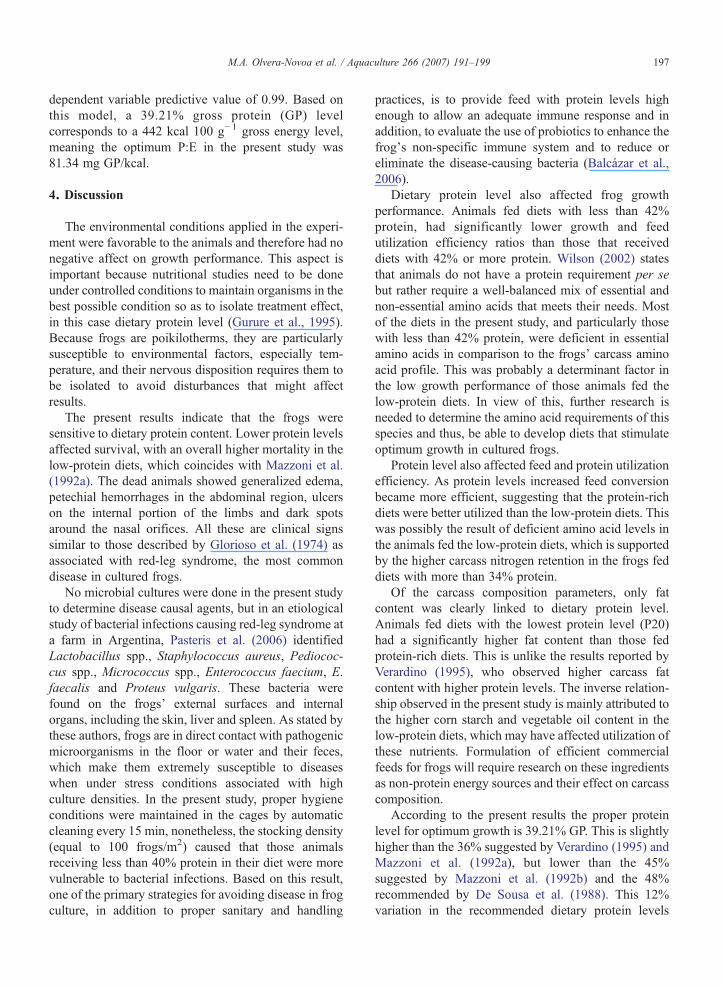
Fig. 2. Graphic estimation of protein re
3.2. Protein requirements
The ANOVA lack-of-fit by linear, quadratic andcubic regression for WG (%) showed the best fit with thequadratic model and the individual weight results (R =65.96; R2 = 0.44; R2 adjusted = 0.43; F(1, 189) = 145.57;P < 0.000). As a result, these were chosen for calculationof optimum protein level (Fig. 2). An interval of 39.21to 42.82% protein was established with the X1–X2
points, and, given that protein utilization efficiency ishigher at lower protein levels, the optimum protein levelfor juvenile frogs was established as 39.21%, corre-sponding to the X2–Y1 point.
Estimation of the protein:energy ratio (P:E) was donewith the model produced by the linear regressionbetween dietary energy level and the calculatedoptimum protein level: Y = 448.55+0.85487X, withR=0.92, R2=0.85, R2 adjusted=0.81, SE=5.6, and a
quirement for juvenile bullfrogs.
197M.A. Olvera-Novoa et al. / Aquaculture 266 (2007) 191–199
dependent variable predictive value of 0.99. Based onthis model, a 39.21% gross protein (GP) levelcorresponds to a 442 kcal 100 g−1 gross energy level,meaning the optimum P:E in the present study was81.34 mg GP/kcal.
4. Discussion
The environmental conditions applied in the experi-ment were favorable to the animals and therefore had nonegative affect on growth performance. This aspect isimportant because nutritional studies need to be doneunder controlled conditions to maintain organisms in thebest possible condition so as to isolate treatment effect,in this case dietary protein level (Gurure et al., 1995).Because frogs are poikilotherms, they are particularlysusceptible to environmental factors, especially tem-perature, and their nervous disposition requires them tobe isolated to avoid disturbances that might affectresults.
The present results indicate that the frogs weresensitive to dietary protein content. Lower protein levelsaffected survival, with an overall higher mortality in thelow-protein diets, which coincides with Mazzoni et al.(1992a). The dead animals showed generalized edema,petechial hemorrhages in the abdominal region, ulcerson the internal portion of the limbs and dark spotsaround the nasal orifices. All these are clinical signssimilar to those described by Glorioso et al. (1974) asassociated with red-leg syndrome, the most commondisease in cultured frogs.
No microbial cultures were done in the present studyto determine disease causal agents, but in an etiologicalstudy of bacterial infections causing red-leg syndrome ata farm in Argentina, Pasteris et al. (2006) identifiedLactobacillus spp., Staphylococcus aureus, Pediococ-cus spp., Micrococcus spp., Enterococcus faecium, E.faecalis and Proteus vulgaris. These bacteria werefound on the frogs’ external surfaces and internalorgans, including the skin, liver and spleen. As stated bythese authors, frogs are in direct contact with pathogenicmicroorganisms in the floor or water and their feces,which make them extremely susceptible to diseaseswhen under stress conditions associated with highculture densities. In the present study, proper hygieneconditions were maintained in the cages by automaticcleaning every 15 min, nonetheless, the stocking density(equal to 100 frogs/m2) caused that those animalsreceiving less than 40% protein in their diet were morevulnerable to bacterial infections. Based on this result,one of the primary strategies for avoiding disease in frogculture, in addition to proper sanitary and handling
practices, is to provide feed with protein levels highenough to allow an adequate immune response and inaddition, to evaluate the use of probiotics to enhance thefrog's non-specific immune system and to reduce oreliminate the disease-causing bacteria (Balcázar et al.,2006).
Dietary protein level also affected frog growthperformance. Animals fed diets with less than 42%protein, had significantly lower growth and feedutilization efficiency ratios than those that receiveddiets with 42% or more protein. Wilson (2002) statesthat animals do not have a protein requirement per sebut rather require a well-balanced mix of essential andnon-essential amino acids that meets their needs. Mostof the diets in the present study, and particularly thosewith less than 42% protein, were deficient in essentialamino acids in comparison to the frogs’ carcass aminoacid profile. This was probably a determinant factor inthe low growth performance of those animals fed thelow-protein diets. In view of this, further research isneeded to determine the amino acid requirements of thisspecies and thus, be able to develop diets that stimulateoptimum growth in cultured frogs.
Protein level also affected feed and protein utilizationefficiency. As protein levels increased feed conversionbecame more efficient, suggesting that the protein-richdiets were better utilized than the low-protein diets. Thiswas possibly the result of deficient amino acid levels inthe animals fed the low-protein diets, which is supportedby the higher carcass nitrogen retention in the frogs feddiets with more than 34% protein.
Of the carcass composition parameters, only fatcontent was clearly linked to dietary protein level.Animals fed diets with the lowest protein level (P20)had a significantly higher fat content than those fedprotein-rich diets. This is unlike the results reported byVerardino (1995), who observed higher carcass fatcontent with higher protein levels. The inverse relation-ship observed in the present study is mainly attributed tothe higher corn starch and vegetable oil content in thelow-protein diets, which may have affected utilization ofthese nutrients. Formulation of efficient commercialfeeds for frogs will require research on these ingredientsas non-protein energy sources and their effect on carcasscomposition.
According to the present results the proper proteinlevel for optimum growth is 39.21% GP. This is slightlyhigher than the 36% suggested by Verardino (1995) andMazzoni et al. (1992a), but lower than the 45%suggested by Mazzoni et al. (1992b) and the 48%recommended by De Sousa et al. (1988). This 12%variation in the recommended dietary protein levels
198 M.A. Olvera-Novoa et al. / Aquaculture 266 (2007) 191–199
highlights a lack of consensus on the optimum proteinlevel for growth in juvenile bullfrogs, which may berelated with the experimental methods applied.
UnlikeDe Sousa et al. (1988),Mazzoni et al. (1992a,b)and Verardino (1995), the recommended protein level inthe present study was generated using a polynomialregression analysis. This is considered the most reliablestatistical method to link growth data to protein levels(De Silva et al., 1989; Shearer, 2000), has the lowesterror in estimation of nutritional requirements (Wilson,2002) and allows identification of the most economic-ally efficient dietary protein level using the confidencelimits of the curve produced (Zeitoun et al., 1976; DeSilva et al., 1989). Therefore, following De Silva et al.(1989), the X1 (39.21%) and X2 (42.82%) valuesextrapolated using the curve's confidence limits wouldrepresent the dietary protein levels that minimizeproduction costs without affecting growth, and thecalculated Xmax value (50.76%) would be that whichsupports maximum growth though it would clearlynegatively affect operating costs due to the high cost ofprotein.
The experimental diets had between 470.85 kcal100 g−1 (P20) and 501.90 kcal 100 g−1 (P58) of grossenergy, meaning a range of 31.05 kcal 100 g−1 couldaffect animal growth. A linear regression analysisbetween diet protein levels and caloric content showedthat recommended protein level (39.21%) correspondedto an energy level of 482 kcal 100 g−1, which is similar tothe frogs’ initial carcass energy value (476.81 kcal100 g−1). Therefore, until this species’ digestible energyrequirements are determined, it is suggested that valuessimilar to those established here be used for dietformulation, including a P:E of 81.34 mg PB/kcal.
In conclusion, the results indicate that frogs ingrowth stage are highly susceptible to dietary proteincontent. The animals fed diets with protein levels below40% had lower growth rates, less efficient feedutilization and were very vulnerable to opportunisticmicrobial diseases. Recommended dietary protein levelis at least 39.21% with a 482 kcal 100 g−1 gross caloriccontent and a P:E of 81.34 mg GP/kcal. Further researchis needed to identify this species’ amino acid require-ments and evaluate diet formulations with protein mixesthat meet its nutritional needs at the least possible cost.In addition, studies are needed to characterize thisspecies’ intestinal microflora, to identify indigenousmicroorganisms with probiotic properties for incorpora-tion into the diet, in an effort to displace theopportunistic pathogenic bacteria present in the diges-tive tract and the culture's environment that cause red-leg syndrome.
Acknowledgements
This research was supported by the Consejo Nacionalde Ciencia y Tecnología (CONACYT, Mexico) througha grant (Project 1746-A9209) and a Masters scholarship(900038) awarded to VM Ontiveros. The authors thankCAMPI feed mill for providing diet ingredients, andLeticia Olivera, Cesar Puerto and Wilberth Ché of theCINVESTAV Aquaculture Nutrition Laboratory fortheir assistance with the proximate chemical analyses.
References
Allford, R.A., Richards, S.J., 1999. Global amphibian declines: aproblem in applied ecology. Ann. Rev. Ecolog. Syst. 30, 133–165.
A.O.A.C., 1990. Official Methods of Analysis of the Association ofOfficial Analytical Chemists15th ed. AOAC,Arlington, VA. 1141 pp.
Balcázar, J.L., de Blas, I., Ruiz-Zarzuela, I., Cunningham, D.,Vendrell, D., Múzquis, J.L., 2006. The role of probiotics inaquaculture. Vet. Microbiol. 114, 173–186.
Cohen, S., Meys, M., Tarvin, T., 1989. The Pico-Tag Method: AManual of Advanced Techniques for Amino Acid Analysis. WatersMillipore Corporation, MA, USA. 123 pp.
Cooper, M.E., 1995. Legal and ethical aspects of new wildlife foodsources. Biodivers. Conserv. 4, 322–335.
De Silva, S.S., Gunasekera, R.M., Atapattu, D., 1989. The dietaryprotein requirement of young tilapia and an evaluation of the leastcost dietary protein levels. Aquaculture 80, 271–284.
De Sousa, M.E., Lopes-Lima, S., Agostinho, C.A., 1988. Avaliançao dedesempenho de rã touro gigante (Rana catesbeiana Shaw) alimenta-das com diferentes niveis de proteina. Anais do VIII EncontroNacional de Ranicultura, Río de Janeiro, Brazil, pp. 356–357.
Duellman, W.F., Trueb, L., 1994. Biology of Amphibians. HopkinsUniversity Press, USA. 670 pp.
Flores-Nava, A., 1995. An overview of frog farming in Mexico. Proc.InfoFish-Aquatech '94. INFOFISH, Kuala Lumpur, Malaysia,pp. 131–137.
Flores-Nava,A., 1999.Cultivo Intensivo deRanaToro. ProgramaRegionaldeApoyo alDesarrollo de la Pesca en el IstmoCentroamericano-UniónEuropea, Panamá, Rep. de Panamá. 42 pp.
Flores-Nava, A., 2001. Generalidades del cultivo de la rana toro Ranacatesbeiana, Shaw, 1802. In: Jaramillo, J.T., Olivera, J., Velásquez,J. (Eds.), Manejo y Reproducción de Vida Silvestre. Univ. Aut.Metropol., México, pp. 211–233.
Flores-Nava, A., 2005. Cultured Aquatic Species InformationProgramme — Rana catesbeiana. FAO Inland Water Resourcesand Aquaculture Service (FIRI). Cultured Aquatic Species FactSheets. FAO, Rome. Updated Fri Apr 21 11:41:24 CEST 2006.Available via FIGIS from http://www.fao.org/figis/servlet/static?dom=culturespecies&xml=Rana_catesbeiana.xml.
Fontanello, D., Arruda, H., Mandelli, J., Reis, J.M., 1984. Manejoalimentar de rãs. Mem. IV Encontro Nacional de Ranicultores. Riode Janeiro, Brasil, 5–9, novembro. Assoc. Bras. Dos Criadores deRãs, pp. 91–104.
Glorioso, J.C., Amborski, R.L., Amborski, G.F., Culley Jr., D.D.,1974. Microbiological studies on septicemic bullfrogs (Ranacatesbeiana). Am. J. Vet. Res. 35 (9), 1241–1245.
Gurure, R.M., Moccia, R.D., Atkinson, J.L., 1995. Optimal proteinrequirements for young Artic charr (Salvelinus alpinus) fedpractical diets. Aquac. Nutr. 1, 227–234.
199M.A. Olvera-Novoa et al. / Aquaculture 266 (2007) 191–199
Hepher, B., 1988. Nutrition of Pond Fishes. Cambridge UniversityPress, USA. 388 pp.
Ladrón de Guevara, O., Padilla, P., García, L., Pino, J.M., 1995.Amino acid determination in some edible Mexican insects. AminoAcids 9, 161–173.
Lopes-Lima, S., Agostinho, C.A., 1998. A criação de rãs. PublicaçõesGlobo Rural, Río de Janeiro, Brasil. 187 pp.
Lopes Lima, S., Casali, A.P., Agostinho, C.A., 2003. Performance andfood intake of bullfrogs (Rana catesbeiana) during the post-metamorphic stage in the “amphifarm” system. R. Bras. Zootec.Viçosa vol. 32 (3). Available from: <http://www.scielo.br.
Mazzoni, R., Carnevia, D., Rosso, A., Salvo,M.A., 1992a. Estudios delporcentaje de proteína en el alimento paletizado para engorda derana toro (Rana catesbeiana Shaw, 1802). Anais de Xii EncontroNacional de Ranicultura, Río de Janeiro, Brazil, pp. 191–199.
Mazzoni, R., Carnevia, D., Rosso, A., Salvo, M.A., Areoso, A.,Antoniello, A., 1992b. Estudios del porcentaje de proteína y laenergía en el alimento paletizado para engorda de rana toro (Ranacatesbeiana Shaw, 1802). Anais de XII Encontro Nacional deRanicultura, Río de Janeiro, Brazil, pp. 185–190.
Montgomery, D.C., 1976. Design and Analysis of Experiments. JohnWilley & Son, USA. 418 pp.
Olvera-Novoa, M.A., Martínez-Palacios, C.A., Real de, L.E., 1994.Nutrition of Fish and Crustaceans — a Laboratory Manual. FAO.GCP/RLA/102/ITA, Field Document No. 19. 58 pp.
Oza, G.M., 1990. Ecological effects of the frog's legs trade.Environmentalist 10 (1), 39–41.
Pasteris, S.E., Bühler, M.I., Nader-Macías, M.E., 2006. Microbiologi-cal and histological studies of farmed bullfrog (Rana catesbeiana)tissues displaying red-leg syndrome. Aquaculture 251, 11–18.
Ricker, E.E., 1973. Linear regression in fishery research. J. Fish. Res.Board Can. 30 (3), 409–434.
Rodríguez, S.M., Flores-Nava, A., Olvera-Novoa, M.A., Carmona,O.C., 1996. Growth and production of bullfrog Rana catesbeianaShaw, 1802, at three stocking densities in a vertical intensiveculture system. Aquac. Eng. 15 (4), 233–244.
Shearer, K.D., 2000. Experimental design, statistical analysis andmodeling of dietary nutrient requirement studies for fish: a criticalreview. Aquac. Nutr. 6, 91–102.
Sholz, P.M., Edwards, D., Dean, J.M., Palm Jr., R.C., 1994. Use of thequadratic response model to estimate optimum combinations ofnutritional variables. Trans. Am. Fish. Soc. 123, 266–272.
Verardino, M., 1995. Niveles de proteina adequada ao crecimento dera-touro (Rana catesbeiana Shaw, 1802). Proc. First Internacio-nal Meeting on Frog Research and Technology, Viçosa, Brazil,pp. 65–66.
Wilson, R.P., 2002. Amino acids and proteins, In: Halver, J.E., Hardy,R.W. (Eds.), Fish Nutrition, third edition. Academic Press,Amsterdam, pp. 144–181.
Zar, J.H., 1984. Biostatistical Analysis 2nd ed. Prentice Hall Inc.,USA. 718 pp.
Zeitoun, I.H., Ullrey, D.E., Magee, W.T., Gill, J.L., Bergen, W.G.,1976. Quantifying nutrient requirements of fish. J. Fish. Res.Board Can. 33 (1), 167–172.