Optimum design of 3D reinforced concrete frames using IPGO ...
24
Optimum design of 3D reinforced concrete frames using IPGO algorithm Ali Kaveh ( [email protected] ) Iran University of Science & Technology https://orcid.org/0000-0002-5428-4788 Shaylin Rezazadeh Ardebili Iran University of Science and Technology Research Article Keywords: 3D Reinforced concrete frames, Structural optimization, Improved plasma generation optimization (IPGO) algorithm, Metaheuristics Posted Date: June 7th, 2022 DOI: https://doi.org/10.21203/rs.3.rs-1507625/v1 License: This work is licensed under a Creative Commons Attribution 4.0 International License. Read Full License
-
Upload
khangminh22 -
Category
Documents
-
view
0 -
download
0
Transcript of Optimum design of 3D reinforced concrete frames using IPGO ...

Optimum design of 3D reinforced concrete framesusing IPGO algorithmAli Kaveh ( [email protected] )
Iran University of Science & Technology https://orcid.org/0000-0002-5428-4788Shaylin Rezazadeh Ardebili
Iran University of Science and Technology
Research Article
Keywords: 3D Reinforced concrete frames, Structural optimization, Improved plasma generationoptimization (IPGO) algorithm, Metaheuristics
Posted Date: June 7th, 2022
DOI: https://doi.org/10.21203/rs.3.rs-1507625/v1
License: This work is licensed under a Creative Commons Attribution 4.0 International License. Read Full License

Optimum design of 3D reinforced concrete frames using IPGO algorithm
Ali Kaveh* and Shaylin Rezazadeh Ardebili
School of Civil Engineering, Iran University of Science and Technology, Narmak,
Tehran, P.O. Box 16846-13114, Iran
Abstract
In this paper, optimum design of three-dimensional (3D) multi-story reinforced concrete (RC)
structures is obtained using an improved version of the plasma generation optimization (IPGO)
algorithm. The reinforcing bars and geometry of the cross-sections are considered as discrete
variables that are chosen from a prearranged section database. The objective function is obtained
from the cost of the framework, steel and concrete. The moment and shear frames are selected to
design according to the American Concrete Institute’s Building Code (ACI 318-8) requirements.
The effectiveness of the proposed algorithm is investigated in the optimum design of 3D RC
frames subjected to lateral seismic forces according to ASCE 7 requirements. Also, moment
frames and their shear frame counterparts are considered and compared for optimal design. The
results indicate a good performance of the proposed algorithm to find an optimal solution for 3D
RC frames.
Keywords: 3D Reinforced concrete frames; Structural optimization; Improved plasma
generation optimization (IPGO) algorithm; Metaheuristics.
1. Introduction
Optimal design of steel structures is generally considered the minimum weight, construction cost
of the members, and maximum stiffness while the reinforced concrete structures have multi-
* E-mail address of the corresponding author: [email protected] (A. Kaveh)

materials and the objective function is obtained the construction cost of the formwork, steel and
concrete [1,2]. Many researchers have recently studied the optimum design of the reinforced
concrete (RC) frames using the genetic algorithm [3,4], the big bang-big crunch (BB-BC) [5],
harmony search-based algorithm [6], the enhanced colliding bodies optimization (ECBO) [7,8],
particle swarm optimization (PSO) algorithm [9], a combination of particle swarm optimization
and multi-criterion decision-making (DMPSO) algorithm [10], etc. These studies are investigated
the optimization of two-dimensional (2D) reinforced concrete frame. On the other hand, the
optimal design of real-world steel frames was carried out by Kaveh et al. [11] performed optimal
design of the 3D steel frames with different ductility types. Carbas [12] optimized steel frames
using enhanced firefly algorithm. Aydogdu et al. [13] optimized the 3D steel frames using
artificial bee colony algorithm incorporating the Levy flight distribution. Kaveh and Laknejadi
[14] used a multi-objective optimization for the optimal design of large steel structures.
Kazemzadeh Azad and Hasancebi [15] performed optimization of steel frames by a guided
stochastic search heuristic algorithm. Kaveh et al. [16] compared two types of frames consisting
of prismatic frames and non-prismatic frames and optimized the 3D steel frames.
The optimum design of real-world RC structural problems requires significant computational
effort because the design methods are needed for performing the constraints imposed by design
codes, architectural requirements, and predetermined section databases [17]. Since the
computational effort of the real-world RC frames optimization is usually high, numerical
examples of previous studies are selected from the optimization of two-dimensional (2D)
reinforced concrete frames. Consequently, an optimization algorithm that satisfies design
requirements and economic criteria in a reasonable time would be a valuable method for
designing these structures. However, there is a limited amount of investigation on optimization
associated with three-dimensional (3D) RC frames according to ACI 318. Fadaee and Grierson
[18] presented the optimum design of 3D frame structures using optimality criteria. Balling and
Yao [19] investigated these frames using a multi-level method. Kaveh and Behnam [20]
optimized 3D multi-story RC frames using the charged system search and the enhanced charged
system search. Esfandiari et al. [21] presented an algorithm combining multi-criterion decision-
making and Particle Swarm Optimization (DMPSO) for an optimum design in 3D RC frames.
Dehnavipour et al. [22] analyzed a six-story frame structure with the PSO algorithm according to
the ACI-318 specifications. In this paper, optimum design of 3D RC frames is investigated by
improved plasma generation optimization (IPGO) algorithm. This algorithm is utilized for 2D
frames and the results were satisfying [23]. The main aim of this study is to find the economical
design of the 3D moment and shear frames and the results of these frames are compared. The
main aim of the study is to find the economical design of the 3D frame.
In the following section, the formulation of the RC frame optimization is described. The section
databases and constraints of the beams and columns are provided in Section 3. The IPGO
algorithm is briefly introduced in Section 4. The numerical examples of the shear and moment
frames are represented in Section 5. Finally, the concluding remarks are outlined in Section 6.
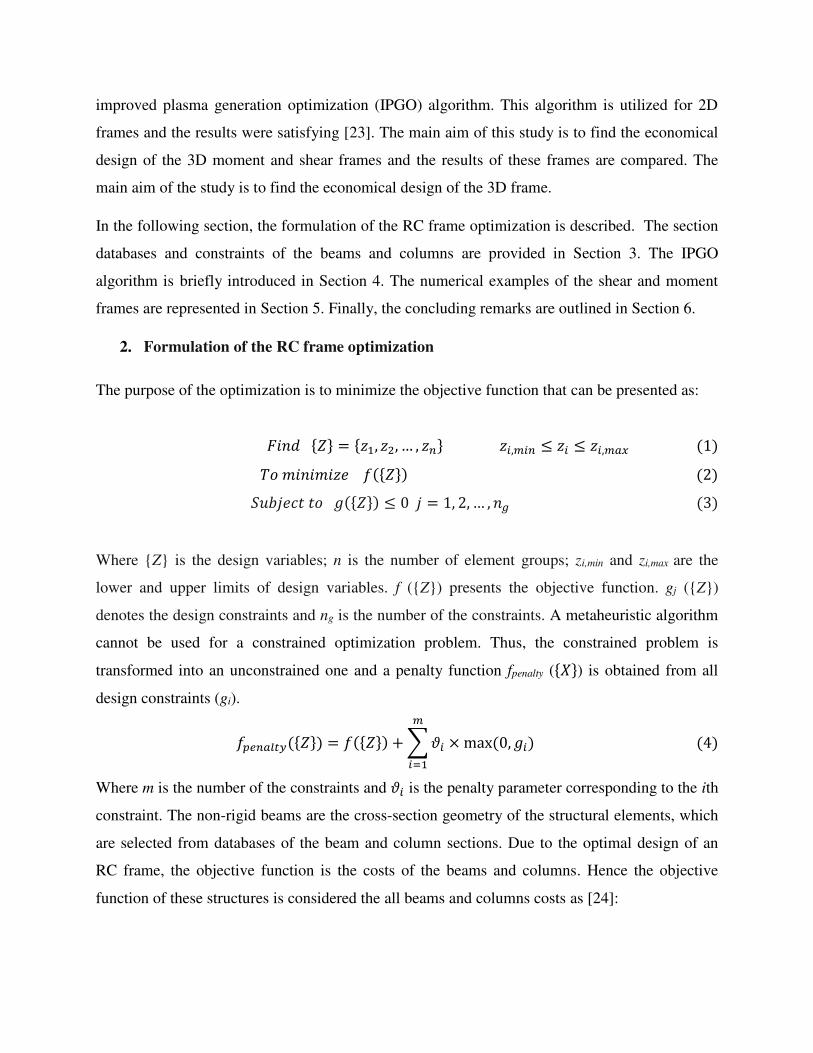
2. Formulation of the RC frame optimization
The purpose of the optimization is to minimize the objective function that can be presented as:
𝐹𝑖𝑛𝑑 {𝑍} = {𝑧1, 𝑧2, … , 𝑧𝑛} 𝑧𝑖,𝑚𝑖𝑛 ≤ 𝑧𝑖 ≤ 𝑧𝑖,𝑚𝑎𝑥 (1) 𝑇𝑜 𝑚𝑖𝑛𝑖𝑚𝑖𝑧𝑒 𝑓({𝑍}) (2) 𝑆𝑢𝑏𝑗𝑒𝑐𝑡 𝑡𝑜 𝑔({𝑍}) ≤ 0 𝑗 = 1, 2, … , 𝑛𝑔 (3)
Where {Z} is the design variables; n is the number of element groups; zi,min and zi,max are the
lower and upper limits of design variables. f ({Z}) presents the objective function. gj ({Z})
denotes the design constraints and ng is the number of the constraints. A metaheuristic algorithm
cannot be used for a constrained optimization problem. Thus, the constrained problem is
transformed into an unconstrained one and a penalty function fpenalty ({𝑋}) is obtained from all
design constraints (gi). 𝑓𝑝𝑒𝑛𝑎𝑙𝑡𝑦({𝑍}) = 𝑓({𝑍}) + ∑ 𝜗𝑖 × max (0, 𝑔𝑖) (4)𝑚𝑖=1
Where m is the number of the constraints and 𝜗𝑖 is the penalty parameter corresponding to the ith
constraint. The non-rigid beams are the cross-section geometry of the structural elements, which
are selected from databases of the beam and column sections. Due to the optimal design of an
RC frame, the objective function is the costs of the beams and columns. Hence the objective
function of these structures is considered the all beams and columns costs as [24]:

𝑓 = ∑ {𝐶𝑐𝑏𝑖ℎ𝑖𝑛𝑏+𝑛𝑐𝑖=1 + 𝐶𝑠𝐴𝑠𝑖𝛾𝑠}𝐿𝑖 + ∑{𝐶𝑓(𝑏𝑖 + 2(ℎ𝑖 − 𝑡𝑖)) + 𝐶𝑡𝑏𝑖}𝐿𝑖𝑛𝑏
𝑖=1 + ∑{2𝐶𝑓(𝑏𝑖 + ℎ𝑖)}𝐿𝑖𝑛𝑐𝑖=1 (5)
Where nb, nc, h, b, Asi, and L are the number of the beams, a number of the columns, depth and
width of the sections, area of the longitudinal bars in elements, and the length of the structural
elements respectively; Cs, Cf, Cc, and Ct are the unit cost of steel, formwork, concrete, and
scaffolding respectively; γs is the steel density.
3. Formation of the section databases
The design variables consist of the cross-section dimensions and detail of the steel bars. Due to a
large number of RC sections, the database of the sections is utilized for the optimization process.
The beam and column databases are conformed with the design code provisions of ACI 318 [25].
The beam sections are defined as rectangular shapes. The bars of #3 to #11 are used as
longitudinal bars. The width and height of the sections, number and diameter of tensile and
compression of bars, tensile and compression capacity, and the cost of the length unit of the
elements are presented in the beams database. The cross-sections are sorted by the increasing
costs. The dimensions of the beams are varied from 350×400 to 350×1050 by a step of 50 mm.
The nominal bending moment strength of a beam section and the depth of an equivalent
rectangular compression block are illustrated in detail in Ref. [26]. The column database includes
the dimensions of the column sections, the number and diameter of the longitudinal bars, and the
cost of the length unit of the members. The column sections are square with dimensions of 250
mm × 250 mm to 1200 mm × 1200 mm, by a step of 50 mm. Also, the bars of the section are
selected symmetric from four #3 bars to twenty #11 bars. SAP 2000 [27] software was used to
determine the elements’ demand. The requirements of the ACI 318-08 code and the algorithm of
the optimization are performed in MATLAB [28] software.
4. Design constraints
4.1 Constraints of beams
In each section of flexure elements, the tensile and compression moment strength of the beams
must be greater than the ultimate positive and negative moment forces of the beam sections. This
constraint for the moment capacity is checked as:

𝑔𝑏1 = |𝑀𝑢| − ∅𝑀𝑛∅𝑀𝑛 (6)
Where Mn and Mu are the nominal moment strength and the ultimate moment force; ∅=0.9 is the
reduction factor. Also, the maximum and minimum values of the longitudinal bars should be
investigated by:
𝐴𝑠,𝑚𝑖𝑛 = √𝑓𝑐′4𝑓𝑦 𝑏𝑑 ≥ 1.4𝑓𝑦 𝑏𝑑, 𝑔𝑏2 = 𝐴𝑠,𝑚𝑖𝑛 − 𝐴 (7)
𝐴𝑠,𝑚𝑎𝑥 = 0.85𝛽1 𝑓𝑐′𝑓𝑦 600600 + 𝑓𝑦 𝑏𝑑, 𝑔𝑏3 = 𝐴 − 𝐴𝑠,𝑚𝑎𝑥 (8)
Due to the deflection limitation, the height of the beams must be greater than the minimum
height, controlled as follows:
ℎ𝑚𝑖𝑛 = 𝐿21, 𝑔𝑏4 = 1 − ℎℎ𝑚𝑖𝑛 (9)
The height of the compressive stress block (a) must be less than the effective depth of the beam
section (d), is considered as:
𝑔𝑏5 = 𝑎𝑑 − 1 (10) The spacing of the longitudinal bars (s) must be greater than the allowable spacing (smin) is
controlled as Eq.11 where db is the diameter of bars.
𝑠𝑚𝑖𝑛 = max(𝑑𝑏 , 1𝑖𝑛), 𝑔𝑏6 = 1 − 𝑠𝑠𝑚𝑖𝑛 (11)
4.2 Constraint of columns
In each section of columns, the combination of the axial and moment strength (Pn, Mn) of the
columns must be greater than the ultimate axial and moment forces (Pu and Mu) of the column
sections. This constraint for the capacity of the column section is checked as:
𝑙𝑢 = √(𝑃𝑢)2 + (𝑀𝑢)2, 𝑙𝑛 = √(∅𝑃𝑛)2 + (∅𝑀𝑛)2 , 𝐶1 = 𝑙𝑢 − 𝑙𝑛𝑙𝑛 (12)

The nominal flexural of the members in x and y directions are calculated and found the ultimate
capacity of each section. MacGregor method is used to consider biaxial moment of the members
[29]. This method replaces the biaxial bending with an equivalent uniaxial eccentricity, and
members are designed with equivalent uniaxial moments and axial force. The sections are
designed for biaxial eccentricity eoi that is larger than either of the ex and ey. For ex/dx greater
than or equal to ey/dy, value eoi should be taken as [20]:
𝑒𝑜𝑖 = 𝑒𝑥 + 𝛽𝑒𝑦 (𝑑𝑥𝑑𝑦) (13)
Where 𝛽 in the above equation is calculated as [20]:
𝛽 = [0.5 + 𝑃𝑢𝑓𝑐′𝐴𝑔] (𝑓𝑦 + 280)700 ≥ 0.6; 𝑃𝑢𝑓𝑐′𝐴𝑔 ≤ 0.4 (14) 𝛽 = [1.3 − 𝑃𝑢𝑓𝑐′𝐴𝑔] (𝑓𝑦 + 280)700 ≥ 0.5; 𝑃𝑢𝑓𝑐′𝐴𝑔 > 0.4 (15)
Where Ag is the gross area of the cross-section; and dx, dy are dimensions of the cross-section
along the X- and Y-axis, respectively. If ex/dx < ey/dy, then, dx and dy terms are transposed.
Hence, a section is checked for the load Pu and eccentricity eoi. The maximum ultimate axial
forces and moments are calculated by the above analysis and are compared to the ultimate
capacity of each member’s section. If the forces are less than the ultimate capacity, the member
section is accepted. If one of them is greater than the capacity, the selected section should be
changed.
The percentage of the longitudinal bars in cross-section is limited from 1 % to 8 % of the cross-
section area (Ag). These constraints of the column can be expressed as:
𝐶2 = 0.01 × 𝐴𝑔𝐴𝑠 − 1 (16)
𝐶3 = 𝐴𝑠0.08 × 𝐴𝑔 − 1 (17)
The penalty of minimum clear spacing (smin) in the column is provided as:

𝑠𝑚𝑖𝑛 = max(1.5𝑑𝑏 , 1.5𝑖𝑛), 𝐶4 = 𝑠𝑚𝑖𝑛 − 𝑠𝑠𝑚𝑖𝑛 (18)
The dimensions of the column section in the top stories should be smaller than the bottom
stories, so the constraints are considered as:
𝐶5 = 𝑏𝑇𝑏𝐵 − 1 (19)
𝐶6 = ℎ𝑇ℎ𝐵 − 1 (20)
5. A brief description of the IPGO Algorithm
The plasma generation optimization (PGO) algorithm is a newly developed population-based
meta-heuristic algorithm [30] and the efficiency of PGO has been investigated through the
structural optimization problem [31]. In order to improve PGO, Improved Plasma Generation
Optimization (IPGO) is developed to find more reliable results. In this version of the algorithm,
memory is used to save a number of the best electrons [23]. The pseudo-code of IPGO is
presented in Algorithm 1 [23] and the explanation of this algorithm is presented in the following
steps.
1. Initial locations: the initial locations of all electrons are randomly obtained from search space
according to Eq.21, and the value of the objective function for each electron is calculated. 𝑥𝑖,𝑗0 = 𝑥𝑗,𝑚𝑖𝑛 + 𝑟𝑎𝑛𝑑 × (𝑥𝑗,𝑚𝑎𝑥 − 𝑥𝑗,𝑚𝑖𝑛) 𝑖 = 1, 2, … , 𝑛 𝑗 = 1, 2, … , 𝑑 (21)
2. Saving best results: Plasma memory (PM) is used to save the best electrons and their values
of the objective function. The electrons of the PM memory are added to the population and the
worst electrons are deleted. Then, electrons are sorted by their values of the objective function.
3. Step size determination: A random number is used to obtain the step size of each electron.
The step size of the electron in excitation, de-excitation and ionization process is obtained by the
following steps.
{ If 𝑟𝑎𝑛𝑑𝟏 < 𝐸𝐷𝑅 Excitation and/or de − excitation processes If 𝑟𝑎𝑛𝑑𝟏 < 𝐸𝐷𝑅 and 𝑟𝑎𝑛𝑑2 < 𝐷𝑅 De − excitation processIf 𝑟𝑎𝑛𝑑𝟏 ≥ 𝐸𝐷𝑅 Ionization process } (22)
In equations, rand1 and rand2 are the random numbers from the interval [0, 1]; EDR is
excitation/de-excitation rate; DR is the de-excitation rate.
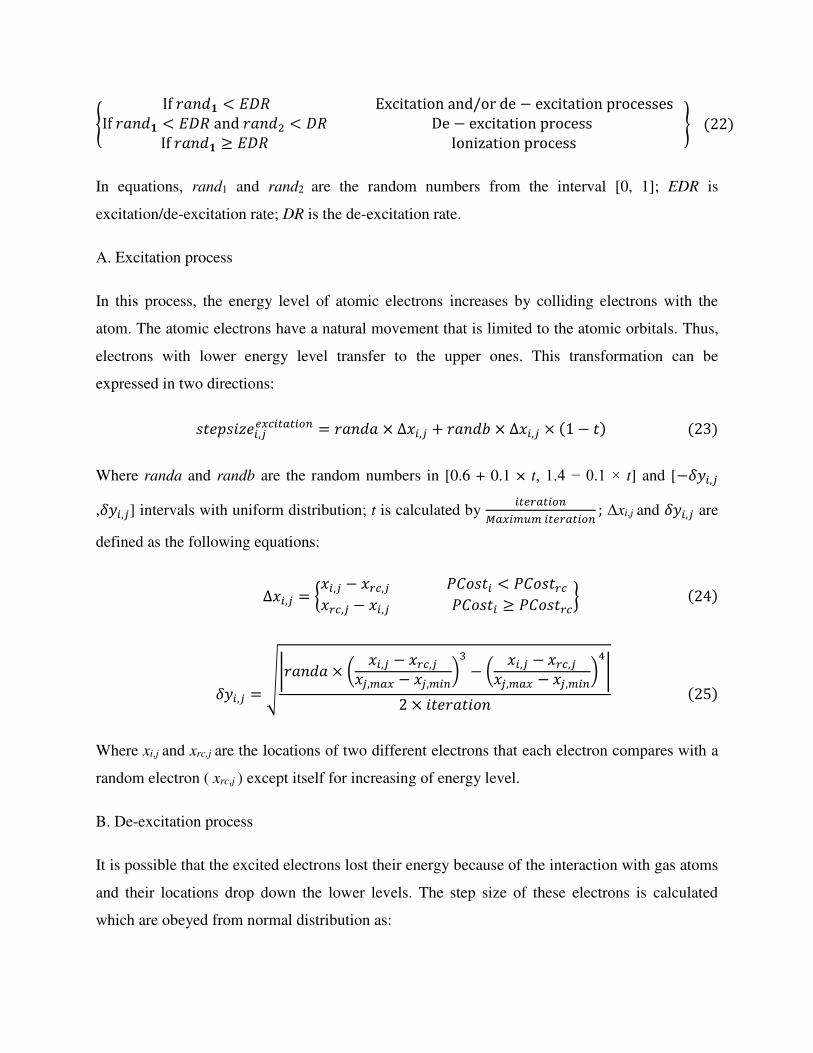
A. Excitation process
In this process, the energy level of atomic electrons increases by colliding electrons with the
atom. The atomic electrons have a natural movement that is limited to the atomic orbitals. Thus,
electrons with lower energy level transfer to the upper ones. This transformation can be
expressed in two directions:
𝑠𝑡𝑒𝑝𝑠𝑖𝑧𝑒𝑖,𝑗𝑒𝑥𝑐𝑖𝑡𝑎𝑡𝑖𝑜𝑛 = 𝑟𝑎𝑛𝑑𝑎 × ∆𝑥𝑖,𝑗 + 𝑟𝑎𝑛𝑑𝑏 × ∆𝑥𝑖,𝑗 × (1 − 𝑡) (23)
Where randa and randb are the random numbers in [0.6 + 0.1 × t, 1.4 − 0.1 × t] and [−𝛿𝑦𝑖,𝑗
,𝛿𝑦𝑖,𝑗] intervals with uniform distribution; t is calculated by 𝑖𝑡𝑒𝑟𝑎𝑡𝑖𝑜𝑛𝑀𝑎𝑥𝑖𝑚𝑢𝑚 𝑖𝑡𝑒𝑟𝑎𝑡𝑖𝑜𝑛 ; Δxi,j and 𝛿𝑦𝑖,𝑗 are
defined as the following equations:
∆𝑥𝑖,𝑗 = {𝑥𝑖,𝑗 − 𝑥𝑟𝑐,𝑗 𝑃𝐶𝑜𝑠𝑡𝑖 < 𝑃𝐶𝑜𝑠𝑡𝑟𝑐𝑥𝑟𝑐,𝑗 − 𝑥𝑖,𝑗 𝑃𝐶𝑜𝑠𝑡𝑖 ≥ 𝑃𝐶𝑜𝑠𝑡𝑟𝑐} (24)
𝛿𝑦𝑖,𝑗 = √|𝑟𝑎𝑛𝑑𝑎 × ( 𝑥𝑖,𝑗 − 𝑥𝑟𝑐,𝑗𝑥𝑗,𝑚𝑎𝑥 − 𝑥𝑗,𝑚𝑖𝑛)3 − ( 𝑥𝑖,𝑗 − 𝑥𝑟𝑐,𝑗𝑥𝑗,𝑚𝑎𝑥 − 𝑥𝑗,𝑚𝑖𝑛)4|2 × 𝑖𝑡𝑒𝑟𝑎𝑡𝑖𝑜𝑛 (25)
Where xi,j and xrc,j are the locations of two different electrons that each electron compares with a
random electron ( xrc,j ) except itself for increasing of energy level.
B. De-excitation process
It is possible that the excited electrons lost their energy because of the interaction with gas atoms
and their locations drop down the lower levels. The step size of these electrons is calculated
which are obeyed from normal distribution as:

𝑠𝑡𝑒𝑝𝑠𝑖𝑧𝑒𝑖,𝐾𝑑𝑒−𝑒𝑥𝑐𝑖𝑡𝑎𝑡𝑖𝑜𝑛 = 𝑠𝑡𝑒𝑝𝑠𝑖𝑧𝑒𝑖,𝐾𝑒𝑥𝑐𝑖𝑡𝑎𝑡𝑖𝑜𝑛 + 𝑟𝑎𝑛𝑑 × (𝑥𝐾,𝑚𝑎𝑥 − 𝑥𝐾,𝑚𝑖𝑛) (26)
Where rand is a random number with a normal distribution (mean=0 and variance=1). DRS is
the de-excitation rate of the excited electron. This parameter controls the number of electrons
that can perform de-excitation process. In de-excitation process, the dimensions of the electrons
are randomly selected by: 𝑁𝐷𝑅𝑆 = 𝑐𝑒𝑖𝑙(𝐷𝑅𝑆 × 𝑑), 𝐾 = 𝑟𝑎𝑛𝑑𝑠𝑎𝑚𝑝𝑙𝑒(𝑑, 𝑁𝐷𝑅𝑆) (27)
Where K is an integer value from 1 to variables number that returns NDRS value that is sampled
uniformly.
C. Ionization process
The electron beams with High energy collide with atoms and a number of these electrons are
ripped from the atom to immerse in the plasma. Due to the high energy, the immersed electrons
collide with others and the atoms are excited and they change into ions. The process of the
ionization is modeled by electrons with levy flight and their movement can be obtained as
follows:
𝑠𝑡𝑒𝑝𝑠𝑖𝑧𝑒𝑖,𝑗𝑖𝑜𝑛𝑖𝑧𝑎𝑡𝑖𝑜𝑛 = 𝑟𝑎𝑛𝑑 × 𝑆𝑖,𝑗 × ∆𝑥𝑖,𝑗 × (1 − 𝑡) (28)
Where rand is a random number with normal distribution; and Si,j can be defined as:
𝑆𝑖,𝑗 = 𝑟𝑎𝑛𝑑1|𝑟𝑎𝑛𝑑2|1𝛽 × 𝜎 (29)
𝜎 = ( Γ(1+𝛽)×sin(𝜋𝛽2 )Γ(1+𝛽2 )×𝛽×2(𝛽−12 ))1𝛽 ; Γ(𝑥) = (𝑥 − 1)! (30)
Where 𝛽 is a constant parameter equal to 1.5 in this study; rand1 and rand2 are random numbers
with normal distribution. The step size of the electron is calculated by Eqs.23, 26 and 28, Then a
new location of the electrons is generated as:
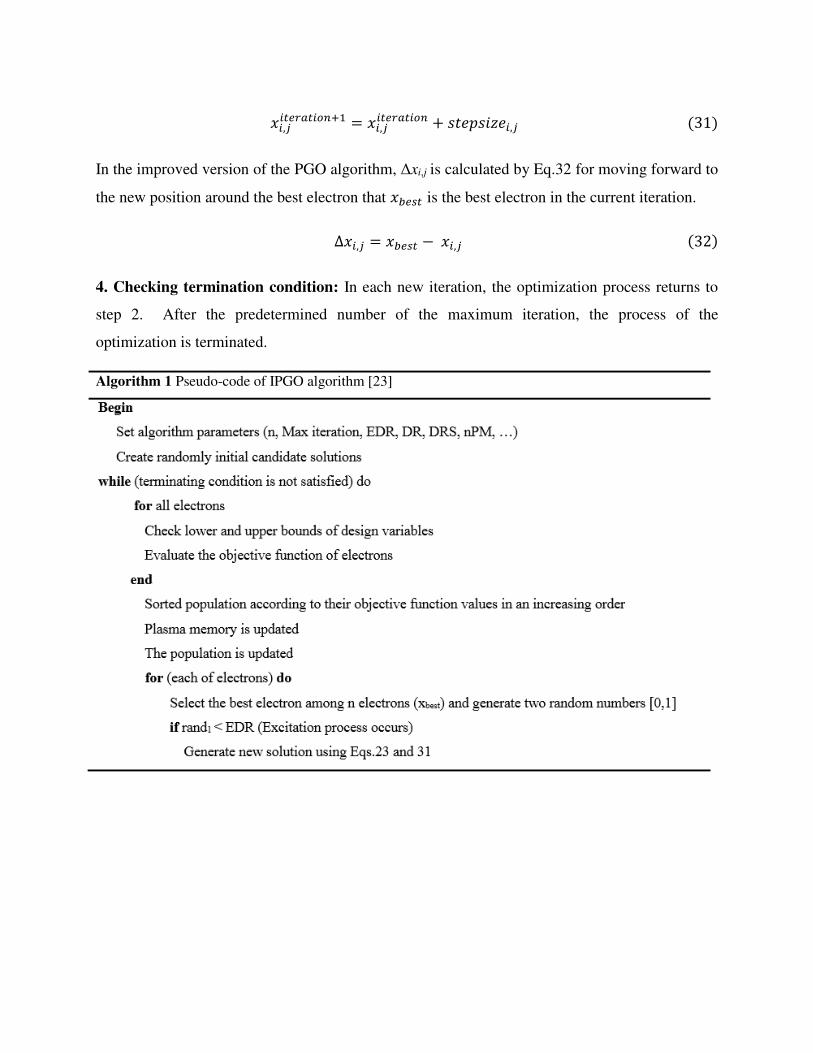
𝑥𝑖,𝑗𝑖𝑡𝑒𝑟𝑎𝑡𝑖𝑜𝑛+1 = 𝑥𝑖,𝑗𝑖𝑡𝑒𝑟𝑎𝑡𝑖𝑜𝑛 + 𝑠𝑡𝑒𝑝𝑠𝑖𝑧𝑒𝑖,𝑗 (31)
In the improved version of the PGO algorithm, Δxi,j is calculated by Eq.32 for moving forward to
the new position around the best electron that 𝑥𝑏𝑒𝑠𝑡 is the best electron in the current iteration. ∆𝑥𝑖,𝑗 = 𝑥𝑏𝑒𝑠𝑡 − 𝑥𝑖,𝑗 (32)
4. Checking termination condition: In each new iteration, the optimization process returns to
step 2. After the predetermined number of the maximum iteration, the process of the
optimization is terminated.
Algorithm 1 Pseudo-code of IPGO algorithm [23]
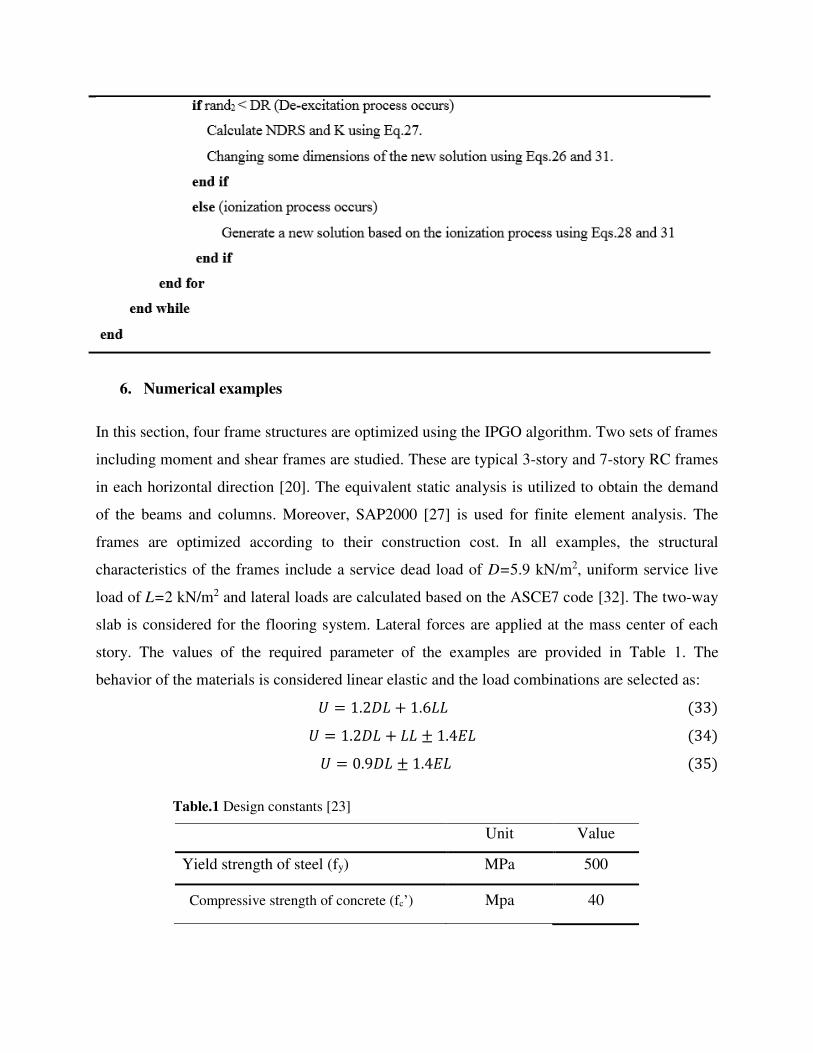
6. Numerical examples
In this section, four frame structures are optimized using the IPGO algorithm. Two sets of frames
including moment and shear frames are studied. These are typical 3-story and 7-story RC frames
in each horizontal direction [20]. The equivalent static analysis is utilized to obtain the demand
of the beams and columns. Moreover, SAP2000 [27] is used for finite element analysis. The
frames are optimized according to their construction cost. In all examples, the structural
characteristics of the frames include a service dead load of D=5.9 kN/m2, uniform service live
load of L=2 kN/m2 and lateral loads are calculated based on the ASCE7 code [32]. The two-way
slab is considered for the flooring system. Lateral forces are applied at the mass center of each
story. The values of the required parameter of the examples are provided in Table 1. The
behavior of the materials is considered linear elastic and the load combinations are selected as: 𝑈 = 1.2𝐷𝐿 + 1.6𝐿𝐿 (33) 𝑈 = 1.2𝐷𝐿 + 𝐿𝐿 ± 1.4𝐸𝐿 (34) 𝑈 = 0.9𝐷𝐿 ± 1.4𝐸𝐿 (35)
Table.1 Design constants [23]
Unit Value
Yield strength of steel (fy) MPa 500
Compressive strength of concrete (fc’)
Mpa 40

Unit weight of steel (γs) kg/m3 7849
Unit weight of concrete (γc) kg/m3 2450
Cost of concrete (Cc) beam €/m3 105.93
column €/ m3 105.17
Cost of steel (Cs) beam €/kg 1.3
column €/kg 1.3
Cost of formwork (Cf) beam €/ m2 25.05
column €/ m2 22.75
Cost of scaffolding (Ct) beam €/ m2 38.89
column €/ m2 -
6.1 Example 1: A 3-story 3D RC shear frame
In this example, the optimal design of a 3-story shear frame is executed by the IPGO algorithm.
Design variables are categorized into six groups as shown in Fig. 1. The shear frame is modeled
by rigid beams. 3500 iterations for IPGO are performed, but the numbers of structural analysis
are taken as 105000. The optimum results of the IPGO algorithm are reported in Table 2. It
should be noted that the objective function in the shear frames is the total cost of the columns
and in the moment frames, it is the total cost of the frame including columns and beams.
According to the results, the cost of the columns in the shear frame is 4901 Euro.

Fig. 1. 3D view of 3-story shear frames and type classification of columns
Table.2 The optimization results of the 3-story shear frame
Member type Group Dimensions Reinforcements
width (mm) depth (mm)
Column
C1 300 300 14#3
C2 500 500 18#5
C3 300 300 4#6
C4 400 400 12#7
C5 300 300 6#6
C6 250 250 10#3
Total cost of columns 4901
6.2 Example 2: A 3-story 3D RC moment frame
This example is a 3-story moment frame with two spans and 162 degrees of freedoms (DOFs).
This frame has 36 beams and 27 columns arranged in 6 groups for columns and 9 groups for
beams. The frame geometry and grouping details are depicted in Fig. 2. Optimal design of the
frame is executed by the IPGO algorithm. For this case, the number of iterations is considered
less than 3500 iterations. The results of the optimization for this case can be seen in Table 3. The
results indicate that the total cost of columns and the cross-sections at the moment frame are
different from those of the shear frame. The cost of the columns in the shear frame is 4901 Euro
while the cost of the columns in the moment frame is 10681 Euro. Since the beams in the
moment frame are considered non-rigid elements, the displacements have affected the column
sections and columns with bigger cross-sections are selected in comparison to columns of the
shear frame.

Fig. 2. 3D view of 3-story moment frames and type classification of columns and beams
Table.3 The optimization results of the 3-story moment frame
Member type Group Dimensions Reinforcements
width (mm) depth (mm) As top As bot
Beam
B1 350 400 2#4 2#3
B2 350 400 2#4 2#3
B3 350 400 6#4 5#4
B4 350 400 2#4 2#3
B5 350 400 4#3 2#3
B6 350 400 6#6 2#9
B7 350 400 2#4 2#3
B8 350 400 3#5 6#3
B9 350 400 4#5 3#6
Column
C1 950 950 10#11
C2 450 450 8#10
C3 450 450 14#5
C4 450 450 6#10
C5 350 350 8#6
C6 350 350 12#4
Total cost of columns 10681
Total cost 30179

6.3 Example 3: A 7-story 3D RC shear frame
This case study is a typical 7-story RC frame with three spans in each horizontal direction.
The optimal design of a shear frame is performed by the IPGO algorithm. The columns of the
structure are categorized into fourteen groups. 3500 iterations for IPGO are considered and
population size of 30 is used to assure the best results. The optimal sections from the IPGO
algorithm are presented in Table 4. According to the results, the total cost of the columns in
the shear frame is 26616 Euro.
Table.4 The optimization results of the 7-story shear frame
Member type Group Dimensions Reinforcements
width (mm) depth (mm) As top As bot
Column
C1 500 500 20#4
C2 500 500 20#4
C3 450 450 16#4
C4 500 500 14#5
C5 450 450 4#8
C6 450 450 16#4
C7 400 400 16#4
C8 450 450 16#4
C9 350 350 10#4
C10 450 450 16#4
C11 350 350 8#5
C12 450 450 4#8
C13 300 300 8#5
C14 400 400 6#6
Total cost of columns 26616
6.4 Example 4: A 7-story 3D RC moment frame
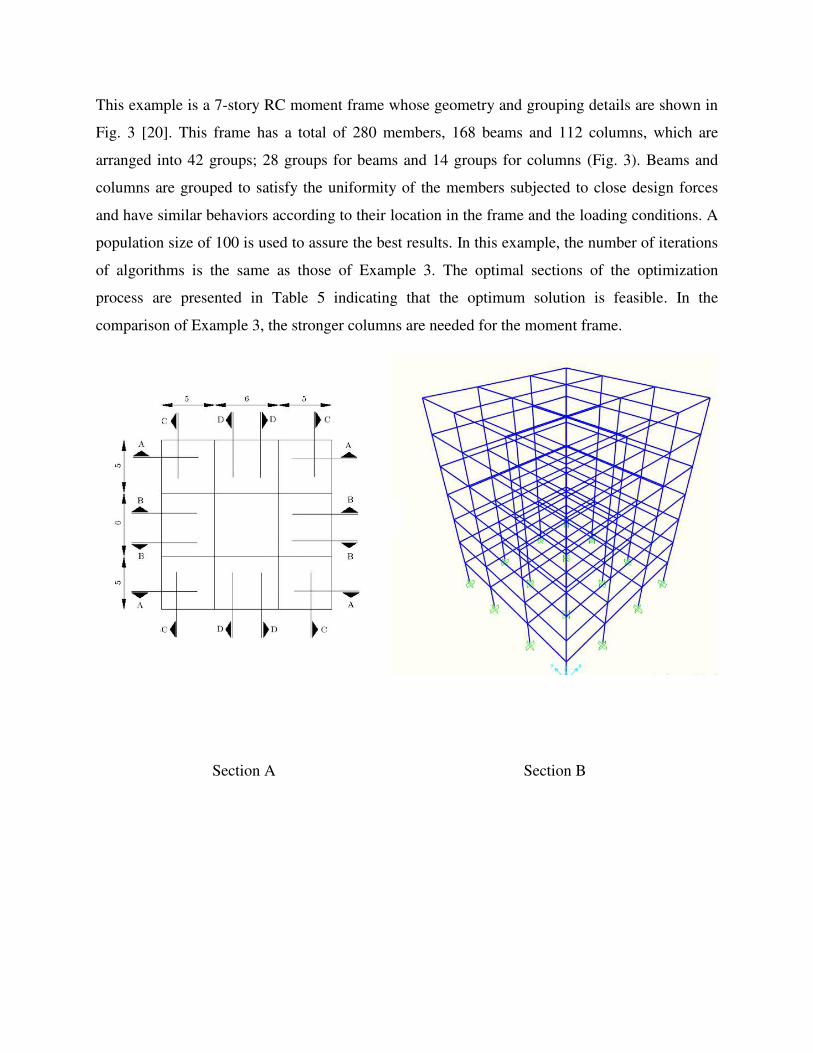
This example is a 7-story RC moment frame whose geometry and grouping details are shown in
Fig. 3 [20]. This frame has a total of 280 members, 168 beams and 112 columns, which are
arranged into 42 groups; 28 groups for beams and 14 groups for columns (Fig. 3). Beams and
columns are grouped to satisfy the uniformity of the members subjected to close design forces
and have similar behaviors according to their location in the frame and the loading conditions. A
population size of 100 is used to assure the best results. In this example, the number of iterations
of algorithms is the same as those of Example 3. The optimal sections of the optimization
process are presented in Table 5 indicating that the optimum solution is feasible. In the
comparison of Example 3, the stronger columns are needed for the moment frame.
Section A Section B

Section C Section D
Fig 3. Plan and sections of the 7-story structure and type classification of beams and columns
Table.5 The optimization results of the 7-story frame under equivalent static analysis
Member type Group Dimensions Reinforcements
width (mm) depth (mm) As top As bot
Beam B1 350 450 3#8 5#84

B2 350 400 3#6 4#7
B3 350 1050 4#6 2#10
B4 350 1000 4#10 5#11
B5 350 450 2#9 6#5
B6 350 500 3#9 2#9
B7 350 700 5#3 5#4
B8 350 500 2#4 3#6
B9 350 400 4#5 2#6
B10 350 450 5#8 4#5
B11 350 400 5#3 3#3
B12 350 400 4#3 2#3
B13 350 400 3#5 3#6
B14 350 400 4#5 2#6
B15 350 900 5#5 5#5
B16 350 550 2#5 5#3
B17 350 400 5#4 2#6
B18 350 400 3#4 3#4
B19 350 400 2#3 6#3
B20 350 400 2#4 2#3
B21 350 400 3#4 3#3
B22 350 600 5#6 6#9
B23 350 400 4#8 3#3
B24 350 400 4#3 5#3
B25 350 750 6#7 4#7
B26 350 550 2#11 6#3
B27 350 450 2#3 4#4
B28 350 400 6#3 4#3
Column
C1 1200 1200 20#11
C2 1200 1200 20#11
C3 1000 1000 20#8

C4 1200 1200 20#11
C5 700 700 16#8
C6 1200 1200 20#11
C7 700 700 10#10
C8 1200 1200 20#11
C9 700 700 18#6
C10 900 900 18#10
C11 400 400 16#5
C12 800 800 18#7
C13 300 300 16#4
C14 300 300 10#5
Total cost of columns 93410
Total cost 213730
Concluding Remarks
The optimum design of 3D RC frames is a nonlinear problem and a time-consuming procedure.
Therefore, the use of an efficient optimization algorithm is vital. The algorithm should be
capable of escaping the local optimums and it should converge in a sensible time. In this paper,
the improved plasma generation optimization (IPGO) algorithm is selected as the optimization
method. The shear and moment RC frames with different stories are designed according to the
standards and requirements of the American Concrete Institute’s Building Code (ACI 318-8).
The objective function is the cost of the material and construction of reinforced concrete
elements. Because a limited number of studies have been conducted on the optimum design of
3D RC frames, in this paper, the procedure of the optimization is tested to investigate the 3D
structures. The shear and moment frames are considered to optimize. The numerical results
demonstrated the difference between the results of the moment frame and shear frame. The
results indicate that the columns of the moment frames are obtained bigger than the
corresponding shear frames. Due to having non-rigid beams in the process of optimization of the
moment frame, the displacement response of the shear frame is often less than the moment

frame. The results show that the proposed approach is feasible to find the optimum design of the
3D RC structures.
Conflicts of interest
The authors have no conflicts of interest to declare that are relevant to the content of this
article.
References
[1] Kaveh A. Advances in Metaheuristic Algorithms for Optimal Design of Structures. 3rd ed.
Springer, Cham, Switzerland; 2021. https://doi.org/10.1007/978-3-319-05549-7
[2] Hoseini Vaes SR, Asaad Samani A, Fathali MA. Optimum performance-based design of
unsymmetrical 2D steel moment frame. Soft Computing 2022, 1-23.
https://doi.org/10.1007/s00500-022-06927-x
[3] Govindaraj V, Ramasamy J. Optimum detailed design of reinforced concrete frames using
genetic algorithms. Engineering Optimization 2007; vol. 39, no. 4, pp. 471-494.
https://doi.org/10.1080/03052150601180767
[4] Chaudhuri P, Maity D. Cost optimization of rectangular RC footing using GA and UPSO.
Soft Computing 2020; 24(2): 709-721.
https://doi.org/10.1007/s00500-019-04437-x
[5] Kaveh A, Sabzi O. A comparative study of two meta-heuristic algorithms for optimum design
of reinforced concrete frames. International Journal of Civil Engineering 2011; vol. 9, no. 3, pp.
193-206.
[6] Akin A, Saka M. Harmony search algorithm based optimum detailed design of reinforced
concrete plane frames subject to ACI 318-05 provisions. Computers & Structures 2015; vol. 147,
pp. 79-95. https://doi.org/10.1016/j.compstruc.2014.10.003
[7] Kaveh A. Cost and CO2 Emission Optimization of Reinforced Concrete Frames Using
Enhanced Colliding Bodies Optimization Algorithm. Applications of Metaheuristic Optimization
Algorithms in Civil Engineering: Springer, pp. 319-350; 2017.
https://doi.org/10.1007/978-3-319-48012-1_17
[8] Kaveh A, Mottaghi L, Izadifard R. Sustainable design of reinforced concrete frames with
non-prismatic beams. Engineering with Computers 2020; pp. 1-18.
https://doi.org/10.1007/s00366-020-01045-4
[9] Gharehbaghi S, Fadaee M. Design optimization of RC frames under earthquake loads. Iran
University of Science & Technology 2012; vol. 2, no. 4, pp. 459-477.
[10] Esfandiary M, Sheikholarefin S, Rahimi Bondarabadi H. A combination of particle swarm
optimization and multi-criterion decision-making for optimum design of reinforced concrete
frames. Iran University of Science & Technology 2016; 6(2), 245-268.
[11] Kaveh A, Ghafari MH, Gholipour Y. Optimal seismic design of 3D steel moment frames:
different ductility types. Structal Multidisciplinary Optimization 2017; 56(6):1353–1368.
[12] Carbas S. Design optimization of steel frames using an enhanced firefly algorithm. Eng
Optimiz 2016; 48(12):2007–2025.
[13] Aydoğdu İ, Akın A, Saka MP. Design optimization of real-world steel space frames using
artificial bee colony algorithm with Levy flight distribution. Adv Eng Softw 2016; 92:1–14.
[14] Kaveh A, Laknejadi K, Alinejad B. Performance based multi-objective optimization of large
steel structures. Acta Mech 2012; 223(2):355–369.
[15] Kazemzadeh Azad S, Hasançebi O. Computationally efficient discrete sizing of steel frames
via guided stochastic search heuristic. Comput Struct 2015; 156:12–28.
[16] Kaveh A, Kabir MZ, Bohlool M. Optimum design of three-dimensional steel frames with
prismatic and non-prismatic elements. Engineering with Computers 2020; 36(3), 1011-1027.
[17] Lagaros ND. A general purpose real-world structural design optimization computing
platform. Struct. Multidiscip. Optim 2013; pp. 1047–1066.
[18] Fadaee, MM. Grierson, D.E. Design optimization of 3D reinforced concrete structures.
Structural Optimization 1996; 12, pp. 127–134.
[19] Balling RJ, Yao X. Optimization of reinforced concrete frames. Journal of Structural
Engineering, ASCE 1997; 123, pp. 193–202.
[20] Kaveh A, Behnam AF. Design optimization of reinforced concrete 3D structures
considering frequency constraints via a charged system search. Scientia Iranica 2013; 20(3), 387-
396.
[21] Esfandiari M, Javad, et al. Optimum design of 3D reinforced concrete frames using DMPSO
algorithm. Advances in Engineering Software 2018. 115: 149-160.
[22] Dehnavipour H, Mehrabani M, Fakhriyat A, Jakubczyk-Gałczyńska A. Optimization-based
design of 3D reinforced concrete structures. Journal of Soft Computing in Civil Engineering
2019; 3(3), 95-106.
[23] Kaveh A, Ardebili SR. An improved plasma generation optimization algorithm for optimal
design of reinforced concrete frames under time-history loading. Structures 2021; Vol. 34, pp.
758-770.
[24] Kaveh A, Mottaghi L, Izadifard R. Sustainable design of reinforced concrete frames with
non-prismatic beams. Engineering with Computers 2020; pp. 1-18.
https://doi.org/10.1007/s00366-020-01045-4
[25] ACI Committee. Building code requirements for structural concrete (ACI 318-08) and
commentary. American Concrete Institute 2008.
[26] Kaveh A. Cost and CO2 Emission Optimization of Reinforced Concrete Frames Using
Enhanced Colliding Bodies Optimization Algorithm. Applications of Metaheuristic Optimization
Algorithms in Civil Engineering: Springer, pp. 319-350; 2017.
https://doi.org/10.1007/978-3-319-48012-1_17
[27] CSI (Computers and Structures Inc.). SAP2000 v12 Analysis Reference Manual. CSI,
Berkeley, 2004.
[28] I. Mathworks, "MATLAB: the language of technical computing," Math-Works, Inc., Natick,
MA; 1998.
[29] MacGregor JG, Wight JK, Teng S, Irawan P. Reinforced concrete: Mechanics and Design
(Vol. 3). Upper Saddle River, NJ: Prentice Hall, 1997.

[30] Kaveh A, Akbari H, Hosseini SM. Plasma generation optimization: a new physically-based
metaheuristic algorithm for solving constrained optimization problems. Engineering
Computations 2020. https://doi.org/10.1108/EC-05-2020-0235
[31] Kaveh A, Hosseini SM, Zaerreza A. Size, Layout, and Topology Optimization of Skeletal
Structures Using Plasma Generation Optimization. Iranian Journal of Science and Technology,
Transactions of Civil Engineering 2020; 1-31. https://doi.org/10.1007/s40996-020-00527-1
[32] Minimum Design Loads for Buildings and Other Structures, ASCE7-05, American Society
of Civil Engineers (ASCE), 2005.