OptiMouse: a comprehensive open source program for ...
22
SOFTWARE Open Access OptiMouse: a comprehensive open source program for reliable detection and analysis of mouse body and nose positions Yoram Ben-Shaul Abstract Background: Accurate determination of mouse positions from video data is crucial for various types of behavioral analyses. While detection of body positions is straightforward, the correct identification of nose positions, usually more informative, is far more challenging. The difficulty is largely due to variability in mouse postures across frames. Results: Here, we present OptiMouse, an extensively documented open-source MATLAB program providing comprehensive semiautomatic analysis of mouse position data. The emphasis in OptiMouse is placed on minimizing errors in position detection. This is achieved by allowing application of multiple detection algorithms to each video, including custom user-defined algorithms, by selection of the optimal algorithm for each frame, and by correction when needed using interpolation or manual specification of positions. Conclusions: At a basic level, OptiMouse is a simple and comprehensive solution for analysis of position data. At an advanced level, it provides an open-source and expandable environment for a detailed analysis of mouse position data. Keywords: Rodent behavior, Position analysis, Preference tests, Video data Background Many studies of rodent behavior are based on the ana- lysis of positional data. Such data can reveal place pref- erence, attraction to particular stimuli, or other positional information such as speed and distance cov- ered [1–6]. Analysis of videos of mouse behavior in arenas can be performed by manual scoring or by auto- mated video analysis. While the first approach does not require any dedicated software, it is highly subjective, prone to error, and time consuming if conducted rigor- ously. Automated analysis of position data is objective and usually fast, but is often also not error free. The challenge of position detection is not to identify body and nose positions in any single image, but rather to do so correctly for the vast majority of frames in any given movie. This is considerably harder for detection of nose as compared to body center coordinates. This dis- tinction is important because it is the snout that indi- cates what a mouse is attending to. The difficulty of the image analysis problem varies from video to video. De- creased contrast between the mouse and the back- ground, increased variability in mouse posture, frames that do not include the mouse in its entirety, as well as temporal and spatial inhomogeneity of the arena, are all factors that increase the likelihood of errors. Common procedures for detecting nose positions involve an initial step of automatic detection, followed by a reviewing of the detection algorithm’ s performance. When errors are detected, they can often be manually corrected. The last stage can be very laborious and time consuming, making it difficult to detect all instances of erroneous detections. For example, a 10-minute movie with a 30 Hz frame rate, will include 18,000 frames. This is a large number of frames to monitor, let alone to correct. Here, we describe a new open-source software, Opti- Mouse, designed for the analysis of positions of individual mice in a behavioral arena. OptiMouse is written in MATLAB and covers the entire sequence of mouse pos- ition data analysis, starting from a video and ending with processed measures of mouse position and movement data within an arena. Other programs for automated ana- lysis of position data exist. Some of these are commercial Correspondence: [email protected] Department of Medical Neurobiology, The Hebrew University, Faculty of Medicine, Jerusalem, Israel © Ben-Shaul et al. 2017 Open Access This article is distributed under the terms of the Creative Commons Attribution 4.0 International License (http://creativecommons.org/licenses/by/4.0/), which permits unrestricted use, distribution, and reproduction in any medium, provided you give appropriate credit to the original author(s) and the source, provide a link to the Creative Commons license, and indicate if changes were made. The Creative Commons Public Domain Dedication waiver (http://creativecommons.org/publicdomain/zero/1.0/) applies to the data made available in this article, unless otherwise stated. Ben-Shaul BMC Biology (2017) 15:41 DOI 10.1186/s12915-017-0377-3
-
Upload
khangminh22 -
Category
Documents
-
view
1 -
download
0
Transcript of OptiMouse: a comprehensive open source program for ...
Ben-Shaul BMC Biology (2017) 15:41 DOI 10.1186/s12915-017-0377-3
SOFTWARE Open Access
OptiMouse: a comprehensive open sourceprogram for reliable detection and analysisof mouse body and nose positions
Yoram Ben-ShaulAbstract
Background: Accurate determination of mouse positions from video data is crucial for various types of behavioralanalyses. While detection of body positions is straightforward, the correct identification of nose positions, usuallymore informative, is far more challenging. The difficulty is largely due to variability in mouse postures across frames.
Results: Here, we present OptiMouse, an extensively documented open-source MATLAB program providingcomprehensive semiautomatic analysis of mouse position data. The emphasis in OptiMouse is placed on minimizingerrors in position detection. This is achieved by allowing application of multiple detection algorithms to each video,including custom user-defined algorithms, by selection of the optimal algorithm for each frame, and by correctionwhen needed using interpolation or manual specification of positions.
Conclusions: At a basic level, OptiMouse is a simple and comprehensive solution for analysis of position data. At anadvanced level, it provides an open-source and expandable environment for a detailed analysis of mouse position data.
Keywords: Rodent behavior, Position analysis, Preference tests, Video data
BackgroundMany studies of rodent behavior are based on the ana-lysis of positional data. Such data can reveal place pref-erence, attraction to particular stimuli, or otherpositional information such as speed and distance cov-ered [1–6]. Analysis of videos of mouse behavior inarenas can be performed by manual scoring or by auto-mated video analysis. While the first approach does notrequire any dedicated software, it is highly subjective,prone to error, and time consuming if conducted rigor-ously. Automated analysis of position data is objectiveand usually fast, but is often also not error free.The challenge of position detection is not to identify
body and nose positions in any single image, but ratherto do so correctly for the vast majority of frames in anygiven movie. This is considerably harder for detection ofnose as compared to body center coordinates. This dis-tinction is important because it is the snout that indi-cates what a mouse is attending to. The difficulty of the
Correspondence: [email protected] of Medical Neurobiology, The Hebrew University, Faculty ofMedicine, Jerusalem, Israel
© Ben-Shaul et al. 2017 Open Access This artInternational License (http://creativecommonsreproduction in any medium, provided you gthe Creative Commons license, and indicate if(http://creativecommons.org/publicdomain/ze
image analysis problem varies from video to video. De-creased contrast between the mouse and the back-ground, increased variability in mouse posture, framesthat do not include the mouse in its entirety, as well astemporal and spatial inhomogeneity of the arena, are allfactors that increase the likelihood of errors. Commonprocedures for detecting nose positions involve an initialstep of automatic detection, followed by a reviewing ofthe detection algorithm’s performance. When errors aredetected, they can often be manually corrected. The laststage can be very laborious and time consuming, makingit difficult to detect all instances of erroneous detections.For example, a 10-minute movie with a 30 Hz framerate, will include 18,000 frames. This is a large numberof frames to monitor, let alone to correct.Here, we describe a new open-source software, Opti-
Mouse, designed for the analysis of positions of individualmice in a behavioral arena. OptiMouse is written inMATLAB and covers the entire sequence of mouse pos-ition data analysis, starting from a video and ending withprocessed measures of mouse position and movementdata within an arena. Other programs for automated ana-lysis of position data exist. Some of these are commercial
icle is distributed under the terms of the Creative Commons Attribution 4.0.org/licenses/by/4.0/), which permits unrestricted use, distribution, andive appropriate credit to the original author(s) and the source, provide a link tochanges were made. The Creative Commons Public Domain Dedication waiverro/1.0/) applies to the data made available in this article, unless otherwise stated.
Ben-Shaul BMC Biology (2017) 15:41 Page 2 of 22
products with a broad range of features (e.g., Ethovi-sion, ANT-maze), others are freely available programs.Among these, several are designed for detection ofparticular features such as stretch or grooming [7, 8],exploratory behaviors [9–11], or social interactions[12, 13]. Other programs also include advanced algo-rithms for detecting patterns in behavior [14–16]. Themotivation for creating yet another software programfor this general problem is two-fold. First, OptiMousewas designed to provide highly accurate detection ofpositions, and to facilitate the process of reviewingand correcting, when needed, the automatically de-tected positions. As described below, many features inOptiMouse were designed with the objective of im-proving accuracy in position detection. Second, Opti-Mouse was developed with the goal of making theentire analysis process accessible and free. Workingwith OptiMouse involves graphical user interfaces,and does not require any programming knowledge. Adetailed user manual accompanies the code and alldetection stages can be controlled by the user.Although it provides several algorithms for detection,
OptiMouse does not rely on any single algorithm to de-tect positions under all scenarios. The key assumptionbehind OptiMouse is that, while usually there will notbe a single set of parameters (a setting) that correctlyidentifies positions in all movie frames, a small numberof settings will suffice to provide correct detection in thevast majority.Building upon these assumptions, OptiMouse includes
the following elements:
1. Application of multiple detection settings to a singlesession. In addition to several built-in algorithms,each with its own associated set of parameters, Opti-Mouse allows seamless integration of custom func-tions for body/nose detection into the user interface.
2. Efficient identification of frames with incorrectposition detection. In addition to serially reviewingthe video to identify problematic frames, OptiMouseallows simultaneous viewing of various featuresdescribing each of the frames. This ability facilitatesidentification of frames with incorrect positiondetection.
3. Methods for correcting detection in frames witherrors. This includes the application of settings tosingle frames or to groups of frames, definingmanual positions, and interpolating body and nosecoordinates.
The ease of use, expandability, and performance ofOptiMouse should make it useful both for occasional in-vestigators of mouse behavior and for researchers thatwish to apply a rigorous analysis of position data.
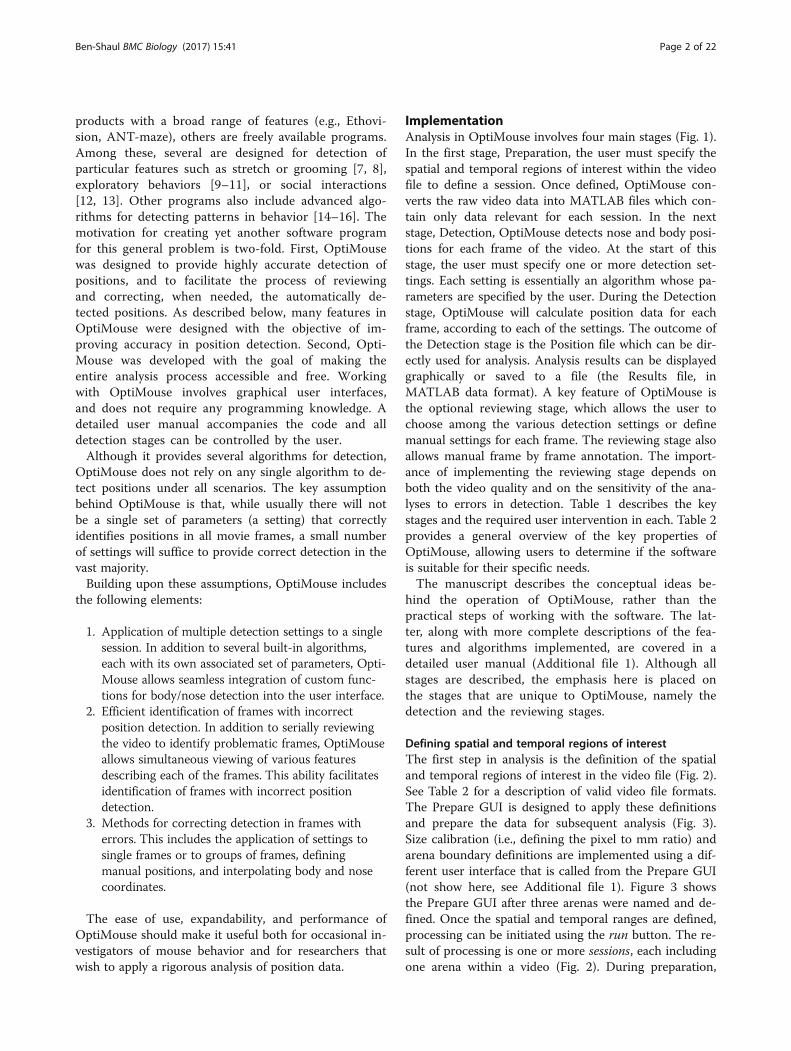
ImplementationAnalysis in OptiMouse involves four main stages (Fig. 1).In the first stage, Preparation, the user must specify thespatial and temporal regions of interest within the videofile to define a session. Once defined, OptiMouse con-verts the raw video data into MATLAB files which con-tain only data relevant for each session. In the nextstage, Detection, OptiMouse detects nose and body posi-tions for each frame of the video. At the start of thisstage, the user must specify one or more detection set-tings. Each setting is essentially an algorithm whose pa-rameters are specified by the user. During the Detectionstage, OptiMouse will calculate position data for eachframe, according to each of the settings. The outcome ofthe Detection stage is the Position file which can be dir-ectly used for analysis. Analysis results can be displayedgraphically or saved to a file (the Results file, inMATLAB data format). A key feature of OptiMouse isthe optional reviewing stage, which allows the user tochoose among the various detection settings or definemanual settings for each frame. The reviewing stage alsoallows manual frame by frame annotation. The import-ance of implementing the reviewing stage depends onboth the video quality and on the sensitivity of the ana-lyses to errors in detection. Table 1 describes the keystages and the required user intervention in each. Table 2provides a general overview of the key properties ofOptiMouse, allowing users to determine if the softwareis suitable for their specific needs.The manuscript describes the conceptual ideas be-
hind the operation of OptiMouse, rather than thepractical steps of working with the software. The lat-ter, along with more complete descriptions of the fea-tures and algorithms implemented, are covered in adetailed user manual (Additional file 1). Although allstages are described, the emphasis here is placed onthe stages that are unique to OptiMouse, namely thedetection and the reviewing stages.
Defining spatial and temporal regions of interestThe first step in analysis is the definition of the spatialand temporal regions of interest in the video file (Fig. 2).See Table 2 for a description of valid video file formats.The Prepare GUI is designed to apply these definitionsand prepare the data for subsequent analysis (Fig. 3).Size calibration (i.e., defining the pixel to mm ratio) andarena boundary definitions are implemented using a dif-ferent user interface that is called from the Prepare GUI(not show here, see Additional file 1). Figure 3 showsthe Prepare GUI after three arenas were named and de-fined. Once the spatial and temporal ranges are defined,processing can be initiated using the run button. The re-sult of processing is one or more sessions, each includingone arena within a video (Fig. 2). During preparation,
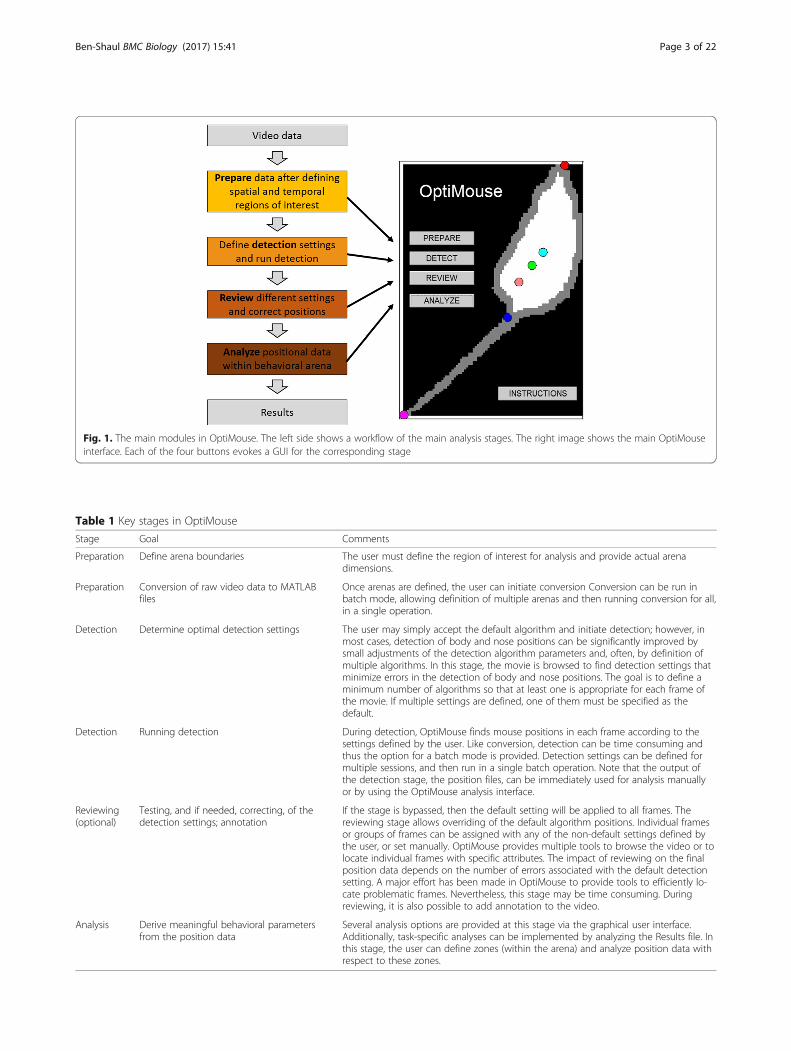
Fig. 1. The main modules in OptiMouse. The left side shows a workflow of the main analysis stages. The right image shows the main OptiMouseinterface. Each of the four buttons evokes a GUI for the corresponding stage
Table 1 Key stages in OptiMouse
Stage Goal Comments
Preparation Define arena boundaries The user must define the region of interest for analysis and provide actual arenadimensions.
Preparation Conversion of raw video data to MATLABfiles
Once arenas are defined, the user can initiate conversion Conversion can be run inbatch mode, allowing definition of multiple arenas and then running conversion for all,in a single operation.
Detection Determine optimal detection settings The user may simply accept the default algorithm and initiate detection; however, inmost cases, detection of body and nose positions can be significantly improved bysmall adjustments of the detection algorithm parameters and, often, by definition ofmultiple algorithms. In this stage, the movie is browsed to find detection settings thatminimize errors in the detection of body and nose positions. The goal is to define aminimum number of algorithms so that at least one is appropriate for each frame ofthe movie. If multiple settings are defined, one of them must be specified as thedefault.
Detection Running detection During detection, OptiMouse finds mouse positions in each frame according to thesettings defined by the user. Like conversion, detection can be time consuming andthus the option for a batch mode is provided. Detection settings can be defined formultiple sessions, and then run in a single batch operation. Note that the output ofthe detection stage, the position files, can be immediately used for analysis manuallyor by using the OptiMouse analysis interface.
Reviewing(optional)
Testing, and if needed, correcting, of thedetection settings; annotation
If the stage is bypassed, then the default setting will be applied to all frames. Thereviewing stage allows overriding of the default algorithm positions. Individual framesor groups of frames can be assigned with any of the non-default settings defined bythe user, or set manually. OptiMouse provides multiple tools to browse the video or tolocate individual frames with specific attributes. The impact of reviewing on the finalposition data depends on the number of errors associated with the default detectionsetting. A major effort has been made in OptiMouse to provide tools to efficiently lo-cate problematic frames. Nevertheless, this stage may be time consuming. Duringreviewing, it is also possible to add annotation to the video.
Analysis Derive meaningful behavioral parametersfrom the position data
Several analysis options are provided at this stage via the graphical user interface.Additionally, task-specific analyses can be implemented by analyzing the Results file. Inthis stage, the user can define zones (within the arena) and analyze position data withrespect to these zones.
Ben-Shaul BMC Biology (2017) 15:41 Page 3 of 22
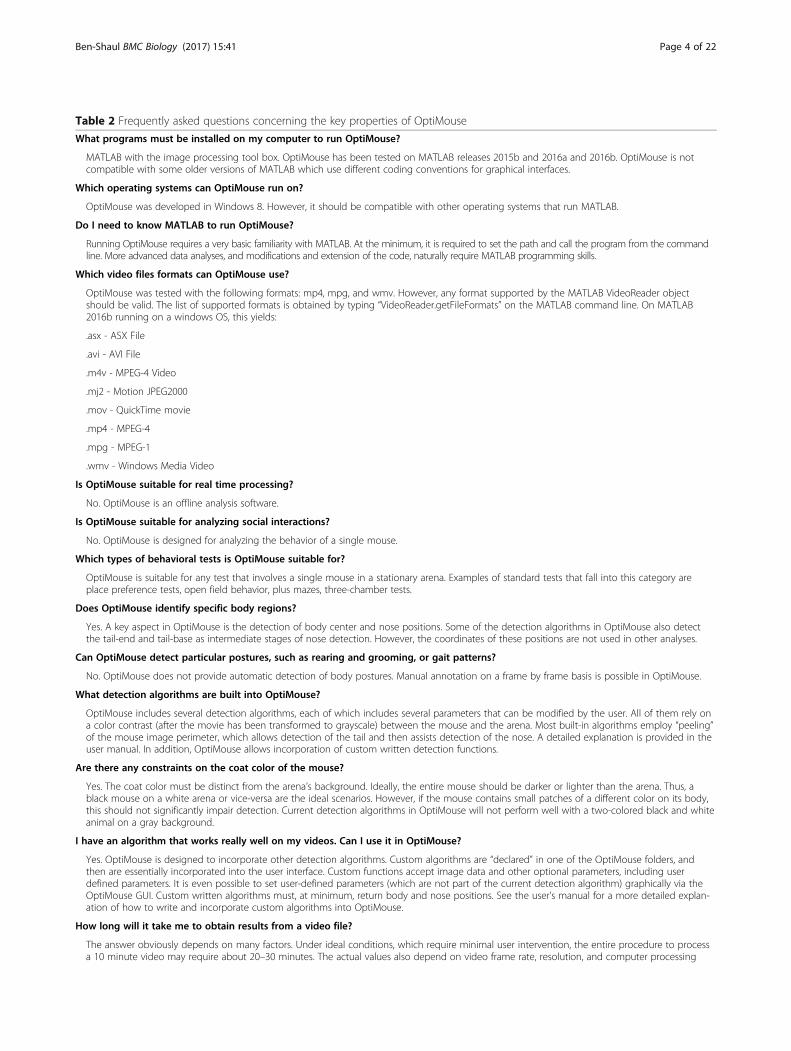
Table 2 Frequently asked questions concerning the key properties of OptiMouse
What programs must be installed on my computer to run OptiMouse?
MATLAB with the image processing tool box. OptiMouse has been tested on MATLAB releases 2015b and 2016a and 2016b. OptiMouse is notcompatible with some older versions of MATLAB which use different coding conventions for graphical interfaces.
Which operating systems can OptiMouse run on?
OptiMouse was developed in Windows 8. However, it should be compatible with other operating systems that run MATLAB.
Do I need to know MATLAB to run OptiMouse?
Running OptiMouse requires a very basic familiarity with MATLAB. At the minimum, it is required to set the path and call the program from the commandline. More advanced data analyses, and modifications and extension of the code, naturally require MATLAB programming skills.
Which video files formats can OptiMouse use?
OptiMouse was tested with the following formats: mp4, mpg, and wmv. However, any format supported by the MATLAB VideoReader objectshould be valid. The list of supported formats is obtained by typing “VideoReader.getFileFormats” on the MATLAB command line. On MATLAB2016b running on a windows OS, this yields:
.asx - ASX File
.avi - AVI File
.m4v - MPEG-4 Video
.mj2 - Motion JPEG2000
.mov - QuickTime movie
.mp4 - MPEG-4
.mpg - MPEG-1
.wmv - Windows Media Video
Is OptiMouse suitable for real time processing?
No. OptiMouse is an offline analysis software.
Is OptiMouse suitable for analyzing social interactions?
No. OptiMouse is designed for analyzing the behavior of a single mouse.
Which types of behavioral tests is OptiMouse suitable for?
OptiMouse is suitable for any test that involves a single mouse in a stationary arena. Examples of standard tests that fall into this category areplace preference tests, open field behavior, plus mazes, three-chamber tests.
Does OptiMouse identify specific body regions?
Yes. A key aspect in OptiMouse is the detection of body center and nose positions. Some of the detection algorithms in OptiMouse also detectthe tail-end and tail-base as intermediate stages of nose detection. However, the coordinates of these positions are not used in other analyses.
Can OptiMouse detect particular postures, such as rearing and grooming, or gait patterns?
No. OptiMouse does not provide automatic detection of body postures. Manual annotation on a frame by frame basis is possible in OptiMouse.
What detection algorithms are built into OptiMouse?
OptiMouse includes several detection algorithms, each of which includes several parameters that can be modified by the user. All of them rely ona color contrast (after the movie has been transformed to grayscale) between the mouse and the arena. Most built-in algorithms employ “peeling”of the mouse image perimeter, which allows detection of the tail and then assists detection of the nose. A detailed explanation is provided in theuser manual. In addition, OptiMouse allows incorporation of custom written detection functions.
Are there any constraints on the coat color of the mouse?
Yes. The coat color must be distinct from the arena’s background. Ideally, the entire mouse should be darker or lighter than the arena. Thus, ablack mouse on a white arena or vice-versa are the ideal scenarios. However, if the mouse contains small patches of a different color on its body,this should not significantly impair detection. Current detection algorithms in OptiMouse will not perform well with a two-colored black and whiteanimal on a gray background.
I have an algorithm that works really well on my videos. Can I use it in OptiMouse?
Yes. OptiMouse is designed to incorporate other detection algorithms. Custom algorithms are “declared” in one of the OptiMouse folders, andthen are essentially incorporated into the user interface. Custom functions accept image data and other optional parameters, including userdefined parameters. It is even possible to set user-defined parameters (which are not part of the current detection algorithm) graphically via theOptiMouse GUI. Custom written algorithms must, at minimum, return body and nose positions. See the user’s manual for a more detailed explan-ation of how to write and incorporate custom algorithms into OptiMouse.
How long will it take me to obtain results from a video file?
The answer obviously depends on many factors. Under ideal conditions, which require minimal user intervention, the entire procedure to processa 10 minute video may require about 20–30 minutes. The actual values also depend on video frame rate, resolution, and computer processing
Ben-Shaul BMC Biology (2017) 15:41 Page 4 of 22
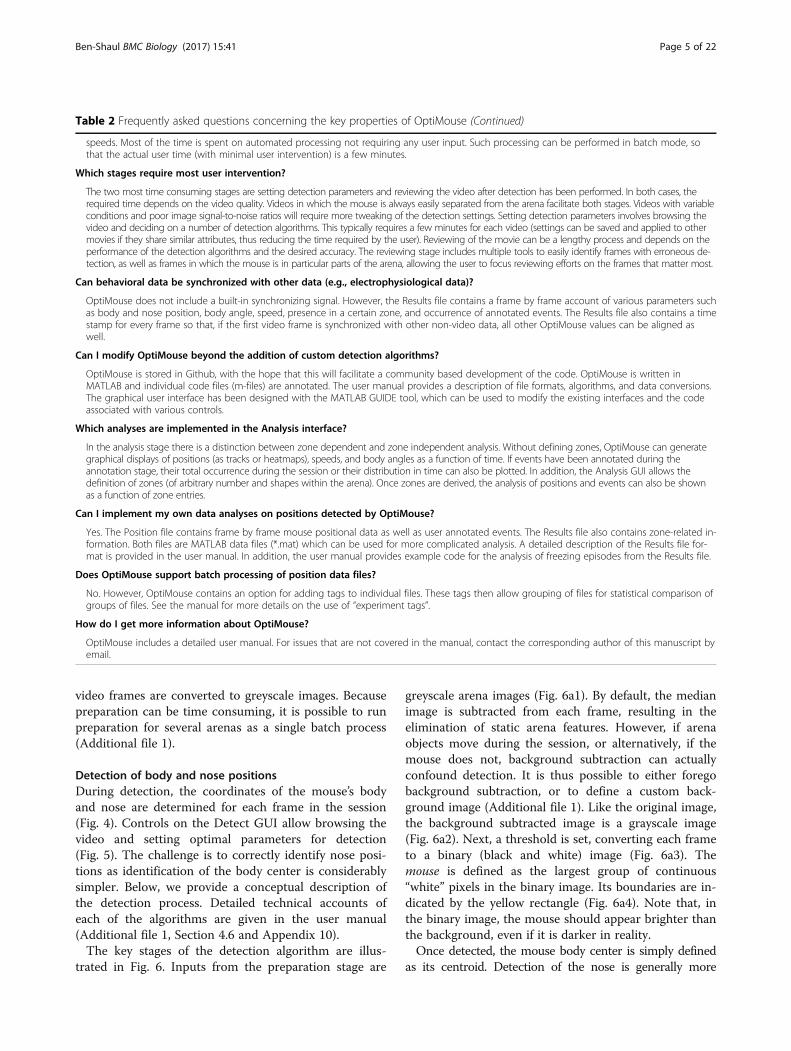
Table 2 Frequently asked questions concerning the key properties of OptiMouse (Continued)
speeds. Most of the time is spent on automated processing not requiring any user input. Such processing can be performed in batch mode, sothat the actual user time (with minimal user intervention) is a few minutes.
Which stages require most user intervention?
The two most time consuming stages are setting detection parameters and reviewing the video after detection has been performed. In both cases, therequired time depends on the video quality. Videos in which the mouse is always easily separated from the arena facilitate both stages. Videos with variableconditions and poor image signal-to-noise ratios will require more tweaking of the detection settings. Setting detection parameters involves browsing thevideo and deciding on a number of detection algorithms. This typically requires a few minutes for each video (settings can be saved and applied to othermovies if they share similar attributes, thus reducing the time required by the user). Reviewing of the movie can be a lengthy process and depends on theperformance of the detection algorithms and the desired accuracy. The reviewing stage includes multiple tools to easily identify frames with erroneous de-tection, as well as frames in which the mouse is in particular parts of the arena, allowing the user to focus reviewing efforts on the frames that matter most.
Can behavioral data be synchronized with other data (e.g., electrophysiological data)?
OptiMouse does not include a built-in synchronizing signal. However, the Results file contains a frame by frame account of various parameters suchas body and nose position, body angle, speed, presence in a certain zone, and occurrence of annotated events. The Results file also contains a timestamp for every frame so that, if the first video frame is synchronized with other non-video data, all other OptiMouse values can be aligned aswell.
Can I modify OptiMouse beyond the addition of custom detection algorithms?
OptiMouse is stored in Github, with the hope that this will facilitate a community based development of the code. OptiMouse is written inMATLAB and individual code files (m-files) are annotated. The user manual provides a description of file formats, algorithms, and data conversions.The graphical user interface has been designed with the MATLAB GUIDE tool, which can be used to modify the existing interfaces and the codeassociated with various controls.
Which analyses are implemented in the Analysis interface?
In the analysis stage there is a distinction between zone dependent and zone independent analysis. Without defining zones, OptiMouse can generategraphical displays of positions (as tracks or heatmaps), speeds, and body angles as a function of time. If events have been annotated during theannotation stage, their total occurrence during the session or their distribution in time can also be plotted. In addition, the Analysis GUI allows thedefinition of zones (of arbitrary number and shapes within the arena). Once zones are derived, the analysis of positions and events can also be shownas a function of zone entries.
Can I implement my own data analyses on positions detected by OptiMouse?
Yes. The Position file contains frame by frame mouse positional data as well as user annotated events. The Results file also contains zone-related in-formation. Both files are MATLAB data files (*.mat) which can be used for more complicated analysis. A detailed description of the Results file for-mat is provided in the user manual. In addition, the user manual provides example code for the analysis of freezing episodes from the Results file.
Does OptiMouse support batch processing of position data files?
No. However, OptiMouse contains an option for adding tags to individual files. These tags then allow grouping of files for statistical comparison ofgroups of files. See the manual for more details on the use of “experiment tags”.
How do I get more information about OptiMouse?
OptiMouse includes a detailed user manual. For issues that are not covered in the manual, contact the corresponding author of this manuscript byemail.
Ben-Shaul BMC Biology (2017) 15:41 Page 5 of 22
video frames are converted to greyscale images. Becausepreparation can be time consuming, it is possible to runpreparation for several arenas as a single batch process(Additional file 1).
Detection of body and nose positionsDuring detection, the coordinates of the mouse’s bodyand nose are determined for each frame in the session(Fig. 4). Controls on the Detect GUI allow browsing thevideo and setting optimal parameters for detection(Fig. 5). The challenge is to correctly identify nose posi-tions as identification of the body center is considerablysimpler. Below, we provide a conceptual description ofthe detection process. Detailed technical accounts ofeach of the algorithms are given in the user manual(Additional file 1, Section 4.6 and Appendix 10).The key stages of the detection algorithm are illus-
trated in Fig. 6. Inputs from the preparation stage are
greyscale arena images (Fig. 6a1). By default, the medianimage is subtracted from each frame, resulting in theelimination of static arena features. However, if arenaobjects move during the session, or alternatively, if themouse does not, background subtraction can actuallyconfound detection. It is thus possible to either foregobackground subtraction, or to define a custom back-ground image (Additional file 1). Like the original image,the background subtracted image is a grayscale image(Fig. 6a2). Next, a threshold is set, converting each frameto a binary (black and white) image (Fig. 6a3). Themouse is defined as the largest group of continuous“white” pixels in the binary image. Its boundaries are in-dicated by the yellow rectangle (Fig. 6a4). Note that, inthe binary image, the mouse should appear brighter thanthe background, even if it is darker in reality.Once detected, the mouse body center is simply defined
as its centroid. Detection of the nose is generally more

Fig. 2. Schematic description of the session preparation process. Preparation involves spatial definitions of one or more arenas and sizecalibration as well as optional removal of irrelevant video sections. Video data for each of the sessions is converted to grayscale images
Ben-Shaul BMC Biology (2017) 15:41 Page 6 of 22
challenging, and is addressed by several features in Opti-Mouse. The first of these is the availability of several algo-rithms for detection. Most algorithms rely on detection ofthe tail, which is identified by a process denoted here aspeeling, in which the outer layer of mouse pixels is
Fig. 3. The Prepare GUI. The Prepare GUI is shown after definition of threeaccessed via the Define button (see the manual for details)
sequentially removed (Fig. 6a5). Since it is the thinnest partof the mouse, the tail is the first part to disappear in thisprocess.Using the default algorithm, the nose is defined as the
furthest point from the tail base, with distance measured
arenas (named left, center, and right). The GUI for arena definition is
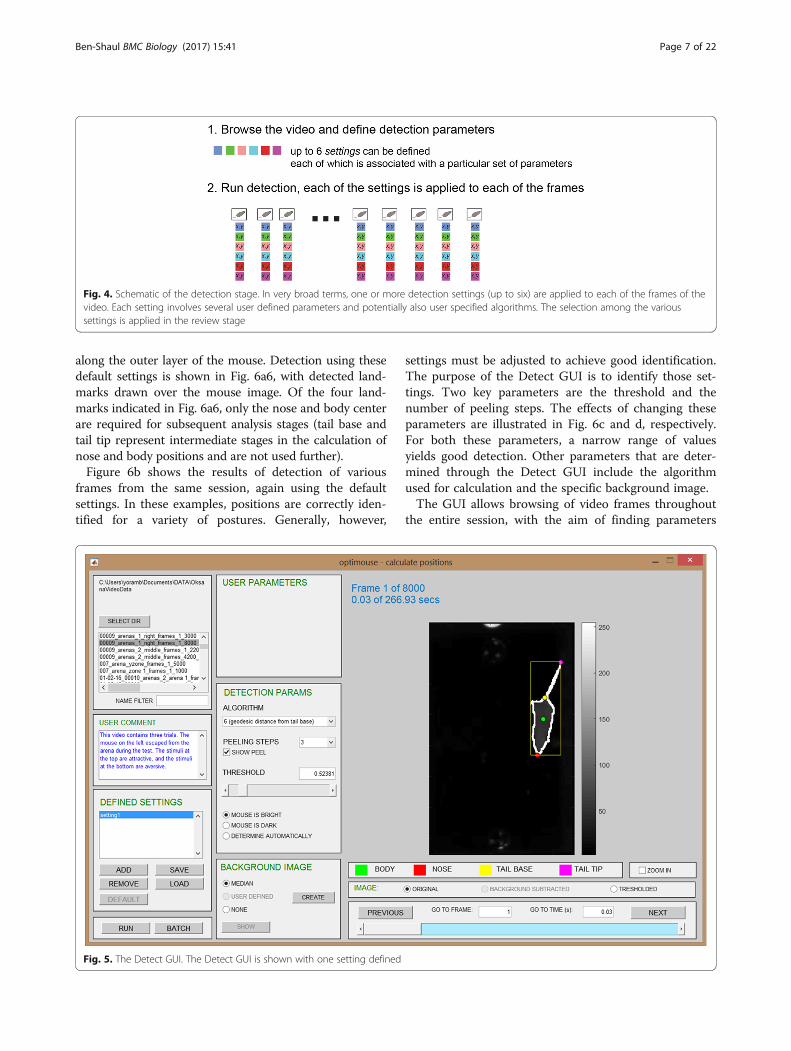
Fig. 4. Schematic of the detection stage. In very broad terms, one or more detection settings (up to six) are applied to each of the frames of thevideo. Each setting involves several user defined parameters and potentially also user specified algorithms. The selection among the varioussettings is applied in the review stage
Ben-Shaul BMC Biology (2017) 15:41 Page 7 of 22
along the outer layer of the mouse. Detection using thesedefault settings is shown in Fig. 6a6, with detected land-marks drawn over the mouse image. Of the four land-marks indicated in Fig. 6a6, only the nose and body centerare required for subsequent analysis stages (tail base andtail tip represent intermediate stages in the calculation ofnose and body positions and are not used further).Figure 6b shows the results of detection of various
frames from the same session, again using the defaultsettings. In these examples, positions are correctly iden-tified for a variety of postures. Generally, however,
Fig. 5. The Detect GUI. The Detect GUI is shown with one setting defined
settings must be adjusted to achieve good identification.The purpose of the Detect GUI is to identify those set-tings. Two key parameters are the threshold and thenumber of peeling steps. The effects of changing theseparameters are illustrated in Fig. 6c and d, respectively.For both these parameters, a narrow range of valuesyields good detection. Other parameters that are deter-mined through the Detect GUI include the algorithmused for calculation and the specific background image.The GUI allows browsing of video frames throughout
the entire session, with the aim of finding parameters
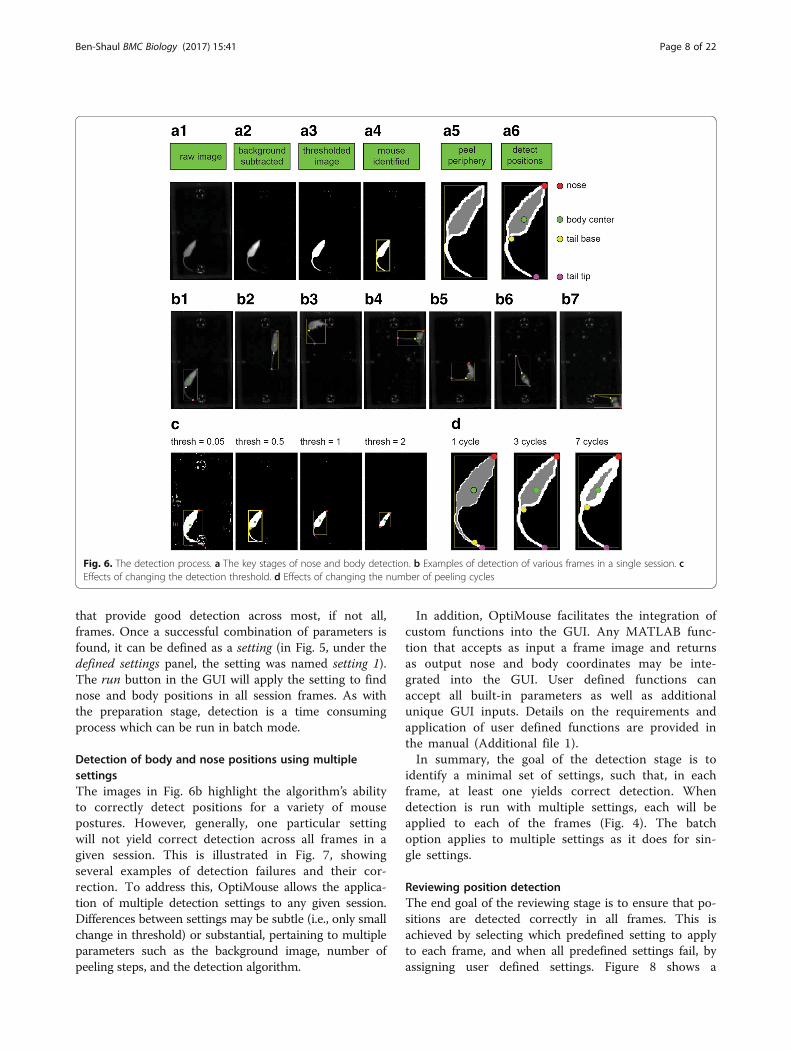
Fig. 6. The detection process. a The key stages of nose and body detection. b Examples of detection of various frames in a single session. cEffects of changing the detection threshold. d Effects of changing the number of peeling cycles
Ben-Shaul BMC Biology (2017) 15:41 Page 8 of 22
that provide good detection across most, if not all,frames. Once a successful combination of parameters isfound, it can be defined as a setting (in Fig. 5, under thedefined settings panel, the setting was named setting 1).The run button in the GUI will apply the setting to findnose and body positions in all session frames. As withthe preparation stage, detection is a time consumingprocess which can be run in batch mode.
Detection of body and nose positions using multiplesettingsThe images in Fig. 6b highlight the algorithm’s abilityto correctly detect positions for a variety of mousepostures. However, generally, one particular settingwill not yield correct detection across all frames in agiven session. This is illustrated in Fig. 7, showingseveral examples of detection failures and their cor-rection. To address this, OptiMouse allows the applica-tion of multiple detection settings to any given session.Differences between settings may be subtle (i.e., only smallchange in threshold) or substantial, pertaining to multipleparameters such as the background image, number ofpeeling steps, and the detection algorithm.
In addition, OptiMouse facilitates the integration ofcustom functions into the GUI. Any MATLAB func-tion that accepts as input a frame image and returnsas output nose and body coordinates may be inte-grated into the GUI. User defined functions canaccept all built-in parameters as well as additionalunique GUI inputs. Details on the requirements andapplication of user defined functions are provided inthe manual (Additional file 1).In summary, the goal of the detection stage is to
identify a minimal set of settings, such that, in eachframe, at least one yields correct detection. Whendetection is run with multiple settings, each will beapplied to each of the frames (Fig. 4). The batchoption applies to multiple settings as it does for sin-gle settings.
Reviewing position detectionThe end goal of the reviewing stage is to ensure that po-sitions are detected correctly in all frames. This isachieved by selecting which predefined setting to applyto each frame, and when all predefined settings fail, byassigning user defined settings. Figure 8 shows a
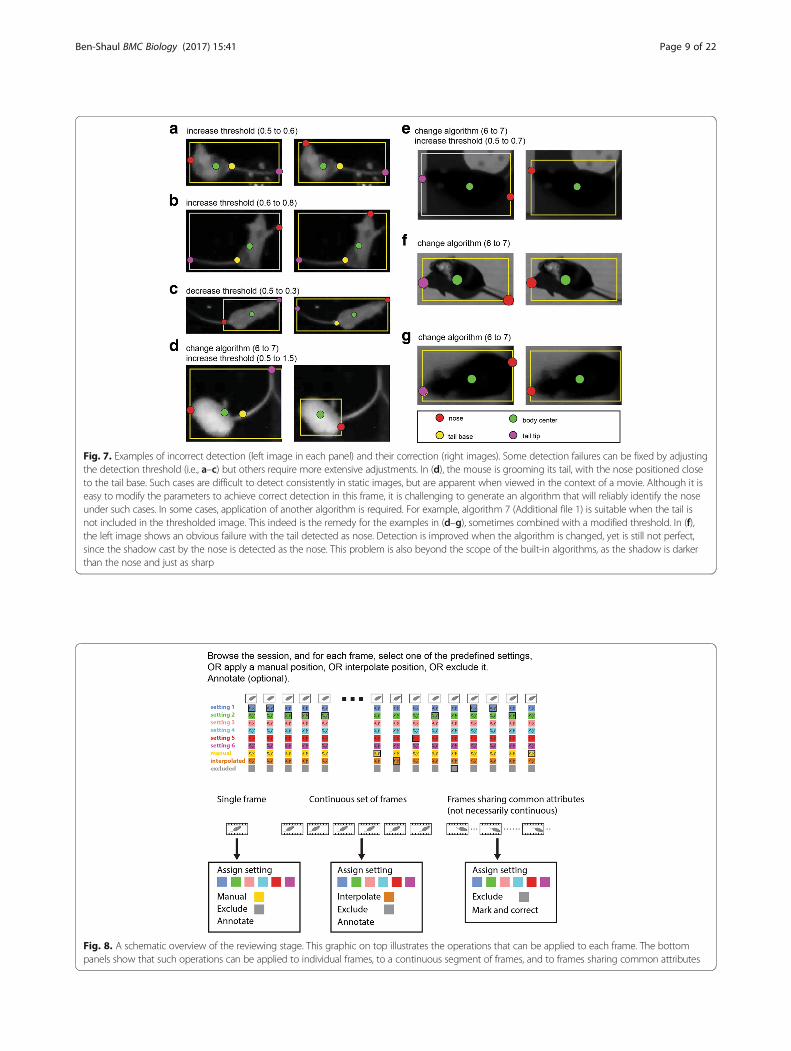
Fig. 7. Examples of incorrect detection (left image in each panel) and their correction (right images). Some detection failures can be fixed by adjustingthe detection threshold (i.e., a–c) but others require more extensive adjustments. In (d), the mouse is grooming its tail, with the nose positioned closeto the tail base. Such cases are difficult to detect consistently in static images, but are apparent when viewed in the context of a movie. Although it iseasy to modify the parameters to achieve correct detection in this frame, it is challenging to generate an algorithm that will reliably identify the noseunder such cases. In some cases, application of another algorithm is required. For example, algorithm 7 (Additional file 1) is suitable when the tail isnot included in the thresholded image. This indeed is the remedy for the examples in (d–g), sometimes combined with a modified threshold. In (f),the left image shows an obvious failure with the tail detected as nose. Detection is improved when the algorithm is changed, yet is still not perfect,since the shadow cast by the nose is detected as the nose. This problem is also beyond the scope of the built-in algorithms, as the shadow is darkerthan the nose and just as sharp
Fig. 8. A schematic overview of the reviewing stage. This graphic on top illustrates the operations that can be applied to each frame. The bottompanels show that such operations can be applied to individual frames, to a continuous segment of frames, and to frames sharing common attributes
Ben-Shaul BMC Biology (2017) 15:41 Page 9 of 22
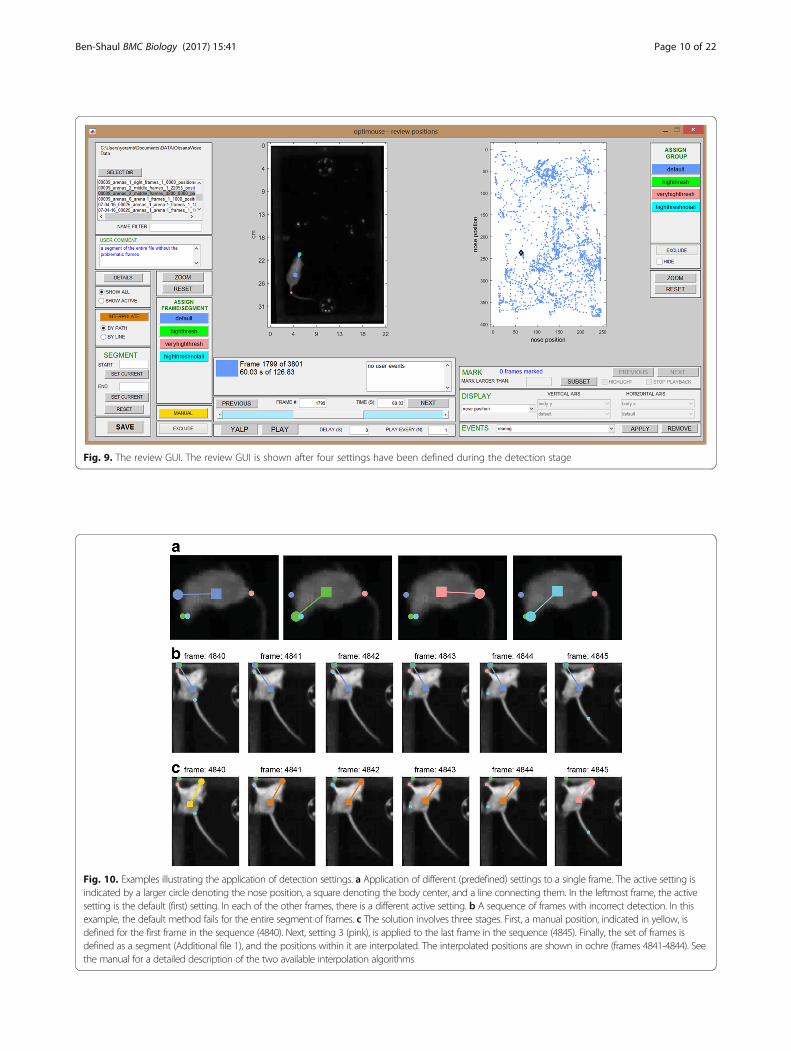
Fig. 9. The review GUI. The review GUI is shown after four settings have been defined during the detection stage
Fig. 10. Examples illustrating the application of detection settings. a Application of different (predefined) settings to a single frame. The active setting isindicated by a larger circle denoting the nose position, a square denoting the body center, and a line connecting them. In the leftmost frame, the activesetting is the default (first) setting. In each of the other frames, there is a different active setting. b A sequence of frames with incorrect detection. In thisexample, the default method fails for the entire segment of frames. c The solution involves three stages. First, a manual position, indicated in yellow, isdefined for the first frame in the sequence (4840). Next, setting 3 (pink), is applied to the last frame in the sequence (4845). Finally, the set of frames isdefined as a segment (Additional file 1), and the positions within it are interpolated. The interpolated positions are shown in ochre (frames 4841-4844). Seethe manual for a detailed description of the two available interpolation algorithms
Ben-Shaul BMC Biology (2017) 15:41 Page 10 of 22
Ben-Shaul BMC Biology (2017) 15:41 Page 11 of 22
schematic of the reviewing stage. Figure 9 shows the Re-view GUI. Several controls on the GUI allow navigation.These include continuous forward and reverse playbackas well as single frame, 1 second, or 1 minute steps, aswell as direct access to frames by number or time. Likemany other GUI actions, navigation can be implementedwith keyboard shortcuts (Additional file 1).Figure 8 also shows the main actions that can be per-
formed in the reviewing stage. The first group of actions in-volves application of settings to single frames. As seen inFig. 9 and Fig. 10, in each frame, the positions determinedby each of the settings are indicated. Every setting is
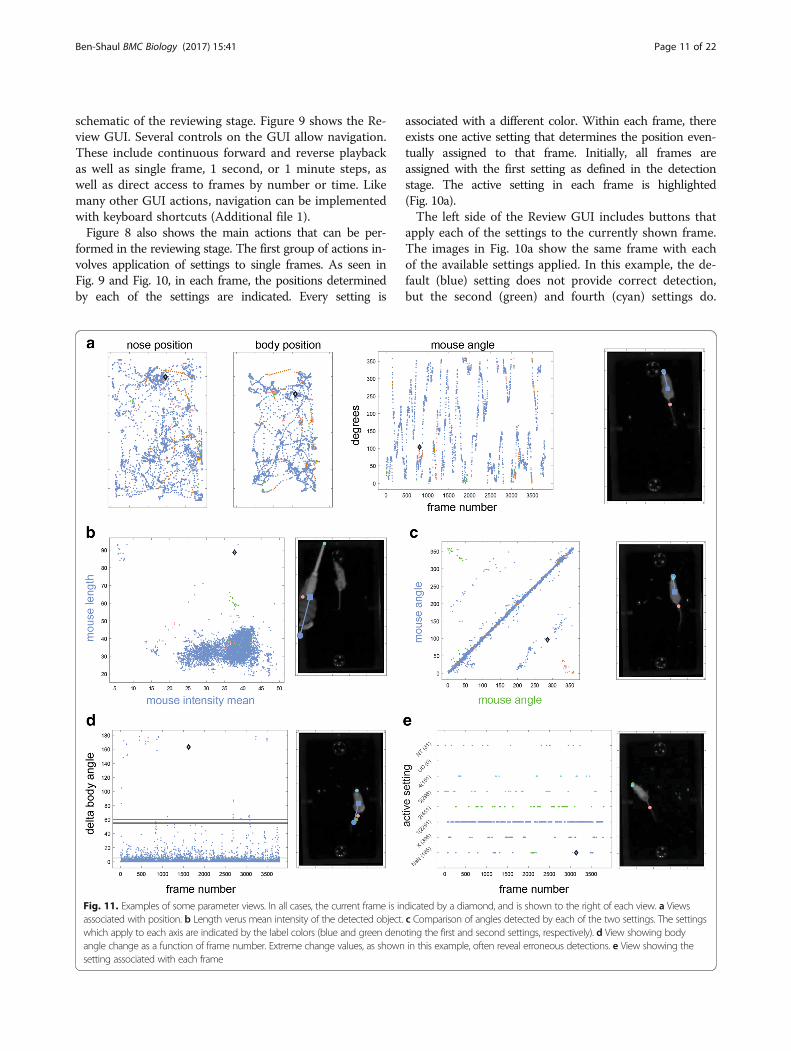
Fig. 11. Examples of some parameter views. In all cases, the current frame is inassociated with position. b Length verus mean intensity of the detected object.which apply to each axis are indicated by the label colors (blue and green denoangle change as a function of frame number. Extreme change values, as shownsetting associated with each frame
associated with a different color. Within each frame, thereexists one active setting that determines the position even-tually assigned to that frame. Initially, all frames areassigned with the first setting as defined in the detectionstage. The active setting in each frame is highlighted(Fig. 10a).The left side of the Review GUI includes buttons that
apply each of the settings to the currently shown frame.The images in Fig. 10a show the same frame with eachof the available settings applied. In this example, the de-fault (blue) setting does not provide correct detection,but the second (green) and fourth (cyan) settings do.
dicated by a diamond, and is shown to the right of each view. a Viewsc Comparison of angles detected by each of the two settings. The settingsting the first and second settings, respectively). d View showing bodyin this example, often reveal erroneous detections. e View showing the

Ben-Shaul BMC Biology (2017) 15:41 Page 12 of 22
When none of the predefined settings work, it is possibleto define manual positions or to exclude individualframes from the analysis.The second group of actions (Fig. 8) allows application
of settings to a continuous sequence of frames. Manualpositions cannot be applied to an entire segment in asingle operation, but it is possible to assign positions toan entire segment, using interpolation based on the startand end positions (Fig. 10b, c).
The parameter viewThe ability to apply settings to an entire sequence offrames accelerates the correction process, but it never-theless requires serial viewing of frames. A key feature ofOptiMouse, designed to further expedite reviewing, isthe option to view information about all frames simul-taneously. This is accomplished with the parameter dis-play (right side of the Review GUI, Fig. 9). In thisdisplay, each frame is indicated by one dot, with thehorizontal and vertical coordinates representing featuresassociated with the frame. The currently shown frame ishighlighted by the black diamond. Pressing the leftmouse button while the cursor is near a dot will showthe associated frame, providing direct access to frameswith particular attributes. As described in the manual,there are numerous parameter combinations (views)which can be shown. Here, we provide a brief descrip-tion of some of these views and the operations that canbe achieved with them.Figure 11a shows three views of a session (with 4000
frames). The current frame is shown on the right. In thenose position view, each dot represents the position ofthe nose, as determined by the active setting for thatframe with the dot’s color indicating the active setting.The body position view shows the coordinates of thebody center. Thus, the diamond positions indicate thenose and body positions associated with the currentframe. The third view in this panel shows mouse anglesas a function of frame number.The parameter views can show many parameters asso-
ciated with detection in each frame. Examples includemouse length and area, angle, body and nose positions,intensity values of mouse or background, and more. Theinterface allows plotting of any of these parameters, asdetermined by any of the settings, against any other par-ameter as determined by any of the settings. For ex-ample, in Fig. 11b, dots represent the length and meanintensity of the mouse. This representation happens tobe useful for identifying a frame with extreme featurevalues, where the detected object is clearly not a mouse.In Fig. 11c, the dots represent mouse angles as de-
tected by two different methods. Note that axes labeltexts describe the parameters shown, while their colorsindicate the relevant setting. In this example, most dots
are located on the diagonal, indicating agreement be-tween the first and second settings. Off-diagonal dotsare more likely to represent erroneous detections,since at least one of them must be incorrect. Thepurpose of views like those in Fig. 11c is to identifyframes with discrepancies between settings. Thus, inthe particular frame shown (Fig. 11c, right), the first(blue) and the second (green) settings yield anglesthat are almost opposite. Here, correct detection isprovided by settings 1 and 4, while settings 2 and 3confound tail and nose.Figure 11d shows another special view where the
dots represent the angular velocity of the mouse.Dot positions indicate the angle differences betweenthe preceding and the current frame. Exceedinglyhigh values are associated with erroneous detectionin either the frame itself, or in the one before it.This is indeed the case with the frame shown in theright side of Fig. 11d, where the default setting con-founds tail with nose. This and two other relatedviews (body speed and nose speed), are useful fordetecting, and as described below, for correcting er-roneous detections.Another useful view (Fig. 11e) shows the active setting
associated with each frame. In addition to showing thedistribution of the different settings, it allows identifica-tion of frames that are not associated with any valid pos-ition. These are denoted as NaN (not a number) frames.NaN frames lack positions because their active settingdoes not yield a valid position. This is the case for thedefault setting in the frame shown in Fig. 11e. In thisframe, three settings do yield a valid position, but onlytwo are correct (settings 2 and 4, as can be seen byexamining the frame image).
Operations that can be performed with the parameterviewThe importance of the parameter view is its ability toidentify frames with particular attributes, as well as toapply changes to a group of frames simultaneously.Some of these operations are described below.
Marking framesFigure 12b shows the nose position view in an arenacontaining two odor containing plates (Fig. 12a). If theimportant measures are time spent investigating theplates, then it may be unnecessary to carefully monitorpositions when the mouse is distant from them. To spe-cifically mark those frames in which the mouse is nearthe upper plate, a polygon can be drawn around the sub-set of relevant dots (Fig. 12c) using the subset button inthe mark panel (Fig. 9). Once a polygon is defined, theframes are marked. Marked frames are highlighted asbold dots (Fig. 12d). Highlighting is useful for identifying
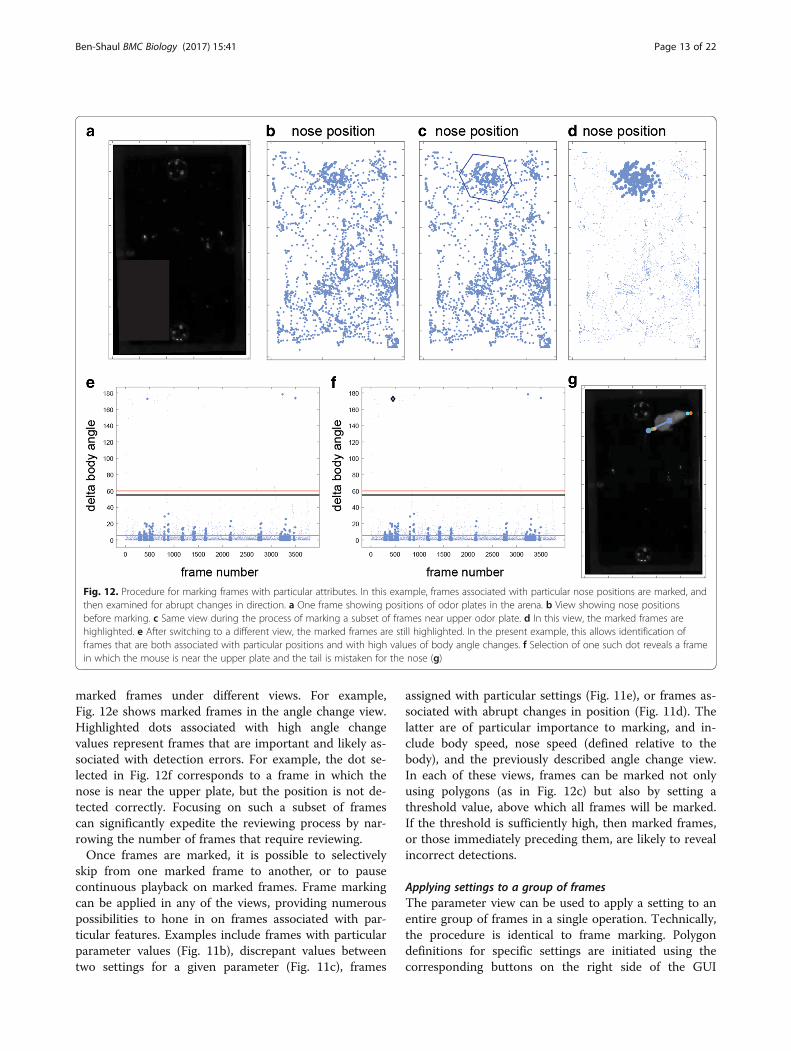
Fig. 12. Procedure for marking frames with particular attributes. In this example, frames associated with particular nose positions are marked, andthen examined for abrupt changes in direction. a One frame showing positions of odor plates in the arena. b View showing nose positionsbefore marking. c Same view during the process of marking a subset of frames near upper odor plate. d In this view, the marked frames arehighlighted. e After switching to a different view, the marked frames are still highlighted. In the present example, this allows identification offrames that are both associated with particular positions and with high values of body angle changes. f Selection of one such dot reveals a framein which the mouse is near the upper plate and the tail is mistaken for the nose (g)
Ben-Shaul BMC Biology (2017) 15:41 Page 13 of 22
marked frames under different views. For example,Fig. 12e shows marked frames in the angle change view.Highlighted dots associated with high angle changevalues represent frames that are important and likely as-sociated with detection errors. For example, the dot se-lected in Fig. 12f corresponds to a frame in which thenose is near the upper plate, but the position is not de-tected correctly. Focusing on such a subset of framescan significantly expedite the reviewing process by nar-rowing the number of frames that require reviewing.Once frames are marked, it is possible to selectively
skip from one marked frame to another, or to pausecontinuous playback on marked frames. Frame markingcan be applied in any of the views, providing numerouspossibilities to hone in on frames associated with par-ticular features. Examples include frames with particularparameter values (Fig. 11b), discrepant values betweentwo settings for a given parameter (Fig. 11c), frames
assigned with particular settings (Fig. 11e), or frames as-sociated with abrupt changes in position (Fig. 11d). Thelatter are of particular importance to marking, and in-clude body speed, nose speed (defined relative to thebody), and the previously described angle change view.In each of these views, frames can be marked not onlyusing polygons (as in Fig. 12c) but also by setting athreshold value, above which all frames will be marked.If the threshold is sufficiently high, then marked frames,or those immediately preceding them, are likely to revealincorrect detections.
Applying settings to a group of framesThe parameter view can be used to apply a setting to anentire group of frames in a single operation. Technically,the procedure is identical to frame marking. Polygondefinitions for specific settings are initiated using thecorresponding buttons on the right side of the GUI
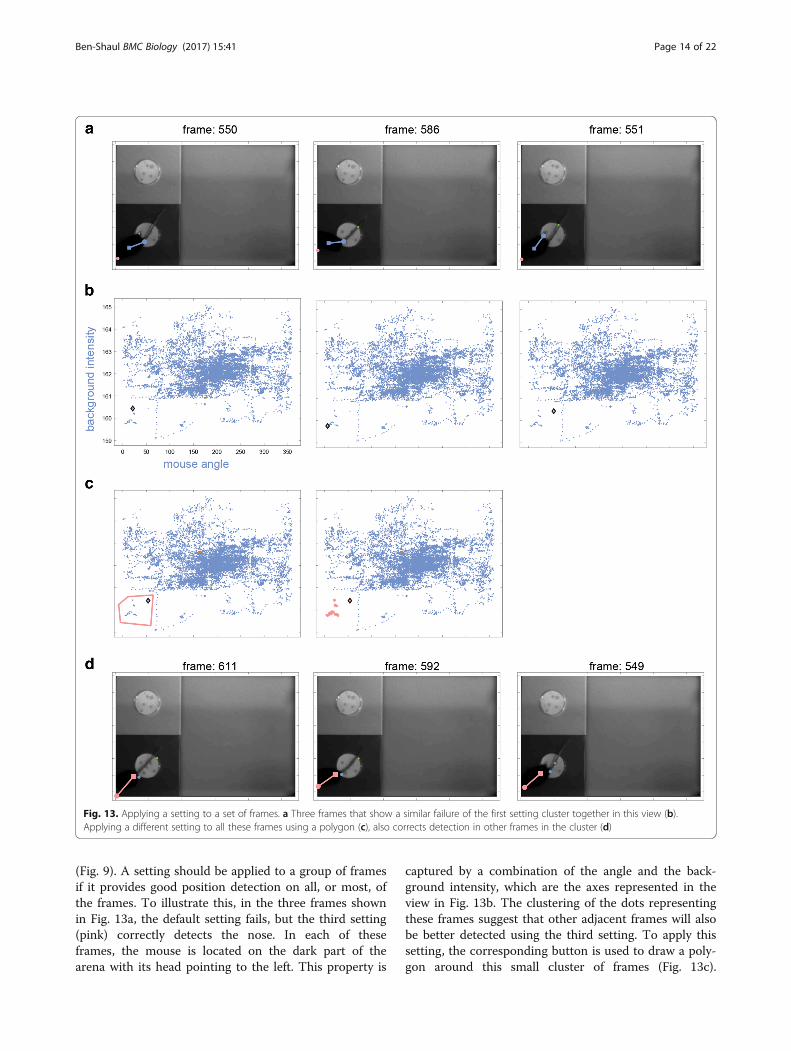
Fig. 13. Applying a setting to a set of frames. a Three frames that show a similar failure of the first setting cluster together in this view (b).Applying a different setting to all these frames using a polygon (c), also corrects detection in other frames in the cluster (d)
Ben-Shaul BMC Biology (2017) 15:41 Page 14 of 22
(Fig. 9). A setting should be applied to a group of framesif it provides good position detection on all, or most, ofthe frames. To illustrate this, in the three frames shownin Fig. 13a, the default setting fails, but the third setting(pink) correctly detects the nose. In each of theseframes, the mouse is located on the dark part of thearena with its head pointing to the left. This property is
captured by a combination of the angle and the back-ground intensity, which are the axes represented in theview in Fig. 13b. The clustering of the dots representingthese frames suggest that other adjacent frames will alsobe better detected using the third setting. To apply thissetting, the corresponding button is used to draw a poly-gon around this small cluster of frames (Fig. 13c).
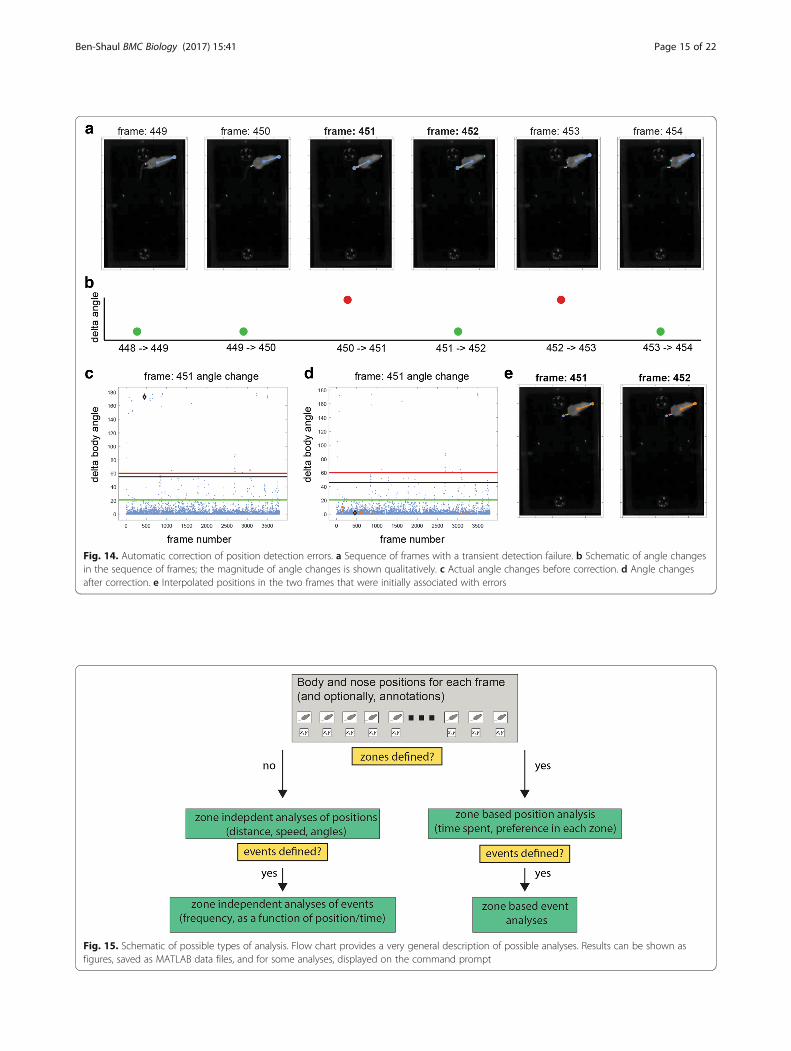
Fig. 14. Automatic correction of position detection errors. a Sequence of frames with a transient detection failure. b Schematic of angle changesin the sequence of frames; the magnitude of angle changes is shown qualitatively. c Actual angle changes before correction. d Angle changesafter correction. e Interpolated positions in the two frames that were initially associated with errors
Fig. 15. Schematic of possible types of analysis. Flow chart provides a very general description of possible analyses. Results can be shown asfigures, saved as MATLAB data files, and for some analyses, displayed on the command prompt
Ben-Shaul BMC Biology (2017) 15:41 Page 15 of 22

Ben-Shaul BMC Biology (2017) 15:41 Page 16 of 22
Examination of other frames in the cluster (Fig. 13d) val-idates the assumption that this setting is adequate forthem as well. Similar solutions can be applied in othersituations where non-consecutive frames sharing somecommon features are best assigned with a particularsetting.In addition to marking and applying predefined set-
tings, polygon definitions in the parameter view can beused to exclude frames. Frame exclusion is useful forwhen frames should be ignored due to technical prob-lems with them.
Correcting brief detection failuresA common type of failure is to confound nose and tail po-sitions. Even when a setting works well for most frames,there may be brief episodes of failures. Such cases will beassociated with abrupt changes in the calculated mouseangle. An example is shown in the sequence of six framesin Fig. 14a. Here, the default setting fails for two of theframes (451 and 452), but correctly identifies the flankingframes. Consequently, there are abrupt angle changes be-tween the second and third, and fourth and fifth frames(Fig. 14b). The sequence of abrupt changes can be utilizedto detect such transient detection failures, after which po-sitions in the intervening frames can be corrected usinginterpolation. Figures 14c and d show the angle changeview before and after applying correction, respectively.The green and red lines in these panels correspond to userdetermined parameters that specify how to detect suchabrupt transient changes (Additional file 1). Note that
Fig. 16. The Analysis GUI after the eight zones were defined
after applying correction, the angle change associated withframe 451 (the current frame in Fig. 14c, d) decreases dra-matically. Interpolated frames are shown in Fig. 14d asochre dots. Figure 14e shows the two problematic framesafter interpolation. As described in the manual (Additionalfile 1), this correction is useful only when errors occurrarely, over a background of correct detections.
AnnotationAn additional, optional, function of the reviewingstage is to assign events to frames. Annotated eventscan include any user defined feature such as gro-oming, freezing, rearing, or any other postural ordynamic property. As indicated in Fig. 8, event an-notation can be applied to single frames or to con-tinuous segments of frames. See the manual for amore detailed explanation of annotation.
AnalysisA schematic description of built-in analyses is shown inFig. 15. The analysis GUI is shown in Fig. 16. Most GUIbuttons create graphical displays of particular analyses.In addition to graphical displays, all analyses can besaved into Results files for further processing and ana-lysis. The Results file is a MATLAB data file (*.mat),which contains a single data structure with variousfields. The information saved to file is considerably morecomprehensive than that shown in the graphical dis-plays, and allows further advanced (custom) analyses.The manual (Additional file 1) describes the Results file
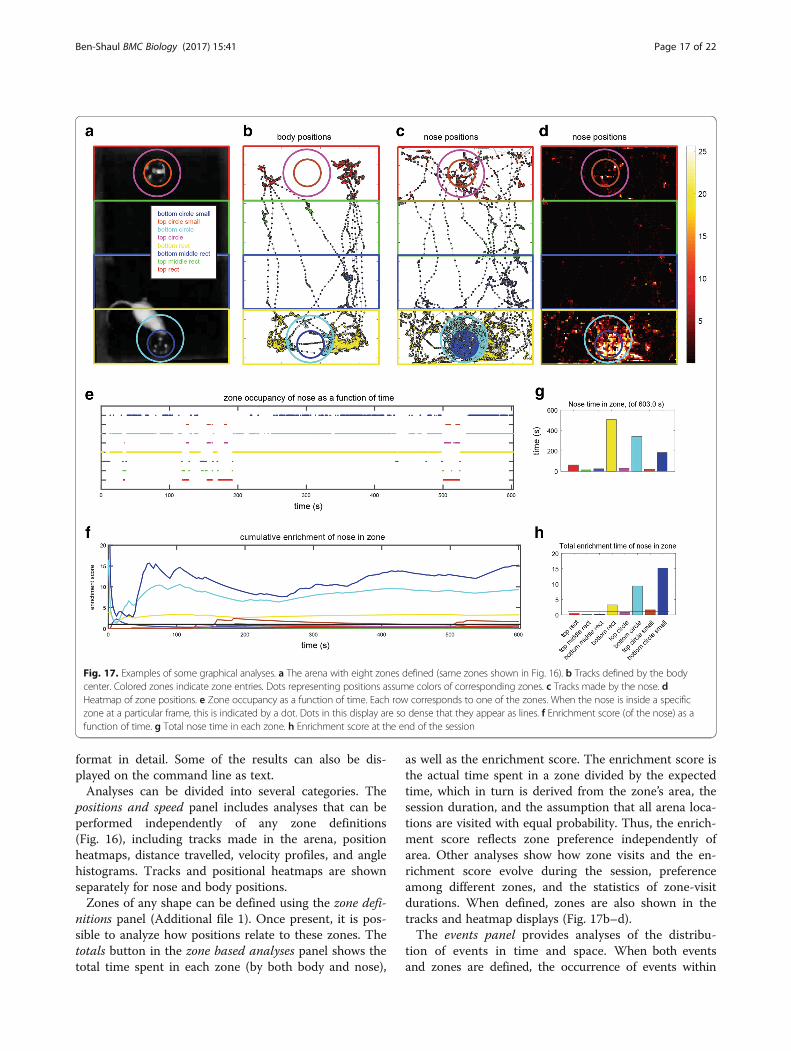
Fig. 17. Examples of some graphical analyses. a The arena with eight zones defined (same zones shown in Fig. 16). b Tracks defined by the bodycenter. Colored zones indicate zone entries. Dots representing positions assume colors of corresponding zones. c Tracks made by the nose. dHeatmap of zone positions. e Zone occupancy as a function of time. Each row corresponds to one of the zones. When the nose is inside a specificzone at a particular frame, this is indicated by a dot. Dots in this display are so dense that they appear as lines. f Enrichment score (of the nose) as afunction of time. g Total nose time in each zone. h Enrichment score at the end of the session
Ben-Shaul BMC Biology (2017) 15:41 Page 17 of 22
format in detail. Some of the results can also be dis-played on the command line as text.Analyses can be divided into several categories. The
positions and speed panel includes analyses that can beperformed independently of any zone definitions(Fig. 16), including tracks made in the arena, positionheatmaps, distance travelled, velocity profiles, and anglehistograms. Tracks and positional heatmaps are shownseparately for nose and body positions.Zones of any shape can be defined using the zone defi-
nitions panel (Additional file 1). Once present, it is pos-sible to analyze how positions relate to these zones. Thetotals button in the zone based analyses panel shows thetotal time spent in each zone (by both body and nose),
as well as the enrichment score. The enrichment score isthe actual time spent in a zone divided by the expectedtime, which in turn is derived from the zone’s area, thesession duration, and the assumption that all arena loca-tions are visited with equal probability. Thus, the enrich-ment score reflects zone preference independently ofarea. Other analyses show how zone visits and the en-richment score evolve during the session, preferenceamong different zones, and the statistics of zone-visitdurations. When defined, zones are also shown in thetracks and heatmap displays (Fig. 17b–d).The events panel provides analyses of the distribu-
tion of events in time and space. When both eventsand zones are defined, the occurrence of events within
Ben-Shaul BMC Biology (2017) 15:41 Page 18 of 22
particular zones can be displayed as well (using the inzones button in the events panel). The complete list ofanalyses and displays is described in detail in the manual(Additional file 1).
ResultsIn this section, we briefly describe a few examples thatprovide some general insights on analysis of position datausing OptiMouse. This analysis is based on a two-odorpreference test in a rectangular arena, but these principlesapply to a broad range of arena configurations.Figure 17a shows a movie frame (as seen in the Ana-
lysis GUI) following the definition of eight zones. In thissession, the mouse was an adult female ICR mouse,which sampled two plates with male urine stimuli. Thearena was a plastic cage with dimensions 36 × 20 ×18 cm (L ×W×H). Lighting was supplied by four redlamps (General Electric, 25 W, LED light bulbs) placedabove the cages and positioned to minimize shadows.The video was made with a HD camcorder (CanonLegria HFR106), mounted 210 cm above the cage floor.The video format was a 24 bit per pixel, RGB, with a1280 × 720 pixel resolution, taken at 30 frames per sec-ond. Movie duration was 602 seconds (18,071 frames).Arena preparation (with a single arena defined, seeFigs. 2 and 3) required 745 seconds (on a Lenovo T440slaptop with 12GB of RAM, an i7-4600 processer, and aSamsung SSD 850 EVO disk). Detection (Figs. 4 and 5)used four different settings (setting 1 (default): algorithm6, three peeling steps, threshold 0.5, setting 2: same assetting 1 with threshold 0.8, setting 3: same as setting 1with threshold 1.35, setting 4: algorithm 7, three peelingsteps, threshold 1.75). Detection required 1407 seconds.Detection using a single setting (the default) required395 seconds. During reviewing of the 18,071 frames, 489(2.7%), 262 (1.5%), and 1434 (8%) were assigned to set-tings 2, 3, and 4, respectively. Eighteen (0.1%) frameswere assigned manual positions and 383 (2.1%) wereinterpolated.Figure 17b and c are displays of body and nose tracks,
respectively, for the entire session. Comparison of thetwo panels underscores the importance of accurate iden-tification of nose rather than body coordinates. Specific-ally, it is the nose rather than the body that enters thesmall circular zones containing odor plates, and providesan indication of preference. Figure 17d shows a heatmapdisplay of nose positions. Figures 17e and f show timesof zone visits and the enrichment score as a function oftime (only nose positions are shown in these panels).The total time spent in each zone, which is proportionalto the number of dots in Fig. 17e, is shown in Fig. 17g.The enrichment score at the end of the session, equiva-lent to height of the traces in Fig. 17f at the last timepoint, is shown in Fig. 17h.
Examination of the enrichment score as a function oftime for the different zones provides two insights. First,the actual preference values are highly sensitive to theprecise definition of the zones. In the current example,the small circular zone at the bottom (blue) is associatedwith stronger preference than the larger circle at thebottom (cyan). Consequently, the difference in prefer-ence between the small lower and upper circles is con-siderably larger than that for the corresponding largecircles. Second, the specific time point at which the en-richment score is considered can have a significant im-pact on the preference scores. As seen in Fig. 17g, inmost zones, the enrichment score changes as a functionof time. This in itself is not unexpected, but it is note-worthy that zone preference can change abruptly, and insome cases, may even reverse in time. Thus, care mustbe taken when defining zones and setting the exact pe-riods for analysis, as these may have a profound, qualita-tive effect on apparent preferences.The analysis shown in Fig. 17 features position data
after the reviewing stage. An obvious question is the ex-tent to which the results rely on careful (and potentiallytime consuming) reviewing. The answer depends onmany factors, which involve the video quality, the mousebehavior, and the relevant behavioral metrics, and willthus vary under different situations. In Fig. 18, we ad-dress this issue with three different videos (Additionalfiles 2, 3, and 4). All these videos (each 10 minutes long)are similar in attributes to the movie described aboveand shown in Fig. 17. The videos have been reviewedand the default settings have been overridden when theydid not yield correct detections. Thus, the annotateddata approximates an error-free account of the mousepositions. The number of frames not associated with thedefault setting (and the total number of frames) are 671(18,410), 3621 (18,027), and 3582 (18,071), for videos 1,2, and 3, respectively. The key point which is immedi-ately apparent from inspection of the position displaysand zone preference scores in Fig. 18 is that the anno-tated and non-annotated data yield very similar results.This comparison indicates that, for these examples, cor-rect detection is achieved in the majority of frames, andthat the failures that do occur, do not have a prominentinfluence on the final results. Thus, the major trends inthe data do not depend on the annotation, indicatingthat the default detection performs well on these videos.Nevertheless, closer inspection does reveal differences,both in positions and in terms of zone preference ratios.We stress that the default setting in OptiMouse will notbe appropriate for all movies. However, we do claimthat, for many videos, there will be one single detectionsetting, that even without reviewing, will yield reliableresults even in the absence of an elaborate reviewingprocess. The importance of the reviewing stage is
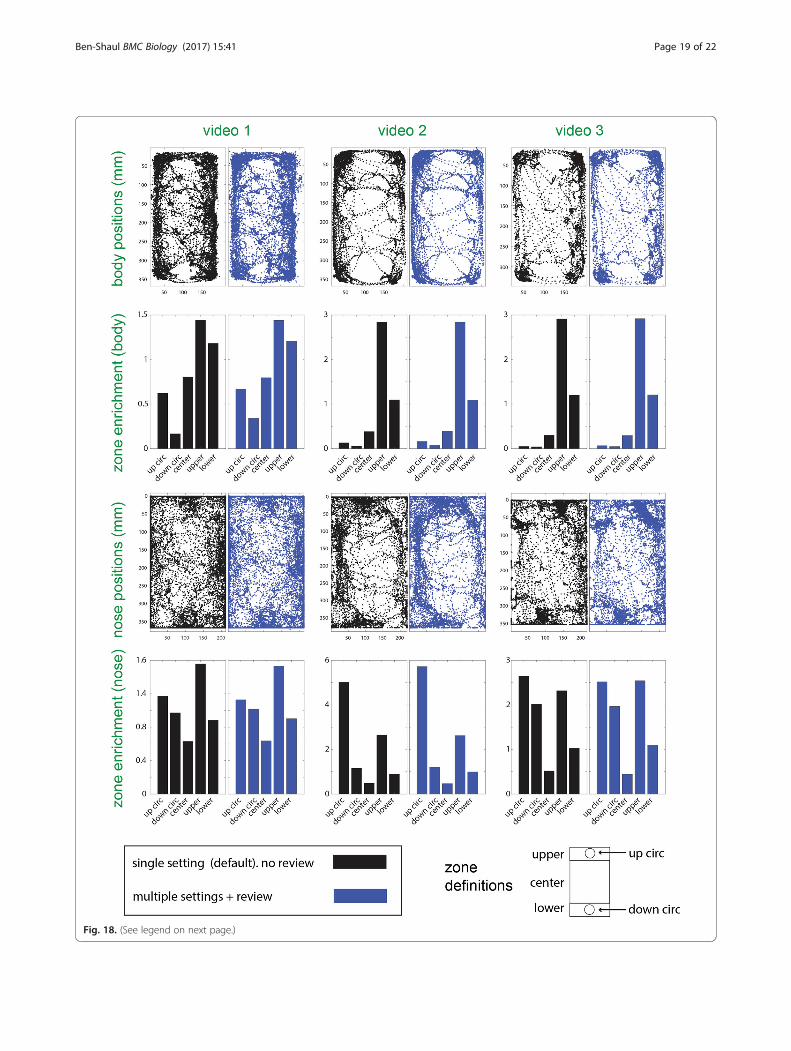
Fig. 18. (See legend on next page.)
Ben-Shaul BMC Biology (2017) 15:41 Page 19 of 22
(See figure on previous page.)Fig. 18. Comparison of positional analysis with and without reviewing for three different videos. Each video is shown in one column, and eachrow represents one type of analysis. The first row from the top shows body position coordinates. The second row shows enrichment scores ofbody positions in each of five different zones, whose coordinates relative to the arena are shown at the bottom of the figure. The third andfourth rows from the top are similar to the upper rows, except that nose, rather than body positions, are shown. Each panel contains two plots.The plots on the left (in black) show the results using the default setting, while plots on the right (blue) show the same analyses after theapplication of non-default settings, including manual settings
Ben-Shaul BMC Biology (2017) 15:41 Page 20 of 22
determined by the video and the question asked. For ex-ample, if a large open-field arena is divided into fourquadrants, the benefits of reviewing are likely to be min-imal. On the other hand, if the analysis involves analysis ofnose positions on a fine spatial scale, or of body angles,then reviewing is likely to be more crucial. Ultimately,users must evaluate the performance of various algorithmson their own data to determine the importance ofreviewing.OptiMouse does not include a module for population
level analysis. However, when the results are saved to aMATLAB file, it is possible to add tags to each session.These tags are useful for identifying sessions for subse-quent population level analyses of position data.
DiscussionIn this manuscript, we presented OptiMouse, an opensource MATLAB-based code for the semiautomatic ana-lysis of mouse position data. Although most examplesabove focused on a simple rectangular arena and two-stimulus preference tests, the principles described hereapply to other arena configurations and behavioral tests.Because OptiMouse allows definition of arenas andzones or any arbitrary shape, it is suitable for any testthat involves a single mouse within a static arena, in-cluding tests such as open field behavior, place prefer-ence or avoidance, and plus mazes [17]. OptiMouse isnot suitable for analyzing social interactions because thedetection algorithm is designed for a single mouse in anarena. At the analysis stage, any behavioral parametersthat are defined by the body and/or nose positions can beeasily extracted from the Results file. This includes mea-sures such as speed, acceleration, and body angle. Freezingepisodes can be easily derived from speed velocity profiles.Appendix 9 in the user manual (Additional file 1) includescode for analysis of freezing using the Results file andexamples of the analysis. Furthermore, if zones are de-fined, the dependence of each of those measures on thezone can be easily derived using the Results file whichcontains occupancy information in each zone for each ofthe frames. Information about more subtle posturalfeatures (such as grooming and reading) can be incorpo-rated into the Results file using manual annotation whichallows frame by frame annotation of any user definedevent (e.g., freezing, grooming; see the manual). Once de-fined, the analysis of the occurrence of these events in
time and space, and particularly in specific zones, is an in-tegral part of the analysis GUI. Automatic detection ofsuch subtle postural features is beyond the current scopeof OptiMouse. Implementing such automatic detectioncan be achieved via user defined detection functions,which will need to return other variables in additionto the required variables that are returned by default(e.g., body and nose positions). See Additional file 1:Appendix 5 in the manual for a detailed explanation ofthe outputs of the detection functions. OptiMouse doesnot support an explicit synchronization signal, but align-ment of behavioral data with non-video data (such aselectrophysiological data) is possible if the non-video datacontains a time stamp that is aligned to the video. Sincethe Results file contains a variable with the time of eachframe and a frame by frame description of all positionand movement parameters, events and behavioral fea-tures can be compared at the temporal resolution of thevideo frame rate.At a basic level, OptiMouse provides a simple yet
comprehensive solution for the analysis of position data,starting with video data and culminating with graphicaldisplays. At a more advanced level, OptiMouse is an ex-pandable software with multiple tools designed toachieve high accuracy detection and more advanced ana-lyses of positional data. Using OptiMouse at a basic levelis appropriate for videos with good quality, when highaccuracy determination of nose positions is not critical,or when the relevant measures concern body rather thannose positions. Under these conditions, after definingarenas, it may suffice to apply one detection setting anddirectly analyze the data, entirely skipping the reviewingstage. The strength of OptiMouse, however, lies in theability to achieve high quality nose position determin-ation under less than ideal conditions. This ability in-volves two elements. First, multiple settings can bedefined for any given session (Fig. 4). Second, positionsare assigned to each frame based on the settings thatyield the most accurate detection (Fig. 8). When none ofthe predefined settings work, positions can be assignedmanually or interpolated.While setting detection parameters, users have almost
full control over all aspects of detection, including back-ground image subtraction, threshold level determination,number of peeling cycles, and selection of the algorithmto apply. Despite this flexibility, and despite the ability to
Ben-Shaul BMC Biology (2017) 15:41 Page 21 of 22
apply multiple settings, the built-in algorithms cannotcover all image detection scenarios. Acknowledging suchlimitations, OptiMouse is designed to seamlessly inte-grate user defined functions into the interface as if theywere built-in.Indeed, the simplest approach to expansion of Opti-
Mouse is to apply custom detection algorithms. Custom al-gorithms may be slight variations of built-in algorithms, butcan also implement entirely novel approaches. They mayalso use other parameters in addition to those integratedwithin OptiMouse. It should be noted that the algorithmsthat can be most easily integrated are limited to singleframe analysis of grayscale converted images. Incorporationof color information, usage of prior knowledge in any givenframe (e.g., using Kalman Filters), and automatic derivationof other positional features (e.g., automatic detection ofrearing, grooming [7, 8]) are potential improvements thatwill require more extensive modification of the code.When it is important to minimize detection errors, the
reviewing stage is crucial. One way to review a session isto watch it in its entirety, pause on errors, and correctthose using predefined settings or a manually defined pos-ition. If there are many detection failures, then seriallyviewing and correcting all errors is impractical. The par-ameter display in the Review GUI was designed to facili-tate reviewing, by allowing simultaneous visualization ofall frames using an approach adopted from spike sortingsoftware [18]. Namely, in spike sorting software, multidi-mensional spike shape data is often represented by a smallnumber of principal components. Principal componentanalysis is not easily applicable to variable movie images,but their dimensionality can be effectively reduced byrepresenting their salient features. The advantage of sucha display is that it allows viewing, marking, or changingsettings for frames that share common attributes. In par-ticular, the ability to focus on rapid changes and discrep-ancies between different settings is useful for identifyingframes with likely errors. The ability to target on specificarena locations (Fig. 12b–d) allows focusing on thoseframes where correct detection is critical. Practically, theuse of keyboard shortcuts can significantly accelerate thereviewing and correction process.In summary, OptiMouse is a fully documented
MATLAB-based open source program, which users canexpand according to their own particular needs. We an-ticipate that OptiMouse will be very useful to other re-searchers in the field, providing a simple, accurate, andfree solutions for analysis of mouse position data.
Additional files
Additional file 1: PDF user manual for OptiMouse. (PDF 6406 kb)
Additional file 2: MP4 file containing Video 1 from Fig. 18.(MP4 29118 kb)
Additional file 3: MP4 file containing Video 2 from Fig. 18.(MP4 26693 kb)
Additional file 4: MP4 file containing Video 3 from Fig. 18.(MP4 26098 kb)
AcknowledgementsI thank Oksana Cohen for extensively and patiently testing the OptiMouse code,for providing many useful suggestions, and for collecting most of the datapresented in this manuscript. I thank Ankur Gupta for helpful discussions andinsights during initial stages of development and Dorrit Inbar for many helpfuldiscussions on the code. I thank Daniel David, Jennifer Spehr, Noa Rosenthal,and Racheli Nisim for testing the code. I thank the labs of Marc Spehr, RafiHaddad, Josh Goldberg, Yoni Kupchik, and Adi Mizrahi for providing movies fortesting, some of which are shown in the manuscript and the manual. I thankmembers of the Ben-Shaul lab for commenting on the user manual. I thank Dr.Gillian Kay for proofreading and helpful editing suggestions.
FundingThis work was funded by the Israeli Science Foundation (grant #1703/16).
Availability of data and materialAll source code can be downloaded from the GitHub repository https://github.com/yorambenshaul/optimouse. The GitHub repository also containsthe user manual, which is also available as Additional file 1. Video dataanalyzed in Fig. 18 is included in Additional files 2, 3, and 4. Additional file 1is a pdf file containing a detailed user manual. Additional files 2, 3, and 4 aremp4 videos for the data whose analysis is described in the Results sectionand in Fig. 18. Each of these movies contains images of three simultaneouslyrecorded arenas, of which only one was used in each example in Fig. 18.The left arena in Additional file 2 corresponds to movie 1. The center arenain Additional file 3 corresponds to movie 2. The left arena in Additional file 4corresponds to movie 3.
Authors’ contributionsYB-S wrote the code and analyzed the data described here.
Competing interestsI declare that I have no competing interests associated with this publication.
Consent for publicationNot applicable.
Ethics approval and consent to participateAll experiments from which videos were taken were approved by therelevant ethical committees of the research institutes.
Publisher’s NoteSpringer Nature remains neutral with regard to jurisdictional claims inpublished maps and institutional affiliations.
References1. da Lin Y, Zhang SZ, Block E, Katz LC. Encoding social signals in the mouse
main olfactory bulb. Nature. 2005;434(7032):470–7.2. Cichy A, Ackels T, Tsitoura C, Kahan A, Gronloh N, Sochtig M, et al.
Extracellular pH regulates excitability of vomeronasal sensory neurons.J Neurosci. 2015;35(9):4025–39.
3. Root CM, Denny CA, Hen R, Axel R. The participation of cortical amygdala ininnate, odour-driven behaviour. Nature. 2014;515(7526):269–73.
4. Ferrero DM, Lemon JK, Fluegge D, Pashkovski SL, Korzan WJ, Datta SR, et al.Detection and avoidance of a carnivore odor by prey. Proc Natl Acad Sci U S A.2011;108(27):11235–40.
5. Brock O, Bakker J, Baum MJ. Assessment of urinary pheromonediscrimination, partner preference, and mating behaviors in female mice.Methods Mol Biol. 2013;1068:319–29.
Ben-Shaul BMC Biology (2017) 15:41 Page 22 of 22
6. Roberts SA, Davidson AJ, McLean L, Beynon RJ, Hurst JL. Pheromonalinduction of spatial learning in mice. Science. 2012;338(6113):1462–5.
7. Holly KS, Orndorff CO, Murray TA. MATSAP: an automated analysis of stretch-attend posture in rodent behavioral experiments. Sci Rep. 2016;6:31286.
8. Reeves SL, Fleming KE, Zhang L, Scimemi A. M-Track: a new software forautomated detection of grooming trajectories in mice. PLoS Comput Biol.2016;12(9):e1005115.
9. Gomez-Marin A, Partoune N, Stephens GJ, Louis M, Brembs B. Automatedtracking of animal posture and movement during exploration and sensoryorientation behaviors. PLoS One. 2012;7(8):e41642.
10. Zarringhalam K, Ka M, Kook YH, Terranova JI, Suh Y, King OD, et al. An opensystem for automatic home-cage behavioral analysis and its application tomale and female mouse models of Huntington's disease. Behav Brain Res.2012;229(1):216–25.
11. Dagan SY, Tsoory MM, Fainzilber M, Panayotis N. COLORcation: a newapplication to phenotype exploratory behavior models of anxiety in mice.J Neurosci Methods. 2016;270:9–16.
12. Perez-Escudero A, Vicente-Page J, Hinz RC, Arganda S, de Polavieja GG.idTracker: tracking individuals in a group by automatic identification ofunmarked animals. Nat Methods. 2014;11(7):743–8.
13. Ohayon S, Avni O, Taylor AL, Perona P, Roian Egnor SE. Automated multi-day tracking of marked mice for the analysis of social behaviour. J NeurosciMethods. 2013;219(1):10–9.
14. Wiltschko AB, Johnson MJ, Iurilli G, Peterson RE, Katon JM, PashkovskiSL, et al. Mapping sub-second structure in mouse behavior. Neuron.2015;88(6):1121–35.
15. Hong W, Kennedy A, Burgos-Artizzu XP, Zelikowsky M, Navonne SG, PeronaP, et al. Automated measurement of mouse social behaviors using depthsensing, video tracking, and machine learning. Proc Natl Acad Sci U S A.2015;112(38):E5351–60.
16. Puscian A, Leski S, Kasprowicz G, Winiarski M, Borowska J, Nikolaev T, et al.Eco-HAB as a fully automated and ecologically relevant assessment of socialimpairments in mouse models of autism. eLife. 2016;5.
17. Crawley JN. What’s Wrong with my Mouse? Behavioral Phenotyping ofTransgenic and Knockout Mice. 2nd ed. Hoboken: Wiley-Interscience;2007. p. xvi–523.
18. Hazan L, Zugaro M, Buzsaki G. Klusters, NeuroScope, NDManager: a freesoftware suite for neurophysiological data processing and visualization.J Neurosci Methods. 2006;155(2):207–16.