Optimization of oil production by OPEC countries
53
CHARLES UNIVERSITY FACULTY OF SOCIAL SCIENCES Institute of Economic Studies Mark´ eta Pil´ atov´ a Optimization of oil production by OPEC countries Bachelor thesis Prague 2018
-
Upload
khangminh22 -
Category
Documents
-
view
0 -
download
0
Transcript of Optimization of oil production by OPEC countries
CHARLES UNIVERSITY
FACULTY OF SOCIAL SCIENCES
Institute of Economic Studies
Marketa Pilatova
Optimization of oil productionby OPEC countries
Bachelor thesis Prague 2018
Author: Marketa Pilatova
Supervisor: RNDr. Michal Cervinka, Ph.D.
Academic Year: 2017/2018
Bibliographic note
PILATOVA, Marketa. Optimization of oil production by OPEC countries.
Prague 2018. 35 pp. Bachelor thesis (Bc.) Charles University, Faculty of
Social Sciences, Institute of Economic Studies. Thesis supervisor RNDr.
Michal Cervinka, Ph.D.
Abstract
Almost 4 years of low oil prices and excess supply call the relevance of OPEC
for current oil market into question. Therefore to investigate its role, this
thesis examines the optimum oil production of individual OPEC countries
accenting the consequent profit. Firstly, Cournot’s model is employed to find
equilibrium price and output on the oligopolistic market. Secondly, model
considering OPEC and Russia as the Stackelberg leader with competitors
forming oligopolistic fringe helps to uncover the potential of the recent car-
tel of OPEC and Russia. In both models, data from the year 2016 with
different levels of elasticity ranging from -0.1 to -0.2 are utilized. Our re-
search suggests that all OPEC members could have increased their profits
by forming a non-cooperative oligopolistic market, where prices would reach
up to 81.7 USD/bbl. Moreover, as a part of the cartel with Russia, OPEC
could increase its joint profits by almost 27 % compared to the oligopolistic
market, benefiting from coordinated output cuts followed by a steep growth
in price. Thus we can conclude that either OPEC lost its power over the
oil market or attempted to maintain its market share and drive higher-cost
producers out of the market.

Abstrakt
Po temer 4 roky vıdame na ropnem trhu nızke ceny a previs nabıdky, coz
znacne zpochybnuje relevanci OPECu. Abychom zjistili jeho roli, rozebereme
v teto praci optimalnı produkci ropy jednotlivych zemı OPECu s durazem
na zisk, ktereho by jednotlive zeme mohly dosahovat. Nejprve pouzijeme
Cournotuv model, abychom nasli rovnovaznou cenu a vystup na oligopolnım
trhu. Nasledne pomocı modelu, povazujıcıho OPEC a Rusko za Stackel-
bergova vudce, jehoz konkurenti tvorı oligopolnı lem, odhalıme potencial
nedavno utvoreneho kartelu OPECu a Ruska. V obou modelech uplatnıme
data z roku 2016 s ruznymi mırami elasticity poptavky na skale od -0.1
do -0.2. Nase zkoumanı ukazuje, ze vsichni clenove OPECu mohli mıt vyssı
zisk, pokud by participovali na nekooperativnım oligopolnım trhu, na kterem
by se cena vysplhala az na 81.7 USD/bbl. V prıpade vytvorenı kartelu s
Ruskem by spolecny profit OPECu mohl byt jeste o 27 % vyssı, a to dıky
koordinovanemu snizovanı vystupu a naslednemu prudkemu narustu cen. Z
toho lze usuzovat, ze bud’ OPEC ztratil kontrolu nad trhem s ropou nebo se
pokusil vytlacit z trhu konkurenty, jejichz produkcnı naklady jsou relativne
vyssı.
Keywords
OPEC, oil production, oligopolistic market, cartel, equilibrium
price
Klıcova slova
OPEC, produkce ropy, oligopolnı trh, kartel, rovnovazna cena

Declaration of Authorship
I hereby proclaim that I wrote my bachelor thesis on my own under the
leadership of my supervisor and that the references include all resources and
literature I have used.
I grant a permission to reproduce and to distribute copies of this thesis
document in whole or in part.
Prague, 11 May 2018
Signature
Acknowledgement
I would like to express my deepest gratitude to RNDr. Michal Cervinka,
Ph.D. for his kindness and tireless commenting on the thesis. A special
thanks belong to Dawud Ansari, M.Sc., who provided me with crucial data
and gave some priceless advice. I would also like to thank my family and
friends for always supporting me, especially to my father who helped me to
carry out the modelling part of this thesis. Finally, I would like to thank
our dearest teacher Ing. Ivo Koubek for encouraging our curiosity and love
for microeconomics.

Bachelor’s Thesis Proposal
Author’s name: Marketa Pilatova
Supervisor’s name: RNDr. Michal Cervinka, Ph.D.
Academic year: 2017/2018
Topic: Optimization of oil production by OPEC countries
Research question and motivation
This thesis primarily examines the optimal oil production levels for indi-
vidual OPEC member countries in an oligopolistic market (disregarding the
existence of OPEC as an economic agent) and the equilibrium price linked
to such market structure. The obtained data of production and price is then
juxtaposed with current state on the market that accounts for the existence
of OPEC. The resulting profits are used to determine to what extent is the
membership beneficial for individual countries. Such analysis is subsequently
used to discuss current role of OPEC and its optimal behaviour.
In light of recent changes in prices that put exporters under high pres-
sure as a result of decreased profits, the issue of oil market and OPEC
becomes vastly important. Since OPEC presumably abandoned its previ-
ously upheld position of decreasing produced quantity to maximize prices,
many now question its relevance and ability to improve the conditions of
the member states. This study grows even more significant, given that, to
our best knowledge, there is no recent relevant literature dealing with such
problematics.
Contribution
Economic literature scarcely covers the optimization problems of oil ex-
porting countries. Al-Qahtani (2008) conducted an analysis of optimal oil
production of Saudi Arabia in 2004, but no comprehensive study of all
OPEC members optimization has been conveyed. Most of the literature
concentrates solely on the market power of OPEC (Huppmann, 2013) and
development of prices (Jobling and Jamasb, 2015). While a lot of work has

been done also in the area of optimizing production of particular fields (Gun-
nerud and Foss, 2010), these studies are of limited relevance to the global
oil market.
The research is therefore of major importance for both the individual
members of OPEC and the organisation itself, as it enables them to make
fully informed decisions about increasing or limiting oil production. Moreover,
the study allows for balancing of negotiation positions within OPEC and
improvement of the distribution of production quotas. Finally, this paper
develops our understanding of cartels, as there are limited environments in
which we can study such behaviour.
Methodology
Firstly, cost functions of individual countries’ production will be obtained,
using model as proposed by Huppmann (2013). Secondly, an inverse demand
function will be derived based on the Cambridge working paper on price
volatility of oil (Jobling and Jamasb, 2015). Finally, the optimization prob-
lem for individual countries will be solved utilizing Nash equilibrium theory
and mathematical programming as suggested by Murphy et al. (1982). Two
major sources of data on consumption and production of oil are available:
IEA Quarterly statistics and OPEC Annual Statistical Bulletin.
Outline
1. Introduction
2. Characteristics of oil market and its recent development
3. Literature review
4. Methodology
5. Numerical results and interpretation
6. Conclusion

Bibliography
AL-QAHTANI, A. (2008). A Model for the Global Oil Market: Optimal
Oil Production Levels for Saudi Arabia. Presented at the IAEE International
Conference, New Orleans, 2008.
BEHAR, A., RITZ, R. A. (2016). An analysis of OPEC’s strategic ac-
tions, US shale growth and the 2014 oil price crash. IMF Working Paper
No. 16/131.
GUNNERUD, V., FOSS, B. (2010). Oil production optimization - A
piecewise linear model, solved with two decomposition strategies. Computers
& Chemical Engineering, Volume 34, Issue 11, Pages 1803-1812.
HUPPMANN, D. (2013). Endogenous shifts in OPEC market power: a
Stackelberg oligopoly with fringe. Working Paper at DIW Berlin.
JOBLING, A., JAMASB, T. (2015). Price Volatility and Demand for Oil:
A Comparative Analysis of Developed and Developing Countries. Cambridge
Working Papers in Economics 1512.
MURPHY, F.H., SHERALI, H.D., SOYSTER, A.L. (1982). A mathemat-
ical programming approach for determining oligopolistic market equilibrium.
Math. Program. 24, 92-106.
Contents
Introduction 1
1 The oil market characteristics 3
1.1 The role of OPEC . . . . . . . . . . . . . . . . . . . . . . . . 6
1.2 Recent developement . . . . . . . . . . . . . . . . . . . . . . 8
2 Literature review 11
2.1 OPEC exercising market power . . . . . . . . . . . . . . . . 12
2.2 Oligopolistic or competitive oil market . . . . . . . . . . . . 13
2.3 Reaction of OPEC to 2014 price downfall . . . . . . . . . . . 16
3 Methodology 18
3.1 Cost and inverse demand function . . . . . . . . . . . . . . . 18
3.2 Cournot model of the oligopolistic market . . . . . . . . . . 21
3.3 Coalition of OPEC and Russia as a Stackelberg leader . . . 22
4 Numerical results and interpretation 24
4.1 Equilibrium price . . . . . . . . . . . . . . . . . . . . . . . . 24
4.2 Equilibrium quantity . . . . . . . . . . . . . . . . . . . . . . 26
4.3 Situation of individual OPEC members . . . . . . . . . . . . 28
Conclusion 33
References 36
List of Tables and Figures 43

Introduction
Oil has become vital for economies all over the world especially due to its
wide range of possible utilization. Among others, it is chiefly used as a
fuel currently powering almost all motor vehicles as well as for manufac-
turing of plastic. According to International Energy Outlook 2017, petro-
leum products satisfy approximately one-third of world energy consumption.
Moreover, the petroleum is unlikely to lose such prominent position in fore-
seeable future despite the possibility of sharp price increase (EIA, 2017).
The exploration of oil market has always been exceptionally engaging
owing to the existence of the Organisation of petroleum exporting countries
(OPEC), the only publicly declared cartel in the world. Especially after the
two oil shocks in the 1970s, numerous studies examining its functioning and
power were published. However, the attention was fading away during the
first decade of the 21st century as prices of oil were high and OPEC seldom
took action.
The situation changed rapidly at the turn of the year 2014 when over
course of few months the price of oil halved. Especially countries heavily
dependent on incomes from oil production need to consider their further
actions. Even more so, OPEC is now facing a severe threat to its position
as a prime price-setter on the oil market by US shale producers. It has to
search for solution beneficial for its members with often very contradictory
preferences. For example, poverty-stricken Venezuela on the verge of civil
war urges current profit maximization much more than wealthy Qatar.
Since we acknowledge the importance of oil not only to its producers
but to the global economy, modelling the oil market is of major significance.
Thorough examination enables not only predicting future price development
but also allows for informed choices of individual producers and consumers.
So far, little attention has been paid to optimization of individual coun-
tries producing oil. Especially for OPEC members, this may be used to set
jointly optimal price and production levels or as a ground to fairly assign
production quotas. Alternatively, it may be used to infer current and future
1
relevance of OPEC.
This thesis aims at helping to fill in the gap. Firstly, we will model oil
market as a non-cooperative oligopolistic market and deduce the benefits, if
any, OPEC brought to individual cartel members. Further, in reaction to the
recent cooperation of OPEC and Russia, we will calculate optimization of
their joint cartel facing oligopolistic fringe of other producers. That should
provide us with an idea of what can be reached if OPEC and Russia fully ex-
ert their market power. Prices corresponding to such optimization problems
may also provide valuable insight to the functioning of the oil market.
The bachelor thesis is organised in the following manner. Firstly, we
start out with the characteristics of oil market including the vital role of
OPEC. Additionally, some discussion of recent development is conducted.
Then a literature review summarizing the most influential works in the field
of oil market modelling and OPEC’s behaviour is provided. The following
chapter is dedicated to methodology, which includes a description of cost
and demand functions as well as analysis of the two methods employed to
model the oil market. Finally, the numerical results are provided alongside
their interpretation.
2

1 The oil market characteristics
Every day 75.7 million barrels (bbl) of crude oil are produced all over the
world (OPEC, 2018b), which translates into almost 4 barrels per person and
year. Considering that 1 barrel corresponds to nearly 120 litres, we consume
approximately 480 litres yearly.
Despite tendencies to support ecological energy sources, this number
keeps on growing. The year-on-year increase from 2016 to 2017 was approx-
imately 1.67 %, mostly drawn by higher consumption in China (accounting
for more than 10 % of total world oil consumption). Similar tendencies
are expected in the next years, with a gradually intensifying role of Indian
imports (OPEC, 2018c).
The suppliers of crude oil can be divided into two subgroups: OPEC and
non-OPEC producers. Currently, there are 14 members of OPEC: Algeria,
Angola, Ecuador, Equatorial Guinea, Gabon, Iran, Iraq, Kuwait, Libya, Ni-
geria, Qatar, Saudi Arabia, United Arab Emirates and Venezuela. Together,
OPEC members produce 32.3 mbbl of crude oil daily (OPEC, 2018b). Non-
OPEC producers extract 43.4 mbbl per day, with an increasing tendency
mostly caused by the higher output of the United States of America (OPEC,
2018c).
Other important information include proved crude oil reserves or reserve-
to-production ratio. Proved reserves show how much oil each country is
expected to own based on geological research and other data. On the other
hand, reserve-to-production ratio estimates the how long could country con-
tinue with its current production given the proved reserves. This is vital for
estimating an appropriate time horizon for policies and planning.
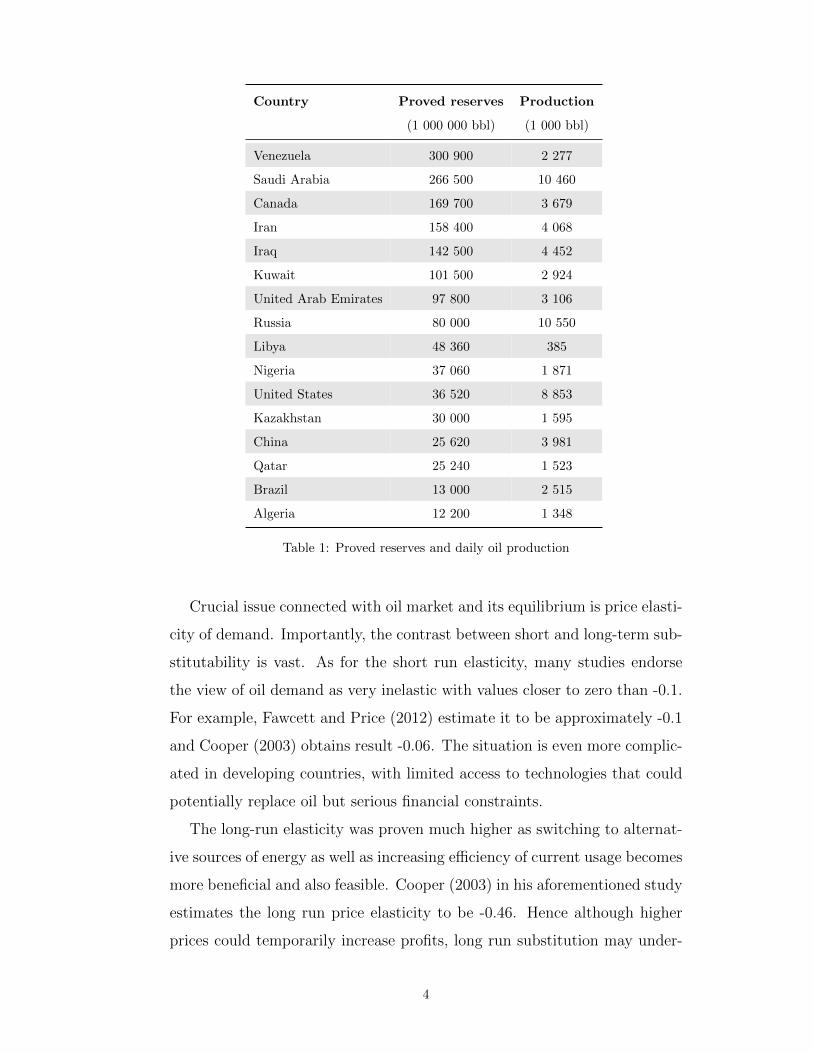
Table 1 shows proved reserves as well as the current daily production of
main oil producers. For brevity, only countries with reserves of at least 10
billion barrels are included. Data were taken over from CIA World Factbook
for both oil production (World Factbook, 2018a) and proved reserves (World
Factbook, 2018b). The provided information is sufficient to estimate the
reserve-to-production ratio.
3
Country Proved reserves Production
(1 000 000 bbl) (1 000 bbl)
Venezuela 300 900 2 277
Saudi Arabia 266 500 10 460
Canada 169 700 3 679
Iran 158 400 4 068
Iraq 142 500 4 452
Kuwait 101 500 2 924
United Arab Emirates 97 800 3 106
Russia 80 000 10 550
Libya 48 360 385
Nigeria 37 060 1 871
United States 36 520 8 853
Kazakhstan 30 000 1 595
China 25 620 3 981
Qatar 25 240 1 523
Brazil 13 000 2 515
Algeria 12 200 1 348
Table 1: Proved reserves and daily oil production
Crucial issue connected with oil market and its equilibrium is price elasti-
city of demand. Importantly, the contrast between short and long-term sub-
stitutability is vast. As for the short run elasticity, many studies endorse
the view of oil demand as very inelastic with values closer to zero than -0.1.
For example, Fawcett and Price (2012) estimate it to be approximately -0.1
and Cooper (2003) obtains result -0.06. The situation is even more complic-
ated in developing countries, with limited access to technologies that could
potentially replace oil but serious financial constraints.
The long-run elasticity was proven much higher as switching to alternat-
ive sources of energy as well as increasing efficiency of current usage becomes
more beneficial and also feasible. Cooper (2003) in his aforementioned study
estimates the long run price elasticity to be -0.46. Hence although higher
prices could temporarily increase profits, long run substitution may under-
4
mine future crude oil demand.
Furthermore, the oil market evinces many characteristics that make it
specific. First and foremost, similarly to other natural resources, the entry
to the market is strictly limited by the availability of oil reserves. That
backs the tendencies towards oligopolistic market structure since little fear
of competition occurs. Furthermore, leaving the oil in the ground incurs
only minor costs to the producer, whereas costs connected to storing are
rather high for the buyers and issues associated with lack of oil are immense.
Therefore oil-rich countries are in a much better negotiating position with
little to lose but much to seize from oil-dependent customers.
Besides, oil is traded at highly liquid spot markets. The very opposite can
be observed for example at coal market with prevailing long-term contracts
(Huppmann and Holz, 2009). Thus trading and investing in crude oil is less
costly, which makes it prone to speculative purchases. In addition, that may
also cause significant price volatility.
Another key element of the market is that oil can be purchased almost
exclusively with dollars (Mileva and Sigfried, 2012), presumably as a result
of a deal between the United States and OPEC members. However, the
situation is changing sluggishly: Russia agreed to sell oil to China for yuans
(Farchy, 2015) or Iran’s deal with its European customers to accept euro
payments (Verma, 2016), mostly as a result of the US sanctions. Those
changes may significantly influence the price of oil, as it hinges less upon the
value of the US dollar.
Finally, the role of infrastructure should not be overlooked. Although
there are some alternatives such as oil tankers, most of the countries, espe-
cially the landlocked ones, rely on the pipelines. In case of Eastern Europe,
this causes heavy dependency on Russian oil as no other source is available
(Cambridge Econometrics, 2016). Building new infrastructure is both fin-
ancially demanding and time-consuming, which once again strengthens the
position of oil producers.
5
1.1 The role of OPEC
With its prominent reserves and exports, OPEC plays a central role in the
crude oil market. Its members produce almost 40 percent of global oil output
(OPEC, 2018c) and have been proven to own 81 percent of worlds oil reserves
(CNN, 2017).
Since the establishment in September 1960 in Bagdad, the OPEC’s stated
mission has been to ”co-ordinate and unify petroleum policies among Mem-
ber Countries, in order to secure fair and stable prices for petroleum pro-
ducers; an efficient, economic and regular supply of petroleum to consum-
ing nations; and a fair return on capital to those investing in the industry”
(OPEC, 2018a). Such results are reached mainly through production quotas,
striving to ensure the well-being of the cartel.
OPEC came into public knowledge mostly after the first oil shock in 1973
reacting to US support of Israel in Yom Kippur war. The oil price quad-
rupled and cutting exports to the United States caused a severe shortage
of gasoline. Despite lifting the embargo year later, grave economic crisis
followed. Many countries, especially the United States underwent numerous
reforms to decrease oil dependency including the creation of large oil stock-
piles, instituting daylight saving time, investment into renewable sources of
energy and so on (History, 2010b).
The first oil shock was shortly followed by another one caused by Iranian
revolution in 1979 and the price of oil more than doubled due to supply
disruption (History, 2010a). Once again, attempts to save and replace oil
together with an exploration of new non-OPEC oil wells intensified. After
the two oil shocks, the demand for oil from OPEC members would not
recover mostly due to the increasing market share of other suppliers (Mileva
and Sigfried, 2012).
At the turn of the century, the oil market was relatively stable. However,
as many states, most notably China, faced favourable economic conditions
in the mid-2000s, the demand for oil was increasing rapidly. In combination
with decreasing supply caused by violence in Iraq and Nigeria, the prices of
6
oil surged to 123 dollars per barrel (BBC, 2008). After reaching an all-time
high, the price of oil slumped in 2008 as a result of economic crisis. The slow
recuperation of the world economy, as well as output loss due to the uprising
in Lybia, contributed to the recovery of oil prices (Darbouche, 2011).
Over the course of its functioning, OPEC has changed its way to manage
production multiple times. In the beginning, prices of oil were observed and
policies were formed in a way to keep them at acceptable levels. Towards
the end of the 1970s, OPEC set the production solely based on individually
assigned quotas without considering other indicators. Finally, the end of the
1980s was marked by a change in favour of preserving a stable market share
(Grundy, 2017). This aim seems to prevail up until recent months, despite
facing very low oil prices.
In general, OPEC members have a lot in common. Firstly, their costs to
produce a barrel of oil are significantly lower than those of other producers
such as the United States or Norway (Mileva and Sigfried, 2012). There-
fore, they have the ability to push the prices down to squeeze higher-cost
producers out of the market.
Furthermore, after a wave of nationalizations in the 1970s, most of the oil
in OPEC countries is produced by governments’ companies (Griffin, 1985).
It is thus important to realize the difference between solely profit-driven
companies and nationalized enterprises, whose aims are much more com-
plex. According to Kisswani (2014), the possibility of social unrests calls for
policies that raise popular support. For many OPEC members, this means
an attempt to harm western nations by cutting oil supplies or increasing
prices. To do that countries are willing to sacrifice 10 to 20 percent of their
revenues, which is unlikely to happen in private companies.
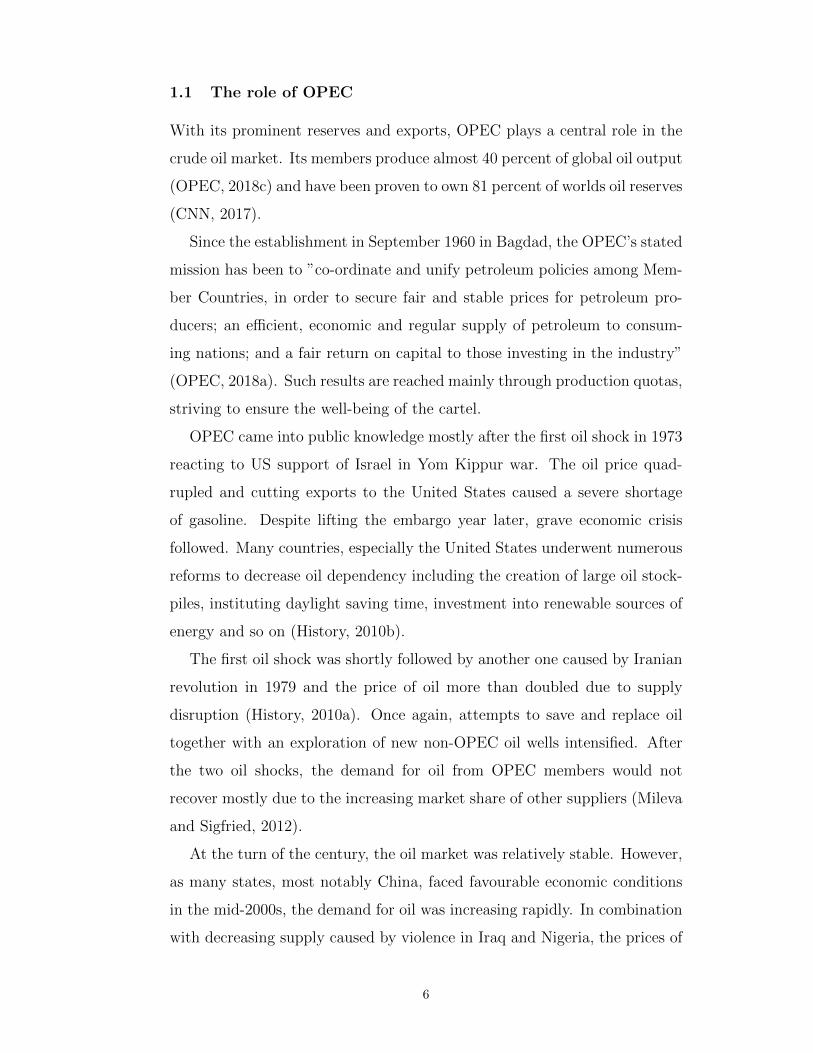
On the other hand, there are also some dissimilarities among the OPEC
members. Those differences can cause disagreement among the OPEC mem-
bers and make its functioning more difficult. A very important instance con-
sists in the extent to which countries depend on oil. All 3 countries with the
highest share of oil production in GDP belong to OPEC. Contrarily, some
7

members’ output accounts for much less than 10 percent of GDP (World
Bank, 2016b) and hence rely on high prices of oil to a much lower extent.
0
10
20
30
40
50
60
70
2005 2006 2007 2008 2009 2010 2011 2012 2013 2014 2015
Oil
rent
s as
% o
f GD
P
OPEC member's dependency on oil
Kuwait
Iraq
Saudi Arabia
Equatorial Guinea
United ArabEmiratesAngola
Gabon
Algeria
Qatar
Ecuador
Nigeria
Iran, Islamic Rep.
Venezuela, RB
Libya
Figure 1: Share of oil rents on GDP (World Bank, 2016b)
Traditionally, there is a large controversy concerning strategical decisions
in OPEC among its members. The largest producers are divided into groups
so-called Doves and Hawks. Countries in the former group include Saudi
Arabia, United Arab Emirates and Kuwait. Contrarily, Venezuela, Iraq and
Iran belong to the latter one. Doves are known to aim at a well-supplied
market with moderate prices and higher market share, while Hawks strive
to increase oil prices (Defterios, 2011). The strategy of Hawks prevailed for
quite a while, but the events of late 2014 and forth call its rationality into
question.
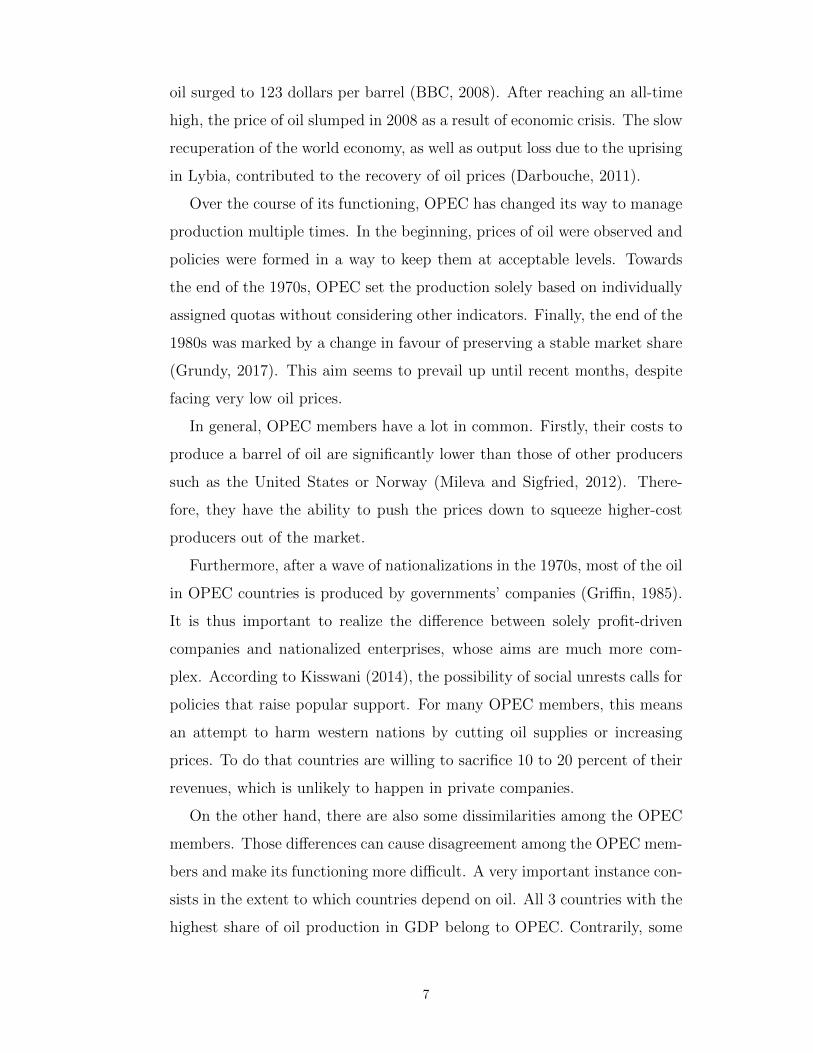
1.2 Recent developement
A sharp downturn in the second half of 2014 severely affected the oil market,
as prices halved in just a few months. Multiple factors presumably influenced
the price, most notably the increase in production of US shale gas by 3.5
million barrels per day over the preceding 5 years (Onour, 2017), global
economic slowdown or shifts towards renewable energy. The development of
8

prices since 2005 is depicted in the graph below:
0
20
40
60
80
100
120
140
160
Brent Oil Spot Prices (USD/bbl)
Figure 2: Brent oil price 2005 to 2018 (EIA, 2018)
OPEC’s reaction to such a change in the oil market was awaited. Sur-
prisingly, contrary to the previous Hawk’s tendencies, OPEC lead by Saudi
Arabia declared a price war on the U.S. shale oil producers. They decided
not to cut output at all, in order not to lose market share and prevent render-
ing their profits to the rest of the producers (Lawler, Bakr and Zhadnnikov,
2014).
A vehement reaction of oil and gas producers lead to 40 percent decrease
in capital expenditures over the first two years after the price crash. Both
blanket layoffs of almost a quarter of workers and cancellation of less profit-
able projects took place. Although at first, the price fall seemed damaging,
it leads to significant decrease in costs in the oil industry (Biscardini, 2017).
The limited effect of a price war on oil market may largely be caused by its
late declaration as many investments unprofitable under low oil prices were
already made. Their complete elimination is hence impossible and instead,
we observe investors attempting to increase the efficiency rather than writing
off their investments.
Another noteworthy moment in the recent history of the oil market is
9
the lift of US ban on oil exports at the beginning of 2016, flooding the
market with even more oil and pushing the price of oil to its new low of 26
dollars (EIA, 2018). The supply by US producers increased over the last 2
years (England, 2018) as well as their capital expenditures, with year-on-year
growth of 7.3 percent from 2016 to 2017 (Biscardini, 2017).
After almost 2 years of low oil prices, OPEC decided to take action and
together with Russia agreed on output cuts. The decrease of 1.8 million
barrels per day should last at least by the end of 2018 if prices do not get
to a more acceptable level sooner. Additionally, Libya and Nigeria agreed
not to raise their outputs, as those 2 countries were previously a source of
increasing excess supply (Lawler, Gamal and Nasralla, 2017). Those policies
proved to be at least partially effective as the market seems to slowly recover
(England, 2018).
The cuts may have many adverse effects to be seen in years to come.
The belief that especially letting go of so many employees resulted in severe
loss of skills and knowledge is widespread. Therefore we may see the costs of
future expansionary projects grow large as oil industry now lacks experienced
workers (Biscardini, 2017).
The future of oil market is rather uncertain. Common cuts of OPEC
and Russia seem to positively affect the prices and investors steadily return.
Furthermore, some claim prices could rise quickly as a result of break down
of conflict in Iraq, Libya, Nigeria and Venezuela or as a result of political
conflict with Iran or Saudi Arabia (Lawler, Gamal and Nasralla, 2017).
However, growing excess supply and modest demand are likely to prevent
prices to return to the pre-2014 levels in the near future.
10
2 Literature review
Extraction and exchange of vital resources including oil had been an attract-
ive topic well before the OPEC was established. Long prevailing theory on
this topic was invented by Hotelling (1931). He proposed that under com-
petitive market, profit (i.e. the difference between price and marginal costs)
from the resource sale should grow at the same pace as the discount rate.
Although some studies (Slade (1982), Moazzami and Anderson (1994) and
Lin (2009)) confirm the validity of Hotelling’s rule for energy and oil mar-
kets while others (Heal and Barrow (1980), Krautkraemer (1998)) claim its
relevance is very low, it is still vital for modelling markets with exhaustible
resources.
During the 1980s, OPEC got into the spotlight because of its presumably
high influence on the two oil shocks that happened in the previous decade.
Therefore many economists started to describe and model the oil market,
with special attention devoted to the power of OPEC and its ability to
influence oil prices.
An early work containing a thorough description of the oil market over
the period 1973 to 1983 was published by Gately (1984). Most importantly,
he analysed the reasons why OPEC behaved in the way it did and what
effects on the economy could have been observed. Gately also speculated to
what extent can the oil shocks be attributed to OPEC, considering whether
competitive market models could explain them. However, he did not do any
original empirical research to prove one of the alternatives correct.
The extent to which OPEC influences the oil market became one of the
major questions diving the community of researchers in the field. Since
Gately’s article, countless studies testing behaviour and power of OPEC
have been published. Some of them favour the notion of strong OPEC with
a vast ability to influence the market, while others deny it and support
the idea of individual optimization. Works of proponents of both views are
presented below.
To reveal whether collusive or non-cooperative behaviour dominated the
11
oil market, authors use various methods. These include modelling the market
and juxtaposing it to reality, comparing OPEC and non-OPEC producers
or generally revealing a causal relationship between OPEC behaviour and
situation on the market.
2.1 OPEC exercising market power
A pivotal work proving the importance of OPEC was written by Griffin
(1985). He describes four different models that can be used to simulate oil
market. Firstly, he presents Adelman’s idea (Adelman, 1982), which re-
gards OPEC as a cartel and whose level of cooperation is to be measured
by the extent to which they share residual demand for oil. Then, MacA-
voy’s approach (Macavoy, 1982), which is close to a competitive market
theory, is discussed. Next, the Ezzati’s target revenue model (Ezzati, 1976)
is examined, the underlying idea is that once a certain level of income is
reached, countries will not produce more oil no matter the price. Finally,
property rights explanation provided by Johany (1978) was also reviewed,
introducing the idea that national oil companies have lower discount rates
compared to the international ones. Therefore after the transfer of rights to
the nations which occurred multiple times in the 1970s, production would
decrease which explains the observed growth in prices.
Not only did Griffin provide a review of the available models, he also
made a comprehensive theoretical test using data from 1971 to 1983 to
prove which one of the theories is correct. He proved that model suggesting
that OPEC is partially sharing the oil market cannot be rejected for any
OPEC member and furthermore, such model has a solid predictive power,
superior to all the other models. Additionally, competitive market behaviour
can be conclusively rejected for most of the OPEC members, while for non-
OPEC producers competitive behaviour cannot be rejected for 10 out of 11
countries. As for the other models, some weaker form of target revenue may
be valid, whereas property rights explanation yields very different results
for individual OPEC members. For example, Iraq directly clashes this idea
12
with state increasing production capacity 2.5 times after nationalization.
Another paper concluding that OPEC behaves as a cartel was written by
Danielsen and Kim (1988). They use the concept of capacity and reserve
ratio, which measures to what extent individual members of OPEC limit the
production in comparison to their capacity or reserves. Under competitive
setup, countries with the highest reserves and cheapest production would
produce the most to make use of high oil prices on the market. However,
the evidence from years 1973 to 1985 proves that contrary to the expecta-
tions, such countries have relatively higher sacrifice ratio which supports the
cooperative scheme.
Similar results were reached by Kaufmann (2004) for period 1986 to 2000.
The idea behind his work is that the main characteristic of a cartel is its
ability to increase prices. Kaufmann proved, that through strategic hand-
ling of production, capacity decisions and quotas OPEC managed to change
prices in their favour. Even more importantly, he also concluded that such
relation is Granger causal and that non-OPEC producers act as price takers
and produce close to capacity.
There were further studies proving that the behaviour of OPEC mem-
bers was collusive over certain periods of time. Those include for example
Loderer (1985), Youhanna (1994), Gulen (1996) and many others. Over-
all, those papers prove that the situation on the market and behaviour of
OPEC members are very different from the competitive ones and therefore
they conclude cooperation is present on the oil market.
2.2 Oligopolistic or competitive oil market
The literature questioning the relevance of Organisation of the Petroleum
Exporting Countries is no less common. Especially papers proposing gradual
weakening of OPEC and slow transition of oil market towards competitive
scenario are emerging swiftly.
One of the works proving the feebleness of cooperation of OPEC members
was written by Huppmann and Holz (2009). They perceived oil market
13
as multipool rather than bilateral, with prices set at pool nodes with a
possibility of arbitrage. The main results of the paper are that actual prices
in 2006 are double those that would be in a perfectly competitive market
but only a third of those that would occur under a cartel setup. The prices
predicted for Nash-Cournot equilibrium are much closer to 2006 values with
only 50 percent higher prices. However, the most suitable and accurate
model is OPEC members forming a non-cooperative oligopoly with non-
OPEC members as competitive fringe.
Three years later, the same duo has presented another article with similar
methodology and updated figures (Huppmann and Holz, 2012). For the first
period, the results differed slightly, suggesting the market is closer to Saudi
Arabia as a Stackelberg leader and other OPEC members forming a non-
cooperative oligopoly. However, after the crisis and volatility in 2008 prices
got closer to the situation on the competitive market. Importantly, both of
those works conclusively reject cartel behaviour.
In 2014, a paper concluding that over the period 1994 to 2014 no co-
ordination that would suggest cartel behaviour of OPEC is observed was
published by Kisswani (2014). Major explanation presented by Kisswani is
that discovery of large oil reserves in the Gulf of Mexico and the North Sea
together with the liberalization of Russia radically decreased the dependency
on OPEC supplies and thereby limited the power it has previously had.
A thesis concentrated solely on the position of Saudi Arabia was written
by Al-Qahtani (2008). The study proves that if the whole OPEC optimized
its oil production in 2004, it would decrease production by 1.4 million barrels
per day, which would lead to 7 percent price increase. Profits of Saudi Arabia
would grow by 4 billion US dollars per year and the rest of OPEC would gain
additional profit of 28 billion US dollars per year. It follows that the cartel
is not fully using its potential to influence the oil market and maximize its
member’s profits. However, the situation is still very different from the one
that would occur in a competitive market.
One of the pioneering works proposing the OPEC behaviour and nature
14
might have switched over time was written by Almoguera et al. (2011).
Compared to previous literature such as (Griffin, 1985), multiple changes
were present: they took a very long period from 1974 to 2004, used sim-
ultaneous equation and optimized for OPEC as a whole rather than for
individual members. Almoguera et. al. tested for changes from collusive to
non-cooperative behaviour and backwards.
They revealed that in late 1970a and early 1980s collusive behaviour
among OPEC members was present, which upholds the results presented
later in the literature review. However, later in the mid-1980s and mid-2000s,
the situation changed in favour of non-cooperative conduct with observable
price wars. All in all for OPEC members Cournot competition dominated
the period accounting for approximately 65 percent of it. Nonetheless, when
colluding, OPEC was able to increase prices by 69 percent by mere 11 percent
decrease in quantity.
Similarly, Grundy (2017) focuses on behavioural dissimilarities between
OPEC and non-OPEC producers since cartel members should presumably
act differently based on their cooperative deals. For period 1973 to 1990
the behaviour of the two groups is very different with a distinctively high
volatility of OPEC members’ production, while in period 1991 to 2010 the
differences diminished and oil producers now form one large cluster suggest-
ing the low future relevance of OPEC.
Finally, Onour (2017) published a study comparing the power of OPEC
and US shale producers to influence the price of oil. He concludes that
if OPEC increases its production by 1 % prices would decrease by 0.12%.
On the other hand, if the US did the same, prices would drop by 1.03 %.
Therefore oil prices react approximately 8 times more to the behaviour of
US producers. Not only does this suggest OPEC has become very weak and
barely able to influence prices of oil, it seems that the US has taken over the
role of swing producer and controls the oil market.
Although no clear conclusion has been reached across the scientific com-
munity, it seems that during the early years of OPEC existence its ability
15

to influence prices was immense. However, over course of last few decades,
its power has slowly vanished, which calls into question its future role as a
leader in the oil market.
2.3 Reaction of OPEC to 2014 price downfall
The situation changed considerably since the price drop towards the end of
2014 from over 100 dollars in September to less than 50 in January 2015.
The decision of OPEC not to cut production in face of such slump in oil
price has been hotly debated and further examined in the literature.
Behar and Ritz (2017) compare two possible strategies OPEC has: to
”accommodate” or ”squeeze”. The former strategy reconciles to the US
shale producers supplying a certain amount of oil and maximizes its profit
within the new situation. On the other hand, OPEC could attempt to
increase production, decrease price and squeeze the new producers out of
the market. Thereby it would secure higher future profits and defend its
market share.
The results of the empirical analysis suggest that up until late 2014,
the optimal strategy of OPEC was to accommodate. However, with the
change of circumstances, the squeeze strategy became more beneficial. The
factors include lower demand for oil products, increasing supply of non-
OPEC producers (especially US shale) or poor cooperation among OPEC
members. The situation or available information may well change again and
prompt another switch to accommodate.
Fattouh et al. (2016) concentrated solely on the situation of Saudi Arabia,
explaining its dilemma between short-term profit maximization and securing
long-term demand. Using a game-theoretic framework, they examine costs
and benefits of decreasing production to raise prices contrary to not acting
at all. The situation is further split based on the elasticity of shale oil supply.
It turns out that for inelastic supply curve, the optimum reaction of Saudi
Arabia is to cut the production. By contrast, for elastic supply, it is better
not to adjust the output.
16
Comparing outcome of different reactions, Fattouh et al. conclude that
under uncertainty it is best for Saudi Arabia to act as if the supply of shale
was elastic and hence no change in oil output shall take place. Nonetheless,
as they get additional information about the elasticity of shale oil supply,
they may adjust their production accordingly. So far it seems that US
shale producers sharply decrease capital investments and a number of rigs.
However, the effect on the amount of oil produced is not so high since the
efficiency increases and costs of shale oil production decrease.
To summarize, the prevailing opinion in the current literature is that
OPEC and its members are undergoing the right steps to deal with the
current situation. However, it is nearly impossible to distinguish whether
this is a well thought-through strategy or rather an inability of OPEC to
act collectively as pointed out by Huppmann and Holz (2015).
17

3 Methodology
In this thesis, we search for an equilibrium of the oil market in a single time
period. We presume purely current profit maximizing behaviour since it is
hard to predict the future as there are too many factors that can influence
the demand and the price of oil. For example, in the future, technologies
can even eliminate the dependency on oil and significantly slash its value.
Therefore the assumption of maximizing present profits is frequently used
in the literature, namely for instance by Huppman and Holz (2012).
The following 29 countries are included in the optimization: Algeria, An-
gola, Argentina, Azerbaijan, Brazil, Canada, China, Colombia, Ecuador,
Egypt, India, Indonesia, Iran, Iraq, Kazakhstan, Kuwait, Libya, Malaysia,
Mexico, Nigeria, Norway, Oman, Qatar, Russian Federation, Saudi Ara-
bia, United Arab Emirates, United Kingdom, United States and Venezuela.
Their total production represents approximately 95 % of the global oil out-
put (OPEC, 2018b), meaning we only exclude few minor producers. In order
to prevent possible distortion of the results (especially prices), we add out-
put corresponding to the missing 5 % of producers to the total quantity
available on the market.
Some simplifying assumptions, such as oil being a perfectly homogenous
product, are made. Hence the differences in quality of oil are not accounted
for, as for most oil producers no significant price differences occur. A similar
approach was used for example by Huppmann and Holz (2012). In like
manner, we will not consider the differences in transportation costs.
3.1 Cost and inverse demand function
To approximate the total costs of individual oil producing countries, we
employ the function proposed by Ansari (2017). We consider the total cost
function Ci of producer i, i = 1, . . . , 29, in the form
Ci (qi) = γ1iqi + γ2iq2i − γ3i (qi − κi)
(ln
(1− qi
κi
)− 1
), (1)
18
where γ1i, γ2i and γ3i are parameters tailoring the function to fit individual
producers and κi are their respective capacities. Additionally, qi represents
the quantities produced.
The parameters γ1i, γ2i and γ3i determining the shape of cost function
were taken over from Ansari’s work (Ansari, 2017). To ascertain the produc-
tion capacities κi, i = 1, . . . 29, we use two different methods. For members
of OPEC, we have an estimation by International Energy Agency, which
annually publishes its Market Report Series (IEA, 2017). It includes data
on sustainable crude oil production capacity of all OPEC members. For the
rest of the oil producers, such data is not available. Thus we build on the
assumption that other producers choose outputs close to their capacities.
We take the maximum production over the last 5 years from the OPEC
Annual Statistical Bulletin (OPEC, 2018b) and consider it to represent 97
percent of the capacity, from which we can easily derive the total crude oil
production capacity of all non-OPEC countries. This approached is based
on the method used by Ansari (2017).
There are many essential features of those functions. First and foremost,
they are convex and increasing on the whole feasible interval (0 ≤ qi ≤ κi).
Furthermore, each of them is continuously differentiable and thus suitable
for finding a solution to the optimization problem. Finally, because of the
logarithmic term, the functions approach infinity as the production gets close
to the capacity. By that, we get a natural production limit without the need
to explicitly including it in the optimization problem.
To proceed, we also need an inverse demand function, which depends on
the total quantity consumed on the market
Q =29∑i=1
qi. (2)
A general linear function depicting demand for oil declares
Q (p) = a− bp, (3)
with p being the equilibrium price of oil. Parameters a and b signify the
intercept and slope of the demand function, respectively. Hence if we want
19
to express the price, we get:
p (Q) =a−Q
b. (4)
That is an inverse demand function showing the market equilibrium price
for a given quantity.
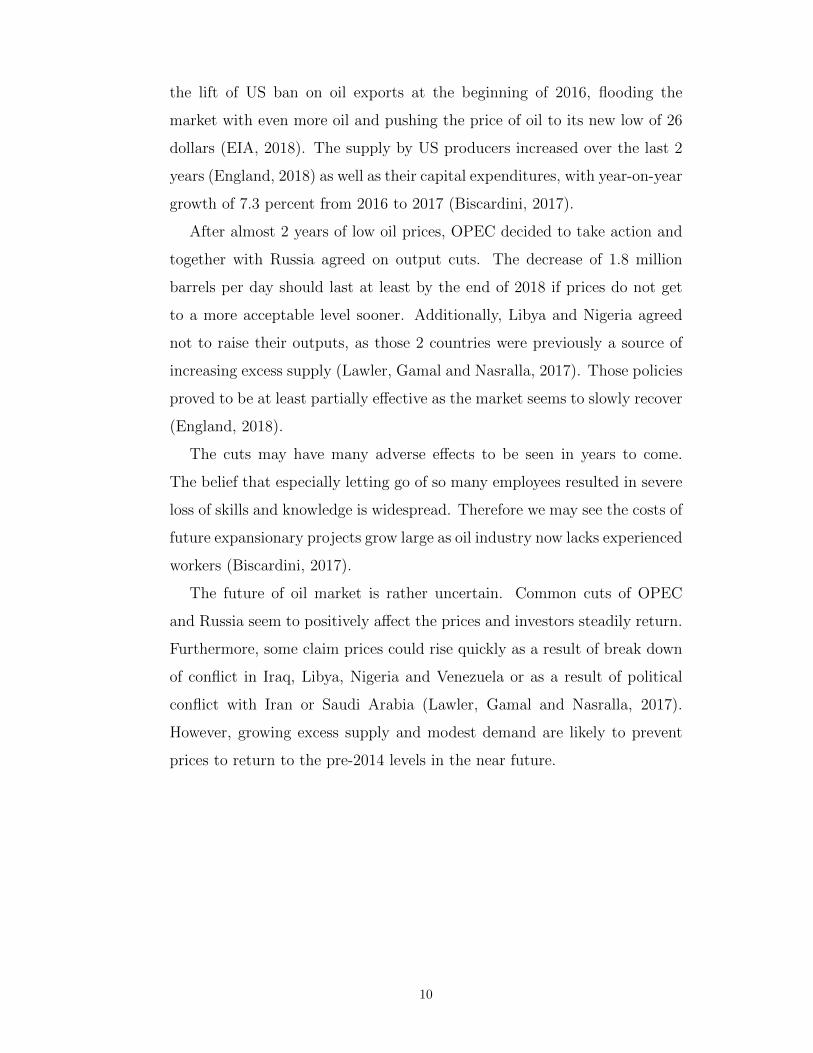
To determine the values of parameters a and b, we use the price elasticity
of demand as well as base values of price and quantity actually observed.
First, we look at the elasticity ϵ, which is calculated in the following way:
ϵ = Q′(p)p
Q. (5)
Since the elasticity cannot be exactly determined, we will model the market
for more levels of elasticity, specifically −0.1, −0.15 and −0.2.
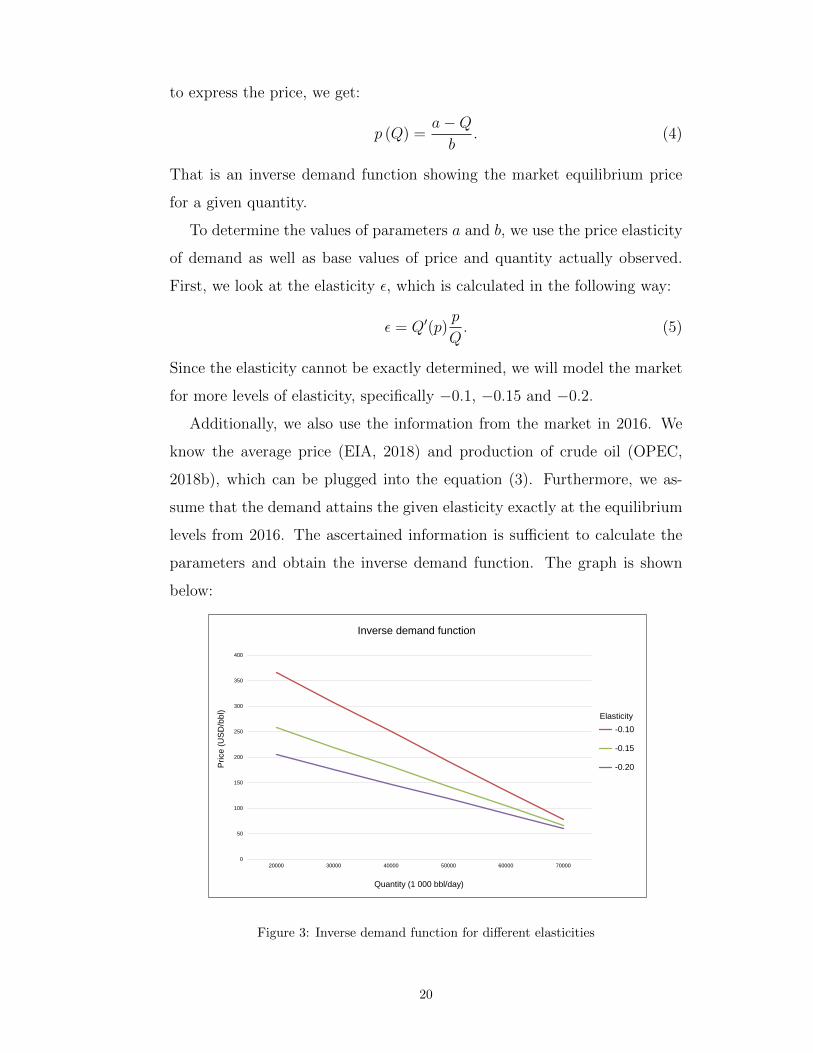
Additionally, we also use the information from the market in 2016. We
know the average price (EIA, 2018) and production of crude oil (OPEC,
2018b), which can be plugged into the equation (3). Furthermore, we as-
sume that the demand attains the given elasticity exactly at the equilibrium
levels from 2016. The ascertained information is sufficient to calculate the
parameters and obtain the inverse demand function. The graph is shown
below:
0
50
100
150
200
250
300
350
400
20000 30000 40000 50000 60000 70000
Price (
US
D/b
bl)
Quantity (1 000 bbl/day)
Inverse demand function
-0.10
-0.15
-0.20
Elasticity
Figure 3: Inverse demand function for different elasticities
20
3.2 Cournot model of the oligopolistic market
We will examine what would the oil market look like under the oligopolistic
setup disregarding the existence of OPEC. The model fitting the situation
on the oil market is the Cournot oligopoly, where individual oil-producing
countries aim to maximize their profits through an appropriate set of output.
Characteristically, all countries play a simultaneous game, meaning they all
have to determine their production at the same time. For such a decision,
they also need to estimate outputs of their competitors.
The assumption underlying the Cournot model include homogeneity of
products, perfect information, profit-maximizing behaviour with no cooper-
ation among the oligopolists and each player having market power. Further-
more, we presume there is no market leader and that the players compete
by setting quantities rather than prices. All of those conditions are likely to
hold at the oil market.
The fulfilment of the first two assumptions relies on the aforementioned
definition and simplification of the optimization problem. Secondly, al-
though there currently exists some coordination among the OPEC members,
the incentives to break the cartel and increase one’s profit are omnipresent
and we frequently witness cheating on the quotas. Therefore we conclude
that individual profits are the main goals of the production and especially
in a non-repeated game, cooperation is not likely. Additionally, as there is
a limited number of players with rather large outputs (even more so after
leaving out the minor producers in our setup), we see that manipulation
with the productions significantly influences the price of oil. Finally, the
nature of the market supports the preference of the output to the price set-
ting. The reason is, that oil is usually traded at stock markets where prices
are set based on the available quantities and demand.
The Cournot-Nash problem to be solved is
maxqi≥0
{p (Q) qi − Ci (qi)}, i = 1, . . . , 29. (6)
To find the Cournot-Nash equilibrium, we use the aforementioned cost and
inverse demand functions.
21
An important feature of the Cournot oligopoly model is the creation of the
Nash equilibrium. The reason is that producers maximize profits through
output setting based on the knowledge of the profit functions of the other
players. Therefore their profits are the highest when choosing to produce at
the levels calculated above and no one has an incentive to deviate from the
equilibrium, which makes it stable.
3.3 Coalition of OPEC and Russia as a Stackelberg leader
In addition to Cournot oligopoly, we will also look at the functioning of oil
market under the existence of the cartel. To react to the newly formed al-
liance, we will model the market as a cartel of OPEC and Russia. There,
countries again maximize their profits through output optimization. How-
ever, the cartel aims at maximizing its profit as a whole rather than its
individual members. That means that some of the countries may have lower
profit as a sacrifice for a higher profit of the whole group.
Furthermore, the game is no longer simultaneous. At first, cartel chooses
its output considering reaction functions of the followers. Then, the produ-
cers outside the cartel react with a Cournot game as described above, taking
into account the decision made by the cartel in the first stage.
Similar assumption to the Cournot oligopoly apply also for the Stackel-
berg game, but we allow for the existence of the market leader. We also add
the assumption of trustworthiness of the cartel and knowledge of its output
decisions. Generally, the credibility of OPEC was not fundamentally under-
mined. Additionally, after each of their meeting, now also with Russia, they
commit to producing a certain amount of oil, usually accomplished with just
minor deviations. Hence such assumptions are arguably realistic ones.
22
The Stackelberg model has two consequtive stages expressed by
maxql, l∈L
{p
(∑l∈L
ql +∑f∈F
qf
)∑l∈L
ql −∑l∈L
Cl (ql)
}
s. t. ql ≥ 0, ∀l ∈ L,
qf ∈ argmaxqf≥0
{p
(∑l∈L
ql +∑f∈F
qf
)qf − Cf (qf )
}∀f ∈ F ,
(7)
where L is the set of the market leaders (OPEC members and Russia) and F
is the set of the followers. We also use the cost and inverse demand functions
formulated previously.
Properties of the problem ensure the existence of a single solution, as the
maximized profit function is strictly concave. Firstly, the revenue is a result
of multiplication of inverse demand function and quantity of the given pro-
ducer. Since quantities of other countries are included only as parameters,
we get a strictly concave function. The convexity of cost function has been
established previously and hence with a negative sign we also have a concave
function. Finally, as the sum of two concave functions is also concave, we
get a single maximum.
In case of Stackelberg game, we get a Subgame Perfect Nash Equilibrium.
In the first stage, the market leader chooses his output, anticipating a cer-
tain reaction of the follower. Then in the second stage, follower knows the
production level chosen by the leader and performs his optimum reaction it.
Once again, if the information is available and players are trustworthy, there
is no chance to improve one’s situation by deviating from the calculated
strategy.
23
4 Numerical results and interpretation
In this chapter, we will look at the result of both the Cournot-Nash problem
and Stackelberg leader model. Firstly, we inspect the equilibrium price
linked to the oligopolistic as well as cartelized market and juxtapose it with
the actual price at the time. Special attention will be paid to the effects
of different price elasticities. Additionally, we analyse the total optimum
quantity to be produced once again in comparison with the status quo.
Finally, we look at some of the OPEC members including the contrast of
their current and prospective situation.
4.1 Equilibrium price
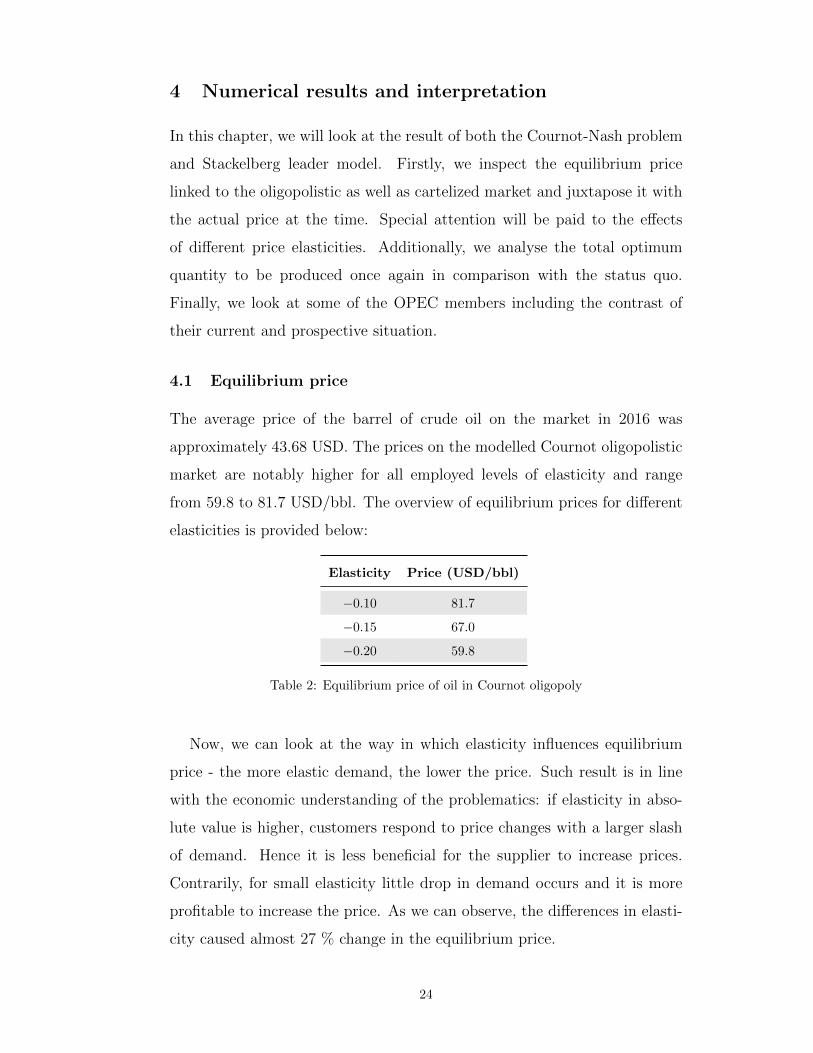
The average price of the barrel of crude oil on the market in 2016 was
approximately 43.68 USD. The prices on the modelled Cournot oligopolistic
market are notably higher for all employed levels of elasticity and range
from 59.8 to 81.7 USD/bbl. The overview of equilibrium prices for different
elasticities is provided below:
Elasticity Price (USD/bbl)
−0.10 81.7
−0.15 67.0
−0.20 59.8
Table 2: Equilibrium price of oil in Cournot oligopoly
Now, we can look at the way in which elasticity influences equilibrium
price - the more elastic demand, the lower the price. Such result is in line
with the economic understanding of the problematics: if elasticity in abso-
lute value is higher, customers respond to price changes with a larger slash
of demand. Hence it is less beneficial for the supplier to increase prices.
Contrarily, for small elasticity little drop in demand occurs and it is more
profitable to increase the price. As we can observe, the differences in elasti-
city caused almost 27 % change in the equilibrium price.
24

Additionally, the results clearly suggest the low significance of OPEC in
those times, as prices should be significantly higher at the market under the
effect of a large cartel. Similar results have been reached by other studies on
the topic. Two main theories can help to clarify the issues - either OPEC
grew toothless or it had other reasons not to act.
Firstly, as some propose, OPEC may have lost its power and become
unable to coordinate output cuts across its members. Therefore it would no
longer be able to influence the oil market. However, such claims are to a
large extent incompatible with the late development of the market. In recent
months, the price of oil has been constantly growing and in March 2018 it
almost reached 70 USD/bbl presumably as a result of the cooperation of
Russia and OPEC on decreasing the production. Hence we can conclude
that the cartel is still able to efficiently push the prices up.
The other and arguably more likely alternative is that OPEC was declar-
ing a price war on more expensive oil producers to squeeze them out of the
market. Thus, rather than pursuing current economic profits they chose to
prefer long-term benefit in form of securing their market share. Especially for
countries with sizeable reserves compared to production, eliminating com-
petition will enable them to keep the prices as well as profits high. That
makes sacrificing contemporary benefits strategically reasonable. Since these
potential considerations are hardly quantifiable, they were not included in
the model. Thus they may cause the actual price and production to differ
from our expectations.
However, a noticeable space still remains for prices to grow, as more
competition is present on the non-cartelized market. That is a result of
dispersion of market shares and incentives to free-ride on potential output
cuts of other players. Without collusion, the producer choosing to decrease
his output to increase prices is likely to lose his position on the market since
he may be replaced by others and the price may not change anyway.
Those theories are supported by the results of equilibrium prices on mar-
kets accounting for the existence and cooperation of OPEC and Russia.
25

Prices vary from 80.3 to 124.8 USD/bbl, which means a substantial increase
in price compared to the Cournot-Nash equilibrium. Table 3 summarizes
results of market organised as a cartel of OPEC and Russia with other
countries forming an oligopoly.
ElasticityOPEC & Russia price
(USD/bbl)
−0.10 148.1
−0.15 108.7
−0.20 89.9
Table 3: Equilibrium price of oil under cartel of OPEC and Russia
Therefore, shall OPEC and Russia regard it beneficial, the cartel may
exert its market power and get the price of oil close to the pre-2014 level.
4.2 Equilibrium quantity
Expectedly, the quantities estimated to be produced on the oligopolistic
market were smaller than the real production in 2016, which was 75 476
thousand bbl/day. Since we only model 29 oil producing countries, we have
to extrapolate the output of the whole industry. The table below summarizes
the equilibrium quantities of the 29 producers as well as the total amount
of oil produced:
ElasticityQuantity of the 29 Quantity of all
(1 000 bbl/day) (1 000 bbl/day)
−0.10 65697 69155
−0.15 66191 69675
−0.20 66652 70160
Table 4: Equilibrium quantity of oil in Cournot oligopoly
It is important to notice that for less elastic demand price is higher,
while quantity goes down. From the perspective of producers, it is more
beneficial to cut production in order to raise the price if the absolute value
26

of elasticity is smaller. A similar logic about the behaviour of customers as
for the equilibrium prices applies here as well.
Generally, the results suggest that most of the countries should produce
very close to their capacities. The reasons are twofold: firstly, most of
them produce oil so cheaply that their marginal costs are well below the oil
price level and hence they are motivated to produce as much as they can
as it increases their profit. Even more importantly, especially for smaller
producers, other players are mostly able to replace the production of someone
who decides to cut it. Therefore, if no cooperation is present, competition
pushes countries to produce extensively, because otherwise their profits may
be hindered.
Major exceptions from the situation described above are the three largest
oil producers: Saudi Arabia, Russia and the United States. Depending on
the elasticity, they on average utilize 65.6 to 67.7 percent of their total
capacities. The reason is, that their own capacities are so immense that the
production cannot be replaced and when exerting market power, they are
better off choosing lower outputs.
On a market with a cartel, the quantity cuts are even more extensive.
With cooperation, individual players do not have to worry about other pro-
ducers increasing their outputs and losing market share. However, imple-
menting such coordination in the real world may be a bit complicated. Every
single player would benefit from deviating from the agreed upon quantities
and producing more while benefiting from concessions made by others.
The problem grows even more significant as it is difficult to find out
whether and who broke the deal. The reason is that it is nearly impossible
to obtain information about the country of origin on the market and incent-
ive to misreport information is overt. Therefore, even under a repeated game
scenario, punishments are scarcely feasible. Additionally, all countries out-
side the cartel benefit without a need to participate in limiting production,
which may be demotivating for cartel members.
The following table summarizes optimum utilization of capacity under the
27

cartel of OPEC and Russia, as they are currently cooperating on limiting
common output. The US production is introduced as a reference value and
also to reveal the impact of cartel on other producers. Additionally, the
total quantity produced by the whole cartelized market is included.
ElasticityCapacity Utilization Quantity
OPEC & Russia USA (1 000 bbl/day)
−0.10 80.2% 99.0% 57634
−0.15 84.5% 92.9% 58838
−0.20 87.5% 83.9% 59711
Table 5: Capacity utilization under cartel of OPEC and Russia
We can clearly conclude, that cartel is better able to utilize their quantity
to manipulate price and profits. Especially with lower elasticity cartel is able
to effectively make use of small slash of demand as a result of a price increase.
As anticipated, the total quantity produced on the market dropped even
further due to cartel’s output cuts. However, we see that other producers
represented by the United States produce much more than previously, as
they can enjoy the high price caused by the cartel.
4.3 Situation of individual OPEC members
Now that we understand the development of oil market as a whole, we look
at positions and roles of individual countries. The overview of their profits
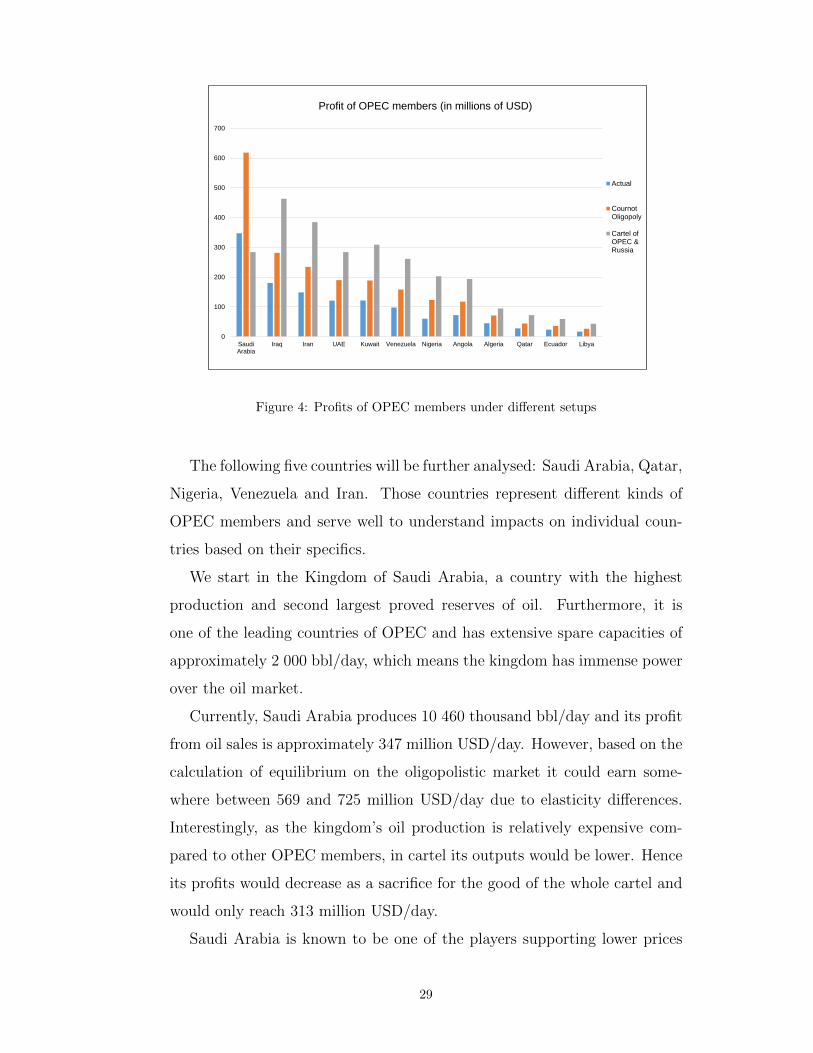
is visible in Figure 4 below.
As we see, all of the countries except for Saudi Arabia would gain the most
if they were part of the OPEC and Russia cartel. For some, the profits on the
cartelized market may be three times higher than those actually obtained
in 2016. The reason is that their oil production is very cheap and thus with
high oil prices caused by cartel’s coordinated output cuts their profits rise
rapidly. Overall for the mean elasticity, the profit of OPEC alone rose by
560.6 million USD/day.
28
0
100
200
300
400
500
600
700
SaudiArabia
Iraq Iran UAE Kuwait Venezuela Nigeria Angola Algeria Qatar Ecuador Libya
Profit of OPEC members (in millions of USD)
Actual
CournotOligopoly
Cartel ofOPEC &Russia
Figure 4: Profits of OPEC members under different setups
The following five countries will be further analysed: Saudi Arabia, Qatar,
Nigeria, Venezuela and Iran. Those countries represent different kinds of
OPEC members and serve well to understand impacts on individual coun-
tries based on their specifics.
We start in the Kingdom of Saudi Arabia, a country with the highest
production and second largest proved reserves of oil. Furthermore, it is
one of the leading countries of OPEC and has extensive spare capacities of
approximately 2 000 bbl/day, which means the kingdom has immense power
over the oil market.
Currently, Saudi Arabia produces 10 460 thousand bbl/day and its profit
from oil sales is approximately 347 million USD/day. However, based on the
calculation of equilibrium on the oligopolistic market it could earn some-
where between 569 and 725 million USD/day due to elasticity differences.
Interestingly, as the kingdom’s oil production is relatively expensive com-
pared to other OPEC members, in cartel its outputs would be lower. Hence
its profits would decrease as a sacrifice for the good of the whole cartel and
would only reach 313 million USD/day.
Saudi Arabia is known to be one of the players supporting lower prices
29
aimed at preserving OPEC’s market share. However, as financial reserves
vanish, it may have to reconsider the stance. OPEC is now cooperating
on production cuts, which should increase price and thereby the oil profits.
Furthermore, the recent introduction of 5 % value-added tax or cuts of gov-
ernment subsidies (Kerr and Omran, 2018) nicely illustrate the situation in
Saudi Arabia.
Let us now look at the position of Qatar, the richest country in OPEC
and country with one of the highest GDP per capita in the world. As
much as all the other oil-exporting countries, its financial conditions changed
significantly after the price drop in 2014. In 2013 oil rents accounted for 26.1
% of its GDP while over the following 2 years later the ratio almost halved
(World Bank, 2016b). Moreover, over the same period, Qatar’s GDP per
capita fell from 88 305 USD to 66 347 USD and continued dropping in 2016
to 59 324 USD. Despite the adverse economic movements, Qatar never left
its prominent position in the 7 richest countries of the world (World Bank,
2016a)
In 2016, Qatar made a daily profit of circa 28 million USD, but it could
make considerably more if fully enjoying the oligopolistic nature of the mar-
ket. The model indicates that depending on elasticity, profits of Qatar would
vary from 39.6 to 54.2 million USD/day. Even more, if the cartel was ex-
erting its market power, 98.8 million USD/day. Although Qatar could earn
higher profits under oligopolistic or efficiently cartelized market, its situation
is still more than satisfactory and low oil prices could not fundamentally en-
danger the citizen’s wellbeing.
In contrast, the poorest OPEC member Nigeria with 2016 GDP per capita
of 2 176 USD suffered much more as its GDP slashed by one third since the
start of oil price collapse. Similarly, the percentage of oil rents in Nigerian
GDP decreased to one-third of its original value (World Bank, 2016a). With
the history of military conflicts, ethnic fragmentation and countless terrorist
attacks by Boko Haram, Nigeria desperately needs the oil money to improve
conditions in the country.
30
Nigeria’s net profits from oil production reached 60.3 million USD per day
in 2016. From our calculation, we can infer that on an oligopolistic market,
with favourable elasticity they could earn as much as 151.4 million USD
daily Interestingly, Nigeria was losing the most money from lack of current
profit maximization. Its actual profits were 45 % lower than in case of the
oligopolistic market, while for example Qatar only lost 29 % of its profits as
a result of OPEC’s production decisions. Since Nigeria’s oil production is
relatively cheap, it would extensively benefit from participation in a cartel
of OPEC and Russia, where its profits could reach 277.8 million USD/day.
Contrary to the richer OPEC members such as Saudi Arabia or Kuwait,
the following 2 countries were always in favour of keeping the price of oil high.
However, their voices within OPEC were not strong enough imminently after
the oil price downswing in 2014. Therefore they both had to subordinate
to the strategy aimed at preserving future market share which significantly
hampers their oil incomes.
As a result of abovementioned, Venezuela is now facing an unpleasant
situation and could use any money potentially available. Its GDP decreased
by 10 % in 2016 and inflation was expected to reach 1 600 % in 2017.
Furthermore, Venezualeans suffer from lack of food and as a result in the
year 2016 the poorest 74 % on average lost weight of 8.7 kg. As a share of oil
on exports used to exceeded 90 %, the oil price drop posed a significant threat
to import-dependent Venezuela. Furthermore, lack of government revenues
leads to cuts in subsidies which primarily hurt the already impoverished
parts of society. (The Economist, 2017)
Nowadays, Venezuela owns largest proved crude oil reserves and its 2016
production brought profits exceeding 98 million USD/day. Nonetheless, oli-
gopolistic market and low elasticity would enable Venezuela to almost double
its oil rents. This would not only bring resources to the government to help
the poor but also it would improve Venezuela’s balance of trade and enable
its currency to appreciate. The earnings of Venezuela could grow even higher
if it took part in the cartel of OPEC and Russia - its daily profits may reach
31
310.8 million USD.
Finally, we look at the situation in Iran. Previously, sanctions including
oil exports were imposed on Iran due to its nuclear programme, but they
were lifted at the beginning of 2016. Then, the share of oil rents on Iranian
GDP reached 13.6 percent (World Bank, 2016b) and GDP grew to 5 219
USD per capita (World Bank, 2016a) with a year-on-year increase of more
than 7 percent.
In 2016, Iran’s profits from oil production were close to 149 million
USD/day. Depending on elasticity, its daily earnings on the oligopolistic
market could vary between 208 to 287 million USD. The profits would grow
even more on the cartelized market, where Iran could use its advantage of
producing cheap oil for higher prices. Its profit could be as high as half
billion dollars per day, even outpacing Saudi Arabia.
Other countries have similar fates to those mentioned above, all of them
were severely weakened by the oil price drop. The most important conclusion
remains, that profit for all of the states in 2016 was far from the one expected
for a non-cooperative oligopolistic market. Furthermore, with the existence
of the cartel, profits could have been even higher. Especially for the members
who direly needed them, OPEC decisions was substantially damaging.
32

Conclusion
In this thesis, we have looked at the optimization of oil production from the
perspective of individual OPEC members. We have modelled oligopolistic
and cartelized market under the leadership of OPEC and Russia. For the
Cournot oligopoly, prices would range from 59.8 to 81.7 USD/bbl, with
corresponding quantities between 70 160 and 69 155 thousand barrels per
day depending on elasticity. The coalition of OPEC and Russia could lead to
prices as high as 148.1 USD/bbl and quantity below 58 million barrels a day.
We can clearly conclude, that compared to the actual situation, modelled
prices are significantly higher while quantities slumped.
To a large extent, our findings are compatible with the previous studies.
Ansari (2017) concludes that at the end of 2015 the price on the oligopolistic
market should be close to 80 USD/bbl mark, while on the cartelized market
price of barrel exceeds 100 USD. The difference in price on the cartelized
market can mostly be explained by the omission of Russia from the cartel but
also by yearly changes, as for example in 2014 the prices on the market with
cartel were also reported close to 150 USD/bbl. Huppmann and Holz (2012)
calculate the equilibrium price on 2009 market for both oligopolistic and
cartel setup, with a result of approximately 150 USD/bbl and 170 USD/bbl
respectively. Despite not including Russia in the cartel the prices are much
higher in both setups, presumably as a result of a substantial loss of market
power due to US capacity rise and following oil glut. Since profits and
quantities of individual countries are not examined in the works, we cannot
compare them to our values.
In line with the microeconomic theory, we observe the effect of elasticity
on the prices and quantities. Low elasticity marking a small decrease in
demand in response to growing prices results in much higher prices and lower
quantities. Especially cartel of OPEC and Russia can effectively utilize such
situation, as they have vast power over the market.
Moreover, we have discovered that unlike Saudi Arabia, other members
of OPEC would benefit significantly from the formation of the cartel with
33
Russia. Additionally, the situation in 2016 was far from optimum for all
of OPEC members and led to major financial losses, which were hardly
bearable for the poorer members of OPEC. Interestingly, poverty-stricken
countries such as Nigeria were oftentimes forced to sacrifice more of their
profits than the richer members.
Importantly, there are many limitations to this particular as well as gen-
eral modelling of the oil market. Many simplifying assumptions such as lin-
earity of demand function or homogeneity of oil production were included.
Those can be accounted for in the model and thus provide space for further
research.
However, there are other matters that cannot be easily covered. Most
importantly, long-term considerations are included in state’s optimization
but can hardly be quantified. Furthermore, the extent to which high prices
of oil bring new competition and substitution methods is unknown. The
subjective importance of future lack of demand also differs based on the re-
serves compared to current production, as countries with output sustainable
for just 10 years do not really have to worry about it. Finally, the preference
of current profits must be considered as poorer countries cannot afford to
postpone their incomes even with the promise of larger future revenues.
The situation is complicated by the lack of reliable and complete data
on countries’ production costs or elasticity, which makes the results of the
models arguable as they are merely approximations of the reality. Addition-
ally, as much as for OPEC members the optimization of production for the
whole country makes sense, the application in countries with dispersed and
privately owned companies is limited.
Thorough discussions analysing the behaviour of OPEC and low profits
of its members are led. Either the problem could lie in the inability of
OPEC to influence the market or it may be a well-elaborated strategy aimed
at maintaining market share and squeezing high-cost producers out of the
market. Recent events on the oil market seem to prove the first theory
wrong, as OPEC is now pushing on prices to increase. However, it has to
34
pay the price in form of losing market share due to output cuts and attracting
potential new investments into higher-cost production.
Based on our research the power of OPEC especially in connection with
Russia is undeniable. The cartel may help to increase prices and profits on
the whole oil market and get it close to the pre-2014 levels. However, the
sustainability of such behaviour in reality is to be tested. Cartel sacrifices a
lot to increase the price, effectively paying for the immense US or Chinese
profits, which many of its members dislike. Furthermore, any renegade devi-
ating from the agreed upon quantities in the cartel may increase his profits.
Particularly the inability of OPEC to reveal breaches of the deal makes the
stability of coordinated output cuts unlikely.
35
References
[1] ADELMAN, Morris A. OPEC as a Cartel. In: J. M. Griffin and D. J.
Teece. OPEC Behavior and World Oil Prices, London: Allen & Unwin,
1982, 37-63.
[2] ALMOGUERA, Pedro A.; DOUGLAS, Christopher C.; HERRERA,
Ana Maria. Testing for the cartel in OPEC: non-cooperative collusion
or just non-cooperative?. Oxford Review of Economic Policy, 27.1, 2011:
144-168.
[3] ANSARI, Dawud. OPEC, Saudi Arabia, and the shale revolution: In-
sights from equilibrium modelling and oil politics. Energy Policy, 111,
2017: 166-178.
[4] AL-QAHTANI, Ayed. A model for the global oil market: Optimal oil
production levels for Saudi Arabia. 2008. PhD Thesis. Colorado School
of Mines.
[5] BBC. Oil price ’may hit $200 a barrel’. 2008. [online]. Available at:
http://news.bbc.co.uk/2/hi/business/7387203.stm. [Accessed 6 April
2018].
[6] BEHAR, Alberto; RITZ, Robert A. OPEC vs US shale: Analyzing the
shift to a market-share strategy. Energy Economics, 63, 2017: 185-198.
[7] BISCARDINI, G., et al. Oil and Gas Trends. PwC. 2017. [online]
Available at: https://www.strategyand.pwc.com/media/file/2017-Oil-
and-Gas-Trends.pdf [Accessed 7 April 2018].
[8] CAMBRIDGE ECONOMETRICS. A Study on Oil Dependency in the
EU. A report for Transport and environment. 2016.
[9] CNN. OPEC Fast Facts. 2017. [online] Available at:
https://edition.cnn.com/2013/07/30/world/opec-fast-facts/index.html
[Accessed 27 March 2018].
36

[10] COOPER, John. Price elasticity of demand for crude oil: estimates for
23 countries. OPEC Energy review, 27.1, 2003: 1-8.
[11] DANIELSEN, Albert L.; KIM, Seungwook. OPEC stability: an empir-
ical assessment. Energy economics, 10.3, 1988: 174-184.
[12] DARBOUCHE, Hakim. The implications of the Arab uprisings for oil
and gas markets. The Oxford Institute for Energy Studies, 2011.
[13] DEFTERIOS, John. OPEC: Hawks vs. doves in
Vienna. The CNN. 2011. [online] Available at:
http://edition.cnn.com/2011/BUSINESS/06/08/defterios.opec.oil/
index.html [Accessed 29 March 2018].
[14] ECONOMIST, The. How Chavez and Maduro have
impoverished Venezuela. 2017. [online] Available at:
https://www.economist.com/news/finance-and-economics/21720289-
over-past-year-74-venezuelans-lost-average-87kg-weight-how [Accessed
19 March 2018].
[15] EIA. Annual Energy Outlook 2017. Washington: U.S. Energy
Information Administration. 2017. [online] Available at: ht-
tps://www.eia.gov/outlooks/ieo/pdf/0484(2017).pdf [Accessed 4
March 2018].
[16] EIA. Europe Brent Spot Price FOB. Washington: U.S. En-
ergy Information Administration. 2018. [online] Available at: ht-
tps://www.eia.gov/dnav/pet/hist/RBRTED.htm [Accessed 29 March
2018].
[17] ENGLAND, John. 2018 outlook on oil and gas. De-
loitte Center for Energy Solutions. 2018. [online] Avail-
able at: https://www2.deloitte.com/us/en/pages/energy-and-
resources/articles/oil-and-gas-industry-outlook.html [Accessed 6
April 2018].
37
[18] EZZATI, Ali. Future OPEC price and production strategies as affected
by its capacity to absorb oil revenues. European Economic Review, 8.2,
1976: 107-138.
[19] FARCHY, Jack. Gazprom Neft sells oil to China in ren-
minbi rather than dollars. 2015. [online] The Financial Times.
Available at: https://www.ft.com/content/8e88d464-0870-11e5-
85de00144feabdc0?mhq5j=e2 [Accessed 2 March 2018].
[20] FATTOUH, Bassam; POUDINEH, Rahmatallah; SEN, Anupama. The
dynamics of the revenue maximization-market share trade-off: Saudi
Arabia’s oil policy in the 2014-15 price fall. Oxford Review of Economic
Policy, 32.2, 2016: 223-240.
[21] FAWCETT, Nicholas; PRICE, Simon. World oil demand in a cross-
country panel. London: Bank of England, 2012. Available at: ht-
tps://www.researchgate.net/publication/267380585 WORLD OIL
DEMAND IN A CROSS-COUNTRY PANEL [Accessed 18 April 2018]
[22] GATELY, Dermot. A ten-year retrospective: OPEC and the world oil
market. Journal of Economic Literature, 22.3, 1984: 1100-1114.
[23] GRIFFIN, James M. OPEC behavior: a test of alternative hypotheses.
The American Economic Review, 75.5, 1985: 954-963.
[24] GRUNDY, Bruce D.; HEANEY, Richard A. Variation in OPEC and
Non-OPEC Crude Oil Production: 1973 to 2010. 2017. Available at: ht-
tps://papers.ssrn.com/sol3/papers.cfm?abstract id=2912652 [Accessed
7 April 2018]
[25] GULEN, S. Gurcan. Is OPEC a cartel? Evidence from cointegration
and causality tests. The Energy Journal, 17.2, 1996, 43-57.
[26] HEAL, Geoffrey; BARROW, Michael. The relationship between interest
rates and metal price movements. The Review of Economic Studies,
47.1, 1980: 161-181.
38
[27] HISTORY.COM. 1979 OPEC states raise oil prices. The History chan-
nel. 2010a. [online] https://www.history.com/this-day-in-history/opec-
states-raise-oil-prices [Accessed 4 April 2018].
[28] HISTORY.COM. Energy Crisis (1970s). The History channel. 2010b.
[online] Available at: https://www.history.com/topics/energy-crisis
[Accessed 4 April 2018].
[29] HOTELLING, Harold. The economics of exhaustible resources. Journal
of political Economy, 39.2, 1931: 137-175.
[30] HUPPMANN, Daniel; HOLZ, Franziska. A model for the global crude
oil market using a multi-pool mcp approach. 2009. Available at: ht-
tps://papers.ssrn.com/sol3/papers.cfm?abstract id=1431388 [Accessed
19 March 2018]
[31] HUPPMANN, Daniel; HOLZ, Franziska. Crude oil market power - a
shift in recent years?. The Energy Journal, 33.4, 2012, 1-22.
[32] HUPPMANN, Daniel; HOLZ, Franziska. What about the OPEC Car-
tel?. DIW Roundup: Politik im Fokus, 2015. Available at: ht-
tps://www.econstor.eu/handle/10419/111843 [Accessed 23 March 2018]
[33] IEA. Oil 2017 : analysis and forecasts to 2022. Paris: In-
ternational Energy Agency. 2017. [online] Available at: ht-
tps://www.iea.org/publications/freepublications/publication/Market
Report Series Oil2017.pdf [Accessed 15 March 2018].
[34] JOHANY, Ali D. OPEC is not a cartel: a property rights explanation
of the rise in crude oil prices. 1978. PhD Thesis.
[35] KAUFMANN, Robert K., et al. Does OPEC matter? An econometric
analysis of oil prices. The Energy Journal, 25.4, 2004, 67-90.
[36] KERR, Simeon; OMRAN Al Ahmed, Saudi Arabia and UAE intro-
duce 5% VAT in bid to narrow deficits. 2018. [online] The Financial
Times. Available at: https://www.ft.com/content/b1742920-efd0-11e7-
b220-857e26d1aca4 [Accessed 23 March 2018]
39

[37] KISSWANI, Khalid M. OPEC and political considerations when decid-
ing on oil extraction. Journal of Economics and Finance, 38.1, 2014:
96-118.
[38] KISSWANI, Khalid M. Does OPEC act as a cartel? Empirical invest-
igation of coordination behavior. Energy Policy, 97, 2016: 171-180.
[39] KRAUTKRAEMER, Jeffrey A. Nonrenewable resource scarcity.
Journal of Economic literature, 36.4, 1998: 2065-2107.
[40] LAWLER, Alex; BAKR, Amena; ZHADNNIKOV, Dmitry. Inside
OPEC room, Naimi declares price war on U.S. shale oil. Reu-
ters. 2014. [online] Available at: https://uk.reuters.com/article/uk-
opec-meeting/inside-opec-room -naimi-declares-price-war-on-u-s-shale-
oil-idUKKCN0JB0M420141128 [Accessed 6 April 2018].
[41] LAWLER, Alex; EL GAMAL, Rania; NASRALLA, Shadia. OPEC,
Russia agree oil cut extension to end of 2018. Reuters. 2017. [online]
Available at: https://www.reuters.com/article/us-opec-meeting/opec-
russia-agree-oil-cut-extension-to-end-of-2018-idUSKBN1DU0WW [Ac-
cessed 6 April 2018].
[42] LIN, C.-Y. Cynthia. Insights from a simple Hotelling model of the world
oil market. Natural Resources Research, 18.1, 2009: 19-28.
[43] LODERER, Claudio. A test of the OPEC cartel hypothesis: 1974-1983.
The Journal of Finance, 40.3, 1985: 991-1006.
[44] MACAVOY, Paul. Crude oil prices as determined by OPEC and market
fundamentals. Ballinger. Cambridge. 1982.
[45] MILEVA, Elitza; SIEGFRIED, Nikolaus. Oil market structure, network
effects and the choice of currency for oil invoicing. Energy Policy, 44,
2012: 385-394.
[46] MOAZZAMI, Bakhtiar; ANDERSON, F. J. Modelling natural Resource
scarcity using the ’error-correction’ approach. Canadian Journal of Eco-
nomics, 27.4, 1994, 801-812.
40

[47] ONOUR, Ibrahim Ahmed. Can OPEC Cartel Reverse
Crude Oil Price Downfall?. 2017. Available at: ht-
tps://papers.ssrn.com/sol3/papers.cfm?abstract id=3049040 [Accessed
7 April 2018].
[48] OPEC. Brief history. Vienna: Organisation of Petro-
leum Exporting Countries. 2018a. [online] Available at:
http://www.opec.org/opec web/en/about us/24.htm [Accessed 27
March 2018].
[49] OPEC. Annual Statistical Bulletin. Vienna: Organisation of
Petroleum Exporting Countries. 2018b. [online] Available at:
http://www.opec.org/opec web/static files project/media/downloads/
publications/ASB2017 13062017.pdf [Accessed 28 March 2018].
[50] OPEC. Monthly Oil Market Report, February 2018. Vienna: Organ-
isation of Petroleum Exporting Countries. 2018c. [online] Available at:
http://www.opec.org/opec web/static files project/media/downloads/
publications/MOMR%20February%202018.pdf [Accessed 22 March
2018].
[51] SLADE, Margaret E. Trends in natural-resource commodity prices: an
analysis of the time domain. Journal of Environmental Economics and
Management, 9.2, 1982: 122-137.
[52] VERMA, Nidhi. Iran wants euro payment for new and
outstanding oil sales. Reuters. 2016. [online] Available at:
https://www.reuters.com/article/us-oil-iran-exclusive/exclusive-
iran-wants-euro-payment-for-new-and-outstanding-oil-sales-source-
idUSKCN0VE21S [Accessed 2 March 2018].
[53] WORLD BANK. GDP per capita (current US$). 2016a. [online] Avail-
able at: https://data.worldbank.org/indicator/NY.GDP.PCAP.CD
[Accessed 10 March 2018].
41
[54] WORLD BANK. Oil rents (% of GDP). 2016b. [online] Available
at: https://data.worldbank.org/indicator/NY.GDP.PETR.RT.ZS [Ac-
cessed 29 March 2018].
[55] WORLD FACTBOOK, The. Crude Oil - Production. 2018a. [on-
line] Available at: https://www.cia.gov/library/publications/the-
world-factbook/rankorder/2241rank.html [Accessed 16 March 2018].
[56] WORLD FACTBOOK, The. Crude Oil - Proved reserves. 2018b.
[online] Available at: https://www.cia.gov/library/publications/the-
world-factbook/rankorder/2244rank.html [Accessed 16 March 2018].
[57] YOUHANNA, Sargon J. A Note on Modelling Opec Behavior 1983-
1989: A Test of the Cartel and Competitive Hypotheses. The American
Economist, 38.2, 1994: 78-84.
42
List of Figures
1 Share of oil rents on GDP (World Bank, 2016b) . . . . . . . 8
2 Brent oil price 2005 to 2018 (EIA, 2018) . . . . . . . . . . . 9
3 Inverse demand function for different elasticities . . . . . . . 20
4 Profits of OPEC members under different setups . . . . . . . 29
List of Tables
1 Proved reserves and daily oil production . . . . . . . . . . . 4
2 Equilibrium price of oil in Cournot oligopoly . . . . . . . . . 24
3 Equilibrium price of oil under cartel of OPEC and Russia . . 26
4 Equilibrium quantity of oil in Cournot oligopoly . . . . . . . 26
5 Capacity utilization under cartel of OPEC and Russia . . . . 28
43