
Optimization of integrated power conditioning PV parameters
7
Optimization of Integrated Power Conditioning PV Parameters Ahmed Hassan 1 , Ahmed Shawky 1 , Mohamed Orabi 1 , IEEE Senior Member, Jaber A. Abu Qahouq 2 , IEEE Senior Member, and Mohamed Z. Youssef 3 , IEEE Senior Member 1 APEARC, Aswan University, Aswan 81542, Egypt 2 Electrical and Computer Eng. Dept., The University of Alabama, Tuscaloosa, Alabama 35487, USA 3 Bombardier Transportation, Kingston, Canada [email protected] Abstract - Photovoltaic systems should be managed to produce the maximum power under all operating conditions. The Manager is called Maximum Power Point Tracker MPPT. In this paper, the MPPT manager is attached into each PV cell in order to solve the problems of the PV shadow effect. The ripple correlation control algorithm has been used as the control action of the MPPT. The proposed system borderlines have been studied here. Then, the suitable operating ranges have been defined. Also, the inverse minor loop gain theorem is used to study the stability regions of the system. Index Terms – Dc-Dc converters; Boost converter; Photovoltaic; Stability; Efficiency. I. INTRODUCTION Renewable energy resources become the best ways to reduce the oil, gas demand and its resultant pollution. This energy comes from natural resources such as sunlight, wind, rain, tides and geothermal heat. It has not any exhaust, noise or danger on wildlife. Therefore, nowadays there is an increasing trend globally to increase the renewable resources in electricity production. Photovoltaic systems become widespread among the renewable energy systems, also, a large initial investment and limited life time span of photovoltaic array make it necessary for the customer to extract the maximum power from the PV system. In additional, the latest technologies in semiconductor physics try to optimize the PV system where, nowadays its cost reduced compared with the past and its energy go higher. This makes the PV system to be more attractive where the cost of watt per cell has been decreased. On the other hand, PV system is still facing some problems like partial shading, hotspot effect, mismatching effect, non uniform irradiation effect, and the multi peak phenomenon [1, 2]. A number of PV cells are connected in series and parallel to form a solar array to produce the desired voltage and current level. In the series connection when numbers of cells are connected in series. The solar array is adversely affected by non equal illumination and one of these cells is shaded where it may be shaded by neighboring construction; this condition is called partial shading [3-4]. In addition in series connection every cell carries the same current. The partial shading makes the shaded cell produce low photon current or acts as a resistor, so it will consume power instead of generating power. The power consumed in the shaded cell will appear in the form of temperature increasing. The temperature increasing can damage the cell or at least reduce its time life, this problem is called hotspot effect [6-7]. In case of series connection the systems assume that all these cells are identical, but each cell different from the other. Each cell has its own characteristic, so it has a MPP different from the other, this is the mismatching problem. In addition to the mismatching problem there is another problem produces the same action which called the non uniform irradiation problem. This problem means that each cell will receive different irradiation from the other, so its behavior will be different. Nowadays a bypass diode is used to eliminate the shaded panel by connecting in parallel with each other. The bypass diode can protect the shaded panel, but in the other hand it causes the multi peak phenomenon. The multi peak phenomenon means that the P-V characteristic curve has not one peak of power. The MPPT will see the P-V characteristic with multi peak of power. This problem confuses the MPPT operation. Figure 1 shows the I-V characteristics of the PV cell at different levels of shading [3-5]. There are two methods for overcoming the previous PV problems. The first one by eliminating the shaded cell where this decreases the non uniform factor of shading and irradiation and the other method is by controlling each cell alone with a MPPT. The first method is so easy, but it affects the system efficiency and stability. The second method is the P1.8 978-1-4673-1000-0/12/$31.00 ©2012 IEEE
-
Upload
independent -
Category
Documents
-
view
1 -
download
0
Transcript of Optimization of integrated power conditioning PV parameters
Optimization of Integrated Power Conditioning PV Parameters
Ahmed Hassan1, Ahmed Shawky1, Mohamed Orabi1, IEEE Senior Member, Jaber A. Abu Qahouq2, IEEE Senior Member, and Mohamed Z. Youssef3, IEEE Senior Member
1APEARC, Aswan University, Aswan 81542, Egypt
2 Electrical and Computer Eng. Dept., The University of Alabama, Tuscaloosa, Alabama 35487, USA 3Bombardier Transportation, Kingston, Canada
Abstract - Photovoltaic systems should be managed to produce the maximum power under all operating conditions. The Manager is called Maximum Power Point Tracker MPPT. In this paper, the MPPT manager is attached into each PV cell in order to solve the problems of the PV shadow effect. The ripple correlation control algorithm has been used as the control action of the MPPT. The proposed system borderlines have been studied here. Then, the suitable operating ranges have been defined. Also, the inverse minor loop gain theorem is used to study the stability regions of the system.
Index Terms – Dc-Dc converters; Boost converter; Photovoltaic; Stability; Efficiency.
I. INTRODUCTION
Renewable energy resources become the best ways to reduce the oil, gas demand and its resultant pollution. This energy comes from natural resources such as sunlight, wind, rain, tides and geothermal heat. It has not any exhaust, noise or danger on wildlife. Therefore, nowadays there is an increasing trend globally to increase the renewable resources in electricity production. Photovoltaic systems become widespread among the renewable energy systems, also, a large initial investment and limited life time span of photovoltaic array make it necessary for the customer to extract the maximum power from the PV system. In additional, the latest technologies in semiconductor physics try to optimize the PV system where, nowadays its cost reduced compared with the past and its energy go higher. This makes the PV system to be more attractive where the cost of watt per cell has been decreased.
On the other hand, PV system is still facing some problems like partial shading, hotspot effect, mismatching effect, non uniform irradiation effect, and the multi peak phenomenon [1, 2]. A number of PV cells are connected in series and parallel
to form a solar array to produce the desired voltage and current level. In the series connection when numbers of cells are connected in series. The solar array is adversely affected by non equal illumination and one of these cells is shaded where it may be shaded by neighboring construction; this condition is called partial shading [3-4]. In addition in series connection every cell carries the same current. The partial shading makes the shaded cell produce low photon current or acts as a resistor, so it will consume power instead of generating power. The power consumed in the shaded cell will appear in the form of temperature increasing. The temperature increasing can damage the cell or at least reduce its time life, this problem is called hotspot effect [6-7]. In case of series connection the systems assume that all these cells are identical, but each cell different from the other. Each cell has its own characteristic, so it has a MPP different from the other, this is the mismatching problem. In addition to the mismatching problem there is another problem produces the same action which called the non uniform irradiation problem. This problem means that each cell will receive different irradiation from the other, so its behavior will be different.
Nowadays a bypass diode is used to eliminate the shaded panel by connecting in parallel with each other. The bypass diode can protect the shaded panel, but in the other hand it causes the multi peak phenomenon. The multi peak phenomenon means that the P-V characteristic curve has not one peak of power. The MPPT will see the P-V characteristic with multi peak of power. This problem confuses the MPPT operation. Figure 1 shows the I-V characteristics of the PV cell at different levels of shading [3-5].
There are two methods for overcoming the previous PV problems. The first one by eliminating the shaded cell where this decreases the non uniform factor of shading and irradiation and the other method is by controlling each cell alone with a MPPT. The first method is so easy, but it affects the system efficiency and stability. The second method is the
P1.8
978-1-4673-1000-0/12/$31.00 ©2012 IEEE

haby
Powe
r
coopprco
ardest way, buy generating po
Powe
r
Mism
Figure 1: P
Figure 2
Pow
er (W
)
Fig
The proposeonnecting the perating as a resented to extontrol algorithm
ut it can solve ower from the
Vo
matching
P-V curve describi
2: the block diagra
Region 1
dP
dV
Voltaggure 3: P-V curve
d system is PV cell withMPPT. Many
tract the maximm [3] has been
all problems oshaded cell.
olt
ing the mismatchin
am of the propose
ge (V)of a photovoltaic
using the sech a controlled y MPPT algormum power. Rn used for con
of the PV syst
Cell_1
Cell_5
Cell_4
Cell_3
Cell_2
ng problem.
d system.
Region 2
dP
dV
cell.
cond method boost conver
rithms have beRipple correlattrolling the bo
tem
by rter een ion
oost
convertWhere, PV sola
Thisbordersshadingselectinconnectsystem study haloop gai
The soutput toutput system then theone.
In thconvertpoint. Tvoltage track thavailabl
A. M
A ripproducealgorithshows tpoint dipoint isincreaseregion 2decreasthe maalgorithalgorith
B. C
The operatestracker current to producurrent.signal (
ter to track ththis control d
ar cell voltage,
s paper is con so that the M
g and load chang the optimtion so the macan cover a
as been done fin theorem.
II. T
system is usingthen sum the ovoltage. Figurconsists of mue output term
he proposed syter with a MPPThe boost conas boosting th
he maximum le irradiance w
MPPT Operati
pple correlatioe the maximumhm depends mthe P-V curve ivides the P-V s in region 1, te simultaneou2, the voltage es. The system
aximum powehms flow chahm [3].
Control Circuit
boost convers around the algorithm. Thsensor circuit uce a voltage . The cell vol(VI) and produ
he maximum pdepends on thecurrent and po
ncerned with MPPT is achiev
ange. This stumum loading
aximum efficilarge range o
for the propose
THE PROPOSED
g a MPPT per output of the cre 2 show the
ulti cells, each minals connecte
ystem each PVPT in order to tnverter is usedhis voltage is a
power pointwith variable lo
on
on control algm power from mainly on the
of the solar ccurve into two
the voltage sigusly. But if th
signal increasm should operaer point [1-3art of the ri
t Algorithm
rter circuit, wh maximum p
his algorithm isis used to senssignal (VI) co
ltage is then muces a voltage
power point oe ripple magniower.
the study of ed under all co
udy is very imcurrent for
ency is achievof irradiation. ed system usin
SYSTEM
cell to maximicells to create e shape of thcell connecteded in series w
V cell is conntrack the maximd to boost thetarget. The sys
t of the cell ad current.
gorithm [3-4] each PV cell. system ripple
cell. The maximo regions. If thgnal and the phe operating es while the pate as close as]. Figure 5
ipple correlati
hich is shownpower point us shown in Figse the inductor orresponds to tmultiplied by e signal that in
f each cell. itude in the
the system onditions of
mportant for the series
ved and the A stability
ng the minor
ize each cell the desired
he proposed d to a MPPT with another
nected to a mum power e input cell stem should
under the
is used to The MPPT
es. Figure 3 mum power he operating ower signal point is in ower signal possible to shows the
ion control
n in Fig. 4 using MPP g. 6. First a current and
the inductor the voltage
ndicates the
P1.8
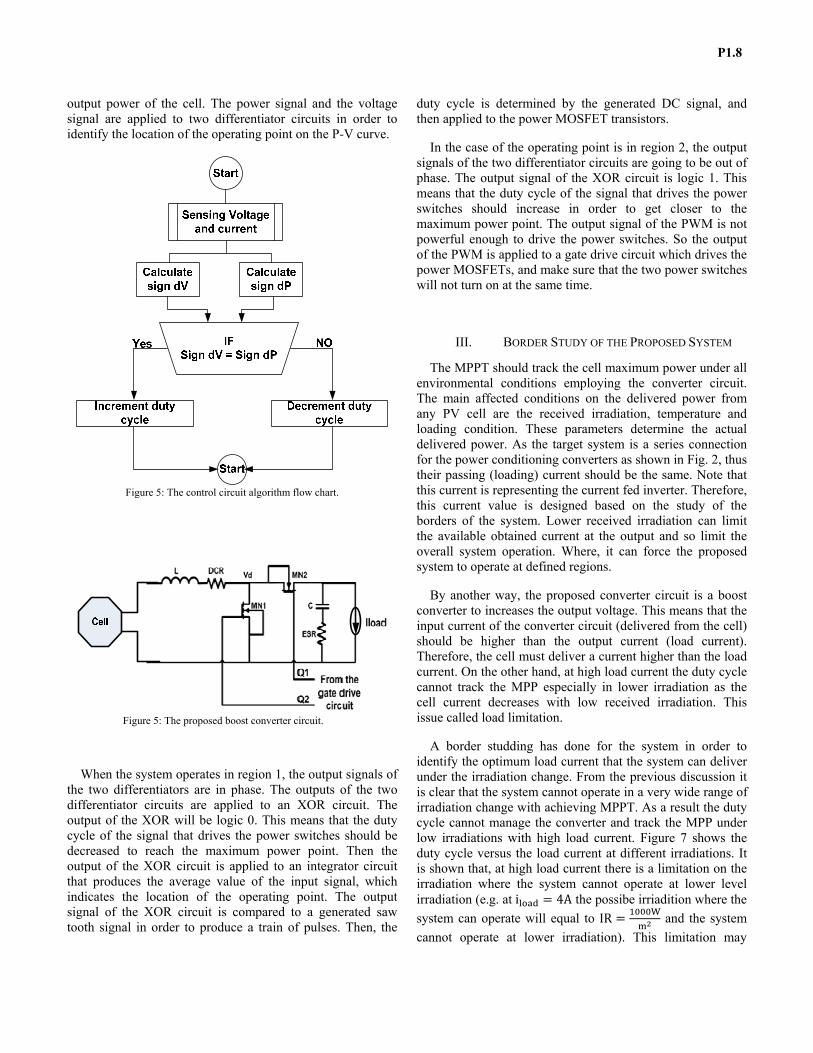
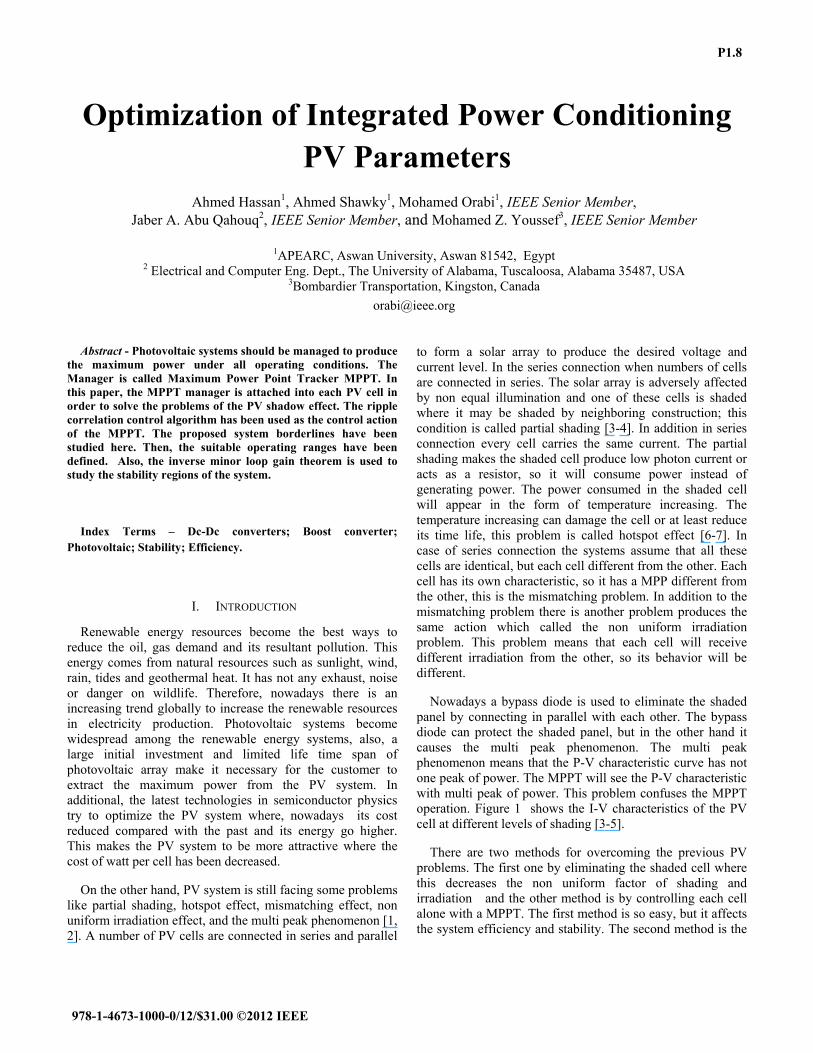
output power of the cell. The power signal and the voltage signal are applied to two differentiator circuits in order to identify the location of the operating point on the P-V curve.
Figure 5: The control circuit algorithm flow chart.
Figure 5: The proposed boost converter circuit.
When the system operates in region 1, the output signals of the two differentiators are in phase. The outputs of the two differentiator circuits are applied to an XOR circuit. The output of the XOR will be logic 0. This means that the duty cycle of the signal that drives the power switches should be decreased to reach the maximum power point. Then the output of the XOR circuit is applied to an integrator circuit that produces the average value of the input signal, which indicates the location of the operating point. The output signal of the XOR circuit is compared to a generated saw tooth signal in order to produce a train of pulses. Then, the
duty cycle is determined by the generated DC signal, and then applied to the power MOSFET transistors.
In the case of the operating point is in region 2, the output signals of the two differentiator circuits are going to be out of phase. The output signal of the XOR circuit is logic 1. This means that the duty cycle of the signal that drives the power switches should increase in order to get closer to the maximum power point. The output signal of the PWM is not powerful enough to drive the power switches. So the output of the PWM is applied to a gate drive circuit which drives the power MOSFETs, and make sure that the two power switches will not turn on at the same time.
III. BORDER STUDY OF THE PROPOSED SYSTEM
The MPPT should track the cell maximum power under all environmental conditions employing the converter circuit. The main affected conditions on the delivered power from any PV cell are the received irradiation, temperature and loading condition. These parameters determine the actual delivered power. As the target system is a series connection for the power conditioning converters as shown in Fig. 2, thus their passing (loading) current should be the same. Note that this current is representing the current fed inverter. Therefore, this current value is designed based on the study of the borders of the system. Lower received irradiation can limit the available obtained current at the output and so limit the overall system operation. Where, it can force the proposed system to operate at defined regions.
By another way, the proposed converter circuit is a boost converter to increases the output voltage. This means that the input current of the converter circuit (delivered from the cell) should be higher than the output current (load current). Therefore, the cell must deliver a current higher than the load current. On the other hand, at high load current the duty cycle cannot track the MPP especially in lower irradiation as the cell current decreases with low received irradiation. This issue called load limitation.
A border studding has done for the system in order to identify the optimum load current that the system can deliver under the irradiation change. From the previous discussion it is clear that the system cannot operate in a very wide range of irradiation change with achieving MPPT. As a result the duty cycle cannot manage the converter and track the MPP under low irradiations with high load current. Figure 7 shows the duty cycle versus the load current at different irradiations. It is shown that, at high load current there is a limitation on the irradiation where the system cannot operate at lower level irradiation (e.g. at i = 4A the possibe irriadition where the system can operate will equal to IR = and the system cannot operate at lower irradiation). This limitation may
P1.8

deatthsy25tora
sypomefmofwdu
efcuefhion
wirrmansyefvathof
ecrease the relt low load currehis make a limiystem will op50: 1000W/mo (0.25: 0.5). Tange and the bo
Efficiency is ystem border sower to the loa
market. Thereffficiency syste
makes a big chaf the proposed
with high efficiuty cycle with
It shows that fficiency, irradurrent the duty fficiency wherigh duty cycle.n a wide range
Second, at hiwill be high. B
radiation. Thismust be in betwnd wide rangeystem can cofficiency. This alue of load chis range combf irradiation lev
Current sensor
Multiplie
I_cell
V_cell
F
iability of oveent the irradiatitation on the d
perate on a wm . However, tThis means theoost converter t
another importudy. High eff
ad which is a tafore, the desem with wideallenge to calc
d system on a wiency. Figure 8load current at
the optimum ldiation level an
cycle will be he the boost co But on the othof irradiation.
igh load the eBut on the hans means the opt
ween to take the of irradiatiover a high lemeans for the
urrent varies bbines between vel.
er Diffrentiator
Diffrentiator
Figure 6: The block
rall system. Otion level rangeduty cycle(e.g.
wide range of the duty cyclee optimization topology will b
rtant parameteficiency meansarget for all theigner should
e range of loculate the optimwide range of 8 shows the et different irrad
load current shnd duty cycle. Fhigh and this d
onverter efficieher hand the sy
fficiency of thnd there are litimum value oe advantages on level. Thereevel of irradi
e proposed sysbetween 1A ahigh efficiency
IntXOR
To powe
k diagram of MPP
n the other hae can increase bat i = 1Airradiation IR
e range decreasof the duty cybe minimized.
er that affectss higher delivee customers in
design a had current. T
mum load currirradiations lefficiency and
diation levels.
hould take careFirst, at light lodecays the overency decreasesystem will oper
he overall systimitations on
of the load currof high efficienefore the overiation with htem the optimu
and 1.5A. Whey and wide ran
tegrator PWM
G_Drive
er switches
PT.
and, but the R =sed
ycle
the red the igh
This rent evel the
e of oad rall s at rate
tem the
rent ncy rall igh um ere, nge
Figu
Figure 8:
iin
Fig
ure 7: Duty cycle v
The total efficienat dif
Zin
gure 9: The repres
vs. load cuurent at
ncy (ƞ) and the dutyfferent irradiation
Toi
Gdi
io
d
sentation of the cur
different irradiatio
y cycle (D) with thlevel (IR).
Gio
Gdo
iin
dZ
rrent to voltage co
on levels.
he load current
o
ioZL
onverter.
P1.8

studumthMwcocusecuthapcocothim
traba
(e W ZRTGGZEqth
ofd soth
IV. S
The main diftudy is that theuty cycle can
maximum powehe defined par
MPPT. The PVwith output imponverter is a cuurrent source aeries with the ourrent to voltaghe converter cpplying properonnecting a vonnection of thhe current to vompedance.
The theoreticansfer functioased analytical
= −−e.g. Z is the
Where: = (JwL + R, R are t= D = −I (V += I = 1JwC
quation (1) doehe load impeda
_ = − = +
Figure 10 shof the open loopas input sign
ources are inpuhe output signa
STABILITY STU
fference betwee boarder lines
manage the er point. Howerameters for k
V cell can be rpedance so thaurrent source. Tas the convertother converterge converter ascan be changer feedback contoltage source
he output. Figuroltage convert
cal formulationn H and Z p transfer functi
−−transfer functio
(2D − 1) + Dthe on resistanc+ 2R + R +es not include nce i is repl
−− +
ows the Transfep boost conver
nals into the cuts and the depls are V andV
UDY OF THE PRO
en the boarderdescribe the rasystem in or
ever, stability keeping the syrepresented as at the input souThe load can beter output will rs. As a result s mentioned ined from voltagtrol or by forcwhich repres
re 9 shows theer without incl
n derived baseparameters whion.
on from V an
DR − D Rces of the two M+ R )
the load impedlaced by (2) to
+
fer Function (Trter which incl
control. Easier pendant sourceV .
OPOSED SYSTEM
r and the stabilange at which rder to track study determinstem tacking a current sou
urce of the boe represented abe connected
the converter in [8]. The typege to current ing the output
sents the pararepresentation
luding the sou
ed on the namhich valid mo
(1)nd i ),
) MOSFETs
dance. To incluget (3).
(2)
_
(3)
TF) block diagrludesi , i a
the independes are outputs,
M
lity the the nes the
urce oost as a d in is a e of
by by
llel n of urce
med odel
ude
ram and
dent so
The functionimpedanFigure convertdoe in (replacini _ =
iins
Figure 1
If the Tso by iconvert
multipli
+
next step aftn with the lonce Z which r11 shows the ter with includ(2), to includeng the input cui +
Figure 10: T
Zin
s Zs
iin
11: The representathe lo
TF between Vincluding the ted to ( )( ) =ied by the term
i (s) + −+
−
fter obtaining oad impedancerepresents the Prepresentation
ding the sourcee the effect of urrent by;
The open loop TF
Toi
Gdi
io
d
ation of the currentoad and source im
and i is Zinput impedan= , a
m of (1 −( ) =
++
the open loe is to includePV cell output
n of the currene impedance. T
the source im
of the converter.
Gio
Gdo
iin
dZo
Z
t to voltage convermpedances.
=Z + Tnce accordingand the othe
). i (s) +
+ d(s)
op transfer e the input impedance.
nt to voltage The same as
mpedance by
(4)
iosZL
io
rter including
G , g to (4) itis er TFs are
+(5)
P1.8

The next step after getting the open loop transfer function with the load impedance and the source impedance is to get the closed loop TF. Figure 12 shows the feedback of the converter which sensing the input voltage then comparing it with the reference voltage which comes from the MPPT to get the error signal. is the gain of the sensor. The error signal is the input of the compensator to get the duty cycle which controls the converter input voltage equal to the reference voltage. In order to get the closed loop TF, the duty cycle d(s) is replaced by ( ) = ( ( ) − ) (6) Equation (5) can be rearranged to be in the form of; ( ) = ( ) + ( ) + ( ) (7) So input voltage equation is obtained as; ( ) = ( ) + ( ) + (8) The inverse minor loop gain is the suitable technique to study the stability of the system from the relation between the input impedance of the converter Z and the output impedance of the source (PV cell) [9-10]. From the previous equations the stability regions can be determined from the term (1 +Z Z ) which makes the equation undefined if it equal zero.
The condition at which this term is equal zero is Z Z =−1 which means that Z and Z are equal in magnitude with 180 difference in phase.
Figure 12: The converter with the closed loop feedback.
The main conclusion is that the stability regions can be determined by equations of the input impedance of the
converter and the output impedance of the PV cell. In addition these impedances can be measured experimentally using a frequency analyzer and then comparing them together to know the stability regions.
V. CONCLUSION
In this paper, a border study of a MPPT has been presented in order to know the suitable operating regions at which the duty cycle can manage the converter to do its purpose. The regions of maximum and minimum efficiency have been defined in order to select the point of optimum efficiency which can cover optimum irradiation ranges. The parameters of the stability are also defined from the stability study of the PV cell and the converter impedances. The inverse minor loop gain theorem has been used to perform the stability study in this paper.
ACKNOWLEDGMENT
This work is sponsored in part by the Egyptian Science and Technology Development Funds (STDF) under STDF project # 1954 and in part by the U.S. - Egypt Science and Technology Joint Fund in cooperation with U.S. Department of Agriculture (USDA) under USDA Project # 58-3148-0-204. Any opinions, findings, and conclusions or recommendations expressed in this material are those of the author(s) and do not necessarily reflect the views of the funding agencies.
REFERENCES
[1] Hassan. A, Abdelkarem. E, Ahmed. M.E, Orabi. M, Yuncong Jiang, Qahouq. J.A.A. ; “Single-cell photovoltaic with integrated converter” in The 33rd IEEE International Telecommunications Energy Conference (INTELEC), 2011
[2] Yuncong Jiang, Qahouq, J.A.A,Hassan, A,Ahmed, M.E,Orabi, M.”Energy Efficient Fine-grained approach for Solar Photovoltaic Management System”, in the 33rd IEEE International Telecommunications Energy Conference (INTELEC), 2011.
[3] Esram, T. Kimball, J.W. Krein, P.T. Chapman, P.L. Midya, P,” Dynamic Maximum Power Point Tracking of Photovoltaic Arrays Using Ripple Correlation Control”, IEEE Transactions for Power Electronics ,vol 21, no 5 ,September 2006
[4] .P. T. Krein, "Ripple correlation control, with some applications," in Proc.1999 IEEE Int. Symp. Circuits Syst., 1999, pp. 283-286.
[5] T. Esram and P. L. Chapman, "Comparison of photovoltaic array maximum power point tracking techniques," Vol 22, IEEE Transactions on Energy Conversion, June 2007.
[6] C. R. Sullivan and M. J. Powers, "A high-efficiency maximum power Point tracker for photovoltaic arrays in a solar-powered race vehicle," in Proc. 24th Annu. IEEE Power Electron. Spec. Conf., 1993, pp. , 574-580
P1.8

[7] C.-T. Pan, 1.-Y. Chen, c.-P. Chu, and Y.-S. Huang, "A fast maximum power point tracker for photovoltaic power systems," in Proc. 25th Annu. Conf. IEEE Ind. Electron. Soc., 1999, pp. 390-393.
[8] T Suntio , J Leppäaho. ; J Huusari,. ; Nousiainen, L. “Issues on Solar-Generator Interfacing With Current-Fed MPP-Tracking Converters” in the IEEE Trans. On Power Electronics, Sept. 2010.
[9] J Leppäaho.; J Huusari; L Nousiainen; T Suntio,“Dynamics of current-fed converters and stability-assessment of solar-generator interfacing” in The International Power Electronics Conference (IPEC), 2010.
[10] T Suntio; J Puukko; L Nousiainen, T Messo,.J Huusari,“Change of paradigm in power electronic converters used in renewable energy applications” in The IEEE 33rd International Telecommunications Energy Conference (INTELEC), 2011.
P1.8