Optimization of Facility Location-Allocation Model for Base
21
* Corresponding author. Tel.: +98 918 132 0048; fax: +00833 830 5006. E-mail address: [email protected] Optimization of Facility Location-Allocation Model for Base Tranceiver Station Antenna Establishment Based on Genetic Al- gorithm Considering Network Effectiveness Criteria (Case Study North of Kermanshah) Dr. Farzad Amiri a* a Assistant Professor, Department of Industrial Engineering, Kermanshah University of Technology, Kermanshah, Iran ARTICLE INFO Keywords: Base Tranceiver Station (BTS) Antenna Facility Location Genetic Algorithm (GA) Network efficiency criteria Geographic Information System (GIS) Technical telecommunication criteria ABSTRACT The location of the base tranceiver station (BTS) antennas plays important role in the proper service and coverage of the mobile connection in each region. Proper location of these antennas is a major challenge for operators in each country, as in addition to maximum network coverage, service costs must also be acceptable and competitive. This means that in busy areas, in order to provide better service, the antennas must be greater and closer to each other. In general, the location problem is a type of optimization problem that aims to select a subset of the can- didate locations to create the facilities that provide the best service at the lowest cost. To solve such problems in a reasonable time, we can use meta-heuristic al- gorithms to find solutions that are close to the optimal solution. Accordingly, this paper attempts to apply the genetic algorithm (GA) to find a suitable solution for finding BTS mobile antennas in north Kermanshah. To this end, a GA model is proposed that improves the location coordinates of the current BTS antennas ex- tracted from the Geographic Information System (GIS). Comparison of model results with the status of BTS active antennas in Kermanshah shows the perfor- mance of the model. 1. INTRODUCTION The human need for telecommunication services has increased significantly in the information age. Telecommu- nication companies (Telcos) continue to improve and develop their technologies and services as well. However, even given the fast development and invention of telecommunications technologies, the process of adopting such technologies in Telcos is not immune from emerging problems, particularly those related to the connection inter- ference experienced by customers [1]. Base Transceiver Station (BTS) as an auxiliary signal generator is used for cellular purposes. Every activity for data exchange such as web browsing and others cannot be separated from the role of BTS. To support the smooth communication of data through BTS to be more optimal, the role of spatial data is needed. With spatial data, cellular network development such as new BTS development can be considered and plotted. The position of a BTS has been calculated based on the range of the transmitted signal. The number of base stations in urban areas is greater than in rural areas because each operator wants full signal coverage so that it can attract consumers to use the operator [2].
-
Upload
khangminh22 -
Category
Documents
-
view
2 -
download
0
Transcript of Optimization of Facility Location-Allocation Model for Base
* Corresponding author. Tel.: +98 918 132 0048; fax: +00833 830 5006.
E-mail address: [email protected]
Optimization of Facility Location-Allocation Model for Base
Tranceiver Station Antenna Establishment Based on Genetic Al-
gorithm Considering Network Effectiveness Criteria (Case
Study North of Kermanshah)
Dr. Farzad Amiri a*
a Assistant Professor, Department of Industrial Engineering, Kermanshah University of Technology, Kermanshah, Iran
ARTICLE INFO
Keywords:
Base Tranceiver Station
(BTS) Antenna
Facility Location
Genetic Algorithm (GA)
Network efficiency criteria
Geographic Information
System (GIS)
Technical telecommunication
criteria
ABSTRACT
The location of the base tranceiver station (BTS) antennas plays important role in
the proper service and coverage of the mobile connection in each region. Proper
location of these antennas is a major challenge for operators in each country, as
in addition to maximum network coverage, service costs must also be acceptable
and competitive. This means that in busy areas, in order to provide better service,
the antennas must be greater and closer to each other. In general, the location
problem is a type of optimization problem that aims to select a subset of the can-
didate locations to create the facilities that provide the best service at the lowest
cost. To solve such problems in a reasonable time, we can use meta-heuristic al-
gorithms to find solutions that are close to the optimal solution. Accordingly, this
paper attempts to apply the genetic algorithm (GA) to find a suitable solution for
finding BTS mobile antennas in north Kermanshah. To this end, a GA model is
proposed that improves the location coordinates of the current BTS antennas ex-
tracted from the Geographic Information System (GIS). Comparison of model
results with the status of BTS active antennas in Kermanshah shows the perfor-
mance of the model.
1. INTRODUCTION
The human need for telecommunication services has increased significantly in the information age. Telecommu-
nication companies (Telcos) continue to improve and develop their technologies and services as well. However,
even given the fast development and invention of telecommunications technologies, the process of adopting such
technologies in Telcos is not immune from emerging problems, particularly those related to the connection inter-
ference experienced by customers [1].
Base Transceiver Station (BTS) as an auxiliary signal generator is used for cellular purposes. Every activity for
data exchange such as web browsing and others cannot be separated from the role of BTS. To support the smooth
communication of data through BTS to be more optimal, the role of spatial data is needed. With spatial data,
cellular network development such as new BTS development can be considered and plotted. The position of a
BTS has been calculated based on the range of the transmitted signal. The number of base stations in urban areas
is greater than in rural areas because each operator wants full signal coverage so that it can attract consumers to
use the operator [2].

Optimization of Facility Location-Allocation Model for Base Tranceiver Station …
[2]
The facility location problem is a branch of operations research with great signicance for both practical and com-
binatorial optimization perspectives. The classical location problem is concerned with determining the location of
a facility to optimize the allocation of facilities to customers [3].
BTS mobile telecommunication stations are part of the mobile telecommunications service network, being popular
over a decade. The establishment of these stations as elements having particular characteristics as well as physical
dimensions have imposed unfortunate consequences on urban areas. The severity of these consequences, due to
the non-observance of the principles and rules of urban planning and the lack of consideration in this regard, is
much greater than expected [4].
The installation location of BTS telecommunication antennas plays a very important role in servicing and provid-
ing appropriate coverage in the areas concerned. Meanwhile, the study of the distribution of waves in urban envi-
ronments is one of the major issues in the designing of a mobile telecommunication network.
Service availability is pursued by a number of operators offering various systems and services that vary with the
development of cellular radio network infrastructure, including in addition to the number and location of BTS
Tower which is a compulsory requirement. If viewed from the opposite viewpoint, the density of the tower loca-
tion is too high to bring some problems that affect the community. On the one hand, the increasing number of
tower sites will indeed support the fulfillment of the community's need for telecommunication services. On the
other hand, if development is done without coordination it will disturb the beauty of a region [5].
The deployment of many base transceiver stations (BTSs) by different telecommunication operators, scattered all
over the vicinity of residence, work and schools, has become a great concern for economic reasons and exposure
to radiation by the general public within the BTS environment [6]. In fact, the quality of wireless communications
depends on many conditions in that area. Without being aware of these conditions, the designing of the commu-
nication network of mobile telecommunication can be impossible or at least non-optimal.
The number of Base Transceiver Station (BTS) continues to increase along with the increase in communication
needs. To meet customer needs and provide the best service. So that the signal quality of the Base Transceiver
Station (BTS) network is maintained, Mobile operators must always check and support the Base Transceiver
Station (BTS). Therefore, an application is needed to find the shortest base transceiver station (BTS) that can run
on the Android platform so that it can help technicians in optimizing the distance to the location of the Base
Transceiver Station (BTS) in case of damage and maintenance [7].
Therefore, the correct locating of BTS antennas is a type of Non-deterministic Polynomial-time hard (NP-HARD)
problem; in this regard, the complexity and volume of computational problems is increased exponentially by the
increase in the number of demand points and service centers. In general, the issue of facility locating is an opti-
mization problem whose purpose is to select a subset out of a set of candidate locations, so that facilities are
provided that offer the most service at the lowest cost [8].
Currently, traditional methods are used to locate BTS Mobile Antennas being based on the technical and legal
standards approved by the Ministry of Communications and Information Technology [9]. In many cases, the qual-
ity of service in an area is not acceptable due to the poor initial location; in order to compensate for this, there
exists an inevitable need for an increase in the number of stations and ultimately the rise of costs and installation
problems.

Dr. Farzad Amiri.
[3]
In order to solve problems, the GA generates a set of possible solutions. Each of these solutions is evaluated using
a fit function. Then new solutions are created using three operators: selection, intersection, and mutation. This
will evolve the solutions. Hence, the search space evolves in a direction that achieves the optimal solution.
Using the proposed method, a significant advance takes place in the problem of locating the BTS mobile antennas
and intelligentization of installed antennas after being located; in addition, these issues reduce the number of
towers and their turning-on costs and increase the quality of the communication service compared to the usual
way.
The main objective of this study is to determine the coordinates of the proposed points for the establishment of
BTS antenna based on the network performance criteria and the GA (a case study of the north Kermanshah), with
proper performance compared to the existing traditional methods.
2. THE REVIEW OF THE RELATED LITERATURE
2.1 Base telecommunication stations (BTS)
Basically, a telecommunication system requires equipment and devices that transfer and receive information
(transceivers) using electronic codes which rely on radio frequency [10].
The first part that is directly connected to the mobile phone in the mobile network, is generally called "mobile
antenna" and, particularly, is BTS, standing for BTS.
BTS stations are the most important part of the Global System for Mobile (GSM) network, being in a large num-
ber, they can be seen almost everywhere in the area covered by the network; the network is generally known by
them. These stations communicate with each other through the direct aerial vision by microwaves, forming an
integrated network and providing subscriber communications.
Base Transceiver Station (BTS) - is a transceiver and acts as interface between the Mobile Stations (MS) to the
network. A BTS will have between 1 and 16 Transceivers (TRX), depending on the geography and demand for
service of an area. Each TRX represents one Absolute radio frequency channel number (ARFCN). However,
depending on geography, service demand and operator’s network strategy and architecture, a BTS may be host
up to two, three or six sectors, or a cell may be serviced by several BTSs with redundant sector coverage. Each
sector is covered by sector antenna, which is a directional antenna [11].
The main tasks of BTS Include the following [12]:
- The organization of common radio channels is used in a cell, in which it receives the channel request from
the Mobile Station (MS) and sends it by BSC to allocate, if possible, a channel to the Mobile Station (MS)
. It also disables the channel and initiates encryption.
- Encoding the information received from BSC to send to the Mobile Station (MS) and decryption of the
information received from the MS and sending it to BSC, multiplying the logical channels and sending
them to the physical channels.
- Controlling radio subsets, which include setting the time for sending information by the MS, which is
regularly updated and sending the results to BSC.

Optimization of Facility Location-Allocation Model for Base Tranceiver Station …
[4]
- Sending the output power control signal to MS to reduce interference and optimize the power of MS.
- The operation of sending information to many units and receiving microwaves from them.
- Synchronizing the required information from pcm link and replacing the number of frames with the counter
in it.
- Setting frequency parameters, output power of transmitters and receiver frequencies, as well as BTS color
code.
Each BTS contains different modules, which are described.
A: Transceiver Interfaces (TRI): BTS are used consecutively for connections, in this case the control information
related to the second BTS are sent.
B: Transceivers (TRX): Each Transceivers (TRX) in binary mode can serve 8 subscribers on eight temporal gate-
ways. Depending on the location of the site, the number of them can be specified, for instance, up to 6 TRXs is
introduced for any sites in crowded areas of each sector. Basically, each site has 3 sectors in three different direc-
tions, and each sector has 6 TRXs. Therefore, its capacity is displayed as 6 + 6 + 6.
C: Local Storage Terminal
D: Transceiver Interfaces Input/output (TRI I/O) Terminal
E: Basic band switch: Determines the order of system's communication with different Image Receivers.
F: Timing: It extracts a base frequency from CLICK of Pulse Code Moduatio (PCM) line to generate carriers,
transmitters and receivers as well as accurate counting of Time Division Multiple Access (TDMA) frames.
G: Transmitter mixer: mixes signals from TRX and sends them on the antenna.
H: divider: Strengthening and dividing received waves, strengthens and amplifies signals received from antennas
and divides them.
I: Power converter: A converter inside the BTS that can convert Voltages Alternating Converted (VAC) 220 or
Voltages Directly Converted (VDC) 66- 48 to the VDC 24 voltage required for the BTS power supply.
At the first competitive facility location model for the cognitive radio network assumed that each customer pat-
ronizes the company with the best signal quality from its nearest base station. Each customer makes own decision
independently from other customers, as in the most facility location models. In this work we propose a new model
for customer behavior. We assume that customers are mobile. They experience and evaluate the quality of con-
nection over the whole network. Thus, the choice of the company (mobile operator) is made upon the average
quality of service , In other words, we assume that customers can move from one operator to another until the
average quality of service will be the same and customers reach the Nash equilibrium [13].
2.2 GA Procedure
GA as an optimization computational algorithm, taking into account a set of solutions for spots in each computa-
tional repetition, efficiently searches for different areas of the solution space. In the search mechanism, although
the value of the objective function of the entire solution space is not computed, the calculated value of the objective
function for each point is interfered in the averaging of the target function in all sub-spaces where that point is

Dr. Farzad Amiri.
[5]
dependent on. These sub-spaces are statistically averaged in terms of objective function in a parallel manner. This
mechanism is called implicit parallelism [14].
This process leads to the search for space in the regions where the statistical average of the target function is high
and the possibility of an absolute optimal point in them is greater. Because in this method, unlike the single-way
methods, the solution space is searched comprehensively, it is less possible to converge to a local optimal point.
In 2008, Calleja and Debono, presented a method for position detection based on pattern recognition using im-
portant parameters in mobile signal by using a database of information sensitive to locations in the area under
study; they concluded that the release of multiple routes does not reduce the precision of its location estimation
[15].
Munene and Kiema, in a case study, selected Nairobi, Kenya, using GIS to locate of antennas BTS antennas. They
concluded that if GIS database was provided, it could help in locating [16].
In 2012, Alamur et al., proposed a method based on GA that was used to capture the radio frequency of mobile
networks and determine the location of the central station. In this method, using a particular type of intersection
operation in the GA, they could come up with better answers [17].
3. RESEARCH METHODS
The present study can be considered as an empirical-applied research according to its application. Initially, the
topographic map of Kermanshah city (with a scale of 1/25000) was processed through the natural resources office
of the city and city neighborhood map (Research Institute of the World 2015) was processed from the municipality
of Kermanshah. Required information was obtained through field surveys, consultation with experts, and data
base production [18, 19].
The sample of this study, north of Kermanshah, ranged from 47 degrees and 08 minutes to 47 degrees and 19
minutes, east and 35 minutes to 34 degrees and 38 minutes, north.
In order to use GA to optimize the number of installed antennas, we must first enter their coordinates into the
algorithm and then use the MATrix LABoratory (MATLAB) simulator to optimize them. In this study, GIS sys-
tem was used and the information required by the system was entered into the system as well; meanwhile, the
exact location was obtained according to the field information (interview and observation), and the final coordi-
nates of the antennas were also obtained. Eventually, these coordinates were applied to the GA and the final
locating was conducted.
Many studies have been carried out to examine the various criteria for choosing the location for the installation of
BTS antenna, and in the following tables; these criteria have been shown along with their sub-criteria.
3.1 Technical telecommunication criteria
This group of criteria includes parameters that are related to the telecommunication operation of the station. The
quality of a network is highly dependent on all technical considerations and criteria in (Table 1).

Optimization of Facility Location-Allocation Model for Base Tranceiver Station …
[6]
3.2 Construction and installation criteria
This category includes parameters that ensure the functionality of the station. Depending on the type and model
of the station that is to be installed in the desired location and in view of the equipment to be installed on the site,
it is necessary to allow the equipment to be transferred and installed on the site (Table 2).
3.3 Legal and ownership Criteria
Regarding concerns about the harmfulness of magnetic radiation due to radiation from the antenna, sometimes
neighbors and residents of the area disagree and continue to operate equipment installation prevented. Accord-
ingly, the following criteria are taken into account when receiving eligible candidates by location of groups (Table
3).
3.4 Urban Criteria
This category includes criteria that are relevant to the social context of the area and vary in different locations
(Table 4).
Using the analytical hierarchy process, along with the GIS for locating, contain three basic steps. In the first step,
in order to achieve the goal of the study, the necessary criteria and sub criteria were formulated, previously pre-
sented in the form of tables.
The criteria and sub-criteria being obtained were weighed in the second step. To determine the coefficient of
significance (weight), the criteria and sub criteria were compared in pairs, then these significant coefficients were
considered in binary comparisons matrix. Using the approximate geometric mean, the coefficients of significance
of the criteria was obtained which is equal to the division of the geometric mean of each parameter by the sum of
the averages.
Delphi method was used to weigh the criteria and sub criteria. Thus, using the views of urban experts, weights of
criteria and sub criteria were obtained and compared with each other; then using Excel software and the geometric
mean method, the final weights of each criterion were calculated. After calculating the final weight of each of the
three criteria, the weight of the sub criteria was also calculated (Table 5).
4. RESULTS OF THE RESEARCH
4.1 Technical Telecommunication criteria
After reviewing all the technical and logical sub-criteria using the binary comparison these values was obtained.
(Table 6)
As the numbers in the table indicate, capacity sub criteria has the most impact and specifies that the population
density in a region, and consequently the demand for calls is a very important parameter in choosing the installa-
tion location of the BTS antenna.
The sub criteria were achieved- as separate layers placed on each other- by the use of the above table and the
integration of the information obtained from GIS, as well as each of the maps; combination of the information
layers leads to the extraction of a (Figure 1) which includes 3 levels of prioritization.

Dr. Farzad Amiri.
[7]
4.2 The construction and installation criteria
The following table is obtained after reviewing all of the following criteria for construction and installation us-
ing the binary comparison of the values. (Table 7)
As it is observed, costs have the most impact on this criterion, indicating that the cost of installing the antenna is
a very important parameter in choosing the location of the BTS.
The sub criteria were achieved -as separate layers placed on each other- by the use of the above (Table 7) and the
integration of the information obtained from GIS, as well as each of the maps; combination of the information
layers leads to the extraction of a map which includes 3 levels of prioritization. (Figure 2)
4.3 Examination of legal and ownership criteria
Due to the similarity of legal and ownership conditions in all regions, the only sub-criteria differing in the segre-
gated areas is described as the ownership cost in (Table 8).
Given that there is no integration of layers in this criterion, and there is only one separate map, the same map is
placed as the outline map. The priority of the legal and property measures is as follows. (Figure 3)
4.4 The examination of the urban criteria
According to the (Table 9), the sub criterion sensitive points has the greatest impact on this criterion, and the
importance of sensitive areas and the military locations attracts a lot of attentions in this regard.
The mapping of urban priorities is achieved in this criterion considering the three parameters, the extraction of
three separated maps using GIS software and their integration in (Figure 4).
4.5 Final integration and identification of proposed locations
In this stage, by combining the layers of the main criteria with each other, the prioritization map of the separation
areas is obtained. The following chart shows the effect of sub-criteria on the finalized in percent. (Figure 5).
Therefore, based on this chart, the proposed coordinates were achieved in order to apply them to the GA in the
north of Kermanshah. (Figure 6)
Given these locations, it is clear that higher priority areas have been nominated for antenna installation. The GIS
has calculated all the parameters considered in this selection with different properties and the desired location.
4.6 Comparison of proposed coordinates with existing antenna installation locations
Nowadays, in the north of Kermanshah, 32 BTS antennas are installed in different regions, compared to the pro-
posed map, it is realized that there is a difference between the locations of the current antennas and the proposed
locations in terms of number and location. As the number of antennas has decreased from 32 to 30 antennas and
their installation location has changed as well.) Figure 7)
Because the development process in urban areas, which are generally privately owned, in addition to the high cost
of providing and installing antennas, requires consideration of legal considerations and related administrative
procedures. An effective proposal to reduce operating time and costs is to relocate existing antennas to new loca-
tions according to the project schedule and based on the progress of relevant legal action.

Optimization of Facility Location-Allocation Model for Base Tranceiver Station …
[8]
4.7 The coordinates of the proposed GIS points
To optimize proposed antennas obtained by GIS, we should consider the coordinates of these points in metric,
and then we should apply these coordinates as the location of the antenna in MATrix LABoratory (MATLAB)
software and optimize them by GA in (Table 10).
4.8 Selecting important parameters to apply to the GA
the optimization problem is intractable for exact solutions by conventional methods and the optimal solution can-
not be reached within a reasonable time. In this section, we applied a GA-based, which could handle the respective
models made for real-life problems. GA is a bio-inspired, probabilistic search method based on the natural selec-
tion method, which was initially developed by Holland. Gen et al. proved that GA would be a proper approach to
acquire near-global solutions [20].
GA is based on the principle of evolution and natural genetics it has been successful in solving many optimization
problems including the BTS placement problem. The design of a GA starts with solution encoding, creation of
individuals that make a population, and evaluation of the individuals. During the evaluation each individual is
assigned a fitness value according to a certain fitness function. Based on the fitness value, some of the better
individuals are selected to seed the next generation by applying crossover and mutation to them. In GA, the vari-
ables can be represented in binary, integer, and real [21].
Using the Parato principle, out of 15 sub-criteria identified that affect location, only the percentage of impact of
5 sub-criteria (quality, sensitive points, imposed costs, quality of service and coverage) are significant, and the
rest of the sub-criteria Can be ignored. (Figure 8)
4.9 Location of applicants for contacting
In order to run the simulation, we randomly scattered 100 users in the target area who want to make calls with the
BTS antennas. The number of users to choose was arbitrary and there was no limit to the number of users and
their location. In our research, we have considered the number of users as 100 people due to the quality of the
output images and their resolution. The random coordinates generated in simulator software are shown in (Figure
9).
The location of users on the map is obtained by applying the coordinates of the points in which the users made
calls (Figure 10).
4.9.1 The examination of the number of BTS antennas and the cost of providing service, with random
selection
Considering that the number of users requested to make calls is 100 people and they are randomly dispersed across
the region, and each user makes an average of five calls, and the number of 30 antennas extracted from the GIS
are installed at locations with specified coordinates, the random algorithm can be used for selecting the initial
population, the number of active antennas and coverage being shown in (Figure 11).
By reviewing (Figure 11), it is realized that 22 randomly selected primary populations are used, 22 antennas are
active and 8 other antennas remain inactive; obviously this is the case if all 100 callers are contacted by the closest
antenna.Therefore, the cost reduction is expected. This cost reduction is shown in (Figure 12).
According to the above, it can be seen that at the beginning of the algorithm and for providing communication
services with 30 BTS antennas and 100 users (each of which made 5 calls), the service cost will be 1.75 multiplied

Dr. Farzad Amiri.
[9]
by 10 and exponent 7, and at the end of the algorithm, this value (after 100 repetitions) will be 1.49 multiplied by
10 and exponent 7. In addition, it is assumed that the algorithm is uniform after the repetition of 34; and the
excessive repetition of this amount does not contribute to the improvement of the algorithm.
4.9.2 The examination of the number of BTS antennas and the cost of providing the services being based
on the tournament method of population selection
With the same conditions that were considered in the random population selection method, if we use the initial
population selection method as a tournament, the number of active antennas and how to cover users is shown in
the )Figure 13)
It should be noted that in this method, 8 antennas have been inactive. However, the location of inactive antennas
has changed slightly. (Figure 13)
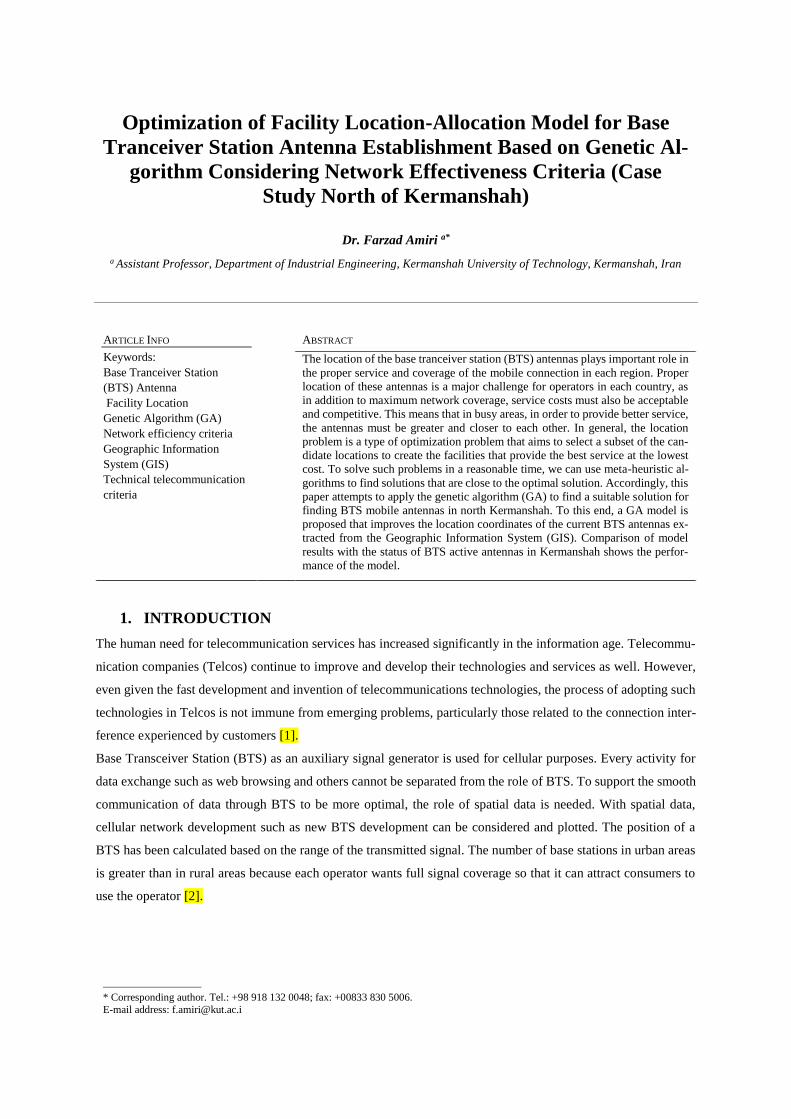
The cost reduction chart in this method is as follows in (Figure 14).
Using this method of selection, it can be observed that the algorithm has converged much faster, and the final
value is obtained in the 29th iteration; in addition, the cost reduction of service in this method is not significantly
different from the random method.
4.9.3 The examination of the number of BTS antennas and the cost of providing service, with the selec-
tion method Roulette wheel
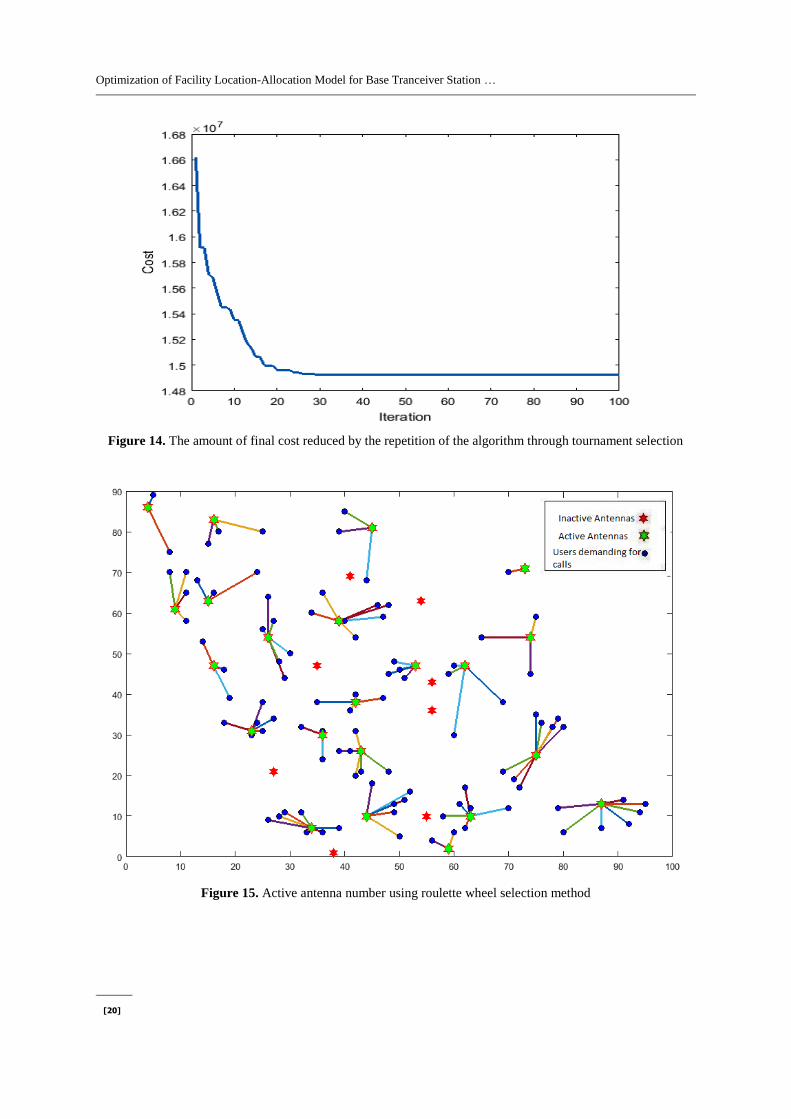
In a similar way to the previous two methods, if we use the roulette wheel method, the number of antennas and
how to cover users is shown in the )Figure 15).
It should be noted that in this method, 8 antennas have been inactive. There is no significant changes over the
previous method .The reduction cost' chart is as follows in (Figure 16).
In this population selection method, it is observed that the algorithm has reached the final value in iteration 28
and faster convergence was observed compared to the previous two methods. Also, the amount of cost reduction
in this method is more than the other two methods.)1.485 multiplied by 10 to the power of 7)
5. CONCLUSIONS
The observation of the results obtained by the alternate implementation of the algorithm shows that the integration
of this innovative method GA being deployed on the points which were originally based on a traditional methods
GIS, resulted in a faster convergence of results and, effective reduction the number of antennas, and significantly
reduction of the service costs.
This reduction in the total number of antennas and service costs is due to the intelligent determination of active
and inactive antennas at any given time.
Accordingly, the final output results of the GA obtained using the roulette wheel pattern in convergence 28 are
shown on the geographical map of the region. Yellow dots (location of available antennas), red dots (active
antenna) and green dots (inactive antenna) (Figure 17).

Optimization of Facility Location-Allocation Model for Base Tranceiver Station …
[10]
REFERENCES
1- Akhriza, T., Sahaduta, H., Susilo A., “Mproving mobility of base transceiver station locating method using
telegram's application”, International Journal of Technology, 1, pp. 177-178 (2017).
2- Nizamuddin E., “Spatial analysis for calculating closest distance of operators’ location to Base Transceiver
Station (BTS) in Banda Aceh city”, IOP Conf. Ser.: Mater. Sci. Eng., 796, pp. 1-2 (2020).
3- Yousefi Yegane, B., Nakhai Kamalabadi, I., Farughi H., “Influence of two different producers in a competi-
tive location problem”, Scientia Iranica, 27(5), pp. 2539-2540 (2020).
4- Shi'a I., “Introduction to the Basics of Urban Planning”, Publications of the University of Science and Tech-
nology (10th edition), 3, pp. 27-35 (2001).
5- Mauludiyanto, A., Pranata, Y., “Planning of Number and Location of New Base Transceiver Station (BTS)
Tower in Mobile Telecommunication System in Jombang Using Analytical Hierarchy Process Method and
Geographic Information System Approach”, Journal on Advance Research in Electrical Engineering, 3(2),
pp. 78-79 (2019).
6- Ajibola, T., Surajudeen-Bakinde, N., Amuda, S., “Development of base transceiver station selection algo-
rithm for collocation arrangement”, Nigerian Journal of Technology (NIJOTECH), 34(3), pp. 538-539 (2015).
7- Mekongga I., Aryanti A., “The Shortest Path Search Application for Base Transceiver Station (BTS) Using
A* Algorithm”, Atlantis Highlights in Engineering, 7, pp. 472-473 (2020).
8- Yaghini, M., “Novel Optimization Algorithms”, The University Press, 9(2), pp. 65-74 (2016).
9- Montazeri-Gh, M., Mahmoodi-K, M., “An optimal energy management development for various configura-
tion of plug-in and hybrid electric vehicle”, Journal of Central South University, 22(5), pp. 1737-1747 (2015).
10- Elehinafe, F., Ayeni, A., Mamudu, A., Odunlami, O., Abatan, O., Folayan, A., Sonibare J., “Assessment of
environmental impact of telecommunication base transceivers stations in residential areas”, IOP Conference
Series: Earth and Environmental Science, 655, pp. 12-66 (2021).
11- Obinna, I., Osawaru, O., “Modelling of Power Consumption in Two Base Stations, Using Ugbor Station and
Benson Idahosa University Station in Benin City as a Case Study”, International Journal of Innovative Sci-
ence and Research Technology, 5(6), pp. 1153-1154. (2020).
12- Mohammad Pour, K., “Principles of Wireless and Mobile Communications”, Khaja Nasir al-Din Tusi Uni-
versity of Technology Publication, 4(1), pp. 25-39. (2009).
13- Davydov, I., Kochetov, Y., Dempe, S., “Local search approach for the competitive facility location problem
in mobile networks”, International Journal of Artificial Intelligence, 16(1), pp. 130-132. (2018).
14- Bavari, A., Salehi, M., “Genetic Algorithms and Optimization of Composite Structures”, Tehran, Abed Pub-
lication, 7(2), pp. 39-48. (2008).
15- Calleja, C., Debono, C., “The application of database correlation methods for location detection in GSM
networks, In Proc. Communications”, Control and Signal Processing, ISCCSP 2008, 3rd International Sym-
posium on, 18(1), pp. 1324-1329. (2008).

Dr. Farzad Amiri.
[11]
16- Munene, E., Kiema, J., “Optimizing the Location of Base Transceiver Stations in Mobile Communication
Network Planning: Case study of the Nairobi”, International Interdisciplinary Journal of Scientific Research,
6(2), pp. 117-128. (2014).
17- Alamur, S., Kara, B., Karasan, O., “Multimodal hub location and hub network design”, Omega, 40, pp. 927-
939. (2012).
18- Zebardast, E., “Application Analytical Hierarchy Process in Urban and Regional Planning”, Journal of Fine
Arts, 10, pp. 47-58. (2001).
19- Golmohammadi, A., “Tavakkoli-Moghaddam, R., Jolai, F., Golmohammadi, A., Concurrent cell formation
and layout design using a genetic algorithm under dynamic conditions”, UCT Journal of Research in Science,
Engineering and Technology, 2(1), pp. 08-15. (2014).
20- Entezaria, Z., Mahootchia, M., “Developing a mathematical model for staff routing and scheduling in home
health care industries: Genetic Algorithm based solution scheme”, Scientia Iranica, 5(2), pp. 75-82. (2020).
21- Nwelih, E., Asagba P., Ugwu C., “Design and Implementation of Neighborhood Control Optimal GSM Base
Transceiver Station Placement Using Genetic Algorithm”, Afr. J. Comp, & ICT, 11(1), pp. 12-27. (2018).
Biographies
Farzad Amiri is the assistant professor of Industrial Engineering at Kermanshah University of Technology
(KUT). received the B.S. degree in Civil Engineering from Bo ali sina University, Hamedan, Iran, in 1994, and
his M.S. and Ph.D. in Industrial Engineering, System Management and Productivity , from the University of
Science and Technology, Tehran, Iran, in 2004 and 2013, respectively. His current research interests include Me-
taheuristic Optimization, Statistical Quality Control, Project Management and System Dynamic. He is a member
of the Iranian Industrial Engineering Society, Project Management Society and Civil Engineering Society.
Table 1. Technical Telecommunication criteria
Criterion Sub criteria DESCRIPTION
Technical tele-
communication
Capacity Demand is determined based on population density
Coverage The area under coverage and the coverable areas are specified
Service level Describes traffic congestion and whether the system is allowed to
block several percent of subscriber calls
Service quality How much is the implementation quality of the system
Expansion Abil-
ity
Prospects for the future projects and the development plan in the
preliminary design should be considered
Table 2. Construction and installation criteria

Optimization of Facility Location-Allocation Model for Base Tranceiver Station …
[12]
Criterion Sub criteria DESCRIPTION
Construc-
tion and in-
stallation
Enough space to de-
ploy equipment
Availability of sufficient space to deploy equipment and predict the
space needed for potential development
Power supply Whether is it possible to use urban power supply and if not, is it pos-
sible to use emergency electricity for power supply
Ground strength Check the required location for strength
Cost The cost of installing the antenna is considered
Table 3. Legal and ownership Criteria
Criterion sub criteria DESCRIPTION
Legal and
ownership
Criteria
The possibility of signing contracts The satisfaction of the owner or the owners and the
possibility to sign contracts are reviewed
The lack of ownership and legal
problem
The location is carefully considered in terms of lack of
ownership and legal problems
Ownership Costs The costs of ownership including buying or renting
should be considered
Table 4. Urban criteria
Criterion sub criteria DESCRIPTION
Urban
sensitive points sensitive points such as hospitals, gyms and military centers are consid-
ered
Traffic Traffic of the target area is evaluated
Communication
paths Important paths are taken into consideration
Table 5. The binary comparison of the criteria and the determination of the significant coefficients (weight)
The main criteria Technical telecom-
munication
Construction
and installa-
tion
Legal and
ownership urban
Geometric
mean
The
weight
Technical telecommuni-
cation 1 7 5 3 3.20 0.54
Construction and instal-
lation 0.14 1 0.33 0.20 0.41 0.07

Dr. Farzad Amiri.
[13]
Legal and ownership 0.20 3 1 0.20 0.59 0.10
urban 0.33 5 5 1 1.7 0.29
Total 5.9 1
Table 6. The binary comparison of Technical Telecommunication sub criteria
Row Capacity Cover Service
level
Services qual-
ity
Expandabil-
ity
Geometric
mean
Standard
weight
Original
weight
Capacity 1 3 5 3 7 3.15 0.50 0.270
Coverage 0.33 1 3 3 5 1.1 0.17 0.0950
Service level 0.20 0.33 1 0.33 5 0.64 0.10 0.0560
Service qual-
ity 0.33 0.33 3 1 3 1 0.16 0.0890
Expandability 0.14 0.20 0.20 0.33 1 0.29 0.046 0.0264
Total 6.18 1 0.54
Table 7. The binary comparison of construction and installation sub criteria
Row
Enough space to
establish equip-
ment
round
strength
Power
supply Costs
Geometric
mean
Standard
weight
Original
weight
Enough space
to establish
equipment
1 0.33 0.20 0.20 0.33 0.068 0.005
ground
strength 3 1 0.20 0.33 0.20 0.041 0.003
Power supply 5 5 1 33 1.70 0.35 0.0245
Costs 5 3 3 1 2.6 0.54 0.038
total 4.84 1 0.07
Table 8. The binary comparison of legal and ownership sub criteria

Optimization of Facility Location-Allocation Model for Base Tranceiver Station …
[14]
Row
The possibil-
ity of con-
tracting
The lack of
legal and
ownership
problems
Ownership
Costs
Geometric
mean
Standard
weight
Original
weight
The possibility of con-
tracting 1 1 0.2 0.58 0.14 0.014
The lack of legal and
ownership problems 1 1 0.2 0.58 0.14 0.014
Ownership Costs 5 5 1 2.92 0.72 0.072
total 4.09 1 0.1
Table 9. The binary comparison of urban criteria
Row sensitive
points Traffic
Communication
paths
Geometric
mean
Standard
weight
Original
weight
sensitive points 1 7 5 3.27 0.73 0.21
Traffic 0.14 1 0.33 0.36 0.08 0.024
Communication
paths 0.20 3 1 0.84 0.19 0.056
total 4.50 1 0.29
Table 10. Metric coordinates of proposed points
No. ID X Y No. ID X Y
1 KW1 5,240,519.15 4,081,944.01 16 SR16 5,247,710.45 4,077,103.85
2 RW2 5,241,583.33 4,080,498.56 17 SB17 5,244,593.92 4,077,418.97
3 SW3 5,242,342.68 4,080,591.17 18 NB18 5,245,705.02 4,079,192.63
4 SW4 5,243,660.31 4,080,072.58 19 NK19 5,246,036.94 4,081,447.28
5 RW5 5,242,416.77 4,079,749.79 20 NK20 5,245,431.75 4,080,824.28
6 RM6 5,243,258.14 4,078,876.00 21 NV21 5,245,208.55 4,080,274.92
7 KE7 5,249,702.11 4,078,502.83 22 MS22 5,244,799.85 4,078,777.89

Dr. Farzad Amiri.
[15]
8 NK8 5,249,425.27 4,080,094.57 23 NV23 5,247,424.17 4,079,452.12
9 NK9 5,249,397.49 4,080,953.67 24 NP24 5,247,062.90 4,080,636.63
10 MS10 5,248,190.45 4,077,636.32 25 NS25 5,242,396.60 4,081,677.71
11 MP11 5,247,328.44 4,077,693.47 26 SV26 5,244,769.41 4,079,702.89
12 MN12 5,247,398.82 4,079,011.36 27 MJ27 5,243,865.72 4,078,200.67
13 NJ13 5,246,991.62 4,079,807.89 28 EV28 5,248,126.82 4,079,687.03
14 MB14 5,245,807.96 4,078,511.25 29 SE29 4,077,868.01 5,251,185.02
15 SR15 5,245,184.08 4,077,129.39 30 NE30 4,077,563.50 5,245,964.59
Figure 1. Integration of sub criteria and determination of priority criteria for construction and installation
Figure 2. Integration of sub criteria and determination of priority criteria for construction and installation

Optimization of Facility Location-Allocation Model for Base Tranceiver Station …
[16]
Figure 3. Identification of legal and ownership priorities
Figure 4. Determination of urban priorities
Figure 5. The effects of sub-criteria
00/05
0/10/15
0/20/25
0/3
Effective percentage

Dr. Farzad Amiri.
[17]
Figure 6. Determination of the proposed GIS coordinates to apply to the GA
Figure 7. Location of BTS antennas in the north of Kermanshah at present
Figure 8. Important parameters
0
0/05
0/1
0/15
0/2
0/25
0/3
Capacity Sensitive points Total cost Quality Coverage

Optimization of Facility Location-Allocation Model for Base Tranceiver Station …
[18]
Figure 9. Accidental dispersion of users
Figure 10. Random dispersion of users
Figure 11. The number of active antenna using random selection

Dr. Farzad Amiri.
[19]
Figure 12. Reduced final cost obtained from repetition of the algorithm in random selection
Figure 13. Active antenna number using tournament selection
Optimization of Facility Location-Allocation Model for Base Tranceiver Station …
[20]
Figure 14. The amount of final cost reduced by the repetition of the algorithm through tournament selection
Figure 15. Active antenna number using roulette wheel selection method

Dr. Farzad Amiri.
[21]
Figure 16. The amount of final cost reduced by the repetition of the algorithm through roulette wheel selection
method
Figure 17. The best location of antennas according to the optimal output of the GA