Optimization of Diverter car belt conveyor supporting structure to Reduce dead weight
12
Optimization of Diverter car belt conveyor supporting structure to Reduce dead weight Dixit M.Patel 1 , Mr. H. J. Patel 2 , Dr. H. N. Shah 3 1 Department of Mechanical Engineering, Master of Engineering In CAD/CAM in Sardar Patel Institute of Technology, Piludra, Mehsana, Gujarat, India. ([email protected] ) 2 Assistance Prof. Department of Mechanical Engineering, Sardar Patel Institute of Technology, Piludra, Merchant Education Campus, Mehsana – 384380, Gujarat, India. ([email protected]) 3 Principal,Sardar Patel Institute of Technology, Piludra, Merchant Education Campus, Mehsana – 384380, Gujarat, India.([email protected]) Abstract- Over the years a lot of work has done and is still continuing with great effort to save weight and cost of applications. The current trend is to provide weight/cost effective products which meet the stringent requirements. The belt conveyor is an endless belt moving over two end pulleys at fixed positions and used for transporting material horizontally or at an incline up or down. Allow quick and efficient transportation for a wide variety of materials. Diverter car belt conveyors are used to transfer concrete horizontally and limited distance vertically. They are particularly useful in areas such as dam slabs where it is difficulty to put concrete at mid side of the river at specific point, bridge, tunnels where space is limited and where it is difficulty to put concrete at specific point, Bridge grader making. A 25 meter cantilever belt conveyor is used in the diverter car belt conveyor system.The supporting the belt conveyor system is called belt conveyor supporting structure. Structure that supports and maintains the alignments of the idlers and pulleys and support the driving machinery. Goal of the project is to study existing conveyor system and optimize dead weight, structures optimize to minimize the overall weight of assembly and material saving can withstand such loads. The design of supporting structure can be make safe. With the help of SOLIDWORK for modeling and ANSYS 14.5 for analysis we analyzed the whole system. Key words- SOLIDWORK 2012, ANSYS 14.5, Weight reduction, Optimized design, material handling systems. I. INTRODUCTION Conveyor is used in many industries to transport goods and materials between stages of a process. Using conveyor systems is a good way to reduce the risks of musculoskeletal injury in tasks 1
-
Upload
independent -
Category
Documents
-
view
2 -
download
0
Transcript of Optimization of Diverter car belt conveyor supporting structure to Reduce dead weight
Optimization of Diverter car belt conveyorsupporting structure to Reduce dead weight
Dixit M.Patel1, Mr. H. J. Patel2, Dr. H. N. Shah3
1 Department of Mechanical Engineering, Master of Engineering In CAD/CAM in Sardar Patel Instituteof Technology, Piludra, Mehsana, Gujarat, India. ([email protected])
2 Assistance Prof. Department of Mechanical Engineering, Sardar Patel Institute of Technology,Piludra, Merchant Education Campus, Mehsana – 384380, Gujarat, India. ([email protected])
3Principal,Sardar Patel Institute of Technology, Piludra, Merchant Education Campus, Mehsana –384380, Gujarat, India.([email protected])
Abstract- Over the years a lot of work has done and is stillcontinuing with great effort to save weight and cost ofapplications. The current trend is to provide weight/cost effectiveproducts which meet the stringent requirements. The belt conveyor isan endless belt moving over two end pulleys at fixed positions andused for transporting material horizontally or at an incline up ordown. Allow quick and efficient transportation for a wide variety ofmaterials. Diverter car belt conveyors are used to transfer concretehorizontally and limited distance vertically. They are particularlyuseful in areas such as dam slabs where it is difficulty to putconcrete at mid side of the river at specific point, bridge, tunnelswhere space is limited and where it is difficulty to put concrete atspecific point, Bridge grader making. A 25 meter cantilever beltconveyor is used in the diverter car belt conveyor system.Thesupporting the belt conveyor system is called belt conveyor supportingstructure. Structure that supports and maintains the alignments of theidlers and pulleys and support the driving machinery. Goal of theproject is to study existing conveyor system and optimize deadweight, structures optimize to minimize the overall weight ofassembly and material saving can withstand such loads. The design ofsupporting structure can be make safe. With the help of SOLIDWORKfor modeling and ANSYS 14.5 for analysis we analyzed the wholesystem.
Key words- SOLIDWORK 2012, ANSYS 14.5, Weight reduction, Optimizeddesign, material handling systems.
I. INTRODUCTIONConveyor is used in many industries to transport goods andmaterials between stages of a process. Using conveyor systemsis a good way to reduce the risks of musculoskeletal injury in tasks
1
or processes that involve manual handling, as they reduce the needfor repetitive lifting and carrying. Conveyors are a powerfulmaterial handling tool. They offer the opportunity to boostproductivity, reduce product handling and damage, and minimizelabour content in a manufacturing or distribution facility.Conveyors are generally classified as either Unit LoadConveyors that are designed to handle specific uniform unitssuch as cartons or pallets, and Process Conveyors that are designedto handle loose product such as sand, gravel, coffee,cookies, etc. which are fed to machinery for furtheroperations or mixing. It is quite common for manufacturing plantsto combine both Process and Unit Load conveyors in its operations.Roller conveyor is not subjected to complex state of loading stillwe found that it is designed with higher factor of safety. If weredesigned critical parts eg. Roller, Shaft, Bearing& Frame etc.then it is possible to minimize the overall weight of theassembly. Powered belt conveyors are considerable long (9000meter to 10000 meter) as compared to roller conveyor. So wecan achieve considerable amount of material saving if we applyabove study related to roller conveyor to this belt conveyor‘Finite Element Method’ is a mathematical technique used tocarry out the stress analysis. In this method the solid model ofthe component is subdivided into smaller elements. Constraintsand loads are applied to the model at specified locations.Various properties are assigned to the model like material,thickness, etc. The model is then analysed in FE solver. Theresults are plotted in the post processor. The scalar plotshows us the stresses and deformations over entire span.
II. LITERATURE REVIEWStructural optimization using computational tools has become a majorresearch field in recent years. Methods commonly used in structuralanalysis and optimization may demand considerable computationalcost, depending on the problem complexity. Among these varioustechniques of DOE may be combined with classic analysis, to reducethe computational effort without affecting the final solutionquality. Ajaykumar Menon et al.(2005) proposed an automation processin MATLAB that incorporates a response surface approximating toolcalled MQR. The results obtained from the proposed method werecompared with ANSYS Design Xplorer goaldriven optimization which wasbased on DOE and ANSYS First order optimization technique [6]. D.M.Chauhan et al. (2006) Optimized weight of the HMT (HydraulicModular Trailer) to have higher pay load capacity. Frame wasoptimized using design optimization module available in ANSYS using
2
first order optimization method. They have concluded that frame wasoptimized and feasible design was obtained with 52% reduction inmass. This reduction in mass of the frame increases the payloadcapacity by 4.900 tones approximately. During optimization of frame,it was found that web thicknesses value should be kept more than theflange thicknesses value for side long member [8]. Wen-Hsien Hsu etal. (2009) has been used a FEM-based Taguchi method to investigatethe effects of various factors to find the robust design of the bodycage. The FEM-based Taguchi methods have effectively decreased thetime and efforts required for evaluating the design variables ofimplants and had fairly assessed the contribution of each designvariable [1]. Bappa Acherjee et al.(2012) carried out a systematicinvestigation on laser transmission contour welding process usingfinite element analysis (FEA) and design of experiments (DOE)techniques. A three dimensional thermal model was developed tosimulate the laser transmission contour welding process with amoving heat source. Design of experiments was employed to plan theexperiments and to develop mathematical models based on simulationresults [2].
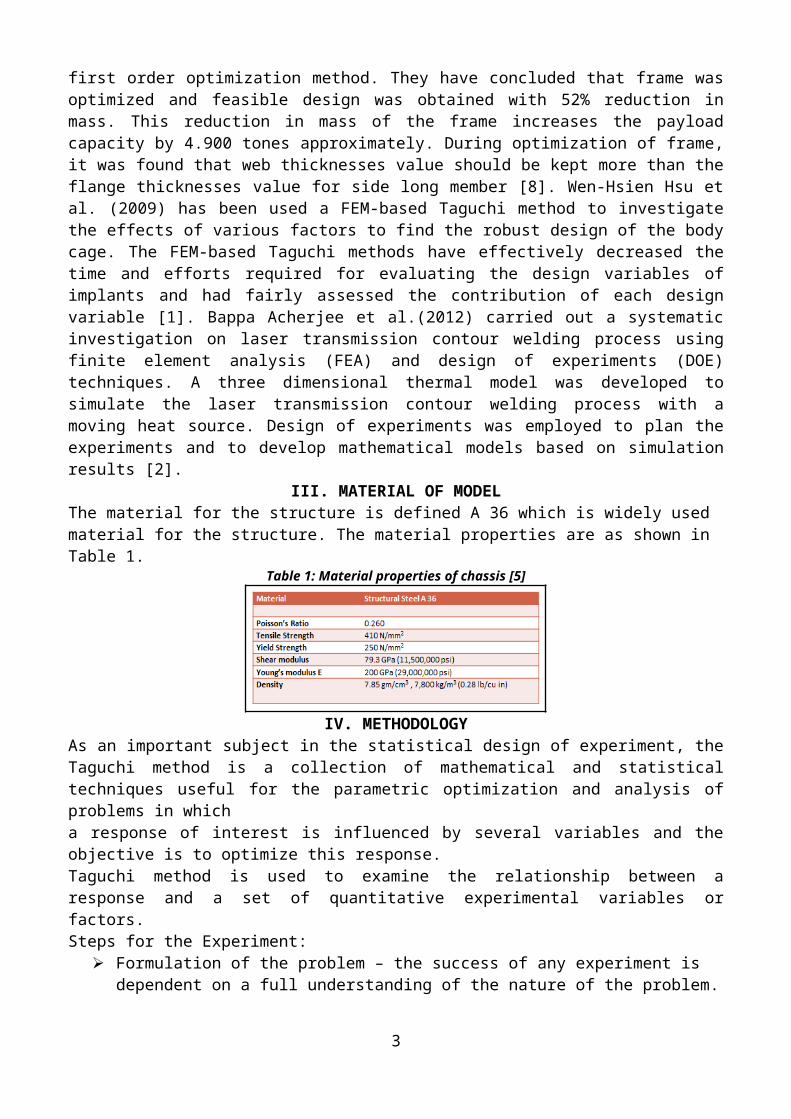
III. MATERIAL OF MODELThe material for the structure is defined A 36 which is widely used material for the structure. The material properties are as shown in Table 1.
Table 1: Material properties of chassis [5]
IV. METHODOLOGYAs an important subject in the statistical design of experiment, theTaguchi method is a collection of mathematical and statisticaltechniques useful for the parametric optimization and analysis ofproblems in whicha response of interest is influenced by several variables and theobjective is to optimize this response. Taguchi method is used to examine the relationship between aresponse and a set of quantitative experimental variables orfactors.Steps for the Experiment:
Formulation of the problem – the success of any experiment is dependent on a full understanding of the nature of the problem.
3
Selection of the output performance characteristics most relevant to the problem.
Selection of parameters. Selection of factor levels. Design of an appropriate Orthogonal Array (OA). To Perform FEA with appropriate set of parameters. Statistical analysis and interpretation of experimental
results. Modeling and FEA with optimum parameter set for validation
Flow chart of experiment is given in Figure 1.
Figure 1: Flow chart of experiment [7]
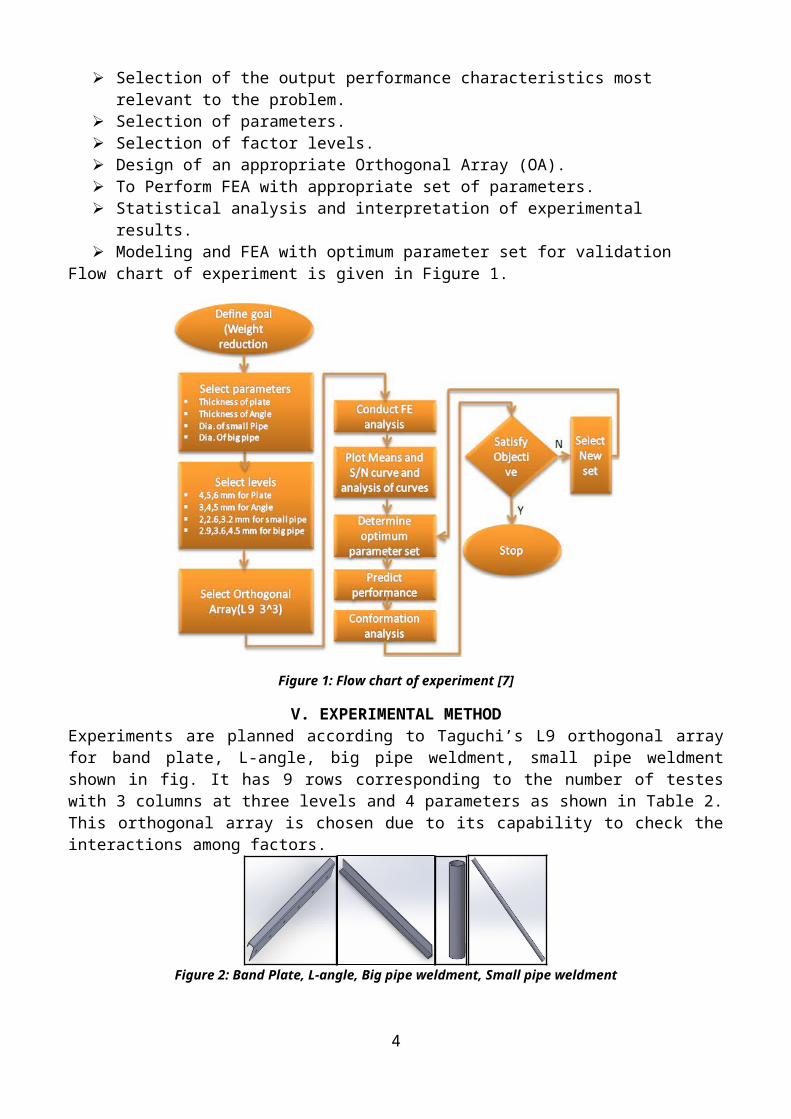
V. EXPERIMENTAL METHODExperiments are planned according to Taguchi’s L9 orthogonal arrayfor band plate, L-angle, big pipe weldment, small pipe weldmentshown in fig. It has 9 rows corresponding to the number of testeswith 3 columns at three levels and 4 parameters as shown in Table 2.This orthogonal array is chosen due to its capability to check theinteractions among factors.
Figure 2: Band Plate, L-angle, Big pipe weldment, Small pipe weldment
4
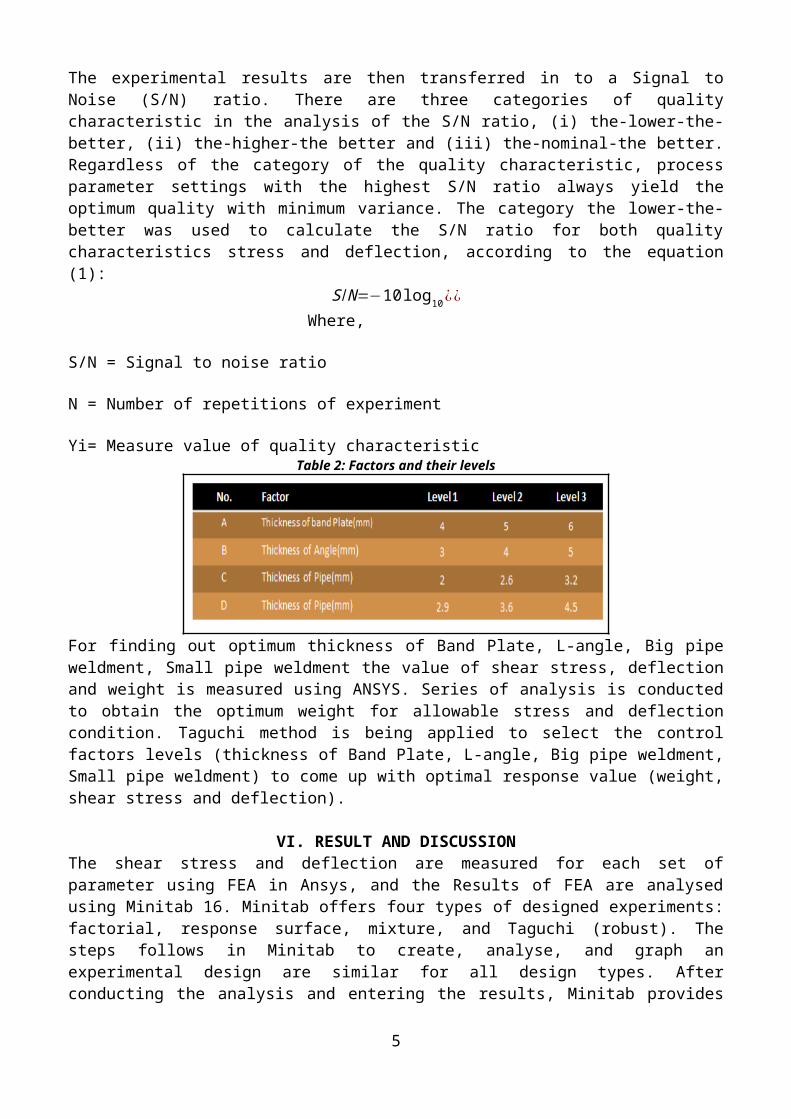
The experimental results are then transferred in to a Signal toNoise (S/N) ratio. There are three categories of qualitycharacteristic in the analysis of the S/N ratio, (i) the-lower-the-better, (ii) the-higher-the better and (iii) the-nominal-the better.Regardless of the category of the quality characteristic, processparameter settings with the highest S/N ratio always yield theoptimum quality with minimum variance. The category the lower-the-better was used to calculate the S/N ratio for both qualitycharacteristics stress and deflection, according to the equation(1):
S /N=−10log10¿¿
Where, S/N = Signal to noise ratio N = Number of repetitions of experiment Yi= Measure value of quality characteristic
Table 2: Factors and their levels
For finding out optimum thickness of Band Plate, L-angle, Big pipeweldment, Small pipe weldment the value of shear stress, deflectionand weight is measured using ANSYS. Series of analysis is conductedto obtain the optimum weight for allowable stress and deflectioncondition. Taguchi method is being applied to select the controlfactors levels (thickness of Band Plate, L-angle, Big pipe weldment,Small pipe weldment) to come up with optimal response value (weight,shear stress and deflection).
VI. RESULT AND DISCUSSIONThe shear stress and deflection are measured for each set ofparameter using FEA in Ansys, and the Results of FEA are analysedusing Minitab 16. Minitab offers four types of designed experiments:factorial, response surface, mixture, and Taguchi (robust). Thesteps follows in Minitab to create, analyse, and graph anexperimental design are similar for all design types. Afterconducting the analysis and entering the results, Minitab provides
5
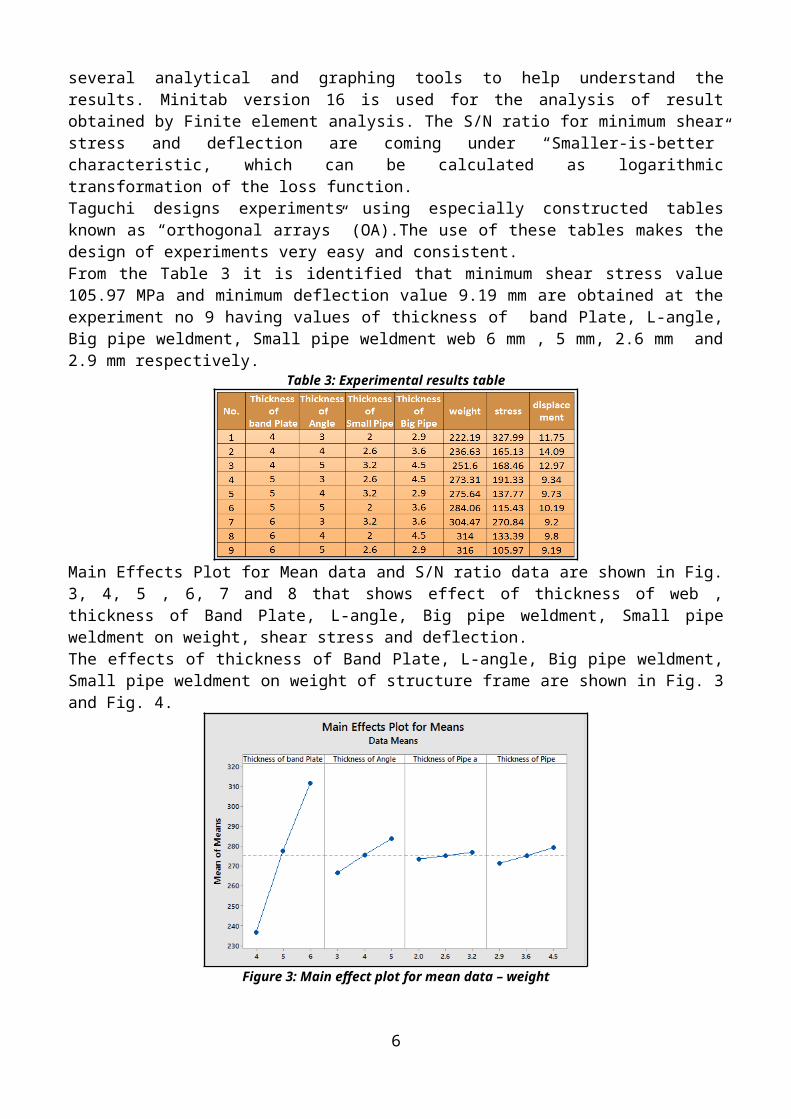
several analytical and graphing tools to help understand theresults. Minitab version 16 is used for the analysis of resultobtained by Finite element analysis. The S/N ratio for minimum shearstress and deflection are coming under “Smaller-is-better”characteristic, which can be calculated as logarithmictransformation of the loss function. Taguchi designs experiments using especially constructed tablesknown as “orthogonal arrays” (OA).The use of these tables makes thedesign of experiments very easy and consistent.From the Table 3 it is identified that minimum shear stress value105.97 MPa and minimum deflection value 9.19 mm are obtained at theexperiment no 9 having values of thickness of band Plate, L-angle,Big pipe weldment, Small pipe weldment web 6 mm , 5 mm, 2.6 mm and2.9 mm respectively.
Table 3: Experimental results table
Main Effects Plot for Mean data and S/N ratio data are shown in Fig.3, 4, 5 , 6, 7 and 8 that shows effect of thickness of web ,thickness of Band Plate, L-angle, Big pipe weldment, Small pipeweldment on weight, shear stress and deflection.The effects of thickness of Band Plate, L-angle, Big pipe weldment,Small pipe weldment on weight of structure frame are shown in Fig. 3and Fig. 4.
Figure 3: Main effect plot for mean data – weight
6
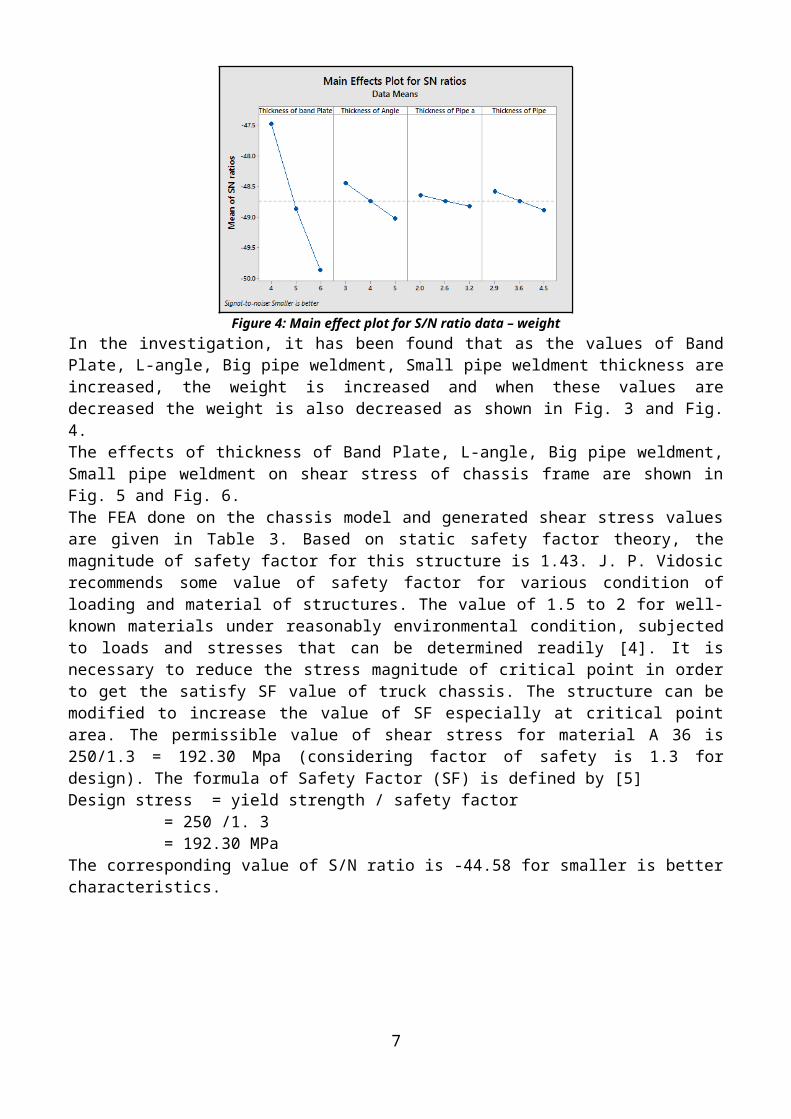
Figure 4: Main effect plot for S/N ratio data – weightIn the investigation, it has been found that as the values of BandPlate, L-angle, Big pipe weldment, Small pipe weldment thickness areincreased, the weight is increased and when these values aredecreased the weight is also decreased as shown in Fig. 3 and Fig.4.The effects of thickness of Band Plate, L-angle, Big pipe weldment,Small pipe weldment on shear stress of chassis frame are shown inFig. 5 and Fig. 6.The FEA done on the chassis model and generated shear stress valuesare given in Table 3. Based on static safety factor theory, themagnitude of safety factor for this structure is 1.43. J. P. Vidosicrecommends some value of safety factor for various condition ofloading and material of structures. The value of 1.5 to 2 for well-known materials under reasonably environmental condition, subjectedto loads and stresses that can be determined readily [4]. It isnecessary to reduce the stress magnitude of critical point in orderto get the satisfy SF value of truck chassis. The structure can bemodified to increase the value of SF especially at critical pointarea. The permissible value of shear stress for material A 36 is250/1.3 = 192.30 Mpa (considering factor of safety is 1.3 fordesign). The formula of Safety Factor (SF) is defined by [5]Design stress = yield strength / safety factor
= 250 /1. 3= 192.30 MPa
The corresponding value of S/N ratio is -44.58 for smaller is bettercharacteristics.
7
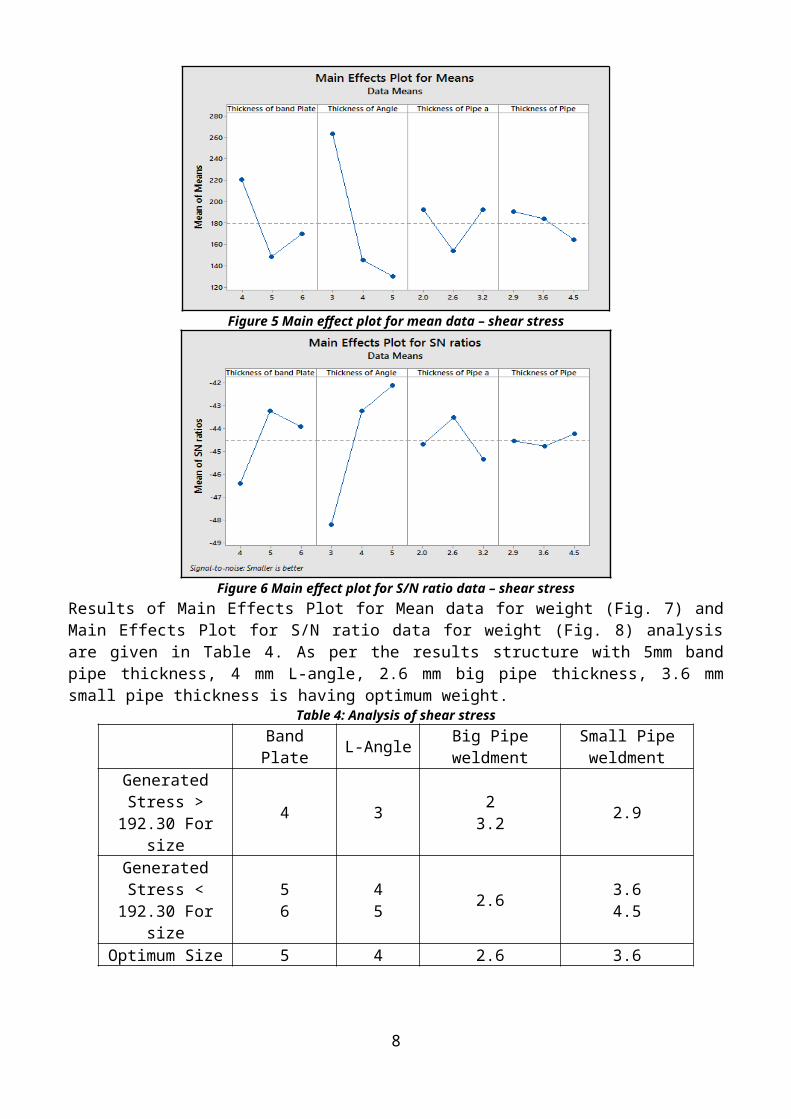
Figure 5 Main effect plot for mean data – shear stress
Figure 6 Main effect plot for S/N ratio data – shear stressResults of Main Effects Plot for Mean data for weight (Fig. 7) andMain Effects Plot for S/N ratio data for weight (Fig. 8) analysisare given in Table 4. As per the results structure with 5mm bandpipe thickness, 4 mm L-angle, 2.6 mm big pipe thickness, 3.6 mmsmall pipe thickness is having optimum weight.
Table 4: Analysis of shear stressBandPlate L-Angle Big Pipe
weldmentSmall Pipeweldment
GeneratedStress >192.30 For
size
4 3 23.2 2.9
GeneratedStress <192.30 For
size
56
45 2.6 3.6
4.5
Optimum Size 5 4 2.6 3.6
8
The effects of thickness of band plate, L-angle, Big pipe weldment,small pipe weldment on deflection of structure frame are shown inFig. 7 and Fig. 8.
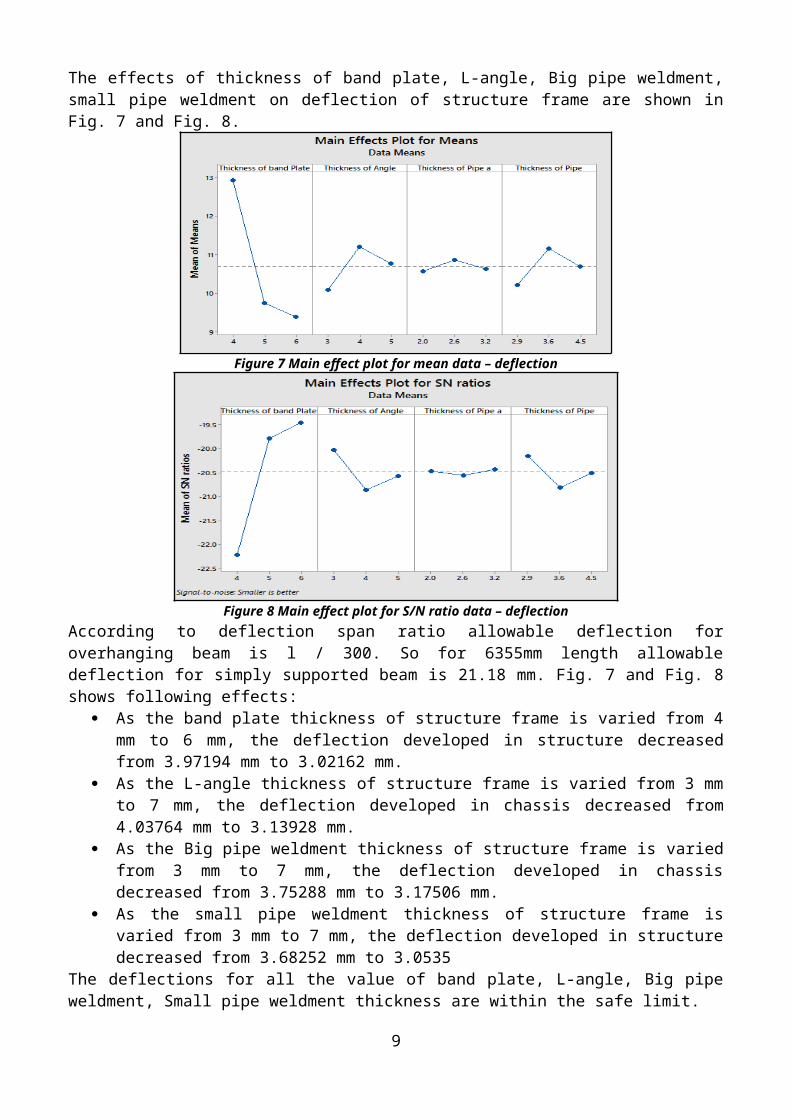
Figure 7 Main effect plot for mean data – deflection
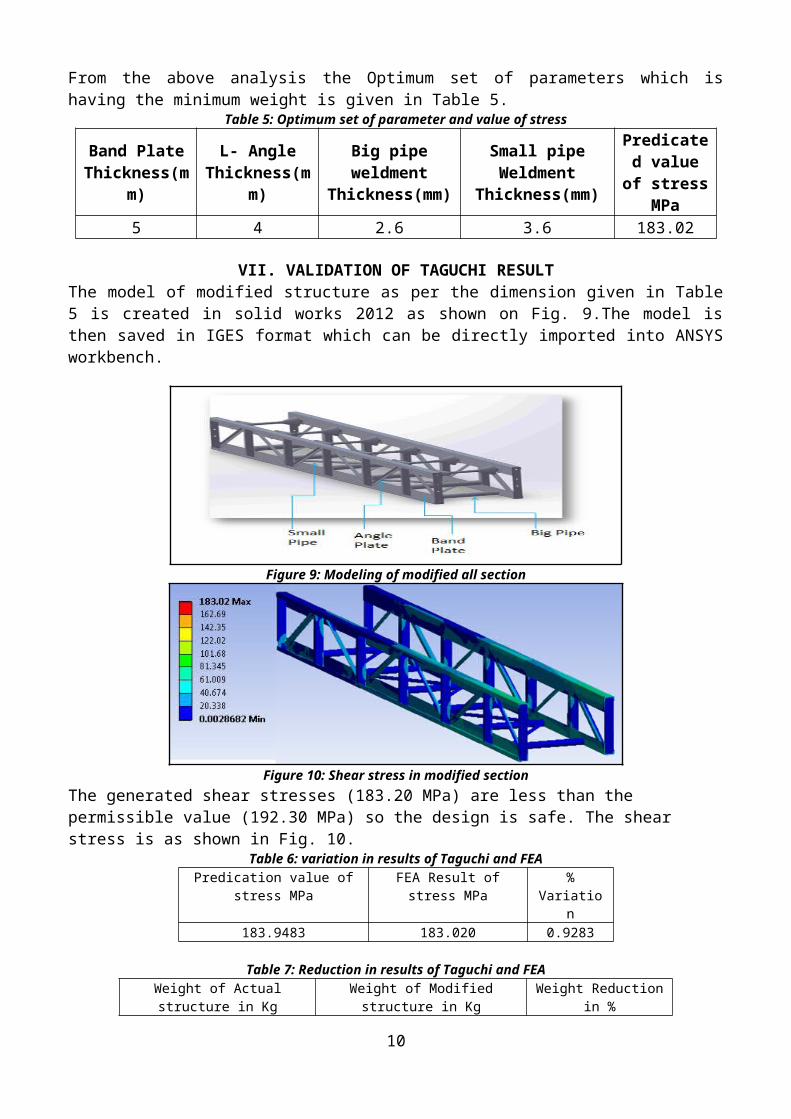
Figure 8 Main effect plot for S/N ratio data – deflectionAccording to deflection span ratio allowable deflection foroverhanging beam is l / 300. So for 6355mm length allowabledeflection for simply supported beam is 21.18 mm. Fig. 7 and Fig. 8shows following effects:
As the band plate thickness of structure frame is varied from 4mm to 6 mm, the deflection developed in structure decreasedfrom 3.97194 mm to 3.02162 mm.
As the L-angle thickness of structure frame is varied from 3 mmto 7 mm, the deflection developed in chassis decreased from4.03764 mm to 3.13928 mm.
As the Big pipe weldment thickness of structure frame is variedfrom 3 mm to 7 mm, the deflection developed in chassisdecreased from 3.75288 mm to 3.17506 mm.
As the small pipe weldment thickness of structure frame isvaried from 3 mm to 7 mm, the deflection developed in structuredecreased from 3.68252 mm to 3.0535
The deflections for all the value of band plate, L-angle, Big pipeweldment, Small pipe weldment thickness are within the safe limit.
9
From the above analysis the Optimum set of parameters which ishaving the minimum weight is given in Table 5.
Table 5: Optimum set of parameter and value of stress
Band PlateThickness(m
m)
L- AngleThickness(m
m)
Big pipeweldment
Thickness(mm)
Small pipeWeldment
Thickness(mm)
Predicated value
of stressMPa
5 4 2.6 3.6 183.02
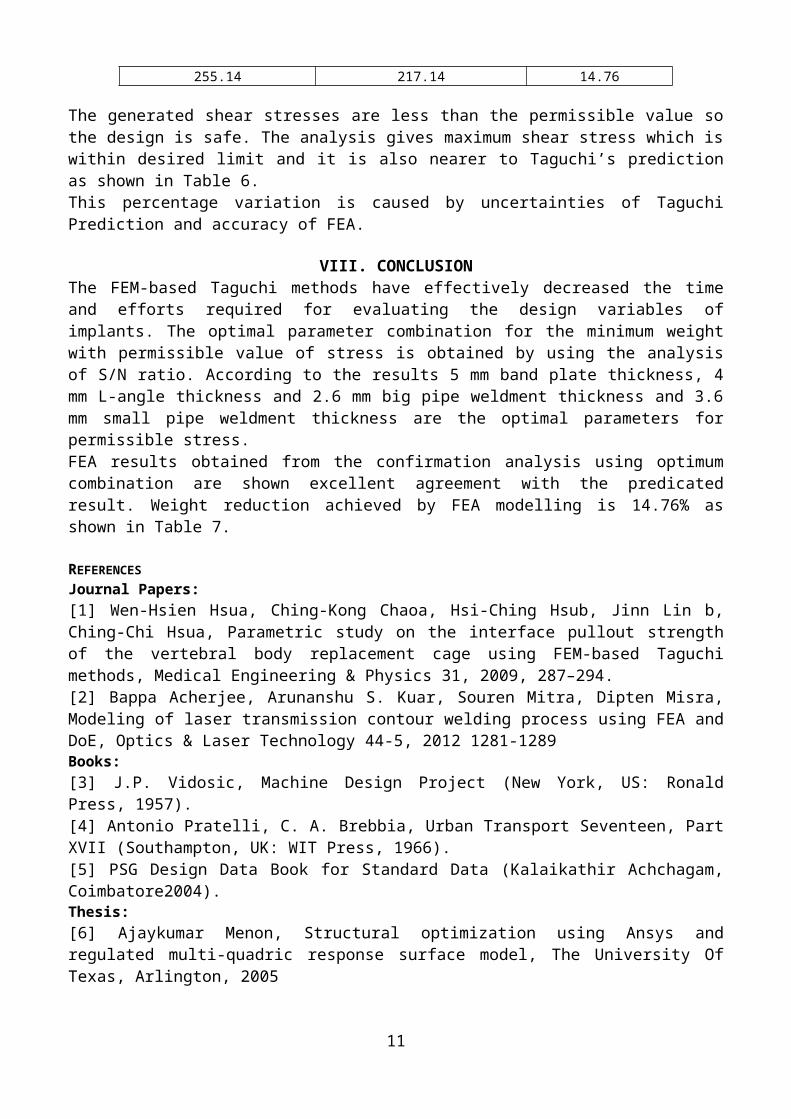
VII. VALIDATION OF TAGUCHI RESULTThe model of modified structure as per the dimension given in Table5 is created in solid works 2012 as shown on Fig. 9.The model isthen saved in IGES format which can be directly imported into ANSYSworkbench.
Figure 9: Modeling of modified all section
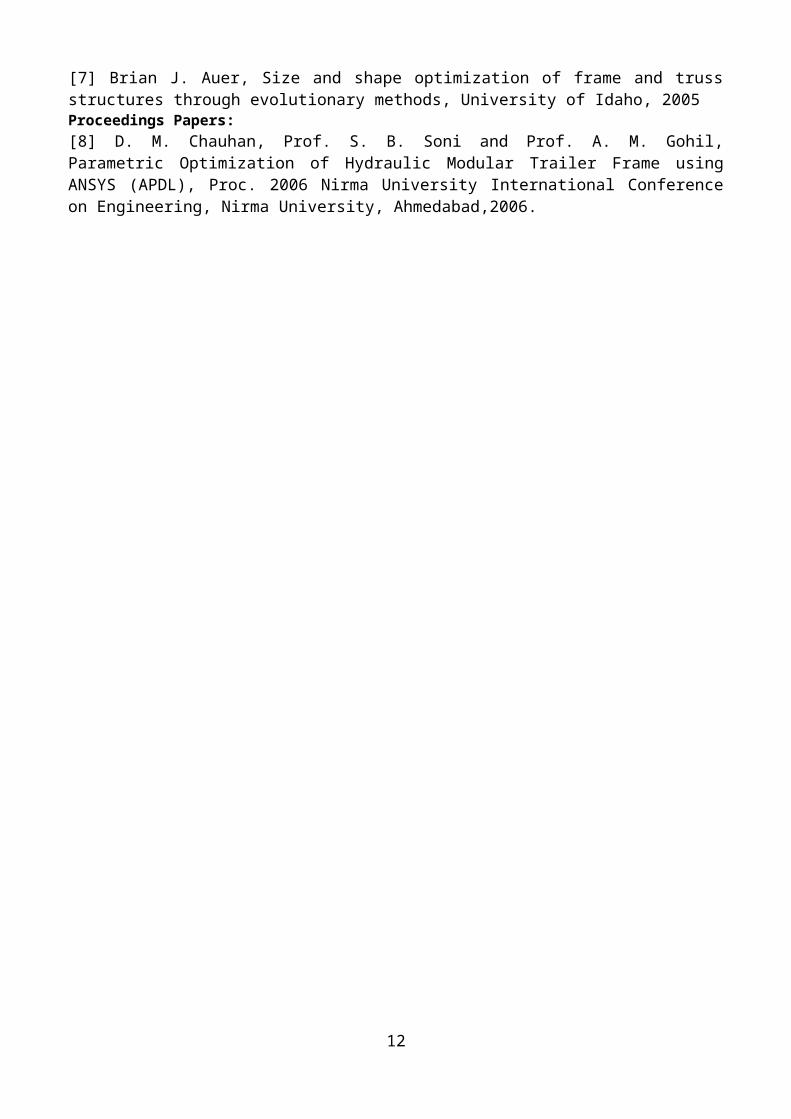
Figure 10: Shear stress in modified sectionThe generated shear stresses (183.20 MPa) are less than the permissible value (192.30 MPa) so the design is safe. The shear stress is as shown in Fig. 10.
Table 6: variation in results of Taguchi and FEAPredication value of
stress MPaFEA Result ofstress MPa
%Variatio
n183.9483 183.020 0.9283
Table 7: Reduction in results of Taguchi and FEAWeight of Actualstructure in Kg
Weight of Modifiedstructure in Kg
Weight Reductionin %
10
255.14 217.14 14.76
The generated shear stresses are less than the permissible value sothe design is safe. The analysis gives maximum shear stress which iswithin desired limit and it is also nearer to Taguchi’s predictionas shown in Table 6. This percentage variation is caused by uncertainties of TaguchiPrediction and accuracy of FEA.
VIII. CONCLUSIONThe FEM-based Taguchi methods have effectively decreased the timeand efforts required for evaluating the design variables ofimplants. The optimal parameter combination for the minimum weightwith permissible value of stress is obtained by using the analysisof S/N ratio. According to the results 5 mm band plate thickness, 4mm L-angle thickness and 2.6 mm big pipe weldment thickness and 3.6mm small pipe weldment thickness are the optimal parameters forpermissible stress.FEA results obtained from the confirmation analysis using optimumcombination are shown excellent agreement with the predicatedresult. Weight reduction achieved by FEA modelling is 14.76% asshown in Table 7.
REFERENCESJournal Papers:[1] Wen-Hsien Hsua, Ching-Kong Chaoa, Hsi-Ching Hsub, Jinn Lin b,Ching-Chi Hsua, Parametric study on the interface pullout strengthof the vertebral body replacement cage using FEM-based Taguchimethods, Medical Engineering & Physics 31, 2009, 287–294.[2] Bappa Acherjee, Arunanshu S. Kuar, Souren Mitra, Dipten Misra,Modeling of laser transmission contour welding process using FEA andDoE, Optics & Laser Technology 44-5, 2012 1281-1289Books:[3] J.P. Vidosic, Machine Design Project (New York, US: RonaldPress, 1957).[4] Antonio Pratelli, C. A. Brebbia, Urban Transport Seventeen, PartXVII (Southampton, UK: WIT Press, 1966).[5] PSG Design Data Book for Standard Data (Kalaikathir Achchagam,Coimbatore2004).Thesis:[6] Ajaykumar Menon, Structural optimization using Ansys andregulated multi-quadric response surface model, The University OfTexas, Arlington, 2005
11
[7] Brian J. Auer, Size and shape optimization of frame and trussstructures through evolutionary methods, University of Idaho, 2005Proceedings Papers:[8] D. M. Chauhan, Prof. S. B. Soni and Prof. A. M. Gohil,Parametric Optimization of Hydraulic Modular Trailer Frame usingANSYS (APDL), Proc. 2006 Nirma University International Conferenceon Engineering, Nirma University, Ahmedabad,2006.
12