Opportunities for Urban Innovation in India & the global South
51
Opportunities for Urban Innovation in India & the global South iihs 14 th Winelands Conference: Innovation for an Urban Age Stellenbosch 2 April 2014 Aromar Revi [email protected] @AromarRevi www.iihs.co.in
Transcript of Opportunities for Urban Innovation in India & the global South

Opportunities for Urban Innovation in India & the global South iihs
14thWinelands Conference: Innovation for an Urban AgeStellenbosch 2 April 2014
Aromar [email protected] @AromarRevi
www.iihs.co.in

The Global Context: 2000-2100

There is Only One Earth and its in a small corner of
the known Universe (Gagarin, Armstrong et. al. 1960s)

Present consumption requires ~2.0 worlds
21st century Population growth needs 1.5+ worlds
Ending poverty at present throughput ~2.0 worlds
Availableonly One
World
The Challenge of the 21st century Sustainability Transition
The Sustainability traverse will be largely played out in Chinese, Indian
& African cities

Design for
Resilience
Reality is more complex: punctuated by multiple Shocks
SARS
Currency crisis
Oil peak
Asian growth
El Nino
FloodDrought
Desertification
We need to design our economic and urban systems for both performance & resilience
Wall St. crash

Himalayan Glacial melt (1921-2009)

Urbanisation is not just a ‘Megatrend’
it’s a ‘Gigatrend’
a millennial transformation of human
culture, society, economy, polity &
planetary systems

The world (of large cities) in 1900
Pop:1.5 billion Urban share:13% Gross World product:~$2 trillion Urban share:~30%
Sources: UN (2011) ; Revi, A, Satterthwaithe, D , et. al. (2014) forthcoming; De Long (1998)

The world (of large cities) in 1950
Pop:2.5 billion Urban share:29% Gross World product:~$7trillion Urban share:~45%
Sources: UN (2011) ; Revi, A,, Satterthwaithe, D , et. al. (2014) forthcoming; De Long (1998)

The world (of large cities) in 2000
Pop:6 billion Urban share: 47% Gross World product:~$65trillion Urban share:~68%
Sources: UN (2011) ; Revi, A, Satterthwaithe, D , et. al. (2014) forthcoming; De Long (1998)

An (urban) world in 2013*
Pop: 7 billion Urban share:~50% Gross World product:~$70 trillion Urban share:~70%
Sources: NASA, (2012), UN (2011 ; Satterthwaithe, D , Revi, A, et. al. (2014) forthcoming; De Long (1998)Sources: UN (2011) ; Revi, A, Satterthwaithe, D , et. al. (2014) forthcoming; De Long (1998)

The world (of large cities) in 2025
Pop: 8 billion Urban share: 58% Gross World product:~$85trillion Urban share:~75%
Sources: UN (2011) ; Revi, A, Satterthwaithe, D , et. al. (2014) forthcoming; De Long (1998)

The Global Urban transformation (1900-2025)
Year Global population (billions)
Urban share (%)
Gross World Product (2012 $
tr)
Urban share (%)
1900 1.5 billion ~13% $ 2 trillion ~30%
1950 2.5 billion ~29% $ 7 trillion ~45%
2000 6 billion ~47% $ 65 trillion ~68%
2014 7 billion ~50% $ 71 trillion ~70%
2025 8 billion ~58% $ 80 trillion ~75%
Sources: UN (2011) ; Revi, A, Satterthwaithe, D , et. al. (2014); De Long (1998)

Urban transformation: Shanghai (1987)
14
Photo: REUTERS

Urban transformation: Shanghai (2012)
15
Photo: REUTERS

SDSN Proposal for 10 SDGs
1. End extreme poverty including hunger
2. Achieve development within planetary boundaries
3. Ensure effective learning for all children and youth for life and
livelihood
4. Achieve gender equality, social inclusion, and human rights for
all
5. Achieve health and wellbeing at all ages
6. Improve agriculture systems and raise rural prosperity
7. Empower inclusive, productive, and resilient cities
8. Curb human-induced climate change and ensure sustainable
energy
9. Secure ecosystem services and biodiversity, and ensure good
management of water and other natural resources
10. Transform governance for sustainable development

SDSN: Proposed Urban SDG (2015-2030)
Make all cities socially inclusive, economically productive, environmentally sustainable, secure, and resilient to climate change and other risks.
Develop participatory, accountable, and effective city* governance to support rapid and equitable urban transformation.*and metropolitan region
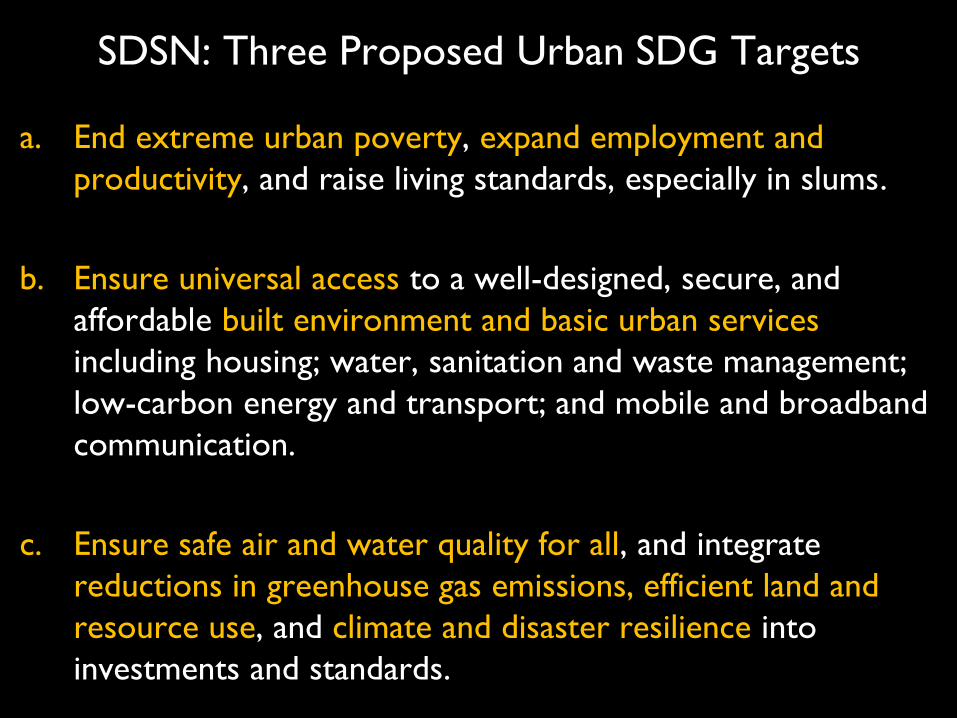
SDSN: Three Proposed Urban SDG Targets
a. End extreme urban poverty, expand employment and
productivity, and raise living standards, especially in slums.
b. Ensure universal access to a well-designed, secure, and
affordable built environment and basic urban services
including housing; water, sanitation and waste management;
low-carbon energy and transport; and mobile and broadband
communication.
c. Ensure safe air and water quality for all, and integrate
reductions in greenhouse gas emissions, efficient land and
resource use, and climate and disaster resilience into
investments and standards.

Urban SDG Target A - Eliminate extreme urban poverty, expand employment & productivity, & raise living standards, especially
in slums & informal settlements
0%
20%
40%
60%
80%
100%
Populationwith incomes
above nationalpoverty line
Population notliving in slumsand informalsettlements
WorkforceParticipation
Rate
FemaleWorkforce
ParticipationGap
Gender WageDisparity
HouseholdsavailaingBankingServices
BANGALORE
0%
20%
40%
60%
80%
100%
Population withincomes above
nationalpoverty line
Population notliving in slumsand informalsettlements
WorkforceParticipation
Rate
FemaleWorkforce
ParticipationGap (approx.)
Gender WageDisparity(approx.)
HouseholdsavailaingBankingServices(approx.)
NEW YORK CITY
NOTE : Indicative #urbanSDG set (work in progress, do not cite)

Urban SDG Target B - Ensure universal access to a secure and affordable built environment & basic services: housing, water, sanitation & waste management; low-carbon energy & transportation; & communication.
0%
20%
40%
60%
80%
100%
Households withaccess to safe,
sufficientdrinking water
Householdsserved by safe
sanitationservices
Households andbusinesses with
access toaffordable and
reliable low-carbon energy
Households withaccess to cell
phones
Households withaccess to internet
Population livingin adequate
housingconditions
0%
20%
40%
60%
80%
100%
Households withaccess to safe,
sufficientdrinking water
Householdsserved by safe
sanitationservices
Households andbusinesses with
access toaffordable and
reliable low-carbon energy…
Households withaccess to cell
phones(approx.)
Households withaccess to internet
Population livingin adequate
housingconditions(approx.)
BANGALORE NEW YORK CITY
NOTE : Indicative #urbanSDG set (work in progress, do not cite)

Urban SDG Target C - Ensure safe air & water quality for all, & integrate reductions in greenhouse gas emissions, efficient land & resource use, &
climate & disaster resilience into investments & standards
0.00
0.20
0.40
0.60
0.80
1.00
Quality ofDisater Risk
Management
Quality ofClimate Change
Action
Air QualityIndex (approx.)
Water QualityIndex
NormalDifferenceVegetation
Index (approx.)
Urban GreenCover
0.00
0.20
0.40
0.60
0.80
1.00
Quality ofDisater Risk
Management
Quality ofClimate
Change Action
Air QualityIndex
(approx.)
Water QualityIndex
NormalDifferenceVegetation
Index…
Urban GreenCover
BANGALORE NEW YORK CITY
NOTE : Indicative #urbanSDG set (work in progress, do not cite)

The Dynamics of Indian Urbanisation
(1951-2031)

India’s Coming transition (2011-2031)
• India will add at least 300 million new people to its cities in the
next 30 years
• This is on top of the current urban population of ~300 million, of
whom over 70 million are poor
• In 2031, three of the ten largest megacities in the world will be in
India: Delhi, Mumbai, Kolkata
• Over 75 other cities will have a population of over 1 million
• This will be the second largest urbanisation in human history
creating huge market opportunities and development challenges
• The only option to avoid complete systemic urban breakdown is
the simultaneous transformation of India’s cities and its villages
• A wide range of technical, institutional and social innovations will
be required to enable this

1951
> 5
1 - 5
0.5 - 1
0.1 – 0.5
< 0.1
Population Size (millions)
Source: Census of India, 1971-2001; UN, 2007; IIHS analysis,
2009-10
India
W. Pakistan
E. Pakistan
Nepal
Tibet

0
100
200
300
400
500
600
700
800
1951 1961 1971 1981 1991 2001 2011 2021 2031
Urb
an S
ett
lem
ents
0
100
200
300
400
500
600
700
800
1951 1961 1971 1981 1991 2001 2011 2021 2031
Po
pu
lati
on
(in
mill
ion
s)
Kolkata(5.7)
1961
Large Urban Settlement Growth
Urban Population Growth
> 5
1 - 5
0.5 - 1
0.1 – 0.5
< 0.1
Population Size (millions)
Source: Census of India, 1971-2001; UN, 2007; IIHS analysis,
2009-10

0
100
200
300
400
500
600
700
800
1951 1961 1971 1981 1991 2001 2011 2021 2031
Urb
an S
ett
lem
ents
0
100
200
300
400
500
600
700
800
1951 1961 1971 1981 1991 2001 2011 2021 2031
Po
pu
lati
on
(in
mill
ion
s)
Kolkata(6.9)
1971
Mumbai(5.8)
Large Urban Settlement Growth
Urban Population Growth
> 5
1 - 5
0.5 - 1
0.1 – 0.5
< 0.1
Population Size (millions)
Source: Census of India, 1971-2001; UN, 2007; IIHS analysis,
2009-10

0
100
200
300
400
500
600
700
800
1951 1961 1971 1981 1991 2001 2011 2021 2031
Urb
an S
ett
lem
ents
0
100
200
300
400
500
600
700
800
1951 1961 1971 1981 1991 2001 2011 2021 2031
Po
pu
lati
on
(in
mill
ion
s)
Kolkata(9)
Delhi(5.6)
1981
Mumbai(8.6)
Large Urban Settlement Growth
Urban Population Growth
> 5
1 - 5
0.5 - 1
0.1 – 0.5
< 0.1
Population Size (millions)
Source: Census of India, 1971-2001; UN, 2007; IIHS analysis,
2009-10

0
100
200
300
400
500
600
700
800
1951 1961 1971 1981 1991 2001 2011 2021 2031
Urb
an S
ett
lem
ents
0
100
200
300
400
500
600
700
800
1951 1961 1971 1981 1991 2001 2011 2021 2031
Po
pu
lati
on
(in
mill
ion
s)
Kolkata(10.9)
Delhi(8.2)
Chennai(5.3)
1991
Mumbai(12.3)
Large Urban Settlement Growth
Urban Population Growth
> 5
1 - 5
0.5 - 1
0.1 – 0.5
< 0.1
Population Size (millions)
Source: Census of India, 1971-2001; UN, 2007; IIHS analysis,
2009-10

0
100
200
300
400
500
600
700
800
1951 1961 1971 1981 1991 2001 2011 2021 2031
Urb
an S
ett
lem
ents
0
100
200
300
400
500
600
700
800
1951 1961 1971 1981 1991 2001 2011 2021 2031
Po
pu
lati
on
(in
mill
ion
s)
Kolkata(13.1)
Delhi(12.4)
Chennai(6.6)
Bangalore(5.6)
Hyderabad(5.4)
2001
Mumbai(16.1)
Large Urban Settlement Growth
Urban Population Growth
> 5
1 - 5
0.5 - 1
0.1 – 0.5
< 0.1
Population Size (millions)
Source: Census of India, 1971-2001; UN, 2007; IIHS analysis,
2009-10

0
100
200
300
400
500
600
700
800
1951 1961 1971 1981 1991 2001 2011 2021 2031
Urb
an S
ett
lem
ents
0
100
200
300
400
500
600
700
800
1951 1961 1971 1981 1991 2001 2011 2021 2031
Po
pu
lati
on
(in
mill
ion
s)
Kolkata(15.5)
Delhi(16.9)
Chennai(7.5)
Bangalore(7.2)
Hyderabad(6.7)
Ahmedabad(5.7)
Pune(5.0)
2011
Mumbai(20)
Large Urban Settlement Growth
Urban Population Growth
> 5
1 - 5
0.5 - 1
0.1 – 0.5
< 0.1
Population Size (millions)
Source: Census of India, 1971-2001; UN, 2007; IIHS analysis,
2009-10

India 2011
• 3 cities with a population > 10 m and • 53 cities with > 1m
• 833 m live in 0.64 m villages• 377 m live in ~ 8,000 urban centres

0
100
200
300
400
500
600
700
800
1951 1961 1971 1981 1991 2001 2011 2021 2031
Urb
an S
ett
lem
ents
0
100
200
300
400
500
600
700
800
1951 1961 1971 1981 1991 2001 2011 2021 2031
Po
pu
lati
on
(in
mill
ion
s)
Mumbai(28.6)
Kolkata(22.3)
Delhi(24.4)
Chennai(11.1)
Bangalore(10.6)
Hyderabad(9.9)
Ahmedabad(8.5)
Pune(7.4)
Surat(6.3)
Kanpur(5.1)
2031
Large Urban Settlement Growth
Urban Population Growth
> 5
1 - 5
0.5 - 1
0.1 – 0.5
< 0.1
Population Size (millions)
Source: Census of India, 1971-2001; UN, 2007; IIHS analysis,
2009-10

India’s Coming transition (2011-2031)
• India will add at least 300 million new people to its cities in the
next 30 years
• This is on top of the current urban population of ~300 million, of
whom over 70 million are poor
• In 2031, three of the ten largest megacities in the world will be in
India: Delhi, Mumbai, Kolkata
• Over 75 other cities will have a population of over 1 million
• This will be the second largest urbanisation in human history
creating huge market opportunities and development challenges
• The only option to avoid complete systemic urban breakdown is
the simultaneous transformation of India’s cities and its villages
• A wide range of technical, institutional and social innovations will
be required to enable this

The challenge of contemporary Indian cities: integration of pre-colonial, colonial, ‘modern’ & informal

[35]
Distribution of Settlements by Settlement Size (1991-2011)
-10%
0%
10%
20%
30%
40%
50%
60%
70%
Million-plus
and larger
cities
Other Class
I cities
Class II
cities
Class III
cities
Class IV, V
and VI
cities
Very large
and large
villages
Medium
sized
villages
Small
villages
Hamlets
and smaller
Pro
po
rti
on
of
all
sett
lem
en
ts (
%)
1991 2001 2011 Source: Census of India (1991-2011); IIHS Analysis
India’s long tailed settlement structure is one of its most important 21st century development opportunities

43%
37%31%
25%19%
15%12%
20%
21%
21%
20%
19%
18%
16%
17%
18%
20%
21%
22%
23%
23%
5%8%
10%
12%
14%
16%
15%
5%4%
3%
3%
3%3%
4%
3%3%
3%
3%
3%3%
4%
2%2%
2%3%
3%3%
3%
1%2%
4%6%
7%8%
10%
3% 4% 5% 6% 9% 11% 12%
0%
10%
20%
30%
40%
50%
60%
70%
80%
90%
100%
1951 1961 1971 1981 1991 2001 2011
Pro
po
rtio
n o
f A
ll In
dia
Po
pu
lati
on
(%
)
267 m.
133 m.
182 m.
618 m.
Million-plus cities (> 1m)
Other Class I cities (0.1-1m)
Class II cities (50-100,000)
Class III cities (20-50,000)
Class IV, V & VI cities (<20,000)
Very large and large villages (>5,000)
Medium sized villages (2-5,000)
Small villages (1-2,000)
Hamlets & Smaller (<1,000)
Class I C
itiesO
ther U
rban
Large Villages
Med
ium
and
Smaller V
illages
Distribution of India’s Population by Settlement Size: 1951 - 2011
Source: Census of India, 1951-2011

0
10
20
30
40
50
60
Rs
Lakh
Cro
re
Rural Urban
0%
10%
20%
30%
40%
50%
60%
70%
80%
90%
100%
Per
cen
t o
f To
tal
India: Rural-Urban GDP
Rural: Urban GDP share (1970-2009)
Rural: Urban GDP fraction (1970-2009)
Early economic reforms
Early economic reforms
Phase I economic reforms
Phase II economic reforms
Phase I economic reforms
Phase II economic reforms
Close to 60% of India’s GDP comes from Urban areas
Source: National Accounts
Statistics

Top 100 Cities : 2011
Land
Population
Output
0.24%
16%
43%

India: GDP & Employment structure (2009)
The urban informal sector with a quarter of the workers produces roughly a quarter of the GDP. The urban formal sector with 5 percent of the workers produces a similar share of the GDP.
Source: NCEUS, 2009; Kannan & Raveendran (2009)
Urban Formal : 5%
Urban Informal : 25%
Rural : 70%
Urban Formal : 25%
Urban Informal : 26%
Rural : 45%

[40]
HALT REPRODUCTION OF POVERTY & INEQUALITY

0
100
200
300
400
500
600
5 10 15 20 25 30 35 40 45 50 55 60 65 70 75 80 85 90 95
Rural
Caste-wise Wealth Distribution in Rural India (2002)
0
100
200
300
400
500
600
5 10 15 20 25 30 35 40 45 50 55 60 65 70 75 80 85 90 95
Rural
ST
SC
OBC
FC
NH
Source: Zacharias & Vakulabharanam (2011) based on All India Debt & Investment Survey, 2002-03

0
100
200
300
400
500
600
5 10 15 20 25 30 35 40 45 50 55 60 65 70 75 80 85 90 95
Urban
Caste-wise Wealth Distribution in Urban India (2002)
0
100
200
300
400
500
600
5 10 15 20 25 30 35 40 45 50 55 60 65 70 75 80 85 90 95
Rural
ST
SC
OBC
FC
NH
Source: Zacharias & Vakulabharanam (2011) based on All India Debt & Investment Survey, 2002-03

India: the opportunity of ten simultaneous Transitions
1. Demographic transition: population stabilisation & aging
2. Health transition: infectious + lifestyle disease burden
3. Education transition: elementary secondary tertiary
4. Energy transition: oil + coal gas + renewables
5. Environmental transition: ‘brown’ + ‘grey’ + ‘green’ agendas
6. Information transition: post phone cell phone + www
7. Livelihoods transition: agrarian green + knowledge jobs
8. Economic transition: primary + secondary tertiary-led
9. Political transition: decentralised, youth and urban
10. Urban transition: rural ‘urban’

Environmental Sustainability
Social Transformation
Unified & Robust Polity
Inclusive Economic Growth
End of Poverty and Reduced Inequality
Five national Development outcomes by the 2030s

India: key barriers to Systemic Innovation
• Gender exclusion
• Caste, class & community exclusion
• Hegemony of place (of birth)
• Hollowing out of institutional capacity &
neutral places for engagement

Stylised sites of Innovation(1950 & 60s)?
StateFirm
FaithFamily
Academy

Stylised sites of Innovation(2000s) ?
StateFirm
FaithFamily
Academy

A typical ‘soft’ Indian Innovation Cycle
Survive
Adapt
Absorb
Transform

Who manages Urban India?Top Management
• MPs & MLAs 5,300
• Higher Judiciary 650
• IAS & IPS 8,200
• CXOs (top 500 corporates) ~ 5,000
• NGO leadership ~ 1,750
Total 20,900
% educated & trained in urban practice < 5%
Middle Management
• Senior Municipal officials ~ 4,000
• Senior Engineers ~ 8,000
• Urban Planners ~ 2,000
Total ~ 14,000
% educated & trained in urban practice < 20%

India’s first independent
National Research & Innovation University
focused on urban transformation
www.iihs.co.in
iihs

IIHS Core Concept
National Scale+
Interdisciplinary Excellence+
Economic & Social Inclusion =
1,00,000 professionals (Urban Practitioners) in 20 years+
Innovative Institutional design & revenue model+
National Regulation=
Transformative National Institution