Open Source Software Development as a Complex System
256
Open Source Software Development as a Complex System John David Nicholas Graves A thesis submitted to Auckland University of Technology in fulfillment of the requirements for the degree of Doctor of Philosophy (PhD) October, 2013 Software Engineering Research Laboratory Faculty of Design and Creative Technologies Supervisors: Dr. Tony Clear and Dr. Steve MacDonell
-
Upload
khangminh22 -
Category
Documents
-
view
0 -
download
0
Transcript of Open Source Software Development as a Complex System

Open Source Software Development as a Complex System
John David Nicholas Graves
A thesis submitted to
Auckland University of Technology
in fulfillment of the requirements for the degree of
Doctor of Philosophy (PhD)
October, 2013
Software Engineering Research Laboratory
Faculty of Design and Creative Technologies
Supervisors: Dr. Tony Clear and Dr. Steve MacDonell

Abstract
Open Source Software Development is an approach to software development involving open,
public exposure of the source code of a computer program under development (hence, ‘open
source’). Each open source program is shared online as a project in a source code repository.
The so-called ‘open source community’ is the system which coordinates the work of software
developers on the code in the repositories. This research explored the growth dynamics of this
system, first by launching open source projects and then via simulation. Following (Barabasi &
Albert, 1999) and a biodiversity model (Hubbell, 2001), simulations of a complex system driven
by preferential attachment, where popular projects attract more developers and grow (subject to
some attrition), provided a systematic explanation for the lack of growth typical of single-
developer projects. In this multi-methodological study, the lack of growth in the research
projects empirically demonstrated the need for a theoretical understanding of open source project
initiation and growth while the subsequent simulation results showed how the pattern of no
growth (one developer) projects could be explained by a simple model.
Open Source Software Development as a Complex System ii
TABLE OF CONTENTS
1. Introduction ............................................................................................................................. 1
1.1 No Explanation for Open Source Project Growth ............................................................ 1
1.2 Insights from Business Startups ....................................................................................... 6
1.3 Insights from Biology....................................................................................................... 8
1.4 Thesis Structure .............................................................................................................. 11
1.5 Artifacts .......................................................................................................................... 12
1.5.1 Publications. ............................................................................................................ 12
1.5.2 Prototype open source projects. .............................................................................. 13
1.5.2.1 Open Allure Dialog System. ............................................................................ 13
1.5.2.2 Wiki-to-Speech. ............................................................................................... 13
1.5.2.3 SlideSpeech. .................................................................................................... 14
1.5.3 Simulations. ............................................................................................................ 15
1.5.3.1 Simulation in R. ............................................................................................... 15
1.5.3.2 Simulation in Excel. ........................................................................................ 15
1.5.3.3 Simulation in NetLogo. ................................................................................... 16
1.5.4 Videos. .................................................................................................................... 17
1.5.5 SlideShare presentations. ........................................................................................ 17
1.5.6 SlideSpeech presentations. ...................................................................................... 17
2. Literature Review.................................................................................................................. 19
2.1 Theoretical Ideas ............................................................................................................ 19
2.1.1 Open source software development as a complex system. ..................................... 19

Open Source Software Development as a Complex System iii
2.1.1.1 Sensitivity to initial conditions. ....................................................................... 22
2.1.1.2 Nonlinear value creation. ................................................................................. 23
2.1.1.3 Diversity. ......................................................................................................... 24
2.1.1.4 Complexity. ..................................................................................................... 38
2.1.1.5 Unpredictability. .............................................................................................. 56
2.1.1.6 Emergent patterns ............................................................................................ 57
2.1.2 Open source software development as an innovation system ................................. 64
2.1.2.1 Recombinant search. ........................................................................................ 65
2.1.2.2 Project uniqueness. .......................................................................................... 67
2.1.2.3 Conditions for beneficial diversity. ................................................................. 68
2.1.3 Open source and evolution...................................................................................... 69
2.1.3.1 Potential biological parallels with open source. .............................................. 70
2.1.3.2 Entropy ............................................................................................................ 73
2.1.3.3 Epigenetics....................................................................................................... 75
2.2 Prior Research ................................................................................................................ 78
2.2.1 A systems view of the bazaar. ................................................................................. 78
2.2.1.1 Sensitivity to initial conditions. ....................................................................... 78
2.2.1.2 Diversity yields robustness. ............................................................................. 79
2.2.1.3 Emergent phenomenon. ................................................................................... 80
2.2.2 Established projects. ............................................................................................... 81
2.2.3 Open source beyond the repositories. ..................................................................... 84
2.2.4 Prior research in open source simulation. ............................................................... 85
2.2.4.1 Fitting a power law distribution....................................................................... 86

Open Source Software Development as a Complex System iv
2.2.4.2 Crosetto’s model. ............................................................................................. 88
2.2.4.3 FLOSSSim. ...................................................................................................... 89
2.2.4.4 Summary .......................................................................................................... 91
3. Research Design.................................................................................................................... 92
4. Data and Analysis ................................................................................................................. 98
4.1 Overview ........................................................................................................................ 98
4.1.1 Open source projects. .............................................................................................. 98
4.1.2 Project notes. ......................................................................................................... 100
4.1.3 Code commits. ...................................................................................................... 104
4.1.4 Project wikis.......................................................................................................... 106
4.1.5 Presentations. ........................................................................................................ 107
4.1.6 Project summary. .................................................................................................. 109
4.2 Open Allure Dialog System ......................................................................................... 109
4.2.1 Project initiation. ................................................................................................... 111
4.2.2 Downloads. ........................................................................................................... 120
4.2.3 Social media trials. ................................................................................................ 124
4.2.4 Public announcements and publicity. ................................................................... 125
4.2.5 Getting Python code to execute. ........................................................................... 127
4.2.6 Documentation. ..................................................................................................... 128
4.2.7 Multiple platforms and the Mac iSight issue. ....................................................... 129
4.2.8 Kiwi PyCon 2010. ................................................................................................. 131
4.2.9 Foreign language versions. ................................................................................... 131
4.2.10 Trying to show higher headcount. ........................................................................ 132

Open Source Software Development as a Complex System v
4.3 Wiki-to-Speech............................................................................................................. 133
4.3.1 Working on mobile phones. .................................................................................. 134
4.3.2 Working on the web. ............................................................................................. 135
4.3.3 More documentation. ............................................................................................ 141
4.3.4 Kiwi PyCon 2011. ................................................................................................. 141
4.3.5 Meetup, MakerSpace, MOOCast and WizIQ. ...................................................... 142
4.4 SlideSpeech .................................................................................................................. 143
4.4.1 SlideSpeech mobile. .............................................................................................. 144
4.4.2 Foreign language video for the Global Education Conference. ............................ 145
4.4.3 Interactivity. .......................................................................................................... 146
4.4.4 Funding and commercialization. ........................................................................... 147
4.5 Simulations ................................................................................................................... 150
4.5.1 Simulation in R. .................................................................................................... 152
4.5.2 Simulation in Excel. .............................................................................................. 160
4.5.3 Simulation in NetLogo. ......................................................................................... 161
5. Discussion ........................................................................................................................... 164
5.1 “Occasionally profound consequences” ....................................................................... 164
5.2 Simulation Accuracy .................................................................................................... 170
6. Conclusion/Implications ..................................................................................................... 173
6.1 Summary ...................................................................................................................... 173
6.2 Contributions ................................................................................................................ 174
6.3 Limitations ................................................................................................................... 174
6.4 Implications for Further Research ................................................................................ 177

Open Source Software Development as a Complex System vi
6.5 Implications for Practice .............................................................................................. 178
6.6 Conclusion .................................................................................................................... 178
7. Appendices .......................................................................................................................... 179
8. References ........................................................................................................................... 223
Open Source Software Development as a Complex System vii
DECLARATION
I hereby declare that this submission is my own work and that, to the best of my knowledge and
belief, it contains no material previously published or written by another person (except where
explicitly defined in the acknowledgments), nor material which to a substantial extent has been
submitted for the award of any other degree or diploma of a university or other institution of
higher learning.
Auckland, October, 2013
__________________________________
John David Nicholas Graves

Open Source Software Development as a Complex System viii
LIST OF FIGURES
Figure 1: Treemap of open source projects grouped by number of contributing developers. Data
source: (Weiss, 2005, Figure 8, p. 147). ....................................................................... 4
Figure 2: Proportional abundances of the seven most abundant phyla on kelp holdfasts
(Anderson, Diebel, Blom & Landers, 2005, Figure 5, p. 45). .................................... 10
Figure 3: Comparison of semi-log graphs of species-level biodiversity (left) and FLOSS
development (right). Sources: (Hankin, 2007, Figure 1, p. 7; Radtke, 2011, Figure
6.3, p. 168). ................................................................................................................. 10
Figure 4: Project Home page for Open Allure Dialog System initiated November 2009. .......... 13
Figure 5: Project Home page for Wiki-to-Speech project initiated January 2011. ...................... 14
Figure 6: Project Home page for SlideSpeech initiated February 2012. ..................................... 14
Figure 7: Sample output of Excel spreadsheet simulating preferential attachment. .................... 16
Figure 8: Sample Run of Developer and Project NetLogo simulation. ....................................... 17
Figure 9: Google Analytics report for SlideSpeech as of 30 March 2013 showing 6,571 unique
visitors since 26 July 2012. Maximum visits per day: 253 on 21 August 2012. ........ 18
Figure 10: Cynefin decision making framework. Source: (Snowden, 2007, Figure 2, p. 69). .... 20
Figure 11: Some changing aspects of computer programming located in domains of the Cynefin
framework. Source: (Hasan & Kazlauskas, 2009, Figure 5, p. 9). ............................ 21
Figure 12: Comparison of JSON and XML syntax for the same data values. ............................. 26
Figure 13: Distribution of Project Tags on Ohloh as of February 2013 with exponential curve fit.
..................................................................................................................................... 30

Open Source Software Development as a Complex System ix
Figure 14: Power Law Relationships: OSS Project Size and Developer Project Membership.
Source: (Madey, Freeh & Tynan, 2002a, Figure 2, p. 1811). ..................................... 31
Figure 15: Number of OS/FS Projects Involved In at Current. Source: (Ghosh, Glott, Krieger &
Robles, 2002, Figure 24, p. 32). .................................................................................. 33
Figure 16: Color heatmap for the code clone coverage of the FreeBSD target (category view).
Source: (Livieri, Higo, Matushita & Inoue, 2007, Figure 6, p. 7). ............................. 34
Figure 17: Two figures from (Holthouse & Greenberg, 1978) highlighting the iteration of the
"Scientific Software Life Cycle" in contrast with "Traditional Software Life Cycle"
(waterfall model). ........................................................................................................ 35
Figure 18: Cladogram of 480 GNU/Linux distributions, placed on a timeline. Highlighted
section is the Ubuntu branch, 2004 through 2012. Source: http://futurist.se/gldt/
version 12.10 ............................................................................................................... 38
Figure 19: The relationship between macroscopic information and complexity of a physical
information system. Source: (Brooks & Wiley, 1988, Figure 2.5, p. 63). .................. 40
Figure 20: Population dynamics modeled by the equation Xt+1 = a Xt (1-Xt) for three values of a
(1.5, 2.5 and 3.5) starting from X1=.01 ....................................................................... 42
Figure 21: Semi-log chart showing changing distribution of SourceForge developer activity
states between 28 June (initial) and 26 October 2001 (limiting). Source: (David and
Rullani, 2006, Figure 2, p. 13). ................................................................................... 42
Figure 22: Population of SourceForge Projects, July 2005 to June 2012, showing the exponential
trend. Data Source: OpenSourceDelivers.com using data from Greg Madey’s
SourceForge Research Data Archive (SRDA, http://srda.cse.nd.edu). ....................... 43

Open Source Software Development as a Complex System x
Figure 23: Metcalfe’s Law illustrated by a graph from George Gilder from Forbes, September
1993, and later described in (Gilder, 2000). ............................................................... 45
Figure 24: Semi-log chart comparing Reed's Law with Metcalfe's Law. .................................... 46
Figure 25: A network of innovations in programming languages. Source: (Solé, Valverde,
Casals, Kauffman, Farmer& Eldredge, 2013, Figure 7a, p. 24). ................................ 50
Figure 26: More Gain than Pain from a Random Event. Source: (Taleb, 2012b, Figure 1). ....... 55
Figure 27: Cellular automata from (Wolfram, 2002, p. 24), reordered and colored to highlight
the difference in the “story” of Rule 26 compared to Rule 30. ................................... 59
Figure 28: Comparison of log-log charts of genera / species (left) and open source project
downloads / rank (right). Sources: (Yule, 1925, Figure 3, p. 46; Feitelson, Heller &
Schach, 2006, Figure 2, p. 3). ..................................................................................... 62
Figure 29: Illustration from (Fleming, 1998, Figure 1, p. 27) showing “The holistic web of
technological evolution.” ............................................................................................ 66
Figure 30: Convergent evolution of morphology in placental and marsupial species in the Old
World and Australia. Source: (Cabej, 2011, Figure 17.11, p. 702). ........................... 77
Figure 31: Real and Simulated Density of Projects with N developers. Source: (Crosetto, 2009,
Figure 5, p. 5). ............................................................................................................. 88
Figure 32: Simulated and Empirical data for Developers per Project. Source: (Radtke, 2011,
Figure 7.2, p. 192). ...................................................................................................... 89
Figure 33: Three instances of “open source” in the 2012 Revision of ACM’s Computing
Classification System. ................................................................................................. 92
Figure 34: Design Science Research Methodology (Peffers, Tuunanen, Rothenberger &
Chatterjee, 2007, Figure 1, p. 59). .............................................................................. 93

Open Source Software Development as a Complex System xi
Figure 35: A Multimethodological Approach to IS Research. Source: (Nunamaker, Chen &
Purdin, 1990, Figure 2, p. 94). .................................................................................... 94
Figure 36: Home page of the Google Code repository. ............................................................... 98
Figure 37: Comparison of Open Source code repositories by Popularity measures on Wikipedia,
as of 1 April 2013. ...................................................................................................... 99
Figure 38: “How many projects are listed in each repository? (05-2011)” showing Google Code
with 208,664 projects. Data source: FLOSSmole (Howison, Conklin & Crowston,
2006). ........................................................................................................................ 100
Figure 39: Count of Daily Notes showing periods of interruption in 2010 and 2012. Dates shown
are d/mm/yyyy. ......................................................................................................... 101
Figure 40: YouTube Videos for Three Projects. Posting dates shown are d/mm/yyyy. ............ 102
Figure 41: Log-log chart of all project YouTube video views as of December 2012 with
exponential regression line fit. .................................................................................. 103
Figure 42: YouTube Video statistics as of January 2013 for video titled "Demo of Julius Speech
Recognition on Linux" posted on 20 January 2010. ................................................. 104
Figure 43: Commit History by Developer (Initials in legend), consolidated across three projects.
Dates shown are dd/mm/yyyy. .................................................................................. 105
Figure 44: Commit History for Three Projects, by project. Dates shown are dd/mm/yyyy. ..... 106
Figure 45: Posts to Project Wikis, by project. ........................................................................... 107
Figure 46: Postings to Public Dropbox Folder by Date. ............................................................ 108
Figure 47: Gource image of Open Allure Dialog System. ......................................................... 110
Figure 48: Age of selected free and open source software projects as of 2013, highlighting the
"LAMP" stack and source code management systems. ............................................ 113

Open Source Software Development as a Complex System xii
Figure 49: YouTube video titled "Python No Hands" demonstrating use of the dragonfly voice
recognition framework for Python to write a program using only voice commands (no
keyboard). ................................................................................................................. 114
Figure 50: Python code highlighting the use of the dragonfly library to invoke text-to-speech.
................................................................................................................................... 114
Figure 51: Slidecast on SlideShare.net titled "Voice Interaction in Python" uploaded 8
November 2009 for Kiwi PyCon 2009. .................................................................... 115
Figure 52: Cumulative total SlideShare Views for all project-related presentations with linear
regression fit. ............................................................................................................. 116
Figure 53: YouTube video titled "Face Tracking with OpenCV in Python" uploaded 23
November 2009. ........................................................................................................ 117
Figure 54: YouTube video titled "Open Allure DS" uploaded 27 November 2009 in an attempt
to create “buzz”. ........................................................................................................ 118
Figure 55: View statistics for Open Allure DS YouTube video. ............................................... 119
Figure 56: YouTube Video Views for research project channel over time with linear regression
line fit. ....................................................................................................................... 120
Figure 57: Downloads of first version of Open Allure code file (version 0.1d5). ..................... 121
Figure 58: PyPI download count for openallure-0.1d17.zip over time with linear regression line
fit. .............................................................................................................................. 122
Figure 59: Ning Networks for direct and indirect social media connections to Open Allure.
December 2009. ........................................................................................................ 124
Figure 60: Daily traffic to Open Allure on FreeCode two years after posting. ......................... 127

Open Source Software Development as a Complex System xiii
Figure 61: Open Allure documentation website, visualized by
http://www.aharef.info/static/htmlgraph/. ................................................................. 129
Figure 62: Gource image of Wiki-to-Speech. ............................................................................ 133
Figure 63: Wiki-to-Speech and Open Allure. Wiki-to-Speech added features in black boxes. 134
Figure 64: Audience Retention for the Wiki-to-Speech-generated YouTube video, "Document
Classification Using the Natural Language Toolkit", uploaded 5 September 2011.
N=783 as of 25 March 2013. .................................................................................... 138
Figure 65: Relative Audience Retention for the Wiki-to-Speech-generated YouTube video,
"Stigmergy”, uploaded 12 September 2011. N=265 as of 25 March 2013. ............. 139
Figure 66: Relative Audience Retention for the Wiki-to-Speech-generated YouTube video,
“Understanding the software development process: participation, role dynamics and
coordination issues”, uploaded 12 September 2011. N=1,278 as of 25 March 2013.
................................................................................................................................... 140
Figure 67: Gource image of SlideSpeech. ................................................................................. 143
Figure 68: Graphics from first SlideSpeech website designed at NatColl in October 2011. ..... 144
Figure 69: YouTube video “Demonstration of SlideSpeech 1.0”, uploaded 24 October 2011
(left) and commercial version of SlideSpeech 1.1203, from 3 December 2012 (right).
................................................................................................................................... 145
Figure 70: SlideSpeech presentation to 9 participants in Blackboard Collaborate room 137 at the
2011 Global Education Conference, 17 November 2011. ........................................ 146
Figure 71: YouTube video titled “Medicine”, uploaded 19 February 2012, demonstrating
interactivity. .............................................................................................................. 147
Figure 72: Architecture of SlideSpeech conversions. ................................................................ 149

Open Source Software Development as a Complex System xiv
Figure 73: Punctuated equilibrium in simulation. Lines show the abundance of each species in
time, with different colors corresponding to different (equivalent) species. Source:
(Hankin, 2007, Figure 6, p. 12). ................................................................................ 151
Figure 74: R code for applying the UNTB model from (Hankin, 2007) to data from (Weiss,
2005). ........................................................................................................................ 152
Figure 75: Output of UNTB with data from (Weiss, 2005). ...................................................... 153
Figure 76: Summary output of UNTB applied to (Weiss, 2005). .............................................. 153
Figure 77: Output of UNTB. Y-axis is log scale. Red dots are data from FLOSSmole (Howison,
Conklin & Crowston, 2006) for Google Code in 2011. Gray lines are simulated
results. ....................................................................................................................... 154
Figure 78: Summary output of UNTB applied to Google Code data on 183,196 projects. Data
source: FLOSSmole (Howison, Conklin & Crowston, 2006). ................................. 155
Figure 79: R code for simulation with attrition (excerpt). ......................................................... 156
Figure 80: Output of R model with attrition for data from (Weiss, 2005). ................................ 156
Figure 81: Output of R model with attrition for data from FLOSSmole (Howison, Conklin &
Crowston, 2006). ....................................................................................................... 157
Figure 82: Output of R model with attrition for data from (Weiss, 2005), interpreted as ranked
developer abundance curve. ...................................................................................... 158
Figure 83: Output of R model with attrition for data from FLOSSmole (Howison, Conklin &
Crowston, 2006), interpreted as ranked developer abundance curve. ...................... 159
Figure 84: Developer Dynamics Excel spreadsheet showing continuity of dominant project
(orange). .................................................................................................................... 161
Open Source Software Development as a Complex System xv
Figure 85: Developer Dynamics Excel spreadsheet showing the change of dominant project
(from purple to blue). ................................................................................................ 161
Figure 86: Sample Run of Developer and Project NetLogo simulation, filtered. ...................... 163
Figure 87: Periods of sustained code commits. Dates are in dd/mm/yyyy format. ................... 166
Figure 88: Periods of sustained posting of presentations to Dropbox. Dates are in dd/mm/yyyy
format. ....................................................................................................................... 166
Figure 89: Cumulative YouTube Video Views totaled 52,374 for the 135 videos on the research
channel as of 11 February 2013. ............................................................................... 167
Figure 90: Slidecasts on SlideShare.net with view counts totaling 11,390 as of 1 April 2013. 168
Figure 91: Source Lines of Code (LOC) added per developer in the GNOME project. Source:
(Koch & Schneider, 2000, Figure 2, p. 3). ................................................................ 170
Figure 92: “People Flow to Where It's Hottest” by Gary Bolles, eParachute. June 2011. ........ 172
Figure 93: Open Source System. Aksulu & Wade (2010), Figure 3, p. 590. ............................ 176
Figure 94: Alternative scaling of data with power law distribution. ......................................... 206
Figure 95: Alternative power law curve fits. ............................................................................. 206
Figure 96: R summary of power law curve fit to data from (Weiss, 2005). .............................. 207
Figure 97: Project Count by License, Sourceforge 2009 December. Power law fit. Data source:
FLOSSmole (Howison, Conklin & Crowston, 2006) ............................................... 218
Figure 98: Count of Projects by Team Size, by License. Sourceforge 2009 December. Data
source: FLOSSmole (Howison, Conklin & Crowston, 2006). ................................. 219
Figure 99: Count of Projects by Label. Google Code November 2011. Data source: FLOSSmole
(Howison, Conklin & Crowston, 2006). ................................................................... 220

Open Source Software Development as a Complex System xvi
Figure 100: Count of Projects by Project Size, by Label. Google Code November 2011. Data
source: FLOSSmole (Howison, Conklin & Crowston, 2006). ................................. 222

Open Source Software Development as a Complex System xvii
LIST OF TABLES
Table 1: Trials by Open Source Project …………………………………………………. 109
Table 2: Downloads of Open Allure from Python Package Index. ……………………… 121
Table 3: Total File Downloads. ………………………………………………………….. 169
Table 4: Frequency of labels used for Google Code projects, November 2011. Data source:
FLOSSmole (Howison, Conklin & Crowston, 2006) ………………………….. 221

Open Source Software Development as a Complex System xviii
Acknowledgements
I dedicate this thesis to my mother and my inspiration, Dr. Helen Mataya Graves, who earned her
PhD at age 52.
I am also grateful to the many personal and professional supporters of this research.
First and foremost, I would like to thank my faculty advisors, Dr. Tony Clear and Dr. Steve
MacDonell, who provided invaluable advice and moral support in the face of my repeated
project setbacks.
At AUT University, my colleagues Dr. Stefan Schliebs, Frederik Schmidt, Amjed Tahir,
Sherlock Licorish, Waqar Hussain, Dr. Haza Nuzly Abdul Hamed and the other graduate
students in KEDRI and SERL generously shared in discussing and testing the ideas expressed
here. I’m particularly grateful to Robin Hankin for introducing me to the model which became
the centerpiece of this research. My discussions with former Vice-Chancellor John Hinchcliff
were also informative and much appreciated. The Auckland University of Technology Ethics
Committee (AUTEC) granted ethics approval for this research on 11 March 2010 (see
Appendix G).
At Singularity University, thanks to José Cordeiro and the faculty and students of GSP10, this
research received an exponential boost. The bold goal of having a positive impact on the lives of
a billion people (10^9) within ten years kept me working to understand how the innovation of
Open Source can scale.
My computer user group connections at the New Zealand Python User Group and the Google
Developers Group –Auckland, particularly Brian Thorne, Guy Kloss and Julius Spencer,
provided the first contributor and audience for the project development work.
A special thanks goes to Andrew Maslowski, a true ‘angel’ investor. The commercialized
version of SlideSpeech, the final project developed and analyzed here, would not exist without
his friendship and financial support.
My sister, Adrienne Southgate, and daughter, Emma Rye, commented constructively on the
writing in my early drafts and urged me on.
Finally, thanks to Ellen Wang, whose comments on the final drafts and vision of my completing
this thesis carried me through it—and on into the future.

Open Source Software Development as a Complex System
What I cannot create, I do not understand. - Richard Feynman
1. Introduction
1.1 No Explanation for Open Source Project Growth
Given the spectacular growth of some open source projects noted in (Weber, 2005) and the
amount of research devoted to open source software development cataloged in (Aksulu & Wade,
2010) and (Crowston, Wei, Howison & Wiggins, 2012), the inception and growth of an open
source project should be well understood. This research set out to explore the hypothesis that
there are reproducible steps for open source project initiation and growth. Alternatively, as a null
hypothesis, the research could have determined that such instructions do not yet exist. Instead of
finding replicable steps, however, the research found a systematic model in which growth took
place independent of the steps followed.
Note the thesis thus sidesteps a subjective definition of the term ‘success’ and relies instead
on the simple, available and objective metric of team size to measure growth (think of human
height, where we can identify individuals who have grown tall, regardless of their ‘success’).
Clear, Raza & MacDonell (2013) point out the work of Myers (1995) from the Information
Systems literature which states: “'Success' is not a unitary phenomenon; it is, by its very nature, a
matter of opinion and genuine grounds for debate.” (p. 65). For example, (Schweik & English,
2012) picked achievement of three software releases as constituting project success. This
achievement occurs for single developer projects. Yet in such cases, when that single developer
stops working on the project, the releases stop. Multiple developer projects, however, can be
sustained. Consequently, the focus here is on team size growth, starting from one developer, then

Open Source Software Development as a Complex System 2
two, with a particular focus on how these numbers grow to become very large (the ‘tall’
projects).
The research initially set out to create a new open source project and measure its speed of
growth in terms of the number of developers and their contributions. The observed speed—zero
over a three year period—posed difficulties for the research methodology as initially proposed.
Growing a new open source project turned out to be similar to starting a new business1, coining a
new term2 or evolving a new species
3: most attempts fail, as quantified in (English & Schweik,
2007). The first phase of the research found a lack of growth in three open source research
projects; this finding required an explanation.
The ‘no growth’ result required re-framing the research question. The new question—why
no growth?—led to a fundamental re-evaluation of open source as a system, rather than merely
an approach to the development of a particular software project. Instead of the in-depth, detailed
examination of open source development envisioned at the start, the research focus shifted to a
broad theoretical examination. Viewing open source software development as a complex system
allowed project growth to be explained at the system level, rather than at the level of individual
projects, with a dynamic model involving a feedback process. Simulations were then used to
investigate the implications of this view. Thus, this study contributes a novel theoretical view of
open source software development as a complex system, while demonstrating empirically how
elusive the growth of new projects can be.
Other studies of open source development had looked inside successful and unsuccessful
projects in search of the ingredients of ‘success’, as in (Midha & Palvia, 2012), or sought to
1 United States Bureau of Labor Statistics, Entrepreneurship and the U.S. Economy, Chart 3. Survival rates of
establishments. Under 50 percent survive 7 years: http://www.bls.gov/bdm/entrepreneurship/bdm_chart3.htm 2 Zipf (1949) observed a power law distribution of word use. Unusual words such as neologisms are rarely used.
3 An individual cannot evolve alone. Desjardins-Proulx & Gravel (2012) offered a nuanced analysis of “speciation-
as-a-population-process” after observing that speciation cannot be viewed as a single mutation.

Open Source Software Development as a Complex System 3
define ‘success’ for open source, as in (Crowston, Annabi, & Howison, 2003), but such efforts
had not revealed how to reliably design and grow an open source project. The correlation of
project measures to growth was not enough to establish causation. In fact, some studies hinted
the causality could run the other way: instead of project characteristics causing project growth,
project growth caused changes in the way the members of open source project teams could work
together. For example, Barcellini, Détienne and Burkhardt (2008) wrote of role emergence:
“[t]he status of user or developer becomes completely relative to the context in which their skills
can be expressed” (p. 569, emphasis added).
David and Rullani (2006) observed that success in open source is a rare event in a
dissipative system, which Madey, Freeh and Tynan (2002a) identified as the product of a
nonlinear feedback process called preferential attachment. A model of this system-level process
reliably reproduced an observable pattern across the populations of open source projects in two
different code repositories. Specifically, the observed relative frequency of projects by number of
developers contributing to the project, from (Weiss, 2005, Figure 8, p. 147) using data from
89,557 projects on SourceForge4, is shown in Figure 1. Area in Figure 1 is proportional to the
number of projects in each group. The majority of projects have only one developer. As the team
size increases, the project count decreases until the groups for projects with more than two dozen
contributors become vanishingly small.
4 SourceForge is a leading code repository for open source projects: http://sourceforge.net/

Open Source Software Development as a Complex System 4
Figure 1: Treemap of open source projects grouped by number of contributing developers. Data source: (Weiss, 2005, Figure 8, p. 147).
A preferential attachment model can be built for open source projects following (Barabasi
& Albert, 1999) by having each new developer select an active developer at random and join
their project. This effectively associates a probability of subsequent growth to each project which
increases as a project grows (gains developers) over time, without requiring new developers to
have any comprehensive knowledge of the state of the population of projects or to make any
assessment of project characteristics. For example, given two projects, the first with one
developer and the second with two developers, the chance of a new developer joining the
projects is one-third and two-thirds, respectively. Each new developer simply joins in the work
others are doing. The next new developer who comes along would likely have a three-fourths
chance of joining a three developer project and only a one-fourth chance of joining the one
developer project. Hence, the model is neutral and ‘the rich get richer’. The origins, workings
and implications of this model are discussed in detail and together form a core contribution of
this thesis.
The next two sections of this introduction summarize these points:

Open Source Software Development as a Complex System 5
1) Open source systematically leverages variance to discover solutions.
2) Open source project initiation involves a search process conducted by users.
3) Open source innovation can take place at exponentially increasing speed.
4) Studies of biological ecosystems can provide useful insights for open source.
First, if the proposed model is correct and there is presently no way to predict or determine
which projects will grow initially, the observed initial growth must depend entirely on chance, or
having ‘good luck’. Good luck can arise from many trials with lots of errors, following a
methodology having high variance, or from just happening to be in the right place at the right
time with the right idea. Taleb (2012a) observed how being in the wrong place at the wrong time
causes things to break (hence fragile) and coined a term for the opposite payoff situation:
antifragile. This notion is discussed further in the Literature Review, section 2.1.1.4.4.
Thus, in the context of open source, the growth of large successful projects can be modeled
by a process based on the unpredictable (random) early success of small projects5. Initial growth
allows an open source project to subsequently attract a disproportionate share of developer
interest and involvement. The internals of large successful projects observed in other studies
likely reflect adjustments to cope with the demands of these increases in involvement; but those
internals are not the cause of the increases.
Most projects have failed to grow before any optimizations of the development process
become relevant; in fact, most failed projects have only one developer. Data collected in this
research indicated that trying to make a solo project grow by emulating a large successful project
did not work. Details from three related projects which all failed to grow provided evidence that
a wide variety of additions and adjustments had no impact on project growth. Then, one of the
projects had a lucky break: an angel investor decided to fund commercial development. This
5 When a large proprietary system shifts to open source (or ‘starts large’), it may by-pass this growth process.

Open Source Software Development as a Complex System 6
event offered an opportunity to compare the initiation and growth of an open source project with
the initiation and growth of a startup business.
1.2 Insights from Business Startups
In the context of entrepreneurship, Blank and Dorf (2012) make a clear distinction between
a startup and a company. A startup is a temporary organization in search of a business model.
The success of the business model allows the startup to grow into a company. Taking this
perspective and applying it to open source software development suggests open source project
initiation actually involves a search process which then leads to a development process. Finding
methods for conducting this search process could lead to more successful projects. Ultimately,
software must solve a problem in the context of the problem (that is, for users), not just in the
development context. Thus, product-market fit could be as important to an open source project as
it is to a startup business.
For entrepreneurs, customers are “outside the building” (Blank & Dorf, 2012, p. xxix).
Startups cannot determine product-market fit without consulting their market. To succeed, a
product must be possible to produce (feasible), shown to be useful (desirable) and be capable of
distribution for profit (viable). These tests are made through interactions with customers, not via
designs and business plans. Open source development puts the software product ‘outside the
building’ and gives users the opportunity to interact with it on their own terms. By allowing
users to participate in the search for a fit between open source solutions and the problems they
have, the open source approach helps avoid one form of project failure: development of code
which is not a solution.
Linus Torvalds, the lead developer of Linux, an exemplar of successful open source
development, observed in an interview (Vaughan-Nichols, 2013) that open source developers

Open Source Software Development as a Complex System 7
commonly make two mistakes: they expect others to help them and they believe their code
matters. In fact, the route to success lies in coding solutions which meet the needs of users;
otherwise, users have no reason to help developers. How the code gets written is secondary.
Torvalds concludes, “The code itself is unimportant; the project is only as useful as people
actually find it.” When open source programs meet user needs, however, Weber (2005) noted
that some users will provide feedback and other developers may improve the code to enhance the
user experience or adapt the code to meet other related needs. By sharing their feedback and
contributions, Weber maintained, the community of users and developers create mutual benefits:
better solutions which meet specific user needs.
Thus open source developers need not act altruistically for open source projects to improve
and grow. From the developer perspective, sharing the work of developing software can have
more benefit than cost, if only because the cost of sharing is so low (Osterloh & Rota, 2007).
Economists have puzzled over a cost/benefit tradeoff for open source developers which appeared
to be ‘do development work and give it away/get no payoff.’ In fact, once some development
work has been done, it becomes a sunk cost; at that point the tradeoff becomes ‘share work/see
payoff’ which more easily allows for non-altruistic sharing. In situations where doing software
development is an open source developer’s job or an aspect of their paid employment, the work
has already been compensated directly. Low cost sharing of the resulting code offers the
potential for feedback and collaboration which may have a high—but unpredictable—indirect
payoff; hence, the behavior is antifragile. The fact that some payoffs from open source
development are system-wide, not developer-specific or project-specific, creates an illusion of
altruism, as discussed in (Lancashire, 2001).

Open Source Software Development as a Complex System 8
The internet has opened new distribution channels for digital goods and services, including
software development services. Open source software development thus taps into the opportunity
presented by internet distribution in two directions from a project perspective: free software goes
out and free development work comes in. Every business balances costs and revenues. In an
open source project, when production costs fall to zero (no payroll for developers) and
distribution costs fall to zero (no cost to transmit copies of the software), revenue can also fall to
zero (users get free downloads) without causing an imbalance. Thus, economically, open source
projects can balance production and distribution costs with revenues at zero, but still generate
value in the form of system-wide, rather than project-specific, profits. Discussion of this non-
rival property of shared information is examined in the Literature Review, in section 2.1.1.4 on
complexity, specifically with reference to (Benkler, 2002).
Without transactional friction, the value created by open source can grow exponentially as
these system-wide profits are reinvested in the creation of more open source projects and open
source content, such as the ‘stack’ of software supporting the World Wide Web. Compound
returns result in exponential growth. Open source developers make extensive use of open source
development tools, source code version control systems and the internet, driving the open source
approach to become increasingly efficient. Kurzweil (2001) called this “The Law of Accelerating
Returns”. These ideas are discussed further in the Literature Review, in section 2.1.1.4.1 on
exponential growth and in section 2.1.2 on innovation.
1.3 Insights from Biology
In biology, ecosystems rely on system-wide interdependencies to regulate populations,
which tend to grow exponentially until bounded by constraints. The ‘invisible hand’ of Adam
Smith plays no role in ecosystems because natural systems lack discrete ‘costs’ for the system to
Open Source Software Development as a Complex System 9
minimize. As discrete costs disappear from the information exchanges involved in open source
software development, the system behaves less like an economic system and more like an
ecosystem.
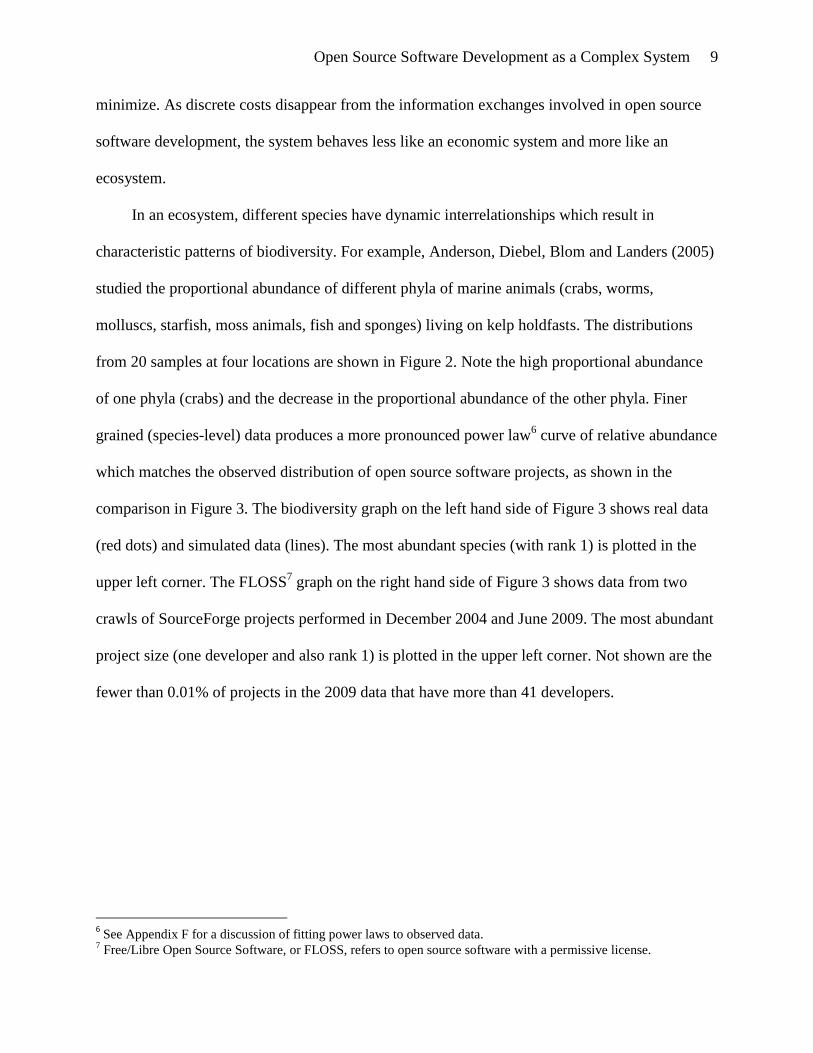
In an ecosystem, different species have dynamic interrelationships which result in
characteristic patterns of biodiversity. For example, Anderson, Diebel, Blom and Landers (2005)
studied the proportional abundance of different phyla of marine animals (crabs, worms,
molluscs, starfish, moss animals, fish and sponges) living on kelp holdfasts. The distributions
from 20 samples at four locations are shown in Figure 2. Note the high proportional abundance
of one phyla (crabs) and the decrease in the proportional abundance of the other phyla. Finer
grained (species-level) data produces a more pronounced power law6 curve of relative abundance
which matches the observed distribution of open source software projects, as shown in the
comparison in Figure 3. The biodiversity graph on the left hand side of Figure 3 shows real data
(red dots) and simulated data (lines). The most abundant species (with rank 1) is plotted in the
upper left corner. The FLOSS7 graph on the right hand side of Figure 3 shows data from two
crawls of SourceForge projects performed in December 2004 and June 2009. The most abundant
project size (one developer and also rank 1) is plotted in the upper left corner. Not shown are the
fewer than 0.01% of projects in the 2009 data that have more than 41 developers.
6 See Appendix F for a discussion of fitting power laws to observed data.
7 Free/Libre Open Source Software, or FLOSS, refers to open source software with a permissive license.

Open Source Software Development as a Complex System 10
Figure 2: Proportional abundances of the seven most abundant phyla on kelp holdfasts (Anderson, Diebel, Blom & Landers, 2005, Figure 5, p. 45).
Figure 3: Comparison of semi-log graphs of species-level biodiversity (left) and FLOSS development (right). Sources: (Hankin, 2007, Figure 1, p. 7; Radtke, 2011, Figure 6.3, p. 168).
This parallel between the observed distribution of life forms and the observed distribution
of open source project ‘forms’ suggests a cross-disciplinary transfer of insight. If both the
biological system and the open source system are complex systems, then tools used to
understand the former may be applied to understanding the latter, and tools for understanding

Open Source Software Development as a Complex System 11
complex systems in general may also be applied. Biological evolution has been studied,
historically, far longer than software development. Making this cross-disciplinary mapping of
theoretical ideas from biology onto software development via complexity theory provides new
and useful perspectives which are explored in the Literature Review, section 2.1.1 on complex
systems.
This three-way cross-disciplinary mapping (between biology, open source and complexity
theory) becomes particularly fruitful when contemporary developments in theoretical biology are
considered. Specifically, Darwin’s theory of natural selection and the Watson-Crick discovery of
DNA had been critiqued as providing insufficient explanations for two aspects of evolution:
diversity and complexity, the two general characteristics of complex systems examined
theoretically in (Page, 2011). Brooks and Wiley (1988) addressed the diversity issue in terms of
entropy, while Cabej (2011) addressed the complexity issue in terms of epigenetics, specifically
by identifying a role for the central nervous system in development. Both of these ideas may
hold useful insights for open source software development. Briefly, entropy helps explain some
dynamics of project initiation and forking while epigenetics suggests how creating software
involves the development of functionality through the writing of code. These topics are
addressed in the Literature Review, section 2.1.3 on evolution.
1.4 Thesis Structure
The thesis has the following structure. The remainder of this Introduction (chapter 1)
notes the artifacts produced during this research, including publications, prototype open source
projects, simulations, videos and presentations. The Literature Review (chapter 2) examines
material related to understanding open source software development as a complex system,
discussing literature from other disciplines along with prior open source research literature. The

Open Source Software Development as a Complex System 12
Research Design (chapter 3) presents the multi-methodological approach used in this study.
The Data (chapter 4) details the evidence collected from three related open source projects and
the application of three simulation tools to model open source software development. The
Discussion (chapter 5) reflects on the observations made in the projects and simulations. Finally,
the Conclusions/Implications (chapter 6) discuss limitations of the research findings and
suggestions for further research.
1.5 Artifacts
1.5.1 Publications.
Preparation of papers was secondary to this research as the primary thrust involved
development of an open source platform for verbal online presentations which could perform a
knowledge sharing function similar to a paper in a multi-media format8. Over 650 presentations
were made (see Appendix E for a selected annotated list), while two papers were prepared and
presented, and one of these was published.
Graves, J. (2010, December). Open Source Interactive Scripting: A Case Study of the Open
Allure Dialogue System. Paper presented at Creative Industries Conference 2010, AUT
University, Auckland, New Zealand. (unpublished)9.
Graves, J. (2011). Wiki-to-Speech for Mobile Presentations. Proceedings of the 2nd
Annual
Conference of Computing and Information Technology Education and Research in New
Zealand (CITRENZ2011), 81–86. Retrieved from
http://www.citrenz.ac.nz/conferences/2011/pdf/81-86.pdf
8 Similar to the Audio Slides feature introduced by Elsevier in mid-2012: http://www.elsevier.com/about/content-
innovation/audioslides-author-presentations-for-journal-articles 9 Available from https://dl.dropbox.com/u/12838403/20130319/Open%20Source%20Interactive%20Scripting.pdf

Open Source Software Development as a Complex System 13
1.5.2 Prototype open source projects.
This research generated three prototype open source projects hosted on the Google Code
source code repository, http://code.google.com. Each of the three projects listed here is described
in detail in the Data and Analysis chapter.
1.5.2.1 Open Allure Dialog System.
The Open Allure Dialog System project in Python began on 28 November 2009 at
http://code.google.com/p/open-allure-ds with the home page shown in Figure 4. Originally aimed
at creating a “voice and vision enabled dialog system” to compete in a contest with other
chatbots, the Open Allure project eventually became a platform for playing web-based
presentations.
Figure 4: Project Home page for Open Allure Dialog System initiated November 2009.
1.5.2.2 Wiki-to-Speech.
The Wiki-to-Speech project in Java for Android began on 13 January 2011 at
http://code.google.com/p/wiki-to-speech/ with the home page shown in Figure 5. The application
linked to the output of the web-based Open Allure system to deliver interactive mobile learning.

Open Source Software Development as a Complex System 14
Figure 5: Project Home page for Wiki-to-Speech project initiated January 2011.
1.5.2.3 SlideSpeech.
The SlideSpeech project in Python began 16 February 2012 at
http://code.google.com/p/slidespeech with the home page shown in Figure 6. SlideSpeech
repackaged and restructured features of the Open Allure project, focusing on authoring
interactive online presentations.
Figure 6: Project Home page for SlideSpeech initiated February 2012.
All three projects used Mercurial http://mercurial.selenic.com/ as the source control
management system.

Open Source Software Development as a Complex System 15
1.5.3 Simulations.
This research generated simulations in R http://www.r-project.org/, in Microsoft® Excel
http://office.microsoft.com/en-nz/excel/ and in NetLogo http://ccl.northwestern.edu/netlogo/.
The simulations listed here are discussed in detail in the section on Simulation, 4.5, and in the
appendices as noted.
1.5.3.1 Simulation in R.
The simulation in R developed by Hankin (2007) was applied to open source project data
available from (Weiss, 2005) and FLOSSmole (Howison, Conklin & Crowston, 2006). See
discussion in section 4.5.1 and Appendix A for sample results.
1.5.3.2 Simulation in Excel.
The Excel simulation was developed to produce the output shown in Figure 7. Each color
is a project. In the run shown in Figure 7, each of 10 developers begins with their own project. At
each simulation time step (a time period of unspecified duration during which one developer
makes a project choice), one developer starts a new project or switches projects by randomly
selecting another developer and joining their project. Each recalculation of the spreadsheet
shows an example of preferential attachment dynamics (press F9 to recalculate). Readers are
encouraged to download and try this. The spreadsheet is available from http://bit.ly/excelsim or
the longer equivalent URL.10
See discussion in section 4.5.2.
10
https://dl.dropbox.com/u/12838403/20130124/Developer%20Dynamics%2020130124.xlsx

Open Source Software Development as a Complex System 16
Figure 7: Sample output of Excel spreadsheet simulating preferential attachment.
1.5.3.3 Simulation in NetLogo.
The NetLogo simulation was developed to produce a time series graph of 250 projects and
a population of developers who start, join and quit the projects. The Info tab of the model
provides usage details. An example run is shown in Figure 8. Green squares are projects and red
dots are developers. Developers are connected to projects by links. The pool of developers not
connected to any project runs along the left edge of the simulation. Time runs vertically on a
‘piano roll’, with oldest at the top. The histogram of projects by “Developers on project” shows a
power law distribution with singletons for the largest projects. Older projects can be seen to
either have relatively high numbers of developers or to be abandoned.
The model is available for download from http://bit.ly/11utByE (or equivalent11
) and in
applet form (which plays directly in a web browser) from http://bit.ly/netlogosim (or
equivalent12
). Readers are encouraged to open and run this simulation applet on the web (Java 5
or higher is required). The source code is provided in Appendix B. See discussion in section
4.5.3.
11
https://dl.dropbox.com/u/12838403/20130124/Developer%20and%20Project%20Model%2020130124.nlogo 12
https://dl.dropbox.com/u/12838403/20130124/Developer%20and%20Project%20Model%2020130124.html

Open Source Software Development as a Complex System 17
Figure 8: Sample Run of Developer and Project NetLogo simulation.
1.5.4 Videos.
In the spirit of open science, 135 short videos were produced and posted to a YouTube
channel, http://bit.ly/openallure, showing work in progress during this research. An annotated
list of selected videos is provided in Appendix C.
1.5.5 SlideShare presentations.
Three slidecasts and two slide decks were prepared and posted on SlideShare.net, a web-
based slide sharing service. An annotated list is provided in Appendix D.
1.5.6 SlideSpeech presentations.
SlideSpeech presentations are slide presentations with voice recordings which play on each
slide (as with slidecasts) with the voice-over typically being computer-generated using text-to-

Open Source Software Development as a Complex System 18
speech. As of this writing, the SlideSpeech platform contains over 550 presentations created by
the author and nearly 2,000 more created by some of the 1,200 registered users, amongst the
6,571 unique visitors to the SlideSpeech website recorded by Google Analytics and reported in
Figure 9. (Despite this level of use, the open source project had not attracted contributing
developers.)
Figure 9: Google Analytics report for SlideSpeech as of 30 March 2013 showing 6,571 unique visitors since 26 July 2012. Maximum visits per day: 253 on 21 August 2012.
An annotated list of SlideSpeech presentations appears in Appendix E.

Open Source Software Development as a Complex System 19
2. Literature Review
This section of the thesis has two parts which cover, in turn, 1) theoretical ideas, derived
largely from related research in other fields, and 2) prior research into open source software
development, including specific prior research relating to simulation of open source project
dynamics. The material is presented in this order so the theoretical ideas can be applied in the
critique of the prior open source research. Some frequently cited works from the open source
literature such as (Lerner & Tirole, 2002) were reviewed for this study, but are not cited here;
such material was either addressed in subsequent cited publications (for example, Benkler, 2002)
or fell outside the focus of this research on project initiation and growth.
2.1 Theoretical Ideas
2.1.1 Open source software development as a complex system.
The conjecture proposed here, ‘open source software development is a complex system’,
requires evidence that open source software development is more than a software development
approach applied at a project level. The interactions of the agents in open source software
development produce system level behaviors. The claim is that the system exhibits properties
observed in other complex systems. These properties are examined one-by-one in the following
sub-sections: 2.1.1.1 sensitivity to initial conditions, 2.1.1.2 nonlinearity, 2.1.1.3 diversity,
2.1.1.4 complex structure, 2.1.1.5 unpredictability and 2.1.1.6 emergent patterns. The claim is
falsifiable if sense can be made of open source by approaching it as some other type of system,
such as the simple, complicated, chaotic or “disorder” systems described by Snowden (2007) as
the domains of the Cynefin framework13
(shown in Figure 10 and summarized in the following
13
Video introduction to Cynefin framework by Dave Snowden: http://www.youtube.com/watch?v=N7oz366X0-8

Open Source Software Development as a Complex System 20
paragraph). Hasan and Kazluaskas (2009) discussed the application of the Cynefin framework to
Information Systems and placed open source in the complex domain, as shown in Figure 11.
Figure 10: Cynefin decision making framework. Source: (Snowden, 2007, Figure 2, p. 69).
Briefly, Cynefin (“kuh-nev-in”) is a sense making or decision making framework, suitable
for exploration, which means the data comes first, then the response (as opposed to a
categorization framework, where the categories come first and the data are fit into the categories,
which is better suited to exploitation). In the complex domain, which has light constraints on
agents and where the agents modify the system, the appropriate decision model is “Probe, Sense,
Respond.” Decision makers should conduct “safe fail” experiments. If the experiments succeed,
amplify; if they fail, dampen. This approach results in emergent practices, which are
characteristically different and unique.

Open Source Software Development as a Complex System 21
Figure 11: Some changing aspects of computer programming located in domains of the Cynefin framework. Source: (Hasan & Kazlauskas, 2009, Figure 5, p. 9).
Applying the Cynefin framework to decision making in open source software development
involves collecting data and looking for patterns. Collections of ‘best practice’ and ‘good
practice’ ideas, such as (Fogel, 2005), have been put forward on the assumption that initiating an
open source software development project is a simple (known) or a complicated (knowable)
process. Yet the pattern of project growth—a few large projects and a multitude of single
developer projects following a power law distribution—has remained unchanged between 2004
and 2009, as shown by the graph in Figure 3 (p. 10). The majority of open source projects do not
grow beyond one developer. This suggests open source is at least a complex system where
sensing (measuring the state of the system) is an insufficient to guide the initiation of
collaborative development activity. It appears that new open source projects are used as probes
by developers to elicit system behaviors that can be sensed and to which they may respond. A
developer launching a new project does not know how other developers in the open source
community will respond to the new project, but they soon find out. The sensitivity to initial

Open Source Software Development as a Complex System 22
conditions is high. If a project gains traction, more resources are devoted to it, creating a
positive, nonlinear feedback loop. Thus, open source software development requires complex
systems theory to understand and explain the observed nonlinear dynamics.
Open source does not fall in the chaotic or disorder domains because patterns do emerge.
Specifically, 1) in terms of structure, the power law distribution of projects by developer count
shown in Figure 3 (p. 10) is an emergent pattern consistent with a complex system and 2) in
terms of behavior, a pattern of punctuated equilibrium is observed over sufficiently long periods
and replicated in simulation, as discussed in the Data and Analysis chapter, section 4.5.
The following sections provide evidence where open source software development matches
properties which characterize complex systems.
2.1.1.1 Sensitivity to initial conditions.
Consider the example of MINIX and Linux. Andrew S. Tanenbaum created MINIX in
1987, four years before the first release of Linux, publishing it in a computer science textbook
(Tanenbaum, 1987). MINIX did not become the basis of a free, open-source operating system (as
Linux did) because the publisher required a small license fee. That small fee was an obstacle to
sharing the MINIX operating system which Linux, which was free, did not have. This difference
in initial conditions resulted in dramatically different growth patterns between these two, similar
operating systems14
.
Sensitivity to initial conditions means a small a priori distinction can subsequently result in
large differences between those projects which grow and those projects which do not grow.
Large differences are caused by feedback loops which amplify small distinctions, some of which
occur by random chance. As a result, the founders and observers of successful open source
14
MINIX was relicensed–too late–as free and open source in 2000. http://www.minix3.org/ Subsequent activity can
be compared to Linux on Ohloh.net: http://www.ohloh.net/p/minix3 versus http://www.ohloh.net/p/linux

Open Source Software Development as a Complex System 23
projects have expressed a sense of ‘luck’ in making particular design choices. However, Taleb
(2012b) argued that luck cannot be a motivational driver—even if it is causal in terms of
selecting winners; what matters is the asymmetry of the payoffs: failed projects are small and
relatively harmless while successful projects can produce large gains. Without this asymmetry (if
failures were more costly and/or successes less spectacular), the tradeoff of risk and reward
would likely produce different behavior. How behavior would change is beyond the scope of this
research, but such questions have been examined in research such as (Ariely, Huber &
Wertenbroch, 2005).
2.1.1.2 Nonlinear value creation.
The value of the open source approach, then, taken as a whole, lies in the nonlinearity of
payoffs. This nonlinearity is a property of complex systems. Again, the full distribution of open
source projects includes many small failures and relatively few, but very significant, successes.
The benefit derived from these successes outweighs the cost of the failures.
For example, consider the following estimate of a portion of the value created by the Linux
kernel. Analysis by Ohloh15
indicated 10,000 contributors produced 15 million lines of code for
this project. Linux is the operating system used with the Apache web server. The NetCraft
survey16
finds Apache has on the order of 360 million installs, so the installations to contributors
ratio for Linux is on the order of 36,000 to 1, counting only the web server instances. If each
installation is valued at the price charged by Microsoft for a competing commercial product17
,
Windows Server 2012 (US$500), then the installed value per Linux contributor is US$18
million.
15
http://www.ohloh.net/p/linux/estimated_cost 16
http://news.netcraft.com/archives/2012/09/10/september-2012-web-server-survey.html 17
http://www.microsoft.com/en-us/server-cloud/windows-server/buy.aspx

Open Source Software Development as a Complex System 24
This very large, nonlinear upside value per contributor on one project can be compared in
scale on the downside with the 5.5 million18
other code repositories on Github, most of which are
used by a single developer for a single project. The cost price per Github repository19
is US$1.40
per month. Open source developers see opportunities in making such investments due to the
payoff asymmetry: downside of US$1.40 (after sunk cost of labor), upside of US$18 million.
2.1.1.3 Diversity.
Page (2011) defines complex systems as “collections of diverse, connected, interdependent
entities whose behavior is determined by rules, which may adapt, but need not” (p. 6). Open
source software projects, consisting of developers, users and software, fit each point of this
definition as detailed below. Moreover, the diversity relates to the characteristics of the system—
the interconnections—as well as to the internals of the independent entities in the system.
2.1.1.3.1 Projects are diverse.
Page (2011) identifies three flavors of diversity. Within a type, we call the diversity
variation. Between different contrasting types, we call it diversity. When parts connect
differently, we call it a difference of configuration. Open source software projects have all three
flavors of diversity. We observe variation in projects of the same type, a diversity of project
types and different project configurations.
2.1.1.3.1.1 Diversity within type (variation).
To illustrate diversity within type for open source software projects, compare the website
for UK Butterflies (http://www.ukbutterflies.co.uk/identification.php) with the website for
18
The number grows constantly. See https://github.com/search 19
https://github.com/plans US$7/month for 5 repositories

Open Source Software Development as a Complex System 25
JavaScript Object Notation (JSON) libraries (http://json.org/). The following sections detail the
parallels between the observed biological and technological variations: subtypes, related types,
supertypes and sources of diversity within type.
2.1.1.3.1.2 Subtypes.
Subtypes indicate the possibility of multiple solutions to essentially the same problem.
Butterflies (at least those in the UK) are classified into five subtypes: Hesperiidae, Papilionidae,
Pieridae, Lycaenidae, Nymphalidae. JSON libraries are classified by programming language.
The json.org website lists JSON libraries written in 53 different languages as of January 2013,
from ActionScript, Ada and ASP right through the alphabet to Visual Basic and Visual FoxPro.
Subtypes of butterflies and JSON libraries categorize diversity within type.
2.1.1.3.1.3 Related types.
Related types indicate the possibility of related solutions to the same, or similar, problem.
Butterflies are similar to moths, with one of the primary differences relating to the shape of the
antennae. Oversimplifying the matter, the butterfly’s antennae are thin while the moth’s are
bushy. Erikson and Hallberg (2011) compare JSON with YAML, which in turn are similar to
XML libraries, which have their own research literature, such as (Haw & Rao, 2007).
Oversimplifying again for the point of comparison, the JSON format is also ‘thin’ while the
XML format is ‘bushy’, as shown in Figure 12 which presents the same data in the two formats:

Open Source Software Development as a Complex System 26
JSON:
[true, null, -42.1e7, "A to Z"]
XML:
<array>
<element type="boolean">true</element>
<element type="null"/>
<element type="float">-42.1e7</element>
<element type="string">A to Z</element>
</array>
Figure 12: Comparison of JSON and XML syntax for the same data values.
These related types demonstrate one hierarchically higher level of diversity, but there are yet
higher levels.
2.1.1.3.1.4 Supertypes.
Supertypes indicate a hierarchy of solutions exists in a problem space. Butterflies belong to
the superorder of insects which go through complete metamorphosis between the larval, pupal,
and adult stages (http://tolweb.org/Endopterygota/8243) which includes ants, beetles and flies.
This superorder belongs to the even larger subclass of winged insects, some of which are aquatic
when immature, such as mayflies (http://tolweb.org/Pterygota/8210). That subclass is then part
of the larger class of insects, Insecta, in the kingdom Animalia.
A similar taxonomy can be observed in software. JSON belongs to the superorder of data
serialization formats which includes formats such as Multipurpose Internet Mail Extensions
(MIME) and Comma Separated Values (CSV). Libraries for reading all these different data
formats fall under the even larger subclass of projects which involve parsing, which is one step

Open Source Software Development as a Complex System 27
of the process of interpreting human readable source code so a computer program can be
executed. Parsing ‘gives the source code wings’ to be metaphorical about it. The subclass of
parsers applied to source code is thus part of the larger class of Programming Language software
which is a type of System Software. The subclass of parsers applied to data is part of the larger
classes of Productivity software and Utility software which are types of Application Software.
At the top of this classification hierarchy is the kingdom of Software.
2.1.1.3.1.5 Sources of diversity within type.
Variation within type indicates variability in environmental factors and historical
contingencies. Butterflies contend with all the usual biological challenges, such as finding food,
avoiding predators, mating and the weather. Leaving aside the question of the ultimate source of
biological diversity for the moment, different combinations of these constraints allow for
different species to evolve.
Within each type of software, variations arise related to the programming language used,
the platform for which the software was developed, the licensing options available and,
significantly, the different versions of the software released over time. Projects may
concurrently release production and beta versions, for example. Thus, along with
‘environmental’ factors, differences in project age and the stage of maturity contribute to a
diverse population of projects within a given type. This observation is explored further in the
section on path dependence, 2.1.1.4.2.
2.1.1.3.1.6 Diversity between different types
Open source projects all have one point of similarity: the openness of the source code.
Beyond that common property, each project is different. Diversity between different project

Open Source Software Development as a Complex System 28
types extends beyond the variations within type along various dimensions. Ultimately, different
types of projects have different goals. For example, all the JSON libraries have the goal of
parsing JSON, so they constitute one type of project. Having different goals introduces another
level of project diversity.
For example, compare two arbitrary projects. The first, Jackson, involves three contributors
developing a Java library for parsing data in the JSON format which is distributed as a single .jar
file under the Apache-2.0 and LGPL licenses; the second project, SVG-Edit, involves over two
dozen contributors developing a browser-based SVG drawing editor written in JavaScript under
the Apache License version 2.0. The Ohloh service (http://www.ohloh.net) simplifies making
such comparisons20
by collecting and analyzing open source code repositories to produce project
summaries. The dimensions of diversity between these two projects include size in terms of
number of contributors (3 or 28), language (Java or Javascript), size in terms of lines of source
code (90K or 40K), proportion of comment lines (average or low), mode of use (download/link
or browser-based), audience (developers or end users), license (LGPL or Apache), age (date of
first commit) and freshness (date of most recent commit) .
Arguably, open source projects are sufficiently different that studying them as a single type
makes drawing conclusions over all instances problematic. Imagine if, as a biologist, your field
of study was mammals, but you failed to differentiate between bats and dolphins. Common
behavioral patterns could be difficult to detect! Research into projects with an open source
approach routinely truncate the population studied to multi-developer projects, although this
means the subject of study is no longer open source in toto.
20
http://www.ohloh.net/p/svg-edit , http://www.ohloh.net/p/jackson

Open Source Software Development as a Complex System 29
A taxonomy of project types might be derived from the tags used on Ohloh21
, which have
the characteristic Zipf distribution22
shown in Figure 13 (the straight line on this log-log chart
with an exponent of -0.785). The primary differentiator appears to be language, with the top
three tags (by frequency) being java (23083), python (13136) and php (12571) as of February
2013. The observed ratio of python tags-to-java tags is 57% (13136/23083) while the Zipf curve
fit gives 58% (2-0.785
). So an emergent pattern of a power curve frequency distribution23
is
observed in the context of these project type tags. Perhaps, looking further down the list, web
(6896), game (6023) and library (3646) projects could be distinguished and studied separately or
comparatively. In any case, open source includes a diversity of project types.
21
http://www.ohloh.net/tags?page=5 22
Discussed in section 2.1.1.6.2 23
Discussed in Appendix F.
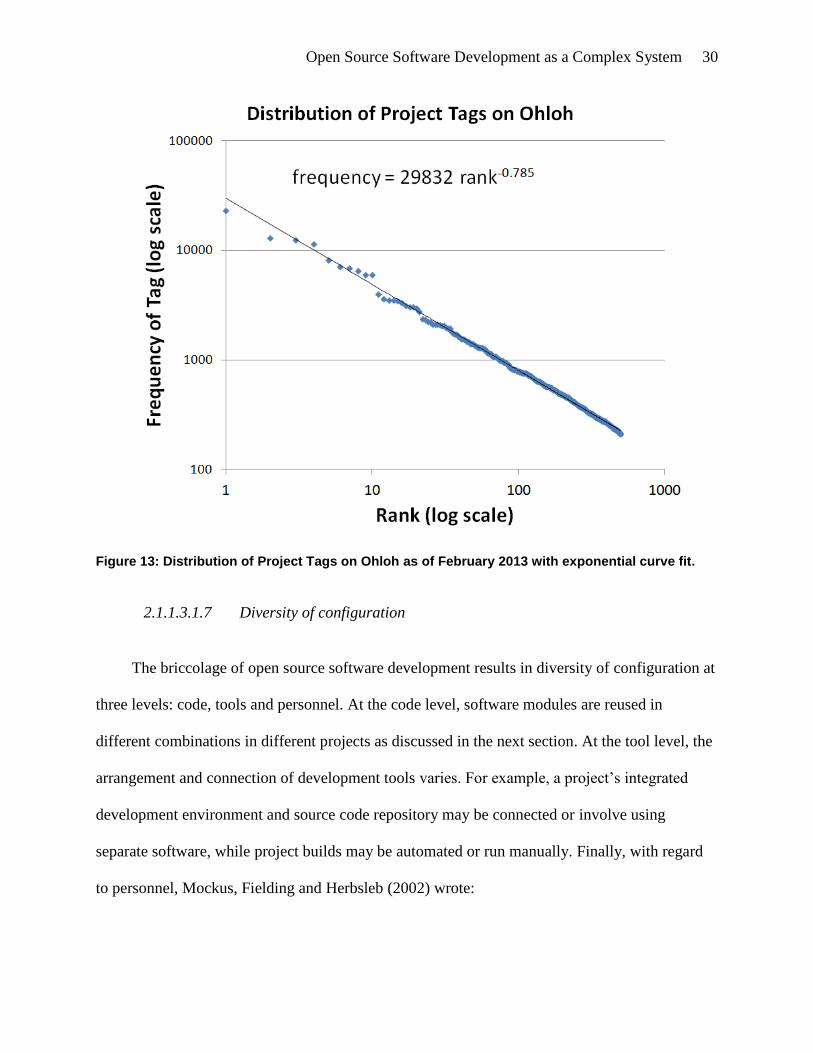
Open Source Software Development as a Complex System 30
Figure 13: Distribution of Project Tags on Ohloh as of February 2013 with exponential curve fit.
2.1.1.3.1.7 Diversity of configuration
The briccolage of open source software development results in diversity of configuration at
three levels: code, tools and personnel. At the code level, software modules are reused in
different combinations in different projects as discussed in the next section. At the tool level, the
arrangement and connection of development tools varies. For example, a project’s integrated
development environment and source code repository may be connected or involve using
separate software, while project builds may be automated or run manually. Finally, with regard
to personnel, Mockus, Fielding and Herbsleb (2002) wrote:

Open Source Software Development as a Complex System 31
“For the modules that we report on in Mozilla, we observed large differences between the
size of core team (22 to 35), the size of the communities that submit bug fixes that are
incorporated into the code (47 to 129), and that find and report bugs that are fixed (119 to
623), and estimated the total population of people that report defects (600 to 3,000)”
(p. 340).
In other words, there are many possible configurations relating to library/module selection,
development tool selection/use and development team organization which contribute to the
diversity of open source projects.
2.1.1.3.2 Projects are connected
Open source projects are diverse, but they are also connected, matching another criterion
for open source to qualify as a complex system.
Open source software development shares both people and code between projects. For
people, Madey, Freeh and Tynan (2002a) observed power law distributions for both the number
of projects with n developers and the number of developers on p projects, as shown in Figure 14.
Figure 14: Power Law Relationships: OSS Project Size and Developer Project Membership. Source: (Madey, Freeh & Tynan, 2002a, Figure 2, p. 1811).

Open Source Software Development as a Complex System 32
The log scale of the Y-axis of the two graphs in Figure 14 reveals the very high frequency
(in the tens of thousands) of 1-developer projects and developers with 1 project. Meanwhile, the
other tail of the frequency distribution with many-developer projects and developers with many
projects has very low frequency (less than 10). The decay in frequency follows a power law, with
the fit shown by the straight lines on the graphs. Beyond the 1-developer projects, however, open
source projects connect multiple developers in a wide variety of configurations. For example,
Crowston and Howison (2005) suggest an onion-like structure, with active users and co-
developers surrounding a project’s core developers.
Note, while the number of projects per developer has a mode of one, the one-
developer/one-project scenario is not the most typical; the distribution from the survey by Ghosh,
Glott, Krieger and Robles (2002) revealed nearly two-thirds of open source developers were
involved in more than one project, as shown in Figure 15. The figure shows 28.6% of the 2784
developers surveyed had only one current project. Thus, projects have only one developer
predominantly, but developers may have multiple projects (for which they are the sole developer
predominantly).

Open Source Software Development as a Complex System 33
Figure 15: Number of OS/FS Projects Involved In at Current. Source: (Ghosh, Glott, Krieger & Robles, 2002, Figure 24, p. 32).
For connections via code between projects, Livieri, Higo, Matushita and Inoue (2007)
examined the “percentage of clones between two files, projects or categories” (defined on p. 108
as the number of identical lines of code between two sources divided by the sum of the lines of
code in both sources) and observed a repository-wide 4% duplication of code for FreeBSD, an
open source operating system, as shown in Figure 16. In Figure 16, letters identify significant
areas of code duplication. Colors show the extent of code duplication, with 4% duplication
shown as light blue, for example. One project type (area J, shown in red) exhibited a cloning rate
of 46% between projects. Thus, nearly half the code was shared verbatim amongst this small
group of similar projects. The rarity of 0% code sharing (white areas in the figure) demonstrated

Open Source Software Development as a Complex System 34
the high frequency with which open source projects are connected via the re-use of existing code
in some way.
Figure 16: Color heatmap for the code clone coverage of the FreeBSD target (category view). Source: (Livieri, Higo, Matushita & Inoue, 2007, Figure 6, p. 7).
2.1.1.3.3 Projects are interdependent.
Evidence for the interdependence of open source projects can relate to the ‘connectedness’
of projects discussed above, where one project may literally overlap another in code or
personnel, but a complex systems perspective also considers different types of interdependence
such as competition or collaboration. Developer time is a limited resource with potentially more
demand than supply, particularly for highly skilled developers. Thus, a population of projects

Open Source Software Development as a Complex System 35
will compete for attention or mind share. Alternatively, modularization of a large project creates
smaller, interdependent projects which require coordination and collaboration. So the overall
open source system can be seen to involve complex interactions between external competition
for resources and internal cooperation.
Consider, however, the assertion that open source developers, particularly those working
solo, are independent, rather than interdependent, relative to the overall system. To clarify this
point, independence of action needs to be differentiated from independence in the means of
action. The independent actions of open source developers discussed in (Dalle & David, 2003)
stand in particular contrast to more structured ‘traditional’ approaches to software development,
such as the waterfall model, which exhibit a linear dependence on specifications and designs. As
Holthouse & Greenberg (1978) observed, before the internet, the “Scientific Software Life
Cycle” required enough independence to allow iteration, as they illustrated in Figure 17.
Figure 17: Two figures from (Holthouse & Greenberg, 1978) highlighting the iteration of the "Scientific Software Life Cycle" in contrast with "Traditional Software Life Cycle" (waterfall model).
Denning, Hern & Kern (1983) reported how the internet grew out of the desire of
independent computer scientists to connect so they could share e-mail, code, data and resources.

Open Source Software Development as a Complex System 36
In 1979, Lawrence Landweber at the University of Wisconsin proposed CSNET24
which the
National Science Foundation funded in January 1981. The proposal set out goals of logically
linking multiple physical computer networks in a “self-governing, self-sustaining, self-
supporting” way (Denning, Hern & Kern 1983, Figure 1, p. 144) that would be open to all
computer researchers. Thus, independent action was a specific design goal of the original
network.
When open source developers take advantage of independent access to the internet by
utilizing free source code repositories to share code, however, they cross a boundary between
independent work and systematic interdependency. The means employed are inherently
collaborative. The repositories allow others to copy and adapt any independently produced code
and offer an opportunity for others to provide feedback to the developer(s). A complex system
requires interaction and interdependence, not strict dependence, so the fact that developers can
and do act independently only adds to the complexity when they share code and work ‘together’
on open source projects.
2.1.1.3.4 Developer behavior is determined by rules which may adapt.
Collaborating on the development of open source software involves certain procedures
(such as version control) and certain permissions (licenses) which determine what developers can
and cannot do. Exploring the history of changes to these procedures and permissions is beyond
the scope of this work; however, for a discussion of licenses, see (Scacchi & Alspaugh, 2012)
and the distribution of license use in Appendix H. Instead, consider here evidence of the current
variety of these procedures and rules. After amassing a large sample of version control systems,
Mockus (2009, Table 2, p. 16) listed 26 “large and notable” forges, while the Open Source
24 http://pages.cs.wisc.edu/~lhl/

Open Source Software Development as a Complex System 37
Initiative listed 70 different licenses on their website25
as of January 2013. The relative
popularity of these licenses is examined in Appendix These many systems and rules for open
source software development will continue to change along with the underlying technology.
Raymond (1999) commented on the significance of these changing rules:
“Linux was the first project to make a conscious and successful effort to use the entire
world as its talent pool. ... [T]he gestation period of Linux coincided with the birth of the
World Wide Web, ... Linus [Torvalds] was the first person who learned how to play by the
new rules that pervasive Internet made possible” (pp. 39-40).
2.1.1.3.5 Users have diverse needs.
Weber (2005) noted one other dimension of diversity, the diversity of user needs:
“As information about what users want and need to do becomes more fine-grained, more
individually differentiated, and harder to communicate, the incentives grow to shift the
locus of innovation closer to them by empowering them with freely modifiable tools”
(p. 267).
For example, with Linux, this diversity finds expression in the wide variety of systems capable
of running the Linux kernel, including server, desktop, laptop, netbook, mobile phone, tablet and
embedded operating systems, illustrated by the cladogram in Figure 18 which shows 480
distributions. The diversity has increased over time as the kernel has been adapted to different
user requirements.
25
http://opensource.org/licenses/index.html

Open Source Software Development as a Complex System 38
Figure 18: Cladogram of 480 GNU/Linux distributions, placed on a timeline. Highlighted section is the Ubuntu branch, 2004 through 2012. Source: http://futurist.se/gldt/ version 12.10
In open source software development, developers (who must, at minimum, test their code) are a
subset of users. The growth patterns of open source project teams are thus inherently developer-
centric. Weber’s observations address how the ‘extra’ contributions made by users of open
source software relate to specifying functionality (an information flow) rather than delivering
functionality (doing the actual work of producing code). What developers make has not been
shown to influence how teams grow. For more details, see Appendix I.
2.1.1.4 Complexity.
This section explores how open source software development exhibits systemic
complexity. Complexity has been defined in different ways, so the first part of this section

Open Source Software Development as a Complex System 39
clarifies which characteristics of complexity are germane to open source. The preceding section
demonstrated how open source software development exhibits the diversity necessary to qualify
as a complex system by drawing parallels with biological diversity. The following section draws
from a more abstract perspective on complexity developed in the contexts of economics, physics
and information science.
Benkler (2002) introduced the notion of information opportunity cost in relation to peer
production (including open source software), where information refers to a reduction in
uncertainty and opportunity cost refers to the amount of reduction relative to perfect information
(no uncertainty). This perspective emphasizes how information lost by pricing systems and
hierarchical forms of organization can be captured by peer production systems. In effect, the
open source approach determines software quality and utility via the use of the software in
different contexts, rather than by a setting a price; since using software has costs, allowing others
to use it provides valuable information over time. Use creates value. For example, the extensive
use and peer review of Linux has reduced uncertainty about its effectiveness, as noted by Eric
Raymond in (Leonard, 1998).
Brooks and Wiley (1988), writing with reference to biological evolution, proposed
application of the concept of entropy from the second law of thermodynamics to explain how
complexity can arise from disorder. Evolution results in complex organisms adapted to their past.
While organisms are thus optimized (through use in different contexts), they are not perfect.
Thus the process of evolution effectively arrives at the same intermediate state (organization
based on imperfect information—what has worked in the past) from the other direction
(measuring relative to having no information, rather than having perfect information as Benkler
proposed). Figure 19 shows this relationship of time, information and complexity framed in

Open Source Software Development as a Complex System 40
terms of entropy, H. Over time, the maximum amount of entropy (theoretically possible states of
the system) increases, as does the observed level of entropy (actual possible states of the system),
allowing complexity to increase through transitions which reduce uncertainty. We know, for
example, that human reproduction takes place, and that this was not always the case. The fact
that humans reproduce creates more possible states while the fact that humans reproduce reduces
the uncertainty about what our genes make possible; hence, the passage of time yields greater
complexity, but relatively lower entropy. Again, use (in this case, life) creates information value.
Gell-Mann and Lloyd (1996, p. 4) equated entropy with ignorance, so when entropy decreases,
ignorance decreases.
Figure 19: The relationship between macroscopic information and complexity of a physical information system. Source: (Brooks & Wiley, 1988, Figure 2.5, p. 63).
Bak (1996) suggested the name self-organized criticality for the system state which results
as a system develops on the horizon between the extreme states of perfect order and complete
disorder. In this dynamic state, a complex system exhibits a characteristic pattern of a power law

Open Source Software Development as a Complex System 41
distribution of ‘catastrophic’ events, where positive feedback results in an avalanche. A viable
system needs a strategy for coping with and capitalizing on such events. In open source,
preferential attachment to a growing project causes a positive feedback loop. Taleb (2012a)
called this strategy “antifragile” since it allows for open source success when things ‘break’ the
right way (the lucky success), rather than the un-lucky breaking of something fragile
(‘catastrophic’ failure).
Thus, the following sections provide evidence where open source exhibits the
characteristics of complexity which fit together to form a complex system: exponential growth,
path dependence and an antifragile strategy for coping with uncertainty and extreme payoffs.
2.1.1.4.1 Exponential Growth.
Biological research offers models of population dynamics which may be useful for
understanding the complexity of open source. May (1976, p. 459) presented first-order, nonlinear
difference equations as “one of the simplest systems an ecologist can study.” These equations
take the form
Xt+1 = F(Xt) (1)
relating the magnitude of the population, X, in one generation at time t, to the population in the
next generation, at time t+1. Such a recursive rule can generate complicated population
dynamics.
For example, the equation
Xt+1 = a Xt (1-Xt) (2)
produces very different sequences for Xt depending on the value of the constant, a, as show in
Figure 20. These models relate to the time between generations.
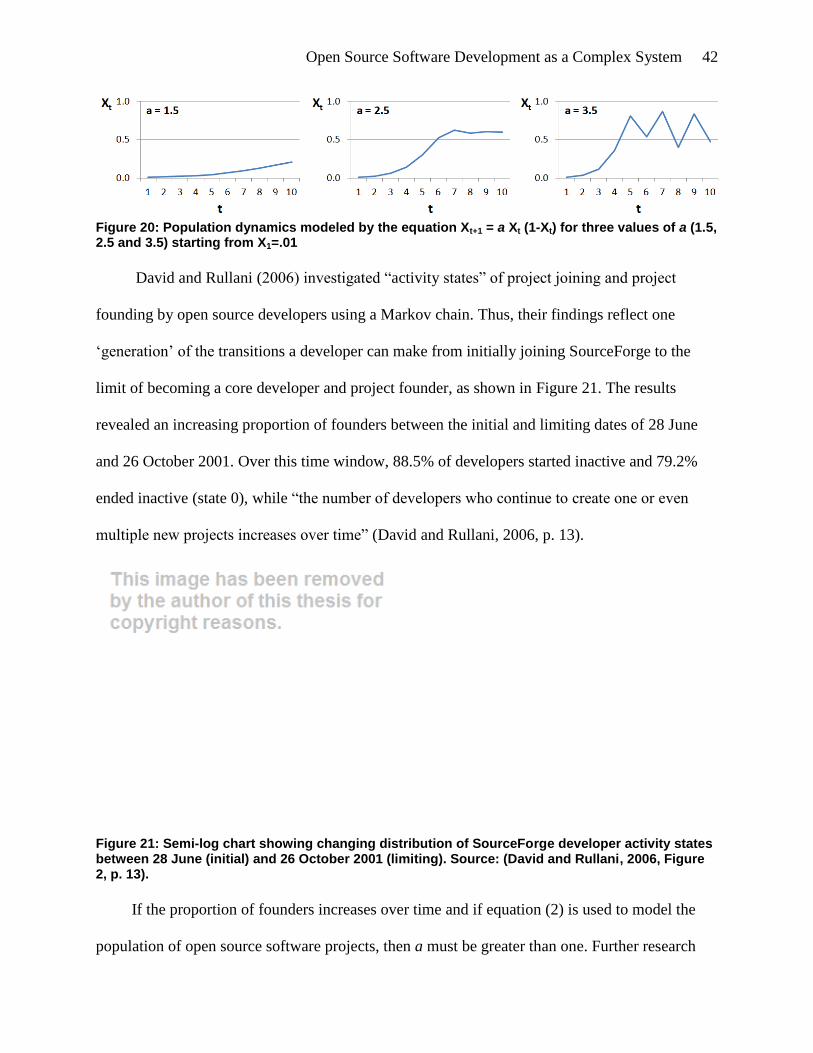
Open Source Software Development as a Complex System 42
Figure 20: Population dynamics modeled by the equation Xt+1 = a Xt (1-Xt) for three values of a (1.5, 2.5 and 3.5) starting from X1=.01
David and Rullani (2006) investigated “activity states” of project joining and project
founding by open source developers using a Markov chain. Thus, their findings reflect one
‘generation’ of the transitions a developer can make from initially joining SourceForge to the
limit of becoming a core developer and project founder, as shown in Figure 21. The results
revealed an increasing proportion of founders between the initial and limiting dates of 28 June
and 26 October 2001. Over this time window, 88.5% of developers started inactive and 79.2%
ended inactive (state 0), while “the number of developers who continue to create one or even
multiple new projects increases over time” (David and Rullani, 2006, p. 13).
Figure 21: Semi-log chart showing changing distribution of SourceForge developer activity states between 28 June (initial) and 26 October 2001 (limiting). Source: (David and Rullani, 2006, Figure 2, p. 13).
If the proportion of founders increases over time and if equation (2) is used to model the
population of open source software projects, then a must be greater than one. Further research

Open Source Software Development as a Complex System 43
might establish an estimated value for a and fit a population dynamics model to the open source
community. Previously, Deshpande and Riehle (2008) claimed exponential growth for open
source based on a sample of more than 5000 active and popular projects for the years 1990 to
2006; and the growth curve of SoureForge projects from July 2005 to June 2012 in Figure 2226
shows that exponential growth trend continuing:
Figure 22: Population of SourceForge Projects, July 2005 to June 2012, showing the exponential trend. Data Source: OpenSourceDelivers.com using data from Greg Madey’s SourceForge Research Data Archive (SRDA, http://srda.cse.nd.edu).
Merely observing this exponential trend in projects, however, is insufficient to establish a
causal relationship between the number of projects today and the number of projects next year,
particularly given the likely contribution of underlying trends in computing. Possible intrinsic
causes of growth are discussed in the section on Innovation, 2.1.2. For now, consider extrinsic
causes of open source project growth. As computers become exponentially more powerful and
less expensive over time, and new applications arise in different domains, exponentially more
26
http://opensourcedelivers.com/2012/07/20/sourceforge-data-repository-shows-rapid-new-project-growth/

Open Source Software Development as a Complex System 44
open source projects may result as a function of the larger addressable search space of
applications.
2.1.1.4.1.1 Moore’s Law.
Thus, one source of growth in open source is exponential growth in computing hardware.
Moore (1965) observed the complexity of integrated electronics increasing by a factor of two
each year. Moore’s Law thus exhibits exponential growth, expressed as 2t, where t is the number
of years.
2.1.1.4.1.2 Metcalfe’s Law.
Another source of exponential growth is network connectivity. Metcalfe’s Law27
(called “a
binary recombinant expansion process” in Weitzman, 1998, p. 337) asserts the value of a
network grows in proportion to the square of the number of pair connections. The formula is
N(N-1)/2, where N is the number of nodes on the network. So, as more compatible devices are
connected, the value of the network increases exponentially as N2, as shown in Figure 23:
27
http://vcmike.wordpress.com/2006/08/18/metcalfe-social-networks/

Open Source Software Development as a Complex System 45
Figure 23: Metcalfe’s Law illustrated by a graph from George Gilder from Forbes, September 1993, and later described in (Gilder, 2000).
2.1.1.4.1.3 Kurzweil’s Law.
Kurzweil (2001) proposed the Law of Accelerating Returns, or compound exponential
growth, for evolution in both biology and technology. As evolution explores a search space
related to reproduction, the efficiency of both the search and the reproduction increase, so the
rate of increase accelerates. Open source developers frequently use open source tools, so open
source as a system should also experience accelerating returns.
2.1.1.4.1.4 Reed’s Law.
Beyond even compound exponentials, however, Reed (1999) showed how networks of size
N allow the formation of 2N-N-1 possible groups. Weitzman (1998, p. 340) called this an
“expansion process of class ∞”. The following provides a brief derivation of Reed’s Law28
and
contrasts it with Metcalfe’s Law.
28
http://hbr.org/2001/02/the-law-of-the-pack/ar/1

Open Source Software Development as a Complex System 46
Given N individuals, select a set A. There would be 2N such subsets with multiple
members, since we can include or exclude each of the N individuals in each subset, except in the
cases where A is size 1 (which happens N times) or size 0 (which happens only once). Thus, the
total number of possible multiple member subsets (groups) of N is given by 2N-N-1. We can
confirm this in the case of individuals A, B, C and D (N=4) by simply listing the 24 - 4 - 1 = 11
groups:
ABCD ABC ABD ACD BCD AB AC AD BC BD CD
Metcalfe’s Law, in contrast, counts only the number of pair connections. Each node can
form a pair with every other node, except itself. We divide by 2 to avoid double counting, giving
N(N-1)/2 pairs. Confirming the math for N=4, we have 4(4-1)/2 = 6 pairs. These six pairs are
shown in bold above. Figure 24, a semi-log chart comparing Reed’s Law and Metcalfe’s Law,
shows how the number of possible groups grows much faster than the number of possible pairs.
Figure 24: Semi-log chart comparing Reed's Law with Metcalfe's Law.
Thus, networks can form vast numbers of overlapping groups. This theoretical possibility
allows observed patterns of open source project group formation to arise. Indeed, the theoretical

Open Source Software Development as a Complex System 47
implication of so many groups requires some explanation for why so few projects are actually
observed relative to the number possible. Constraints on project diversity are addressed in the
next section.
2.1.1.4.2 Path Dependence.
I had hoisted myself up on the shoulders of giants.
– Linus Torvalds
(Williams, 2002, p. 96)
An account of the complexity of open source software development profits from an
examination of its history. In particular, from a theoretical perspective, looking back to the
origins of the approach reveals prerequisites which made open source possible and necessary.
Enumerating these ancestral ideas and their genealogy informs our understanding in two ways.
First, historical facts reveal how specific people made new expressions or combinations of
existing ideas, creating the foundation for further inventions. Second, tracing out the pathway
leading to open source reveals changes as the approach developed relative to the environment in
which it was created.
‘People making changes’ defines the word development. When people make changes to
computer artifacts, we have software development. Open source software development, at the
level of this study, is a system for making and sharing changes to software. As a result, we need
to be pedantic regarding the word evolution and how it applies at this level of analysis. An
individual can grow and change, but does not evolve. Darwin (1859) explained evolution as a
population-level process of natural selection acting on variations in a population of individuals
(p. 7). In particular, evolution only occurs when a variation is reproduced in the population.
Consequently, the number of individuals exhibiting the variation must exceed one.

Open Source Software Development as a Complex System 48
Open source software development involves developers making changes to copies of
source code then sharing their changes back to the project so the changes can be merged and re-
copied. This study differs from studies focused on the one particular copy of an open source
project’s code found in its repository (or the ‘evolution’ observed via the history preserved in an
individual project’s code repository), since the variations of interest here are generated
elsewhere, specifically in the population of new projects. These may start with some copied
source code, but the modified code and any original new work is usually not merged back into
the preceding project(s) because the purpose or application of the new project is different from
the source(s). (The exceptional cases here are project ‘forks’ where the tines of the fork may later
be merged back together.) New projects can undergo proper Darwinian evolution with selection,
like biological species. For this level of analysis, the most important observations relate to the
growth and diversity of projects, rather than changes in the project code. In short, as with DNA
and living things, the code itself does not compete and evolve, but projects in the population of
projects do compete and evolve.
2.1.1.4.3 Origins of open source.
The qualifier “open source” is claimed to have been coined on 3 February 1998 at a
meeting in Palo Alto, California by a group including Eric Raymond and Bruce Perens who
founded the Open Source Initiative (OSI) later that month29
. Netscape had released the source
code for the Netscape Communicator web browser on 22 January 1998, referring to themselves
as “a premier provider of open software” in the press release30
. OSI was created to advocate for
more collaboration and sharing of source code.
29
http://opensource.org/history 30 https://blog.lizardwrangler.com/2008/01/22/january-22-1998-the-beginning-of-mozilla/

Open Source Software Development as a Complex System 49
The “open source” terminology built on a prior formal statement regarding sharing source
code published by Richard Stallman as “The {GNU} Manifesto” in March 198531
. One
statement in this manifesto reads: “Complete system sources will be available to everyone.”
Explaining that statement requires going back even further in computing history. Source
code is required for making modifications to software due to the distinction between the source
code, written in a human readable programming language, and the machine executable object
code produced from a program by a compiler. The separation of source and executable code
traces back at least to the creation of the first complete FORTRAN compiler published in April
1957. The lineage is traced out in Figure 25 from (Solé, Valverde, Casals, Kauffman, Farmer&
Eldredge, 2013) which uses yellow and violet for highlighting procedural languages, blue for the
object-oriented languages, green for languages used in artificial intelligence and red for
languages used in systems programming. Notably, the cover page of that original FORTRAN
user manual32
stated, “This material may be reproduced as desired.”
31 http://www.gnu.org/gnu/manifesto.html 32
http://www.softwarepreservation.org/projects/FORTRAN/manual/Intro-Section_II.pdf

Open Source Software Development as a Complex System 50
Figure 25: A network of innovations in programming languages. Source: (Solé, Valverde, Casals, Kauffman, Farmer& Eldredge, 2013, Figure 7a, p. 24).
Thus, although the wording has changed, the basic concept of sharing copies has remained
the same ever since the innovations which led to the separation of source and executable code:
‘open source’ means copying and sharing software source code is free and unrestricted to enable
study and modification. Subsequently, the definition was formalized at OSI33
to include ten
33
http://opensource.org/osd
Open Source Software Development as a Complex System 51
criteria: Free Redistribution, including Source Code and a Technology-Neutral License, Not
Specific to a Product, allowing Derived Works, potentially protecting the Integrity of The
Author's Source Code, without Discrimination Against Persons or Groups, or Fields of
Endeavor. So open source was made possible by sharing and made necessary by economic
pressure to not share (software licensing).
Thus, ‘open source’, as a distinct approach to software development (although not referred
to as such until later), preceded the commercialization of software development and the
treatment of software source code as property. The United States Copyright Office began
accepting copyright registrations for computer programs on 19 May 196434
. Johnson (1998)
related the story of the first proprietary software product:Autoflow, introduced by ADR in 1965;
IBM began to sell software separately from hardware starting on 1 January 1970. By 1977, a
Standard Industry Classification code (7273) was introduced to track software publishers35
.
Microsoft was founded on 4 April 1975, became a public company on 13 March 1986 and grew
to become the world’s most valuable company on 30 December 1999 with a market
capitalization of US$616.3 billion36
. Closed source software development, where modifications
to source code are emphatically not shared, has historically been a standout economic success.
34
http://heinonline.org/HOL/Page?handle=hein.journals/jocoso11&g_sent=1&
collection=journals&id=401 35 See http://www.census.gov/epcd/www/sic.html
From 1997, NAICS 511210 http://www.naics.com/censusfiles/ND511210.HTM
From 1999, Global Industry Classification Standard (GICS) grouped Information Technology companies
into 4510 Software & Services and 4520 Technology Hardware & Equipment
http://www.msci.com/resources/xls/GICS_map_199908-20020328.xls
From 2005, Industry Classification Benchmark (ICB) distinguished 9530 Software & Computer Services
from 9570 Technology Hardware & Equipment
http://www.icbenchmark.com/ICBDocs/Structure_Defs_English.xlsx 36
Microsoft’s record was surpassed by Apple Computer on 20 August 2012.
http://blogs.wsj.com/marketbeat/2012/08/20/apples-market-value-to-infinity-and-beyond/

Open Source Software Development as a Complex System 52
Meanwhile, open source software can take significant credit for helping to create the
internet37
, which contributed US$1,672 billion to global gross domestic product in 2009
according to (McKinsey, 2011)38
. Thus, by economic measures, both open and closed source
software have created value for billions of users globally. Proprietary software products compete
in a market with product dynamics driven by customers. Open source projects also compete with
project dynamics driven by developers and users.
Without the friction of payment, users are free to obtain and use open source software,
joining the user population for that software in the process. Weber (2005) explored the
implications of this user group membership from a political and economic perspective and
concluded that users create value. Instead of causing an unravelling of economic incentives by
free riding on the work of the developers, some users voluntarily take on the role of suggesting
new ideas and quality improvements. Developers are a subset of the user group, so the feedback
provided by such user-developers can be particularly useful. This shift from a pure consumer
role to a potential contributor role changes the number of parties involved beyond Metcalfe’s
pairs (a seller and buyer of a proprietary product linked through a single transaction) toward
Reed’s groups (overlapping users and developers, where a change suggested by a user that is
implemented by a developer benefits all the users), discussed in section 2.1.1.4.1.4.
Wikipedia provides a showcase for the mutual benefits of the resulting system. Most
visitors to Wikipedia simply read the articles, but some contribute new material while others
correct and enhance the existing material. Users of Wikipedia can switch at any time from a pure
consumption role to a producer/consumer, or “prosumer” role (Tofler, 1980). The scope and
quality of the shared material thus continually improves over time as a function of use.
37
The World Wide Web was placed in the public domain by CERN on 30 April 1993:
https://cds.cern.ch/record/1164399 38 Google also collects research on the value of the internet at http://www.valueoftheweb.com/

Open Source Software Development as a Complex System 53
Incremental improvements involve path dependence. Specifically, a ‘stub’ article may be created
to which subsequent additions, improvements and corrections are made. Anderka and Stein
(2012) examined Wikipedia’s integrated system for identifying flaws, called cleanup tags. These
tags are found on one in four Wikipedia articles. Similarly, open source projects have bug
reporting or issue tracking systems. The relative scale of the overlapping groups of users and
developers suggests the leverage possible from linking user contributions with distribution of the
products of open source development work. For Wikipedia in October 2012, the user group was
488 million39
while the developer group for Mediawiki was 88440
, a ratio of over 500,000 users
per developer.
The computer researchers who developed the internet welcomed everyone who was
conducting research to join the network. The system began as a tool for that open group. The
openness allowed for the formation of other groups, in addition to providing connections for
many pair-wise person-to-person e-mail communications. Shirky (2008, p. 54) called the new
technically-enabled multi-person communication capability “ridiculously easy group-forming.”
For example, the ‘reply all’ feature of e-mail provides a simple means to carry out the task of
group communication.
Groups form through connections; hence, the formation process has inherent path
dependence. If different people joined a team at an early stage, it would not only be a different
team, but subsequent members of the team would also be likely to differ, as discussed in
(Beckman & Burton, 2008). While computer networks are capable of sustaining communication
connections between large groups of people (for example, a large mailing list), the people
involved are not necessarily capable of sustained communication with everyone in the group (too
39
http://reportcard.wmflabs.org/ 40 https://www.ohloh.net/orgs/wikimedia
Open Source Software Development as a Complex System 54
many posts on a mailing list make it less useful). Groups thus tend to self-organize in a manner
which allows members to communicate in a familiar and comfortable way; McPherson, Smith-
Lovin & Cook (2001) called this homophily. Combining these two observations suggests how the
number of actual groups becomes a constrained subset of the number of possible groups: viable
groups are those which form with the right people at the right time for the group members to
communicate comfortably. Studies of the key roles of senior, core developers in open source
projects, such as (Xu, Christley & Madey, 2006), bear this out. Nevertheless, new projects
constantly start and grow, yielding a mixture of mature and immature projects following
different paths.
2.1.1.4.4 Antifragile strategy.
Given a theoretically exponential number of possibilities constrained by path dependence,
open source has the potential to run into developmental dead ends. An antifragile strategy helps
the open source approach avoid this fate. Taleb (2012a) defined an antifragile strategy as one
having more upside than downside resulting from random events. Since a tea cup may be
knocked from a table and broken, the potential for this random event or ‘accident’ causes the tea
cup to be fragile. If a random event or ‘accident’ causes a gain rather than a loss, Taleb calls it
antifragile.
Key to success with such a strategy is a convex payoff function, with outsized benefits
from the unpredictable (‘accidental’) variations, as shown in Figure 26. Variable X is an
exposure. A convex payoff function yields nonlinear gains as the exposure increases. Some small
quantity of exposure incurs a small loss. Larger exposures result in large gains.

Open Source Software Development as a Complex System 55
Figure 26: More Gain than Pain from a Random Event. Source: (Taleb, 2012b, Figure 1).
According to Taleb, an antifragile strategy ‘likes’ time, since longer time periods offer
more opportunities for rare, but highly rewarding, outcomes. For example, Taleb characterizes
evolution as “achievement of potential stochastic gains thanks to continuous, repetitive, small,
localized mistakes” (Taleb, 2012a, p. 349). Open source succeeds overall due to the
extraordinary, nonlinear growth of a small minority of projects. While projects using the
approach are ‘right’ only a small fraction of the time, the cost of being wrong is limited to the
time invested in creating a project on a code repository and posting some code. This cost is far
lower than the payoff for being right—where a project grows, developers collaborate and many
users benefit. Hence, open source exhibits a convexity of payoffs, with the exposure variable, X,
being the investment of developer time. This exposure may be small for individual developers,
but it becomes quite large when summed across the population of open source developers.

Open Source Software Development as a Complex System 56
2.1.1.5 Unpredictability.
Complex systems can be counter-intuitive. In particular, the extreme behaviors of complex
systems are unpredictable. Much of our experience, and hence intuition, leads us to expect linear
relationships, with normal distributions of error.
For example, Newton's Second Law states that force equals mass times acceleration, so
given the constant acceleration of gravity the force needed to lift something increases in
proportion to the mass, or amount. As we select a carton of milk from the dairy case, the litre
size is more or less half the weight of the two litre size. More milk weighs more. We take this
type of linear variation for granted. It is normal in both the statistical and the colloquial sense.
We would be quite surprised to encounter a dairy case where the weight-to-size
relationship was nonlinear. Imagine if two litres of milk weighed four times one litre. This type
of nonlinear surprise is what catches us off guard when we attempt to sit on a seat which turns
out to be lower than we thought, or when we step off a curb unexpectedly. Since sitting and
walking are both controlled falls from a standing position, once we start to sit or step forward our
body begins to accelerate and the distance we fall changes exponentially with the formula -1/2 g
t2, where g is the acceleration of gravity and t is time. So if we fall for twice as much time as
expected, we fall through four times the distance. Thus a small misjudgment (prediction error)
can result in a nasty surprise, such as a sprained ankle.
Complex systems have nonlinear feedback patterns which produce such surprises.
Consequently, they cause significant prediction errors when analyzed with inappropriate models.
Taleb (2012a) calls this the Turkey problem. Right before Thanksgiving Day, the turkey has a
positive relationship with the farmer who provides food every day. The turkey's linear model
predicts a future of more or less unlimited free meals. Unfortunately, Thanksgiving Day is not

Open Source Software Development as a Complex System 57
part of the turkey's model. Such prediction errors can be fatal. Events which fall outside the
variability expected from observations of past events can have particularly significant payoffs
(both positive and negative) because of the surprise factor.
In open source, unpredictability arises from sparse data related to extreme events and the
diversity of open source projects. For example, in a review of 36 articles on prediction studies,
Syeed, Kilamo, Hammouda and Systä (2012) concluded:
“Q3. What metrics persist across the domains of the OSS projects?
Researchers studied the effectiveness and accuracy of several metric suites using data from
one or more OSS projects. Despite of their esteemed contribution in predicting OSS
projects, they suffer from lack of generalizability due to the diverse nature of OSS projects
and the project specific nature of the metric suites” (p. 283).
2.1.1.6 Emergent patterns
Complex systems characteristically exhibit emergent patterns. These patterns emerge from
system dynamics in ways that can make the assignment of cause-and-effect relationships, and
hence control of the system, problematic (Snowden, 2007). The following discussion begins with
emergent patterns in cellular automata to provide background for understanding preferential
attachment and the consequent emergent pattern observed in open source projects.
2.1.1.6.1 Cellular automata: emergent patterns from simple rules.
Wolfram (2002) used computers to show how complexity can arise from simple
generational patterns. In particular, he found one of the simplest possible one-dimensional
cellular automata produced a variety of unexpected, random patterns. If something so simple
could produce complexity, he argued, then other complex phenomena could have equally simple,

Open Source Software Development as a Complex System 58
algorithmic explanations. This discussion of cellular automata lays a foundation for the idea of
preferential attachment and its application in an agent-based model of open source software
development presented in section 4.5 on Simulations in the Data and Analysis chapter.
Cellular automata are rule-based systems of cells. Consider a row of cells. Each cell may be
black or white, 1 or 0. Rules specify how to make a new row from an existing row. The simplest
rules are the null rules: make all cells in the new row white or all cells black. Next simplest are
the one-for-one copy rule and the invert rule: make a cell the same color in the new row as in the
old row, or the opposite color. Next, a cell’s color can be specified in relation to three values
from the old row: the cell in the same position and each of its neighbors (left and right). This
simple level of ‘awareness’ of self and other is sufficient to generate unpredictable complex
behavior: an emergent pattern. Cellular automata allow exploration of this ‘expression’ of rules:
the transformation from specification to implementation, from genotype to phenotype. A small
change in the rules can have a dramatic effect.
Specifically, the change in specification from Wolfram’s cellular automata Rule 26 to Rule
30 is only one bit out of 32, but the results exhibit an entirely different kind of pattern. The
pattern of Rule 26 is highly regular while Rule 30 demonstrates an irregular, emergent pattern,
shown in Figure 27.

Open Source Software Development as a Complex System 59
Figure 27: Cellular automata from (Wolfram, 2002, p. 24), reordered and colored to highlight the difference in the “story” of Rule 26 compared to Rule 30.
In Figure 27, two cellular automata rules from (Wolfram, 2002, p. 24) have been reordered to
collect all the ‘self=1’ rules on the left and colored to highlight the difference in the ‘story’ of
Rule 26 compared to Rule 30. For Wolfram’s Rule 26, the black cells in each new row are
generated when white cells have one black neighbor in the old row (red highlight) while in Rule
30, black cells are also copied unless there is a neighbor on the left (blue highlight). This makes
Rule 30 both ‘self aware’ and handed (biased to one side). Thus, changing one bit in Rule 26
(gray highlight) results in the unpredictable, emergent complexity of Rule 30.
When writing a program, a software developer considers their own personal needs and
possibly the needs of other developers or users. The difference in the rules between open source
and closed source (proprietary) software development is small, yet it alters the relationship
between the developer and the users. In particular, the open source developer may also be a user
and knows the user group may include other developers. This overlap of the user and developer
groups introduces a ‘self awareness’ and a bias, like the handedness of the cellular automata,
which can lead to emergent behavior. Moreover, a developer is more likely to start or join a
Open Source Software Development as a Complex System 60
project with familiar developers than with strangers (Hahn, Moon & Zhang, 2008, H1 on p. 383).
This study explores some of the complexities of project initiation and the growth of open source
projects through such a lens.
2.1.1.6.2 Preferential attachment.
Barabasi and Albert (1999) observed that networks exhibit an emergent property of a scale-
free power law distribution of vertex connectivity when new vertices are added and connected
preferentially to well-connected vertices. Scale-free means the patterns are evident at all levels,
from the overview of the full system down to the most detailed view. They speculated this
phenomenon of preferential attachment could have widespread application:
“Similar mechanisms could explain the origin of the social and economic disparities
governing competitive systems, because the scale-free inhomogeneities are the inevitable
consequence of self-organization due to the local decisions made by the individual vertices,
based on information that is biased toward the more visible (richer) vertices, irrespective of
the nature and origin of this visibility” (Barabasi & Albert, 1999, p. 512).
Thus, preferential attachment could cause the power law distributions of biodiversity (species
abundance) or the distribution of open source software projects. Abundant species tend to remain
or become more abundant because of the greater chances for subsequent generations born from
more parents. Large open source projects tend to attract more developers simply by virtue of
their developer count; the developers already involved will communicate about their
involvement with a larger group of potential project members than the developers working on a
smaller project.
Looking at open source software from the user side, Feitelson, Heller and Schach (2006)
studied download counts from open source projects, giving specific consideration to deviations

Open Source Software Development as a Complex System 61
from Zipf’s Law, a scale-free power law. In a study of word frequency, Zipf (1949) found the
number of occurrences of a word, n, is proportional to the inverse of the rank, r:
n ∝ 1/r or log(n) ∝ -log(r) (3)
Thus, the relationship is nonlinear (1, ½, ⅓, ¼, …). Observations fall on a straight line on a log-
log chart when Zipf’s Law holds true. The recurrence of this pattern in different populations—
word usage, open source software downloads and biodiversity—suggests the possibility of
commonalities within these different contexts.
Figure 28 shows a log-log chart of downloads and download rank from (Feitelson, Heller &
Schach, 2006), side-by-side with a chart showing a similar pattern from the literature of
mathematical evolution from (Yule, 1925). Yule noted a power law relationship between
biological types (genera) and subtypes (species). Specifically, in the Leguminosae (peas, beans,
legumes) family shown in the Figure, “monotypic genera are the most frequent, ditypic genera
less frequent, tritypic genera less frequent still, and so on, the numbers trailing away as the size
of genus is increased” (Yule, 1925, p. 26). For downloads, “Super-projects” have the highest
numbers of downloads while “struggling” projects have the lowest. The comparison suggests
"Super-projects" may each be a unique type while “struggling” projects may be relatively
undifferentiated.

Open Source Software Development as a Complex System 62
Figure 28: Comparison of log-log charts of genera / species (left) and open source project downloads / rank (right). Sources: (Yule, 1925, Figure 3, p. 46; Feitelson, Heller & Schach, 2006, Figure 2, p. 3).
Placing these charts side-by-side suggests how preferential attachment may be at work in
both contexts. In taxonomy, genus is above species hierarchically. Counting the number of
species within a genus provides a measure of diversity, so a genus with only one species exhibits
uniqueness (no diversity). High diversity indicates extensive exploration of the ecological search
space, which takes time; or low selection pressure; or both. New species will preferentially attach
to a genus which already contains many species, as modeled in (Maruvka, Kessler & Shnerb,
2011).
A quality of uniqueness may contribute to making certain open source software projects
outstandingly successful. Preferential attachment of developers to a one-of-a-kind project can
drive a positive feedback loop which allows that project to become a standout success. Note how
the uniqueness of a project viewed from this perspective relates to external factors, such as the
number and quality of other similar projects, which are not captured in any uniform and
repeatable way in the project’s organization or code repository.
Yule (1925) stated the following assumptions for his model of evolution:

Open Source Software Development as a Complex System 63
(1) “Within any species, in an interval of time, an ‘accident’ may happen that brings about a
(viable) ‘specific mutation,’ i.e., the throwing of a new form which is regarded as a new
species, but a species within the same genus as the parent.
The chance of this occurrence in any assigned interval of time (an hour, or a year or a
century) is taken as the same for all species within the group considered and as a constant
for all time.”
(2) “Within any genus, in any interval of time, an ‘accident’ may happen that brings about
the throwing of a (viable) ‘generic mutation,’ i.e., a new form so different from the parent
that it will be placed in a new genus.
The chance for this occurrence in any assigned interval of time is similarly taken as the
same for all genera within the group considered and as constant for all time” (p. 24).
Note for future reference this contrast of “specific” and “generic” accidents, as they are
shown shortly to parallel the “local” and “distant” factors proposed in (Fleming, 1998) in the
context of innovation. Also note the neutrality of Yule’s model: the chance of an “accident”
happening is the same for all and constant, as elaborated in the following section.
2.1.1.6.3 A neutral model.
Thus, viewing open source software development from a complex systems perspective
reveals a connection with models of evolution, biodiversity and information theory. Observations
regarding complexity arising from simple rules lead to consideration of a simple theoretical
explanation for the skewed distribution of open source software projects. The model needs to
explain why a few projects grow while so many others do not. Perhaps the distribution depends
on luck (historical accident), rather than on generically ‘successful’ project characteristics, with
subsequent growth fueled by preferential attachment.

Open Source Software Development as a Complex System 64
Hubbell (2001) proposed a unified neutral theory of biodiversity (UNTB) which defined
neutrality in the specific sense of each individual interacting with the ecology under the same
rules. Hankin (2007) implemented a computer simulation of UNTB as a set of simple rules:
“Consider a system of JM individuals, and a timestep sufficiently short for only a single
individual to die. Then:
1. Choose a site at random; the individual at this site dies.
2. With probability 1 − ν, an individual of species chosen at random from the remaining
population is born
3. With probability ν, an individual of a new species is born.
Subsequent timesteps may be enacted using the new community as a pool in step 2” (p.
3)
The ranked population abundance chart produced by this simulation matches published
distributions for the population of open source projects. A simulation applying this model to
open source project data is discussed in the Data and Analysis chapter. The algorithm
implements preferential attachment in step 2 with a random selection. From a software
engineering perspective, this result could be quite discouraging, as it suggests the open source
process is inherently stochastic rather than deterministic; that an open source project cannot be
designed to grow with certainty. The next section explores the possibility of viewing this
uncertainty in a positive light, as a source of innovation.
2.1.2 Open source software development as an innovation system
Modeling open source software development as a complex system exhibiting preferential
attachment highlights the problem of project origination noted in (Raymond, 1999):

Open Source Software Development as a Complex System 65
“It is fairly clear that one cannot code from the ground up in bazaar style. One can test,
debug and improve in bazaar style, but it would be very hard to originate a project in bazaar
mode. ... When you start community-building, what you need to be able to present is a
plausible promise” (p. 37).
Plausibility turns out to have its own research literature. Scacchi (2006) surveyed research
related to innovation which might have relevance to open source. Just as considerable thought
was devoted to the origins and organization of living things before open source software existed,
much thought had also been devoted to the origins and organization of ideas. This body of work
is beyond the scope of this research, but the following section dips into it to extract two useful
concepts: recombinant search (Fleming, 1998) and the conditions for beneficial diversity (Page,
2008). Open source provides a laboratory for the study of the development of ideas, as code
repositories record the history of both successful and unsuccessful projects, capturing details of
the changes made to the code in each project, including who worked on it and when. Some of
this data may be understood in light of research into the process of invention.
2.1.2.1 Recombinant search.
When writing a new open source program, a software developer may start by looking for
work done by others to use or modify, as discussed in (Haefliger, Von Krogh & Spaeth, 2008).
The public exposure of source code for search, study and use by others is considered one of the
benefits of the open source approach. The search and development process naturally involves a
creative synthesis where libraries and bits of code are brought together in a new project. Fleming
(1998) explains how such recombinant search produces new inventions. Combining “local”
factors exploits familiar, frequently used inventions; combining “distant” factors explores more
Open Source Software Development as a Complex System 66
of the search space, with higher likelihoods for both failure and breakthrough. Fleming uses the
example of ink jet printing to illustrate a combination of familiar factors; the factors (glass slides,
ink, thin-film resistor material and a power source) had all been used previously (Fleming, 1998,
pp. 56-57). Alternatively, a computer using an optical disk drive rather than a magnetic drive
illustrates a discontinuous combination (Fleming, 1998, p. 59). Figure 29 illustrates how factors
of both types may combine over time. “The nodes are inventions, and arcs indicate that a
succeeding invention has drawn from a preceding invention or from outside the extant
technosphere” (Fleming, 1998, p. 27).
Figure 29: Illustration from (Fleming, 1998, Figure 1, p. 27) showing “The holistic web of technological evolution.”
A new open source project may have a better chance of growing when it builds upon
familiar, frequently used ‘standards.’ On the other hand, a new project is likely to require some
untried techniques to generate a breakthrough. Rosenberg (2008) summarized this neatly in
Rosenberg’s Law:
“[Rosenberg's Law]
Software is easy to make, except when you want it to do something new.
[Corollary]
The only software that's worth making is software that does something new” (p. 268).

Open Source Software Development as a Complex System 67
The number of possible factor combinations grows until the search space becomes so large
that the time required for exploration becomes a constraint. Consequently, Weitzman (1998, p.
357) argued that path dependence becomes greater over time as the number of paths not taken
expands combinatorially. Paths not taken include paths taken only so far and then abandoned;
these appear in open source code repositories as projects with no growth. David and Rullani
(2007) noted the resulting “dissipative” effort in open source software development, stating,
“[The Free/Libre Open Source Software] mode of innovation is able to generate a substantial
amount of both exploration and exploitation” (p. 21).
The ability of search engines to automate the scanning and indexing of open source
software enhances the visibility of potential factors for recombination. An open source developer
may often be presented with a choice of ‘hits’ in response to a search query. Crowdsourcing the
curation of search results, or finding answers to technical questions as demonstrated at
StackOverflow (http://stackoverflow.com), potentially accelerates the pace of innovation by
shortening the factor search time, as discussed in (Helbing & Balietti, 2011).
2.1.2.2 Project uniqueness.
Open source software development produces unique software projects. Each one is
different. The structures are different. The development teams are different. Projects use
different languages and different development tools in different combinations. Movies made
from open source code repositories using Gource41
, a software version control visualization tool,
show the development of projects over time; these animations highlight significant differences in
morphology. Projects do not look alike or grow in identical ways. In particular, multiple projects
41
Gource - Software Version Control Visualization Tool http://www.youtube.com/watch?v=E5xPMW5fg48

Open Source Software Development as a Complex System 68
do not develop the way a field of corn grows from seed or the way a housing development grows
from a single set of blueprints. Each project has its quirks. Thus, understanding the
characteristics of a population of open source software development projects may require taking
an approach suitable for drawing conclusions for individual projects (1 of ), than (non-existent)
average or ‘typical’ projects ( ).
One fact can be inferred from this pervasive uniqueness or ‘newness’: most projects will
not grow into successful collaborations. ‘New’ does not mean necessary, worthwhile, suitable or
better. In fact, the most frequent type of project has one and only one developer—possibly
because it suits the needs of only that one developer. Simply as a function of combinatorial
complexity, where errors of omission and commission can multiply as code is written and
shared, projects are fragile to the vagaries of selection by other developers and execution on their
different systems. When projects fail to match the various criteria developers apply before
downloading code, or when the downloaded code fails to run or function as expected, those
projects are cut off from any process of collaborative improvement. Thus, conditions for
beneficial diversity become significant.
2.1.2.3 Conditions for beneficial diversity.
Page (2008) cited four conditions for beneficial diversity:
1. No genius can produce the best solution alone.
2. Contributors are smart relative to the problem.
3. Incremental improvements can be made to proposed solutions.
4. The contributor group is large enough for genuine diversity. (from pp. 159-162)
Some open source projects manifest all these characteristics, allowing the beneficial
collaboration of diverse contributors. Top open source projects involve more code than any solo
developer could produce working alone (point 1), so these projects involve large groups of

Open Source Software Development as a Complex System 69
contributors (point 4). Developers express and enhance their programming skills (point 2) by
making incremental improvements to open source projects (point 3). Smaller projects can have
the best solution developed by some genius, but then it is the overall system of competition
between such solutions which defines the ‘best solution’ in the context of a large and diverse set
of proffered solutions. Amongst the large numbers of no-growth projects are many second-best
solutions and third-best solutions and so on, any of which could have been ‘best’ if the diversity
of available solutions were not so great. So point 1 applies again, but at a system level rather than
a project level. This is another example of an antifragile strategy at work in open source;
diversity is good.
These conditions are necessary but not sufficient for an open source project to exhibit
beneficial collaboration. There must also be some compelling and challenging problem which
the collaborators agree upon. Whether “scratching a developer’s personal itch” (Raymond, 1999,
p. 25) grows into a group of developers collaborating on a project thus depends significantly on
the nature of the “itch,” particularly the way in which the project compares with other solutions
and the level of difficulty involved in working on the project. Thus, the ‘niche’ may be more
important than the itch.
2.1.3 Open source and evolution.
This section pursues additional cross-disciplinary connections which may be useful
theoretically in the context of open source ecology. Viewing open source software development
from an ecological perspective draws on parallels with biological research. Drawing such
parallels is not unprecedented. For example, Madey and Christley (2008) suggested the study of

Open Source Software Development as a Complex System 70
SourceForge might take lessons from bioinformatics42
. A listing of potential parallels is
followed by a discussion of two ideas of note, touching on diversity and complexity: entropy and
epigenetics.
2.1.3.1 Potential biological parallels with open source.
Biology and open source have a variety of potential parallels which could be investigated
to discover useful cross-disciplinary insights. In the spirit of drawing attention to possible
‘distant’ factors which might contribute to understanding open source, suggestive quotes from
example papers from outside the open source literature have been noted:
Genotype (genetic coding)/phenotype (expression of coding) relationship between source
code and running system: “Bacterial genomes and large-scale computer software projects
both consist of a large number of components (genes or software packages) connected via
a network of mutual dependencies” (Pang & Maslov, 2013, p. 71).
Adaptation: the study of microbes could inform our understanding of the evolution of
software as open source code moves between platforms. “[M]icrobial evolution
experiments support the following generalizations. First, populations adapt rapidly when
they are introduced into new environments. ... Second, genetic comparisons ... provide
striking examples of parallel molecular evolution ... Third, genetic adaptation to one
environment is often, but not always, associated with fitness loss in other environments”
(Elena & Lenski, 2003, p. 467).
Endosymbiosis: software modules or libraries embedded in larger projects. “By
combining the capabilities of two entirely different organisms, endosymbioses can result
42
http://www.nd.edu/~oss/Papers/FOSSRRI_Madey_Christley.pdf (slides 15-22) Downloaded 1 May 2013.

Open Source Software Development as a Complex System 71
in evolutionary quantum leaps” (Greiner & Bock, 2013, p. 354).
Environmental factors influencing growth could produce models of open source which
include factors relating to the life circumstances of the developers: “[N]onlinear mixed
effects models and information theory can be used to apply standard growth models to
repeated measures of body mass in wild populations, while incorporating biologically
informed parameters such as life history and environmental factors. Few studies have
attempted to develop growth models in this way, and future work applying a similar
approach to other long-term datasets of wild populations will be informative when
comparing the influences of social system and ecology on the overall shape of the growth
curve” (English, Bateman, & Clutton-Brock, 2012).
Niche applications could inform an understanding of when open source projects can
compete with a commercial project: “[T]he value of species distribution models (also
called ecological niche models) in anticipating and characterizing vulnerability to
invasion is undeniable” (Larson & Olden, 2012, p. 1115).
Cooperation in open source could be expressed by a formula: “[N]atural selection
favours cooperation, if the benefit of the altruistic act, b, divided by the cost, c, exceeds
the average number of neighbours, k, which means b/c>k” (Ohtsuki, Hauert, Lieberman,
& Nowak, 2006, p. 502).

Open Source Software Development as a Complex System 72
Indirect Reciprocity could help explain how open source works without direct
reciprocity: “I help you and somebody else helps me” (Nowak & Sigmund, 2005, p.
1291).
Competition for limited resources could inform understanding of dominant projects:
“[T]he model predicts that competition generates (1) stable coexistence if species
consume most of the resources for which they have high requirements, (2) oscillations
and chaos if species consume most of the resources for which they have intermediate
requirements, and (3) competitive exclusion with a winner that depends on the initial
conditions if species consume most of the resources for which they have low
requirements” (Huisman & Weissing, 2001, p. 2682).
Extinction could supply new models, as open source projects do become dormant: “[The
birth-death-mutation] process and its resulting statistics should be applicable to a very
wide range of empirical datasets” (Maruvka, Kessler & Shnerb, 2011, p. 2).
Ranked biodiversity abundance curve matches the projects by number of developers
curve (Figure 3, p. 10 of this thesis).
Initially, the main goal of this research was to find out how to start and grow a new open
source software project. Failing to achieve the growth component of that goal led to re-
examining the nature of the problem and viewing open source as a complex system. Complex
systems approaches have been applied to understanding the origins of life: how to start and grow
a new species.

Open Source Software Development as a Complex System 73
For example, Szathmáry and Smith (1995) proposed a series of transitions in evolution
which involve emergent capabilities arising from complex interactions of populations of smaller
entities as they form larger entities. They state, in particular:
“If cooperation is to evolve, non-additive, or synergistic, fitness interactions are needed. If
two or more cooperating individuals can achieve something that a similar number of
isolated individuals cannot, the preconditions exist: the image to bear in mind is that two
men, each with one oar, can propel a boat, but one man with one oar will row in circles”
(Szathmáry & Smith, 1995, p. 229).
The parallel with open source collaboration is so clear it impels some speculation regarding how
else open source and evolution may be similar. Moreover, such similarities could provide
insights for open source which might not be obvious otherwise.
2.1.3.2 Entropy
Brooks and Wiley (1988) grappled with a perplexing problem in evolutionary biology:
what causes the observed diversity of living things given the capacity of biological processes to
generate diversity. In short, they argued that increasingly complex species are too few in number,
if caused by ‘bottom up’ random variation pruned by natural selection based on fitness. Having
an ancestry (path dependence) imposes a tighter constraint than fitness, so species are actually
adapted to their past rather than to their present circumstances. Looking instead from a ‘top
down’ perspective, they claimed entropy reduction could be causal. Entropy is a measure of
uncertainty (Gell-Mann & Lloyd, 1996), so a system with more possible states has higher
entropy. (Consider which presents a higher level of uncertainty regarding the color of a ball
drawn from a jar: a jar of red balls, or a jar of red and blue balls.) While a new species may have

Open Source Software Development as a Complex System 74
more order/greater complexity, the informational entropy of the entire branching system
increases with speciation due to the increase in the number of possible subsequent system states.
Evolution could be seen as an irreversible, non-equilibrium, historically-constrained
information process: new species are an inevitable result of increasing variety—and
consequently greater complexity—along branching evolutionary pathways. A speciation event
settles the overall system into one fixed (path dependent) state amongst the many possible,
reducing entropy relative to the prior system state. Thus, the impact on entropy of a speciation
event depends on the perspective, whether looking to the past or to the future. Finally, the initial
conditions (the past) matter more than the boundary conditions (the present) for each species.
Assigning entropy rather than fitness to the primary causal role suggests the possibility of a
‘non-Newtonian’ view of open source software development. The path of software development
runs along an irreversible ‘arrow of time,’ with projects becoming increasingly complex. The
ultimate causes of project growth may be historical contingencies, tempered by proximal causes
relating to the specifics of a project. Whether projects grow, however, may depend essentially on
the circumstances, not on the project characteristics. Specifically, a project may be selected as a
solution to a problem which users need solved at the time, thereby reducing uncertainty, without
regard to the optimality of the choice. This research was not designed to parse the relative effects
of popularity and performance, but the simulation results suggest popularity wins, as a model
based on popularity (preferential attachment) suffices to reproduce the observed distribution of
projects, as discussed in section 4.5 on Simulations in the Data and Analysis chapter.
Consider the development pathway of an individual open source project, particularly the
pattern of branching and merging code which predominates over the forking of projects. Forking
takes place when the difference between the original (parent) and the forked (child) project

Open Source Software Development as a Complex System 75
overcomes project cohesion, raising costs according to (Bitzer & Schröder, 2007). The history of
open source software development could be viewed as a sequence of forks, starting from an
ancestral, pre-assembly-language proto-project. The growth of each new project could then be
understood as some recombination of the preceding work, or the adaptation of prior work to a
new application. Much prior open source work contributed to the projects created during this
research. Evidence presented in the Data and Analysis chapter suggests a lack of adaptability of
those predecessor projects or the projects created from them (a failure to reduce uncertainty)
created obstacles to growth.
2.1.3.3 Epigenetics.
Cabej (2011) took issue with the insufficiency of genetic information for specifying all the
complex details of morphology in metazoa (form and structure in animals). Briefly, a ‘bottom
up’ causality falls short, with development controlled exclusively by genes providing far too
little data to construct and maintain all the intricacies of a living animal. Cabej cites, in
particular, the one trillion nerve cells in the human brain, each of which “establishes an average
of 10,000 specific connections with specific neurons, implying that information for establishing
these connections alone is of the order of quadrillions of bits, millions of times greater than the
total amount of information contained in the genomic DNA” (Cabej, 2011, p. xxxiv). Beyond a
certain level of ontogenesis (growth from the fertilized egg), the nervous system assumes ‘top
down’ control of subsequent development, which Cabej claims is then “computationally
generated in neural circuits” (Cabej, 2011, p. 5).
Convergent evolution is one implication of this view (Cabej, 2011, p. 702). The ‘logic’ of
various animal forms means computationally generated biological solutions can arise along
independent evolutionary pathways. The results of such convergence in seven niche

Open Source Software Development as a Complex System 76
morphologies are shown in Figure 30, where the pathways involve animals from two different
lineages: the mammals, whose reproduction involves a placenta; and the marsupials, whose
young are carried in a pouch.
Convergent evolution in nature suggests the possibility of convergent development in open
source. The ‘logic’ of a particular software niche may act to direct the form and function of
projects aiming to fill that niche, despite their having different developmental pathways. How
projects grow may depend on the functionality they aim to develop. Some prior research into
open source has approached the data set of open source projects as a single, monolithic type; for
example (Heller, Marschner, Rosenfeld & Heer, 2011), a linked geo-scatter visualization paper.
Grouping projects into functional types might improve the chances for discovering common
characteristics.

Open Source Software Development as a Complex System 77
Figure 30: Convergent evolution of morphology in placental and marsupial species in the Old World and Australia. Source: (Cabej, 2011, Figure 17.11, p. 702).

Open Source Software Development as a Complex System 78
2.2 Prior Research
This section critically evaluates prior research relating to open source software
development, with particular attention to the treatment of open source software project initiation
and growth.
2.2.1 A systems view of the bazaar.
The first work examined here is Raymond (1999), The Cathedral and the Bazaar. Simply
put, the Cathedral is a hierarchical system while the Bazaar is a noisy, seemingly disorganized,
complex system. Raymond provided 19 guidelines for creating “good” open source software in
the bazaar style without explicitly taking a complex systems perspective. Specifically, he
addressed complex system properties of sensitivity to initial conditions, how diversity can yield
robustness, and emergent phenomenon. Selected guidelines have been extracted from the paper
and re-grouped here to highlight these points.
2.2.1.1 Sensitivity to initial conditions.
“Every good work of software starts by scratching a developer's personal itch.”
“To solve an interesting problem, start by finding a problem that is interesting to
you.”
“If you have the right attitude, interesting problems will find you.”
“If you treat your beta-testers as if they're your most valuable resource, they will
respond by becoming your most valuable resource.”
“Smart data structures and dumb code works a lot better than the other way
around.”
“Release early. Release often. And listen to your customers.”

Open Source Software Development as a Complex System 79
These guidelines all touch on project inception, particularly focusing on taking interesting
project ideas, sharing them quickly and then listening. Unfortunately, this ‘formula’ is far from
foolproof. Releasing “good” software does not guarantee growth of an open source project.
Raymond did not structure the guidelines to fit a complex systems view of open source. If he
had, the need for some guidance regarding when to stop development would have been clear. As
Snowden (2007) points out in the Cynefin framework, an appropriate decision making strategy in
a complex system is ‘Probe, Sense, Respond’ with the responses being either amplification or
dampening actions. Raymond included ‘Probe’ and ‘Sense’ in the guidelines but did not fully
explain the extent of the probing or both sides of ‘Respond.’
2.2.1.2 Diversity yields robustness.
“Treating your users as co-developers is your least-hassle route to rapid code
improvement and effective debugging.”
“The next best thing to having good ideas is recognizing good ideas from your
users. Sometimes the latter is better.”
“Often, the most striking and innovative solutions come from realizing that your
concept of the problem was wrong.”
“Provided the development coordinator has a communications medium at least as
good as the Internet, and knows how to lead without coercion, many heads are
inevitably better than one.”
These guidelines reflect benefits of diversity and ways to obtain it. A complex systems
view offers four conditions for beneficial diversity (listed previously in section 2.1.2.3), only
three of which find expression here. The most relevant condition for open source—the possibility

Open Source Software Development as a Complex System 80
of incremental improvements—was evidently assumed to be self evident. However, a guideline
making this condition explicit might have helped developers avoid writing ‘un-maintainable’
code, by encouraging the use of comments, for example.
2.2.1.3 Emergent phenomenon.
“Given a large enough beta-tester and co-developer base, almost every problem will
be characterized quickly and the fix obvious to someone.”
“Perfection (in design) is achieved not when there is nothing more to add, but rather
when there is nothing more to take away.”
“Any tool should be useful in the expected way, but a truly great tool lends itself to
uses you never expected.”
These guidelines identify some emergent aspects of open source development, particularly
the rapid identification and resolution of problems. Since “debugging is parallelizable”
(Raymond, 1999, p. 48), open source supports continual improvement and unanticipated uses
(unpredictability). Viewed from a complex systems perspective, however, the clearest omissions
here relate to quantification of the emergent power law relationships, the emergent nonlinear
behavior of high-growth projects and identification of the role of preferential attachment in
driving project growth. In particular, the phrase “given a large enough beta-tester and co-
developer base” (Raymond, 1999, p. 29) is problematic for the majority of open source projects
with one and only one developer, where no such base is “given”. A guideline encouraging pairs
or teams of users and developers to agree to start projects together might have helped push solo
developers into forming such groups, so at least one other “someone” would be a given.

Open Source Software Development as a Complex System 81
Raymond’s essay not only provides guidelines, it tells a story. His story is not one of
project initiation; instead, he relates how projects initiated by others were used as starting points,
citing Minix (a version of Unix) as the basis of Linux, and fetchpop and popclient as inputs to his
program fetchmail. He even warns about the difficulty of starting projects, suggesting instead, “it
is absolutely critical that the coordinator be able to recognize good design ideas from others”
(Raymond, 1999, p. 37). The historical path dependence of the complex system he is describing
stands out clearly. Clarifying the forward implications of that path dependence could encourage
developers to expose more of their “good design ideas” in open source projects—whether their
projects grow or not—since the work might be picked up and used to build other projects.
The following section reviews studies of established projects.
2.2.2 Established projects.
The literature regarding the founding of open source software projects includes works
which aim to provide how-to instructions for starting and running new projects. For example,
Fogel (2005) began with a statement of the problem and hinted at a difficulty of researching the
topic: “Most free software projects fail. We tend not to hear very much about the failures. Only
successful projects attract attention, ...” (p. 1). Fogel detailed the infrastructure and politics of
multi-developer projects, but did not provide evidence showing how that advice remedies the
problem of the high failure rate in single-developer projects. The temptation to take successful
projects as a model is difficult to resist, but that approach yields survivorship bias. Looking at
winners to try to understand losers is a classic case of looking for the dropped car keys under the
lamp post because the light is brightest there. Obviously, more data is available for successful
projects. The dynamics of successful projects are interesting and important to understand.
Unfortunately, success is not the problem. Studying success does not necessarily give insight to

Open Source Software Development as a Complex System 82
the problem of failure. Failed projects may have many of the same internal characteristics as
successful projects, but without the growth.
Indeed, Feitelson, Heller & Schach (2006) attempted to define open source “success”
empirically in terms of growth in the number of downloads—without making any causal claims.
Data from SourceForge from May 2005 yielded a ranked distribution of projects by number of
downloads, where 1,680 downloads marked the point where the distribution departed from a Zipf
distribution, shown previously in Figure 28 on page 62 (right hand side). Projects with fewer
downloads were categorized as “Struggling” (rather than “Unsuccessful” since a project might
gain sufficient downloads to reach the threshold in the future). Subsequent research (Israeli &
Feitelson, 2007) suggested the historical pattern of downloads and releases might provide a more
nuanced measure of success, distinguishing between projects with (combinations of) six different
patterns: growing, constant or declining downloads; downloads related to releases; limited time
span; and dead. Ultimately, however, the paper stopped short of offering causal explanations for
these observed patterns.
Analyzing the micro dynamics of founding and joining open source software projects on
SourceForge.Net (SF.net), David & Rullani (2006) characterized the open source ecology as
follows:
“Developers working in already existing projects represent the exploitation side of the
SF.net community, whereas ‘founders’ represent the exploration side of its production
model. ... The process of selective survival renders the system as a whole dissipative, i.e.
it is based on a mechanism ‘burning’ a high amount of resources to produce a
comparatively small number of surviving innovations.” (p. 5).

Open Source Software Development as a Complex System 83
From this perspective, failure is systemic: a high founding rate provides a supply of entrants to a
contest which then ‘selects’ the occasional success from the many candidates. If this view is
correct, selection is manifestly a system-level rather than project-level process. System-level
research would need to be conducted accordingly, including examination of data beyond the
project-level. Nevertheless, project-level analyses have been conducted which attempt to explain
this system-level selection process by measuring the characteristics of sets of individual projects.
For example, Michlmayr (2006) compared two sets of projects, 40 “successful” and 40
“unsuccessful”—matched on factors of age, lines of code and development status, but
differentiated by whether they appeared on the SourceForge list of top projects by download
count—by testing for statistical differences between the sets across a list of project-level process
maturity factors: version control, mailing lists, documentation, systematic testing and portability.
While differences were found, the author noted “no conclusions on a possible causality between
process maturity and success can be drawn from the present study.” (Michlmayr, 2006, p. 10)
Alternatively, Schweik, English and Haire (2009) used classification trees on 107,747
SourceForge projects across a list of 13 project-level characteristics43
to find “the sum of the
number of descriptive categories chosen by a project's developers to describe the project” as “the
most important factor for separating successful from abandoned projects in the Initiation Stage”
(p. 9). This result was inconclusive, unfortunately. The authors speculated about the implications
of the finding before concluding, “However, we cannot be sure whether higher utility, clear
vision (i.e setting goals), leadership or any combination of these three factors are the key to
success” (p. 10).
43
The 13 factors included Developers, Tracker Reports, Page Visits, Forum posts, Downloads, Project Information
Index, Intended Audience, Operating System, Programming language, User Interface, Database Environment,
Project Topic and Project License.

Open Source Software Development as a Complex System 84
2.2.3 Open source beyond the repositories.
Open source clearly involves more activity than is measured by SourceForge project data.
For example, consider, BeautifulSoup developed by Leonard Richardson, a single-developer
project with no downloads from SourceForge which nevertheless makes a significant
contribution to the open source ecosystem. The website for this Python library provides a direct
download of source code, so SourceForge is not required to obtain the software. Richardson
writes, “Since 2004, [BeautifulSoup has] been saving programmers hours or days of work on
quick-turnaround screen scraping projects.” 44
Such re-use of a single developer’s output by tens
of thousands of other developers45
(users of BeautifulSoup) should not be ignored. Some analysis
of time saved would be required to measure the value added, however.
Moreover, open source code need not be explicitly re-used to be useful; merely inspecting
the code can be informative. The amount of code shared through a resource such as
StackOverflow.com, a popular46
question and answer site for developers, can be as little as a
single line, the name of a particular function, or the format strings for a parameter of a particular
function47
. Thus, prior research based on established projects using data exclusively from code
repositories falls short of modeling some dynamic and practical aspects of the open source
process. Another strand of the literature approaches these challenges through simulation.
44
http://www.crummy.com/software/BeautifulSoup/bs4/download/ Downloaded 2 May 2013. 45
The Beautiful Soup library is also available through other sources, at least one of which tracks downloads. As of
2012-12-05, the listing of Beautiful Soup 4 on the Python Package Index reports 45987 downloads of the code
posted on 2012-08-20, an average of over 400 downloads per day: http://pypi.python.org/pypi/beautifulsoup4/4.1.3 46
Traffic measurements at Quantcast put StackOverflow usage above 20 million people per month as of February
2013 http://www.quantcast.com/stackoverflow.com 47
http://strftime.org/ is an online cheat sheet for the Python “string from time” function, linked from this
StackOverflow post: http://stackoverflow.com/questions/13889230/how-to-convert-string-date-interval-to-number-
of-days-or-seconds-iso-8601

Open Source Software Development as a Complex System 85
2.2.4 Prior research in open source simulation.
Building a simulation of a dynamic process allows for a formal expression of a set of
assumptions. Running the simulation then reveals the implications of those assumptions. Finally,
the simulation results may be compared with real world observations to validate the model. Thus,
the simulation approach offers an alternative route to the goal of a parsimonious system model,
starting from the theoretical side. Rather than examining data and seeking explanations therein,
limited by the available observations, the simulation approach starts with assertions which then
generate data points, some of which may otherwise be difficult to observe. Returning to the field
and actually observing the (previously unobserved) predictions of a simulation provides evidence
for the validity of the theory (Wiegand, Jeltsch, Hanski & Grimm, 2003).
Simulation has the added benefit of involving some meta-cognition, or thinking about how
we understand a system. Meadows (2008) provides a list of “leverage points” which highlight
layers of complexity in the design and control of systems. One of the most powerful leverage
points is the “mindset.” The preceding sections touched on a central principle in the mindset of
open source developers: the paradigm of sharing. The list of leverage points goes on to include—
in order of decreasing power—goals, self-organization, rules, information flows, positive
feedback loops, negative feedback loops, delays, stocks and flows, buffers and parameters48
.
Early attempts to simulate open source software development began by investigating parameters,
as discussed in the next section.
48
First published as D.H. Meadows, “Ways to Intervene in a System,” Whole Earth Review, Winter 1997
http://www.wholeearth.com/issue/2091/article/27/places.to.intervene.in.a.system

Open Source Software Development as a Complex System 86
2.2.4.1 Fitting a power law distribution.
For example, having observed power law distributions in open source and forming a
hypothesis that “open source software development can be modeled as self-organizing,
collaboration, social networks” via “non-random attachment of nodes (sometimes called
preferential attachment)” in (Madey, Freeh & Tynan, 2002a, pp. 1806-1808), Madey, Freeh &
Tynan (2002b) proposed using a Swarm model to “search for simulation parameters that
generate similar power law distributions” (p. 1474). The report in (Madey, Freeh & Tynan,
2004) concluded that while preferential attachment improved the fit of the model, “[s]imply
adding preferential attachment did not provide a model that could properly model the ‘young-
upstart’ phenomenon, where a new project or new developer quickly passes older projects or
developers” (p. 20). This point is addressed in the context of the implementations of the Hubbell
model in the Simulation section (4.5.2).
When Smith, Capiluppi and Fernandez-Ramil (2006) developed an agent-based simulation
model of open source development using NetLogo, they aimed to explore the evolution of large
projects. Their simulation code included the statement:
if ((random 100) < new-developer-chance) and (fitness < boredom-threshold)
[sprout-developers 1 [set color white set experience 1]]
This means some percentage of the time (depending on the setting of new-developer-chance) when
the fitness of a module is sufficiently low (less than the setting of boredom-threshold), the
simulation will create (sprout) a developer. Then they have:
if ((fitness > boredom-threshold) or (fitness = 0)) and (random 100 > boredom-tolerance) [
ifelse experience-counts?
[if random max-experience > experience [die]]
[die]
]
]
Open Source Software Development as a Complex System 87
This means some percentage of the time (depending on the setting of boredom-tolerance) when a
module has either zero fitness or sufficiently high fitness (depending on the setting of boredom-
threshold), the simulation will remove (die) a developer, optionally depending on the developer’s
experience level. Running this simulation led to the observation:
“The model was most sensitive to the value of the boredom threshold parameter, which
controls when new developers join and leave the project. … [I]f the boredom threshold
was low, the evolution of the first few modules resulted in a system that attracted no new
developers; the original developers soon left and the project became moribund” (Smith,
Capiluppi & Fernandez-Ramil, 2006, p. 429).
Thus, the simulation offered a clue about how to grow an open source project: make modules
interesting to work on with other developers. Specifically, each new module should need some
work done on it to attract an additional developer (fitness below threshold), but the module
should not immediately be finished (fitness above threshold) or worthless (zero fitness) as the
developer will then stop working.
Real world evidence appears to support the hypothesis that open source contributors are
attracted by sharing in work which adds value. For example, when Anderka and Stein (2012)
observed approximately 25% of Wikipedia articles contained at least one cleanup tag, the finding
corroborated the simulation results. One way in which Wikipedia attracts and retains contributors
is through the explicit identification of flaws: imperfections incite corrections. Ghosh, Glott,
Krieger and Robles (2002) surveyed 2,784 open source developers and found “learning and
developing new skills” and “share knowledge and skills” (p. 45) were each cited as reasons to
stay involved in open source development by over two-thirds of the surveyed developers.

Open Source Software Development as a Complex System 88
2.2.4.2 Crosetto’s model.
Crosetto (2009) took an agent-based computational economics approach to simulating open
source, where the simulated agents played a payoff-maximizing game, which resulted in the
simulation result shown in Figure 31, a log-log chart which plots “density,” a proportional
measure of population relative to the total population, versus the log(10) of the number of
developers per project. (See Appendix F for further discussion of scaling.) Based on a “no
growth” assumption (p. 9) which fixed the payoff from a project, the simulation was
characterized as having “qualitative similarity, but not an accurate match” (p. 11) with the real
data.
Figure 31: Real and Simulated Density of Projects with N developers. Source: (Crosetto, 2009, Figure 5, p. 5).
In fact, projects do grow and the payoffs change significantly as a consequence of growth,
as discussed in section 2.1.1.4.4. Two non-distinct populations interact: developers and users.

Open Source Software Development as a Complex System 89
Consequently, Haythornthwaite (2009) postulated two overlapping patterns of peer production,
variously termed ‘crowd/community’ or ‘lightweight/heavyweight’, to highlight the extent (or
‘weight’) of the commitment required. These patterns characterize the user and developer groups
respectively in open source projects. A simulation relating these groups is discussed in the next
section.
2.2.4.3 FLOSSSim.
Radtke (2011) used agent-based modeling to simulate open source software development,
through the simulation tool he developed called FLOSSSim, obtaining the model fit shown in
Figure 32.
Figure 32: Simulated and Empirical data for Developers per Project. Source: (Radtke, 2011, Figure 7.2, p. 192).
Radtke concluded, “The notion that FLOSS is primarily a developer-driven process is
supported, while users are a distant second in influencing the process” (Radtke, 2011, p. 268).
Moreover, with respect to project selection by developers, he found:
• “Projects that are popular with developers are more likely to be selected.

Open Source Software Development as a Complex System 90
• Large projects with a significant portion of work already completed are more likely to be
selected.
• Projects that are popular with users are more likely to be selected.
• Projects in lower development stages are more likely to be selected” (p. 273).
The second and fourth points are contradictory, while the first and third both relate to popularity
(with both users and developers), so older, more established projects have a distinct advantage
over newly founded projects, whose main draw is their lower ‘fittedness’. Radtke speculates:
“[D]evelopers prefer projects in earlier stages. It has been suggested this is because more
reputation can be gained from developing core code. In addition, if developers are driven to
join projects in order to resolve their own personal problems, as a project reaches the upper
stages it transitions from development to maintenance, meaning there are fewer and fewer
tasks remaining to be written that might solve a developer’s problem and thus be an
incentive to join the project.” (Radtke, 2011, p. 206).
The dominance of older projects emerges in the pattern of preferential attachment discussed
previously. If developers periodically transition randomly between projects, however, they move
to a project in an earlier stage without this being a ‘preference’. Joining younger projects could
thus occur by virtue of their availability, not their profitability.
Radtke’s simulation approach focused on very tight validation of the simulation results
against the observed distribution of projects. The fitting process worked for all project sizes
except for the largest ones. He noted, “Only the extreme projects with greater than 14
developers, which account for only 0.63% of the projects, are not reproduced” (Radtke, 2011, p.
197). Unfortunately, from a complex systems perspective, and particularly from an antifragile

Open Source Software Development as a Complex System 91
complex systems perspective, understanding the nonlinearity of the growth in those projects with
over 14 developers is critical to understanding the systematic process of nonlinear open source
project growth. The model needs to explain both tails of the distribution, including the largest
projects such as Linux which play such a significant role in defining open source software. It is
worth noting that a model which excludes users and the environment entirely (using developers
and team size only) can produce a distribution which matches both tails of the project size
distribution, as will be shown in section 4.5 on Simulation.
2.2.4.4 Summary
Given these prior studies of the history and practice of open source software development
along with previous research into simulating the open source development process, the current
understanding yields an incomplete picture. The observed pattern of success and failure (defined
as growth and no-growth) has yet to be explained in a way which allows reliably designing for
successful project initiation and growth. The multi-methodological approach employed in this
research to understand this problem is discussed in the next section.

Open Source Software Development as a Complex System 92
3. Research Design
To place this research in the appropriate context, first consider that “open source” appears
in three places in the 2012 Revision of ACM’s Computing Classification System49
, as shown in
Figure 33:
Figure 33: Three instances of “open source” in the 2012 Revision of ACM’s Computing Classification System.
These multiple perspectives on open source reflect its influence on design, decision making and
collaborative interaction within the larger domains of computing knowledge: software
engineering, information systems and human-centered interaction. While the topic can be
considered in relation to these computing contexts, the initial focus of this research was solely on
design, particularly the question of open source project initiation: how to build an open source
project which grows to become self-sustaining. This framed the research as a software
engineering problem to be approached using the Design Science methodology of (Peffers,
Tuunanen, Rothenberger & Chatterjee, 2007) shown in Figure 34. As stated by Walls, Widmeyer
& El Sawy (1992), the objective of the Design Science methodology was to arrive at a theory
that would “prescribe both the properties an artifact should have if it is to achieve certain goals
and the method(s) of artifact construction” (p. 41).
49
http://www.acm.org/about/class/2012
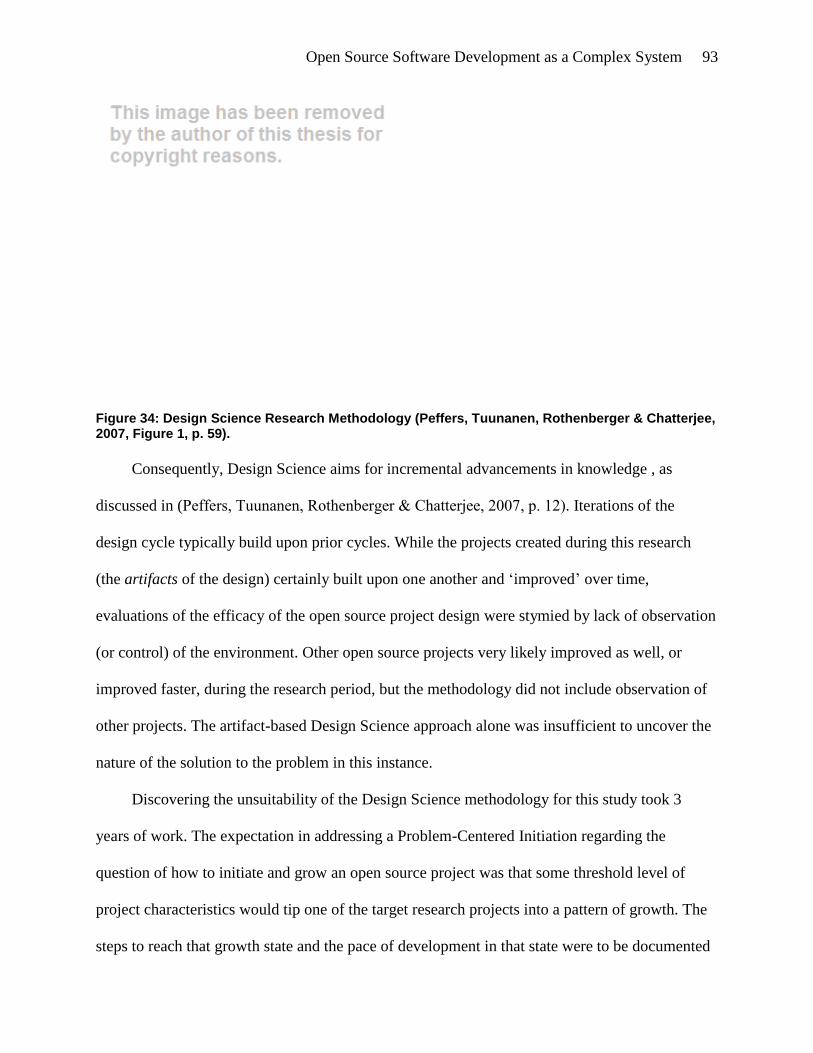
Open Source Software Development as a Complex System 93
Figure 34: Design Science Research Methodology (Peffers, Tuunanen, Rothenberger & Chatterjee, 2007, Figure 1, p. 59).
Consequently, Design Science aims for incremental advancements in knowledge , as
discussed in (Peffers, Tuunanen, Rothenberger & Chatterjee, 2007, p. 12). Iterations of the
design cycle typically build upon prior cycles. While the projects created during this research
(the artifacts of the design) certainly built upon one another and ‘improved’ over time,
evaluations of the efficacy of the open source project design were stymied by lack of observation
(or control) of the environment. Other open source projects very likely improved as well, or
improved faster, during the research period, but the methodology did not include observation of
other projects. The artifact-based Design Science approach alone was insufficient to uncover the
nature of the solution to the problem in this instance.
Discovering the unsuitability of the Design Science methodology for this study took 3
years of work. The expectation in addressing a Problem-Centered Initiation regarding the
question of how to initiate and grow an open source project was that some threshold level of
project characteristics would tip one of the target research projects into a pattern of growth. The
steps to reach that growth state and the pace of development in that state were to be documented

Open Source Software Development as a Complex System 94
and, if possible, generalized. When none of the project development efforts produced the
expected growth, however, the limits of the methodology in this case—specifically the project-
level focus of the research—became apparent. The search for a causal explanation for open
source project initiation and growth required looking outside the research projects.
Ultimately, (Nunamaker, Chen & Purdin, 1990) provided an alternative framework which
better represented the actuality of the multi-methodological approach taken in this study,
illustrated in Figure 35.
Figure 35: A Multimethodological Approach to IS Research. Source: (Nunamaker, Chen & Purdin, 1990, Figure 2, p. 94).

Open Source Software Development as a Complex System 95
From a multi-methodological perspective, the research began in the domain of Systems
Development with prototyping and development of an open source project. This phase of the
research encountered repeated failures in execution as techniques and methods appropriate for
larger projects were found to be ineffective for starting this new project from scratch. For
example, providing extensive project documentation had no impact on growth. A second project
was launched with the same results. After a third project also failed to grow, the research, per
force, became a field study (Observation), as the research data reflected the lack of response
from the developer community. Ultimately, shifting the research focus from the project-level to
the system-level involved Experimentation, using computer simulations, to explore a Theory of
open source as a complex system involving a mathematical model. The experimental and
theoretical results provided a useful perspective on the failures encountered during the systems
development and observation phases.
Nunamaker, Chen and Purdin (1990) consider Systems Development as the “hub” of the
four research strategies, suggesting its value lies in “proof-by-demonstration” (pp. 91-95). The
problem of how to initiate and grow an open source project could have been solved in the
Systems Development phase of this research by following a series of steps which, properly
analyzed, could then have been generalized. This was the initial hypothesis and rationale.
Instead, the research demonstrated the failure which is typical of open source projects, adding to
evidence supporting the null hypothesis: no reliable, generalizable set of steps yet found can
guarantee successful open source project initiation and growth. Taken alone, such a negative
result is inconclusive based on a single case (or, in this instance, three cases); the observed
failures could be due to factors specific to these trials: specifically the particular steps followed
(or not followed) in initiating the target open source projects. However, while the research

Open Source Software Development as a Complex System 96
projects failed to grow, many other projects also failed to grow, suggesting a systematic rather
than project-specific cause.
Reexamining the problem experimentally at a systems level rather than at a project level
using simulation revealed additional evidence regarding the way in which such failures could
occur systematically, independent of the steps followed. In short, the multi-methodological
approach achieved a synergy which a strictly evaluative or strictly experimental approach would
have missed. Merely reporting the project outcomes would not have advanced knowledge
significantly, given the lack of success. A statistical analysis without experimentation, as in
(Michlmayr, 2006), would not have yielded the cause of growth, as discussed in section 2.2.2.
Relying solely on simulation, as in (Radtke, 2011), however, would also have limited the
research result as previously discussed in section 2.2.4.3.
Thus, at the outset, the goal of this research was to initiate an open source project which
would grow by attracting a team of developers. Ethics approval was granted for the study of this
team, subject to insertion of a notice of participation in the open source project. Ultimately,
however, the data collected in the Systems Development phase related to three projects initiated
by the author, named Open Allure Dialog System (aka Open Allure or OADS), Wiki-to-Speech
and SlideSpeech, none of which were successful in attracting developers. The raw data took the
form of records and recordings of daily project-related decisions, events and outputs along with
weekly measures of progress; specifically, counts of views and downloads of project-related
content were tracked in a spreadsheet. The working hypothesis was that the growth of an open
source project could be observed over time as particular project characteristics were established.
An analysis of the temporal relationship of the characteristics with the observed growth could
then be conducted.

Open Source Software Development as a Complex System 97
The expectation of achieving observable growth was so high that the focus of the data
collection related to time: measuring how quickly (not whether) the project(s) could grow. Every
record and artifact was marked with the date and, where possible, the hour of the day. Empirical
testing of the process of open source software development began in Auckland, New Zealand in
November 2009 and continued for 37 months—with two interruptions—through December
2012. The first interruption was the 4 month period from June to September 2010 when research
was suspended for the Singularity University Graduate Summer Program 2010, in Mountain
View, California. The second interruption, for 6 months from April to October 2012, related to
proprietary (closed source) development of the SlideSpeech project which usurped most of the
available time. Thus, the data collected details over 26 months of trials spread over 3 years. The
notes, videos, code and project documentation produced by the research and described in the
Data and Analysis chapter provided the raw data for the subsequent analysis.
The following sections thus offer data relating the history of the development pathways of
three projects. These illustrate how attempts to engineer success based on lessons from the
literature led to continual failure, ultimately raising the questions which led to exploring models
of open source using simulations. Three different simulations were developed to highlight the
new insights revealed by the theoretical model as they emerged: first mover advantage,
punctuated equilibrium, and the relationship of non-participants to the open source community.

Open Source Software Development as a Complex System 98
4. Data and Analysis
This section provides details regarding the data collected, in an overview (section 4.1), a
review of each of the three open source research projects (sections 4.2, 4.3 and 4.4) and a review
of the research simulations (section 4.5).
4.1 Overview
Data collected included download counts from the open source research projects, project
notes, code commits, project wikis and presentations.
4.1.1 Open source projects.
The open source research projects were hosted at Google Code. The home page of Google
Code shown in Figure 36 (from February 2013) listed project labels including Python, Java and
Android. The research projects fell into these categories.
Figure 36: Home page of the Google Code repository.
Open source research literature has frequently cited data from SourceForge, a code
repository for open source projects established in November 1999. Google Code was established
in July 2006, so the relative lack of research citations to Google Code can be attributed, in part,

Open Source Software Development as a Complex System 99
to the shorter lifetime of the repository. Google Code grew quickly to become a large and
popular repository, however. While not authoritative, the comparison of open source software
hosting facilities on Wikipedia,50
shown in Figure 37, suggested a set of dimensions for
measuring the popularity of repositories: number of users, number of projects and Alexa rank.
Note the Alexa ranks of SourceForge and Github place them as the two most popular from a
frequency of access perspective. More current and accurate data were available from other
sources. Specifically, the number of projects shown for Google Code, “250,000+” was cited
from a blog post at Google from December 200951
whereas a SQL query into the Google Code
repository data on FLOSSmole52
returned only 208,664 projects as of May 2011. FLOSSmole
nevertheless identified Google Code as one of the largest repositories, as shown in Figure 38.
The SourceForge and GitHub repositories (which may each host more projects than Google
Code) are not shown. As of 2 April 2013, the Alexa rankings of the top repositories (where a
lower ranking is more popular) were SourceForge 166, Github 205 and Googlecode 2,60253
.
Figure 37: Comparison of Open Source code repositories by Popularity measures on Wikipedia, as of 1 April 2013.
50
http://en.wikipedia.org/wiki/Comparison_of_open-source_software_hosting_facilities 51
http://googleblog.blogspot.co.nz/2009/12/meaning-of-open.html 52
http://flossmole.org/content/how-many-projects-are-listed-each-repository-05-2011 53
http://www.alexa.com/siteinfo/sourceforge.net, http://www.alexa.com/siteinfo/github.com,
http://www.alexa.com/siteinfo/googlecode.com

Open Source Software Development as a Complex System 100
Figure 38: “How many projects are listed in each repository? (05-2011)” showing Google Code with 208,664 projects. Data source: FLOSSmole (Howison, Conklin & Crowston, 2006).
Research into the population of open source projects has depended on the availability of
repository-level project data for data mining. This research set out initially to avoid using
repository-level data, if possible, due to concerns relating to membership bias and survivorship
bias. For collecting project-level data, Google Code provided a convenient and appropriate
repository given its size. When repository-level data was ultimately required to calibrate the
simulations, data on SourceForge and Google Code was taken from the literature rather than
from primary sources, following Radtke (2011) who pointed out the duplication of effort a crawl
would require (p. 112).
4.1.2 Project notes.
A journal of project development activity was kept, ultimately running to 226 pages, in
order to capture events which took place which might not otherwise have been recorded in other
parts of the project, such as the source code repositories. The expectation was that these notes
would allow reconstruction and analysis of the sequence and timing of turning points in the

Open Source Software Development as a Complex System 101
project development process. Consequently, the notes were recorded in Microsoft® Word with a
standard time and date stamp with the format yyyymmdd hh:mm (am/pm), making it possible to
tally the accumulated number of notes over time to reflect the continuity in data collection shown
in Figure 39.
Figure 39: Count of Daily Notes showing periods of interruption in 2010 and 2012. Dates shown are d/mm/yyyy.
Videos created for each of the three projects are tallied in Figure 40, highlighting the continuity
of sharing videos which demonstrated project progress.
0
100
200
300
400
500
600
700
2/11/2009 2/11/2010 2/11/2011 1/11/2012
Count of Daily Notes

Open Source Software Development as a Complex System 102
Figure 40: YouTube Videos for Three Projects. Posting dates shown are d/mm/yyyy.
The distribution of video views by view rank for the 135 videos as of December 2012 is shown
as a log-log chart in Figure 41. A Zipf-like power law fits in the high frequency tail of this
distribution. The most frequently viewed video has a disproportionately large number of views,
while the subsequent less-watched videos have view counts inversely proportional to their rank.
The exponent of the fit (-1.429) means the second most watched video is predicted to have
1/2-1.429
=37% of the views of the first video; 1/3-1.429
=21% for the third video; 1/4-1.429
=14% for
the fourth video and so on, with the 135th
video having 1/135-1.429
=0.1% of the views of the most
watched video. In the low frequency end of the distribution, the fit values are too high. Instead of
a few dozen views, some videos had fewer than 10 views.
0
10
20
30
40
50
60
70
80
90
8/11/2009 8/11/2010 8/11/2011 7/11/2012
YouTube Videos for Three Projects
OADS
Wiki-to-Speech
SlideSpeech
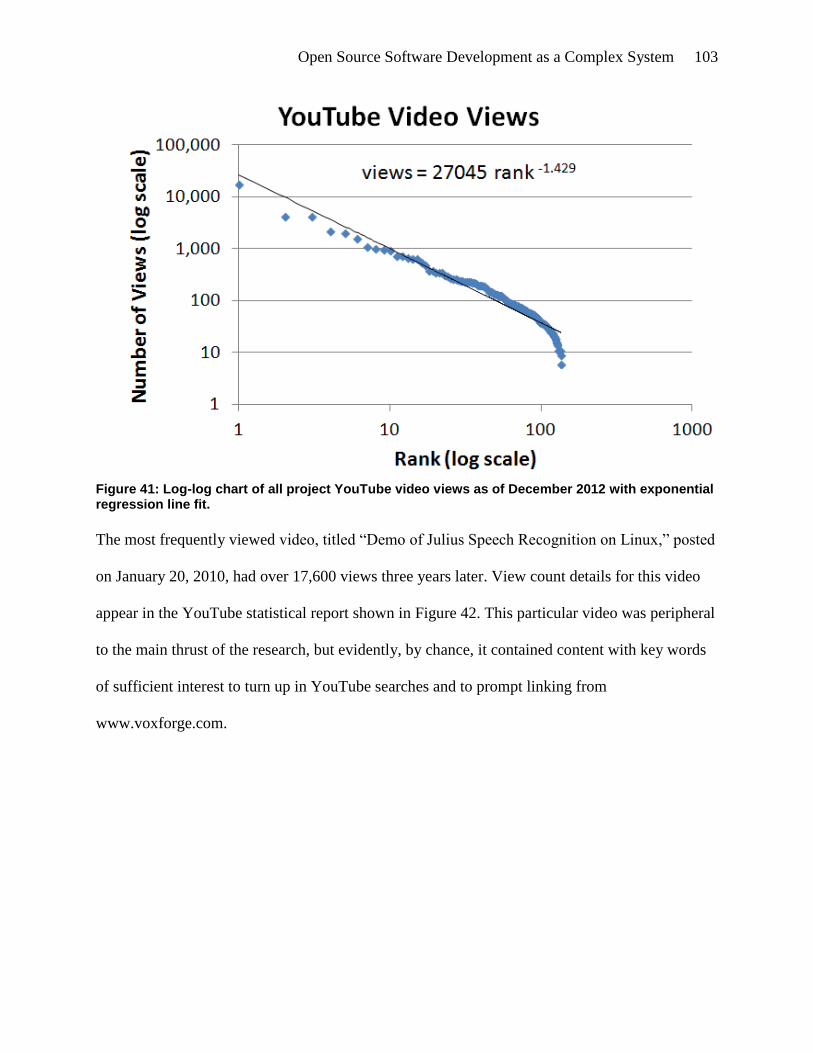
Open Source Software Development as a Complex System 103
Figure 41: Log-log chart of all project YouTube video views as of December 2012 with exponential regression line fit.
The most frequently viewed video, titled “Demo of Julius Speech Recognition on Linux,” posted
on January 20, 2010, had over 17,600 views three years later. View count details for this video
appear in the YouTube statistical report shown in Figure 42. This particular video was peripheral
to the main thrust of the research, but evidently, by chance, it contained content with key words
of sufficient interest to turn up in YouTube searches and to prompt linking from
www.voxforge.com.

Open Source Software Development as a Complex System 104
Figure 42: YouTube Video statistics as of January 2013 for video titled "Demo of Julius Speech Recognition on Linux" posted on 20 January 2010.
4.1.3 Code commits.
The consolidated Commit History by Developer across all three projects, shown in Figure
43, reveals the cumulative total number of code commits and illustrates how all three projects
failed almost completely to attract additional developers. ‘JG’ are the initials of the author. ‘BT’
and ‘SS’ are the initials of two other committers.

Open Source Software Development as a Complex System 105
Figure 43: Commit History by Developer (Initials in legend), consolidated across three projects. Dates shown are dd/mm/yyyy.
Separated out by project, the commit history shown in Figure 44 reveals an overlap between the
Python-based Open Allure project and the Java-based Wiki-to-Speech project.
0
20
40
60
80
100
120
140
160
180
200
29/11/2009 29/11/2010 29/11/2011 28/11/2012
Nu
mb
er
of
Co
mm
its
Commit History by Developer
BT
JG
SS

Open Source Software Development as a Complex System 106
Figure 44: Commit History for Three Projects, by project. Dates shown are dd/mm/yyyy.
The specific progress represented by these commits is discussed on a per-project basis in
following sections.
4.1.4 Project wikis.
Postings to the project wikis also had date stamps (month and year), allowing for the tally of
project documentation shown in Figure 45.
0
20
40
60
80
100
120
140
160
29/11/2009 29/11/2010 29/11/2011 28/11/2012
Nu
mb
er
of
Co
mm
its
Commit History for Three Projects
Open Allure DS
Wiki-to-Speech
SlideSpeech

Open Source Software Development as a Complex System 107
Figure 45: Posts to Project Wikis, by project.
4.1.5 Presentations.
Before the SlideSpeech platform was developed, presentations were shared on the Dropbox
cloud storage service54
for sharing to the public internet. Dropbox offered a folder called ‘Public’
which automatically shared any files stored within it. The research protocol involved creating a
subfolder with the date as the folder name, in yyyymmdd format, so a chronological list of the
posted research materials could be produced by simply printing a directory of the Public folder.
As of March 2013, the full listing contains 11,599 files posted on 196 dates, shown in Figure 46.
A selection of these presentations is listed in Appendix E.
54
http://dropbox.com
0
5
10
15
20
25
30
Mar-10 Aug-10 Feb-11 Aug-11 Feb-12
Posts to Project Wiki
Open Allure DS
Wiki-to-Speech
SlideSpeech

Open Source Software Development as a Complex System 108
Figure 46: Postings to Public Dropbox Folder by Date.
Together, Figure 39 through Figure 46 illustrate the amount and timing of the record
keeping, promotion, coding, documentation and presentation output of the three projects over the
research period. The following sections detail the ideas and approaches tested during each phase
of each project. While the Design Science methodology assumes cycles of artifact creation and
evaluation, the nature of the open source project initiation task—specifically the process of
trying to recruit volunteer developers—had no natural end-cycle state when developers failed to
join the research project(s). Thus as the project inputs accumulated and the view counts and
download tallies grew, the conclusion of a ‘cycle’ remained indeterminate. This dilemma was
addressed by starting additional projects, but, as these also failed to attract developers, it became
necessary to conduct a ‘super-cycle’ meta-evaluation regarding the research methodology itself.
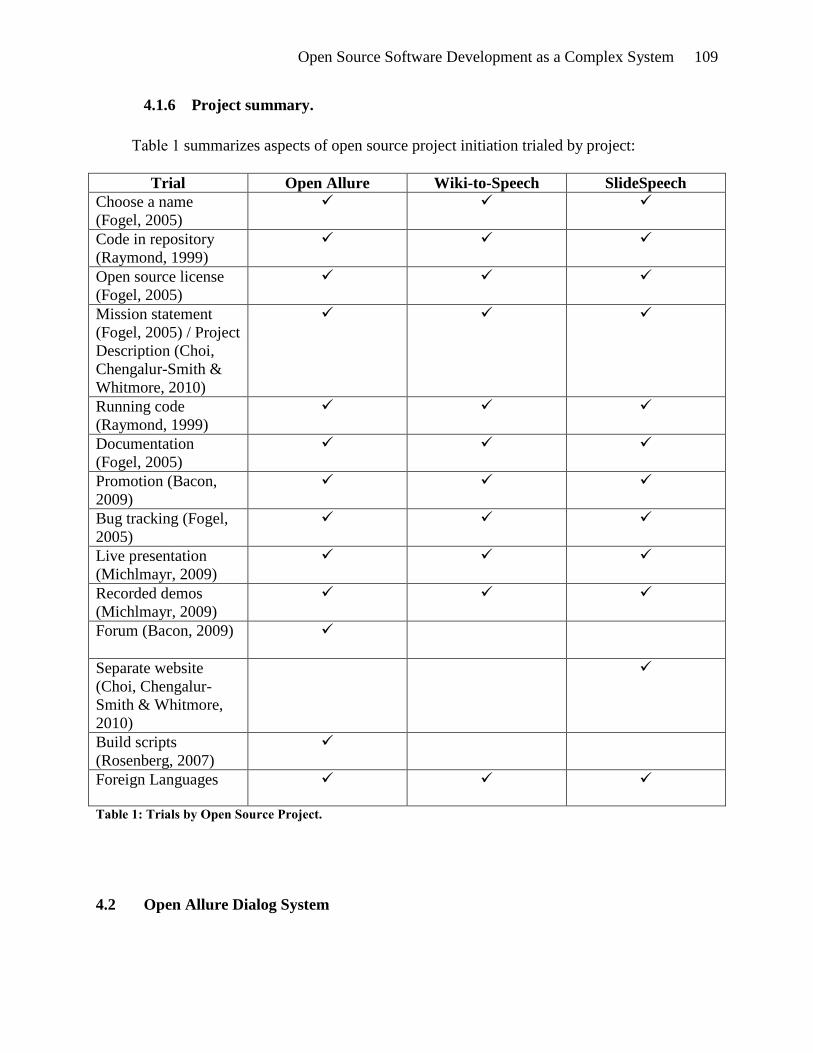
Open Source Software Development as a Complex System 109
4.1.6 Project summary.
Table 1 summarizes aspects of open source project initiation trialed by project:
Trial Open Allure Wiki-to-Speech SlideSpeech
Choose a name
(Fogel, 2005)
Code in repository
(Raymond, 1999)
Open source license
(Fogel, 2005)
Mission statement
(Fogel, 2005) / Project
Description (Choi,
Chengalur-Smith &
Whitmore, 2010)
Running code
(Raymond, 1999)
Documentation
(Fogel, 2005)
Promotion (Bacon,
2009)
Bug tracking (Fogel,
2005)
Live presentation
(Michlmayr, 2009)
Recorded demos
(Michlmayr, 2009)
Forum (Bacon, 2009)
Separate website
(Choi, Chengalur-
Smith & Whitmore,
2010)
Build scripts
(Rosenberg, 2007)
Foreign Languages
Table 1: Trials by Open Source Project.
4.2 Open Allure Dialog System

Open Source Software Development as a Complex System 110
Figure 47: Gource image of Open Allure Dialog System.
Of the three research projects, the Open Allure Dialog System project, illustrated by the
Gource55
image in Figure 47, explored the widest variety of ideas and approaches to initiating
and growing an open source project. In Figure 47, which shows the project in its final state of
development, the nodes represent files, color coded by file type, while lines are directories. The
Figure shows the complexity of a mature software project, including files for translations (the
.mo and .po file types), documentation (.html), build scripts (.nsi) and the Python source code
(.py files). Broadly, the exploration of open source development with this project first expanded,
55
Gource is a software version control visualization tool http://code.google.com/p/gource/

Open Source Software Development as a Complex System 111
then narrowed, as the project progressed and grew into this structure. The first step was to get
some open source code to run.
4.2.1 Project initiation.
In November 2009, when this research began, turning on a webcam, putting on a headset
and talking with another person through the computer on Skype suggested another possibility:
using the webcam and headset to talk with the computer. This required exploring a combination
of four different technologies: webcam-based facial or gesture recognition, voice recognition,
text-to-speech and the artificial intelligence required to integrate these audiovisual inputs and
produce audiovisual output. The initial research proposal aimed to motivate this combination of
technologies in an open source project through competition in the Chatterbox Challenge, an
annual contest to find the best chatbot.
The guiding principles of the development effort were taken from (Raymond, 1999),
namely, “Every good work of software starts by scratching a developer’s personal itch” (p. 25) ,
and:
“It is fairly clear that one cannot code from the ground up in bazaar style. One can test,
debug and improve in bazaar style, but it would be very hard to originate a project in
bazaar mode. Linus did not try it. I did not either.Your nascent developer community
needs to have something runnable and testable to play with.
When you start community-building, what you need to be able to present is a plausible
promise.Your program does not have to work particularly well. It can be crude, buggy,
incomplete, and poorly documented. What it must not fail to do is (a) run and (b)

Open Source Software Development as a Complex System 112
convince potential co-developers that it can be evolved into something really neat in the
foreseeable future.” (p. 37).
By taking on a project of personal interest and working toward presentation of a plausible
promise with crude, buggy, incomplete and poorly documented code, with the ultimate incentive
of creating a winning chatbot system, the expectation was that a community would form to fully
develop the ideas behind the Open Allure project if the code could run convincingly.
Open source software development has decades of history, as shown in Figure 48. As a
result, projects can draw on this accumulated work to jumpstart development. The chatbot idea
motivating Open Allure naturally led to (Bird, Klein & Loper, 2009) which offered a toolkit for
natural language processing called NLTK56
written in Python57
. Python, an open source
programming language, has a reputation for ease of learning, including an endorsement by Eric
Raymond58
, so it appeared to be a good choice for developing a chatbot prototype. Brin and Page
(1998) had also used Python for early work on the Google search engine.
56
http://nltk.org/ 57
http://python.org/ 58
http://www.linuxjournal.com/article/3882

Open Source Software Development as a Complex System 113
Figure 48: Age of selected free and open source software projects as of 2013, highlighting the "LAMP" stack and source code management systems.
Going beyond natural language processing to implement the other interface requirements,
specifically the webcam-based gesture recognition and voice recognition, required finding other
Python libraries. The first of these was the dragonfly59
voice recognition framework, downloaded
on 2 November 2009. Here was an example of an ‘easy win’ for open source in the hands of a
novice Python programmer. Without having to write or even fully understand the code
connecting Python to the Windows speech recognition API, by 6 November 2009 it was possible
to create a video illustrating the use of dragonfly to write and run a Python program completely
under voice control. The conclusion of the “Python No Hands” video60
is shown in Figure 49; it
shows “Hello World” as print output following the writing and running of the code in demo.py
(in the window in the background) using voice commands instead of the keyboard.
59
http://code.google.com/p/dragonfly/ 60
http://www.youtube.com/watch?v=xeyqSzXluAo

Open Source Software Development as a Complex System 114
Figure 49: YouTube video titled "Python No Hands" demonstrating use of the dragonfly voice recognition framework for Python to write a program using only voice commands (no keyboard).
Text-to-speech capability (generation of audio) also came with dragonfly, so three lines of
code, shown in Figure 50, were all that was required to get voice output working.
Figure 50: Python code highlighting the use of the dragonfly library to invoke text-to-speech.
Combining voice recognition for input with text-to-speech for output enabled creation of a
voice mirror (a system which could repeat words spoken to it) on 8 November 2009. This
success meant the project could demonstrate running code, so the question of how to start
building a community around the project arose. Python development in New Zealand had

Open Source Software Development as a Complex System 115
reached sufficient scale to allow organizing a national meeting, Kiwi PyCon 200961
, in
Christchurch. Presentations of the “Python No Hands” video and a slide deck, titled “Voice
Interaction in Python”62
, shown in Figure 51, were made to the group63
. Note how the slidecast
version (including a voice recording on each slide, posted on SlideShare.net) was ultimately
viewed over 6,400 times.
Figure 51: Slidecast on SlideShare.net titled "Voice Interaction in Python" uploaded 8 November 2009 for Kiwi PyCon 2009.
The cumulative views of project-related slidecast presentations on SlideShare is shown in
Figure 52. SlideShare sent a notice when this total passed 10,000 on 9 November 2012.
61
http://ojs.pythonpapers.org/index.php/tppm/issue/view/16 62
http://www.slideshare.net/jgraves1141/voice-interaction-in-python 63
http://pyvideo.org/video/132/lightning-talks 1:22 to 3:05

Open Source Software Development as a Complex System 116
Figure 52: Cumulative total SlideShare Views for all project-related presentations with linear regression fit.
The level of interest at Kiwi PyCon 2009 was measured by the number of developers, out
of 150 attendees64
, who became involved in the project afterwards: one. More community
development efforts were clearly needed, on an international level. This led to the download of
Bacon’s (2009) book The Art of Community, on 10 November 2009, which advised “Building
Buzz” in Chapter 6 (with the caveat “There is no secret recipe for creating community
enthusiasm” on page 115).
Development work then turned to using the webcam for input. The OpenCV library65
provided a Python interface for face recognition. It was used to create the video “Face Tracking
with OpenCV in Python”66
uploaded to YouTube on 23 November 2009, shown in Figure 53.
64
http://nz.pycon.org/2009/nov/13/kiwi-pycon-media-statement-4/ 65
http://sourceforge.net/projects/opencvlibrary/files/opencv-win/2.0/ 66
http://www.youtube.com/watch?v=O1ILR0bFHgE

Open Source Software Development as a Complex System 117
Figure 53: YouTube video titled "Face Tracking with OpenCV in Python" uploaded 23 November 2009.
Thus, by 28 November 2009, with the posting of the YouTube video titled “Open Allure
DS”, shown in Figure 54, and creation of the first open source code repository, at Google Code
http://code.google.com/p/open-allure-ds, the project goal was publicly announced and the trials
relating to the first project began. The expectation was that the project would attract attention and
engage the interest of open source developers, merely by virtue of being on the internet and
searchable. The “Open Allure DS” video, linked from the project home page, attempted to create

Open Source Software Development as a Complex System 118
the “buzz” suggested in (Bacon, 2009). Viewing statistics for the video67
(Figure 55) show what
happened next: 400 views in the next 4 months.
Figure 54: YouTube video titled "Open Allure DS" uploaded 27 November 2009 in an attempt to create “buzz”.
67
http://www.youtube.com/watch?v=0mmAA0ZZcIA

Open Source Software Development as a Complex System 119
Figure 55: View statistics for Open Allure DS YouTube video.
Overall, project video views exhibited linear growth (averaging 48.8 views per day, or one
every 30 minutes), taking the total view count past 50,000 in November 2012, as shown in
Figure 56. An annotated list of selected videos in Appendix C highlights the range of
demonstrations and promotions created and posted to YouTube as part of the research effort.

Open Source Software Development as a Complex System 120
Figure 56: YouTube Video Views for research project channel over time with linear regression line fit.
4.2.2 Downloads.
Source code was made available in four ways: in the Google Code Mercurial source code
repository, as a Google Code file download at the same repository, via the Python Package Index
and on Github. The first post to the Google Code repository68
was on 28 November 2009, with
the first version of Open Allure appearing 25 February 2010. Unfortunately, download statistics
on code in the source code repository were not available from Google, so a separate file
download (for which download counts were reported) was offered starting on 9 March 2010.
Tracking the count of file downloads began 16 April 2010, after 128 downloads had already
occurred, resulting in the chart shown in Figure 57.
68
https://code.google.com/p/open-allure-ds/

Open Source Software Development as a Complex System 121
Figure 57: Downloads of first version of Open Allure code file (version 0.1d5).
Project downloads from the Python Package Index version of Open Allure began after the
first posting, on 29 March 2010. Download counts as of 11 March 2013 are shown in Table 1. A
chart of the download count over time for the “d17” version is shown in Figure 58.
File Uploaded Downloads
openallure-0.1d8.tar.gz 29 March 2010 489
openallure-0.1d14.zip 27 April 2010 488
openallure-0.1d17.zip 13 May 2010 640 Table 2: Downloads of Open Allure from Python Package Index.

Open Source Software Development as a Complex System 122
Figure 58: PyPI download count for openallure-0.1d17.zip over time with linear regression line fit.
Despite the growth in download counts, the project did not attract new developers. One
clear problem was getting the downloaded code to run69
, as it had dependencies which needed to
be pre-installed. Worse, the dependencies were not fully documented in the first 0.1d5 release, so
a developer testing the code after downloading it would get error messages such as “ImportError:
No module named nltk.corpus.” Resolving this error involved a manual process of tracking down
the “nltk” module, installing it and launching Open Allure again, which might produce other
similar errors until all the dependencies were installed. Trying to use too many new technologies
simultaneously created a high hurdle for potential developers70
.
69
Issue #7 in the project issue tracker from 19 February 2011 suggested “Need to dig into how to make OADS easy
to run.” https://code.google.com/p/open-allure-ds/issues/detail?id=7 70
To give a sense of how involved the setup of a new system with downloaded dependencies can be, this
presentation http://slidespeech.com/s/o3djW6Wnen/ gives instructions for getting started with FLOSSSim. It
compresses one hour of work into 90 seconds.

Open Source Software Development as a Complex System 123
The barrier was not insurmountable, however. Here was one developer’s report:
“From: [developer in France]
Date: 28 Dec 2010 04:17
Subject: [Sugar-devel] "Openallure for Learning" in Sugar
To: "IAEP SugarLabs" <[email protected]>
Cc: "Sugar Devel" <[email protected]>,
"John Graves" <[email protected]>
Hi,
I discovered and tested in Sugar the application "Openallure for
Learning" ( http://code.google.com/p/open-allure-ds/ and
http://openallureds.ning.com/ ),
a "voice and vision enabled educational software" writen in Python.
As a Python application, it's multiplatform (Linux, Mac, Win). I got it
running in Ubuntu (after adding a few (22) dependencies) and on a XO 1.5
running Sugar 0.90.1 (after adding python-config-obj and python-nltk).
Thanks to its scriptable conception, it let's for example a teacher
design an interactive dialog (consisting a set of questions displayed on
screen and voice-synthetized per text-to-speech) and of answers made by
the student by pointing with the finger the line corresponding to the
selection, as captured by the camera.
It's certainly worth to experiment with the interactivity offered by the
Openallure application and I am sure that there is room for designing
powerfull extensions.
It worked here in Sugar (0.90) from the command line. I tried as well to
sugarize this activity (following the instructions in
http://wiki.sugarlabs.org/go/Running_Linux_Applications_Under_Sugar ),
however, I didnt manage to have a better user experience, compared to
the native application.
Kind regards,
[Developer name]”71
It may be noteworthy that, almost two years later (September 2012), Sugar Labs developers
released a version of Sugar (12.1.0) where “text-to-speech is woven into the interface”72
. This
integration of text-to-speech into Sugar 12.1.0 may have been influenced by the December 2010
71
This followup also ocurred, with a second developer writing: “I'll try to have a look at this, but I won't be able to
do it right away.” http://www.mail-archive.com/[email protected]/msg18756.html 72
http://www.engadget.com/2012/09/02/olpc-delivers-big-os-update-with-text-to-speech-displaylink/

Open Source Software Development as a Complex System 124
trial with Open Allure, even if none of the Open Allure code was reused. Open Allure may have
served as a sketch, scaffold or inspiration for the work ultimately done in Sugar. This particular
instance of the re-use or re-application of an idea from Open Allure cannot be demonstrated
except by the circumstantial observation: they tried it, they saw the potential for it and they
ultimately built a system to implement their version of it.
4.2.3 Social media trials.
The low level of interest following Kiwi PyCon 2009 led to several social media trials,
starting in December 2009. At the time, a free service called Ning (http://www.ning.com) was
freely available for building topic-specific social networks, so networks with direct73
and
indirect74
connections to Open Allure were created as shown in Figure 59:
Figure 59: Ning Networks for direct and indirect social media connections to Open Allure. December 2009.
While the New Zealand Computer Society AI Specialist Group network grew rapidly at
first (7 members in the first 30 minutes, 13 in the first day, 20 in the first week), the growth
plateaued at 49 members. This was enough to ultimately convene one meeting, held in February
73
http://openallureds.ning.com/ 74
http://nzaisg.ning.com/

Open Source Software Development as a Complex System 125
2011. The site remains active and may have at some point drawn attention to the Open Allure
project, but there was no evidence that this indirect recruitment approach worked. The direct
approach, the Open Allure DS group, languished.
Along with creating these collaborative blogging sites, postings were made on other
collaborative sites, such as CloudWorks75
in the UK and Classroom 2.076
in the US. Again, posts
related to a topic other than the Open Allure project itself received many more views, as the
audience on these sites was probably non-technical. For example, the CloudWorks post on
“Building Intelligent Interactive Tutors,” a book by Beverly Park Woolf, attracted 480 views
while one post at Classroom 2.0 on “Open Source Voice and Vision Enabled Tutorial Software”
had only 7 views as of 30 March 2013.
4.2.4 Public announcements and publicity.
Another project promotion opportunity arose in January 2010 at the LCA Conference in
Wellington, New Zealand. LCA (linux.conf.au), the annual meeting for the Linux community in
Australia/New Zealand, attracted over 600 developers in 201077
. The “Python No Hands” video
was played as part of a series of lightning talks for developers. Open Allure was presented in the
Education minconf,78
discussed one-on-one with other conference attendees (including Martin
Michlmayr, cited earlier) and mentioned to the entire conference in plenary session captured on
video during a question-and-answer period following one of the keynote speeches.79
This
75
http://cloudworks.ac.uk/cloud/view/2813/links (480 views as of March 2013) 76
http://www.classroom20.com/profiles/blogs/open-source-voice-and-vision (7 views as of March 2013) 77
http://www.stuff.co.nz/technology/3257752 78
http://www.lca2010.org.nz/wiki/Education_talk_3d 79
http://2009.r2.co.nz/20100118/50350.htm (in this video, shown in audience at 7:42 and asking question at 52:30)

Open Source Software Development as a Complex System 126
attracted the attention of a journalist covering the event, who requested an interview which
appeared on iTWire80
as “Learning with the computer using open source”.
In addition, Ron Stevens, a podcaster, published a 53-minute long interview81
titled, “Open
Allure: May 31, 2010” on his website, “Python411 Podcast Series: computer programming for
everybody”, which he described as “one of the most special I feel I have ever done.” This
interview was also summarized on the Github site for Open Allure82
.
Finally, Open Allure registered with ohloh.net83
, a directory of open source software, on 5
February 2010 and appeared in Freshmeat84
(now FreeCode) starting from 5 January 2011.
Subsequent daily traffic (23 December 2012 to 21 March 2013) is shown in Figure 60. The Y-
axis of the Figure has a range of zero to 9 clicks, so the traffic is low but steady, even 2 years
after the original posting. Ohloh and FreeCode provide directories of open source projects which
span multiple repositories. Ohloh provides a repository scanning and analysis service while
FreeCode sends out a regular e-mail bulletin regarding project updates and new project
announcements. Each provides another avenue for an open source developer to find a project of
interest.
80
http://www.itwire.com/opinion-and-analysis/open-sauce/36617-learning-with-the-computer-using-open-source 81
http://www.awaretek.com/python/ 82
https://github.com/jg1141/Open-Allure-DS/wiki/python411-interview-with-john-graves 83
http://www.ohloh.net/p/openallure 84
https://freecode.com/projects/open-allure-dialog-system

Open Source Software Development as a Complex System 127
Figure 60: Daily traffic to Open Allure on FreeCode two years after posting.
This FreeCode traffic data indicates how these bits of publicity may have worked to attract
interest to the project, even years later.
4.2.5 Getting Python code to execute.
Despite the publicity, public interest failed to translate into collaborative development
work. To address the need for running code, attempts were made to package Open Allure with
Portable Python85
and as a Microsoft® Windows executable version, generated using py2exe.86
In one test, the Portable Python version had a prohibitively long launch time of 8 minutes.
Meanwhile, the py2exe-generated executable version (openallure.exe) precluded any interested
Python developer from changing or improving the code. Nevertheless, the file openallure-win-
0.1d30.exe, uploaded in December 2010, had been downloaded 108 times by March 2013. Once
85
http://www.portablepython.com/ 86
http://www.py2exe.org/

Open Source Software Development as a Complex System 128
installed and launched (the file was a self-extracting zip file), this version began talking
immediately, saying “This software allows you to talk using the computer’s voice” and then
continuing on to read the script in the included plain text file, welcome.txt. Yet putting this
running executable code into the hands of developers still wasn’t enough to stimulate
collaboration.
4.2.6 Documentation.
Another set of project inputs involved trials with project documentation. Python has a
documentation tool called Sphinx87
, driven by restructured text. This was applied to produce
Open Allure version v0.1d14dev (alpha) documentation88
in the form of web pages documenting
each module of Open Allure (the main module, openallure, and sub-modules: gesture,
qsequence, text, video, voice). The extent of the Sphinx documentation, including an index of the
methods and a list of the modules, is indicated by the visualization shown in Figure 61.
87
http://sphinx-doc.org/ 88
http://pythonhosted.org/openallure/

Open Source Software Development as a Complex System 129
Figure 61: Open Allure documentation website, visualized by http://www.aharef.info/static/htmlgraph/. Key: black: the HTML tag, the root node blue: for links (the A tag) green: for the DIV tag yellow: for forms orange: for blockquotes gray: all other tags
In addition, a wiki was created (independent of the Google code project wiki89
) at Wikia,90
but none of this documentation effort evidenced any sign of stimulating collaboration.
4.2.7 Multiple platforms and the Mac iSight issue.
Running on multiple platforms was one of the reasons for using Python as the open source
language of choice for the Open Allure project. Since most of the libraries were cross-platform,
89
https://code.google.com/p/open-allure-ds/w/list 90
http://openallure.wikia.com/wiki/Openallure_Wiki

Open Source Software Development as a Complex System 130
by 19 April 2010, ‘something’ of Open Allure was running on Mac, Windows and Linux.
Differences between the hardware and software available on the different platforms made it
difficult to code one program to run identically on all three platforms. The text-to-speech output
capability was especially variable between platforms, as that aspect of the system was entirely
dependent on the voice engines available. On the Mac, the built-in voice, Alex, was accessible
via the utility called say through a system call; while on Windows, the Python dragonfly library
could address the Windows Speech API directly; and on Ubuntu (Linux), the eSpeak voice
engine91
required a separate installation. The voice quality also varied widely, with the Mac
voice sounding much better than the default Windows voice, Microsoft Anna, which
outperformed the eSpeak voices by a similar margin.
More problematic was getting the webcam code92
to work with the Mac’s built-in iSight
camera. This problem was ultimately found to relate to the different color-coding scheme used
by the Mac, but tracking this down took days of work and solving it turned out to be more
difficult than it was worth. Webcam-based gesture recognition did not work particularly well
even on the Linux or Windows systems, as shown by the video “Cooking with Open Allure”93
.
Nevertheless, the difficulty was worth noting, since it gave one potential contributor enough pain
that an unresolved issue ticket was added to the Github repository about it, titled “iSight
camera”94
.
Once support for webcam-based gesture detection was removed from the feature set, it became
possible to package up a Mac version of Open Allure using py2app95
. The first such release,
openallure-osx-0.1d27.zip, was posted for download in December 2010. That series of releases
91
http://espeak.sourceforge.net/ 92
Webcam code shown running in Linux: http://www.youtube.com/watch?v=xbac_DfucM8 93
http://www.youtube.com/watch?v=4lL1nC8U0w8 94
https://github.com/jg1141/Open-Allure-DS/issues 95
http://svn.pythonmac.org/py2app/py2app/trunk/doc/index.html

Open Source Software Development as a Complex System 131
for the Mac continued through openallure-osx-0.1d35.zip, posted in January 2011, with the grand
total number of downloads of all versions reaching 124 by March 2013. Still, making the system
available on Mac, Windows and Linux did not produce a developer community.
4.2.8 Kiwi PyCon 2010.
Kiwi PyCon 2010, the second annual meeting of Python developers in New Zealand, gave
the author an opportunity to present “Sage: Python and Math in a Browser” and include a
demonstration of Open Allure. On video96
, this presentation had attracted 4,654 views by March
2013 although most of this presentation used a screencast and a human voice recording rather
than slides and text-to-speech.
4.2.9 Foreign language versions.
The text-to-speech engine on the Mac offered the potential for downloading additional
voices in different languages, specifically the iVox voices from Assistiveware97
. Re-coding the
Python source to allow unicode characters and translating the text prompts led to production of
Portuguese98
and Italian99
versions of Open Allure, posted in January 2011. The YouTube
demonstration “Open Allure em Português”100
had 92 views and the code had netted 6 and 10
downloads respectively by March 2013, but no additional developers.
96
http://www.youtube.com/watch?v=GJcym7gMKrg 97
http://www.assistiveware.com/product/infovox-ivox 98
https://code.google.com/p/open-allure-ds/downloads/detail?name=openallure-osx-0.1d31-pt.zip&can=2&q= 99
https://code.google.com/p/open-allure-ds/downloads/detail?name=openallure-osx-0.1d32-it.zip&can=2&q= 100
http://www.youtube.com/watch?v=rxGOBV3-tAg posted 15 January 2011

Open Source Software Development as a Complex System 132
4.2.10 Trying to show higher headcount.
A futile attempt was made to look bigger than the short list of code committers shown on
the project repository homepage101
, through creation of a web page on the project wiki102
titled,
“Contributors: The helpful people who make Open Allure happen,” which listed everyone who
had contributed in any way, however slight, amounting to 20 names. This page was last updated
on 29 April 2011. By then, it had become clear that Open Allure needed to take a different
approach if it was ever going to attract developers.
The new approach grew out of a technical problem. As more text was added to the dialog
on the screen, the rendering of the text (word wrapping) became more complex. Since web
browsers are adept at rendering text, a natural solution was to delegate the rendering task to the
browser. This required rewriting the dialog code to work through a web browser interface. This,
in turn, occasioned a change in the project name and goal. As the text being spoken by the
system was already coming from wiki pages on the web in some instances, the new web-based
version was called Wiki-to-Speech.
101
https://code.google.com/p/open-allure-ds/people/list 102
https://code.google.com/p/open-allure-ds/wiki/Contributors

Open Source Software Development as a Complex System 133
4.3 Wiki-to-Speech
Figure 62: Gource image of Wiki-to-Speech.
The Wiki-to-Speech project had two parts: a desktop/server part and a mobile application
part. The code for the Java-based mobile application is illustrated by the Gource image in Figure
62. Again, the nodes are files, color coded by file type. An .apk file is an Android Package, the
compiled version of an app distributed to users. Lines are directories. The two parts of the project
explored possibilities for stimulating developer involvement in three new ways: via a web-based
interface, through use of another development language (Java) and through mobile app
development. Figure 63 shows how Wiki-to-Speech related to Open Allure in terms of features,
more than doubling the feature set. Including web developers and Java developers and Android
mobile developers expanded the pool of potential open source developers significantly.

Open Source Software Development as a Complex System 134
Figure 63: Wiki-to-Speech and Open Allure. Wiki-to-Speech added features in black boxes.
4.3.1 Working on mobile phones.
Google’s open source Android system for smart phones gained worldwide adoption in
2010103
due in part to the ease of learning and development. From downloading the free
developer tools for the first time on 10 November 2010, it took until 13 January 2011 (64 days)
to get an Android phone to talk, until 3 February 2011 (85 days) to produce a smart phone
version of Wiki-to-Speech, documented by the YouTube video104
titled “Wiki to Speech
Demonstration”, and until 14 March 2011 (124 days) to have a version 1.0 Wiki-to-Speech app
available for download105
. Even so, taking three months from start to finish may have presented a
hurdle for other interested developers. The wikitospeech-1.0.tar.gz file containing Java source
code for Wiki-to-Speech106
, posted on the Google code repository for Wiki-to-Speech in March
103
http://gigaom.com/2011/04/15/android-activation-timeline/ 104
http://www.youtube.com/watch?v=HgtREvCZMtg 105
https://play.google.com/store/apps/details?id=com.jgraves.WikiToSpeech 106
https://code.google.com/p/wiki-to-speech/downloads/detail?name=wikitospeech-1.0.tar.gz&can=2&q=
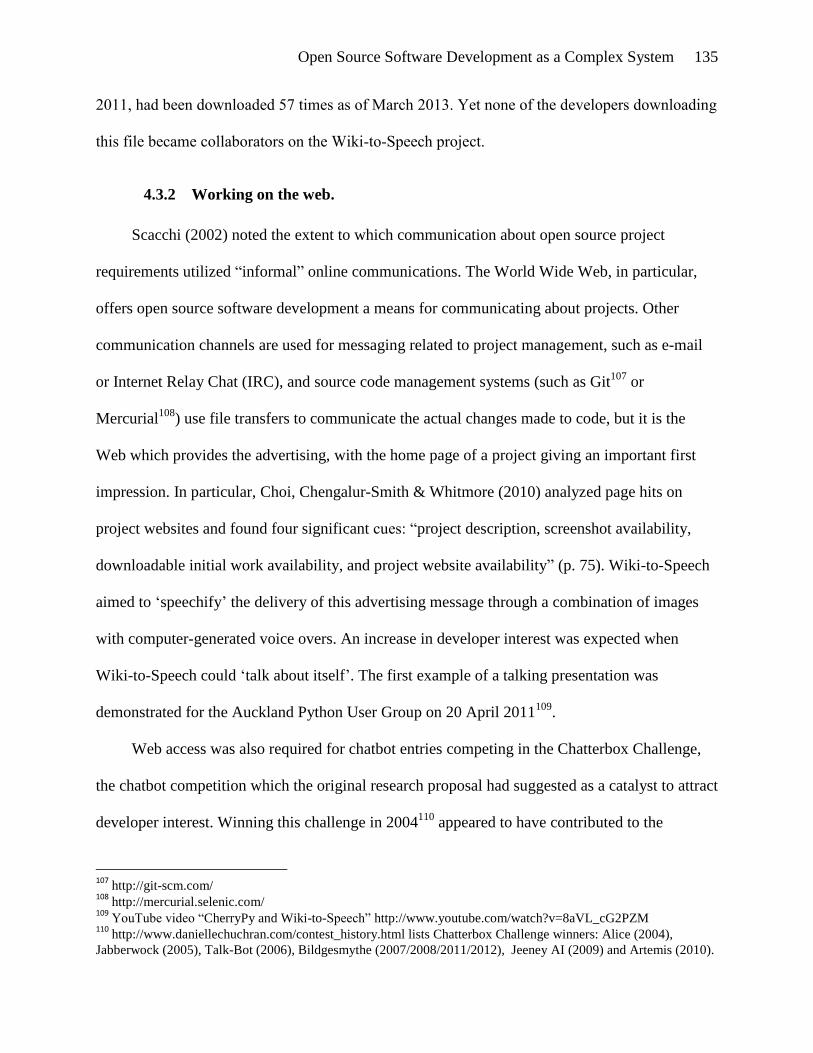
Open Source Software Development as a Complex System 135
2011, had been downloaded 57 times as of March 2013. Yet none of the developers downloading
this file became collaborators on the Wiki-to-Speech project.
4.3.2 Working on the web.
Scacchi (2002) noted the extent to which communication about open source project
requirements utilized “informal” online communications. The World Wide Web, in particular,
offers open source software development a means for communicating about projects. Other
communication channels are used for messaging related to project management, such as e-mail
or Internet Relay Chat (IRC), and source code management systems (such as Git107
or
Mercurial108
) use file transfers to communicate the actual changes made to code, but it is the
Web which provides the advertising, with the home page of a project giving an important first
impression. In particular, Choi, Chengalur-Smith & Whitmore (2010) analyzed page hits on
project websites and found four significant cues: “project description, screenshot availability,
downloadable initial work availability, and project website availability” (p. 75). Wiki-to-Speech
aimed to ‘speechify’ the delivery of this advertising message through a combination of images
with computer-generated voice overs. An increase in developer interest was expected when
Wiki-to-Speech could ‘talk about itself’. The first example of a talking presentation was
demonstrated for the Auckland Python User Group on 20 April 2011109
.
Web access was also required for chatbot entries competing in the Chatterbox Challenge,
the chatbot competition which the original research proposal had suggested as a catalyst to attract
developer interest. Winning this challenge in 2004110
appeared to have contributed to the
107
http://git-scm.com/ 108
http://mercurial.selenic.com/ 109
YouTube video “CherryPy and Wiki-to-Speech” http://www.youtube.com/watch?v=8aVL_cG2PZM 110
http://www.daniellechuchran.com/contest_history.html lists Chatterbox Challenge winners: Alice (2004),
Jabberwock (2005), Talk-Bot (2006), Bildgesmythe (2007/2008/2011/2012), Jeeney AI (2009) and Artemis (2010).
Open Source Software Development as a Complex System 136
popularity and success of AIML, the Artificial Intelligence Markup Language, developed by
Richard Wallace for Alice111
. As of the 2011 contest deadline, Wiki-to-Speech was only able to
provide a downloadable version112
, which played a wiki-based script113
as demonstrated in a
YouTube video114
titled “Chatterbox Challenge 2011 Script”. Consequently, rather than winning
the Challenge, Wiki-to-Speech was disqualified.
While the chatbot approach was text-only, a combination of slides with computer generated
voice overs appeared to offer a better, multimedia approach to project communication. In fact,
images combined with voice overs could be used to produce video. The design first aimed to
incorporate image links into the wiki-based script, as shown by the lines containing a path
parameter, Slide1.JPG and Slide2.JPG in this excerpt115
of a script from the Wiki-to-Speech
wiki:
111
https://files.ifi.uzh.ch/cl/hess/classes/seminare/chatbots/style.pdf 112
https://code.google.com/p/open-allure-ds/downloads/detail?name=WikiToSpeech-win-0.1d38-for-Chatterbox-
Challenge-2011.exe&can=2&q= 113
https://code.google.com/p/wiki-to-speech/wiki/ChatterboxChallenge2011Script 114
http://www.youtube.com/watch?v=MHp2j4OwVD8 115
https://code.google.com/p/wiki-to-
speech/wiki/DocumentClassificationUsingTheNaturalLanguageToolkitByBenHealey
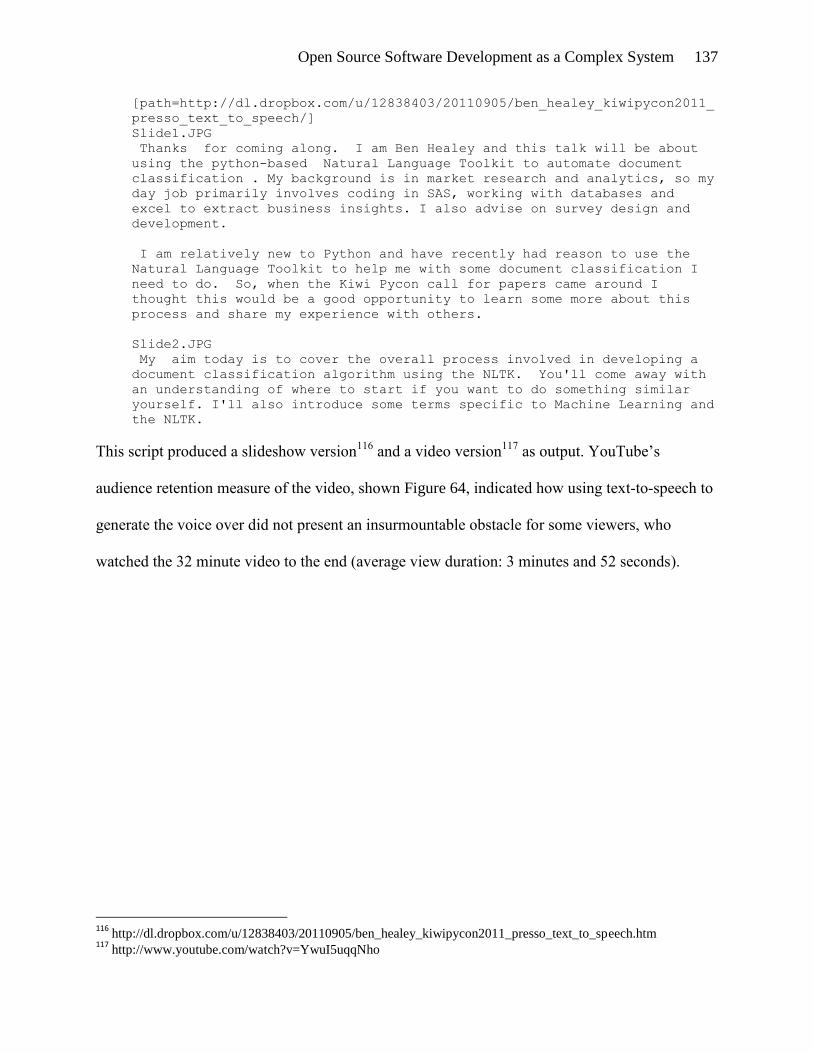
Open Source Software Development as a Complex System 137
[path=http://dl.dropbox.com/u/12838403/20110905/ben_healey_kiwipycon2011_
presso_text_to_speech/]
Slide1.JPG
Thanks for coming along. I am Ben Healey and this talk will be about
using the python-based Natural Language Toolkit to automate document
classification . My background is in market research and analytics, so my
day job primarily involves coding in SAS, working with databases and
excel to extract business insights. I also advise on survey design and
development.
I am relatively new to Python and have recently had reason to use the
Natural Language Toolkit to help me with some document classification I
need to do. So, when the Kiwi Pycon call for papers came around I
thought this would be a good opportunity to learn some more about this
process and share my experience with others.
Slide2.JPG
My aim today is to cover the overall process involved in developing a
document classification algorithm using the NLTK. You'll come away with
an understanding of where to start if you want to do something similar
yourself. I'll also introduce some terms specific to Machine Learning and
the NLTK.
This script produced a slideshow version116
and a video version117
as output. YouTube’s
audience retention measure of the video, shown Figure 64, indicated how using text-to-speech to
generate the voice over did not present an insurmountable obstacle for some viewers, who
watched the 32 minute video to the end (average view duration: 3 minutes and 52 seconds).
116
http://dl.dropbox.com/u/12838403/20110905/ben_healey_kiwipycon2011_presso_text_to_speech.htm 117
http://www.youtube.com/watch?v=YwuI5uqqNho

Open Source Software Development as a Complex System 138
Figure 64: Audience Retention for the Wiki-to-Speech-generated YouTube video, "Document Classification Using the Natural Language Toolkit", uploaded 5 September 2011. N=783 as of 25 March 2013.
Some presentations worked better than others in this format. For example, a shorter presentation
titled “Stigmergy”118
showed above average relative audience retention at a point three and half
minutes into the 5 minute, 11 second long presentation, as shown in the YouTube report in
Figure 65.
118
http://www.youtube.com/watch?v=0plmYzxdvyQ

Open Source Software Development as a Complex System 139
Figure 65: Relative Audience Retention for the Wiki-to-Speech-generated YouTube video, "Stigmergy”, uploaded 12 September 2011. N=265 as of 25 March 2013.
The greatest value added by a Wiki-to-Speech presentation appeared to be its ‘reach’, as many
more people might have a chance to view a presentation than would have without the tool. This
was demonstrated by a video created using Wiki-to-Speech119
titled, “Understanding the
software development process: participation, role dynamics and coordination issues,” posted 31
August 2011, which had 1,276 views and above average relative audience retention as of 24
March 2013, as shown in Figure 66. If not for this Wiki-to-Speech version, no more than 30
people would ever have heard this talk (those attending in person).
119
http://www.youtube.com/watch?v=QYdoWLizYFM

Open Source Software Development as a Complex System 140
Figure 66: Relative Audience Retention for the Wiki-to-Speech-generated YouTube video, “Understanding the software development process: participation, role dynamics and coordination issues”, uploaded 12 September 2011. N=1,278 as of 25 March 2013.
For Wiki-to-Speech to function effectively as an advertisement/trainer for prospective
Wiki-to-Speech open source project collaborators, however, the presentation production process
needed to be simplified and streamlined. By 23 July 2011, a demonstration video120
titled “Wiki-
to-Speech ODP Conversion Demo” could run through the instructions twice in under 2 minutes,
but the procedure still required a dozen steps, including downloading and installing the Wiki-to-
120
http://www.youtube.com/watch?v=-lSynFS7g1A

Open Source Software Development as a Complex System 141
Speech tools. Working on the web allowed taking the additional step of working through the
web, providing a presentation conversion service via a server to clients with only a web browser.
The first web service for Wiki-to-Speech utilized a Python-based localhost tunneling
solution called PageKite121
on 7 May 2011. Running the presentation converter on an internet-
connected PC started a localhost web service, accessible by a web browser on that same PC. By
simultaneously running PageKite, the service became visible to the internet, at the web address
http://wikitospeech.pagekite.me. With this arrangement, users of the system could upload a
presentation and have it converted into a talking presentation. Also, if many users were to be
supported, the whole conversion system could be located at a cloud computing service, such as
Amazon Web Services122
.
4.3.3 More documentation.
Competing online documentation tools offered more opportunities to post introductions to
Wiki-to-Speech. Weebly123
, ReadTheDocs124
and FLOSS Manuals125
could each offer some
information about Wiki-to-Speech by 21 May 2011. Unfortunately, no measurement of the
viewing of the documentation was made. In any case, this documentation had no noticeable
impact on project activity.
4.3.4 Kiwi PyCon 2011.
At Kiwi PyCon 2011, Wiki-to-Speech offered another lightning talk126
and four
presentations given at the conference were prepared as Wiki-to-Speech presentations: Audrey
121
http://pagekite.net/ 122
http://aws.amazon.com/ 123
http://wikitospeech.weebly.com/ 124
https://readthedocs.org/projects/wiki-to-speech/ 125
http://booki.flossmanuals.net/wiki-to-speech/_draft/_v/1.0/introduction/ 126
http://dl.dropbox.com/u/12838403/20110822/pycon2011.htm

Open Source Software Development as a Complex System 142
Roy’s talk127
on “Python and the Web”, Jeff Rush’s talk128
on “The Magic of
Metaprogramming”, Glenn Ramsey’s talk129
on “Design Patterns in Python” and Ben Healey’s
talk130
on “Document Classification using the Natural Language Toolkit”. A conference report131
“[Edu-sig] Wiki-to-Speech at Kiwi PyCon” was posted to the Python Edu-SIG mail server.
4.3.5 Meetup, MakerSpace, MOOCast and WizIQ.
As these various online project promotions failed to attract collaborators, trials with
additional ‘connector’ meetings were made, including presenting132
at the Auckland barcamp133
and a user group Meetup134
, visiting the local MakerSpace (called Tangleball135
), participation in
a MOOCast series136
of online meetings regarding the new term ‘MOOC’ (Massively Open
Online Course) and offering an online class “Introduction to Wiki-to-Speech” on WizIQ137
. One
student eventually expressed interest in taking the class, on 11 March 2012.
Despite these promotional activities, no collaborators joined the Wiki-to-Speech project at
all. Another trial attempted to introduce a higher standard of packaging and marketing. Steve
Yeoman’s class of digital design students at NatColl (now Yoobee School of Design138
) was
briefed on the features of the system and asked to design an attractive website for it, including a
new name. They came up with the name SlideSpeech.
127
https://dl.dropbox.com/u/12838403/20110827/audreyroy.htm 128
http://dl.dropbox.com/u/12838403/20110827/metaprogramming.htm 129
https://dl.dropbox.com/u/12838403/20110830/glennramsey.htm 130
http://dl.dropbox.com/u/12838403/20110905/ben_healey_kiwipycon2011_presso_text_to_speech.htm 131
http://code.activestate.com/lists/python-edu-sig/10416/ 132
http://dl.dropbox.com/u/12838403/20110714/barcamp.htm 133
http://www.eventfinder.co.nz/2011/jul/botany-downs/barcamp-auckland-5 134
http://www.meetup.com/nz-python-user-group/ 135
http://tumblr.tangleball.org.nz/ , http://www.meetup.com/Tangleball/ 136
http://edumooc2011.blogspot.co.nz/2011/07/moocast1-july-6-2011.html 137
http://goo.gl/KGmJp 138
http://www.yoobee.ac.nz/

Open Source Software Development as a Complex System 143
4.4 SlideSpeech
Figure 67: Gource image of SlideSpeech.
Like its predecessor project (Wiki-to-Speech), SlideSpeech was a hybrid of client and
server, web and mobile. While Open Allure had emphasized the desktop interaction and Wiki-to-
Speech added in smart mobile phones, the core focus of SlideSpeech was the web service and the
reach such a service might generate. The goal was to convert presentations, prepared in
PowerPoint or the Open Document Presentation (.odp) file format, into a compressed (.zip) file
containing a set of slide images and a script for a smart mobile device to read. The Gource image
shown in Figure 67 represents the relationships within the Python code for this converter. (The
nodes are files, color coded by file type. Lines are directories.) With the design work done by the

Open Source Software Development as a Complex System 144
NatColl students in early October 2011, SlideSpeech gained a logo and a pretty website139
,
shown in Figure 68.
Figure 68: Graphics from first SlideSpeech website designed at NatColl in October 2011.
4.4.1 SlideSpeech mobile.
On 24 October 2011, a new mobile SlideSpeech app, driven by a downloaded .zip file
script, was used to produce the video140
titled “Demonstration of SlideSpeech 1.0” shown in
Figure 69 (along with a comparison screenshot from a later, commercial version of SlideSpeech,
1.1203).
139
http://slidespeech.snapsynapse.com/ 140
http://www.youtube.com/watch?v=e1fwBHzBYTk

Open Source Software Development as a Complex System 145
Figure 69: YouTube video “Demonstration of SlideSpeech 1.0”, uploaded 24 October 2011 (left) and commercial version of SlideSpeech 1.1203, from 3 December 2012 (right).
4.4.2 Foreign language video for the Global Education Conference.
The ability of SlideSpeech to produce output in different languages was used to create a
Spanish language video141
titled, “SlideSpeech: Presentar directamente a vídeo con texto a voz”,
uploaded 11 November 2011. This was linked to the discussion of an online class at the 2011
Global Education Conference142
titled, “SlideSpeech: Present Directly to Video Using Text-to-
Speech”, shown in-progress in Figure 70. GlobalEd11 ran from 14-18 November 2011, attracting
over 10,000 unique logins. The Spanish language version of the SlideSpeech presentation was
motivated by the conference’s set of Spanish language presentations143
. As the conference
organizer had warned, however, the audience was largely non-technical.
141
http://youtu.be/p1Sb7_hlUow 142
http://www.globaleducationconference.com/page/2011-conference-quick-links 143
http://www.globaleducationconference.com/page/spanish-espanol-globaledcon

Open Source Software Development as a Complex System 146
Figure 70: SlideSpeech presentation to 9 participants in Blackboard Collaborate room 137 at the 2011 Global Education Conference, 17 November 2011.
4.4.3 Interactivity.
The last feature added to the Python prototype code was interactivity, demonstrated in the
YouTube video144
titled “Medicine”, posted on 19 February 2012. Figure 71 shows how this
version of SlideSpeech allowed coding of scripted interactions responding to key words entered
into an input field similar to a search box:
144
http://youtu.be/FTs4g3wXJAk
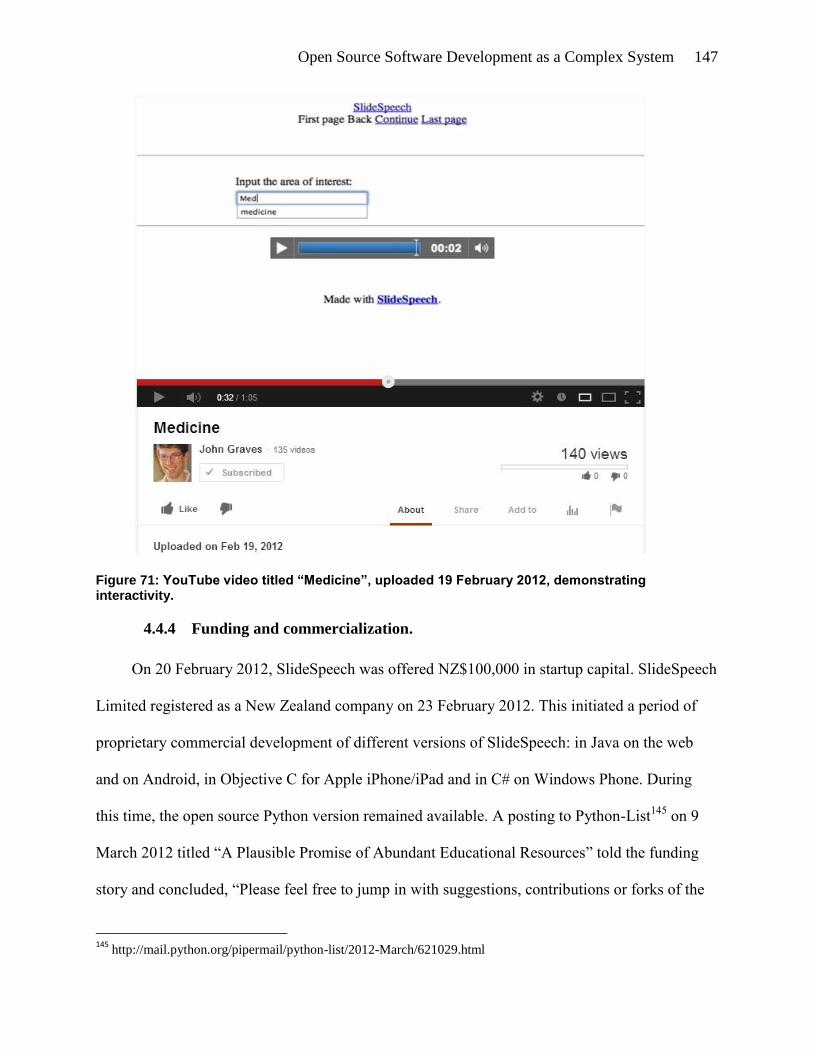
Open Source Software Development as a Complex System 147
Figure 71: YouTube video titled “Medicine”, uploaded 19 February 2012, demonstrating interactivity.
4.4.4 Funding and commercialization.
On 20 February 2012, SlideSpeech was offered NZ$100,000 in startup capital. SlideSpeech
Limited registered as a New Zealand company on 23 February 2012. This initiated a period of
proprietary commercial development of different versions of SlideSpeech: in Java on the web
and on Android, in Objective C for Apple iPhone/iPad and in C# on Windows Phone. During
this time, the open source Python version remained available. A posting to Python-List145
on 9
March 2012 titled “A Plausible Promise of Abundant Educational Resources” told the funding
story and concluded, “Please feel free to jump in with suggestions, contributions or forks of the
145
http://mail.python.org/pipermail/python-list/2012-March/621029.html

Open Source Software Development as a Complex System 148
code repositories listed below. Let's make Educational Abundance happen with Python this
year.” A follow up inquiry146
titled “Describing code with slides” on 15 November 2012 had no
replies. No code contributions had been made as of March 2013.
The architecture of the open source SlideSpeech Python converter system is shown in
Figure 72. The system takes five different inputs. The three marked in green include both images
and speaker notes for the text-to-speech ("COMPLETE"), while the PDF and PNG inputs
marked in black provide images only. Converters marked in blue create images ("PNG") while
those marked in red extract notes (“Notes”). The notes are parsed into the
Question/Answer/Response (QAR) data structure, then rendered as audio and as JSON. Finally,
the audio is wrapped with the images in HTML5 for the web player and the JSON is packaged
with the images in a ZIP file for the mobile app players.
146
http://code.activestate.com/lists/python-list/631078/

Open Source Software Development as a Complex System 149
Figure 72: Architecture of SlideSpeech conversions.

Open Source Software Development as a Complex System 150
4.5 Simulations
On 31 May 2012, Dr. Robin Hankin, Senior Lecturer, Mathematical Sciences, AUT
University, presented a one-hour session for graduate students titled, “Working with Statistical
Data @ AUT”. During a discussion after the session he happened to mention having a model
which explained genetic drift without resorting to selection, simply as a statistical process. This
neutral model was described in (Hankin, 2007), which featured the graph included in Figure 3
(p. 10), the graph shown in Figure 73 below, and the reference which included Figure 2 (p. 10).
Hankin’s model aimed to explain the pattern of biological abundance. This research aimed to
find out how to achieve an abundance of open source developers working together on a project.
Hankin’s simulation immediately appeared to offer two answers: in simulation 1) abundance
resulted from dynamics in the population, not from characteristics of the (equivalent) individuals
and 2) newcomers could win (although not often) as discussed below and shown in Figure 73.
The idea of punctuated equilibrium, introduced to the literature on evolution by (Gould &
Eldredge, 1972), suggests the pattern of biological speciation is “rapid and episodic” (p. 110)
rather than gradual. While Madey, Freeh & Tynan (2004) found a “young up-start” open source
project could not be properly modeled by preferential attachment (p. 20), perhaps the model was
not run long enough. The transition shown in Figure 73 occurs roughly at time step 15000. The
episodes of rapid speciation discussed by Gould and Eldredge may have been separated by
hundreds of millions of years147
.
147
Beautifully visualized at Chronozoom: http://www.chronozoomproject.org

Open Source Software Development as a Complex System 151
Figure 73: Punctuated equilibrium in simulation. Lines show the abundance of each species in time, with different colors corresponding to different (equivalent) species. Source: (Hankin, 2007, Figure 6, p. 12).
Pursuing research into open source project initiation via simulation required making
simplifying assumptions regarding the knowledge and possible actions of the people involved in
open source software development. Given the numerous factors that had been posited to
(somehow) affect the success or failure of open source projects, an agent-based simulation was
likely to suffer from having an inadequate or underspecified model of the agents. Hankin’s
model took the simplification of simulated behavior to an extreme level, on par with cellular
automata. Agents are simply born or die; they never compete. Then again, Wolfram (2002)
maintained that the simple recursive rules of cellular automata could produce complex patterns
and potentially explain complex behavior. He wrote, in a discussion related to biology, “features

Open Source Software Development as a Complex System 152
actually arise in essence just because they are easy to produce with fairly simple programs” (p.
387).
This section explains observations relating to three implementations of Hankin’s model, in
R, Excel and NetLogo, leaving the analysis of their verisimilitude to the Discussion section.
4.5.1 Simulation in R.
Hankin (2007) implemented the unified neutral theory of biodiversity (UNTB) from
(Hubbell, 2001) using the open source statistical package called R148
. To apply the same
simulation which produced the biodiversity graph of Figure 3 (p. 10) to open source project
developers, data from (Weiss, 2005, Figure 8, p. 147) was used to generate a ‘species’ table
including developer counts. Each row of the table represented a project (‘species’) while the
developers on that project counted as individuals of that ‘species’ (as in a biodiversity census).
The R code shown in Figure 74 produced the graph shown in Figure 75 and the output shown in
Figure 76. The Y-axis of Figure 75 is log scale; the red dots are data from (Weiss, 2005) while
the gray lines are simulated results. The simulation ‘grows’ results through a preferential
attachment (cloning) algorithm like the one described in section 2.1.1.6.3 (with death omitted)
until it reaches a population equal in size to the actual population.
Figure 74: R code for applying the UNTB model from (Hankin, 2007) to data from (Weiss, 2005).
148
http://www.r-project.org/

Open Source Software Development as a Complex System 153
Figure 75: Output of UNTB with data from (Weiss, 2005).
Figure 76: Summary output of UNTB applied to (Weiss, 2005).
Neither of the models from (Crosetto, 2009) or (Radtke, 2011), shown in Figure 31 and
Figure 32 respectively, fits well against the tail of the distribution with large numbers of
developers on a project (the Y-axis in Figure 75). While UNTB failed to predict the precise
abundance distribution of open source development projects, it did successfully predict the tails

Open Source Software Development as a Complex System 154
of the distribution, both the high frequency of single developer projects and the rare instances of
projects with dozens of developers. As a second example, running UNTB against Google Code
data from the analysis “How many projects of each team size are listed in Google Code? (05-
2011)” at FLOSSmole149
produced Figure 77 and the output shown in Figure 78. See Appendix
A for details.
Figure 77: Output of UNTB. Y-axis is log scale. Red dots are data from FLOSSmole (Howison, Conklin & Crowston, 2006) for Google Code in 2011. Gray lines are simulated results.
149
http://flossmole.org/content/how-many-projects-each-team-size-are-listed-google-code-05-2011

Open Source Software Development as a Complex System 155
Figure 78: Summary output of UNTB applied to Google Code data on 183,196 projects. Data source: FLOSSmole (Howison, Conklin & Crowston, 2006).
The mechanism generating these distributions in UNTB is preferential attachment of new
projects to the most frequently occurring project sizes: most often one developer. While the
resulting population exhibits the type of power law distribution actually observed with open
source projects, a better fit can be obtained by simulating preferential attachment ‘the other
way’: to projects with the largest size. Without some counterbalancing attrition, however, this
type of preferential attachment algorithm results in runaway growth of the largest projects.
Consequently, a simulation model including attrition was created, with the R code shown in
Figure 79. This code ‘grows’ a population of developers by incrementing the developer number
and assigning the new developer to a new or an existing project with some chance determined by
the parameters createNew and joinOld. A random developer is also unassigned from a project
with some chance determined by the parameter quitCurrent. This simulation code produced the
model fits shown in Figure 80 and Figure 81, showing remarkable similarity with the actual data.

Open Source Software Development as a Complex System 156
Figure 79: R code for simulation with attrition (excerpt).
Figure 80: Output of R model with attrition for data from (Weiss, 2005).

Open Source Software Development as a Complex System 157
Figure 81: Output of R model with attrition for data from FLOSSmole (Howison, Conklin & Crowston,
2006).
These outputs still reflected the developers-on-project orientation of prior open source
research, however. Taking the analysis one step further in the direction of biodiversity by
calculating the total number of developers involved in projects of each size (count of projects
times number of developers) and then ordering these totals by rank, rather than by the developers
on project count, produced the ranked abundance curves shown in Figure 82 and Figure 83. This
accords with the type of census used in a biodiversity study by treating a solo developer as a
‘different animal’ from a developer in a larger project. Using rank on the X-axis causes the 120
developers in 3 projects of size 40 to come before the 99 developers in 3 projects of size 33. The
actual and simulated results are visually indistinguishable from this perspective.

Open Source Software Development as a Complex System 158
Figure 82: Output of R model with attrition for data from (Weiss, 2005), interpreted as ranked developer
abundance curve.

Open Source Software Development as a Complex System 159
Figure 83: Output of R model with attrition for data from FLOSSmole (Howison, Conklin & Crowston,
2006), interpreted as ranked developer abundance curve.
Finally, two additional pieces of the simulation output suggested insights into how open
source works. First, the large number of developers generated in the simulation before the
simulation halted with the target number of projects (set to match the observed total number of
projects) pointed to the likely existence of a very large population of software developers who
are not actively involved in open source at all. This big group (93% of the simulated developers
in a typical simulation run) could be an important, but difficult to study, part of the open source
ecosystem—like dark matter in astronomy. If only 7% of the universe of potential open source
developers ever becomes an open source developer by starting or joining an open source project,
and only a tiny fraction of the open source projects ever draws significant numbers of
collaborators, then studies which focus exclusively on those large projects may be missing the

Open Source Software Development as a Complex System 160
impact open source has on a very large population of developers who may use, but not create,
open source software.
Second, when the simulation halts with the target number of projects created, C, a tally of
the number of projects with developers assigned is less than C due to attrition. A project may
start with one developer, but then that developer quits. From the perspective of the code
repository, an open source project has a birthday, but not a funeral. This means the open source
system has the potential to resurrect ‘dead’ (no active developer) projects and thus accumulate
diversity in a manner which biological systems cannot; once an extinction occurs, biological
diversity is lost. Repositories consequently become active agents in the evolution of the open
source system simply by storing source code.
4.5.2 Simulation in Excel.
As Madey, Freeh and Tynan (2004) found, simulation of a preferential attachment model
seemed to suggest a leading project should become a winning project and remain forever
dominant, as illustrated in Figure 84 (project 10 dominates throughout). Actual data show new
projects do sometimes grow and surpass older projects (for example, Ruby on Rails, 2200
committers, first commit 2004 surpassed Drupal, 147 committers, first commit 2000150
). Yet
Hankin’s UNTB model exhibited punctuated equilibrium over the long term, as shown in Figure
73. An Excel spreadsheet with a small scale implementation of UNTB was built to explore these
shifts in the dominant project and attempt to understand precisely how a new project could grow
to overtake an established project. Occasionally, the model produced a run showing change in
the dominant project, as in Figure 85 (project 9 in purple is the most dominant at step 33 while
project 1 in blue is the most dominant at step 69).
150
http://www.ohloh.net/p/rails, http://www.ohloh.net/p/drupal

Open Source Software Development as a Complex System 161
Figure 84: Developer Dynamics Excel spreadsheet showing continuity of dominant project (orange).
Figure 85: Developer Dynamics Excel spreadsheet showing the change of dominant project (from purple to blue).
In the simulation, the change in dominance happens the same way the initial leadership
happens: by chance. Since the preferential attachment algorithm is stochastic, the dominant
project is not always selected by a developer randomly changing projects with a bias toward
projects with the most developers. Occasionally, an alternative project can be selected by one
developer after another, just as it is sometimes possible to flip a fair coin and get heads over and
over again.
4.5.3 Simulation in NetLogo.
The R and Excel models, while useful, fell short of providing a visualization of the process
of open source project initiation and growth. To remedy this, another open source simulation

Open Source Software Development as a Complex System 162
tool, NetLogo, was called upon to model the linkage of developers to projects over time.
NetLogo utilizes ‘turtles’ to provide an animation of agent behavior and ‘links’ to show
connections between agents. Turtles may be any desired shape and colour. For the “Developer
and Project Model” of open source in NetLogo151
, green squares were selected to represent
projects and red circles to represent developers, with a developer’s involvement in a project
indicated by a link. This simulation created the visualization shown in Figure 8 (p. 17). Source
code for the model is listed in Appendix B.
The NetLogo model visualized the importance of project age, an emergent pattern. In
particular, the model showed how projects which started first and survived became dominant, as
shown in Figure 86. This Figure, shows the same simulation run as Figure 8, filtered to hide
projects with fewer than 10 developers. The filtering highlights the bias to older projects.
151
Available from
https://dl.dropbox.com/u/12838403/20130124/Developer%20and%20Project%20Model%2020130124.nlogo

Open Source Software Development as a Complex System 163
Figure 86: Sample Run of Developer and Project NetLogo simulation, filtered.
This pattern coincided with Tony Wasserman’s observation about “How to Start an Open Source
Project” at Gnunify’07152
: “Lesson One: New open source projects are similar to commercial
startups. The most important step in starting a new project is to avoid making any fatal errors.”
While the NetLogo model highlighted this ‘first mover advantage’, it was not as useful for
exploring the distribution of populations at actual scale and the punctuated equilibrium
phenomenon examined via the R and Excel models.
152
http://www.slideshare.net/gnunify/how-to-start-an-open-source-project slide 3.
Open Source Software Development as a Complex System 164
5. Discussion
5.1 “Occasionally profound consequences”
Scacchi et al. (2010) stated: “FOSS systems are much more than just source code, or
software applications; they are better understood as packages of interrelated social and technical
resources that interact and overlap, and that can occasionally give rise to profound
consequences” (p. 8). This thesis argues for understanding open source software development as
a complex system, where the word “occasionally” in the preceding sentence might be replaced
with a particular type of model which reveals the ultimate cause of the “profound consequences”
in the dynamics of nonlinear feedback and exponential growth. Without such an understanding,
the circumstances which ‘occasion’ the growth of open source projects may be impossible to
specify in a generalizable way a priori.
Understanding complex system characteristics including sensitivity to initial conditions and
path dependence are critical to guiding decision making in the complex domain. When the
solutions sought are neither known nor knowable based merely on observations of the system
state, it becomes necessary to experiment. Experiments, by definition, sometimes fail. In fact, the
distribution of open source projects by developer count can be interpreted as a quantitative
expression of the amount of failure needed to achieve the observed successes. Such knowledge
becomes profoundly useful as more systems are built using antifragile strategies which leverage
low cost failures to achieve high payoff successes; the cost/benefit tradeoff becomes predictable.
The research program followed to reach these conclusions moved through all four of the
modes of research in the multi-methodological framework of (Nunamaker, Chen and Purdin,
1990): systems development, observation, theory building and experimentation via simulation.
The systems development part led to the creation of open source projects. Observation of these

Open Source Software Development as a Complex System 165
projects in the field revealed systemic failure. Finally, a theory developed to explain this system-
level phenomenon found validation in the simulation experiments. Together, the parts achieved a
synergy with an unpredictable result. Consider these high-level points of evidence: three
attempts at growing open source software development projects failed, raising questions of
causality (other projects had been successful—but how?); a neutral model predicted a high
probability of such failures with the exceptional successes occurring due to chance; a chance
encounter led to commercial funding of one of the projects. The model and this evidence seemed
to fit. The fit may be seen as a coincidence or as a reflection of the methodology depending on
whether the luck of the diligent (Austin, 1978, cited in Cropley, 2006, p. 393) is considered to be
merely luck, or the product of hard work.
The data show conducting the systems development part of this research required hundreds
of days of hard work. Thomas Edison said, “Genius is 1% inspiration, 99% perspiration,”
(Josephson, 1959, p. 97) but the ratio appears to have been even more skewed in this case:
working on one idea for three years is closer to 0.1% than to 1%. Radtke (2011) also noted “the
extreme projects with greater than 14 developers” were just 0.63% of projects (p. 197). The
paper “Wiki-to-Speech for Mobile Presentations” (Graves, 2011) describes nine un-dated
“iterations” in the development of Wiki-to-Speech, while the chronicle of day-to-day work
captured by the commit history shows activity actually occurred in six spurts across the three
projects, in periods of active coding ranging from 2 to 16 weeks in length, as shown graphically
in Figure 43. These periods of active code commits are summarized in Figure 87. Two periods
(highlighted in red) were observed with sustained commit rates averaging more than one commit
per day.

Open Source Software Development as a Complex System 166
Figure 87: Periods of sustained code commits. Dates are in dd/mm/yyyy format.
Sharing presentations via Dropbox, shown in Figure 46, took place more consistently, with
periods of active posting summarized in Figure 88. However, the average rate of sustained
posting never rose above 3 postings in 4 days.
Figure 88: Periods of sustained posting of presentations to Dropbox. Dates are in dd/mm/yyyy format.
Thus, the data fail to reflect any acceleration in individual output, suggesting exponential growth
or improvements in productivity arising from an open source approach come from community
effects rather than from effects on the productivity of individuals within the open source
community.
This lack of acceleration contributes another dimension to the failure of the original
research agenda, beyond the lack of growth in the number of developers contributing to the
research projects. Open source may contribute to speeding up the learning process or the
development process of a solo developer who takes advantage of open source tools and code, but
the data collected here do not support this hypothesis.

Open Source Software Development as a Complex System 167
On the other hand, the data do reflect a remarkable scope of influence for a solo open
source developer. Although a gain in output productivity was not observed, a gain in throughput
productivity was evidenced by the huge numbers of views which accumulated, unexpectedly and
unpredictably, for the research project’s videos and slidecasts. The YouTube video views,
cumulatively tallied in Figure 89, exceeded the number of seats in New Zealand’s largest sports
stadium, Eden Park, with a capacity of 50,000 people. The slidecasts, listed in Figure 90, had
more views than the total number of passengers on 20 jumbo jets. It was the power of this
‘reach’ which motivated continuation of the research and investment by an angel investor.
Figure 89: Cumulative YouTube Video Views totaled 52,374 for the 135 videos on the research channel as of 11 February 2013.

Open Source Software Development as a Complex System 168
Figure 90: Slidecasts on SlideShare.net with view counts totaling 11,390 as of 1 April 2013.
Khan Academy provided a leading example of what can happen when the reach of the web
combines with parallel experimentation: someone gets lucky. Periodic observations of the Khan
Academy website, http://khanacademy.org, noted the view counts of his tutorial YouTube videos
grew dramatically from 84,000,000 on 8 November 2011 to 122,482,136 on 20 February 2012
and to 223,392,147 on 1 January 2013—all from one teacher! Yet, in (Khan, 2012), the creator
of these videos wrote: “Let me be clear—I think it’s essential for everything that follows—that at
the start this was all an experiment, an improvisation” (p. 17). Then he explained, “[W]hen I
started posting videos on YouTube, I had to abide by their guidelines. Although their rules have
now changed for certain kinds of content, there was then a ten-minute limit for what the site
would post. So my lessons were just about ten minutes long. And it turned out that ten minutes,
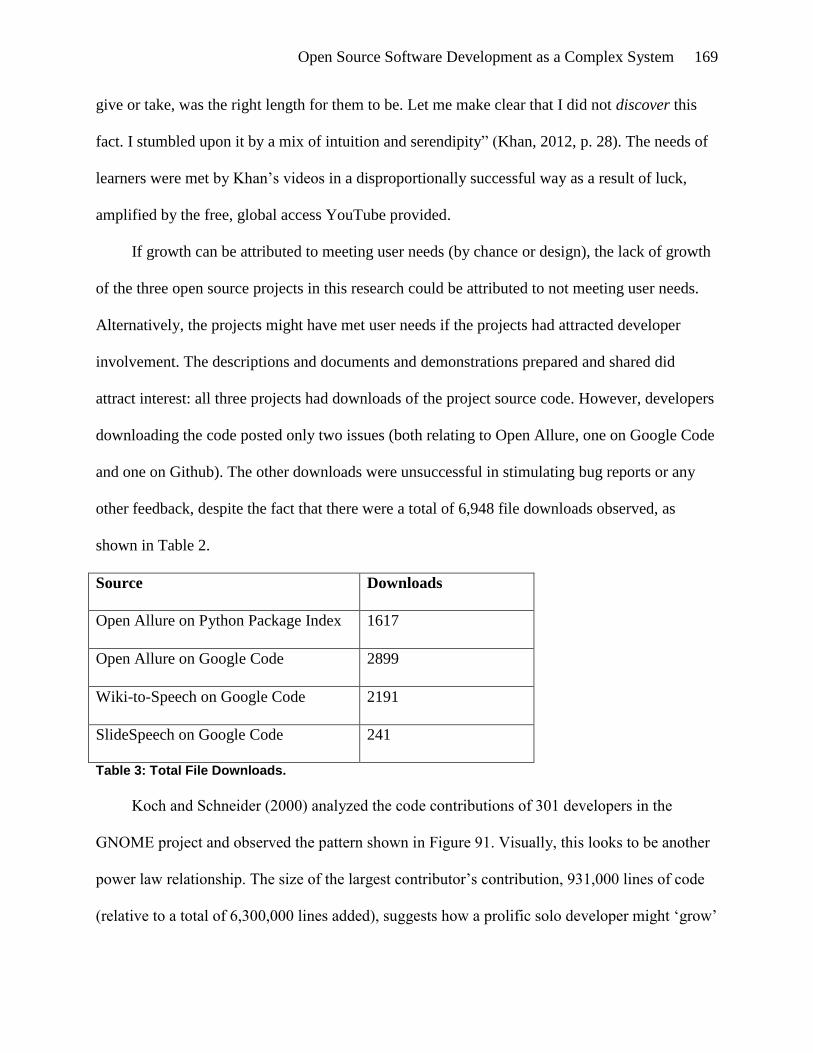
Open Source Software Development as a Complex System 169
give or take, was the right length for them to be. Let me make clear that I did not discover this
fact. I stumbled upon it by a mix of intuition and serendipity” (Khan, 2012, p. 28). The needs of
learners were met by Khan’s videos in a disproportionally successful way as a result of luck,
amplified by the free, global access YouTube provided.
If growth can be attributed to meeting user needs (by chance or design), the lack of growth
of the three open source projects in this research could be attributed to not meeting user needs.
Alternatively, the projects might have met user needs if the projects had attracted developer
involvement. The descriptions and documents and demonstrations prepared and shared did
attract interest: all three projects had downloads of the project source code. However, developers
downloading the code posted only two issues (both relating to Open Allure, one on Google Code
and one on Github). The other downloads were unsuccessful in stimulating bug reports or any
other feedback, despite the fact that there were a total of 6,948 file downloads observed, as
shown in Table 2.
Source Downloads
Open Allure on Python Package Index 1617
Open Allure on Google Code 2899
Wiki-to-Speech on Google Code 2191
SlideSpeech on Google Code 241
Table 3: Total File Downloads.
Koch and Schneider (2000) analyzed the code contributions of 301 developers in the
GNOME project and observed the pattern shown in Figure 91. Visually, this looks to be another
power law relationship. The size of the largest contributor’s contribution, 931,000 lines of code
(relative to a total of 6,300,000 lines added), suggests how a prolific solo developer might ‘grow’

Open Source Software Development as a Complex System 170
a project, allowing it to reach a size or state of functionality sufficient to attract additional
developers. The research projects may simply have been too small. In any case, the observation
yields an intriguing possibility. Perhaps open source software development is not only a complex
system but also fractal in nature, with power law patterns observable at multiple levels: projects
within users, developers within projects, and contributed code within developers.
Figure 91: Source Lines of Code (LOC) added per developer in the GNOME project. Source: (Koch &
Schneider, 2000, Figure 2, p. 3).
5.2 Simulation Accuracy
As the initial goal of this research was to find and demonstrate a reliable way to initiate and
grow an open source project by actually building and attempting to grow open source projects (a
proof-by-demonstration), the simulations constructed were not investigated from the perspective
of producing a model of open source with an optimized fit, as in (Radtke, 2011). These
simulations intentionally oversimplified the actual dynamics to explore the possibility of a

Open Source Software Development as a Complex System 171
parsimonious description of the open source project growth process, in the spirit, as Hankin
(2007) suggested, of a null hypothesis where differences in project growth are ascribed to a
random, project-neutral process. A simulation based solely on preferential attachment does not
replicate every detail of the observed distribution of open source projects, but it matches the
problematic tails of the distribution: the majority of single developer projects and the tiny
minority of projects with dozens to thousands of contributors.
The accuracy of the fit between the simulation results and the actual developer counts can
be gauged by putting each simulated value on a percent of actual basis. This simple approach is
preferable to using a single metric for the overall fit (such as RMSE) because our concern is with
the quality of the fit in each of the tails. For the SourceForge data, n=41, Figure 82 (p. 158), the
simulated values ranged from 78% to 202% of actual, with a mean of 108%. For the Google
Code data, n=34, Figure 83 (p. 159), simulated values ranged from 50% to 153% of actual, with
a mean of 82%. Thus, adding attrition to the models in R allowed matching the full ranked
abundance distribution to within a factor of 2 at each point with a mean error between 8% and
18%. The Swarm models introduced by (Madey, Freeh, & Tynan, 2004) may also produce a fit
across the full distribution, but this could not be confirmed. Their paper found introducing a
“fitness factor” was necessary to model the “young-upstart” phenomenon (Madey, Freeh, &
Tynan, 2004, p. 20), yet the UNTB model from (Hankin, 2007) exhibited punctuated equilibrium
without resorting to a fitness factor, so a close comparison of the assumptions of the two models
should be made to determine the cause of this difference. For example, the growth rate in the
developer population may be an important assumption. UNTB takes the size of the population of
project developers as fixed, with developers merely quitting, joining, or starting projects.
Barabasi and Albert (1999) modeled network growth, which may potentially have motivated

Open Source Software Development as a Complex System 172
Madey, Freeh, and Tynan (2004) to assume a growing population of developers. Simulating the
‘downfall’ of a dominant project using preferential attachment without a fitness factor may
require constraining the population of potential developers during the simulation period so the
dominant project can lose developers to the upstart and not have them replaced by new entrants.
Such staffing transitions between ‘hot’ commercial companies evidently occur. An example
presented by Gary Bolles153
is shown in Figure 92, which indicated significant staffing shifts
from Microsoft and Yahoo to Facebook and LinkedIn in June 2011 (when, arguably, all the firms
involved possessed ‘fitness’):
Figure 92: “People Flow to Where It's Hottest” by Gary Bolles, eParachute. June 2011.
153
Slide 7 from the presentation “Welcome to the Bubble: The Silicon Valley Ecosystem Today”
http://slidespeech.com/s/jSpBrfI4en/

Open Source Software Development as a Complex System 173
6. Conclusion/Implications
6.1 Summary
The research described in this thesis set out to explain the initiation and growth of open
source projects. To that end, three open source projects were launched, but all three failed to
attract contributors and grow to become self-sustaining. The reasons for this lack of growth
could have been project-specific, but such growth failures had been frequently observed in open
source. Models of the project initiation and growth process were constructed based on
preferential attachment and shown to produce simulated results matching the observed
distribution of projects by project size (measured by developer count). The research concluded
with an examination of the implications of these models.
In summary, Open Source Software Development, for all its diversity, can be understood as
a complex system, modeled using simple rules. The benefits of this perspective are threefold: 1)
the stigma of failure can be removed from some open source projects which fail to grow; these
may be seen as experiments (or ‘probes’) which constitute a functional part of the open source
ecosystem, 2) the theory supports development strategies of ‘fail fast’ (quickly halting
development on projects which do not gain traction) and ‘safe fail’ (using small, inexpensive
experiments to test for responses) and 3) an array of cross-disciplinary research findings can be
brought to bear on open source research questions. While a successful outcome of the original
research agenda would have resulted in a description of the steps leading to the growth of a self-
sustaining open source project, it now seems evident that those steps could not have been
generalized or shown to be repeatable. The pathway to growth appears to be project specific.
One can hardly base a practical guide to open source development on a recommendation to work
hard and hope you meet someone who wants to help, however. A preferential attachment model

Open Source Software Development as a Complex System 174
which reveals the power of connections may help developers better understand the value of
building an attractive, accessible project. The inherent uncertainty of trying something new
mandates taking an approach which is failure-tolerant, since failure-proof is not an option.
Understanding patterns of biological evolution and innovation and mapping that understanding
onto the complexities of software development is likely to be increasingly fruitful as systems
become more powerful and lifelike.
6.2 Contributions
This research has led to the following novel contributions. Studies of open source software
development focused on team dynamics and collaboration frequently exclude the majority of
open source projects which have only a single developer. This thesis argued these many small
projects are an important part of the open source software development system. First, the
research empirically confirmed the ‘no-growth’ reality faced by most open source projects.
Dynamic simulation models then demonstrated a simple mechanism for project growth which
offered an explanation for the lack of growth. The explanatory power of these models suggested
a re-examination of open source from a complex systems perspective, leading to insights
including identification of an ‘antifragile’ payoff strategy, patterns of punctuated equilibrium and
first mover advantage, and a projection for exponential growth.
6.3 Limitations
These contributions should be considered in light of the following constraints. The data
recorded in the open source research projects for this thesis, while voluminous, related to the
particular pathway of one developer (the author) into the practice of open source software
development. Likewise, the simulation results related to data from two particular repositories.
Basing meaningful generalizations on these narrow research perspectives required drawing

Open Source Software Development as a Complex System 175
connections between these results and other studies, including work done in different disciplines.
Consequently, validation of the theoretical ideas presented here was limited to showing the
match between a simple model and a pattern observed and analyzed by others in prior research.
Much more work could be done to provide greater validation. Further research suggested by this
model is discussed in the next section.
Meanwhile, the limited evidence supporting the models generated and presented here can
be weighed by the evidence needed to arrive at the research question which led to these models.
The lack of growth of the research projects provided critical evidence necessary to challenge the
level of understanding of the research problem. Investigating at the project level how to initiate
and grow a project via an actual, successful trial should have clarified those practical aspects of
open source software development; yet those ‘how to’ questions remain unanswered by this
research. While the likelihood of such a successful trial was low, the simulation results from this
study have shown the chance of success was greater than zero. Given approval of this thesis,
subsequent researchers should be encouraged: trying and failing can provide a valuable result
when the failure leads to consideration of alternative perspectives and useful explanations.
Indeed, while this thesis focused on team size growth as an objective measure of projects,
Aksulu & Wade (2010) depict open source as a system which outputs processes, technology and
people as well as projects, as shown in Figure 93. ‘Success’ could be measured along any of
these dimensions. Arguably, having gained experience from starting multiple open source
projects, obtaining investment funding, writing this thesis and earning a PhD, the author has
achieved ‘success’ even though none of the research projects may ever grow to have a self-
sustaining development team.

Open Source Software Development as a Complex System 176
Figure 93: Open Source System. Aksulu & Wade (2010), Figure 3, p. 590.
Ceding the causal mechanism for open source project growth to chance (a statistically
random process of preferential attachment for developers joining projects) flies in the face of a
common sense intuition about how the ‘best’ (or at least ‘better’) open source projects are
engineered for success. The view that the users or the functionality of the software ‘must’ play a
role in determining which project teams grow to self-sustainability shares this intuitive appeal.
While the neutral model proposed offers a match to observed actual values for the overall pattern
of project sizes, this result cannot rule out the possibility of a non-neutral, factor-specific model
providing a better fit to the subset of projects with multiple developers (arguably the only
‘interesting’ open source projects). The clear challenge, in that case, will be demonstrating the
generality of the factor-specific model and its superiority to the null (no-factor) model of this
thesis. For now, the simulation results indicate the preferential attachment model works better
than factor-specific models because the factors developers use to select projects to join are not

Open Source Software Development as a Complex System 177
consistent throughout the population. That diversity of selection criteria effectively ‘averages
out’ to a decision to preferentially join projects with larger teams—even though no developer
makes their choice based purely on that simplistic criteria.
6.4 Implications for Further Research
Further research could investigate fitting a preferential attachment model to additional
repositories or other subsets of the universe of open source projects. Complexity Science offers
new and exciting opportunities for cross-disciplinary research. Coincident with the conclusion of
this study, the Santa Fe Institute launched their first Massively Open Online Course (MOOC),
titled “Introduction to Complexity” taught by Melanie Mitchell154
while Scott Page155
at
University of Michigan posted his course, “Model Thinking.” Both courses noted how modeling
techniques enable systematic study of phenomena which may be impossible to understand
without using such dynamic tools. As this thesis demonstrated, open source software
development can be studied as a complex system via simulation, yielding insights which
statistical data mining methods would likely miss.
Thus, drawing insights from parallel strands of research in other disciplines which relate to
complex systems, as suggested in relation to biological evolution in section 2.1.3.1, appears to be
a particularly interesting avenue for further research. Alternatively, the models of preferential
attachment developed in this thesis may merit investigation from perspectives other than
software development or computer science. In particular, a thorough study of the model
parameters which control the extent to which developers participate in open source projects,
create new projects, join existing projects and stop contributing could reveal community-level
insights such as the historical dynamics or ‘cultural’ differences between the developers in
154
http://www.complexityexplorer.org/ The author’s completion certificate is posted here:
https://plus.google.com/100772331866826784248/posts/chnjRcSke4M 155
https://class.coursera.org/modelthinking-003/class/index

Open Source Software Development as a Complex System 178
different sub-sets of the open source community or the participants in other large scale social
collaborations. Fitting the model to the dozens of other repositories collected by Mockus (2009)
in a comparative analysis could also yield insights.
6.5 Implications for Practice
Those setting out to initiate an open source project should consider the odds of both gain
and loss, of growth and no-growth. When the cost of sharing is low enough and the potential
benefits great enough, adopting an antifragile strategy offers an opportunity to benefit from the
uncertainty and unpredictability of software development. Failure is part of the process. Beware
of putting more resources into struggling projects; double down on projects which see early
success. The ‘science’ of software development has not yet reached a point where growth of a
project involving people—open source software developers and users—can be reliably predicted.
The system of open source software development is complex.
6.6 Conclusion
Viewing open source software development as a complex system provides a fulcrum to
leverage an understanding of the dynamics of the initiation and growth of open source projects.
Data mining approaches can suffer from survivorship bias by excluding data relating to early
stage, single developer, no-growth projects. Case studies of large, successful open source
projects likewise tend to focus on how development teams coordinate their work without
addressing the question of team origins investigated here. Empirically testing our understanding
of open source project dynamics by launching new open source projects and observing the
results may ultimately produce projects which grow to become self-sustaining and, through
study, inform the practice of open source development. Meanwhile, agent-based simulations can
reveal aspects of the nature of the challenge.

Open Source Software Development as a Complex System 179
7. Appendices
APPENDIX A: OUTPUT FROM UNTB
Input data from FLOSSmole (Howison, Conklin & Crowston, 2006) for Google Code in 2011.
Output from simulation run using UNTB package in R. The ‘Developer’ lines are identifiers for
the number of developers per project in the original population (the ‘species’) while the ‘Count’
lines are frequencies. Thus a count of 1 is a singleton (a project size observed only once). In
Figure 77, the actual data (input) are shown with red dots on a log-linear plot while the
simulation output is shown with a gray line.
Input:
Developer: 1 2 3 4 5 6 7 8 9 10 11
Count: 146766 20334 7907 4189 1906 954 449 245 141 91 55
Developer: 12 13 14 15 18 17 16 20 23 26 19
Count: 41 24 22 14 10 8 7 6 4 4 3
Developer: 21 25 22 28 30 32 33 35 42 44 47
Count: 3 3 1 1 1 1 1 1 1 1 1
Developer: 59
Count: 1
Output:
Developer: 1 2 3 4 5 6 7 8 9 10 11
Count: 126412 31783 10518 4039 1555 694 272 146 50 26 12
Developer: 12 13 16 18
Count: 7 2 1 1

Open Source Software Development as a Complex System 180
APPENDIX B: SOURCE CODE FOR NETLOGO “DEVELOPER AND PROJECT MODEL”
1 ;;;;;;;;;;;;;;;;;;;;;;;;
2 ;;; Setup Procedures ;;;
3 ;;;;;;;;;;;;;;;;;;;;;;;;
4
5 breed [ developers developer ]
6 breed [ projects project ]
7
8 to setup
9 clear-all
10
11 set-default-shape developers "circle"
12 set-default-shape projects "square"
13
14 ;; make the initial developer-project pair
15 make-developer ;; first developer, unattached
16 make-project turtle 0 ;; first project, linked to first developer
17
18 reset-ticks
19 end
20
21
22 ;;;;;;;;;;;;;;;;;;;;;;;
23 ;;; Main Procedures ;;;
24 ;;;;;;;;;;;;;;;;;;;;;;;
25
26 to go
27 ;; use Y axis to show age
28 ask turtles [ fd (1 / YAxisScale) ]
29
30 ;; allow available developers to join a project
31 ask developers
32 [
33 ;; a developer is available if not linked to project
34 if count my-links = 0
35 [
36
37 if random 10000 < ChanceIn10000JoiningNewProject
38 [
39 ;; preferentially attach to project which has more developers
40 ;; by randomly selecting one of the linked developers and
41 ;; joining their project
42 let projectToJoin nobody
43 ask one-of developers with [count link-neighbors = 1]
44 [
45 ask link-neighbors
46 [
47 set projectToJoin self
48 ]
49 ]
50
51 ;; move into line with project, preserving age
52 let atY ycor
53 move-to projectToJoin
54 set ycor atY
55
56 ;; join project via link
57 create-link-with projectToJoin
58 ]

Open Source Software Development as a Complex System 181
59 ]
60
61 ;; possibly have a developer quit
62 if random 10000 < ChanceIn10000Quit
63 [
64 ask my-links [die]
65 set xcor min-pxcor
66 ]
67 ]
68
69 ;; make a new developer
70 make-developer
71
72 ;; possibly have new developer start project
73 if random 100 < ChanceIn100StartingProject
[make-project max-one-of developers [who]]
74
75 tick
76 layout
77 ;; if count developers >= 500 [stop]
78 if count projects >= 250 [stop]
79 ;; if ticks >= 1000 [stop]
80 end
81
82 ;; create a new developer
83 to make-developer
84 create-developers 1
85 [
86 set color red
87 ;; position along left edge
88 setxy min-pxcor min-pycor + 10
89 set heading 0
90 ]
91 end
92
93 ;; create a new project linked to new developer
94 to make-project [newDeveloper]
95 create-projects 1
96 [
97 set color green
98 ;; position the new project below developer
99 move-to newDeveloper
100 set heading 180
101 fd 1
102 set heading 0
103 create-link-with newDeveloper
104 ]
105 end
106
107 ;;;;;;;;;;;;;;
108 ;;; Layout ;;;
109 ;;;;;;;;;;;;;;
110
111 ;; change back and forth from size based on developer count to a size of 1
112 to resize-projects
113 ifelse all? projects [size <= 1]
114 [
115 ask projects [ set size sqrt count link-neighbors ]
116 ]
117 [
118 ask projects [ set size 1 ]
119 ]
120 layout

Open Source Software Development as a Complex System 182
121 end
122
123 to layout
124 let xOffset max-pxcor
125 let projectList projects
126 ifelse LayoutByAge?
127 [
128 set projectList sort-by [[who] of ?1 < [who] of ?2] projects
129 ]
130 [
131 set projectList sort-by [[10000 * count link-neighbors - who] of ?1
> [10000 * count link-neighbors - who] of ?2] projects
132 ]
133 foreach projectList
134 [
135 ask ? [
136 set xOffset xOffset - 1
137 let shift xOffset - xcor
138 set xcor xOffset
139 ask link-neighbors
140 [
141 set xcor xOffset
142 ]
143 ]
144 ]
145 end
146
147 to showNDevelopers
148 ;; Show projects with N developers
149 ;; For slider to work interactively, set view updates to continuous
150 ask projects
151 [
152 ifelse count link-neighbors < ShowProjectsWithNDevelopers
153 [
154 hide-turtle
155 ask my-links
156 [
157 hide-link
158 ]
159 ask link-neighbors
160 [
161 hide-turtle
162 ]
163 ]
164 [
165 show-turtle
166 ask my-links
167 [
168 show-link
169 ]
170 ask link-neighbors
171 [
172 show-turtle
173 ]
174 ]
175 ]
176 end

Open Source Software Development as a Complex System 183
APPENDIX C: ANNOTATED LIST OF SELECTED VIDEOS
Project videos provided both a record of stages of development (upload date and the video
content) and an indication of the subsequent level of interest (the number of views). This
annotated list highlights the most significant and most frequently viewed videos. Please note the
cryptic names (such as “s1srNOk2ISI”) in the uniform resource locators (URLs) for these videos
were generated by YouTube to provide unique identifiers within the YouTube system. All videos
listed are publicly viewable. This means the videos may have been viewed by people who were
not open source developers, so view counts relevant to aspects of this research may be
significantly less than the reported numbers.
Video 1:
Demo of Julius Speech Recognition on Linux
URL: http://www.youtube.com/watch?v=s1srNOk2ISI
Posted: 10 January 2010
Length: 2:36
Views as of 26 March 2013: 18,951
Explains the roles of the configuration, grammar, dictionary and tied files in the Julius
continuous speech recognition engine. The Julius speech recognition engine was not integrated
into the Open Allure Dialog System project, so this video was an ‘aside’ to the research project,
yet turned out to be the most viewed video, accumulating over four times as many views as the
next most viewed video. This provides a significant data point in the argument that success is
unpredictable and nonlinear.
Video 2:
Python No Hands
URL: http://www.youtube.com/watch?v=xeyqSzXluAo
Posted: 8 November 2009
Length: 1:39
Views as of 26 March 2013: 1,055
Begins with the words “start listening”, a verbal cue which turns on the Microsoft Windows
speech recognition engine, and then goes on to demonstrate writing and running a “Hello World”
program in Python (demo.py) entirely using voice commands. This video is particularly
noteworthy for two reasons: 1) the date of creation, only one week after downloading the Python
dragonfly library which allowed creation of the demonstrated voice commands such as “insert
comment” (similar to a keyboard macro) and 2) having been shown publicly at two conference
events: Kiwi PyCon 2009 in Christchurch and LCA 2010 in Wellington.

Open Source Software Development as a Complex System 184
Video 3:
Face Tracking with OpenCV in Python
URL: http://www.youtube.com/watch?v=O1ILR0bFHgE
Posted: 23 November 2009
Length: 0:38
Views as of 26 March 2013: 4,295
Demonstrates OpenCV face tracking in action. This was the second most viewed project video
until surpassed by Video 12. OpenCV was not integrated into the Open Allure Dialog System
project, so this video was also an ‘aside’ to the research, illustrating again the unpredictability of
success.
Video 4:
Open Allure DS
URL: http://www.youtube.com/watch?v=0mmAA0ZZcIA
Posted: 28 November 2009
Length: 1:01
Views as of 26 March 2013: 570
Begins with the words “Welcome to Open Allure DS: a voice and vision dialog system in
Python” and utilizes a screencast of Prezi156
to make a dynamic presentation. Intended to convey
the main features of the Open Allure system and invite participants.
Video 5:
Cooking with Open Allure
URL: http://www.youtube.com/watch?v=4lL1nC8U0w8
Posted: 3 May 2010
Length: 2:50
Views as of 26 March 2013: 115
Demonstrates control of Open Allure text-to-speech output via webcam-based gesture
recognition from across the room (kitchen). A frying pan is used to trigger one of the gestures.
Video 6:
Open Allure em Português
URL: http://www.youtube.com/watch?v=rxGOBV3-tAg
Posted: 15 January 2011
Length: 0:56
Views as of 26 March 2013: 92
Spoken in beautiful, computer-generated Portuguese using Infovox iVox and the Marcia voice
from the Acapela Group on a Mac. Begins with the words “Este software permite que você fale
com a voz do computador” (This software allows you to talk using the computer’s voice).
Video 7:
SlideSpeech Speaks Chinese
URL: http://youtu.be/vCjLtc3Jdns
Posted: 25 February 2012
156
http://prezzi.com

Open Source Software Development as a Complex System 185
Length: 1:08
Views as of 26 March 2013: 90
Uses the iVox Heather voice on a Mac to introduce the use of the SVOX Chinese voice on an
Android phone.
Video 8:
Wiki to Speech Demonstration
URL: http://www.youtube.com/watch?v=HgtREvCZMtg
Posted: 3 February 2011
Length: 3:16
Views as of 26 March 2013: 372
Demonstrates a small Android phone speaking and asking questions (text-only). Begins with the
computer-generated voice on the phone saying “Greetings. This script was fetched from the
internet.”
Video 9:
CherryPy and Wiki-to-Speech
URL: http://www.youtube.com/watch?v=8aVL_cG2PZM
Posted: 19 April 2011
Length: 5:14
Views as of 26 March 2013: 712
The Alex voice on the Mac begins by saying, “This talk has been prepared and delivered using
the subject of the presentation: CherryPy and Wiki-to-Speech.” The video goes on to give a
technical tutorial on the relationship between CherryPy input form parameters and Python
function parameters.
Video 10:
Chatterbox Challenge 2011 Script
URL: http://www.youtube.com/watch?v=MHp2j4OwVD8
Posted: 8 March 2011
Length: 5:23
Views as of 26 March 2013: 158
The Alex voice on the Mac begins by asking, “Sorry, before we start, what is your name?” The
name John is input and the voice continues, “Thanks. Hello John.” The video goes on to
demonstrate the script’s long-winded and rather evasive answers to Challenge questions from
prior contests, explaining in the process how the type of chatbot being demonstrated is different
from others.
Video 11:
Document Classification Using the Natural Language Toolkit
URL: http://www.youtube.com/watch?v=YwuI5uqqNho
Posted: 5 September 2011
Length: 32:33
Views as of 26 March 2013: 795
Lengthy (half hour, 26 slide) presentation authored by Ben Healey for Kiwi PyCon 2011.
Recorded using the Brian (British English) voice from IVONA.

Open Source Software Development as a Complex System 186
Video 12:
Sage: Python and Math in a Browser
URL: http://www.youtube.com/watch?v=GJcym7gMKrg
Posted: 17 November 2010
Length: 10:34
Views as of 26 March 2013: 4,645
A presentation for Kiwi PyCon 2010 using a screencast and human voice recording with a bit of
Wiki-to-Speech at the end. This video drew two rave reviews: “Wow! Very useful tutorial on
basic to not-at-all-basic Sage.” and “Great video overview of Sage!”
Video 13:
Stigmergy
URL: http://www.youtube.com/watch?v=0plmYzxdvyQ
Posted: 12 September 2011
Length: 5:10
Views as of 26 March 2013: 267
First presentation with CC-BY-NC-SA license. Recorded using the Heather voice from
AssistiveWare157
on a Mac. This presentation was able to play on an inexpensive Apad tablet and
a photo of this158
was featured on the home page of the Wiki-to-Speech Google code repository.
Video 14:
Understanding the software development process: participation, role dynamics and coordination
issues
URL: http://www.youtube.com/watch?v=QYdoWLizYFM
Posted: 31 August 2011
Length: 13:20
Views as of 26 March 2013: 1,283
Wiki-to-Speech version of D9 Confirmation of Candidature presentation by Sherlock Licorish
for AUT Computing and Mathematical Sciences. Illustrated the extensive reach possible for an
otherwise internal-only presentation by placing a version online.
Video 15:
Wiki-to-Speech ODP Conversion Demo
URL: http://www.youtube.com/watch?v=-lSynFS7g1A
Posted: 23 July 2011
Length: 1:53
Views as of 26 March 2013: 109
Explains how to create a talking presentation from an Open Document Presentation (ODP) using
Wiki-to-Speech.
Video 16:
Demonstration of SlideSpeech 1.0
URL: http://www.youtube.com/watch?v=e1fwBHzBYTk
157
http://www.assistiveware.com/product/infovox-ivox/voices 158
http://dl.dropbox.com/u/12838403/20111125/Apad_running_WikiToSpeech.jpg
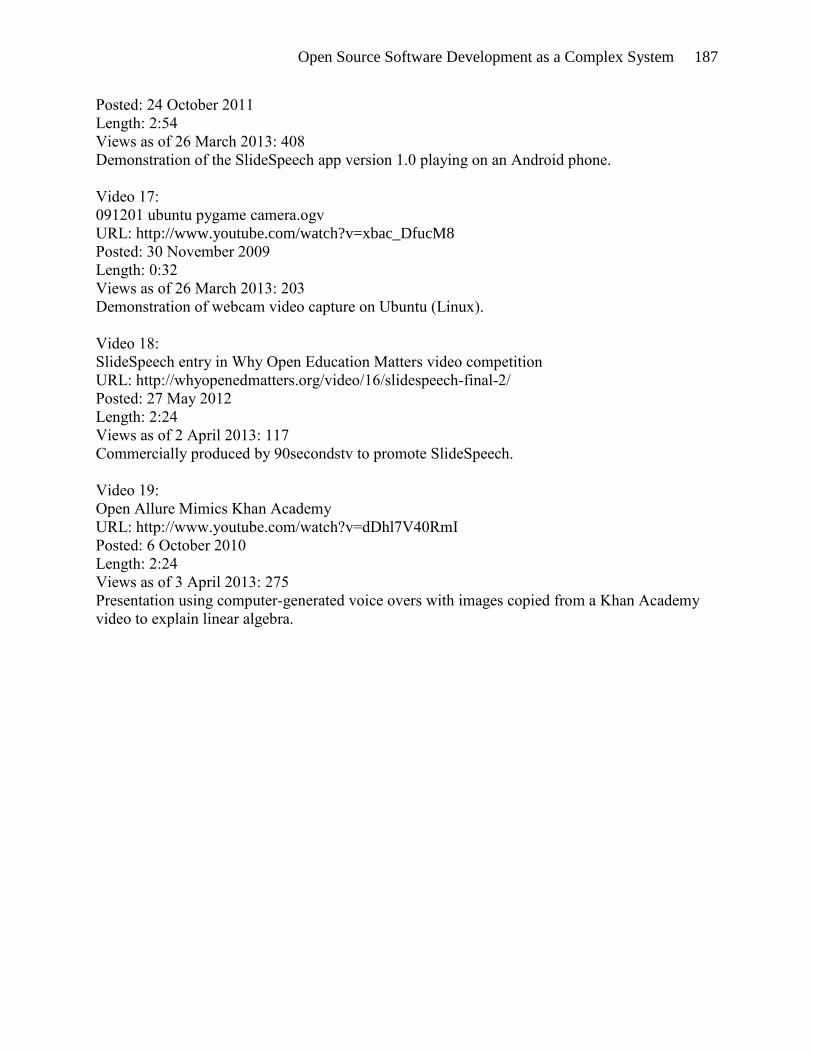
Open Source Software Development as a Complex System 187
Posted: 24 October 2011
Length: 2:54
Views as of 26 March 2013: 408
Demonstration of the SlideSpeech app version 1.0 playing on an Android phone.
Video 17:
091201 ubuntu pygame camera.ogv
URL: http://www.youtube.com/watch?v=xbac_DfucM8
Posted: 30 November 2009
Length: 0:32
Views as of 26 March 2013: 203
Demonstration of webcam video capture on Ubuntu (Linux).
Video 18:
SlideSpeech entry in Why Open Education Matters video competition
URL: http://whyopenedmatters.org/video/16/slidespeech-final-2/
Posted: 27 May 2012
Length: 2:24
Views as of 2 April 2013: 117
Commercially produced by 90secondstv to promote SlideSpeech.
Video 19:
Open Allure Mimics Khan Academy
URL: http://www.youtube.com/watch?v=dDhl7V40RmI
Posted: 6 October 2010
Length: 2:24
Views as of 3 April 2013: 275
Presentation using computer-generated voice overs with images copied from a Khan Academy
video to explain linear algebra.

Open Source Software Development as a Complex System 188
APPENDIX D: ANNOTATED LIST OF SLIDESHARE SLIDECASTS AND SLIDES
Slidecasts utilize a slide presentation with a recorded voice-over which plays for each slide
to deliver the presentation. In total, these five presentations had been viewed 11,390 times and
downloaded 87 times as of 1 April 2013.
Slidecast 1:
Voice Interaction in Python
URL: http://www.slideshare.net/jgraves1141/voice-interaction-in-python
Posted: 8 November 2009
Length: 10 slide with human voice-over recordings
Views / downloads as of 1 April 2013: 6,856 / 70
Slidecast 2:
How to Slidecast
URL: http://www.slideshare.net/jgraves1141/how-to-slidecast
Posted: 23 February 2010
Length: 40 slide with human voice-over recordings
Views / downloads as of 1 April 2013: 1,528 / 6
Slidecast 3:
Introduction to Wiki-to-Speech
URL: http://www.slideshare.net/jgraves1141/introduction-to-wikitospeech
Posted: 18 March 2011
Length: 12 slide with human voice-over recordings
Views / downloads as of 1 April 2013: 1,507 / 7
Slides 1:
Python No Hands
URL: http://www.slideshare.net/jgraves1141/python-no-hands
Posted: 8 November 2009
Length: 1 slide and an embedded YouTube video
Views / downloads as of 1 April 2013: 839 / 3
Slides 2:
SlideSpeech: Present Directly to Video Using Text-to-Speech
URL: http://www.slideshare.net/jgraves1141/slidespeech-present-directly-to-video-using-
texttospeech
Posted: 16 November 2011
Length: 34 slides, no audio
Views / downloads as of 1 April 2013: 657 / 1

Open Source Software Development as a Complex System 189
APPENDIX E: ANNOTATED LIST OF SELECTED PRESENTATIONS
Presentation 1:
Welcome to MMVC12 by Dr. Nellie Deutsch
URL: http://slidespeech.com/s/nDvEwz9Ken
Posted: 5 August 2012
Length: 1 slide, 1:04
Page views as of 30 March 2013: 3,337
Dr. Nellie Deutsch hosted the Moodle Moot Virtual Conference 2012 and used SlideSpeech to
provide an introduction. As of 30 March 2013, Google Analytics reported this as the SlideSpeech
presentation with the most views.
Presentation 2:
WizIQ Virtual Classroom
URL: http:// http://slidespeech.com/s/f2eLoXaben
Posted: 26 August 2012
Length: 2 slides, 1:54
Page views as of 30 March 2013: 642
Dr. Nellie Deutsch gives a pitch for using the WizIQ Virtual Classroom. As of 30 March 2013,
Google Analytics reported this as the SlideSpeech presentation with the second most views.
Presentation 3:
SlideSpeech at EduCamp Auckland 2012
URL: http://slidespeech.com/s/j14dzlcRen
Posted: 30 July 2012
Length: 6 slides, 1:54
Page views as of 30 March 2013: 109
A summary of a presentation of SlideSpeech at EduCamp Auckland 2012, a weekend conference
of teachers for professional development. As of 30 March 2013, Google Analytics reported this
as the SlideSpeech presentation with the third most views.
Presentation 4:
Profile of Victoria Ransom
URL: http://slidespeech.com /s/lQWKAjtOen
Posted: 30 July 2012
Length: 9 slides
Page views as of 30 March 2013: 80
Presentation 5:
Profile of Candace Kinser
URL: http://slidespeech.com/s/jZsduTnGen
Posted: 30 July 2012
Length: 8 slides
Page views as of 30 March 2013: 78

Open Source Software Development as a Complex System 190
Presentation 6:
CS Education Advocacy: Lessons from Hogwarts
URL: http://slidespeech.com/s/d7dVhfBJen
Posted: 14 September 2012
Length: 37 slides
SlideSpeech presentation prepared by Kim Wilkens.
Presentation 7:
FLOSSSim
URL: http://slidespeech.com/s/o3djW6Wnen/
Posted: 7 January 2013
Length: 19 slides
Steps through the process of setting up FLOSSSim.
Presentation 8:
How to install and use SlideSpeech LibreOffice Plugin
URL: http://slidespeech.com/s/6XxfLBizen/
Posted: 27 April 2013
Length: 27 slides
Instructions and links for SlideSpeech LibreOffice Plugin
Presentation 9:
Two demonstration slides with script
URL: https://dl.dropbox.com/u/12838403/20110501/script.txt
Posted: 1 May 2011
Length: 2 slides
Demonstrates a text file with hardcoded links to two image files and a question written in the
question/answer/response syntax.
Presentation 10:
CITRENZ
URL: https://dl.dropbox.com/u/12838403/20110601/CITRENZ.htm
Posted: 1 June 2011
Length: 3 slides
Presentation with computer generated voice-overs introducing the paper “Wiki-to-Speech for
Mobile Presentations” for the Computing and Information Technology Research and Education
New Zealand (CITRENZ2011) conference.
Presentation 11:
How To
URL: https://dl.dropbox.com/u/12838403/20110601/how_to.htm
Posted: 1 June 2011
Length: 7 slides
Presentation with computer generated voice-overs providing instructions on how to convert an
Open Document Presentation (.odp) file to Wiki-to-Speech using the utility odp2wts.exe.

Open Source Software Development as a Complex System 191
Presentation 12:
How to Create an ODP-to-Speech presentation from PowerPoint
URL: https://dl.dropbox.com/u/12838403/20110603/howto.htm
Posted: 3 June 2011
Length: 23 slides
Presentation with computer generated voice-overs and screenshots providing instructions on how
to convert a PowerPoint presentation to Wiki-to-Speech using the utility odp2wts.exe and then
save the result to Dropbox.
Presentation 13:
Signing up for eduMOOC in one easy step
URL: https://dl.dropbox.com/u/12838403/20110624/eduMOOC.htm
Posted: 24 June 2011
Length: 4 slides
Instructions on how to fill out the registration form for eduMOOC, a pilot Massively Open
Online Course, organized by the Center for Online Learning, Research and Service at the
University of Illinois, Springfield.
Presentation 14:
Sample
URL: https://dl.dropbox.com/u/12838403/20110624/sample.htm
Posted: 24 June 2011
Length: 3 slides
Experiment using HTML as the slide instead of a slide image.
Presentation 15:
Mobile Access to Presentations on Android
URL: https://dl.dropbox.com/u/12838403/20110627/script.htm
Posted: 27 June 2011
Length: 41 slides
‘Full length’ presentation with computer-generated voice-overs describing access to
presentations on Android mobile phones and tablets.
Presentation 16:
An introduction to some eduMOOC resources
URL: https://dl.dropbox.com/u/12838403/20110629/eduMOOC.htm
Posted: 29 June 2011
Length: 16 slides
Presentation with computer-generated voice-overs giving a tour of the resources available for
eduMOOC.
Presentation 17:
Christmas pudding
URL: https://dl.dropbox.com/u/12838403/20110629/20110629_201713b.htm
Posted: 29 June 2011

Open Source Software Development as a Complex System 192
Length: 3 slides
Experiment involving creation of a presentation directly from an e-mail message.
Presentation 18:
eduMOOC week 1
URL: https://dl.dropbox.com/u/12838403/20110701/edumoocweek1.htm
Posted: 1 July 2011
Length: 28 slides
Presentation with computer-generated voice-overs giving a summary of the discussion during the
first week of eduMOOC.
Presentation 19:
Collections
URL: https://dl.dropbox.com/u/12838403/20110703/art.htm
Posted: 3 July 2011
Length: 18 slides
Presentation with computer-generated voice-overs of a dozen paintings by New Zealand artists.
Presentation 20:
Wiki-to-Speech for Mobile Presentations
URL: https://dl.dropbox.com/u/12838403/20110704/citrenz.htm
Posted: 4 July 2011
Length: 33 slides
Presentation with computer-generated voice-overs using multiple voices, shown during
presentation of the paper “Wiki-to-Speech for Mobile Presentations” at the Computing and
Information Technology Research and Education New Zealand (CITRENZ2011) conference.
Presentation 21:
Wiki-to-Speech Summary of the First eduMOOCast
URL: https://dl.dropbox.com/u/12838403/20110707/eduMOOCast6july.htm
Posted: 7 July 2011
Length: 22 slides
Presentation with female computer-generated voice-overs and screenshots of a Skype call
recorded and posted on UStream by Jeff Lebow. The eduMOOCast featured Dave Cormier and
Vince Stevens.
Presentation 22:
Wiki-to-Speech and barcamp
URL: https://dl.dropbox.com/u/12838403/20110714/barcamp.htm
Posted: 14 July 2011
Length: 28 slides
Presentation with female computer-generated voice-overs for barcamp Auckland 2011.
Presentation 23:
Developer Dynamics in Open Source Software
URL: https://dl.dropbox.com/u/12838403/20110714/developer_dyanmics.htm

Open Source Software Development as a Complex System 193
Posted: 14 July 2011
Length: 15 slides
Presentation with computer-generated voice-overs showing use of Stella simulation software to
model developer dynamics.
Presentation 24:
Wiki-to-Speech Summary of the Second eduMOOCast
URL: https://dl.dropbox.com/u/12838403/20110714/edumoocast2.htm
Posted: 14 July 2011
Length: 7 slides
Presentation with female computer-generated voice-overs summarizing use of Google+ for
eduMOOCast.
Presentation 25:
Wiki-to-Speech View of Learning Theory for eduMOOC
URL: https://dl.dropbox.com/u/12838403/20110718/learning_theory.htm
Posted: 18 July 2011
Length: 34 slides
Presentation with Graham voice from iVox discussing the Popplet
http://popplet.com/app/#/49744 which offers an interactive visual presentation (map) of Learning
Theory.
Presentation 26:
Wiki-to-Speech Summary of eduMOOCast Week 4
URL: https://dl.dropbox.com/u/12838403/20110721/edumoocast4.htm
Posted: 21 July 2011
Length: 13 slides
Presentation with female computer-generated voice-overs summarizing an eduMOOCast on
Google+ featuring Steven Downes, Rob Darrow, Michael Marzio, Jeffrey Lebow and Dr. Nellie
Deutsch Muller.
Presentation 27:
Stigmergy
URL: https://dl.dropbox.com/u/12838403/20110721/stigmergy.htm
Posted: 21 July 2011
Length: 19 slides
Presentation with male computer-generated voice-overs discussing stigmergy. Also published as
a video: http://www.youtube.com/watch?v=0plmYzxdvyQ
Presentation 28:
Wiki-to-Speech Summary of eduMOOCast Week 5
URL: https://dl.dropbox.com/u/12838403/20110727/edumoocast5.htm
Posted: 27 July 2011
Length: 19 slides
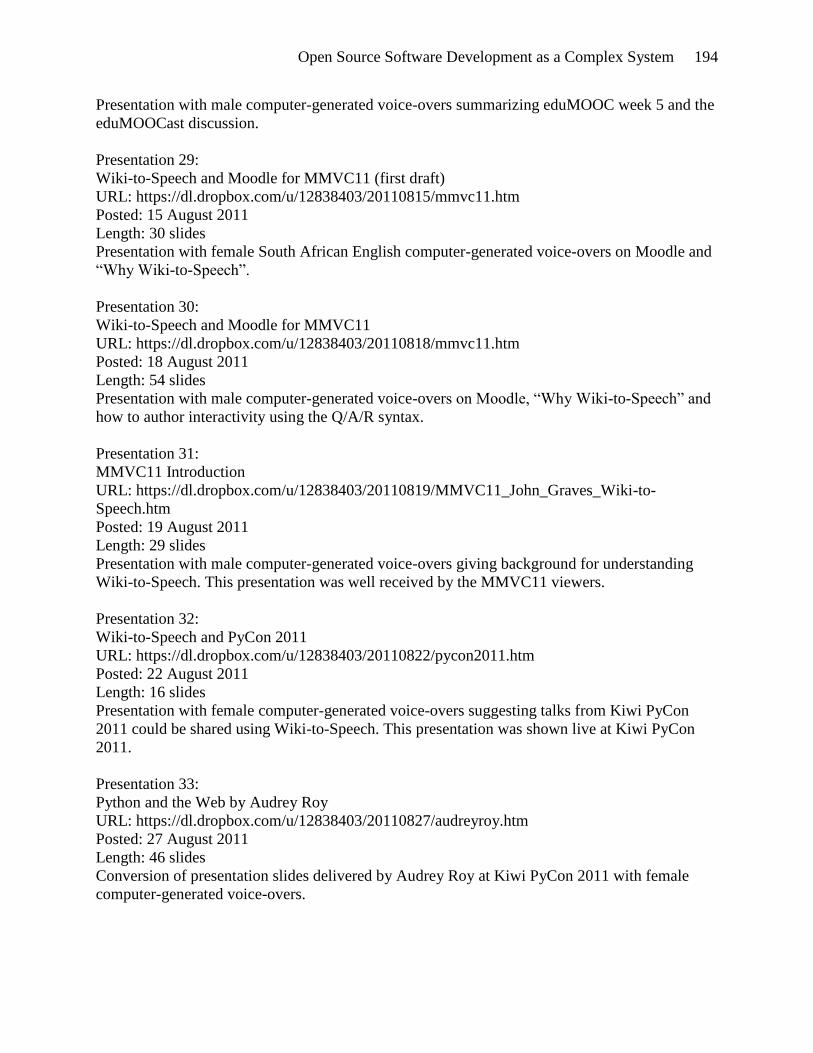
Open Source Software Development as a Complex System 194
Presentation with male computer-generated voice-overs summarizing eduMOOC week 5 and the
eduMOOCast discussion.
Presentation 29:
Wiki-to-Speech and Moodle for MMVC11 (first draft)
URL: https://dl.dropbox.com/u/12838403/20110815/mmvc11.htm
Posted: 15 August 2011
Length: 30 slides
Presentation with female South African English computer-generated voice-overs on Moodle and
“Why Wiki-to-Speech”.
Presentation 30:
Wiki-to-Speech and Moodle for MMVC11
URL: https://dl.dropbox.com/u/12838403/20110818/mmvc11.htm
Posted: 18 August 2011
Length: 54 slides
Presentation with male computer-generated voice-overs on Moodle, “Why Wiki-to-Speech” and
how to author interactivity using the Q/A/R syntax.
Presentation 31:
MMVC11 Introduction
URL: https://dl.dropbox.com/u/12838403/20110819/MMVC11_John_Graves_Wiki-to-
Speech.htm
Posted: 19 August 2011
Length: 29 slides
Presentation with male computer-generated voice-overs giving background for understanding
Wiki-to-Speech. This presentation was well received by the MMVC11 viewers.
Presentation 32:
Wiki-to-Speech and PyCon 2011
URL: https://dl.dropbox.com/u/12838403/20110822/pycon2011.htm
Posted: 22 August 2011
Length: 16 slides
Presentation with female computer-generated voice-overs suggesting talks from Kiwi PyCon
2011 could be shared using Wiki-to-Speech. This presentation was shown live at Kiwi PyCon
2011.
Presentation 33:
Python and the Web by Audrey Roy
URL: https://dl.dropbox.com/u/12838403/20110827/audreyroy.htm
Posted: 27 August 2011
Length: 46 slides
Conversion of presentation slides delivered by Audrey Roy at Kiwi PyCon 2011 with female
computer-generated voice-overs.

Open Source Software Development as a Complex System 195
Presentation 34:
The Magic of Metaprogramming by Jeff Rush
URL: https://dl.dropbox.com/u/12838403/20110827/metaprogramming.htm
Posted: 27 August 2011
Length: 71 slides
Conversion of presentation slides delivered by Jeff Rush at Kiwi PyCon 2011 with male
computer-generated voice-overs.
Presentation 35:
Design Patterns in Python by Glenn Ramsey
URL: https://dl.dropbox.com/u/12838403/20110830/glennramsey.htm
Posted: 30 August 2011
Length: 57 slides
Conversion of presentation slides delivered by Glenn Ramsey at Kiwi PyCon 2011 with male
computer-generated voice-overs.
Presentation 36:
Teaser for YouTube video “Astro Teller on Innovation”
URL: https://dl.dropbox.com/u/12838403/20110831/astro_at_su.htm
Posted: 31 August 2011
Length: 9 slides
Presentation using Graham voice from iVox. Shown at Androids in Auckland User Group.
Presentation 37:
Wiki-to-Speech
URL: https://dl.dropbox.com/u/12838403/20110901/WikitoSpeech.htm
Posted: 1 September 2011
Length: 8 slides
Presentation with male computer-generated voice-overs making a case for the convenience of
Wiki-to-Speech.
Presentation 38:
Mix and Mash 2011
URL: https://dl.dropbox.com/u/12838403/20110901/mixandmash.htm
Posted: 1 September 2011
Length: 5 slides
Presentation with female computer-generated voice-overs giving an introduction the Mix and
Mash competition.
Presentation 39:
Invitation to WizIQ Wiki-to-Speech Workshop
URL: https://dl.dropbox.com/u/12838403/20110905/wiziq_workshop.htm
Posted: 5 September 2011
Length: 10 slides
Presentation with female computer-generated voice-overs giving an invitation a WizIQ
workshop on Wiki-to-Speech.

Open Source Software Development as a Complex System 196
Presentation 40:
Document Classification Using the Natural Language Toolkit by Ben Healey
URL:
https://dl.dropbox.com/u/12838403/20110905/ben_healey_kiwipycon2011_presso_text_to_spee
ch.htm
Posted: 5 September 2011
Length: 27 slides
Conversion of presentation slides using delivered by Ben Healey at Kiwi PyCon 2011 with male
computer-generated voice-overs.
Presentation 41:
WizIQ Wiki-to-Speech Workshop
URL: https://dl.dropbox.com/u/12838403/20110909/wiziq_workshop.htm
Posted: 9 September 2011
Length: 30 slides
Presentation with female computer-generated voice-overs for a WizIQ workshop on Wiki-to-
Speech.
Presentation 42:
Test
URL: https://dl.dropbox.com/u/12838403/20110920/test.htm
Posted: 20 September 2011
Length: 3 slides, with questions between them
Demonstration with male computer-generated voice-overs of interactivity using questions and
answers with verbal responses.
Presentation 43:
Test19
URL: https://dl.dropbox.com/u/12838403/20110921/test19.htm
Posted: 21 September 2011
Length: 3 slides, with all audio in single file
Demonstration of combining all audio from multiple slides into a single file. The JavaScript
contains hardcoded details of the offsets and the length of each piece of the audio:
var slideImageFiles = ["Slide1.PNG","Slide2.PNG","Slide3.PNG"];
var audioStartTimes = [0.0,1.99,12.56];
var audioLength = [1564,10563];
Presentation 44:
Auckland Startup Weekend
URL: https://dl.dropbox.com/u/12838403/20110923/startup_weekend.htm
Posted: 23 September 2011
Length: 2 slides
Demonstration with male computer-generated voice-overs for Auckland Startup Weekend.
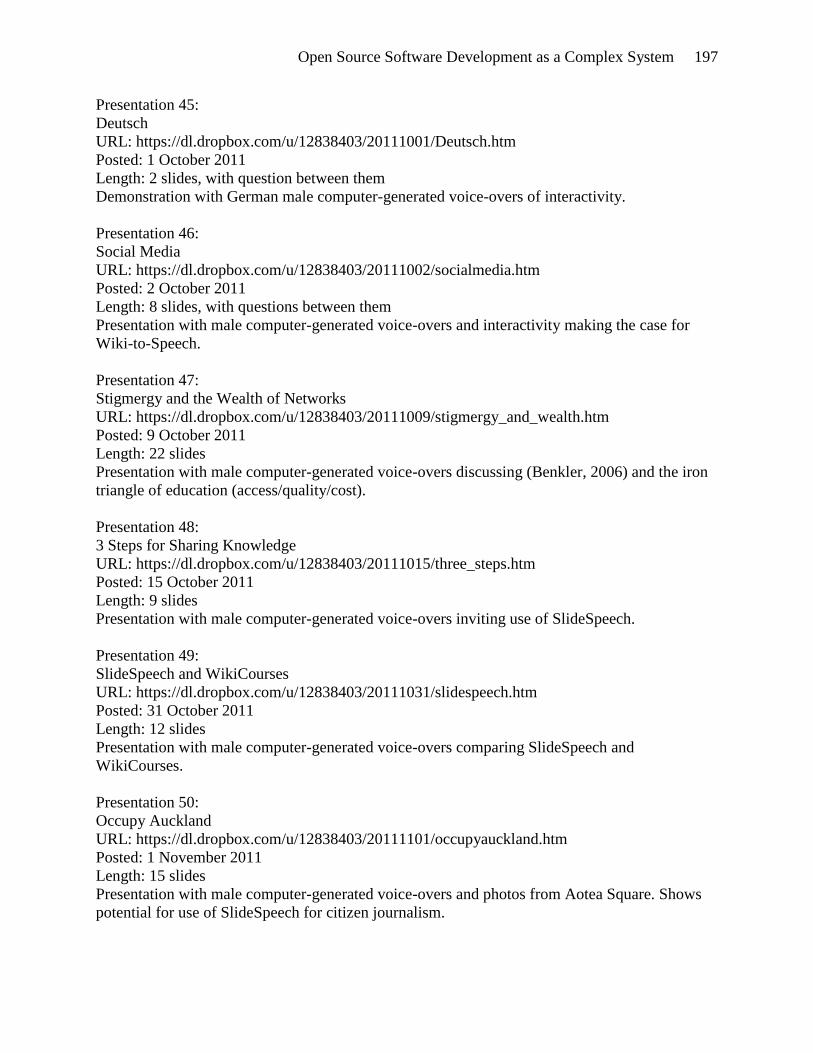
Open Source Software Development as a Complex System 197
Presentation 45:
Deutsch
URL: https://dl.dropbox.com/u/12838403/20111001/Deutsch.htm
Posted: 1 October 2011
Length: 2 slides, with question between them
Demonstration with German male computer-generated voice-overs of interactivity.
Presentation 46:
Social Media
URL: https://dl.dropbox.com/u/12838403/20111002/socialmedia.htm
Posted: 2 October 2011
Length: 8 slides, with questions between them
Presentation with male computer-generated voice-overs and interactivity making the case for
Wiki-to-Speech.
Presentation 47:
Stigmergy and the Wealth of Networks
URL: https://dl.dropbox.com/u/12838403/20111009/stigmergy_and_wealth.htm
Posted: 9 October 2011
Length: 22 slides
Presentation with male computer-generated voice-overs discussing (Benkler, 2006) and the iron
triangle of education (access/quality/cost).
Presentation 48:
3 Steps for Sharing Knowledge
URL: https://dl.dropbox.com/u/12838403/20111015/three_steps.htm
Posted: 15 October 2011
Length: 9 slides
Presentation with male computer-generated voice-overs inviting use of SlideSpeech.
Presentation 49:
SlideSpeech and WikiCourses
URL: https://dl.dropbox.com/u/12838403/20111031/slidespeech.htm
Posted: 31 October 2011
Length: 12 slides
Presentation with male computer-generated voice-overs comparing SlideSpeech and
WikiCourses.
Presentation 50:
Occupy Auckland
URL: https://dl.dropbox.com/u/12838403/20111101/occupyauckland.htm
Posted: 1 November 2011
Length: 15 slides
Presentation with male computer-generated voice-overs and photos from Aotea Square. Shows
potential for use of SlideSpeech for citizen journalism.

Open Source Software Development as a Complex System 198
Presentation 51:
Work the Room
URL: https://dl.dropbox.com/u/12838403/20111102/worktheroom.htm
Posted: 2 November 2011
Length: 16 slides, with questions
Technical presentation with female computer-generated voice-overs of the Work the Room app
for the Androids in Auckland User Group.
Presentation 52:
Hispanic
URL: https://dl.dropbox.com/u/12838403/20111107/hispanic.htm
Posted: 7 November 2011
Length: 3 slides
Presentation with Spanish female computer-generated voice-overs introducing SlideSpeech.
Presentation 53:
Cross Cultural SlideSpeech
URL: https://dl.dropbox.com/u/12838403/20111109/cross_cultural_slidespeech.htm
Posted: 9 November 2011
Length: 8 slides
Presentation with male computer-generated voice-overs for Global Education Conference.
Presentation 54:
Present Directly to Video Using Text-to-Speech
URL: https://dl.dropbox.com/u/12838403/20111112/globaled11_johngraves.htm
Posted: 12 November 2011
Length: 32 slides, with link from last slide to http://slidespeech.com
Presentation with male computer-generated voice-overs for Global Education Conference.
Presentation 55:
Present Directly to Video Using Text-to-Speech (Arabic Version)
URL: https://dl.dropbox.com/u/12838403/20111114/globaledcon11_johngraves_ar.htm
Posted: 14 November 2011
Length: 8 slides
Presentation with Arabic male computer-generated voice-overs for Global Education
Conference.
Presentation 56:
Sahal
URL: https://dl.dropbox.com/u/12838403/20111114/sahal.htm
Posted: 14 November 2011
Length: 7 slides
Presentation with male computer-generated voice-overs on Devendra Sahal.
Presentation 57:
Present Directly to Video Using Text-to-Speech (Female Arabic Version)

Open Source Software Development as a Complex System 199
URL: https://dl.dropbox.com/u/12838403/20111115/globaledcon11_johngraves_ar.htm
Posted: 15 November 2011
Length: 12 slides
Presentation with Arabic female computer-generated voice-overs for Global Education
Conference.
Presentation 58:
Present Directly to Video Using Text-to-Speech (Human Voice Arabic Version)
URL: https://dl.dropbox.com/u/12838403/20111115_tahir/globaledcon11_johngraves_ar.htm
Posted: 15 November 2011
Length: 8 slides
Presentation with human male Arabic voice-overs (Amjed Tahir) for Global Education
Conference.
Presentation 59:
Present Directly to Video Using Text-to-Speech (German version)
URL: https://dl.dropbox.com/u/12838403/20111116/globaledcon11_johngraves_de.htm
Posted: 16 November 2011
Length: 8 slides
Presentation with German female computer-generated voice-overs for Global Education
Conference.
Presentation 60:
Laurilard Conversational Framework: Putting SlideSpeech in Context
URL: https://dl.dropbox.com/u/12838403/20111116/laurillard.htm
Posted: 16 November 2011
Length: 12 slides
Presentation with male computer-generated voice-overs putting SlideSpeech in the context of the
Laurilard Conversational Framework.
Presentation 61:
Save
URL: https://dl.dropbox.com/u/12838403/20111116/save.htm
Posted: 16 November 2011
Length: 2 slides, with a question between them
Demonstrates auto advance after the verbal response to a question is played.
Presentation 62:
Integration2
URL: https://dl.dropbox.com/u/12838403/20111118/Integration2.htm
Posted: 18 November 2011
Length: 5 slides, with a hybrid of slide and question
Presentation with male computer-generated voice-overs of a calculus problem.
Presentation 63:
Surfers Gone Wild Teaser

Open Source Software Development as a Complex System 200
URL: https://dl.dropbox.com/u/12838403/20111123/SurfersGoneWild.htm
Posted: 23 November 2011
Length: 26 slides
Presentation with male computer-generated voice-overs giving a pitch for Anna Wilding’s movie
idea, Surfers Gone Wild. Prepared by Anna Wilding.
Presentation 64:
Auckland Libraries
URL: https://dl.dropbox.com/u/12838403/20111124/PTI%20PRESENTATION-voicetest.htm
Posted: 24 November 2011
Length: 14 slides
Presentation with female computer-generated voice-overs giving an explanation of services
available at the Auckland Libraries. Prepared by Pikiora Wylie.
Presentation 65:
Project Justice
URL: https://dl.dropbox.com/u/12838403/20111130/Mission1SlideSpeech.htm
Posted: 30 November 2011
Length: 8 slides
Presentation with female computer-generated voice-overs giving instructions for school kids to
work on Project Justice. Prepared by Kim Wilkens.
Presentation 66:
Sermon: When I’m 64 by Christine Whelan
URL: http://dl.dropbox.com/u/32648680/SlideSpeech/1333173594.256370/odpName.htm
Posted: 25 March 2012
Length: 22 slides
Manually constructed example of a recorded sermon presented as a narrated slideshow.
Presentation 67:
Tennis
URL: https://dl.dropbox.com/u/12838403/20120113/static/1326449087.34/odpName.htm
Posted: 12 January 2012
Length: 5 slides
Presentation with female computer-generated voice-overs on Anna Wilding’s special day at the
Heineken Open. One of the first presentations created from SlideSpeech running as a web
service.
Presentation 68:
Interactivity from SlideSpeech Web Service
URL: https://dl.dropbox.com/u/12838403/20120113/static/1326530401.64/odpName.htm
Posted: 13 January 2012
Length: 2 questions
Demonstration of slide-less interactivity with female computer-generated voice-overs, generated
by SlideSpeech running as a web service.

Open Source Software Development as a Complex System 201
Presentation 69:
Shadow Work
URL: https://dl.dropbox.com/u/12838403/20120123/Shadow-work.htm
Posted: 23 January 2012
Length: 4 slides
Promotional presentation using male computer-generated voice-overs for a psychology
workshop.
Presentation 70:
WG Building
URL: https://dl.dropbox.com/u/12838403/20120123/WG%20building.htm
Posted: 23 January 2012
Length: 10 slides
Presentation using male computer-generated voice-overs on uses for AUT’s new WG building.
Presentation 71:
Welcome to SlideSpeech on the Web
URL: https://dl.dropbox.com/u/12838403/20120218/1329510486.02/odpName.htm
Posted: 18 February 2012
Length: 12 slides
How-to presentation using female computer-generated voice-overs, explaining use of
SlideSpeech’s web service.
Presentation 72:
SlideSpeech Speaks Chinese Using SVOX
URL: https://dl.dropbox.com/u/12838403/20120225/china5.htm
Posted: 25 February 2012
Length: 9 slides
Presentation using female computer-generated voice-overs in English and Chinese (slides 6 & 7).
Also published as a video: http://youtu.be/vCjLtc3Jdns
Presentation 73:
Advising Boards and Commissions in the City of Providence
URL: https://dl.dropbox.com/u/12838403/20120226/cle/odpName.htm
Posted: 26 February 2012
Length: 6 slides
Presentation using male computer-generated voice-overs for continuing legal education.
Presentation 74:
Teacher
URL: https://dl.dropbox.com/u/12838403/20120227/teacher/odpName.htm
Posted: 27 February 2012
Length: 7 slides
Presentation using female computer-generated voice-overs to ask “What if?” questions
suggesting that SlideSpeech could be used by teachers to reach students on mobile devices.

Open Source Software Development as a Complex System 202
Presentation 75:
Chinese demo
URL: https://dl.dropbox.com/u/12838403/20120228/chinese_demo.htm
Posted: 28 February 2012
Length: 5 slides
Presentation using Chinese female computer-generated voice-overs to explain PowerPoint.
Presentation 76:
Japanese
URL: https://dl.dropbox.com/u/12838403/20120229/japanese.htm
Posted: 29 Feburary 2012
Length: 2 slides
Presentation using Japanese female computer-generated voice-overs.
Presentation 77:
SlideSpeech Workflow
URL: https://dl.dropbox.com/u/12838403/20120305/workflow.htm
Posted: 5 March 2012
Length: 4 slides
Presentation using female computer-generated voice-overs to explain SlideSpeech workflow.
Presentation 78:
Whitireia Presentation
URL: https://dl.dropbox.com/u/12838403/20120306/index.html
Posted: 6 March 2012
Length: 10 slides
Presentation using female computer-generated voice-overs to introduce SlideSpeech at Whitireia
New Zealand (previously called Whitireia Community Polytechnic).
Presentations 79-91:
Presentations Developed in-class at Whitireia
URL: https://dl.dropbox.com/u/12838403/20120307/index.html
Posted: 7 March 2012
Thes presentations were generated by students and faculty at Whitireia during an in-class tutorial
on the SlideSpeech system.
Presentation 92:
Beautiful New Zealand
URL: https://dl.dropbox.com/u/12838403/20120311/photo-slide-en.htm
Posted: 11 March 2012
Length: 5 slides
Presentation using male computer-generated voice-overs to show photographs by Stephan
Schliebs. Prepared by Stephan Schliebs.
Presentation 93:
Professional Development at St. Mary’s College

Open Source Software Development as a Complex System 203
URL: https://dl.dropbox.com/u/12838403/20120311/lds.htm
Posted: 11 March 2012
Length: 6 slides
Presentation using female computer-generated voice-overs to announce a Professional
Development Day at St. Mary’s College.
Presentation 94:
CPR
URL: https://dl.dropbox.com/u/12838403/20120311/cpr.htm
Posted: 11 March 2012
Length: 2 slides
Presentation using female computer-generated voice-overs to demonstrate a proof-of-concept
explanation of CPR.
Presentation 95:
Degrees of the Scale
URL:
https://dl.dropbox.com/u/12838403/20120313/Degrees_of_the_Scale_with_Speech_Notes.htm
Posted: 13 March 2012
Length: 6 slides
Presentation using male computer-generated voice-overs to discuss music. Prepared by a music
teacher at St. Mary’s College.
Presentation 96:
Wunderschönes Neuseeland (Beautiful New Zealand)
URL: https://dl.dropbox.com/u/12838403/20120314/photo-slide-de-2.htm
Posted: 14 March 2012
Length: 4 slides
Presentation using German female computer-generated voice-overs to show photographs by
Stephan Schliebs. Prepared by Stephan Schliebs. Combined with Presentation 92 to make a dual
language prototype.
Presentation 97:
Birds (in Russian)
URL: https://dl.dropbox.com/u/12838403/20120316/aboutBirdsinRU.htm
Posted:16 March 2012
Length: 5 slides
Presentation using Russian female computer-generated voice-overs to discuss birds. Prepared by
a girl in Moscow.
Presentation 98:
Dialog on Dialogs Presentation Response
URL: https://dl.dropbox.com/u/12838403/20120317/dialog.htm
Posted: 17 March 2012
Length: 16 slides

Open Source Software Development as a Complex System 204
Presentation using female computer-generated voice-overs to respond to a presentation made by
Elijah Mayfield at Carnegie Mellon University.
Presentation 99:
Visual Brand & Design Development by James McGoram / Messiah Studio
URL: https://dl.dropbox.com/u/12838403/20120324/odpName.htm
Posted: 24 March 2012
Length: 13 slides
Commercially developed presentation using female computer-generated voice-overs to discuss
visual brand and design development for SlideSpeech.
Presentation 100:
SlideSpeech Update
URL: https://dl.dropbox.com/u/12838403/20120329/john.htm
Posted: 29 March 2012
Length: 18 slides
Presentation using female computer-generated voice-overs to update newly hired SlideSpeech
development team.
Presentation 101:
Engineers Without Borders / New Zealand
URL: https://dl.dropbox.com/u/12838403/20120331/ewbnz.htm
Posted: 31 March 2012
Length: 6 slides
Presentation using female computer-generated voice-overs posted to EWBNZ Facebook page.
Presentation 102:
The Wu Yi Problem: Coping with a world of knowledge too big to know
URL: https://dl.dropbox.com/u/12838403/20120402/wuyi.htm
Posted: 2 April 2012
Length: 26 slides
Presentation using male computer-generated voice-overs to discuss Wu Yi problem at St. Mary’s
College.
Presentation 103:
SlideSpeech Server
URL: https://dl.dropbox.com/u/12838403/20120403/server.htm
Posted: 3 April 2012
Length: 5 slides
Presentation using female computer-generated voice-overs and screenshots to present an early
version of the commercial SlideSpeech web service.
Presentation 104:
HTML5
URL: https://dl.dropbox.com/u/12838403/20120404/ans.htm
Posted: 4 April 2012

Open Source Software Development as a Complex System 205
Length: 7 slides
Presentation using female computer-generated voice-overs to explain the HTML5-based
SlideSpeech player. Prepared by SlideSpeech consultant Ans Bradford.
Presentation 105:
Teacher (Swahili version)
URL: https://dl.dropbox.com/u/12838403/20120406/odpName.htm
Posted: 6 April 2012
Length: 7 slides
Presentation prepared and narrated in Swahili by SlideSpeech consultant Murhula Barati.
Presentation 106:
Marta (Polish)
URL: https://dl.dropbox.com/u/12838403/20120429/polish.htm
Posted: 29 April 2012
Length: 1 slide
Presentation using Polish female computer-generated voice-over. Prepared by SlideSpeech
employee Marta Jankowska.
Presentation 107:
SlideSpeech Interactivity in HTML5
URL: https://dl.dropbox.com/u/12838403/20121020/html/index.html
Posted: 20 October 2012
Length: 2 slides, 2 questions
Presentation using male computer-generated voice-overs with interactivity in the context of a
modified version of the commercially developed HTML5-based SlideSpeech slideshow.
Presentation 108:
SlideSpeech and Learning Studios
URL: https://dl.dropbox.com/u/12838403/20121105/slidespeech_gF7k0Vvsen_v2/index.html
Posted: 5 November 2012
Length: 50 slides
Presentation using a variety of male and female computer-generated voice-overs to give a round
up of the ideas behind SlideSpeech. Presented to the National Liaison Conference at AUT
University.

Open Source Software Development as a Complex System 206
APPENDIX F: POWER LAW CURVE FITS
The three charts in Figure 94 plot the same data from (Weiss, 2005) with three different scales on
the x and y axes: linear-linear, log-linear (aka semi-log) and log-log.
Figure 94: Alternative scaling of data with power law distribution.
The three charts in Figure 95 plot the data again showing the curve fits generated by the
statistical package R (left hand plot) and from a trend line in Excel (middle and right hand plots).
Figure 95: Alternative power law curve fits.
A power law has the form of equation 4:
y = axb
(4)
The fit generated by Excel yields parameters of a = 135734 and b = -2.8 with an R2 of 0.98,
which gives a tight match on the low frequency end of the distribution, but clearly over estimates
the high frequency end.

Open Source Software Development as a Complex System 207
The fit generated using R yields parameters of a = 58083 and b = -2.1, which gives a tight
match on the high frequency end of the distribution and a highly significant result as shown in
Figure 96, but clearly over estimates the low frequency end.
Figure 96: R summary of power law curve fit to data from (Weiss, 2005).
Either model offers an acceptable power law fit. For the purposes of this research, it is sufficient
to establish a power law relationship (as opposed, for example, to a linear relationship) between
the count of developers on a project and the number of projects of that size, without attaching too
much importance to the precise values of the parameters which result from fitting one tail of the
distribution more tightly than the other. Noise in the data (particularly ‘non-contributing’
contributors who may be listed as project contributors but who do not actually contribute code)
precludes that degree of precision. In any case, the variability of parameters between repositories
is greater than the difference between the different power law fits on one repository. For
example, for Google Code data from May 2011159
, parameter values from Excel are a = 234424
and b = -3.5 with an R2 of 0.96, while R yields a = 146715 and b = -2.8 with an R
2 of 0.99.
(Note: R2
is a poor measure of goodness of fit for a power law distribution because it is a
comparison to fitting the mean value.)
159
http://flossmole.org/content/how-many-projects-each-team-size-are-listed-google-code-05-2011

Open Source Software Development as a Complex System 208
APPENDIX G: ETHICS APPROVAL AND SUPPORTING DOCUMENTS

Open Source Software Development as a Complex System 209

Open Source Software Development as a Complex System 210

Open Source Software Development as a Complex System 211

Open Source Software Development as a Complex System 212

Open Source Software Development as a Complex System 213

Open Source Software Development as a Complex System 214

Open Source Software Development as a Complex System 215

Open Source Software Development as a Complex System 216

Open Source Software Development as a Complex System 217
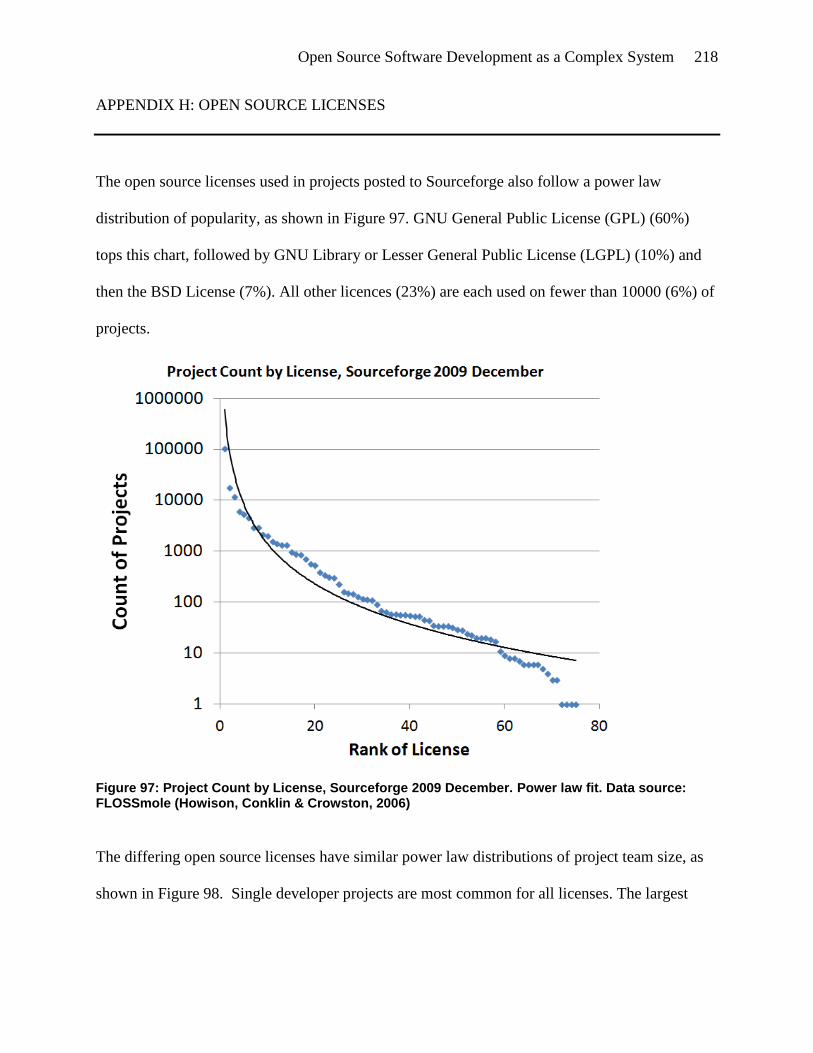
Open Source Software Development as a Complex System 218
APPENDIX H: OPEN SOURCE LICENSES
The open source licenses used in projects posted to Sourceforge also follow a power law
distribution of popularity, as shown in Figure 97. GNU General Public License (GPL) (60%)
tops this chart, followed by GNU Library or Lesser General Public License (LGPL) (10%) and
then the BSD License (7%). All other licences (23%) are each used on fewer than 10000 (6%) of
projects.
Figure 97: Project Count by License, Sourceforge 2009 December. Power law fit. Data source: FLOSSmole (Howison, Conklin & Crowston, 2006)
The differing open source licenses have similar power law distributions of project team size, as
shown in Figure 98. Single developer projects are most common for all licenses. The largest

Open Source Software Development as a Complex System 219
markers are GPL, with the marker size for LGPL, BSD and the other licenses scaled relative to
the total number of projects using each license (the distribution of Figure 97).
Figure 98: Count of Projects by Team Size, by License. Sourceforge 2009 December. Data source: FLOSSmole (Howison, Conklin & Crowston, 2006).
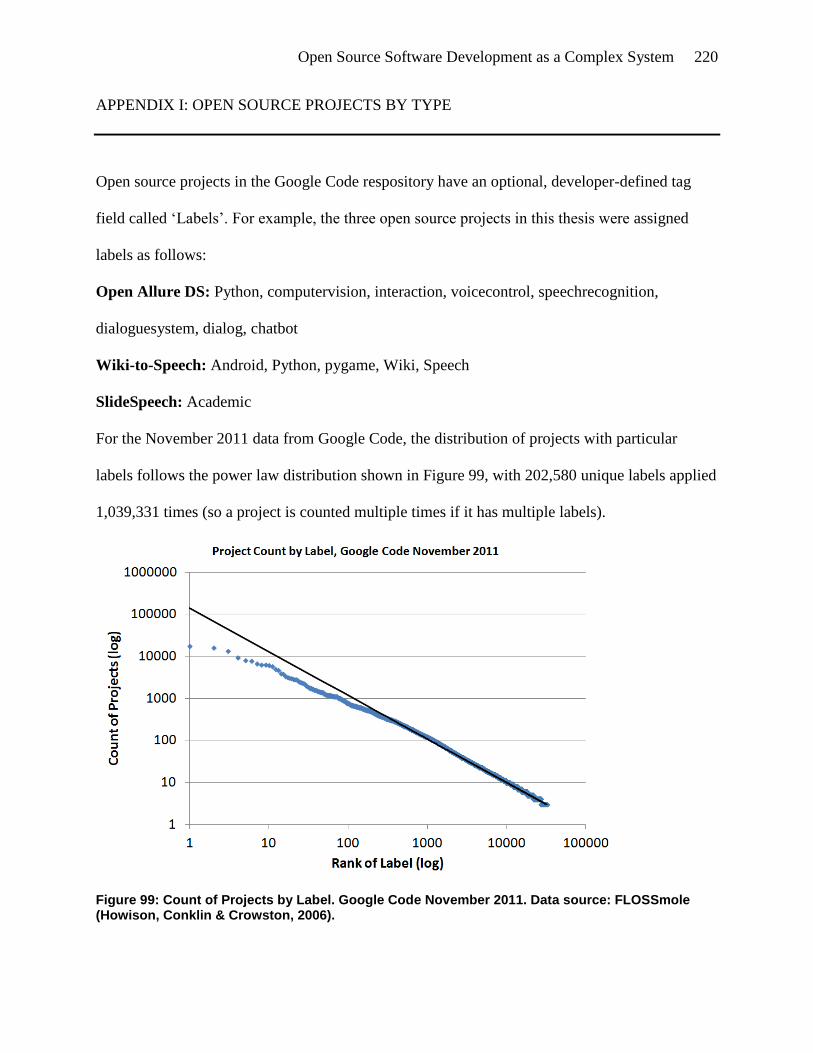
Open Source Software Development as a Complex System 220
APPENDIX I: OPEN SOURCE PROJECTS BY TYPE
Open source projects in the Google Code respository have an optional, developer-defined tag
field called ‘Labels’. For example, the three open source projects in this thesis were assigned
labels as follows:
Open Allure DS: Python, computervision, interaction, voicecontrol, speechrecognition,
dialoguesystem, dialog, chatbot
Wiki-to-Speech: Android, Python, pygame, Wiki, Speech
SlideSpeech: Academic
For the November 2011 data from Google Code, the distribution of projects with particular
labels follows the power law distribution shown in Figure 99, with 202,580 unique labels applied
1,039,331 times (so a project is counted multiple times if it has multiple labels).
Figure 99: Count of Projects by Label. Google Code November 2011. Data source: FLOSSmole (Howison, Conklin & Crowston, 2006).

Open Source Software Development as a Complex System 221
Given this diversity (across 236,614 projects), even the most frequently used labels are rare, as
shown in Table 4:
Table 4: Frequency of labels used for Google Code projects, November 2011. Data source: FLOSSmole (Howison, Conklin & Crowston, 2006).
Nevertheless, these labels can be used to filter the population of projects and a team size
distribution generated for each project label, as shown in Figure 100. The largest markers are for
the projects labeled ‘Academic’ and all others are scaled based on the total count of projects
which have been assigned each label. Only the top 74 labels by total count are shown; labels with
under 1000 projects are not shown. The sixth most common label, gme, refers to the Google
Mashup Editor160
, a tool to create mashup projects which are very rarely team projects (only 15
of 7799 projects had more than 1 developer), accounting for the large markers showing 10
projects of size 2, 3 projects of size 3 and the single projects of size 4 and 5 indicated. All other
labels show a similar power law distribution of project sizes. Thus, it does not appear to matter
what is being developed or for whom; the pattern of team sizes is the same.
160
http://en.wikipedia.org/wiki/Google_Mashup_Editor

Open Source Software Development as a Complex System 222
Figure 100: Count of Projects by Project Size, by Label. Google Code November 2011. Data source: FLOSSmole (Howison, Conklin & Crowston, 2006).

Open Source Software Development as a Complex System 223
8. References
Aksulu, A., & Wade, M. (2010). A comprehensive review and synthesis of open source research.
Journal of the Association for Information Systems, 11(11), 576–656.
Anderka, M., & Stein, B. (2012). A breakdown of quality flaws in Wikipedia. Proceedings of the
2nd Joint WICOW/AIRWeb Workshop on Web Quality - WebQuality ’12, 11-18.
doi:10.1145/2184305.2184309
Anderson, M. J., Diebel, C. E., Blom, W. M., & Landers, T. J. (2005). Consistency and variation
in kelp holdfast assemblages: Spatial patterns of biodiversity for the major phyla at different
taxonomic resolutions. Journal of Experimental Marine Biology and Ecology, 320(1), 35–
56. doi:10.1016/j.jembe.2004.12.023
Ariely, D., Huber, J., & Wertenbroch, K. (2005). When do losses loom larger than gains?
Journal of Marketing Research, 42(2), 134–138. doi: 10.1509/jmkr.42.2.134.62283
Austin, J. H. (1978). Chase, chance, and creativity. New York: Columbia University Press.
Bacon, J. (2009). The Art of Community (1st ed.). Sebastopol: O’Reilly Media. Retrieved from
http://www.artofcommunityonline.org/downloads/jonobacon-theartofcommunity-1ed.pdf
Bak, P. (1996). How nature works: the science of self-organized criticality. New York:
Copernicus.
Barabasi, A., & Albert, R. (1999). Emergence of scaling in random networks. Science,
286(5439), 509–12.
Barcellini, F., Détienne, F., & Burkhardt, J.-M. (2008). User and developer mediation in an Open
Source Software community: Boundary spanning through cross participation in online

Open Source Software Development as a Complex System 224
discussions. International Journal of Human-Computer Studies, 66(7), 558–570.
doi:10.1016/j.ijhcs.2007.10.008
Beckman, C. M., & Burton, M. D. (2008). Founding the Future: Path Dependence in the
Evolution of Top Management Teams from Founding to IPO. Organization Science, 19(1),
3–24. doi:10.1287/orsc.1070.0311
Benkler, Y. (2002). Coase’s Penguin, or, Linux and The Nature of the Firm. The Yale Law
Journal., 112. doi:10.2307/1562247
Benkler, Y. (2006). The wealth of networks: How social production transforms markets and
freedom. New Haven: Yale University Press.
Bird, S., Klein, E., & Loper, E. (2009). Natural language processing with Python. Sebastopol:
O'Reilly Media.
Bitzer, J., & Schröder, P. J. H. (2007). Open Source Software, Competition and Innovation.
Industry & Innovation, 14(5), 461–476. doi:10.1080/13662710701711315
Blank, S. G., & Dorf, B. (2012). The startup owner's manual: the step-by-step guide for building
a great company. Pescadero: K&S Ranch, Inc.
Brin, S. & Page, L. (1998). The Anatomy of a Large-Scale Hypertextual Web Search Engine.
Computer Networks and ISDN Systems, 30(1–7), 107-117. doi:10.1016/S0169-
7552(98)00110-X
Brooks, D. & Wiley, E. (1988) Evolution As Entropy. Chicago: University of Chicago Press.
Cabej, N. R. (2011). Epigenetic principles of evolution. London: Elsevier.
Open Source Software Development as a Complex System 225
Choi, N., Chengalur-Smith, I., & Whitmore, A. (2010). Managing first impressions of new open
source software projects. Software, IEEE, 73–77. doi:10.1109/MS.2010.26
Clear, T., Raza, B., & MacDonell, S. (2013). A critical evaluation of failure in a nearshore
outsourcing project (what dilemma analysis can tell us). In 2013 IEEE 8th International
Conference on Global Software Engineering. doi:10.1109/ICGSE.2013.31
Cropley, A. (2006). In praise of convergent thinking. Creativity Research Journal. 18(3), 391-
404. doi:10.1207/s15326934crj1803_13
Crosetto, P. (2009). Turning private vices into collective virtues: a simple model and an
experiment on the SourceForge development community. University of Milan DEAS
working paper 2009-14. Retrieved from http://ideas.repec.org/p/mil/wpdepa/2009-14.html.
doi:10.2139/ssrn.1944918
Crowston, K., Annabi, H., & Howison, J. (2003). Defining open source software project success.
In S. T. March, A. Massey, & J. I. DeGross (Eds.), Procedings of 24th International
Conference on Information Systems, 327–340.
Crowston, K., & Howison, J. (2005). The social structure of free and open source software
development. First Monday, 10(2). Retrieved from
http://firstmonday.org/ojs/index.php/fm/rt/printerFriendly/1478/1393.
Crowston, K., Wei, K., Howison, J., & Wiggins, A. (2012). Free/Libre open-source software
development: What We Know and What We Do Not Know. ACM Computing Surveys,
44(2), 1–35. doi:10.1145/2089125.2089127

Open Source Software Development as a Complex System 226
Darwin, C. (1859). On the Origin of Species by Means of Natural Selection. London: John
Murray.
Dalle, J., & David, P. M. (2003). The Allocation of Software Development Resources In “Open
Source” Production Mode. Stanford Institute for Economic Policy Research, 02-27.
David, P., & Rullani, F. (2006). Micro-dynamics of Free and Open Source Software
Development. Lurking, laboring and launching new projects on SourceForge. Stanford
Institute for Economic Policy Research, 06-05. Retrieved from http://eprints.luiss.it/868/
Denning, P., Hearn, A., & Kern, C. (1983). History and overview of CSNET. Proceedings of the
Symposium on Communications Architectures & Protocols (SIGCOMM '83), 138–145.
doi:10.1145/1035237.1035267
Deshpande, A., & Riehle, D. (2008). The total growth of open source. Open Source Development,
Communities and Quality, 197-209. doi:10.1007/978-0-387-09684-1_16
Desjardins-Proulx, P., & Gravel, D. (2012). A complex speciation-richness relationship in a
simple neutral model. Ecology and evolution, 2(8), 1781–90. doi:10.1002/ece3.292
Elena, S. F., & Lenski, R. E. (2003). Evolution experiments with microorganisms: the dynamics
and genetic bases of adaptation. Nature reviews, 4(6), 457–69. doi:10.1038/nrg1088
English, R., & Schweik, C. (2007). Identifying success and tragedy of FLOSS commons: A
preliminary classification of SourceForge. net projects. Emerging Trends in FLOSS
Research and Development. IEEE. doi:10.1109/FLOSS.2007.9
Open Source Software Development as a Complex System 227
English, S., Bateman, A. W., & Clutton-Brock, T. H. (2012). Lifetime growth in wild meerkats:
incorporating life history and environmental factors into a standard growth model.
Oecologia, 169(1), 143–53. doi:10.1007/s00442-011-2192-9
Eriksson, M., & Hallberg, V. (2011). Comparison between JSON and YAML for data
serialization. (Bachelor’s thesis, Royal Institute of Technology, Stockholm, Sweden).
Retrieved from
http://www.csc.kth.se/utbildning/kth/kurser/DD143X/dkand11/Group2Mads/Rapport_Ma
lin_Eriksson_Viktor_Hallberg.pdf
Feitelson, D. G., Heller, G. Z., & Schach, S. R. (2006). An empirically-based criterion for
determining the success of an open-source project. Australian Software Engineering
Conference, 1–6. doi:10.1109/ASWEC.2006.12
Fleming, L. O. (1998). Explaining the source and tempo of invention : Recombinant learning and
Exhaustion in Technological Evolution . Palo Alto: Stanford University.
Fogel, K. (2005). Producing open source software: how to run a successful free software project
(1st ed.). Sebastopol: O'Reilly Media.
Gell-Mann, M., & Lloyd, S. (1996). Information measures, effective complexity, and total
information. Complexity, 2(1), 44–52. doi:10.1002/(SICI)1099-
0526(199609/10)2:1<44::AID-CPLX10>3.0.CO;2-X
Ghosh, R., Glott, R., Krieger, B., & Robles, G. (2002). Free/libre and open source software:
Survey and study. (International Institute of Infonomics. University of Maastricht, The
Netherlands.) Retrieved from http://www.math.unipd.it/~bellio/FLOSS Final Report -
Part 4 - Survey of Developers.pdf

Open Source Software Development as a Complex System 228
Gilder, G. (2000). Telecosm: How infinite bandwidth will revolutionize our world. New York:
Free Press.
Gould, S. J., & Eldredge, N. (1972). Punctuated equilibria: an alternative to phyletic
gradualism. In T. Schopf (Ed.), Models in paleobiology (pp. 82–115). San Francisco:
Freeman, Cooper & Co.
Graves, J. (2011). Wiki-to-Speech for Mobile Presentations. Proceedings of the 2nd
Annual
Conference of Computing and Information Technology Education and Research in New
Zealand (CITRENZ2011), 81–86. Retrieved from
http://www.citrenz.ac.nz/conferences/2011/pdf/81-86.pdf
Greiner, S., & Bock, R. (2013). Tuning a ménage à trois: Co-evolution and co-adaptation of
nuclear and organellar genomes in plants. BioEssays, 354–365. doi:10.1002/bies.201200137
Haefliger, S., Von Krogh, G., & Spaeth, S. (2008). Code Reuse in Open Source Software.
Management Science, 54(1), 180–193. doi:10.1287/mnsc.1070.0748
Hahn, J., Moon, J. Y., & Zhang, C. (2008). Emergence of New Project Teams from Open Source
Software Developer Networks: Impact of Prior Collaboration Ties. Information Systems
Research, 19(3), 369–391. doi:10.1287/isre.1080.0192
Hankin, R. (2007). Introducing untb, an R package for simulating ecological drift under the
unified neutral theory of biodiversity. Journal of Statistical Software , 22(12), 1-15.

Open Source Software Development as a Complex System 229
Hasan, H., & Kazlauskas, A. (2009). Making Sense of IS with the Cynefin Framework.
Proceedings of the Pacific Asia Conference on Information Systems (PACIS) (pp. 1–13).
Hyderabad, India: Indian School of Business.
Haythornthwaite, C. (2009). Crowds and communities: Light and heavyweight models of peer
production. IEEE Proceedings of the Hawaii International Conference On System Sciences.
Haw, S. C., & Rao, G. S. V. R. K. (2007). A Comparative Study and Benchmarking on XML
Parsers. The 9th International Conference on Advanced Communication Technology,
321–325. doi:10.1109/ICACT.2007.358364
Helbing, D., & Balietti, S. (2011). How to create an innovation accelerator. The European
Physical Journal Special Topics, 195(1), 101–136. doi:10.1140/epjst/e2011-01403-6
Heller, B., Marschner, E., Rosenfeld, E., & Heer, J. (2011). Visualizing collaboration and
influence in the open-source software community. Proceedings of the 8th working
conference on Mining software repositories - MSR’11, 223. doi:10.1145/1985441.1985476
Holthouse, M. A., & Greenberg, S. G. (1978). Software Technology for Scientific and
Engineering Applications. IEEE. doi:10.1109/CMPSAC.1978.810572
Howison, J., Conklin, M., & Crowston, K. (2006). FLOSSmole: A collaborative repository for
FLOSS research data and analyses. International Journal of Information Technology and
Web Engineering, 1(3), 17–26. doi:10.4018/jitwe.2006070102
Hubbell, S. P. (2001). The Unified Neutral Theory of Biodiversity and Biogeography. Princeton:
Princeton University Press.

Open Source Software Development as a Complex System 230
Huisman, J., & Weissing, F. (2001). Biological conditions for oscillations and chaos generated
by multispecies competition. Ecology, 82(10), 2682–2695. doi:10.2307/2679953
Israeli, A., & Feitelson, D. (2007). Success of open source projects: Patterns of downloads and
releases with time. IEEE Intl. Conf. Software Science, Technology, & Engineering,
87-94. doi:10.1109/SwSTE.2007.11
Johnson, L. (1998). A view from the 1960s: How the software industry began. Annals of the
History of Computing, IEEE. doi:10.1109/85.646207
Josephson, M. (1959). Edison: A biography. New York: Wiley.
Khan, S. (2012) The One World Schoolhouse: Education Reimagined. London: Hodder &
Stoughton.
Koch, S., & Schneider, G. (2000). Results from software engineering research into open source
development projects using public data. In H. R. Hansen & W. H. Janko (Eds.),
Diskussionspapiere zum Taetigkeitsfeld Informationsverarbeitung und
Informationswirtschaft. (22) Wirtschaftsuniversität Wien.
Kurzweil, R. (2001). The Law of Accelerating Returns. Retrieved December 20, 2012, from
http://www.kurzweilai.net/the-law-of-accelerating-returns
Lancashire, D. (2001). Code, culture and cash: The fading altruism of open source development.
First Monday, 6(12), 1–31. doi:10.5210/fm.v6i12.904

Open Source Software Development as a Complex System 231
Larson, E. R., & Olden, J. D. (2012). Using avatar species to model the potential distribution of
emerging invaders. Global Ecology and Biogeography, 21(11), 1114–1125.
doi:10.1111/j.1466-8238.2012.00758.x
Leonard, A. (1998). Let My Software Go! Salon 21st, 14 April. Retrieved from
http://www.salon.com/1998/03/30/feature947788266/
Lerner, J., & Tirole, J. (2002). The Simple Economics of Open Source. Journal of Industrial
Economics, 50(2), 197–234. doi:10.1109/HICSS.2001.927045
Livieri, S., Higo, Y., Matushita, M., & Inoue, K. (2007). Very-Large Scale Code Clone Analysis
and Visualization of Open Source Programs Using Distributed CCFinder: D-CCFinder.
29th International Conference on Software Engineering (ICSE’07), 106–115.
doi:10.1109/ICSE.2007.97
Madey, G., Freeh, V., & Tynan, R. (2002a). The open source software development
phenomenon: An analysis based on social network theory. Proceedings of the Eighth
Americas Conference on Information Systems, 1806–1813.
Madey, G., Freeh, V., & Tynan, R. (2002b). Agent-based modeling of open source using Swarm.
Proceedings of the Eighth Americas Conference on Information Systems, 1472–1475.
Madey, G., Freeh, V., & Tynan, R. (2004). Modeling the Free / Open Source Software
Community : A Quantitative Investigation. In S. Koch (Ed.), Free/Open Source Software
Development. Hershey: Idea Publishing. doi:10.4018/978-1-59140-369-2.ch009

Open Source Software Development as a Complex System 232
Madey, G. & Christley, S. (2008) Experiences with the Notre Dame OSS Archive and
VectorBase BRC. Retrieved from
http://www3.nd.edu/~oss/Papers/FOSSRRI_Madey_Christley.pdf
Maruvka, Y. E., Kessler, D. A., & Shnerb, N. M. (2011). The birth-death-mutation process: a
new paradigm for fat tailed distributions. PloS one, 6(11), e26480.
doi:10.1371/journal.pone.0026480
May, R. M. (1976). Simple mathematical models with very complicated dynamics. Nature,
261(5560), 459-467. doi:10.1038/261459a0
McPherson, M., Smith-Lovin, L., & Cook, J. M. (2001). Birds of a feather: Homophily in social
networks. Annual review of sociology, 415-444. doi:10.1146/annurev.soc.27.1.415
Meadows, D.H. (2008) Thinking in Systems: A Primer. White River Junction: Chelsea Green
Publishing Company.
Michlmayr, M. (2006). Software process maturity and the success of free software projects. In K.
Zieliriski & T. Szmuc (Eds.), Software Engineering: evolution and emerging technologies
(pp. 3–14). Amsterdam: IOS Press.
Michlmayr, M. (2009, August). Community management in open source projects. Upgrade.
Retrieved from http://ww.cyrius.com/publications/michlmayr-community_management.pdf
Midha, V., & Palvia, P. (2012). Factors affecting the success of Open Source Software. Journal
of Systems and Software, 85(4), 895–905. doi:10.1016/j.jss.2011.11.010

Open Source Software Development as a Complex System 233
Mockus, A., Fielding, R. T., & Herbsleb, J. D. (2002). Two case studies of open source software
development: Apache and Mozilla. ACM Transactions on Software Engineering and
Methodology, 11(3), 309–346. doi:10.1145/567793.567795
Mockus, A. (2009). Amassing and indexing a large sample of version control systems: Towards
the census of public source code history. 2009 6th IEEE International Working
Conference on Mining Software Repositories, 11–20. doi:10.1109/MSR.2009.5069476
Moore, G. (1998). Cramming more components onto integrated circuits. Proceedings of the
IEEE, 38(8). doi: 10.1109/JPROC.1998.658762
Myers, M. (1995). Dialectical hermeneutics: a theoretical framework for the implementation of
information systems. Information Systems Journal, 5(1), 51–70. doi: 10.1111/j.1365-
2575.1995.tb00089.x
Nowak, M. A, & Sigmund, K. (2005). Evolution of indirect reciprocity. Nature, 437(7063),
1291–8. doi:10.1038/nature04131
Nunamaker, J. F., Chen, M., & Purdin, T. D. M. (1990). Systems development in information
systems research. Proceedings of the Twenty-Third Hawaii International Conference on
System Sciences (pp. 89–106). IEEE. doi:10.1109/HICSS.1990.205401
Ohtsuki, H., Hauert, C., Lieberman, E., & Nowak, M. A. (2006). A simple rule for the evolution
of cooperation on graphs and social networks. Nature, 441(7092), 502–5.
doi:10.1038/nature04605

Open Source Software Development as a Complex System 234
Osterloh, M., & Rota, S. (2007). Open source software development—Just another case of
collective invention? Research Policy, 36(2), 157–171. doi:10.1016/j.respol.2006.10.004
Page, S. (2008). The Difference. Princeton: Princeton University Press.
Page, S. (2011). Diversity and Complexity. Princeton: Princeton University Press.
Pang, T. Y., & Maslov, S. (2013). Universal distribution of component frequencies in biological
and technological systems. Proceedings of the National Academy of Sciences of the United
States of America, 71–75. doi:10.1073/pnas.1217795110
Peffers, K., Tuunanen, T., Rothenberger, M. a., & Chatterjee, S. (2007). A Design Science
Research Methodology for Information Systems Research. Journal of Management
Information Systems, 24(3), 45–77. doi:10.2753/MIS0742-1222240302
Radtke, N. P. (2011). FLOSSSim: Understanding the Free/Libre Open Source Software (FLOSS)
Development Process through Agent-Based Modeling. Arizona State University.
Raymond, E. (1999). The cathedral and the bazaar. Knowledge, Technology & Policy, 12(3), 23–
49. doi:10.1007/s12130-999-1026-0
Reed, D. (1999). That Sneaky Exponential—Beyond Metcalfe’s Law to the Power of
Community Building. Context.
Rosenberg, S. (2008). Dreaming in code: Two dozen Programmers, three years, 4,732 bugs, and
one quest for transcendent software. New York: Three Rivers Press.
Scacchi, W. (2002). Understanding the requirements for developing open source software
systems. Software, IEE Proceedings-, 149(1), 24-39. doi: 10.1049/ip-sen:20020202

Open Source Software Development as a Complex System 235
Scacchi, W. (2006). Understanding Open Source Software Evolution. In N. H. Madhavji, J.
Fernandez-Ramil, & D. Perry (Eds.), Software Evolution and Feedback: Theory and
Practice. Wiley. (pp. 181–206). doi:10.1002/0470871822.ch9
Scacchi, W., & Alspaugh, T. a. (2012). Understanding the role of licenses and evolution in open
architecture software ecosystems. Journal of Systems and Software, 85(7), 1479–1494.
doi:10.1016/j.jss.2012.03.033
Scacchi, W., Crowston, K., Jensen, C., Madey, G., Squire, M., Alspaugh, T., Gasser, L., Hissam,
S., Kanomata, Y., Ekbia, H., Wei, K. & Schweik, C. (2010). Towards a science of open
source systems. 2010 FOSS Workshop on the Future of Research in Free/Open Source
Software. Retrieved from http://www.ics.uci.edu/~wscacchi/ProjectReports/CCC-FOSS-
FinalReport-29Nov10.pdf
Schweik, C. M. and R. C. English (2012), Internet Success: A Study of Open-Source Software
Commons, Cambridge, MA: MIT Press.
Schweik, C. M., English, R., & Haire, S. (2009). Factors leading to success or abandonment of
open source commons: An empirical analysis of SourceForge. net projects. South African
Computer Journal, 43, 58-65.
Shirky, C. (2008) Here Comes Everybody : The Power of Organizing Without Organizations.
New York: Penguin.
Smith, N., Capiluppi, A., & Fernandez-Ramil, J. (2006). Agent-based Simulation of Open
Source Software Evolution. Software Process Improvement and Practice, 11, 423–434. doi:
10.1007/11754305_31

Open Source Software Development as a Complex System 236
Snowden, D. E. (2007). A Leader's Framework for Decision Making. Harvard Business Review,
85(11), 68-76.
Solé, R. V, Valverde, S., Casals, M. R., Kauffman, S. A., Farmer, D., & Eldredge, N. (2013).
The Evolutionary Ecology of Technological Innovations, Complexity, 18(4), 15–27.
doi:10.1002/cplx
Syeed, M. M. M., Kilamo, T., Hammouda, I., & Systä, T. (2012). Open Source Prediction
Methods : A Systematic Literature Review. In I. Hammouda et al. (Eds.), OSS 2012, IFIP
AICT 378 (pp. 280–285).
Szathmáry, E., & Smith, J. (1995). The major evolutionary transitions. Nature, 374, 227–232.
Taleb, N. (2012a). Antifragile: Things That Gain from Disorder. New York: Random House.
Taleb, N. (2012b) Understanding is a Poor Substitute for Convexity (Antifragility). Edge.
Retrieved from http://edge.org/conversation/understanding-is-a-poor-substitute-for-
convexity-antifragility
Tanenbaum, A. S. (1987). Operating systems: design and implementation. Upper Saddle River:
Pearson Prentice-Hall.
Tofler, A. (1980). The third wave. New York: William Morrow.
Vaughan-Nichols, S. (2013). Linus Torvalds’s Lessons on Software Development Management.
HP Input Output. Retrieved from http://h30565.www3.hp.com/t5/Feature-Articles/Linus-
Torvalds-s-Lessons-on-Software-Development-Management/ba-p/440
Walls, J. G., Widmeyer, G. R., & El Sawy, O. A. (1992). Building an information system design
theory for vigilant EIS. Information systems research, 3(1), 36-59.
doi:10.1287/isre.3.1.36
Weber, S. (2005). The Success of Open Source. Cambridge: Harvard University Press.

Open Source Software Development as a Complex System 237
Wiegand, T., Jeltsch, F., Hanski, I., & Grimm, V. (2003). Using pattern-oriented modeling for
revealing hidden information: a key for reconciling ecological theory and application.
Oikos, 65(August 2002), 209–222. doi:10.1034/j.1600-0706.2003.12027.x
Weiss, D. (2005). Quantitative Analysis of Open Source Projects on SourceForge. The First
International Conference on Open Source Systems (OSS 2005), Genova, Italy, 140-147.
Weitzman, M. L. (1998). Recombinant Growth. The Quarterly Journal of Economics (Vol. 113,
pp. 331–360). doi:10.1162/003355398555595
Williams, S. (2002). Free as in Freedom: Richard Stallman's Crusade for Free Software.
Sebastopol: O'Reilly Media.
Wolfram, S. (2002). A new kind of science. Champaign: Wolfram media.
Xu, J., Christley, S., & Madey, G. (2006). Application of social network analysis to the study of
open source software. In J. Bitzer & P. J. H. Schroder (Eds.), The Economics of Open
Source Software Development (pp. 205–224). Emerald Group Publishing Limited.
doi:10.1016/B978-044452769-1/50012-3
Yule, G. U. (1925). A Mathematical Theory of Evolution, Based on the Conclusions of Dr. J. C.
Willis, F.R.S. Philosophical Transactions of the Royal Society B: Biological Sciences,
213(402-410), 21–87. doi:10.1098/rstb.1925.0002
Zipf, G. K. (1949) Human behavior and the principle of least effort. Boston: Addison-Wesley.