BioSpider: a web server for automating metabolome annotations

Software Tool for Researching Annotations of Proteins (STRAP):Open-Source Protein Annotation Software with Data Visualization
Vivek N. Bhatia, David H. Perlman, Catherine E. Costello, and Mark E. McComb*Cardiovascular Proteomics Center, Boston University School of Medicine, 670 Albany St., Room504, Boston, Massachusetts 02118
AbstractIn order that biological meaning may be derived and testable hypotheses may be built fromproteomics experiments, assignments of proteins identified by mass spectrometry or other techniquesmust be supplemented with additional notation, such as information on known protein functions,protein-protein interactions, or biological pathway associations. Collecting, organizing, andinterpreting this data often requires the input of experts in the biological field of study, in additionto the time-consuming search for and compilation of information from online protein databases.Furthermore, visualizing this bulk of information can be challenging due to the limited availabilityof easy-to-use and freely available tools for this process. In response to these constraints, we haveundertaken the design of software to automate annotation and visualization of proteomics data inorder to accelerate the pace of research. Here we present the Software Tool for ResearchingAnnotations of Proteins (STRAP) – a user-friendly, open-source C# application. STRAPautomatically obtains gene ontology (GO) terms associated with proteins in a proteomics results IDlist using the freely accessible UniProtKB and EBI GOA databases. Summarized in an easy-to-navigate tabular format, STRAP includes meta-information on the protein in addition tocomplimentary GO terminology. Additionally, this information can be edited by the user so that in-house expertise on particular proteins may be integrated into the larger dataset. STRAP provides asortable tabular view for all terms, as well as graphical representations of GO-term association datain pie (biological process, cellular component and molecular function) and bar charts (crosscomparison of sample sets) to aid in the interpretation of large datasets and differential analysesexperiments. Furthermore, proteins of interest may be exported as a unique FASTA-formatted fileto allow for customizable re-searching of mass spectrometry data, and gene names corresponding tothe proteins in the lists may be encoded in the Gaggle microformat for further characterization,including pathway analysis. STRAP, a tutorial, and the C# source code are freely available fromhttp://cpctools.sourceforge.net.
Keywordsproteomics; annotation; software; mass spectrometry; data analysis
INTRODUCTIONMost mass spectrometry based proteomics experiments are designed to address the question,“what are the differences between the observed sets of expressed proteins in normal versusdiseased or modified states?” Typically, proteins are isolated from cells, tissues or biologicalfluids obtained from host organisms experiencing a challenged state relative to a control. These
*Address reprint requests to: Mark E. McComb, Cardiovascular Proteomics Center, Boston University School of Medicine, 670 AlbanyStreet, room 504, Boston, MA 02118-2543, tel (617) 638-4280, [email protected].
NIH Public AccessAuthor ManuscriptAnal Chem. Author manuscript; available in PMC 2010 December 1.
Published in final edited form as:Anal Chem. 2009 December 1; 81(23): 9819–9823. doi:10.1021/ac901335x.
NIH
-PA Author Manuscript
NIH
-PA Author Manuscript
NIH
-PA Author Manuscript

proteins are then identified and characterized by analytical techniques such as massspectrometry. The results often yield lengthy lists of differentially expressed proteins, withtens to thousands of entries. Deriving meaning from these lists of proteins is quite challengingbut necessary if biological conclusions are to be drawn from the experiment. Interpretation ofthis data begins with annotation of the protein lists with information such as known proteinfunction, followed by analyses of whether these attributes display meaningful trends. In orderto obtain these protein annotations, knowledge must be gleaned either from experts in the field,through an exhaustive search of the literature, or through the consultation of online proteindatabases. Accomplishing this process manually is extremely laborious and scales in time andeffort linearly with the size of the protein lists such that it is feasible with only the smallest ofdatasets. Clearly, there is a widespread and growing need for software to facilitate this process.
To address these requirements, a number of genomics and proteomics software applicationshave been proposed with varying degrees of utility and success. While not all-inclusive,examples of gene-based and GO-related software may be readily found within the tools sectionof the Gene Ontology website (www.geneontology.org)1; and mass spectrometry andproteomics based tools may be found at ProteomeCommons(proteomecommons.org/tools-browse.jsp)2. One goal of such software is to retrieve and collateinformation from online databases and to provide a straightforward way to interpret proteomicsdata. For functional annotation, the most mature and widely used online repository is the GeneOntology database, the product of a project to establish a standardized language andhierarchical framework for gene and gene-product annotation. In the field of proteomics, manyprotein information repositories have utilized the GO annotation nomenclature, including thehighly annotated and curated UniProtKB protein knowledgebase (www.uniprot.org)3, anonline repository of protein sequence, annotation and functional information.
Specific software tools have been created for the purpose of functionally annotating gene andgene product lists. Among the commercial packages, the most popular for proteomicsannotation are ProteinCenter, available from Proxeon (www.proxeon.com), and Scaffold, fromProteome Software (www.proteomesoftware.com). These commercial packages are,unfortunately, relatively costly and this property limits their adoption, particularly by academiclaboratories. Meanwhile, there are examples of free tools which are capable of browsing/parsing or annotating entire protein lists at once, such as g:Profiler4, PANDORA5, andDAS6. Their annotation lists, however, are general and lack the granularity required to showdetailed trends within or between protein lists. Recently released by the Institute for SystemsBiology, PIPE: Protein Information Property Explorer7, and another recently developed serverbased application, PIKE: Protein Information and Knowledge Extractor(proteo.cnb.uam.es:8080/pike)8 have more extensive and comprehensive protein listannotation capabilities. Nevertheless, the complicated organization of GO terms in Scaffold,ProteinCenter, PIPE, and PIKE makes it difficult to quickly interpret the biological meaningof a protein set or a comparative proteomics data set. Additionally, none of these programsallow the user to manually edit GO annotations within a dataset. This is critical as the extentand validity of GO annotations are currently limited. Furthermore, a main focus of proteomicsexperiments is to investigate the differential expression of proteins between pairs or amonggroups of samples. For this reason, it is important for any protein annotation software to havecapabilities to compare protein sets. Scaffold is restricted to tabular protein set comparison,while PEAK and PIPE lack such abilities altogether. Although ProteinCenter does haveextensive data set comparison capabilities, it requires the user to upload complete datasets tothe ProteinCenter server as part of its web-based subscription package. This loss of controlover valuable proprietary data may discourage some users.
While there is no question as to the utility of existing tools, there is no single tool that is open-source and easy to use, yet capable of automatically annotating large protein lists and visually
Bhatia et al. Page 2
Anal Chem. Author manuscript; available in PMC 2010 December 1.
NIH
-PA Author Manuscript
NIH
-PA Author Manuscript
NIH
-PA Author Manuscript

rendering the annotations such that large scale proteomics data sets can be compared. STRAPwas designed to meet this specific need while being the only freely available tool that runslocally on the user’s computer. It uses dedicated columns for GO terms, but the globalpresentation of the category names has been streamlined for ease of interpretation and manualGO term annotation.
EXPERIMENTALThe Software Tool for Researching Annotations of Proteins (STRAP) was written in C# andwas developed in the Visual C# 2008 environment. Additionally, it uses the open-sourceZedGraph (zedgraph.org) and 3D Pie Chart(www.codeproject.com/KB/graphics/julijanpiechart.aspx) libraries to create charts. STRAPwas designed to be intuitive and easy to implement in a common PC-based laboratory suchthat users would be comfortable using STRAP. Although Windows-based machines areubiquitous in the proteomics world, STRAP may also be used on Apple computers with theuse of Boot Camp (included with Mac OS) or virtualization software such as Sun VirtualBox(free) or Parallels Desktop (commercial). STRAP data can be exported to the Gaggle9 networkfor analysis with other tools provided that FireGoose (the Gaggle Toolbar for Firefox)10 isinstalled on the host PC. The STRAP installer, a tutorial and C# source code can be obtaineddirectly from http://cpctools.sourceforge.net.
In order to demonstrate STRAP’s capabilities, we used data from a recent lymphoma biomarkerstudy11. This example data set, which is included with the STRAP installer, is composed ofthree protein sets reflecting the differentially expressed proteomes of three B-cell proliferativestates.
RESULTSOverview of STRAP and Accepted File Formats
STRAP provides proteomics researchers with an easy way to obtain, group and compare proteinannotations for lists of proteins. STRAP begins with the input of protein lists from a proteomicsexperiment. For example, such an experiment may begin with LC-MS/MS and end with aprotein ID list following a standard database search using a search engine such as Mascot(www.matrixscience.com)12. For initial dissemination, we chose several input and outputformats for STRAP which are summarized schematically in Figure 1. Input files for STRAPmust contain protein entry or accession numbers in the UniProt Knowledgebase(www.uniprot.org) format (e.g., HBB_HUMAN, or P002833). These lists may be in any ofthree currently supported formats: plain text lists of proteins (ASCII format), Mascot databasesearch results (.dat format), or protXML results (XML format) obtained from ProteinProphet13 using the Trans Proteomic Pipeline (TPP)14,15
(tools.proteomecenter.org/software.php). Mascot and TPP file formats were chosen becauseof their popularity in proteomics, but the text file format gives STRAP the flexibility to beintegrated into alternative workflows. The Mascot .dat search results format contains identifiersthrough which protein accession numbers are retrieved by STRAP. ProtXML results obtainedusing the TPP tools are in an XML format defined by the Institute for Systems Biology (ISB)that is mined by STRAP for accession numbers. STRAP focuses on data obtained from theTPP because of its open-source, community-driven nature. Each protein hit in the TPP’sprotXML file also has an associated probability which reflects the likelihood of valid proteinassignment to the raw data. A STRAP user may choose to import only proteins above a givenprobability threshold. This probability cutoff acts as a filter to reduce the presence of low-scoring proteins and will allow for more accurate and manageable data sets.
Bhatia et al. Page 3
Anal Chem. Author manuscript; available in PMC 2010 December 1.
NIH
-PA Author Manuscript
NIH
-PA Author Manuscript
NIH
-PA Author Manuscript

Following importing of protein identifications and subsequent annotations, the results may besaved as an annotated text file (.atxt) which contains all pertinent information regarding thedataset, or a FASTA formatted protein dataset containing the names and sequences of theidentified proteins. The .atxt files may be reloaded into STRAP at any later time to reconstitutethe project for further analysis without the need to download all of the protein annotations againwhile the FASTA dataset export may be used for subsequent searching via a database searchalgorithm when incorporating iterative search strategies. Additionally, gene namescorresponding to the proteins in the lists may be encoded in the Gaggle microformat(gaggle.systemsbiology.org/docs) for use with more diverse data analysis and interpretationprograms that are a part of the Gaggle9. The Gaggle microformat file may be submitted foranalyses by other Gaggled programs (e.g., KEGG Pathway Search) via FireGoose10. We choseto integrate STRAP with Gaggled programs to increase the overall utility of STRAP and allowfor incorporation within open-source proteomics workflows which make use of the TPP.
AnnotationsSTRAP parses protein annotation information from XML data in the online UniProtKBdatabase. Because downloading annotations can take several minutes, depending on the sizeof a protein list, annotation is carried out in a multi-threaded fashion to allow a user tosimultaneously continue using STRAP, and other programs, for other tasks. At the time ofdownloading a new protein list, the user may select the option to also import GO annotationsfrom the EBI GOA database (http://www.ebi.ac.uk/GOA/)16. Downloaded annotationinformation is categorized into the following results: protein name, primary gene name,taxonomy, length, function, catalytic activity, and several gene ontology (GO) terms. Ascreenshot of the tabular results shown in STRAP is presented in Figure 2. Because GO termsare organized within nested hierarchies below the three major categories of Biological Process,Cellular Component, and Molecular Function, STRAP displays the GO term annotations onits main annotation table in columns corresponding to these three categories, each with adifferent representative symbol. Further organization of the GO terms into sub-categories isbased on a simplified version of the categories originally published by the Gene OntologyConsortium, with major categories being taken from geneontology.org17.
The main GO term columns used are as shown in Table 1. A complete description of GO termssub-category may be found in the Supplemental Table 1 (A–C) under the main category towhich they belong. For simplicity, any GO column is made visible only if there is at least oneprotein in the list that has the corresponding GO term annotation. STRAP displays a simplifiedGO category list to improve viewing capabilities; however, the user may still view the originalGO lineage of a protein’s GO terms via STRAP’s built-in Gene Ontology Term Browser(Figure 3). In addition to the full annotation display of GO term attributes obtained from theon-line database, users can manually edit these terms within STRAP as necessary if a user hasadditional expert information about the proteins of interest. Both inclusion into, and exclusionfrom, previously associated GO term categories can be specified for each protein entry. Theseresults then may be stored in the STRAP atxt file.
GO Annotation VisualizationThere are currently two ways to visualize protein annotations in STRAP: pie charts and bargraphs. Selecting pie-chart rendering allows for display of each major category of GO term(biological process, cellular component, and molecular function) as shown in Figure 4. Eachslice of the pie chart is labeled with the appropriate subcategory title, and the number of GOannotations that fall under this category. In addition to showing the number of GO annotations,a percentage value is listed to indicate the fraction of GO terms that is represented out of thecomplete list of GO annotations for the entire set of proteins. From the particular data set shownin figure 4, it appears that “Regulation” is a frequent annotation in common to many proteins
Bhatia et al. Page 4
Anal Chem. Author manuscript; available in PMC 2010 December 1.
NIH
-PA Author Manuscript
NIH
-PA Author Manuscript
NIH
-PA Author Manuscript

in the current protein list. Based on the biological context of the data, this might be an interestingsubset of proteins for further study.11
Whereas pie charts provide visualization of single data sets that are easy to interpret on a per-sample or per-project bases, bar graphs may be rendered for ease of comparative analysis ofmultiple datasets. STRAP can render bar graphs on both single results sets and multiple setsof proteins and thus be used to qualitatively and semi-quantitatively interpret the biologicalsignificance of proteomics data. Comparison may be performed on any of the protein data sets’GO terms, including the number of annotations for sub-categories within each top-level GOcategory. In the example shown here in Figure 5, a comparison is made across threecomplimentary proteomics data sets. This easily allows the visualization of global changes inprotein functions across the data sets, and provides information for global data analysis andcomparison and affords planning of future experiments. In this example, among the three datasets, “growth” is an annotation that is found more frequently in set 3 than the other sets, whichmay imply that growth-related proteins are up-regulated in set 3. 11 When there are too manydata sets (e.g., more than 5) being compared, the user can elect to generate a comparison tablein addition to a bar chart.
CONCLUSIONSSTRAP is user-friendly, open-source software that automates the protein annotation and GO-term visualization process that is otherwise extremely laborious when done manually. It canread protein lists from a variety of formats, including Mascot and TPP search results, and thenannotate these lists using the online UniProtKB and the EBI GOA database. From an annotatedlist of proteins, it can generate various GO term graphs and charts to aid data interpretationand thus expedite proteomic data analysis. Furthermore, these graphs provide qualitativeinformation that is instrumental to planning future experiments. This easy to use PC-basedsoftware allows researchers to rapidly parse and annotate large sets of proteins from a varietyof sources. Additionally, it can export data to FASTA databases or to the large pool of Gaggleframework software for further data interrogation including pathway analysis.
While STRAP currently mines the UniProtKB and EBI GOA databases for annotationinformation, these databases do not contain an exhaustive list of proteins, and proteins that arein these databases are not always completely annotated. Fortunately, both databases are rapidlygrowing to encompass more complete annotations and additional protein entries. While weanticipate that future releases of STRAP will have the capability to automatically searchdatabases other than the UniProtKB and EBI GOA, users can use the ID Mapping tool providedby UniProt (www.uniprot.org/?tab=mapping) for pre-analysis file conversion should they beinterested in characterization of proteins obtained from other database driven proteomicsexperiments.
Because gene ontology annotation is still incomplete, it is useful to access gene ontologyannotations from various sources. There are several applications in the public domain whichfocus on predicting gene ontology annotations: GoFigure18, Blast2GO19, GOanna20, andGeneTools17 predict GO terms with a homology search, and EBIMed21 predicts them using aliterature-based search. We plan to integrate such GO term prediction as well as GO termenrichment and depletion calculation capabilities in a future release of STRAP. Furthermore,to meet the increasing focus on post-translational modifications (PTMs) in proteomics, futurereleases of STRAP will include the ability to visualize and compare the character and extentof PTMs across data sets in addition to simple protein comparisons. Finally, as the source codeis readily available to the community, others may add their own functionality to STRAP asthey see fit.
Bhatia et al. Page 5
Anal Chem. Author manuscript; available in PMC 2010 December 1.
NIH
-PA Author Manuscript
NIH
-PA Author Manuscript
NIH
-PA Author Manuscript

Supplementary MaterialRefer to Web version on PubMed Central for supplementary material.
AcknowledgmentsWe thank all the members of the Center for Biomedical Mass Spectrometry for evaluating STRAP and providingfeedback during the course of program development. This research was funded by NIH-NHLBI contract N01 HV28178and NIH-NCRR grant P41 RR10888.
REFERENCES1. Ashburner M, Ball CA, Blake JA, Botstein D, Butler H, Cherry JM, Davis AP, Dolinski K, Dwight
SS, Eppig JT, Harris MA, Hill DP, Issel-Tarver L, Kasarskis A, Lewis S, Matese JC, Richardson JE,Ringwald M, Rubin GM, Sherlock G. Nat Genet 2000;25:25–29. [PubMed: 10802651]
2. Falkner JA, Falkner JW, Andrews PC. Bioinformatics 2006;22:632–633. [PubMed: 16434446]3. Apweiler R, Bairoch A, Wu CH, Barker WC, Boeckmann B, Ferro S, Gasteiger E, Huang H, Lopez
R, Magrane M, Martin MJ, Natale DA, O'Donovan C, Redaschi N, Yeh L-SL. Nucl. Acids Res2004;32:D115–D119. [PubMed: 14681372]
4. Reimand J, Kull M, Peterson H, Hansen J, Vilo J. Nucleic Acids Res 2007;35:W193–W200. [PubMed:17478515]
5. Kaplan N, Vaaknin A, Linial M. Nucleic Acids Res 2003;31:5617–5626. [PubMed: 14500825]6. Olason PI. Nucleic Acids Res 2005;33:W468–W470. [PubMed: 15980514]7. Ramos H, Shannon P, Aebersold R. Bioinformatics 2008;24:2110–2111. [PubMed: 18635572]8. Rodriguez-Perez MA, Medina-Aunon A, Encarnacion-Guevara SM, Bernal-Silvia S, Barrera-Saldana
H, Albar-Ramirez JP. Clinical & Translational Oncology 2008;10:604–617. [PubMed: 18940741]9. Shannon PT, Reiss DJ, Bonneau R, Baliga NS. BMC Bioinformatics 2006;7:176. [PubMed: 16569235]10. Bare JC, Shannon PT, Schmid AK, Baliga NS. BMC Bioinformatics 2007;8:456. [PubMed:
18021453]11. Romesser PB, Perlman DH, McComb ME, Faller DV, Costello CE, Denis GV. Am. J. Pathol. 2009In
Press12. Perkins DN, Pappin DJ, Creasy DM, Cottrell JS. Electrophoresis 1999;20:3551–3567. [PubMed:
10612281]13. Nesvizhskii AI, Keller A, Kolker E, Aebersold R. Anal Chem 2003;75:4646–4658. [PubMed:
14632076]14. Pedrioli PG, Eng JK, Hubley R, Vogelzang M, Deutsch EW, Raught B, Pratt B, Nilsson E, Angeletti
RH, Apweiler R, Cheung K, Costello CE, Hermjakob H, Huang S, Julian RK, Kapp E, McCombME, Oliver SG, Omenn G, Paton NW, Simpson R, Smith R, Taylor CF, Zhu W, Aebersold R. NatBiotechnol 2004;22:1459–1466. [PubMed: 15529173]
15. Keller A, Eng J, Zhang N, Li XJ, Aebersold R. Mol Syst Biol 2005;12005 001716. Barrell D, Dimmer E, Huntley RP, Binns D, O'Donovan C, Apweiler R. Nucleic Acids Res
2009;37:D396–D403. [PubMed: 18957448]17. Beisvag V, Junge FK, Bergum H, Jolsum L, Lydersen S, Gunther CC, Ramampiaro H, Langaas M,
Sandvik AK, Laegreid A. BMC Bioinformatics 2006;7:470. [PubMed: 17062145]18. Khan S, Situ G, Decker K, Schmidt CJ. Bioinformatics 2003;19:2484–2485. [PubMed: 14668239]19. Conesa A, Gotz S, Garcia-Gomez JM, Terol J, Talon M, Robles M. Bioinformatics 2005;21:3674–
3676. [PubMed: 16081474]20. McCarthy FM, Wang N, Magee GB, Nanduri B, Lawrence ML, Camon EB, Barrell DG, Hill DP,
Dolan ME, Williams WP, Luthe DS, Bridges SM, Burgess SC. BMC Genomics 2006;7:229.[PubMed: 16961921]
21. Rebholz-Schuhmann D, Kirsch H, Arregui M, Gaudan S, Rynbeek M, Stoehr P. Nat Biotechnol2006;24:902–903. [PubMed: 16900125]
Bhatia et al. Page 6
Anal Chem. Author manuscript; available in PMC 2010 December 1.
NIH
-PA Author Manuscript
NIH
-PA Author Manuscript
NIH
-PA Author Manuscript

Figure 1.Schematic representation of STRAP functionality, including data input and output. STRAPcan read protein lists in UniProt entry or accession number format obtained from plain textfiles, as well as from Mascot and TPP ProteinProphet results files. STRAP then gathers proteinGO-term annotation data from the public UniProtKB and the EBI GOA databases and allowsediting of this data, providing the capacity to integrate in-house expertise on the proteins ofstudy. STRAP can save the annotations to disk or export them to the Gaggle framework viaFiregoose. 82×51mm (300 × 300 DPI)
Bhatia et al. Page 7
Anal Chem. Author manuscript; available in PMC 2010 December 1.
NIH
-PA Author Manuscript
NIH
-PA Author Manuscript
NIH
-PA Author Manuscript

Figure 2.GUI interface of STRAP showing the main protein annotation view. All columns in the mainannotation table, including the GO category column allow sorting. This allows users to groupproteins by any gene ontology. Annotation attributes can be edited to include or eliminate GO-term associations with particular protein entries according to the users’ expertise. 86×165mm(300 × 300 DPI)
Bhatia et al. Page 8
Anal Chem. Author manuscript; available in PMC 2010 December 1.
NIH
-PA Author Manuscript
NIH
-PA Author Manuscript
NIH
-PA Author Manuscript

Figure 3.STRAP’s built in Gene Ontology Term Browser. The browser presents all GO terms associatedwith a particular protein entry, as well as each GO term’s complete lineage. 82×28mm (300 ×300 DPI)
Bhatia et al. Page 9
Anal Chem. Author manuscript; available in PMC 2010 December 1.
NIH
-PA Author Manuscript
NIH
-PA Author Manuscript
NIH
-PA Author Manuscript
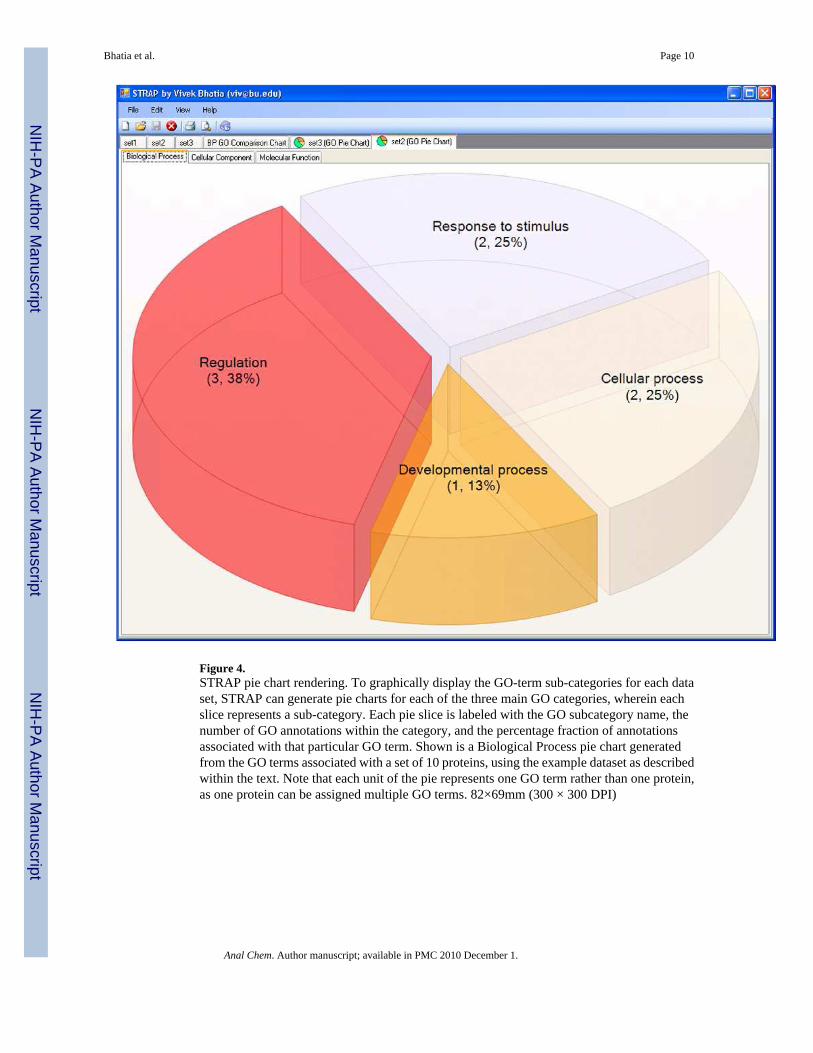
Figure 4.STRAP pie chart rendering. To graphically display the GO-term sub-categories for each dataset, STRAP can generate pie charts for each of the three main GO categories, wherein eachslice represents a sub-category. Each pie slice is labeled with the GO subcategory name, thenumber of GO annotations within the category, and the percentage fraction of annotationsassociated with that particular GO term. Shown is a Biological Process pie chart generatedfrom the GO terms associated with a set of 10 proteins, using the example dataset as describedwithin the text. Note that each unit of the pie represents one GO term rather than one protein,as one protein can be assigned multiple GO terms. 82×69mm (300 × 300 DPI)
Bhatia et al. Page 10
Anal Chem. Author manuscript; available in PMC 2010 December 1.
NIH
-PA Author Manuscript
NIH
-PA Author Manuscript
NIH
-PA Author Manuscript

Figure 5.STRAP bar chart rendering for the comparison of multiple data sets. STRAP can generate barcharts allowing for comparison and visualization of large datasets based upon GO terms. Thisbar graph compares the amount of Biological Process GO term annotations between three setsof proteins as described within the text. 82×58mm (300 × 300 DPI)
Bhatia et al. Page 11
Anal Chem. Author manuscript; available in PMC 2010 December 1.
NIH
-PA Author Manuscript
NIH
-PA Author Manuscript
NIH
-PA Author Manuscript

NIH
-PA Author Manuscript
NIH
-PA Author Manuscript
NIH
-PA Author Manuscript
Bhatia et al. Page 12
Table 1
STRAP categorization of gene ontology (GO) terms. The three major categories of GO terms are incorporatedwithin strap as shown here. For the complete list of categories and subcategories, see Supplemental Table 1.
Major GO Category Associated GO Term Number of Subcategories
Biological Process GO:0008150 10Cellular Component GO:0005575 17Molecular Function GO:0003674 12
Anal Chem. Author manuscript; available in PMC 2010 December 1.
Copyright © 2022 FDOKUMEN