O/o Deputy Director General A-Wing, 5th ... - Ministry of Coal
123
MONTHLY STATISTICAL REPORT MINISTRY OF COAL March 2022 O/o Deputy Director General A-Wing, 5 th Floor, Lok Nayak Bhavan, Lok Nayak Bhavan, New Delhi-110003.
-
Upload
khangminh22 -
Category
Documents
-
view
3 -
download
0
Transcript of O/o Deputy Director General A-Wing, 5th ... - Ministry of Coal
MONTHLY STATISTICAL REPORT
MINISTRY OF COAL
March 2022
O/o Deputy Director General
A-Wing, 5th Floor, Lok Nayak Bhavan,
Lok Nayak Bhavan, New Delhi-110003.
Preface
The Monthly Coal Statistics for the month of March 2022 is placed below.
Ministry of Coal gets various reports/returns from CIL along with its
Subsidiaries, SCCL and NLCIL, Monthly DO Letters from CMDs of all
Companies to the Secretary (Coal) and monthly production and dispatch
information of Captive Block and Lignite Block from CCO. Based on these
sources, compilation has been made for the use of various stakeholders.
It is informed that all the information provided in the report is provisional.

Table of Contents
S. No
Chapter Name Table Page
1 All India
Production &
Despatch
Coal Production 1 State-wise Coal Production 2 Over Burden Removal ( OBR) 3 Coal Despatch 4 Sector-wise Coal Despatch 5 Lignite Production & Despatch 6 Coal Production By "Others" 7-9
2 Analysis of Big Mines of CIL
Production of Big Mines of CIL 10-25
OBR Analysis of Big Mines of CIL 26-41 3 Exploration Drilling Performance 42
4 Performance of
Coal PSUs
Production Status 43-46 Productivity 47-48 HEMM Performance 49-50
OBR Status 51-52
Mode-Wise Coal Despatch 53-55 Sector-Wise Coal Despatch 55-58 Vendible Stock Position 59
5 Performance of
NLCIL
Lignite Production Status 60 Status of Power Production 60 Productivity in Lignite Mining and Power
60
OBR Status 61 HEMM Performance 61 Power and Lignite Sales 61
6 Financial
Performance
Capital Expenditure Status 62 Manpower Position 63 Sundry Debtors Status 64 Age-wise Debtors 65 Auction Status of Coal in CIL 66-69
7 Electricity
Generation
Electricity Generation and Coal Consumption
70
8 Coal Import
Coal Import information 71-81
9 Major Ongoing Projects
CIL 82-86
NLCIL 87-93
SCCL 94-110
ALL Coal production & Despatch
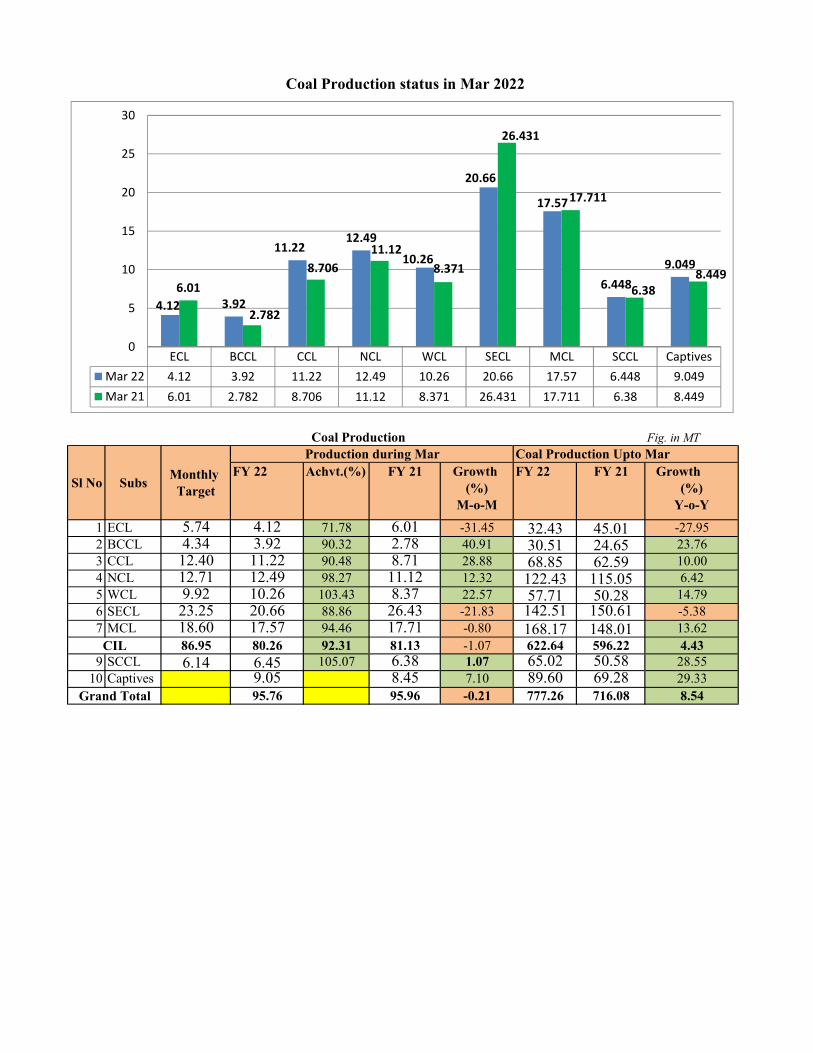
Fig. in MT
FY 22 Achvt.(%) FY 21 Growth (%)
M-o-M
FY 22 FY 21 Growth (%)
Y-o-Y
1 ECL 5.74 4.12 71.78 6.01 -31.45 32.43 45.01 -27.952 BCCL 4.34 3.92 90.32 2.78 40.91 30.51 24.65 23.763 CCL 12.40 11.22 90.48 8.71 28.88 68.85 62.59 10.004 NCL 12.71 12.49 98.27 11.12 12.32 122.43 115.05 6.425 WCL 9.92 10.26 103.43 8.37 22.57 57.71 50.28 14.796 SECL 23.25 20.66 88.86 26.43 -21.83 142.51 150.61 -5.387 MCL 18.60 17.57 94.46 17.71 -0.80 168.17 148.01 13.62
86.95 80.26 92.31 81.13 -1.07 622.64 596.22 4.439 SCCL 6.14 6.45 105.07 6.38 1.07 65.02 50.58 28.55
10 Captives 9.05 8.45 7.10 89.60 69.28 29.3395.76 95.96 -0.21 777.26 716.08 8.54
Sl No Subs Monthly Target
Production during Mar Coal Production Upto Mar
Coal Production status in Mar 2022
Coal Production
CIL
Grand Total
ECL BCCL CCL NCL WCL SECL MCL SCCL CaptivesMar 22 4.12 3.92 11.22 12.49 10.26 20.66 17.57 6.448 9.049Mar 21 6.01 2.782 8.706 11.12 8.371 26.431 17.711 6.38 8.449
4.12 3.92
11.2212.49
10.26
20.66
17.57
6.4489.049
6.01
2.782
8.70611.12
8.371
26.431
17.711
6.388.449
0
5
10
15
20
25
30
1
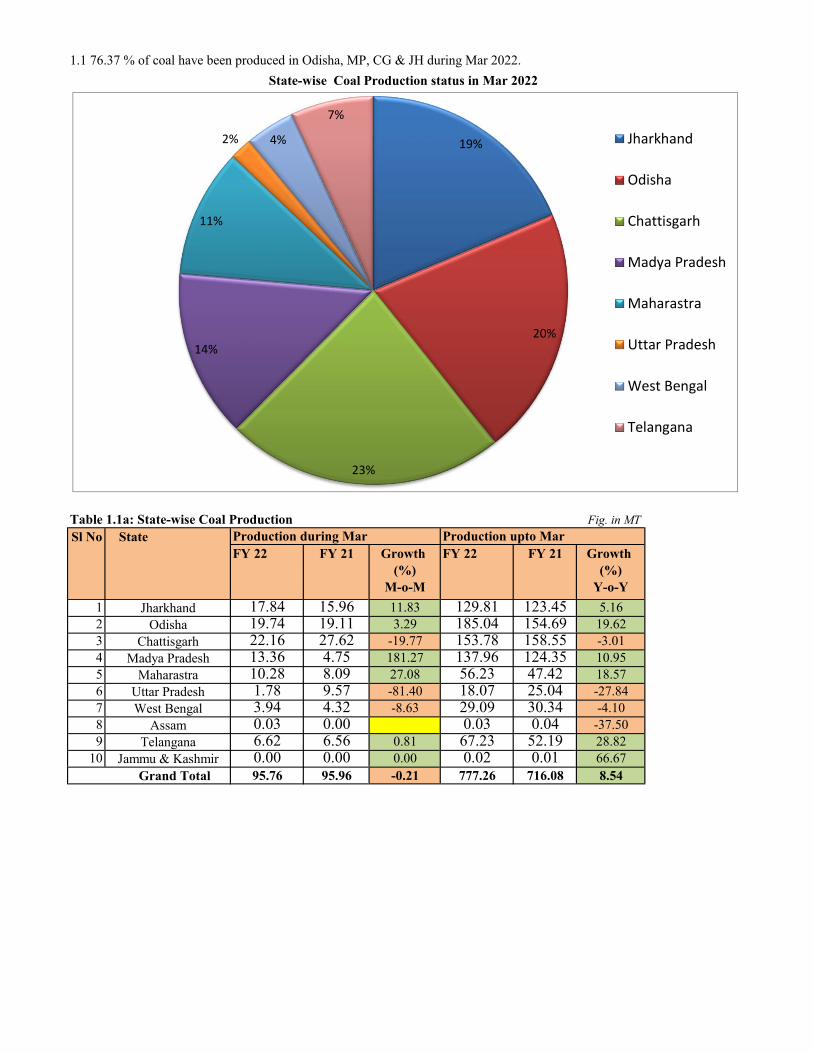
Table 1.1a: State-wise Coal Production Fig. in MTSl No State
FY 22 FY 21 Growth (%)
M-o-M
FY 22 FY 21 Growth (%)
Y-o-Y1 17.84 15.96 11.83 129.81 123.45 5.162 19.74 19.11 3.29 185.04 154.69 19.623 22.16 27.62 -19.77 153.78 158.55 -3.014 13.36 4.75 181.27 137.96 124.35 10.955 10.28 8.09 27.08 56.23 47.42 18.576 1.78 9.57 -81.40 18.07 25.04 -27.847 3.94 4.32 -8.63 29.09 30.34 -4.108 0.03 0.00 0.03 0.04 -37.509 6.62 6.56 0.81 67.23 52.19 28.82
10 0.00 0.00 0.00 0.02 0.01 66.6795.76 95.96 -0.21 777.26 716.08 8.54
Uttar Pradesh
1.1 76.37 % of coal have been produced in Odisha, MP, CG & JH during Mar 2022.State-wise Coal Production status in Mar 2022
Production during Mar Production upto Mar
JharkhandOdisha
ChattisgarhMadya Pradesh
Maharastra
West BengalAssam
TelanganaJammu & Kashmir
Grand Total
19%
20%
23%
14%
11%
2% 4%
7%
Jharkhand
Odisha
Chattisgarh
Madya Pradesh
Maharastra
Uttar Pradesh
West Bengal
Telangana
2
s
Table 1.2: Summary of OBR Fig. in M.CumSl No Subs
FY 22 Achvt.(%) FY 21 Growth (%)
M-o-M
FY 22 FY 21 Growth (%)
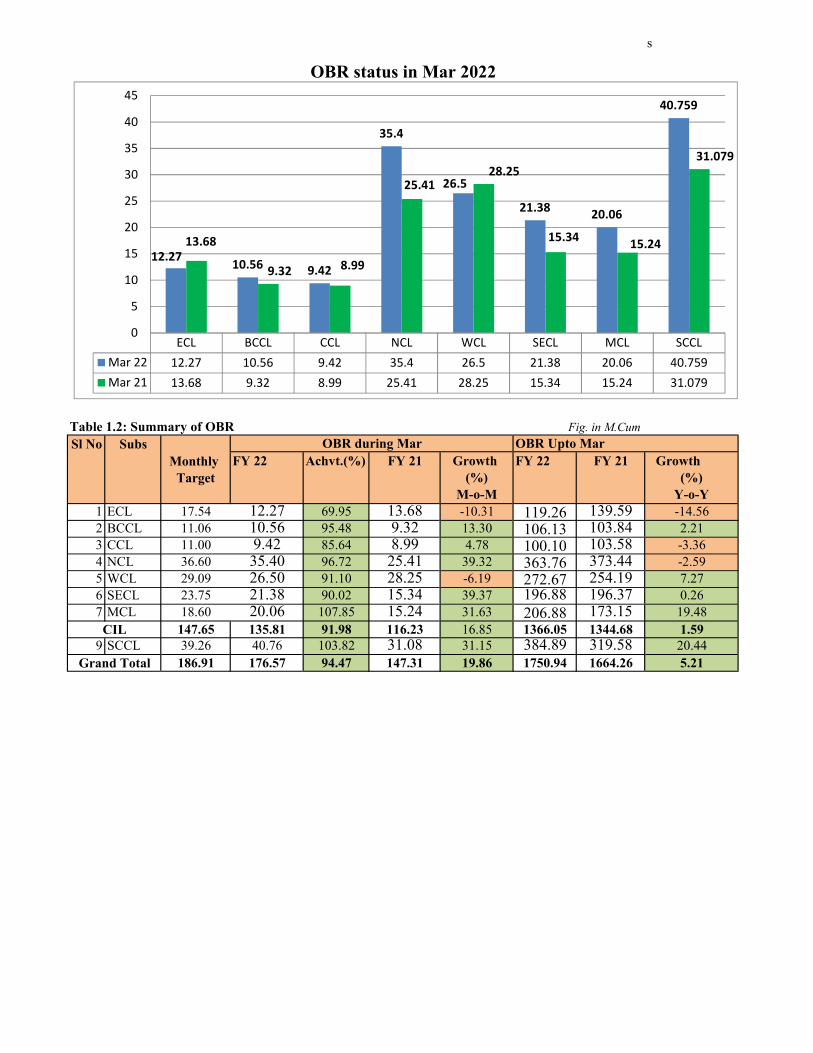
Y-o-Y1 ECL 17.54 12.27 69.95 13.68 -10.31 119.26 139.59 -14.562 BCCL 11.06 10.56 95.48 9.32 13.30 106.13 103.84 2.213 CCL 11.00 9.42 85.64 8.99 4.78 100.10 103.58 -3.364 NCL 36.60 35.40 96.72 25.41 39.32 363.76 373.44 -2.595 WCL 29.09 26.50 91.10 28.25 -6.19 272.67 254.19 7.276 SECL 23.75 21.38 90.02 15.34 39.37 196.88 196.37 0.267 MCL 18.60 20.06 107.85 15.24 31.63 206.88 173.15 19.48
147.65 135.81 91.98 116.23 16.85 1366.05 1344.68 1.599 SCCL 39.26 40.76 103.82 31.08 31.15 384.89 319.58 20.44
186.91 176.57 94.47 147.31 19.86 1750.94 1664.26 5.21Grand Total
OBR status in Mar 2022
Monthly Target
OBR during Mar OBR Upto Mar
CIL
ECL BCCL CCL NCL WCL SECL MCL SCCLMar 22 12.27 10.56 9.42 35.4 26.5 21.38 20.06 40.759Mar 21 13.68 9.32 8.99 25.41 28.25 15.34 15.24 31.079
12.27 10.56 9.42
35.4
26.5
21.38 20.06
40.759
13.68
9.32 8.99
25.4128.25
15.34 15.24
31.079
0
5
10
15
20
25
30
35
40
45
3
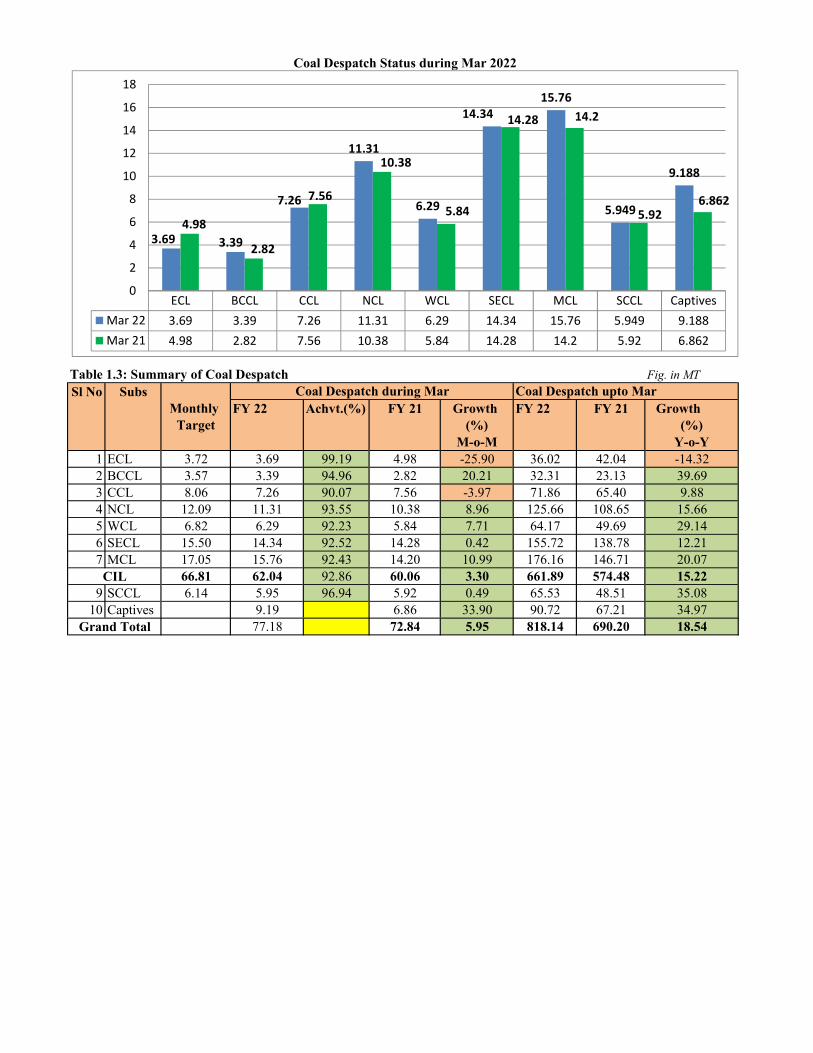
Table 1.3: Summary of Coal Despatch Fig. in MTSl No Subs
FY 22 Achvt.(%) FY 21 Growth (%)
M-o-M
FY 22 FY 21 Growth (%)
Y-o-Y1 ECL 3.72 3.69 99.19 4.98 -25.90 36.02 42.04 -14.322 BCCL 3.57 3.39 94.96 2.82 20.21 32.31 23.13 39.693 CCL 8.06 7.26 90.07 7.56 -3.97 71.86 65.40 9.884 NCL 12.09 11.31 93.55 10.38 8.96 125.66 108.65 15.665 WCL 6.82 6.29 92.23 5.84 7.71 64.17 49.69 29.146 SECL 15.50 14.34 92.52 14.28 0.42 155.72 138.78 12.217 MCL 17.05 15.76 92.43 14.20 10.99 176.16 146.71 20.07
66.81 62.04 92.86 60.06 3.30 661.89 574.48 15.229 SCCL 6.14 5.95 96.94 5.92 0.49 65.53 48.51 35.08
10 Captives 9.19 6.86 33.90 90.72 67.21 34.9777.18 72.84 5.95 818.14 690.20 18.54
Coal Despatch Status during Mar 2022
Monthly Target
Coal Despatch during Mar Coal Despatch upto Mar
CIL
Grand Total
ECL BCCL CCL NCL WCL SECL MCL SCCL CaptivesMar 22 3.69 3.39 7.26 11.31 6.29 14.34 15.76 5.949 9.188Mar 21 4.98 2.82 7.56 10.38 5.84 14.28 14.2 5.92 6.862
3.69 3.39
7.26
11.31
6.29
14.3415.76
5.949
9.188
4.98
2.82
7.56
10.38
5.84
14.28 14.2
5.926.862
0
2
4
6
8
10
12
14
16
18
4
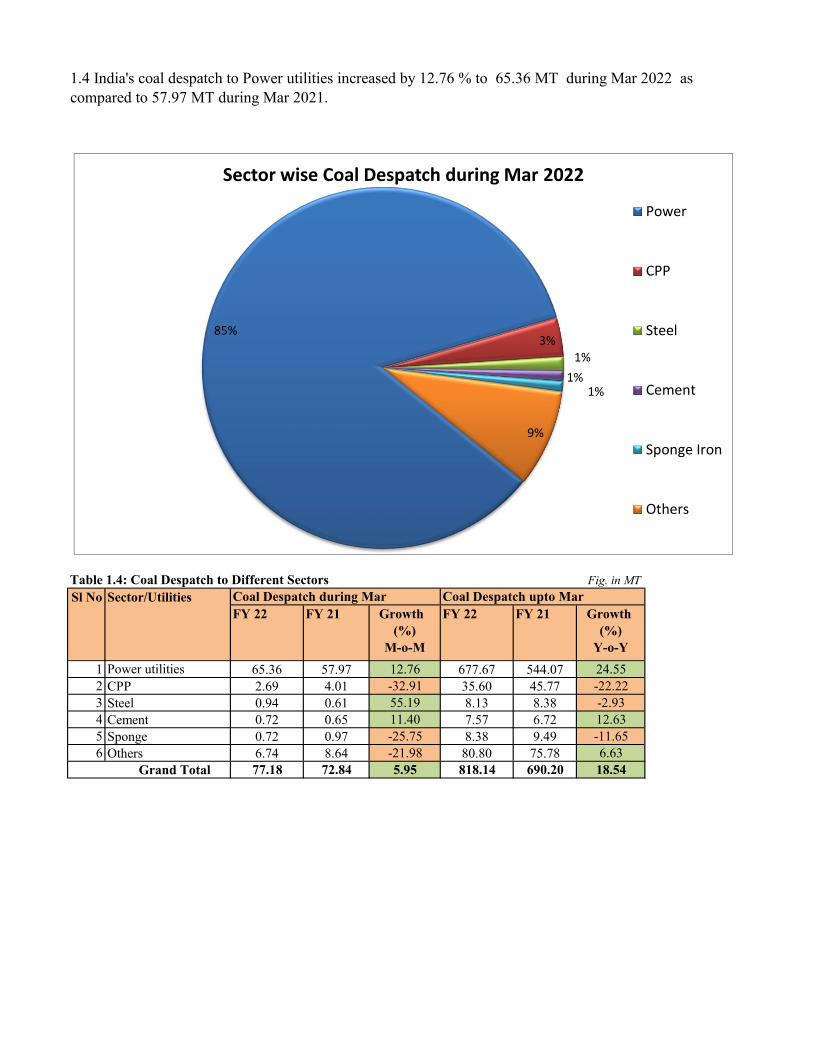
Table 1.4: Coal Despatch to Different Sectors Fig. in MTSl No Sector/Utilities
FY 22 FY 21 Growth (%)
M-o-M
FY 22 FY 21 Growth (%)
Y-o-Y1 65.36 57.97 12.76 677.67 544.07 24.552 CPP 2.69 4.01 -32.91 35.60 45.77 -22.223 Steel 0.94 0.61 55.19 8.13 8.38 -2.934 Cement 0.72 0.65 11.40 7.57 6.72 12.635 Sponge 0.72 0.97 -25.75 8.38 9.49 -11.656 Others 6.74 8.64 -21.98 80.80 75.78 6.63
77.18 72.84 5.95 818.14 690.20 18.54
Grand Total
1.4 India's coal despatch to Power utilities increased by 12.76 % to 65.36 MT during Mar 2022 as compared to 57.97 MT during Mar 2021.
Coal Despatch during Mar Coal Despatch upto Mar
Power utilities
85%3%
1%1%
1%
9%
Sector wise Coal Despatch during Mar 2022
Power
CPP
Steel
Cement
Sponge Iron
Others
5
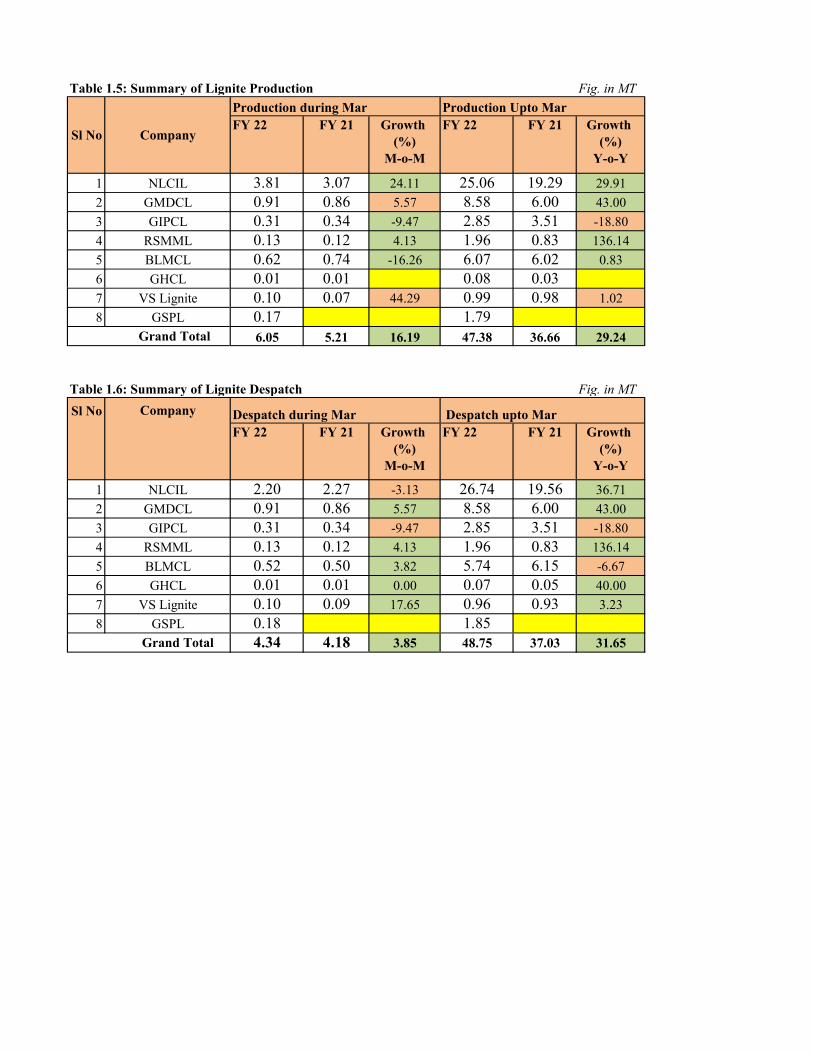
Fig. in MT
FY 22 FY 21 Growth (%)
M-o-M
FY 22 FY 21 Growth (%)
Y-o-Y
1 3.81 3.07 24.11 25.06 19.29 29.912 0.91 0.86 5.57 8.58 6.00 43.003 0.31 0.34 -9.47 2.85 3.51 -18.804 0.13 0.12 4.13 1.96 0.83 136.145 0.62 0.74 -16.26 6.07 6.02 0.836 0.01 0.01 0.08 0.037 0.10 0.07 44.29 0.99 0.98 1.028 0.17 1.79
6.05 5.21 16.19 47.38 36.66 29.24
Table 1.6: Summary of Lignite Despatch Fig. in MTSl No
FY 22 FY 21 Growth (%)
M-o-M
FY 22 FY 21 Growth (%)
Y-o-Y
1 2.20 2.27 -3.13 26.74 19.56 36.712 0.91 0.86 5.57 8.58 6.00 43.003 0.31 0.34 -9.47 2.85 3.51 -18.804 0.13 0.12 4.13 1.96 0.83 136.145 0.52 0.50 3.82 5.74 6.15 -6.676 0.01 0.01 0.00 0.07 0.05 40.007 0.10 0.09 17.65 0.96 0.93 3.238 0.18 1.85
4.34 4.18 3.85 48.75 37.03 31.65
GHCLVS Lignite
Grand Total
Table 1.5: Summary of Lignite Production
Sl No Company
Production during Mar Production Upto Mar
NLCILGMDCLGIPCL
RSMMLBLMCL
GSPL
Despatch during Mar Despatch upto Mar
Grand Total
GMDCLGIPCL
RSMMLBLMCLGHCL
VS Lignite
NLCIL
GSPL
Company
6
Annex 1
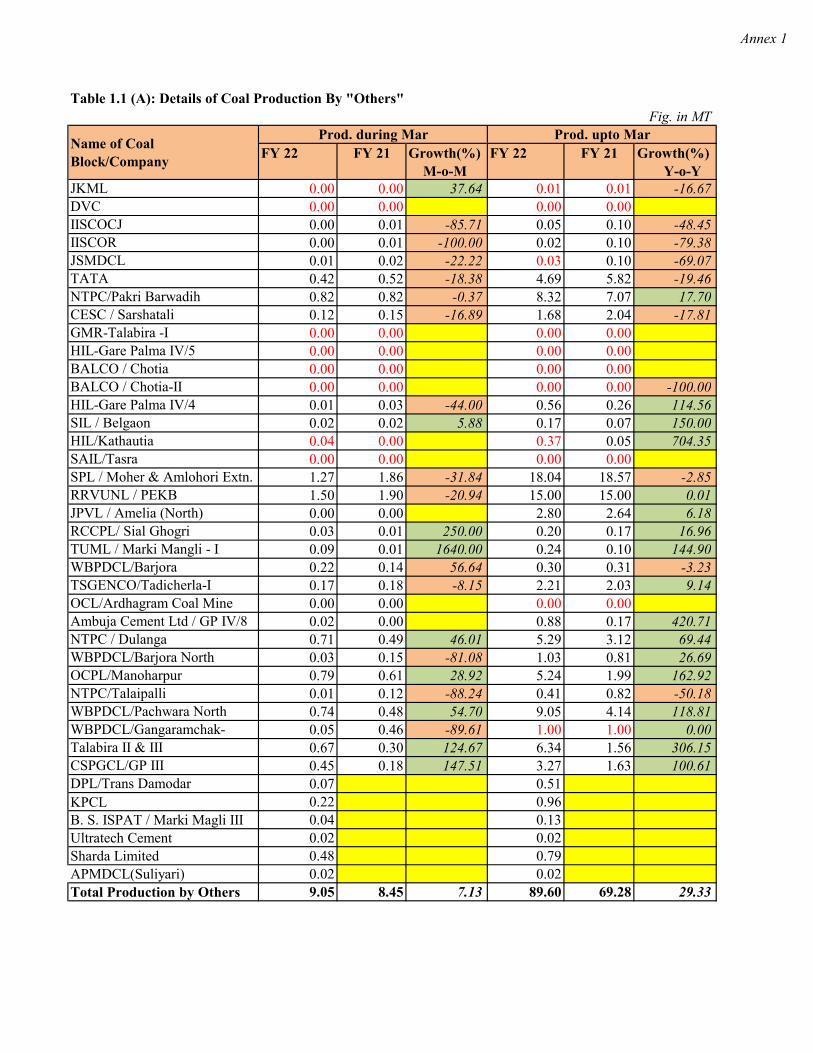
Table 1.1 (A): Details of Coal Production By "Others"Fig. in MT
FY 22 FY 21 Growth(%) M-o-M
FY 22 FY 21 Growth(%) Y-o-Y
0.00 0.00 37.64 0.01 0.01 -16.670.00 0.00 0.00 0.000.00 0.01 -85.71 0.05 0.10 -48.450.00 0.01 -100.00 0.02 0.10 -79.380.01 0.02 -22.22 0.03 0.10 -69.070.42 0.52 -18.38 4.69 5.82 -19.460.82 0.82 -0.37 8.32 7.07 17.700.12 0.15 -16.89 1.68 2.04 -17.810.00 0.00 0.00 0.000.00 0.00 0.00 0.000.00 0.00 0.00 0.000.00 0.00 0.00 0.00 -100.000.01 0.03 -44.00 0.56 0.26 114.560.02 0.02 5.88 0.17 0.07 150.000.04 0.00 0.37 0.05 704.350.00 0.00 0.00 0.001.27 1.86 -31.84 18.04 18.57 -2.851.50 1.90 -20.94 15.00 15.00 0.010.00 0.00 2.80 2.64 6.180.03 0.01 250.00 0.20 0.17 16.960.09 0.01 1640.00 0.24 0.10 144.900.22 0.14 56.64 0.30 0.31 -3.230.17 0.18 -8.15 2.21 2.03 9.140.00 0.00 0.00 0.000.02 0.00 0.88 0.17 420.710.71 0.49 46.01 5.29 3.12 69.440.03 0.15 -81.08 1.03 0.81 26.690.79 0.61 28.92 5.24 1.99 162.920.01 0.12 -88.24 0.41 0.82 -50.180.74 0.48 54.70 9.05 4.14 118.810.05 0.46 -89.61 1.00 1.00 0.000.67 0.30 124.67 6.34 1.56 306.150.45 0.18 147.51 3.27 1.63 100.610.07 0.51
KPCL 0.22 0.96B. S. ISPAT / Marki Magli III 0.04 0.13Ultratech Cement 0.02 0.02
0.48 0.790.02 0.029.05 8.45 7.13 89.60 69.28 29.33
Sharda LimitedAPMDCL(Suliyari)
DVC
GMR-Talabira -I
BALCO / Chotia-II
SAIL/Tasra
DPL/Trans Damodar
HIL/Kathautia
SPL / Moher & Amlohori Extn.RRVUNL / PEKBJPVL / Amelia (North)
TUML / Marki Mangli - I
TSGENCO/Tadicherla-IOCL/Ardhagram Coal Mine
IISCOCJ
JSMDCLTATA NTPC/Pakri BarwadihCESC / Sarshatali
HIL-Gare Palma IV/5BALCO / Chotia
HIL-Gare Palma IV/4
RCCPL/ Sial Ghogri
WBPDCL/Barjora
OCPL/ManoharpurNTPC/TalaipalliWBPDCL/Pachwara North
WBPDCL/Barjora North
SIL / Belgaon
Prod. during Mar
JKML
WBPDCL/Gangaramchak-Talabira II & III
Total Production by Others
Name of Coal Block/Company
IISCOR
Ambuja Cement Ltd / GP IV/8NTPC / Dulanga
CSPGCL/GP III
Prod. upto Mar
7
Annex 1
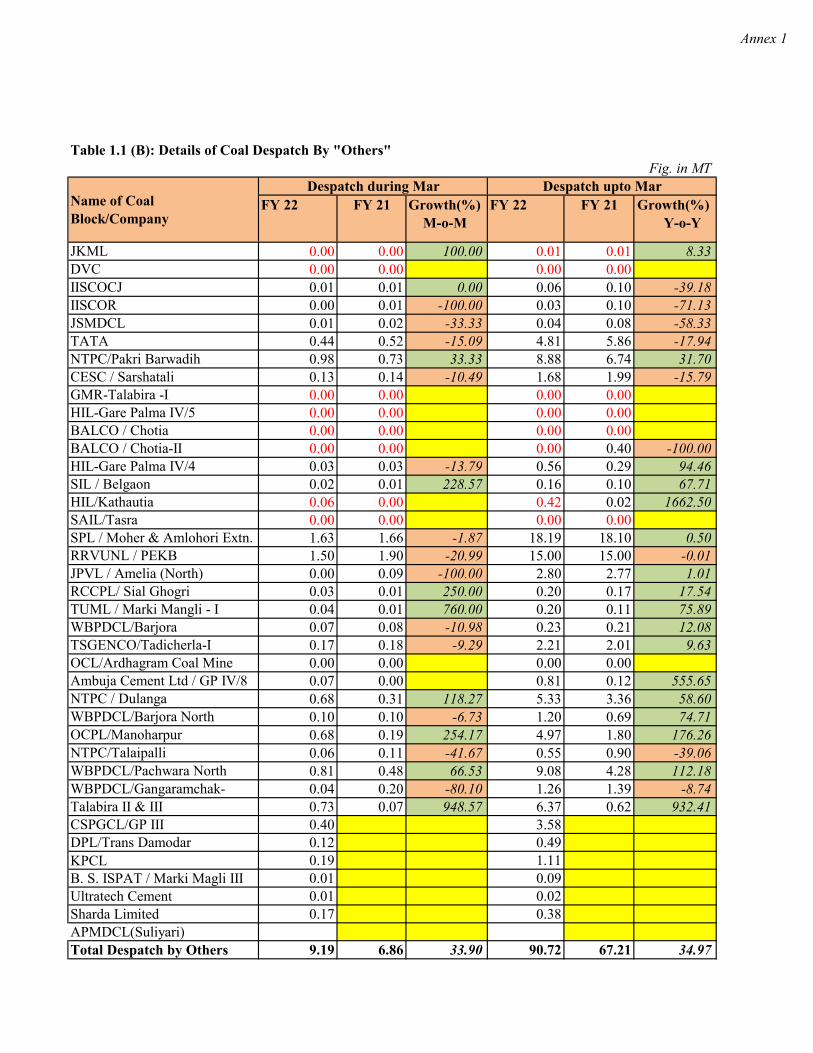
Table 1.1 (B): Details of Coal Despatch By "Others"Fig. in MT
FY 22 FY 21 Growth(%) M-o-M
FY 22 FY 21 Growth(%) Y-o-Y
0.00 0.00 100.00 0.01 0.01 8.330.00 0.00 0.00 0.000.01 0.01 0.00 0.06 0.10 -39.180.00 0.01 -100.00 0.03 0.10 -71.130.01 0.02 -33.33 0.04 0.08 -58.330.44 0.52 -15.09 4.81 5.86 -17.940.98 0.73 33.33 8.88 6.74 31.700.13 0.14 -10.49 1.68 1.99 -15.790.00 0.00 0.00 0.000.00 0.00 0.00 0.000.00 0.00 0.00 0.000.00 0.00 0.00 0.40 -100.000.03 0.03 -13.79 0.56 0.29 94.460.02 0.01 228.57 0.16 0.10 67.710.06 0.00 0.42 0.02 1662.500.00 0.00 0.00 0.001.63 1.66 -1.87 18.19 18.10 0.501.50 1.90 -20.99 15.00 15.00 -0.010.00 0.09 -100.00 2.80 2.77 1.010.03 0.01 250.00 0.20 0.17 17.540.04 0.01 760.00 0.20 0.11 75.890.07 0.08 -10.98 0.23 0.21 12.080.17 0.18 -9.29 2.21 2.01 9.630.00 0.00 0.00 0.000.07 0.00 0.81 0.12 555.650.68 0.31 118.27 5.33 3.36 58.600.10 0.10 -6.73 1.20 0.69 74.710.68 0.19 254.17 4.97 1.80 176.260.06 0.11 -41.67 0.55 0.90 -39.060.81 0.48 66.53 9.08 4.28 112.180.04 0.20 -80.10 1.26 1.39 -8.740.73 0.07 948.57 6.37 0.62 932.410.40 3.580.12 0.49
KPCL 0.19 1.11B. S. ISPAT / Marki Magli III 0.01 0.09Ultratech Cement 0.01 0.02
0.17 0.38
9.19 6.86 33.90 90.72 67.21 34.97
Sharda LimitedAPMDCL(Suliyari)Total Despatch by Others
RRVUNL / PEKBJPVL / Amelia (North)RCCPL/ Sial GhogriTUML / Marki Mangli - IWBPDCL/Barjora TSGENCO/Tadicherla-IOCL/Ardhagram Coal MineAmbuja Cement Ltd / GP IV/8
WBPDCL/Gangaramchak-Talabira II & IIICSPGCL/GP IIIDPL/Trans Damodar
WBPDCL/Barjora NorthOCPL/ManoharpurNTPC/Talaipalli
Despatch during Mar
JSMDCL
Name of Coal Block/Company
JKMLDVCIISCOCJIISCOR
Despatch upto Mar
WBPDCL/Pachwara North
TATA NTPC/Pakri BarwadihCESC / SarshataliGMR-Talabira -I
NTPC / Dulanga
HIL-Gare Palma IV/5BALCO / ChotiaBALCO / Chotia-IIHIL-Gare Palma IV/4SIL / BelgaonHIL/KathautiaSAIL/TasraSPL / Moher & Amlohori Extn.
8
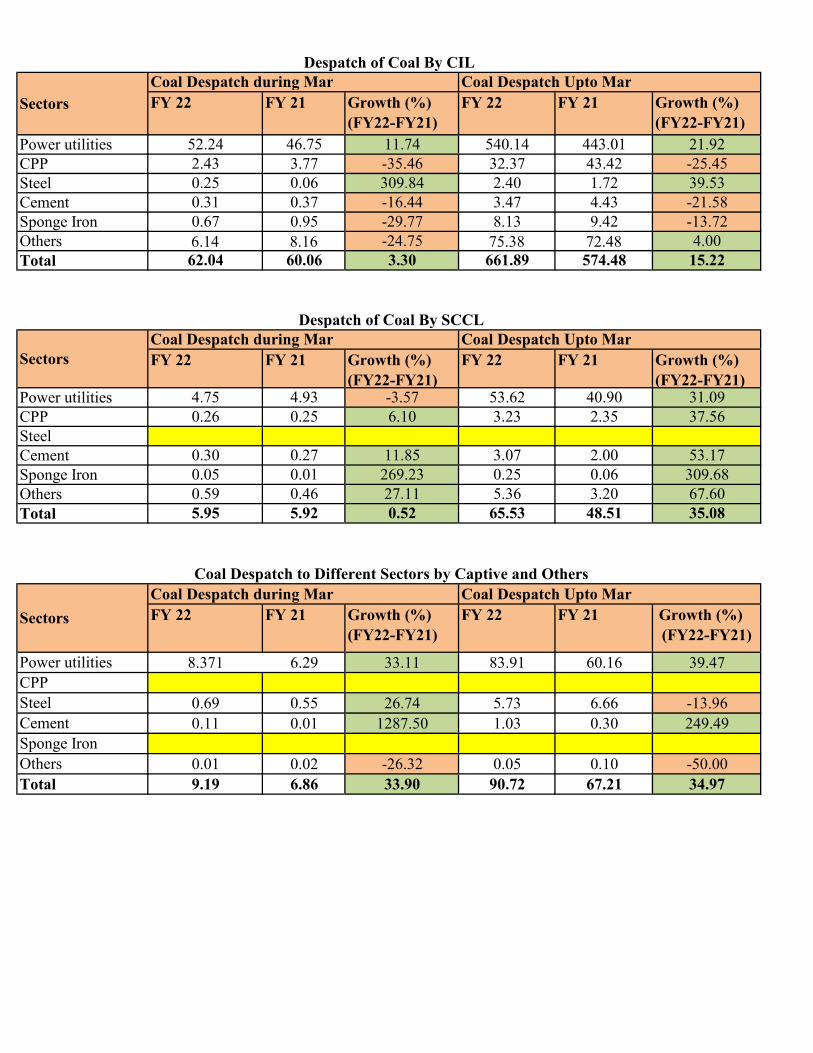
FY 22 FY 21 Growth (%) (FY22-FY21)
FY 22 FY 21 Growth (%) (FY22-FY21)
52.24 46.75 11.74 540.14 443.01 21.922.43 3.77 -35.46 32.37 43.42 -25.450.25 0.06 309.84 2.40 1.72 39.530.31 0.37 -16.44 3.47 4.43 -21.580.67 0.95 -29.77 8.13 9.42 -13.726.14 8.16 -24.75 75.38 72.48 4.0062.04 60.06 3.30 661.89 574.48 15.22
FY 22 FY 21 Growth (%) (FY22-FY21)
FY 22 FY 21 Growth (%) (FY22-FY21)
4.75 4.93 -3.57 53.62 40.90 31.090.26 0.25 6.10 3.23 2.35 37.56
0.30 0.27 11.85 3.07 2.00 53.170.05 0.01 269.23 0.25 0.06 309.680.59 0.46 27.11 5.36 3.20 67.605.95 5.92 0.52 65.53 48.51 35.08
FY 22 FY 21 Growth (%) (FY22-FY21)
FY 22 FY 21 Growth (%) (FY22-FY21)
8.371 6.29 33.11 83.91 60.16 39.47
0.69 0.55 26.74 5.73 6.66 -13.960.11 0.01 1287.50 1.03 0.30 249.49
0.01 0.02 -26.32 0.05 0.10 -50.009.19 6.86 33.90 90.72 67.21 34.97Total
Power utilitiesCPPSteelCementSponge IronOthers
SectorsCoal Despatch during Mar Coal Despatch Upto Mar
SectorsCoal Despatch during Mar Coal Despatch Upto Mar
Power utilitiesCPPSteelCementSponge IronOthersTotal
Coal Despatch to Different Sectors by Captive and Others
Despatch of Coal By SCCL
Despatch of Coal By CIL
SectorsCoal Despatch during Mar Coal Despatch Upto Mar
Power utilitiesCPPSteelCementSponge IronOthersTotal
9
Analysis of Big Mines of CIL, SCCL &
Others
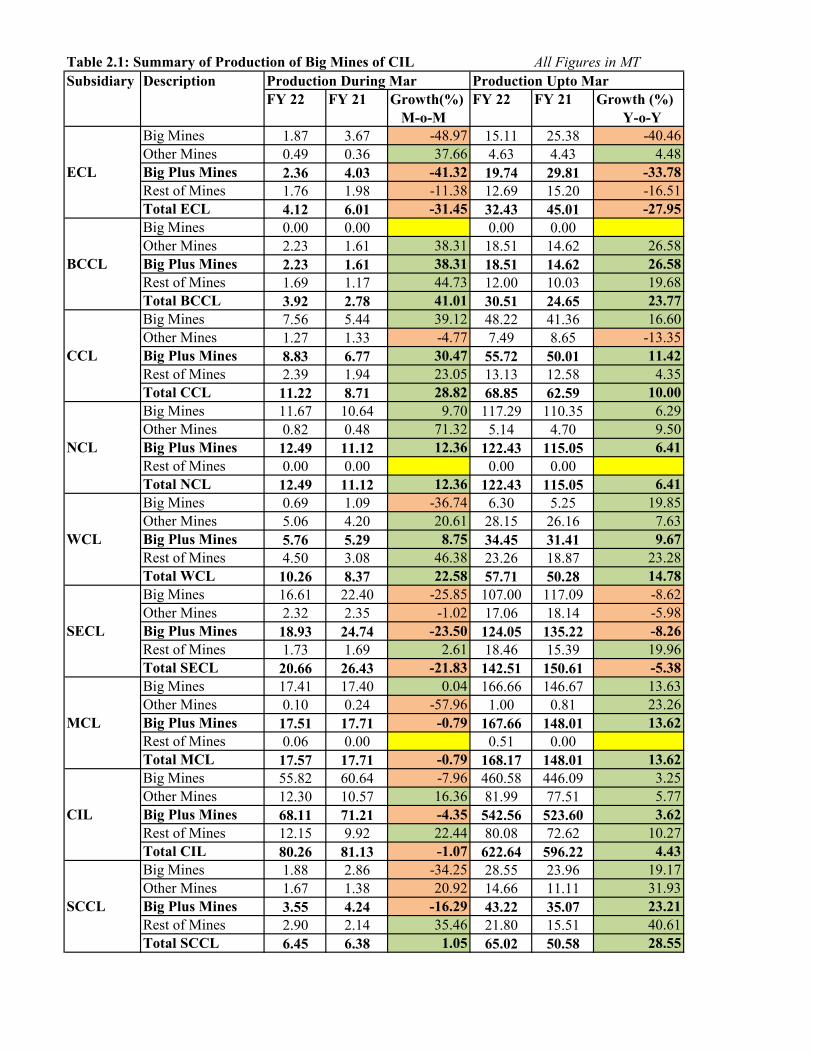
Table 2.1: Summary of Production of Big Mines of CIL All Figures in MT
FY 22 FY 21 Growth(%) M-o-M
FY 22 FY 21 Growth (%) Y-o-Y
1.87 3.67 -48.97 15.11 25.38 -40.460.49 0.36 37.66 4.63 4.43 4.482.36 4.03 -41.32 19.74 29.81 -33.781.76 1.98 -11.38 12.69 15.20 -16.514.12 6.01 -31.45 32.43 45.01 -27.950.00 0.00 0.00 0.002.23 1.61 38.31 18.51 14.62 26.582.23 1.61 38.31 18.51 14.62 26.581.69 1.17 44.73 12.00 10.03 19.683.92 2.78 41.01 30.51 24.65 23.777.56 5.44 39.12 48.22 41.36 16.601.27 1.33 -4.77 7.49 8.65 -13.358.83 6.77 30.47 55.72 50.01 11.422.39 1.94 23.05 13.13 12.58 4.35
11.22 8.71 28.82 68.85 62.59 10.0011.67 10.64 9.70 117.29 110.35 6.290.82 0.48 71.32 5.14 4.70 9.50
12.49 11.12 12.36 122.43 115.05 6.410.00 0.00 -95.26 0.00 0.00 -100.00
12.49 11.12 12.36 122.43 115.05 6.410.69 1.09 -36.74 6.30 5.25 19.855.06 4.20 20.61 28.15 26.16 7.635.76 5.29 8.75 34.45 31.41 9.674.50 3.08 46.38 23.26 18.87 23.28
10.26 8.37 22.58 57.71 50.28 14.7816.61 22.40 -25.85 107.00 117.09 -8.622.32 2.35 -1.02 17.06 18.14 -5.98
18.93 24.74 -23.50 124.05 135.22 -8.261.73 1.69 2.61 18.46 15.39 19.96
20.66 26.43 -21.83 142.51 150.61 -5.3817.41 17.40 0.04 166.66 146.67 13.630.10 0.24 -57.96 1.00 0.81 23.2617.51 17.71 -0.79 167.66 148.01 13.620.06 0.00 #DIV/0! 0.51 0.00 #DIV/0!
17.57 17.71 -0.79 168.17 148.01 13.6255.82 60.64 -7.96 460.58 446.09 3.2512.30 10.57 16.36 81.99 77.51 5.7768.11 71.21 -4.35 542.56 523.60 3.6212.15 9.92 22.44 80.08 72.62 10.2780.26 81.13 -1.07 622.64 596.22 4.431.88 2.86 -34.25 28.55 23.96 19.171.67 1.38 20.92 14.66 11.11 31.933.55 4.24 -16.29 43.22 35.07 23.212.90 2.14 35.46 21.80 15.51 40.616.45 6.38 1.05 65.02 50.58 28.55
Rest of MinesTotal SECLBig MinesOther MinesBig Plus Mines
Other MinesBig Plus Mines
Subsidiary
ECL
BCCL
CCL
NCL
WCL
SECL
MCL
CIL
SCCL
Description
Rest of MinesTotal SCCL
Rest of MinesTotal CILBig MinesOther MinesBig Plus Mines
Rest of MinesTotal MCLBig Mines
Rest of MinesTotal WCLBig MinesOther MinesBig Plus Mines
Rest of MinesTotal NCLBig MinesOther MinesBig Plus Mines
Rest of MinesTotal CCLBig MinesOther MinesBig Plus Mines
Rest of MinesTotal BCCLBig MinesOther MinesBig Plus Mines
Rest of MinesTotal ECLBig MinesOther MinesBig Plus Mines
Production During Mar Production Upto Mar
Big MinesOther MinesBig Plus Mines
10
FY 22 FY 21 Growth(%) M-o-M
FY 22 FY 21 Growth (%) Y-o-Y
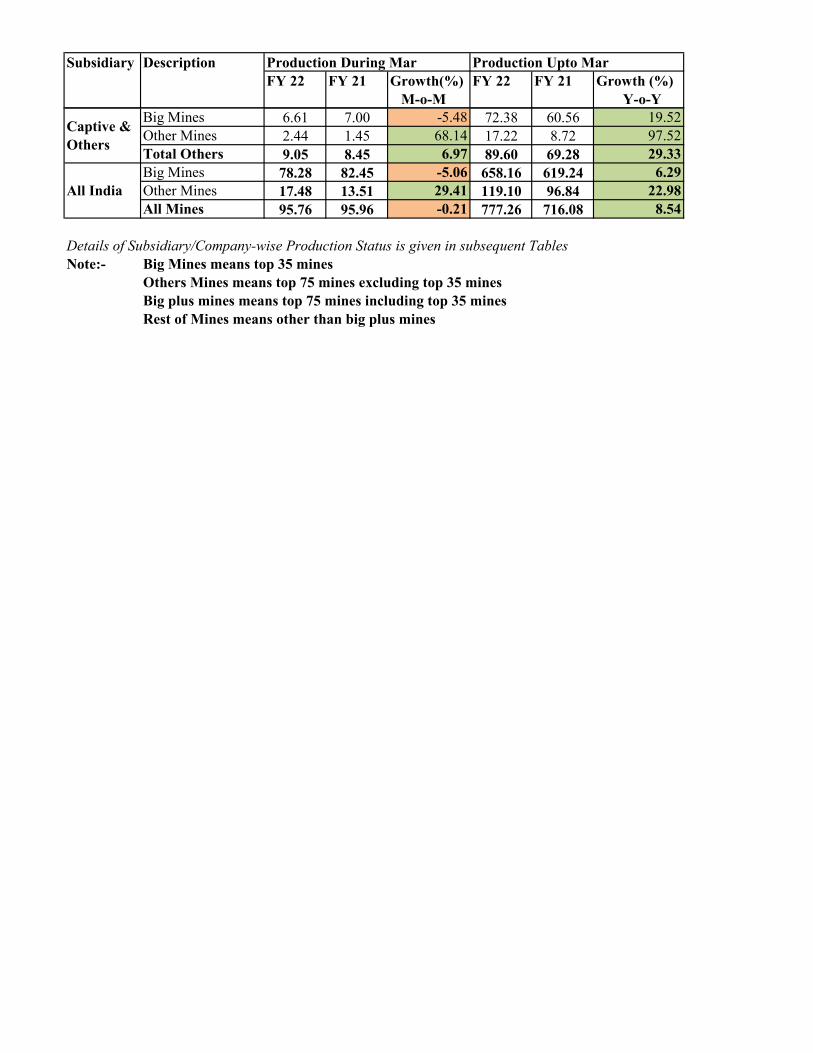
Subsidiary Description Production During Mar Production Upto Mar
6.61 7.00 -5.48 72.38 60.56 19.522.44 1.45 68.14 17.22 8.72 97.529.05 8.45 6.97 89.60 69.28 29.3378.28 82.45 -5.06 658.16 619.24 6.2917.48 13.51 29.41 119.10 96.84 22.9895.76 95.96 -0.21 777.26 716.08 8.54
Details of Subsidiary/Company-wise Production Status is given in subsequent TablesNote:- Big Mines means top 35 mines
Others Mines means top 75 mines excluding top 35 minesBig plus mines means top 75 mines including top 35 minesRest of Mines means other than big plus mines
Big MinesOther MinesAll Mines
Captive & Others
All India
Big MinesOther MinesTotal Others
11

Table 2.1.1 (A) : Departmental Coal Production ECL All Figures in MT
FY 22 FY 21 Growth (%) M-o-M FY 22 FY 21 Growth (%)
Y-o-YRajmahal Big 0.04 0.27 -86.25 0.89 0.47 88.79Sonepur Bazari Big 0.26 0.38 -30.98 2.16 2.72 -20.45Jhajhra UG Others 0.36 0.25 42.62 3.63 3.56 2.04Chitra East Others 0.13 0.10 25.70 1.00 0.87 14.44
0.30 0.65 -53.59 3.05 3.19 -4.300.49 0.36 37.66 4.63 4.43 4.480.79 1.00 -21.29 7.68 7.62 0.811.01 0.96 5.62 7.78 9.16 -15.091.80 1.96 -8.16 15.46 16.78 -7.87
Table 2.1.1 (B): Contractual Coal Production ECL
FY 22 FY 21 Growth (%) M-o-M FY 22 FY 21 Growth (%)
Y-o-YRajmahal Big 0.26 1.96 -86.83 4.59 15.43 -70.28Sonepur Bazari Big 1.32 1.07 23.33 7.47 6.76 10.54Jhajhra UG Others 0.00 0.00 0.00 0.00Chitra East Others 0.00 0.00 0.00 0.00
1.57 3.02 -47.98 12.06 22.19 -45.660.00 0.00 0.00 0.001.57 3.02 -47.98 12.06 22.19 -45.660.75 1.03 -27.21 4.91 6.03 -18.542.32 4.05 -42.72 16.97 28.22 -39.87
Table 2.1.1 (C) : Total Coal Production ECL
FY 22 FY 21 Growth (%) M-o-M FY 22 FY 21 Growth (%)
Y-o-YRajmahal Big 0.29 2.22 -86.76 5.48 15.90 -65.57Sonepur Bazari Big 1.58 1.45 8.97 9.63 9.48 1.66Jhajhra UG Others 0.36 0.25 42.62 3.63 3.56 2.04Chitra East Others 0.13 0.10 25.70 1.00 0.87 14.44
1.87 3.67 -48.97 15.11 25.38 -40.460.49 0.36 37.66 4.63 4.43 4.482.36 4.03 -41.32 19.74 29.81 -33.781.76 1.98 -11.38 12.69 15.20 -16.514.12 6.01 -31.45 32.43 45.01 -27.95Total ECL
Mine
Mine
Mine
Type
Type
Type
Total OthersTotal Big Plus MinesTotal Rest of MinesTotal ECL
Total Rest of MinesTotal ECL
Production during the year
Total Big MinesTotal OthersTotal Big Plus MinesTotal Rest of Mines
Production during Mar
Production during Mar Production during the year
Total Big Mines
Production during Mar Production during the year
Total Big MinesTotal OthersTotal Big Plus Mines
12
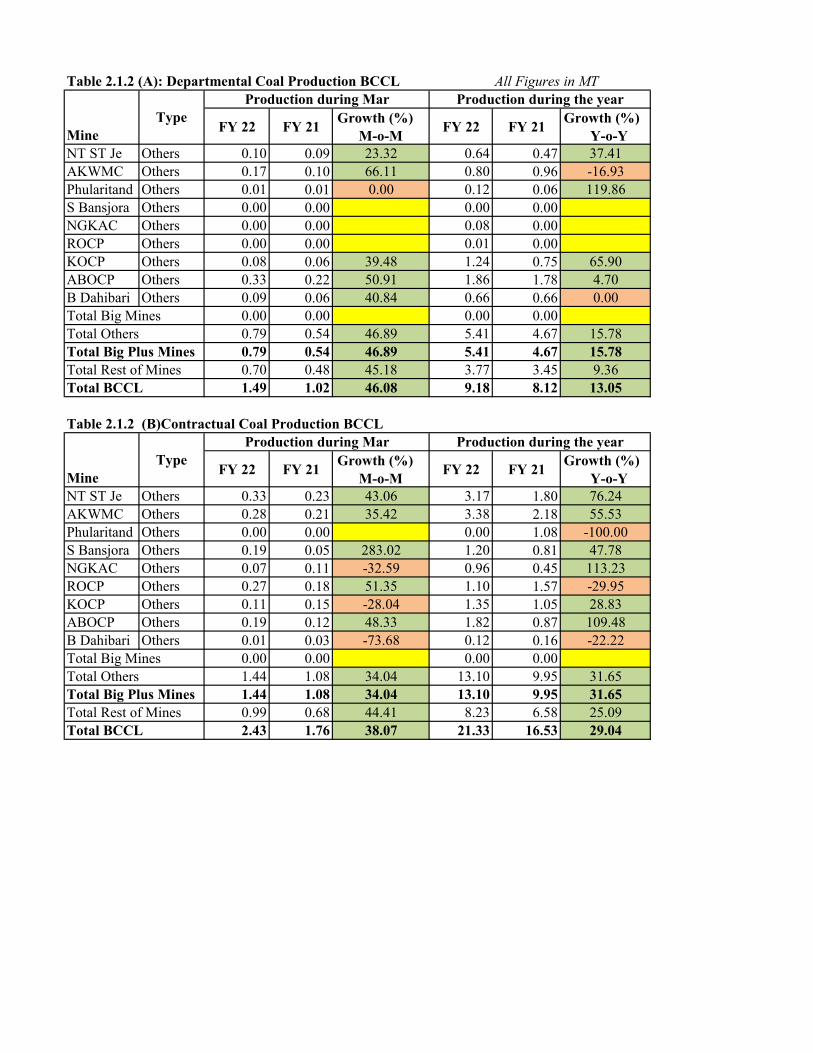
Table 2.1.2 (A): Departmental Coal Production BCCL All Figures in MT
FY 22 FY 21 Growth (%) M-o-M FY 22 FY 21 Growth (%)
Y-o-YNT ST Je Others 0.10 0.09 23.32 0.64 0.47 37.41AKWMC Others 0.17 0.10 66.11 0.80 0.96 -16.93Phularitand Others 0.01 0.01 0.00 0.12 0.06 119.86S Bansjora Others 0.00 0.00 0.00 0.00NGKAC Others 0.00 0.00 0.08 0.00ROCP Others 0.00 0.00 0.01 0.00KOCP Others 0.08 0.06 39.48 1.24 0.75 65.90ABOCP Others 0.33 0.22 50.91 1.86 1.78 4.70B Dahibari Others 0.09 0.06 40.84 0.66 0.66 0.00
0.00 0.00 0.00 0.000.79 0.54 46.89 5.41 4.67 15.780.79 0.54 46.89 5.41 4.67 15.780.70 0.48 45.18 3.77 3.45 9.361.49 1.02 46.08 9.18 8.12 13.05
Table 2.1.2 (B)Contractual Coal Production BCCL
FY 22 FY 21 Growth (%) M-o-M FY 22 FY 21 Growth (%)
Y-o-YNT ST Je Others 0.33 0.23 43.06 3.17 1.80 76.24AKWMC Others 0.28 0.21 35.42 3.38 2.18 55.53Phularitand Others 0.00 0.00 0.00 1.08 -100.00S Bansjora Others 0.19 0.05 283.02 1.20 0.81 47.78NGKAC Others 0.07 0.11 -32.59 0.96 0.45 113.23ROCP Others 0.27 0.18 51.35 1.10 1.57 -29.95KOCP Others 0.11 0.15 -28.04 1.35 1.05 28.83ABOCP Others 0.19 0.12 48.33 1.82 0.87 109.48B Dahibari Others 0.01 0.03 -73.68 0.12 0.16 -22.22
0.00 0.00 0.00 0.001.44 1.08 34.04 13.10 9.95 31.651.44 1.08 34.04 13.10 9.95 31.650.99 0.68 44.41 8.23 6.58 25.092.43 1.76 38.07 21.33 16.53 29.04
Mine
Mine
Type
Type
Total OthersTotal Big Plus MinesTotal Rest of MinesTotal BCCL
Total Rest of MinesTotal BCCL
Production during Mar Production during the year
Total Big Mines
Production during Mar Production during the year
Total Big MinesTotal OthersTotal Big Plus Mines
13

Table 2.1.2 (C)Total Coal Production BCCL
FY 22 FY 21 Growth (%) M-o-M FY 22 FY 21 Growth (%)
Y-o-YNT ST Je Others 0.44 0.32 37.74 3.81 2.26 68.24AKWMC Others 0.46 0.31 45.55 4.18 3.14 33.34Phularitand Others 0.01 0.01 0.00 0.12 1.13 -88.98S Bansjora Others 0.19 0.05 283.02 1.20 0.81 47.78NGKAC Others 0.07 0.11 -32.59 1.03 0.45 130.61ROCP Others 0.27 0.18 51.35 1.11 1.57 -29.31KOCP Others 0.19 0.21 -8.61 2.59 1.80 44.27ABOCP Others 0.52 0.34 49.98 3.68 2.65 39.18B Dahibari Others 0.09 0.09 0.00 0.78 0.82 -5.17
0.00 0.00 0.00 0.002.23 1.61 38.31 18.51 14.62 26.582.23 1.61 38.31 18.51 14.62 26.581.69 1.17 44.73 12.00 10.03 19.683.92 2.78 41.01 30.51 24.65 23.77Total BCCL
MineType
Production during the year
Total Big MinesTotal OthersTotal Big Plus MinesTotal Rest of Mines
Production during Mar
14
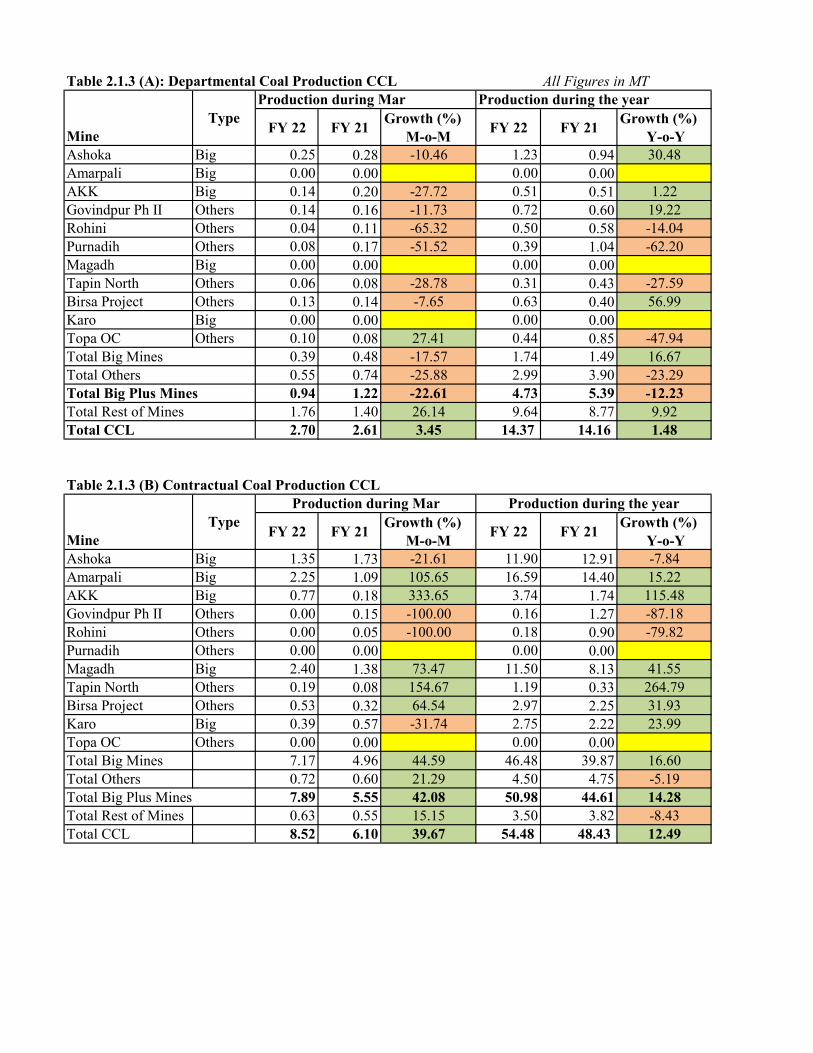
Table 2.1.3 (A): Departmental Coal Production CCL All Figures in MT
FY 22 FY 21 Growth (%) M-o-M FY 22 FY 21 Growth (%)
Y-o-YAshoka Big 0.25 0.28 -10.46 1.23 0.94 30.48Amarpali Big 0.00 0.00 0.00 0.00AKK Big 0.14 0.20 -27.72 0.51 0.51 1.22Govindpur Ph II Others 0.14 0.16 -11.73 0.72 0.60 19.22Rohini Others 0.04 0.11 -65.32 0.50 0.58 -14.04Purnadih Others 0.08 0.17 -51.52 0.39 1.04 -62.20Magadh Big 0.00 0.00 0.00 0.00Tapin North Others 0.06 0.08 -28.78 0.31 0.43 -27.59Birsa Project Others 0.13 0.14 -7.65 0.63 0.40 56.99Karo Big 0.00 0.00 0.00 0.00Topa OC Others 0.10 0.08 27.41 0.44 0.85 -47.94
0.39 0.48 -17.57 1.74 1.49 16.670.55 0.74 -25.88 2.99 3.90 -23.290.94 1.22 -22.61 4.73 5.39 -12.231.76 1.40 26.14 9.64 8.77 9.922.70 2.61 3.45 14.37 14.16 1.48
Table 2.1.3 (B) Contractual Coal Production CCL
FY 22 FY 21 Growth (%) M-o-M FY 22 FY 21 Growth (%)
Y-o-YAshoka Big 1.35 1.73 -21.61 11.90 12.91 -7.84Amarpali Big 2.25 1.09 105.65 16.59 14.40 15.22AKK Big 0.77 0.18 333.65 3.74 1.74 115.48Govindpur Ph II Others 0.00 0.15 -100.00 0.16 1.27 -87.18Rohini Others 0.00 0.05 -100.00 0.18 0.90 -79.82Purnadih Others 0.00 0.00 0.00 0.00Magadh Big 2.40 1.38 73.47 11.50 8.13 41.55Tapin North Others 0.19 0.08 154.67 1.19 0.33 264.79Birsa Project Others 0.53 0.32 64.54 2.97 2.25 31.93Karo Big 0.39 0.57 -31.74 2.75 2.22 23.99Topa OC Others 0.00 0.00 0.00 0.00Total Big Mines 7.17 4.96 44.59 46.48 39.87 16.60Total Others 0.72 0.60 21.29 4.50 4.75 -5.19Total Big Plus Mines 7.89 5.55 42.08 50.98 44.61 14.28Total Rest of Mines 0.63 0.55 15.15 3.50 3.82 -8.43Total CCL 8.52 6.10 39.67 54.48 48.43 12.49
Total Rest of MinesTotal CCL
Production during Mar Production during the year
MineType
Production during Mar Production during the year
Total Big MinesTotal OthersTotal Big Plus Mines
MineType
15

Table 2.1.3 (C) :Total Coal Production CCL
FY 22 FY 21 Growth (%) M-o-M FY 22 FY 21 Growth (%)
Y-o-YAshoka Big 1.61 2.01 -20.05 13.13 13.85 -5.24Amarpali Big 2.25 1.09 105.65 16.59 14.40 15.22AKK Big 0.91 0.38 143.81 4.25 2.24 89.60Govindpur Ph II Others 0.14 0.31 -55.29 0.88 1.87 -53.02Rohini Others 0.04 0.16 -75.48 0.68 1.49 -53.97Purnadih Others 0.08 0.17 -51.52 0.39 1.04 -62.20Magadh Big 2.40 1.38 73.47 11.50 8.13 41.55Tapin North Others 0.25 0.16 58.85 1.50 0.75 98.99Birsa Project Others 0.66 0.46 43.20 3.60 2.65 35.73Karo Big 0.39 0.57 -31.74 2.75 2.22 23.99Topa OC Others 0.10 0.08 27.41 0.44 0.85 -47.94
7.56 5.44 39.12 48.22 41.36 16.601.27 1.33 -4.77 7.49 8.65 -13.358.83 6.77 30.47 55.72 50.01 11.422.39 1.94 23.05 13.13 12.58 4.35
11.22 8.71 28.82 68.85 62.59 10.00
Total Big MinesTotal OthersTotal Big Plus MinesTotal Rest of MinesTotal CCL
Production during Mar Production during the year
MineType
16
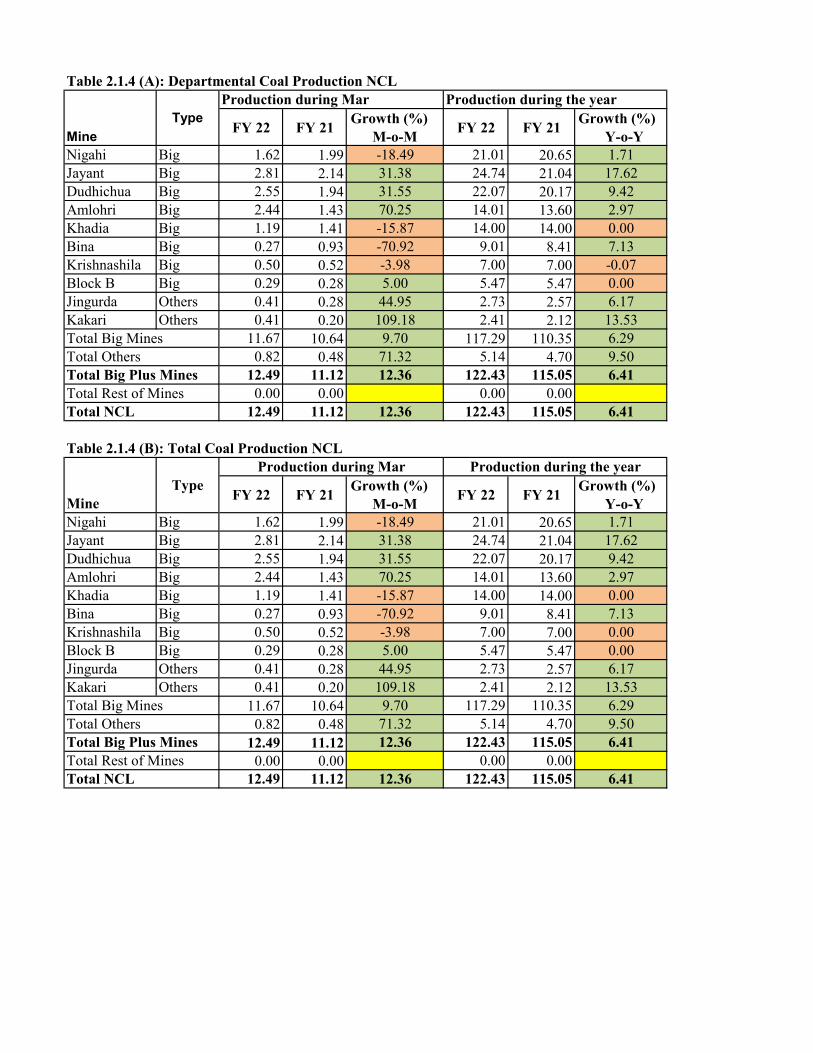
Table 2.1.4 (A): Departmental Coal Production NCL
FY 22 FY 21 Growth (%) M-o-M FY 22 FY 21 Growth (%)
Y-o-YNigahi Big 1.62 1.99 -18.49 21.01 20.65 1.71Jayant Big 2.81 2.14 31.38 24.74 21.04 17.62Dudhichua Big 2.55 1.94 31.55 22.07 20.17 9.42Amlohri Big 2.44 1.43 70.25 14.01 13.60 2.97Khadia Big 1.19 1.41 -15.87 14.00 14.00 0.00Bina Big 0.27 0.93 -70.92 9.01 8.41 7.13Krishnashila Big 0.50 0.52 -3.98 7.00 7.00 -0.07Block B Big 0.29 0.28 5.00 5.47 5.47 0.00Jingurda Others 0.41 0.28 44.95 2.73 2.57 6.17Kakari Others 0.41 0.20 109.18 2.41 2.12 13.53
11.67 10.64 9.70 117.29 110.35 6.290.82 0.48 71.32 5.14 4.70 9.50
12.49 11.12 12.36 122.43 115.05 6.410.00 0.00 -95.26 0.00 0.00 -69.95
12.49 11.12 12.36 122.43 115.05 6.41
Table 2.1.4 (B): Total Coal Production NCL
FY 22 FY 21 Growth (%) M-o-M FY 22 FY 21 Growth (%)
Y-o-YNigahi Big 1.62 1.99 -18.49 21.01 20.65 1.71Jayant Big 2.81 2.14 31.38 24.74 21.04 17.62Dudhichua Big 2.55 1.94 31.55 22.07 20.17 9.42Amlohri Big 2.44 1.43 70.25 14.01 13.60 2.97Khadia Big 1.19 1.41 -15.87 14.00 14.00 0.00Bina Big 0.27 0.93 -70.92 9.01 8.41 7.13Krishnashila Big 0.50 0.52 -3.98 7.00 7.00 0.00Block B Big 0.29 0.28 5.00 5.47 5.47 0.00Jingurda Others 0.41 0.28 44.95 2.73 2.57 6.17Kakari Others 0.41 0.20 109.18 2.41 2.12 13.53
11.67 10.64 9.70 117.29 110.35 6.290.82 0.48 71.32 5.14 4.70 9.50
12.49 11.12 12.36 122.43 115.05 6.410.00 0.00 -95.26 0.00 0.00 -100.00
12.49 11.12 12.36 122.43 115.05 6.41
Total Big MinesTotal OthersTotal Big Plus MinesTotal Rest of MinesTotal NCL
Total Big Plus MinesTotal Rest of MinesTotal NCL
Production during Mar Production during the year
MineType
Production during Mar Production during the year
Total Big MinesTotal Others
MineType
17
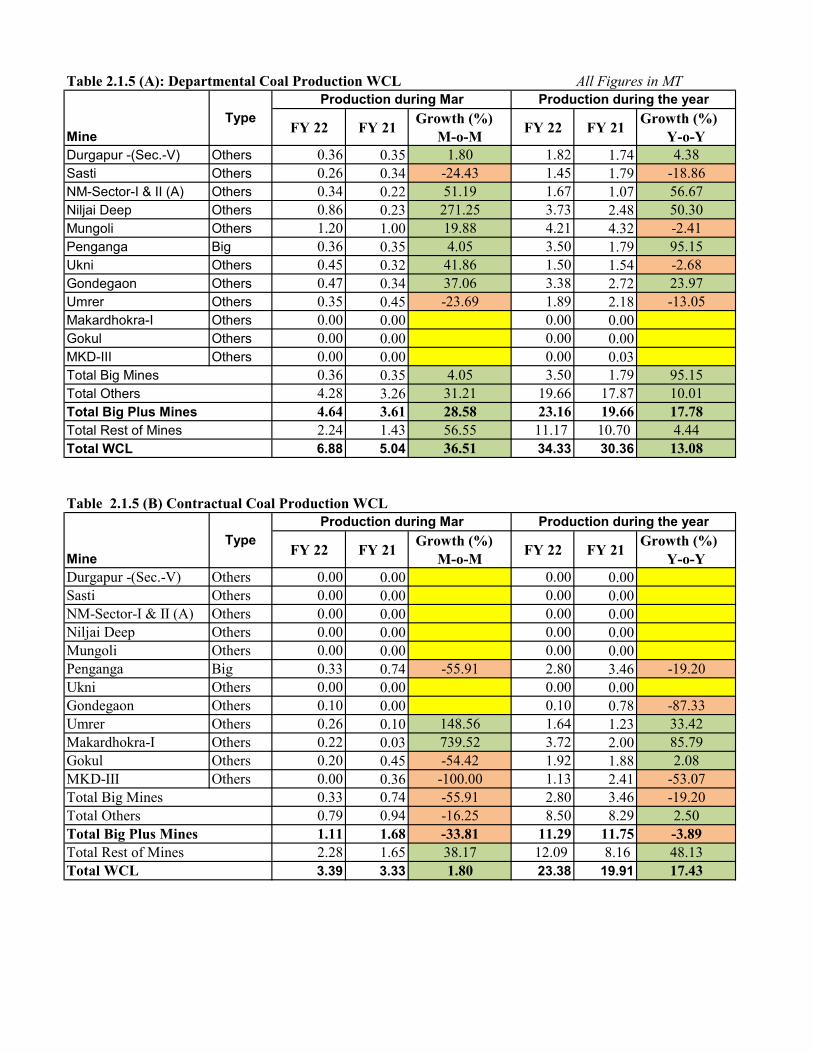
Table 2.1.5 (A): Departmental Coal Production WCL All Figures in MT
FY 22 FY 21 Growth (%) M-o-M FY 22 FY 21 Growth (%)
Y-o-YDurgapur -(Sec.-V) Others 0.36 0.35 1.80 1.82 1.74 4.38Sasti Others 0.26 0.34 -24.43 1.45 1.79 -18.86NM-Sector-I & II (A) Others 0.34 0.22 51.19 1.67 1.07 56.67Niljai Deep Others 0.86 0.23 271.25 3.73 2.48 50.30Mungoli Others 1.20 1.00 19.88 4.21 4.32 -2.41Penganga Big 0.36 0.35 4.05 3.50 1.79 95.15Ukni Others 0.45 0.32 41.86 1.50 1.54 -2.68Gondegaon Others 0.47 0.34 37.06 3.38 2.72 23.97Umrer Others 0.35 0.45 -23.69 1.89 2.18 -13.05Makardhokra-I Others 0.00 0.00 0.00 0.00Gokul Others 0.00 0.00 0.00 0.00MKD-III Others 0.00 0.00 0.00 0.03
0.36 0.35 4.05 3.50 1.79 95.154.28 3.26 31.21 19.66 17.87 10.014.64 3.61 28.58 23.16 19.66 17.782.24 1.43 56.55 11.17 10.70 4.446.88 5.04 36.51 34.33 30.36 13.08
Table 2.1.5 (B) Contractual Coal Production WCL
FY 22 FY 21 Growth (%) M-o-M FY 22 FY 21 Growth (%)
Y-o-YDurgapur -(Sec.-V) Others 0.00 0.00 0.00 0.00Sasti Others 0.00 0.00 0.00 0.00NM-Sector-I & II (A) Others 0.00 0.00 0.00 0.00Niljai Deep Others 0.00 0.00 0.00 0.00Mungoli Others 0.00 0.00 0.00 0.00Penganga Big 0.33 0.74 -55.91 2.80 3.46 -19.20Ukni Others 0.00 0.00 0.00 0.00Gondegaon Others 0.10 0.00 0.10 0.78 -87.33Umrer Others 0.26 0.10 148.56 1.64 1.23 33.42Makardhokra-I Others 0.22 0.03 739.52 3.72 2.00 85.79Gokul Others 0.20 0.45 -54.42 1.92 1.88 2.08MKD-III Others 0.00 0.36 -100.00 1.13 2.41 -53.07
0.33 0.74 -55.91 2.80 3.46 -19.200.79 0.94 -16.25 8.50 8.29 2.501.11 1.68 -33.81 11.29 11.75 -3.892.28 1.65 38.17 12.09 8.16 48.133.39 3.33 1.80 23.38 19.91 17.43
Mine
Mine
Type
Type
Total OthersTotal Big Plus MinesTotal Rest of MinesTotal WCL
Total Rest of MinesTotal WCL
Production during Mar Production during the year
Total Big Mines
Production during Mar Production during the year
Total Big MinesTotal OthersTotal Big Plus Mines
18
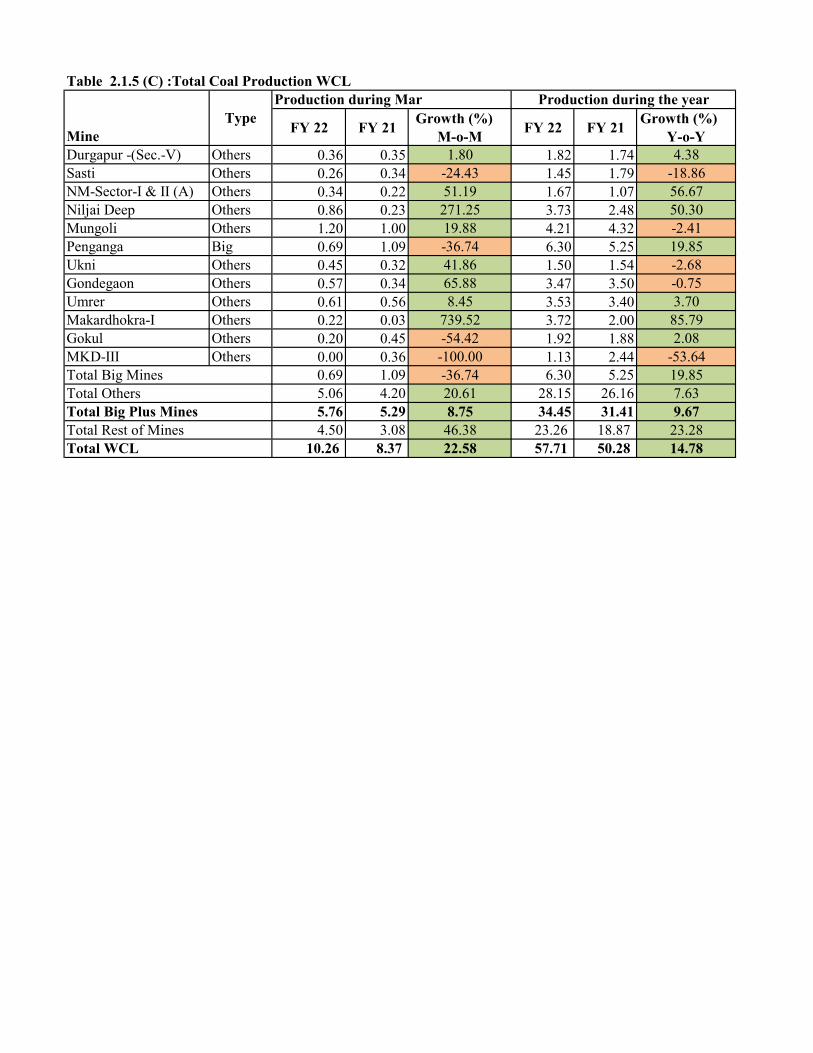
Table 2.1.5 (C) :Total Coal Production WCL
FY 22 FY 21 Growth (%) M-o-M FY 22 FY 21 Growth (%)
Y-o-YDurgapur -(Sec.-V) Others 0.36 0.35 1.80 1.82 1.74 4.38Sasti Others 0.26 0.34 -24.43 1.45 1.79 -18.86NM-Sector-I & II (A) Others 0.34 0.22 51.19 1.67 1.07 56.67Niljai Deep Others 0.86 0.23 271.25 3.73 2.48 50.30Mungoli Others 1.20 1.00 19.88 4.21 4.32 -2.41Penganga Big 0.69 1.09 -36.74 6.30 5.25 19.85Ukni Others 0.45 0.32 41.86 1.50 1.54 -2.68Gondegaon Others 0.57 0.34 65.88 3.47 3.50 -0.75Umrer Others 0.61 0.56 8.45 3.53 3.40 3.70Makardhokra-I Others 0.22 0.03 739.52 3.72 2.00 85.79Gokul Others 0.20 0.45 -54.42 1.92 1.88 2.08MKD-III Others 0.00 0.36 -100.00 1.13 2.44 -53.64
0.69 1.09 -36.74 6.30 5.25 19.855.06 4.20 20.61 28.15 26.16 7.635.76 5.29 8.75 34.45 31.41 9.674.50 3.08 46.38 23.26 18.87 23.28
10.26 8.37 22.58 57.71 50.28 14.78Total WCL
MineType
Production during the year
Total Big MinesTotal OthersTotal Big Plus MinesTotal Rest of Mines
Production during Mar
19
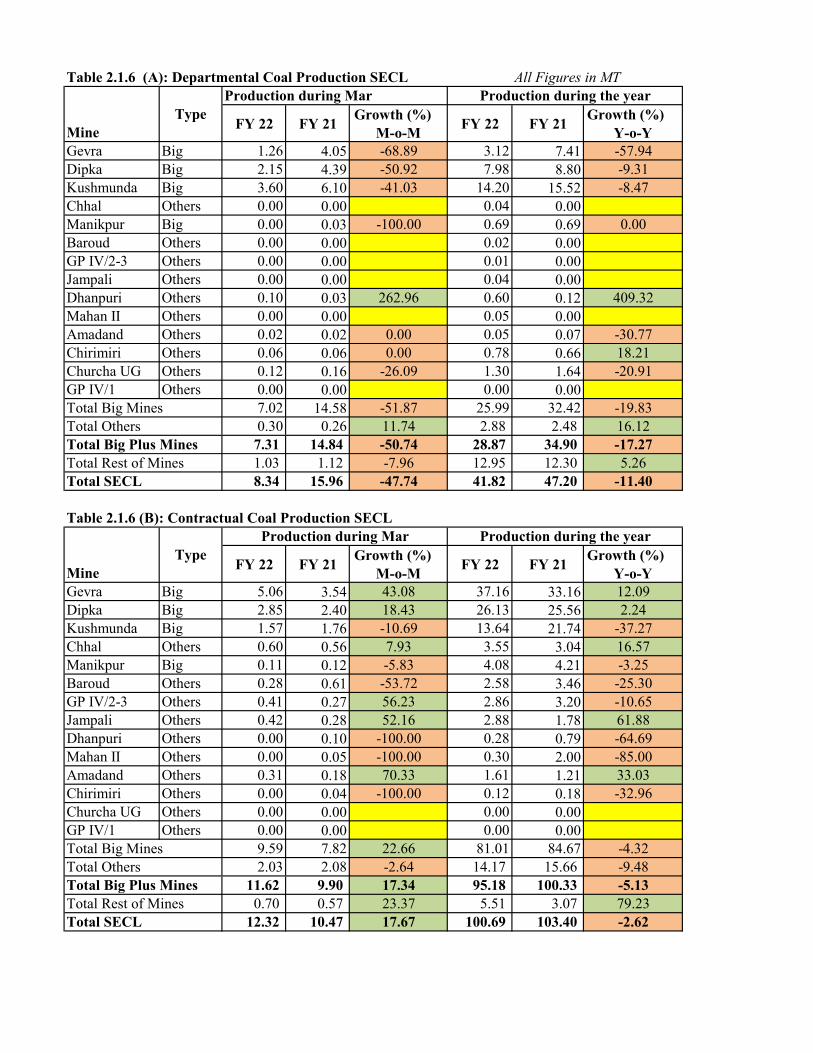
Table 2.1.6 (A): Departmental Coal Production SECL All Figures in MT
FY 22 FY 21 Growth (%) M-o-M FY 22 FY 21 Growth (%)
Y-o-YGevra Big 1.26 4.05 -68.89 3.12 7.41 -57.94Dipka Big 2.15 4.39 -50.92 7.98 8.80 -9.31Kushmunda Big 3.60 6.10 -41.03 14.20 15.52 -8.47Chhal Others 0.00 0.00 0.04 0.00 #DIV/0!Manikpur Big 0.00 0.03 -100.00 0.69 0.69 0.00Baroud Others 0.00 0.00 0.02 0.00GP IV/2-3 Others 0.00 0.00 0.01 0.00Jampali Others 0.00 0.00 0.04 0.00Dhanpuri Others 0.10 0.03 262.96 0.60 0.12 409.32Mahan II Others 0.00 0.00 0.05 0.00Amadand Others 0.02 0.02 0.00 0.05 0.07 -30.77Chirimiri Others 0.06 0.06 0.00 0.78 0.66 18.21Churcha UG Others 0.12 0.16 -26.09 1.30 1.64 -20.91GP IV/1 Others 0.00 0.00 0.00 0.00
7.02 14.58 -51.87 25.99 32.42 -19.830.30 0.26 11.74 2.88 2.48 16.127.31 14.84 -50.74 28.87 34.90 -17.271.03 1.12 -7.96 12.95 12.30 5.268.34 15.96 -47.74 41.82 47.20 -11.40
Table 2.1.6 (B): Contractual Coal Production SECL
FY 22 FY 21 Growth (%) M-o-M FY 22 FY 21 Growth (%)
Y-o-YGevra Big 5.06 3.54 43.08 37.16 33.16 12.09Dipka Big 2.85 2.40 18.43 26.13 25.56 2.24Kushmunda Big 1.57 1.76 -10.69 13.64 21.74 -37.27Chhal Others 0.60 0.56 7.93 3.55 3.04 16.57Manikpur Big 0.11 0.12 -5.83 4.08 4.21 -3.25Baroud Others 0.28 0.61 -53.72 2.58 3.46 -25.30GP IV/2-3 Others 0.41 0.27 56.23 2.86 3.20 -10.65Jampali Others 0.42 0.28 52.16 2.88 1.78 61.88Dhanpuri Others 0.00 0.10 -100.00 0.28 0.79 -64.69Mahan II Others 0.00 0.05 -100.00 0.30 2.00 -85.00Amadand Others 0.31 0.18 70.33 1.61 1.21 33.03Chirimiri Others 0.00 0.04 -100.00 0.12 0.18 -32.96Churcha UG Others 0.00 0.00 0.00 0.00GP IV/1 Others 0.00 0.00 0.00 0.00
9.59 7.82 22.66 81.01 84.67 -4.322.03 2.08 -2.64 14.17 15.66 -9.48
11.62 9.90 17.34 95.18 100.33 -5.130.70 0.57 23.37 5.51 3.07 79.23
12.32 10.47 17.67 100.69 103.40 -2.62
Mine
Mine
Type
Type
Total OthersTotal Big Plus MinesTotal Rest of MinesTotal SECL
Total Rest of MinesTotal SECL
Production during Mar Production during the year
Total Big Mines
Production during Mar Production during the year
Total Big MinesTotal OthersTotal Big Plus Mines
20

Table 2.1.6 (C): Total Coal Production SECL
FY 22 FY 21 Growth (%) M-o-M FY 22 FY 21 Growth (%)
Y-o-YGevra Big 6.32 7.59 -16.71 40.28 40.57 -0.71Dipka Big 5.00 6.79 -26.38 34.11 34.36 -0.72Kushmunda Big 5.17 7.86 -34.24 27.84 37.26 -25.28Chhal Others 0.60 0.56 7.93 3.59 3.04 17.88Manikpur Big 0.12 0.15 -24.68 4.77 4.90 -2.73Baroud Others 0.28 0.61 -53.72 2.60 3.46 -24.72GP IV/2-3 Others 0.41 0.27 56.23 2.87 3.20 -10.34Jampali Others 0.42 0.28 52.16 2.92 1.78 64.13Dhanpuri Others 0.10 0.13 -24.62 0.88 0.91 -3.29Mahan II Others 0.00 0.05 -100.00 0.35 2.00 -82.50Amadand Others 0.33 0.20 63.32 1.66 1.28 29.78Chirimiri Others 0.06 0.10 -37.00 0.90 0.84 7.28Churcha UG Others 0.12 0.16 -26.09 1.30 1.64 -20.91GP IV/1 Others 0.00 0.00 0.00 0.00
16.61 22.40 -25.85 107.00 117.09 -8.622.32 2.35 -1.02 17.06 18.14 -5.98
18.93 24.74 -23.50 124.05 135.22 -8.261.73 1.69 2.61 18.46 15.39 19.96
20.66 26.43 -21.83 142.51 150.61 -5.38Total SECL
MineType
Production during the year
Total Big MinesTotal OthersTotal Big Plus MinesTotal Rest of Mines
Production during Mar
21
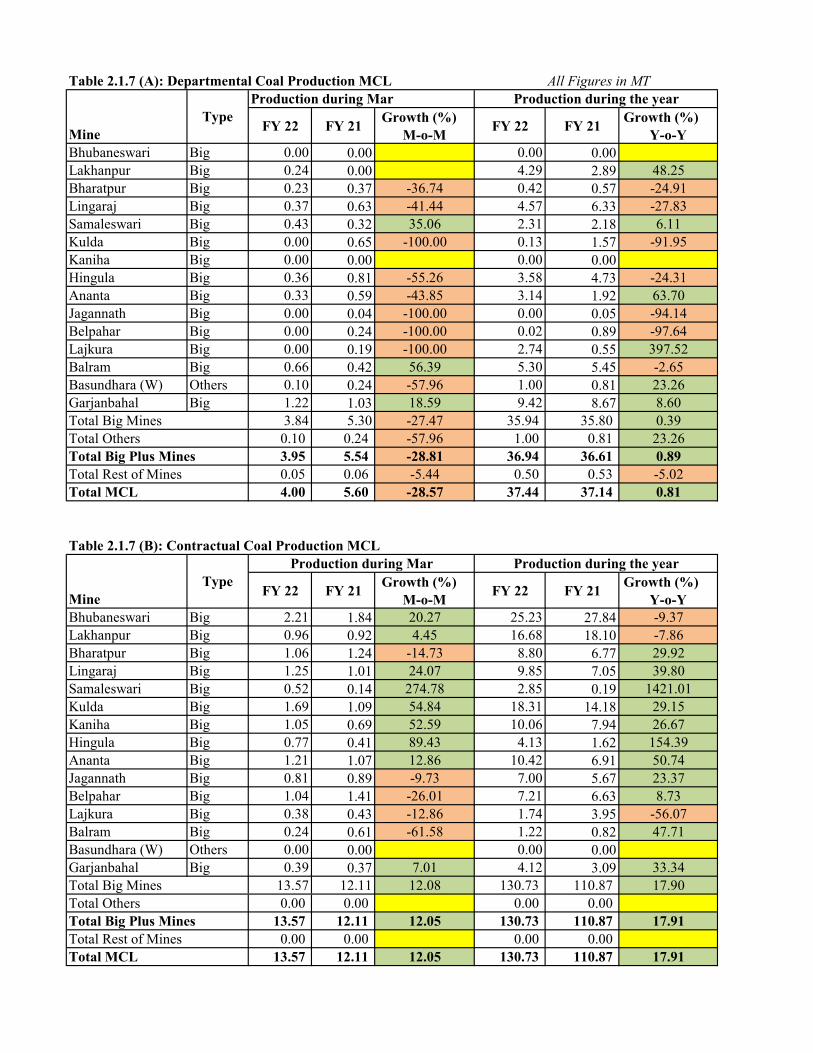
Table 2.1.7 (A): Departmental Coal Production MCL All Figures in MT
FY 22 FY 21 Growth (%) M-o-M FY 22 FY 21 Growth (%)
Y-o-YBhubaneswari Big 0.00 0.00 0.00 0.00Lakhanpur Big 0.24 0.00 4.29 2.89 48.25Bharatpur Big 0.23 0.37 -36.74 0.42 0.57 -24.91Lingaraj Big 0.37 0.63 -41.44 4.57 6.33 -27.83Samaleswari Big 0.43 0.32 35.06 2.31 2.18 6.11Kulda Big 0.00 0.65 -100.00 0.13 1.57 -91.95Kaniha Big 0.00 0.00 0.00 0.00Hingula Big 0.36 0.81 -55.26 3.58 4.73 -24.31Ananta Big 0.33 0.59 -43.85 3.14 1.92 63.70Jagannath Big 0.00 0.04 -100.00 0.00 0.05 -94.14Belpahar Big 0.00 0.24 -100.00 0.02 0.89 -97.64Lajkura Big 0.00 0.19 -100.00 2.74 0.55 397.52Balram Big 0.66 0.42 56.39 5.30 5.45 -2.65Basundhara (W) Others 0.10 0.24 -57.96 1.00 0.81 23.26Garjanbahal Big 1.22 1.03 18.59 9.42 8.67 8.60
3.84 5.30 -27.47 35.94 35.80 0.390.10 0.24 -57.96 1.00 0.81 23.263.95 5.54 -28.81 36.94 36.61 0.890.05 0.06 -5.44 0.50 0.53 -5.024.00 5.60 -28.57 37.44 37.14 0.81
Table 2.1.7 (B): Contractual Coal Production MCL
FY 22 FY 21 Growth (%) M-o-M FY 22 FY 21 Growth (%)
Y-o-YBhubaneswari Big 2.21 1.84 20.27 25.23 27.84 -9.37Lakhanpur Big 0.96 0.92 4.45 16.68 18.10 -7.86Bharatpur Big 1.06 1.24 -14.73 8.80 6.77 29.92Lingaraj Big 1.25 1.01 24.07 9.85 7.05 39.80Samaleswari Big 0.52 0.14 274.78 2.85 0.19 1421.01Kulda Big 1.69 1.09 54.84 18.31 14.18 29.15Kaniha Big 1.05 0.69 52.59 10.06 7.94 26.67Hingula Big 0.77 0.41 89.43 4.13 1.62 154.39Ananta Big 1.21 1.07 12.86 10.42 6.91 50.74Jagannath Big 0.81 0.89 -9.73 7.00 5.67 23.37Belpahar Big 1.04 1.41 -26.01 7.21 6.63 8.73Lajkura Big 0.38 0.43 -12.86 1.74 3.95 -56.07Balram Big 0.24 0.61 -61.58 1.22 0.82 47.71Basundhara (W) Others 0.00 0.00 0.00 0.00Garjanbahal Big 0.39 0.37 7.01 4.12 3.09 33.34
13.57 12.11 12.08 130.73 110.87 17.900.00 0.00 0.00 0.00
13.57 12.11 12.05 130.73 110.87 17.910.00 0.00 0.00 0.00 -225.27
13.57 12.11 12.05 130.73 110.87 17.91
Mine
Mine
Type
Type
Total OthersTotal Big Plus MinesTotal Rest of MinesTotal MCL
Total Rest of MinesTotal MCL
Production during Mar Production during the year
Total Big Mines
Production during Mar Production during the year
Total Big MinesTotal OthersTotal Big Plus Mines
22

Table 2.1.7 (C): Total Coal Production MCL
FY 22 FY 21 Growth (%) M-o-M
Growth (%) Y-o-Y
Bhubaneswari Big 2.21 1.84 20.27 25.23 27.84 -9.37Lakhanpur Big 1.19 0.92 30.20 20.97 20.99 -0.12Bharatpur Big 1.30 1.62 -19.78 9.23 7.34 25.70Lingaraj Big 1.62 1.63 -1.13 14.42 13.38 7.78Samaleswari Big 0.95 0.46 107.46 5.16 2.37 118.21Kulda Big 1.69 1.74 -2.81 18.44 15.75 17.08Kaniha Big 1.05 0.69 52.59 10.06 7.94 26.67Hingula Big 1.13 1.22 -7.11 7.71 6.35 21.35Ananta Big 1.55 1.67 -7.34 13.56 8.83 53.55Jagannath Big 0.81 0.94 -14.05 7.00 5.72 22.39Belpahar Big 1.04 1.65 -36.77 7.23 7.52 -3.80Lajkura Big 0.38 0.63 -39.84 4.48 4.50 -0.54Balram Big 0.89 1.04 -13.57 6.52 6.27 3.96Basundhara (W) Others 0.10 0.24 -57.96 1.00 0.81 23.26Garjanbahal Big 1.61 1.39 15.54 13.54 11.77 15.10
17.41 17.40 0.04 166.66 146.67 13.630.10 0.24 -57.96 1.00 0.81 23.26
17.51 17.65 -0.77 167.66 147.48 13.680.05 0.06 -19.70 0.50 0.53 -5.30
17.57 17.71 -0.79 168.17 148.01 13.62Total MCL
MineType
Production during the year
Total Big MinesTotal OthersTotal Big Plus MinesTotal Rest of Mines
Production during Mar
23
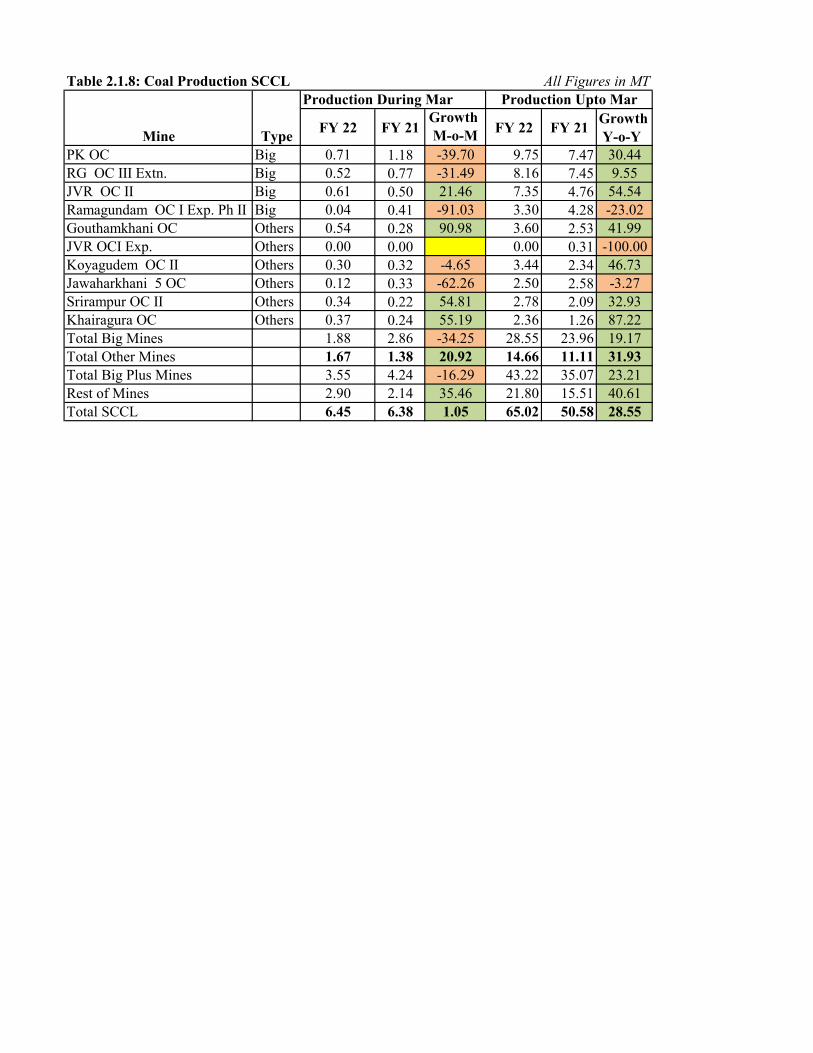
Table 2.1.8: Coal Production SCCL
FY 22 FY 21Growth M-o-M FY 22 FY 21 Growth
Y-o-YPK OC Big 0.71 1.18 -39.70 9.75 7.47 30.44RG OC III Extn. Big 0.52 0.77 -31.49 8.16 7.45 9.55JVR OC II Big 0.61 0.50 21.46 7.35 4.76 54.54Ramagundam OC I Exp. Ph II Big 0.04 0.41 -91.03 3.30 4.28 -23.02Gouthamkhani OC Others 0.54 0.28 90.98 3.60 2.53 41.99JVR OCI Exp. Others 0.00 0.00 0.00 0.31 -100.00Koyagudem OC II Others 0.30 0.32 -4.65 3.44 2.34 46.73Jawaharkhani 5 OC Others 0.12 0.33 -62.26 2.50 2.58 -3.27Srirampur OC II Others 0.34 0.22 54.81 2.78 2.09 32.93Khairagura OC Others 0.37 0.24 55.19 2.36 1.26 87.22Total Big Mines 1.88 2.86 -34.25 28.55 23.96 19.17Total Other Mines 1.67 1.38 20.92 14.66 11.11 31.93Total Big Plus Mines 3.55 4.24 -16.29 43.22 35.07 23.21Rest of Mines 2.90 2.14 35.46 21.80 15.51 40.61Total SCCL 6.45 6.38 1.05 65.02 50.58 28.55
All Figures in MTProduction During Mar Production Upto Mar
Mine Type
24
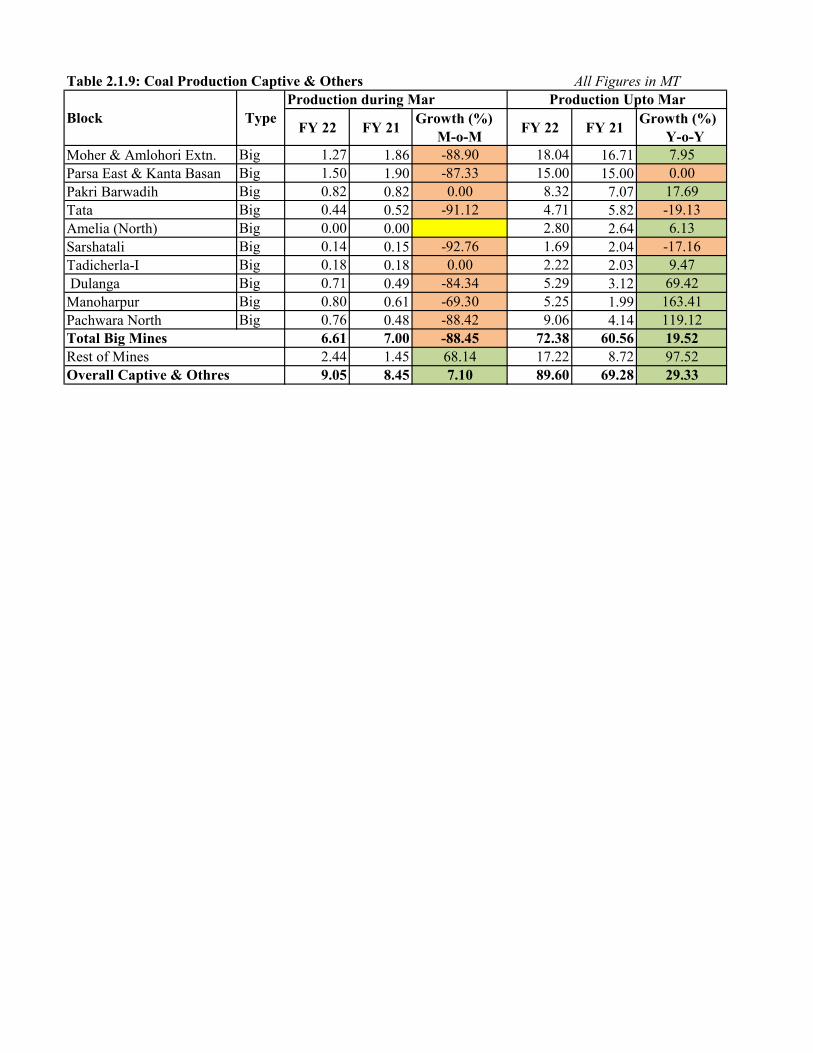
Table 2.1.9: Coal Production Captive & Others All Figures in MT
FY 22 FY 21 Growth (%) M-o-M FY 22 FY 21 Growth (%)
Y-o-YMoher & Amlohori Extn. Big 1.27 1.86 -88.90 18.04 16.71 7.95Parsa East & Kanta Basan Big 1.50 1.90 -87.33 15.00 15.00 0.00Pakri Barwadih Big 0.82 0.82 0.00 8.32 7.07 17.69Tata Big 0.44 0.52 -91.12 4.71 5.82 -19.13Amelia (North) Big 0.00 0.00 -100.00 2.80 2.64 6.13Sarshatali Big 0.14 0.15 -92.76 1.69 2.04 -17.16Tadicherla-I Big 0.18 0.18 0.00 2.22 2.03 9.47 Dulanga Big 0.71 0.49 -84.34 5.29 3.12 69.42Manoharpur Big 0.80 0.61 -69.30 5.25 1.99 163.41Pachwara North Big 0.76 0.48 -88.42 9.06 4.14 119.12
6.61 7.00 -88.45 72.38 60.56 19.522.44 1.45 68.14 17.22 8.72 97.529.05 8.45 7.10 89.60 69.28 29.33
Production during Mar Production Upto Mar
Total Big MinesRest of MinesOverall Captive & Othres
Block Type
25
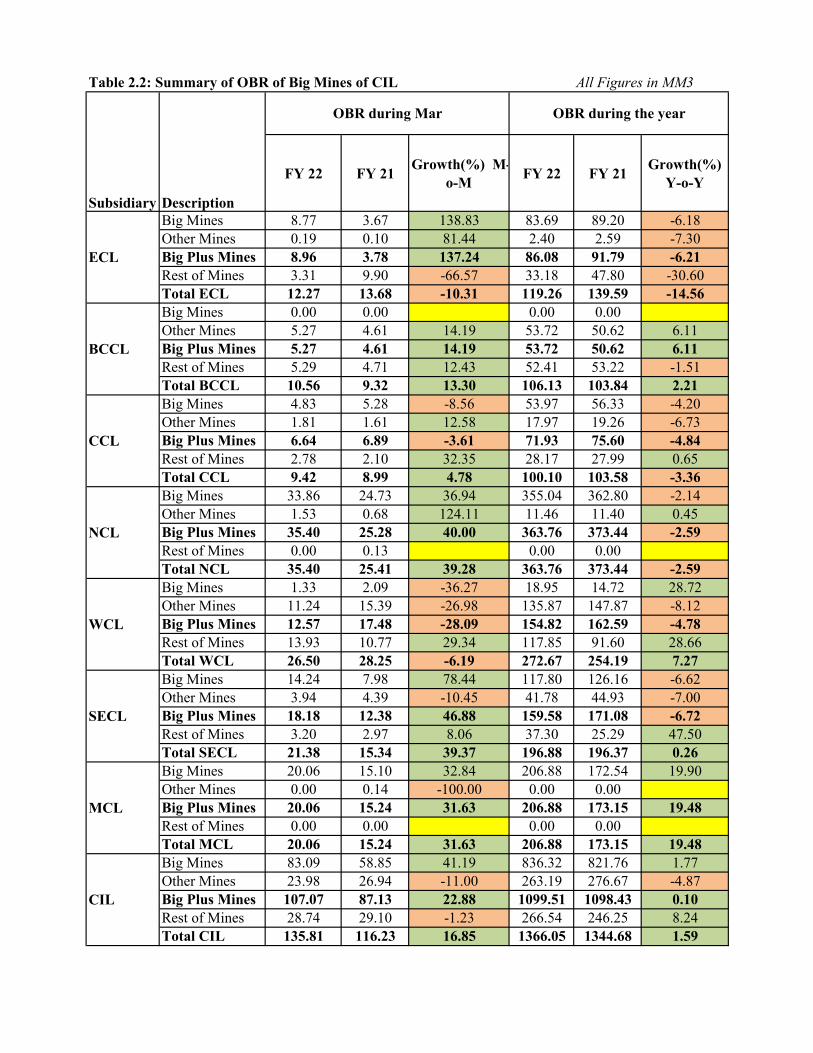
Table 2.2: Summary of OBR of Big Mines of CIL All Figures in MM3
FY 22 FY 21 Growth(%) M-o-M FY 22 FY 21 Growth(%)
Y-o-Y
8.77 3.67 138.83 83.69 89.20 -6.180.19 0.10 81.44 2.40 2.59 -7.308.96 3.78 137.24 86.08 91.79 -6.213.31 9.90 -66.57 33.18 47.80 -30.6012.27 13.68 -10.31 119.26 139.59 -14.560.00 0.00 0.00 0.005.27 4.61 14.19 53.72 50.62 6.115.27 4.61 14.19 53.72 50.62 6.115.29 4.71 12.43 52.41 53.22 -1.5110.56 9.32 13.30 106.13 103.84 2.214.83 5.28 -8.56 53.97 56.33 -4.201.81 1.61 12.58 17.97 19.26 -6.736.64 6.89 -3.61 71.93 75.60 -4.842.78 2.10 32.35 28.17 27.99 0.659.42 8.99 4.78 100.10 103.58 -3.3633.86 24.73 36.94 355.04 362.80 -2.141.53 0.68 124.11 11.46 11.40 0.45
35.40 25.28 40.00 363.76 373.44 -2.590.00 0.13 0.00 0.0035.40 25.41 39.28 363.76 373.44 -2.591.33 2.09 -36.27 18.95 14.72 28.72
11.24 15.39 -26.98 135.87 147.87 -8.1212.57 17.48 -28.09 154.82 162.59 -4.7813.93 10.77 29.34 117.85 91.60 28.6626.50 28.25 -6.19 272.67 254.19 7.2714.24 7.98 78.44 117.80 126.16 -6.623.94 4.39 -10.45 41.78 44.93 -7.00
18.18 12.38 46.88 159.58 171.08 -6.723.20 2.97 8.06 37.30 25.29 47.5021.38 15.34 39.37 196.88 196.37 0.2620.06 15.10 32.84 206.88 172.54 19.900.00 0.14 -100.00 0.00 0.00 #DIV/0!20.06 15.24 31.63 206.88 173.15 19.480.00 0.00 0.00 0.0020.06 15.24 31.63 206.88 173.15 19.4883.09 58.85 41.19 836.32 821.76 1.7723.98 26.94 -11.00 263.19 276.67 -4.87
107.07 87.13 22.88 1099.51 1098.43 0.1028.74 29.10 -1.23 266.54 246.25 8.24
135.81 116.23 16.85 1366.05 1344.68 1.59
Big Plus Mines
Rest of Mines
Big Plus Mines
Big Plus Mines
Rest of Mines
Rest of Mines
Big Plus Mines
Other Mines
Big Plus Mines
OBR during Mar
Total WCL
Other Mines
NCL
Big Mines
Other Mines
Subsidiary
Big Mines
Big MinesDescription
Total ECLRest of MinesBig Plus MinesECL
Total NCL
WCL
SECL
Other Mines
Other Mines
Big Mines
Big Mines
Rest of Mines
Big Plus Mines
Other Mines
Total BCCL
Rest of MinesTotal MCL
Total SECL
Total CIL
OBR during the year
MCL
Rest of Mines
CIL
Big Mines
BCCL
CCL
Big MinesTotal CCL
Big Plus Mines
Other Mines
Other Mines
Rest of Mines
Big Mines
26
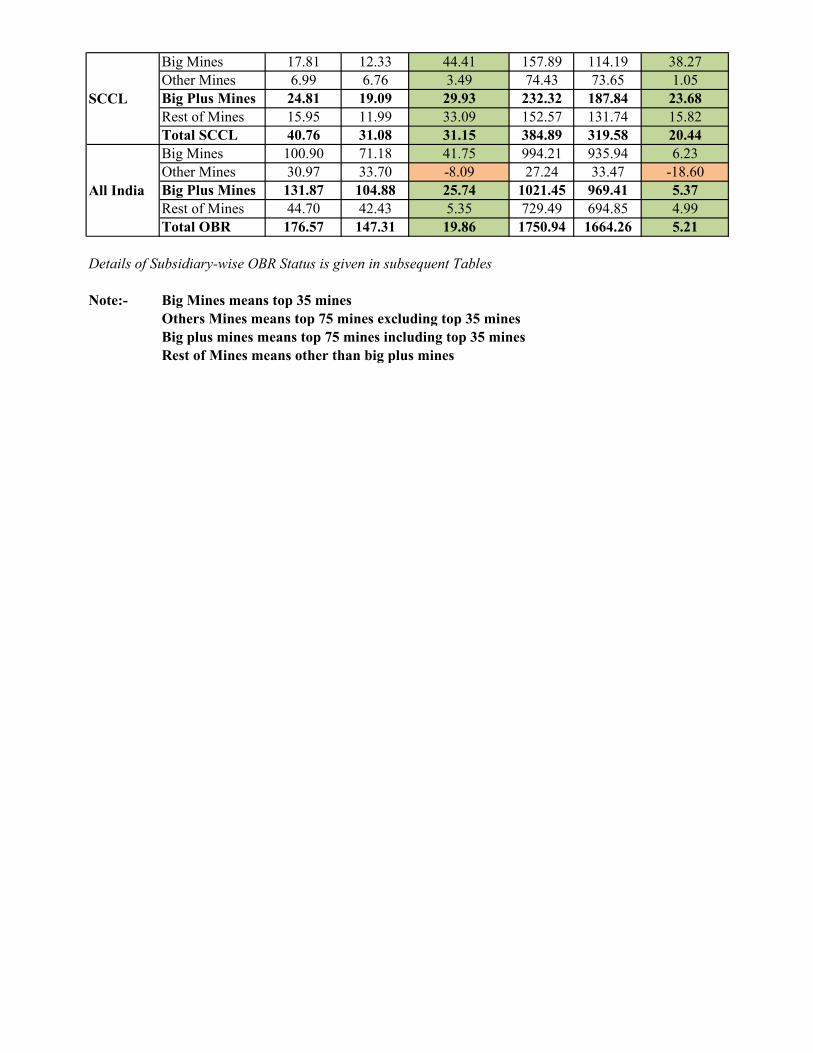
17.81 12.33 44.41 157.89 114.19 38.276.99 6.76 3.49 74.43 73.65 1.0524.81 19.09 29.93 232.32 187.84 23.6815.95 11.99 33.09 152.57 131.74 15.8240.76 31.08 31.15 384.89 319.58 20.44
100.90 71.18 41.75 994.21 935.94 6.2330.97 33.70 -8.09 27.24 33.47 -18.60
131.87 104.88 25.74 1021.45 969.41 5.3744.70 42.43 5.35 729.49 694.85 4.99
176.57 147.31 19.86 1750.94 1664.26 5.21
Details of Subsidiary-wise OBR Status is given in subsequent Tables
Note:- Big Mines means top 35 minesOthers Mines means top 75 mines excluding top 35 minesBig plus mines means top 75 mines including top 35 minesRest of Mines means other than big plus mines
SCCL
All IndiaRest of MinesTotal OBR
Other Mines
Total SCCLRest of Mines
Other MinesBig Plus Mines
Big Plus Mines
Big Mines
Big Mines
27
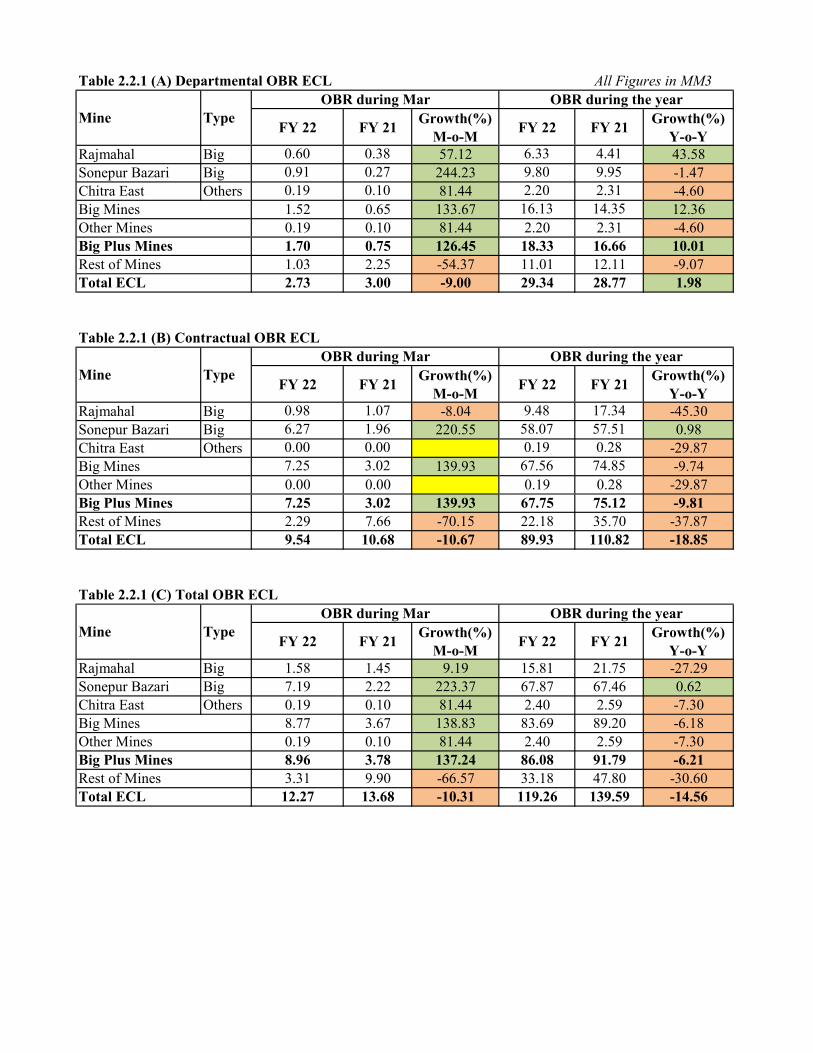
Table 2.2.1 (A) Departmental OBR ECL
FY 22 FY 21 Growth(%) M-o-M FY 22 FY 21 Growth(%)
Y-o-YRajmahal Big 0.60 0.38 57.12 6.33 4.41 43.58Sonepur Bazari Big 0.91 0.27 244.23 9.80 9.95 -1.47Chitra East Others 0.19 0.10 81.44 2.20 2.31 -4.60
1.52 0.65 133.67 16.13 14.35 12.360.19 0.10 81.44 2.20 2.31 -4.601.70 0.75 126.45 18.33 16.66 10.011.03 2.25 -54.37 11.01 12.11 -9.072.73 3.00 -9.00 29.34 28.77 1.98
Table 2.2.1 (B) Contractual OBR ECL
FY 22 FY 21 Growth(%) M-o-M FY 22 FY 21 Growth(%)
Y-o-YRajmahal Big 0.98 1.07 -8.04 9.48 17.34 -45.30Sonepur Bazari Big 6.27 1.96 220.55 58.07 57.51 0.98Chitra East Others 0.00 0.00 0.19 0.28 -29.87
7.25 3.02 139.93 67.56 74.85 -9.740.00 0.00 0.19 0.28 -29.877.25 3.02 139.93 67.75 75.12 -9.812.29 7.66 -70.15 22.18 35.70 -37.879.54 10.68 -10.67 89.93 110.82 -18.85
Table 2.2.1 (C) Total OBR ECL
FY 22 FY 21 Growth(%) M-o-M FY 22 FY 21 Growth(%)
Y-o-YRajmahal Big 1.58 1.45 9.19 15.81 21.75 -27.29Sonepur Bazari Big 7.19 2.22 223.37 67.87 67.46 0.62Chitra East Others 0.19 0.10 81.44 2.40 2.59 -7.30
8.77 3.67 138.83 83.69 89.20 -6.180.19 0.10 81.44 2.40 2.59 -7.308.96 3.78 137.24 86.08 91.79 -6.213.31 9.90 -66.57 33.18 47.80 -30.6012.27 13.68 -10.31 119.26 139.59 -14.56Total ECL
Big Plus MinesRest of Mines
Big Mines
Mine
Total ECL
Type
Type
Total ECL
Big Plus MinesRest of Mines
Other Mines
All Figures in MM3
OBR during the year
Rest of Mines
Big Mines
OBR during Mar
Big Plus Mines
Other Mines
Other Mines
OBR during the yearOBR during Mar
OBR during the year
Big Mines
MineOBR during Mar
TypeMine
28
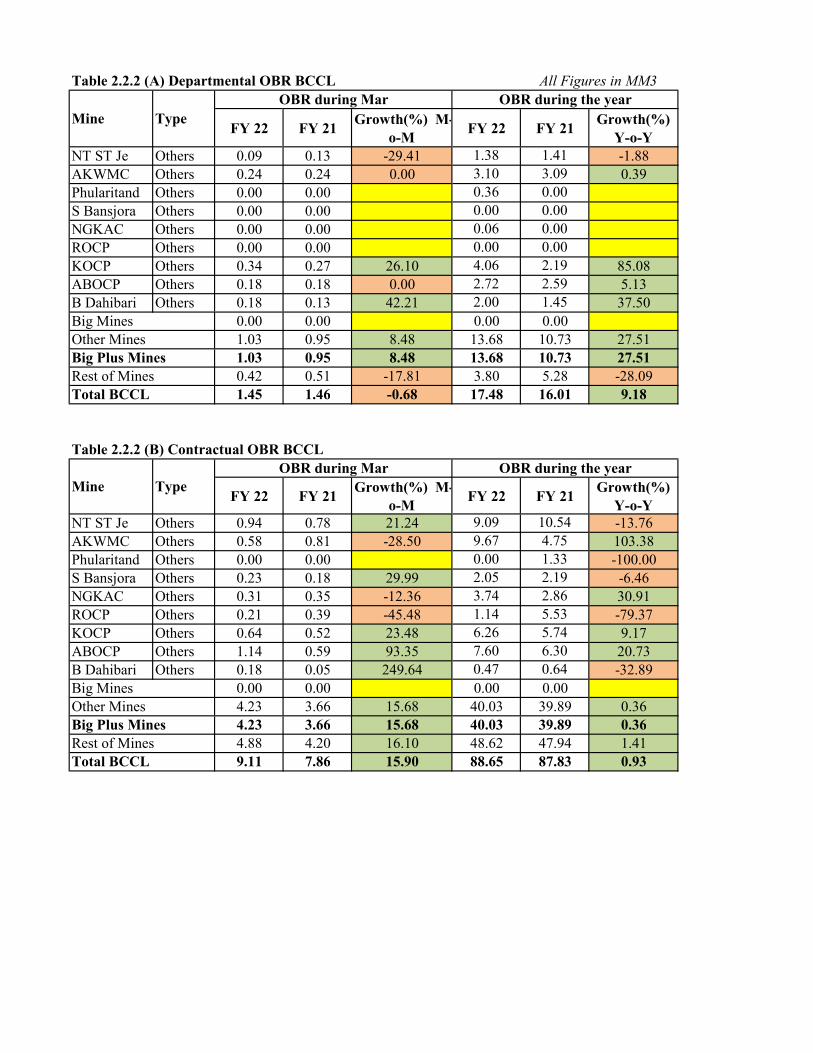
Table 2.2.2 (A) Departmental OBR BCCL
FY 22 FY 21 Growth(%) M-o-M FY 22 FY 21 Growth(%)
Y-o-YNT ST Je Others 0.09 0.13 -29.41 1.38 1.41 -1.88AKWMC Others 0.24 0.24 0.00 3.10 3.09 0.39Phularitand Others 0.00 0.00 0.36 0.00S Bansjora Others 0.00 0.00 0.00 0.00NGKAC Others 0.00 0.00 0.06 0.00ROCP Others 0.00 0.00 0.00 0.00KOCP Others 0.34 0.27 26.10 4.06 2.19 85.08ABOCP Others 0.18 0.18 0.00 2.72 2.59 5.13B Dahibari Others 0.18 0.13 42.21 2.00 1.45 37.50
0.00 0.00 0.00 0.001.03 0.95 8.48 13.68 10.73 27.511.03 0.95 8.48 13.68 10.73 27.510.42 0.51 -17.81 3.80 5.28 -28.091.45 1.46 -0.68 17.48 16.01 9.18
Table 2.2.2 (B) Contractual OBR BCCL
FY 22 FY 21 Growth(%) M-o-M FY 22 FY 21 Growth(%)
Y-o-YNT ST Je Others 0.94 0.78 21.24 9.09 10.54 -13.76AKWMC Others 0.58 0.81 -28.50 9.67 4.75 103.38Phularitand Others 0.00 0.00 0.00 1.33 -100.00S Bansjora Others 0.23 0.18 29.99 2.05 2.19 -6.46NGKAC Others 0.31 0.35 -12.36 3.74 2.86 30.91ROCP Others 0.21 0.39 -45.48 1.14 5.53 -79.37KOCP Others 0.64 0.52 23.48 6.26 5.74 9.17ABOCP Others 1.14 0.59 93.35 7.60 6.30 20.73B Dahibari Others 0.18 0.05 249.64 0.47 0.64 -32.89
0.00 0.00 0.00 0.004.23 3.66 15.68 40.03 39.89 0.364.23 3.66 15.68 40.03 39.89 0.364.88 4.20 16.10 48.62 47.94 1.419.11 7.86 15.90 88.65 87.83 0.93
Other Mines
Total BCCL
OBR during Mar
Big Plus Mines
All Figures in MM3
Big Plus MinesRest of Mines
Type
Other Mines
OBR during the year
Total BCCL
MineOBR during Mar
Big Mines
OBR during the year
Rest of Mines
TypeMine
Big Mines
29

Table 2.2.2 (C) Total OBR BCCL
FY 22 FY 21 Growth(%) M-o-M FY 22 FY 21 Growth(%)
Y-o-YNT ST Je Others 1.04 0.91 13.90 10.48 11.95 -12.36AKWMC Others 0.81 1.05 -22.44 12.77 7.84 62.81Phularitand Others 0.00 0.00 0.36 1.33 -72.75S Bansjora Others 0.23 0.18 29.99 0.60 2.19 -72.80NGKAC Others 0.31 0.35 -12.36 3.80 2.86 32.96ROCP Others 0.21 0.39 -45.48 1.14 5.53 -79.37KOCP Others 0.98 0.79 24.38 10.32 7.93 30.18ABOCP Others 1.32 0.77 71.86 10.32 8.89 16.19B Dahibari Others 0.36 0.18 102.70 2.47 2.09 18.10
0.00 0.00 0.00 0.005.27 4.61 14.19 53.72 50.62 6.115.27 4.61 14.19 53.72 50.62 6.115.29 4.71 12.43 52.41 53.22 -1.5110.56 9.32 13.30 106.13 103.84 2.21
Big Plus MinesOther Mines
Mine
Big Mines
Total BCCLRest of Mines
TypeOBR during Mar OBR during the year
30

Table 2.2.3 (A) Departmental OBR CCL
FY 22 FY 21 Growth(%) M-o-M FY 22 FY 21 Growth(%)
Y-o-YAshoka Big 0.10 0.13 -20.08 1.64 1.32 24.43Piparwar Big 0.00 0.00 0.00 0.46Amarpali Big 0.00 0.00 0.00 0.00AKK Big 0.07 0.08 -22.38 1.59 2.36Govindpur Ph II Others 0.11 0.11 -1.35 1.14 1.23 -7.20Rohini Others 0.12 0.18 -35.39 0.96 1.62 -40.40Purnadih Others 0.21 0.13 59.61 1.54 2.10 -26.84Magadh Big 0.00 0.00 0.00 0.00Tapin North Others 0.04 0.08 -43.42 0.68 1.50Birsa Project Others 0.12 0.03 244.12 1.44 1.06 35.37Karo Big 0.00 0.00 0.00 0.00Topa OC Others 0.07 0.00 0.62 0.00
0.17 0.21 -21.00 3.23 4.14 -22.080.67 0.53 25.68 6.38 7.51 -15.080.83 0.74 12.43 9.60 11.65 -17.571.43 1.53 -6.67 18.28 23.06 -20.742.26 2.27 -0.44 27.88 34.71 -19.68
Table 2.2.3 (B) Contractual OBR CCL
FY 22 FY 21 Growth(%) M-o-M FY 22 FY 21 Growth(%)
Y-o-YAshoka Big 0.99 1.86 -46.52 12.39 18.19 -31.88Piparwar Big 0.00 0.00 0.00 0.89Amarpali Big 1.63 1.30 25.02 15.82 18.58 -14.84AKK Big 0.60 0.51 18.06 6.67 2.36 182.62Govindpur Ph II Others 0.00 0.17 -100.00 0.18 2.41 -92.74Rohini Others 0.00 0.00 0.00 0.64 -100.00Purnadih Others 0.00 0.00 0.00 0.00Magadh Big 1.29 1.25 2.79 14.30 9.94 43.81Tapin North Others 0.51 0.33 54.53 4.84 1.72 181.30Birsa Project Others 0.61 0.46 34.80 6.31 4.52 39.65Karo Big 0.15 0.15 0.00 1.56 2.23 -30.06Topa OC Others 0.02 0.13 -84.72 0.27 2.47 -89.09
4.66 5.07 -8.04 50.74 52.19 -2.781.15 1.08 6.16 11.59 11.75 -1.395.81 6.15 -5.54 62.33 63.95 -2.531.36 0.57 139.02 9.89 4.93 100.817.17 6.72 6.70 72.22 68.87 4.86
OBR during the yearMine
OBR during Mar
Rest of Mines
Type
Total CCL
Type
Total CCL
Other MinesBig Plus MinesRest of Mines
Big Mines
All Figures in MM3
Mine
Other MinesBig Plus Mines
Big Mines
OBR during the yearOBR during Mar
31
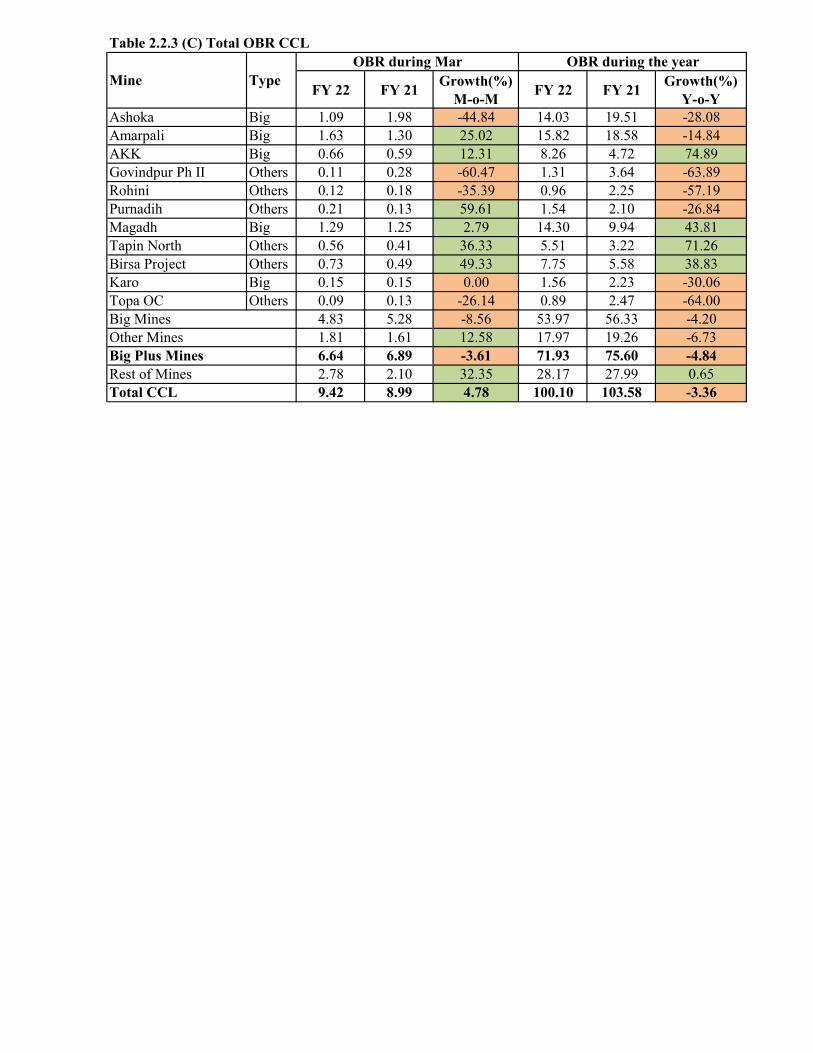
Table 2.2.3 (C) Total OBR CCL
FY 22 FY 21 Growth(%) M-o-M FY 22 FY 21 Growth(%)
Y-o-YAshoka Big 1.09 1.98 -44.84 14.03 19.51 -28.08Amarpali Big 1.63 1.30 25.02 15.82 18.58 -14.84AKK Big 0.66 0.59 12.31 8.26 4.72 74.89Govindpur Ph II Others 0.11 0.28 -60.47 1.31 3.64 -63.89Rohini Others 0.12 0.18 -35.39 0.96 2.25 -57.19Purnadih Others 0.21 0.13 59.61 1.54 2.10 -26.84Magadh Big 1.29 1.25 2.79 14.30 9.94 43.81Tapin North Others 0.56 0.41 36.33 5.51 3.22 71.26Birsa Project Others 0.73 0.49 49.33 7.75 5.58 38.83Karo Big 0.15 0.15 0.00 1.56 2.23 -30.06Topa OC Others 0.09 0.13 -26.14 0.89 2.47 -64.00
4.83 5.28 -8.56 53.97 56.33 -4.201.81 1.61 12.58 17.97 19.26 -6.736.64 6.89 -3.61 71.93 75.60 -4.842.78 2.10 32.35 28.17 27.99 0.659.42 8.99 4.78 100.10 103.58 -3.36
Other Mines
OBR during the yearOBR during MarType
Total CCL
Big Mines
Big Plus MinesRest of Mines
Mine
32
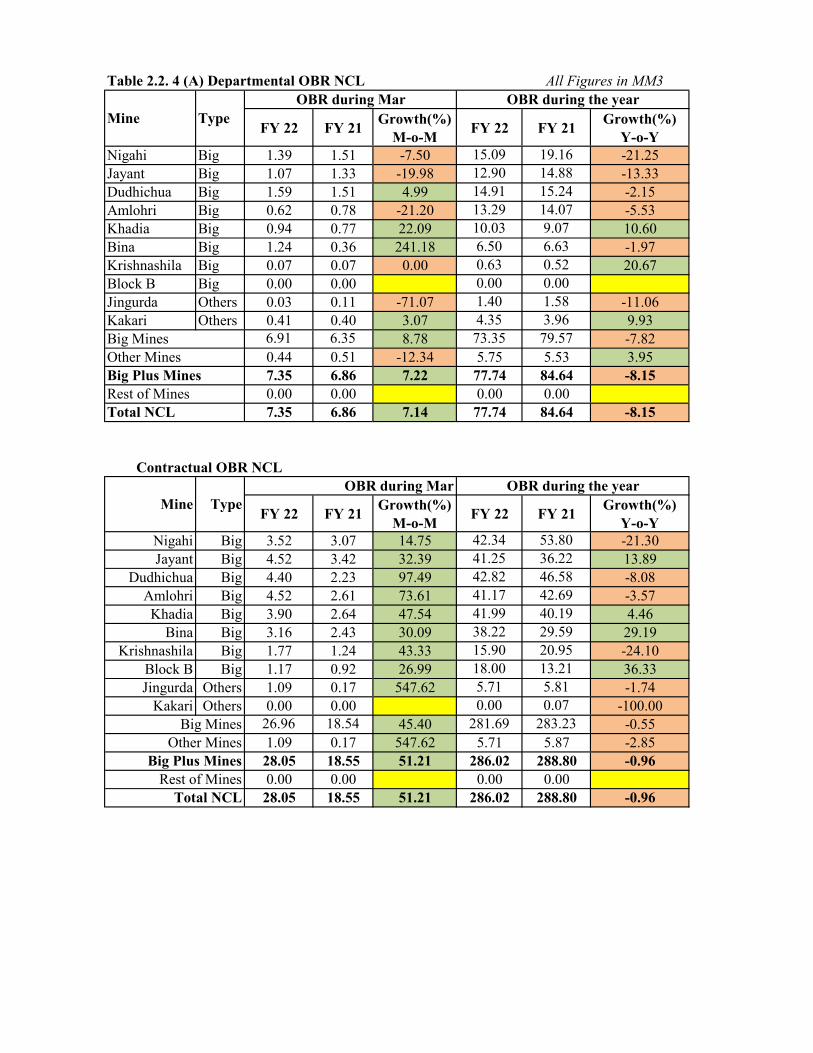
Table 2.2. 4 (A) Departmental OBR NCL
FY 22 FY 21 Growth(%) M-o-M FY 22 FY 21 Growth(%)
Y-o-YNigahi Big 1.39 1.51 -7.50 15.09 19.16 -21.25Jayant Big 1.07 1.33 -19.98 12.90 14.88 -13.33Dudhichua Big 1.59 1.51 4.99 14.91 15.24 -2.15Amlohri Big 0.62 0.78 -21.20 13.29 14.07 -5.53Khadia Big 0.94 0.77 22.09 10.03 9.07 10.60Bina Big 1.24 0.36 241.18 6.50 6.63 -1.97Krishnashila Big 0.07 0.07 0.00 0.63 0.52 20.67Block B Big 0.00 0.00 0.00 0.00Jingurda Others 0.03 0.11 -71.07 1.40 1.58 -11.06Kakari Others 0.41 0.40 3.07 4.35 3.96 9.93
6.91 6.35 8.78 73.35 79.57 -7.820.44 0.51 -12.34 5.75 5.53 3.957.35 6.86 7.22 77.74 84.64 -8.150.00 0.00 0.00 0.007.35 6.86 7.14 77.74 84.64 -8.15
FY 22 FY 21 Growth(%) M-o-M FY 22 FY 21 Growth(%)
Y-o-YNigahi Big 3.52 3.07 14.75 42.34 53.80 -21.30Jayant Big 4.52 3.42 32.39 41.25 36.22 13.89
Dudhichua Big 4.40 2.23 97.49 42.82 46.58 -8.08Amlohri Big 4.52 2.61 73.61 41.17 42.69 -3.57Khadia Big 3.90 2.64 47.54 41.99 40.19 4.46
Bina Big 3.16 2.43 30.09 38.22 29.59 29.19Krishnashila Big 1.77 1.24 43.33 15.90 20.95 -24.10
Block B Big 1.17 0.92 26.99 18.00 13.21 36.33Jingurda Others 1.09 0.17 547.62 5.71 5.81 -1.74
Kakari Others 0.00 0.00 0.00 0.07 -100.0026.96 18.54 45.40 281.69 283.23 -0.551.09 0.17 547.62 5.71 5.87 -2.8528.05 18.55 51.21 286.02 288.80 -0.960.00 0.00 0.00 0.0028.05 18.55 51.21 286.02 288.80 -0.96
All Figures in MM3OBR during the year
Big Plus Mines
Other Mines
Rest of Mines
OBR during the year
Total NCL
Type
Other MinesBig Mines
OBR during MarContractual OBR NCL
OBR during MarTypeMine
Big Mines
Big Plus MinesRest of Mines
Total NCL
Mine
33
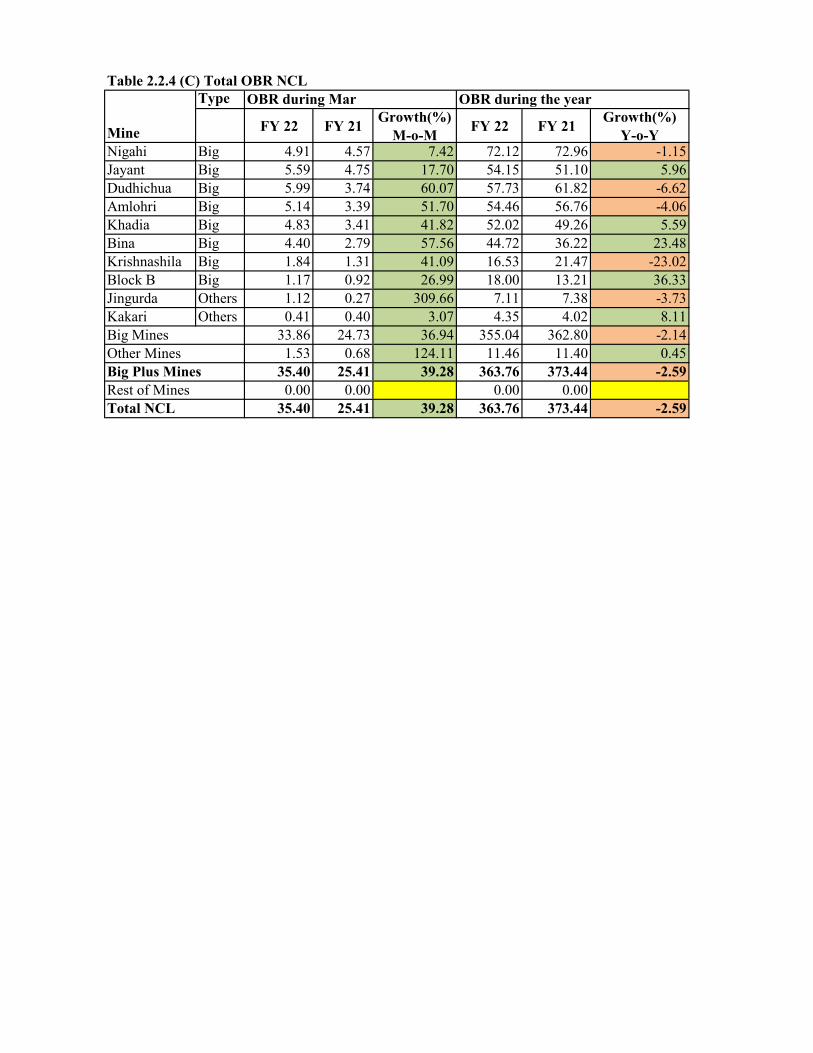
Table 2.2.4 (C) Total OBR NCLType
FY 22 FY 21 Growth(%) M-o-M FY 22 FY 21 Growth(%)
Y-o-YNigahi Big 4.91 4.57 7.42 72.12 72.96 -1.15Jayant Big 5.59 4.75 17.70 54.15 51.10 5.96Dudhichua Big 5.99 3.74 60.07 57.73 61.82 -6.62Amlohri Big 5.14 3.39 51.70 54.46 56.76 -4.06Khadia Big 4.83 3.41 41.82 52.02 49.26 5.59Bina Big 4.40 2.79 57.56 44.72 36.22 23.48Krishnashila Big 1.84 1.31 41.09 16.53 21.47 -23.02Block B Big 1.17 0.92 26.99 18.00 13.21 36.33Jingurda Others 1.12 0.27 309.66 7.11 7.38 -3.73Kakari Others 0.41 0.40 3.07 4.35 4.02 8.11
33.86 24.73 36.94 355.04 362.80 -2.141.53 0.68 124.11 11.46 11.40 0.45
35.40 25.41 39.28 363.76 373.44 -2.590.00 0.00 0.00 0.00
35.40 25.41 39.28 363.76 373.44 -2.59
Other MinesBig Mines
Mine
Total NCL
OBR during Mar
Rest of MinesBig Plus Mines
OBR during the year
34
FY 22 FY 21 Growth(%) M-o-M FY 22 FY 21 Growth(%)
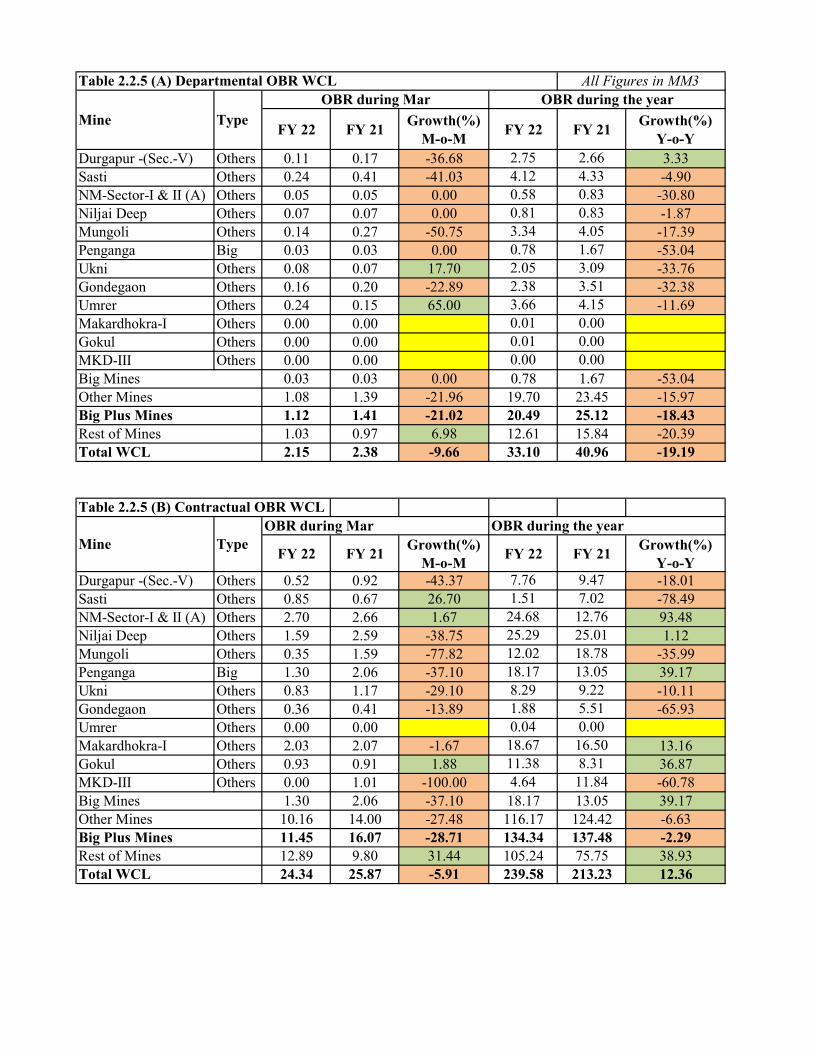
Y-o-YDurgapur -(Sec.-V) Others 0.11 0.17 -36.68 2.75 2.66 3.33Sasti Others 0.24 0.41 -41.03 4.12 4.33 -4.90NM-Sector-I & II (A) Others 0.05 0.05 0.00 0.58 0.83 -30.80Niljai Deep Others 0.07 0.07 0.00 0.81 0.83 -1.87Mungoli Others 0.14 0.27 -50.75 3.34 4.05 -17.39Penganga Big 0.03 0.03 0.00 0.78 1.67 -53.04Ukni Others 0.08 0.07 17.70 2.05 3.09 -33.76Gondegaon Others 0.16 0.20 -22.89 2.38 3.51 -32.38Umrer Others 0.24 0.15 65.00 3.66 4.15 -11.69Makardhokra-I Others 0.00 0.00 0.01 0.00Gokul Others 0.00 0.00 0.01 0.00MKD-III Others 0.00 0.00 0.00 0.00
0.03 0.03 0.00 0.78 1.67 -53.041.08 1.39 -21.96 19.70 23.45 -15.971.12 1.41 -21.02 20.49 25.12 -18.431.03 0.97 6.98 12.61 15.84 -20.392.15 2.38 -9.66 33.10 40.96 -19.19
Table 2.2.5 (B) Contractual OBR WCL
FY 22 FY 21 Growth(%) M-o-M FY 22 FY 21 Growth(%)
Y-o-YDurgapur -(Sec.-V) Others 0.52 0.92 -43.37 7.76 9.47 -18.01Sasti Others 0.85 0.67 26.70 1.51 7.02 -78.49NM-Sector-I & II (A) Others 2.70 2.66 1.67 24.68 12.76 93.48Niljai Deep Others 1.59 2.59 -38.75 25.29 25.01 1.12Mungoli Others 0.35 1.59 -77.82 12.02 18.78 -35.99Penganga Big 1.30 2.06 -37.10 18.17 13.05 39.17Ukni Others 0.83 1.17 -29.10 8.29 9.22 -10.11Gondegaon Others 0.36 0.41 -13.89 1.88 5.51 -65.93Umrer Others 0.00 0.00 0.04 0.00Makardhokra-I Others 2.03 2.07 -1.67 18.67 16.50 13.16Gokul Others 0.93 0.91 1.88 11.38 8.31 36.87MKD-III Others 0.00 1.01 -100.00 4.64 11.84 -60.78
1.30 2.06 -37.10 18.17 13.05 39.1710.16 14.00 -27.48 116.17 124.42 -6.6311.45 16.07 -28.71 134.34 137.48 -2.2912.89 9.80 31.44 105.24 75.75 38.9324.34 25.87 -5.91 239.58 213.23 12.36
OBR during the yearMine
OBR during MarType
Big MinesOther Mines
Total WCLRest of MinesBig Plus Mines
All Figures in MM3Table 2.2.5 (A) Departmental OBR WCLOBR during Mar
Total WCL
OBR during the year
Rest of Mines
TypeMine
Big Plus Mines
Big MinesOther Mines
35
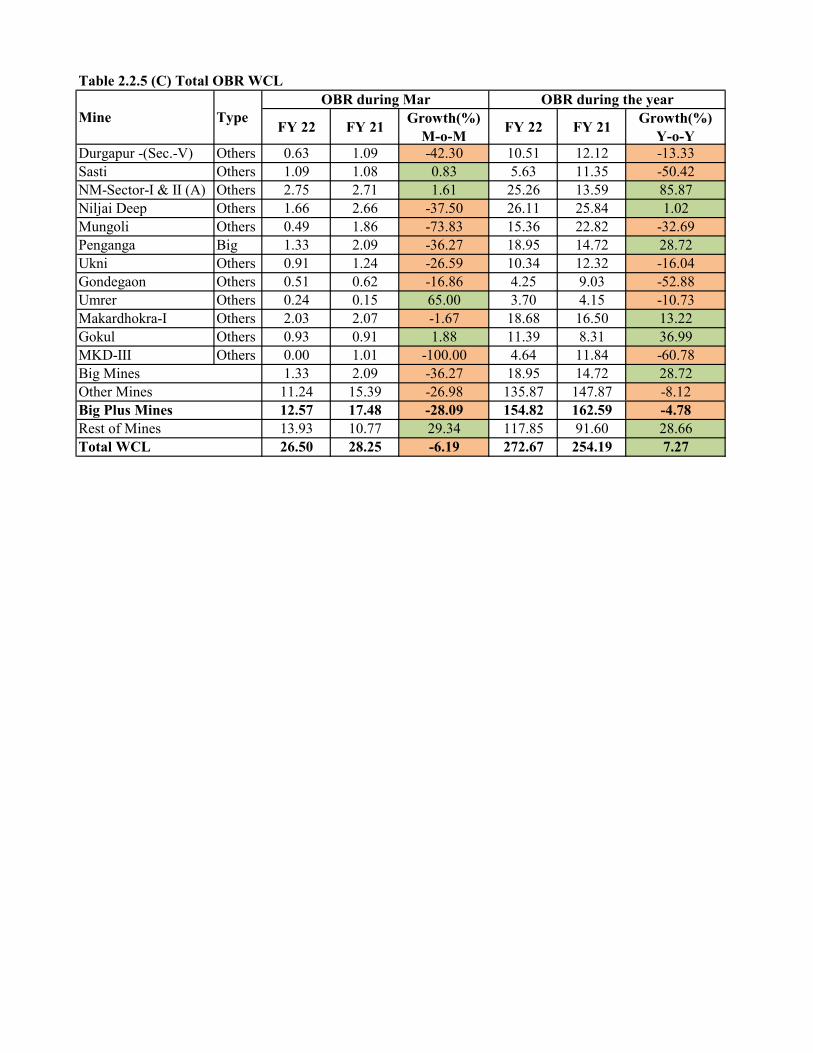
Table 2.2.5 (C) Total OBR WCL
FY 22 FY 21 Growth(%) M-o-M FY 22 FY 21 Growth(%)
Y-o-YDurgapur -(Sec.-V) Others 0.63 1.09 -42.30 10.51 12.12 -13.33Sasti Others 1.09 1.08 0.83 5.63 11.35 -50.42NM-Sector-I & II (A) Others 2.75 2.71 1.61 25.26 13.59 85.87Niljai Deep Others 1.66 2.66 -37.50 26.11 25.84 1.02Mungoli Others 0.49 1.86 -73.83 15.36 22.82 -32.69Penganga Big 1.33 2.09 -36.27 18.95 14.72 28.72Ukni Others 0.91 1.24 -26.59 10.34 12.32 -16.04Gondegaon Others 0.51 0.62 -16.86 4.25 9.03 -52.88Umrer Others 0.24 0.15 65.00 3.70 4.15 -10.73Makardhokra-I Others 2.03 2.07 -1.67 18.68 16.50 13.22Gokul Others 0.93 0.91 1.88 11.39 8.31 36.99MKD-III Others 0.00 1.01 -100.00 4.64 11.84 -60.78
1.33 2.09 -36.27 18.95 14.72 28.7211.24 15.39 -26.98 135.87 147.87 -8.1212.57 17.48 -28.09 154.82 162.59 -4.7813.93 10.77 29.34 117.85 91.60 28.6626.50 28.25 -6.19 272.67 254.19 7.27
OBR during the year
Big Mines
OBR during Mar
Total WCLRest of Mines
TypeMine
Big Plus MinesOther Mines
36
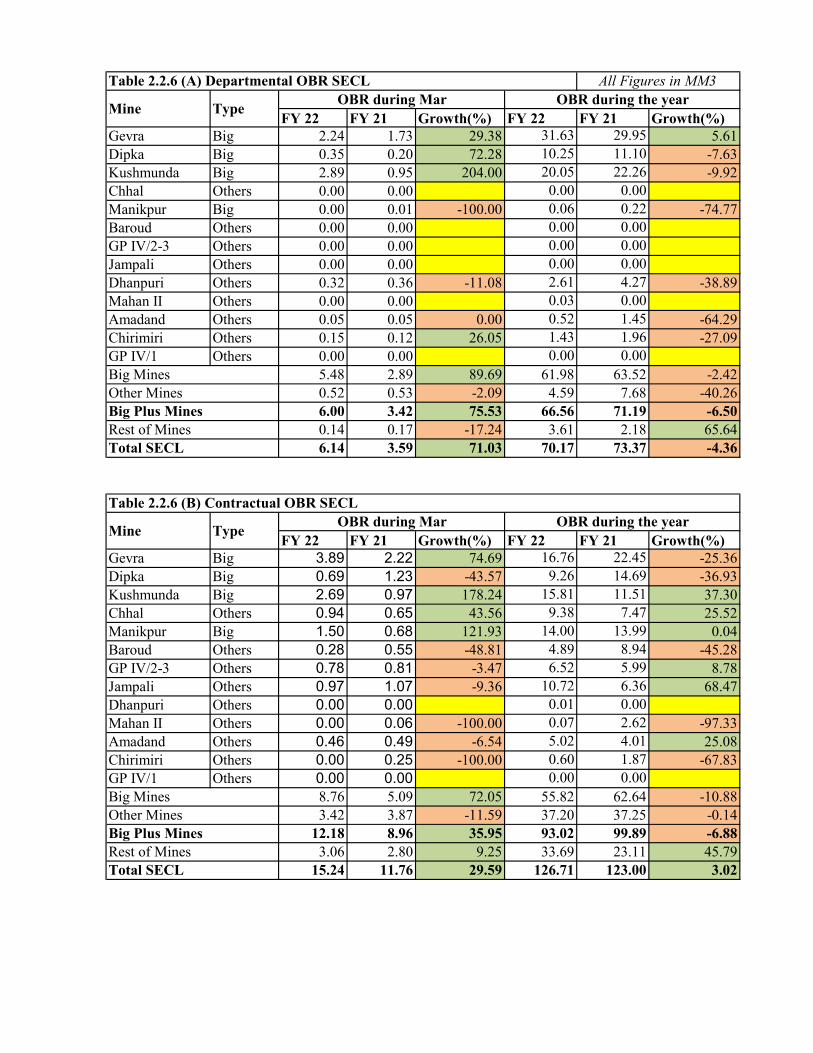
FY 22 FY 21 Growth(%) FY 22 FY 21 Growth(%) Gevra Big 2.24 1.73 29.38 31.63 29.95 5.61Dipka Big 0.35 0.20 72.28 10.25 11.10 -7.63Kushmunda Big 2.89 0.95 204.00 20.05 22.26 -9.92Chhal Others 0.00 0.00 #DIV/0! 0.00 0.00Manikpur Big 0.00 0.01 -100.00 0.06 0.22 -74.77Baroud Others 0.00 0.00 #DIV/0! 0.00 0.00GP IV/2-3 Others 0.00 0.00 0.00 0.00Jampali Others 0.00 0.00 0.00 0.00Dhanpuri Others 0.32 0.36 -11.08 2.61 4.27 -38.89Mahan II Others 0.00 0.00 0.03 0.00Amadand Others 0.05 0.05 0.00 0.52 1.45 -64.29Chirimiri Others 0.15 0.12 26.05 1.43 1.96 -27.09GP IV/1 Others 0.00 0.00 0.00 0.00
5.48 2.89 89.69 61.98 63.52 -2.420.52 0.53 -2.09 4.59 7.68 -40.266.00 3.42 75.53 66.56 71.19 -6.500.14 0.17 -17.24 3.61 2.18 65.646.14 3.59 71.03 70.17 73.37 -4.36
FY 22 FY 21 Growth(%) FY 22 FY 21 Growth(%) Gevra Big 3.89 2.22 74.69 16.76 22.45 -25.36Dipka Big 0.69 1.23 -43.57 9.26 14.69 -36.93Kushmunda Big 2.69 0.97 178.24 15.81 11.51 37.30Chhal Others 0.94 0.65 43.56 9.38 7.47 25.52Manikpur Big 1.50 0.68 121.93 14.00 13.99 0.04Baroud Others 0.28 0.55 -48.81 4.89 8.94 -45.28GP IV/2-3 Others 0.78 0.81 -3.47 6.52 5.99 8.78Jampali Others 0.97 1.07 -9.36 10.72 6.36 68.47Dhanpuri Others 0.00 0.00 0.01 0.00Mahan II Others 0.00 0.06 -100.00 0.07 2.62 -97.33Amadand Others 0.46 0.49 -6.54 5.02 4.01 25.08Chirimiri Others 0.00 0.25 -100.00 0.60 1.87 -67.83GP IV/1 Others 0.00 0.00 0.00 0.00
8.76 5.09 72.05 55.82 62.64 -10.883.42 3.87 -11.59 37.20 37.25 -0.14
12.18 8.96 35.95 93.02 99.89 -6.883.06 2.80 9.25 33.69 23.11 45.79
15.24 11.76 29.59 126.71 123.00 3.02
OBR during Mar
Rest of Mines
Type
OBR during the yearMine Type
Total SECL
Other MinesBig Plus MinesRest of Mines
Big Mines
All Figures in MM3
Table 2.2.6 (B) Contractual OBR SECL
Table 2.2.6 (A) Departmental OBR SECL
Mine
Other MinesBig Plus Mines
Big Mines
Total SECL
OBR during the yearOBR during Mar
37
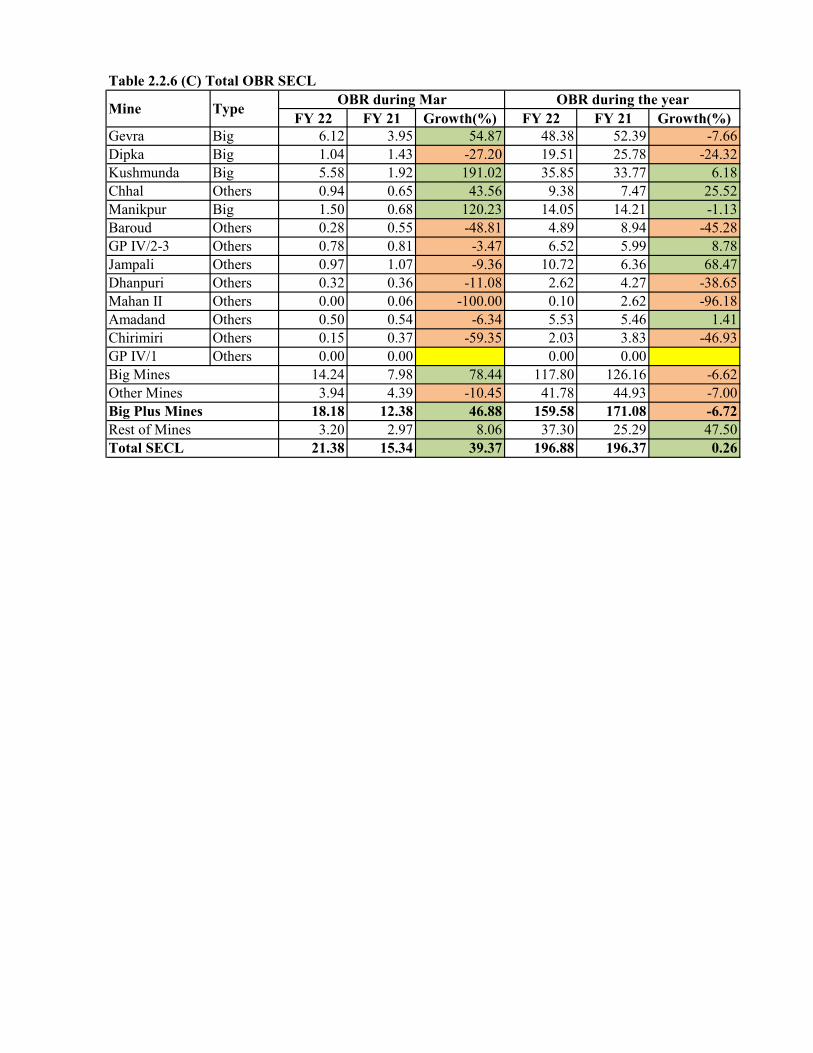
Table 2.2.6 (C) Total OBR SECL
FY 22 FY 21 Growth(%) FY 22 FY 21 Growth(%) Gevra Big 6.12 3.95 54.87 48.38 52.39 -7.66Dipka Big 1.04 1.43 -27.20 19.51 25.78 -24.32Kushmunda Big 5.58 1.92 191.02 35.85 33.77 6.18Chhal Others 0.94 0.65 43.56 9.38 7.47 25.52Manikpur Big 1.50 0.68 120.23 14.05 14.21 -1.13Baroud Others 0.28 0.55 -48.81 4.89 8.94 -45.28GP IV/2-3 Others 0.78 0.81 -3.47 6.52 5.99 8.78Jampali Others 0.97 1.07 -9.36 10.72 6.36 68.47Dhanpuri Others 0.32 0.36 -11.08 2.62 4.27 -38.65Mahan II Others 0.00 0.06 -100.00 0.10 2.62 -96.18Amadand Others 0.50 0.54 -6.34 5.53 5.46 1.41Chirimiri Others 0.15 0.37 -59.35 2.03 3.83 -46.93GP IV/1 Others 0.00 0.00 0.00 0.00
14.24 7.98 78.44 117.80 126.16 -6.623.94 4.39 -10.45 41.78 44.93 -7.00
18.18 12.38 46.88 159.58 171.08 -6.723.20 2.97 8.06 37.30 25.29 47.50
21.38 15.34 39.37 196.88 196.37 0.26
Type OBR during the yearOBR during Mar
Total SECL
Big Mines
Big Plus MinesRest of Mines
Mine
Other Mines
38

Table 2.2.7 (A) Departmental OBR MCL All Figures in MM3
FY 22 FY 21 Growth(%) FY 22 FY 21 Growth(%) Bhubaneswari Big 0.00 0.00 0.00 0.00Lakhanpur Big 0.46 0.51 -8.86 4.28 3.36 27.24Bharatpur Big 0.09 0.17 -50.86 1.99 3.33 -40.33Lingaraj Big 0.20 0.14 46.06 1.90 1.67 13.73Samaleswari Big 0.07 0.10 -29.32 1.57 0.67 133.28Kulda Big 0.00 0.00 0.00 0.10 -100.00Kaniha Big 0.00 0.00 0.00 0.00Hingula Big 0.01 0.02 -37.06 0.16 0.52 -69.72Ananta Big 0.14 0.25 -43.92 1.80 2.01 -10.45Jagannath Big 0.22 0.15 44.87 2.21 2.19 0.66Belpahar Big 0.04 0.15 -71.62 1.30 0.88 48.05Lajkura Big 0.11 0.14 -18.76 1.28 1.29 -1.17Balram Big 0.18 0.15 19.01 1.48 1.75 -15.46Basundhara (W) Others 0.01 0.03 -81.38 0.05 0.43 -88.50Garjanbahal Big 0.20 0.18 8.35 2.03 2.32 -12.42
1.72 1.88 -8.51 20.00 20.12 -0.570.01 0.03 -81.38 0.05 0.43 -88.501.73 1.91 -9.42 20.05 20.54 -2.390.00 0.00 0.00 0.001.73 1.91 -9.42 20.05 20.54 -2.39
Table 2.2.7 (B) Contractual OBR MCL
FY 22 FY 21 Growth(%) FY 22 FY 21 Growth(%) Bhubaneswari Big 0.99 1.28 -22.63 13.38 18.26 -26.71Lakhanpur Big 2.97 0.91 227.29 34.52 36.31 -4.91Bharatpur Big 0.82 1.11 -25.57 9.30 6.47 43.75Lingaraj Big 1.56 0.87 78.35 12.59 11.13 13.16Samaleswari Big 1.04 0.48 115.18 9.81 4.45 120.30Kulda Big 1.21 1.35 -10.24 15.37 16.41 -6.30Kaniha Big 0.58 0.36 60.29 7.31 3.85 89.60Hingula Big 1.35 1.81 -25.24 18.54 9.07 104.48Ananta Big 2.75 1.69 62.22 24.95 12.46 100.20Jagannath Big 0.92 0.31 197.30 5.11 3.04 68.18Belpahar Big 0.83 0.88 -5.61 4.69 4.50 4.18Lajkura Big 1.09 0.49 119.65 10.87 7.31 48.68Balram Big 1.34 1.02 30.74 13.96 13.90 0.46Basundhara (W) Others 0.00 0.11 -100.00 0.05 0.18 -72.96Garjanbahal Big 0.89 0.64 39.21 6.37 5.27 20.88
18.34 13.21 38.79 186.78 152.43 22.540.00 0.11 -100.00 0.05 0.18 -72.9618.34 13.32 37.69 186.83 152.61 22.430.00 0.00 0.00 0.0018.34 13.32 37.69 186.83 152.61 22.42
OBR during the year
OBR during the year
Total MCL
OBR during Mar
Total MCL
Big Plus MinesRest of Mines
Big Plus MinesRest of Mines
Mine
OBR during Mar
Big MinesOther Mines
Type
Mine Type
Big MinesOther Mines
39

Table 2.2.7 (C) Total OBR MCL
FY 22 FY 21 Growth(%) FY 22 FY 21 Growth(%) Bhubaneswari Big 0.99 1.28 -22.63 13.38 18.26 -26.71Lakhanpur Big 3.44 1.42 142.39 38.80 39.67 -2.19Bharatpur Big 0.91 1.28 -29.01 11.29 9.81 15.17Lingaraj Big 1.76 1.01 73.97 14.49 12.80 13.23Samaleswari Big 1.11 0.58 89.73 11.38 5.13 122.01Kulda Big 1.21 1.35 -10.44 15.38 16.51 -6.87Kaniha Big 0.58 0.36 60.29 7.31 3.85 89.60Hingula Big 1.36 1.83 -25.35 18.70 9.59 94.97Ananta Big 2.89 1.94 48.56 26.75 14.47 84.85Jagannath Big 1.13 0.46 147.35 7.31 5.23 39.87Belpahar Big 0.87 1.02 -15.16 5.99 5.38 11.35Lajkura Big 1.20 0.63 89.60 12.14 8.60 41.19Balram Big 1.52 1.18 29.22 15.44 15.65 -1.32Basundhara (W) Others 0.01 0.14 -96.16 0.10 0.61 -83.87Garjanbahal Big 1.09 0.82 32.39 8.41 7.60 10.69
20.06 15.10 32.84 206.78 172.54 19.850.01 0.14 -96.16 0.10 0.61 -83.87
20.06 15.24 31.65 206.88 173.15 19.480.00 0.00 0.00 0.0020.06 15.24 31.63 206.88 173.15 19.48
OBR during Mar
Total MCL
OBR during the year
Rest of MinesBig Plus MinesOther MinesBig Mines
Mine Type
40
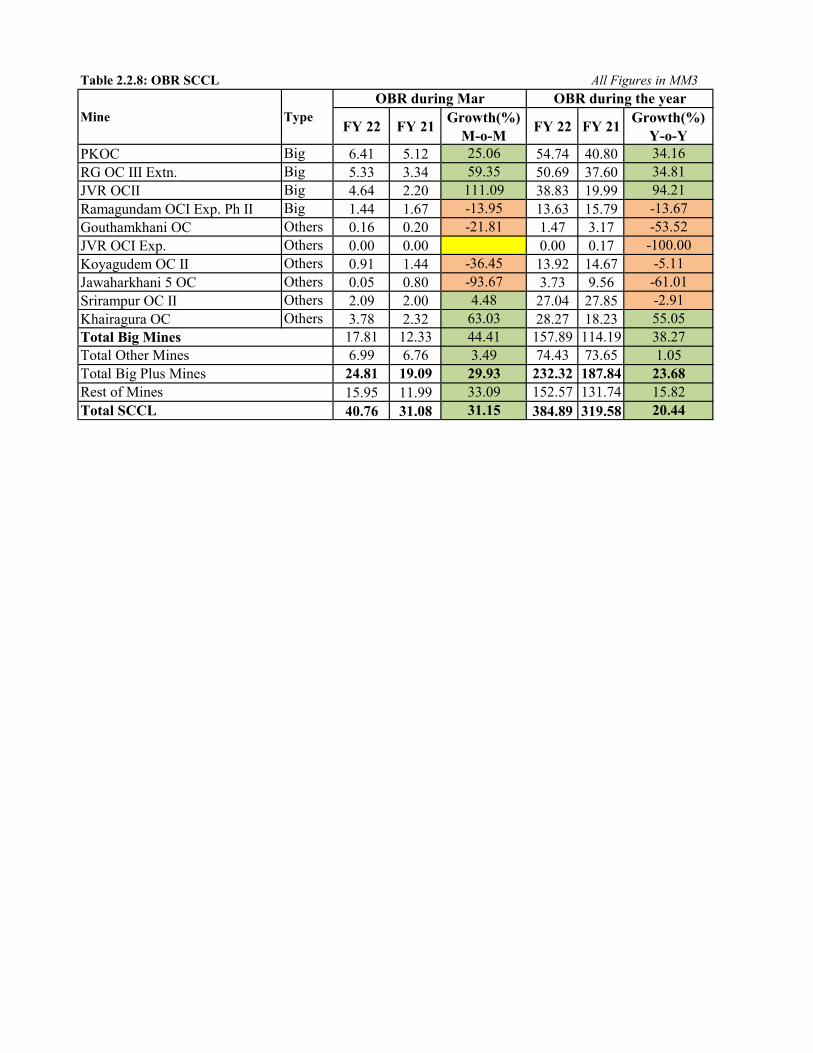
Table 2.2.8: OBR SCCL
FY 22 FY 21 Growth(%) M-o-M FY 22 FY 21 Growth(%)
Y-o-YPKOC Big 6.41 5.12 25.06 54.74 40.80 34.16RG OC III Extn. Big 5.33 3.34 59.35 50.69 37.60 34.81JVR OCII Big 4.64 2.20 111.09 38.83 19.99 94.21Ramagundam OCI Exp. Ph II Big 1.44 1.67 -13.95 13.63 15.79 -13.67Gouthamkhani OC Others 0.16 0.20 -21.81 1.47 3.17 -53.52JVR OCI Exp. Others 0.00 0.00 0.00 0.17 -100.00Koyagudem OC II Others 0.91 1.44 -36.45 13.92 14.67 -5.11Jawaharkhani 5 OC Others 0.05 0.80 -93.67 3.73 9.56 -61.01Srirampur OC II Others 2.09 2.00 4.48 27.04 27.85 -2.91Khairagura OC Others 3.78 2.32 63.03 28.27 18.23 55.05
17.81 12.33 44.41 157.89 114.19 38.276.99 6.76 3.49 74.43 73.65 1.05
24.81 19.09 29.93 232.32 187.84 23.6815.95 11.99 33.09 152.57 131.74 15.8240.76 31.08 31.15 384.89 319.58 20.44
All Figures in MM3OBR during Mar OBR during the year
Rest of MinesTotal SCCL
Total Big MinesTotal Other MinesTotal Big Plus Mines
Mine Type
41
Exploration
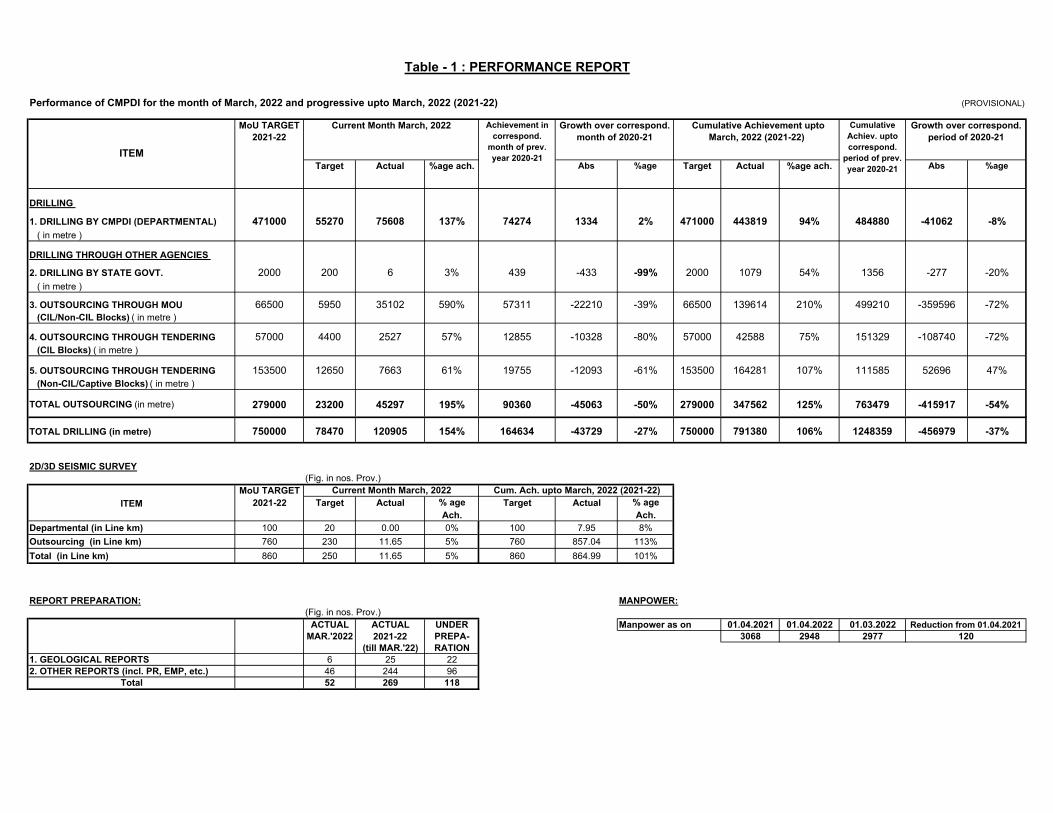
Table - 1 : PERFORMANCE REPORT
Performance of CMPDI for the month of March, 2022 and progressive upto March, 2022 (2021-22) (PROVISIONAL)
ITEM
DRILLING
1. DRILLING BY CMPDI (DEPARTMENTAL) 471000 55270 75608 137% 74274 1334 2% 471000 443819 94% 484880 -41062 -8% ( in metre )
DRILLING THROUGH OTHER AGENCIES
2. DRILLING BY STATE GOVT. 2000 200 6 3% 439 -433 -99% 2000 1079 54% 1356 -277 -20% ( in metre )
3. OUTSOURCING THROUGH MOU 66500 5950 35102 590% 57311 -22210 -39% 66500 139614 210% 499210 -359596 -72% (CIL/Non-CIL Blocks) ( in metre )
4. OUTSOURCING THROUGH TENDERING 57000 4400 2527 57% 12855 -10328 -80% 57000 42588 75% 151329 -108740 -72% (CIL Blocks) ( in metre )
5. OUTSOURCING THROUGH TENDERING 153500 12650 7663 61% 19755 -12093 -61% 153500 164281 107% 111585 52696 47% (Non-CIL/Captive Blocks) ( in metre )
TOTAL OUTSOURCING (in metre) 279000 23200 45297 195% 90360 -45063 -50% 279000 347562 125% 763479 -415917 -54%
TOTAL DRILLING (in metre) 750000 78470 120905 154% 164634 -43729 -27% 750000 791380 106% 1248359 -456979 -37%
2D/3D SEISMIC SURVEY(Fig. in nos. Prov.)
MoU TARGETITEM 2021-22 Target Actual % age Target Actual % age
Ach. Ach.Departmental (in Line km) 100 20 0.00 0% 100 7.95 8%Outsourcing (in Line km) 760 230 11.65 5% 760 857.04 113%Total (in Line km) 860 250 11.65 5% 860 864.99 101%
REPORT PREPARATION: MANPOWER:(Fig. in nos. Prov.)
ACTUAL ACTUAL UNDER Manpower as on 01.04.2021 01.04.2022 01.03.2022MAR.'2022 2021-22 PREPA- 3068 2948 2977
(till MAR.'22) RATION1. GEOLOGICAL REPORTS 6 25 222. OTHER REPORTS (incl. PR, EMP, etc.) 46 244 96
Total 52 269 118
120
%age ach.Target ActualAbs %age
Reduction from 01.04.2021
MoU TARGET 2021-22
Cumulative Achievement upto March, 2022 (2021-22)
Cumulative Achiev. upto correspond.
period of prev. year 2020-21
Growth over correspond. period of 2020-21
Abs %age
Current Month March, 2022 Achievement in correspond.
month of prev. year 2020-21
Growth over correspond. month of 2020-21
Target Actual %age ach.
Current Month March, 2022 Cum. Ach. upto March, 2022 (2021-22)
42
Performance of Coal PSUs
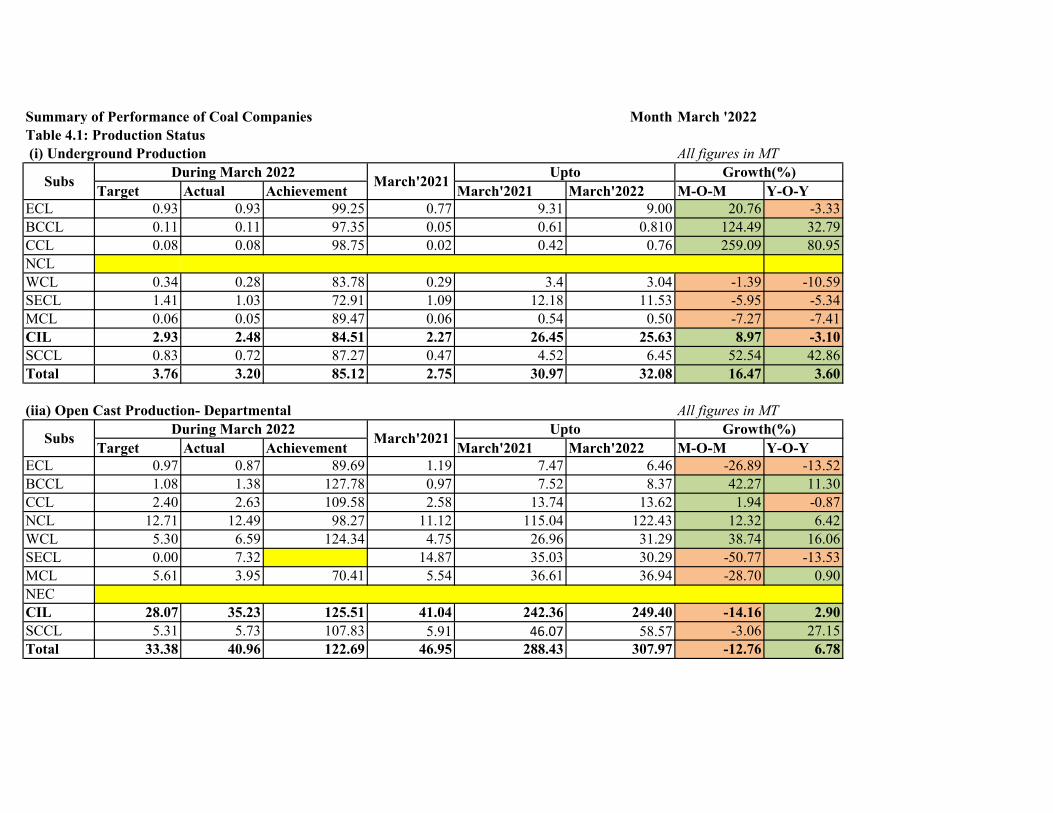
Summary of Performance of Coal Companies Month March '2022Table 4.1: Production Status (i) Underground Production All figures in MT
Target Actual Achievement March'2021 March'2022 M-O-M Y-O-YECL 0.93 0.93 99.25 0.77 9.31 9.00 20.76 -3.33BCCL 0.11 0.11 97.35 0.05 0.61 0.810 124.49 32.79CCL 0.08 0.08 98.75 0.02 0.42 0.76 259.09 80.95NCLWCL 0.34 0.28 83.78 0.29 3.4 3.04 -1.39 -10.59SECL 1.41 1.03 72.91 1.09 12.18 11.53 -5.95 -5.34MCL 0.06 0.05 89.47 0.06 0.54 0.50 -7.27 -7.41CIL 2.93 2.48 84.51 2.27 26.45 25.63 8.97 -3.10SCCL 0.83 0.72 87.27 0.47 4.52 6.45 52.54 42.86Total 3.76 3.20 85.12 2.75 30.97 32.08 16.47 3.60
(iia) Open Cast Production- Departmental All figures in MT
Target Actual Achievement March'2021 March'2022 M-O-M Y-O-YECL 0.97 0.87 89.69 1.19 7.47 6.46 -26.89 -13.52BCCL 1.08 1.38 127.78 0.97 7.52 8.37 42.27 11.30CCL 2.40 2.63 109.58 2.58 13.74 13.62 1.94 -0.87NCL 12.71 12.49 98.27 11.12 115.04 122.43 12.32 6.42WCL 5.30 6.59 124.34 4.75 26.96 31.29 38.74 16.06SECL 0.00 7.32 14.87 35.03 30.29 -50.77 -13.53MCL 5.61 3.95 70.41 5.54 36.61 36.94 -28.70 0.90NECCIL 28.07 35.23 125.51 41.04 242.36 249.40 -14.16 2.90SCCL 5.31 5.73 107.83 5.91 46.07 58.57 -3.06 27.15Total 33.38 40.96 122.69 46.95 288.43 307.97 -12.76 6.78
Subs
Subs During March 2022 March'2021
During March 2022 March'2021 Upto
Growth(%)
Growth(%)
Upto
43
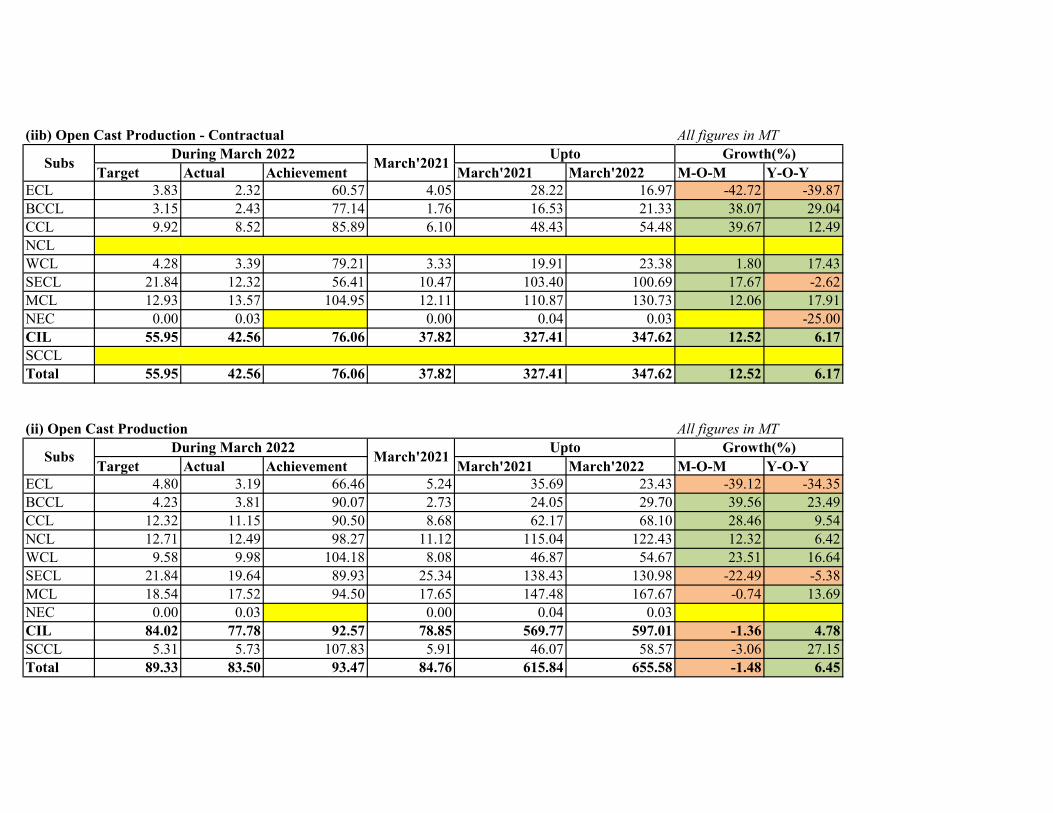
(iib) Open Cast Production - Contractual All figures in MT
Target Actual Achievement March'2021 March'2022 M-O-M Y-O-YECL 3.83 2.32 60.57 4.05 28.22 16.97 -42.72 -39.87BCCL 3.15 2.43 77.14 1.76 16.53 21.33 38.07 29.04CCL 9.92 8.52 85.89 6.10 48.43 54.48 39.67 12.49NCLWCL 4.28 3.39 79.21 3.33 19.91 23.38 1.80 17.43SECL 21.84 12.32 56.41 10.47 103.40 100.69 17.67 -2.62MCL 12.93 13.57 104.95 12.11 110.87 130.73 12.06 17.91NEC 0.00 0.03 0.00 0.04 0.03 -25.00CIL 55.95 42.56 76.06 37.82 327.41 347.62 12.52 6.17SCCLTotal 55.95 42.56 76.06 37.82 327.41 347.62 12.52 6.17
(ii) Open Cast Production All figures in MT
Target Actual Achievement March'2021 March'2022 M-O-M Y-O-YECL 4.80 3.19 66.46 5.24 35.69 23.43 -39.12 -34.35BCCL 4.23 3.81 90.07 2.73 24.05 29.70 39.56 23.49CCL 12.32 11.15 90.50 8.68 62.17 68.10 28.46 9.54NCL 12.71 12.49 98.27 11.12 115.04 122.43 12.32 6.42WCL 9.58 9.98 104.18 8.08 46.87 54.67 23.51 16.64SECL 21.84 19.64 89.93 25.34 138.43 130.98 -22.49 -5.38MCL 18.54 17.52 94.50 17.65 147.48 167.67 -0.74 13.69NEC 0.00 0.03 0.00 0.04 0.03CIL 84.02 77.78 92.57 78.85 569.77 597.01 -1.36 4.78SCCL 5.31 5.73 107.83 5.91 46.07 58.57 -3.06 27.15Total 89.33 83.50 93.47 84.76 615.84 655.58 -1.48 6.45
Subs
Subs
During March 2022 March'2021 Upto
During March 2022 March'2021
Growth(%)
Growth(%)Upto
44

(iii) Total Coal Production All figures in MTSubs
Target Actual Achievement March'2021 March'2022 M-O-M Y-O-YECL 5.73 4.12 71.79 6.01 45.00 32.43 -31.49 -27.93BCCL 4.34 3.92 90.26 2.78 24.66 30.51 41.06 23.72CCL 12.40 11.23 90.56 8.70 62.59 68.86 29.04 10.02NCL 12.71 12.49 98.27 11.12 115.04 122.43 12.32 6.42WCL 9.92 10.26 103.48 8.37 50.27 57.71 22.66 14.80SECL 23.25 20.67 88.89 26.43 150.61 142.51 -21.81 -5.38MCL 18.60 17.57 94.48 17.71 148.02 168.17 -0.76 13.61NEC 0.00 0.03 0.00 0.04 0.03 -25.00CIL 86.96 80.26 92.30 81.13 596.22 622.64 -1.07 4.43SCCL 6.14 6.45 105.07 6.38 50.58 65.02 1.05 28.55Total 93.09 86.70 93.14 87.51 646.80 687.66 -0.93 6.32
Upto During March 2022 March'2021 Growth(%)
45

Table 4.1 (A): Coking Coal Production In MT
FY 22 FY 21Growth (%)
M-o-M FY 22 FY 21Growth(%)
Y-o-YECL 0.00 0.00 -100.00 0.01 0.02 -6.67BCCL 3.80 2.64 44.16 29.04 23.38 24.19CCL 3.26 2.60 25.19 17.17 15.04 14.13WCL 0.01 0.02 -33.33 0.16 0.18 -12.71SECL 0.03 0.02 4.17 0.23 0.22 2.74Coal India 7.10 5.29 34.34 46.61 38.84 19.99
Table 4.1 (BA) : Washed Coking Coal Production In MT
FY 22 FY 21Growt (%)
M-o-M FY 22 FY 21Growth(%)
Y-o-YBCCL 0.121 0.092 31.52 1.21 0.74 64.49CCL 0.05 0.022 136.36 0.40 0.44 -8.47Coal India 0.17 0.11 51.75 1.61 1.17 37.29
Table 4.1 (BB) : Production of Middlings In MT
FY 22 FY 21Growth (%)
M-o-M FY 22 FY 21Growth(%)
Y-o-YBCCL 0.17 0.13 28.03 1.82 1.46 24.28CCL 0.07 0.05 32.00 0.63 0.77 -19.15Coal India 0.24 0.18 29.12 2.44 2.24 9.26
Production During Mar Production Upto Mar
Subs
Subs
Subs
Production During Mar Production Upto Mar
Production During Mar Production Upto Mar
46
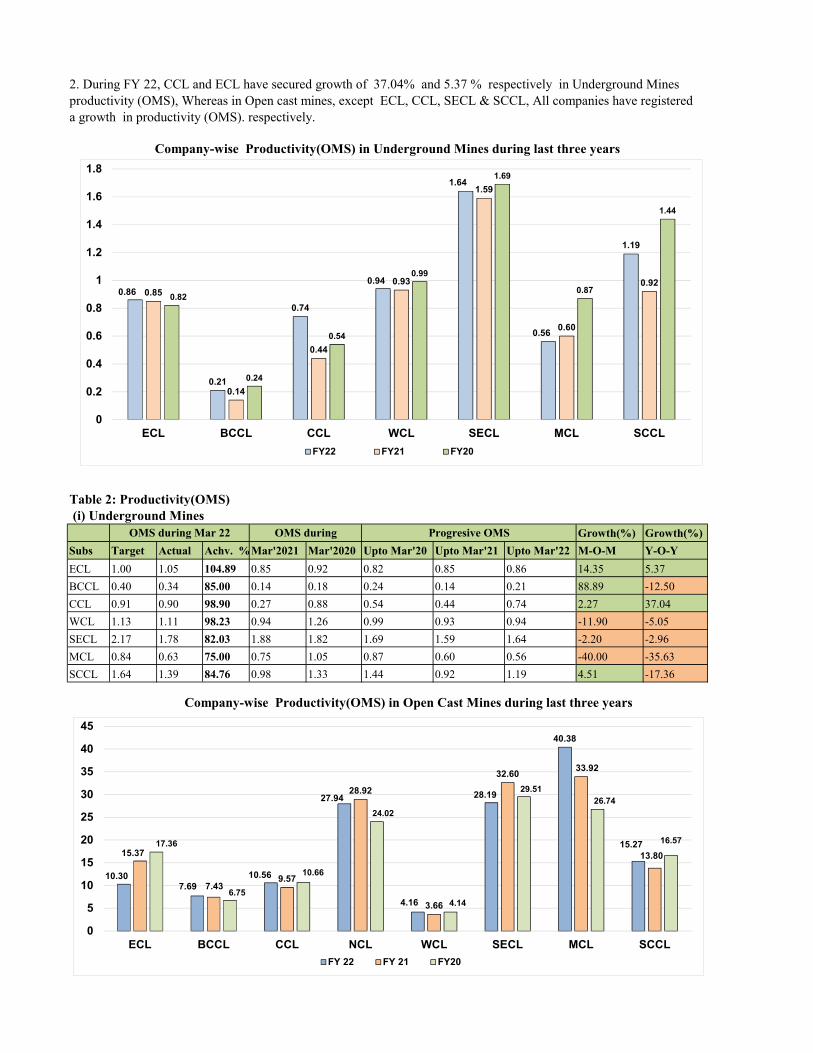
Table 2: Productivity(OMS) (i) Underground Mines
Growth(%) Growth(%)Subs Target Actual Achv. %Mar'2021 Mar'2020 Upto Mar'20 Upto Mar'21 Upto Mar'22 M-O-M Y-O-YECL 1.00 1.05 104.89 0.85 0.92 0.82 0.85 0.86 14.35 5.37BCCL 0.40 0.34 85.00 0.14 0.18 0.24 0.14 0.21 88.89 -12.50CCL 0.91 0.90 98.90 0.27 0.88 0.54 0.44 0.74 2.27 37.04WCL 1.13 1.11 98.23 0.94 1.26 0.99 0.93 0.94 -11.90 -5.05SECL 2.17 1.78 82.03 1.88 1.82 1.69 1.59 1.64 -2.20 -2.96MCL 0.84 0.63 75.00 0.75 1.05 0.87 0.60 0.56 -40.00 -35.63SCCL 1.64 1.39 84.76 0.98 1.33 1.44 0.92 1.19 4.51 -17.36
Company-wise Productivity(OMS) in Open Cast Mines during last three years
2. During FY 22, CCL and ECL have secured growth of 37.04% and 5.37 % respectively in Underground Mines productivity (OMS), Whereas in Open cast mines, except ECL, CCL, SECL & SCCL, All companies have registered a growth in productivity (OMS). respectively.
Company-wise Productivity(OMS) in Underground Mines during last three years
OMS during Mar 22 OMS during Progresive OMS
0.86
0.21
0.74
0.94
1.64
0.56
1.19
0.85
0.14
0.44
0.93
1.59
0.60
0.920.82
0.24
0.54
0.99
1.69
0.87
1.44
0
0.2
0.4
0.6
0.8
1
1.2
1.4
1.6
1.8
ECL BCCL CCL WCL SECL MCL SCCLFY22 FY21 FY20
10.307.69
10.56
27.94
4.16
28.19
40.38
15.2715.37
7.439.57
28.92
3.66
32.60 33.92
13.8017.36
6.75
10.66
24.02
4.14
29.5126.74
16.57
0
5
10
15
20
25
30
35
40
45
ECL BCCL CCL NCL WCL SECL MCL SCCLFY 22 FY 21 FY20
47
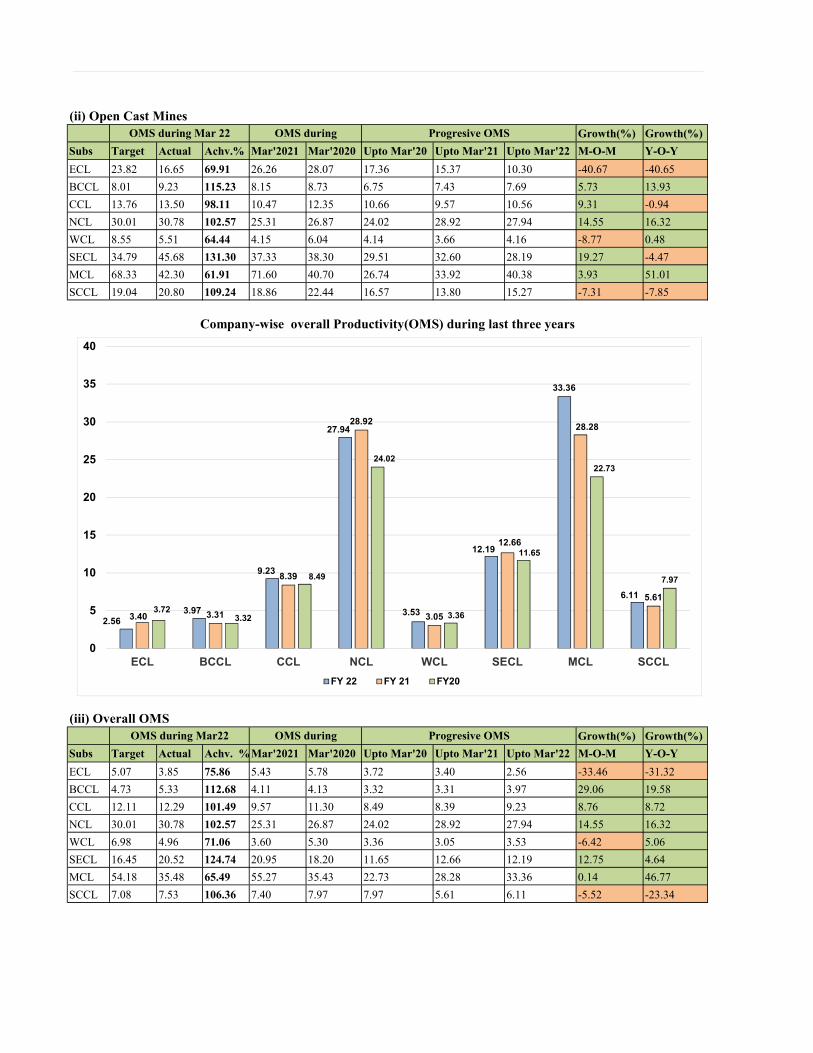
(ii) Open Cast MinesGrowth(%) Growth(%)
Subs Target Actual Achv.% Mar'2021 Mar'2020 Upto Mar'20 Upto Mar'21 Upto Mar'22 M-O-M Y-O-YECL 23.82 16.65 69.91 26.26 28.07 17.36 15.37 10.30 -40.67 -40.65BCCL 8.01 9.23 115.23 8.15 8.73 6.75 7.43 7.69 5.73 13.93CCL 13.76 13.50 98.11 10.47 12.35 10.66 9.57 10.56 9.31 -0.94NCL 30.01 30.78 102.57 25.31 26.87 24.02 28.92 27.94 14.55 16.32WCL 8.55 5.51 64.44 4.15 6.04 4.14 3.66 4.16 -8.77 0.48SECL 34.79 45.68 131.30 37.33 38.30 29.51 32.60 28.19 19.27 -4.47MCL 68.33 42.30 61.91 71.60 40.70 26.74 33.92 40.38 3.93 51.01SCCL 19.04 20.80 109.24 18.86 22.44 16.57 13.80 15.27 -7.31 -7.85
(iii) Overall OMSGrowth(%) Growth(%)
Subs Target Actual Achv. %Mar'2021 Mar'2020 Upto Mar'20 Upto Mar'21 Upto Mar'22 M-O-M Y-O-YECL 5.07 3.85 75.86 5.43 5.78 3.72 3.40 2.56 -33.46 -31.32BCCL 4.73 5.33 112.68 4.11 4.13 3.32 3.31 3.97 29.06 19.58CCL 12.11 12.29 101.49 9.57 11.30 8.49 8.39 9.23 8.76 8.72NCL 30.01 30.78 102.57 25.31 26.87 24.02 28.92 27.94 14.55 16.32WCL 6.98 4.96 71.06 3.60 5.30 3.36 3.05 3.53 -6.42 5.06SECL 16.45 20.52 124.74 20.95 18.20 11.65 12.66 12.19 12.75 4.64MCL 54.18 35.48 65.49 55.27 35.43 22.73 28.28 33.36 0.14 46.77SCCL 7.08 7.53 106.36 7.40 7.97 7.97 5.61 6.11 -5.52 -23.34
OMS during Mar 22 OMS during Progresive OMS
Company-wise overall Productivity(OMS) during last three years
OMS during Mar22 OMS during Progresive OMS
2.563.97
9.23
27.94
3.53
12.19
33.36
6.11
3.40 3.31
8.39
28.92
3.05
12.66
28.28
5.613.72
3.32
8.49
24.02
3.36
11.65
22.73
7.97
0
5
10
15
20
25
30
35
40
ECL BCCL CCL NCL WCL SECL MCL SCCLFY 22 FY 21 FY20
48

Available(%)
Utilised(%)
Utilisation to Availabilty %
Available(%)
Utilised(%)
Utilisation to Availabilty
%
Available(%)
Utilised(%)
Utilisation to Availabilty %
ECL 1 85 73 86 90 85 95 86 79 92.3BCCL 1 85 73 86 70 57 81 72 44 61CCLNCL 23 85 73 86 71 65 91 74 67 90WCL 1 85 73 86 91 10 11 84 57 68SECL 2 85 73 86 100 100 100 95 62 65MCL 1 85 73 86 0 0 81 0 0
Available(%)
Utilised(%)
Utilisation to Availabilty %
Available(%)
Utilised(%)
Utilisation to Availabilty
%
Available(%)
Utilised(%)
Utilisation to Availabilty %
ECL 56 80 58 73 78 52 67 77 47 60BCCL 101 80 58 73 81 48 59 75 42 56CCL 110 80 58 73 83 48 58 80 45 56NCL 103 80 58 73 78 44 57 73 44 60WCL 136 80 58 73 82 40 49 81 35 43SECL 70 80 58 73 72 41 57 71 40 56MCL 79 80 58 73 82 24 29 81 27 33
Subs
Available(%)
Utilised(%)
Utilisation to Availabilty %
Available(%)
Utilised(%)
Utilisation to Availabilty
%
Available(%)
Utilised(%)
Utilisation to Availabilty %
ECLBCCLCCLNCL 8 81 61 75 89 38 42 90 42 46WCLSECLMCL 21 81 61 75 74 45 61 81 44 54
Table 4 : Subsidiary-wise HEMM Utilisation10. It may be observed that Dragline has been under-utilised in BCCL and WCL during Mar 2022, whereas it was not available for use in MCL.
(i) DraglineSubs No of Units CMPDI Norms Actual Status during Mar 2022
(in % )during FY 22 (in % )
ii) It may be observed that Shovel has been under-utilised during Mar 2022.
(ii) ShovelSubs No of Units CMPDI Norms Actual Status during Mar 2022
(in % )during FY 22 (in % )
iii) It may be observed that Surface Miner has been under-utilised during Mar 2022.(iii) Surface Miner
No of Units CMPDI Norms Actual Status during Mar 2022 (in % )
during FY 22 (in % )
49
Available(%)
Utilised(%)
Utilisation to Availabilty %
Available(%)
Utilised(%)
Utilisation to Availabilty
%
Available(%)
Utilised(%)
Utilisation to Availabilty %
ECL 221 67 50 75 79 37 46 77 38 50BCCL 335 67 50 75 77 28 36 74 27 36CCL 400 67 50 75 82 43 52 78 41 53NCL 535 67 50 75 75 44 59 75 44 58WCL 372 67 50 75 80 40 51 83 34 41SECL 544 67 50 75 72 37 51 78 34 44MCL 309 67 50 75 82 18 22 77 22 29
Available(%)
Utilised(%)
Utilisation to Availabilty %
Available(%)
Utilised(%)
Utilisation to Availabilty
%
Available(%)
Utilised(%)
Utilisation to Availabilty %
ECL 79 70 45 64 70 22 31 70 22 31BCCL 96 70 45 64 71 14 20 69 14 20CCL 188 70 45 64 84 16 19 80 15 19NCL 168 70 45 64 75 25 33 72 25 35WCL 158 70 45 64 80 21 26 79 22 28SECL 153 70 45 64 67 34 51 66 35 53MCL 140 70 45 64 72 20 28 77 20 26
Available(%)
Utilised(%)
Utilisation to Availabilty %
Available(%)
Utilised(%)
Utilisation to Availabilty
%
Available(%)
Utilised(%)
Utilisation to Availabilty %
ECL 48 78 40 51 81 20 24 83 16 19BCCL 77 78 40 51 78 25 32 74 27 36CCL 119 78 40 51 86 22 26 89 21 24NCL 139 78 40 51 80 17 22 84 18 21WCL 74 78 40 51 91 18 20 89 14 16SECL 103 78 40 51 87 31 36 85 28 33MCL 62 78 40 51 87 31 36 85 16 19
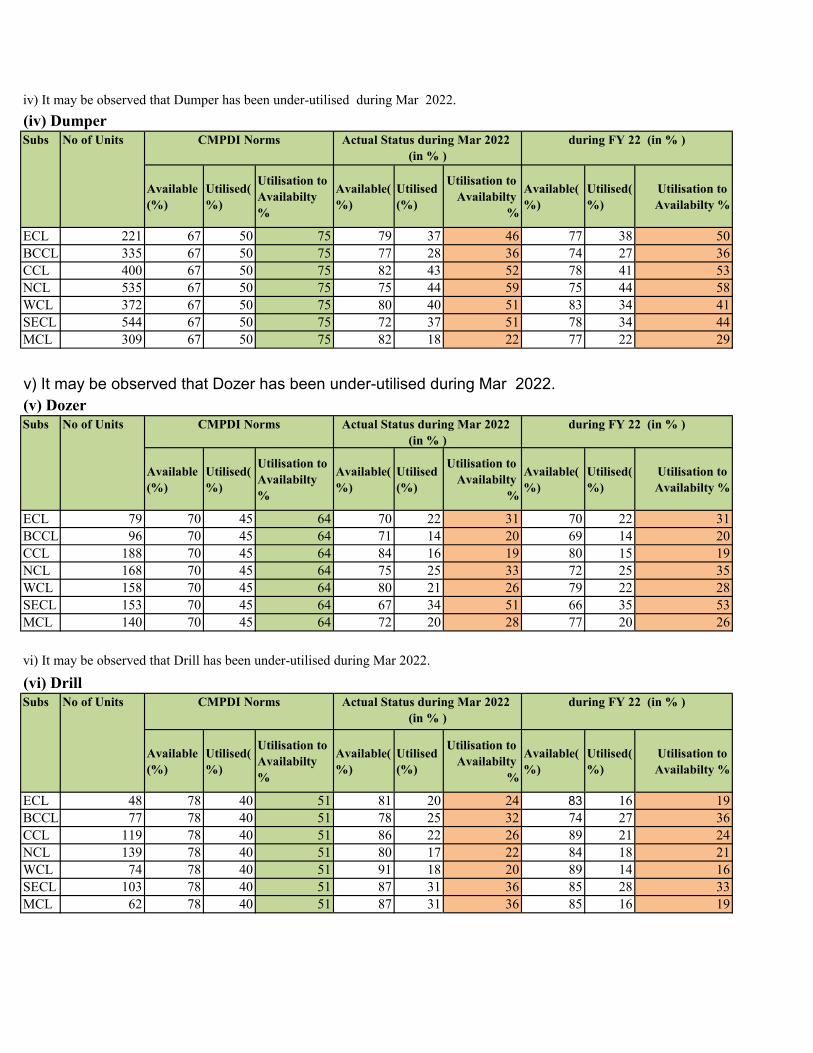
iv) It may be observed that Dumper has been under-utilised during Mar 2022.(iv) DumperSubs No of Units CMPDI Norms Actual Status during Mar 2022
(in % )during FY 22 (in % )
v) It may be observed that Dozer has been under-utilised during Mar 2022.(v) DozerSubs No of Units CMPDI Norms Actual Status during Mar 2022
(in % )during FY 22 (in % )
vi) It may be observed that Drill has been under-utilised during Mar 2022.
(vi) DrillSubs No of Units CMPDI Norms Actual Status during Mar 2022
(in % )during FY 22 (in % )
50
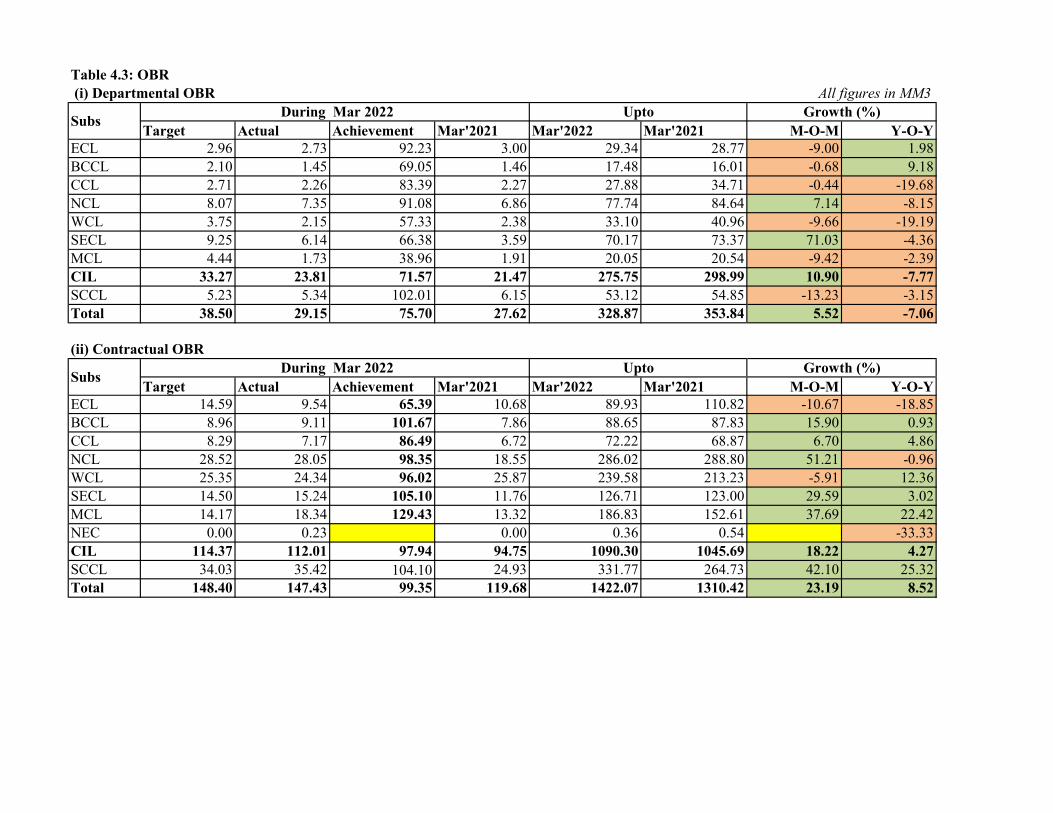
Table 4.3: OBR (i) Departmental OBR
Target Actual Achievement Mar'2021 Mar'2022 Mar'2021 M-O-M Y-O-YECL 2.96 2.73 92.23 3.00 29.34 28.77 -9.00 1.98BCCL 2.10 1.45 69.05 1.46 17.48 16.01 -0.68 9.18CCL 2.71 2.26 83.39 2.27 27.88 34.71 -0.44 -19.68NCL 8.07 7.35 91.08 6.86 77.74 84.64 7.14 -8.15WCL 3.75 2.15 57.33 2.38 33.10 40.96 -9.66 -19.19SECL 9.25 6.14 66.38 3.59 70.17 73.37 71.03 -4.36MCL 4.44 1.73 38.96 1.91 20.05 20.54 -9.42 -2.39CIL 33.27 23.81 71.57 21.47 275.75 298.99 10.90 -7.77SCCL 5.23 5.34 102.01 6.15 53.12 54.85 -13.23 -3.15Total 38.50 29.15 75.70 27.62 328.87 353.84 5.52 -7.06
(ii) Contractual OBR
Target Actual Achievement Mar'2021 Mar'2022 Mar'2021 M-O-M Y-O-YECL 14.59 9.54 65.39 10.68 89.93 110.82 -10.67 -18.85BCCL 8.96 9.11 101.67 7.86 88.65 87.83 15.90 0.93CCL 8.29 7.17 86.49 6.72 72.22 68.87 6.70 4.86NCL 28.52 28.05 98.35 18.55 286.02 288.80 51.21 -0.96WCL 25.35 24.34 96.02 25.87 239.58 213.23 -5.91 12.36SECL 14.50 15.24 105.10 11.76 126.71 123.00 29.59 3.02MCL 14.17 18.34 129.43 13.32 186.83 152.61 37.69 22.42NEC 0.00 0.23 #DIV/0! 0.00 0.36 0.54 #DIV/0! -33.33CIL 114.37 112.01 97.94 94.75 1090.30 1045.69 18.22 4.27SCCL 34.03 35.42 104.10 24.93 331.77 264.73 42.10 25.32Total 148.40 147.43 99.35 119.68 1422.07 1310.42 23.19 8.52
Subs
Growth (%)Subs
All figures in MM3Growth (%) During Mar 2022 Upto
During Mar 2022 Upto
51
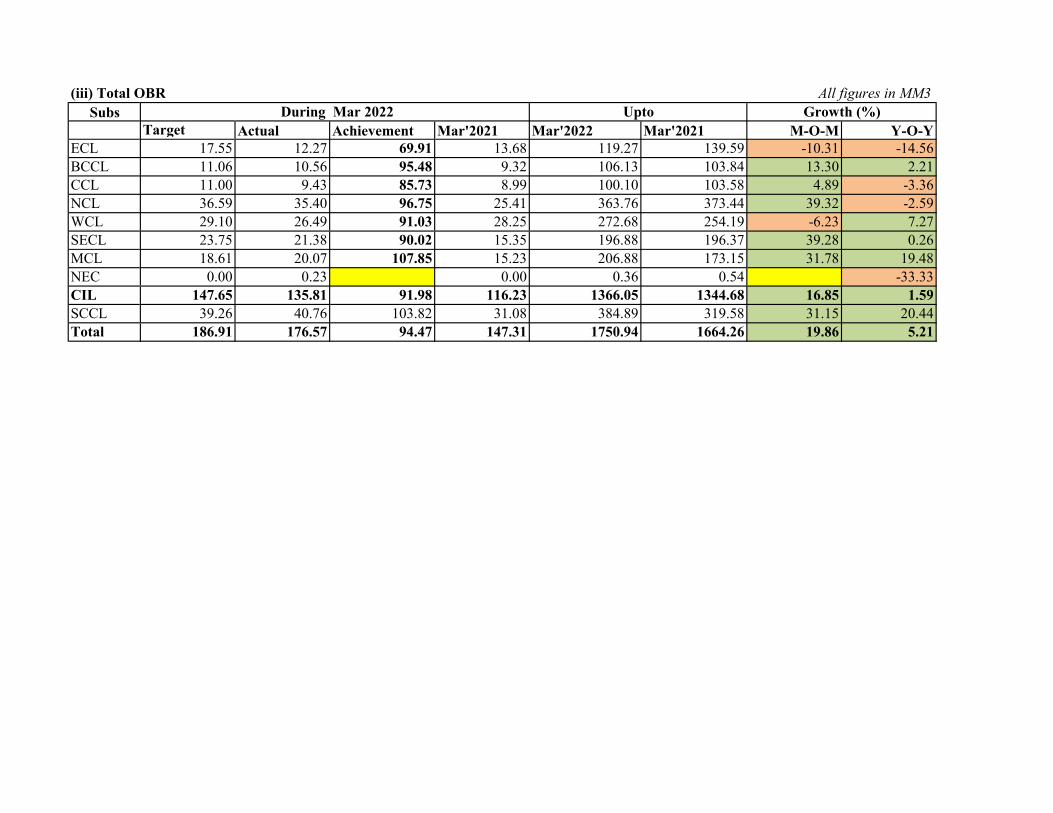
(iii) Total OBRSubs
Target Actual Achievement Mar'2021 Mar'2022 Mar'2021 M-O-M Y-O-YECL 17.55 12.27 69.91 13.68 119.27 139.59 -10.31 -14.56BCCL 11.06 10.56 95.48 9.32 106.13 103.84 13.30 2.21CCL 11.00 9.43 85.73 8.99 100.10 103.58 4.89 -3.36NCL 36.59 35.40 96.75 25.41 363.76 373.44 39.32 -2.59WCL 29.10 26.49 91.03 28.25 272.68 254.19 -6.23 7.27SECL 23.75 21.38 90.02 15.35 196.88 196.37 39.28 0.26MCL 18.61 20.07 107.85 15.23 206.88 173.15 31.78 19.48NEC 0.00 0.23 0.00 0.36 0.54 -33.33CIL 147.65 135.81 91.98 116.23 1366.05 1344.68 16.85 1.59SCCL 39.26 40.76 103.82 31.08 384.89 319.58 31.15 20.44Total 186.91 176.57 94.47 147.31 1750.94 1664.26 19.86 5.21
All figures in MM3Growth (%) During Mar 2022 Upto
52
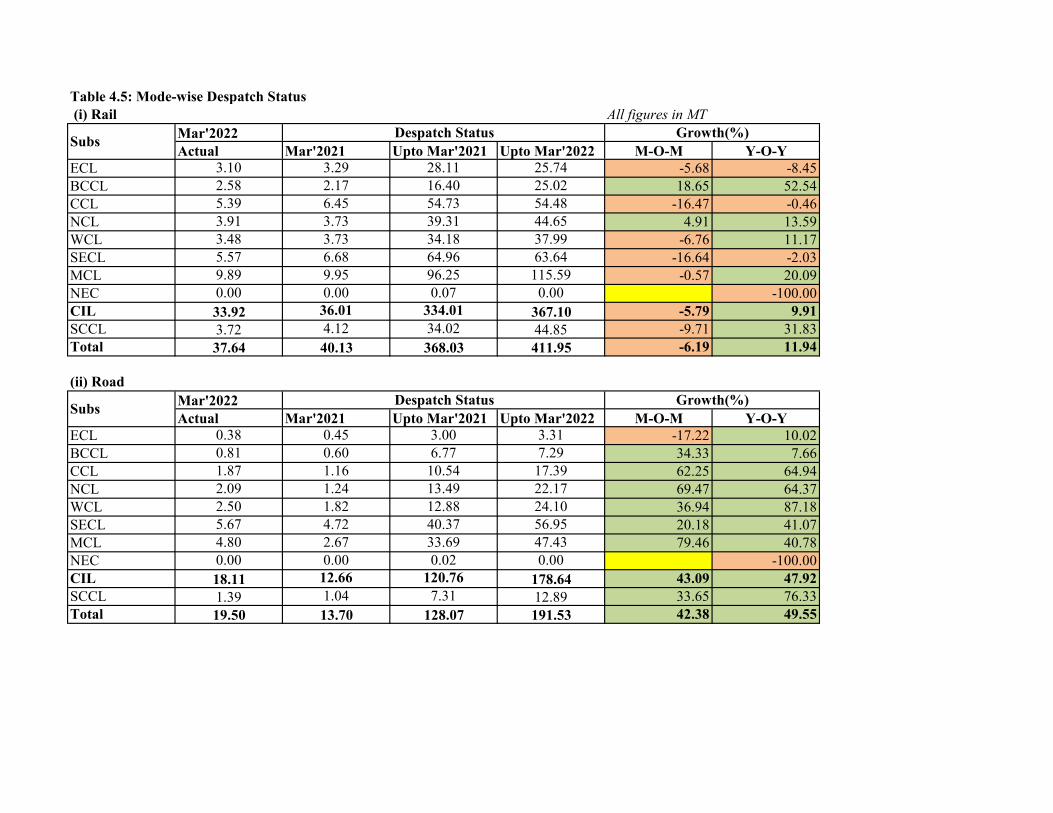
Table 4.5: Mode-wise Despatch Status (i) Rail
Mar'2022Actual Mar'2021 Upto Mar'2021 Upto Mar'2022 M-O-M Y-O-Y
ECL 3.10 3.29 28.11 25.74 -5.68 -8.45BCCL 2.58 2.17 16.40 25.02 18.65 52.54CCL 5.39 6.45 54.73 54.48 -16.47 -0.46NCL 3.91 3.73 39.31 44.65 4.91 13.59WCL 3.48 3.73 34.18 37.99 -6.76 11.17SECL 5.57 6.68 64.96 63.64 -16.64 -2.03MCL 9.89 9.95 96.25 115.59 -0.57 20.09NEC 0.00 0.00 0.07 0.00 -100.00CIL 33.92 36.01 334.01 367.10 -5.79 9.91SCCL 3.72 4.12 34.02 44.85 -9.71 31.83Total 37.64 40.13 368.03 411.95 -6.19 11.94
(ii) RoadMar'2022Actual Mar'2021 Upto Mar'2021 Upto Mar'2022 M-O-M Y-O-Y
ECL 0.38 0.45 3.00 3.31 -17.22 10.02BCCL 0.81 0.60 6.77 7.29 34.33 7.66CCL 1.87 1.16 10.54 17.39 62.25 64.94NCL 2.09 1.24 13.49 22.17 69.47 64.37WCL 2.50 1.82 12.88 24.10 36.94 87.18SECL 5.67 4.72 40.37 56.95 20.18 41.07MCL 4.80 2.67 33.69 47.43 79.46 40.78NEC 0.00 0.00 0.02 0.00 -100.00CIL 18.11 12.66 120.76 178.64 43.09 47.92SCCL 1.39 1.04 7.31 12.89 33.65 76.33Total 19.50 13.70 128.07 191.53 42.38 49.55
Subs
Subs
All figures in MT Despatch Status Growth(%)
Despatch Status Growth(%)
53

(iii) MGRMar'2022Actual Mar'2021 Upto Mar'2021 Upto Mar'2022 M-O-M Y-O-Y
ECL 0.27 1.24 10.76 6.88 -78.40 -36.03BCCL 0.00 0.00 0.00 0.00CCL 0.00 0.00 0.00 0.00NCL 5.08 5.08 52.13 55.55 0.00 6.54WCL 0.00 0.08 0.71 0.18 -100.00 -75.18SECL 2.44 2.42 26.76 28.42 0.74 6.20MCL 1.07 1.30 14.85 13.14 -17.07 -11.54NEC 0.00 0.00 0.00 0.00CIL 8.86 10.11 105.21 104.16 -12.38 -1.00SCCL 0.77 0.70 6.84 7.23 10.00 5.70Total 9.63 10.81 112.05 111.39 -10.93 -0.59
(iv) Conveyor BeltMar'2022Actual Mar'2021 Upto Mar'2021 Upto Mar'2022 M-O-M Y-O-Y
ECL 0.00 0.00 0.00 0.00BCCL 0.00 0.00 0.00 0.00CCL 0.00 0.00 0.00 0.00NCL 0.22 0.29 3.23 3.12 -25.34 -3.41WCL 0.09 0.02 0.21 0.39 466.67 88.83SECL 0.66 0.46 6.68 6.71 44.42 0.54MCL 0.00 0.04 1.21 0.00 -100.00 -100.00NEC 0.00 0.00 0.00 0.00CIL 0.96 0.81 11.33 10.22 19.33 -9.76SCCL 0.07 0.06 0.34 0.56 16.67 64.71Total 1.03 0.87 11.67 10.78 19.15 -7.59
Subs
Subs
Despatch Status Growth(%)
Despatch Status Growth(%)
54
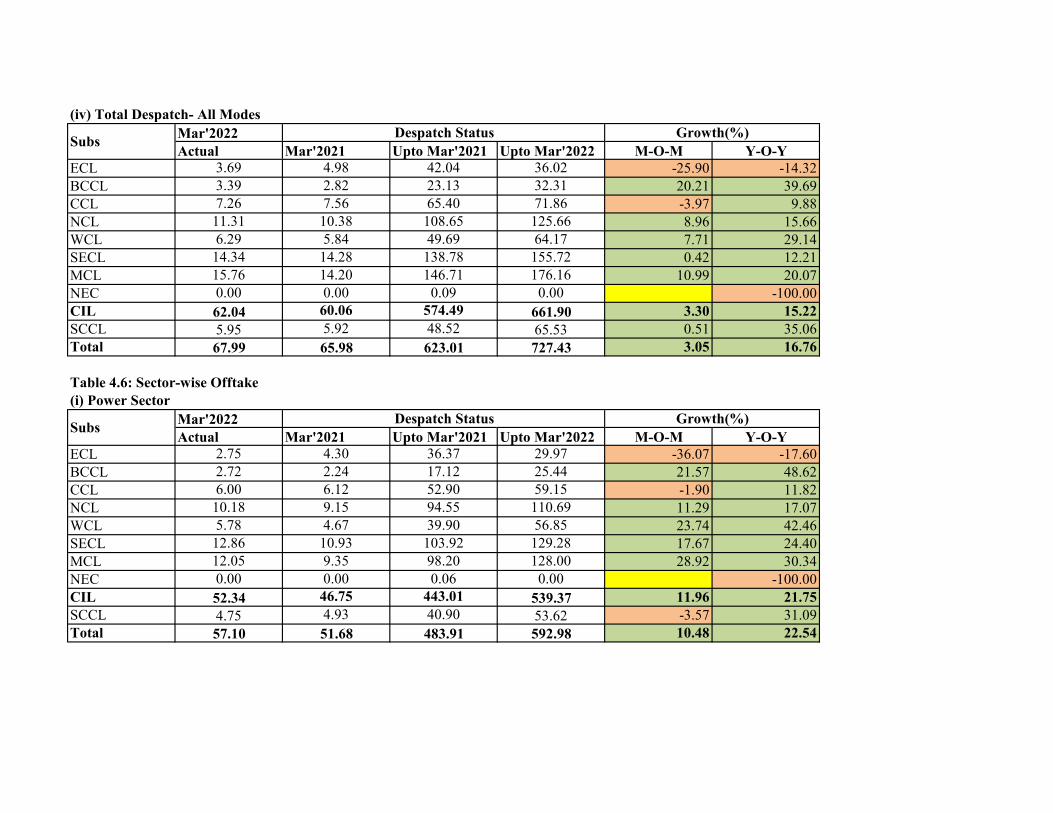
(iv) Total Despatch- All ModesMar'2022Actual Mar'2021 Upto Mar'2021 Upto Mar'2022 M-O-M Y-O-Y
ECL 3.69 4.98 42.04 36.02 -25.90 -14.32BCCL 3.39 2.82 23.13 32.31 20.21 39.69CCL 7.26 7.56 65.40 71.86 -3.97 9.88NCL 11.31 10.38 108.65 125.66 8.96 15.66WCL 6.29 5.84 49.69 64.17 7.71 29.14SECL 14.34 14.28 138.78 155.72 0.42 12.21MCL 15.76 14.20 146.71 176.16 10.99 20.07NEC 0.00 0.00 0.09 0.00 -100.00CIL 62.04 60.06 574.49 661.90 3.30 15.22SCCL 5.95 5.92 48.52 65.53 0.51 35.06Total 67.99 65.98 623.01 727.43 3.05 16.76
Table 4.6: Sector-wise Offtake(i) Power Sector
Mar'2022Actual Mar'2021 Upto Mar'2021 Upto Mar'2022 M-O-M Y-O-Y
ECL 2.75 4.30 36.37 29.97 -36.07 -17.60BCCL 2.72 2.24 17.12 25.44 21.57 48.62CCL 6.00 6.12 52.90 59.15 -1.90 11.82NCL 10.18 9.15 94.55 110.69 11.29 17.07WCL 5.78 4.67 39.90 56.85 23.74 42.46SECL 12.86 10.93 103.92 129.28 17.67 24.40MCL 12.05 9.35 98.20 128.00 28.92 30.34NEC 0.00 0.00 0.06 0.00 -100.00CIL 52.34 46.75 443.01 539.37 11.96 21.75SCCL 4.75 4.93 40.90 53.62 -3.57 31.09Total 57.10 51.68 483.91 592.98 10.48 22.54
Subs
Subs
Despatch Status Growth(%)
Despatch Status Growth(%)
55
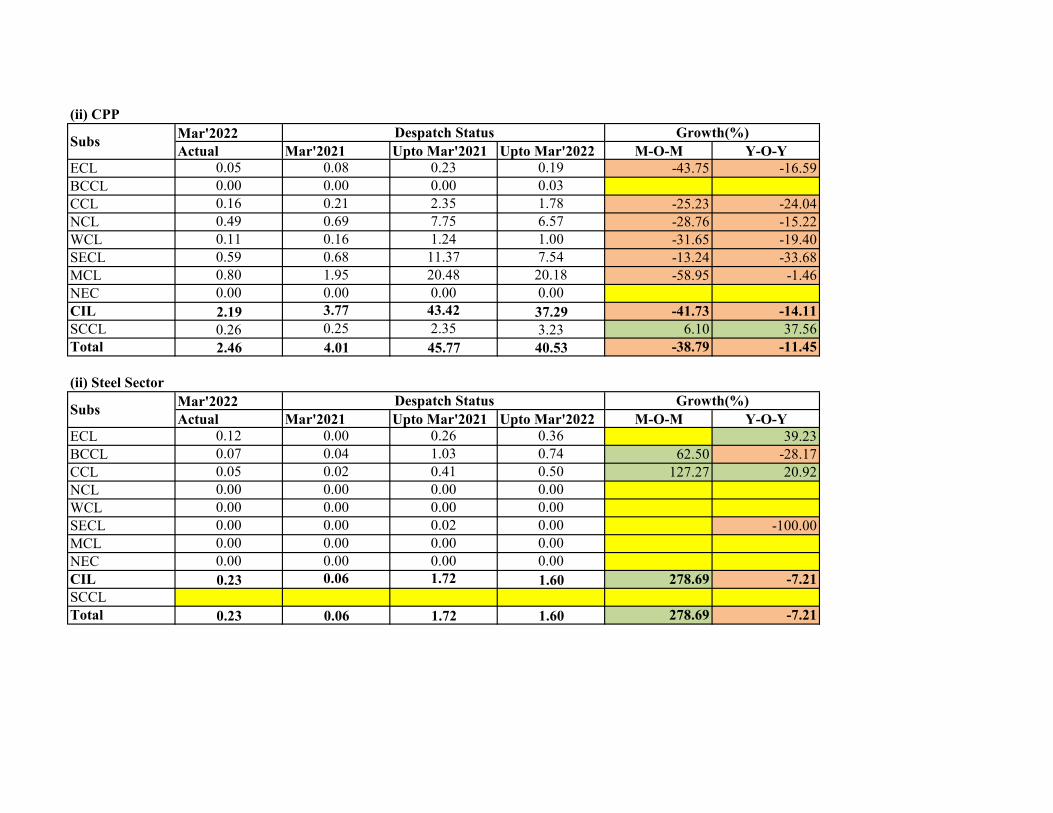
(ii) CPPMar'2022Actual Mar'2021 Upto Mar'2021 Upto Mar'2022 M-O-M Y-O-Y
ECL 0.05 0.08 0.23 0.19 -43.75 -16.59BCCL 0.00 0.00 0.00 0.03CCL 0.16 0.21 2.35 1.78 -25.23 -24.04NCL 0.49 0.69 7.75 6.57 -28.76 -15.22WCL 0.11 0.16 1.24 1.00 -31.65 -19.40SECL 0.59 0.68 11.37 7.54 -13.24 -33.68MCL 0.80 1.95 20.48 20.18 -58.95 -1.46NEC 0.00 0.00 0.00 0.00 -100.00CIL 2.19 3.77 43.42 37.29 -41.73 -14.11SCCL 0.26 0.25 2.35 3.23 6.10 37.56Total 2.46 4.01 45.77 40.53 -38.79 -11.45
(ii) Steel SectorMar'2022Actual Mar'2021 Upto Mar'2021 Upto Mar'2022 M-O-M Y-O-Y
ECL 0.12 0.00 0.26 0.36 39.23BCCL 0.07 0.04 1.03 0.74 62.50 -28.17CCL 0.05 0.02 0.41 0.50 127.27 20.92NCL 0.00 0.00 0.00 0.00WCL 0.00 0.00 0.00 0.00SECL 0.00 0.00 0.02 0.00 -100.00MCL 0.00 0.00 0.00 0.00NEC 0.00 0.00 0.00 0.00CIL 0.23 0.06 1.72 1.60 278.69 -7.21SCCLTotal 0.23 0.06 1.72 1.60 278.69 -7.21
Subs
Subs
Despatch Status Growth(%)
Despatch Status Growth(%)
56
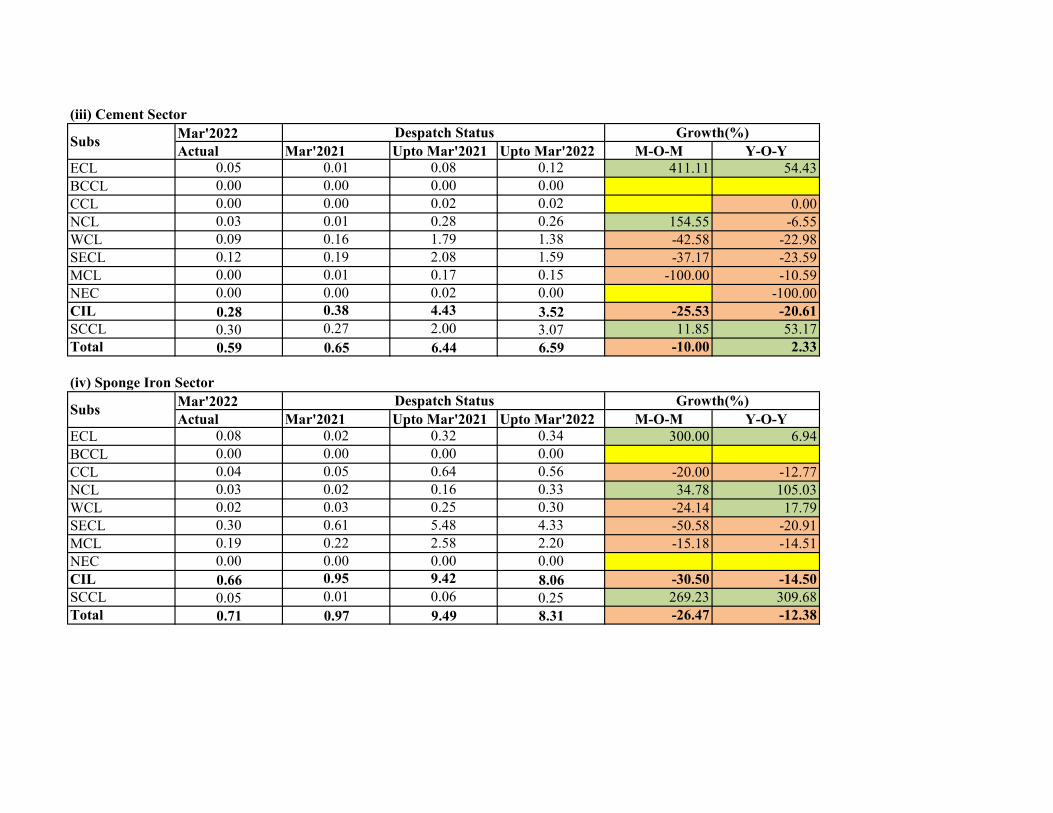
(iii) Cement SectorMar'2022Actual Mar'2021 Upto Mar'2021 Upto Mar'2022 M-O-M Y-O-Y
ECL 0.05 0.01 0.08 0.12 411.11 54.43BCCL 0.00 0.00 0.00 0.00CCL 0.00 0.00 0.02 0.02 -100.00 0.00NCL 0.03 0.01 0.28 0.26 154.55 -6.55WCL 0.09 0.16 1.79 1.38 -42.58 -22.98SECL 0.12 0.19 2.08 1.59 -37.17 -23.59MCL 0.00 0.01 0.17 0.15 -100.00 -10.59NEC 0.00 0.00 0.02 0.00 -100.00CIL 0.28 0.38 4.43 3.52 -25.53 -20.61SCCL 0.30 0.27 2.00 3.07 11.85 53.17Total 0.59 0.65 6.44 6.59 -10.00 2.33
(iv) Sponge Iron SectorMar'2022Actual Mar'2021 Upto Mar'2021 Upto Mar'2022 M-O-M Y-O-Y
ECL 0.08 0.02 0.32 0.34 300.00 6.94BCCL 0.00 0.00 0.00 0.00CCL 0.04 0.05 0.64 0.56 -20.00 -12.77NCL 0.03 0.02 0.16 0.33 34.78 105.03WCL 0.02 0.03 0.25 0.30 -24.14 17.79SECL 0.30 0.61 5.48 4.33 -50.58 -20.91MCL 0.19 0.22 2.58 2.20 -15.18 -14.51NEC 0.00 0.00 0.00 0.00CIL 0.66 0.95 9.42 8.06 -30.50 -14.50SCCL 0.05 0.01 0.06 0.25 269.23 309.68Total 0.71 0.97 9.49 8.31 -26.47 -12.38
Subs
Subs
Despatch Status Growth(%)
Despatch Status Growth(%)
57
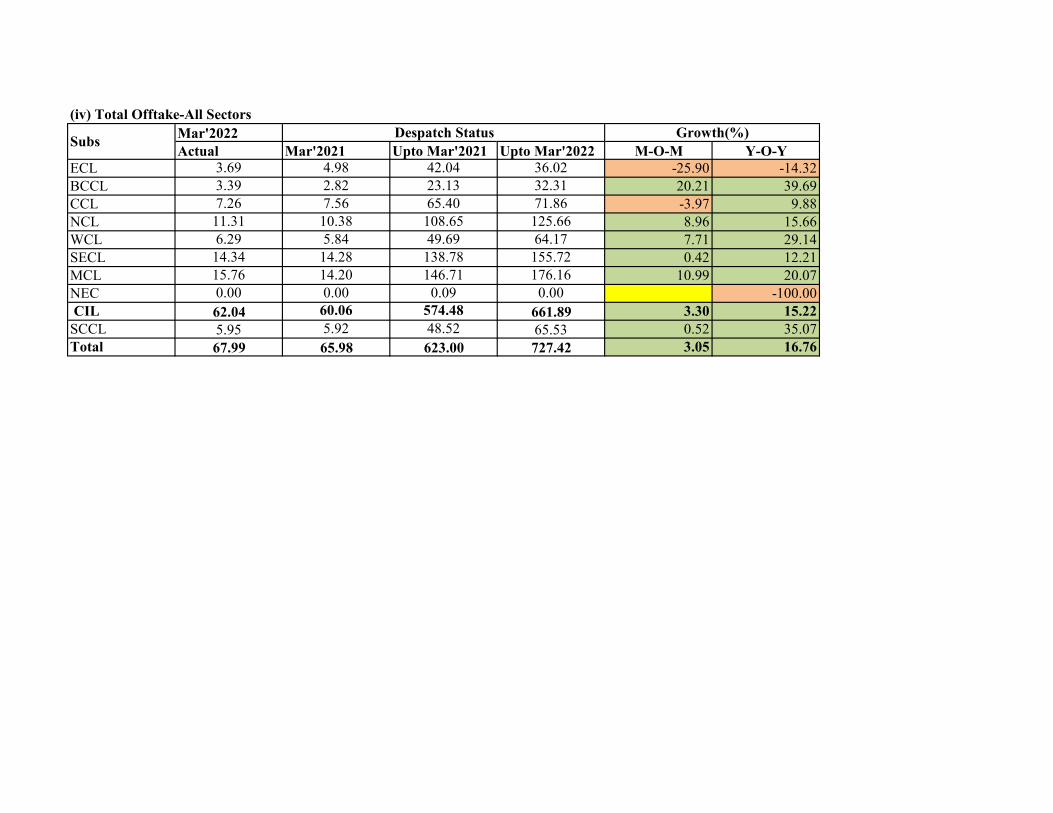
(iv) Total Offtake-All SectorsMar'2022Actual Mar'2021 Upto Mar'2021 Upto Mar'2022 M-O-M Y-O-Y
ECL 3.69 4.98 42.04 36.02 -25.90 -14.32BCCL 3.39 2.82 23.13 32.31 20.21 39.69CCL 7.26 7.56 65.40 71.86 -3.97 9.88NCL 11.31 10.38 108.65 125.66 8.96 15.66WCL 6.29 5.84 49.69 64.17 7.71 29.14SECL 14.34 14.28 138.78 155.72 0.42 12.21MCL 15.76 14.20 146.71 176.16 10.99 20.07NEC 0.00 0.00 0.09 0.00 -100.00 CIL 62.04 60.06 574.48 661.89 3.30 15.22SCCL 5.95 5.92 48.52 65.53 0.52 35.07Total 67.99 65.98 623.00 727.42 3.05 16.76
Subs Despatch Status Growth(%)
58
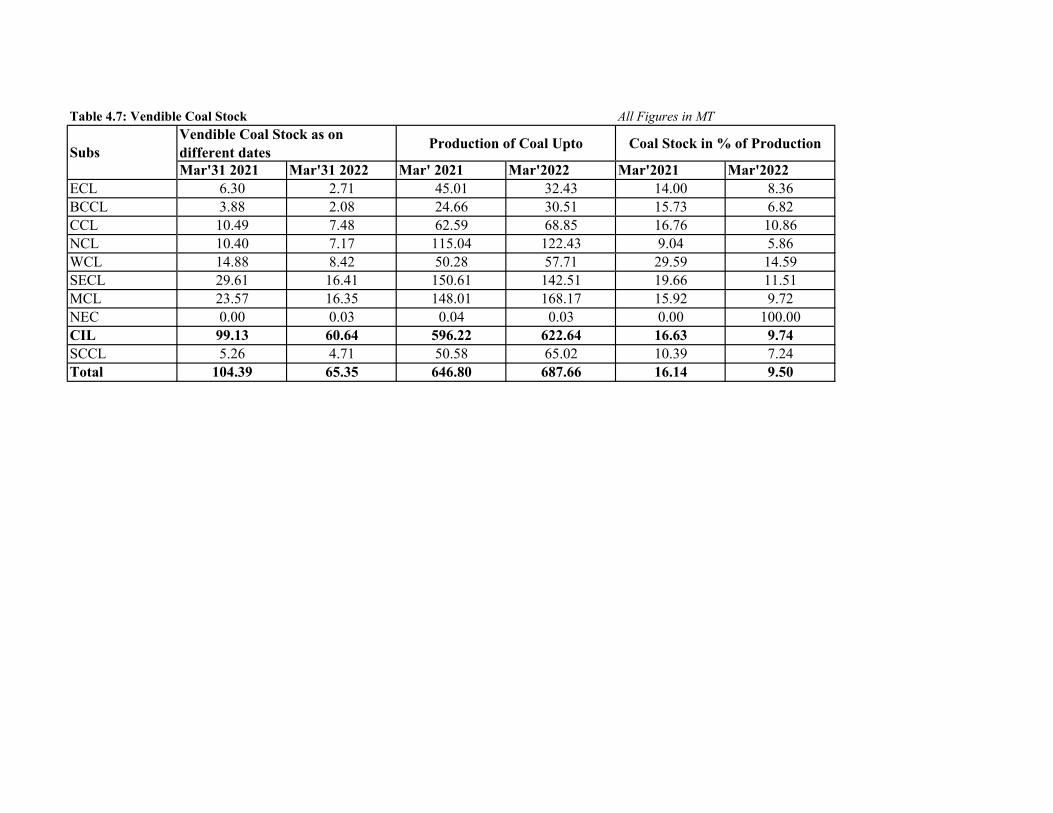
Table 4.7: Vendible Coal Stock
Mar'31 2021 Mar'31 2022 Mar' 2021 Mar'2022 Mar'2021 Mar'2022ECL 6.30 2.71 45.01 32.43 14.00 8.36BCCL 3.88 2.08 24.66 30.51 15.73 6.82CCL 10.49 7.48 62.59 68.85 16.76 10.86NCL 10.40 7.17 115.04 122.43 9.04 5.86WCL 14.88 8.42 50.28 57.71 29.59 14.59SECL 29.61 16.41 150.61 142.51 19.66 11.51MCL 23.57 16.35 148.01 168.17 15.92 9.72NEC 0.00 0.03 0.04 0.03 0.00 100.00CIL 99.13 60.64 596.22 622.64 16.63 9.74SCCL 5.26 4.71 50.58 65.02 10.39 7.24Total 104.39 65.35 646.80 687.66 16.14 9.50
All Figures in MTVendible Coal Stock as on different dates Production of Coal Upto Coal Stock in % of ProductionSubs
59
Performance of NLCIL

Performance of NLCILTable 5.1: Lignite Production (in MT)
Growth(%) Growth(%)Target Actual Achvm(%) Mar'2021 M-o-M Mar'2022 Mar'2021 Y-o-Y
Departmental 2.59 3.61 139.81 2.97 21.72 23.63 18.02 31.13Outsourced 0.13 0.19 148.80 0.11 67.57 1.48 1.24 19.40Total 2.71 3.80 140.22 3.08 23.38 25.11 19.26 30.37
Table 5.2: Production of Power (MU)Growth(%) Growth(%)
Target Actual Achvm(%) Mar'2021 M-o-M Mar'2022 Mar'2021 Y-o-YNLCIL 1641.52 1897.60 115.60 1560.18 21.63 20839.90 14031.42 48.52NTPL 679.00 307.83 45.34 497.20 -38.09 4182.46 5290.58 -20.95Total 2320.52 2205.43 95.04 2057.38 7.20 25022.36 19322.00 29.50
Table 5.3: Power from Renewable Sources (MU)Growth(%) Growth(%)
Target Actual Achvm(%) Mar'2021 M-o-M Mar'2022 Mar'2021 Y-o-YWind Power 1.49 1.86 124.83 0.92 102.17 85.23 96.91 -12.05Solar Power 195.82 212.53 108.53 204.21 4.07 2098.39 1964.78 6.80Total 197.31 214.39 108.66 205.13 4.51 2183.62 2061.69 5.91
Table 5.4: Productivity Growth(%) Growth(%)
Target Actual Achvm(%) Mar'2021 M-o-M Mar'2022 Mar'2021 Y-o-YMines (in te) 21.92 31.49 143.66 26.6 18.38 18.09 14.07 28.57TPP (Kwh) 40171 39834 99.16 30766 29.47 39662 25054 58.31
Productivity during Mar 2022 Upto Mar
Mode of Production
Company
Sources
Mode of Production
Upto Mar
During Mar 2022 Upto Mar
During Mar 2022 Upto Mar
During Mar 2022
60
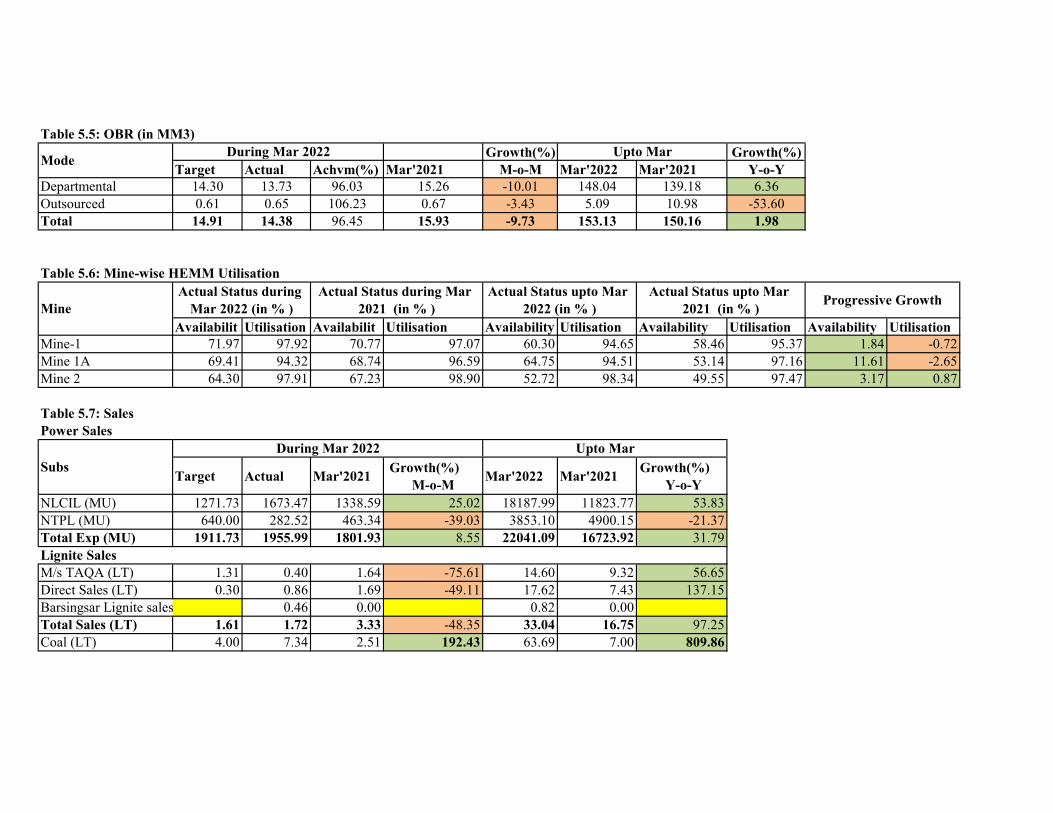
Table 5.5: OBR (in MM3)Growth(%) Growth(%)
Target Actual Achvm(%) Mar'2021 M-o-M Mar'2022 Mar'2021 Y-o-YDepartmental 14.30 13.73 96.03 15.26 -10.01 148.04 139.18 6.36Outsourced 0.61 0.65 106.23 0.67 -3.43 5.09 10.98 -53.60Total 14.91 14.38 96.45 15.93 -9.73 153.13 150.16 1.98
Table 5.6: Mine-wise HEMM Utilisation
Availabilit Utilisation Availabilit Utilisation Availability Utilisation Availability Utilisation Availability UtilisationMine-1 71.97 97.92 70.77 97.07 60.30 94.65 58.46 95.37 1.84 -0.72Mine 1A 69.41 94.32 68.74 96.59 64.75 94.51 53.14 97.16 11.61 -2.65Mine 2 64.30 97.91 67.23 98.90 52.72 98.34 49.55 97.47 3.17 0.87
Table 5.7: Sales Power Sales
Target Actual Mar'2021 Growth(%) M-o-M Mar'2022 Mar'2021 Growth(%)
Y-o-YNLCIL (MU) 1271.73 1673.47 1338.59 25.02 18187.99 11823.77 53.83NTPL (MU) 640.00 282.52 463.34 -39.03 3853.10 4900.15 -21.37Total Exp (MU) 1911.73 1955.99 1801.93 8.55 22041.09 16723.92 31.79
M/s TAQA (LT) 1.31 0.40 1.64 -75.61 14.60 9.32 56.65Direct Sales (LT) 0.30 0.86 1.69 -49.11 17.62 7.43 137.15Barsingsar Lignite sales 0.46 0.00 0.82 0.00Total Sales (LT) 1.61 1.72 3.33 -48.35 33.04 16.75 97.25Coal (LT) 4.00 7.34 2.51 192.43 63.69 7.00 809.86
Lignite Sales
Progressive Growth
During Mar 2022 Upto Mar
Mode
Mine
Subs
During Mar 2022 Upto Mar
Actual Status during Mar 2022 (in % )
Actual Status during Mar 2021 (in % )
Actual Status upto Mar 2022 (in % )
Actual Status upto Mar 2021 (in % )
61
Financial Performance
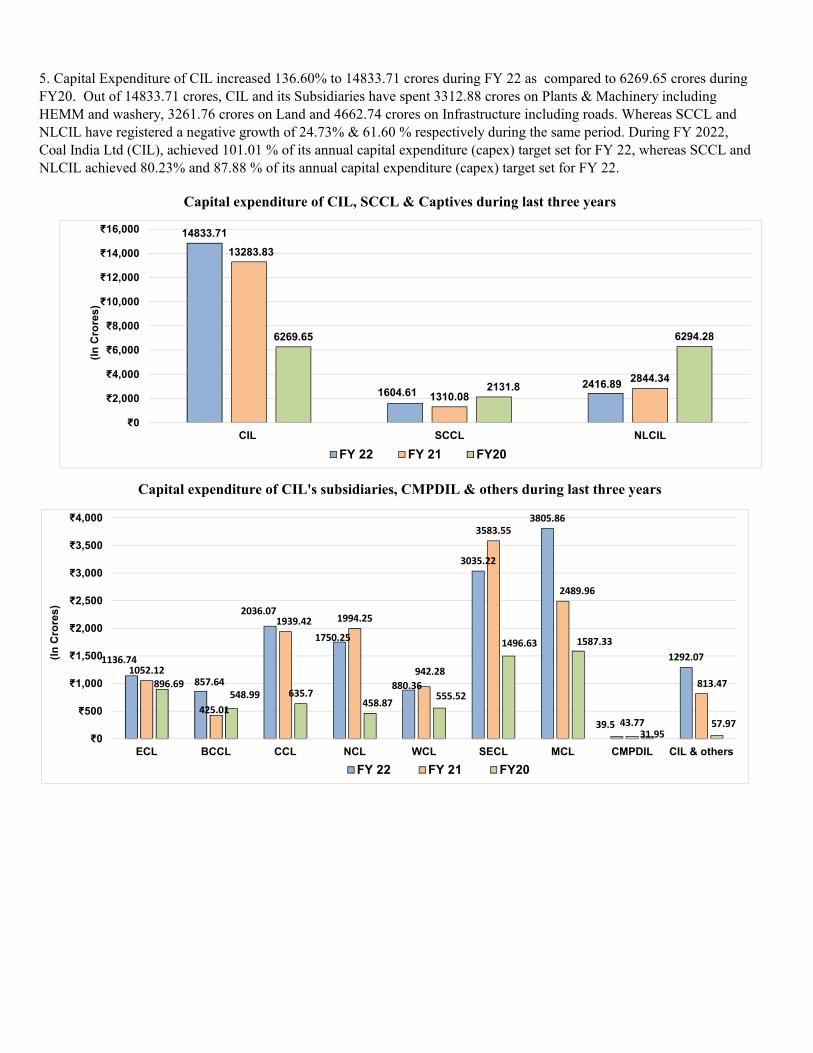
5. Capital Expenditure of CIL increased 136.60% to 14833.71 crores during FY 22 as compared to 6269.65 crores during FY20. Out of 14833.71 crores, CIL and its Subsidiaries have spent 3312.88 crores on Plants & Machinery including HEMM and washery, 3261.76 crores on Land and 4662.74 crores on Infrastructure including roads. Whereas SCCL and NLCIL have registered a negative growth of 24.73% & 61.60 % respectively during the same period. During FY 2022, Coal India Ltd (CIL), achieved 101.01 % of its annual capital expenditure (capex) target set for FY 22, whereas SCCL and NLCIL achieved 80.23% and 87.88 % of its annual capital expenditure (capex) target set for FY 22.
Capital expenditure of CIL, SCCL & Captives during last three years
Capital expenditure of CIL's subsidiaries, CMPDIL & others during last three years
1136.74
857.64
2036.07
1750.25
880.36
3035.22
3805.86
39.5
1292.071052.12
425.01
1939.42 1994.25
942.28
3583.55
2489.96
43.77
813.47896.69548.99 635.7
458.87555.52
1496.63 1587.33
31.9557.97
₹0
₹500
₹1,000
₹1,500
₹2,000
₹2,500
₹3,000
₹3,500
₹4,000
ECL BCCL CCL NCL WCL SECL MCL CMPDIL CIL & others
(In C
rore
s)
FY 22 FY 21 FY20
14833.71
1604.612416.89
13283.83
1310.082844.34
6269.65
2131.8
6294.28
₹0
₹2,000
₹4,000
₹6,000
₹8,000
₹10,000
₹12,000
₹14,000
₹16,000
CIL SCCL NLCIL
(In C
rore
s)
FY 22 FY 21 FY20
62
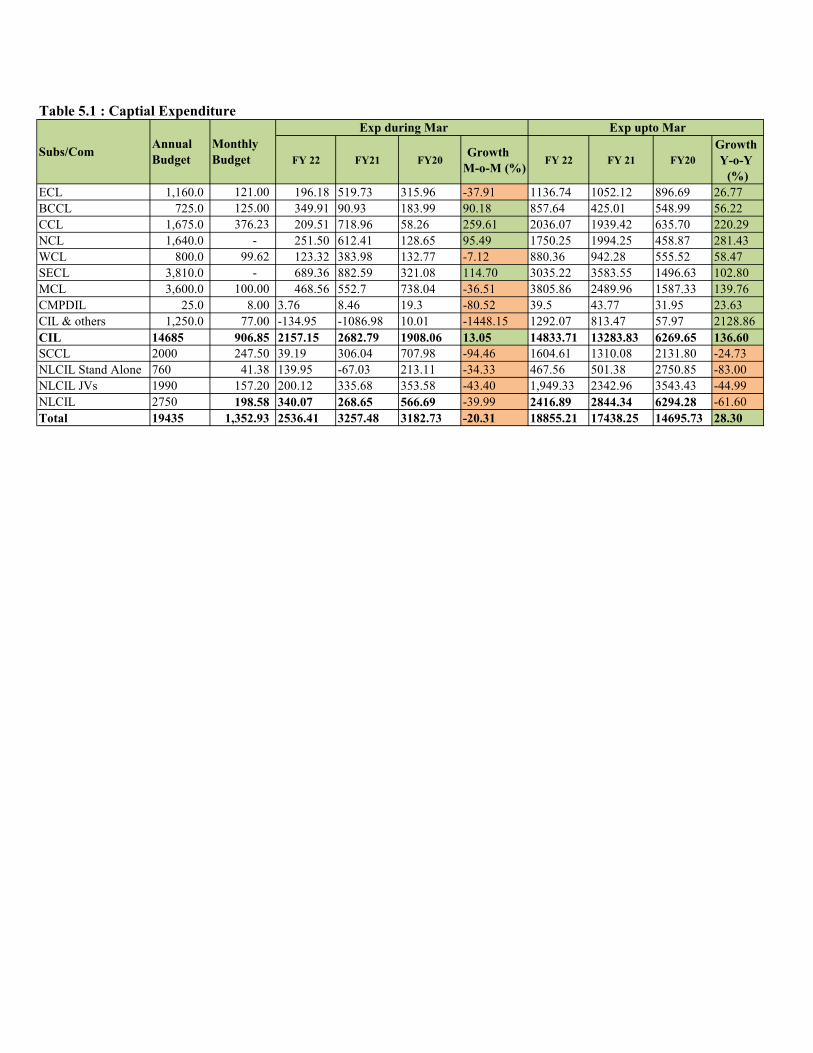
FY 22 FY21 FY20Growth
M-o-M (%)FY 22 FY 21 FY20
Growth Y-o-Y
(%)ECL 1,160.0 121.00 196.18 519.73 315.96 -37.91 1136.74 1052.12 896.69 26.77BCCL 725.0 125.00 349.91 90.93 183.99 90.18 857.64 425.01 548.99 56.22CCL 1,675.0 376.23 209.51 718.96 58.26 259.61 2036.07 1939.42 635.70 220.29NCL 1,640.0 - 251.50 612.41 128.65 95.49 1750.25 1994.25 458.87 281.43WCL 800.0 99.62 123.32 383.98 132.77 -7.12 880.36 942.28 555.52 58.47SECL 3,810.0 - 689.36 882.59 321.08 114.70 3035.22 3583.55 1496.63 102.80MCL 3,600.0 100.00 468.56 552.7 738.04 -36.51 3805.86 2489.96 1587.33 139.76CMPDIL 25.0 8.00 3.76 8.46 19.3 -80.52 39.5 43.77 31.95 23.63CIL & others 1,250.0 77.00 -134.95 -1086.98 10.01 -1448.15 1292.07 813.47 57.97 2128.86CIL 14685 906.85 2157.15 2682.79 1908.06 13.05 14833.71 13283.83 6269.65 136.60SCCL 2000 247.50 39.19 306.04 707.98 -94.46 1604.61 1310.08 2131.80 -24.73NLCIL Stand Alone 760 41.38 139.95 -67.03 213.11 -34.33 467.56 501.38 2750.85 -83.00NLCIL JVs 1990 157.20 200.12 335.68 353.58 -43.40 1,949.33 2342.96 3543.43 -44.99NLCIL 2750 198.58 340.07 268.65 566.69 -39.99 2416.89 2844.34 6294.28 -61.60Total 19435 1,352.93 2536.41 3257.48 3182.73 -20.31 18855.21 17438.25 14695.73 28.30
Table 5.1 : Captial Expenditure
Subs/Com Annual Budget
Monthly Budget
Exp during Mar Exp upto Mar
63
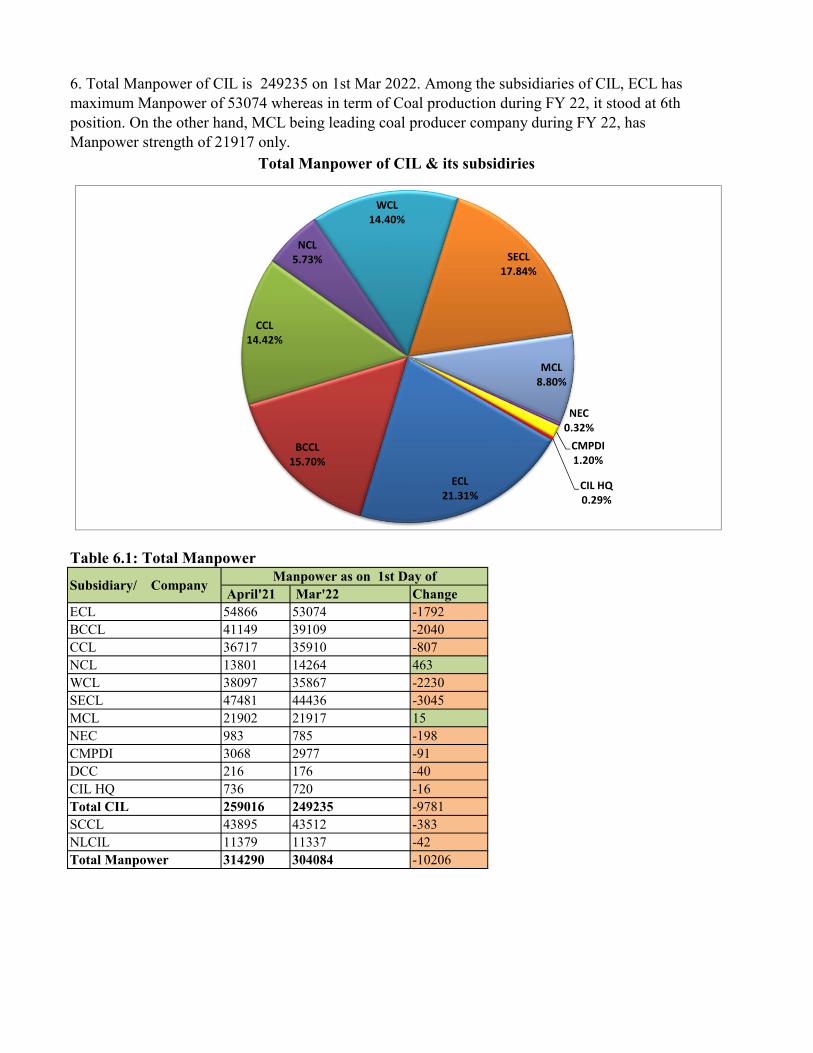
April'21 Mar'22 ChangeECL 54866 53074 -1792BCCL 41149 39109 -2040CCL 36717 35910 -807NCL 13801 14264 463WCL 38097 35867 -2230SECL 47481 44436 -3045MCL 21902 21917 15NEC 983 785 -198CMPDI 3068 2977 -91DCC 216 176 -40CIL HQ 736 720 -16Total CIL 259016 249235 -9781SCCL 43895 43512 -383NLCIL 11379 11337 -42Total Manpower 314290 304084 -10206
6. Total Manpower of CIL is 249235 on 1st Mar 2022. Among the subsidiaries of CIL, ECL has maximum Manpower of 53074 whereas in term of Coal production during FY 22, it stood at 6th position. On the other hand, MCL being leading coal producer company during FY 22, has Manpower strength of 21917 only.
Total Manpower of CIL & its subsidiries
Table 6.1: Total Manpower
Subsidiary/ Company Manpower as on 1st Day of
ECL21.31%
BCCL15.70%
CCL14.42%
NCL5.73%
WCL14.40%
SECL17.84%
MCL8.80%
NEC0.32%
CMPDI1.20%
CIL HQ0.29%
64
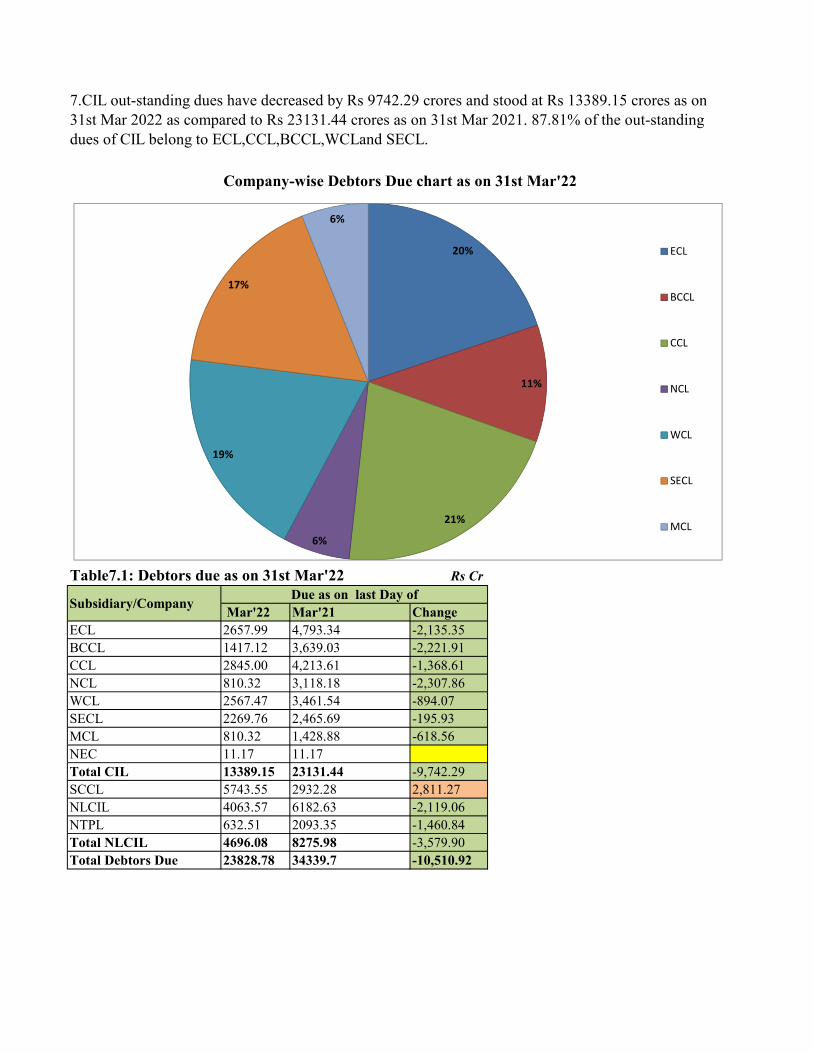
Rs Cr
Mar'22 Mar'21 ChangeECL 2657.99 4,793.34 -2,135.35BCCL 1417.12 3,639.03 -2,221.91CCL 2845.00 4,213.61 -1,368.61NCL 810.32 3,118.18 -2,307.86WCL 2567.47 3,461.54 -894.07SECL 2269.76 2,465.69 -195.93MCL 810.32 1,428.88 -618.56NEC 11.17 11.17Total CIL 13389.15 23131.44 -9,742.29SCCL 5743.55 2932.28 2,811.27NLCIL 4063.57 6182.63 -2,119.06NTPL 632.51 2093.35 -1,460.84Total NLCIL 4696.08 8275.98 -3,579.90Total Debtors Due 23828.78 34339.7 -10,510.92
Company-wise Debtors Due chart as on 31st Mar'22
Table7.1: Debtors due as on 31st Mar'22
Subsidiary/Company Due as on last Day of
7.CIL out-standing dues have decreased by Rs 9742.29 crores and stood at Rs 13389.15 crores as on 31st Mar 2022 as compared to Rs 23131.44 crores as on 31st Mar 2021. 87.81% of the out-standing dues of CIL belong to ECL,CCL,BCCL,WCLand SECL.
20%
11%
21%
6%
19%
17%
6%
ECL
BCCL
CCL
NCL
WCL
SECL
MCL
65
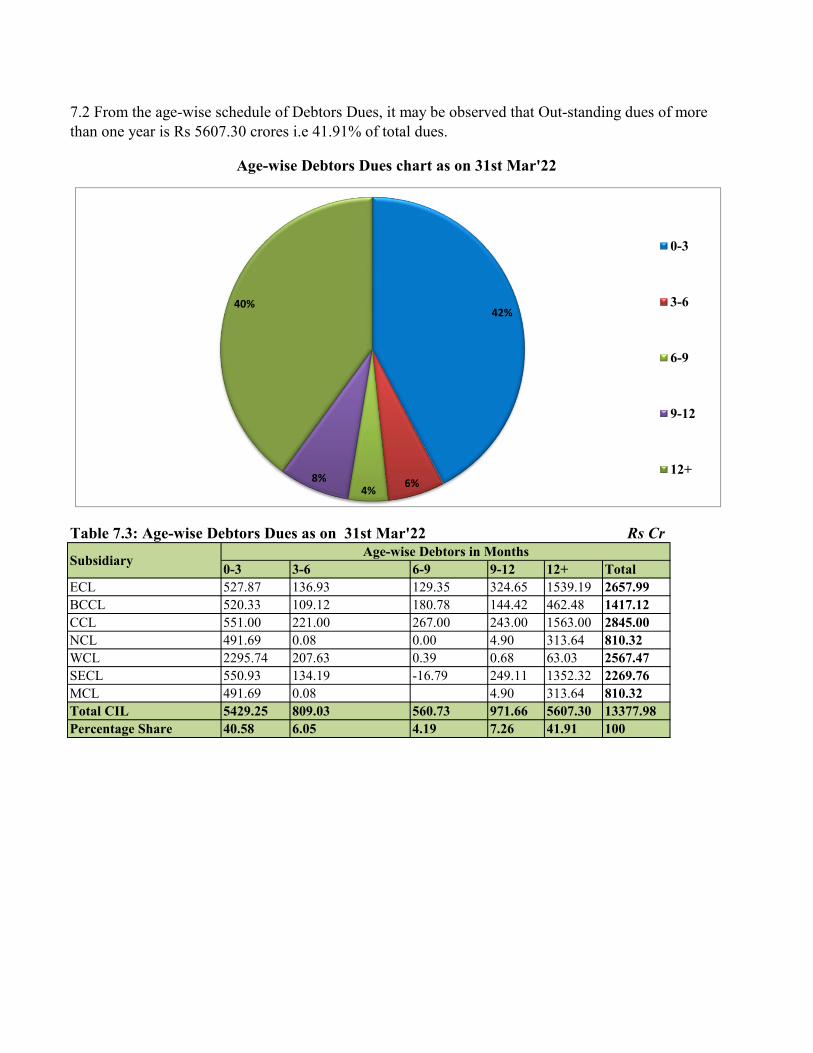
Rs Cr
0-3 3-6 6-9 9-12 12+ TotalECL 527.87 136.93 129.35 324.65 1539.19 2657.99BCCL 520.33 109.12 180.78 144.42 462.48 1417.12CCL 551.00 221.00 267.00 243.00 1563.00 2845.00NCL 491.69 0.08 0.00 4.90 313.64 810.32WCL 2295.74 207.63 0.39 0.68 63.03 2567.47SECL 550.93 134.19 -16.79 249.11 1352.32 2269.76MCL 491.69 0.08 4.90 313.64 810.32Total CIL 5429.25 809.03 560.73 971.66 5607.30 13377.98Percentage Share 40.58 6.05 4.19 7.26 41.91 100
Table 7.3: Age-wise Debtors Dues as on 31st Mar'22
Subsidiary Age-wise Debtors in Months
7.2 From the age-wise schedule of Debtors Dues, it may be observed that Out-standing dues of more than one year is Rs 5607.30 crores i.e 41.91% of total dues.
Age-wise Debtors Dues chart as on 31st Mar'22
42%
6%4%8%
40%
0-3
3-6
6-9
9-12
12+
66
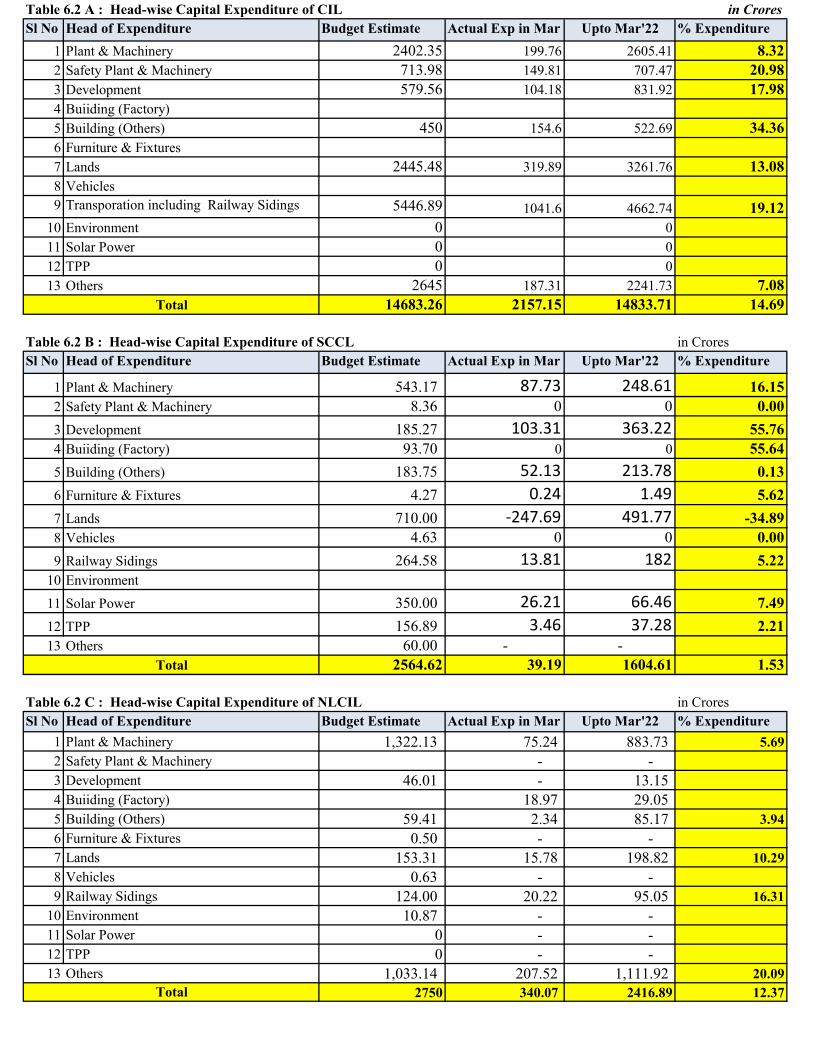
Table 6.2 A : Head-wise Capital Expenditure of CIL in Crores
1 Plant & Machinery 2402.35 199.76 2605.41 8.322 Safety Plant & Machinery 713.98 149.81 707.47 20.983 Development 579.56 104.18 831.92 17.984 Buiiding (Factory)5 Building (Others) 450 154.6 522.69 34.366 Furniture & Fixtures7 Lands 2445.48 319.89 3261.76 13.088 Vehicles9 Transporation including Railway Sidings
etc.5446.89 1041.6 4662.74 19.12
10 Environment 0 011 Solar Power 0 012 TPP 0 013 Others 2645 187.31 2241.73 7.08
14683.26 2157.15 14833.71 14.69
Table 6.2 B : Head-wise Capital Expenditure of SCCL in Crores
1 Plant & Machinery 543.17 87.73 248.61 16.152 Safety Plant & Machinery 8.36 0 0 0.003 Development 185.27 103.31 363.22 55.764 Buiiding (Factory) 93.70 0 0 55.645 Building (Others) 183.75 52.13 213.78 0.136 Furniture & Fixtures 4.27 0.24 1.49 5.627 Lands 710.00 -247.69 491.77 -34.898 Vehicles 4.63 0 0 0.009 Railway Sidings 264.58 13.81 182 5.22
10 Environment11 Solar Power 350.00 26.21 66.46 7.4912 TPP 156.89 3.46 37.28 2.2113 Others 60.00 - -
2564.62 39.19 1604.61 1.53
Table 6.2 C : Head-wise Capital Expenditure of NLCIL in Crores
1 Plant & Machinery 1,322.13 75.24 883.73 5.692 Safety Plant & Machinery - - 3 Development 46.01 - 13.15 4 Buiiding (Factory) 18.97 29.05 5 Building (Others) 59.41 2.34 85.17 3.946 Furniture & Fixtures 0.50 - - 7 Lands 153.31 15.78 198.82 10.298 Vehicles 0.63 - - 9 Railway Sidings 124.00 20.22 95.05 16.31
10 Environment 10.87 - - 11 Solar Power 0 - - 12 TPP 0 - - 13 Others 1,033.14 207.52 1,111.92 20.09
2750 340.07 2416.89 12.37Total
Upto Mar'22
Head of Expenditure
Total
% Expenditure
Sl No
Budget Estimate
% Expenditure
Sl No
Budget Estimate
Upto Mar'22
Head of Expenditure
Actual Exp in Mar
Budget Estimate Sl No Upto Mar'22 % ExpenditureActual Exp in Mar
Actual Exp in Mar
Total
Head of Expenditure
67
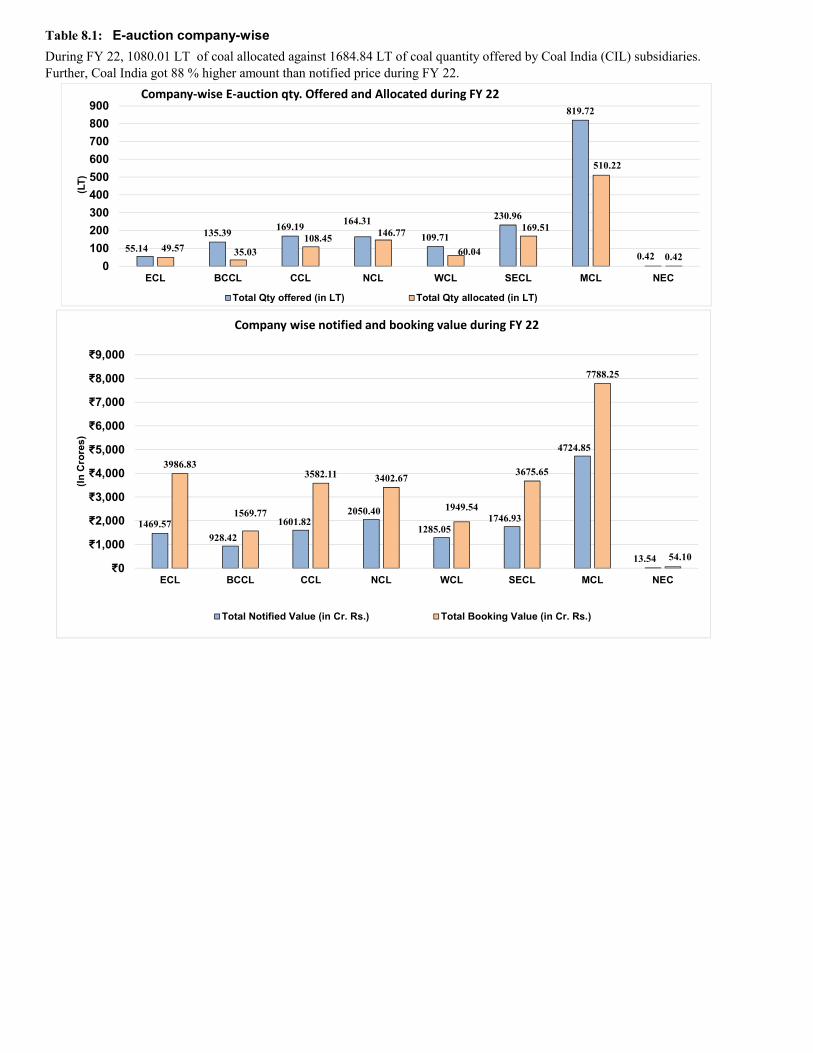
Table 8.1: E-auction company-wise During FY 22, 1080.01 LT of coal allocated against 1684.84 LT of coal quantity offered by Coal India (CIL) subsidiaries. Further, Coal India got 88 % higher amount than notified price during FY 22.
55.14135.39 169.19 164.31
109.71
230.96
819.72
0.4249.57 35.03
108.45 146.77
60.04
169.51
510.22
0.420
100200300400500600700800900
ECL BCCL CCL NCL WCL SECL MCL NEC
(LT)
Company-wise E-auction qty. Offered and Allocated during FY 22
Total Qty offered (in LT) Total Qty allocated (in LT)
1469.57928.42
1601.822050.40
1285.051746.93
4724.85
13.54
3986.83
1569.77
3582.11 3402.67
1949.54
3675.65
7788.25
54.10₹0
₹1,000
₹2,000
₹3,000
₹4,000
₹5,000
₹6,000
₹7,000
₹8,000
₹9,000
ECL BCCL CCL NCL WCL SECL MCL NEC
(In C
rore
s)
Company wise notified and booking value during FY 22
Total Notified Value (in Cr. Rs.) Total Booking Value (in Cr. Rs.)
68
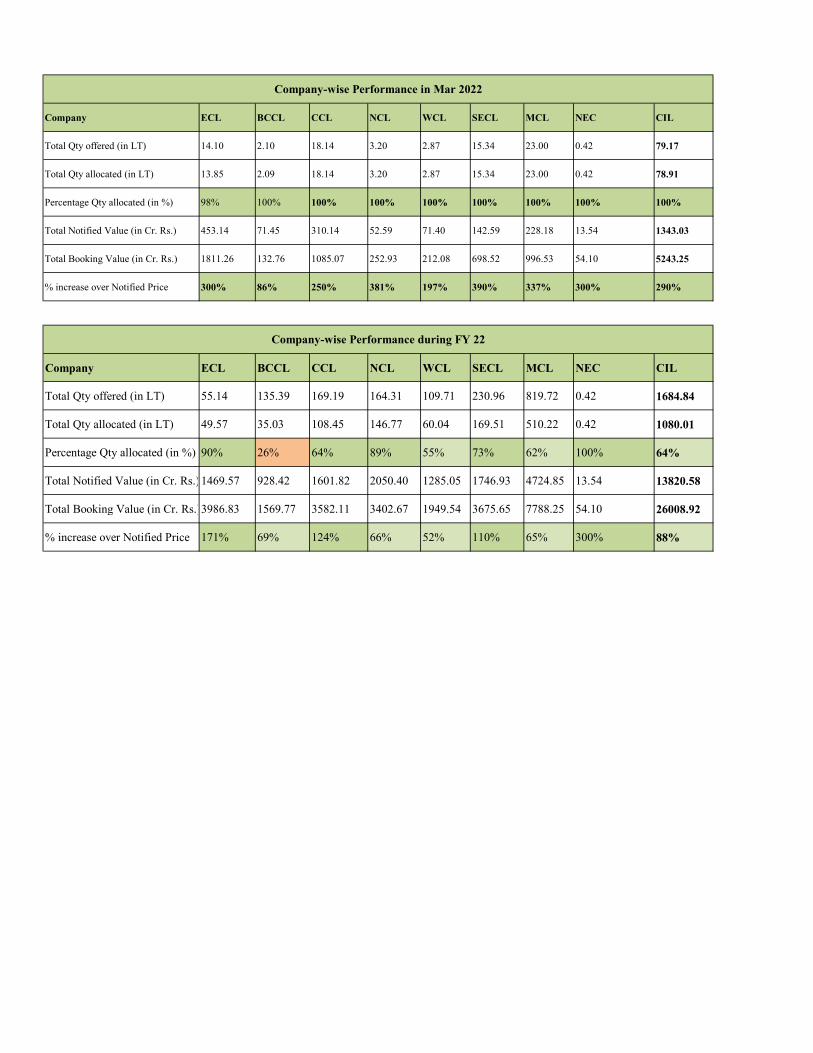
Company ECL BCCL CCL NCL WCL SECL MCL NEC CIL
Total Qty offered (in LT) 14.10 2.10 18.14 3.20 2.87 15.34 23.00 0.42 79.17
Total Qty allocated (in LT) 13.85 2.09 18.14 3.20 2.87 15.34 23.00 0.42 78.91
Percentage Qty allocated (in %) 98% 100% 100% 100% 100% 100% 100% 100% 100%
Total Notified Value (in Cr. Rs.) 453.14 71.45 310.14 52.59 71.40 142.59 228.18 13.54 1343.03
Total Booking Value (in Cr. Rs.) 1811.26 132.76 1085.07 252.93 212.08 698.52 996.53 54.10 5243.25
% increase over Notified Price 300% 86% 250% 381% 197% 390% 337% 300% 290%
Company ECL BCCL CCL NCL WCL SECL MCL NEC CIL
Total Qty offered (in LT) 55.14 135.39 169.19 164.31 109.71 230.96 819.72 0.42 1684.84
Total Qty allocated (in LT) 49.57 35.03 108.45 146.77 60.04 169.51 510.22 0.42 1080.01
Percentage Qty allocated (in %) 90% 26% 64% 89% 55% 73% 62% 100% 64%
Total Notified Value (in Cr. Rs.) 1469.57 928.42 1601.82 2050.40 1285.05 1746.93 4724.85 13.54 13820.58
Total Booking Value (in Cr. Rs.)3986.83 1569.77 3582.11 3402.67 1949.54 3675.65 7788.25 54.10 26008.92
% increase over Notified Price 171% 69% 124% 66% 52% 110% 65% 300% 88%
Company-wise Performance in Mar 2022
Company-wise Performance during FY 22
69

Electricity Generation
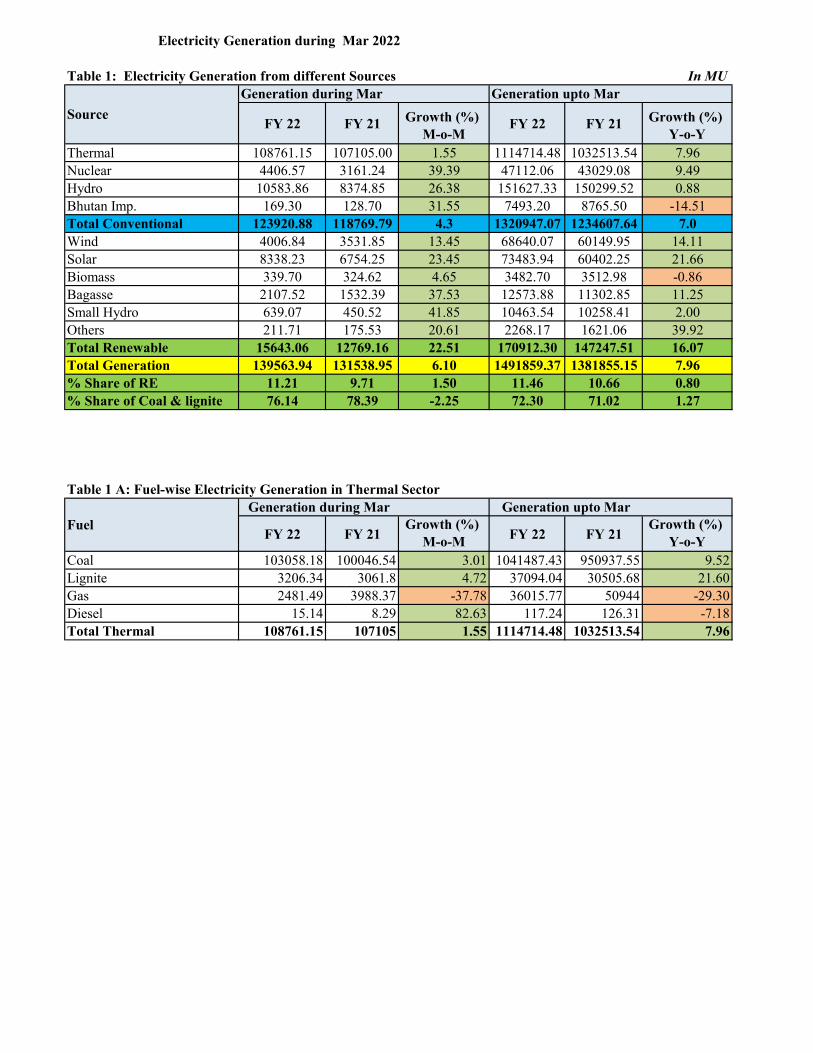
Table 1: Electricity Generation from different Sources In MUGeneration during Mar Generation upto Mar
FY 22 FY 21 Growth (%) M-o-M
FY 22 FY 21 Growth (%) Y-o-Y
Thermal 108761.15 107105.00 1.55 1114714.48 1032513.54 7.96Nuclear 4406.57 3161.24 39.39 47112.06 43029.08 9.49Hydro 10583.86 8374.85 26.38 151627.33 150299.52 0.88Bhutan Imp. 169.30 128.70 31.55 7493.20 8765.50 -14.51Total Conventional 123920.88 118769.79 4.3 1320947.07 1234607.64 7.0Wind 4006.84 3531.85 13.45 68640.07 60149.95 14.11Solar 8338.23 6754.25 23.45 73483.94 60402.25 21.66Biomass 339.70 324.62 4.65 3482.70 3512.98 -0.86Bagasse 2107.52 1532.39 37.53 12573.88 11302.85 11.25Small Hydro 639.07 450.52 41.85 10463.54 10258.41 2.00Others 211.71 175.53 20.61 2268.17 1621.06 39.92Total Renewable 15643.06 12769.16 22.51 170912.30 147247.51 16.07Total Generation 139563.94 131538.95 6.10 1491859.37 1381855.15 7.96% Share of RE 11.21 9.71 1.50 11.46 10.66 0.80% Share of Coal & lignite 76.14 78.39 -2.25 72.30 71.02 1.27
Table 1 A: Fuel-wise Electricity Generation in Thermal Sector
FY 22 FY 21Growth (%)
M-o-M FY 22 FY 21Growth (%)
Y-o-YCoal 103058.18 100046.54 3.01 1041487.43 950937.55 9.52Lignite 3206.34 3061.8 4.72 37094.04 30505.68 21.60Gas 2481.49 3988.37 -37.78 36015.77 50944 -29.30Diesel 15.14 8.29 82.63 117.24 126.31 -7.18Total Thermal 108761.15 107105 1.55 1114714.48 1032513.54 7.96
Electricity Generation during Mar 2022
Source
FuelGeneration during Mar Generation upto Mar
70
Status of Import Coal
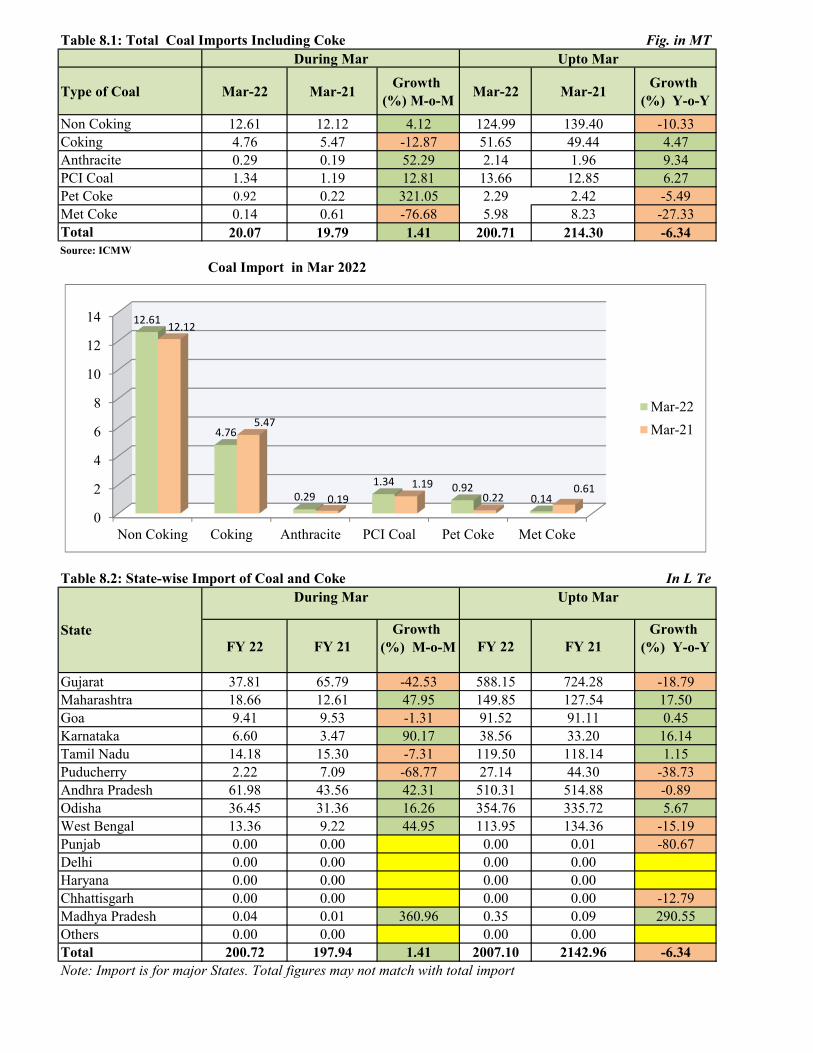
Table 8.1: Total Coal Imports Including Coke Fig. in MT
Type of Coal Mar-22 Mar-21 Growth (%) M-o-M Mar-22 Mar-21 Growth
(%) Y-o-YNon Coking 12.61 12.12 4.12 124.99 139.40 -10.33Coking 4.76 5.47 -12.87 51.65 49.44 4.47Anthracite 0.29 0.19 52.29 2.14 1.96 9.34PCI Coal 1.34 1.19 12.81 13.66 12.85 6.27Pet Coke 0.92 0.22 321.05 2.29 2.42 -5.49Met Coke 0.14 0.61 -76.68 5.98 8.23 -27.33Total 20.07 19.79 1.41 200.71 214.30 -6.34Source: ICMW
Table 8.2: State-wise Import of Coal and Coke In L Te
FY 22 FY 21Growth
(%) M-o-M FY 22 FY 21Growth
(%) Y-o-Y
Gujarat 37.81 65.79 -42.53 588.15 724.28 -18.79Maharashtra 18.66 12.61 47.95 149.85 127.54 17.50Goa 9.41 9.53 -1.31 91.52 91.11 0.45Karnataka 6.60 3.47 90.17 38.56 33.20 16.14Tamil Nadu 14.18 15.30 -7.31 119.50 118.14 1.15Puducherry 2.22 7.09 -68.77 27.14 44.30 -38.73Andhra Pradesh 61.98 43.56 42.31 510.31 514.88 -0.89Odisha 36.45 31.36 16.26 354.76 335.72 5.67West Bengal 13.36 9.22 44.95 113.95 134.36 -15.19Punjab 0.00 0.00 0.00 0.01 -80.67Delhi 0.00 0.00 0.00 0.00Haryana 0.00 0.00 0.00 0.00Chhattisgarh 0.00 0.00 0.00 0.00 -12.79Madhya Pradesh 0.04 0.01 360.96 0.35 0.09 290.55Others 0.00 0.00 0.00 0.00Total 200.72 197.94 1.41 2007.10 2142.96 -6.34Note: Import is for major States. Total figures may not match with total import
During Mar
Coal Import in Mar 2022
State
During Mar
Upto Mar
Upto Mar
0
2
4
6
8
10
12
14
Non Coking Coking Anthracite PCI Coal Pet Coke Met Coke
12.61
4.76
0.291.34 0.92
0.14
12.12
5.47
0.191.19
0.220.61
Mar-22Mar-21
71
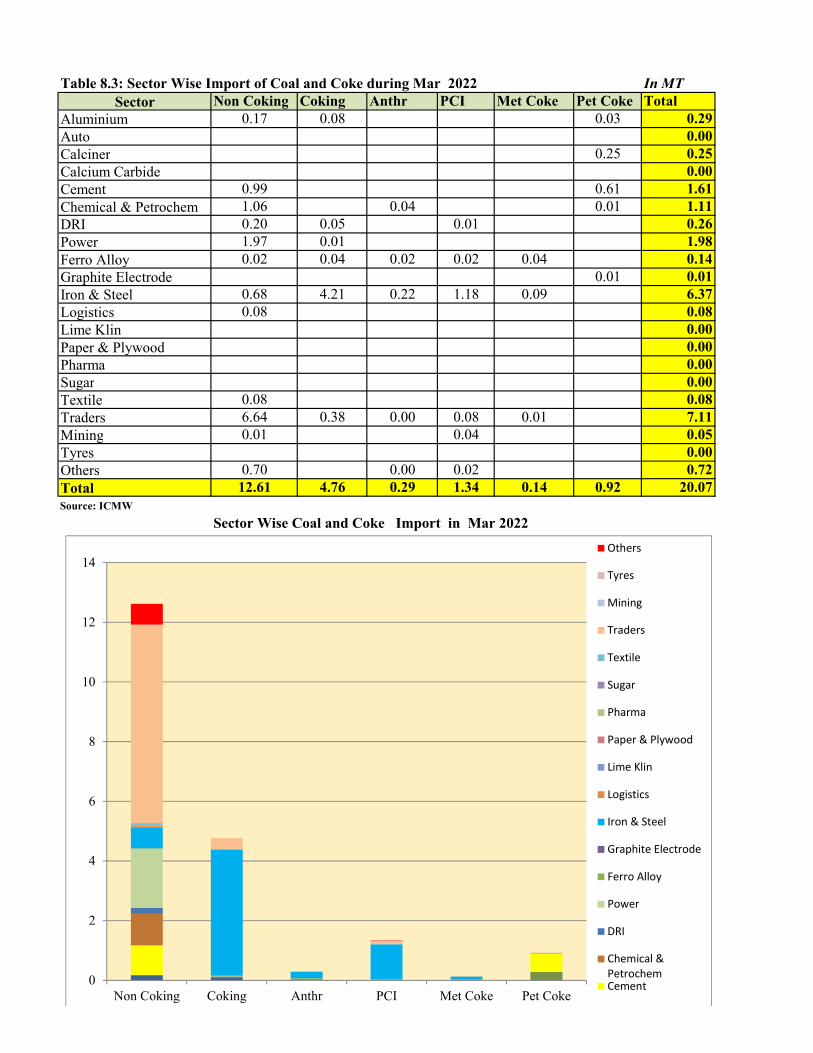
Table 8.3: Sector Wise Import of Coal and Coke during Mar 2022 In MTSector Non Coking Coking Anthr PCI Met Coke Pet Coke Total
Aluminium 0.17 0.08 0.03 0.29Auto 0.00Calciner 0.25 0.25Calcium Carbide 0.00Cement 0.99 0.61 1.61Chemical & Petrochem 1.06 0.04 0.01 1.11DRI 0.20 0.05 0.01 0.26Power 1.97 0.01 1.98Ferro Alloy 0.02 0.04 0.02 0.02 0.04 0.14Graphite Electrode 0.01 0.01Iron & Steel 0.68 4.21 0.22 1.18 0.09 6.37Logistics 0.08 0.08Lime Klin 0.00Paper & Plywood 0.00Pharma 0.00Sugar 0.00Textile 0.08 0.08Traders 6.64 0.38 0.00 0.08 0.01 7.11Mining 0.01 0.04 0.05Tyres 0.00Others 0.70 0.00 0.02 0.72Total 12.61 4.76 0.29 1.34 0.14 0.92 20.07Source: ICMW
Sector Wise Coal and Coke Import in Mar 2022
0
2
4
6
8
10
12
14
Non Coking Coking Anthr PCI Met Coke Pet Coke
Others
Tyres
Mining
Traders
Textile
Sugar
Pharma
Paper & Plywood
Lime Klin
Logistics
Iron & Steel
Graphite Electrode
Ferro Alloy
Power
DRI
Chemical &PetrochemCement
72

Table 8.4: Grade-wise Non-Coking Coal Import during Mar 2022.
Port G1 G2 G3 G4 G5 G6 G7 G8 G9 G11 G12 G13 G14 G15Not Known
Total
Bedi 0.15 0.15Bhavnagar 1.54 1.54Dhamra 6.52 6.52Ennore 7.05 7.05Gangavaram 0.45 1.00 4.62 0.54 4.10 0.83 11.54Hazira 6.01 6.01Jafrabad 0.05 0.05Jaigad 5.97 5.97Jakhau 0.20 0.20Kandla 0.0025 2.027 0.612 1.02 1.80 0.38 1.93 1.36 0.36 0.55 0.78 0.32 0.26 11.40Karaikal 2.22 2.22Kolkata 0.51 0.82 0.30 0.20 2.43 4.26Krishnapatnam 0.73 1.56 0.74 11.62 14.64Marmagoa 4.28 4.28Muldwarka 0.05 0.05Mumbai & Jnpt 3.19 3.19Mundra 1.01 2.60 1.86 0.80 6.27Navlakhi 7.64 7.64New Mangalore 0.27 0.51 0.20 0.38 3.26 4.63Okha 0.35 0.35Others 5.25 5.25Paradip 5.83 5.83Sikka 0.15 0.15Tuticorin / Voc 4.25 4.25Vizag 4.61 2.93 0.86 1.77 0.86 0.30 0.98 0.43 12.75Total 0.00 2.03 0.61 0.45 1.00 11.77 6.36 8.24 6.90 3.76 0.86 3.08 2.32 0.52 78.24 126.15Source: ICMW
In Lakh Te
73
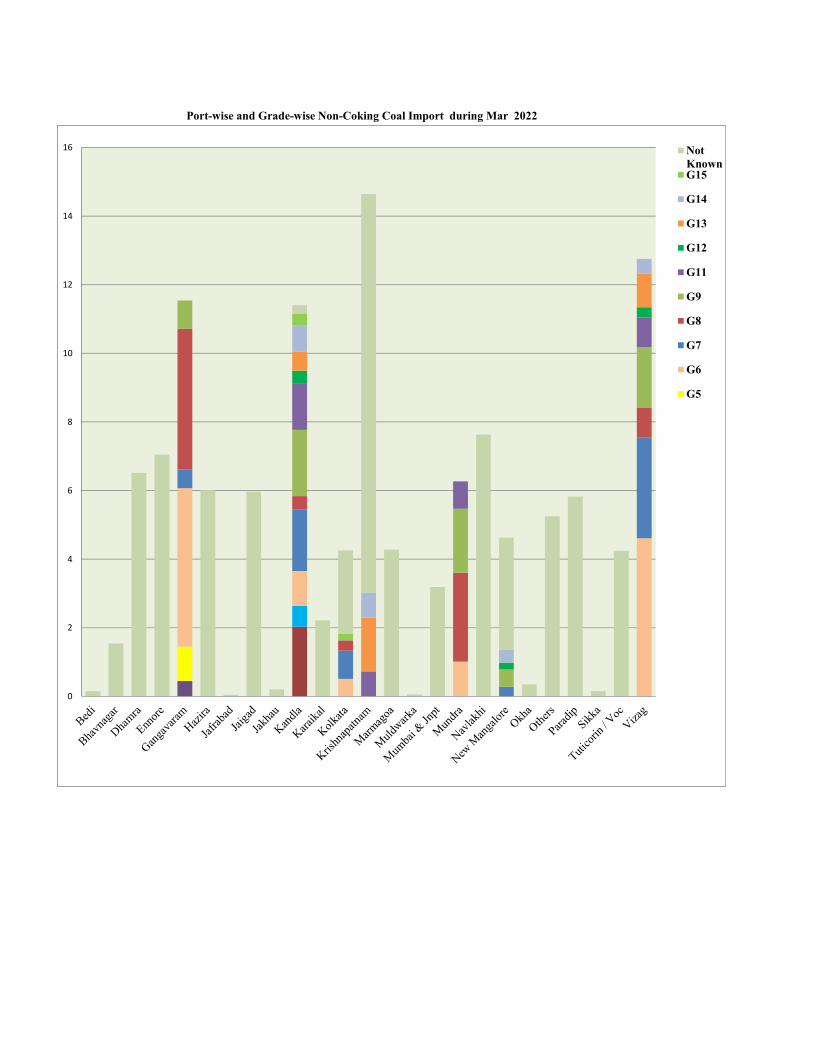
Port-wise and Grade-wise Non-Coking Coal Import during Mar 2022
0
2
4
6
8
10
12
14
16 NotKnownG15
G14
G13
G12
G11
G9
G8
G7
G6
G5
74
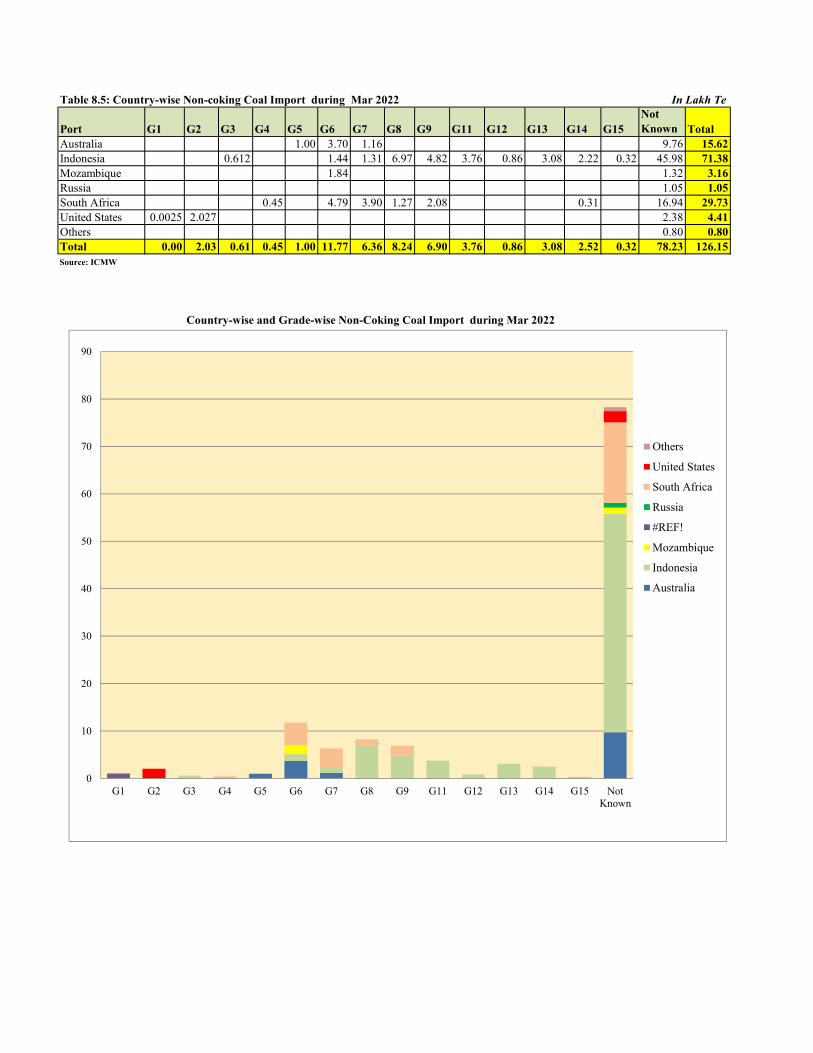
Table 8.5: Country-wise Non-coking Coal Import during Mar 2022 In Lakh Te
Port G1 G2 G3 G4 G5 G6 G7 G8 G9 G11 G12 G13 G14 G15Not Known Total
Australia 1.00 3.70 1.16 9.76 15.62Indonesia 0.612 1.44 1.31 6.97 4.82 3.76 0.86 3.08 2.22 0.32 45.98 71.38Mozambique 1.84 1.32 3.16Russia 1.05 1.05South Africa 0.45 4.79 3.90 1.27 2.08 0.31 16.94 29.73United States 0.0025 2.027 2.38 4.41Others 0.80 0.80Total 0.00 2.03 0.61 0.45 1.00 11.77 6.36 8.24 6.90 3.76 0.86 3.08 2.52 0.32 78.23 126.15Source: ICMW
Country-wise and Grade-wise Non-Coking Coal Import during Mar 2022
0
10
20
30
40
50
60
70
80
90
G1 G2 G3 G4 G5 G6 G7 G8 G9 G11 G12 G13 G14 G15 NotKnown
Others
United States
South Africa
Russia
#REF!
Mozambique
Indonesia
Australia
75
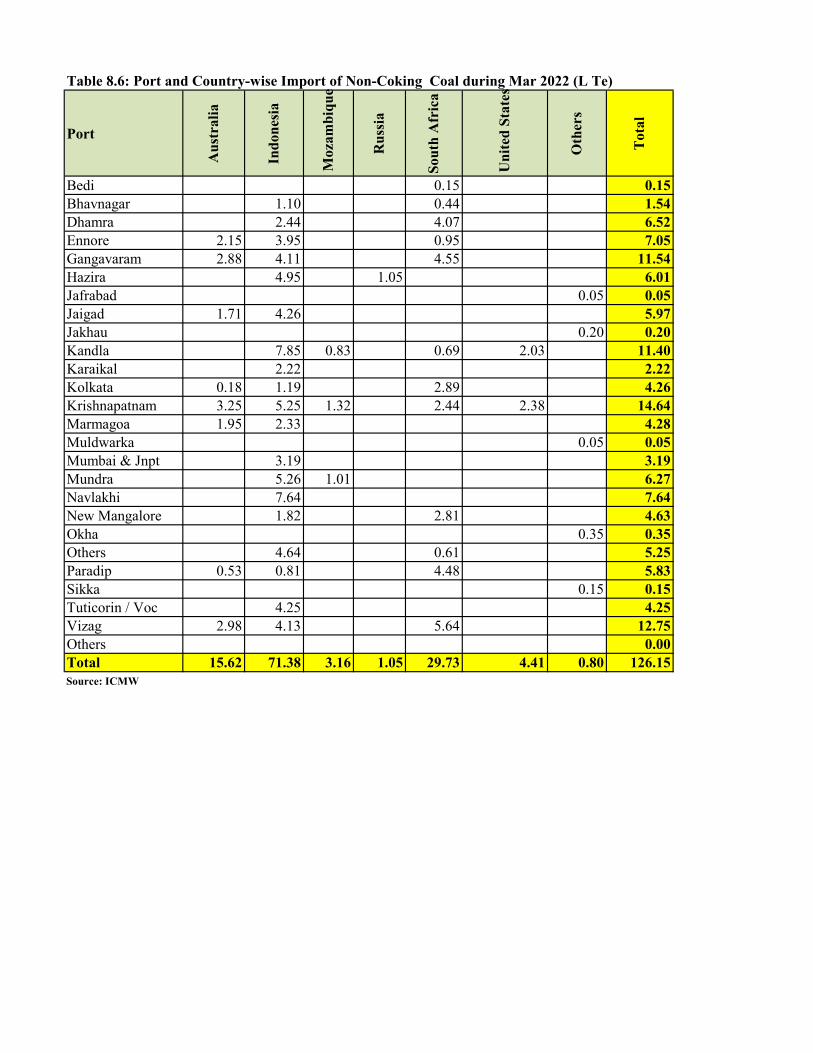
Table 8.6: Port and Country-wise Import of Non-Coking Coal during Mar 2022 (L Te)
Port
Aus
tral
ia
Indo
nesi
a
Moz
ambi
que
Rus
sia
Sout
h A
fric
a
Uni
ted
Stat
es
Oth
ers
Tot
al
Bedi 0.15 0.15Bhavnagar 1.10 0.44 1.54Dhamra 2.44 4.07 6.52Ennore 2.15 3.95 0.95 7.05Gangavaram 2.88 4.11 4.55 11.54Hazira 4.95 1.05 6.01Jafrabad 0.05 0.05Jaigad 1.71 4.26 5.97Jakhau 0.20 0.20Kandla 7.85 0.83 0.69 2.03 11.40Karaikal 2.22 2.22Kolkata 0.18 1.19 2.89 4.26Krishnapatnam 3.25 5.25 1.32 2.44 2.38 14.64Marmagoa 1.95 2.33 4.28Muldwarka 0.05 0.05Mumbai & Jnpt 3.19 3.19Mundra 5.26 1.01 6.27Navlakhi 7.64 7.64New Mangalore 1.82 2.81 4.63Okha 0.35 0.35Others 4.64 0.61 5.25Paradip 0.53 0.81 4.48 5.83Sikka 0.15 0.15Tuticorin / Voc 4.25 4.25Vizag 2.98 4.13 5.64 12.75Others 0.00Total 15.62 71.38 3.16 1.05 29.73 4.41 0.80 126.15Source: ICMW
76
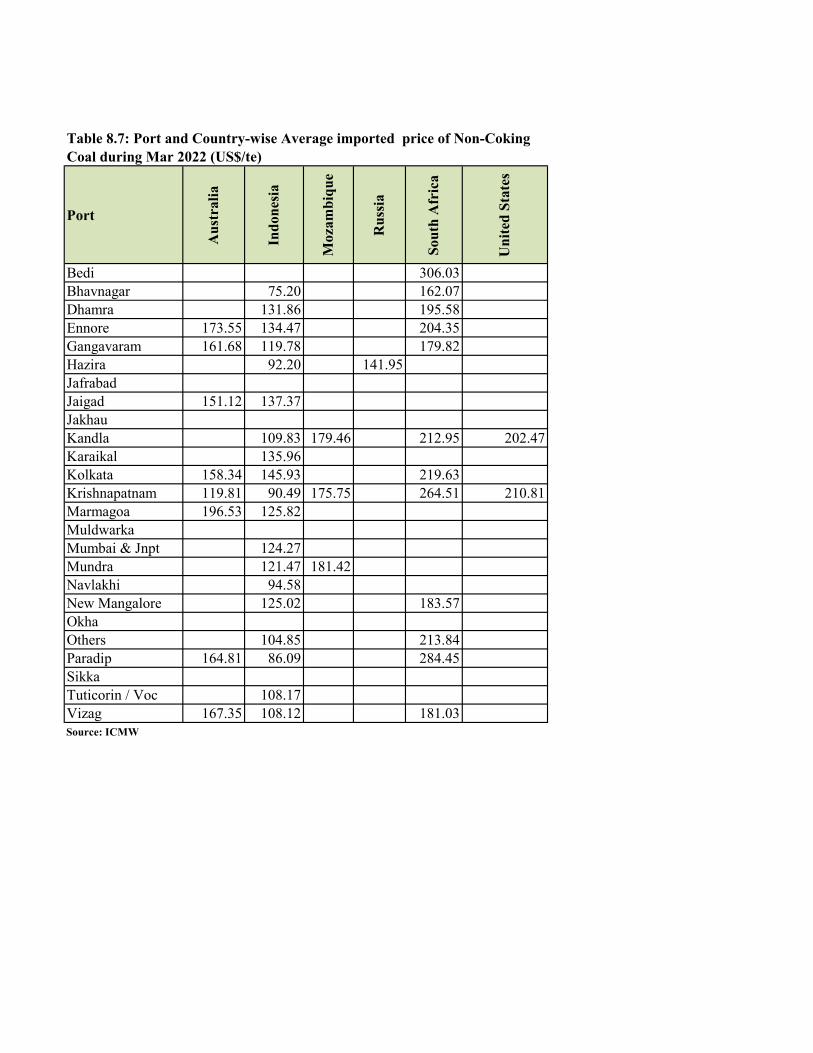
PortA
ustr
alia
Indo
nesi
a
Moz
ambi
que
Rus
sia
Sout
h A
fric
a
Uni
ted
Stat
es
Bedi 306.03Bhavnagar 75.20 162.07Dhamra 131.86 195.58Ennore 173.55 134.47 204.35Gangavaram 161.68 119.78 179.82Hazira 92.20 141.95JafrabadJaigad 151.12 137.37JakhauKandla 109.83 179.46 212.95 202.47Karaikal 135.96Kolkata 158.34 145.93 219.63Krishnapatnam 119.81 90.49 175.75 264.51 210.81Marmagoa 196.53 125.82MuldwarkaMumbai & Jnpt 124.27Mundra 121.47 181.42Navlakhi 94.58New Mangalore 125.02 183.57OkhaOthers 104.85 213.84Paradip 164.81 86.09 284.45SikkaTuticorin / Voc 108.17Vizag 167.35 108.12 181.03Source: ICMW
Table 8.7: Port and Country-wise Average imported price of Non-Coking Coal during Mar 2022 (US$/te)
77
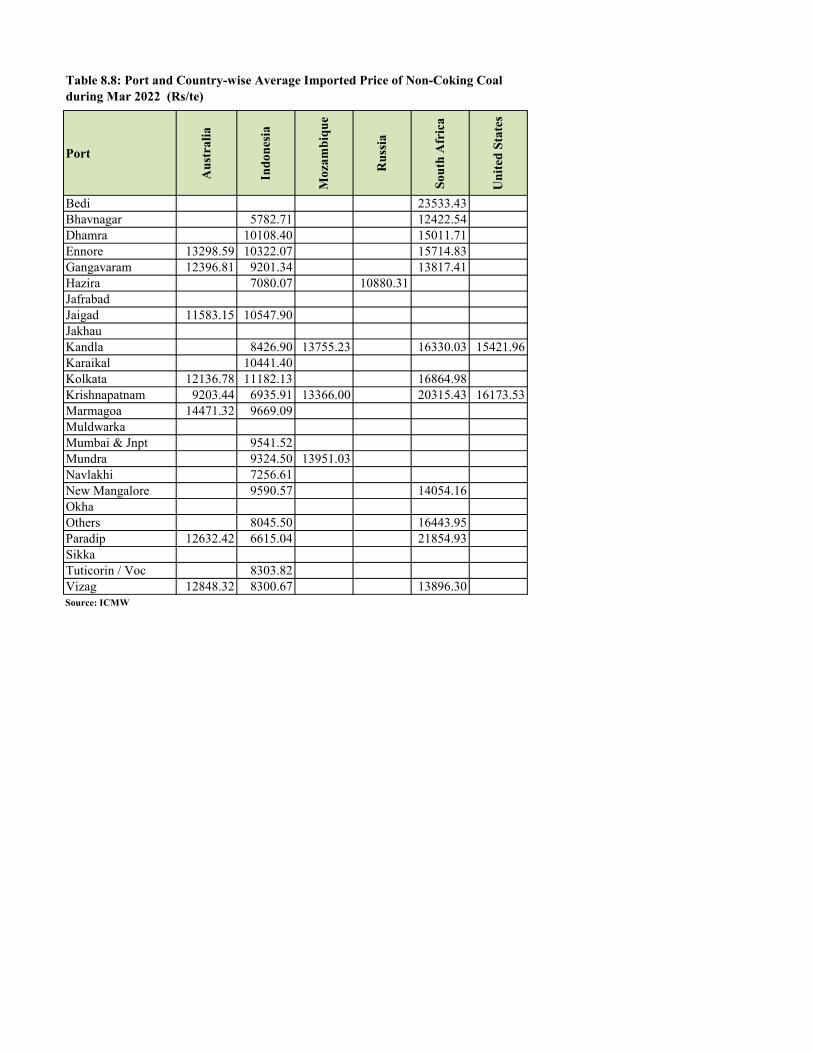
Port
Aus
tral
ia
Indo
nesi
a
Moz
ambi
que
Rus
sia
Sout
h A
fric
a
Uni
ted
Stat
es
Bedi 23533.43Bhavnagar 5782.71 12422.54Dhamra 10108.40 15011.71Ennore 13298.59 10322.07 15714.83Gangavaram 12396.81 9201.34 13817.41Hazira 7080.07 10880.31JafrabadJaigad 11583.15 10547.90JakhauKandla 8426.90 13755.23 16330.03 15421.96Karaikal 10441.40Kolkata 12136.78 11182.13 16864.98Krishnapatnam 9203.44 6935.91 13366.00 20315.43 16173.53Marmagoa 14471.32 9669.09MuldwarkaMumbai & Jnpt 9541.52Mundra 9324.50 13951.03Navlakhi 7256.61New Mangalore 9590.57 14054.16OkhaOthers 8045.50 16443.95Paradip 12632.42 6615.04 21854.93SikkaTuticorin / Voc 8303.82Vizag 12848.32 8300.67 13896.30Source: ICMW
Table 8.8: Port and Country-wise Average Imported Price of Non-Coking Coal during Mar 2022 (Rs/te)
78
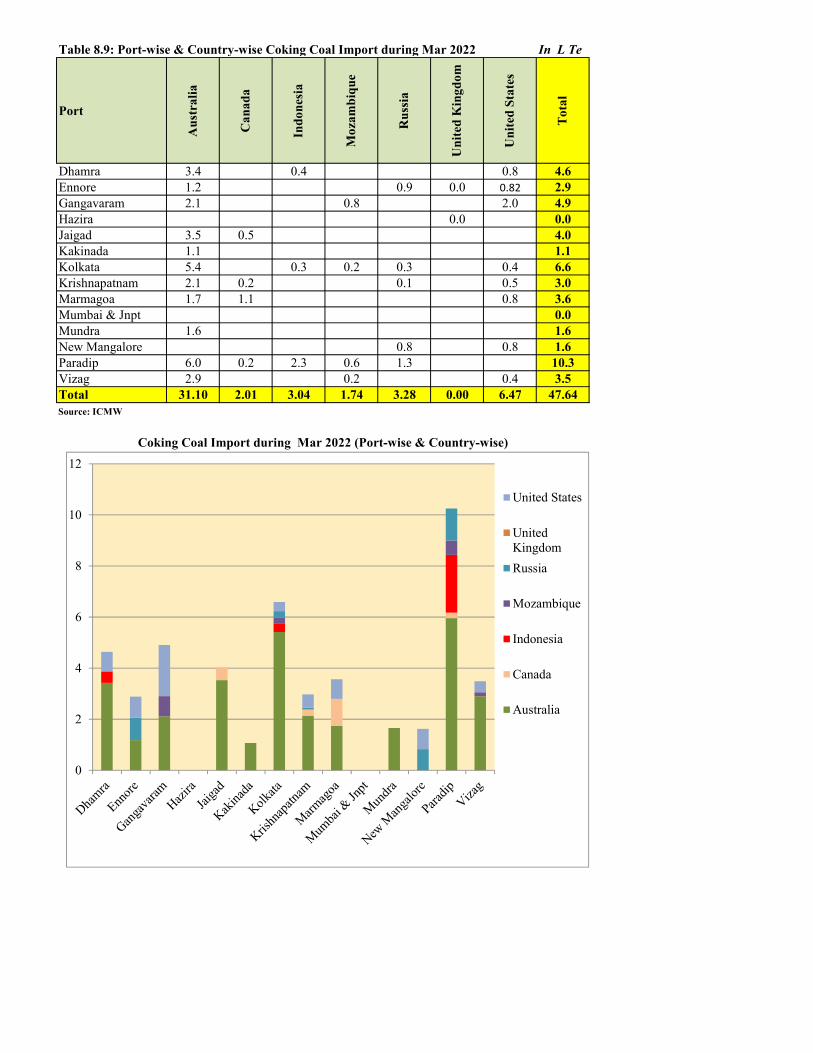
Table 8.9: Port-wise & Country-wise Coking Coal Import during Mar 2022 In L Te
Port
Aus
tral
ia
Can
ada
Indo
nesi
a
Moz
ambi
que
Rus
sia
Uni
ted
Kin
gdom
Uni
ted
Stat
es
Tot
al
Dhamra 3.4 0.4 0.8 4.6Ennore 1.2 0.9 0.0 0.82 2.9Gangavaram 2.1 0.8 2.0 4.9Hazira 0.0 0.0Jaigad 3.5 0.5 4.0Kakinada 1.1 1.1Kolkata 5.4 0.3 0.2 0.3 0.4 6.6Krishnapatnam 2.1 0.2 0.1 0.5 3.0Marmagoa 1.7 1.1 0.8 3.6Mumbai & Jnpt 0.0Mundra 1.6 1.6New Mangalore 0.8 0.8 1.6Paradip 6.0 0.2 2.3 0.6 1.3 10.3Vizag 2.9 0.2 0.4 3.5Total 31.10 2.01 3.04 1.74 3.28 0.00 6.47 47.64Source: ICMW
Coking Coal Import during Mar 2022 (Port-wise & Country-wise)
0
2
4
6
8
10
12
United States
UnitedKingdomRussia
Mozambique
Indonesia
Canada
Australia
79
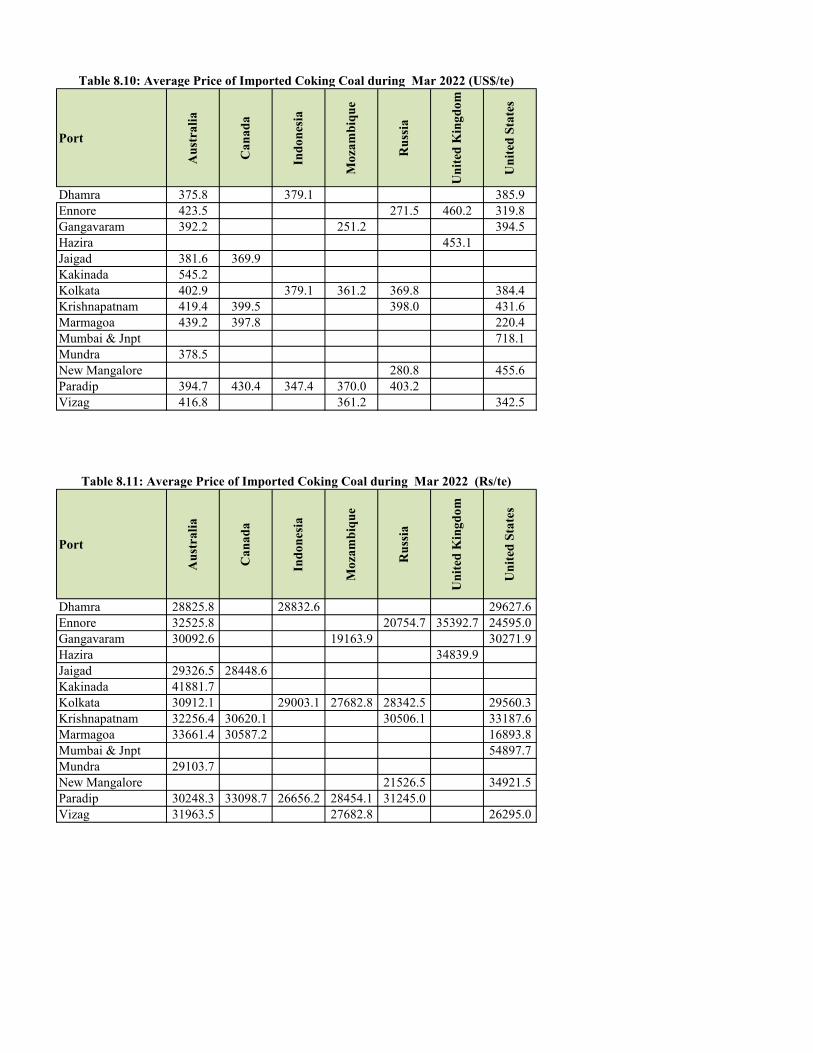
Port
Aus
tral
ia
Can
ada
Indo
nesi
a
Moz
ambi
que
Rus
sia
Uni
ted
Kin
gdom
Uni
ted
Stat
es
Dhamra 375.8 379.1 385.9Ennore 423.5 271.5 460.2 319.8Gangavaram 392.2 251.2 394.5Hazira 453.1Jaigad 381.6 369.9Kakinada 545.2Kolkata 402.9 379.1 361.2 369.8 384.4Krishnapatnam 419.4 399.5 398.0 431.6Marmagoa 439.2 397.8 220.4Mumbai & Jnpt 718.1Mundra 378.5New Mangalore 280.8 455.6Paradip 394.7 430.4 347.4 370.0 403.2Vizag 416.8 361.2 342.5
Port
Aus
tral
ia
Can
ada
Indo
nesi
a
Moz
ambi
que
Rus
sia
Uni
ted
Kin
gdom
Uni
ted
Stat
es
Dhamra 28825.8 28832.6 29627.6Ennore 32525.8 20754.7 35392.7 24595.0Gangavaram 30092.6 19163.9 30271.9Hazira 34839.9Jaigad 29326.5 28448.6Kakinada 41881.7Kolkata 30912.1 29003.1 27682.8 28342.5 29560.3Krishnapatnam 32256.4 30620.1 30506.1 33187.6Marmagoa 33661.4 30587.2 16893.8Mumbai & Jnpt 54897.7Mundra 29103.7New Mangalore 21526.5 34921.5Paradip 30248.3 33098.7 26656.2 28454.1 31245.0Vizag 31963.5 27682.8 26295.0
Table 8.10: Average Price of Imported Coking Coal during Mar 2022 (US$/te)
Table 8.11: Average Price of Imported Coking Coal during Mar 2022 (Rs/te)
80
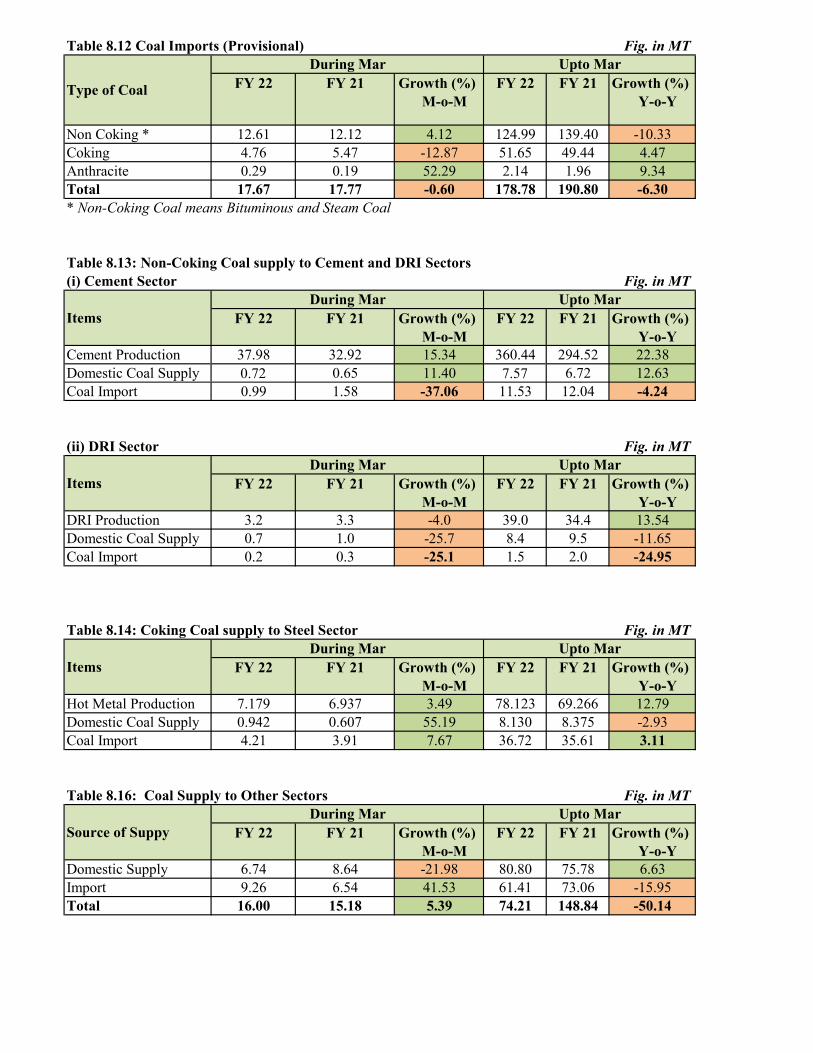
Table 8.12 Coal Imports (Provisional) Fig. in MT
FY 22 FY 21 Growth (%) M-o-M
FY 22 FY 21 Growth (%) Y-o-Y
Non Coking * 12.61 12.12 4.12 124.99 139.40 -10.33Coking 4.76 5.47 -12.87 51.65 49.44 4.47Anthracite 0.29 0.19 52.29 2.14 1.96 9.34Total 17.67 17.77 -0.60 178.78 190.80 -6.30* Non-Coking Coal means Bituminous and Steam Coal
Table 8.13: Non-Coking Coal supply to Cement and DRI Sectors(i) Cement Sector Fig. in MT
FY 22 FY 21 Growth (%) M-o-M
FY 22 FY 21 Growth (%) Y-o-Y
Cement Production 37.98 32.92 15.34 360.44 294.52 22.38Domestic Coal Supply 0.72 0.65 11.40 7.57 6.72 12.63Coal Import 0.99 1.58 -37.06 11.53 12.04 -4.24
(ii) DRI Sector Fig. in MT
FY 22 FY 21 Growth (%) M-o-M
FY 22 FY 21 Growth (%) Y-o-Y
DRI Production 3.2 3.3 -4.0 39.0 34.4 13.54Domestic Coal Supply 0.7 1.0 -25.7 8.4 9.5 -11.65Coal Import 0.2 0.3 -25.1 1.5 2.0 -24.95
Table 8.14: Coking Coal supply to Steel Sector Fig. in MT
FY 22 FY 21 Growth (%) M-o-M
FY 22 FY 21 Growth (%) Y-o-Y
Hot Metal Production 7.179 6.937 3.49 78.123 69.266 12.79Domestic Coal Supply 0.942 0.607 55.19 8.130 8.375 -2.93Coal Import 4.21 3.91 7.67 36.72 35.61 3.11
Table 8.16: Coal Supply to Other Sectors Fig. in MT
FY 22 FY 21 Growth (%) M-o-M
FY 22 FY 21 Growth (%) Y-o-Y
Domestic Supply 6.74 8.64 -21.98 80.80 75.78 6.63Import 9.26 6.54 41.53 61.41 73.06 -15.95Total 16.00 15.18 5.39 74.21 148.84 -50.14
Upto Mar
Upto Mar
Upto Mar
Upto Mar
Upto Mar
Type of Coal
During Mar
ItemsDuring Mar
Source of SuppyDuring Mar
ItemsDuring Mar
ItemsDuring Mar
81
Major On-going Projects of PSUs
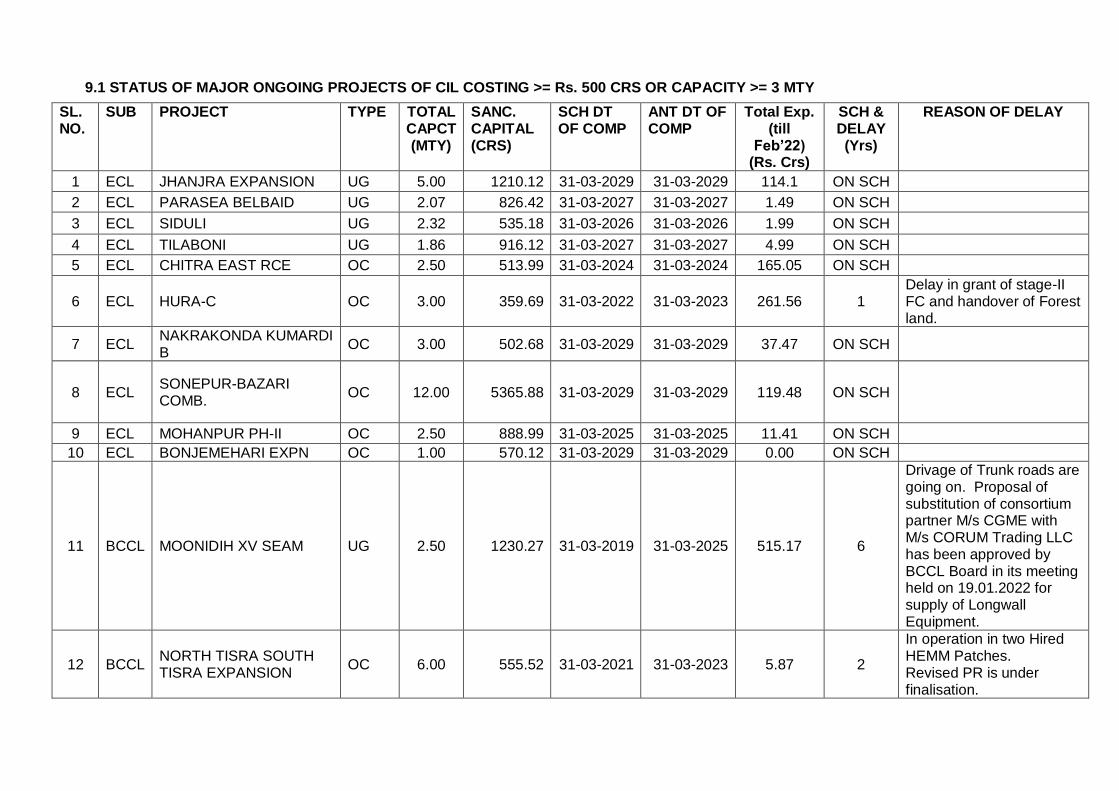
9.1 STATUS OF MAJOR ONGOING PROJECTS OF CIL COSTING >= Rs. 500 CRS OR CAPACITY >= 3 MTY
SL. NO.
SUB PROJECT TYPE TOTAL CAPCT (MTY)
SANC. CAPITAL (CRS)
SCH DT OF COMP
ANT DT OF COMP
Total Exp. (till
Feb’22) (Rs. Crs)
SCH & DELAY (Yrs)
REASON OF DELAY
1 ECL JHANJRA EXPANSION UG 5.00 1210.12 31-03-2029 31-03-2029 114.1 ON SCH
2 ECL PARASEA BELBAID UG 2.07 826.42 31-03-2027 31-03-2027 1.49 ON SCH
3 ECL SIDULI UG 2.32 535.18 31-03-2026 31-03-2026 1.99 ON SCH
4 ECL TILABONI UG 1.86 916.12 31-03-2027 31-03-2027 4.99 ON SCH
5 ECL CHITRA EAST RCE OC 2.50 513.99 31-03-2024 31-03-2024 165.05 ON SCH
6 ECL HURA-C OC 3.00 359.69 31-03-2022 31-03-2023 261.56 1 Delay in grant of stage-II FC and handover of Forest land.
7 ECL NAKRAKONDA KUMARDI B
OC 3.00 502.68 31-03-2029 31-03-2029 37.47 ON SCH
8 ECL SONEPUR-BAZARI COMB.
OC 12.00 5365.88 31-03-2029 31-03-2029 119.48 ON SCH
9 ECL MOHANPUR PH-II OC 2.50 888.99 31-03-2025 31-03-2025 11.41 ON SCH
10 ECL BONJEMEHARI EXPN OC 1.00 570.12 31-03-2029 31-03-2029 0.00 ON SCH
11 BCCL MOONIDIH XV SEAM UG 2.50 1230.27 31-03-2019 31-03-2025 515.17 6
Drivage of Trunk roads are going on. Proposal of substitution of consortium partner M/s CGME with M/s CORUM Trading LLC has been approved by BCCL Board in its meeting held on 19.01.2022 for supply of Longwall Equipment.
12 BCCL NORTH TISRA SOUTH TISRA EXPANSION
OC 6.00 555.52 31-03-2021 31-03-2023 5.87 2
In operation in two Hired HEMM Patches. Revised PR is under finalisation.
82
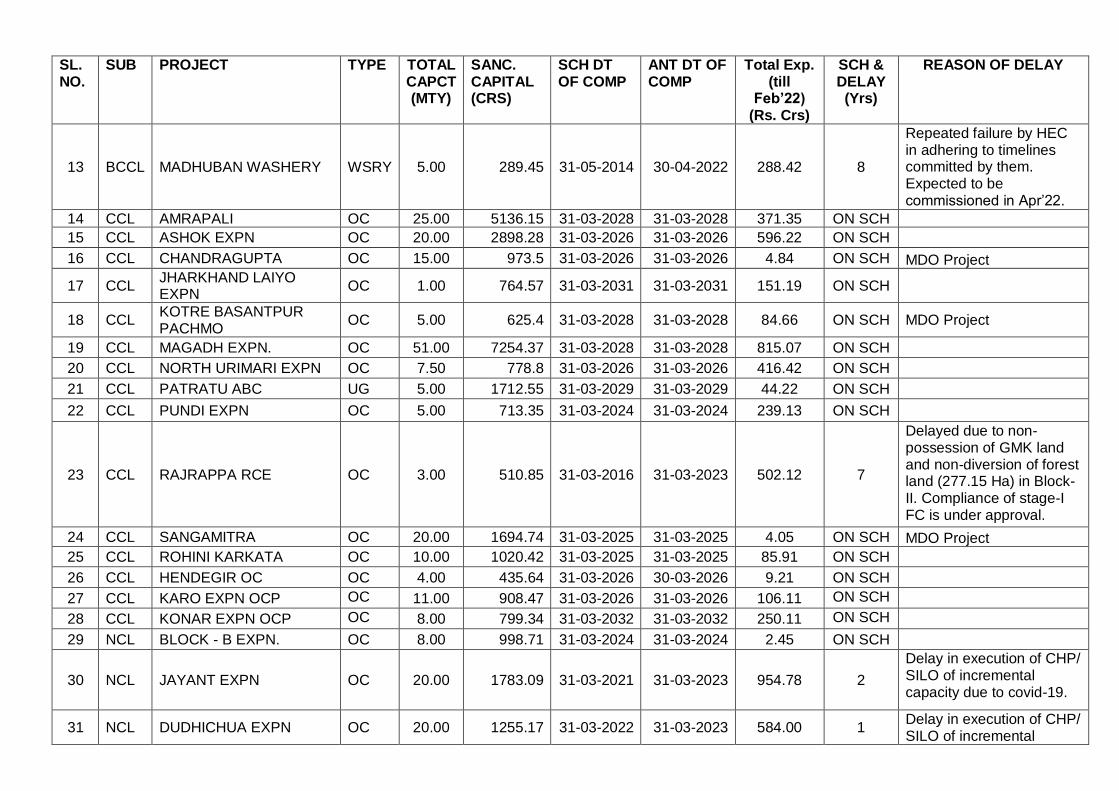
SL. NO.
SUB PROJECT TYPE TOTAL CAPCT (MTY)
SANC. CAPITAL (CRS)
SCH DT OF COMP
ANT DT OF COMP
Total Exp. (till
Feb’22) (Rs. Crs)
SCH & DELAY (Yrs)
REASON OF DELAY
13 BCCL MADHUBAN WASHERY WSRY 5.00 289.45 31-05-2014 30-04-2022 288.42 8
Repeated failure by HEC in adhering to timelines committed by them. Expected to be commissioned in Apr’22.
14 CCL AMRAPALI OC 25.00 5136.15 31-03-2028 31-03-2028 371.35 ON SCH
15 CCL ASHOK EXPN OC 20.00 2898.28 31-03-2026 31-03-2026 596.22 ON SCH
16 CCL CHANDRAGUPTA OC 15.00 973.5 31-03-2026 31-03-2026 4.84 ON SCH MDO Project
17 CCL JHARKHAND LAIYO EXPN
OC 1.00 764.57 31-03-2031 31-03-2031 151.19 ON SCH
18 CCL KOTRE BASANTPUR PACHMO
OC 5.00 625.4 31-03-2028 31-03-2028 84.66 ON SCH MDO Project
19 CCL MAGADH EXPN. OC 51.00 7254.37 31-03-2028 31-03-2028 815.07 ON SCH
20 CCL NORTH URIMARI EXPN OC 7.50 778.8 31-03-2026 31-03-2026 416.42 ON SCH
21 CCL PATRATU ABC UG 5.00 1712.55 31-03-2029 31-03-2029 44.22 ON SCH
22 CCL PUNDI EXPN OC 5.00 713.35 31-03-2024 31-03-2024 239.13 ON SCH
23 CCL RAJRAPPA RCE OC 3.00 510.85 31-03-2016 31-03-2023 502.12 7
Delayed due to non-possession of GMK land and non-diversion of forest land (277.15 Ha) in Block-II. Compliance of stage-I FC is under approval.
24 CCL SANGAMITRA OC 20.00 1694.74 31-03-2025 31-03-2025 4.05 ON SCH MDO Project
25 CCL ROHINI KARKATA OC 10.00 1020.42 31-03-2025 31-03-2025 85.91 ON SCH
26 CCL HENDEGIR OC OC 4.00 435.64 31-03-2026 30-03-2026 9.21 ON SCH
27 CCL KARO EXPN OCP OC 11.00 908.47 31-03-2026 31-03-2026 106.11 ON SCH
28 CCL KONAR EXPN OCP OC 8.00 799.34 31-03-2032 31-03-2032 250.11 ON SCH
29 NCL BLOCK - B EXPN. OC 8.00 998.71 31-03-2024 31-03-2024 2.45 ON SCH
30 NCL JAYANT EXPN OC 20.00 1783.09 31-03-2021 31-03-2023 954.78 2
Delay in execution of CHP/ SILO of incremental capacity due to covid-19.
31 NCL DUDHICHUA EXPN OC 20.00 1255.17 31-03-2022 31-03-2023 584.00 1 Delay in execution of CHP/ SILO of incremental
83
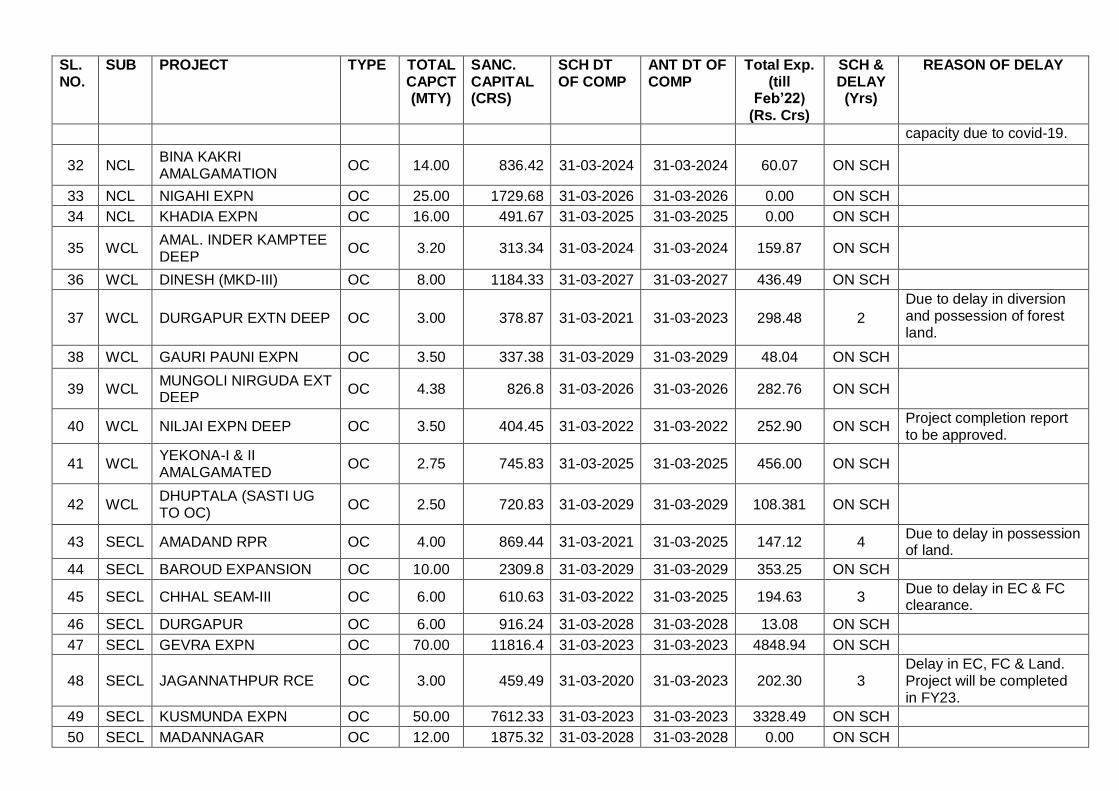
SL. NO.
SUB PROJECT TYPE TOTAL CAPCT (MTY)
SANC. CAPITAL (CRS)
SCH DT OF COMP
ANT DT OF COMP
Total Exp. (till
Feb’22) (Rs. Crs)
SCH & DELAY (Yrs)
REASON OF DELAY
capacity due to covid-19.
32 NCL BINA KAKRI AMALGAMATION
OC 14.00 836.42 31-03-2024 31-03-2024 60.07 ON SCH
33 NCL NIGAHI EXPN OC 25.00 1729.68 31-03-2026 31-03-2026 0.00 ON SCH
34 NCL KHADIA EXPN OC 16.00 491.67 31-03-2025 31-03-2025 0.00 ON SCH
35 WCL AMAL. INDER KAMPTEE DEEP
OC 3.20 313.34 31-03-2024 31-03-2024 159.87 ON SCH
36 WCL DINESH (MKD-III) OC 8.00 1184.33 31-03-2027 31-03-2027 436.49 ON SCH
37 WCL DURGAPUR EXTN DEEP OC 3.00 378.87 31-03-2021 31-03-2023 298.48 2
Due to delay in diversion and possession of forest land.
38 WCL GAURI PAUNI EXPN OC 3.50 337.38 31-03-2029 31-03-2029 48.04 ON SCH
39 WCL MUNGOLI NIRGUDA EXT DEEP
OC 4.38 826.8 31-03-2026 31-03-2026 282.76 ON SCH
40 WCL NILJAI EXPN DEEP OC 3.50 404.45 31-03-2022 31-03-2022 252.90 ON SCH Project completion report to be approved.
41 WCL YEKONA-I & II AMALGAMATED
OC 2.75 745.83 31-03-2025 31-03-2025 456.00 ON SCH
42 WCL DHUPTALA (SASTI UG TO OC)
OC 2.50 720.83 31-03-2029 31-03-2029 108.381 ON SCH
43 SECL AMADAND RPR OC 4.00 869.44 31-03-2021 31-03-2025 147.12 4 Due to delay in possession of land.
44 SECL BAROUD EXPANSION OC 10.00 2309.8 31-03-2029 31-03-2029 353.25 ON SCH
45 SECL CHHAL SEAM-III OC 6.00 610.63 31-03-2022 31-03-2025 194.63 3 Due to delay in EC & FC clearance.
46 SECL DURGAPUR OC 6.00 916.24 31-03-2028 31-03-2028 13.08 ON SCH
47 SECL GEVRA EXPN OC 70.00 11816.4 31-03-2023 31-03-2023 4848.94 ON SCH
48 SECL JAGANNATHPUR RCE OC 3.00 459.49 31-03-2020 31-03-2023 202.30 3 Delay in EC, FC & Land. Project will be completed in FY23.
49 SECL KUSMUNDA EXPN OC 50.00 7612.33 31-03-2023 31-03-2023 3328.49 ON SCH
50 SECL MADANNAGAR OC 12.00 1875.32 31-03-2028 31-03-2028 0.00 ON SCH
84
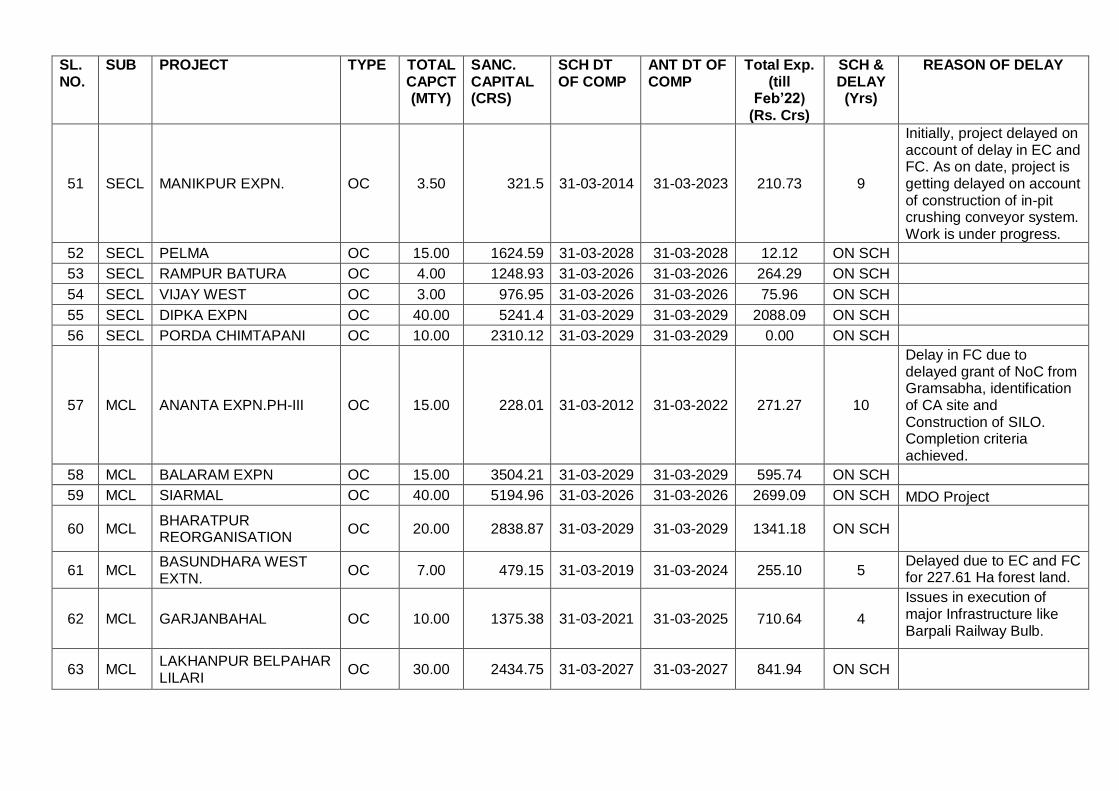
SL. NO.
SUB PROJECT TYPE TOTAL CAPCT (MTY)
SANC. CAPITAL (CRS)
SCH DT OF COMP
ANT DT OF COMP
Total Exp. (till
Feb’22) (Rs. Crs)
SCH & DELAY (Yrs)
REASON OF DELAY
51 SECL MANIKPUR EXPN. OC 3.50 321.5 31-03-2014 31-03-2023 210.73 9
Initially, project delayed on account of delay in EC and FC. As on date, project is getting delayed on account of construction of in-pit crushing conveyor system. Work is under progress.
52 SECL PELMA OC 15.00 1624.59 31-03-2028 31-03-2028 12.12 ON SCH
53 SECL RAMPUR BATURA OC 4.00 1248.93 31-03-2026 31-03-2026 264.29 ON SCH
54 SECL VIJAY WEST OC 3.00 976.95 31-03-2026 31-03-2026 75.96 ON SCH
55 SECL DIPKA EXPN OC 40.00 5241.4 31-03-2029 31-03-2029 2088.09 ON SCH
56 SECL PORDA CHIMTAPANI OC 10.00 2310.12 31-03-2029 31-03-2029 0.00 ON SCH
57 MCL ANANTA EXPN.PH-III OC 15.00 228.01 31-03-2012 31-03-2022 271.27 10
Delay in FC due to delayed grant of NoC from Gramsabha, identification of CA site and Construction of SILO. Completion criteria achieved.
58 MCL BALARAM EXPN OC 15.00 3504.21 31-03-2029 31-03-2029 595.74 ON SCH
59 MCL SIARMAL OC 40.00 5194.96 31-03-2026 31-03-2026 2699.09 ON SCH MDO Project
60 MCL BHARATPUR REORGANISATION
OC 20.00 2838.87 31-03-2029 31-03-2029 1341.18 ON SCH
61 MCL BASUNDHARA WEST EXTN.
OC 7.00 479.15 31-03-2019 31-03-2024 255.10 5 Delayed due to EC and FC for 227.61 Ha forest land.
62 MCL GARJANBAHAL OC 10.00 1375.38 31-03-2021 31-03-2025 710.64 4
Issues in execution of major Infrastructure like Barpali Railway Bulb.
63 MCL LAKHANPUR BELPAHAR LILARI
OC 30.00 2434.75 31-03-2027 31-03-2027 841.94 ON SCH
85
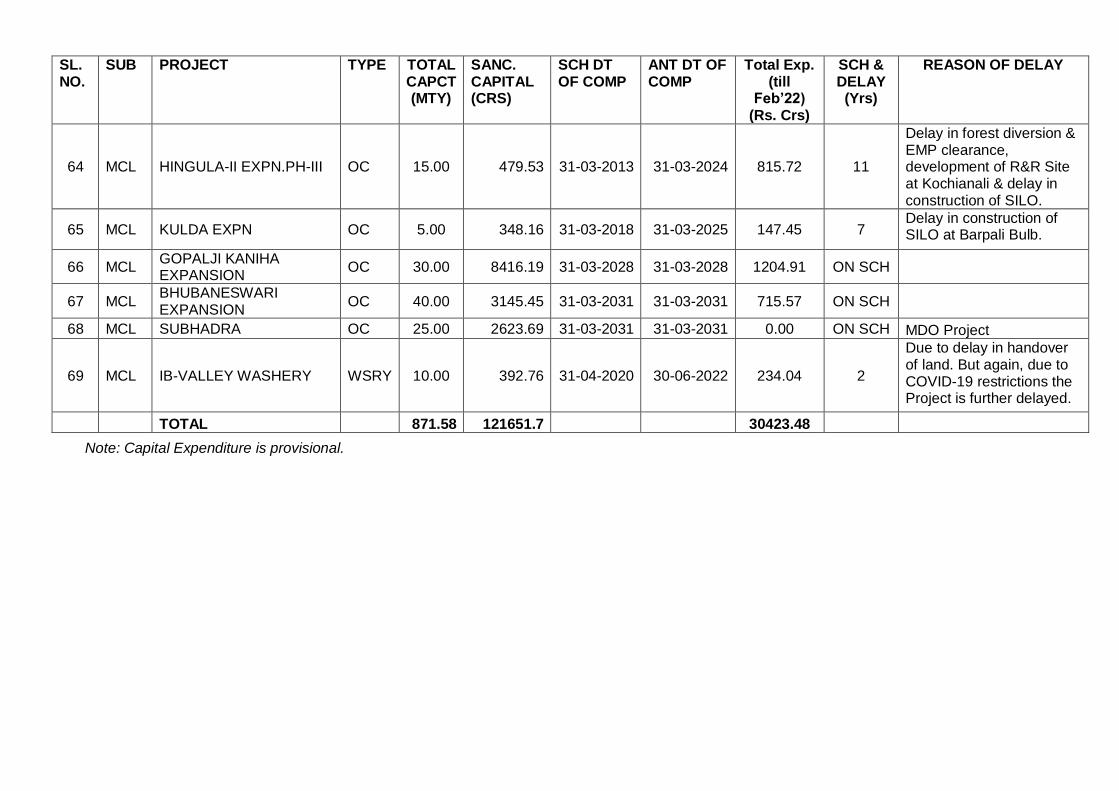
SL. NO.
SUB PROJECT TYPE TOTAL CAPCT (MTY)
SANC. CAPITAL (CRS)
SCH DT OF COMP
ANT DT OF COMP
Total Exp. (till
Feb’22) (Rs. Crs)
SCH & DELAY (Yrs)
REASON OF DELAY
64 MCL HINGULA-II EXPN.PH-III OC 15.00 479.53 31-03-2013 31-03-2024 815.72 11
Delay in forest diversion & EMP clearance, development of R&R Site at Kochianali & delay in construction of SILO.
65 MCL KULDA EXPN OC 5.00 348.16 31-03-2018 31-03-2025 147.45 7 Delay in construction of SILO at Barpali Bulb.
66 MCL GOPALJI KANIHA EXPANSION
OC 30.00 8416.19 31-03-2028 31-03-2028 1204.91 ON SCH
67 MCL BHUBANESWARI EXPANSION
OC 40.00 3145.45 31-03-2031 31-03-2031 715.57 ON SCH
68 MCL SUBHADRA OC 25.00 2623.69 31-03-2031 31-03-2031 0.00 ON SCH MDO Project
69 MCL IB-VALLEY WASHERY WSRY 10.00 392.76 31-04-2020 30-06-2022 234.04 2
Due to delay in handover of land. But again, due to COVID-19 restrictions the Project is further delayed.
TOTAL 871.58 121651.7 30423.48
Note: Capital Expenditure is provisional.
86

9.2 STATUS OF NLCIL-ONGOING MAJOR PROJECTS
Date of approval
Sanctioned
Cost Rs. Crore
Scheduled date of completion
Anticipated
Cost Rs. Crore
Anticipated
date of completion
Cumulative Expenditure
upto31.03.20 21 Rs. Crore
Capex2021-22 Rs. Crore
Cumulative (upto 31st
March2022)
Cumulative Progress (%) (upto 31st March 2022)
Remarks Physical Financial
Target Actual Provl
(upto 31st
March2022)
Target
/Schedule Actual
Target
/Schedule Actual
NEYVELI NEW THERMAL POWER PROJECT (2X500 MW): (NNTPP)
09.06.2011
5907.11 (Oct- 2010)
U-I: Oct 2017 U-II: Apr 2018
5907.11
(Oct-2010) 7080.41
(RCE-1) *
7980.79 (RCE-2)**
U-1- # U-II-##
7,392.54
100.00
78.50
7471.04
100.00
99.62
77.86
93.61
--
*- RCE 1 cost Rs.7080.41 Crore. **- RCE-2cost Rs.7980.79Crore. # - Unit-I commercial operation from 28.12.2019. ## - Unit-I commercial operation from 10.02.2021.
NTA-4:LOA for FGD System package issued to M/s L&T Limited on 31.01.2022. L1 PERT was approved on 04.03.2022. Basic Engineering drawings
submission/review is under progress. Bhoomi Pooja conducted on 17.03.2022.Geo technical Soil investigation work under progress. Contract
Agreement signed by M/s L&T on 30.03.2022. Advance Payments for Supply, Erection and Civil portion for 1st5% invoices received were processed.
Date of approval
Sanctioned
Cost Rs. Crore
Scheduled
date of completion
Anticipated
Cost Rs. Crore
Anticipated
date of completion
Cumulative Expenditure
(upto31.03. 2021)Rs.
Crore
Capex2021-22 Rs. Crore
Cumulative 31st
March2022)
Rs. Crore
Cumulative Progress (%) (upto 31st March 2022)
Remarks
Physical Financial
Target Actual Provl (31st March
2022)
Target
/Schedule Actual
Target
/Schedule Actual
EXPANSION OF MINE-I 10.50 MTPA (AREA EXPANSION) & EXPANSION OF MINE-IA (FROM 3.0 MTPA TO 7.0 MTPA)
30.04.2013
1458.17 Original
709.06 RCE (12.09.2016)
June 2015 / June2018
709.06
2027-28*
488.53
11.0
11.12
499.65
70.31
70.47
70.31
70.47
--
*- Approved in the revised Mining Plan.
As approved by 492nd Board of NLCIL, the project was put on hold due to Land acquisition and less demand for Lignite. Since, NNTPS has commenced
its operation, Lignite demand is in increase. It is planned to ramp up the production of Mine-IA in 2021-22. Project revived and Lignite production
commenced from 31.01.2022.
Date of approval
Sanctioned
Cost Rs. Crore
Scheduled
date of completion
Anticipated
Cost Rs. Crore
Anticipated
date of completion
Cumulative
Expenditure (upto
31.03.2021)
Rs. Crore
Capex 2021-22 Rs Crore
Cumulative (31st
March2022
Rs. Crore
Cumulative Progress (upto 31st March 2022)
Remarks
Physical Financial
Target Actual Provl
31st
March2022)
Target
/Schedule
Actual
Target Actual
RAJASTHAN MINE AND POWER PROJECTS HADLA LIGNITE MINE (1.9 MTPA)
23.03.2015 522.45 Sept 2019 522.45 Put on hold 9.88 0.00 0.00 9.88 99.99 0.48 28.60 1.89 *
87
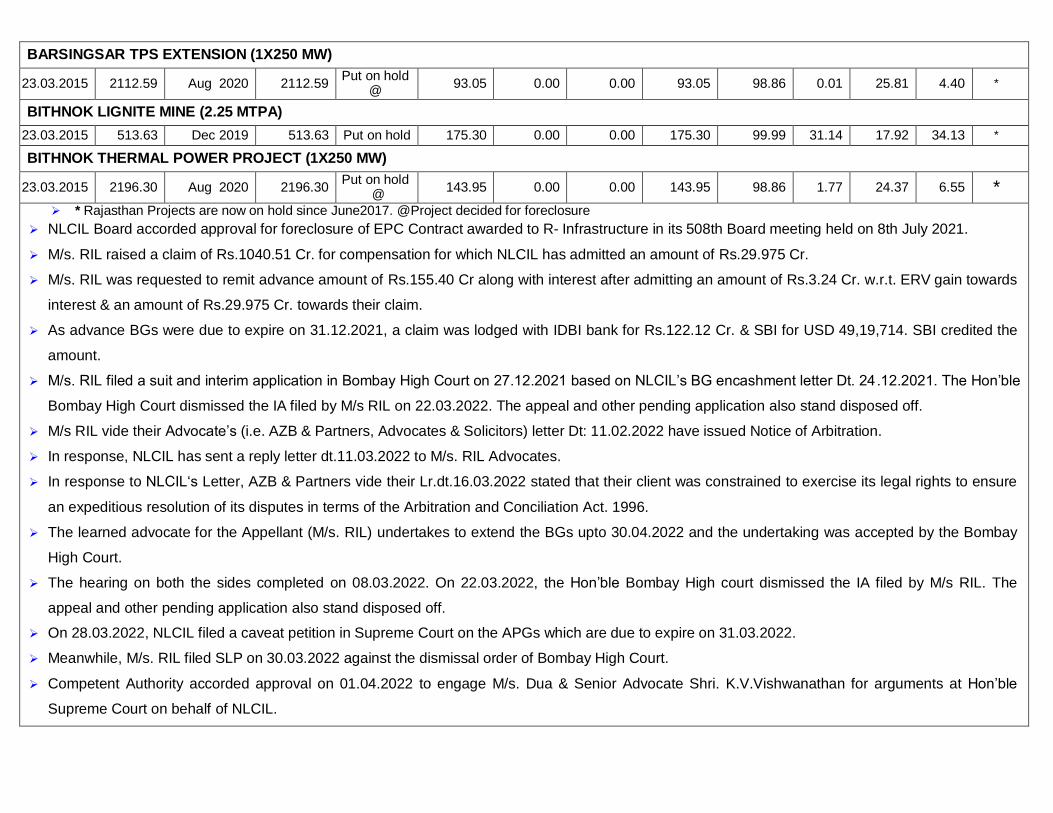
BARSINGSAR TPS EXTENSION (1X250 MW)
23.03.2015 2112.59 Aug 2020 2112.59 Put on hold
@ 93.05 0.00 0.00 93.05 98.86 0.01 25.81 4.40 *
BITHNOK LIGNITE MINE (2.25 MTPA)
23.03.2015 513.63 Dec 2019 513.63 Put on hold 175.30 0.00 0.00 175.30 99.99 31.14 17.92 34.13 *
BITHNOK THERMAL POWER PROJECT (1X250 MW)
23.03.2015 2196.30 Aug 2020 2196.30 Put on hold
@ 143.95 0.00 0.00 143.95 98.86 1.77 24.37 6.55 *
* Rajasthan Projects are now on hold since June2017. @Project decided for foreclosure
NLCIL Board accorded approval for foreclosure of EPC Contract awarded to R- Infrastructure in its 508th Board meeting held on 8th July 2021.
M/s. RIL raised a claim of Rs.1040.51 Cr. for compensation for which NLCIL has admitted an amount of Rs.29.975 Cr.
M/s. RIL was requested to remit advance amount of Rs.155.40 Cr along with interest after admitting an amount of Rs.3.24 Cr. w.r.t. ERV gain towards
interest & an amount of Rs.29.975 Cr. towards their claim.
As advance BGs were due to expire on 31.12.2021, a claim was lodged with IDBI bank for Rs.122.12 Cr. & SBI for USD 49,19,714. SBI credited the
amount.
M/s. RIL filed a suit and interim application in Bombay High Court on 27.12.2021 based on NLCIL’s BG encashment letter Dt. 24.12.2021. The Hon’ble
Bombay High Court dismissed the IA filed by M/s RIL on 22.03.2022. The appeal and other pending application also stand disposed off.
M/s RIL vide their Advocate’s (i.e. AZB & Partners, Advocates & Solicitors) letter Dt: 11.02.2022 have issued Notice of Arbitration.
In response, NLCIL has sent a reply letter dt.11.03.2022 to M/s. RIL Advocates.
In response to NLCIL‘s Letter, AZB & Partners vide their Lr.dt.16.03.2022 stated that their client was constrained to exercise its legal rights to ensure
an expeditious resolution of its disputes in terms of the Arbitration and Conciliation Act. 1996.
The learned advocate for the Appellant (M/s. RIL) undertakes to extend the BGs upto 30.04.2022 and the undertaking was accepted by the Bombay
High Court.
The hearing on both the sides completed on 08.03.2022. On 22.03.2022, the Hon’ble Bombay High court dismissed the IA filed by M/s RIL. The
appeal and other pending application also stand disposed off.
On 28.03.2022, NLCIL filed a caveat petition in Supreme Court on the APGs which are due to expire on 31.03.2022.
Meanwhile, M/s. RIL filed SLP on 30.03.2022 against the dismissal order of Bombay High Court.
Competent Authority accorded approval on 01.04.2022 to engage M/s. Dua & Senior Advocate Shri. K.V.Vishwanathan for arguments at Hon’ble
Supreme Court on behalf of NLCIL.
88
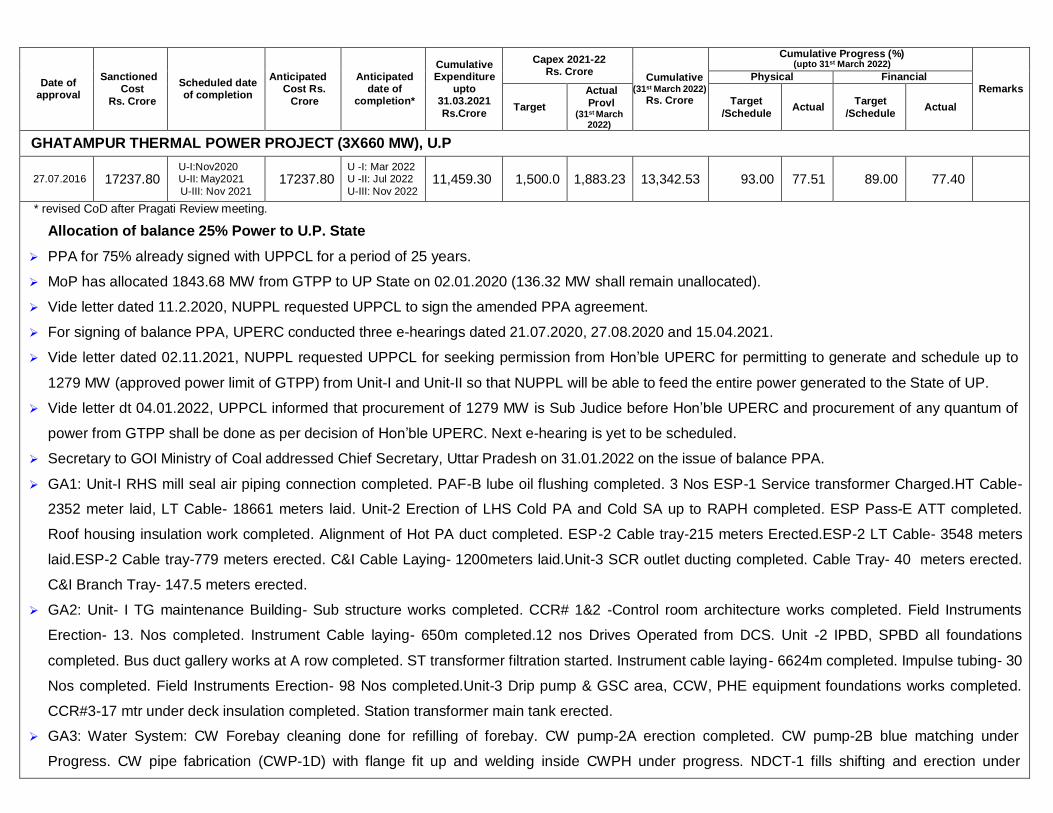
Date of
approval
Sanctioned Cost
Rs. Crore
Scheduled date of completion
Anticipated Cost Rs.
Crore
Anticipated date of
completion*
Cumulative Expenditure
upto 31.03.2021
Rs.Crore
Capex 2021-22 Rs. Crore
Cumulative (31st March 2022)
Rs. Crore
Cumulative Progress (%) (upto 31st March 2022)
Remarks Physical Financial
Target
Actual
Provl (31st March
2022)
Target
/Schedule
Actual
Target
/Schedule
Actual
GHATAMPUR THERMAL POWER PROJECT (3X660 MW), U.P
27.07.2016
17237.80 U-I:Nov2020 U-II: May2021
U-III: Nov 2021
17237.80 U -I: Mar 2022 U -II: Jul 2022
U-III: Nov 2022
11,459.30
1,500.0
1,883.23
13,342.53
93.00
77.51
89.00
77.40
* revised CoD after Pragati Review meeting.
Allocation of balance 25% Power to U.P. State
PPA for 75% already signed with UPPCL for a period of 25 years.
MoP has allocated 1843.68 MW from GTPP to UP State on 02.01.2020 (136.32 MW shall remain unallocated).
Vide letter dated 11.2.2020, NUPPL requested UPPCL to sign the amended PPA agreement.
For signing of balance PPA, UPERC conducted three e-hearings dated 21.07.2020, 27.08.2020 and 15.04.2021.
Vide letter dated 02.11.2021, NUPPL requested UPPCL for seeking permission from Hon’ble UPERC for permitting to generate and schedule up to
1279 MW (approved power limit of GTPP) from Unit-I and Unit-II so that NUPPL will be able to feed the entire power generated to the State of UP.
Vide letter dt 04.01.2022, UPPCL informed that procurement of 1279 MW is Sub Judice before Hon’ble UPERC and procurement of any quantum of
power from GTPP shall be done as per decision of Hon’ble UPERC. Next e-hearing is yet to be scheduled.
Secretary to GOI Ministry of Coal addressed Chief Secretary, Uttar Pradesh on 31.01.2022 on the issue of balance PPA.
GA1: Unit-I RHS mill seal air piping connection completed. PAF-B lube oil flushing completed. 3 Nos ESP-1 Service transformer Charged.HT Cable-
2352 meter laid, LT Cable- 18661 meters laid. Unit-2 Erection of LHS Cold PA and Cold SA up to RAPH completed. ESP Pass-E ATT completed.
Roof housing insulation work completed. Alignment of Hot PA duct completed. ESP-2 Cable tray-215 meters Erected.ESP-2 LT Cable- 3548 meters
laid.ESP-2 Cable tray-779 meters erected. C&I Cable Laying- 1200meters laid.Unit-3 SCR outlet ducting completed. Cable Tray- 40 meters erected.
C&I Branch Tray- 147.5 meters erected.
GA2: Unit- I TG maintenance Building- Sub structure works completed. CCR# 1&2 -Control room architecture works completed. Field Instruments
Erection- 13. Nos completed. Instrument Cable laying- 650m completed.12 nos Drives Operated from DCS. Unit -2 IPBD, SPBD all foundations
completed. Bus duct gallery works at A row completed. ST transformer filtration started. Instrument cable laying- 6624m completed. Impulse tubing- 30
Nos completed. Field Instruments Erection- 98 Nos completed.Unit-3 Drip pump & GSC area, CCW, PHE equipment foundations works completed.
CCR#3-17 mtr under deck insulation completed. Station transformer main tank erected.
GA3: Water System: CW Forebay cleaning done for refilling of forebay. CW pump-2A erection completed. CW pump-2B blue matching under
Progress. CW pipe fabrication (CWP-1D) with flange fit up and welding inside CWPH under progress. NDCT-1 fills shifting and erection under
89
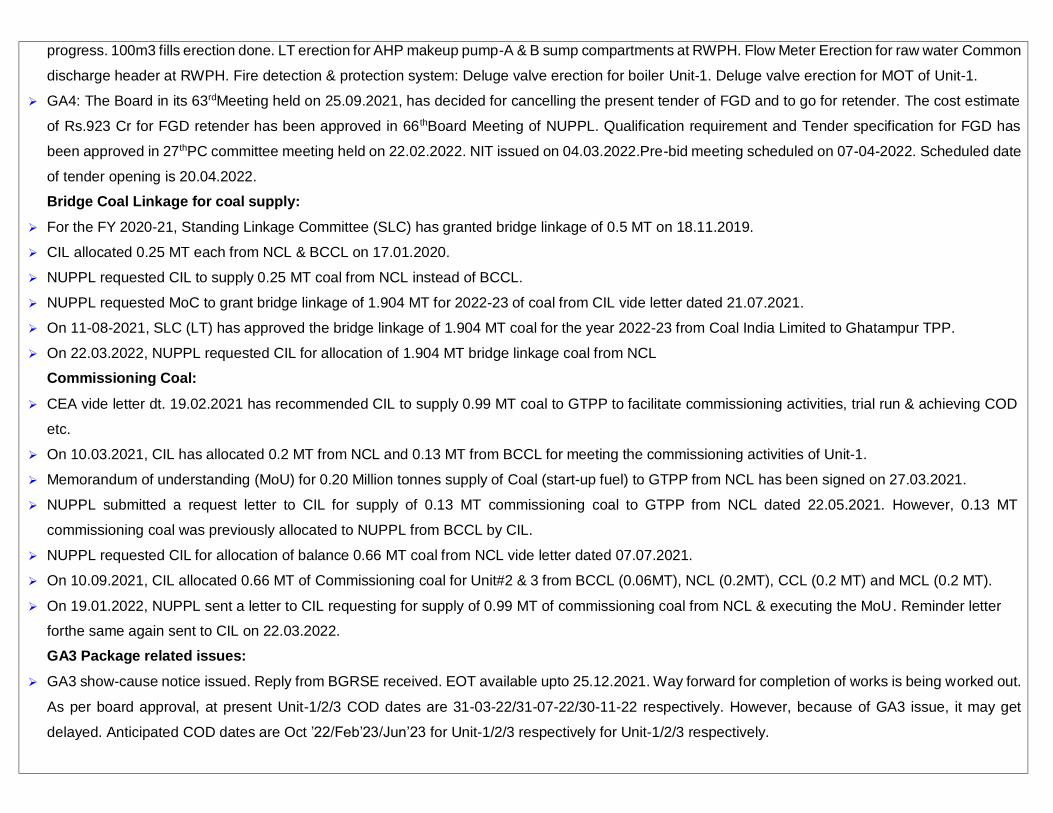
progress. 100m3 fills erection done. LT erection for AHP makeup pump-A & B sump compartments at RWPH. Flow Meter Erection for raw water Common
discharge header at RWPH. Fire detection & protection system: Deluge valve erection for boiler Unit-1. Deluge valve erection for MOT of Unit-1.
GA4: The Board in its 63rdMeeting held on 25.09.2021, has decided for cancelling the present tender of FGD and to go for retender. The cost estimate
of Rs.923 Cr for FGD retender has been approved in 66 thBoard Meeting of NUPPL. Qualification requirement and Tender specification for FGD has
been approved in 27thPC committee meeting held on 22.02.2022. NIT issued on 04.03.2022.Pre-bid meeting scheduled on 07-04-2022. Scheduled date
of tender opening is 20.04.2022.
Bridge Coal Linkage for coal supply:
For the FY 2020-21, Standing Linkage Committee (SLC) has granted bridge linkage of 0.5 MT on 18.11.2019.
CIL allocated 0.25 MT each from NCL & BCCL on 17.01.2020.
NUPPL requested CIL to supply 0.25 MT coal from NCL instead of BCCL.
NUPPL requested MoC to grant bridge linkage of 1.904 MT for 2022-23 of coal from CIL vide letter dated 21.07.2021.
On 11-08-2021, SLC (LT) has approved the bridge linkage of 1.904 MT coal for the year 2022-23 from Coal India Limited to Ghatampur TPP.
On 22.03.2022, NUPPL requested CIL for allocation of 1.904 MT bridge linkage coal from NCL
Commissioning Coal:
CEA vide letter dt. 19.02.2021 has recommended CIL to supply 0.99 MT coal to GTPP to facilitate commissioning activities, trial run & achieving COD
etc.
On 10.03.2021, CIL has allocated 0.2 MT from NCL and 0.13 MT from BCCL for meeting the commissioning activities of Unit-1.
Memorandum of understanding (MoU) for 0.20 Million tonnes supply of Coal (start-up fuel) to GTPP from NCL has been signed on 27.03.2021.
NUPPL submitted a request letter to CIL for supply of 0.13 MT commissioning coal to GTPP from NCL dated 22.05.2021. However, 0.13 MT
commissioning coal was previously allocated to NUPPL from BCCL by CIL.
NUPPL requested CIL for allocation of balance 0.66 MT coal from NCL vide letter dated 07.07.2021.
On 10.09.2021, CIL allocated 0.66 MT of Commissioning coal for Unit#2 & 3 from BCCL (0.06MT), NCL (0.2MT), CCL (0.2 MT) and MCL (0.2 MT).
On 19.01.2022, NUPPL sent a letter to CIL requesting for supply of 0.99 MT of commissioning coal from NCL & executing the MoU. Reminder letter
for the same again sent to CIL on 22.03.2022.
GA3 Package related issues:
GA3 show-cause notice issued. Reply from BGRSE received. EOT available upto 25.12.2021. Way forward for completion of works is being worked out.
As per board approval, at present Unit-1/2/3 COD dates are 31-03-22/31-07-22/30-11-22 respectively. However, because of GA3 issue, it may get
delayed. Anticipated COD dates are Oct ’22/Feb’23/Jun’23 for Unit-1/2/3 respectively for Unit-1/2/3 respectively.
90
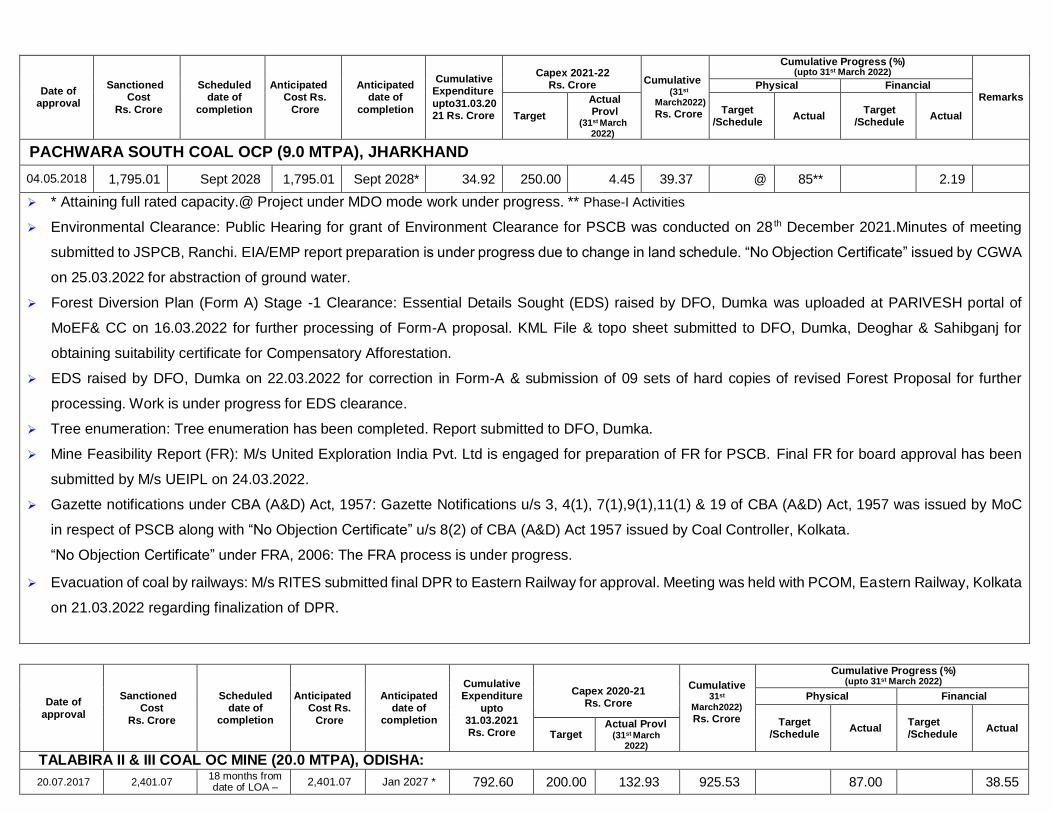
Date of
approval
Sanctioned Cost
Rs. Crore
Scheduled date of
completion
Anticipated Cost Rs.
Crore
Anticipated date of
completion
Cumulative
Expenditure
upto31.03.20 21 Rs. Crore
Capex 2021-22 Rs. Crore
Cumulative
(31st
March2022)
Rs. Crore
Cumulative Progress (%) (upto 31st March 2022)
Remarks Physical Financial
Target
Actual Provl
(31st March 2022)
Target /Schedule
Actual
Target /Schedule
Actual
PACHWARA SOUTH COAL OCP (9.0 MTPA), JHARKHAND
04.05.2018 1,795.01 Sept 2028 1,795.01 Sept 2028* 34.92 250.00 4.45 39.37 @ 85** 2.19
* Attaining full rated capacity.@ Project under MDO mode work under progress. ** Phase-I Activities
Environmental Clearance: Public Hearing for grant of Environment Clearance for PSCB was conducted on 28 th December 2021.Minutes of meeting
submitted to JSPCB, Ranchi. EIA/EMP report preparation is under progress due to change in land schedule. “No Objection Certificate” issued by CGWA
on 25.03.2022 for abstraction of ground water.
Forest Diversion Plan (Form A) Stage -1 Clearance: Essential Details Sought (EDS) raised by DFO, Dumka was uploaded at PARIVESH portal of
MoEF& CC on 16.03.2022 for further processing of Form-A proposal. KML File & topo sheet submitted to DFO, Dumka, Deoghar & Sahibganj for
obtaining suitability certificate for Compensatory Afforestation.
EDS raised by DFO, Dumka on 22.03.2022 for correction in Form-A & submission of 09 sets of hard copies of revised Forest Proposal for further
processing. Work is under progress for EDS clearance.
Tree enumeration: Tree enumeration has been completed. Report submitted to DFO, Dumka.
Mine Feasibility Report (FR): M/s United Exploration India Pvt. Ltd is engaged for preparation of FR for PSCB. Final FR for board approval has been
submitted by M/s UEIPL on 24.03.2022.
Gazette notifications under CBA (A&D) Act, 1957: Gazette Notifications u/s 3, 4(1), 7(1),9(1),11(1) & 19 of CBA (A&D) Act, 1957 was issued by MoC
in respect of PSCB along with “No Objection Certificate” u/s 8(2) of CBA (A&D) Act 1957 issued by Coal Controller, Kolkata.
“No Objection Certificate” under FRA, 2006: The FRA process is under progress.
Evacuation of coal by railways: M/s RITES submitted final DPR to Eastern Railway for approval. Meeting was held with PCOM, Eastern Railway, Kolkata
on 21.03.2022 regarding finalization of DPR.
Date of
approval
Sanctioned Cost
Rs. Crore
Scheduled date of
completion
Anticipated Cost Rs.
Crore
Anticipated date of
completion
Cumulative Expenditure
upto 31.03.2021 Rs. Crore
Capex 2020-21
Rs. Crore
Cumulative
31st
March2022)
Rs. Crore
Cumulative Progress (%) (upto 31st March 2022)
Physical Financial
Target /Schedule
Actual
Target /Schedule
Actual
Target Actual Provl
(31st March 2022)
TALABIRA II & III COAL OC MINE (20.0 MTPA), ODISHA:
20.07.2017 2,401.07 18 months from date of LOA –
2,401.07 Jan 2027 * 792.60 200.00 132.93 925.53 87.00 38.55 91

06.02.18
* Attaining full rated capacity. Talabira Coal Mines CoD declared on 01.04.2021.
Talabira Mine operation commenced on 11th December 2019. Coal Production commenced on 26th April 2020.
Land compensation to PAPs started on 24thJuly 2019. Cumulative Rs.112.29 Cr disbursed for 103.69-hectare land and 500 no. of Khatas in
Sambalpur district. Cumulative Rs.11.75 Cr disbursed for 13.68hectare land and 65 no. of Khatas in Jharsugudadistricttill31stMarch 2022.
Disbursement of Annuity and Cash in lieu of employment: Payment of Annuity and Cash in lieu of employment commenced on 14th July 2021.
Cumulative Summary for disbursement of Annuity and Cash in lieu of employment till 31stMarch 2022: Total no. of PAF – 20 Nos., total amount for
Cash in lieu of employment: Rs 1.20 Cr & total amount for Annuity: Rs.0.096 Cr.
Acquisition of land for approach road to mines: Registration of 11 khatas out of 14 khatas of General category has been completed for 5.71 acre of
land out of total 7.80-Acre land. Registration of 7khatas out of 9 khatas of ST/SC land has been completed for 3.83 acre of land out of total 5.91 Acre
land. Total Registration of 18 khatas out of 23 khatas has been completed for 9.54 acre of land out of total land 13.71-acre land.
Direct Sale of Excess Coal: Approval has been granted by MOC on 17th May 2021 to allow NLCIL for sale of excess coal through e-auction for
maximum of 19 LT in first half of F.Y. 2021-22 and 12.50 LT in second half of F.Y. 2021-22. Auction for 19 LT in first half of F.Y. 2021-22held on 26th
May 2021.Dispatch started on 20th June 2021 and completed on 24th December 2021. E-Auction for 5.00 LT of Coal was held on 18.11.2021 and
dispatch of coal commenced on 30.12.2021 and completed on 27.03.2022. Cumulative 56.52 LTof excess coal through e-auction has been dispatched
till 31.03.2022.
DISPATCH OF COAL to NTPL: LOA for Logistic contract to move coal from Talabira mines to NTPL has been issued on 12th July 2021. Lifting of Coal
by NTPL from Talabira II & III OCP commenced from 10th September 2021. Out of Target of 29.45 LT for F.Y. 2021-22, 14.17 LT of Coal has been
dispatched to NTPL till 31st March 2022. CMD/NLCIL requested the Member (Operations & Business Development), Ministry of Railways, Railway Board
for augmenting railway racks for expediting the coal movement considering the acute coal shortage and to allot 3 BOBRN rakes and 1 BOXN rakes
on daily basis to sustain power generation on 15th January 2022, 4th February 2022 and again on 03rd March 2022.
DISPATCH OF COAL to NTPC: Talabira Project of NLCIL has commenced coal supply to NTPC Darlipali and NTPC Lara on 14 th and 16thOctober 2021
respectively. A quantity of 22.53 LT of coal has been despatched till31st March 2022.
Railway Siding: Package-I: LoA has been issued to M/s Triveni Engicons Pvt Ltd on 13thMarch 2020. Package-II: LoA has been issued to M/s SMS
Ltd on 5thJune 2020.Govt. land of 1.77 km in Hirma & Malda Village handed over to M/s SMS Ltd. (Package II) on 10thAugust 2020. Purchase order
for rails procurement (Package-III) issued on 31stMarch 2020.First Consignment of Rail received at site on 15thFebruary 2021. Cumulative 2158.13
MT out of total 2300 MT of Rail received at site. 2.1 Ac of Govt. Non forest land Outside Mine Lease Boundary Land in Singhabaga Village has been
approved by Board of Revenue, Odisha. Permission from District Administration to purchase tenancy land from SC/ST landowner under Sec.22 is in
progress. Total 18 no. of registration for 5.19 acres tenancy Land has been completed.
92
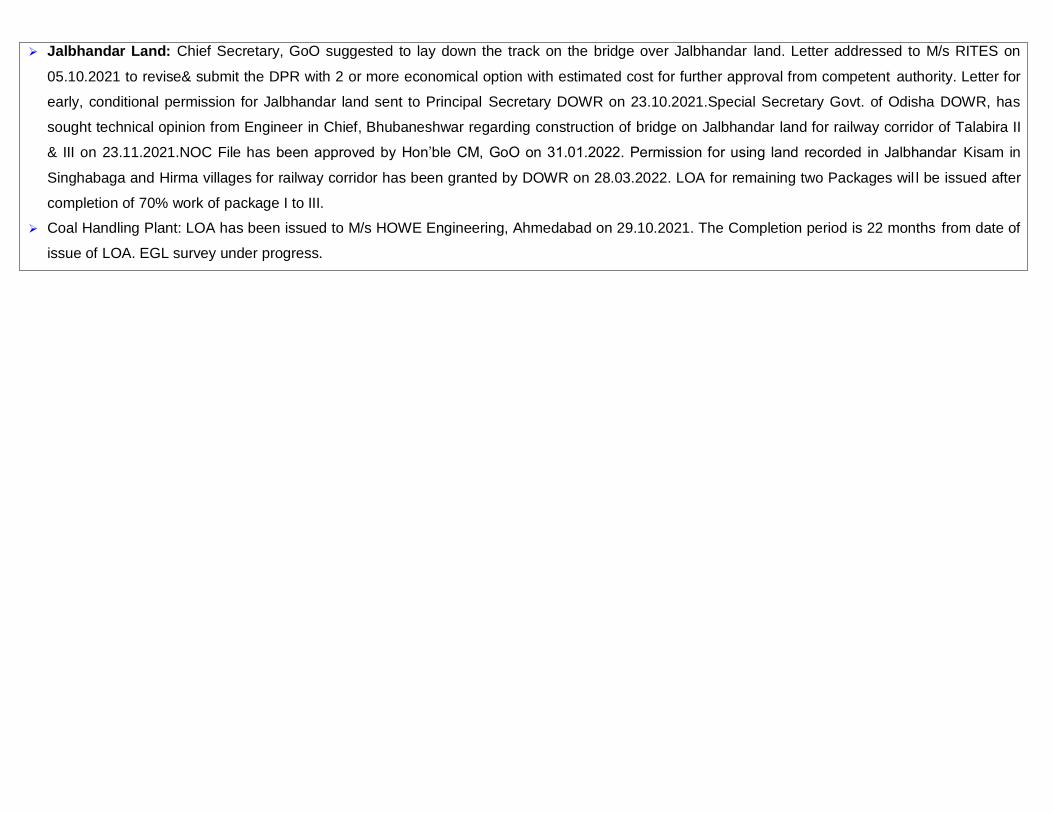
Jalbhandar Land: Chief Secretary, GoO suggested to lay down the track on the bridge over Jalbhandar land. Letter addressed to M/s RITES on
05.10.2021 to revise& submit the DPR with 2 or more economical option with estimated cost for further approval from competent authority. Letter for
early, conditional permission for Jalbhandar land sent to Principal Secretary DOWR on 23.10.2021.Special Secretary Govt. of Odisha DOWR, has
sought technical opinion from Engineer in Chief, Bhubaneshwar regarding construction of bridge on Jalbhandar land for railway corridor of Talabira II
& III on 23.11.2021.NOC File has been approved by Hon’ble CM, GoO on 31.01.2022. Permission for using land recorded in Jalbhandar Kisam in
Singhabaga and Hirma villages for railway corridor has been granted by DOWR on 28.03.2022. LOA for remaining two Packages wil l be issued after
completion of 70% work of package I to III.
Coal Handling Plant: LOA has been issued to M/s HOWE Engineering, Ahmedabad on 29.10.2021. The Completion period is 22 months from date of
issue of LOA. EGL survey under progress.
93
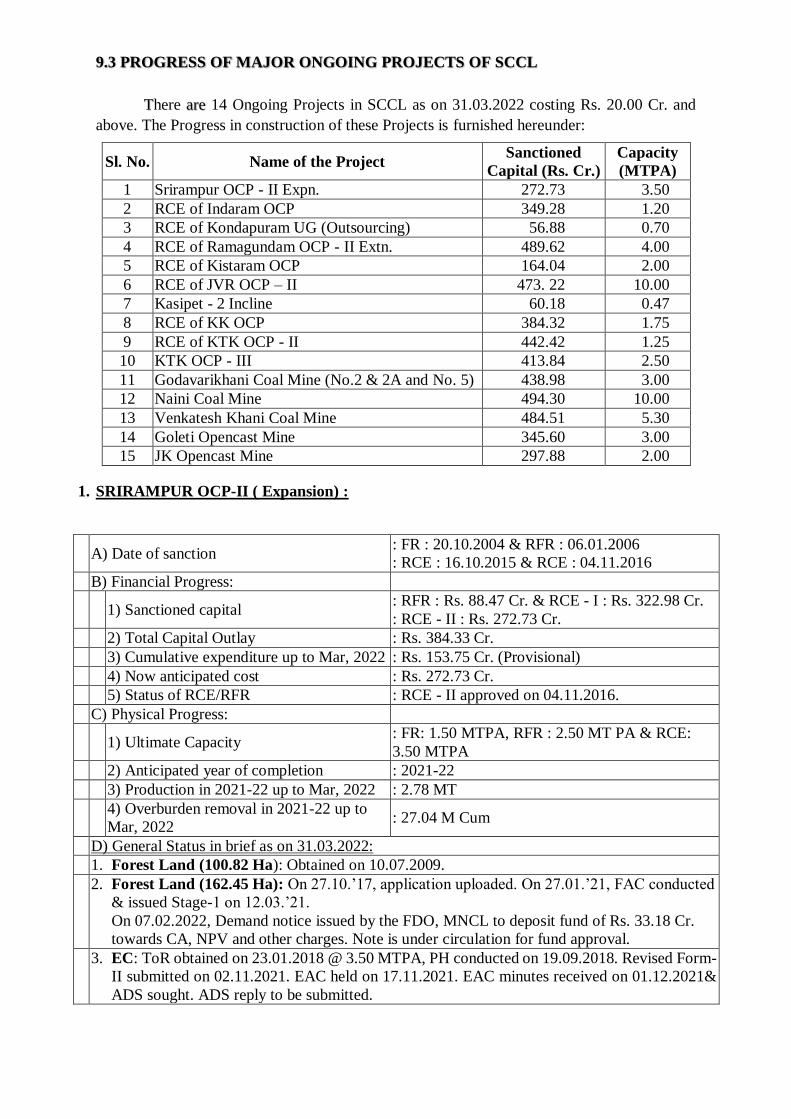
9.3 PROGRESS OF MAJOR ONGOING PROJECTS OF SCCL
There are 14 Ongoing Projects in SCCL as on 31.03.2022 costing Rs. 20.00 Cr. and
above. The Progress in construction of these Projects is furnished hereunder:
Sl. No. Name of the Project Sanctioned
Capital (Rs. Cr.)
Capacity
(MTPA)
1 Srirampur OCP - II Expn. 272.73 3.50
2 RCE of Indaram OCP 349.28 1.20
3 RCE of Kondapuram UG (Outsourcing) 56.88 0.70
4 RCE of Ramagundam OCP - II Extn. 489.62 4.00
5 RCE of Kistaram OCP 164.04 2.00
6 RCE of JVR OCP – II 473. 22 10.00
7 Kasipet - 2 Incline 60.18 0.47
8 RCE of KK OCP 384.32 1.75
9 RCE of KTK OCP - II 442.42 1.25
10 KTK OCP - III 413.84 2.50
11 Godavarikhani Coal Mine (No.2 & 2A and No. 5) 438.98 3.00
12 Naini Coal Mine 494.30 10.00
13 Venkatesh Khani Coal Mine 484.51 5.30
14 Goleti Opencast Mine 345.60 3.00
15 JK Opencast Mine 297.88 2.00
1. SRIRAMPUR OCP-II ( Expansion) :
A) Date of sanction : FR : 20.10.2004 & RFR : 06.01.2006
: RCE : 16.10.2015 & RCE : 04.11.2016
B) Financial Progress:
1) Sanctioned capital : RFR : Rs. 88.47 Cr. & RCE - I : Rs. 322.98 Cr.
: RCE - II : Rs. 272.73 Cr.
2) Total Capital Outlay : Rs. 384.33 Cr.
3) Cumulative expenditure up to Mar, 2022 : Rs. 153.75 Cr. (Provisional)
4) Now anticipated cost : Rs. 272.73 Cr.
5) Status of RCE/RFR : RCE - II approved on 04.11.2016.
C) Physical Progress:
1) Ultimate Capacity : FR: 1.50 MTPA, RFR : 2.50 MT PA & RCE:
3.50 MTPA
2) Anticipated year of completion : 2021-22
3) Production in 2021-22 up to Mar, 2022 : 2.78 MT
4) Overburden removal in 2021-22 up to
Mar, 2022 : 27.04 M Cum
D) General Status in brief as on 31.03.2022:
1. Forest Land (100.82 Ha): Obtained on 10.07.2009.
2. Forest Land (162.45 Ha): On 27.10.’17, application uploaded. On 27.01.’21, FAC conducted
& issued Stage-1 on 12.03.’21.
On 07.02.2022, Demand notice issued by the FDO, MNCL to deposit fund of Rs. 33.18 Cr.
towards CA, NPV and other charges. Note is under circulation for fund approval.
3. EC: ToR obtained on 23.01.2018 @ 3.50 MTPA, PH conducted on 19.09.2018. Revised Form-
II submitted on 02.11.2021. EAC held on 17.11.2021. EAC minutes received on 01.12.2021&
ADS sought. ADS reply to be submitted.
94

4. Diversion of Private Land (50.21 Ha): Requisition submitted in Oct, 2017. Enjoyment &
SES completed for 154 houses and the same is under scrutiny at Tahsildar, Jaipur. After
scrutiny PN is to be published by Dist. Revenue authorities.
5. Non-Forest Land acquisition (Thallapalli, Singapuram, Guthedarpalli & Ramaraopet
Villages):
6. Thallapalli (Ac. 60-08½gts) for dump area: PN published on 17.07.2019. PD published on
19.03.2020. DC, MNCL extended LA proceedings for further 12 months upto 17.03.2022.
Award Enquiry conducted on 28.10.2021. Award passed on 17.01.022 for an extent of Ac.60-
18 ½gts. Rs.12.00 Cr. cheque handed over to RDO, MNCL for payment to Thallapalli
villagers peradu land compensation & amount to be disbursed.
a. Singapuram: Ac. 505-12gts (Agricultural Patta Land) for quarry area, Ac. 131-16gts
(Structured Patta Land) for dump area Ac. 312-03gts (Assigned Land) for dump area:
Completed.
b. Ramaraopet & Guthedarpalli for quarry area: Ac. 49-07gts (Assigned land): Completed.
c. NF land (48.92 Ha) for expansion project: Requisition is to be submitted.
d. R&R: Thallapalli-800, Singapur-963, Guthedarpalli-136, Total PDFs =1899 & 1899
allotted.
e. R&R of Thallapalli village (800 PDF): 800/800 plots allotted. Completed.
f. R&R of Singapur & Guthedharpalli villages (963 PDF in Singapur & 136 PDF in
Guthedarpalli): Singapur: 963 plots allotted. Guthedarpally: 136 - plots allotted.
Completed.
g. R&R Dubbapalii (120 PDF): Action is to be initiated.
7. Drilling of 6 Nos. large dia. (24") boreholes: Completed & two 300 HP pumps working.
8. CHP: All works completed & PWWLS commissioned on13.01.2020.
9. Rly. Line to STPP (21.175Km): Single track line completed. 1st coal load taken on
01.08.2018.
10. OBR: OBR commenced from 01.06.2013.
11. Coal Production: Production from the projects has started from 1.08.2013
1. 2013-14 = 1.45 MT
2. 2014-15 = 2.54MT
3. 2015-16 = 2.70 MT
4. 2016-17 = 2.03 MT
5. 2017-18 = 2.57 MT
6. 2018-19 = 2.98 MT
7. 2019-20 = 2.97 MT
8. 2020-21= 2.09 MT
9. 2021-22= 2.77 MT
2. INDARAM OCP PROJECT:
A) Date of sanction : 04.07.2011 & RCE: 19.8.2017
B) Financial Progress:
1) Sanctioned capital : Rs. 162.76 Cr. & RCE: Rs. 349.28 Cr.
2) Total Capital Outlay : Rs. 358.43 Cr.
3) Cumulative expenditure up to Mar,
2022 : Rs. 314.63 Cr. ( Provisional)
4) Now anticipated cost : Rs. 349.28 Cr.
5) Status of RCE : RCE approved on 19.8.2017.
C) Physical Progress:
1) Ultimate Capacity : 1.2 MTPA
2) Anticipated year of completion : 2021-22
3) Production in 2021-22 up to Mar, 2022 : 1.50 MT
95
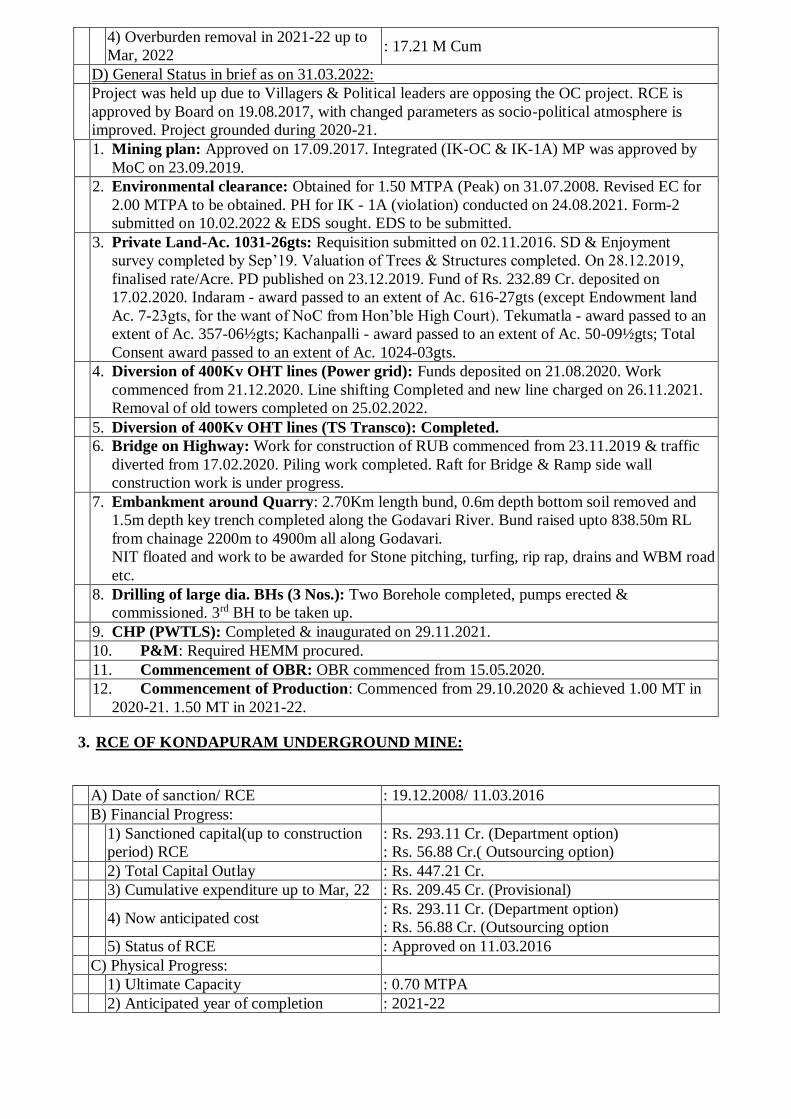
4) Overburden removal in 2021-22 up to
Mar, 2022 : 17.21 M Cum
D) General Status in brief as on 31.03.2022:
Project was held up due to Villagers & Political leaders are opposing the OC project. RCE is
approved by Board on 19.08.2017, with changed parameters as socio-political atmosphere is
improved. Project grounded during 2020-21.
1. Mining plan: Approved on 17.09.2017. Integrated (IK-OC & IK-1A) MP was approved by
MoC on 23.09.2019.
2. Environmental clearance: Obtained for 1.50 MTPA (Peak) on 31.07.2008. Revised EC for
2.00 MTPA to be obtained. PH for IK - 1A (violation) conducted on 24.08.2021. Form-2
submitted on 10.02.2022 & EDS sought. EDS to be submitted.
3. Private Land-Ac. 1031-26gts: Requisition submitted on 02.11.2016. SD & Enjoyment
survey completed by Sep’19. Valuation of Trees & Structures completed. On 28.12.2019,
finalised rate/Acre. PD published on 23.12.2019. Fund of Rs. 232.89 Cr. deposited on
17.02.2020. Indaram - award passed to an extent of Ac. 616-27gts (except Endowment land
Ac. 7-23gts, for the want of NoC from Hon’ble High Court). Tekumatla - award passed to an
extent of Ac. 357-06½gts; Kachanpalli - award passed to an extent of Ac. 50-09½gts; Total
Consent award passed to an extent of Ac. 1024-03gts.
4. Diversion of 400Kv OHT lines (Power grid): Funds deposited on 21.08.2020. Work
commenced from 21.12.2020. Line shifting Completed and new line charged on 26.11.2021.
Removal of old towers completed on 25.02.2022.
5. Diversion of 400Kv OHT lines (TS Transco): Completed.
6. Bridge on Highway: Work for construction of RUB commenced from 23.11.2019 & traffic
diverted from 17.02.2020. Piling work completed. Raft for Bridge & Ramp side wall
construction work is under progress.
7. Embankment around Quarry: 2.70Km length bund, 0.6m depth bottom soil removed and
1.5m depth key trench completed along the Godavari River. Bund raised upto 838.50m RL
from chainage 2200m to 4900m all along Godavari.
NIT floated and work to be awarded for Stone pitching, turfing, rip rap, drains and WBM road
etc.
8. Drilling of large dia. BHs (3 Nos.): Two Borehole completed, pumps erected &
commissioned. 3rd BH to be taken up.
9. CHP (PWTLS): Completed & inaugurated on 29.11.2021.
10. P&M: Required HEMM procured.
11. Commencement of OBR: OBR commenced from 15.05.2020.
12. Commencement of Production: Commenced from 29.10.2020 & achieved 1.00 MT in
2020-21. 1.50 MT in 2021-22.
3. RCE OF KONDAPURAM UNDERGROUND MINE:
A) Date of sanction/ RCE : 19.12.2008/ 11.03.2016
B) Financial Progress:
1) Sanctioned capital(up to construction
period) RCE
: Rs. 293.11 Cr. (Department option)
: Rs. 56.88 Cr.( Outsourcing option)
2) Total Capital Outlay : Rs. 447.21 Cr.
3) Cumulative expenditure up to Mar, 22 : Rs. 209.45 Cr. (Provisional)
4) Now anticipated cost : Rs. 293.11 Cr. (Department option)
: Rs. 56.88 Cr. (Outsourcing option
5) Status of RCE : Approved on 11.03.2016
C) Physical Progress:
1) Ultimate Capacity : 0.70 MTPA
2) Anticipated year of completion : 2021-22
96
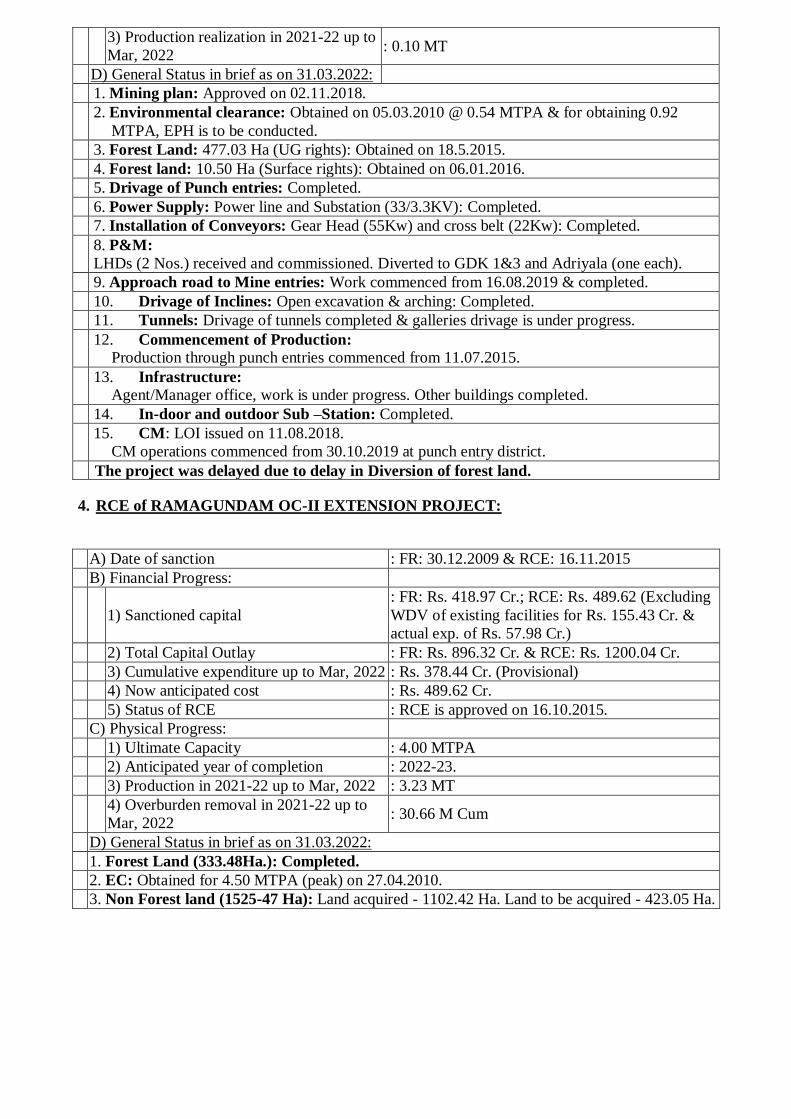
3) Production realization in 2021-22 up to
Mar, 2022 : 0.10 MT
D) General Status in brief as on 31.03.2022:
1. Mining plan: Approved on 02.11.2018.
2. Environmental clearance: Obtained on 05.03.2010 @ 0.54 MTPA & for obtaining 0.92
MTPA, EPH is to be conducted.
3. Forest Land: 477.03 Ha (UG rights): Obtained on 18.5.2015.
4. Forest land: 10.50 Ha (Surface rights): Obtained on 06.01.2016.
5. Drivage of Punch entries: Completed.
6. Power Supply: Power line and Substation (33/3.3KV): Completed.
7. Installation of Conveyors: Gear Head (55Kw) and cross belt (22Kw): Completed.
8. P&M:
LHDs (2 Nos.) received and commissioned. Diverted to GDK 1&3 and Adriyala (one each).
9. Approach road to Mine entries: Work commenced from 16.08.2019 & completed.
10. Drivage of Inclines: Open excavation & arching: Completed.
11. Tunnels: Drivage of tunnels completed & galleries drivage is under progress.
12. Commencement of Production:
Production through punch entries commenced from 11.07.2015.
13. Infrastructure:
Agent/Manager office, work is under progress. Other buildings completed.
14. In-door and outdoor Sub –Station: Completed.
15. CM: LOI issued on 11.08.2018.
CM operations commenced from 30.10.2019 at punch entry district.
The project was delayed due to delay in Diversion of forest land.
4. RCE of RAMAGUNDAM OC-II EXTENSION PROJECT:
A) Date of sanction : FR: 30.12.2009 & RCE: 16.11.2015
B) Financial Progress:
1) Sanctioned capital
: FR: Rs. 418.97 Cr.; RCE: Rs. 489.62 (Excluding
WDV of existing facilities for Rs. 155.43 Cr. &
actual exp. of Rs. 57.98 Cr.)
2) Total Capital Outlay : FR: Rs. 896.32 Cr. & RCE: Rs. 1200.04 Cr.
3) Cumulative expenditure up to Mar, 2022 : Rs. 378.44 Cr. (Provisional)
4) Now anticipated cost : Rs. 489.62 Cr.
5) Status of RCE : RCE is approved on 16.10.2015.
C) Physical Progress:
1) Ultimate Capacity : 4.00 MTPA
2) Anticipated year of completion : 2022-23.
3) Production in 2021-22 up to Mar, 2022 : 3.23 MT
4) Overburden removal in 2021-22 up to
Mar, 2022 : 30.66 M Cum
D) General Status in brief as on 31.03.2022:
1. Forest Land (333.48Ha.): Completed.
2. EC: Obtained for 4.50 MTPA (peak) on 27.04.2010.
3. Non Forest land (1525-47 Ha): Land acquired - 1102.42 Ha. Land to be acquired - 423.05 Ha.
97
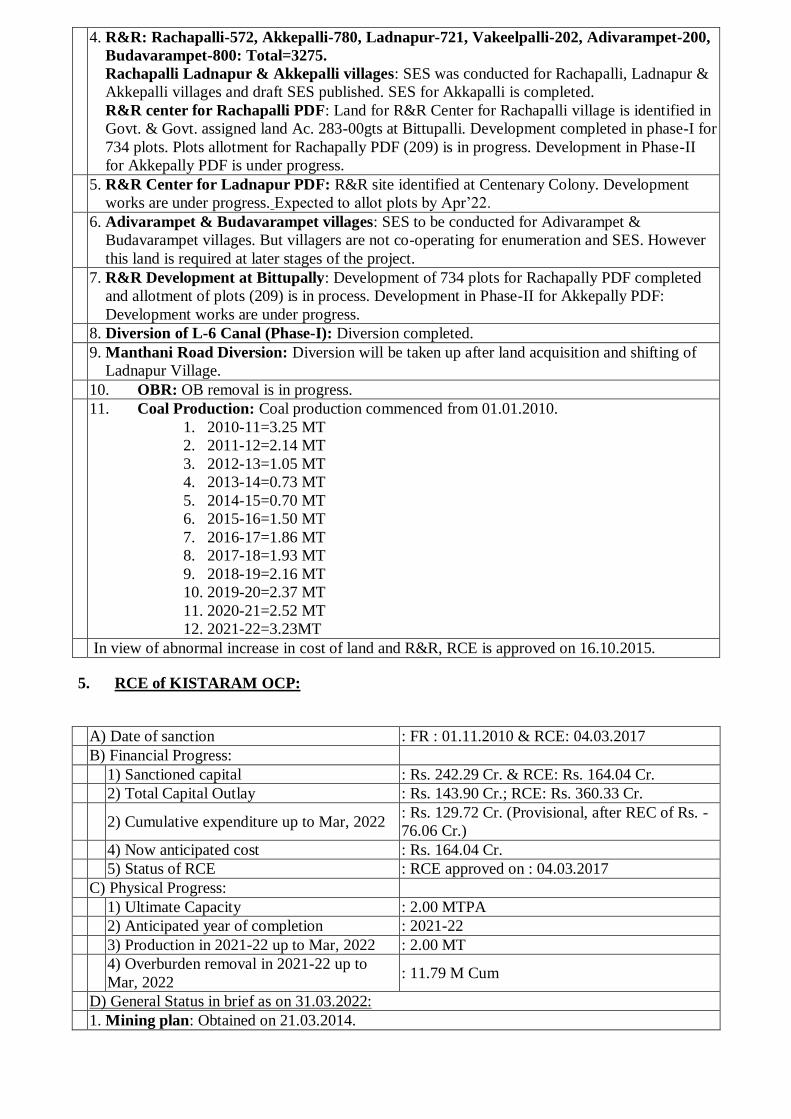
4. R&R: Rachapalli-572, Akkepalli-780, Ladnapur-721, Vakeelpalli-202, Adivarampet-200,
Budavarampet-800: Total=3275.
Rachapalli Ladnapur & Akkepalli villages: SES was conducted for Rachapalli, Ladnapur &
Akkepalli villages and draft SES published. SES for Akkapalli is completed.
R&R center for Rachapalli PDF: Land for R&R Center for Rachapalli village is identified in
Govt. & Govt. assigned land Ac. 283-00gts at Bittupalli. Development completed in phase-I for
734 plots. Plots allotment for Rachapally PDF (209) is in progress. Development in Phase-II
for Akkepally PDF is under progress.
5. R&R Center for Ladnapur PDF: R&R site identified at Centenary Colony. Development
works are under progress. Expected to allot plots by Apr’22.
6. Adivarampet & Budavarampet villages: SES to be conducted for Adivarampet &
Budavarampet villages. But villagers are not co-operating for enumeration and SES. However
this land is required at later stages of the project.
7. R&R Development at Bittupally: Development of 734 plots for Rachapally PDF completed
and allotment of plots (209) is in process. Development in Phase-II for Akkepally PDF:
Development works are under progress.
8. Diversion of L-6 Canal (Phase-I): Diversion completed.
9. Manthani Road Diversion: Diversion will be taken up after land acquisition and shifting of
Ladnapur Village.
10. OBR: OB removal is in progress.
11. Coal Production: Coal production commenced from 01.01.2010.
1. 2010-11=3.25 MT
2. 2011-12=2.14 MT
3. 2012-13=1.05 MT
4. 2013-14=0.73 MT
5. 2014-15=0.70 MT
6. 2015-16=1.50 MT
7. 2016-17=1.86 MT
8. 2017-18=1.93 MT
9. 2018-19=2.16 MT
10. 2019-20=2.37 MT
11. 2020-21=2.52 MT
12. 2021-22=3.23MT
In view of abnormal increase in cost of land and R&R, RCE is approved on 16.10.2015.
5. RCE of KISTARAM OCP:
A) Date of sanction : FR : 01.11.2010 & RCE: 04.03.2017
B) Financial Progress:
1) Sanctioned capital : Rs. 242.29 Cr. & RCE: Rs. 164.04 Cr.
2) Total Capital Outlay : Rs. 143.90 Cr.; RCE: Rs. 360.33 Cr.
2) Cumulative expenditure up to Mar, 2022 : Rs. 129.72 Cr. (Provisional, after REC of Rs. -
76.06 Cr.)
4) Now anticipated cost : Rs. 164.04 Cr.
5) Status of RCE : RCE approved on : 04.03.2017
C) Physical Progress:
1) Ultimate Capacity : 2.00 MTPA
2) Anticipated year of completion : 2021-22
3) Production in 2021-22 up to Mar, 2022 : 2.00 MT
4) Overburden removal in 2021-22 up to
Mar, 2022 : 11.79 M Cum
D) General Status in brief as on 31.03.2022:
1. Mining plan: Obtained on 21.03.2014.
98
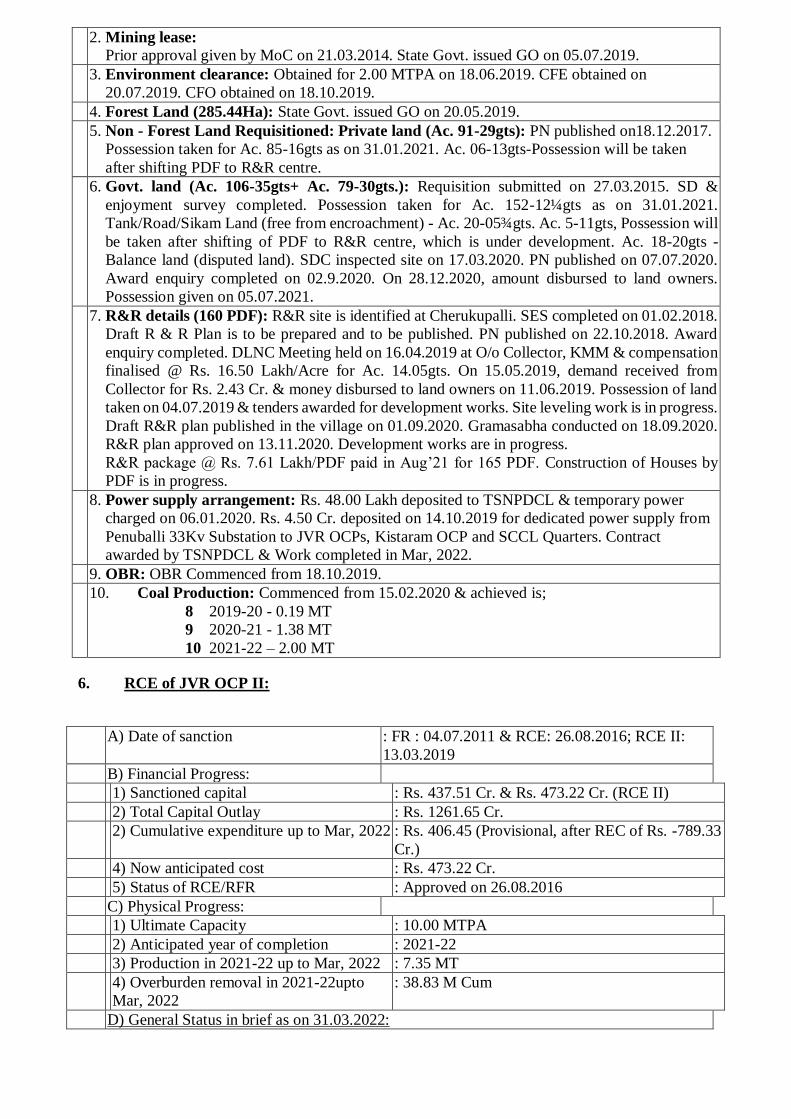
2. Mining lease:
Prior approval given by MoC on 21.03.2014. State Govt. issued GO on 05.07.2019.
3. Environment clearance: Obtained for 2.00 MTPA on 18.06.2019. CFE obtained on
20.07.2019. CFO obtained on 18.10.2019.
4. Forest Land (285.44Ha): State Govt. issued GO on 20.05.2019.
5. Non - Forest Land Requisitioned: Private land (Ac. 91-29gts): PN published on18.12.2017.
Possession taken for Ac. 85-16gts as on 31.01.2021. Ac. 06-13gts-Possession will be taken
after shifting PDF to R&R centre.
6. Govt. land (Ac. 106-35gts+ Ac. 79-30gts.): Requisition submitted on 27.03.2015. SD &
enjoyment survey completed. Possession taken for Ac. 152-12¼gts as on 31.01.2021.
Tank/Road/Sikam Land (free from encroachment) - Ac. 20-05¾gts. Ac. 5-11gts, Possession will
be taken after shifting of PDF to R&R centre, which is under development. Ac. 18-20gts -
Balance land (disputed land). SDC inspected site on 17.03.2020. PN published on 07.07.2020.
Award enquiry completed on 02.9.2020. On 28.12.2020, amount disbursed to land owners.
Possession given on 05.07.2021.
7. R&R details (160 PDF): R&R site is identified at Cherukupalli. SES completed on 01.02.2018.
Draft R & R Plan is to be prepared and to be published. PN published on 22.10.2018. Award
enquiry completed. DLNC Meeting held on 16.04.2019 at O/o Collector, KMM & compensation
finalised @ Rs. 16.50 Lakh/Acre for Ac. 14.05gts. On 15.05.2019, demand received from
Collector for Rs. 2.43 Cr. & money disbursed to land owners on 11.06.2019. Possession of land
taken on 04.07.2019 & tenders awarded for development works. Site leveling work is in progress.
Draft R&R plan published in the village on 01.09.2020. Gramasabha conducted on 18.09.2020.
R&R plan approved on 13.11.2020. Development works are in progress.
R&R package @ Rs. 7.61 Lakh/PDF paid in Aug’21 for 165 PDF. Construction of Houses by
PDF is in progress.
8. Power supply arrangement: Rs. 48.00 Lakh deposited to TSNPDCL & temporary power
charged on 06.01.2020. Rs. 4.50 Cr. deposited on 14.10.2019 for dedicated power supply from
Penuballi 33Kv Substation to JVR OCPs, Kistaram OCP and SCCL Quarters. Contract
awarded by TSNPDCL & Work completed in Mar, 2022.
9. OBR: OBR Commenced from 18.10.2019.
10. Coal Production: Commenced from 15.02.2020 & achieved is;
8 2019-20 - 0.19 MT
9 2020-21 - 1.38 MT
10 2021-22 – 2.00 MT
6. RCE of JVR OCP II:
A) Date of sanction : FR : 04.07.2011 & RCE: 26.08.2016; RCE II:
13.03.2019
B) Financial Progress:
1) Sanctioned capital : Rs. 437.51 Cr. & Rs. 473.22 Cr. (RCE II)
2) Total Capital Outlay : Rs. 1261.65 Cr.
2) Cumulative expenditure up to Mar, 2022 : Rs. 406.45 (Provisional, after REC of Rs. -789.33
Cr.)
4) Now anticipated cost : Rs. 473.22 Cr.
5) Status of RCE/RFR : Approved on 26.08.2016
C) Physical Progress:
1) Ultimate Capacity : 10.00 MTPA
2) Anticipated year of completion : 2021-22
3) Production in 2021-22 up to Mar, 2022 : 7.35 MT
4) Overburden removal in 2021-22upto
Mar, 2022
: 38.83 M Cum
D) General Status in brief as on 31.03.2022:
99
1. Mining Plan: MP for 10 MTPA was approved on 11.02.2019.
2. Environment Clearance: EC for 10 MTPA obtained on 11.10.2021.
3. Mining lease: Obtained on 03.11.2016.
4. Forest Land (776.20Ha): Stage II on 30.5.2017. State Govt. issued G.O on 07.07.2017.
5. Non Forest land (686.80 Ha as per RCE): Private Land - 563.45 Ha & Govt. land –
123.35 Ha. Acquisition of Private land (Ac. 94-07gts. of Kistaram (dump yard):
Completed.
6. Acquisition of Private land (Ac. 489-04gts. of Kommepalli): 09 land owners filed Writ
Petition No. 21315/ 2017 on 20.06.2017 in Hon’ble High Court, Hyd. challenging the
Awards passed by Lok Adalat, KMM in respect of certain Survey Numbers. Hon’ble High
Court issued orders to maintain Status-quo. On 28.11.2017, Hon’ble Prl. Dist. & Sessions
Judge, KMM referred the case to Hon’ble High Court, Hyd. to pass appropriate orders on
the Award. On 30.04.2018, Hon’ble high Court directed Dist. Judge to disburse amounts by
30.06.2018. During trail hearing on 30.07.2018, Dist. Judge informed that compensation
would be disbursed for about Ac.309-00gts by 16.08.2018 on filing of individual Cheque
Petitions.
On 31.07.2018, GM, Kgm & GM(Est) met Dist. Judge, KMM for disbursement of
payments. On 31.8.2018, Dist. Judge, KMM instructed the concerned to withdraw the
amount for disbursement to the land owners for an extent of Ac. 235-00 gts, who got
Hon’ble High Court Orders (99 land owners).
Further, for Ac. 110-00gts, land owners have to approach the High Court to get the similar
orders for compensation (28 land owners). On 30.09.2018 individual writ petitions’
submitted at Dist. Judge, KMM by land owners for an extent of Ac. 124-00gts. Dist. Judge,
KMM disbursed compensation during 2nd week of Jan’19 for an extent of Ac. 238-00gts of
Patta Land of Kommepalli village. Balance Ac. 63-00gts, the land owners are submitting
individual Cheque Petitions in the Dist. Court. For remaining extent of Ac. 125-10gts Patta
Land, award enquiry is under process at Dist. Judge KMM. Case heard on 29.07.2021 and it
was transferred to Hon’ble Addl. Dist. Judge’s Court, STPL. Case heard on 22.03.2022 and
posted to 28.04.2022. The Addl. Dist. Judge, STPL has to pass awards after clearing the title
disputes. Tahsildar, Sathupalli has handed over Ac. 489-04gts to SCCL on 24.09.2021 by
Panchanama. Physical possession taken. Dozing completed. Trench work is under progress.
7. Kommepalli Village Site (Ac 23-07gts) R&R: Completed.
8. Govt. land (Ac 304-27gts): Ac. 260-26gts land is under possession of SCCL. Remaining
land is required at later stages.
9. R&R details (229 PDF) (Kommepalli): R&R approved for 229 PDF by Commissioner,
R&R. RDO, Kallur, disbursed the R&R entitlements to the PDF of Kommepalli on
28.08.2018 to 30.08.2018. On 02.10.2018, RDO, Kallur handed over house plots to PDF.
Development of R&R centre completed & PDF are constructing houses at R&R centre.
10. CHP: Conventional CHP: Work commenced from 18.04.2019. 1/3 streams commissioned
& 2 streams are under progress.
Hiring of mobile crushers:
PO released on 09.07.2019. Machine commissioned on 11.11.2019.
11. Construction of CHP under EPC mode: PO released on 19.04.2019. The Firm
commenced work from 01.11.2019. Scheduled completion is 18 months from Zero date i.e.
from 01.11.2019 to 31.04.2021. Due to Covid-19, CHP is expected to be commissioned by
May’22.
12. Railway line between Bhadrachalam Road to Sattupalli (53.20Km &Rs. 704.31 Cr.):
Present revised project cost as per Railway Board (28.02.2020): Rs. 927.94 Cr. SCCL Share:
Rs. 618.55 Cr. Amount deposited to SCR by SCCL: Rs. 618.55 Cr. Track completed so far:
40 Km. Probable date of completion of the project: 31.03.2022
Up to Bhavanapalem (39.25 Km) by Feb- 2022. (Construction of 03 (06) bridges is under
progress).
The balance track completion up to Sathupally is expected by May-2022.
13. OBR: OB removal commenced from 1st Sept, 2017.
100
14. Coal Production: Production commenced from 31.10.2017.
1. 2017-18 = 0.75 MT
2. 2018-19 = 2.96 MT
3. 2019-20 = 4.83 MT
4. 2020-21 = 4.76 MT
5. 2021-22 = 7.35 MT
7. KASIPET – 2 Incline:
A) Date of sanction : FR : 04.07.2011
B) Financial Progress:
1) Sanctioned capital : Rs. 60.18 Cr.
2) Total Capital Outlay : Rs. 57.86 Cr.
2) Cumulative expenditure up to Mar, 22 : Rs. 55.72 Cr. (Provisional)
4) Now anticipated cost : Rs. 60.18 Cr.
5) Status of RCE/RFR : Not required.
C) Physical Progress:
1) Ultimate Capacity : 0.47 MTPA
2) Anticipated year of completion : 2021-22
3) Production in 2021-22 up to Mar, 2022 : 0.07 MT
D) General Status in brief as on 31.03.2022:
1. Mining Plan: Approved on 01.01.2015.
2. Environment Clearance: Obtained for 0.47 MTPA on 11.05.2015.
3. NF Land required (33.08 Ha.). Completed.
4. Tunnels: Completed @ 211.30m & 226.60m. Coal production commenced from 23.01.2019.
5. Power supply – Completed
6. Surface infrastructures: Completed by Aug’19.
7. Surface Bunker: Work commenced from 11.12.2017 & completed.
8. Sinking of Air Shaft (61m): Completed in Apr’21.
9. Construction of Fan house & erection of Fan: Construction of fan house is under progress.
10. Stowing Plant: Action to be initiated at later stages.
11. Road Diversion: Completed.
12. Coal production: Coal production commenced from 23.01.2019 & achieved is;
1. 2019-20 - 0.043 MT
2. 2020-21 - 0.05 MT.
3. 2021-22 – 0.07 MT
8. RCE OF KK OCP:
A) Date of sanction FR/ RCE : FR/RCE : 24.07.2012/ 11.03.2016
B) Financial Progress:
1) Sanctioned capital FR/RCE : Rs. 417.33 Cr./ Rs. 384.32 Cr.
2) Total Capital Outlay : Rs. 493.18 Cr.
2) Cumulative expenditure up to Mar,
2022 : Rs. 169.03 Cr. (Provisional)
4) Now anticipated cost : Rs. 384.32 Cr.
5) Status of RCE/RFR : RCE approved on 11.03.2016.
C) Physical Progress:
1) Ultimate Capacity : 1.75 MTPA
2) Anticipated year of completion : 2021-22
3) Production in 2021-22 up to Mar, 2022 : 1.76 MT
101
4) Overburden removal in 2021-22 up to
Mar, 2022 : 18.12 M. Cum
D) General Status in brief as on 31.03.2022:
1. Mining Plan: Approved on 25.11.2014
2. Mining Lease: Covered under NGML valid for further 20 years.
3. Environment Clearance: Obtained for 2.00 MTPA (peak) on 19.03.2015.
4. NF Land required (Ac. 1999-32gts as per FR): Acquired: Ac. 1516-06gts, Balance to be
acquired: Ac. 483-26gts
A) Ac.121.26gts: PN & PD published and to be prepared the Award by the RDO/LAO, BPA.
Tahsildar, Kasipet submitted spot inspection report & stating that only an extent of Ac.76-
25gts. (Out of 121-26) is under occupation of the individuals. Ex-gratia fixed @ 3,
00,000/- per Acre and Proceedings sent to DC, MNCL on 22.01.2022 by the RDO, BPA.
To be approved by the DC, MNCL.
B) Ac. 60-30gts: Tahsildar, Kasipet submitted spot inspection report & stating that only an
extent of Ac. 60-30gts. is under occupation of the individuals. PN proposals sent to the
DC, MNCL on 24.11.2021 & approved on 03.01.2022, published on 01.02.2022.
5. Status of R&R of Dubbagudem Village (Patta Land Ac. 25-33gts - 410 PDF): Enjoyment
& SES completed on 22.05.2019 (Structures land: Ac. 8-20gts & Agriculture land: Ac.17-
13gts i.e. Total land = Ac. 25-33gts & Total houses-243). PN published on 08.02.2020 for Ac.
08-20gts of structures land & on 24.03.2020, for agriculture land of Ac.17-13gts. PD
published on 02.04.2021 for Ac.17-13gts & Ac. 08-20gts on 20.06.2021. Estimation of trees
& houses completed and report submitted on 30.03.2022. On 23.11.2021, Award enquiry
conducted by the RDO, BPA. The Award to be passed. On 29.03.2022 RDO, BPA sent a draft
Award to an extent of Acs.06-21 gts. out of (17-13) Agriculture land to Collector, MNCL for
approval.
6. Development of R&R centre (Ac. 32-06gts) at Peddanapalli Village for Dubbagudem 410
PDF: Award passed on 17.05.2021 and land handed over to SCCL. RDO, BPA requested the
GM, MM on 25.10.2021 to furnish the Layout Map of Plots with an extent of 200 Sq.yds for
distribution to the each PDF of Dubbagudem village. The Layout map submitted to the RDO,
BPA for onward transmission to Grampanchyath authorities. On 24.12.2021 a Gramasabha
was conducted at Dubbagudem village in the supervision of the Addl. Collector, MNCL,
RDO, BPA & GM, MM and constituted the R&R committee to finalized the process of R&R
Scheme. The villagers of the Dubbagudem has requested to the Addl. Collector to allot the
land to an extent of 240 yards (02 Guntas) for each family. RDO, BPA requested GM, MM on
24.03.2022 to furnish layout plan @ 240 Sq. Yards for each PDF for distribution. Accordingly
GM, MM submitted layout plan on 28.03.2022.
7. Diversion of Road (5.48 Km) Part-A: Bridges and road work completed in Dec’21
8. Diversion of Road (5.57Km) Part-B - R&B awarded the work & commenced from
04.11.2020. Work is under progress.
9. Procurement of HEMM: Required HEMM procured.
10. OBR: OB removal commenced from 21.04.2017.
11. Coal Production: Coal production commenced.
1. 2017-18 = 1.01 MT
2. 2018-19 = 0.80 MT
3. 2019-20 = 1.75 MT
4. 2020-21 = 1.34 MT
5. 2021-22 = 1.76 MT
9. KTK OC-2:
A) Date of sanction : FR : 14.05.2015, RCE: 19.8.2017
B) Financial Progress:
1) Sanctioned capital : Rs. 427.46 Cr. RCE: 442.42 Cr.
102
2) Total Capital Outlay : Rs. 368.23 Cr.
3) Cumulative expenditure up to Mar, 22 : Rs. 127.65 Cr. (Provisional)
4) Now anticipated cost : Rs. 442.42 Cr.
5) Status of RCE/RFR : RCE approved on 19.8.2017
C) Physical Progress:
1) Ultimate Capacity : 1.25 MTPA
2) Anticipated year of completion : 2018-19
3) Production realization in 2021-22 up to
Mar, 2022 : 1.18 MT
4) Overburden removal in 2021-22 up to
Mar, 2022 : 15.73 M. Cum
D) General Status in brief as on 31.03.2022:
1. Mining plan: Approved on 26.07.2016.
2. Environment clearance: Obtained for 1.50 MTPA (peak) on 26.10.2016.
3. NF Land required (668.23 Ha.). 594.65 Ha is under possession.
Govt. Land (Ac. 55-03gts) –Required for R&R: Survey is to be taken up
Govt. Land (Ac. 23-25gts) - PN published on 14.01.2022.
Pvt. Land (Ac. 75 - 21gts) -: PN published on 14.01.2022.
4. R & R Status (922 PDF and 125 PAF): Gaddiganipalli, Faqeergadda and Balajinagar villages
have to be rehabilitated. R&R site is identified at SCCL land at Chelpur village, Ghanpur,
Mandal. Note sent for approval.
5. Power supply arrangement (33 Kv line): New H.T line commissioned and charged.
6. Diversion of Nallah: Completed.
7. Diversion of road: Completed.
8. CHP construction: Completed.
9. Procurement of HEMM: Required HEMM procured.
10. OBR: OB removal commenced by contractor from 01.09.2017.
11. Commencement of Production: Coal production commenced from 22.02.2018.
1. 2017-18 = 0.34 MT
2. 2018-19 = 0.65 MT
3. 2019-20 = 1.27 MT
4. 2020-21 = 1.14 MT
5. 2021-22 = 1.18 MT
10. KTK OC III:
A) Date of sanction : 04.03.2017
B) Finan B) Financial Progress:
1) Sanctioned capital : Rs. 413.84 Cr.
2) Total Capital Outlay : Rs. 530.83 Cr.
3) Cumulative expenditure up to Mar, 2022 : Rs. 304.39 Cr. (provisional).
4) Now anticipated cost : Rs. 413.84 Cr.
5) Status of RCE/RFR
C) Physical Progress:
1) Ultimate Capacity : 2.50 MTPA
2) Anticipated year of completion : 2021-22
3) Production in 2021-22 up to Mar, 2022 : 0.35 MT
4) Overburden removal in 2021-22 up to
Mar, 2022 : 14.41 M. Cum
D) General Status in brief as on 31.03.2022:
1. Mining plan: Approved on 19.11.2018.
2. Mining lease (422.69 Ha NCBA): State Govt. issued LoI/Memo on 10.07.2020.
103
3. Environment clearance: Obtained for 3.75 MTPA for OC & 0.48 for UG (peak) on
27.04.2020.
4. Non forest land acquisition: PN published for Ac. 411-01½gts on 05.05.2019. Consent
obtained @ Rs. 15 L/Acre from villagers. Award enquiry conducted on 19/20.03.2020 & Rs.
64.04 Cr. deposited to DC. Award passed by DC & compensation disbursed on 10.06.2020.
Ac. 411-01½gts is under utilization from May’21.
5. PN published for another Ac. 412-22gts on 03.02.2020. Rs. 71 Cr. Deposited. Declaration
published on 31.01.2021. Award enquiry conducted from 23.02.2021 to 25.02.2021. Award
passed for Ac. 416-03gts & compensation disbursement completed for Ac. 416-03gts.
6. Ac. 522-35gts: PN published on 01.07.2021. Rs.82.47 Cr. Fund deposited with DC on
27.12.2021. Declaration published for Ac. 508-30gts on 08.01.2022. Award enquiry
conducted from 29.01.2022 to 01.02.2022. Award passed for Ac 173-35 gts on 26.03.2022.
7. Ac. 333-26gts: PN published on 12.02.2022. Gramasabha was conducted on 04.03.2022.
8. R&R: R&R of Madhavaraopalli @181 PDF completed & village handed over.
9. CHP: Erection of Mobile Crusher completed in Jan’21. Construction of permanent CHP
(PWTLS) will be taken up later.
10.Diversion of transmission line: Work completed on 20.02.2020.
11.Diversion of Road for Coal Transportation and Service road (1.80 KM): Completed in
Jan’21.
12.OBR: OBR commenced from 15.07.2020.
13.Coal production: Commenced from 05.03.2021 & achieved 0.016 MT in 2020-21. 0.35 MT
in 2021-22.
11. Godavarikhani Coal Mine (No. 2 & 2A and No. 5):
A) Date of sanction : FR: 26.07.2019
B) Financial Progress:
1) Sanctioned capital : FR: Rs. 438.98 Cr.
2) Total Capital Outlay : Rs. 607.04 Cr.
3) Cumulative expenditure up to Mar, 22 : Rs. 95.89 Cr. (Provisional)
4) Now anticipated cost : Rs. 438.98 Cr.
5) Status of RCE :
C) Physical Progress:
1) Ultimate Capacity : 3.00 MTPA
2) Anticipated year of completion : 2022-23
3) Production in 2021-22 up to Mar, 2022 : 0.41 MT
4) Overburden removal in 2021-22 up to
Mar, 2022 : 6.79 M. Cum
D) General Status in brief as on 31.03.2022:
1. Mining plan: Approved on 29.03.2019.
1. Environment clearance: EC issued on 01.12.2021.
2. Mining Lease: Available.
3. Acquisition of Private land (Ac. 24-15gts required for Road & Nallah): Possession taken
on 28.01.2022.
4. Acquisition of Govt. Land (Ac. 40-36gts): Ac.6-15gts in Janagaon Village-At award stage.
Ac.6-21gts of Mutyala village- Award passed on 13.08.2021
Ac.01-34 gts of Janagaon Village- SD & Enjoyment report awaited.
Ac.23-15gts of Sundilla village- Possession taken.
104
5. Acquisition of NFL (Ac. 186-19gts required for Quarry & Dump yard-Ac. 77-29gts,
Private land + Ac.108-30gts, Govt. land): Ac.17-23gts - Award passed on 13.08.2021.
Ac.16-04gts - possession taken on 28.01.2022.
Ac. 44-11gts: Enjoyment survey completed & report waited (pending due to overlapping of
village boundaries).
Ac. 51-16gts - SD & enjoyment Survey completed & PD published on 17.12.2021
Ac. 57-00gts - SD & enjoyment Survey completed. DC referred to CCLA for the clarification
regarding the overlapping the
Village boundaries.
6. Govt. Land (Ac. 294-30gts): As per the instructions of J.C Peddapalli, requisition submitted
for demarcation of the lands on 29.01.2019, demarcation of the lands and report was submitted
by Revenue Dept. Meeting was held with DC, Peddapalli on 09.03.2021 & DC advised RDO,
to take up the detailed verification of the records for the said lands to finalize the issue.
7. Diversion of Road: 8 Hume pipe Culverts & 5 Slab Culverts completed and further work is
under progress.
8. Diversion of Nallah: Work awarded on 04.05.2019.Work commenced during Dec’19 &
completed on 10.03.2022.
9. Relocation of Main Magazine: Location finalised near Upparlakesaram in SCCL land.
Permission obtained from Chief Controller of Explosives, Chennai for construction of
Magazine on 28.01.2021. Construction commenced from 22.04.2021.
10. Diversion of 33Kv TSNPDCL OHT Line: Work is under progress.
11. Diversion of BSNL Tele Communication Cables: To be taken up
12. Shifting of 33Kv outdoor Sub-station: Construction completed.
13. Procurement of P&M: Existing MOCP equipment will be utilized for some time.
14. OBR: Commenced from 01.02.2022.
15. Commencement of Production: Production commenced from 21.02.2022 & achieved
0.41 MT in 2021-22.
12. Naini Coal Mine:
A) Date of sanction : FR: 20.03.2020
B) Financial Progress:
1) Sanctioned capital : FR: Rs. 494.30 Cr.
2) Total Capital Outlay : Rs. 961.01 Cr.
3) Cumulative expenditure up to Mar, 2022 : Rs. 245.65 Cr. (Provisional)
4) Now anticipated cost : Rs. 494.30 Cr.
5) Status of RCE :
C) Physical Progress:
1) Ultimate Capacity : 10.00 MTPA
2) Anticipated year of completion : 2023-24
3) Production in 2021-22 up to Mar, 2022 : --- MT
4) Overburden removal in 2021-22 up to
Mar, 2022 : --- M. Cum
D) General Status in brief as on 31.03.2022:
1. Mining plan: Approved on 29.03.2019.
2. Environmental Clearance: EC issued on 01.12.2021.
3. Mining Lease: 11(1) Notification uploaded in Gazette of India website on 26.06.2020. Thus
the ML for the project is obtained.
4. Acquisition of NFL (129.524 Ha): SES completed in Nov’2021 & report submitted to
Collector, Angul on 21.01.2022. Enjoyment Survey to be taken up.
105
5. Diversion of FL (783.275 Ha): Stage-I obtained on 28.07.2021. Rs 105.78 Cr. deposited in
ADHOC-CAMPA towards NPV, CA charges, Afforestation in safety zone area and Regional
wild life Management Plan. Stage-I compliance report forwarded to MoEF & CC on
18.12.2021. MoEF & CC has sought additional information (ADS) on 13.01.2022. In
compliance to the ADS, plans & schemes for Plantation, SMC & CA in safety zone area has
been submitted to DFO, Angul on 31.01.2022 for approval. Forest dept. is insisting for
preparation of SMC measures though LiDAR survey and Wildlife /elephant Management plan
by the Wildlife Institute of India. The SMC plan & the Wildlife/Elephant Management plan
may take time. Hence on request of SCCL, Forest dept. accepted the undertaking & forwarded
the EDS compliance to MoEF on 17.03.2022. An amount of Rs. 7.94 Cr. has been deposited in
CAMPA towards SMC charges on 23.03.2022.
Stage-II is expected in Apr’22.
6. DPR Preparation for Railway siding (3.50Km) (Tentuloi to Naini): FSR submitted to ECO
Railways and the same has been approved on 23.03.2022. Preparation of DPR by IRCON is in
process.
7. DPR/Chhendipada-Jarpada road (25Km): CE works submitted DPR on 22.10.2020 &
estimates @ Rs. 18.00 Cr.
8. DPR for Strengthening of Chendipada-Nisha Road: CE works submitted DPR on
22.10.2020 & estimates @ Rs. 36.00 Cr. Amount deposit @ Rs. 36.24 Cr. to R&B, Angul.
9. Consultant/design, supply, erection & commissioning of CHP (EPC): To be taken up after
appointment of MDO.
10. Diversion of Nallah: DPR prepared and submitted to Angul irrigation Dept. on
10.06.2020. EIC (Engineer in Chief), DoWR has been requested to consider the matter on
priority. NoC issued on 29.03.2022.
11. Temporary Power supply (3 MVA) arrangement: Proposal for establishing 3 MVA
sub-station has been approved. Suitable contractors will be identified with the help of
TPCODL.
12. Permanent Power supply arrangement for Naini (21 MVA) & New Pathrapara (30
MVA): SR GM (CP), OPTCL submitted report on 30.06.2020, stating that the system is
adequate for drawl of 21 MVA power form 220/33KV substation at Rengali (30Km from Naini
Project). Officials of OPTCL and SCCL met the Tahsildar, Chhendipada to discuss regarding
availability of land for establishing 220/33KV substation recently. Collector, Angul convened a
meeting with the Project Proponents on 07.03.2022 to discuss on the matter.
13. 68Km common Rail Corridor between Angul-Balaram- Putagadia-Jarapada:
Mahanadi Coal Railway Ltd., (MCRL), a JV company between MCL, IRCON & IDCO is
constructing 68Km common Rail Corridor between Angul-Balaram- Putagadia-Jarapada
(linking different Coal Blocks including Naini coal block) at an approximate cost of Rs. 1700
Cr. 6Km line completed out of 14Km between Angul to Balaram in Phase-I.
MCRL shall take up the balance section i.e., 54 Km line in Phase-II &deposited Rs 9.50 Cr. to
LAO towards establishment charges to commence NFL acquisition. Forest Dept. has issued
Stage-I FC for diversion of AC. 310 forest land in Phase-II and preparation of compliance
under process to get Stage-II.
14. Temporary Coal Evacuation arrangement: Till the completion of MCRL railway line,
it is proposed to utilize Kerejanga Railway siding for coal evacuation from Naini. Coal will be
transported through existing SH-63 upto Majika (32 Km) and then from Majika to Kerejanga
siding through village road (8Km). Permission for SH-63 road for 22Km upto Nisha has been
obtained. CE (DPI & Road) has been requested for preparation of DPR for improvement of
addtional10Km up to Majhika. Dist Administration has been requested to facilitate for
development of alternate road from Majhika upto Kerejanga 8.6Km. DRM, Khurda Div. has
been requested for development of required infrastructure /rail line at Kerejanga.
15. Exploration -130 BH (58 BH in NFL & 72 BH in FL) & GR Preparation: Total 80
Nos. (FL - 41 Nos. & NFL 39 Nos.) of bore holes completed @ 16,500 meterage (ordered
qty). Revised GR is under preparation.
16. OBR: Commencement of OBR is expected from Jun’22.
106
17. Commencement of Production: Coal production expected from Aug’22.
13. Venkatesh Khani Coal Mine:
A) Date of sanction : 03.10.2020
B) Financial Progress:
1) Sanctioned capital : Rs. 484.51 Cr.
2) Total Capital Outlay : Rs. 1423.65 Cr.
3) Cumulative expenditure up to Mar, 22 : Rs. 58.93 Cr. ( Provisional)
4) Now anticipated cost : Rs. 484.51 Cr.
5) Status of RCE : NA
C) Physical Progress:
1) Ultimate Capacity : 5.30 MTPA
2) Anticipated year of completion : 2022-23
3) Production in 2021-22 up to Mar, 2022 : --- MT
4) Overburden removal in 2021-22 up to
Mar, 2022 : --- M Cum
D) General Status in brief as on 31.03.2022:
FR of Venkatesh Khani Coal Mine (Conversion of VK No. 7 & PVK No. 5 Inclines to OC in a
phased manner and Amalgamation of GK OC Mine) was approved by SCCL Board of Directors
on 03.10.2020, vide minute No. 555:5.6.
1. Mining plan: Approved on 27.01.2020 by MoC.
2. Environmental clearance: ToR granted on 28.10.2021. PH is scheduled on 19.04.2022.
3. Diversion of FL for Surface rights (649.3014 Ha): Application submitted to PCCF on
28.02.2020. Survey of CA & Tree enumeration completed. On 08.10.2020, Advisor Forestry,
CCF, DFO, KGM did site inspection. On 28.11.2020, FDO, KGM forwarded the proposal to
DFO, Bhadradri Kothagudem. DFO forward to CCF on 28.11.2020 & CCF to PCCF on
04.12.2020
PCCF forward to State Govt. on 16.01.2021. State Govt. forwarded to MoEF & CC on
18.02.2021. On 08.03.2021 MoEF & CC sought certain info./clarification from state govt. On
17.04.2021, FDO, Paloncha and on 19.04.2021, FDO, Kothagudem sent EDS report to DFO,
Kothagudem. CS, GoT issued non availability of CA land certificate on 03.06.2021 & the
same was submitted to PCCF on 10.06.2021. On 29.06.2021, PCCF forwarded to State Govt.
GoT cleared the file on 16.07.2021. Uploaded to MoEF (Parivesh) on 05.08.2021. Requested
PCCF on 14.02.2022 for acceptance of Rehabilitated dumps of Medipalli OCP as CA land
and also for Site Inspection by MoEF & CC. On 24.02.2022, DFO Peddapalli requested, GM.
RG1 to furnish the vegetation data of sample plots. Again on 02/03/2022, DFO, Peddapalli
requested GM.RG-1 to submit 0.1 Ha. Sample plot vegetation growth. On 28.03.2022, SCCL
submitted reply to the DFO, Peddapalli regarding sample plots of rehabilitated dumps of
MOCP as sought. CF, Peddapalli to forward report to PCCF regarding Proposed CA land at
MOCP. MoEF has to instruct Regional Office, Hyderabad to conduct site inspection.
4. Acquisition of Pvt. Land (1.86 Ha) for Road: On 15.12.2020, application submitted to DC
for acquisition of 1.32 Ha Pvt. land at Penagadapa village. SD Survey completed on
06.01.2021. PN published on 05.06.2021. PD published on 23.12.2021. Rs .65.20 Lakh
deposited on 25.03.2022 to RDO, KGM.
5. Acquisition of Govt. Land (25.75 Ha): State Govt. granted SIA exemption. Alienation
proposals submitted on 13.09.2021 to Secretary Energy Dept. Telangana.
6. R&R (Maya Bazar & Vanama Nagar - 224 PDF): State Govt. granted SIA exemption.
Requisition submitted to DC on 27.04.2021. DGPS survey for boundary demarcation
completed. Gramasabha was conducted on 30.10.2021. Socio economic survey completed
from 11.11.2021 to 15.11.2021.
107

7. Diversion of Road KGM to VJA (NH 30, 5.00Km): NH Authority is taking up the work &
Rs. 22.50 Cr. deposited. Work awarded to M/s. Srinivasa Edifice Pvt. Ltd on 24.06.2021.
Work commenced from 24.12.2021.
8. Diversion of OHT lines, SAP, Telephone, OFC, VTS, Signal & communication lines:
Diversion of OHT lines is under progress. Estimation received from BSNL. Money deposited
to BSNL on 28.01.2022. Work to be started.
9. Shifting RCHP/ RLY Siding: NIT floated on 02.04.2022.
RLY Siding: DPR submitted for approval to SCR on 07.10.21 by RITES. M/S RITES is
identified as PMC agency & prepared detailed estimates of works to be taken up.
10. Shifting of Rudrampur Filter Bed: Tender awarded on 27.07.2020 & work commenced
from 23.10.2020. .
11. Diversion of Mission Bhagirada pipe line: DE Mission Bhagiradha visited the site on
29.09.2020. Cost estimation for @ Rs 1.25 Crore was received from Misssion Bhagiratha
Authorities on 14.02.2022. Note under circulation to deposit funds.
12. Shifting GM office: Work awarded @ Rs.5.59 Cr. on 19/03/2022 to PBR Project.
13. Shifting of Area Work shop: Order issued on 08.07.2021 @ Rs.3.38 Cr. Work is under
progress.
14. Commencement of OBR: Expected from Sep’22.
15. Commencement of Production: Expected from Dec’22.
14. Goleti Opencast Mine:
A) Date of sanction : 26.07.2021
B) Financial Progress:
1) Sanctioned capital : Rs. 345.60 Cr.
2) Total Capital Outlay : Rs. 397.87 Cr.
3) Cumulative expenditure up to Mar, 22 : Rs. 28.68 Cr. ( Provisional)
4) Now anticipated cost : Rs. 345.60 Cr.
5) Status of RCE : NA
C) Physical Progress:
1) Ultimate Capacity : 3.00 MTPA
2) Anticipated year of completion : 2024-25
3) Production in 2021-22 up to Mar, 2022 : --- MT
4) Overburden removal in 2021-22 up to
Mar, 2022 : --- M Cum
D) General Status in brief as on 31.03.2022:
Feasibility Report of Goleti Opencast Mine [Conversion of Goleti 1&1A Incline in to OC (up to
280m of UG Area) and amalgamation of Bellampalli Opencast II Expansion & Abbapur OCP],
Bellampalli Area was approved by SCCL Board of Directors during meeting held on 26.07.2021.
1. Mining plan: Approved on 18.11.2020 by MoC.
2. Environmental clearance: EC is linked to BPA OC - II violation. Form – 1 of Goleti OC
submitted on 23.02.2021. EDS-1 & EDS -2 issued and reply submitted EAC meeting held on
25.05.2021. EAC-Minutes issued on 07.06.2021 and the proposal was deferred. Meeting with
MoEF & CC official held at Delhi on 17.06.2021 for clarification on Abbapur and BPA OCs.
Informed that revalidation of Abbapur OC will be considered but show cause notice will be
issued for BPA OC-II Exp, as it was not applied under violation category. Show cause notice
issued on 28.07.2021 (received on 04.08.2021) & replied on 10.08.2021. Form-1 for Goleti
OC was uploaded on 24.03.2022 under violation category (BPA OC-II).
108
3. Diversion of FL for Surface rights (665.161 Ha): FL application Uploaded on 24.12.2020.
Asifabad Division (575.461 Ha):
Sample plotting of tree enumeration was completed.
CF, Adilabad along with DFO, KB Asifabad inspected on 07.07.2021.
Part II Report is to be forwarded by the DFO, KB Asifabad to the CF, Adilabad.
16.12.2021: RDO KBA has submitted the Resolution of Divisional Level FRC to the District
Collector for issuing of NoC as per RoFR Act. 14.01.2022: CA scheme for 1230 Ha of DFL
was prepared and sent to PCCF for vetting.
On 08.02.2022, CCF along with DFO, KB Asifabad has inspected Dorli OCP-1&2 and D-1
dump of Khairagura OCP with a view to consider the land as CA land. PCCF was requested
on 17.02.2022, to accept the non forest land of Dorli OCP-1&2 and D-1 dump of Khairagura
OCP as CA land for the purpose of forest land diversions required for the SCCL projects.
On 26.02.2022, PCCF has requested CFs to submit detailed report on acceptance of the
rehabilitated OB dumps as CA land.
Detailed inspection by forest department is under process to submit report to the PCCF
regarding CA land.
CF/DFO/CF has to send report to the PCCF regarding proposed rehabilitated OB dumps as
CA land.
BPA Division (39.925 Ha):
Tree enumeration completed. Part –II Report is to be forwarded by DFO, MNCL to CF,
Nirmal. 30.12.2021: RDO, Bellampalli has submitted Gramasabha resolution & Mandal level
FRC to District Collector Mancherial for issuing NOC as per RoFR Act (Abbapur Village).
4. Acquisition of Pvt. Land (0.825 Ha): To be taken up
5. Acquisition of Govt. Land (48.950 Ha): To be taken up
6. Land for installation of Over land belt conveyor from Mine to CHP (5.393 ha): To be
taken up
1. Acquisition of Pvt. Land (4.888 Ha): To be taken up
2. Acquisition of Govt. Assigned Land (0.266 Ha): To be taken up
3. Acquisition of Govt. Land (0.239 Ha): To be taken up
7. R&R (Sonapur - 60 PDF): To be taken up
8. R&R (Goleti Township for Overland Conveyor - 20 PDF): To be taken up
9. Diversion of Goleti-Khairagura OCP Road: To be taken up
10. Diversion of Goleti-Madaram Road: To be taken up
11. Other Roads: To be taken up
12. Diversion of Narsapur Nallah (Phase-I) : To be taken up
13. Diversion of Narsapur Nallah & Nallah at 975 RL (Phase-II): To be taken up
14. Commencement of OBR: Expected from Sep’22.
15. Commencement of Production: Expected from Dec’22.
15. JK Opencast Mine:
A) Date of sanction : 10.12.2021
B) Financial Progress:
1) Sanctioned capital : Rs. 297.88 Cr.
2) Total Capital Outlay : Rs. 335.98 Cr.
3) Cumulative expenditure up to Mar, 22 : Rs. 0.00 Cr. ( Provisional)
4) Now anticipated cost : Rs. 297.88 Cr.
5) Status of RCE : NA
C) Physical Progress:
1) Ultimate Capacity : 2.00 MTPA
2) Anticipated year of completion : 2023-24
3) Production in 2021-22 up to Mar, 2022 : --- MT
109
4) Overburden removal in 2021-22 up to
Mar, 2022 : --- M Cum
D) General Status in brief as on 31.03.2022:
Feasibility Report of Jawahar Khani Opencast Mine (JK OC Mine) [Amalgamation of JK-5 OC
and 21 Incline (conversion to OC), Yellandu Area was approved by SCCL Board of Directors
during meeting held on 10.12.2021.
1. Mining plan: Approved on 29.10.2020 by MoC.
2. Environmental clearance: Linked to JK-5 OC violation: JK 5 OC, draft EMP submitted to
TSPCB on 16.11.2020. PH in Bhadradri KGM Dist. conducted on 03.03.2021. PH in KMM
Dist. conducted on19.03.2021. Form-2 submitted on 15.05.2021. EDS sought on 14.07.2021
& reply submitted on 23.07.2021. EAC for JK5 OC violation EC is held on 09.08.2021.
Minutes issued on 29.08.2021 & ADS sought. ADS reply submitted on 28.01.2022. EAC
held on 18.02.2022. Recommended for EC & awaited EC.
3. Diversion of FL for Surface rights (151.8519 Ha): SCCL submitted application on
10.09.2020. PCCF forwarded proposals on 18.05.2021 (revised & including 45ha) to the
FDO, Yellandu for further processing. CA Scheme prepared & forwarded to DFO, KGM by
FDO, Yellandu on 08.10.2021. DFO forwarded the proposal to the CF, KGM on 11.10.2021.
CF, KGM forwarded the proposal to PCCF. On the request of SCCL, PCCF revised the CA
Scheme on 22.12.2021 for Rs. 20.63 Cr. instead of Rs. 29.84 Cr. The revised CA Scheme
has been prepared by DFO, Mahabubabad for Rs.23.74 Cr. & sent to PCCF on 27.01.2022 for
Vetting. On 17.02.2022, requested PCCF to accept rehabilitated NFL (JK 5 OCP, Yellandu)
as CA LAND against diversion of forest land of 151. 8517 Ha. In this regard, Forest officials
inspected rehabilitated dumps on 16.02.2022. On 08.03.2022, CFO KGM, DFO Khammam
and Advisor (Forestry) visited 205 Ha NFL Area. On 31.03.22, DFO Khammam submitted
the Field inspection report to CFO, Khammam.
4. Acquisition of Govt. assigned Land (64.14 Ha) Required for Quarry: To be taken up
5. Acquisition of Govt. assigned Land (18.63 Ha) Required for Road & infrastructure
Area: To be taken up
6. Acquisition of Govt. assigned Land (11.36 Ha) for Safe Barrier: To be taken up
7. Shifting of HT Lines (2 Nos. of 33 KV HT lines): Estimation @ Rs. 3.66 Crore received
from Electrical Dept, NPDCL, Yellandu. Note for fund provision is under circulation from
10.02.2022.
8. Power supply Arrangements: To be taken up
9. Road for OB transport: To be taken up
10. Diversion of Karepally Road: To be taken up
11. CHP(Warf Loading Arrangements): To be taken up
12. Railway Siding: To be taken up
13. Commencement of OBR: Expected from Sep’22.
14. Commencement of Production: Expected from Dec’22.
110
MINISTRY OF COAL
O/o Deputy Director General
A-Wing, 5th Floor, Lok Nayak Bhavan,
Lok Nayak Bhavan, New Delhi- 110003