
Online Help - NetApp Support
670
-
Upload
khangminh22 -
Category
Documents
-
view
3 -
download
0
Transcript of Online Help - NetApp Support

Contents
Introduction to Active IQ Unified Manager................................................................16Introduction to Active IQ Unified Manager health monitoring....................................................................................16Unified Manager health monitoring features................................................................................................................17Introduction to Active IQ Unified Manager performance monitoring......................................................................... 18Unified Manager performance monitoring features..................................................................................................... 18Using Unified Manager REST APIs.............................................................................................................................19What the Unified Manager server does........................................................................................................................ 19
How the discovery process works.....................................................................................................................19Cluster configuration and performance data collection activity.......................................................................20What a data continuity collection cycle is........................................................................................................ 21What the timestamp means in collected data and events..................................................................................22
Understanding the user interface................................................................................. 23Typical window layouts................................................................................................................................................ 23Window layout customization...................................................................................................................................... 24Using the Unified Manager Help..................................................................................................................................25Bookmarking your favorite Help topics....................................................................................................................... 25Searching for storage objects........................................................................................................................................26Exporting storage data as reports..................................................................................................................................27Filtering inventory page content................................................................................................................................... 28Viewing active events from the notification bell.......................................................................................................... 29
Monitoring and managing clusters from the dashboard............................................30Fixing ONTAP issues directly from Unified Manager................................................................................................. 30
What options do I have when I see the Fix It or Fix All button.......................................................................31Viewing the status of management actions you have chosen to fix..................................................................32What ONTAP issues can Unified Manager fix.................................................................................................32
Dashboard page............................................................................................................................................................ 34
Troubleshooting workloads using the workload analyzer..........................................38What data does the workload analyzer display.............................................................................................................39When would I use the workload analyzer.....................................................................................................................41Using the workload analyzer........................................................................................................................................ 41
Managing events.............................................................................................................43What health events are..................................................................................................................................................43What performance events are....................................................................................................................................... 44
Sources of performance events......................................................................................................................... 45Types of system-defined performance threshold policies.................................................................................46
What Active IQ platform events are............................................................................................................................. 48What Event Management System events are................................................................................................................49
EMS events that are added automatically to Unified Manager........................................................................ 50What happens when an event is received......................................................................................................................52
iiContents

Configuring event notification settings.........................................................................................................................53Viewing events and event details.................................................................................................................................. 54Viewing unassigned events........................................................................................................................................... 54Acknowledging and resolving events........................................................................................................................... 55Assigning events to specific users................................................................................................................................ 56Disabling unwanted events........................................................................................................................................... 56Fixing issues using Unified Manager automatic remediations.....................................................................................57Enabling and disabling Active IQ event reporting........................................................................................................58Uploading a new Active IQ rules file........................................................................................................................... 59How Active IQ platform events are generated..............................................................................................................60Resolving Active IQ platform events............................................................................................................................60Subscribing to ONTAP EMS events.............................................................................................................................61Configuring event retention settings.............................................................................................................................62What a Unified Manager maintenance window is........................................................................................................63
Scheduling a maintenance window to disable cluster event notifications........................................................ 63Changing or canceling a scheduled maintenance window............................................................................... 64Viewing events that occurred during a maintenance window...........................................................................64
Managing host system resource events.........................................................................................................................65Understanding more about events.................................................................................................................................65
Event state definitions.......................................................................................................................................65Description of event severity types...................................................................................................................66Description of event impact levels....................................................................................................................67Description of event impact areas.....................................................................................................................67How object status is computed......................................................................................................................... 68Dynamic performance event chart details........................................................................................................ 68Configuration changes detected by Unified Manager...................................................................................... 70
List of events and severity types................................................................................................................................... 71Aggregate events...............................................................................................................................................71Cluster events....................................................................................................................................................73Disks events...................................................................................................................................................... 77Enclosures events..............................................................................................................................................77Fans events........................................................................................................................................................78Flash card events...............................................................................................................................................78Inodes events.....................................................................................................................................................78Network interface (LIF) events.........................................................................................................................79LUN events....................................................................................................................................................... 80Management station events...............................................................................................................................82MetroCluster Bridge events.............................................................................................................................. 83MetroCluster Connectivity events.................................................................................................................... 83MetroCluster switch events.............................................................................................................................. 84NVMe Namespace events.................................................................................................................................85Node events.......................................................................................................................................................86NVRAM battery events.................................................................................................................................... 88Port events.........................................................................................................................................................89Power supplies events....................................................................................................................................... 90Protection events...............................................................................................................................................90Qtree events...................................................................................................................................................... 90Service processor events...................................................................................................................................91SnapMirror relationship events.........................................................................................................................91SnapMirror and Vault relationship events........................................................................................................ 92Snapshot events.................................................................................................................................................93SnapVault relationship events...........................................................................................................................93Storage failover settings events.........................................................................................................................93Storage services events..................................................................................................................................... 94
iiiContents

Storage shelf events.......................................................................................................................................... 95Storage VM events............................................................................................................................................95User and group quota events.............................................................................................................................97Volume events...................................................................................................................................................98Volume move status events............................................................................................................................. 102
Description of event windows and dialog boxes........................................................................................................ 102Notifications page...........................................................................................................................................103Event Management inventory page................................................................................................................ 104Event details page........................................................................................................................................... 108Event Setup page............................................................................................................................................ 115Disable Events dialog box.............................................................................................................................. 116
Managing alerts............................................................................................................118What alerts are............................................................................................................................................................ 118What information is contained in an alert email.........................................................................................................118Adding alerts...............................................................................................................................................................119
Guidelines for adding alerts............................................................................................................................122Adding alerts for performance events.........................................................................................................................122Testing alerts...............................................................................................................................................................123Enabling and Disabling alerts for Resolved and Obsolete events.............................................................................. 124Excluding disaster recovery destination volumes from generating alerts.................................................................. 125Viewing alerts............................................................................................................................................................. 125Editing alerts...............................................................................................................................................................126Deleting alerts.............................................................................................................................................................127Description of alert windows and dialog boxes .........................................................................................................127
Alert Setup page............................................................................................................................................. 127Add Alert dialog box...................................................................................................................................... 129Edit Alert dialog box...................................................................................................................................... 131
Managing health thresholds........................................................................................134What storage capacity health thresholds are...............................................................................................................134Configuring global health threshold settings..............................................................................................................134
Configuring global aggregate health threshold values....................................................................................134Configuring global volume health threshold values....................................................................................... 135Configuring global qtree health threshold values........................................................................................... 136Configuring lag threshold settings for unmanaged protection relationships.................................................. 137
Editing individual aggregate health threshold settings............................................................................................... 137Editing individual volume health threshold settings...................................................................................................138Editing individual qtree health threshold settings.......................................................................................................139Description of health thresholds pages....................................................................................................................... 140
Aggregate Thresholds page............................................................................................................................ 140Volume Thresholds page.................................................................................................................................142Relationship Thresholds page.........................................................................................................................145Qtree Thresholds page.................................................................................................................................... 146Edit Aggregate Thresholds dialog box........................................................................................................... 146Edit Volume Thresholds dialog box............................................................................................................... 148Edit Qtree Thresholds dialog box................................................................................................................... 150
Managing performance thresholds.............................................................................152How user-defined performance threshold policies work............................................................................................ 152What happens when a performance threshold policy is breached..............................................................................154
ivContents

What performance counters can be tracked using thresholds.....................................................................................154What objects and counters can be used in combination threshold policies................................................................156Creating user-defined performance threshold policies............................................................................................... 157Assigning performance threshold policies to storage objects.....................................................................................158Viewing performance threshold policies.................................................................................................................... 159Editing user-defined performance threshold policies................................................................................................. 160Removing performance threshold policies from storage objects............................................................................... 161What happens when a performance threshold policy is changed............................................................................... 161What happens to performance threshold policies when an object is moved.............................................................. 162Descriptions of the performance threshold policy pages............................................................................................162
Performance Thresholds page.........................................................................................................................163Create or Clone Performance Threshold Policy page.....................................................................................164Edit Performance Threshold Policy page....................................................................................................... 165Assign Performance Threshold Policy page...................................................................................................166Clear Performance Threshold Policy page..................................................................................................... 167
Analyzing performance events....................................................................................168Displaying information about performance events.....................................................................................................168Analyzing events from user-defined performance thresholds.................................................................................... 169
Responding to user-defined performance threshold events............................................................................ 170Analyzing events from system-defined performance thresholds................................................................................171
Responding to system-defined performance threshold events........................................................................171Responding to QoS policy group performance events................................................................................... 172Understanding events from adaptive QoS policies that have a defined block size.........................................173Responding to node resources overutilized performance events....................................................................175Responding to cluster imbalance performance events....................................................................................175
Analyzing events from dynamic performance thresholds.......................................................................................... 177Identifying victim workloads involved in a dynamic performance event.......................................................177Identifying bully workloads involved in a dynamic performance event.........................................................178Identifying shark workloads involved in a dynamic performance event........................................................ 179Performance event analysis for a MetroCluster configuration....................................................................... 180Responding to a dynamic performance event caused by QoS policy group throttling...................................184Responding to a dynamic performance event caused by a disk failure.......................................................... 186Responding to a dynamic performance event caused by HA takeover...........................................................188
Resolving performance events.................................................................................... 190Confirming that the latency is within the expected range...........................................................................................190Review the impact of configuration changes on workload performance....................................................................191Options for improving workload performance from the client-side...........................................................................192Check for client or network issues..............................................................................................................................193Verify whether other volumes in the QoS policy group have unusually high activity............................................... 193Move logical interfaces (LIFs)................................................................................................................................... 194Run storage efficiency operations at less busy times..................................................................................................194
What storage efficiency is...............................................................................................................................195Add disks and reallocate data..................................................................................................................................... 196How enabling Flash Cache on a node can improve workload performance...............................................................196How enabling Flash Pool on a storage aggregate can improve workload performance............................................. 196MetroCluster configuration health check................................................................................................................... 197MetroCluster configuration verification..................................................................................................................... 197Moving workloads to a different aggregate................................................................................................................ 198Moving workloads to a different node........................................................................................................................199Moving workloads to an aggregate on a different node............................................................................................. 200
vContents

Moving workloads to a node in a different HA pair...................................................................................................201Moving workloads to another node in a different HA pair.........................................................................................203Use QoS policy settings to prioritize the work on this node...................................................................................... 204Remove inactive volumes and LUNs..........................................................................................................................205Add disks and perform aggregate layout reconstruction............................................................................................ 205
Managing and monitoring clusters and cluster object health................................. 206Understanding cluster monitoring.............................................................................................................................. 206
Understanding node root volumes.................................................................................................................. 206Understanding events and thresholds for node root aggregates......................................................................206Understanding quorum and epsilon................................................................................................................ 206
Viewing the cluster list and details............................................................................................................................. 207Checking the health of clusters in a MetroCluster configuration............................................................................... 208Viewing the health and capacity status of All SAN Array clusters............................................................................ 210Viewing the node list and details................................................................................................................................ 211Generating a hardware inventory report for contract renewal.................................................................................... 212Viewing the Storage VM list and details.................................................................................................................... 212Viewing the aggregate list and details........................................................................................................................ 213Viewing FabricPool capacity information.................................................................................................................. 214Viewing storage pool details.......................................................................................................................................215Viewing the volume list and details............................................................................................................................216Viewing details about NFS shares.............................................................................................................................. 217Viewing details about SMB/CIFS shares....................................................................................................................217Viewing the list of Snapshot copies............................................................................................................................218Deleting Snapshot copies............................................................................................................................................218Calculating reclaimable space for Snapshot copies....................................................................................................219Description of cluster object windows and dialog boxes........................................................................................... 220
Health: All Clusters view................................................................................................................................220Cluster health fields........................................................................................................................................ 221Capacity: All Clusters view............................................................................................................................ 222Cluster capacity fields.....................................................................................................................................222Cluster / Health details page........................................................................................................................... 224Health: All Nodes view...................................................................................................................................235Node health fields........................................................................................................................................... 236Health: All Aggregates view...........................................................................................................................237Aggregate health fields................................................................................................................................... 238Capacity: All Aggregates view....................................................................................................................... 241Aggregate capacity fields................................................................................................................................242Aggregate / Health details page......................................................................................................................243Health: All Storage VMs view........................................................................................................................251SVM health fields........................................................................................................................................... 252Storage VM / Health details page...................................................................................................................253Storage Pool dialog box..................................................................................................................................265Health: All Volumes view...............................................................................................................................266Volume health fields....................................................................................................................................... 267Capacity: All Volumes view........................................................................................................................... 271Volume capacity fields....................................................................................................................................272Volume / Health details page.......................................................................................................................... 274Capacity: All Qtrees view...............................................................................................................................286Qtree capacity fields....................................................................................................................................... 287Health: All NFS Shares view..........................................................................................................................288NFS Shares health fields.................................................................................................................................289Health: All SMB Shares view.........................................................................................................................290
viContents
SMB/CIFS Shares health fields...................................................................................................................... 291Export Policy Rules dialog box...................................................................................................................... 292Snapshot Copies on a Volume dialog box...................................................................................................... 293
Managing cluster security objectives......................................................................... 295What security criteria is being evaluated.................................................................................................................... 295
Cluster compliance categories........................................................................................................................ 296SVM compliance categories........................................................................................................................... 297Volume compliance categories....................................................................................................................... 298
What does not compliant mean...................................................................................................................................298Viewing high-level cluster security status.................................................................................................................. 298Viewing detailed security status for clusters and SVMs.............................................................................................299Viewing security events that may require software or firmware updates................................................................... 299Viewing how user authentication is being managed on all clusters............................................................................300Viewing the encryption status of all volumes.............................................................................................................300Viewing all active security events...............................................................................................................................301Adding alerts for security events................................................................................................................................ 301Disabling specific security events...............................................................................................................................302Security events............................................................................................................................................................302
Monitoring VMware virtual infrastructure.............................................................. 304Viewing and adding vCenter Server........................................................................................................................... 306Monitoring virtual machines.......................................................................................................................................308Viewing virtual infrastructure in a disaster recovery setup........................................................................................ 310
Provisioning and managing workloads...................................................................... 312Workloads overview................................................................................................................................................... 312
Viewing workloads......................................................................................................................................... 314Assigning policies to workloads.....................................................................................................................315Provisioning file share volumes......................................................................................................................316Provisioning LUNs......................................................................................................................................... 317
Managing Performance Service Levels...................................................................................................................... 318Creating and editing Performance Service Levels..........................................................................................321
Managing Storage Efficiency Policies........................................................................................................................322Creating and editing Storage Efficiency Policies........................................................................................... 323
Managing reports.........................................................................................................325Understanding the view and report relationship......................................................................................................... 325Types of reports.......................................................................................................................................................... 326Report workflow......................................................................................................................................................... 327Reporting quick start...................................................................................................................................................327Using Excel to customize your report........................................................................................................................ 330Searching for a scheduled report................................................................................................................................ 331Downloading reports...................................................................................................................................................332Scheduling a report..................................................................................................................................................... 332Managing report schedules......................................................................................................................................... 333Unified Manager databases accessible for custom reporting......................................................................................334Report Schedules page................................................................................................................................................335
viiContents

Managing and monitoring MetroCluster configurations.........................................336Parts of a fabric MetroCluster configuration.............................................................................................................. 336
Parts of a two-node SAS-attached stretch MetroCluster configuration..........................................................340Parts of a two-node bridge-attached stretch MetroCluster configuration.......................................................341
Cluster connectivity status definitions........................................................................................................................342Data mirroring status definitions................................................................................................................................ 342Monitoring MetroCluster configurations....................................................................................................................343Monitoring MetroCluster replication..........................................................................................................................344
Managing quotas..........................................................................................................346What quota limits are..................................................................................................................................................346Viewing user and user group quotas........................................................................................................................... 346Creating rules to generate email addresses.................................................................................................................347Creating an email notification format for user and user group quotas....................................................................... 348Editing user and group quota email addresses............................................................................................................348Understanding more about quotas.............................................................................................................................. 349
Overview of the quota process........................................................................................................................349About quotas...................................................................................................................................................350Why you use quotas........................................................................................................................................350
Description of quotas dialog boxes.............................................................................................................................350Email Notification Format page..................................................................................................................... 350Rules to Generate User and Group Quota Email Address page..................................................................... 351
Managing scripts..........................................................................................................354How scripts work with alerts...................................................................................................................................... 354Adding scripts.............................................................................................................................................................355Deleting scripts........................................................................................................................................................... 356Testing script execution.............................................................................................................................................. 356Enabling and disabling the ability to upload scripts...................................................................................................357Supported Unified Manager CLI commands..............................................................................................................358Description of script windows and dialog boxes........................................................................................................ 362
Scripts page.....................................................................................................................................................362Add Script dialog box.....................................................................................................................................363
Managing annotations for storage objects.................................................................364What annotations are.................................................................................................................................................. 364How annotation rules work in Unified Manager........................................................................................................ 364Description of predefined annotation values.............................................................................................................. 366Viewing the annotation list and details....................................................................................................................... 366Adding annotations dynamically................................................................................................................................ 367Adding annotations manually to individual storage objects.......................................................................................367Adding values to annotations......................................................................................................................................368Creating annotation rules............................................................................................................................................369Configuring conditions for annotation rules...............................................................................................................370Editing annotation rules..............................................................................................................................................371Reordering annotation rules........................................................................................................................................371Deleting annotations................................................................................................................................................... 372Deleting values from annotations............................................................................................................................... 372Deleting annotation rules............................................................................................................................................373
viiiContents

Description of Annotations windows and dialog boxes............................................................................................. 374Annotations page............................................................................................................................................ 374Add Annotation dialog box............................................................................................................................ 377Edit Annotation dialog box.............................................................................................................................378Add Annotation Rule dialog box....................................................................................................................378Edit Annotation Rule dialog box.................................................................................................................... 379Reorder Annotation Rule dialog box..............................................................................................................380Annotate Cluster dialog box........................................................................................................................... 380Annotate SVM dialog box.............................................................................................................................. 380Annotate Volume dialog box.......................................................................................................................... 381
Managing and monitoring groups..............................................................................382Understanding groups.................................................................................................................................................382
What a group is...............................................................................................................................................382How group rules work for groups...................................................................................................................382How group actions work on storage objects...................................................................................................384
Managing groups of storage objects........................................................................................................................... 385Adding groups................................................................................................................................................ 385Deleting groups...............................................................................................................................................385Editing groups.................................................................................................................................................386Adding group rules......................................................................................................................................... 386Editing group rules......................................................................................................................................... 387Deleting group rules....................................................................................................................................... 388Configuring conditions for group rules.......................................................................................................... 388Adding group actions......................................................................................................................................389Editing group actions......................................................................................................................................389Configuring volume health thresholds for groups.......................................................................................... 390Deleting group actions....................................................................................................................................390Reordering group actions................................................................................................................................391
Description of groups windows and dialog boxes...................................................................................................... 391Groups page.................................................................................................................................................... 391Add Group dialog box.................................................................................................................................... 394Edit Group dialog box.................................................................................................................................... 394Groups details page.........................................................................................................................................394Add Group Rule dialog box............................................................................................................................395Edit Group Rule dialog box............................................................................................................................396Add Group Action dialog box........................................................................................................................ 397Group action-volume thresholds section........................................................................................................ 397Edit Group Action dialog box.........................................................................................................................400Reorder Group Actions dialog box.................................................................................................................400
Managing and monitoring protection relationships................................................. 401Types of SnapMirror protection..................................................................................................................................401Viewing volume protection relationships................................................................................................................... 402Creating a SnapVault protection relationship from the Health: All Volumes view.................................................... 403Creating a SnapVault protection relationship from the Volume / Health details page............................................... 405Creating a SnapMirror protection relationship from the Health: All Volumes view..................................................406Creating a SnapMirror protection relationship from the Volume / Health details page............................................. 407Creating a SnapMirror relationship with version-flexible replication........................................................................409Creating SnapMirror relationships with version-flexible replication with backup option......................................... 410Configuring destination efficiency settings................................................................................................................ 411Creating SnapMirror and SnapVault schedules.......................................................................................................... 411
ixContents
Creating cascade or fanout relationships to extend protection from an existing protection relationship...................412Editing protection relationships from the Volume Relationships page...................................................................... 412Editing protection relationships from the Volume / Health details page.................................................................... 413Creating a SnapMirror policy to maximize transfer efficiency.................................................................................. 413Creating a SnapVault policy to maximize transfer efficiency.....................................................................................414Aborting an active data protection transfer from the Volume Relationships page..................................................... 415Aborting an active data protection transfer from the Volume / Health details page...................................................415Quiescing a protection relationship from the Volume Relationships page.................................................................416Quiescing a protection relationship from the Volume / Health details page.............................................................. 417Breaking a SnapMirror relationship from the Volume Relationships page................................................................417Breaking a SnapMirror relationship from the Volume / Health details page..............................................................418Removing a protection relationship from the Volume Relationships page................................................................ 418Removing a protection relationship from the Volume / Health details page.............................................................. 419Resuming scheduled transfers on a quiesced relationship from the Volume Relationships page.............................. 419Resuming scheduled transfers on a quiesced relationship from the Volume / Health details page............................420Initializing or updating protection relationships from the Volume Relationships page............................................. 420Initializing or updating protection relationships from the Volume / Health details page...........................................421Resynchronizing protection relationships from the Volume Relationships page....................................................... 422Resynchronizing protection relationships from the Volume / Health details page.....................................................422Reversing protection relationships from the Volume Relationships page.................................................................. 423Reversing protection relationships from the Volume / Health details page................................................................424Restoring data............................................................................................................................................................. 425Restoring data using the Volume details page............................................................................................................ 426What resource pools are..............................................................................................................................................427Creating resource pools.............................................................................................................................................. 427Editing resource pools................................................................................................................................................ 428Viewing resource pools inventory...............................................................................................................................429Adding resource pool members.................................................................................................................................. 429Removing aggregates from resource pools.................................................................................................................430Deleting resource pools.............................................................................................................................................. 430Understanding SVM associations...............................................................................................................................431SVM and resource pool requirements to support storage services.............................................................................431Creating SVM associations.........................................................................................................................................432Viewing SVM associations.........................................................................................................................................433Deleting SVM associations.........................................................................................................................................433What jobs are.............................................................................................................................................................. 434Monitoring jobs.......................................................................................................................................................... 434Viewing job details..................................................................................................................................................... 435Aborting jobs.............................................................................................................................................................. 435Retrying a failed protection job.................................................................................................................................. 435Description of Protection relationships windows and dialog boxes........................................................................... 436
Resource Pools page....................................................................................................................................... 436Create Resource Pool dialog box....................................................................................................................439Edit Resource Pool dialog box....................................................................................................................... 440Aggregates dialog box.................................................................................................................................... 440SVM Associations page..................................................................................................................................442Create Storage Virtual Machine Associations wizard.................................................................................... 443Jobs page.........................................................................................................................................................444Job details page...............................................................................................................................................446Advanced Secondary Settings dialog box...................................................................................................... 448Advanced Destination Settings dialog box.....................................................................................................449Restore dialog box.......................................................................................................................................... 450Browse Directories dialog box....................................................................................................................... 452Configure Protection dialog box.....................................................................................................................453
xContents
Create New Schedule dialog box....................................................................................................................457Create SnapMirror Policy dialog box............................................................................................................. 458Create SnapVault Policy dialog box............................................................................................................... 459Edit Relationship dialog box.......................................................................................................................... 461Initialize/Update dialog box........................................................................................................................... 462Resynchronize dialog box...............................................................................................................................463Select Source Snapshot Copy dialog box....................................................................................................... 464Reverse Resync dialog box.............................................................................................................................467Relationship: All Relationships view............................................................................................................. 468Relationship: Last 1 month Transfer Status view........................................................................................... 471Relationship: Last 1 month Transfer Rate view............................................................................................. 472
Executing protection workflows using OnCommand Workflow Automation........474Configuring a connection between Workflow Automation and Unified Manager.....................................................474Removing OnCommand Workflow Automation setup from Unified Manager......................................................... 475What happens when OnCommand Workflow Automation is reinstalled or upgraded...............................................475Description of OnCommand Workflow Automation setup windows and dialog boxes.............................................475
Workflow Automation page............................................................................................................................475
Managing performance using performance capacity and available IOPSinformation............................................................................................................... 477
What performance capacity used is............................................................................................................................ 477What the performance capacity used value means..................................................................................................... 478What available IOPS is............................................................................................................................................... 478Viewing node and aggregate performance capacity used values................................................................................479Viewing node and aggregate available IOPS values...................................................................................................480Viewing performance capacity counter charts to identify issues................................................................................481Performance capacity used performance threshold conditions.................................................................................. 482Using the performance capacity used counter to manage performance..................................................................... 483
Monitoring performance using the Performance Inventory pages......................... 484Object monitoring using the Performance object inventory pages.............................................................................484Refining Performance inventory page contents..........................................................................................................485
Searching on Object Inventory Performance pages........................................................................................485Sorting on the Object Inventory Performance pages...................................................................................... 485Filtering data in the Object Inventory Performance pages............................................................................. 485
Understanding the Unified Manager recommendations to tier data to the cloud....................................................... 487Descriptions of the Performance inventory pages...................................................................................................... 488
Performance: All Clusters view......................................................................................................................488Cluster performance fields..............................................................................................................................489Performance: All Nodes view.........................................................................................................................490Node performance fields.................................................................................................................................491Performance: All Aggregates view.................................................................................................................492Aggregate performance fields.........................................................................................................................493Performance: All Storage VMs view..............................................................................................................495Storage VM performance fields......................................................................................................................496Performance: All Volumes view..................................................................................................................... 496Performance: Volumes in QoS Policy Group view.........................................................................................498Volume performance fields.............................................................................................................................499Performance: All LUNs view......................................................................................................................... 501Performance: LUNs in QoS Policy Group view.............................................................................................502
xiContents

LUN performance fields................................................................................................................................. 503Performance: All NVMe Namespaces view...................................................................................................504NVMe Namespace performance fields...........................................................................................................505Performance: All Network Interfaces view.................................................................................................... 506Network Interface performance fields............................................................................................................ 507Performance: All Ports view...........................................................................................................................508Port performance fields...................................................................................................................................509Performance: QoS Policy Groups view.......................................................................................................... 510QoS Policy Group fields................................................................................................................................. 511
Monitoring cluster performance from the Performance Cluster Landing page....514Understanding the Performance Cluster Landing page.............................................................................................. 514Performance Cluster Landing page............................................................................................................................ 514
Performance Cluster Summary page.............................................................................................................. 515Top Performers page.......................................................................................................................................517
Monitoring performance using the Performance Explorer pages...........................520Understanding the root object.....................................................................................................................................520Apply filtering to reduce the list of correlated objects in the grid..............................................................................520Specifying a time range for correlated objects........................................................................................................... 520
Selecting a predefined time range...................................................................................................................521Specifying a custom time range......................................................................................................................521
Defining the list of correlated objects for comparison graphing................................................................................ 522Understanding counter charts..................................................................................................................................... 523Types of performance counter charts..........................................................................................................................524Selecting performance charts to display..................................................................................................................... 526Expanding the Counter Charts pane........................................................................................................................... 527Changing the Counter Charts focus to a shorter period of time................................................................................. 527Viewing event details in the Events Timeline.............................................................................................................527Counter Charts Zoom View........................................................................................................................................ 528
Displaying the Counter Charts Zoom View....................................................................................................529Specifying the time range in Zoom View....................................................................................................... 529Selecting performance thresholds in Counter Charts Zoom View................................................................. 530
Viewing volume latency by cluster component.......................................................................................................... 531Viewing SVM IOPS traffic by protocol .....................................................................................................................531Viewing volume and LUN latency charts to verify performance guarantee...............................................................532Viewing the performance for All SAN Array clusters............................................................................................... 532Viewing node IOPS based on workloads that reside only on the local node..............................................................533Components of the Object Landing pages..................................................................................................................534
Summary page................................................................................................................................................ 536Components of the Performance Explorer page.............................................................................................538
Descriptions of the counter charts.............................................................................................................................. 540Latency performance counter charts...............................................................................................................540IOPS performance counter charts...................................................................................................................542MB/s performance counter charts...................................................................................................................544Utilization performance counter chart............................................................................................................ 545Performance Capacity Used performance counter charts...............................................................................546Available IOPS performance counter chart.................................................................................................... 547Cache Miss Ratio performance counter chart.................................................................................................548
Descriptions of the Performance Explorer pages....................................................................................................... 549Cluster/Performance Explorer page................................................................................................................549Node/Performance Explorer page...................................................................................................................550
xiiContents

Aggregate/Performance Explorer page...........................................................................................................551Storage VM/Performance Explorer page........................................................................................................552Volume/Performance Explorer page...............................................................................................................553Constituent Volume/Performance Explorer page........................................................................................... 555LUN/Performance Explorer page................................................................................................................... 556NVMe Namespace/Performance Explorer page.............................................................................................557Network Interface/Performance Explorer page.............................................................................................. 558Port/Performance Explorer page.....................................................................................................................559Cluster/Performance Information page...........................................................................................................560Node/Performance Information page............................................................................................................. 561Aggregate/Performance Information page......................................................................................................563Storage VM/Performance Information page.................................................................................................. 564Volume/Performance Information page..........................................................................................................565Constituent Volume/Performance Information page...................................................................................... 566LUN/Performance Information page..............................................................................................................567NVMe Namespace/Performance Information page........................................................................................568Network Interface/Performance Information page......................................................................................... 568Port/Performance Information page............................................................................................................... 569
Managing performance using QoS policy group information................................. 570How storage QoS can control workload throughput.................................................................................................. 570Viewing all QoS policy groups available on all clusters............................................................................................ 571Viewing volumes or LUNs that are in the same QoS policy group............................................................................572Viewing the QoS policy group settings applied to specific volumes or LUNs...........................................................573Viewing performance charts to compare volumes or LUNs that are in the same QoS policy group......................... 573How different types of QoS policies are displayed in the throughput charts............................................................. 574Viewing workload QoS minimum and maximum settings in the Performance Explorer.......................................... 575
Understanding and using the Node Failover Planning page....................................578Using the Node Failover Planning page to determine corrective actions................................................................... 578Components of the Node Failover Planning page...................................................................................................... 579Using a threshold policy with the Node Failover Planning page................................................................................580Using the Performance Capacity Used Breakdown chart for failover planning.........................................................581
Collecting data and monitoring workload performance.......................................... 584Types of workloads monitored by Unified Manager.................................................................................................. 584Workload performance measurement values.............................................................................................................. 585What the expected range of performance is............................................................................................................... 587How the latency forecast is used in performance analysis ........................................................................................ 588How Unified Manager uses workload latency to identify performance issues.......................................................... 590How cluster operations can affect workload latency.................................................................................................. 591Performance monitoring of MetroCluster configurations.......................................................................................... 592
Volume behavior during switchover and switchback..................................................................................... 593What performance events are..................................................................................................................................... 595
Performance event analysis and notification.................................................................................................. 597How Unified Manager determines the performance impact for an event.......................................................599Cluster components and why they can be in contention.................................................................................600Roles of workloads involved in a performance event.....................................................................................603
Managing backup and restore operations................................................................. 605
xiiiContents

Virtual appliance backup and restore process.............................................................................................................605Backup and restore using a MySQL database dump.................................................................................................. 605
Configuring the destination and schedule for database dump backups.......................................................... 606What a database restore is...............................................................................................................................607Restoring a MySQL database backup on a Linux system.............................................................................. 608Restoring a MySQL database backup on Windows....................................................................................... 609
Backup and restore using NetApp Snapshots ............................................................................................................610Creating the volume where backups are stored.............................................................................................. 610Specifying the destination location for Snapshot backups............................................................................. 611Defining a schedule for Snapshot backups.....................................................................................................612Restoring a Snapshot backup..........................................................................................................................613
Description of backup windows and dialog boxes..................................................................................................... 614Database Backup page....................................................................................................................................614Backup Settings dialog box............................................................................................................................ 614
Managing clusters........................................................................................................ 616How the cluster discovery process works...................................................................................................................616Viewing the list of monitored clusters........................................................................................................................ 617Adding clusters........................................................................................................................................................... 617Editing clusters........................................................................................................................................................... 619Removing clusters...................................................................................................................................................... 619Rediscovering clusters................................................................................................................................................ 620Page descriptions for data source management.......................................................................................................... 620
Cluster Setup page.......................................................................................................................................... 620Add Cluster dialog box...................................................................................................................................623Edit Cluster dialog box................................................................................................................................... 623
Managing user access.................................................................................................. 625Adding users............................................................................................................................................................... 625Editing the user settings..............................................................................................................................................626Viewing users..............................................................................................................................................................626Deleting users or groups............................................................................................................................................. 627Changing the local user password.............................................................................................................................. 627What the maintenance user does.................................................................................................................................628What RBAC is............................................................................................................................................................ 628What role-based access control does.......................................................................................................................... 628Definitions of user types.............................................................................................................................................629Definitions of user roles..............................................................................................................................................629Unified Manager user roles and capabilities...............................................................................................................630Description of user access windows and dialog boxes............................................................................................... 632
Users page.......................................................................................................................................................632Add User dialog box.......................................................................................................................................633Edit User dialog box....................................................................................................................................... 634
Managing authentication............................................................................................ 635Enabling remote authentication.................................................................................................................................. 635Disabling nested groups from remote authentication................................................................................................. 636Setting up authentication services.............................................................................................................................. 636Adding authentication servers.................................................................................................................................... 637Testing the configuration of authentication servers.................................................................................................... 639Editing authentication servers.....................................................................................................................................640
xivContents

Deleting authentication servers...................................................................................................................................640Authentication with Active Directory or OpenLDAP................................................................................................ 641Enabling SAML authentication.................................................................................................................................. 641Identity provider requirements................................................................................................................................... 643Changing the identity provider used for SAML authentication................................................................................. 644Disabling SAML authentication................................................................................................................................. 644Description of authentication windows and dialog boxes.......................................................................................... 645
Remote Authentication page...........................................................................................................................645SAML Authentication page............................................................................................................................648
Managing security certificates.................................................................................... 650Viewing the HTTPS security certificate..................................................................................................................... 650Generating an HTTPS security certificate.................................................................................................................. 650
Restarting the Unified Manager virtual machine............................................................................................652Downloading an HTTPS certificate signing request.................................................................................................. 652Installing an HTTPS security certificate.....................................................................................................................653Page descriptions for certificate management............................................................................................................ 653
HTTPS Certificate page..................................................................................................................................654Regenerate HTTPS Certificate dialog box..................................................................................................... 654
Managing feature settings........................................................................................... 656Policy-based storage management..............................................................................................................................656API Gateway...............................................................................................................................................................657Inactivity timeout........................................................................................................................................................657Active IQ portal events............................................................................................................................................... 657
Troubleshooting............................................................................................................659Changing the Unified Manager host name................................................................................................................. 659
Changing the Unified Manager virtual appliance host name......................................................................... 659Changing the Unified Manager host name on Linux systems........................................................................660
Adding disk space to the Unified Manager database directory.................................................................................. 661Adding space to the data disk of the VMware virtual machine......................................................................661Adding space to the data directory of the Linux host.....................................................................................661Adding space to the logical drive of the Microsoft Windows server..............................................................663
Changing the performance statistics collection interval............................................................................................. 663Changing the length of time Unified Manager retains event and performance data.................................................. 664Enabling periodic AutoSupport.................................................................................................................................. 665Sending on-demand AutoSupport messages.............................................................................................................. 666AutoSupport page....................................................................................................................................................... 666Unknown authentication error.................................................................................................................................... 667User not found............................................................................................................................................................ 668Issue with adding LDAP using Other authentication services................................................................................... 668
Copyright and trademark........................................................................................... 670Copyright.................................................................................................................................................................... 670Trademark...................................................................................................................................................................670
xvContents

Introduction to Active IQ Unified Manager
Active IQ Unified Manager (formerly OnCommand Unified Manager) enables you to monitor andmanage the health and performance of your ONTAP storage systems from a single interface.
Unified Manager provides the following features:
• Discovery, monitoring, and notifications for systems that are installed with ONTAP software.
• Dashboard to show capacity, security, and performance health of the environment.
• Enhanced alerts, events, and threshold infrastructure.
• Displays detailed graphs that plot workload activity over time; including IOPS (operations),MBps (throughput), latency (response time), utilization, performance capacity, and cache ratio.
• Identifies workloads that are overusing cluster components and the workloads whoseperformance is impacted by the increased activity.
• Provides suggested corrective actions that can be performed to address certain incidents andevents, and a "Fix It" button for some events so you can resolve the issue immediately.
• Integrates with OnCommand Workflow Automation to execute automated protectionworkflows.
• Ability to create new workloads, such as a LUN or file share, directly from Unified Managerand assign a Performance Service Level to define the performance and storage objectives forthe users accessing the application using that workload.
Introduction to Active IQ Unified Manager health monitoringActive IQ Unified Manager (formerly OnCommand Unified Manager) helps you to monitor alarge number of systems running ONTAP software through a centralized user interface. TheUnified Manager server infrastructure delivers scalability, supportability, and enhanced monitoringand notification capabilities.
The key capabilities of Unified Manager include monitoring, alerting, managing availability andcapacity of clusters, managing protection capabilities, and bundling of diagnostic data and sendingit to technical support.
You can use Unified Manager to monitor your clusters. When issues occur in the cluster, UnifiedManager notifies you about the details of such issues through events. Some events also provideyou with a remedial action that you can take to rectify the issues. You can configure alerts forevents so that when issues occur, you are notified through email, and SNMP traps.
You can use Unified Manager to manage storage objects in your environment by associating themwith annotations. You can create custom annotations and dynamically associate clusters, storagevirtual machines (SVMs), and volumes with the annotations through rules.
You can also plan the storage requirements of your cluster objects using the information providedin the capacity and health charts, for the respective cluster object.
Related conceptsWhat the Unified Manager server does on page 19
The Unified Manager server infrastructure consists of a data collection unit, a database, and anapplication server. It provides infrastructure services such as discovery, monitoring, role-basedaccess control (RBAC), auditing, and logging.
Introduction to Active IQ Unified Manager performance monitoring on page 18
16Introduction to Active IQ Unified Manager

Active IQ Unified Manager (formerly OnCommand Unified Manager) provides performancemonitoring capabilities and event root-cause analysis for systems that are running NetApp ONTAPsoftware.
Unified Manager health monitoring featuresUnified Manager is built on a server infrastructure that delivers scalability, supportability, andenhanced monitoring and notification capabilities. Unified Manager supports monitoring ofsystems running ONTAP software.
Unified Manager includes the following features:
• Discovery, monitoring, and notifications for systems that are installed with ONTAP software:
◦ Physical objects: nodes, disks, disk shelves, SFO pairs, ports, and Flash Cache
◦ Logical objects: clusters, storage virtual machines (SVMs), aggregates, volumes, LUNs,namespaces, qtrees, LIFs, Snapshot copies, junction paths, NFS shares, SMB shares, userand group quotas, QoS policy groups, and initiator groups
◦ Protocols: CIFS, NFS, FC, iSCSI, NVMe, and FCoE
◦ Storage efficiency: SSD aggregates, Flash Pool aggregates, FabricPool aggregates,deduplication, and compression
◦ Protection: SnapMirror relationships (synchronous and asynchronous) and SnapVaultrelationships
• Viewing the cluster discovery and monitoring status
• MetroCluster configuration: viewing and monitoring the configuration, MetroCluster switchesand bridges, issues, and connectivity status of the cluster components
• Enhanced alerts, events, and threshold infrastructure
• LDAP, LDAPS, SAML authentication, and local user support
• RBAC (for a predefined set of roles)
• AutoSupport and support bundle
• Enhanced dashboard to show capacity, availability, protection, and performance health of theenvironment
• Volume move interoperability, volume move history, and junction path change history
• Scope of Impact area that graphically displays the resources that are impacted for events suchas Some Failed Disks, MetroCluster Aggregate Mirroring Degraded, and MetroCluster SpareDisks Left Behind events
• Possible Effect area that displays the effect of the MetroCluster events
• Suggested Corrective Actions area that displays the actions that can be performed to addressevents such as Some Failed Disks, MetroCluster Aggregate Mirroring Degraded, andMetroCluster Spare Disks Left Behind events
• Resources that Might be Impacted area that displays the resources that might be impacted forevents such as for the Volume Offline event, the Volume Restricted event, and the Thin-Provisioned Volume Space At Risk event
• Support for SVMs with FlexVol or FlexGroup volumes
• Support for monitoring node root volumes
• Enhanced Snapshot copy monitoring, including computing reclaimable space and deletingSnapshot copies
• Annotations for storage objects
• Report creation and management of storage object information such as physical and logicalcapacity, utilization, space savings, performance, and related events
• Integration with OnCommand Workflow Automation to execute workflows
The Storage Automation Store contains NetApp-certified automated storage workflow packsdeveloped for use with OnCommand Workflow Automation (WFA). You can download the
17Introduction to Active IQ Unified Manager

packs, and then import them to WFA to execute them. The automated workflows are availableat the following link: Storage Automation Store
Related conceptsIntroduction to Active IQ Unified Manager health monitoring on page 16
Active IQ Unified Manager (formerly OnCommand Unified Manager) helps you to monitor alarge number of systems running ONTAP software through a centralized user interface. TheUnified Manager server infrastructure delivers scalability, supportability, and enhanced monitoringand notification capabilities.
Introduction to Active IQ Unified Manager performance monitoringActive IQ Unified Manager (formerly OnCommand Unified Manager) provides performancemonitoring capabilities and event root-cause analysis for systems that are running NetApp ONTAPsoftware.
Unified Manager helps you to identify workloads that are overusing cluster components anddecreasing the performance of other workloads on the cluster. By defining performance thresholdpolicies you can also specify maximum values for certain performance counters so that events aregenerated when the threshold is breached. Unified Manager alerts you about these performanceevents so that you can take corrective action, and bring performance back to normal levels ofoperation. You can view and analyze events in the Unified Manager UI.
Unified Manager monitors the performance of two types of workloads:
• User-defined workloads
These workloads consist of FlexVol volumes and FlexGroup volumes that you have created inyour cluster.
• System-defined workloads
These workloads consist of internal system activity.
Related conceptsIntroduction to Active IQ Unified Manager health monitoring on page 16
Active IQ Unified Manager (formerly OnCommand Unified Manager) helps you to monitor alarge number of systems running ONTAP software through a centralized user interface. TheUnified Manager server infrastructure delivers scalability, supportability, and enhanced monitoringand notification capabilities.
Unified Manager performance monitoring featuresUnified Manager collects and analyzes performance statistics from systems running ONTAPsoftware. It uses dynamic performance thresholds and user-defined performance thresholds tomonitor a variety of performance counters over many cluster components.
A high response time (latency) indicates that the storage object, for example, a volume, isperforming slower than normal. This issue also indicates that the performance has decreased forclient applications that are using the volume. Unified Manager identifies the storage componentwhere the performance issue lies and provides a list of suggested actions you can take to addressthe performance issue.
Unified Manager includes the following features:
• Monitors and analyzes workload performance statistics from a system running ONTAPsoftware.
• Tracks performance counters for clusters, nodes, aggregates, ports, SVMs, volumes, LUNs,NVMe namespaces, and network interfaces (LIFs).
• Displays detailed graphs that plot workload activity over time; including IOPS (operations),MB/s (throughput), latency (response time), utilization, performance capacity, and cache ratio.
18Introduction to Active IQ Unified Manager
• Enables you to create user-defined performance threshold policies that trigger events and sendemail alerts when the thresholds are breached.
• Uses system-defined thresholds and dynamic performance thresholds that learn about yourworkload activity to identify and alert you to performance issues.
• Identifies the quality of service (QoS) policies and Performance Service Level policies (PSLs)that are applied to your volumes and LUNs.
• Clearly identifies the cluster component that is in contention.
• Identifies workloads that are overusing cluster components and the workloads whoseperformance is impacted by the increased activity.
Using Unified Manager REST APIsActive IQ Unified Manager provides you with REST APIs to view the information aboutmonitoring and managing your storage environment. APIs also allow provisioning and managingstorage objects based on policies.
You can also execute ONTAP APIs on all ONTAP-managed clusters by using the API gatewaysupported by Unified Manager.
For information about Unified Manager REST APIs, see the Active IQ Unified Manager APIDeveloper's Guide.
What the Unified Manager server doesThe Unified Manager server infrastructure consists of a data collection unit, a database, and anapplication server. It provides infrastructure services such as discovery, monitoring, role-basedaccess control (RBAC), auditing, and logging.
Unified Manager collects cluster information, stores the data in the database, and analyzes the datato see if there are any cluster issues.
How the discovery process worksAfter you have added the cluster to Unified Manager, the server discovers the cluster objects andadds them to its database. Understanding how the discovery process works helps you to manageyour organization's clusters and their objects.
The default monitoring interval is 15 minutes: if you have added a cluster to Unified Managerserver, it takes 15 minutes to display the cluster details in the Unified Manager UI.
The following image illustrates the discovery process in Active IQ Unified Manager:
19Introduction to Active IQ Unified Manager
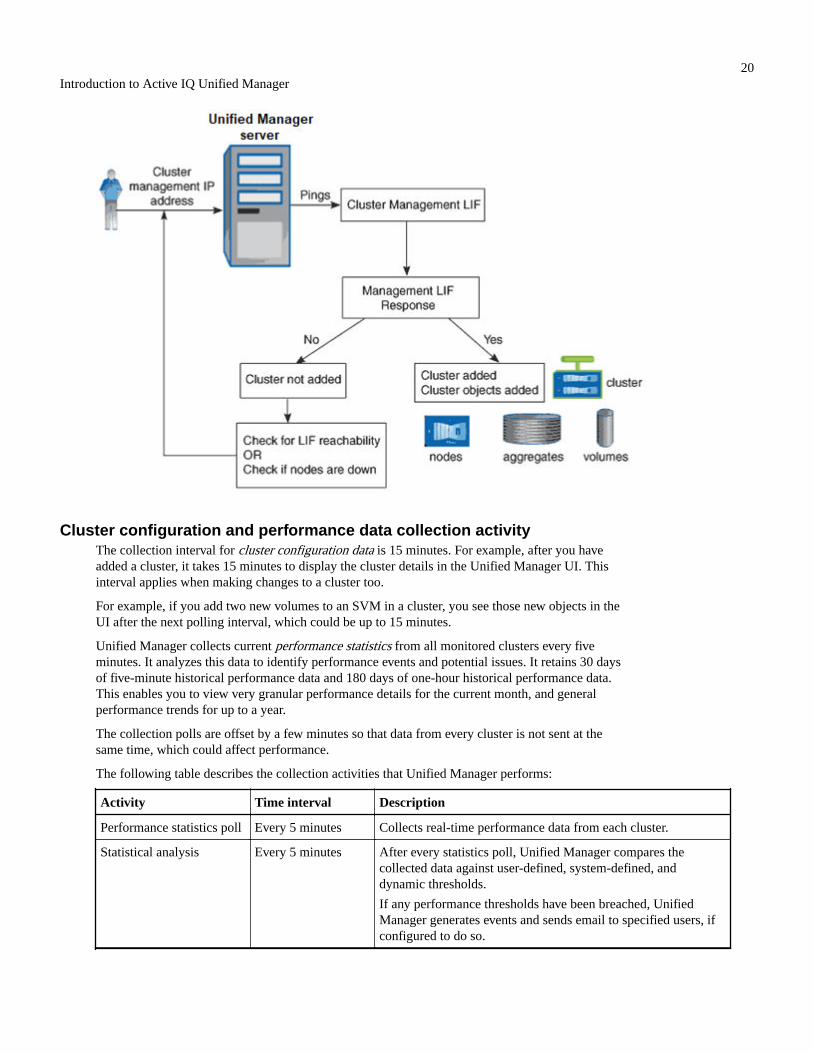
Cluster configuration and performance data collection activityThe collection interval for cluster configuration data is 15 minutes. For example, after you haveadded a cluster, it takes 15 minutes to display the cluster details in the Unified Manager UI. Thisinterval applies when making changes to a cluster too.
For example, if you add two new volumes to an SVM in a cluster, you see those new objects in theUI after the next polling interval, which could be up to 15 minutes.
Unified Manager collects current performance statistics from all monitored clusters every fiveminutes. It analyzes this data to identify performance events and potential issues. It retains 30 daysof five-minute historical performance data and 180 days of one-hour historical performance data.This enables you to view very granular performance details for the current month, and generalperformance trends for up to a year.
The collection polls are offset by a few minutes so that data from every cluster is not sent at thesame time, which could affect performance.
The following table describes the collection activities that Unified Manager performs:
Activity Time interval Description
Performance statistics poll Every 5 minutes Collects real-time performance data from each cluster.
Statistical analysis Every 5 minutes After every statistics poll, Unified Manager compares thecollected data against user-defined, system-defined, anddynamic thresholds.
If any performance thresholds have been breached, UnifiedManager generates events and sends email to specified users, ifconfigured to do so.
20Introduction to Active IQ Unified Manager
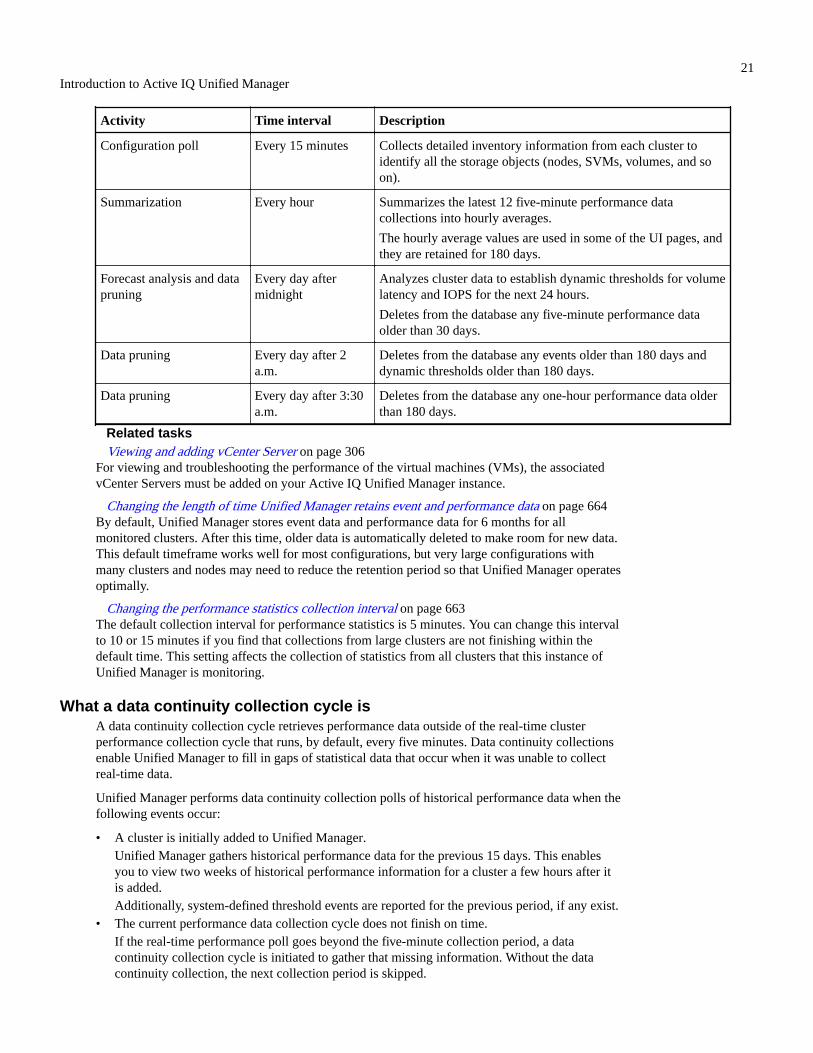
Activity Time interval Description
Configuration poll Every 15 minutes Collects detailed inventory information from each cluster toidentify all the storage objects (nodes, SVMs, volumes, and soon).
Summarization Every hour Summarizes the latest 12 five-minute performance datacollections into hourly averages.
The hourly average values are used in some of the UI pages, andthey are retained for 180 days.
Forecast analysis and datapruning
Every day aftermidnight
Analyzes cluster data to establish dynamic thresholds for volumelatency and IOPS for the next 24 hours.
Deletes from the database any five-minute performance dataolder than 30 days.
Data pruning Every day after 2a.m.
Deletes from the database any events older than 180 days anddynamic thresholds older than 180 days.
Data pruning Every day after 3:30a.m.
Deletes from the database any one-hour performance data olderthan 180 days.
Related tasksViewing and adding vCenter Server on page 306
For viewing and troubleshooting the performance of the virtual machines (VMs), the associatedvCenter Servers must be added on your Active IQ Unified Manager instance.
Changing the length of time Unified Manager retains event and performance data on page 664By default, Unified Manager stores event data and performance data for 6 months for allmonitored clusters. After this time, older data is automatically deleted to make room for new data.This default timeframe works well for most configurations, but very large configurations withmany clusters and nodes may need to reduce the retention period so that Unified Manager operatesoptimally.
Changing the performance statistics collection interval on page 663The default collection interval for performance statistics is 5 minutes. You can change this intervalto 10 or 15 minutes if you find that collections from large clusters are not finishing within thedefault time. This setting affects the collection of statistics from all clusters that this instance ofUnified Manager is monitoring.
What a data continuity collection cycle isA data continuity collection cycle retrieves performance data outside of the real-time clusterperformance collection cycle that runs, by default, every five minutes. Data continuity collectionsenable Unified Manager to fill in gaps of statistical data that occur when it was unable to collectreal-time data.
Unified Manager performs data continuity collection polls of historical performance data when thefollowing events occur:
• A cluster is initially added to Unified Manager.
Unified Manager gathers historical performance data for the previous 15 days. This enablesyou to view two weeks of historical performance information for a cluster a few hours after itis added.
Additionally, system-defined threshold events are reported for the previous period, if any exist.
• The current performance data collection cycle does not finish on time.
If the real-time performance poll goes beyond the five-minute collection period, a datacontinuity collection cycle is initiated to gather that missing information. Without the datacontinuity collection, the next collection period is skipped.
21Introduction to Active IQ Unified Manager

• Unified Manager has been inaccessible for a period of time and then it comes back online, asin the following situations:
◦ It was restarted.
◦ It was shut down during a software upgrade or when creating a backup file.
◦ A network outage is repaired.
• A cluster has been inaccessible for a period of time and then it comes back online, as in thefollowing situations:
◦ A network outage is repaired.
◦ A slow wide area network connection delayed the normal collection of performance data.
A data continuity collection cycle can collect a maximum of 24 hours of historical data. If UnifiedManager is down for longer than 24 hours, a gap in performance data appears in the UI pages.
A data continuity collection cycle and a real-time data collection cycle cannot run at the sametime. The data continuity collection cycle must finish before the real-time performance datacollection is initiated. When the data continuity collection is required to collect more than onehour of historical data, then you see a banner message for that cluster at the top of theNotifications pane.
What the timestamp means in collected data and eventsThe timestamp that appears in collected health and performance data, or that appears as thedetection time for an event, is based on the ONTAP cluster time, adjusted to the time zone set onthe web browser.
It is highly recommended that you use a Network Time Protocol (NTP) server to synchronize thetime on your Unified Manager servers, ONTAP clusters, and web browsers.
Note: If you see timestamps that look incorrect for a particular cluster, you might want to checkthat the cluster time has been set correctly.
22Introduction to Active IQ Unified Manager

Understanding the user interface
The Unified Manager user interface mainly consists of a dashboard that provides an at-a-glanceview of the objects that are monitored. The user interface also provides access to viewing all thecluster objects.
You can select a preferred view and use the action buttons as necessary. Your screen configurationis saved in a workspace so that all of the functionality you require is available when you startUnified Manager. However, when you navigate from one view to another, and then navigate back,the view might not be the same.
Typical window layoutsUnderstanding the typical window layouts helps you to navigate and use Active IQ UnifiedManager effectively. Most Unified Manager windows are similar to one of two general layouts:object list or details. The recommended display setting is at least 1280 by 1024 pixels.
Not every window contains every element in the following diagrams.
Object list window layout
23Understanding the user interface

Object details window layout
Related referenceWindow layout customization on page 24
Active IQ Unified Manager enables you to customize the layout of information on the storage andnetwork object pages. By customizing the windows, you can control which data is viewable andhow the data is displayed.
Window layout customizationActive IQ Unified Manager enables you to customize the layout of information on the storage andnetwork object pages. By customizing the windows, you can control which data is viewable andhow the data is displayed.
Sorting
You can click the column header to change the sort order of the column entries. When you
click the column header, the sort arrows ( and ) appear for that column.
Filtering
You can click the filter icon ( ) to apply filters to customize the display of informationon the storage and network object pages so that only those entries that match the conditionsthat are provided are displayed. You apply filters from the Filters pane.
The Filters pane enables you to filter most of the columns based on the options that areselected. For example, on the Health: All Volumes view, you can use the Filters pane todisplay all of the volumes that are offline by selecting the appropriate filter option underState.
Capacity-related columns in any list always display capacity data in appropriate unitsrounded off to two decimal points. This also applies when filtering capacity columns. Forexample, if you use the filter in the Total Data Capacity column in the Health: AllAggregates view to filter data greater than 20.45 GB, the actual capacity of 20.454 GB is
24Understanding the user interface

displayed as 20.45 GB. Similarly, if you filter data less than 20.45 GB, the actual capacityof 20.449 GB is displayed as 20.45 GB.
If you use the filter in the Available Data % column in the Health: All Aggregates view tofilter data greater than 20.45%, the actual capacity of 20.454% is displayed as 20.45%.Similarly, if you filter data less than 20.45%, the actual capacity of 20.449% is displayed as20.45%.
Hiding or showing the columns
You can click the column display icon (Show/Hide) to select which columns you want todisplay. Once you have selected the appropriate columns you can re-order them by draggingthem using your mouse.
Searching
You can use the search box to search for certain object attributes to help refine the list ofitems in the inventory page. For example, you can enter "cloud" to refine the list of volumesin the volumes inventory page to see all volumes that have the word "cloud" in them.
Exporting data
You can click the Reports button (or Export button to export data to a comma-separatedvalues (.csv) file, (.pdf) document, or Microsoft Excel (.xlsx) file and use the exporteddata to build reports.
Using the Unified Manager HelpThe Help includes information about all features included in Active IQ Unified Manager. You canuse the table of contents, the index, or the search tool to find information about the features andhow to use them.
About this task
Help is available from each tab and from the menu bar of the Unified Manager user interface.
The search tool in the Help does not work for partial words.
Choices
• To learn about specific fields or parameters, click .
• To view all the Help contents, click > Help/Documentation in the menu bar.
You can find more detailed information by expanding any portion of the Table of Contents inthe navigation pane.
• To search the Help contents, click the Search tab in the navigation pane, type the word orseries of words you want to find, and click Go!
• To print Help topics, click the printer icon.
Related tasksBookmarking your favorite Help topics on page 25
In the Help Favorites tab, you can bookmark Help topics that you use frequently. Help bookmarksprovide fast access to your favorite topics.
Bookmarking your favorite Help topicsIn the Help Favorites tab, you can bookmark Help topics that you use frequently. Help bookmarksprovide fast access to your favorite topics.
Steps
1. Navigate to the Help topic that you want to add as a favorite.
25Understanding the user interface

2. Click Favorites, and then click Add.
Searching for storage objectsTo quickly access a specific object, you can use the Search all Storage Objects field at the top ofthe menu bar. This method of global search across all objects enables you to quickly locatespecific objects by type. Search results are sorted by storage object type and you can filter themfurther by object using the drop-down menu.
Before you begin
• You must have one of the following roles to perform this task: Operator, ApplicationAdministrator, or Storage Administrator.
• A valid search must contain at least three characters.
About this task
When using the drop-down menu value "All", the global search displays the total number ofresults found in all object categories; with a maximum of 25 search results for each objectcategory. You can select a specific object type from the drop-down menu to refine the searchwithin a specific object type. In this case the returned list is not restricted to the top 25 objects.
The object types you can search for include:
• Clusters
• Nodes
• Storage VMs
• Aggregates
• Volumes
• Qtrees
• SMB Shares
• NFS Shares
• User or Group Quotas
• LUNs
• NVMe Namespaces
• Initiator Groups
• Initiators
Entering a workload name returns the list of workloads under the appropriate Volumes or LUNscategory.
You can click any object in the search results to navigate to the Health details page for that object.If there is no direct health page for an object, then the Health page of the parent object isdisplayed. For example, when searching for a specific LUN, the SVM details page on which theLUN resides is displayed.
Note: Ports and LIFs are not searchable in the global search bar.
Steps
1. Select an object type from the menu to refine the search results for only a single object type.
2. Type a minimum of three characters of the object name in the Search all Storage Objectsfield.In this example, the drop-down box has the Volumes object type selected. Typing "vol1" intothe Search all Storage Objects field displays a list of all volumes whose names contain thesecharacters.
26Understanding the user interface

Exporting storage data as reportsYou can export storage data in a variety of output formats and then use the exported data to buildreports. For example, if there are 10 critical events that have not been resolved, you can export thedata from the Event Management inventory page to create a report, and then send the report toadmins who can resolve the issues.
About this task
You can export data to a .csv file, .xlsx file, or .pdf document from the Storage and Networkinventory pages and use the exported data to build reports. There are other locations in the productwhere only .csv or .pdf files can be generated.
Steps
1. Perform one of the following actions:
If you want to export... Do this...
Storage object inventory details Click Storage or Network from the left-navigation menu, and then select astorage object. Choose one of the system-provided views, or any custom viewthat you have created.
QoS Policy Group details Click Storage > QoS Policy Groups from the left-navigation menu.
Storage capacity and protectionhistory details
Click Storage > Aggregates or Storage > Volumes, then select a singleaggregate or volume.
Event details Click Event Management from the left-navigation menu.
Storage object top 10performance details
Click Storage > Clusters > Performance:All Clusters, then select a cluster andchoose the Top Performers tab. Then select a storage object and performancecounter.
2. Click the Reports button (or Export button in some UI pages).
3. Click Download CSV, Download PDF, or Download Excel to confirm the export request.
From the Top Performers tab you can choose to download a report of the statistics for thesingle cluster you are viewing or for all clusters in the data center.
The file is downloaded.
27Understanding the user interface

4. Open the file in the appropriate application.
Related tasksScheduling a report on page 332
After you have a view or Excel file that you want to schedule for regular generation anddistribution, you can schedule the report.
Related referenceHealth: All Clusters view on page 220
The Health: All Clusters view enables you to view health information about the clusters that youare monitoring.
Filtering inventory page contentYou can filter inventory page data in Unified Manager to quickly locate data based on specificcriteria. You can use filtering to narrow the contents of the Unified Manager pages to show onlythe results in which you are interested. This provides a very efficient method of displaying onlythe data in which you are interested.
About this task
Use Filtering to customize the grid view based on your preferences. Available filter options arebased on the object type being viewed in the grid. If filters are currently applied, the number ofapplied filters displays at the right of the Filter button.
Three types of filter parameters are supported.
Parameter Validation
String (text) The operators are contains and starts with.
Number The operators are greater than and less than.
Enum (text) The operators are is and is not.
The Column, Operator, and Value fields are required for each filter; the available filters reflect thefilterable columns on the current page. The maximum number of filters you can apply is four.Filtered results are based on combined filter parameters. Filtered results apply to all pages in yourfiltered search, not just the page currently displayed.
You can add filters using the Filtering panel.
1. At the top of the page, click the Filter button. The Filtering panel displays.
2. Click the left drop-down list and select an object; for example, Cluster, or a performancecounter.
3. Click the center drop-down list, and select the operator you want to use.
4. In the last list, select or enter a value to complete the filter for that object.
5. To add another filter, click +Add Filter. An additional filter field displays. Complete this filterusing the process described in the preceding steps. Note that upon adding your fourth filter, the+Add Filter button no longer displays.
6. Click Apply Filter. The filter options are applied to the grid and the number of filters isdisplayed to the right of the Filter button.
7. Use the Filtering panel to remove individual filters by clicking the trash icon at the right of thefilter to be removed.
8. To remove all filters, click Reset at the bottom of the filtering panel.
28Understanding the user interface

Filtering example
The illustration shows the Filtering panel with three filters. The +Add Filter button displays whenyou have fewer than the maximum of four filters.
After clicking Apply Filter, the Filtering panel closes, applies your filters, and shows the number
of filters applied ( ).
Viewing active events from the notification bell
The notification bell ( ) in the menu bar provides a fast way to view the most important activeevents that Unified Manager is tracking.
About this task
The list of active events provides a way to see the total number of critical, error, warning, andupgrade events on all clusters. This list includes events from the previous 7 days, and it does notinclude Information events. You can click a link to display the list of events that you are mostinterested in.
Note that when a cluster is not reachable, Unified Manager displays this information in this page.You can view detailed information about a cluster that is unreachable by clicking the Detailsbutton. This action opens the Event details page. Scale monitoring issues, such as low space orRAM on the management station, are also displayed on this page.
Steps
1. From the menu bar, click .
2. To view details for any of the active events, click the event text link, such as "2 Capacity" or "4Performance".
29Understanding the user interface

Monitoring and managing clusters from the dashboard
The dashboard provides cumulative at-a-glance information about the current health of yourmonitored ONTAP systems. The dashboard provides "panels" that enable you to assess the overallcapacity, performance, and security health of the clusters you are monitoring.
Additionally, there are certain ONTAP issues that you can fix directly from the Unified Manageruser interface instead of having to use ONTAP System Manager or the ONTAP CLI.
At the top of the dashboard you can select whether the panels show information for all monitoredclusters or for an individual cluster. You can start by viewing the status of all clusters and then drilldown to individual clusters when you want to view detailed information.
Note: Some of the panels listed below may not appear on the page based on your configuration.
Panels Description
Management Actions When Unified Manager can diagnose and determine a single resolutionfor an issue, those resolutions are displayed in this panel with a Fix Itbutton.
Capacity Displays the total and used capacity for the local tier and cloud tier, andthe number of days until local capacity reaches the upper limit.
Performance Capacity Displays the performance capacity value for each cluster and the numberof days until performance capacity reaches the upper limit.
Workload IOPS Displays the total number workloads that are currently running in acertain range of IOPS.
Workload Performance Displays the total number of conforming and non-conforming workloadsthat are assigned to each defined Performance Service Level.
Security Displays the number of clusters that are compliant or not compliant, thenumber of SVMs that are compliant or not compliant, and the number ofvolumes that are encrypted or not encrypted.
Usage Overview Displays clusters sorted by highest IOPS, highest throughput (MBps), orhighest used physical capacity.
Related referenceDashboard page on page 34
The Dashboard page has "panels" that display the high level capacity, performance, and securityhealth of the clusters you are monitoring. This page also provides a Management Actions panelthat lists fixes that Unified Manager can make to resolve certain events.
Fixing ONTAP issues directly from Unified ManagerYou can fix certain ONTAP issues directly from the Unified Manager user interface instead ofhaving to use ONTAP System Manager or the ONTAP CLI.
A feature called "Management Actions" provides fixes to a number of ONTAP issues that havetriggered Unified Manager events. Management Actions are available from the Dashboard, fromthe Event details page, and from the Workload Analysis selection on the left-navigation menu.
There are certain issues that Unified Manager can diagnose thoroughly and provide a singleresolution. When available, those resolutions are displayed in Management Actions with a Fix Itbutton. Click the Fix It button to fix the issue. You must have the Application Administrator orStorage Administrator role.
30Monitoring and managing clusters from the dashboard

Unified Manager sends ONTAP commands to the cluster to make the requested fix. When the fixis complete the event is obsoleted.
Some management actions enable you to fix the same issue on multiple storage objects using theFix All button. For example, there may be 5 volumes that have the "Volume Space Full" event thatcould be resolved by clicking the Fix All management action for "Enable volume autogrow". Oneclick enables you to fix this issue on 5 volumes.
What options do I have when I see the Fix It or Fix All buttonThe Fix It button and Fix All button enable you to fix issues that Unified Manager has beennotified about through an event.
We recommend that you click the Fix It or Fix All button to fix an issue when it is available.However, if you are not sure that you want to resolve the issue as recommended by UnifiedManager, you can perform the following actions:
Table 1: Fix All Options
What do you want to do? Action
Have Unified Manager fix the issue on all identifiedobjects.
Click the Fix All button.
Do not fix the issue for any of the identified objects atthis time and hide this management action until the eventis raised again.
Click the down arrow and click Dismiss All.
Fix the issue on only some of the identified objects. Click the name of the management action to expand thelist and show all individual Fix It actions.
Then follow the steps for fixing or dismissing individualmanagement actions.
Table 2: Fix It Options
What do you want to do? Action
Have Unified Manager fix the issue. Click the Fix It button.
Do not fix the issue at this time and hide thismanagement action until the event is raised again.
Click the down arrow and click Dismiss.
Display the details for this event so you can betterunderstand the issue.
• Click the Fix It button and review the fix that will beapplied in the resulting dialog box.
• Click the down arrow and click View Event Detail todisplay the Event details page.
Then click Fix It from either of these resulting pages ifyou want to fix the issue.
Display the details for this storage object so you canbetter understand the issue.
Click the name of the storage object to display details ineither the Performance Explorer or Health Details page.
In some cases the fix is reflected in the next 15 minute configuration poll. In other cases it can takeup to many hours for the configuration change to be verified and for the event to be obsoleted.
To see the list of completed and in progress management actions, click in the top of theManagement Actions panel and select Completed or In Progress.
31Monitoring and managing clusters from the dashboard

Fix All operations run in a serial fashion, so when you view the In Progress panel some objectswill have the Status In Progress whereas others will have the Status Scheduled; meaning they arestill waiting to be implemented.
Viewing the status of management actions you have chosen to fixYou can view the status of all management actions that you have chosen to fix in the ManagementActions page. Most actions are shown as Completed fairly quickly after Unified Manager sendsthe ONTAP command to the cluster. However, some actions, such as moving a volume, can take alonger period of time.
About this task
There are three views available on the Management Actions page:
• Completed shows both management actions that completed successfully and those that havefailed. Failed actions provide a reason for the failure so that you can address the issuemanually.
• In Progress shows both those management actions that are being implemented, and those thatare scheduled to be implemented.
• Recommended shows all the management actions that are currently active for all monitoredclusters.
Steps
1. Click in the top of the Management Actions panel and select the View you want to see.The Management Actions page is displayed
2. You can click the caret icon next to the management action in the Description field to seedetails about the issue and the command that is being used to fix the issue.
3. To view any actions that failed, sort on the Status column in the Completed View. You canuse the Filter tool for this same purpose.
4. If you want to view more information about a Failed management action, or if you decide thatyou want to fix a Recommended management action, you can click View Event Detail fromthe expanded area after you click the caret icon next to the management action. A Fix It buttonis available from that page.
What ONTAP issues can Unified Manager fixThis table describes the ONTAP issues that Unified Manager can resolve directly from the UnifiedManager user interface by clicking the Fix It or Fix All button.
Event Name and Description Management Action "Fix It" Operation
Volume Space Full
The volume is almost out of space and ithas breached the capacity full threshold.This threshold is set by default to 90% ofthe volume size.
Enable volume autogrow Unified Manager determines that volumeautogrow is not configured for this volume,so it enables this feature so the volume willgrow in capacity when needed.
Inodes Full
This volume has run out of inodes andcannot accept any new files.
Increase number of inodeson volume
Increases the number of inodes on thevolume by 2 percent.
32Monitoring and managing clusters from the dashboard

Event Name and Description Management Action "Fix It" Operation
Storage Tier Policy Mismatch Detected
The volume has lots of inactive data andthe current tiering policy is set to"snapshot-only" or "none".
Enable automatic cloudtiering
Since the volume already resides on aFabricPool, it changes the tiering policy to"auto" so that inactive data is moved to thelower cost cloud tier.
Storage Tier Mismatch Detected
The volume has lots of inactive data, but itdoes not reside on a cloud-enabled storagetier (FabricPool).
Change volumes’ storagetier
Moves the volume to cloud-enabled storagetier and sets the tiering policy to "auto" tomove inactive data to the cloud tier.
Audit Log Disabled
The audit log is not enabled for thestorage VM
Enable audit logging forthe storage VM
Enables audit logging on the storage VM.
Note that the storage VM must alreadyhave either a local or remote audit loglocation configured.
Login Banner Disabled
The login banner for the cluster should beenabled to increase security by makingaccess restrictions clear.
Set login banner for thecluster
Sets the cluster login banner to "Accessrestricted to authorized users".
Login Banner Disabled
The login banner for the storage VMshould be enabled to increase security bymaking access restrictions clear.
Set login banner for thestorage VM
Sets the storage VM login banner to"Access restricted to authorized users".
SSH is Using Insecure Ciphers
Ciphers with the suffix "-cbc" areconsidered insecure.
Remove insecure ciphersfrom the cluster
Removes the insecure ciphers — such asaes192-cbc and aes128-cbc — from thecluster.
SSH is Using Insecure Ciphers
Ciphers with the suffix "-cbc" areconsidered insecure.
Remove insecure ciphersfrom the storage VM
Removes the insecure ciphers — such asaes192-cbc and aes128-cbc — from thestorage VM.
AutoSupport HTTPS transport disabled
The transport protocol used to sendAutoSupport messages to technicalsupport should be encrypted.
Set HTTPS as thetransport protocol forAutoSupport messages
Sets HTTPS as the transport protocol forAutoSupport messages on the cluster.
Cluster Load Imbalance ThresholdBreached
Indicates that the load is imbalancedamong the nodes in the cluster. This eventis generated when the performancecapacity used variance is more than 30%between nodes.
Balance cluster workloads Unified Manager identifies the best volumeto move from one node to the other toreduce the imbalance, and then moves thevolume.
Cluster Capacity Imbalance ThresholdBreached
Indicates that the capacity is imbalancedamong the aggregates in the cluster. Thisevent is generated when the used capacityvariance is more than 70% betweenaggregates.
Balance cluster capacity Unified Manager identifies the best volumeto move from one aggregate to another toreduce the imbalance, and then moves thevolume.
33Monitoring and managing clusters from the dashboard

Event Name and Description Management Action "Fix It" Operation
Performance Capacity Used ThresholdBreached
Indicates that the load on the node couldbecome over utilized if you don't reducethe utilization by one or more highlyactive workloads. This event is generatedwhen the node performance capacity usedvalue is more than 100% for more than 12hours.
Limit high load on node Unified Manager identifies the volume withthe highest IOPS and it applies a QoSpolicy using the historical expected andpeak IOPS levels to reduce the load on thenode.
Dynamic Event Warning ThresholdBreached
Indicates that the node is alreadyoperating in an overloaded state due to theabnormally high load of some of theworkloads.
Reduce overload in node Unified Manager identifies the volume withthe highest IOPS and it applies a QoSpolicy using the historical expected andpeak IOPS levels to reduce the load on thenode.
Takeover is not possible
Failover is currently disabled, so access tothe node's resources during an outage orreboot would be lost until the nodebecame available again.
Enable node failover Unified Manager sends the appropriatecommand to enable failover on all nodes inthe cluster.
Option Cf.takeover.on_panic isConfigured OFF
The nodeshell option"cf.takeover.on_panic" is set to off, whichcould cause an issue on HA-configuredsystems.
Enable takeover on panic Unified Manager sends the appropriatecommand to the cluster to change thissetting to on.
Disable nodeshell optionsnapmirror.enable
The old nodeshell option"snapmirror.enable" is set to on, whichcould cause an issue during boot afterupgrading to ONTAP 9.3 or greater.
Set snapmirror.enableoption to off
Unified Manager sends the appropriatecommand to the cluster to change thissetting to off.
Telnet enabled
Indicates a potential security issuebecause Telnet is insecure and passes datain an unencrypted manner.
Disable Telnet Unified Manager sends the appropriatecommand to the cluster to disable Telnet.
Dashboard pageThe Dashboard page has "panels" that display the high level capacity, performance, and securityhealth of the clusters you are monitoring. This page also provides a Management Actions panelthat lists fixes that Unified Manager can make to resolve certain events.
Most of the panels also display the number of active events in that category, and the number ofnew events added over the previous 24 hours. This information helps you decide which clustersyou may need to analyze further to resolve events. Clicking on the events displays the top eventsand provides a link to the Event Management inventory page filtered to show the active events inthat category.
34Monitoring and managing clusters from the dashboard

At the top of the dashboard you can select whether the panels show information for all monitoredclusters ("All Clusters") or for an individual cluster. You can start by viewing the status of allclusters and then drill down to individual clusters when you want to view detailed information.
Note: Some of the panels listed below will not appear on the page based on your configuration.
Management Actions panel
There are certain issues that Unified Manager can diagnose thoroughly and provide a singleresolution. When available, those resolutions are displayed in this panel with a Fix It or FixAll button. You can fix these issues immediately from Unified Manager instead of having touse ONTAP System Manager or the ONTAP CLI.
See Fixing ONTAP issues directly from Unified Manager on page 30 for more information.
Capacity panel
When viewing all clusters, this panel displays the physical used capacity (after applyingstorage efficiency savings) and physical available capacity (not including potential storageefficiency savings) for each cluster, the number of days until the disks are projected to befull, and the data reduction ratio based on configured ONTAP storage efficiency settings. Italso lists the used capacity for any configured cloud tiers. Clicking the bar chart takes youto the Aggregates inventory page for that cluster. Clicking the "Days To Full" text displays amessage that identifies the aggregate with the least number of capacity days remaining;click the aggregate name to see more details.
When viewing a single cluster, this panel displays the physical used capacity and physicalavailable capacity for the data aggregates sorted by each individual disk type on the localtier, and for the cloud tier. Clicking the bar chart for a disk type takes you to the Volumesinventory page for the volumes using that disk type.
Performance Capacity panel
When viewing all clusters, this panel displays the performance capacity value for eachcluster (averaged over the previous 1 hour) and the number of days until performancecapacity reaches the upper limit (based on daily growth rate). Clicking the bar chart takesyou to the Nodes inventory page for that cluster. Note that the Nodes inventory pagedisplays the performance capacity averaged over the previous 72 hours. Clicking the "DaysTo Full" text displays a message that identifies the node with the least number ofperformance capacity days remaining; click the node name to see more details.
When viewing a single cluster, this panel displays the cluster performance capacity usedpercentage, total IOPS, and total throughput (MB/s) values, and the number of days untileach of these three metrics are anticipated to reach their upper limit.
Workload IOPS panel
When viewing a single cluster, this panel displays the total number workloads that arecurrently running in a certain range of IOPS, and indicates the number for each disk typewhen you hover your cursor over the chart.
Workload Performance panel
This panel displays the total number of conforming and non-conforming workloads that areassigned to each Performance Service Level (PSL) policy. It also displays the number ofworkloads that are not assigned a PSL. Clicking a bar chart takes you to the conformingworkloads assigned to that policy in the Workloads page. Clicking the number that followsthe bar chart takes you to the conforming and non-conforming workloads assigned to thatpolicy.
Security panel
When viewing all clusters, this panel displays the number of clusters that are compliant andnot compliant, the number of storage VMs that are compliant and not compliant, and the
35Monitoring and managing clusters from the dashboard

number of volumes that are encrypted and not encrypted. Compliance is based on theNetApp Security Hardening Guide for ONTAP 9. Click the right-arrow at the top of thepanel to view security details for all clusters in the Security page.
When viewing a single cluster, this panel displays whether the cluster is compliant or notcompliant, the number of storage VMs that are compliant and not compliant, and thenumber of volumes that are encrypted and not encrypted. Click the right-arrow at the top ofthe panel to view security details for the cluster in the Security page.
Usage Overview panel
When viewing all clusters, you can choose to view clusters sorted by highest IOPS, highestthroughput (MB/s), or highest used physical capacity.
When viewing a single cluster, you can choose to view workloads sorted by highest IOPS,highest throughput (MB/s), or highest used logical capacity.
Related conceptsManaging performance using performance capacity and available IOPS information on page477
Performance capacity indicates how much throughput you can get out of a resource withoutsurpassing the useful performance of that resource. When viewed using existing performancecounters, performance capacity is the point at which you get the maximum utilization from a nodeor aggregate before latency becomes an issue.
What health events are on page 43Health events are notifications that are generated automatically when a predefined conditionoccurs or when an object crosses a health threshold. These events enable you to take action toprevent issues that can lead to poor performance and system unavailability. Events include animpact area, severity, and impact level.
Sources of performance events on page 45Performance events are issues related to workload performance on a cluster. They help youidentify storage objects with slow response times, also known as high latency. Together with otherhealth events that occurred at the same time, you can determine the issues that might have caused,or contributed to, the slow response times.
Managing cluster security objectives on page 295Unified Manager provides a dashboard that identifies how secure your ONTAP clusters, storagevirtual machines (SVMs), and volumes are based on recommendations defined in the NetAppSecurity Hardening Guide for ONTAP 9.
Monitoring cluster performance from the Performance Cluster Landing page on page 514The Performance Cluster Landing page displays the high-level performance status of a selectedcluster that is being monitored by an instance of Unified Manager. This page enables you to assessthe overall performance of a specific cluster, and to quickly note, locate, or assign for resolutionany cluster-specific events that are identified.
Monitoring performance using the Performance Inventory pages on page 484The object inventory performance pages display performance information, performance events,and object health for all objects within an object type category. This provides you with an at-a-glance overview of the performance status of each object within a cluster, for example, for allnodes or all volumes.
Provisioning and managing workloads on page 312The active management feature of Active IQ Unified Manager provides Performance ServiceLevels, Storage Efficiency Policies, and storage provider APIs for provisioning, monitoring, andmanaging storage workloads in a data center.
Related tasksFixing issues using Unified Manager automatic remediations on page 57
36Monitoring and managing clusters from the dashboard
There are certain events that Unified Manager can diagnose thoroughly and provide a singleresolution using the Fix It button. When available, those resolutions are displayed in theDashboard, from the Event details page, and from the Workload Analysis selection on the left-navigation menu.
Displaying information about performance events on page 168You can use the Event Management inventory page to view a list of all the performance events onthe clusters being monitored by Unified Manager. By viewing this information you can determinethe most critical events and then drill down to detailed information to determine the cause of theevent.
Related referencePerformance event analysis and notification on page 597
Performance events notify you about I/O performance issues on a workload caused by contentionon a cluster component. Unified Manager analyzes the event to identify all workloads involved,the component in contention, and whether the event is still an issue that you might need to resolve.
Description of event severity types on page 66Each event is associated with a severity type to help you prioritize the events that requireimmediate corrective action.
37Monitoring and managing clusters from the dashboard

Troubleshooting workloads using the workload analyzer
The workload analyzer provides a way to view important health and performance criteria for asingle workload on a single page to assist in troubleshooting. By viewing all current and pastevents for a workload you can get a better idea why the workload may be having a performance orcapacity issue now.
Using this tool can also help you determine if storage is the cause of any performance issues for anapplication or if the issue is caused by a networking or other related issue.
You can initiate this functionality from a variety of places in the user interface:
• From the Workload Analysis selection on the left-navigation menu
• From the Event details page by clicking the Analyze Workload button
• From any workload inventory page (volume, LUN, workload, NFS share, or SMB/CIFS share),
by clicking the more icon , then Analyze Workload
• From the Virtual Machines page by clicking the Analyze Workload button from any Datastoreobject
When you launch the tool from the left-navigation menu, you can enter the name of any workloadthat you want to analyze and select the time range for which you want to troubleshoot. When youlaunch the tool from any of the workload or virtual machine inventory pages, the name of theworkload is filled in automatically, and the workload's data is presented with the default 2 hourtime range. When you launch the tool from the Event details page, the name of the workload isfilled in automatically, and the data of 10 days is displayed.
Related conceptsMonitoring virtual machines on page 308
For any latency issue on the virtual machine (VM) applications, you might need to monitor theVMs to analyze and troubleshoot the cause. The VMs are available when their vCenter Server andthe ONTAP clusters hosting the VM storage are added to Unified Manager.
Options for improving workload performance from the client-side on page 192You can check your client workloads, such as applications or databases, that are sending I/O tovolumes involved in a performance event to determine if a client-side change might correct theevent.
How storage QoS can control workload throughput on page 570You can create a Quality of Service (QoS) policy group to control the I/O per second (IOPS) orthroughput (MB/s) limit for the workloads it contains. If the workloads are in a policy group withno set limit, such as the default policy group, or the set limit does not meet your needs, you canincrease the limit or move the workloads to a new or existing policy group that has the desiredlimit.
Related tasksViewing volumes or LUNs that are in the same QoS policy group on page 572
You can display a list of the volumes and LUNs that have been assigned to the same QoS policygroup.
Viewing the QoS policy group settings applied to specific volumes or LUNs on page 573You can view the QoS policy groups that have been applied to your volumes and LUNs, and youcan link to the Performance/QoS Policy Groups view to display the detailed configuration settingsfor each QoS policy.
Viewing performance charts to compare volumes or LUNs that are in the same QoS policy groupon page 573
38Troubleshooting workloads using the workload analyzer

You can view the volumes and LUNs that are in the same QoS policy groups and then compare theperformance on a single IOPS, MB/s, or IOPS/TB chart to identify any issues.
What data does the workload analyzer displayThe workload analyzer page displays information about any current events that could be affectingthe workload, recommendations to potentially fix the issue causing the event, and charts foranalyzing performance and capacity history.
At the top of the page you specify the name of the workload (volume or LUN) that you want toanalyze and the timeframe over which you want to see statistics. You can change the timeframe atany point if you want to view a shorter or longer period of time.
The other areas of the page display the analysis results and the performance and capacity charts.
Note: Workload charts for LUNs do not provide the same level of statistics as those charts forvolumes, so you will notice differences when analyzing these two types of workloads.
Events summary area
Displays a brief overview of the number and types of events that have occurred over thetimeframe. When there are events from different impact areas (for example, performanceand capacity), this information is displayed so you can select details for the type of eventyou are interested in. Click the event type to view a list of the event names.
If there is only one event during the timeframe, then a list of recommendations to fix theissue is listed for some events.
Event Timeline
Shows all occurrences of events during the specified timeframe. Hover your cursor overeach event to view the event name.
If you arrived at this page by clicking the Analyze Workload button from the Event detailspage, the icon for the selected event appears larger so that you can identify the event.
Performance charts area
Displays charts for latency, throughput (both IOPS and MB/s), and utilization (for both thenode and aggregate) based on the timeframe you selected. You can click the Viewperformance details link to display the Performance Explorer page for the workload in caseyou want to perform further analysis.
• Latency displays the latency for the workload over the selected timeframe. The charthas three views that enable you to see:
◦ Total latency
◦ Breakdown latency (broken out by reads, writes, and other processes)
◦ Cluster Components latency (broken out by cluster component)
See Cluster components and why they can be in contention on page 600 for adescription of the cluster components that are displayed here.
• Throughput displays both IOPS and MB/s throughput for the workload over theselected timeframe. The chart has four views that enable you to see:
◦ Total throughput
◦ Breakdown throughput (broken out by reads, writes, and other processes)
◦ Cloud Throughput (the MB/s being used to write data to and read data from thecloud; for those workloads that are tiering capacity to the cloud)
◦ IOPS with Forecast (a prediction of what the upper and lower IOPS throughputvalues were expected to be over the timeframe)
39Troubleshooting workloads using the workload analyzer

This chart also displays Quality of Service (QoS) maximum and minimum throughputthreshold settings, if configured, so you can see where the system may be limiting thethroughput intentionally with QoS policies.
• Utilization displays utilization for both the aggregate and node on which the workloadis running over the selected timeframe. From here you can see if your aggregate or nodeare overutilized, possibly causing high latency. When analyzing FlexGroup volumesthere are multiple nodes and multiple aggregates listed on the utilization charts.
Capacity chart area
Displays charts for data capacity and Snapshot capacity for the past one month for theworkload.
For volumes, you can click the View capacity details link to display the Health Details pagefor the workload in case you want to perform further analysis. LUNs do not provide thislink because there is no Health Details page for LUNs.
• Capacity View displays the total available space allocated for the workload and thelogical used space (after all NetApp optimizations).
• Snapshot View displays the total space reserved for Snapshot copies, and the amount ofspace currently being used. Note that LUNs do not provide a Snapshot View.
• Cloud Tier View displays how much capacity is being used in the local performancetier and how much is being used in the cloud tier.
These charts include an estimate of the amount of time remaining before the capacity is fullfor this workload. This information is based on historical usage and requires a minimum of10 days of data. When less than 30 days of capacity remain, Unified Manager identifies thestorage as "almost full".
Related conceptsHow different types of QoS policies are displayed in the throughput charts on page 574
You can view the ONTAP-defined quality of service (QoS) policy settings that have been appliedto a volume or LUN in the Performance Explorer and Workload Analysis IOPS, IOPS/TB, andMB/s charts. The information displayed in the charts is different depending on the type of QoSpolicy that has been applied to the workload.
Related referenceLatency performance counter charts on page 540
The Latency counter charts display the number of milliseconds that are required for the selectedstorage object to respond to application requests.
IOPS performance counter charts on page 542The IOPS counter charts display the number of input/output operations processed per second bythe selected storage object.
MB/s performance counter charts on page 544The MB/s counter charts display the number of megabytes of data transferred to and from theselected object per second.
Utilization performance counter chart on page 545
40Troubleshooting workloads using the workload analyzer

The Utilization counter chart displays the average percentage of the selected resource that is beingused.
When would I use the workload analyzerYou would typically use the workload analyzer to troubleshoot a latency issue reported by a user,to more thoroughly analyze a reported event or alert, or to explore a workload that you see isoperating abnormally.
In the case where users have contacted you to say that the application they are using is runningvery slowly, you can check the latency, throughput, and utilization charts for the workload overwhich the application is running to see if storage is the cause of the performance issue. You canuse the capacity chart as well to see if capacity is low because an ONTAP system in whichcapacity is over 85% used can cause performance issues. These charts will help you determine ifthe issue is caused by storage or by a networking or other related issue.
In the case where Unified Manager has generated a performance event and you want to review thecause of the issue more thoroughly, you can launch the workload analyzer from the Event detailspage by clicking the Analyze Workload button to research some of the latency, throughput, andcapacity trends for the workload.
In the case where you notice a workload that appears to be operating abnormally when viewingany workload inventory page (volume, LUN, workload, NFS share, or SMB/CIFS share), you can
click the more icon , then Analyze Workload to open the Workload Analysis page to examinethe workload further.
Using the workload analyzerThere are many ways to start the workload analyzer from the user interface. Here we describelaunching the tool from the left-navigation pane.
Steps
1. In the left navigation pane, click Workload Analysis.The Workload Analysis page is displayed.
2. If you know the workload name, enter the name. If you are not sure of the full name, enter aminimum of 3 characters and the system displays a list of workloads that match the string.
3. Select the time range if you want to view statistics for longer than the default 2 hours and clickApply.
4. View the Summary area to see the events that have occurred during the timeframe.
5. View the performance and capacity charts to see when any of the metrics are abnormal and seeif any events align with the abnormal entry.
Related conceptsWhat the expected range of performance is on page 587
The latency forecast is a prediction of what the upper and lower performance values are expectedto be at a specific time. For the workload latency, the upper values form the performancethreshold. When the actual value crosses the performance threshold, Unified Manager triggers adynamic performance event.
How Unified Manager uses workload latency to identify performance issues on page 590
41Troubleshooting workloads using the workload analyzer

The workload latency (response time) is the time it takes for a volume on a cluster to respond toI/O requests from client applications. Unified Manager uses the latency to detect and alert you toperformance events.
Related referenceHow the latency forecast is used in performance analysis on page 588
Unified Manager uses the latency forecast to represent the typical I/O latency (response time)activity for your monitored workloads. It alerts you when the actual latency for a workload isabove the upper bounds of the latency forecast, which triggers a dynamic performance event, sothat you can analyze the performance issue and take corrective action for resolving it.
42Troubleshooting workloads using the workload analyzer

Managing events
Events help you to identify issues in the clusters that are monitored.
What health events areHealth events are notifications that are generated automatically when a predefined conditionoccurs or when an object crosses a health threshold. These events enable you to take action toprevent issues that can lead to poor performance and system unavailability. Events include animpact area, severity, and impact level.
Health events are categorized by the type of impact area such as availability, capacity,configuration, or protection. Events are also assigned a severity type and impact level that assistyou in determining if immediate action is required.
You can configure alerts to send notification automatically when specific events or events of aspecific severity occur.
Obsolete, resolved, and informational events are automatically logged and retained for a default of180 days.
It is important that you take immediate corrective action for events with severity level Error orCritical.
Related conceptsWhat alerts are on page 118
While events occur continuously, the Unified Manager generates an alert only when an eventmeets specified filter criteria. You can choose the events for which alerts should be generated—forexample, when a space threshold is exceeded or an object goes offline. You can also associate analert with a script that is executed when an alert is triggered.
What performance events are on page 44Performance events are incidents related to workload performance on a cluster. They help youidentify workloads with slow response times. Together with health events that occurred at the sametime, you can determine the issues that might have caused, or contributed to, the slow responsetimes.
What Event Management System events are on page 49The Event Management System (EMS) collects event data from different parts of the ONTAPkernel and provides event forwarding mechanisms. These ONTAP events can be reported as EMSevents in Unified Manager. Centralized monitoring and management eases configuration of criticalEMS events and alert notifications based on these EMS events.
Event state definitions on page 65The state of an event helps you identify whether an appropriate corrective action is required. Anevent can be New, Acknowledged, Resolved, or Obsolete. Note that both New and Acknowledgedevents are considered to be active events.
Related referenceDescription of event severity types on page 66
Each event is associated with a severity type to help you prioritize the events that requireimmediate corrective action.
Description of event impact levels on page 67Each event is associated with an impact level (Incident, Risk, Event, or Upgrade) to help youprioritize the events that require immediate corrective action.
Description of event impact areas on page 67
43Managing events

Events are categorized into six impact areas (availability, capacity, configuration, performance,protection, and security) to enable you to concentrate on the types of events for which you areresponsible.
What performance events arePerformance events are incidents related to workload performance on a cluster. They help youidentify workloads with slow response times. Together with health events that occurred at the sametime, you can determine the issues that might have caused, or contributed to, the slow responsetimes.
When Unified Manager detects multiple occurrences of the same event condition for the samecluster component, it treats all occurrences as a single event, not as separate events.
Related conceptsWhat alerts are on page 118
While events occur continuously, the Unified Manager generates an alert only when an eventmeets specified filter criteria. You can choose the events for which alerts should be generated—forexample, when a space threshold is exceeded or an object goes offline. You can also associate analert with a script that is executed when an alert is triggered.
What health events are on page 43Health events are notifications that are generated automatically when a predefined conditionoccurs or when an object crosses a health threshold. These events enable you to take action toprevent issues that can lead to poor performance and system unavailability. Events include animpact area, severity, and impact level.
Event state definitions on page 65The state of an event helps you identify whether an appropriate corrective action is required. Anevent can be New, Acknowledged, Resolved, or Obsolete. Note that both New and Acknowledgedevents are considered to be active events.
What the expected range of performance is on page 587The latency forecast is a prediction of what the upper and lower performance values are expectedto be at a specific time. For the workload latency, the upper values form the performancethreshold. When the actual value crosses the performance threshold, Unified Manager triggers adynamic performance event.
Configuration changes detected by Unified Manager on page 70Unified Manager monitors your clusters for configuration changes to help you determine whethera change might have caused or contributed to a performance event. The Performance Explorer
pages display a change event icon ( ) to indicate the date and time when the change wasdetected.
Roles of workloads involved in a performance event on page 603Unified Manager uses roles to identify the involvement of a workload in a performance event. Theroles include victims, bullies, and sharks. A user-defined workload can be a victim, bully, andshark at the same time.
Types of workloads monitored by Unified Manager on page 584You can use Unified Manager to monitor the performance of two types of workloads: user-definedand system-defined.
Related tasksDisplaying information about performance events on page 168
You can use the Event Management inventory page to view a list of all the performance events onthe clusters being monitored by Unified Manager. By viewing this information you can determine
44Managing events
the most critical events and then drill down to detailed information to determine the cause of theevent.
Related referenceDescription of event severity types on page 66
Each event is associated with a severity type to help you prioritize the events that requireimmediate corrective action.
Description of event impact levels on page 67Each event is associated with an impact level (Incident, Risk, Event, or Upgrade) to help youprioritize the events that require immediate corrective action.
Description of event impact areas on page 67Events are categorized into six impact areas (availability, capacity, configuration, performance,protection, and security) to enable you to concentrate on the types of events for which you areresponsible.
Performance event analysis and notification on page 597Performance events notify you about I/O performance issues on a workload caused by contentionon a cluster component. Unified Manager analyzes the event to identify all workloads involved,the component in contention, and whether the event is still an issue that you might need to resolve.
Sources of performance eventsPerformance events are issues related to workload performance on a cluster. They help youidentify storage objects with slow response times, also known as high latency. Together with otherhealth events that occurred at the same time, you can determine the issues that might have caused,or contributed to, the slow response times.
Unified Manager receives performance events from the following sources:
User-defined performance threshold policy events
Performance issues based on custom threshold values that you have set. You configureperformance threshold policies for storage objects; for example, aggregates and volumes, sothat events are generated when a threshold value for a performance counter has beenbreached.
You must define a performance threshold policy and assign it to a storage object to receivethese events.
System-defined performance threshold policy events
Performance issues based on threshold values that are system-defined. These thresholdpolicies are included with the installation of Unified Manager to cover commonperformance problems.
These threshold policies are enabled by default, and you might see events shortly afteradding a cluster.
Dynamic performance threshold events
Performance issues that are the result of failures or errors in an IT infrastructure, or fromworkloads overutilizing cluster resources. The cause of these events might be a simple issuethat corrects itself over a period of time or that can be addressed with a repair orconfiguration change. A dynamic threshold event indicates that the workloads on anONTAP system are slow due to other workloads with high usage of shared clustercomponents.
These thresholds are enabled by default, and you might see events after three days ofcollecting data from a new cluster.
Related conceptsManaging performance thresholds on page 152
45Managing events

Performance threshold policies enable you to determine the point at which Unified Managergenerates an event to inform system administrators about issues that could be impacting workloadperformance. These threshold policies are known as user-defined performance thresholds.
Related tasksDisabling unwanted events on page 56
All events are enabled by default. You can disable events globally to prevent the generation ofnotifications for events that are not important in your environment. You can enable events that aredisabled when you want to resume receiving notifications for them.
Types of system-defined performance threshold policiesUnified Manager provides some standard threshold policies that monitor cluster performance andgenerate events automatically. These policies are enabled by default, and they generate warning orinformation events when the monitored performance thresholds are breached.
Note: System-defined performance threshold policies are not enabled on Cloud VolumesONTAP, ONTAP Edge, or ONTAP Select systems.
If you are receiving unnecessary events from any system-defined performance threshold policies,you can disable the events for individual policies from the Event Setup page.
Cluster threshold policies
The system-defined cluster performance threshold policies are assigned, by default, to everycluster being monitored by Unified Manager:
Cluster load imbalance
Identifies situations in which one node is operating at a much higher load than other nodesin the cluster, and therefore potentially affecting workload latencies.
It does this by comparing the performance capacity used value for all nodes in the cluster tosee if there is a load difference of 30% between any nodes. This is a warning event.
Cluster capacity imbalance
Identifies situations in which one aggregate has a much higher used capacity than otheraggregates in the cluster, and therefore potentially affecting space required for operations.
It does this by comparing the used capacity value for all aggregates in the cluster to see ifthere is a difference of 70% between any aggregates. This is a warning event.
Node threshold policies
The system-defined node performance threshold policies are assigned, by default, to every node inthe clusters being monitored by Unified Manager:
Performance Capacity Used Threshold Breached
Identifies situations in which a single node is operating above the bounds of its operationalefficiency, and therefore potentially affecting workload latencies.
It does this by looking for nodes that are using more than 100% of their performancecapacity for more than 12 hours. This is a warning event.
Node HA pair over-utilized
Identifies situations in which nodes in an HA pair are operating above the bounds of the HApair operational efficiency.
It does this by looking at the performance capacity used value for the two nodes in the HApair. If the combined performance capacity used of the two nodes exceeds 200% for morethan 12 hours, then a controller failover will impact workload latencies. This is aninformational event.
46Managing events

Node disk fragmentation
Identifies situations in which a disk or disks in an aggregate are fragmented, slowing keysystem services and potentially affecting workload latencies on a node.
It does this by looking at certain read and write operation ratios across all aggregates on anode. This policy might also be triggered during SyncMirror resynchronization or whenerrors are found during disk scrub operations. This is a warning event.
Note: The "Node disk fragmentation" policy analyzes HDD-only aggregates; Flash Pool,SSD, and FabricPool aggregates are not analyzed.
Aggregate threshold policies
The system-defined aggregate performance threshold policy is assigned by default to everyaggregate in the clusters being monitored by Unified Manager:
Aggregate disks over-utilized
Identifies situations in which an aggregate is operating above the limits of its operationalefficiency, thereby potentially affecting workload latencies. It identifies these situations bylooking for aggregates where the disks in the aggregate are more than 95% utilized for morethan 30 minutes. This multicondition policy then performs the following analysis to helpdetermine the cause of the issue:
• Is a disk in the aggregate currently undergoing background maintenance activity?
Some of the background maintenance activities a disk could be undergoing are diskreconstruction, disk scrub, SyncMirror resynchronization, and reparity.
• Is there a communications bottleneck in the disk shelf Fibre Channel interconnect?
• Is there too little free space in the aggregate?
A warning event is issued for this policy only if one (or more) of the three subordinatepolicies are also considered breached. A performance event is not triggered if only the disksin the aggregate are more than 95% utilized.
Note: The "Aggregate disks over-utilized" policy analyzes HDD-only aggregates and FlashPool (hybrid) aggregates; SSD and FabricPool aggregates are not analyzed.
Workload latency threshold policies
The system-defined workload latency threshold policies are assigned to any workload that has aconfigured Performance Service Level policy that has a defined "expected latency" value:
Workload Volume/LUN Latency Threshold Breached as defined by Performance Service Level
Identifies volumes (file shares) and LUNs that have exceeded their "expected latency" limit,and that are affecting workload performance. This is a warning event.
It does this by looking for workloads that have exceeded the expected latency value for 30%of the time during the previous hour.
QoS threshold policies
The system-defined QoS performance threshold policies are assigned to any workload that has aconfigured ONTAP QoS maximum throughput policy (IOPS, IOPS/TB, or MB/s). UnifiedManager triggers an event when the workload throughput value is 15% less than the configuredQoS value:
QoS Max IOPS or MB/s threshold
Identifies volumes and LUNs that have exceeded their QoS maximum IOPS or MB/sthroughput limit, and that are affecting workload latency. This is a warning event.
47Managing events

When a single workload is assigned to a policy group, it does this by looking for workloadsthat have exceeded the maximum throughput threshold defined in the assigned QoS policygroup during each collection period for the previous hour.
When multiple workloads share a single QoS policy, it does this by adding the IOPS orMB/s of all workloads in the policy and checking that total against the threshold.
QoS Peak IOPS/TB or IOPS/TB with Block Size threshold
Identifies volumes that have exceeded their adaptive QoS peak IOPS/TB throughput limit(or IOPS/TB with Block Size limit), and that are affecting workload latency. This is awarning event.
It does this by converting the peak IOPS/TB threshold defined in the adaptive QoS policyinto a QoS maximum IOPS value based on the size of each volume, and then it looks forvolumes that have exceeded the QoS max IOPS during each performance collection periodfor the previous hour.
Note: This policy is applied to volumes only when the cluster is installed with ONTAP9.3 and later software.
When the "block size" element has been defined in the adaptive QoS policy, the threshold isconverted into a QoS maximum MB/s value based on the size of each volume. Then it looksfor volumes that have exceeded the QoS max MB/s during each performance collectionperiod for the previous hour.
Note: This policy is applied to volumes only when the cluster is installed with ONTAP9.5 and later software.
Related conceptsUnderstanding events from adaptive QoS policies that have a defined block size on page 173
Adaptive QoS policy groups automatically scale a throughput ceiling or floor based on the volumesize, maintaining the ratio of IOPS to TBs as the size of the volume changes. Starting withONTAP 9.5 you can specify the block size in the QoS policy to effectively apply a MB/s thresholdat the same time.
Related tasksDisabling unwanted events on page 56
All events are enabled by default. You can disable events globally to prevent the generation ofnotifications for events that are not important in your environment. You can enable events that aredisabled when you want to resume receiving notifications for them.
What Active IQ platform events areUnified Manager can display events that have been discovered by the Active IQ platform. Theseevents are created by running a set of rules against AutoSupport messages generated from allstorage systems being monitored by Unified Manager.
Unified Manager checks for a new rules file automatically and only downloads a new file whenthere are newer rules. In sites with no external network access, you need to upload the rulesmanually from Storage Management > Event Setup > Upload Rules.
These Active IQ events do not overlap with existing Unified Manager events, and they identifyincidents or risks concerning system configuration, cabling, best practice, and availability issues.
NetApp Active IQ is a cloud based service that provides predictive analytics and proactive supportto optimize storage system operations across the NetApp hybrid cloud. See NetApp Active IQ formore information.
Related conceptsWhat security criteria is being evaluated on page 295
48Managing events

In general, security criteria for your ONTAP clusters, storage virtual machines (SVMs), andvolumes are being evaluated against the recommendations defined in the NetApp SecurityHardening Guide for ONTAP 9.
How Active IQ platform events are generated on page 60Active IQ platform incidents and risks are converted to Unified Manager events as shown in thefollowing diagram.
Related tasksEnabling and disabling Active IQ event reporting on page 58
Active IQ platform events are generated and displayed in the Unified Manager user interface bydefault. If you find that these events are too "noisy", or that you do not want to view these eventsin Unified Manager, then you can disable these events from being generated. You can enable themat a later time if you want to resume receiving these notifications.
What Event Management System events areThe Event Management System (EMS) collects event data from different parts of the ONTAPkernel and provides event forwarding mechanisms. These ONTAP events can be reported as EMSevents in Unified Manager. Centralized monitoring and management eases configuration of criticalEMS events and alert notifications based on these EMS events.
The Unified Manager address is added as a notification destination to the cluster when you add thecluster to Unified Manager. An EMS event is reported as soon as the event occurs in the cluster.
There are two methods for receiving EMS events in Unified Manager:
• A certain number of important EMS events are reported automatically.
• You can subscribe to receive individual EMS events.
The EMS events that are generated by Unified Manager are reported differently depending on themethod in which the event was generated:
Functionality Automatic EMS messages Subscribed EMS messages
Available EMS events Subset of EMS events All EMS events
EMS message name whentriggered
Unified Manager event name(converted from EMS event name)
Non-specific in the format "Error EMSreceived". The detailed message providesthe dot-notation format of the actual EMSevent
Messages received As soon as the cluster has beendiscovered
After adding each required EMS event toUnified Manager, and after the next 15minute polling cycle
Event life cycle Same as other Unified Manager events:New, Acknowledged, Resolved, andObsolete states
The EMS event is made obsolete after thecluster is refreshed, after 15 minutes, fromwhen the event was created
Captures events duringUnified Manager downtime
Yes, when the system starts up itcommunicates with each cluster toacquire missing events
No
Event details Suggested corrective actions areimported directly from ONTAP toprovide consistent resolutions
Corrective actions not available in EventDetails page
Note: Some of the new automatic EMS events are Informational events that indicate that aprevious event has been resolved. For example, the "FlexGroup Constituents Space Status All
49Managing events

OK" Informational event indicates that the "FlexGroup Constituents Have Space Issues" Errorevent has been resolved. Informational events cannot be managed using the same event lifecycle as other event severity types, however, the event is obsoleted automatically if the samevolume receives another "Space Issues" Error event.
EMS events that are added automatically to Unified ManagerThe following ONTAP EMS events are added automatically to Unified Manager. These eventswill be generated when triggered on any cluster that Unified Manager is monitoring.
The following EMS events are available when monitoring clusters running ONTAP 9.5 or greatersoftware:
Unified Manager Event name EMS Event name Affected resource Unified Managerseverity
Cloud Tier Access Denied forAggregate Relocation
arl.netra.ca.check.failed Aggregate Error
Cloud Tier Access Denied forAggregate Relocation DuringStorage Failover
gb.netra.ca.check.failed Aggregate Error
FabricPool Mirror ReplicationResync Completed
wafl.ca.resync.complete Cluster Error
FabricPool Space Nearly Full fabricpool.nearly.full Cluster Error
NVMe-oF Grace Period Started nvmf.graceperiod.start Cluster Warning
NVMe-oF Grace Period Active nvmf.graceperiod.active Cluster Warning
NVMe-oF Grace Period Expired nvmf.graceperiod.expired Cluster Warning
LUN Destroyed lun.destroy LUN Information
Cloud AWS MetaDataConnFail cloud.aws.metadataConnFail Node Error
Cloud AWS IAMCredsExpired cloud.aws.iamCredsExpired Node Error
Cloud AWS IAMCredsInvalid cloud.aws.iamCredsInvalid Node Error
Cloud AWS IAMCredsNotFound cloud.aws.iamCredsNotFound Node Error
Cloud AWSIAMCredsNotInitialized
cloud.aws.iamNotInitialized Node Information
Cloud AWS IAMRoleInvalid cloud.aws.iamRoleInvalid Node Error
Cloud AWS IAMRoleNotFound cloud.aws.iamRoleNotFound Node Error
Cloud Tier Host Unresolvable objstore.host.unresolvable Node Error
Cloud Tier Intercluster LIF Down objstore.interclusterlifDown Node Error
Request Mismatch Cloud TierSignature
osc.signatureMismatch Node Error
One of NFSv4 Pools Exhausted Nblade.nfsV4PoolExhaust Node Critical
QoS Monitor Memory Maxed qos.monitor.memory.maxed Node Error
QoS Monitor Memory Abated qos.monitor.memory.abated Node Information
NVMeNS Destroy NVMeNS.destroy Namespace Information
50Managing events

Unified Manager Event name EMS Event name Affected resource Unified Managerseverity
NVMeNS Online NVMeNS.offline Namespace Information
NVMeNS Offline NVMeNS.online Namespace Information
NVMeNS Out of Space NVMeNS.out.of.space Namespace Warning
Synchronous Replication Out OfSync
sms.status.out.of.sync SnapMirrorrelationship
Warning
Synchronous Replication Restored sms.status.in.sync SnapMirrorrelationship
Information
Synchronous Replication AutoResync Failed
sms.resync.attempt.failed SnapMirrorrelationship
Error
Many CIFS Connections Nblade.cifsManyAuths SVM Error
Max CIFS Connection Exceeded Nblade.cifsMaxOpenSameFile SVM Error
Max Number of CIFS ConnectionPer User Exceeded
Nblade.cifsMaxSessPerUsrConn SVM Error
CIFS NetBIOS Name Conflict Nblade.cifsNbNameConflict SVM Error
Attempts to Connect NonexistentCIFS Share
Nblade.cifsNoPrivShare SVM Critical
CIFS Shadow Copy OperationFailed
cifs.shadowcopy.failure SVM Error
Virus Found By AV Server Nblade.vscanVirusDetected SVM Error
No AV Server Connection for VirusScan
Nblade.vscanNoScannerConn SVM Critical
No AV Server Registered Nblade.vscanNoRegdScanner SVM Error
No Responsive AV ServerConnection
Nblade.vscanConnInactive SVM Information
AV Server too Busy to Accept NewScan Request
Nblade.vscanConnBackPressure SVM Error
Unauthorized User Attempt to AVServer
Nblade.vscanBadUserPrivAccess SVM Error
FlexGroup Constituents Have SpaceIssues
flexgroup.constituents.have.space.issues
Volume Error
FlexGroup Constituents Space StatusAll OK
flexgroup.constituents.space.status.all.ok
Volume Information
FlexGroup Constituents Have InodesIssues
flexgroup.constituents.have.inodes.issues
Volume Error
FlexGroup Constituents InodesStatus All OK
flexgroup.constituents.inodes.status.all.ok
Volume Information
Volume Logical Space Nearly Full monitor.vol.nearFull.inc.sav Volume Warning
Volume Logical Space Full monitor.vol.full.inc.sav Volume Error
51Managing events

Unified Manager Event name EMS Event name Affected resource Unified Managerseverity
Volume Logical Space Normal monitor.vol.one.ok.inc.sav Volume Information
WAFL Volume AutoSize Fail wafl.vol.autoSize.fail Volume Error
WAFL Volume AutoSize Done wafl.vol.autoSize.done Volume Information
WAFL READDIR File OperationTimeout
wafl.readdir.expired Volume Error
What happens when an event is receivedWhen Unified Manager receives an event, it is displayed in the Dashboard page, in the EventManagement inventory page, in the Summary and Explorer tabs of the Cluster/Performance page,and in the object-specific inventory page (for example, the Volumes/Health inventory page).
When Unified Manager detects multiple continuous occurrences of the same event condition forthe same cluster component, it treats all occurrences as a single event, not as separate events. Theduration of the event is incremented to indicate that the event is still active.
Depending on how you configure settings in the Alert Setup page, you can notify other users aboutthese events. The alert causes the following actions to be initiated:
• An email about the event can be sent to all Unified Manager Administrator users.
• The event can be sent to additional email recipients.
• An SNMP trap can be sent to the trap receiver.
• A custom script can be executed to perform an action.
This workflow is shown in the following diagram.
52Managing events

Configuring event notification settingsYou can configure Unified Manager to send alert notifications when an event is generated or whenan event is assigned to a user. You can configure the SMTP server that is used to send the alert,and you can set various notification mechanisms—for example, alert notifications can be sent asemails or SNMP traps.
Before you begin
You must have the following information:
• Email address from which the alert notification is sent
The email address appears in the "From" field in sent alert notifications. If the email cannot bedelivered for any reason, this email address is also used as the recipient for undeliverable mail.
• SMTP server host name, and the user name and password to access the server
• Host name or IP address for the trap destination host that will receive the SNMP trap, alongwith the SNMP version, outbound trap port, community, and other required SNMPconfiguration values
To specify multiple trap destinations, separate each host with a comma. In this case, all otherSNMP settings, such as version and outbound trap port, must be the same for all hosts in thelist.
You must have the Application Administrator or Storage Administrator role.
Steps
1. In the left navigation pane, click General > Notifications.
2. In the Notifications page, configure the appropriate settings and click Save.
Notes:
• If the From Address is pre-filled with the address"[email protected]", you should change it to a real, working emailaddress to make sure that all email notifications are delivered successfully.
• If the host name of the SMTP server cannot be resolved, you can specify the IP address(IPv4 or IPv6) of the SMTP server instead of the host name.
Related tasksConfiguring event retention settings on page 62
You can specify the number of months an event is retained in the Unified Manager server before itis automatically deleted.
Adding alerts on page 119You can configure alerts to notify you when a particular event is generated. You can configurealerts for a single resource, for a group of resources, or for events of a particular severity type. Youcan specify the frequency with which you want to be notified and associate a script to the alert.
Adding users on page 625You can add local users or database users by using the Users page. You can also add remote usersor groups that belong to an authentication server. You can assign roles to these users and, based on
53Managing events
the privileges of the roles, users can manage the storage objects and data with Unified Manager, orview the data in a database.
Viewing events and event detailsYou can view details about an event that is triggered by Unified Manager to take corrective action.For example, if there is a health event Volume Offline, you can click that event to view the detailsand perform corrective actions.
Before you begin
You must have the Operator, Application Administrator, or Storage Administrator role.
About this task
The event details include information such as the source of the event, cause of the event, and anynotes related to the event.
Steps
1. In the left navigation pane, click Event Management.By default, the All active events view displays the New and Acknowledged (active) events thathave been generated over the previous 7 days that have an Impact Level of Incident or Risk.
2. If you want to view a particular category of events, for example, capacity events orperformance events, click View and select from the menu of event types.
3. Click the event name for which you want to view the details.The event details are displayed in the Event details page.
Related tasksAssigning events to specific users on page 56
You can assign unassigned events to yourself or to other users, including remote users. You canreassign assigned events to another user, if required. For example, when frequent issues occur on astorage object, you can assign the events for these issues to the user who manages that object.
Adding alerts on page 119You can configure alerts to notify you when a particular event is generated. You can configurealerts for a single resource, for a group of resources, or for events of a particular severity type. Youcan specify the frequency with which you want to be notified and associate a script to the alert.
Acknowledging and resolving events on page 55You should acknowledge an event before you start working on the issue that generated the event sothat you do not continue to receive repeat alert notifications. After you take corrective action for aparticular event, you should mark the event as resolved.
Viewing unassigned eventsYou can view unassigned events and then assign each of them to a user who can resolve them.
Before you begin
You must have the Operator, Application Administrator, or Storage Administrator role.
Steps
1. In the left navigation pane, click Event Management.
By default, New and Acknowledged events are displayed on the Event Management inventorypage.
2. From the Filters pane, select the Unassigned filter option in the Assigned To area.
54Managing events

Related tasksAdding users on page 625
You can add local users or database users by using the Users page. You can also add remote usersor groups that belong to an authentication server. You can assign roles to these users and, based onthe privileges of the roles, users can manage the storage objects and data with Unified Manager, orview the data in a database.
Assigning events to specific users on page 56You can assign unassigned events to yourself or to other users, including remote users. You canreassign assigned events to another user, if required. For example, when frequent issues occur on astorage object, you can assign the events for these issues to the user who manages that object.
Acknowledging and resolving eventsYou should acknowledge an event before you start working on the issue that generated the event sothat you do not continue to receive repeat alert notifications. After you take corrective action for aparticular event, you should mark the event as resolved.
Before you begin
You must have the Operator, Application Administrator, or Storage Administrator role.
About this task
You can acknowledge and resolve multiple events simultaneously.
Note: You cannot acknowledge Information events.
Steps
1. In the left navigation pane, click Event Management.
2. From the events list, perform the following actions to acknowledge the events:
If you want to... Do this...
Acknowledge and mark a singleevent as resolved
a. Click the event name.
b. From the Event details page, determine the cause of the event.
c. Click Acknowledge.
d. Take appropriate corrective action.
e. Click Mark As Resolved.
Acknowledge and mark multipleevents as resolved
a. Determine the cause of the events from the respective Event details page.
b. Select the events.
c. Click Acknowledge.
d. Take appropriate corrective actions.
e. Click Mark As Resolved.
After the event is marked resolved, the event is moved to the resolved events list.
3. Optional: In the Notes and Updates area, add a note about how you addressed the event, andthen click Post.
Related tasksAdding users on page 625
You can add local users or database users by using the Users page. You can also add remote usersor groups that belong to an authentication server. You can assign roles to these users and, based on
55Managing events

the privileges of the roles, users can manage the storage objects and data with Unified Manager, orview the data in a database.
Assigning events to specific usersYou can assign unassigned events to yourself or to other users, including remote users. You canreassign assigned events to another user, if required. For example, when frequent issues occur on astorage object, you can assign the events for these issues to the user who manages that object.
Before you begin
• The user's name and email ID must be configured correctly.
• You must have the Operator, Application Administrator, or Storage Administrator role.
Steps
1. In the left navigation pane, click Event Management.
2. In the Event Management inventory page, select one or more events that you want to assign.
3. Assign the event by choosing one of the following options:
If you want to assign the eventto...
Then do this...
Yourself Click Assign To > Me.
Another user a. Click Assign To > Another user.
b. In the Assign Owner dialog box, enter the user name, or select a user fromthe drop-down list.
c. Click Assign.
An email notification is sent to the user.
Note: If you do not enter a user name or select a user from the drop-downlist, and click Assign, the event remains unassigned.
Related tasksAdding users on page 625
You can add local users or database users by using the Users page. You can also add remote usersor groups that belong to an authentication server. You can assign roles to these users and, based onthe privileges of the roles, users can manage the storage objects and data with Unified Manager, orview the data in a database.
Disabling unwanted eventsAll events are enabled by default. You can disable events globally to prevent the generation ofnotifications for events that are not important in your environment. You can enable events that aredisabled when you want to resume receiving notifications for them.
Before you begin
You must have the Application Administrator or Storage Administrator role.
About this task
When you disable events, the previously generated events in the system are marked obsolete, andthe alerts that are configured for these events are not triggered. When you enable events that aredisabled, the notifications for these events are generated starting with the next monitoring cycle.
When you disable an event for an object (for example, the vol offline event), and then lateryou enable the event, Unified Manager does not generate new events for objects that went offline
56Managing events

when the event was in the disabled state. Unified Manager generates a new event only when thereis a change in the object state after the event was re-enabled.
Steps
1. In the left navigation pane, click Storage Management > Event Setup.
2. In the Event Setup page, disable or enable events by choosing one of the following options:
If you want to... Then do this...
Disable events a. Click Disable.
b. In the Disable Events dialog box, select the event severity.
c. In the Matching Events column, select the events that you want to disablebased on the event severity, and then click the right arrow to move thoseevents to the Disable Events column.
d. Click Save and Close.
e. Verify that the events that you disabled are displayed in the list view of theEvent Setup page.
Enable events a. Select the check box for the event, or events, that you want to enable.
b. Click Enable.
Related tasksEnabling and disabling Active IQ event reporting on page 58
Active IQ platform events are generated and displayed in the Unified Manager user interface bydefault. If you find that these events are too "noisy", or that you do not want to view these eventsin Unified Manager, then you can disable these events from being generated. You can enable themat a later time if you want to resume receiving these notifications.
Related referenceTypes of system-defined performance threshold policies on page 46
Unified Manager provides some standard threshold policies that monitor cluster performance andgenerate events automatically. These policies are enabled by default, and they generate warning orinformation events when the monitored performance thresholds are breached.
List of events and severity types on page 71You can use the list of events to become more familiar with event categories, event names, and theseverity type of each event that you might see in Unified Manager. Events are listed in alphabeticalorder by object category.
Fixing issues using Unified Manager automatic remediationsThere are certain events that Unified Manager can diagnose thoroughly and provide a singleresolution using the Fix It button. When available, those resolutions are displayed in theDashboard, from the Event details page, and from the Workload Analysis selection on the left-navigation menu.
About this task
Most events have a variety of possible resolutions that are displayed in the Event details page soyou can implement the best solution using ONTAP System Manager or the ONTAP CLI. A Fix Itaction is available when Unified Manager has determined that there is a single resolution to fix theissue, and that it can be resolved using an ONTAP CLI command.
Steps
1. To view events that can be fixed from the Dashboard, click Dashboard.
57Managing events

2. To resolve any of the issues that Unified Manager can fix, click the Fix It button. To fix anissue that exists on multiple objects, click the Fix All button.
Enabling and disabling Active IQ event reportingActive IQ platform events are generated and displayed in the Unified Manager user interface bydefault. If you find that these events are too "noisy", or that you do not want to view these eventsin Unified Manager, then you can disable these events from being generated. You can enable themat a later time if you want to resume receiving these notifications.
Before you begin
You must have the Application Administrator role.
About this task
When you disable this feature, Unified Manager stops receiving Active IQ platform eventsimmediately.
When you enable this feature, Unified Manager starts receiving Active IQ platform events shortlyafter midnight based on the timezone of the cluster. The start time is based on when UnifiedManager receives AutoSupport messages from each cluster.
Steps
1. In the left navigation pane, click General > Feature Settings.
2. In the Feature Settings page, disable or enable Active IQ platform events by choosing one ofthe following options:
If you want to... Then do this...
Disable Active IQ platformevents
In the Active IQ Portal Events panel, move the slider button to the left.
Enable Active IQ platform events In the Active IQ Portal Events panel, move the slider button to the right.
Related conceptsWhat Active IQ platform events are on page 48
58Managing events

Unified Manager can display events that have been discovered by the Active IQ platform. Theseevents are created by running a set of rules against AutoSupport messages generated from allstorage systems being monitored by Unified Manager.
Related tasksDisabling unwanted events on page 56
All events are enabled by default. You can disable events globally to prevent the generation ofnotifications for events that are not important in your environment. You can enable events that aredisabled when you want to resume receiving notifications for them.
Uploading a new Active IQ rules fileUnified Manager checks for a new Active IQ rules file automatically and downloads a new filewhen there are newer rules. However, in sites with no external network access, you need to uploadthe rules file manually.
Before you begin
• Active IQ event reporting must be enabled.
• You must download the rules file from the NetApp Support Site.
About this task
It is recommended that you download a new rules file approximately once a month to make sureyour storage systems are being protected and that they are running optimally. The rules file islocated at: http://mysupport.netapp.com/NOW/public/unified_manager/bin/secure_rules.zip
Steps
1. On a computer that has network access, navigate to the NetApp Support Site and download thecurrent rules .zip file.
2. Transfer the rules file to some media that you can bring into the secure area and then copy itonto a system in the secure area.
3. In the left navigation pane, click Storage Management > Event Setup.
4. In the Event Setup page, click the Upload Rules button.
5. In the Upload Rules dialog box, navigate to and select the rules .zip file you downloaded andclick Upload.
This process can take a few minutes.
Result
The rules file is unzipped on the Unified Manager server. After your managed clusters generate anAutoSupport file after midnight Unified Manager will check the clusters against the rules file andgenerate new risk and incident events if required.
59Managing events
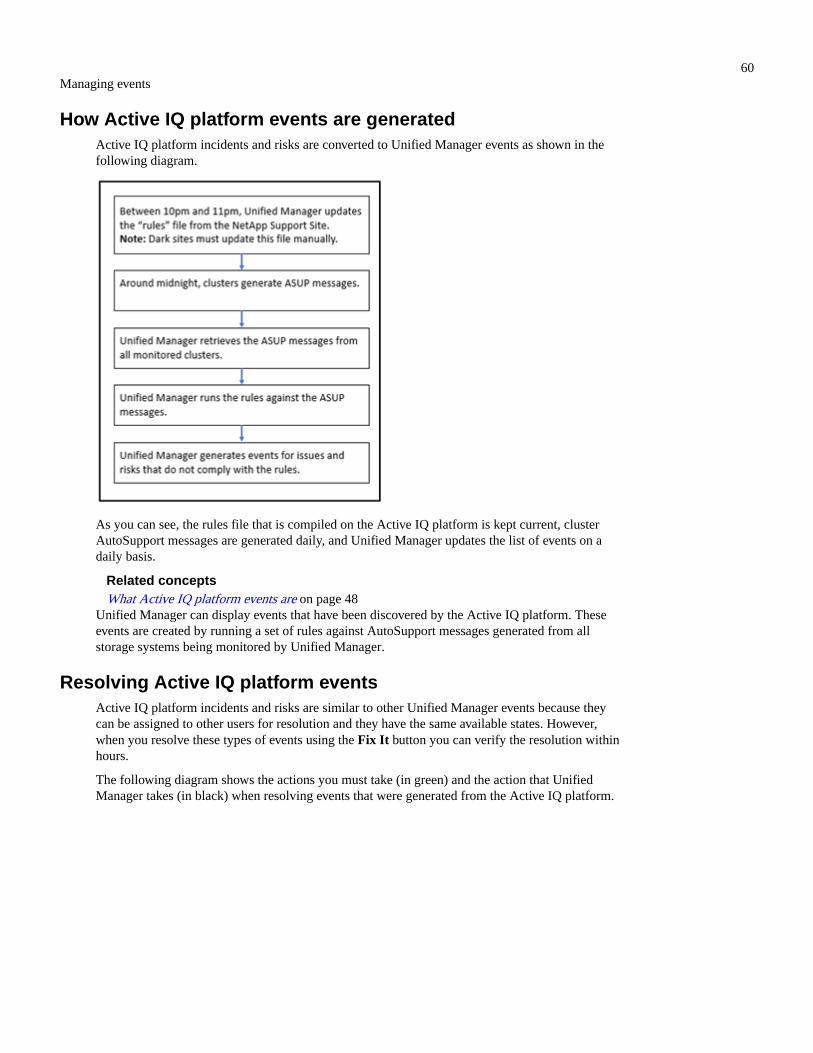
How Active IQ platform events are generatedActive IQ platform incidents and risks are converted to Unified Manager events as shown in thefollowing diagram.
As you can see, the rules file that is compiled on the Active IQ platform is kept current, clusterAutoSupport messages are generated daily, and Unified Manager updates the list of events on adaily basis.
Related conceptsWhat Active IQ platform events are on page 48
Unified Manager can display events that have been discovered by the Active IQ platform. Theseevents are created by running a set of rules against AutoSupport messages generated from allstorage systems being monitored by Unified Manager.
Resolving Active IQ platform eventsActive IQ platform incidents and risks are similar to other Unified Manager events because theycan be assigned to other users for resolution and they have the same available states. However,when you resolve these types of events using the Fix It button you can verify the resolution withinhours.
The following diagram shows the actions you must take (in green) and the action that UnifiedManager takes (in black) when resolving events that were generated from the Active IQ platform.
60Managing events

When performing a manual resolution you must log into System Manager or the ONTAPcommand-line interface to fix the issue. You will be able to verify the issue only after the clustergenerates a new AutoSupport message at midnight.
When performing a semi-automatic resolution using the Fix It button you are able to verify thatthe fix was successful within hours.
Subscribing to ONTAP EMS eventsYou can subscribe to receive Event Management System (EMS) events that are generated bysystems that are installed with ONTAP software. A subset of EMS events are reported to UnifiedManager automatically, but additional EMS events are reported only if you have subscribed tothese events.
Before you begin
Do not subscribe to EMS events that are already added to Unified Manager automatically as thiscan cause confusion when receiving two events for the same issue.
About this task
You can subscribe to any number of EMS events. All the events to which you subscribe arevalidated, and only the validated events are applied to the clusters you are monitoring in UnifiedManager. The ONTAP 9 EMS Event Catalog provides detailed information for all of the EMSmessages for the specified version of ONTAP 9 software. Locate the appropriate version of theEMS Event Catalog from the ONTAP 9 Product Documentation page for a list of the applicableevents.
ONTAP 9 Product Library
You can configure alerts for the ONTAP EMS events to which you subscribe, and you can createcustom scripts to be executed for these events.
61Managing events

Note: If you do not receive the ONTAP EMS events to which you have subscribed, there mightbe an issue with the DNS configuration of the cluster which is preventing the cluster fromreaching the Unified Manager server. To resolve this issue, the cluster administrator mustcorrect the DNS configuration of the cluster, and then restart Unified Manager. Doing so willflush the pending EMS events to the Unified Manager server.
Steps
1. In the left navigation pane, click Storage Management > Event Setup.
2. In the Event Setup page, click the Subscribe to EMS events button.
3. In the Subscribe to EMS events dialog box, enter the name of the ONTAP EMS event towhich you want to subscribe.
To view the names of the EMS events to which you can subscribe, from the ONTAP clustershell, you can use the event route show command (prior to ONTAP 9) or the eventcatalog show command (ONTAP 9 or later).
How to configure ONTAP EMS Event Subscriptions in OnCommand Unified Manager /Active IQ Unified Manager
4. Click Add.The EMS event is added to the Subscribed EMS events list, but the Applicable to Clustercolumn displays the status as "Unknown" for the EMS event that you added.
5. Click Save and Close to register the EMS event subscription with the cluster.
6. Click Subscribe to EMS events again.The status "Yes" appears in the Applicable to Cluster column for the EMS event that youadded.
If the status is not "Yes", check the spelling of the ONTAP EMS event name. If the name isentered incorrectly, you must remove the incorrect event, and then add the event again.
After you finish
When the ONTAP EMS event occurs, the event is displayed on the Events page. You can select theevent to view details about the EMS event in the Event details page. You can also manage thedisposition of the event or create alerts for the event.
Related tasksAssigning events to specific users on page 56
You can assign unassigned events to yourself or to other users, including remote users. You canreassign assigned events to another user, if required. For example, when frequent issues occur on astorage object, you can assign the events for these issues to the user who manages that object.
Related referenceEMS events that are added automatically to Unified Manager on page 50
The following ONTAP EMS events are added automatically to Unified Manager. These eventswill be generated when triggered on any cluster that Unified Manager is monitoring.
Configuring event retention settingsYou can specify the number of months an event is retained in the Unified Manager server before itis automatically deleted.
Before you begin
You must have the Application Administrator role.
About this task
Retaining events for more than 6 months could affect the server performance and is notrecommended.
62Managing events

Steps
1. In the left navigation pane, click General > Data Retention.
2. In the Data Retention page, select the slider in the Event Retention area and move it to thenumber of months that events should be retained, and click Save.
Related tasksConfiguring event notification settings on page 53
You can configure Unified Manager to send alert notifications when an event is generated or whenan event is assigned to a user. You can configure the SMTP server that is used to send the alert,and you can set various notification mechanisms—for example, alert notifications can be sent asemails or SNMP traps.
What a Unified Manager maintenance window isYou define a Unified Manager maintenance window to suppress events and alerts for a specifictimeframe when you have scheduled cluster maintenance and you do not want to receive a flood ofunwanted notifications.
When the maintenance window starts, an "Object Maintenance Window Started" event is posted tothe Event Management inventory page. This event is obsoleted automatically when themaintenance window ends.
During a maintenance window the events related to all objects on that cluster are still generated,but they do not appear in any of the UI pages, and no alerts or other types of notification are sentfor these events. You can, however, view the events that were generated for all storage objectsduring a maintenance window by selecting one of the View options on the Event Managementinventory page.
You can schedule a maintenance window to be initiated in the future, you can change the start andend times for a scheduled maintenance window, and you can cancel a scheduled maintenancewindow.
Scheduling a maintenance window to disable cluster event notificationsIf you have a planned downtime for a cluster, for example, to upgrade the cluster or to move one ofthe nodes, you can suppress the events and alerts that would normally be generated during thattimeframe by scheduling a Unified Manager maintenance window.
Before you begin
You must have the Application Administrator or Storage Administrator role.
About this task
During a maintenance window, the events related to all objects on that cluster are still generated,but they do not appear in the event page, and no alerts or other types of notification are sent forthese events.
The time you enter for the maintenance window is based on the time at the Unified Managerserver.
Steps
1. In the left navigation pane, click Storage Management > Cluster Setup.
2. In the Maintenance Mode column for the cluster, select the slider button and move it to theright.The calendar window is displayed.
3. Select the start and end date and time for the maintenance window and click Apply.The message "Scheduled" appears next to the slider button.
63Managing events

Result
When the start time is reached the cluster goes into maintenance mode and an "ObjectMaintenance Window Started" event is generated.
Changing or canceling a scheduled maintenance windowIf you have configured a Unified Manager maintenance window to occur in the future, you canchange the start and end times or cancel the maintenance window from occurring.
Before you begin
You must have the Application Administrator or Storage Administrator role.
About this task
Canceling a currently running maintenance window is useful if you have completed clustermaintenance before the scheduled maintenance window end time and you want to start receivingevents and alerts from the cluster again.
Steps
1. In the left navigation pane, click Storage Management > Cluster Setup.
2. In the Maintenance Mode column for the cluster:
If you want to... Perform this step...
Change the timeframe for ascheduled maintenance window
a. Click the text "Scheduled" next to the slider button.
b. Change the start and/or end date and time and click Apply.
Extend the length of an activemaintenance window
a. Click the text "Active" next to the slider button.
b. Change the end date and time and click Apply.
Cancel a scheduled maintenancewindow
Select the slider button and move it to the left.
Cancel an active maintenancewindow
Select the slider button and move it to the left.
Viewing events that occurred during a maintenance windowIf necessary, you can view the events that were generated for all storage objects during a UnifiedManager maintenance window. Most events will appear in the Obsolete state once the maintenancewindow has completed and all system resources are back up and running.
Before you begin
At least one maintenance window must have completed before any events are available.
About this task
Events that occurred during a maintenance window do not appear on the Event Managementinventory page by default.
Steps
1. In the left navigation pane, click Events.By default, all active (New and Acknowledged) events are displayed on the Event Managementinventory page.
2. From the View pane, select the option All events generated during maintenance.The list of events trigged during the last 7 days from all maintenance window sessions andfrom all clusters are displayed.
64Managing events

3. If there have been multiple maintenance windows for a single cluster, you can click theTriggered Time calendar icon and select the period of time for the maintenance windowevents that you are interested in viewing.
Managing host system resource eventsUnified Manager includes a service that monitors resource issues on the host system on whichUnified Manager is installed. Issues such as lack of available disk space or lack of memory on thehost system may trigger management station events that are displayed as banner messages acrossthe top of the UI.
About this task
Management station events indicate an issue with the host system on which Unified Manager isinstalled. Examples of management station issues include disk space running low on the hostsystem; Unified Manager missing a regular data collection cycle; and noncompletion, or latecompletion, of statistics analysis because the next collection poll was initiated.
Unlike all other Unified Manager event messages, these particular management station warningand critical events are displayed in banner messages.
Step
To view management station event information, perform these actions:
If you want to... Do this...
View details of the event Click the event banner to display the Event details page that includes suggestedsolutions for the issue.
View all management stationevents
a. In the left navigation pane, click Event Management.
b. In the Filters pane on the Event Management inventory page, click the box forManagement Station in the Source Type list.
Related conceptsAdding disk space to the Unified Manager database directory on page 661
The Unified Manager database directory contains all of the health and performance data collectedfrom ONTAP systems. Some circumstances may require that you increase the size of the databasedirectory.
Related referenceManagement station events on page 82
Management station events provide you with information about the status of server on whichUnified Manager is installed so that you can monitor for potential problems. Events are groupedby impact area and include the event and trap name, impact level, source type, and severity.
Understanding more about eventsUnderstanding the concepts about events helps you to manage your clusters and cluster objectsefficiently and to define alerts appropriately.
Event state definitionsThe state of an event helps you identify whether an appropriate corrective action is required. Anevent can be New, Acknowledged, Resolved, or Obsolete. Note that both New and Acknowledgedevents are considered to be active events.
The event states are as follows:
65Managing events

New
The state of a new event.
Acknowledged
The state of an event when you have acknowledged it.
Resolved
The state of an event when it is marked as resolved.
Obsolete
The state of an event when it is automatically corrected or when the cause of the event is nolonger valid.
Note: You cannot acknowledge or resolve an obsolete event.
Example of different states of an event
The following examples illustrate the manual and automatic event state changes.
When the event Cluster Not Reachable is triggered, the event state is New. When youacknowledge the event, the event state changes to Acknowledged. When you have taken anappropriate corrective action, you must mark the event as resolved. The event state then changes toResolved.
If the Cluster Not Reachable event is generated due to a power outage, then when the power isrestored the cluster starts functioning without any administrator intervention. Therefore, theCluster Not Reachable event is no longer valid, and the event state changes to Obsolete in the nextmonitoring cycle.
Unified Manager sends an alert when an event is in the Obsolete or Resolved state. The emailsubject line and email content of an alert provides information about the event state. An SNMPtrap also includes information about the event state.
Related conceptsHow object status is computed on page 68
Object status is determined by the most severe event that currently holds a New or Acknowledgedstate. For example, if an object status is Error, then one of the object's events has a severity type ofError. When corrective action has been taken, the event state moves to Resolved.
Description of event severity typesEach event is associated with a severity type to help you prioritize the events that requireimmediate corrective action.
Critical
A problem occurred that might lead to service disruption if corrective action is not takenimmediately.
Performance critical events are sent from user-defined thresholds only.
Error
The event source is still performing; however, corrective action is required to avoid servicedisruption.
Warning
The event source experienced an occurrence that you should be aware of, or a performancecounter for a cluster object is out of normal range and should be monitored to make sure itdoes not reach the critical severity. Events of this severity do not cause service disruption,and immediate corrective action might not be required.
66Managing events

Performance warning events are sent from user-defined, system-defined, or dynamicthresholds.
Information
The event occurs when a new object is discovered, or when a user action is performed. Forexample, when any storage object is deleted or when there are any configuration changes,the event with severity type Information is generated.
Information events are sent directly from ONTAP when it detects a configuration change.
Related referenceList of events and severity types on page 71
You can use the list of events to become more familiar with event categories, event names, and theseverity type of each event that you might see in Unified Manager. Events are listed in alphabeticalorder by object category.
Description of event impact levelsEach event is associated with an impact level (Incident, Risk, Event, or Upgrade) to help youprioritize the events that require immediate corrective action.
Incident
An incident is a set of events that can cause a cluster to stop serving data to the client andrun out of space for storing data. Events with an impact level of Incident are the mostsevere. Immediate corrective action should be taken to avoid service disruption.
Risk
A risk is a set of events that can potentially cause a cluster to stop serving data to the clientand run out of space for storing data. Events with an impact level of Risk can cause servicedisruption. Corrective action might be required.
Event
An event is a state or status change of storage objects and their attributes. Events with animpact level of Event are informational and do not require corrective action.
Upgrade
Upgrade events are a specific type of event reported from the Active IQ platform. Theseevents identify issues where the resolution requires you to upgrade ONTAP software, nodefirmware, or operating system software (for security advisories). You may want to performimmediate corrective action for some of these issues, whereas other issues may be able towait until your next scheduled maintenance.
Description of event impact areasEvents are categorized into six impact areas (availability, capacity, configuration, performance,protection, and security) to enable you to concentrate on the types of events for which you areresponsible.
Availability
Availability events notify you if a storage object goes offline, if a protocol service goesdown, if an issue with storage failover occurs, or if an issue with hardware occurs.
Capacity
Capacity events notify you if your aggregates, volumes, LUNs, or namespaces areapproaching or have reached a size threshold, or if the rate of growth is unusual for yourenvironment.
67Managing events

Configuration
Configuration events inform you of the discovery, deletion, addition, removal, or renamingof your storage objects. Configuration events have an impact level of Event and a severitytype of Information.
Performance
Performance events notify you of resource, configuration, or activity conditions on yourcluster that might adversely affect the speed of data storage input or retrieval on yourmonitored storage objects.
Protection
Protection events notify you of incidents or risks involving SnapMirror relationships, issueswith destination capacity, problems with SnapVault relationships, or issues with protectionjobs. Any ONTAP object (especially aggregates, volumes, and SVMs) that host secondaryvolumes and protection relationships are categorized in the protection impact area.
Security
Security events notify you of how secure your ONTAP clusters, storage virtual machines(SVMs), and volumes are based on parameters defined in the NetApp Security HardeningGuide for ONTAP 9.
Additionally, this area includes upgrade events that are reported from the Active IQplatform.
How object status is computedObject status is determined by the most severe event that currently holds a New or Acknowledgedstate. For example, if an object status is Error, then one of the object's events has a severity type ofError. When corrective action has been taken, the event state moves to Resolved.
Related conceptsEvent state definitions on page 65
The state of an event helps you identify whether an appropriate corrective action is required. Anevent can be New, Acknowledged, Resolved, or Obsolete. Note that both New and Acknowledgedevents are considered to be active events.
Related tasksAcknowledging and resolving events on page 55
You should acknowledge an event before you start working on the issue that generated the event sothat you do not continue to receive repeat alert notifications. After you take corrective action for aparticular event, you should mark the event as resolved.
Dynamic performance event chart detailsFor dynamic performance events, the System Diagnosis section of the Event details page lists thetop workloads with the highest latency or usage of the cluster component that is in contention. Theperformance statistics are based on the time the performance event was detected up to the last timethe event was analyzed. The charts also display historical performance statistics for the clustercomponent that is in contention.
For example, you can identify workloads with high utilization of a component to determine whichworkload to move to a less-utilized component. Moving the workload would reduce the amount ofwork on the current component, possibly bringing the component out of contention. At the of thissection is the time and date range when an event was detected and last analyzed. For active events(new or acknowledged), the last analyzed time continues to update.
The latency and activity charts display the names of the top workloads when you hover yourcursor over the chart. Clicking the Workload Type menu at the right of the chart enables you tosort the workloads based on their role in the event, including sharks, bullies, or victims, and
68Managing events

displays details about their latency and their usage on the cluster component in contention. Youcan compare the actual value to the expected value to see when the workload was outside itsexpected range of latency or usage. See Workloads monitored by Unified Manager.
Note: When you sort by peak deviation in latency, system-defined workloads are not displayedin the table, because latency applies only to user-defined workloads. Workloads with very lowlatency values are not displayed in the table.
For more information about the dynamic performance thresholds, see What events are. Forinformation about how Unified Manager ranks the workloads and determines the sort order, seeHow Unified Manager determines the performance impact for an event.
The data in the graphs shows 24 hours of performance statistics prior to the last time the event wasanalyzed. The actual values and expected values for each workload are based on the time theworkload was involved in the event. For example, a workload might become involved in an eventafter the event was detected, so its performance statistics might not match the values at the time ofevent detection. By default, the workloads are sorted by peak (highest) deviation in latency.
Note: Because Unified Manager retains a maximum of 30 days of 5-minute historicalperformance and event data, if the event is more than 30 days old, no performance data isdisplayed.
Workload Sort column
Latency chart
Displays the impact of the event to the latency of the workload during the lastanalysis.
Component Usage column
Displays details about the workload usage of the cluster component in contention. Inthe graphs, the actual usage is a blue line. A red bar highlights the event duration,from the detection time to the last analyzed time. For more information, seeWorkload performance measurements.
Note: For the network component, because network performance statistics comefrom activity off the cluster, this column is not displayed.
Component Usage
Displays the history of utilization, in percent, for the network processing, dataprocessing, and aggregate components or the history of activity, in percent, for theQoS policy group component. The chart is not displayed for the network orinterconnect components. You can point to the statistics to view the usage statistics ata specific point in time.
Total Write MB/s History
For the MetroCluster Resources component only, shows the total write throughput, inmegabytes per second (MBps), for all volume workloads that are being mirrored tothe partner cluster in a MetroCluster configuration.
Event History
Displays red-shaded lines to indicate the historic events for the component incontention. For obsolete events, the chart displays events that occurred before theselected event was detected and after it was resolved.
Related conceptsHow Unified Manager determines the performance impact for an event on page 599
Unified Manager uses the deviation in activity, utilization, write throughput, cluster componentusage, or I/O latency (response time) for a workload to determine the level of impact to workload
69Managing events

performance. This information determines the role of each workload in the event and how they areranked on the Event details page.
Cluster components and why they can be in contention on page 600You can identify cluster performance issues when a cluster component goes into contention. Theperformance of workloads that use the component slow down and their response time (latency) forclient requests increases, which triggers an event in Unified Manager.
Types of workloads monitored by Unified Manager on page 584You can use Unified Manager to monitor the performance of two types of workloads: user-definedand system-defined.
Analyzing performance events on page 168You can analyze performance events to identify when they were detected, whether they are active(new or acknowledged) or obsolete, the workloads and cluster components involved, and theoptions for resolving the events on your own.
Roles of workloads involved in a performance event on page 603Unified Manager uses roles to identify the involvement of a workload in a performance event. Theroles include victims, bullies, and sharks. A user-defined workload can be a victim, bully, andshark at the same time.
Related tasksDisplaying information about performance events on page 168
You can use the Event Management inventory page to view a list of all the performance events onthe clusters being monitored by Unified Manager. By viewing this information you can determinethe most critical events and then drill down to detailed information to determine the cause of theevent.
Identifying victim workloads involved in a dynamic performance event on page 177In Unified Manager, you can identify which volume workloads have the highest deviation inresponse time (latency) caused by a storage component in contention. Identifying these workloadshelps you understand why the client applications accessing them have been performing slowerthan usual.
Identifying bully workloads involved in a dynamic performance event on page 178In Unified Manager, you can identify which workloads have the highest deviation in usage for acluster component in contention. Identifying these workloads helps you understand why certainvolumes on the cluster have slow response times (latency).
Related referencePerformance event analysis and notification on page 597
Performance events notify you about I/O performance issues on a workload caused by contentionon a cluster component. Unified Manager analyzes the event to identify all workloads involved,the component in contention, and whether the event is still an issue that you might need to resolve.
Configuration changes detected by Unified ManagerUnified Manager monitors your clusters for configuration changes to help you determine whethera change might have caused or contributed to a performance event. The Performance Explorer
pages display a change event icon ( ) to indicate the date and time when the change wasdetected.
You can review the performance charts in the Performance Explorer pages and in the WorkloadAnalysis page to see whether the change event impacted the performance of the selected clusterobject. If the change was detected at or around the same time as a performance event, the changemight have contributed to the issue, which caused the event alert to trigger.
Unified Manager can detect the following change events, which are categorized as Informationalevents:
70Managing events

• A volume moves between aggregates.
Unified Manager can detect when the move is in progress, completed, or failed. If UnifiedManager is down during a volume move, when it is back up it detects the volume move anddisplays a change event for it.
• The throughput (MB/s or IOPS) limit of a QoS policy group that contains one or moremonitored workloads changes.
Changing a policy group limit can cause intermittent spikes in the latency (response time),which might also trigger events for the policy group. The latency gradually returns to normaland any events caused by the spikes become obsolete.
• A node in an HA pair takes over or gives back the storage of its partner node.
Unified Manager can detect when the takeover, partial takeover, or giveback operation hasbeen completed. If the takeover is caused by a panicked node, Unified Manager does not detectthe event.
• An ONTAP upgrade or revert operation is completed successfully.
The previous version and new version are displayed.
List of events and severity typesYou can use the list of events to become more familiar with event categories, event names, and theseverity type of each event that you might see in Unified Manager. Events are listed in alphabeticalorder by object category.
Aggregate eventsAggregate events provide you with information about the status of aggregates so that you canmonitor for potential problems. Events are grouped by impact area and include the event and trapname, impact level, source type, and severity.
Impact area: availability
An asterisk (*) identifies EMS events that have been converted to Unified Manager events.
Event name
(Trap name)
Impactlevel
Source type Severity
Aggregate Offline
(ocumEvtAggregateStateOffline)
Incident Aggregate Critical
Aggregate Failed
(ocumEvtAggregateStateFailed)
Incident Aggregate Critical
Aggregate Restricted
(ocumEvtAggregateStateRestricted)
Risk Aggregate Warning
Aggregate Reconstructing
(ocumEvtAggregateRaidStateReconstructing)
Risk Aggregate Warning
Aggregate Degraded
(ocumEvtAggregateRaidStateDegraded)
Risk Aggregate Warning
Cloud Tier Partially Reachable
(ocumEventCloudTierPartiallyReachable)
Risk Aggregate Warning
Cloud Tier Unreachable
(ocumEventCloudTierUnreachable)
Risk Aggregate Error
71Managing events

Event name
(Trap name)
Impactlevel
Source type Severity
Cloud Tier Access Denied for Aggregate Relocation *
(arlNetraCaCheckFailed)
Risk Aggregate Error
Cloud Tier Access Denied for Aggregate Relocation During StorageFailover *
(gbNetraCaCheckFailed)
Risk Aggregate Error
MetroCluster Aggregate Left Behind
(ocumEvtMetroClusterAggregateLeftBehind)
Risk Aggregate Error
MetroCluster Aggregate Mirroring Degraded
(ocumEvtMetroClusterAggregateMirrorDegraded)
Risk Aggregate Error
Impact area: capacity
Event name
(Trap name)
Impactlevel
Source type Severity
Aggregate Space Nearly Full
(ocumEvtAggregateNearlyFull)
Risk Aggregate Warning
Aggregate Space Full
(ocumEvtAggregateFull)
Risk Aggregate Error
Aggregate Days Until Full
(ocumEvtAggregateDaysUntilFullSoon)
Risk Aggregate Error
Aggregate Overcommitted
(ocumEvtAggregateOvercommitted)
Risk Aggregate Error
Aggregate Nearly Overcommitted
(ocumEvtAggregateAlmostOvercommitted)
Risk Aggregate Warning
Aggregate Snapshot Reserve Full
(ocumEvtAggregateSnapReserveFull)
Risk Aggregate Warning
Aggregate Growth Rate Abnormal
(ocumEvtAggregateGrowthRateAbnormal)
Risk Aggregate Warning
Impact area: configuration
Event name
(Trap name)
Impactlevel
Source type Severity
Aggregate Discovered
(Not applicable)
Event Aggregate Information
Aggregate Renamed
(Not applicable)
Event Aggregate Information
Aggregate Deleted
(Not applicable)
Event Node Information
72Managing events

Impact area: performance
Event name
(Trap name)
Impactlevel
Source type Severity
Aggregate IOPS Critical Threshold Breached
(ocumAggregateIopsIncident)
Incident Aggregate Critical
Aggregate IOPS Warning Threshold Breached
(ocumAggregateIopsWarning)
Risk Aggregate Warning
Aggregate MB/s Critical Threshold Breached
(ocumAggregateMbpsIncident)
Incident Aggregate Critical
Aggregate MB/s Warning Threshold Breached
( ocumAggregateMbpsWarning)
Risk Aggregate Warning
Aggregate Latency Critical Threshold Breached
(ocumAggregateLatencyIncident)
Incident Aggregate Critical
Aggregate Latency Warning Threshold Breached
( ocumAggregateLatencyWarning)
Risk Aggregate Warning
Aggregate Performance Capacity Used Critical Threshold Breached
(ocumAggregatePerfCapacityUsedIncident)
Incident Aggregate Critical
Aggregate Performance Capacity Used Warning ThresholdBreached
(ocumAggregatePerfCapacityUsedWarning)
Risk Aggregate Warning
Aggregate Utilization Critical Threshold Breached
(ocumAggregateUtilizationIncident)
Incident Aggregate Critical
Aggregate Utilization Warning Threshold Breached
(ocumAggregateUtilizationWarning)
Risk Aggregate Warning
Aggregate Disks Over-utilized Threshold Breached
(ocumAggregateDisksOverUtilizedWarning)
Risk Aggregate Warning
Aggregate Dynamic Threshold Breached
(ocumAggregateDynamicEventWarning)
Risk Aggregate Warning
Cluster eventsCluster events provide information about the status of clusters, which enables you to monitor theclusters for potential problems. The events are grouped by impact area, and include the eventname, trap name, impact level, source type, and severity.
Impact area: availability
An asterisk (*) identifies EMS events that have been converted to Unified Manager events.
Event name
(Trap name)
Impactlevel
Source type Severity
Cluster Lacks Spare Disks
(ocumEvtDisksNoSpares)
Risk Cluster Warning
73Managing events

Event name
(Trap name)
Impactlevel
Source type Severity
Cluster Not Reachable
(ocumEvtClusterUnreachable)
Risk Cluster Error
Cluster Monitoring Failed
(ocumEvtClusterMonitoringFailed)
Risk Cluster Warning
Cluster FabricPool License Capacity Limits Breached
(ocumEvtExternalCapacityTierSpaceFull)
Risk Cluster Warning
NVMe-oF Grace Period Started *
(nvmfGracePeriodStart)
Risk Cluster Warning
NVMe-oF Grace Period Active *
(nvmfGracePeriodActive)
Risk Cluster Warning
NVMe-oF Grace Period Expired *
(nvmfGracePeriodExpired)
Risk Cluster Warning
Object Maintenance Window Started
(objectMaintenanceWindowStarted)
Event Cluster Critical
Object Maintenance Window Ended
(objectMaintenanceWindowEnded)
Event Cluster Information
MetroCluster Spare Disks Left Behind
(ocumEvtSpareDiskLeftBehind)
Risk Cluster Error
MetroCluster Automatic Unplanned Switchover Disabled
(ocumEvtMccAutomaticUnplannedSwitchOverDisabled)
Risk Cluster Warning
Impact area: capacity
Event name
(Trap name)
Impactlevel
Source type Severity
Cluster Capacity Imbalance Threshold Breached
(ocumConformanceNodeImbalanceWarning)
Risk Cluster Warning
Cluster Cloud Tier Planning
(clusterCloudTierPlanningWarning)
Risk Cluster Warning
FabricPool Mirror Replication Resync Completed *
(waflCaResyncComplete)
Event Cluster Warning
FabricPool Space Nearly Full *
(fabricpoolNearlyFull)
Risk Cluster Error
Impact area: configuration
Event name
(Trap name)
Impactlevel
Source type Severity
Node Added
(Not applicable)
Event Cluster Information
74Managing events

Event name
(Trap name)
Impactlevel
Source type Severity
Node Removed
(Not applicable)
Event Cluster Information
Cluster Removed
(Not applicable)
Event Cluster Information
Cluster Add Failed
(Not applicable)
Event Cluster Error
Cluster Name Changed
(Not applicable)
Event Cluster Information
Emergency EMS received
(Not applicable)
Event Cluster Critical
Critical EMS received
(Not applicable)
Event Cluster Critical
Alert EMS received
(Not applicable)
Event Cluster Error
Error EMS received
(Not applicable)
Event Cluster Warning
Warning EMS received
(Not applicable)
Event Cluster Warning
Debug EMS received
(Not applicable)
Event Cluster Warning
Notice EMS received
(Not applicable)
Event Cluster Warning
Informational EMS received
(Not applicable)
Event Cluster Warning
ONTAP EMS events are categorized into three Unified Manager event severity levels.
Unified Manager event severity level ONTAP EMS event severity level
Critical Emergency
Critical
Error Alert
Warning Error
Warning
Debug
Notice
Informational
75Managing events

Impact area: performance
Event name
(Trap name)
Impactlevel
Source type Severity
Cluster Load Imbalance Threshold Breached
()
Risk Cluster Warning
Cluster IOPS Critical Threshold Breached
(ocumClusterIopsIncident)
Incident Cluster Critical
Cluster IOPS Warning Threshold Breached
(ocumClusterIopsWarning)
Risk Cluster Warning
Cluster MB/s Critical Threshold Breached
(ocumClusterMbpsIncident)
Incident Cluster Critical
Cluster MB/s Warning Threshold Breached
(ocumClusterMbpsWarning)
Risk Cluster Warning
Cluster Dynamic Threshold Breached
(ocumClusterDynamicEventWarning)
Risk Cluster Warning
Impact area: security
Event name
(Trap name)
Impactlevel
Source type Severity
AutoSupport HTTPS Transport Disabled
(ocumClusterASUPHttpsConfiguredDisabled)
Risk Cluster Warning
Log Forwarding Not Encrypted
(ocumClusterAuditLogUnencrypted)
Risk Cluster Warning
Default Local Admin User Enabled
(ocumClusterDefaultAdminEnabled)
Risk Cluster Warning
FIPS Mode Disabled
(ocumClusterFipsDisabled)
Risk Cluster Warning
Login Banner Disabled
(ocumClusterLoginBannerDisabled)
Risk Cluster Warning
NTP Server Count is Low
(securityConfigNTPServerCountLowRisk)
Risk Cluster Warning
Cluster Peer Communication Not Encrypted
(ocumClusterPeerEncryptionDisabled)
Risk Cluster Warning
SSH is Using Insecure Ciphers
(ocumClusterSSHInsecure)
Risk Cluster Warning
Telnet Protocol Enabled
(ocumClusterTelnetEnabled)
Risk Cluster Warning
Related referenceSecurity events on page 302
76Managing events

Security events provide you with information about the security status of ONTAP clusters, storagevirtual machines (SVMs), and volumes based on parameters defined in the NetApp SecurityHardening Guide for ONTAP 9. These events notify you of potential issues so that you canevaluate their severity and fix the issue if necessary.
Disks eventsDisks events provide you with information about the status of disks so that you can monitor forpotential problems. Events are grouped by impact area and include the event and trap name,impact level, source type, and severity.
Impact area: availability
Event name
(Trap name)
Impactlevel
Source type Severity
Flash Disks - Spare Blocks Almost Consumed
(ocumEvtClusterFlashDiskFewerSpareBlockError)
Risk Cluster Error
Flash Disks - No Spare Blocks
(ocumEvtClusterFlashDiskNoSpareBlockCritical)
Incident Cluster Critical
Some Unassigned Disks
(ocumEvtClusterUnassignedDisksSome)
Risk Cluster Warning
Some Failed Disks
(ocumEvtDisksSomeFailed)
Incident Cluster Critical
Enclosures eventsEnclosures events provide you with information about the status of disk shelf enclosures in yourdata center so that you can monitor for potential problems. Events are grouped by impact area andinclude the event and trap name, impact level, source type, and severity.
Impact area: availability
Event name
(Trap name)
Impactlevel
Source type Severity
Disk Shelf Fans Failed
(ocumEvtShelfFanFailed)
Incident Storage shelf Critical
Disk Shelf Power Supplies Failed
(ocumEvtShelfPowerSupplyFailed)
Incident Storage shelf Critical
Disk Shelf Multipath Not Configured
(ocumDiskShelfConnectivityNotInMultiPath)
This event does not apply to:
• Clusters that are in a MetroCluster configuration
• The following platforms: FAS2554, FAS2552, FAS2520, andFAS2240
Risk Node Warning
Disk Shelf Path Failure
(ocumDiskShelfConnectivityPathFailure)
Risk Storage Shelf Warning
77Managing events

Impact area: configuration
Event name
(Trap name)
Impactlevel
Source type Severity
Disk Shelf Discovered
(Not applicable)
Event Node Information
Disk Shelves Removed
(Not applicable)
Event Node Information
Fans eventsFans events provide you with information about the status fans on nodes in your data center so thatyou can monitor for potential problems. Events are grouped by impact area and include the eventand trap name, impact level, source type, and severity.
Impact area: availability
Event name
(Trap name)
Impactlevel
Source type Severity
One or More Failed Fans
(ocumEvtFansOneOrMoreFailed)
Incident Node Critical
Flash card eventsFlash card events provide you with information about the status of the flash cards installed onnodes in your data center so that you can monitor for potential problems. Events are grouped byimpact area and include the event and trap name, impact level, source type, and severity.
Impact area: availability
Event name
(Trap name)
Impactlevel
Source type Severity
Flash Cards Offline
(ocumEvtFlashCardOffline)
Incident Node Critical
Inodes eventsInode events provide information when the inode is full or nearly full so that you can monitor forpotential problems. Events are grouped by impact area and include the event and trap name,impact level, source type, and severity.
Impact area: capacity
Event name
(Trap name)
Impactlevel
Source type Severity
Inodes Nearly Full
(ocumEvtInodesAlmostFull)
Risk Volume Warning
Inodes Full
(ocumEvtInodesFull)
Risk Volume Error
78Managing events
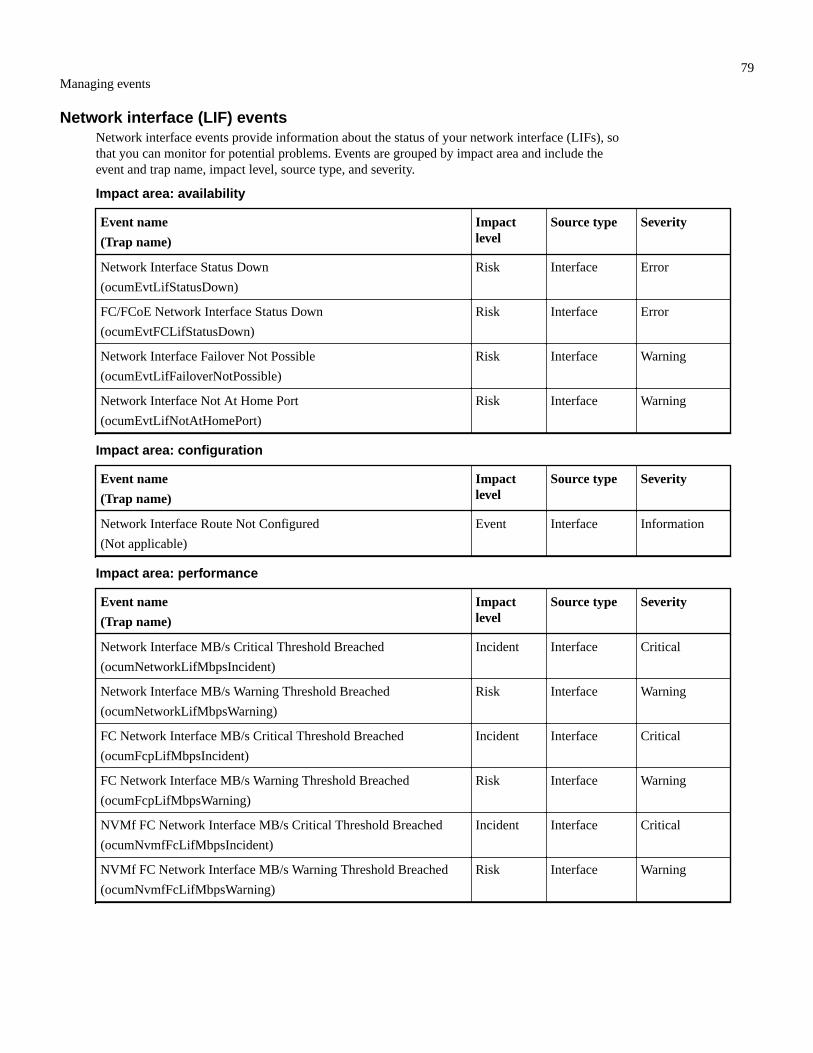
Network interface (LIF) eventsNetwork interface events provide information about the status of your network interface (LIFs), sothat you can monitor for potential problems. Events are grouped by impact area and include theevent and trap name, impact level, source type, and severity.
Impact area: availability
Event name
(Trap name)
Impactlevel
Source type Severity
Network Interface Status Down
(ocumEvtLifStatusDown)
Risk Interface Error
FC/FCoE Network Interface Status Down
(ocumEvtFCLifStatusDown)
Risk Interface Error
Network Interface Failover Not Possible
(ocumEvtLifFailoverNotPossible)
Risk Interface Warning
Network Interface Not At Home Port
(ocumEvtLifNotAtHomePort)
Risk Interface Warning
Impact area: configuration
Event name
(Trap name)
Impactlevel
Source type Severity
Network Interface Route Not Configured
(Not applicable)
Event Interface Information
Impact area: performance
Event name
(Trap name)
Impactlevel
Source type Severity
Network Interface MB/s Critical Threshold Breached
(ocumNetworkLifMbpsIncident)
Incident Interface Critical
Network Interface MB/s Warning Threshold Breached
(ocumNetworkLifMbpsWarning)
Risk Interface Warning
FC Network Interface MB/s Critical Threshold Breached
(ocumFcpLifMbpsIncident)
Incident Interface Critical
FC Network Interface MB/s Warning Threshold Breached
(ocumFcpLifMbpsWarning)
Risk Interface Warning
NVMf FC Network Interface MB/s Critical Threshold Breached
(ocumNvmfFcLifMbpsIncident)
Incident Interface Critical
NVMf FC Network Interface MB/s Warning Threshold Breached
(ocumNvmfFcLifMbpsWarning)
Risk Interface Warning
79Managing events

LUN eventsLUN events provide you with information about the status of your LUNs, so that you can monitorfor potential problems. Events are grouped by impact area and include the event and trap name,impact level, source type, and severity.
Impact area: availability
An asterisk (*) identifies EMS events that have been converted to Unified Manager events.
Event name
(Trap name)
Impactlevel
Source type Severity
LUN Offline
(ocumEvtLunOffline)
Incident LUN Critical
LUN Destroyed *
(lunDestroy)
Event LUN Information
LUN mapped with unsupported operating system in igroup
(igroupUnsupportedOsType)
Incident LUN Warning
Single Active Path To Access LUN
(ocumEvtLunSingleActivePath)
Risk LUN Warning
No Active Paths To Access LUN
(ocumEvtLunNotReachable)
Incident LUN Critical
No Optimized Paths To Access LUN
(ocumEvtLunOptimizedPathInactive)
Risk LUN Warning
No Paths To Access LUN From HA Partner
(ocumEvtLunHaPathInactive)
Risk LUN Warning
No Path to Access LUN from one Node in HA-pair
(ocumEvtLunNodePathStatusDown)
Risk LUN Error
Impact area: capacity
Event name
(Trap name)
Impactlevel
Source type Severity
Insufficient Space For LUN Snapshot Copy
(ocumEvtLunSnapshotNotPossible)
Risk Volume Warning
Impact area: configuration
Event name
(Trap name)
Impactlevel
Source type Severity
LUN mapped with unsupported operating system in igroup
(igroupUnsupportedOsType)
Risk LUN Warning
80Managing events

Impact area: performance
Event name
(Trap name)
Impactlevel
Source type Severity
LUN IOPS Critical Threshold Breached
(ocumLunIopsIncident)
Incident LUN Critical
LUN IOPS Warning Threshold Breached
(ocumLunIopsWarning)
Risk LUN Warning
LUN MB/s Critical Threshold Breached
(ocumLunMbpsIncident)
Incident LUN Critical
LUN MB/s Warning Threshold Breached
(ocumLunMbpsWarning)
Risk LUN Warning
LUN Latency ms/op Critical Threshold Breached
(ocumLunLatencyIncident)
Incident LUN Critical
LUN Latency ms/op Warning Threshold Breached
(ocumLunLatencyWarning)
Risk LUN Warning
LUN Latency and IOPS Critical Threshold Breached
(ocumLunLatencyIopsIncident)
Incident LUN Critical
LUN Latency and IOPS Warning Threshold Breached
(ocumLunLatencyIopsWarning)
Risk LUN Warning
LUN Latency and MB/s Critical Threshold Breached
(ocumLunLatencyMbpsIncident)
Incident LUN Critical
LUN Latency and MB/s Warning Threshold Breached
(ocumLunLatencyMbpsWarning)
Risk LUN Warning
LUN Latency and Aggregate Performance Capacity Used CriticalThreshold Breached
(ocumLunLatencyAggregatePerfCapacityUsedIncident)
Incident LUN Critical
LUN Latency and Aggregate Performance Capacity Used WarningThreshold Breached
(ocumLunLatencyAggregatePerfCapacityUsedWarning)
Risk LUN Warning
LUN Latency and Aggregate Utilization Critical ThresholdBreached
(ocumLunLatencyAggregateUtilizationIncident)
Incident LUN Critical
LUN Latency and Aggregate Utilization Warning ThresholdBreached
(ocumLunLatencyAggregateUtilizationWarning)
Risk LUN Warning
LUN Latency and Node Performance Capacity Used CriticalThreshold Breached
(ocumLunLatencyNodePerfCapacityUsedIncident)
Incident LUN Critical
81Managing events

Event name
(Trap name)
Impactlevel
Source type Severity
LUN Latency and Node Performance Capacity Used WarningThreshold Breached
(ocumLunLatencyNodePerfCapacityUsedWarning)
Risk LUN Warning
LUN Latency and Node Performance Capacity Used - TakeoverCritical Threshold Breached
(ocumLunLatencyAggregatePerfCapacityUsedTakeoverIncident)
Incident LUN Critical
LUN Latency and Node Performance Capacity Used - TakeoverWarning Threshold Breached
(ocumLunLatencyAggregatePerfCapacityUsedTakeoverWarning)
Risk LUN Warning
LUN Latency and Node Utilization Critical Threshold Breached
(ocumLunLatencyNodeUtilizationIncident)
Incident LUN Critical
LUN Latency and Node Utilization Warning Threshold Breached
(ocumLunLatencyNodeUtilizationWarning)
Risk LUN Warning
QoS LUN Max IOPS Warning Threshold Breached
(ocumQosLunMaxIopsWarning)
Risk LUN Warning
QoS LUN Max MB/s Warning Threshold Breached
(ocumQosLunMaxMbpsWarning)
Risk LUN Warning
Workload LUN Latency Threshold Breached as defined byPerformance Service Level Policy
(ocumConformanceLatencyWarning)
Risk LUN Warning
Management station eventsManagement station events provide you with information about the status of server on whichUnified Manager is installed so that you can monitor for potential problems. Events are groupedby impact area and include the event and trap name, impact level, source type, and severity.
Impact area: configuration
Event name
(Trap name)
Impactlevel
Source type Severity
Management Server Disk Space Nearly Full
(ocumEvtUnifiedManagerDiskSpaceNearlyFull)
Risk Managementstation
Warning
Management Server Disk Space Full
(ocumEvtUnifiedManagerDiskSpaceFull)
Incident Managementstation
Critical
Management Server Low On Memory
(ocumEvtUnifiedManagerMemoryLow)
Risk Managementstation
Warning
Management Server Almost Out Of Memory
(ocumEvtUnifiedManagerMemoryAlmostOut)
Incident Managementstation
Critical
MySQL Log File Size Increased; Restart Required
(ocumEvtMysqlLogFileSizeWarning)
Incident Managementstation
Warning
82Managing events

Impact area: performance
Event name
(Trap name)
Impactlevel
Source type Severity
Performance Data Analysis Is Impacted
(ocumEvtUnifiedManagerDataMissingAnalyze)
Risk Managementstation
Warning
Performance Data Collection Is Impacted
(ocumEvtUnifiedManagerDataMissingCollection)
Incident Managementstation
Critical
Note: These last two performance events were available for Unified Manager 7.2 only. If eitherof these events exist in the New state, and then you upgrade to a newer version of UnifiedManager software, the events will not be purged automatically. You will need to move theevents to the Resolved state manually.
MetroCluster Bridge eventsMetroCluster Bridge events provide you with information about the status of the bridges so thatyou can monitor for potential problems. Events are grouped by impact area and include the eventand trap name, impact level, source type, and severity.
Impact area: availability
Event name
(Trap name)
Impact level Source type Severity
Bridge Unreachable
(ocumEvtBridgeUnreachable)
Incident MetroClusterBridge
Critical
Bridge Temperature Abnormal
(ocumEvtBridgeTemperatureAbnormal)
Incident MetroClusterBridge
Critical
MetroCluster Connectivity eventsConnectivity events provide you with information about the connectivity between the componentsof a cluster and between clusters in a MetroCluster configuration so that you can monitor forpotential problems. Events are grouped by impact area and include the event and trap name,impact level, source type, and severity.
Impact area: availability
Event name
(Trap name)
Impactlevel
Source type Severity
All Inter-Switch Links Down
(ocumEvtMetroClusterAllISLBetweenSwitchesDown)
Incident MetroCluster inter-switch connection
Critical
All Links Between MetroCluster Partners Down
(ocumEvtMetroClusterAllLinksBetweenPartnersDown)
Incident MetroClusterrelationship
Critical
FC-SAS Bridge To Storage Stack Link Down
(ocumEvtBridgeSasPortDown)
Incident MetroClusterbridge stackconnection
Critical
MetroCluster Configuration Switched Over
((ocumEvtMetroClusterDRStatusImpacted)
Risk MetroClusterrelationship
Warning
83Managing events

Event name
(Trap name)
Impactlevel
Source type Severity
MetroCluster Configuration Partially Switched Over
(ocumEvtMetroClusterDRStatusPartiallyImpacted)
Risk MetroClusterrelationship
Error
MetroCluster Disaster Recovery Capability Impacted
(ocumEvtMetroClusterDRStatusImpacted)
Risk MetroClusterrelationship
Critical
MetroCluster Partners Not Reachable Over Peering Network
(ocumEvtMetroClusterPartnersNotReachableOverPeeringNetwork)
Incident MetroClusterrelationship
Critical
Node To FC Switch All FC-VI Interconnect Links Down
(ocumEvtMccNodeSwitchFcviLinksDown)
Incident MetroCluster nodeswitch connection
Critical
Node To FC Switch One Or More FC-Initiator Links Down
(ocumEvtMccNodeSwitchFcLinksOneOrMoreDown)
Risk MetroCluster nodeswitch connection
Warning
Node To FC Switch All FC-Initiator Links Down
(ocumEvtMccNodeSwitchFcLinksDown)
Incident MetroCluster nodeswitch connection
Critical
Switch To FC-SAS Bridge FC Link Down
(ocumEvtMccSwitchBridgeFcLinksDown)
Incident MetroClusterswitch bridgeconnection
Critical
Inter Node All FC VI InterConnect Links Down
(ocumEvtMccInterNodeLinksDown)
Incident Inter-nodeconnection
Critical
Inter Node One Or More FC VI InterConnect Links Down
(ocumEvtMccInterNodeLinksOneOrMoreDown)
Risk Inter-nodeconnection
Warning
Node To Bridge Link Down
(ocumEvtMccNodeBridgeLinksDown)
Incident Node bridgeconnection
Critical
Node to Storage Stack All SAS Links Down
( ocumEvtMccNodeStackLinksDown)
Incident Node stackconnection
Critical
Node to Storage Stack One Or More SAS Links Down
( ocumEvtMccNodeStackLinksOneOrMoreDown)
Risk Node stackconnection
Warning
MetroCluster switch eventsMetroCluster switch events provide you with information about the status of the MetroClusterswitches so that you can monitor for potential problems. Events are grouped by impact area andinclude the event and trap name, impact level, source type, and severity.
Impact area: availability
Event name
(Trap name)
Impactlevel
Source type Severity
Switch Temperature Abnormal
(ocumEvtSwitchTemperatureAbnormal)
Incident MetroClusterSwitch
Critical
Switch Unreachable
(ocumEvtSwitchUnreachable)
Incident MetroClusterSwitch
Critical
84Managing events

Event name
(Trap name)
Impactlevel
Source type Severity
Switch Fans Failed
(ocumEvtSwitchFansOneOrMoreFailed)
Incident MetroClusterSwitch
Critical
Switch Power Supplies Failed
(ocumEvtSwitchPowerSuppliesOneOrMoreFailed)
Incident MetroClusterSwitch
Critical
Switch Temperature Sensors Failed
(ocumEvtSwitchTemperatureSensorFailed)
Note: This event is applicable only for Cisco switches.
Incident MetroClusterSwitch
Critical
NVMe Namespace eventsNVMe Namespace events provide you with information about the status of your namespaces, sothat you can monitor for potential problems. Events are grouped by impact area and include theevent and trap name, impact level, source type, and severity.
An asterisk (*) identifies EMS events that have been converted to Unified Manager events.
Impact area: availability
Event name
(Trap name)
Impactlevel
Source type Severity
NVMeNS Offline *
(nvmeNamespaceStatusOffline)
Event Namespace Information
NVMeNS Online *
(nvmeNamespaceStatusOnline)
Event Namespace Information
NVMeNS Out of Space *
(nvmeNamespaceSpaceOutOfSpace)
Risk Namespace Warning
NVMeNS Destroy *
(nvmeNamespaceDestroy)
Event Namespace Information
Impact area: performance
Event name
(Trap name)
Impactlevel
Source type Severity
NVMe Namespace IOPS Critical Threshold Breached
(ocumNvmeNamespaceIopsIncident)
Incident Namespace Critical
NVMe Namespace IOPS Warning Threshold Breached
(ocumNvmeNamespaceIopsWarning)
Risk Namespace Warning
NVMe Namespace MB/s Critical Threshold Breached
(ocumNvmeNamespaceMbpsIncident)
Incident Namespace Critical
NVMe Namespace MB/s Warning Threshold Breached
(ocumNvmeNamespaceMbpsWarning)
Risk Namespace Warning
85Managing events

Event name
(Trap name)
Impactlevel
Source type Severity
NVMe Namespace Latency ms/op Critical Threshold Breached
(ocumNvmeNamespaceLatencyIncident)
Incident Namespace Critical
NVMe Namespace Latency ms/op Warning Threshold Breached
(ocumNvmeNamespaceLatencyWarning)
Risk Namespace Warning
NVMe Namespace Latency and IOPS Critical Threshold Breached
(ocumNvmeNamespaceLatencyIopsIncident)
Incident Namespace Critical
NVMe Namespace Latency and IOPS Warning Threshold Breached
(ocumNvmeNamespaceLatencyIopsWarning)
Risk Namespace Warning
NVMe Namespace Latency and MB/s Critical Threshold Breached
(ocumNvmeNamespaceLatencyMbpsIncident)
Incident Namespace Critical
NVMe Namespace Latency and MB/s Warning Threshold Breached
(ocumNvmeNamespaceLatencyMbpsWarning)
Risk Namespace Warning
Node eventsNode events provide you with information about node status so that you can monitor for potentialproblems. Events are grouped by impact area and include the event and trap name, impact level,source type, and severity.
An asterisk (*) identifies EMS events that have been converted to Unified Manager events.
Impact area: availability
Event name
(Trap name)
Impactlevel
Source type Severity
Node Root Volume Space Nearly Full
(ocumEvtClusterNodeRootVolumeSpaceNearlyFull )
Risk Node Warning
Cloud AWS MetaDataConnFail *
(ocumCloudAwsMetadataConnFail)
Risk Node Error
Cloud AWS IAMCredsExpired *
(ocumCloudAwsIamCredsExpired)
Risk Node Error
Cloud AWS IAMCredsInvalid *
(ocumCloudAwsIamCredsInvalid)
Risk Node Error
Cloud AWS IAMCredsNotFound *
(ocumCloudAwsIamCredsNotFound)
Risk Node Error
Cloud AWS IAMCredsNotInitialized *
(ocumCloudAwsIamCredsNotInitialized)
Event Node Information
Cloud AWS IAMRoleInvalid *
(ocumCloudAwsIamRoleInvalid)
Risk Node Error
Cloud AWS IAMRoleNotFound *
(ocumCloudAwsIamRoleNotFound)
Risk Node Error
86Managing events

Event name
(Trap name)
Impactlevel
Source type Severity
Cloud Tier Host Unresolvable *
(ocumObjstoreHostUnresolvable)
Risk Node Error
Cloud Tier Intercluster LIF Down *
(ocumObjstoreInterClusterLifDown)
Risk Node Error
One of NFSv4 Pools Exhausted *
(nbladeNfsv4PoolEXhaust)
Incident Node Critical
Request Mismatch Cloud Tier Signature *
(oscSignatureMismatch)
Risk Node Error
Impact area: capacity
Event name
(Trap name)
Impactlevel
Source type Severity
QoS Monitor Memory Maxed *
(ocumQosMonitorMemoryMaxed)
Risk Node Error
QoS Monitor Memory Abated *
(ocumQosMonitorMemoryAbated)
Event Node Information
Impact area: configuration
Event name
(Trap name)
Impactlevel
Source type Severity
Node Renamed
(Not applicable)
Event Node Information
Impact area: performance
Event name
(Trap name)
Impactlevel
Source type Severity
Node IOPS Critical Threshold Breached
(ocumNodeIopsIncident)
Incident Node Critical
Node IOPS Warning Threshold Breached
(ocumNodeIopsWarning)
Risk Node Warning
Node MB/s Critical Threshold Breached
(ocumNodeMbpsIncident)
Incident Node Critical
Node MB/s Warning Threshold Breached
(ocumNodeMbpsWarning)
Risk Node Warning
Node Latency ms/op Critical Threshold Breached
(ocumNodeLatencyIncident)
Incident Node Critical
Node Latency ms/op Warning Threshold Breached
(ocumNodeLatencyWarning)
Risk Node Warning
87Managing events

Event name
(Trap name)
Impactlevel
Source type Severity
Node Performance Capacity Used Critical Threshold Breached
(ocumNodePerfCapacityUsedIncident)
Incident Node Critical
Node Performance Capacity Used Warning Threshold Breached
(ocumNodePerfCapacityUsedWarning)
Risk Node Warning
Node Performance Capacity Used - Takeover Critical ThresholdBreached
(ocumNodePerfCapacityUsedTakeoverIncident)
Incident Node Critical
Node Performance Capacity Used - Takeover Warning ThresholdBreached
(ocumNodePerfCapacityUsedTakeoverWarning)
Risk Node Warning
Node Utilization Critical Threshold Breached
(ocumNodeUtilizationIncident)
Incident Node Critical
Node Utilization Warning Threshold Breached
(ocumNodeUtilizationWarning)
Risk Node Warning
Node HA Pair Over-utilized Threshold Breached
(ocumNodeHaPairOverUtilizedInformation)
Event Node Information
Node Disk Fragmentation Threshold Breached
(ocumNodeDiskFragmentationWarning)
Risk Node Warning
Performance Capacity Used Threshold Breached
(ocumNodeOverUtilizedWarning)
Risk Node Warning
Node Dynamic Threshold Breached
(ocumNodeDynamicEventWarning)
Risk Node Warning
Impact area: security
Event name
(Trap name)
Impactlevel
Source type Severity
Advisory ID: NTAP-<advisory ID>
(ocumx)
Risk Node Critical
NVRAM battery eventsNVRAM battery events provide you with information about the status of your batteries so that youcan monitor for potential problems. Events are grouped by impact area and include the event andtrap name, impact level, source type, and severity.
Impact area: availability
Event name
(Trap name)
Impactlevel
Source type Severity
NVRAM Battery Low
(ocumEvtNvramBatteryLow)
Risk Node Warning
88Managing events

Event name
(Trap name)
Impactlevel
Source type Severity
NVRAM Battery Discharged
(ocumEvtNvramBatteryDischarged)
Risk Node Error
NVRAM Battery Overly Charged
(ocumEvtNvramBatteryOverCharged)
Incident Node Critical
Port eventsPort events provide you with status about cluster ports so that you can monitor changes orproblems on the port, like whether the port is down.
Impact area: availability
Event name
(Trap name)
Impactlevel
Source type Severity
Port Status Down
(ocumEvtPortStatusDown)
Incident Node Critical
Impact area: performance
Event name
(Trap name)
Impactlevel
Source type Severity
Network Port MB/s Critical Threshold Breached
(ocumNetworkPortMbpsIncident)
Incident Port Critical
Network Port MB/s Warning Threshold Breached
(ocumNetworkPortMbpsWarning)
Risk Port Warning
FCP Port MB/s Critical Threshold Breached
(ocumFcpPortMbpsIncident)
Incident Port Critical
FCP Port MB/s Warning Threshold Breached
(ocumFcpPortMbpsWarning)
Risk Port Warning
Network Port Utilization Critical Threshold Breached
(ocumNetworkPortUtilizationIncident)
Incident Port Critical
Network Port Utilization Warning Threshold Breached
(ocumNetworkPortUtilizationWarning)
Risk Port Warning
FCP Port Utilization Critical Threshold Breached
(ocumFcpPortUtilizationIncident)
Incident Port Critical
FCP Port Utilization Warning Threshold Breached
(ocumFcpPortUtilizationWarning)
Risk Port Warning
89Managing events

Power supplies eventsPower supplies events provide you with information about the status of your hardware so that youcan monitor for potential problems. Events are grouped by impact area and include the event andtrap name, impact level, source type, and severity.
Impact area: availability
Event name
(Trap name)
Impactlevel
Source type Severity
One or More Failed Power Supplies
(ocumEvtPowerSupplyOneOrMoreFailed)
Incident Node Critical
Protection eventsProtection events tell you if a job has failed or been aborted so that you can monitor for problems.Events are grouped by impact area and include the event and trap name, impact level, source type,and severity.
Impact area: protection
Event name
(Trap name)
Impactlevel
Source type Severity
Protection Job Failed
(ocumEvtProtectionJobTaskFailed)
Incident Volume orstorage service
Critical
Protection Job Aborted
(ocumEvtProtectionJobAborted)
Risk Volume orstorage service
Warning
Qtree eventsQtree events provide you with information about the qtree capacity and the file and disk limits sothat you can monitor for potential problems. Events are grouped by impact area and include theevent and trap name, impact level, source type, and severity.
Impact area: capacity
Event name
(Trap name)
Impactlevel
Source type Severity
Qtree Space Nearly Full
(ocumEvtQtreeSpaceNearlyFull)
Risk Qtree Warning
Qtree Space Full
(ocumEvtQtreeSpaceFull)
Risk Qtree Error
Qtree Space Normal
(ocumEvtQtreeSpaceThresholdOk)
Event Qtree Information
Qtree Files Hard Limit Reached
(ocumEvtQtreeFilesHardLimitReached)
Incident Qtree Critical
Qtree Files Soft Limit Breached
(ocumEvtQtreeFilesSoftLimitBreached)
Risk Qtree Warning
90Managing events

Event name
(Trap name)
Impactlevel
Source type Severity
Qtree Space Hard Limit Reached
(ocumEvtQtreeSpaceHardLimitReached)
Incident Qtree Critical
Qtree Space Soft Limit Breached
(ocumEvtQtreeSpaceSoftLimitBreached)
Risk Qtree Warning
Service processor eventsService processor events provide you with information about the status of your processor so thatyou can monitor for potential problems. Events are grouped by impact area and include the eventand trap name, impact level, source type, and severity.
Impact area: availability
Event name
(Trap name)
Impactlevel
Source type Severity
Service Processor Not Configured
(ocumEvtServiceProcessorNotConfigured)
Risk Node Warning
Service Processor Offline
(ocumEvtServiceProcessorOffline)
Risk Node Error
SnapMirror relationship eventsSnapMirror relationship events provide you with information about the status of yourAsynchronous and Synchronous SnapMirror relationships so that you can monitor for potentialproblems. Events are grouped by impact area and include the event and trap name, impact level,source type, and severity.
Impact area: protection
An asterisk (*) identifies EMS events that have been converted to Unified Manager events.
Event name
(Trap name)
Impactlevel
Source type Severity
Mirror Replication Unhealthy
(ocumEvtSnapmirrorRelationshipUnhealthy)
Risk SnapMirrorrelationship
Warning
Mirror Replication Broken-off
(ocumEvtSnapmirrorRelationshipStateBrokenoff)
Risk SnapMirrorrelationship
Error
Mirror Replication Initialize Failed
(ocumEvtSnapmirrorRelationshipInitializeFailed)
Risk SnapMirrorrelationship
Error
Mirror Replication Update Failed
(ocumEvtSnapmirrorRelationshipUpdateFailed)
Risk SnapMirrorrelationship
Error
Mirror Replication Lag Error
(ocumEvtSnapMirrorRelationshipLagError)
Risk SnapMirrorrelationship
Error
Mirror Replication Lag Warning
(ocumEvtSnapMirrorRelationshipLagWarning)
Risk SnapMirrorrelationship
Warning
91Managing events

Event name
(Trap name)
Impactlevel
Source type Severity
Mirror Replication Resync Failed
(ocumEvtSnapmirrorRelationshipResyncFailed)
Risk SnapMirrorrelationship
Error
Synchronous Replication Out Of Sync *
(syncSnapmirrorRelationshipOutofsync)
Risk SnapMirrorrelationship
Warning
Synchronous Replication Restored *
(syncSnapmirrorRelationshipInSync)
Event SnapMirrorrelationship
Information
Synchronous Replication Auto Resync Failed *
(syncSnapmirrorRelationshipAutoSyncRetryFailed)
Risk SnapMirrorrelationship
Error
SnapMirror and Vault relationship eventsSnapMirror and Vault relationship events provide you with information about the status of yourAsynchronous SnapMirror and Vault relationships so that you can monitor for potential problems.Events are grouped by impact area and include the event and trap name, impact level, source type,and severity.
Impact area: protection
Event name
(Trap name)
Impactlevel
Source type Severity
Asynchronous Mirror and Vault Unhealthy
(ocumEvtMirrorVaultRelationshipUnhealthy)
Risk SnapMirrorrelationship
Warning
Asynchronous Mirror and Vault Broken-off
(ocumEvtMirrorVaultRelationshipStateBrokenoff)
Risk SnapMirrorrelationship
Error
Asynchronous Mirror and Vault Initialize Failed
(ocumEvtMirrorVaultRelationshipInitializeFailed)
Risk SnapMirrorrelationship
Error
Asynchronous Mirror and Vault Update Failed
(ocumEvtMirrorVaultRelationshipUpdateFailed)
Risk SnapMirrorrelationship
Error
Asynchronous Mirror and Vault Lag Error
(ocumEvtMirrorVaultRelationshipLagError)
Risk SnapMirrorrelationship
Error
Asynchronous Mirror and Vault Lag Warning
(ocumEvtMirrorVaultRelationshipLagWarning)
Risk SnapMirrorrelationship
Warning
Asynchronous Mirror and Vault Resync Failed
(ocumEvtMirrorVaultRelationshipResyncFailed)
Risk SnapMirrorrelationship
Error
92Managing events

Snapshot eventsSnapshot events provide information about the status of snapshots which enables you to monitorthe snapshots for potential problems. The events are grouped by impact area, and include the eventname, trap name, impact level, source type, and severity.
Impact area: availability
Event name
(Trap name)
Impactlevel
Source type Severity
Snapshot Auto-delete Disabled
(Not applicable)
Event Volume Information
Snapshot Auto-delete Enabled
(Not applicable)
Event Volume Information
Snapshot Auto-delete Configuration Modified
(Not applicable)
Event Volume Information
SnapVault relationship eventsSnapVault relationship events provide you with information about the status of your SnapVaultrelationships so that you can monitor for potential problems. Events are grouped by impact areaand include the event and trap name, impact level, source type, and severity.
Impact area: protection
Event name
(Trap name)
Impactlevel
Source type Severity
Asynchronous Vault Unhealthy
(ocumEvtSnapVaultRelationshipUnhealthy)
Risk SnapMirrorrelationship
Warning
Asynchronous Vault Broken-off
(ocumEvtSnapVaultRelationshipStateBrokenoff)
Risk SnapMirrorrelationship
Error
Asynchronous Vault Initialize Failed
(ocumEvtSnapVaultRelationshipInitializeFailed)
Risk SnapMirrorrelationship
Error
Asynchronous Vault Update Failed
(ocumEvtSnapVaultRelationshipUpdateFailed)
Risk SnapMirrorrelationship
Error
Asynchronous Vault Lag Error
(ocumEvtSnapVaultRelationshipLagError)
Risk SnapMirrorrelationship
Error
Asynchronous Vault Lag Warning
(ocumEvtSnapVaultRelationshipLagWarning)
Risk SnapMirrorrelationship
Warning
Asynchronous Vault Resync Failed
(ocumEvtSnapvaultRelationshipResyncFailed)
Risk SnapMirrorrelationship
Error
Storage failover settings eventsStorage failover (SFO) settings events provide you with information about whether your storagefailover is disabled or not configured so that you can monitor for potential problems. Events are
93Managing events

grouped by impact area and include the event and trap name, impact level, source type, andseverity.
Impact area: availability
Event name
(Trap name)
Impactlevel
Source type Severity
Storage Failover Interconnect One Or More Links Down
(ocumEvtSfoInterconnectOneOrMoreLinksDown)
Risk Node Warning
Storage Failover Disabled
(ocumEvtSfoSettingsDisabled)
Risk Node Error
Storage Failover Not Configured
(ocumEvtSfoSettingsNotConfigured)
Risk Node Error
Storage Failover State - Takeover
(ocumEvtSfoStateTakeover)
Risk Node Warning
Storage Failover State - Partial Giveback
(ocumEvtSfoStatePartialGiveback)
Risk Node Error
Storage Failover Node Status Down
(ocumEvtSfoNodeStatusDown)
Risk Node Error
Storage Failover Takeover Not Possible
(ocumEvtSfoTakeoverNotPossible)
Risk Node Error
Storage services eventsStorage services events provide you with information about the creation and subscription ofstorage services so that you can monitor for potential problems. Events are grouped by impact areaand include the event and trap name, impact level, source type, and severity.
Impact area: configuration
Event name
(Trap name)
Impactlevel
Source type Severity
Storage Service Created
(Not applicable)
Event Storageservice
Information
Storage Service Subscribed
(Not applicable)
Event Storageservice
Information
Storage Service Unsubscribed
(Not applicable)
Event Storageservice
Information
Impact area: protection
Event name
(Trap name)
Impactlevel
Source type Severity
Unexpected Deletion of Managed SnapMirror Relationship
ocumEvtStorageServiceUnsupportedRelationshipDeletion
Risk Storageservice
Warning
94Managing events

Event name
(Trap name)
Impactlevel
Source type Severity
Unexpected Deletion of Storage Service Member Volume
(ocumEvtStorageServiceUnexpectedVolumeDeletion)
Incident Storageservice
Critical
Storage shelf eventsStorage shelf events tell you if your storage shelf has abnormal so that you can monitor forpotential problems. Events are grouped by impact area and include the event and trap name,impact level, source type, and severity.
Impact area: availability
Event name
(Trap name)
Impactlevel
Source type Severity
Abnormal Voltage Range
(ocumEvtShelfVoltageAbnormal)
Risk Storage shelf Warning
Abnormal Current Range
(ocumEvtShelfCurrentAbnormal)
Risk Storage shelf Warning
Abnormal Temperature
(ocumEvtShelfTemperatureAbnormal)
Risk Storage shelf Warning
Storage VM eventsStorage VM events provide you with information about the status of your SVMs so that you canmonitor for potential problems. Events are grouped by impact area and include the event and trapname, impact level, source type, and severity.
Impact area: availability
An asterisk (*) identifies EMS events that have been converted to Unified Manager events.
Event name
(Trap name)
Impactlevel
Source type Severity
SVM CIFS Service Down
(ocumEvtVserverCifsServiceStatusDown)
Incident SVM Critical
SVM CIFS Service Not Configured
(Not applicable)
Event SVM Information
Attempts to Connect Nonexistent CIFS Share *
(nbladeCifsNoPrivShare)
Incident SVM Critical
CIFS NetBIOS Name Conflict *
(nbladeCifsNbNameConflict)
Risk SVM Error
CIFS Shadow Copy Operation Failed *
(cifsShadowCopyFailure)
Risk SVM Error
Many CIFS Connections *
(nbladeCifsManyAuths)
Risk SVM Error
95Managing events

Event name
(Trap name)
Impactlevel
Source type Severity
Max CIFS Connection Exceeded *
(nbladeCifsMaxOpenSameFile)
Risk SVM Error
Max Number of CIFS Connection Per User Exceeded *
(nbladeCifsMaxSessPerUsrConn)
Risk SVM Error
SVM FC/FCoE Service Down
(ocumEvtVserverFcServiceStatusDown)
Incident SVM Critical
SVM iSCSI Service Down
(ocumEvtVserverIscsiServiceStatusDown)
Incident SVM Critical
SVM NFS Service Down
(ocumEvtVserverNfsServiceStatusDown)
Incident SVM Critical
SVM FC/FCoE Service Not Configured
(Not applicable)
Event SVM Information
SVM iSCSI Service Not Configured
(Not applicable)
Event SVM Information
SVM NFS Service Not Configured
(Not applicable)
Event SVM Information
SVM Stopped
(ocumEvtVserverDown)
Risk SVM Warning
AV Server too Busy to Accept New Scan Request *
(nbladeVscanConnBackPressure)
Risk SVM Error
No AV Server Connection for Virus Scan *
(nbladeVscanNoScannerConn)
Incident SVM Critical
No AV Server Registered *
(nbladeVscanNoRegdScanner)
Risk SVM Error
No Responsive AV Server Connection *
(nbladeVscanConnInactive)
Event SVM Information
Unauthorized User Attempt to AV Server *
(nbladeVscanBadUserPrivAccess)
Risk SVM Error
Virus Found By AV Server *
(nbladeVscanVirusDetected)
Risk SVM Error
Impact area: configuration
Event name
(Trap name)
Impactlevel
Source type Severity
SVM Discovered
(Not applicable)
Event SVM Information
96Managing events
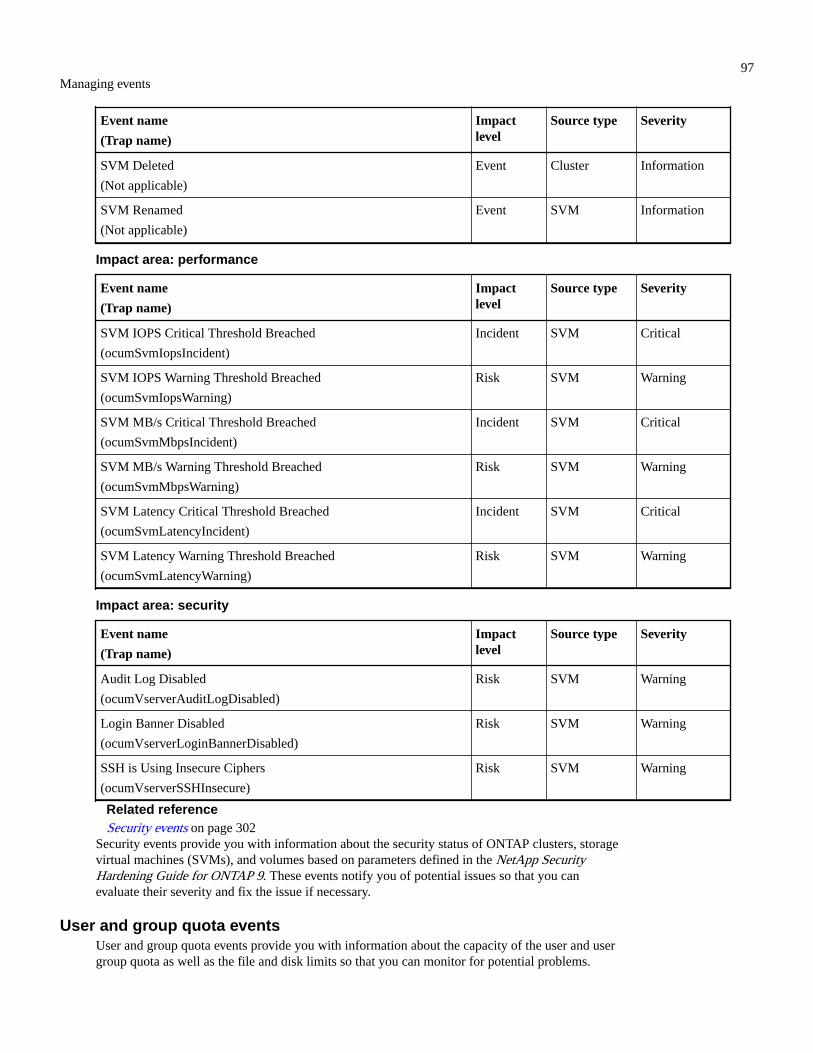
Event name
(Trap name)
Impactlevel
Source type Severity
SVM Deleted
(Not applicable)
Event Cluster Information
SVM Renamed
(Not applicable)
Event SVM Information
Impact area: performance
Event name
(Trap name)
Impactlevel
Source type Severity
SVM IOPS Critical Threshold Breached
(ocumSvmIopsIncident)
Incident SVM Critical
SVM IOPS Warning Threshold Breached
(ocumSvmIopsWarning)
Risk SVM Warning
SVM MB/s Critical Threshold Breached
(ocumSvmMbpsIncident)
Incident SVM Critical
SVM MB/s Warning Threshold Breached
(ocumSvmMbpsWarning)
Risk SVM Warning
SVM Latency Critical Threshold Breached
(ocumSvmLatencyIncident)
Incident SVM Critical
SVM Latency Warning Threshold Breached
(ocumSvmLatencyWarning)
Risk SVM Warning
Impact area: security
Event name
(Trap name)
Impactlevel
Source type Severity
Audit Log Disabled
(ocumVserverAuditLogDisabled)
Risk SVM Warning
Login Banner Disabled
(ocumVserverLoginBannerDisabled)
Risk SVM Warning
SSH is Using Insecure Ciphers
(ocumVserverSSHInsecure)
Risk SVM Warning
Related referenceSecurity events on page 302
Security events provide you with information about the security status of ONTAP clusters, storagevirtual machines (SVMs), and volumes based on parameters defined in the NetApp SecurityHardening Guide for ONTAP 9. These events notify you of potential issues so that you canevaluate their severity and fix the issue if necessary.
User and group quota eventsUser and group quota events provide you with information about the capacity of the user and usergroup quota as well as the file and disk limits so that you can monitor for potential problems.
97Managing events

Events are grouped by impact area and include the event and trap name, impact level, source type,and severity.
Impact area: capacity
Event name
(Trap name)
Impactlevel
Source type Severity
User or Group Quota Disk Space Soft Limit Breached
(ocumEvtUserOrGroupQuotaDiskSpaceSoftLimitBreached)
Risk User or groupquota
Warning
User or Group Quota Disk Space Hard Limit Reached
(ocumEvtUserOrGroupQuotaDiskSpaceHardLimitReached)
Incident User or groupquota
Critical
User or Group Quota File Count Soft Limit Breached
(ocumEvtUserOrGroupQuotaFileCountSoftLimitBreached)
Risk User or groupquota
Warning
User or Group Quota File Count Hard Limit Reached
(ocumEvtUserOrGroupQuotaFileCountHardLimitReached)
Incident User or groupquota
Critical
Volume eventsVolume events provide information about the status of volumes which enables you to monitor forpotential problems. The events are grouped by impact area, and include the event name, trap name,impact level, source type, and severity.
An asterisk (*) identifies EMS events that have been converted to Unified Manager events.
Impact area: availability
Event name
(Trap name)
Impactlevel
Source type Severity
Volume Restricted
(ocumEvtVolumeRestricted)
Risk Volume Warning
Volume Offline
(ocumEvtVolumeOffline)
Incident Volume Critical
Volume Partially Available
(ocumEvtVolumePartiallyAvailable)
Risk Volume Error
Volume Unmounted
(Not applicable)
Event Volume Information
Volume Mounted
(Not applicable)
Event Volume Information
Volume Remounted
(Not applicable)
Event Volume Information
Volume Junction Path Inactive
(ocumEvtVolumeJunctionPathInactive)
Risk Volume Warning
Volume Autosize Enabled
(Not applicable)
Event Volume Information
98Managing events
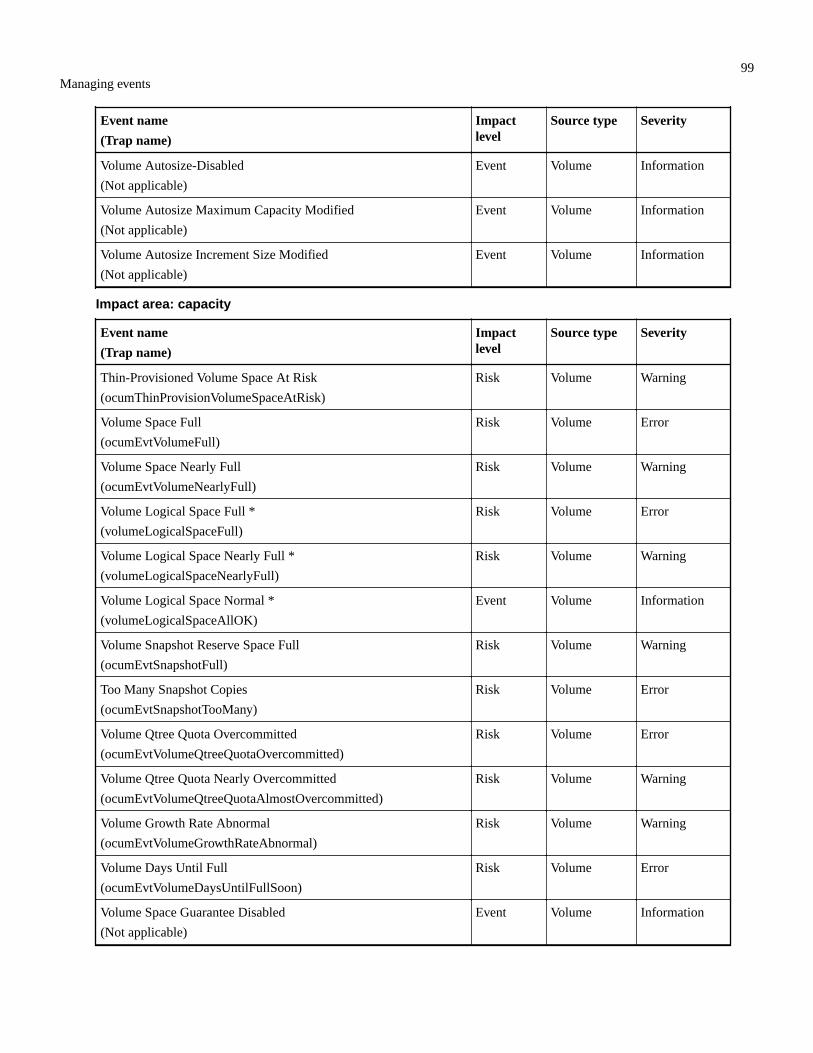
Event name
(Trap name)
Impactlevel
Source type Severity
Volume Autosize-Disabled
(Not applicable)
Event Volume Information
Volume Autosize Maximum Capacity Modified
(Not applicable)
Event Volume Information
Volume Autosize Increment Size Modified
(Not applicable)
Event Volume Information
Impact area: capacity
Event name
(Trap name)
Impactlevel
Source type Severity
Thin-Provisioned Volume Space At Risk
(ocumThinProvisionVolumeSpaceAtRisk)
Risk Volume Warning
Volume Space Full
(ocumEvtVolumeFull)
Risk Volume Error
Volume Space Nearly Full
(ocumEvtVolumeNearlyFull)
Risk Volume Warning
Volume Logical Space Full *
(volumeLogicalSpaceFull)
Risk Volume Error
Volume Logical Space Nearly Full *
(volumeLogicalSpaceNearlyFull)
Risk Volume Warning
Volume Logical Space Normal *
(volumeLogicalSpaceAllOK)
Event Volume Information
Volume Snapshot Reserve Space Full
(ocumEvtSnapshotFull)
Risk Volume Warning
Too Many Snapshot Copies
(ocumEvtSnapshotTooMany)
Risk Volume Error
Volume Qtree Quota Overcommitted
(ocumEvtVolumeQtreeQuotaOvercommitted)
Risk Volume Error
Volume Qtree Quota Nearly Overcommitted
(ocumEvtVolumeQtreeQuotaAlmostOvercommitted)
Risk Volume Warning
Volume Growth Rate Abnormal
(ocumEvtVolumeGrowthRateAbnormal)
Risk Volume Warning
Volume Days Until Full
(ocumEvtVolumeDaysUntilFullSoon)
Risk Volume Error
Volume Space Guarantee Disabled
(Not applicable)
Event Volume Information
99Managing events

Event name
(Trap name)
Impactlevel
Source type Severity
Volume Space Guarantee Enabled
(Not Applicable)
Event Volume Information
Volume Space Guarantee Modified
(Not applicable)
Event Volume Information
Volume Snapshot Reserve Days Until Full
(ocumEvtVolumeSnapshotReserveDaysUntilFullSoon)
Risk Volume Error
FlexGroup Constituents Have Space Issues *
(flexGroupConstituentsHaveSpaceIssues)
Risk Volume Error
FlexGroup Constituents Space Status All OK *
(flexGroupConstituentsSpaceStatusAllOK)
Event Volume Information
FlexGroup Constituents Have Inodes Issues *
(flexGroupConstituentsHaveInodesIssues)
Risk Volume Error
FlexGroup Constituents Inodes Status All OK *
(flexGroupConstituentsInodesStatusAllOK)
Event Volume Information
WAFL Volume AutoSize Fail *
(waflVolAutoSizeFail)
Risk Volume Error
WAFL Volume AutoSize Done *
(waflVolAutoSizeDone)
Event Volume Information
Impact area: configuration
Event name
(Trap name)
Impactlevel
Source type Severity
Volume Renamed
(Not applicable)
Event Volume Information
Volume Discovered
(Not applicable)
Event Volume Information
Volume Deleted
(Not applicable)
Event Volume Information
Impact area: performance
Event name
(Trap name)
Impactlevel
Source type Severity
QoS Volume Max IOPS Warning Threshold Breached
(ocumQosVolumeMaxIopsWarning)
Risk Volume Warning
QoS Volume Max MB/s Warning Threshold Breached
(ocumQosVolumeMaxMbpsWarning)
Risk Volume Warning
QoS Volume Max IOPS/TB Warning Threshold Breached
(ocumQosVolumeMaxIopsPerTbWarning)
Risk Volume Warning
100Managing events

Event name
(Trap name)
Impactlevel
Source type Severity
Workload Volume Latency Threshold Breached as defined byPerformance Service Level Policy
(ocumConformanceLatencyWarning)
Risk Volume Warning
Volume IOPS Critical Threshold Breached
(ocumVolumeIopsIncident)
Incident Volume Critical
Volume IOPS Warning Threshold Breached
(ocumVolumeIopsWarning)
Risk Volume Warning
Volume MB/s Critical Threshold Breached
(ocumVolumeMbpsIncident)
Incident Volume Critical
Volume MB/s Warning Threshold Breached
(ocumVolumeMbpsWarning )
Risk Volume Warning
Volume Latency ms/op Critical Threshold Breached
(ocumVolumeLatencyIncident)
Incident Volume Critical
Volume Latency ms/op Warning Threshold Breached
(ocumVolumeLatencyWarning)
Risk Volume Warning
Volume Cache Miss Ratio Critical Threshold Breached
(ocumVolumeCacheMissRatioIncident)
Incident Volume Critical
Volume Cache Miss Ratio Warning Threshold Breached
(ocumVolumeCacheMissRatioWarning)
Risk Volume Warning
Volume Latency and IOPS Critical Threshold Breached
(ocumVolumeLatencyIopsIncident)
Incident Volume Critical
Volume Latency and IOPS Warning Threshold Breached
(ocumVolumeLatencyIopsWarning)
Risk Volume Warning
Volume Latency and MB/s Critical Threshold Breached
(ocumVolumeLatencyMbpsIncident)
Incident Volume Critical
Volume Latency and MB/s Warning Threshold Breached
(ocumVolumeLatencyMbpsWarning)
Risk Volume Warning
Volume Latency and Aggregate Performance Capacity Used CriticalThreshold Breached
(ocumVolumeLatencyAggregatePerfCapacityUsedIncident)
Incident Volume Critical
Volume Latency and Aggregate Performance Capacity UsedWarning Threshold Breached
(ocumVolumeLatencyAggregatePerfCapacityUsedWarning)
Risk Volume Warning
Volume Latency and Aggregate Utilization Critical ThresholdBreached
(ocumVolumeLatencyAggregateUtilizationIncident)
Incident Volume Critical
101Managing events

Event name
(Trap name)
Impactlevel
Source type Severity
Volume Latency and Aggregate Utilization Warning ThresholdBreached
(ocumVolumeLatencyAggregateUtilizationWarning)
Risk Volume Warning
Volume Latency and Node Performance Capacity Used CriticalThreshold Breached
(ocumVolumeLatencyNodePerfCapacityUsedIncident)
Incident Volume Critical
Volume Latency and Node Performance Capacity Used WarningThreshold Breached
(ocumVolumeLatencyNodePerfCapacityUsedWarning)
Risk Volume Warning
Volume Latency and Node Performance Capacity Used - TakeoverCritical Threshold Breached
(ocumVolumeLatencyAggregatePerfCapacityUsedTakeoverIncident)
Incident Volume Critical
Volume Latency and Node Performance Capacity Used - TakeoverWarning Threshold Breached
(ocumVolumeLatencyAggregatePerfCapacityUsedTakeoverWarning)
Risk Volume Warning
Volume Latency and Node Utilization Critical Threshold Breached
(ocumVolumeLatencyNodeUtilizationIncident)
Incident Volume Critical
Volume Latency and Node Utilization Warning Threshold Breached
(ocumVolumeLatencyNodeUtilizationWarning)
Risk Volume Warning
Volume move status eventsVolume move status events tell you about the status of your volume move so that you can monitorfor potential problems. Events are grouped by impact area and include the event and trap name,impact level, source type, and severity.
Impact area: capacity
Event name
(Trap name)
Impactlevel
Source type Severity
Volume Move Status: In Progress
(Not applicable)
Event Volume Information
Volume Move Status - Failed
(ocumEvtVolumeMoveFailed)
Risk Volume Error
Volume Move Status: Completed
(Not applicable)
Event Volume Information
Volume Move - Cutover Deferred
(ocumEvtVolumeMoveCutoverDeferred)
Risk Volume Warning
Description of event windows and dialog boxesEvents notify you about any issues in your environment. You can use the Event Managementinventory page and Event details page to monitor all the events. You can use the Notification Setup
102Managing events

Options dialog box to configure notification. You can use the Event Setup page to disable orenable events.
Notifications pageYou can configure the Unified Manager server to send notifications when an event is generated orwhen it is assigned to a user. You can also configure the notification mechanisms. For example,notifications can be sent as emails or SNMP traps.
You must have the Application Administrator or Storage Administrator role.
This area enables you to configure the following email settings for alert notification:
From Address
Specifies the email address from which the alert notification is sent. This value is also usedas the from address for a report when shared. If the From Address is pre-filled with theaddress "[email protected]", you should change it to a real,working email address to make sure that all email notifications are delivered successfully.
SMTP Server
This area enables you to configure the following SMTP server settings:
Host Name or IP Address
Specifies the host name of your SMTP host server, which is used to send the alertnotification to the specified recipients.
User Name
Specifies the SMTP user name. SMTP user name is required only when the SMTPAUTH isenabled in the SMTP server.
Password
Specifies the SMTP password. SMTP user name is required only when the SMTPAUTH isenabled in the SMTP server.
Port
Specifies the port that is used by the SMTP host server to send alert notification.
The default value is 25.
Use START/TLS
Checking this box provides secure communication between the SMTP server and themanagement server by using the TLS/SSL protocols (also known as start_tls and StartTLS).
Use SSL
Checking this box provides secure communication between the SMTP server and themanagement server by using the SSL protocol.
SNMP
This area enables you to configure the following SNMP trap settings:
Version
Specifies the SNMP version you want to use depending on the type of security you require.Options include Version 1, Version 3, Version 3 with Authentication, and Version 3 withAuthentication and Encryption. The default value is Version 1.
103Managing events

Trap Destination Host
Specifies the host name or IP address (IPv4 or IPv6) that receives the SNMP traps that aresent by the management server. To specify multiple trap destinations, separate each hostwith a comma.
Note: All other SNMP settings, such as "Version" and "Outbound Port", must be thesame for all hosts in the list.
Outbound Trap Port
Specifies the port through which the SNMP server receives the traps that are sent by themanagement server.
The default value is 162.
Community
The community string to access the host.
Engine ID
Specifies the unique identifier of the SNMP agent and is automatically generated by themanagement server. Engine ID is available with SNMP Version 3, SNMP Version 3 withAuthentication, and SNMP Version 3 with Authentication and Encryption.
Username
Specifies the SNMP user name. User name is available with SNMP Version 3, SNMPVersion 3 with Authentication, and SNMP Version 3 with Authentication and Encryption.
Authentication Protocol
Specifies the protocol used to authenticate a user. Protocol options include MD5 and SHA.MD5 is the default value. Authentication protocol is available with SNMP Version 3 withAuthentication and SNMP Version 3 with Authentication and Encryption.
Authentication Password
Specifies the password used when authenticating a user. Authentication password isavailable with SNMP Version 3 with Authentication and SNMP Version 3 withAuthentication and Encryption.
Privacy Protocol
Specifies the privacy protocol used to encrypt SNMP messages. Protocol options includeAES 128 and DES. The default value is AES 128. Privacy protocol is available with SNMPVersion 3 with Authentication and Encryption.
Privacy Password
Specifies the password when using privacy protocol. Privacy password is available withSNMP Version 3 with Authentication and Encryption.
Related tasksConfiguring event notification settings on page 53
You can configure Unified Manager to send alert notifications when an event is generated or whenan event is assigned to a user. You can configure the SMTP server that is used to send the alert,and you can set various notification mechanisms—for example, alert notifications can be sent asemails or SNMP traps.
Event Management inventory pageThe Event Management inventory page enables you to view a list of current events and theirproperties. You can perform tasks such as acknowledging, resolving, and assigning events. Youcan also add an alert for specific events.
• Filter components
104Managing events

• Command buttons• Events list
The information on this page is refreshed automatically every 5 minutes to ensure that the mostcurrent new events are displayed.
Filter components
Enable you to customize the information that is displayed in the events list. You can refine the listof events that are displayed using the following components:
• View menu to select from a pre-defined list of filter selections.
This includes items such as all active (new and acknowledged) events, active performanceevents, events assigned to me (the logged in user), and all events generated during allmaintenance windows.
• Search pane to refine the list of events by entering full or partial terms.
• Filter button that launches the Filters pane so you can select from every available field and fieldattribute to refine the list of events.
Command buttons
The command buttons enable you to perform the following tasks:
Assign To
Enables you to select the user to whom the event is assigned. When you assign an event to auser, the user name and the time when you assigned the event is added in the events list forthe selected events.
• Me
Assigns the event to the currently logged in user.
• Another user
Displays the Assign Owner dialog box, which enables you to assign or reassign theevent to other users. You can also unassign events by leaving the ownership field blank.
Acknowledge
Acknowledges the selected events.
When you acknowledge an event, your user name and the time when you acknowledged theevent are added in the events list for the selected events. When you acknowledge an event,you are responsible for managing that event.
Note: You cannot acknowledge Information events.
Mark As Resolved
Enables you to change the event state to resolved.
When you resolve an event, your user name and the time when you resolved the event areadded in the events list for the selected events. After you have taken corrective action forthe event, you must mark the event as resolved.
Add Alert
Displays the Add Alert dialog box, which enables you to add alerts for the selected events.
Reports
Enables you to export details of the current event view to a comma-separated values (.csv)file or PDF document.
Show/Hide Column Selector
Enables you to choose the columns that display on the page and select the order in whichthey are displayed.
105Managing events

Events list
Displays details of all the events ordered by triggered time.
By default the All active events view is displayed to show the New and Acknowledged events forthe previous seven days that have an Impact Level of Incident or Risk.
Triggered Time
The time at which the event was generated.
Severity
The event severity: Critical ( ), Error ( ), Warning ( ), and Information ( ).
State
The event state: New, Acknowledged, Resolved, or Obsolete.
Impact Level
The event impact level: Incident, Risk, Event, or Upgrade.
Impact Area
The event impact area: Availability, Capacity, Performance, Protection, Configuration, orSecurity.
Name
The event name. You can select the name to display the Event details page for that event.
Source
The name of the object on which the event has occurred. You can select the name to displaythe health or performance details page for that object.
When a shared QoS policy breach occurs, only the workload object that is consuming themost IOPS or MB/s is shown in this field. Additional workloads that are using this policyare displayed in the Event details page.
Source Type
The object type (for example, Storage VM, Volume, or Qtree) with which the event isassociated.
Assigned To
The name of the user to whom the event is assigned.
Event Origin
Whether the event originated from the "Active IQ Portal" or directly from "Active IQUnified Manager".
Annotation Name
The name of the annotation that is assigned to the storage object.
Notes
The number of notes that are added for an event.
Days Outstanding
The number of days since the event was initially generated.
Assigned Time
The time that has elapsed since the event was assigned to a user. If the time elapsed exceedsa week, the timestamp when the event was assigned to a user is displayed.
106Managing events

Acknowledged By
The name of the user who acknowledged the event. The field is blank if the event is notacknowledged.
Acknowledged Time
The time that has elapsed since the event was acknowledged. If the time elapsed exceeds aweek, the timestamp when the event was acknowledged is displayed.
Resolved By
The name of the user who resolved the event. The field is blank if the event is not resolved.
Resolved Time
The time that has elapsed since the event was resolved. If the time elapsed exceeds a week,the timestamp when the event was resolved is displayed.
Obsoleted Time
The time when the state of the event became Obsolete.
Related conceptsSources of performance events on page 45
Performance events are issues related to workload performance on a cluster. They help youidentify storage objects with slow response times, also known as high latency. Together with otherhealth events that occurred at the same time, you can determine the issues that might have caused,or contributed to, the slow response times.
What happens when an event is received on page 52When Unified Manager receives an event, it is displayed in the Dashboard page, in the EventManagement inventory page, in the Summary and Explorer tabs of the Cluster/Performance page,and in the object-specific inventory page (for example, the Volumes/Health inventory page).
Related tasksViewing events and event details on page 54
You can view details about an event that is triggered by Unified Manager to take corrective action.For example, if there is a health event Volume Offline, you can click that event to view the detailsand perform corrective actions.
Assigning events to specific users on page 56You can assign unassigned events to yourself or to other users, including remote users. You canreassign assigned events to another user, if required. For example, when frequent issues occur on astorage object, you can assign the events for these issues to the user who manages that object.
Viewing unassigned events on page 54You can view unassigned events and then assign each of them to a user who can resolve them.
Acknowledging and resolving events on page 55You should acknowledge an event before you start working on the issue that generated the event sothat you do not continue to receive repeat alert notifications. After you take corrective action for aparticular event, you should mark the event as resolved.
Adding alerts on page 119You can configure alerts to notify you when a particular event is generated. You can configurealerts for a single resource, for a group of resources, or for events of a particular severity type. Youcan specify the frequency with which you want to be notified and associate a script to the alert.
Exporting storage data as reports on page 27You can export storage data in a variety of output formats and then use the exported data to buildreports. For example, if there are 10 critical events that have not been resolved, you can export the
107Managing events

data from the Event Management inventory page to create a report, and then send the report toadmins who can resolve the issues.
Displaying information about performance events on page 168You can use the Event Management inventory page to view a list of all the performance events onthe clusters being monitored by Unified Manager. By viewing this information you can determinethe most critical events and then drill down to detailed information to determine the cause of theevent.
Viewing security events that may require software or firmware updates on page 299There are certain security events that have an impact area of "Upgrade". These events are reportedfrom the Active IQ platform, and they identify issues where the resolution requires you to upgradeONTAP software, node firmware, or operating system software (for security advisories).
Related referenceList of events and severity types on page 71
You can use the list of events to become more familiar with event categories, event names, and theseverity type of each event that you might see in Unified Manager. Events are listed in alphabeticalorder by object category.
Event details pageFrom the Event details page, you can view the details of a selected event, such as the eventseverity, impact level, impact area, and event source. You can also view additional informationabout possible remediations to resolve the issue.
Event Name
The name of the event and the time the event was last seen.
For non-performance events, while the event is in the New or Acknowledged state the lastseen information is not known and is therefore hidden.
Event Description
A brief description of the event.
In some cases a reason for the event being triggered is provided in the event description.
Component in Contention
For dynamic performance events, this section displays icons that represent the logical andphysical components of the cluster. If a component is in contention, its icon is circled andhighlighted red.
See Cluster components and why they can be in contention on page 600 for a description ofthe components that are displayed here.
The Event Information, System Diagnosis, and Suggested Actions sections are described in othertopics.
Command buttons
The command buttons enable you to perform the following tasks:
Notes icon
Enables you to add or update a note about the event, and review all notes left by other users.
Actions menu
Assign to Me
Assigns the event to you.
108Managing events
Assign to Others
Opens the Assign Owner dialog box, which enables you to assign or reassign the event toother users.
When you assign an event to a user, the user's name and the time when the event wasassigned are added in the events list for the selected events.
You can also unassign events by leaving the ownership field blank.
Acknowledge
Acknowledges the selected events so that you do not continue to receive repeat alertnotifications.
When you acknowledge an event, your user name and the time that you acknowledged theevent are added in the events list (Acknowledged By) for the selected events. When youacknowledge an event, you take responsibility for managing that event.
Mark As Resolved
Enables you to change the event state to Resolved.
When you resolve an event, your user name and the time that you resolved the event areadded in the events list (Resolved By) for the selected events. After you have takencorrective action for the event, you must mark the event as resolved.
Add Alert
Displays the Add Alert dialog box, which enables you to add an alert for the selected event.
Related conceptsManaging health thresholds on page 134
You can configure global health threshold values for all the aggregates, volumes, and qtrees totrack any health threshold breaches.
Managing performance thresholds on page 152Performance threshold policies enable you to determine the point at which Unified Managergenerates an event to inform system administrators about issues that could be impacting workloadperformance. These threshold policies are known as user-defined performance thresholds.
What happens when an event is received on page 52When Unified Manager receives an event, it is displayed in the Dashboard page, in the EventManagement inventory page, in the Summary and Explorer tabs of the Cluster/Performance page,and in the object-specific inventory page (for example, the Volumes/Health inventory page).
Cluster components and why they can be in contention on page 600You can identify cluster performance issues when a cluster component goes into contention. Theperformance of workloads that use the component slow down and their response time (latency) forclient requests increases, which triggers an event in Unified Manager.
Types of workloads monitored by Unified Manager on page 584You can use Unified Manager to monitor the performance of two types of workloads: user-definedand system-defined.
Related tasksViewing events and event details on page 54
You can view details about an event that is triggered by Unified Manager to take corrective action.For example, if there is a health event Volume Offline, you can click that event to view the detailsand perform corrective actions.
Disabling unwanted events on page 56
109Managing events
All events are enabled by default. You can disable events globally to prevent the generation ofnotifications for events that are not important in your environment. You can enable events that aredisabled when you want to resume receiving notifications for them.
Displaying information about performance events on page 168You can use the Event Management inventory page to view a list of all the performance events onthe clusters being monitored by Unified Manager. By viewing this information you can determinethe most critical events and then drill down to detailed information to determine the cause of theevent.
Identifying victim workloads involved in a dynamic performance event on page 177In Unified Manager, you can identify which volume workloads have the highest deviation inresponse time (latency) caused by a storage component in contention. Identifying these workloadshelps you understand why the client applications accessing them have been performing slowerthan usual.
Identifying bully workloads involved in a dynamic performance event on page 178In Unified Manager, you can identify which workloads have the highest deviation in usage for acluster component in contention. Identifying these workloads helps you understand why certainvolumes on the cluster have slow response times (latency).
Related referenceTypes of system-defined performance threshold policies on page 46
Unified Manager provides some standard threshold policies that monitor cluster performance andgenerate events automatically. These policies are enabled by default, and they generate warning orinformation events when the monitored performance thresholds are breached.
Performance event analysis and notification on page 597Performance events notify you about I/O performance issues on a workload caused by contentionon a cluster component. Unified Manager analyzes the event to identify all workloads involved,the component in contention, and whether the event is still an issue that you might need to resolve.
What the Event Information section displaysYou use the Event Information section on the Event details page to view the details about aselected event, such as the event severity, impact level, impact area, and event source.
Fields that are not applicable to the event type are hidden. You can view the following eventdetails:
Event Trigger Time
The time at which the event was generated.
State
The event state: New, Acknowledged, Resolved, or Obsolete.
Obsoleted Cause
The actions that caused the event to be obsoleted, for example, the issue was fixed.
Event Duration
For active (new and acknowledged) events, this is the time between detection and the timewhen the event was last analyzed. For obsolete events, this is the time between detectionand when the event was resolved.
This field is displayed for all performance events, and for other event types only after theyhave been resolved or obsoleted.
Last Seen
The date and time at which the event was last seen as active.
110Managing events

For performance events this value may be more recent than the Event Trigger Time as thisfield is updated after each new collection of performance data as long as the event is active.For other types of events, when in the New or Acknowledged state, this content is notupdated and the field is therefore hidden.
Severity
The event severity: Critical ( ), Error ( ), Warning ( ), and Information ( ).
Impact Level
The event impact level: Incident, Risk, Event, or Upgrade.
Impact Area
The event impact area: Availability, Capacity, Performance, Protection, Configuration, orSecurity.
Source
The name of the object on which the event has occurred.
When viewing the details for a shared QoS policy event, up to three of the workload objectsthat are consuming the most IOPS or MBps are listed in this field.
You can click the source name link to display the health or performance details page for thatobject.
Source Annotations
Displays the annotation name and value for the object to which the event is associated.
This field is displayed only for health events on clusters, SVMs, and volumes.
Source Groups
Displays the names of all the groups of which the impacted object is a member.
This field is displayed only for health events on clusters, SVMs, and volumes.
Source Type
The object type (for example, SVM, Volume, or Qtree) with which the event is associated.
On Cluster
The name of the cluster on which the event occurred.
You can click the cluster name link to display the health or performance details page forthat cluster.
Affected Objects Count
The number of objects affected by the event.
You can click the object link to display the inventory page populated with the objects thatare currently affected by this event.
This field is displayed only for performance events.
Affected Volumes
The number of volumes that are being affected by this event.
This field is displayed only for performance events on nodes or aggregates.
Triggered Policy
The name of the threshold policy that issued the event.
111Managing events
You can hover your cursor over the policy name to see the details of the threshold policy.For adaptive QoS policies the defined policy, block size, and allocation type (allocatedspace or used space) is also displayed.
This field is displayed only for performance events.
Rule Id
For Active IQ platform events, this is the number of the rule that was triggered to generatethe event.
Acknowledged by
The name of the person who acknowledged the event and the time that the event wasacknowledged.
Resolved by
The name of the person who resolved the event and the time that the event was resolved.
Assigned to
The name of the person who is assigned to work on the event.
Alert Settings
The following information about alerts is displayed:
• If there are no alerts associated with the selected event, an Add alert link is displayed.
You can open the Add Alert dialog box by clicking the link.
• If there is one alert associated with the selected event, the alert name is displayed.
You can open the Edit Alert dialog box by clicking the link.
• If there is more than one alert associated with the selected event, the number of alerts isdisplayed.
You can open the Alert Setup page by clicking the link to view more details about thesealerts.
Alerts that are disabled are not displayed.
Last Notification Sent
The date and time at which the most recent alert notification was sent.
Send by
The mechanism that was used to send the alert notification: email or SNMP trap.
Previous Script Run
The name of the script that was executed when the alert was generated.
Related conceptsEvent state definitions on page 65
The state of an event helps you identify whether an appropriate corrective action is required. Anevent can be New, Acknowledged, Resolved, or Obsolete. Note that both New and Acknowledgedevents are considered to be active events.
Related tasksAssigning events to specific users on page 56
You can assign unassigned events to yourself or to other users, including remote users. You canreassign assigned events to another user, if required. For example, when frequent issues occur on astorage object, you can assign the events for these issues to the user who manages that object.
Acknowledging and resolving events on page 55
112Managing events

You should acknowledge an event before you start working on the issue that generated the event sothat you do not continue to receive repeat alert notifications. After you take corrective action for aparticular event, you should mark the event as resolved.
Adding alerts on page 119You can configure alerts to notify you when a particular event is generated. You can configurealerts for a single resource, for a group of resources, or for events of a particular severity type. Youcan specify the frequency with which you want to be notified and associate a script to the alert.
Related referenceDescription of event severity types on page 66
Each event is associated with a severity type to help you prioritize the events that requireimmediate corrective action.
Description of event impact levels on page 67Each event is associated with an impact level (Incident, Risk, Event, or Upgrade) to help youprioritize the events that require immediate corrective action.
What the Suggested Actions section displaysThe Suggested Actions section of the Event details page provides possible reasons for the eventand suggests a few actions so that you can try to resolve the event on your own. The suggestedactions are customized based on the type of event or type of threshold that has been breached.
This area is displayed only for some types of events.
In some cases there are Help links provided on the page that reference additional information formany suggested actions, including instructions for performing a specific action. Some of theactions may involve using Unified Manager, ONTAP System Manager, OnCommand WorkflowAutomation, ONTAP CLI commands, or a combination of these tools.
You should consider the actions suggested here as only a guidance in resolving this event. Theaction you take to resolve this event should be based on the context of your environment.
If you want to analyze the object and event in more detail, click the Analyze Workload button todisplay the Workload Analysis page.
There are certain events that Unified Manager can diagnose thoroughly and provide a singleresolution. When available, those resolutions are displayed with a Fix It button. Click this buttonto have Unified Manager fix the issue causing the event.
For Active IQ platform events, this section may contain a link to a NetApp Knowledgebase article,when available, that describes the issue and possible resolutions. In sites with no external networkaccess, a PDF of the Knowledgebase article is opened locally; the PDF is part of the rules file thatyou manually download to the Unified Manager instance.
Related conceptsUnderstanding events from adaptive QoS policies that have a defined block size on page 173
Adaptive QoS policy groups automatically scale a throughput ceiling or floor based on the volumesize, maintaining the ratio of IOPS to TBs as the size of the volume changes. Starting withONTAP 9.5 you can specify the block size in the QoS policy to effectively apply a MB/s thresholdat the same time.
Fixing ONTAP issues directly from Unified Manager on page 30You can fix certain ONTAP issues directly from the Unified Manager user interface instead ofhaving to use ONTAP System Manager or the ONTAP CLI.
What Active IQ platform events are on page 48
113Managing events

Unified Manager can display events that have been discovered by the Active IQ platform. Theseevents are created by running a set of rules against AutoSupport messages generated from allstorage systems being monitored by Unified Manager.
Related tasksResponding to QoS policy group performance events on page 172
Unified Manager generates QoS policy warning events when workload throughput (IOPS,IOPS/TB, or MBps) has exceeded the defined ONTAP QoS policy setting and workload latency isbecoming affected. These system-defined events provide the opportunity to correct potentialperformance issues before many workloads are affected by latency.
Responding to node resources overutilized performance events on page 175Unified Manager generates node resources overutilized warning events when a single node isoperating above the bounds of its operational efficiency, and therefore potentially affectingworkload latencies. These system-defined events provide the opportunity to correct potentialperformance issues before many workloads are affected by latency.
What the System Diagnosis section displaysThe System Diagnosis section of the Event details page provides information that can help youdiagnose issues that may have been responsible for the event.
This area is displayed only for some events.
Some performance events provide charts that are relevant to the particular event that has beentriggered. Typically this includes and IOPS or MBps chart and a latency chart for the previous tendays. When arranged this way you can see which storage components are most affecting latency,or being affected by latency, when the event is active.
For dynamic performance events, the following charts are displayed:
• Workload Latency - Displays the history of latency for the top victim, bully, or sharkworkloads at the component in contention.
• Workload Activity - Displays details about the workload usage of the cluster component incontention.
• Resource Activity - Display historical performance statistics for the cluster component incontention.
Other charts are displayed when some cluster components are in contention.
Other events provide a brief description of the type of analysis the system is performing on thestorage object. In some cases there will be one or more lines; one for each component that hasbeen analyzed, for system-defined performance policies that analyze multiple performancecounters. In this scenario, a green or red icon displays next to the diagnosis to indicate whether anissue was found, or not, in that particular diagnosis.
Related conceptsAnalyzing events from user-defined performance thresholds on page 169
Events generated from user-defined thresholds indicate that a performance counter for a certainstorage object, for example, an aggregate or volume, has crossed the threshold you defined in thepolicy. This indicates that the cluster object is experiencing a performance issue.
Analyzing events from system-defined performance thresholds on page 171Events generated from system-defined performance thresholds indicate that a performancecounter, or set of performance counters, for a certain storage object has crossed the threshold froma system-defined policy. This indicates that the storage object, for example, an aggregate or node,is experiencing a performance issue.
Analyzing events from dynamic performance thresholds on page 177Events generated from dynamic thresholds indicate that the actual response time (latency) for aworkload is too high, or too low, compared to the expected response time range. You use the Event
114Managing events

details page to analyze the performance event and take corrective action, if necessary, to returnperformance back to normal.
Related referenceDynamic performance event chart details on page 68
For dynamic performance events, the System Diagnosis section of the Event details page lists thetop workloads with the highest latency or usage of the cluster component that is in contention. Theperformance statistics are based on the time the performance event was detected up to the last timethe event was analyzed. The charts also display historical performance statistics for the clustercomponent that is in contention.
IOPS performance counter charts on page 542The IOPS counter charts display the number of input/output operations processed per second bythe selected storage object.
MB/s performance counter charts on page 544The MB/s counter charts display the number of megabytes of data transferred to and from theselected object per second.
Utilization performance counter chart on page 545The Utilization counter chart displays the average percentage of the selected resource that is beingused.
Event Setup pageThe Event Setup page displays the list of events that are disabled, and provides information suchas the associated object type and severity of the event. You can also perform tasks such asdisabling or enabling events globally.
You can access this page only if you have the Application Administrator or Storage Administratorrole.
• Command buttons• List view
Command buttons
The command buttons enable you to perform the following tasks for selected events:
Disable
Launches the Disable Events dialog box, which you can use to disable events.
Enable
Enables selected events that you had chosen to disable previously.
Upload Rules
Launches the Upload Rules dialog box, which enables sites with no external network accessto manually upload the Active IQ rules file to Unified Manager. The rules are run againstcluster AutoSupport messages to generate events for system configuration, cabling, bestpractice, and availability as defined by the Active IQ platform.
Subscribe to EMS Events
Launches the Subscribe to EMS Events dialog box, which enables you to subscribe toreceive specific Event Management System (EMS) events from the clusters that you aremonitoring. The EMS collects information about events that occur on the cluster. When anotification is received for a subscribed EMS event, a Unified Manager event is generatedwith the appropriate severity.
115Managing events

List view
The List view displays (in tabular format) information about events that are disabled. You can usethe column filters to customize the data that is displayed.
Event
Displays the name of the event that is disabled.
Severity
Displays the severity of the event. The severity can be Critical, Error, Warning, orInformation.
Source Type
Displays the source type for which the event is generated.
Related tasksDisabling unwanted events on page 56
All events are enabled by default. You can disable events globally to prevent the generation ofnotifications for events that are not important in your environment. You can enable events that aredisabled when you want to resume receiving notifications for them.
Uploading a new Active IQ rules file on page 59Unified Manager checks for a new Active IQ rules file automatically and downloads a new filewhen there are newer rules. However, in sites with no external network access, you need to uploadthe rules file manually.
Configuring event retention settings on page 62You can specify the number of months an event is retained in the Unified Manager server before itis automatically deleted.
Subscribing to ONTAP EMS events on page 61You can subscribe to receive Event Management System (EMS) events that are generated bysystems that are installed with ONTAP software. A subset of EMS events are reported to UnifiedManager automatically, but additional EMS events are reported only if you have subscribed tothese events.
Disable Events dialog boxThe Disable Events dialog box displays the list of event types for which you can disable events.You can disable events for an event type based on a particular severity or for a set of events.
You must have the Application Administrator or Storage Administrator role.
• Event properties area• Command buttons
Event Properties area
The Event Properties area specifies the following event properties:
Event Severity
Enables you to select events based on the severity type, which can be Critical, Error,Warning, or Information.
Event Name Contains
Enables you to filter events whose name contains the specified characters.
Matching events
Displays the list of events matching the event severity type and the text string you specify.
Disable events
Displays the list of events that you have selected for disabling.
116Managing events

The severity of the event is also displayed along with the event name.
Command buttons
The command buttons enable you to perform the following tasks for the selected events:
Save and close
Disables the event type and closes the dialog box.
Cancel
Discards the changes and closes the dialog box.
Related tasksDisabling unwanted events on page 56
All events are enabled by default. You can disable events globally to prevent the generation ofnotifications for events that are not important in your environment. You can enable events that aredisabled when you want to resume receiving notifications for them.
117Managing events

Managing alerts
You can configure alerts to send notification automatically when specific events or events ofcertain severity types occur. You can also associate an alert with a script that is executed when analert is triggered.
What alerts areWhile events occur continuously, the Unified Manager generates an alert only when an eventmeets specified filter criteria. You can choose the events for which alerts should be generated—forexample, when a space threshold is exceeded or an object goes offline. You can also associate analert with a script that is executed when an alert is triggered.
Filter criteria include object class, name, or event severity.
Related conceptsWhat health events are on page 43
Health events are notifications that are generated automatically when a predefined conditionoccurs or when an object crosses a health threshold. These events enable you to take action toprevent issues that can lead to poor performance and system unavailability. Events include animpact area, severity, and impact level.
What performance events are on page 44Performance events are incidents related to workload performance on a cluster. They help youidentify workloads with slow response times. Together with health events that occurred at the sametime, you can determine the issues that might have caused, or contributed to, the slow responsetimes.
What Event Management System events are on page 49The Event Management System (EMS) collects event data from different parts of the ONTAPkernel and provides event forwarding mechanisms. These ONTAP events can be reported as EMSevents in Unified Manager. Centralized monitoring and management eases configuration of criticalEMS events and alert notifications based on these EMS events.
Managing scripts on page 354You can use scripts to automatically modify or update multiple storage objects in UnifiedManager. The script is associated with an alert. When an event triggers an alert, the script isexecuted. You can upload custom scripts and test their execution when an alert is generated.
What information is contained in an alert emailUnified Manager alert emails provide the type of event, the severity of the event, the name of thepolicy or threshold that was breached to cause the event, and a description of the event. The emailmessage also provides a hyperlink for each event that enables you to view the details page for theevent in the UI.
Alert emails are sent to all users who have subscribed to receive alerts.
If a performance counter or capacity value has a large change during a collection period, it couldcause both a critical and a warning event to be triggered at the same time for the same thresholdpolicy. In this case, you may receive one email for the warning event and one for the critical event.This is because Unified Manager enables you to subscribe separately to receive alerts for warningand critical threshold breaches.
A sample alert email is shown below:
118Managing alerts

Adding alertsYou can configure alerts to notify you when a particular event is generated. You can configurealerts for a single resource, for a group of resources, or for events of a particular severity type. Youcan specify the frequency with which you want to be notified and associate a script to the alert.
Before you begin
• You must have configured notification settings such as the user email address, SMTP server,and SNMP trap host to enable the Active IQ Unified Manager server to use these settings tosend notifications to users when an event is generated.
• You must know the resources and events for which you want to trigger the alert, and the usernames or email addresses of the users that you want to notify.
• If you want to have a script execute based on the event, you must have added the script toUnified Manager by using the Scripts page.
• You must have the Application Administrator or Storage Administrator role.
About this task
You can create an alert directly from the Event details page after receiving an event in addition tocreating an alert from the Alert Setup page, as described here.
Steps
1. In the left navigation pane, click Storage Management > Alert Setup.
2. In the Alert Setup page, click Add.
3. In the Add Alert dialog box, click Name, and enter a name and description for the alert.
119Managing alerts

4. Click Resources, and select the resources to be included in or excluded from the alert.
You can set a filter by specifying a text string in the Name contains field to select a group ofresources. Based on the text string that you specify, the list of available resources displays onlythose resources that match the filter rule. The text string that you specify is case-sensitive.
If a resource conforms to both the include and exclude rules that you have specified, theexclude rule takes precedence over the include rule, and the alert is not generated for eventsrelated to the excluded resource.
5. Click Events, and select the events based on the event name or event severity type for whichyou want to trigger an alert.
Tip: To select more than one event, press the Ctrl key while you make your selections.
6. Click Actions, and select the users that you want to notify, choose the notification frequency,choose whether an SNMP trap will be sent to the trap receiver, and assign a script to beexecuted when an alert is generated.
Note: If you modify the email address that is specified for the user and reopen the alert forediting, the Name field appears blank because the modified email address is no longermapped to the user that was previously selected. Also, if you modified the email address ofthe selected user from the Users page, the modified email address is not updated for theselected user.
You can also choose to notify users through SNMP traps.
7. Click Save.
Example of adding an alert
This example shows how to create an alert that meets the following requirements:
• Alert name: HealthTest
• Resources: includes all volumes whose name contains "abc" and excludes all volumes whosename contains "xyz"
• Events: includes all critical health events
• Actions: includes "[email protected]", a "Test" script, and the user has to be notified every15 minutes
Perform the following steps in the Add Alert dialog box:
1. Click Name, and enter HealthTest in the Alert Name field.
2. Click Resources, and in the Include tab, select Volumes from the drop-down list.
a. Enter abc in the Name contains field to display the volumes whose name contains "abc".
b. Select <<All Volumes whose name contains 'abc'>> from the Available Resources area,and move it to the Selected Resources area.
c. Click Exclude, and enter xyz in the Name contains field, and then click Add.
3. Click Events, and select Critical from the Event Severity field.
4. Select All Critical Events from the Matching Events area, and move it to the Selected Eventsarea.
5. Click Actions, and enter [email protected] in the Alert these users field.
6. Select Remind every 15 minutes to notify the user every 15 minutes.
You can configure an alert to repeatedly send notifications to the recipients for a specified time.You should determine the time from which the event notification is active for the alert.
7. In the Select Script to Execute menu, select Test script.
8. Click Save.
120Managing alerts

Related conceptsHow scripts work with alerts on page 354
You can associate an alert with your script so that the script is executed when an alert is raised foran event in Unified Manager. You can use the scripts to resolve issues with storage objects oridentify which storage objects are generating the events.
Guidelines for adding alerts on page 122You can add alerts based on a resource, such as a cluster, node, aggregate, or volume, and eventsof a particular severity type. As a best practice, you can add an alert for any of your critical objectsafter you have added the cluster to which the object belongs.
What alerts are on page 118While events occur continuously, the Unified Manager generates an alert only when an eventmeets specified filter criteria. You can choose the events for which alerts should be generated—forexample, when a space threshold is exceeded or an object goes offline. You can also associate analert with a script that is executed when an alert is triggered.
Sources of performance events on page 45Performance events are issues related to workload performance on a cluster. They help youidentify storage objects with slow response times, also known as high latency. Together with otherhealth events that occurred at the same time, you can determine the issues that might have caused,or contributed to, the slow response times.
What happens when an event is received on page 52When Unified Manager receives an event, it is displayed in the Dashboard page, in the EventManagement inventory page, in the Summary and Explorer tabs of the Cluster/Performance page,and in the object-specific inventory page (for example, the Volumes/Health inventory page).
Related tasksTesting alerts on page 123
You can test an alert to verify that you have configured it correctly. When an event is triggered, analert is generated, and an alert email is sent to the configured recipients. You can verify whetherthe notification is sent and whether your script is executed by using the test alert.
Enabling and Disabling alerts for Resolved and Obsolete events on page 124For all events that you have configured to send alerts, an alert message is sent when those eventstransition through all available states: New, Acknowledged, Resolved, and Obsolete. If you do notwant to receive alerts for events as they move into the Resolved and Obsolete states, you canconfigure a global setting to suppress those alerts.
Configuring event notification settings on page 53You can configure Unified Manager to send alert notifications when an event is generated or whenan event is assigned to a user. You can configure the SMTP server that is used to send the alert,and you can set various notification mechanisms—for example, alert notifications can be sent asemails or SNMP traps.
Adding users on page 625You can add local users or database users by using the Users page. You can also add remote usersor groups that belong to an authentication server. You can assign roles to these users and, based onthe privileges of the roles, users can manage the storage objects and data with Unified Manager, orview the data in a database.
Creating user-defined performance threshold policies on page 157You create performance threshold policies for storage objects so that notifications are sent when aperformance counter exceeds a specific value. The event notification identifies that the cluster isexperiencing a performance issue.
Related referenceAlert Setup page on page 127
121Managing alerts

The Alert Setup page displays a list of alerts and provides information about the alert name, status,notification method, and notification frequency. You can also add, edit, remove, enable, or disablealerts from this page.
Guidelines for adding alertsYou can add alerts based on a resource, such as a cluster, node, aggregate, or volume, and eventsof a particular severity type. As a best practice, you can add an alert for any of your critical objectsafter you have added the cluster to which the object belongs.
You can use the following guidelines and considerations to create alerts to manage your systemseffectively:
• Alert description
You should provide a description for the alert so that it helps you track your alerts effectively.
• Resources
You should decide which physical or logical resource requires an alert. You can include andexclude resources, as required. For example, if you want to closely monitor your aggregates byconfiguring an alert, you must select the required aggregates from the list of resources.
If you select a category of resources, for example, <<All User or Group Quotas>>, then youwill receive alerts for all objects in that category.
Note: Selecting a cluster as the resource does not automatically select the storage objectswithin that cluster. For example, if you create an alert for all critical events for all clustersyou will receive alerts only for cluster critical events. You will not receive alerts for criticalevents on nodes, aggregates, and so forth.
• Event severity
You should decide if an event of a specified severity type (Critical, Error, Warning) shouldtrigger the alert and, if so, which severity type.
• Selected Events
If you add an alert based on the type of event generated, you should decide which eventsrequire an alert.
If you select an event severity, but do not select any individual events (if you leave the"Selected Events" column empty) then you will receive alerts for all events in the category.
• Actions
You must provide the user names and email addresses of the users who receive the notification.You can also specify an SNMP trap as a mode of notification. You can associate your scripts toan alert so that they are executed when an alert is generated.
• Notification frequency
You can configure an alert to repeatedly send notification to the recipients for a specified time.You should determine the time from which the event notification is active for the alert. If youwant the event notification to be repeated until the event is acknowledged, you shoulddetermine how often you want the notification to be repeated.
• Execute Script
You can associate your script with an alert. Your script is executed when the alert is generated.
Adding alerts for performance eventsYou can configure alerts for individual performance events just like any other events received byUnified Manager. Additionally, if you want to treat all performance events alike and have emailsent to the same person, you can create a single alert to notify you when any critical or warningperformance events are triggered.
Before you begin
You must have the Application Administrator or Storage Administrator role.
122Managing alerts

About this task
The example below shows how to create an event for all critical latency, IOPS, and MBps events.You can use this same methodology to select events from all performance counters, and for allwarning events.
Steps
1. In the left navigation pane, click Storage Management > Alert Setup.
2. In the Alert Setup page, click Add.
3. In the Add Alert dialog box, click Name, and enter a name and description for the alert.
4. Do not select any resources on the Resources page.
Because no resources are selected, the alert is applied to all clusters, aggregates, volumes, andso on, for which these events are received.
5. Click Events and perform the following actions:
a. In the Event Severity list, select Critical.
b. In the Event Name Contains field, enter latency and then click the arrow to select all thematching events.
c. In the Event Name Contains field, enter iops and then click the arrow to select all thematching events.
d. In the Event Name Contains field, enter mbps and then click the arrow to select all thematching events.
6. Click Actions and then select the name of the user who will receive the alert email in the Alertthese users field.
7. Configure any other options on this page for issuing SNMP taps and executing a script.
8. Click Save.
Related tasksCreating user-defined performance threshold policies on page 157
You create performance threshold policies for storage objects so that notifications are sent when aperformance counter exceeds a specific value. The event notification identifies that the cluster isexperiencing a performance issue.
Assigning performance threshold policies to storage objects on page 158You assign a user-defined performance threshold policy to a storage object so that UnifiedManager reports an event if the value of the performance counter exceeds the policy setting.
Testing alertsYou can test an alert to verify that you have configured it correctly. When an event is triggered, analert is generated, and an alert email is sent to the configured recipients. You can verify whetherthe notification is sent and whether your script is executed by using the test alert.
Before you begin
• You must have configured notification settings such as the email address of the recipients,SMTP server, and SNMP trap.
The Unified Manager server can use these settings to send notifications to users when an eventis generated.
• You must have assigned a script and configured the script to run when the alert is generated.
• You must have the Application Administrator role.
Steps
1. In the left navigation pane, click Storage Management > Alert Setup.
123Managing alerts
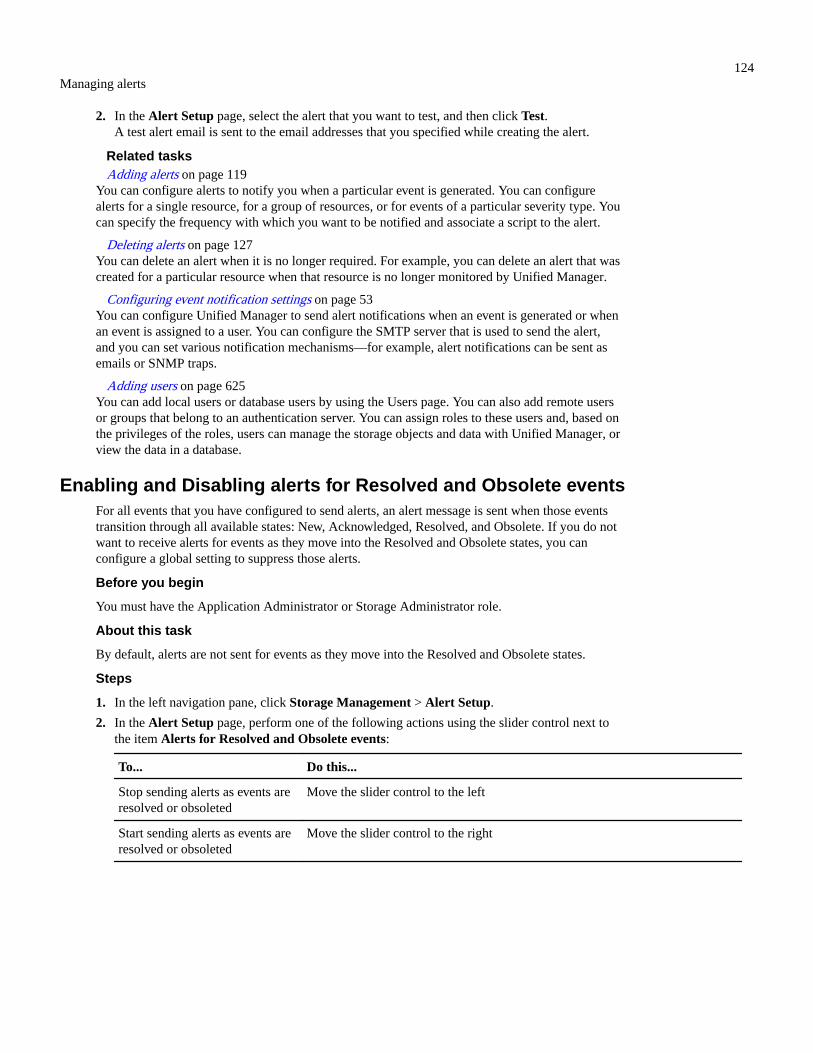
2. In the Alert Setup page, select the alert that you want to test, and then click Test.A test alert email is sent to the email addresses that you specified while creating the alert.
Related tasksAdding alerts on page 119
You can configure alerts to notify you when a particular event is generated. You can configurealerts for a single resource, for a group of resources, or for events of a particular severity type. Youcan specify the frequency with which you want to be notified and associate a script to the alert.
Deleting alerts on page 127You can delete an alert when it is no longer required. For example, you can delete an alert that wascreated for a particular resource when that resource is no longer monitored by Unified Manager.
Configuring event notification settings on page 53You can configure Unified Manager to send alert notifications when an event is generated or whenan event is assigned to a user. You can configure the SMTP server that is used to send the alert,and you can set various notification mechanisms—for example, alert notifications can be sent asemails or SNMP traps.
Adding users on page 625You can add local users or database users by using the Users page. You can also add remote usersor groups that belong to an authentication server. You can assign roles to these users and, based onthe privileges of the roles, users can manage the storage objects and data with Unified Manager, orview the data in a database.
Enabling and Disabling alerts for Resolved and Obsolete eventsFor all events that you have configured to send alerts, an alert message is sent when those eventstransition through all available states: New, Acknowledged, Resolved, and Obsolete. If you do notwant to receive alerts for events as they move into the Resolved and Obsolete states, you canconfigure a global setting to suppress those alerts.
Before you begin
You must have the Application Administrator or Storage Administrator role.
About this task
By default, alerts are not sent for events as they move into the Resolved and Obsolete states.
Steps
1. In the left navigation pane, click Storage Management > Alert Setup.
2. In the Alert Setup page, perform one of the following actions using the slider control next tothe item Alerts for Resolved and Obsolete events:
To... Do this...
Stop sending alerts as events areresolved or obsoleted
Move the slider control to the left
Start sending alerts as events areresolved or obsoleted
Move the slider control to the right
124Managing alerts
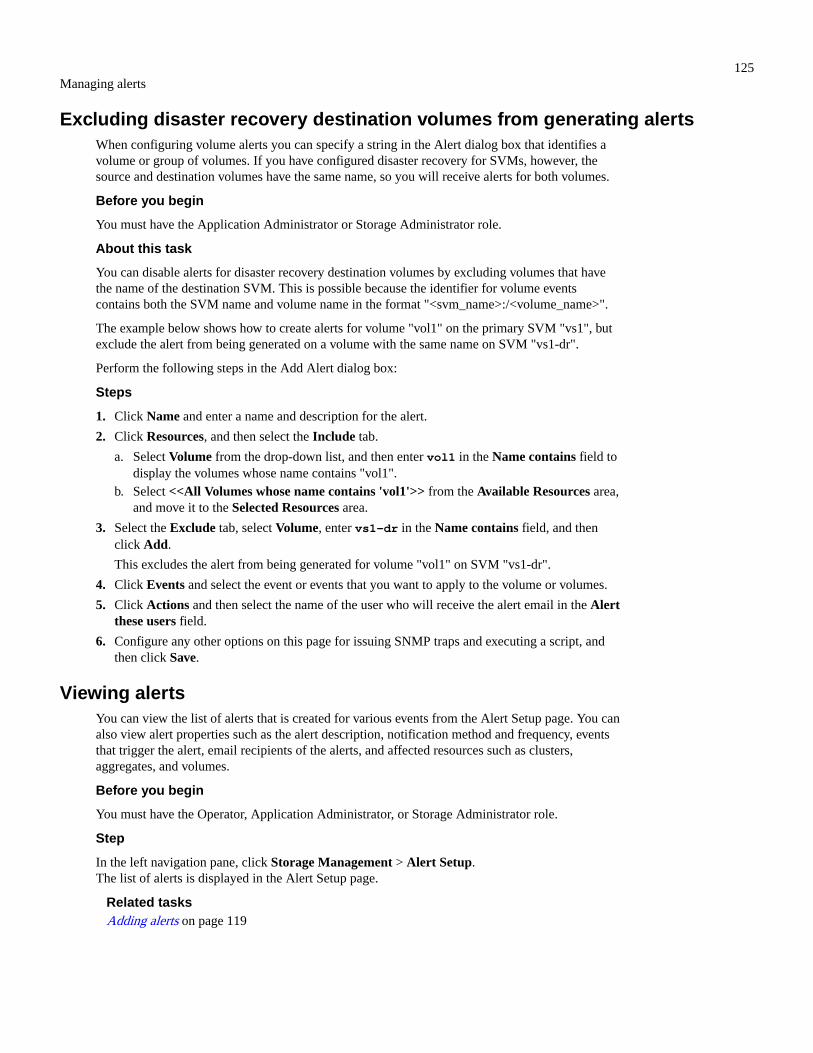
Excluding disaster recovery destination volumes from generating alertsWhen configuring volume alerts you can specify a string in the Alert dialog box that identifies avolume or group of volumes. If you have configured disaster recovery for SVMs, however, thesource and destination volumes have the same name, so you will receive alerts for both volumes.
Before you begin
You must have the Application Administrator or Storage Administrator role.
About this task
You can disable alerts for disaster recovery destination volumes by excluding volumes that havethe name of the destination SVM. This is possible because the identifier for volume eventscontains both the SVM name and volume name in the format "<svm_name>:/<volume_name>".
The example below shows how to create alerts for volume "vol1" on the primary SVM "vs1", butexclude the alert from being generated on a volume with the same name on SVM "vs1-dr".
Perform the following steps in the Add Alert dialog box:
Steps
1. Click Name and enter a name and description for the alert.
2. Click Resources, and then select the Include tab.
a. Select Volume from the drop-down list, and then enter vol1 in the Name contains field todisplay the volumes whose name contains "vol1".
b. Select <<All Volumes whose name contains 'vol1'>> from the Available Resources area,and move it to the Selected Resources area.
3. Select the Exclude tab, select Volume, enter vs1-dr in the Name contains field, and thenclick Add.
This excludes the alert from being generated for volume "vol1" on SVM "vs1-dr".
4. Click Events and select the event or events that you want to apply to the volume or volumes.
5. Click Actions and then select the name of the user who will receive the alert email in the Alertthese users field.
6. Configure any other options on this page for issuing SNMP traps and executing a script, andthen click Save.
Viewing alertsYou can view the list of alerts that is created for various events from the Alert Setup page. You canalso view alert properties such as the alert description, notification method and frequency, eventsthat trigger the alert, email recipients of the alerts, and affected resources such as clusters,aggregates, and volumes.
Before you begin
You must have the Operator, Application Administrator, or Storage Administrator role.
Step
In the left navigation pane, click Storage Management > Alert Setup.The list of alerts is displayed in the Alert Setup page.
Related tasksAdding alerts on page 119
125Managing alerts

You can configure alerts to notify you when a particular event is generated. You can configurealerts for a single resource, for a group of resources, or for events of a particular severity type. Youcan specify the frequency with which you want to be notified and associate a script to the alert.
Deleting alerts on page 127You can delete an alert when it is no longer required. For example, you can delete an alert that wascreated for a particular resource when that resource is no longer monitored by Unified Manager.
Adding users on page 625You can add local users or database users by using the Users page. You can also add remote usersor groups that belong to an authentication server. You can assign roles to these users and, based onthe privileges of the roles, users can manage the storage objects and data with Unified Manager, orview the data in a database.
Enabling and Disabling alerts for Resolved and Obsolete events on page 124For all events that you have configured to send alerts, an alert message is sent when those eventstransition through all available states: New, Acknowledged, Resolved, and Obsolete. If you do notwant to receive alerts for events as they move into the Resolved and Obsolete states, you canconfigure a global setting to suppress those alerts.
Editing alertsYou can edit alert properties such as the resource with which the alert is associated, events,recipients, notification options, notification frequency, and associated scripts.
Before you begin
You must have the Application Administrator role.
Steps
1. In the left navigation pane, click Storage Management > Alert Setup.
2. In the Alert Setup page, select the alert that you want to edit, and click Edit.
3. In the Edit Alert dialog box, edit the name, resources, events, and actions sections, asrequired.
You can change or remove the script that is associated with the alert.
4. Click Save.
Related conceptsWhat alerts are on page 118
While events occur continuously, the Unified Manager generates an alert only when an eventmeets specified filter criteria. You can choose the events for which alerts should be generated—forexample, when a space threshold is exceeded or an object goes offline. You can also associate analert with a script that is executed when an alert is triggered.
Related tasksTesting script execution on page 356
You can verify that your script is executed correctly when an alert is generated for a storage object.
Testing alerts on page 123You can test an alert to verify that you have configured it correctly. When an event is triggered, analert is generated, and an alert email is sent to the configured recipients. You can verify whetherthe notification is sent and whether your script is executed by using the test alert.
Adding users on page 625You can add local users or database users by using the Users page. You can also add remote usersor groups that belong to an authentication server. You can assign roles to these users and, based on
126Managing alerts

the privileges of the roles, users can manage the storage objects and data with Unified Manager, orview the data in a database.
Deleting alertsYou can delete an alert when it is no longer required. For example, you can delete an alert that wascreated for a particular resource when that resource is no longer monitored by Unified Manager.
Before you begin
You must have the Application Administrator role.
Steps
1. In the left navigation pane, click Storage Management > Alert Setup.
2. On the Alert Setup page, select the alerts that you want to delete, and click Delete.
3. Click Yes to confirm the delete request.
Related tasksAdding users on page 625
You can add local users or database users by using the Users page. You can also add remote usersor groups that belong to an authentication server. You can assign roles to these users and, based onthe privileges of the roles, users can manage the storage objects and data with Unified Manager, orview the data in a database.
Description of alert windows and dialog boxesYou should configure alerts to receive notifications about events by using the Add Alert dialogbox. You can also view the list of alerts from the Alert Setup page.
Alert Setup pageThe Alert Setup page displays a list of alerts and provides information about the alert name, status,notification method, and notification frequency. You can also add, edit, remove, enable, or disablealerts from this page.
You must have the Application Administrator or Storage Administrator role.
• Command buttons• List view• Details area
Command buttons
Add
Displays the Add Alert dialog box, which enables you to add new alerts.
Edit
Displays the Edit Alert dialog box, which enables you to edit selected alerts.
Delete
Deletes the selected alerts.
Enable
Enables the selected alerts to send notifications.
Disable
Disables the selected alerts when you want to temporarily stop sending notifications.
127Managing alerts

Test
Tests the selected alerts to verify their configuration after being added or edited.
Alerts for Resolved and Obsolete Events
Allows you to enable or disable the sending of alerts when events are moved to theResolved or Obsolete states. This can help users from receiving unnecessary notifications.
List view
The list view displays, in tabular format, information about the alerts that are created. You can usethe column filters to customize the data that is displayed. You can also select an alert to view moreinformation about it in the details area.
Status
Specifies whether an alert is enabled ( ) or disabled ( ).
Alert
Displays the name of the alert.
Description
Displays a description for the alert.
Notification Method
Displays the notification method that is selected for the alert. You can notify users throughemail or SNMP traps.
Notification Frequency
Specifies the frequency (in minutes) with which the management server continues to sendnotifications until the event is acknowledged, resolved, or moved to the Obsolete state.
Details area
The details area provides more information about the selected alert.
Alert Name
Displays the name of the alert.
Alert Description
Displays a description for the alert.
Events
Displays the events for which you want to trigger the alert.
Resources
Displays the resources for which you want to trigger the alert.
Includes
Displays the group of resources for which you want to trigger the alert.
Excludes
Displays the group of resources for which you do not want to trigger the alert.
Notification Method
Displays the notification method for the alert.
Notification Frequency
Displays the frequency with which the management server continues to send alertnotifications until the event is acknowledged, resolved, or moved to the Obsolete state.
128Managing alerts

Script Name
Displays the name of the script associated with the selected alert. This script is executedwhen an alert is generated.
Email Recipients
Displays the email addresses of users who receive the alert notification.
Related conceptsSources of performance events on page 45
Performance events are issues related to workload performance on a cluster. They help youidentify storage objects with slow response times, also known as high latency. Together with otherhealth events that occurred at the same time, you can determine the issues that might have caused,or contributed to, the slow response times.
What happens when an event is received on page 52When Unified Manager receives an event, it is displayed in the Dashboard page, in the EventManagement inventory page, in the Summary and Explorer tabs of the Cluster/Performance page,and in the object-specific inventory page (for example, the Volumes/Health inventory page).
Related tasksAdding alerts on page 119
You can configure alerts to notify you when a particular event is generated. You can configurealerts for a single resource, for a group of resources, or for events of a particular severity type. Youcan specify the frequency with which you want to be notified and associate a script to the alert.
Testing alerts on page 123You can test an alert to verify that you have configured it correctly. When an event is triggered, analert is generated, and an alert email is sent to the configured recipients. You can verify whetherthe notification is sent and whether your script is executed by using the test alert.
Enabling and Disabling alerts for Resolved and Obsolete events on page 124For all events that you have configured to send alerts, an alert message is sent when those eventstransition through all available states: New, Acknowledged, Resolved, and Obsolete. If you do notwant to receive alerts for events as they move into the Resolved and Obsolete states, you canconfigure a global setting to suppress those alerts.
Editing alerts on page 126You can edit alert properties such as the resource with which the alert is associated, events,recipients, notification options, notification frequency, and associated scripts.
Deleting alerts on page 127You can delete an alert when it is no longer required. For example, you can delete an alert that wascreated for a particular resource when that resource is no longer monitored by Unified Manager.
Related referenceList of events and severity types on page 71
You can use the list of events to become more familiar with event categories, event names, and theseverity type of each event that you might see in Unified Manager. Events are listed in alphabeticalorder by object category.
Add Alert dialog boxYou can create alerts to notify you when a particular event is generated, so that you can address theissue quickly and thereby minimize impact to your environment. You can create alerts for a singleresource or a set of resources, and for events of a particular severity type. You can also specify thenotification method and frequency of the alerts.
You must have the Application Administrator or Storage Administrator role.
129Managing alerts

Name
This area enables you to specify a name and description for the alert:
Alert Name
Enables you to specify an alert name.
Alert Description
Enables you to specify a description for the alert.
Resources
This area enables you to select an individual resource or group the resources based on a dynamicrule for which you want to trigger the alert. A dynamic rule is the set of resources filtered based onthe text string you specify. You can search for resources by selecting a resource type from thedrop-down list or you can specify the exact resource name to display a specific resource.
If you are creating an alert from any of the storage object details pages, the storage object isautomatically included in the alert.
Include
Enables you to include the resources for which you want to trigger alerts. You can specify atext string to group resources that match the string and select this group to be included inthe alert. For example, you can group all volumes whose name contains the "abc" string.
Exclude
Enables you to exclude resources for which you do not want to trigger alerts. For example,you can exclude all volumes whose name contains the "xyz" string.
The Exclude tab is displayed only when you select all resources of a particular resourcetype: for example, <<All Volumes>> or <<All Volumes whose name contains 'xyz'>>.
If a resource conforms to both the include and exclude rules that you have specified, theexclude rule takes precedence over the include rule and the alert is not generated for theevent.
Events
This area enables you to select the events for which you want to create the alerts. You can createalerts for events based on a particular severity or for a set of events.
To select more than one event, you should hold down the Ctrl key while you make your selections.
Event Severity
Enables you to select events based on the severity type, which can be Critical, Error, orWarning.
Event Name Contains
Enables you to select events whose name contains specified characters.
Actions
This area enables you to specify the users that you want to notify when an alert is triggered. Youcan also specify the notification method and the frequency of notification.
Alert these users
Enables you to specify the email address or user name of the user to receive notifications.
If you modify the email address that is specified for the user and reopen the alert forediting, the Name field appears blank because the modified email address is no longermapped to the user that was previously selected. Also, if you have modified the email
130Managing alerts

address of the selected user from the Users page, the modified email address is not updatedfor the selected user.
Notification Frequency
Enables you to specify the frequency with which the management server sends notificationsuntil the event is acknowledged, resolved, or moved to the obsolete state.
You can choose the following notification methods:
• Notify only once
• Notify at a specified frequency
• Notify at a specified frequency within the specified time range
Issue SNMP trap
Selecting this box enables you to specify whether SNMP traps should be sent to theglobally configured SNMP host.
Execute Script
Enables you to add your custom script to the alert. This script is executed when an alert isgenerated.
Note: If you do not see this capability available in the user interface it is because thefunctionality has been disabled by your administrator. If required, you can enable thisfunctionality from Storage Management > Feature Settings.
Command buttons
Save
Creates an alert and closes the dialog box.
Cancel
Discards the changes and closes the dialog box.
Related tasksAdding alerts on page 119
You can configure alerts to notify you when a particular event is generated. You can configurealerts for a single resource, for a group of resources, or for events of a particular severity type. Youcan specify the frequency with which you want to be notified and associate a script to the alert.
Edit Alert dialog boxYou can edit alert properties such as the resource with which the alert is associated, events, script,and notification options.
Name
This area enables you to edit the name and description for the alert.
Alert Name
Enables you to edit the alert name.
Alert Description
Enables you to specify a description for the alert.
Alert State
Enables you to enable or disable the alert.
Resources
This area enables you to select an individual resource or group the resources based on a dynamicrule for which you want to trigger the alert. You can search for resources by selecting a resource
131Managing alerts

type from the drop-down list or you can specify the exact resource name to display a specificresource.
Include
Enables you to include the resources for which you want to trigger alerts. You can specify atext string to group resources that match the string and select this group to be included inthe alert. For example, you can group all volumes whose name contains the "vol0" string.
Exclude
Enables you to exclude resources for which you do not want to trigger alerts. For example,you can exclude all volumes whose name contains the "xyz" string.
Note: The Exclude tab is displayed only when you select all resources of a particularresource type—for example, <<All Volumes>> or <<All Volumes whose name contains'xyz'>>.
Events
This area enables you to select the events for which you want to trigger the alerts. You can triggeran alert for events based on a particular severity or for a set of events.
Event Severity
Enables you to select events based on the severity type, which can be Critical, Error, orWarning.
Event Name Contains
Enables you to select events whose name contains the specified characters.
Actions
This area enables you to specify the notification method and the frequency of notification.
Alert these users
Enables you to edit the email address or user name, or specify a new email address or username to receive notifications.
Notification Frequency
Enables you to edit the frequency with which the management server sends notificationsuntil the event is acknowledged, resolved, or moved to the obsolete state.
You can choose the following notification methods:
• Notify only once
• Notify at a specified frequency
• Notify at a specified frequency within the specified time range
Issue SNMP trap
Enables you to specify whether SNMP traps should be sent to the globally configuredSNMP host.
Execute Script
Enables you to associate a script with the alert. This script is executed when an alert isgenerated.
Command buttons
Save
Saves the changes and closes the dialog box.
Cancel
Discards the changes and closes the dialog box.
132Managing alerts

Related tasksEditing alerts on page 126
You can edit alert properties such as the resource with which the alert is associated, events,recipients, notification options, notification frequency, and associated scripts.
133Managing alerts

Managing health thresholds
You can configure global health threshold values for all the aggregates, volumes, and qtrees totrack any health threshold breaches.
What storage capacity health thresholds areA storage capacity health threshold is the point at which the Unified Manager server generatesevents to report any capacity problem with storage objects. You can configure alerts to sendnotification whenever such events occurs.
The storage capacity health thresholds for all aggregates, volumes, and qtrees are set to defaultvalues. You can change the settings as required for an object or a group of objects.
Configuring global health threshold settingsYou can configure global health threshold conditions for capacity, growth, Snapshot reserve,quotas, and inodes to monitor your aggregate, volume, and qtree size effectively. You can also editthe settings for generating events for exceeding lag thresholds.
About this task
Global health threshold settings apply to all objects with which they are associated, such asaggregates, volumes, and so forth. When thresholds are crossed, an event is generated and, if alertsare configured, an alert notification is sent. Threshold defaults are set to recommended values, butyou can modify them to generate events at intervals to meet your specific needs. When thresholdsare changed, events are generated or obsoleted in the next monitoring cycle.
Global health threshold settings are accessible from the Event Thresholds section of the left-navigation menu. You can also modify threshold settings for individual objects, from the inventorypage or the details page for that object.
Choices
• Configuring global aggregate health threshold values
You can configure the health threshold settings for capacity, growth, and Snapshot copies forall aggregates to track any threshold breach.
• Configuring global volume health threshold values
You can edit the health threshold settings for capacity, Snapshot copies, qtree quotas, volumegrowth, overwrite reserve space, and inodes for all volumes to track any threshold breach.
• Configuring global qtree health threshold values
You can edit the health threshold settings for capacity for all qtrees to track any thresholdbreach.
• Editing lag health threshold settings for unmanaged protection relationships
You can increase or decrease the warning or error lag time percentage so that events aregenerated at intervals that are more appropriate to your needs.
Configuring global aggregate health threshold valuesYou can configure global health threshold values for all aggregates to track any threshold breach.Appropriate events are generated for threshold breaches and you can take preventive measuresbased on these events. You can configure the global values based on the best practice settings forthresholds that apply to all monitored aggregates.
Before you begin
You must have the Application Administrator or Storage Administrator role.
134Managing health thresholds
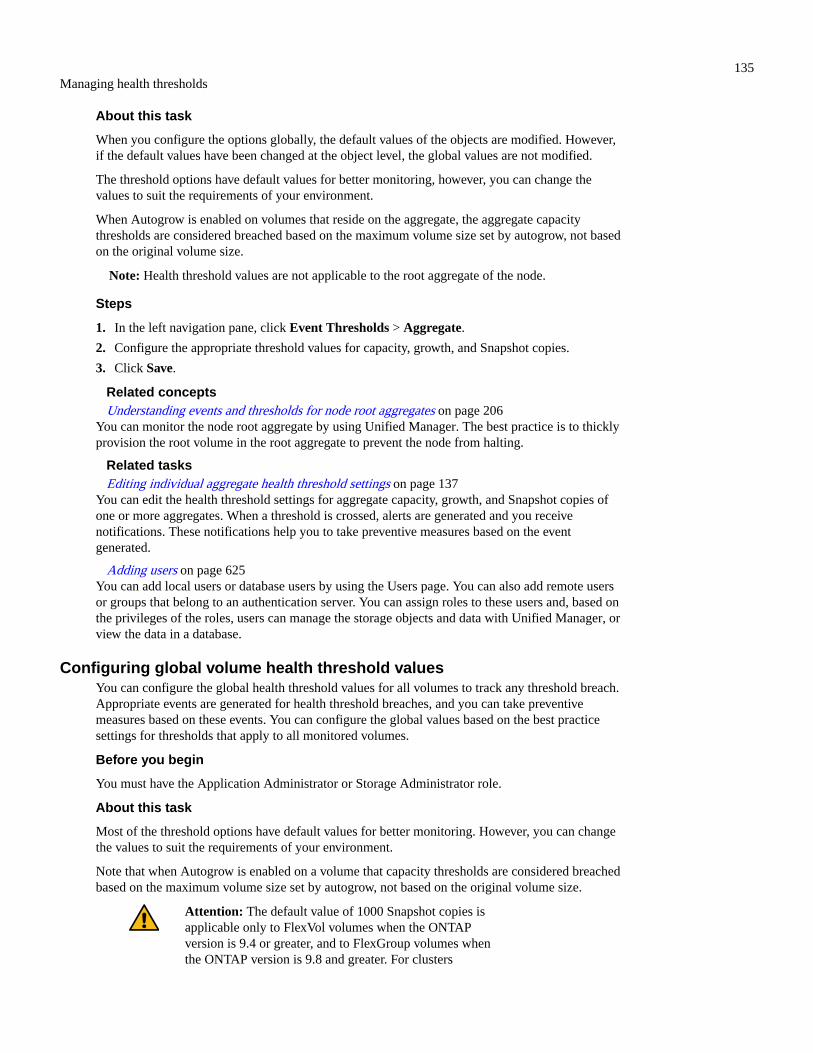
About this task
When you configure the options globally, the default values of the objects are modified. However,if the default values have been changed at the object level, the global values are not modified.
The threshold options have default values for better monitoring, however, you can change thevalues to suit the requirements of your environment.
When Autogrow is enabled on volumes that reside on the aggregate, the aggregate capacitythresholds are considered breached based on the maximum volume size set by autogrow, not basedon the original volume size.
Note: Health threshold values are not applicable to the root aggregate of the node.
Steps
1. In the left navigation pane, click Event Thresholds > Aggregate.
2. Configure the appropriate threshold values for capacity, growth, and Snapshot copies.
3. Click Save.
Related conceptsUnderstanding events and thresholds for node root aggregates on page 206
You can monitor the node root aggregate by using Unified Manager. The best practice is to thicklyprovision the root volume in the root aggregate to prevent the node from halting.
Related tasksEditing individual aggregate health threshold settings on page 137
You can edit the health threshold settings for aggregate capacity, growth, and Snapshot copies ofone or more aggregates. When a threshold is crossed, alerts are generated and you receivenotifications. These notifications help you to take preventive measures based on the eventgenerated.
Adding users on page 625You can add local users or database users by using the Users page. You can also add remote usersor groups that belong to an authentication server. You can assign roles to these users and, based onthe privileges of the roles, users can manage the storage objects and data with Unified Manager, orview the data in a database.
Configuring global volume health threshold valuesYou can configure the global health threshold values for all volumes to track any threshold breach.Appropriate events are generated for health threshold breaches, and you can take preventivemeasures based on these events. You can configure the global values based on the best practicesettings for thresholds that apply to all monitored volumes.
Before you begin
You must have the Application Administrator or Storage Administrator role.
About this task
Most of the threshold options have default values for better monitoring. However, you can changethe values to suit the requirements of your environment.
Note that when Autogrow is enabled on a volume that capacity thresholds are considered breachedbased on the maximum volume size set by autogrow, not based on the original volume size.
Attention: The default value of 1000 Snapshot copies isapplicable only to FlexVol volumes when the ONTAPversion is 9.4 or greater, and to FlexGroup volumes whenthe ONTAP version is 9.8 and greater. For clusters
135Managing health thresholds
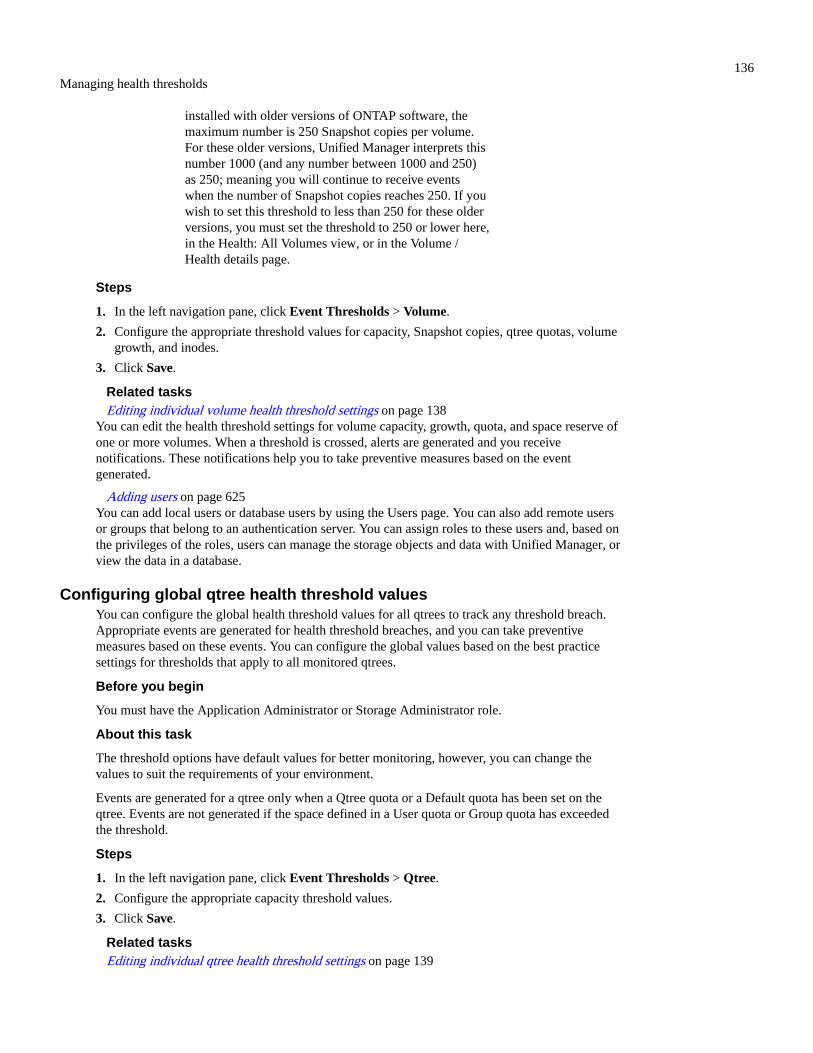
installed with older versions of ONTAP software, themaximum number is 250 Snapshot copies per volume.For these older versions, Unified Manager interprets thisnumber 1000 (and any number between 1000 and 250)as 250; meaning you will continue to receive eventswhen the number of Snapshot copies reaches 250. If youwish to set this threshold to less than 250 for these olderversions, you must set the threshold to 250 or lower here,in the Health: All Volumes view, or in the Volume /Health details page.
Steps
1. In the left navigation pane, click Event Thresholds > Volume.
2. Configure the appropriate threshold values for capacity, Snapshot copies, qtree quotas, volumegrowth, and inodes.
3. Click Save.
Related tasksEditing individual volume health threshold settings on page 138
You can edit the health threshold settings for volume capacity, growth, quota, and space reserve ofone or more volumes. When a threshold is crossed, alerts are generated and you receivenotifications. These notifications help you to take preventive measures based on the eventgenerated.
Adding users on page 625You can add local users or database users by using the Users page. You can also add remote usersor groups that belong to an authentication server. You can assign roles to these users and, based onthe privileges of the roles, users can manage the storage objects and data with Unified Manager, orview the data in a database.
Configuring global qtree health threshold valuesYou can configure the global health threshold values for all qtrees to track any threshold breach.Appropriate events are generated for health threshold breaches, and you can take preventivemeasures based on these events. You can configure the global values based on the best practicesettings for thresholds that apply to all monitored qtrees.
Before you begin
You must have the Application Administrator or Storage Administrator role.
About this task
The threshold options have default values for better monitoring, however, you can change thevalues to suit the requirements of your environment.
Events are generated for a qtree only when a Qtree quota or a Default quota has been set on theqtree. Events are not generated if the space defined in a User quota or Group quota has exceededthe threshold.
Steps
1. In the left navigation pane, click Event Thresholds > Qtree.
2. Configure the appropriate capacity threshold values.
3. Click Save.
Related tasksEditing individual qtree health threshold settings on page 139
136Managing health thresholds

You can edit the health threshold settings for qtree capacity for one or more qtrees. When athreshold is crossed, alerts are generated and you receive notifications. These notifications helpyou to take preventive measures based on the event generated.
Configuring lag threshold settings for unmanaged protection relationshipsYou can edit the global default lag warning and error health threshold settings for unmanagedprotection relationships so that events are generated at intervals that are appropriate to your needs.
Before you begin
You must have the Application Administrator or Storage Administrator role.
About this task
The lag time must be no more than the defined transfer schedule interval. For example, if thetransfer schedule is hourly, then the lag time must not be more than one hour. The lag thresholdspecifies a percentage that the lag time must not exceed. Using the example of one hour, if the lagthreshold is defined as 150%, then you will receive an event when the lag time is more than 1.5hours.
The settings described in this task are applied globally to all unmanaged protection relationships.The settings cannot be specified and applied exclusively to one unmanaged protection relationship.
Steps
1. In the left navigation pane, click Event Thresholds > Relationship.
2. Increase or decrease the global default warning or error lag time percentage as required.
3. To disable a warning or error event from being triggered from any lag threshold amount,uncheck the box next to Enabled.
4. Click Save.
Related tasksAdding users on page 625
You can add local users or database users by using the Users page. You can also add remote usersor groups that belong to an authentication server. You can assign roles to these users and, based onthe privileges of the roles, users can manage the storage objects and data with Unified Manager, orview the data in a database.
Editing individual aggregate health threshold settingsYou can edit the health threshold settings for aggregate capacity, growth, and Snapshot copies ofone or more aggregates. When a threshold is crossed, alerts are generated and you receivenotifications. These notifications help you to take preventive measures based on the eventgenerated.
Before you begin
You must have the Application Administrator or Storage Administrator role.
About this task
Based on changes to the threshold values, events are generated or obsoleted in the next monitoringcycle.
When Autogrow is enabled on volumes that reside on the aggregate, the aggregate capacitythresholds are considered breached based on the maximum volume size set by autogrow, not basedon the original volume size.
Steps
1. In the left navigation pane, click Storage > Aggregates.
137Managing health thresholds

2. In the Health: All Aggregates view, select one or more aggregates and then click EditThresholds.
3. In the Edit Aggregate Thresholds dialog box, edit the threshold settings of one of thefollowing: capacity, growth, or Snapshot copies by selecting the appropriate check box andthen modifying the settings.
4. Click Save.
Related conceptsUnderstanding events and thresholds for node root aggregates on page 206
You can monitor the node root aggregate by using Unified Manager. The best practice is to thicklyprovision the root volume in the root aggregate to prevent the node from halting.
Related tasksConfiguring global aggregate health threshold values on page 134
You can configure global health threshold values for all aggregates to track any threshold breach.Appropriate events are generated for threshold breaches and you can take preventive measuresbased on these events. You can configure the global values based on the best practice settings forthresholds that apply to all monitored aggregates.
Adding users on page 625You can add local users or database users by using the Users page. You can also add remote usersor groups that belong to an authentication server. You can assign roles to these users and, based onthe privileges of the roles, users can manage the storage objects and data with Unified Manager, orview the data in a database.
Editing individual volume health threshold settingsYou can edit the health threshold settings for volume capacity, growth, quota, and space reserve ofone or more volumes. When a threshold is crossed, alerts are generated and you receivenotifications. These notifications help you to take preventive measures based on the eventgenerated.
Before you begin
You must have the Application Administrator or Storage Administrator role.
About this task
Based on changes to the threshold values, events are generated or obsoleted in the next monitoringcycle.
Note that when Autogrow is enabled on a volume that capacity thresholds are considered breachedbased on the maximum volume size set by autogrow, not based on the original volume size.
Attention: The default value of 1000 Snapshot copies isapplicable only to FlexVol volumes when the ONTAPversion is 9.4 or greater, and to FlexGroup volumes whenthe ONTAP version is 9.8 and greater. For clustersinstalled with older versions of ONTAP software, themaximum number is 250 Snapshot copies per volume.For these older versions, Unified Manager interprets thisnumber 1000 (and any number between 1000 and 250)as 250; meaning you will continue to receive eventswhen the number of Snapshot copies reaches 250. If youwish to set this threshold to less than 250 for these olderversions, you must set the threshold to 250 or lower here,in the Health: All Volumes view, or in the Volume /Health details page.
138Managing health thresholds

Steps
1. In the left navigation pane, click Storage > Volumes.
2. In the Health: All Volumes view, select one or more volumes and then click Edit Thresholds.
3. In the Edit Volume Thresholds dialog box, edit the threshold settings of one of the following:capacity, Snapshot copies, qtree quota, growth, or inodes by selecting the appropriate checkbox and then modifying the settings.
4. Click Save.
Related tasksConfiguring global volume health threshold values on page 135
You can configure the global health threshold values for all volumes to track any threshold breach.Appropriate events are generated for health threshold breaches, and you can take preventivemeasures based on these events. You can configure the global values based on the best practicesettings for thresholds that apply to all monitored volumes.
Adding users on page 625You can add local users or database users by using the Users page. You can also add remote usersor groups that belong to an authentication server. You can assign roles to these users and, based onthe privileges of the roles, users can manage the storage objects and data with Unified Manager, orview the data in a database.
Editing individual qtree health threshold settingsYou can edit the health threshold settings for qtree capacity for one or more qtrees. When athreshold is crossed, alerts are generated and you receive notifications. These notifications helpyou to take preventive measures based on the event generated.
Before you begin
You must have the Application Administrator or Storage Administrator role.
About this task
Based on changes to the threshold values, events are generated or obsoleted in the next monitoringcycle.
Steps
1. In the left navigation pane, click Storage > Qtrees.
2. In the Capacity: All Qtrees view, select one or more qtrees and then click Edit Thresholds.
3. In the Edit Qtree Thresholds dialog box, change the capacity thresholds for the selected qtreeor qtrees and click Save.
Note: You can also set individual qtree thresholds from the Qtrees tab on the Storage VM /Health details page.
Related tasksConfiguring global qtree health threshold values on page 136
You can configure the global health threshold values for all qtrees to track any threshold breach.Appropriate events are generated for health threshold breaches, and you can take preventive
139Managing health thresholds
measures based on these events. You can configure the global values based on the best practicesettings for thresholds that apply to all monitored qtrees.
Description of health thresholds pagesYou can use the appropriate Health Thresholds page to configure global health threshold values foraggregates and volumes, and configure global lag warning and error threshold values forunmanaged protection relationships.
Aggregate Thresholds pageThe Aggregate Thresholds page enables you to configure global health threshold values formonitored aggregates. When you configure the options globally, the default values of all objectsare modified. However, if the default values have been changed at the object level, the globalvalues are not modified.
You must have the Application Administrator or Storage Administrator role.
Events are generated when a threshold is breached. You can take corrective actions for suchevents.
The threshold values are not applicable to the root aggregate of the node.
You can set aggregate health thresholds for the following: capacity, aggregate growth, andaggregate Snapshot copies.
• Capacity• Growth• Snapshot Copies
Capacity area
The Capacity area enables you to set the following aggregate capacity threshold conditions. Notethat when Autogrow is enabled on volumes that reside on the aggregate, the aggregate capacitythresholds are considered breached based on the maximum volume size set by autogrow, not basedon the original volume size.
Space Nearly Full
Specifies the percentage at which an aggregate is considered to be nearly full:
• Default value: 80 percent
The value for this threshold must be lower than the value for the Aggregate Fullthreshold for the management server to generate an event.
• Event generated: Aggregate Nearly Full
• Event severity: Warning
Space Full
Specifies the percentage at which an aggregate is considered full:
• Default value: 90 percent
• Event generated: Aggregate Full
• Event severity: Error
Nearly Overcommitted
Specifies the percentage at which an aggregate is considered to be nearly overcommitted:
• Default value: 95 percent
The value for this threshold must be lower than the value for the AggregateOvercommitted Full threshold for the management server to generate an event.
• Event generated: Aggregate Nearly Overcommitted
140Managing health thresholds

• Event severity: Warning
Overcommitted
Specifies the percentage at which an aggregate is considered to be overcommitted:
• Default value: 100 percent
• Event generated: Aggregate Overcommitted
• Event severity: Error
Days Until Full
Specifies the number of days remaining before the aggregate reaches full capacity:
• Default value: 15 (this is also the minimum value)
• Event generated: Aggregate Days Until Full
• Event severity: Error
Growth area
The Growth area enables you to set the following threshold conditions for aggregate growth:
Growth Rate
Specifies the percentage at which an aggregate's growth rate is considered to be normalbefore the system generates an Aggregate Growth Rate Abnormal event:
• Default value: 1 percent
• Event generated: Aggregate Growth Rate Abnormal
• Event severity: Warning
Growth Rate Sensitivity
Specifies the factor that is applied to the standard deviation of an aggregate's growth rate. Ifthe growth rate exceeds the factored standard deviation, an Aggregate Growth RateAbnormal event is generated.
A lower value for growth rate sensitivity indicates that the aggregate is highly sensitive tochanges in the growth rate. The range for the growth rate sensitivity is 1 through 5.
• Default value: 2
Note: If you modify the growth rate sensitivity for aggregates at the global thresholdlevel, the change is also applied to the growth rate sensitivity for volumes at the globalthreshold level.
Snapshot copies area
The Snapshot copies area enables you to set the following Snapshot reserve threshold conditions:
Snapshot Reserve Full
Specifies the percentage at which an aggregate has consumed all the space reserved forSnapshot copies:
• Default value: 90 percent
• Event generated: Aggregate Snapshot Reserve Full
• Event severity: Warning
Related conceptsUnderstanding events and thresholds for node root aggregates on page 206
141Managing health thresholds
You can monitor the node root aggregate by using Unified Manager. The best practice is to thicklyprovision the root volume in the root aggregate to prevent the node from halting.
Related tasksConfiguring global aggregate health threshold values on page 134
You can configure global health threshold values for all aggregates to track any threshold breach.Appropriate events are generated for threshold breaches and you can take preventive measuresbased on these events. You can configure the global values based on the best practice settings forthresholds that apply to all monitored aggregates.
Editing individual aggregate health threshold settings on page 137You can edit the health threshold settings for aggregate capacity, growth, and Snapshot copies ofone or more aggregates. When a threshold is crossed, alerts are generated and you receivenotifications. These notifications help you to take preventive measures based on the eventgenerated.
Volume Thresholds pageThe Volume Thresholds page enables you to configure global health threshold values formonitored volumes. You can set thresholds for individual volumes or for all the volumes globally.When you configure the options globally, the default values of all objects are modified. However,if the default values have been changed at the object level, the global values are not modified.
You must have the Application Administrator or Storage Administrator role.
Events are generated when a threshold is breached. You can take corrective actions for suchevents.
You can set thresholds for the following: capacity, volume Snapshot copies, qtree quotas, volumegrowth, and inodes.
• Capacity area• Snapshot Copies area• Qtree Quota area• Growth area• Inodes area
Capacity area
The Capacity area enables you to set the following volume capacity threshold conditions. Notethat when Autogrow is enabled on a volume that capacity thresholds are considered breachedbased on the maximum volume size set by autogrow, not based on the original volume size.
Space Nearly Full
Specifies the percentage at which a volume is considered to be nearly full:
• Default value: 80 percent
The value for this threshold must be lower than the value for the Volume Full thresholdin order for the management server to generate an event.
• Event generated: Volume Nearly Full
• Event severity: Warning
Space Full
Specifies the percentage at which a volume is considered full:
• Default value: 90 percent
• Event generated: Volume Full
• Event Severity: Error
142Managing health thresholds

Days Until Full
Specifies the number of days remaining before the volume reaches full capacity:
• Default value: 15 (this is also the minimum value)
• Event generated: Volume Days Until Full
• Event severity: Error
Snapshot copies area
The Snapshot copies area enables you to set the following threshold conditions for the Snapshotcopies in the volume:
Snapshot Reserve Full
Specifies the percentage at which the space reserved for Snapshot copies is considered full:
• Default value: 90 percent
• Event generated: Volume Snapshot Reserve Full
• Event severity: Error
Days Until Full
Specifies the number of days remaining before the space reserved for Snapshot copiesreaches full capacity:
• Default value: 7
• Event generated: Volume Snapshot Reserve Days Until Full
• Event severity: Error
Count
Specifies the number of Snapshot copies on a volume that are considered to be too many:
• Default value: 1000
• Event generated: Too Many Snapshot Copies
• Event severity: Error
The number of Snapshot copies that are considered the maximum per volume beforeUnified Manager triggers an event is lower than the ONTAP maximum:
ONTAP Maximum Unified ManagerMaximum
FlexVol volumes running ONTAP 9.3 or earlier andFlexGroup volumes running ONTAP 9.7 or earlier
255 250
FlexVol volumes running ONTAP 9.4 or greater andFlexGroup volumes running ONTAP 9.8 or greater
1023 1000
Qtree Quota area
The Qtree Quota area enables you to set the following volume quota threshold conditions:
Nearly Overcommitted
Specifies the percentage at which a volume is considered to be nearly overcommitted byqtree quotas:
• Default value: 95 percent
• Event generated: Volume Qtree Quota Nearly Overcommitted
• Event severity: Warning
143Managing health thresholds

Overcommitted
Specifies the percentage at which a volume is considered to be overcommitted by qtreequotas:
• Default value: 100 percent
• Event generated: Volume Qtree Quota Overcommitted
• Event severity: Error
Growth area
The Growth area enables you to set the following threshold conditions for volume growth:
Growth Rate
Specifies the percentage at which a volume's growth rate is considered to be normal beforethe system generates a Volume Growth Rate Abnormal event:
• Default value: 1 percent
• Event generated: Volume Growth Rate Abnormal
• Event severity: Warning
Growth Rate Sensitivity
Specifies the factor that is applied to the standard deviation of a volume's growth rate. If thegrowth rate exceeds the factored standard deviation, a Volume Growth Rate Abnormal eventis generated.
A lower value for growth rate sensitivity indicates that the volume is highly sensitive tochanges in the growth rate. The range for the growth rate sensitivity is 1 through 5.
• Default value: 2
Note: If you modify the growth rate sensitivity for volumes at the global threshold level,the change is also applied to the growth rate sensitivity for aggregates at the globalthreshold level.
Inodes area
The Inodes area enables you to set the following threshold conditions for inodes:
Nearly Full
Specifies the percentage at which a volume is considered to have consumed most of itsinodes:
• Default value: 80 percent
• Event generated: Inodes Nearly Full
• Event severity: Warning
Full
Specifies the percentage at which a volume is considered to have consumed all of its inodes:
• Default value: 90 percent
• Event generated: Inodes Full
• Event severity: Error
Related tasksConfiguring global volume health threshold values on page 135
You can configure the global health threshold values for all volumes to track any threshold breach.Appropriate events are generated for health threshold breaches, and you can take preventive
144Managing health thresholds

measures based on these events. You can configure the global values based on the best practicesettings for thresholds that apply to all monitored volumes.
Editing individual volume health threshold settings on page 138You can edit the health threshold settings for volume capacity, growth, quota, and space reserve ofone or more volumes. When a threshold is crossed, alerts are generated and you receivenotifications. These notifications help you to take preventive measures based on the eventgenerated.
Relationship Thresholds pageThe Relationship Thresholds page enables you to configure global lag warning and error thresholdvalues for unmanaged protection relationships so that you are notified and can take action whenlag or threshold errors occur. Changes to these settings are applied during the next scheduledupdate.
You must have the Application Administrator or Storage Administrator role.
Events are generated when a threshold is breached. You can take corrective actions for suchevents. Lag threshold settings for unmanaged relationships are enabled by default.
The lag threshold specifies a percentage that the lag time must not exceed. Using an example ofone hour, if the lag threshold is defined as 150%, then you will receive an event when the lag timeis more than 1.5 hours.
Lag Thresholds for Unmanaged Relationships area
The Lag area enables you set unmanaged relationship lag thresholds for the following conditions:
Warning
Specifies the percentage at which the lag duration equals or exceeds the lag warningthreshold:
• Default value: 150 percent
• Events generated: SnapMirror Relationship Lag Warning or SnapVault Relationship LagWarning
• Event severity: Warning
Error
Specifies the percentage at which the lag duration equals or exceeds the lag error threshold:
• Default value: 250 percent
• Events generated: SnapMirror Relationship Lag Error or SnapVault Relationship LagError
• Event severity: Error
Additionally, you can disable a warning or error event from being triggered from any lag thresholdamount by unchecking the box next to Enabled.
Related tasksConfiguring lag threshold settings for unmanaged protection relationships on page 137
You can edit the global default lag warning and error health threshold settings for unmanagedprotection relationships so that events are generated at intervals that are appropriate to your needs.
Editing individual aggregate health threshold settings on page 137You can edit the health threshold settings for aggregate capacity, growth, and Snapshot copies ofone or more aggregates. When a threshold is crossed, alerts are generated and you receive
145Managing health thresholds

notifications. These notifications help you to take preventive measures based on the eventgenerated.
Qtree Thresholds pageThe Qtree Thresholds page enables you to configure global capacity threshold values formonitored qtrees. Events are generated for a qtree only when a Qtree quota or a Default quota hasbeen set on the qtree. Events are not generated if the space defined in a User quota or Group quotahas exceeded the threshold.
You must have the Application Administrator or Storage Administrator role.
Events are generated when a threshold is breached. You can take corrective actions for suchevents.
Capacity area
The Capacity area enables you to set the following qtree capacity threshold conditions.
Space Nearly Full
Specifies the percentage at which a qtree is considered to be nearly full:
• Default value: 80 percent
The value for this threshold must be lower than the value for the Qtree Full threshold.
• Event generated: Qtree Nearly Full
• Event severity: Warning
Space Full
Specifies the percentage at which a qtree is considered full:
• Default value: 90 percent
• Event generated: Qtree Full
• Event severity: Error
Related tasksConfiguring global qtree health threshold values on page 136
You can configure the global health threshold values for all qtrees to track any threshold breach.Appropriate events are generated for health threshold breaches, and you can take preventivemeasures based on these events. You can configure the global values based on the best practicesettings for thresholds that apply to all monitored qtrees.
Editing individual qtree health threshold settings on page 139You can edit the health threshold settings for qtree capacity for one or more qtrees. When athreshold is crossed, alerts are generated and you receive notifications. These notifications helpyou to take preventive measures based on the event generated.
Edit Aggregate Thresholds dialog boxYou can configure alerts to send notifications when an event related to an aggregate's capacity isgenerated, and you can take corrective actions for the event. For example, for the Aggregate Fullthreshold, you can configure an alert to send notification when the condition persists over aspecified period.
You must have the Application Administrator or Storage Administrator role.
The Edit Aggregate Thresholds dialog box enables you to configure aggregate-level thresholdsthat are applied to selected aggregates. If you configure aggregate-level thresholds, they takepriority over the global-level threshold values. You can configure threshold settings for capacity,growth, and Snapshot copies at the aggregate level. If these settings are not configured, the globalthreshold values are applied.
146Managing health thresholds
Note: The threshold values are not applicable to the root aggregate of the node.
• Capacity• Growth• Snapshot Copies• Command buttons
Capacity area
The Capacity area enables you to set the following aggregate capacity threshold conditions:
Space Nearly Full
Specifies the percentage at which an aggregate is considered to be nearly full. It alsodisplays the size of the aggregate corresponding to the specified threshold value.
You can also use the slider to set the threshold value.
Space Full
Specifies the percentage at which an aggregate is considered full. It also displays the size ofthe aggregate corresponding to the specified threshold value.
You can also use the slider to set the threshold value.
Nearly Overcommitted
Specifies the percentage at which an aggregate is considered to be nearly overcommitted.
Overcommitted
Specifies the percentage at which an aggregate is considered to be overcommitted.
Days Until Full
Specifies the number of days remaining before the aggregate reaches full capacity.
Growth area
The Growth area enables you to set the following threshold condition for aggregate growth:
Growth Rate
Specifies the percentage at which an aggregate's growth rate is considered to be normalbefore the system generates an Aggregate Growth Rate Abnormal event.
Growth Rate Sensitivity
Specifies the factor that is applied to the standard deviation of an aggregate's growth rate. Ifthe growth rate exceeds the factored standard deviation, an Aggregate Growth RateAbnormal event is generated.
A lower value for growth rate sensitivity indicates that the aggregate is highly sensitive tochanges in the growth rate.
Note: If you modify the growth rate sensitivity for aggregates at the global thresholdlevel, the change is also applied to the growth rate sensitivity for volumes at the globalthreshold level.
Snapshot copies area
The Snapshot copies area enables you to set the following Snapshot reserve threshold conditions:
Snapshot Reserve Full
Specifies the percentage at which an aggregate has consumed all its space reserved forSnapshot copies.
You can also use the slider to set the threshold value.
147Managing health thresholds

Command buttons
The command buttons enable you to perform the following tasks for a selected aggregate:
Restore to Defaults
Enables you to restore the aggregate-level threshold values to the global values.
Save
Saves all the threshold settings.
Save and Close
Saves all the threshold settings and then closes the dialog box.
Cancel
Ignores the changes (if any) to the threshold settings and closes the dialog box.
Related conceptsUnderstanding events and thresholds for node root aggregates on page 206
You can monitor the node root aggregate by using Unified Manager. The best practice is to thicklyprovision the root volume in the root aggregate to prevent the node from halting.
Related tasksEditing individual aggregate health threshold settings on page 137
You can edit the health threshold settings for aggregate capacity, growth, and Snapshot copies ofone or more aggregates. When a threshold is crossed, alerts are generated and you receivenotifications. These notifications help you to take preventive measures based on the eventgenerated.
Configuring global aggregate health threshold values on page 134You can configure global health threshold values for all aggregates to track any threshold breach.Appropriate events are generated for threshold breaches and you can take preventive measuresbased on these events. You can configure the global values based on the best practice settings forthresholds that apply to all monitored aggregates.
Edit Volume Thresholds dialog boxYou can configure alerts to send notifications when an event related to a volume's capacity isgenerated, and you can take corrective actions for the event. For example, for the Volume Fullthreshold, you can configure an alert to send notification when the condition persists over aspecified period.
You must have the Application Administrator or Storage Administrator role.
The Edit Volume Thresholds dialog box enables you to configure volume-level thresholds that areapplied to the selected volumes. When thresholds are configured at the volume level, they takepriority over the group-level thresholds or the global-level threshold values.
You can configure threshold settings for capacity, Snapshot copies, qtree quota, growth, and inodesat the volume level. When a group action of volume threshold type is configured, the group actionthreshold values are used for settings that are not configured at the volume level. When no groupaction of volume threshold type is configured, areas in Edit Volume Thresholds dialog box that arenot configured, use global threshold values.
• Capacity• Snapshot Copies• Qtree Quota• Growth• Inodes• Command buttons
148Managing health thresholds

Capacity area
The Capacity area enables you to set the following volume capacity threshold conditions:
Space Nearly Full
Specifies the percentage at which a volume is considered to be nearly full. It also displaysthe size of the volume corresponding to the specified threshold value.
You can also use the slider to set the threshold value.
Space Full
Specifies the percentage at which a volume is considered full. It also displays the size of thevolume corresponding to the specified threshold value.
You can also use the slider to set the threshold value.
Days Until Full
Specifies the number of days remaining before the volume reaches full capacity.
Snapshot Copies
The Snapshot Copies area enables you to set the following threshold conditions for the Snapshotcopies in the volume.
Snapshot Reserve Full
Specifies the percentage at which the space reserved for Snapshot copies is considered full.
Days Until Full
Specifies the number of days remaining before the space reserved for Snapshot copiesreaches full capacity.
Count
Specifies the number of Snapshot copies on a volume that are considered to be too many.
Qtree Quota area
The Qtree Quota area enables you to set the following qtree quota threshold conditions for theselected volumes:
Nearly Overcommitted
Specifies the percentage at which a volume is considered to be nearly overcommitted byqtree quotas.
Overcommitted
Specifies the percentage at which a volume is considered to be overcommitted by qtreequotas.
Growth area
The Growth area enables you to set the following threshold condition for volume growth:
Growth Rate
Specifies the percentage at which a volume's growth rate is considered to be normal beforethe system generates a Volume Growth Rate Abnormal event.
Growth Rate Sensitivity
Specifies the factor that is applied to the standard deviation of a volume's growth rate. If thegrowth rate exceeds the factored standard deviation, a Volume Growth Rate Abnormal eventis generated.
A lower value for growth rate sensitivity indicates that the volume is highly sensitive tochanges in the growth rate.
149Managing health thresholds

Note: If you modify the growth rate sensitivity for volumes at the global threshold level,the change is also applied to the growth rate sensitivity for aggregates at the globalthreshold level.
Inodes area
The Inodes area enables you to set the following threshold conditions for inodes:
Nearly Full
Specifies the percentage at which a volume is considered to have consumed most of itsinodes.
You can also use the sliders to set the threshold value.
Full
Specifies the percentage at which a volume is considered to have consumed all of its inodes.
You can also use the sliders to set the threshold value.
Command buttons
The command buttons enable you to perform the following tasks for a selected volume:
Restore to Defaults
Enables you to restore the threshold values to one of the following:
• Group values, if the volume belongs to a group and that group has a volume thresholdaction type.
• Global values, if the volume does not belong to any group or if it belongs to a group thatdoes not have a volume threshold action type.
Save
Saves all the threshold settings.
Save and Close
Saves all the threshold settings and then closes the dialog box.
Cancel
Ignores the changes (if any) to the threshold settings and closes the dialog box.
Related tasksEditing individual volume health threshold settings on page 138
You can edit the health threshold settings for volume capacity, growth, quota, and space reserve ofone or more volumes. When a threshold is crossed, alerts are generated and you receivenotifications. These notifications help you to take preventive measures based on the eventgenerated.
Configuring global volume health threshold values on page 135You can configure the global health threshold values for all volumes to track any threshold breach.Appropriate events are generated for health threshold breaches, and you can take preventivemeasures based on these events. You can configure the global values based on the best practicesettings for thresholds that apply to all monitored volumes.
Edit Qtree Thresholds dialog boxYou can configure alerts to send notifications when an event related to a qtree's capacity isgenerated, and you can take corrective actions for the event. For example, for the Qtree Fullthreshold, you can configure an alert to send notification when the condition persists over aspecified period.
You must have the Application Administrator or Storage Administrator role.
150Managing health thresholds
The Edit Qtree Thresholds dialog box enables you to configure qtree-level thresholds that areapplied to the selected qtrees. When thresholds are configured at the qtree level, they take priorityover the group-level thresholds or the global-level threshold values.
You can configure threshold settings for capacity at the qtree level. When a group action of qtreethreshold type is configured, the group action threshold values are used for settings that are notconfigured at the qtree level. When no group action of qtree threshold type is configured, areas inEdit Qtree Thresholds dialog box that are not configured, use global threshold values.
Capacity area
The Capacity area enables you to set the following qtree capacity threshold conditions:
Space Nearly Full
Specifies the percentage at which a qtree is considered to be nearly full. It also displays thesize of the qtree corresponding to the specified threshold value.
You can also use the slider to set the threshold value.
Space Full
Specifies the percentage at which a qtree is considered full. It also displays the size of theqtree corresponding to the specified threshold value.
You can also use the slider to set the threshold value.
Command buttons
The command buttons enable you to perform the following tasks for a selected qtree:
Restore to Defaults
Enables you to restore the threshold values to one of the following:
• Group values, if the qtree belongs to a group and that group has a qtree threshold actiontype.
• Global values, if the qtree does not belong to any group or if it belongs to a group thatdoes not have a qtree threshold action type.
Save
Saves all the threshold settings.
Save and Close
Saves all the threshold settings and then closes the dialog box.
Cancel
Ignores the changes (if any) to the threshold settings and closes the dialog box.
Related tasksEditing individual qtree health threshold settings on page 139
You can edit the health threshold settings for qtree capacity for one or more qtrees. When athreshold is crossed, alerts are generated and you receive notifications. These notifications helpyou to take preventive measures based on the event generated.
Configuring global qtree health threshold values on page 136You can configure the global health threshold values for all qtrees to track any threshold breach.Appropriate events are generated for health threshold breaches, and you can take preventivemeasures based on these events. You can configure the global values based on the best practicesettings for thresholds that apply to all monitored qtrees.
151Managing health thresholds
Managing performance thresholds
Performance threshold policies enable you to determine the point at which Unified Managergenerates an event to inform system administrators about issues that could be impacting workloadperformance. These threshold policies are known as user-defined performance thresholds.
This release supports user-defined, system-defined, and dynamic performance thresholds. Withdynamic and system-defined performance thresholds, Unified Manager analyzes the workloadactivity to determine the appropriate threshold value. With user-defined thresholds, you can definethe upper performance limits for many performance counters and for many storage objects.
Note: System-defined performance thresholds and dynamic performance thresholds are set byUnified Manager and are not configurable. If you are receiving unnecessary events from anysystem-defined performance threshold policies, you can disable individual policies from theEvent Setup page.
How user-defined performance threshold policies workYou set performance threshold policies on storage objects (for example, on aggregates andvolumes) so that an event can be sent to the storage administrator to inform the administrator thatthe cluster is experiencing a performance issue.
You create a performance threshold policy for a storage object by:
• Selecting a storage object
• Selecting a performance counter associated with that object
• Specifying values that define the performance counter upper limits that are considered warningand critical situations
• Specifying a time period that defines how long the counter must exceed the upper limit
For example, you can set a performance threshold policy on a volume so that you receive a criticalevent notification whenever IOPS for that volume exceeds 750 operations per second for 10consecutive minutes. This same threshold policy can also specify that a warning event be sentwhen IOPS exceeds 500 operations per second for 10 minutes.
Note: The current release provides thresholds that send events when a counter value exceeds thethreshold setting. You cannot set thresholds that send events when a counter value falls below athreshold setting.
An example counter chart is shown here, indicating that a warning threshold (yellow icon) wasbreached at 1:00, and that a critical threshold (red icon) was breached at 12:10, 12:30, and 1:10:
152Managing performance thresholds

A threshold breach must occur continuously for the specified duration. If the threshold dips belowthe limit values for any reason, a subsequent breach is considered the start of a new duration.
Some cluster objects and performance counters enable you to create a combination thresholdpolicy that requires two performance counters to exceed their maximum limits before an event isgenerated. For example, you can create a threshold policy using the following criteria:
Cluster object Performancecounter
Warning threshold Critical threshold Duration
Volume Latency 10 milliseconds 20 milliseconds 15 minutes
Aggregate Utilization 65% 85%
Threshold policies that use two cluster objects cause an event to be generated only when bothconditions are breached. For example, using the threshold policy defined in the table:
If volume latency is averaging... And aggregate disk utilization is... Then...
15 milliseconds 50% No event is reported.
15 milliseconds 75% A Warning event is reported.
25 milliseconds 75% A Warning event is reported.
25 milliseconds 90% A Critical event is reported.
Related referenceWhat performance counters can be tracked using thresholds on page 154
Some common performance counters, such as IOPS and MB/s, can have thresholds set for allstorage objects. There are other counters that can have thresholds set for only certain storageobjects.
What objects and counters can be used in combination threshold policies on page 156
153Managing performance thresholds
Only some performance counters can be used together in combination policies. When primary andsecondary performance counters are specified, both performance counters must exceed theirmaximum limits before an event is generated.
What happens when a performance threshold policy is breachedWhen a counter value exceeds its defined performance threshold value for the amount of timespecified in the duration, the threshold is breached and an event is reported.
The event causes the following actions to be initiated:
• The event is displayed in the Dashboard, the Performance Cluster Summary page, the Eventspage, and the object-specific Performance Inventory page.
• (optional) An email alert about the event can be sent to one or more email recipients, and anSNMP trap can be sent to a trap receiver.
• (optional) A script can be executed to automatically modify or update storage objects.
The first action is always executed. You configure whether the optional actions are performed inthe Alert Setup page. You can define unique actions depending on whether a Warning or a Criticalthreshold policy is breached.
After a performance threshold policy breach has occurred on a storage object, no further events aregenerated for that policy until the counter value goes below the threshold value, at which point theduration resets for that limit. While the threshold continues to be exceeded, the end time of theevent is continually updated to reflect that this event is ongoing.
A threshold event captures, or freezes, the information related to severity and policy definition sothat unique threshold information displays with the event, even if the threshold policy is modifiedin the future.
Related conceptsWhat performance events are on page 44
Performance events are incidents related to workload performance on a cluster. They help youidentify workloads with slow response times. Together with health events that occurred at the sametime, you can determine the issues that might have caused, or contributed to, the slow responsetimes.
What alerts are on page 118While events occur continuously, the Unified Manager generates an alert only when an eventmeets specified filter criteria. You can choose the events for which alerts should be generated—forexample, when a space threshold is exceeded or an object goes offline. You can also associate analert with a script that is executed when an alert is triggered.
What performance counters can be tracked using thresholdsSome common performance counters, such as IOPS and MB/s, can have thresholds set for allstorage objects. There are other counters that can have thresholds set for only certain storageobjects.
Available performance counters
Storage object Performance counter Description
Cluster IOPS Average number of input/output operations the cluster processes persecond.
MB/s Average number of megabytes of data transferred to and from this clusterper second.
154Managing performance thresholds

Storage object Performance counter Description
Node IOPS Average number of input/output operations the node processes persecond.
MB/s Average number of megabytes of data transferred to and from this nodeper second.
Latency Average number of milliseconds the node takes to respond to applicationrequests.
Utilization Average percentage of the node's CPU and RAM that is being used.
Performance CapacityUsed
Average percentage of performance capacity that is being consumed bythe node.
Performance CapacityUsed - Takeover
Average percentage of performance capacity that is being consumed bythe node, plus the performance capacity of its partner node.
Aggregate IOPS Average number of input/output operations the aggregate processes persecond.
MB/s Average number of megabytes of data transferred to and from thisaggregate per second.
Latency Average number of milliseconds the aggregate takes to respond toapplication requests.
Utilization Average percentage of the aggregate's disks that are being used.
Performance CapacityUsed
Average percentage of performance capacity that is being consumed bythe aggregate.
Storage VM IOPS Average number of input/output operations the SVM processes persecond.
MB/s Average number of megabytes of data transferred to and from this SVMper second.
Latency Average number of milliseconds the SVM takes to respond to applicationrequests.
Volume IOPS Average number of input/output operations the volume processes persecond.
MB/s Average number of megabytes of data transferred to and from this volumeper second.
Latency Average number of milliseconds the volume takes to respond toapplication requests.
Cache miss ratio Average percentage of read requests from client applications that arereturned from the volume instead of being returned from cache.
LUN IOPS Average number of input/output operations the LUN processes persecond.
MB/s Average number of megabytes of data transferred to and from this LUNper second.
Latency Average number of milliseconds the LUN takes to respond to applicationrequests.
155Managing performance thresholds

Storage object Performance counter Description
Namespace IOPS Average number of input/output operations the namespace processes persecond.
MB/s Average number of megabytes of data transferred to and from thisnamespace per second.
Latency Average number of milliseconds the namespace takes to respond toapplication requests.
Port Bandwidth utilization Average percentage of the port's available bandwidth that is being used.
MB/s Average number of megabytes of data transferred to and from this port persecond.
NetworkInterface (LIF)
MB/s Average number of megabytes of data transferred to and from this LIF persecond.
What objects and counters can be used in combination threshold policiesOnly some performance counters can be used together in combination policies. When primary andsecondary performance counters are specified, both performance counters must exceed theirmaximum limits before an event is generated.
Primary storage object and counter Secondary storage object and counter
Volume Latency Volume IOPS
Volume MB/s
Aggregate Utilization
Aggregate Performance Capacity Used
Node Utilization
Node Performance Capacity Used
Node Performance Capacity Used - Takeover
LUN Latency LUN IOPS
LUN MB/s
Aggregate Utilization
Aggregate Performance Capacity Used
Node Utilization
Node Performance Capacity Used
Node Performance Capacity Used - Takeover
Note: When a volume combination policy is applied to a FlexGroup volume, instead of to aFlexVol volume, only the "Volume IOPS" and "Volume MB/s" attributes can be selected as thesecondary counter. If the threshold policy contains one of the node or aggregate attributes, thenthe policy will not be applied to the FlexGroup volume, and you will receive an error messagedescribing this case. This is because FlexGroup volumes can exist on more than one node oraggregate.
156Managing performance thresholds

Creating user-defined performance threshold policiesYou create performance threshold policies for storage objects so that notifications are sent when aperformance counter exceeds a specific value. The event notification identifies that the cluster isexperiencing a performance issue.
Before you begin
You must have the Application Administrator role.
About this task
You create performance threshold policies by entering the threshold values on the CreatePerformance Threshold Policy page. You can create new policies by defining all the policy valuesin this page, or you can make a copy of an existing policy and change the values in the copy(called cloning).
Valid threshold values are 0.001 through 10,000,000 for numbers, 0.001-100 for percentages, and0.001-200 for Performance Capacity Used percentages.
Note: The current release provides thresholds that send events when a counter value exceeds thethreshold setting. You cannot set thresholds that send events when a counter value falls below athreshold setting.
Steps
1. In the left navigation pane, select Event Thresholds > Performance.The Performance Thresholds page is displayed.
2. Click the appropriate button depending on whether you want to build a new policy or if youwant to clone a similar policy and modify the cloned version.
To... Click...
Create a new policy Create
Clone an existing policy Select an existing policy and click Clone
The Create Performance Threshold Policy page or Clone Performance Threshold Policy pageis displayed.
3. Define the threshold policy by specifying the performance counter threshold values you wantto set for specific storage objects:
a. Select the storage object type and specify a name and description for the policy.
b. Select the performance counter to be tracked and specify the limit values that defineWarning and Critical events.
You must define at least one Warning or one Critical limit. You do not need to define bothtypes of limits.
c. Select a secondary performance counter, if required, and specify the limit values forWarning and Critical events.
Including a secondary counter requires that both counters exceed the limit values before thethreshold is breached and an event is reported. Only certain objects and counters can beconfigured using a combination policy.
d. Select the duration of time for which the limit values must be breached for an event to besent.
When cloning an existing policy, you must enter a new name for the policy.
4. Click Save to save the policy.
157Managing performance thresholds

You are returned to the Performance Thresholds page. A success message at the top of the pageconfirms that the threshold policy was created and provides a link to the Inventory page for thatobject type so that you can apply the new policy to storage objects immediately.
After you finish
If you want to apply the new threshold policy to storage objects at this time, you can click the Goto object_type now link to go to the Inventory page.
Related tasksAssigning performance threshold policies to storage objects on page 158
You assign a user-defined performance threshold policy to a storage object so that UnifiedManager reports an event if the value of the performance counter exceeds the policy setting.
Related referenceWhat performance counters can be tracked using thresholds on page 154
Some common performance counters, such as IOPS and MB/s, can have thresholds set for allstorage objects. There are other counters that can have thresholds set for only certain storageobjects.
What objects and counters can be used in combination threshold policies on page 156Only some performance counters can be used together in combination policies. When primary andsecondary performance counters are specified, both performance counters must exceed theirmaximum limits before an event is generated.
Assigning performance threshold policies to storage objectsYou assign a user-defined performance threshold policy to a storage object so that UnifiedManager reports an event if the value of the performance counter exceeds the policy setting.
Before you begin
You must have the Application Administrator role.
The performance threshold policy, or policies, that you want to apply to the object must exist.
About this task
You can apply only one performance policy at a time to an object, or to a group of objects.
You can assign a maximum of three threshold policies to each storage object. When assigningpolicies to multiple objects, if any of the objects already has the maximum number of policiesassigned, Unified Manager performs the following actions:
• Applies the policy to all of the selected objects that have not reached their maximum
• Ignores the objects that have reached the maximum number of policies
• Displays a message that the policy was not assigned to all objects
Steps
1. From the Performance inventory page of any storage object, select the object or objects towhich you want to assign a threshold policy:
To assign thresholds to... Click...
A single object The check box at the left of that object.
Multiple objects The check box at the left of each object.
All objects on the page The drop-down box, and choose Select all objects on this page.
All objects of the same type The drop-down box, and choose Select all objects.
158Managing performance thresholds

You can use the sorting and filtering functionality to refine the list of objects on the inventorypage to make it easier to apply threshold policies to many objects.
2. Make your selection, and then click Assign Performance Threshold Policy.The Assign Performance Threshold Policy page is displayed, showing a list of thresholdpolicies that exist for that specific type of storage object.
3. Click each policy to display the details of the performance threshold settings to verify that youhave selected the correct threshold policy.
4. After you have selected the appropriate threshold policy, click Assign Policy.A success message at the top of the page confirms that the threshold policy was assigned to theobject or objects, and provides a link to the Alerting page so that you can configure alertsettings for this object and policy.
After you finish
If you want to have alerts sent over email, or as an SNMP trap, to notify you that a particularperformance event has been generated, you must configure the alert settings in the Alert Setuppage.
Related tasksViewing performance threshold policies on page 159
You can view all of the currently defined performance threshold policies from the PerformanceThresholds page.
Creating user-defined performance threshold policies on page 157You create performance threshold policies for storage objects so that notifications are sent when aperformance counter exceeds a specific value. The event notification identifies that the cluster isexperiencing a performance issue.
Adding alerts on page 119You can configure alerts to notify you when a particular event is generated. You can configurealerts for a single resource, for a group of resources, or for events of a particular severity type. Youcan specify the frequency with which you want to be notified and associate a script to the alert.
Filtering data in the Object Inventory Performance pages on page 485You can filter data in the Object Inventory Performance pages to quickly locate data based onspecific criteria. You can use filtering to narrow the contents of the Object Inventory Performancepages to show only the results you have specified. This provides a very efficient method ofdisplaying only the performance data in which you are interested.
Sorting on the Object Inventory Performance pages on page 485You can sort all data on Object Inventory Performance pages by any column in ascending ordescending order. This enables you to quickly locate object inventory data, which is helpful whenexamining performance or beginning a troubleshooting process.
Viewing performance threshold policiesYou can view all of the currently defined performance threshold policies from the PerformanceThresholds page.
About this task
The list of threshold policies is sorted alphabetically by policy name, and it includes policies forall types of storage objects. You can click a column header to sort the policies by that column. Ifyou are looking for a specific policy, use the filter and search mechanisms to refine the list ofthreshold policies that appear in the inventory list.
You can hover your cursor over the Policy Name and the Condition name to see the configurationdetails of the policy. Additionally, you can use the provided buttons to create, clone, edit, anddelete user-defined threshold policies.
159Managing performance thresholds

Step
In the left navigation pane, select Event Thresholds > Performance.The Performance Thresholds page is displayed.
Related tasksFiltering inventory page content on page 28
You can filter inventory page data in Unified Manager to quickly locate data based on specificcriteria. You can use filtering to narrow the contents of the Unified Manager pages to show onlythe results in which you are interested. This provides a very efficient method of displaying onlythe data in which you are interested.
Related referencePerformance Thresholds page on page 163
You can use the Performance Thresholds page to view all the currently defined performancethreshold policies. This page also provides the functionality to create, clone, edit, and deletethreshold policies.
Editing user-defined performance threshold policiesYou can edit the threshold settings for existing performance threshold policies. This can be usefulif you find that you are receiving too many or too few alerts for certain threshold conditions.
Before you begin
You must have the Application Administrator role.
About this task
You cannot change the policy name or the type of storage object that is being monitored forexisting threshold policies.
Steps
1. In the left navigation pane, select Event Thresholds > Performance.The Performance Thresholds page displays.
2. Select the threshold policy that you want to change and click Edit.The Edit Performance Threshold Policy page is displayed.
3. Make your changes to the threshold policy and click Save.You are returned to the Performance Thresholds page.
Result
After they are saved, changes are updated immediately on all storage objects that use the policy.
After you finish
Depending on the type of changes that you made to the policy, you may want to review the alertsettings configured for the objects that use the policy in the Alert Setup page.
Related conceptsWhat happens when a performance threshold policy is changed on page 161
If you adjust the counter value or duration of an existing performance threshold policy, the policychange is applied to all storage objects that use the policy. The new setting takes placeimmediately, and Unified Manager begins to compare performance counter values to the newthreshold settings for all newly collected performance data.
Related tasksAdding alerts on page 119
160Managing performance thresholds

You can configure alerts to notify you when a particular event is generated. You can configurealerts for a single resource, for a group of resources, or for events of a particular severity type. Youcan specify the frequency with which you want to be notified and associate a script to the alert.
Removing performance threshold policies from storage objectsYou can remove a user-defined performance threshold policy from a storage object when you nolonger want Unified Manager to monitor the value of the performance counter.
Before you begin
You must have the Application Administrator role.
About this task
You can remove only one policy at a time from a selected object.
You can remove a threshold policy from multiple storage objects by selecting more than one objectin the list.
Steps
1. From the inventory page of any storage object, select one or more objects that have at leastone performance threshold policy applied.
To clear thresholds from... Do this...
A single object Select the check box at the left of that object.
Multiple objects Select the check box at the left of each object.
All objects on the page Click in the column header.
2. Click Clear Performance Threshold Policy.The Clear Threshold Policy page displays, showing a list of threshold policies that arecurrently assigned to the storage objects.
3. Select the threshold policy you want to remove from the objects and click Clear Policy.
When you select a threshold policy, the details of the policy display so that you can confirmthat you have selected the appropriate policy.
What happens when a performance threshold policy is changedIf you adjust the counter value or duration of an existing performance threshold policy, the policychange is applied to all storage objects that use the policy. The new setting takes placeimmediately, and Unified Manager begins to compare performance counter values to the newthreshold settings for all newly collected performance data.
If any active events exist for objects that are using the changed threshold policy, the events aremarked as obsolete, and the threshold policy begins monitoring the counter as a newly definedthreshold policy.
When viewing the counter on which the threshold has been applied in the Counter Charts DetailedView, the critical and warning threshold lines reflect the current threshold settings. The originalthreshold settings do not appear on this page even if you view historical data when the oldthreshold setting was in effect.
Note: Because older threshold settings do not appear in the Counter Charts Detailed View, youmight see historical events that appear below the current threshold lines.
161Managing performance thresholds

What happens to performance threshold policies when an object is movedBecause performance threshold policies are assigned to storage objects, if you move an object, allassigned threshold policies remain attached to the object after the move is completed. Forexample, if you move a volume or LUN to a different aggregate, the threshold policies are stillactive for the volume or LUN on the new aggregate.
If a secondary counter condition exists for the threshold policy (a combination policy)—forexample, if an additional condition is assigned to an aggregate or a node—the secondary countercondition is applied to the new aggregate or node to which the volume or LUN has been moved.
If any new active events exist for objects that are using the changed threshold policy, the events aremarked as obsolete, and the threshold policy begins monitoring the counter as a newly definedthreshold policy.
A volume move operation causes ONTAP to send an informational change event. A change eventicon appears in the Events timeline on the Performance Explorer page and the Workload Analysispage to indicate the time when the move operation was completed.
Note: If you move an object to a different cluster, the user-defined threshold policy is removedfrom the object. If required, you must assign a threshold policy to the object after the moveoperation is completed. Dynamic and system-defined threshold policies, however, are appliedautomatically to an object after it has moved to a new cluster.
Threshold policy functionality during HA takeover and giveback
When a takeover or giveback operation occurs in a high-availability (HA) configuration, objectsthat are moved from one node to the other node retain their threshold policies in the same manneras in the manual move operations. Because Unified Manager checks for cluster configurationchanges every 15 minutes, the impact of the switchover to the new node is not identified until thenext poll of the cluster configuration.
Note: If both a takeover and giveback operation occur within the 15-minute configurationchange collection period, you might not see the performance statistics move from one node tothe other node.
Threshold policy functionality during aggregate relocation
If you move an aggregate from one node to another node using the aggregate relocationstart command, both single and combination threshold policies are retained on all objects, andthe node portion of the threshold policy is applied to the new node.
Threshold policy functionality during MetroCluster switchover
Objects that move from one cluster to another cluster in a MetroCluster configuration do not retaintheir user-defined threshold policy settings. If required, you can apply threshold policies on thevolumes and LUNs that have moved to the partner cluster. After an object has moved back to itsoriginal cluster, the user-defined threshold policy is reapplied automatically.
Volume behavior during switchover and switchback
Descriptions of the performance threshold policy pagesYou use the Performance Thresholds page to create, edit, clone, delete, and view performancethreshold policies.
The topics below display when you click Help on the appropriate page.
162Managing performance thresholds
Performance Thresholds pageYou can use the Performance Thresholds page to view all the currently defined performancethreshold policies. This page also provides the functionality to create, clone, edit, and deletethreshold policies.
The list of performance threshold policies is sorted alphabetically by policy name. You can click acolumn header to sort the policies by that column. If you are looking for a specific policy, you canuse the filter and search mechanisms to refine the list of threshold policies that appear in theinventory list.
Filter and Search bar
The Filtering button enables you to refine the list of threshold policies by displaying only thepolicies that match certain criteria.
The Search button enables you to search for certain policies by entering full or partial policynames to refine the list of threshold policies that appear in the inventory list.
Command buttons
Create
Creates a new performance threshold policy.
Clone
Creates a new performance threshold policy based on a copy of the policy that you haveselected.
Edit
Modifies the performance threshold policy that you have selected. All storage objects thatare using the policy are updated to use the revised policy.
Delete
Deletes the performance threshold policy that you have selected. The policy is removedfrom all storage objects that are using the policy. You can click the item in the AssociatedObjects column to view the objects that are currently using this policy.
Threshold Policies list
Policy Name
Displays the name of the threshold policy. You can position your cursor over the policyname to view the details of the policy.
Description
Displays a brief description of the threshold policy.
First Condition
Displays the primary condition for the threshold policy, including the defined performancecounter and the warning trigger values and critical trigger values. You can position yourcursor over the condition name to view the details of the condition.
Second Condition
Displays the secondary threshold policy condition, if defined. You can position your cursorover the condition name to view the details of the condition. If a second condition is notdefined, this column is blank.
Note: When a second condition is defined, an event is generated only when bothconditions are breached.
163Managing performance thresholds

Associated Objects
Displays the type of storage object to which the threshold policy can be applied, and thenumber of objects that are using the policy. This field is blank until you assign the policy toat least one object.
You can click the column heading to sort the policies by object type: volume, LUN,aggregate, and so on. You can click the policy name to display the inventory page populatedwith the objects that are currently using the threshold policy.
Related tasksCreating user-defined performance threshold policies on page 157
You create performance threshold policies for storage objects so that notifications are sent when aperformance counter exceeds a specific value. The event notification identifies that the cluster isexperiencing a performance issue.
Assigning performance threshold policies to storage objects on page 158You assign a user-defined performance threshold policy to a storage object so that UnifiedManager reports an event if the value of the performance counter exceeds the policy setting.
Filtering inventory page content on page 28You can filter inventory page data in Unified Manager to quickly locate data based on specificcriteria. You can use filtering to narrow the contents of the Unified Manager pages to show onlythe results in which you are interested. This provides a very efficient method of displaying onlythe data in which you are interested.
Create or Clone Performance Threshold Policy pageYou can use the Create Performance Threshold Policy page or the Clone Threshold Policy page tocreate a new performance threshold policy.
You can complete the fields on this page and click Save to add a performance threshold policy.
For Object Type
Select the type of storage object for which you want to create a threshold policy.
Policy Name
Enter the name of the threshold policy. The name appears on other Unified Manager pagesand should provide a brief description of the policy.
Description
(optional) Enter a detailed description of the threshold policy.
Threshold Values
Define the primary, and optionally the secondary, threshold counter condition. Including asecondary counter requires that both counters exceed the limit values before the threshold isconsidered breached.
Select a counter
Select the counter on which you want to set a performance threshold.
Warning
Enter the limit value for the counter that is considered a warning.
Critical
Enter the limit value for the counter that is considered critical.
Valid threshold values are 0.001 through 10,000,000 for numbers, 0.001-100 forpercentages, and 0.001-200 for Performance Capacity Used percentages.
164Managing performance thresholds

Duration
Select the number of minutes that the counter value must be greater than the warning orcritical limit value. Because Unified Manager collects new performance counter valuesevery five minutes, the menu provides values in multiples of five based on the refreshinterval.
Related tasksCreating user-defined performance threshold policies on page 157
You create performance threshold policies for storage objects so that notifications are sent when aperformance counter exceeds a specific value. The event notification identifies that the cluster isexperiencing a performance issue.
Assigning performance threshold policies to storage objects on page 158You assign a user-defined performance threshold policy to a storage object so that UnifiedManager reports an event if the value of the performance counter exceeds the policy setting.
Related referenceWhat performance counters can be tracked using thresholds on page 154
Some common performance counters, such as IOPS and MB/s, can have thresholds set for allstorage objects. There are other counters that can have thresholds set for only certain storageobjects.
What objects and counters can be used in combination threshold policies on page 156Only some performance counters can be used together in combination policies. When primary andsecondary performance counters are specified, both performance counters must exceed theirmaximum limits before an event is generated.
Edit Performance Threshold Policy pageYou can use the Edit Performance Threshold Policy page to modify an existing performancethreshold policy.
You can modify the fields on this page and click Save to change a performance threshold policy.All cluster objects that are currently using the threshold policy are automatically updated to usethe new policy definition.
For Object Type
Object type cannot be changed.
Policy Name
Change the name of the threshold policy.
Description
Change the detailed description of the threshold policy.
Threshold Values
Change the primary, and optionally the secondary, threshold counter condition.
Select a counter
Change the counter on which you want to set a performance threshold.
Warning
Enter the limit value for the counter that is considered a warning.
Critical
Enter the limit value for the counter that is considered critical.
Duration
Change the number of minutes that the counter value must be greater than the warning orcritical limit value.
165Managing performance thresholds

Related tasksEditing user-defined performance threshold policies on page 160
You can edit the threshold settings for existing performance threshold policies. This can be usefulif you find that you are receiving too many or too few alerts for certain threshold conditions.
Related referenceWhat performance counters can be tracked using thresholds on page 154
Some common performance counters, such as IOPS and MB/s, can have thresholds set for allstorage objects. There are other counters that can have thresholds set for only certain storageobjects.
What objects and counters can be used in combination threshold policies on page 156Only some performance counters can be used together in combination policies. When primary andsecondary performance counters are specified, both performance counters must exceed theirmaximum limits before an event is generated.
Assign Performance Threshold Policy pageYou can use the Assign Performance Threshold Policy page to assign a performance thresholdpolicy to one or more storage objects.
The list of policies is populated with only those policies that are valid for the storage object typeyou selected.
You select the policy you want to apply to the object or objects, and then you click Apply Policy.
There are a few cases where an error message may be returned when you attempt to apply a policy,for example, when applying a combination policy to a FlexGroup volume, where the secondcounter includes either a node or aggregate object. Because FlexGroup volumes can be spreadacross multiple nodes and aggregates, this operation is not allowed.
Related conceptsWhat happens when a performance threshold policy is breached on page 154
When a counter value exceeds its defined performance threshold value for the amount of timespecified in the duration, the threshold is breached and an event is reported.
Related tasksAssigning performance threshold policies to storage objects on page 158
You assign a user-defined performance threshold policy to a storage object so that UnifiedManager reports an event if the value of the performance counter exceeds the policy setting.
Creating user-defined performance threshold policies on page 157You create performance threshold policies for storage objects so that notifications are sent when aperformance counter exceeds a specific value. The event notification identifies that the cluster isexperiencing a performance issue.
Related referenceWhat performance counters can be tracked using thresholds on page 154
Some common performance counters, such as IOPS and MB/s, can have thresholds set for allstorage objects. There are other counters that can have thresholds set for only certain storageobjects.
What objects and counters can be used in combination threshold policies on page 156
166Managing performance thresholds

Only some performance counters can be used together in combination policies. When primary andsecondary performance counters are specified, both performance counters must exceed theirmaximum limits before an event is generated.
Clear Performance Threshold Policy pageYou can use the Clear Performance Threshold Policy page to remove, or clear, a performancethreshold policy from one or more storage objects.
The list of policies is populated with only those policies that are being used in the selected objector objects.
You select the policy that you want to remove from the storage object or objects, and then youclick Clear Policy.
Related tasksRemoving performance threshold policies from storage objects on page 161
You can remove a user-defined performance threshold policy from a storage object when you nolonger want Unified Manager to monitor the value of the performance counter.
167Managing performance thresholds

Analyzing performance events
You can analyze performance events to identify when they were detected, whether they are active(new or acknowledged) or obsolete, the workloads and cluster components involved, and theoptions for resolving the events on your own.
Related conceptsCluster components and why they can be in contention on page 600
You can identify cluster performance issues when a cluster component goes into contention. Theperformance of workloads that use the component slow down and their response time (latency) forclient requests increases, which triggers an event in Unified Manager.
How Unified Manager determines the performance impact for an event on page 599Unified Manager uses the deviation in activity, utilization, write throughput, cluster componentusage, or I/O latency (response time) for a workload to determine the level of impact to workloadperformance. This information determines the role of each workload in the event and how they areranked on the Event details page.
Related tasksDisplaying information about performance events on page 168
You can use the Event Management inventory page to view a list of all the performance events onthe clusters being monitored by Unified Manager. By viewing this information you can determinethe most critical events and then drill down to detailed information to determine the cause of theevent.
Identifying victim workloads involved in a dynamic performance event on page 177In Unified Manager, you can identify which volume workloads have the highest deviation inresponse time (latency) caused by a storage component in contention. Identifying these workloadshelps you understand why the client applications accessing them have been performing slowerthan usual.
Identifying bully workloads involved in a dynamic performance event on page 178In Unified Manager, you can identify which workloads have the highest deviation in usage for acluster component in contention. Identifying these workloads helps you understand why certainvolumes on the cluster have slow response times (latency).
Identifying shark workloads involved in a dynamic performance event on page 179In Unified Manager, you can identify which workloads have the highest deviation in usage for astorage component in contention. Identifying these workloads helps you determine if theseworkloads should be moved to a less-utilized cluster.
Related referencePerformance event analysis and notification on page 597
Performance events notify you about I/O performance issues on a workload caused by contentionon a cluster component. Unified Manager analyzes the event to identify all workloads involved,the component in contention, and whether the event is still an issue that you might need to resolve.
Displaying information about performance eventsYou can use the Event Management inventory page to view a list of all the performance events onthe clusters being monitored by Unified Manager. By viewing this information you can determinethe most critical events and then drill down to detailed information to determine the cause of theevent.
Before you begin
• You must have the Operator, Application Administrator, or Storage Administrator role.
168Analyzing performance events

About this task
The list of events is sorted by detected time, with the most recent events listed first. You can clicka column header to sort the events based on that column. For example, you can sort by the Statuscolumn to view events by severity. If you are looking for a specific event, or for a specific type ofevent, you can use the filter and search mechanisms to refine the list of events that appear in thelist.
Events from all sources are displayed on this page:
• User-defined performance threshold policy
• System-defined performance threshold policy
• Dynamic performance threshold
The Event Type column lists the source of the event. You can select an event to view details aboutthe event in the Event details page.
Steps
1. In the left navigation pane, click Event Management.
2. From the View menu, select Active performance events.The page displays all New and Acknowledged Performance events that have been generated inthe past 7 days.
3. Locate an event that you want to analyze and click the event name.The details page for the event displays.
Note: You can also display the details page for an event by clicking the event name linkfrom the Performance Explorer page and from an alert email.
Related conceptsAnalyzing performance events on page 168
You can analyze performance events to identify when they were detected, whether they are active(new or acknowledged) or obsolete, the workloads and cluster components involved, and theoptions for resolving the events on your own.
Cluster components and why they can be in contention on page 600You can identify cluster performance issues when a cluster component goes into contention. Theperformance of workloads that use the component slow down and their response time (latency) forclient requests increases, which triggers an event in Unified Manager.
Related referencePerformance event analysis and notification on page 597
Performance events notify you about I/O performance issues on a workload caused by contentionon a cluster component. Unified Manager analyzes the event to identify all workloads involved,the component in contention, and whether the event is still an issue that you might need to resolve.
Analyzing events from user-defined performance thresholdsEvents generated from user-defined thresholds indicate that a performance counter for a certainstorage object, for example, an aggregate or volume, has crossed the threshold you defined in thepolicy. This indicates that the cluster object is experiencing a performance issue.
You use the Event details page to analyze the performance event and take corrective action, ifnecessary, to return performance back to normal.
Related conceptsManaging performance thresholds on page 152
169Analyzing performance events

Performance threshold policies enable you to determine the point at which Unified Managergenerates an event to inform system administrators about issues that could be impacting workloadperformance. These threshold policies are known as user-defined performance thresholds.
Related tasksChecking the health of clusters in a MetroCluster configuration on page 208
You can use Unified Manager to check the operational health of clusters, and their components, ina MetroCluster configuration. If the clusters were involved in a performance event detected byUnified Manager, the health status can help you determine whether a hardware or software issuecontributed to the event.
Related referenceEvent details page on page 108
From the Event details page, you can view the details of a selected event, such as the eventseverity, impact level, impact area, and event source. You can also view additional informationabout possible remediations to resolve the issue.
List of events and severity types on page 71You can use the list of events to become more familiar with event categories, event names, and theseverity type of each event that you might see in Unified Manager. Events are listed in alphabeticalorder by object category.
Responding to user-defined performance threshold eventsYou can use Unified Manager to investigate performance events caused by a performance countercrossing a user-defined warning or critical threshold. You can also use Unified Manager to checkthe health of the cluster component to see whether recent health events detected on the componentcontributed to the performance event.
Before you begin
• You must have the Operator, Application Administrator, or Storage Administrator role.
• There must be new or obsolete performance events.
Steps
1. Display the Event details page to view information about the event.
2. Review the Description, which describes the threshold breach that caused the event.
For example, the message "Latency value of 456 ms/op has triggered a WARNING event basedon threshold setting of 400 ms/op" indicates that a latency warning event occurred for theobject.
3. Hover your cursor over the policy name to display details about the threshold policy thattriggered the event.
This includes the policy name, the performance counter being evaluated, the counter value thatmust be breached to be considered a critical or warning event, and the duration by which thecounter must exceed the value.
4. Make a note of the Event Trigger Time so you can investigate whether other events mighthave occurred at the same time that could have contributed to this event.
5. Follow one of the options below to further investigate the event, to determine whether you needto perform any actions to resolve the performance problem:
Option Possible investigation actions
Click the Source object name todisplay the Explorer page for thatobject.
This page enables you to view the object details and compare this object withother similar storage objects to see whether other storage objects have aperformance issue around the same time. For example, to see whether othervolumes on the same aggregate are also having a performance issue.
170Analyzing performance events

Option Possible investigation actions
Click the cluster name to displaythe Cluster Summary page.
This page enables you to view the details for the cluster on which this objectresides to see whether other performance issues have occurred around the sametime.
Analyzing events from system-defined performance thresholdsEvents generated from system-defined performance thresholds indicate that a performancecounter, or set of performance counters, for a certain storage object has crossed the threshold froma system-defined policy. This indicates that the storage object, for example, an aggregate or node,is experiencing a performance issue.
You use the Event details page to analyze the performance event and take corrective action, ifnecessary, to return performance back to normal.
Note: System-defined threshold policies are not enabled on Cloud Volumes ONTAP, ONTAPEdge, or ONTAP Select systems.
Related tasksChecking the health of clusters in a MetroCluster configuration on page 208
You can use Unified Manager to check the operational health of clusters, and their components, ina MetroCluster configuration. If the clusters were involved in a performance event detected byUnified Manager, the health status can help you determine whether a hardware or software issuecontributed to the event.
Related referenceEvent details page on page 108
From the Event details page, you can view the details of a selected event, such as the eventseverity, impact level, impact area, and event source. You can also view additional informationabout possible remediations to resolve the issue.
List of events and severity types on page 71You can use the list of events to become more familiar with event categories, event names, and theseverity type of each event that you might see in Unified Manager. Events are listed in alphabeticalorder by object category.
Types of system-defined performance threshold policies on page 46Unified Manager provides some standard threshold policies that monitor cluster performance andgenerate events automatically. These policies are enabled by default, and they generate warning orinformation events when the monitored performance thresholds are breached.
Responding to system-defined performance threshold eventsYou can use Unified Manager to investigate performance events caused by a performance countercrossing a system-defined warning threshold. You can also use Unified Manager to check thehealth of the cluster component to see whether recent events detected on the componentcontributed to the performance event.
Before you begin
• You must have the Operator, Application Administrator, or Storage Administrator role.
• There must be new or obsolete performance events.
Steps
1. Display the Event details page to view information about the event.
2. Review the Description, which describes the threshold breach that caused the event.
171Analyzing performance events

For example, the message "Node utilization value of 90 % has triggered a WARNING eventbased on threshold setting of 85 %" indicates that a node utilization warning event occurred forthe cluster object.
3. Make a note of the Event Trigger Time so you can investigate whether other events mighthave occurred at the same time that could have contributed to this event.
4. Under System Diagnosis, review the brief description of the type of analysis the system-defined policy is performing on the cluster object.
For some events a green or red icon is displayed next to the diagnosis to indicate whether anissue was found in that particular diagnosis. For other types of system-defined events countercharts display the performance for the object.
5. Under Suggested Actions, click the Help me do this link to view the suggested actions youcan perform to try and resolve the performance event on your own.
Responding to QoS policy group performance eventsUnified Manager generates QoS policy warning events when workload throughput (IOPS,IOPS/TB, or MBps) has exceeded the defined ONTAP QoS policy setting and workload latency isbecoming affected. These system-defined events provide the opportunity to correct potentialperformance issues before many workloads are affected by latency.
Before you begin
• You must have the Operator, Application Administrator, or Storage Administrator role.
• There must be new, acknowledged, or obsolete performance events.
About this task
Unified Manager generates warning events for QoS policy breaches when workload throughputhas exceeded the defined QoS policy setting during each performance collection period for theprevious hour. Workload throughput may exceed the QoS threshold for only a short period of timeduring each collection period, but Unified Manager displays only the "average" throughput duringthe collection period on the chart. For this reason you may receive QoS events while thethroughput for a workload might not have crossed the policy threshold shown in the chart.
You can use System Manager or the ONTAP commands to manage policy groups, including thefollowing tasks:
• Creating a new policy group for the workload
• Adding or removing workloads in a policy group
• Moving a workload between policy groups
• Changing the throughput limit of a policy group
• Moving a workload to a different aggregate or node
Steps
1. Display the Event details page to view information about the event.
2. Review the Description, which describes the threshold breach that caused the event.
For example, the message "IOPS value of 1,352 IOPS on vol1_NFS1 has triggered aWARNING event to identify potential performance problems for the workload" indicates that aQoS Max IOPS event occurred on volume vol1_NFS1.
3. Review the Event Information section to see more details about when the event occurred andhow long the event has been active.
Additionally, for volumes or LUNs that are sharing the throughput of a QoS policy you can seethe names of the top three workloads that are consuming the most IOPS or MBps.
4. Under the System Diagnosis section, review the two charts: one for total average IOPS orMBps (depending on the event), and one for latency. When arranged this way you can see
172Analyzing performance events

which cluster components are most affecting latency when the workload approached the QoSmax limit.
For a shared QoS policy event, the top three workloads are shown in the throughput chart. Ifmore than three workloads are sharing the QoS policy, then additional workloads are addedtogether in an "Other workloads" category. Additionally, the Latency chart shows the averagelatency on all workloads that are part of the QoS policy.
Note that for adaptive QoS policy events that the IOPS and MBps charts show IOPS or MBpsvalues that ONTAP has converted from the assigned IOPS/TB threshold policy based on thesize of the volume.
5. Under the Suggested Actions section, review the suggestions and determine which actions youshould perform to avoid an increase in latency for the workload.
If required, click the Help button to view more details about the suggested actions you canperform to try and resolve the performance event.
Related conceptsHow different types of QoS policies are displayed in the throughput charts on page 574
You can view the ONTAP-defined quality of service (QoS) policy settings that have been appliedto a volume or LUN in the Performance Explorer and Workload Analysis IOPS, IOPS/TB, andMB/s charts. The information displayed in the charts is different depending on the type of QoSpolicy that has been applied to the workload.
Understanding events from adaptive QoS policies that have a defined block size on page 173Adaptive QoS policy groups automatically scale a throughput ceiling or floor based on the volumesize, maintaining the ratio of IOPS to TBs as the size of the volume changes. Starting withONTAP 9.5 you can specify the block size in the QoS policy to effectively apply a MB/s thresholdat the same time.
How storage QoS can control workload throughput on page 570You can create a Quality of Service (QoS) policy group to control the I/O per second (IOPS) orthroughput (MB/s) limit for the workloads it contains. If the workloads are in a policy group withno set limit, such as the default policy group, or the set limit does not meet your needs, you canincrease the limit or move the workloads to a new or existing policy group that has the desiredlimit.
Cluster components and why they can be in contention on page 600You can identify cluster performance issues when a cluster component goes into contention. Theperformance of workloads that use the component slow down and their response time (latency) forclient requests increases, which triggers an event in Unified Manager.
Related referenceTypes of system-defined performance threshold policies on page 46
Unified Manager provides some standard threshold policies that monitor cluster performance andgenerate events automatically. These policies are enabled by default, and they generate warning orinformation events when the monitored performance thresholds are breached.
Understanding events from adaptive QoS policies that have a defined block sizeAdaptive QoS policy groups automatically scale a throughput ceiling or floor based on the volumesize, maintaining the ratio of IOPS to TBs as the size of the volume changes. Starting withONTAP 9.5 you can specify the block size in the QoS policy to effectively apply a MB/s thresholdat the same time.
Assigning an IOPS threshold in an adaptive QoS policy places a limit only on the number ofoperations that occur in each workload. Depending on the block size that is set on the client thatgenerates the workloads, some IOPS include much more data and therefore place a much largerburden on the nodes that process the operations.
173Analyzing performance events

The MB/s value for a workload is generated using the following formula:
MB/s = (IOPS * Block Size) / 1000
If a workload is averaging 3,000 IOPS and the block size on the client is set to 32 KB, then theeffective MB/s for this workload is 96. If this same workload is averaging 3,000 IOPS and theblock size on the client is set to 48 KB, then the effective MB/s for this workload is 144. You cansee that the node is processing 50% more data when the block size is larger.
Let's look at the following adaptive QoS policy that has a defined block size and how events aretriggered based on the block size that is set on the client.
Create a policy and set the peak throughput to 2,500 IOPS/TB with a block size of 32KB. Thiseffectively sets the MB/s threshold to 80 MB/s ((2500 IOPS * 32KB) / 1000) for a volume with 1TB used capacity. Note that Unified Manager generates a Warning event when the throughputvalue is 10% less than the defined threshold. Events are generated under the following situations:
Used Capacity Event is generated when throughput exceeds this number of ...
IOPS MB/s
1 TB 2,250 IOPS 72 MB/s
2 TB 4,500 IOPS 144 MB/s
5 TB 11,250 IOPS 360 MB/s
If the volume is using 2TB of the available space, and the IOPS is 4,000, and the QoS block size isset to 32KB on the client, then the MB/ps throughput is 128 MB/s ((4,000 IOPS * 32 KB) / 1000).No event is generated in this scenario because both 4,000 IOPS and 128 MB/s are below thethreshold for a volume that is using 2 TB of space.
If the volume is using 2TB of the available space, and the IOPS is 4,000, and the QoS block size isset to 64KB on the client, then the MB/s throughput is 256 MB/s ((4,000 IOPS * 64 KB) / 1000).In this case the 4,000 IOPS does not generate an event, but the MB/s value of 256 MB/s is abovethe threshold of 144 MB/s and an event is generated.
For this reason, when an event is triggered based on a MB/s breach for an adaptive QoS policy thatincludes the block size, a MB/s chart is displayed in the System Diagnosis section of the Eventdetails page. If the event is triggered based on an IOPS breach for the adaptive QoS policy, anIOPS chart is displayed in the System Diagnosis section. If a breach occurs for both IOPS andMB/s you will receive two events.
For more information on adjusting QoS settings, see the ONTAP 9 Performance Monitoring PowerGuide.
ONTAP 9 Performance Monitoring Power Guide
Related conceptsHow different types of QoS policies are displayed in the throughput charts on page 574
You can view the ONTAP-defined quality of service (QoS) policy settings that have been appliedto a volume or LUN in the Performance Explorer and Workload Analysis IOPS, IOPS/TB, andMB/s charts. The information displayed in the charts is different depending on the type of QoSpolicy that has been applied to the workload.
Related tasksResponding to QoS policy group performance events on page 172
Unified Manager generates QoS policy warning events when workload throughput (IOPS,IOPS/TB, or MBps) has exceeded the defined ONTAP QoS policy setting and workload latency is
174Analyzing performance events
becoming affected. These system-defined events provide the opportunity to correct potentialperformance issues before many workloads are affected by latency.
Responding to node resources overutilized performance eventsUnified Manager generates node resources overutilized warning events when a single node isoperating above the bounds of its operational efficiency, and therefore potentially affectingworkload latencies. These system-defined events provide the opportunity to correct potentialperformance issues before many workloads are affected by latency.
Before you begin
• You must have the Operator, Application Administrator, or Storage Administrator role.
• There must be new or obsolete performance events.
About this task
Unified Manager generates warning events for node resources overutilized policy breaches bylooking for nodes that are using more than 100% of their performance capacity for more than 30minutes.
You can use System Manager or the ONTAP commands to correct this type of performance issue,including the following tasks:
• Creating and applying a QoS policy to any volumes or LUNs that are overusing systemresources
• Reducing the QoS maximum throughput limit of a policy group to which workloads have beenapplied
• Moving a workload to a different aggregate or node
• Increasing capacity by adding disks to the node, or by upgrading to a node with a faster CPUand more RAM
Steps
1. Display the Event details page to view information about the event.
2. Review the Description, which describes the threshold breach that caused the event.
For example, the message "Perf. Capacity Used value of 139% on simplicity-02 has triggered aWARNING event to identify potential performance problems in the data processing unit."indicates that performance capacity on node simplicity-02 is overused and affecting nodeperformance.
3. Under the System Diagnosis section, review the three charts: one for performance capacityused on the node, one for average storage IOPS being used by the top workloads, and one forlatency on the top workloads. When arranged in this way you can see which workloads are thecause of the latency on the node.
You can view which workloads have QoS policies applied, and which do not, by moving yourcursor over the IOPS chart.
4. Under the Suggested Actions section, review the suggestions and determine which actions youshould perform to avoid an increase in latency for the workload.
If required, click the Help button to view more details about the suggested actions you canperform to try and resolve the performance event.
Responding to cluster imbalance performance eventsUnified Manager generates cluster imbalance warning events when one node in a cluster isoperating at a much higher load than other nodes, and therefore potentially affecting workload
175Analyzing performance events

latencies. These system-defined events provide the opportunity to correct potential performanceissues before many workloads are affected by latency.
Before you begin
You must have the Operator, Application Administrator, or Storage Administrator role.
About this task
Unified Manager generates warning events for cluster imbalance threshold policy breaches bycomparing the performance capacity used value for all nodes in the cluster to see if there is a loaddifference of 30% between any nodes.
These steps help you identify the following resources so that you can move high-performingworkloads to a lower utilized node:
• The nodes on the same cluster that are less utilized
• The aggregates on the new node that are the least utilized
• The highest-performing volumes on the current node
Steps
1. Display the Event details page to view information about the event.
2. Review the Description, which describes the threshold breach that caused the event.
For example, the message "The performance capacity used counter indicates a load differenceof 62% between the nodes on cluster Dallas-1-8 and has triggered a WARNING event based onthe system threshold of 30%" indicates that performance capacity on one of the nodes isoverused and affecting node performance.
3. Review the text in the Suggested Actions to move a high-performing volume from the nodewith the high performance capacity used value to a node with the lowest performance capacityused value.
4. Identify the nodes with the highest and lowest performance capacity used value:
a. In the Event Information section, click the name of the source cluster.
b. In the Cluster / Performance Summary page, click Nodes in the Managed Objects area.
c. In the Nodes inventory page, sort the nodes by the Performance Capacity Used column.
d. Identify the nodes with the highest and lowest performance capacity used value and writedown those names.
5. Identify the volume using the most IOPS on the node that has the highest performance capacityused value:
a. Click the node with the highest performance capacity used value.
b. In the Node / Performance Explorer page, select Aggregates on this Node from the Viewand Compare menu.
c. Click the aggregate with the highest performance capacity used value.
d. In the Aggregate / Performance Explorer page, select Volumes on this Aggregate fromthe View and Compare menu.
e. Sort the volumes by the IOPS column, and write down the name of the volume using themost IOPS, and the name of the aggregate where the volume resides.
6. Identify the aggregate with the lowest utilization on the node that has the lowest performancecapacity used value:
a. Click Storage > Aggregates to display the Aggregates inventory page.
b. Select the Performance: All Aggregates view.
c. Click the Filter button and add a filter where "Node" equals the name of the node with thelowest performance capacity used value that you wrote down in step 4.
d. Write down the name of the aggregate that has the lowest performance capacity used value.
176Analyzing performance events
7. Move the volume from the overloaded node to the aggregate you identified as having lowutilization on the new node.
You can perform the move operation by using ONTAP System Manager, OnCommandWorkflow Automation, ONTAP commands, or a combination of these tools.
After you finish
After a few days, check to see whether you are receiving the same cluster imbalance event fromthis cluster.
Analyzing events from dynamic performance thresholdsEvents generated from dynamic thresholds indicate that the actual response time (latency) for aworkload is too high, or too low, compared to the expected response time range. You use the Eventdetails page to analyze the performance event and take corrective action, if necessary, to returnperformance back to normal.
Note: Dynamic performance thresholds are not enabled on Cloud Volumes ONTAP, ONTAPEdge, or ONTAP Select systems.
Related referenceEvent details page on page 108
From the Event details page, you can view the details of a selected event, such as the eventseverity, impact level, impact area, and event source. You can also view additional informationabout possible remediations to resolve the issue.
List of events and severity types on page 71You can use the list of events to become more familiar with event categories, event names, and theseverity type of each event that you might see in Unified Manager. Events are listed in alphabeticalorder by object category.
Identifying victim workloads involved in a dynamic performance eventIn Unified Manager, you can identify which volume workloads have the highest deviation inresponse time (latency) caused by a storage component in contention. Identifying these workloadshelps you understand why the client applications accessing them have been performing slowerthan usual.
Before you begin
• You must have the Operator, Application Administrator, or Storage Administrator role.
• There must be new, acknowledged, or obsolete dynamic performance events.
About this task
The Event details page displays a list of the user-defined and system-defined workloads, ranked bythe highest deviation in activity or usage on the component or most impacted by the event. Thevalues are based on the peaks that Unified Manager identified when it detected and last analyzedthe event.
Steps
1. Display the Event details page to view information about the event.
2. In the Workload Latency and Workload Activity charts, select Victim Workloads.
3. Hover your cursor over the charts to view the top user-defined workloads that are affecting thecomponent, and the name of the victim workload.
Related conceptsHow Unified Manager determines the performance impact for an event on page 599
177Analyzing performance events

Unified Manager uses the deviation in activity, utilization, write throughput, cluster componentusage, or I/O latency (response time) for a workload to determine the level of impact to workloadperformance. This information determines the role of each workload in the event and how they areranked on the Event details page.
Cluster components and why they can be in contention on page 600You can identify cluster performance issues when a cluster component goes into contention. Theperformance of workloads that use the component slow down and their response time (latency) forclient requests increases, which triggers an event in Unified Manager.
Related tasksDisplaying information about performance events on page 168
You can use the Event Management inventory page to view a list of all the performance events onthe clusters being monitored by Unified Manager. By viewing this information you can determinethe most critical events and then drill down to detailed information to determine the cause of theevent.
Identifying bully workloads involved in a dynamic performance event on page 178In Unified Manager, you can identify which workloads have the highest deviation in usage for acluster component in contention. Identifying these workloads helps you understand why certainvolumes on the cluster have slow response times (latency).
Identifying shark workloads involved in a dynamic performance event on page 179In Unified Manager, you can identify which workloads have the highest deviation in usage for astorage component in contention. Identifying these workloads helps you determine if theseworkloads should be moved to a less-utilized cluster.
Related referenceEvent details page on page 108
From the Event details page, you can view the details of a selected event, such as the eventseverity, impact level, impact area, and event source. You can also view additional informationabout possible remediations to resolve the issue.
Performance event analysis and notification on page 597Performance events notify you about I/O performance issues on a workload caused by contentionon a cluster component. Unified Manager analyzes the event to identify all workloads involved,the component in contention, and whether the event is still an issue that you might need to resolve.
Identifying bully workloads involved in a dynamic performance eventIn Unified Manager, you can identify which workloads have the highest deviation in usage for acluster component in contention. Identifying these workloads helps you understand why certainvolumes on the cluster have slow response times (latency).
Before you begin
• You must have the Operator, Application Administrator, or Storage Administrator role.
• There must be new, acknowledged, or obsolete dynamic performance events.
About this task
The Event details page displays a list of the user-defined and system-defined workloads ranked bythe highest usage of the component or most impacted by the event. The values are based on thepeaks that Unified Manager identified when it detected and last analyzed the event.
Steps
1. Display the Event details page to view information about the event.
2. In the Workload Latency and Workload Activity charts, select Bully Workloads.
178Analyzing performance events

3. Hover your cursor over the charts to view the top user-defined bully workloads that areaffecting the component.
Related conceptsHow Unified Manager determines the performance impact for an event on page 599
Unified Manager uses the deviation in activity, utilization, write throughput, cluster componentusage, or I/O latency (response time) for a workload to determine the level of impact to workloadperformance. This information determines the role of each workload in the event and how they areranked on the Event details page.
Cluster components and why they can be in contention on page 600You can identify cluster performance issues when a cluster component goes into contention. Theperformance of workloads that use the component slow down and their response time (latency) forclient requests increases, which triggers an event in Unified Manager.
Related tasksDisplaying information about performance events on page 168
You can use the Event Management inventory page to view a list of all the performance events onthe clusters being monitored by Unified Manager. By viewing this information you can determinethe most critical events and then drill down to detailed information to determine the cause of theevent.
Identifying victim workloads involved in a dynamic performance event on page 177In Unified Manager, you can identify which volume workloads have the highest deviation inresponse time (latency) caused by a storage component in contention. Identifying these workloadshelps you understand why the client applications accessing them have been performing slowerthan usual.
Identifying shark workloads involved in a dynamic performance event on page 179In Unified Manager, you can identify which workloads have the highest deviation in usage for astorage component in contention. Identifying these workloads helps you determine if theseworkloads should be moved to a less-utilized cluster.
Related referenceEvent details page on page 108
From the Event details page, you can view the details of a selected event, such as the eventseverity, impact level, impact area, and event source. You can also view additional informationabout possible remediations to resolve the issue.
Performance event analysis and notification on page 597Performance events notify you about I/O performance issues on a workload caused by contentionon a cluster component. Unified Manager analyzes the event to identify all workloads involved,the component in contention, and whether the event is still an issue that you might need to resolve.
Identifying shark workloads involved in a dynamic performance eventIn Unified Manager, you can identify which workloads have the highest deviation in usage for astorage component in contention. Identifying these workloads helps you determine if theseworkloads should be moved to a less-utilized cluster.
Before you begin
• You must have the Operator, Application Administrator, or Storage Administrator role.
• There are new, acknowledged, or obsolete performance dynamic event.
About this task
The Event details page displays a list of the user-defined and system-defined workloads ranked bythe highest usage of the component or most impacted by the event. The values are based on thepeaks that Unified Manager identified when it detected and last analyzed the event.
179Analyzing performance events

Steps
1. Display the Event details page to view information about the event.
2. In the Workload Latency and Workload Activity charts, select Shark Workloads.
3. Hover your cursor over the charts to view the top user-defined workloads that are affecting thecomponent, and the name of the shark workload.
Related conceptsHow Unified Manager determines the performance impact for an event on page 599
Unified Manager uses the deviation in activity, utilization, write throughput, cluster componentusage, or I/O latency (response time) for a workload to determine the level of impact to workloadperformance. This information determines the role of each workload in the event and how they areranked on the Event details page.
Cluster components and why they can be in contention on page 600You can identify cluster performance issues when a cluster component goes into contention. Theperformance of workloads that use the component slow down and their response time (latency) forclient requests increases, which triggers an event in Unified Manager.
Related tasksDisplaying information about performance events on page 168
You can use the Event Management inventory page to view a list of all the performance events onthe clusters being monitored by Unified Manager. By viewing this information you can determinethe most critical events and then drill down to detailed information to determine the cause of theevent.
Identifying victim workloads involved in a dynamic performance event on page 177In Unified Manager, you can identify which volume workloads have the highest deviation inresponse time (latency) caused by a storage component in contention. Identifying these workloadshelps you understand why the client applications accessing them have been performing slowerthan usual.
Identifying bully workloads involved in a dynamic performance event on page 178In Unified Manager, you can identify which workloads have the highest deviation in usage for acluster component in contention. Identifying these workloads helps you understand why certainvolumes on the cluster have slow response times (latency).
Related referenceEvent details page on page 108
From the Event details page, you can view the details of a selected event, such as the eventseverity, impact level, impact area, and event source. You can also view additional informationabout possible remediations to resolve the issue.
Performance event analysis and notification on page 597Performance events notify you about I/O performance issues on a workload caused by contentionon a cluster component. Unified Manager analyzes the event to identify all workloads involved,the component in contention, and whether the event is still an issue that you might need to resolve.
Performance event analysis for a MetroCluster configurationYou can use Unified Manager to analyze a performance event for a MetroCluster configuration.You can identify the workloads involved in the event and review the suggested actions forresolving it.
MetroCluster performance events might be due to bully workloads that are over-utilizing theinterswitch links (ISLs) between the clusters, or due to link health issues. Unified Managermonitors each cluster in a MetroCluster configuration independently, without consideration ofperformance events on a partner cluster.
180Analyzing performance events

Performance events from both clusters in the MetroCluster configuration are also displayed on theUnified Manager Dashboard page. You can also view the Health pages of Unified Manager tocheck the health of each cluster and to view their relationship.
Related conceptsPerformance monitoring of MetroCluster configurations on page 592
Unified Manager enables you to monitor the write throughput between clusters in a MetroClusterconfiguration to identify workloads with a high amount of write throughput. If these high-performing workloads are causing other volumes on the local cluster to have high I/O responsetimes, Unified Manager triggers performance events to notify you.
Roles of workloads involved in a performance event on page 603Unified Manager uses roles to identify the involvement of a workload in a performance event. Theroles include victims, bullies, and sharks. A user-defined workload can be a victim, bully, andshark at the same time.
Related tasksChecking the health of clusters in a MetroCluster configuration on page 208
You can use Unified Manager to check the operational health of clusters, and their components, ina MetroCluster configuration. If the clusters were involved in a performance event detected byUnified Manager, the health status can help you determine whether a hardware or software issuecontributed to the event.
Analyzing a dynamic performance event on a cluster in a MetroCluster configuration on page181
You can use Unified Manager to analyze the cluster in a MetroCluster configuration on which aperformance event was detected. You can identify the cluster name, event detection time, and thebully and victim workloads involved.
Related referencePerformance event analysis and notification on page 597
Performance events notify you about I/O performance issues on a workload caused by contentionon a cluster component. Unified Manager analyzes the event to identify all workloads involved,the component in contention, and whether the event is still an issue that you might need to resolve.
Analyzing a dynamic performance event on a cluster in a MetroCluster configurationYou can use Unified Manager to analyze the cluster in a MetroCluster configuration on which aperformance event was detected. You can identify the cluster name, event detection time, and thebully and victim workloads involved.
Before you begin
• You must have the Operator, Application Administrator, or Storage Administrator role.
• There must be new, acknowledged, or obsolete performance events for a MetroClusterconfiguration.
• Both clusters in the MetroCluster configuration must be monitored by the same instance ofUnified Manager.
Steps
1. Display the Event details page to view information about the event.
2. Review the event description to see the names of the workloads involved and the number ofworkloads involved.
In this example, the MetroCluster Resources icon is red, indicating that the MetroClusterresources are in contention. You position your cursor over the icon to display a description ofthe icon.
181Analyzing performance events

3. Make a note of the cluster name and the event detection time, which you can use to analyzeperformance events on the partner cluster.
4. In the charts, review the victim workloads to confirm that their response times are higher thanthe performance threshold.
In this example, the victim workload is displayed in the hover text. The Latency charts display,at a high-level, a consistent latency pattern for the victim workloads involved. Even though theabnormal latency of the victim workloads triggered the event, a consistent latency patternmight indicate that the workloads are performing within their expected range, but that a spikein I/O increased the latency and triggered the event.
If you recently installed an application on a client that accesses these volume workloads andthat application sends a high amount of I/O to them, you might be anticipating their latencies toincrease. If the latency for the workloads returns within the expected range, the event statechanges to obsolete, and remains in this state for more than 30 minutes, you can probablyignore the event. If the event is ongoing, and remains in the new state, you can investigate itfurther to determine whether other issues caused the event.
5. In the Workload Throughput chart, select Bully Workloads to display the bully workloads.
The presence of bully workloads indicates that the event might have been caused by one ormore workloads on the local cluster overutilizing the MetroCluster resources. The bullyworkloads have a high deviation in write throughput (MB/s).
This chart displays, at a high-level, the write throughput (MB/s) pattern for the workloads. Youcan review the write MB/s pattern to identify abnormal throughput, which might indicate that aworkload is over-utilizing the MetroCluster resources.
If no bully workloads are involved in the event, the event might have been caused by a healthissue with the link between the clusters or a performance issue on the partner cluster. You canuse Unified Manager to check the health of both clusters in a MetroCluster configuration. Youcan also use Unified Manager to check for and analyze performance events on the partnercluster.
Related conceptsPerformance event analysis for a MetroCluster configuration on page 180
You can use Unified Manager to analyze a performance event for a MetroCluster configuration.You can identify the workloads involved in the event and review the suggested actions forresolving it.
Performance monitoring of MetroCluster configurations on page 592
182Analyzing performance events

Unified Manager enables you to monitor the write throughput between clusters in a MetroClusterconfiguration to identify workloads with a high amount of write throughput. If these high-performing workloads are causing other volumes on the local cluster to have high I/O responsetimes, Unified Manager triggers performance events to notify you.
Roles of workloads involved in a performance event on page 603Unified Manager uses roles to identify the involvement of a workload in a performance event. Theroles include victims, bullies, and sharks. A user-defined workload can be a victim, bully, andshark at the same time.
Related tasksChecking the health of clusters in a MetroCluster configuration on page 208
You can use Unified Manager to check the operational health of clusters, and their components, ina MetroCluster configuration. If the clusters were involved in a performance event detected byUnified Manager, the health status can help you determine whether a hardware or software issuecontributed to the event.
Analyzing a dynamic performance event for a remote cluster on a MetroCluster configuration onpage 183
You can use Unified Manager to analyze dynamic performance events on a remote cluster in aMetroCluster configuration. The analysis helps you determine whether an event on the remotecluster caused an event on its partner cluster.
Related referencePerformance event analysis and notification on page 597
Performance events notify you about I/O performance issues on a workload caused by contentionon a cluster component. Unified Manager analyzes the event to identify all workloads involved,the component in contention, and whether the event is still an issue that you might need to resolve.
Analyzing a dynamic performance event for a remote cluster on a MetroCluster configurationYou can use Unified Manager to analyze dynamic performance events on a remote cluster in aMetroCluster configuration. The analysis helps you determine whether an event on the remotecluster caused an event on its partner cluster.
Before you begin
• You must have the Operator, Application Administrator, or Storage Administrator role.
• You must have analyzed a performance event on a local cluster in a MetroCluster configurationand obtained the event detection time.
• You must have checked the health of the local cluster and its partner cluster involved in theperformance event and obtained the name of the partner cluster.
Steps
1. Log in to the Unified Manager instance that is monitoring the partner cluster.
2. In the left navigation pane, click Events to display the event list.
3. From the Time Range selector, select Last Hour, and then click Apply Range.
4. In the Filtering selector, select Cluster from the left drop-down menu, type the name of thepartner cluster in the text field, and then click Apply Filter.
If there are no events for the selected cluster over the last hour, this indicates that the clusterhas not experienced any performance issues during the time that the event was detected on itspartner.
5. If the selected cluster has events detected over the last hour, compare the event detection timeto the event detection time for the event on the local cluster.
183Analyzing performance events

If these events involve bully workloads causing contention on the data processing component,one or more of these bullies might have caused the event on the local cluster. You can click theevent to analyze it and review the suggested actions for resolving it on the Event details page.
If these events do not involve bully workloads, they did not cause the performance event on thelocal cluster.
Related conceptsPerformance monitoring of MetroCluster configurations on page 592
Unified Manager enables you to monitor the write throughput between clusters in a MetroClusterconfiguration to identify workloads with a high amount of write throughput. If these high-performing workloads are causing other volumes on the local cluster to have high I/O responsetimes, Unified Manager triggers performance events to notify you.
Roles of workloads involved in a performance event on page 603Unified Manager uses roles to identify the involvement of a workload in a performance event. Theroles include victims, bullies, and sharks. A user-defined workload can be a victim, bully, andshark at the same time.
Related tasksAnalyzing a dynamic performance event on a cluster in a MetroCluster configuration on page181
You can use Unified Manager to analyze the cluster in a MetroCluster configuration on which aperformance event was detected. You can identify the cluster name, event detection time, and thebully and victim workloads involved.
Checking the health of clusters in a MetroCluster configuration on page 208You can use Unified Manager to check the operational health of clusters, and their components, ina MetroCluster configuration. If the clusters were involved in a performance event detected byUnified Manager, the health status can help you determine whether a hardware or software issuecontributed to the event.
Related referencePerformance event analysis and notification on page 597
Performance events notify you about I/O performance issues on a workload caused by contentionon a cluster component. Unified Manager analyzes the event to identify all workloads involved,the component in contention, and whether the event is still an issue that you might need to resolve.
Responding to a dynamic performance event caused by QoS policy group throttlingYou can use Unified Manager to investigate a performance event caused by a Quality of Service(QoS) policy group throttling workload throughput (MB/s). The throttling increased the responsetimes (latency) of volume workloads in the policy group. You can use the event information todetermine whether new limits on the policy groups are needed to stop the throttling.
Before you begin
• You must have the Operator, Application Administrator, or Storage Administrator role.
• There must be new, acknowledged, or obsolete performance events.
Steps
1. Display the Event details page to view information about the event.
2. Read the Description, which displays the name of the workloads impacted by the throttling.
Note: The description can display the same workload for the victim and bully, because thethrottling makes the workload a victim of itself.
3. Record the name of the volume, using an application such as a text editor.
You can search on the volume name to locate it later.
184Analyzing performance events

4. In the Workload Latency and Workload Utilization charts, select Bully Workloads.
5. Hover your cursor over the charts to view the top user-defined workloads that are affectingthe policy group.The workload at the top of the list has the highest deviation and caused the throttling tooccur. The activity is the percentage of the policy group limit used by each workload.
6. In the Suggested Actions area, click the Analyze Workload button for the top workload.
7. In the Workload Analysis page, set the Latency chart to view all Cluster Components, andthe Throughput chart to view Breakdown.The breakdown charts are displayed under the Latency chart and the IOPS chart.
8. Compare the QoS Limits in the Latency chart to see what amount of throttling impacted thelatency at the time of the event.The QoS policy group has a maximum throughput of 1,000 operations per second (op/sec),which the workloads in it cannot collectively exceed. At the time of the event, the workloadsin the policy group had a combined throughput of over 1,200 op/sec, which caused the policygroup to throttle its activity back to 1,000 op/sec.
9. Compare the Reads/writes latency values to the Reads/writes/other values.Both charts show a high number of read requests with high latency, but the number ofrequests and amount of latency for write requests is low. These values help you determinewhether there is a high amount of throughput or number of operations that increased thelatency. You can use these values when deciding to put a policy group limit on the throughputor operations.
10. Use ONTAP System Manager to increase the current limit on the policy group to 1,300 op/sec.
11. After a day, return to Unified Manager and enter the workload that you recorded in Step 3 inthe Workload Analysis page.
12. Select the Throughput Breakdown chart.The Reads/writes/other chart is displayed.
13. At the top of the page, point your cursor to the change event icon ( ) for the policy grouplimit change.
14. Compare the Reads/writes/other chart to the Latency chart.The read and write requests are the same, but the throttling has stopped and the latency hasdecreased.
Related conceptsHow Unified Manager uses workload latency to identify performance issues on page 590
The workload latency (response time) is the time it takes for a volume on a cluster to respond toI/O requests from client applications. Unified Manager uses the latency to detect and alert you toperformance events.
Cluster components and why they can be in contention on page 600You can identify cluster performance issues when a cluster component goes into contention. Theperformance of workloads that use the component slow down and their response time (latency) forclient requests increases, which triggers an event in Unified Manager.
Roles of workloads involved in a performance event on page 603Unified Manager uses roles to identify the involvement of a workload in a performance event. Theroles include victims, bullies, and sharks. A user-defined workload can be a victim, bully, andshark at the same time.
Related tasksSearching for storage objects on page 26
To quickly access a specific object, you can use the Search all Storage Objects field at the top ofthe menu bar. This method of global search across all objects enables you to quickly locate
185Analyzing performance events

specific objects by type. Search results are sorted by storage object type and you can filter themfurther by object using the drop-down menu.
Displaying information about performance events on page 168You can use the Event Management inventory page to view a list of all the performance events onthe clusters being monitored by Unified Manager. By viewing this information you can determinethe most critical events and then drill down to detailed information to determine the cause of theevent.
Identifying victim workloads involved in a dynamic performance event on page 177In Unified Manager, you can identify which volume workloads have the highest deviation inresponse time (latency) caused by a storage component in contention. Identifying these workloadshelps you understand why the client applications accessing them have been performing slowerthan usual.
Identifying bully workloads involved in a dynamic performance event on page 178In Unified Manager, you can identify which workloads have the highest deviation in usage for acluster component in contention. Identifying these workloads helps you understand why certainvolumes on the cluster have slow response times (latency).
Identifying shark workloads involved in a dynamic performance event on page 179In Unified Manager, you can identify which workloads have the highest deviation in usage for astorage component in contention. Identifying these workloads helps you determine if theseworkloads should be moved to a less-utilized cluster.
Responding to a dynamic performance event caused by a disk failureYou can use Unified Manager to investigate a performance event caused by workloadsoverutilizing an aggregate. You can also use Unified Manager to check the health of the aggregateto see if recent health events detected on the aggregate contributed to the performance event.
Before you begin
• You must have the Operator, Application Administrator, or Storage Administrator role.
• There must be new, acknowledged, or obsolete performance events.
Steps
1. Display the Event details page to view information about the event.
2. Read the Description, which describes the workloads involved in the event and the clustercomponent in contention.There are multiple victim volumes whose latency was impacted by the cluster component incontention. The aggregate, which is in the middle of a RAID reconstruct to replace the faileddisk with a spare disk, is the cluster component in contention. Under Component inContention, the Aggregate icon is highlighted red and the name of the aggregate is displayedin parentheses.
3. In the Workload Utilization chart, select Bully Workloads.
4. Hover your cursor over the chart to view the top bully workloads that are affecting thecomponent.The top workloads with the highest peak utilization since the event was detected aredisplayed at the top of the chart. One of the top workloads is the system-defined workloadDisk Health, which indicates a RAID reconstruct. A reconstruct is the internal processinvolved with rebuilding the aggregate with the spare disk. The Disk Health workload, alongwith other workloads on the aggregate, likely caused the contention on the aggregate and theassociated event.
5. After confirming that the activity from the Disk Health workload caused the event, wait forapproximately 30 minutes for the reconstruction to finish and for Unified Manager to analyzethe event and detect whether the aggregate is still in contention.
186Analyzing performance events

6. Refresh the Event details.After the RAID reconstruction is complete, check that the State is obsolete, indicating thatthe event is resolved.
7. In the Workload Utilization chart, select Bully Workloads to view the workloads on theaggregate by peak utilization.
8. In the Suggested Actions area, click the Analyze Workload button for the top workload.
9. In the Workload Analysis page, set the Time Range to display the last 24 hours (1 day) ofdata for the selected volume.
In the Event Timeline, a red dot ( ) indicates when the disk failure event occurred.
10. In the Node and Aggregate Utilization chart, hide the line for the Node statistics so that justthe Aggregate line remains.
11. Compare the data in this chart to the data at the time of the event in the Latency chart.At the time of the event, the Aggregate Utilization shows a high amount of read and writeactivity, caused by the RAID reconstruction processes, which increased the latency of theselected volume. A few hours after the event occurred, both the reads and writes and thelatency have decreased, confirming that the aggregate is no longer in contention.
Related conceptsHow Unified Manager uses workload latency to identify performance issues on page 590
The workload latency (response time) is the time it takes for a volume on a cluster to respond toI/O requests from client applications. Unified Manager uses the latency to detect and alert you toperformance events.
Configuration changes detected by Unified Manager on page 70Unified Manager monitors your clusters for configuration changes to help you determine whethera change might have caused or contributed to a performance event. The Performance Explorer
pages display a change event icon ( ) to indicate the date and time when the change wasdetected.
How Unified Manager determines the performance impact for an event on page 599Unified Manager uses the deviation in activity, utilization, write throughput, cluster componentusage, or I/O latency (response time) for a workload to determine the level of impact to workloadperformance. This information determines the role of each workload in the event and how they areranked on the Event details page.
Roles of workloads involved in a performance event on page 603Unified Manager uses roles to identify the involvement of a workload in a performance event. Theroles include victims, bullies, and sharks. A user-defined workload can be a victim, bully, andshark at the same time.
Related tasksDisplaying information about performance events on page 168
You can use the Event Management inventory page to view a list of all the performance events onthe clusters being monitored by Unified Manager. By viewing this information you can determinethe most critical events and then drill down to detailed information to determine the cause of theevent.
Identifying victim workloads involved in a dynamic performance event on page 177In Unified Manager, you can identify which volume workloads have the highest deviation inresponse time (latency) caused by a storage component in contention. Identifying these workloadshelps you understand why the client applications accessing them have been performing slowerthan usual.
Identifying bully workloads involved in a dynamic performance event on page 178
187Analyzing performance events

In Unified Manager, you can identify which workloads have the highest deviation in usage for acluster component in contention. Identifying these workloads helps you understand why certainvolumes on the cluster have slow response times (latency).
Identifying shark workloads involved in a dynamic performance event on page 179In Unified Manager, you can identify which workloads have the highest deviation in usage for astorage component in contention. Identifying these workloads helps you determine if theseworkloads should be moved to a less-utilized cluster.
Responding to a dynamic performance event caused by HA takeoverYou can use Unified Manager to investigate a performance event caused by high data processingon a cluster node that is in a high-availability (HA) pair. You can also use Unified Manager tocheck the health of the nodes to see whether any recent health events detected on the nodescontributed to the performance event.
Before you begin
• You must have the Operator, Application Administrator, or Storage Administrator role.
• There must be new, acknowledged, or obsolete performance events.
Steps
1. Display the Event details page to view information about the event.
2. Read the Description, which describes the workloads involved in the event and the clustercomponent in contention.There is one victim volume whose latency was impacted by the cluster component incontention. The data processing node, which took over all workloads from its partner node, isthe cluster component in contention. Under Component in Contention, the Data Processingicon is highlighted red and the name of the node that was handling data processing at the timeof the event is displayed in parentheses.
3. In the Description, click the name of the volume.The Volume Performance Explorer page is displayed. At the top of the page, in the Events time
line, a change event icon ( ) indicates the time that Unified Manager detected the start of theHA takeover.
4. Point your cursor to the change event icon for the HA takeover and details about the HAtakeover are displayed in hover text.
In the Latency chart, an event indicates that the selected volume crossed the performancethreshold due to high latency around the same time as the HA takeover.
5. Click Zoom View to display the Latency chart on a new page.
6. In the View menu, select Cluster Components to view the total latency by cluster component.
7. Point your mouse cursor to the change event icon for the start of the HA takeover and comparethe latency for data processing to the total latency.At the time of the HA takeover, there was a spike in data processing from the increasedworkload demand on the data processing node. The increased CPU utilization drove up thelatency and triggered the event.
8. After fixing the failed node, use ONTAP System Manager to perform an HA giveback, whichmoves the workloads from the partner node to the fixed node.
9. After the HA giveback is complete, after the next configuration discovery in Unified Manager(approximately 15 minutes), find the event and workload that triggered by the HA takeover inthe Event Management inventory page.The event triggered by the HA takeover now has a state of obsolete, which indicates that theevent is resolved. The latency at the data processing component has decreased, which has
188Analyzing performance events

decreased the total latency. The node that the selected volume is now using for data processinghas resolved the event.
Related conceptsHow Unified Manager uses workload latency to identify performance issues on page 590
The workload latency (response time) is the time it takes for a volume on a cluster to respond toI/O requests from client applications. Unified Manager uses the latency to detect and alert you toperformance events.
Configuration changes detected by Unified Manager on page 70Unified Manager monitors your clusters for configuration changes to help you determine whethera change might have caused or contributed to a performance event. The Performance Explorer
pages display a change event icon ( ) to indicate the date and time when the change wasdetected.
How Unified Manager determines the performance impact for an event on page 599Unified Manager uses the deviation in activity, utilization, write throughput, cluster componentusage, or I/O latency (response time) for a workload to determine the level of impact to workloadperformance. This information determines the role of each workload in the event and how they areranked on the Event details page.
Roles of workloads involved in a performance event on page 603Unified Manager uses roles to identify the involvement of a workload in a performance event. Theroles include victims, bullies, and sharks. A user-defined workload can be a victim, bully, andshark at the same time.
Related tasksDisplaying information about performance events on page 168
You can use the Event Management inventory page to view a list of all the performance events onthe clusters being monitored by Unified Manager. By viewing this information you can determinethe most critical events and then drill down to detailed information to determine the cause of theevent.
Identifying victim workloads involved in a dynamic performance event on page 177In Unified Manager, you can identify which volume workloads have the highest deviation inresponse time (latency) caused by a storage component in contention. Identifying these workloadshelps you understand why the client applications accessing them have been performing slowerthan usual.
Identifying bully workloads involved in a dynamic performance event on page 178In Unified Manager, you can identify which workloads have the highest deviation in usage for acluster component in contention. Identifying these workloads helps you understand why certainvolumes on the cluster have slow response times (latency).
Identifying shark workloads involved in a dynamic performance event on page 179In Unified Manager, you can identify which workloads have the highest deviation in usage for astorage component in contention. Identifying these workloads helps you determine if theseworkloads should be moved to a less-utilized cluster.
189Analyzing performance events
Resolving performance events
You can use the suggested actions to try and resolve performance events on your own. The firstthree suggestions are always displayed, and the actions under the fourth suggestion are specific tothe type of event displayed.
The Help me do this links provide additional information for each suggested action, includinginstructions for performing a specific action. Some of the actions may involve using UnifiedManager, ONTAP System Manager, OnCommand Workflow Automation, ONTAP CLIcommands, or a combination of these tools.
Related conceptsHow Unified Manager determines the performance impact for an event on page 599
Unified Manager uses the deviation in activity, utilization, write throughput, cluster componentusage, or I/O latency (response time) for a workload to determine the level of impact to workloadperformance. This information determines the role of each workload in the event and how they areranked on the Event details page.
Related referencePerformance event analysis and notification on page 597
Performance events notify you about I/O performance issues on a workload caused by contentionon a cluster component. Unified Manager analyzes the event to identify all workloads involved,the component in contention, and whether the event is still an issue that you might need to resolve.
Confirming that the latency is within the expected rangeWhen a cluster component is in contention, volume workloads that use it might have decreasedresponse time (latency). You can review the latency of each victim workload on the component incontention to confirm that its actual latency is within its expected range. You can also click avolume name to view the historical data for the volume.
If the performance event is in the obsolete state, the latency of each victim involved in the eventmight have returned within its expected range.
Related conceptsRoles of workloads involved in a performance event on page 603
Unified Manager uses roles to identify the involvement of a workload in a performance event. Theroles include victims, bullies, and sharks. A user-defined workload can be a victim, bully, andshark at the same time.
How Unified Manager determines the performance impact for an event on page 599Unified Manager uses the deviation in activity, utilization, write throughput, cluster componentusage, or I/O latency (response time) for a workload to determine the level of impact to workloadperformance. This information determines the role of each workload in the event and how they areranked on the Event details page.
Related tasksIdentifying victim workloads involved in a dynamic performance event on page 177
In Unified Manager, you can identify which volume workloads have the highest deviation inresponse time (latency) caused by a storage component in contention. Identifying these workloadshelps you understand why the client applications accessing them have been performing slowerthan usual.
Identifying bully workloads involved in a dynamic performance event on page 178
190Resolving performance events

In Unified Manager, you can identify which workloads have the highest deviation in usage for acluster component in contention. Identifying these workloads helps you understand why certainvolumes on the cluster have slow response times (latency).
Identifying shark workloads involved in a dynamic performance event on page 179In Unified Manager, you can identify which workloads have the highest deviation in usage for astorage component in contention. Identifying these workloads helps you determine if theseworkloads should be moved to a less-utilized cluster.
Review the impact of configuration changes on workload performanceConfiguration changes on the cluster, such as a failed disk, HA failover, or a moved volume, couldnegatively impact volume performance and cause increased latency.
In Unified Manager, you can review the Workload Analysis page to see when a recentconfiguration change occurred and compare it to the operations and latency (response time) to seewhether there was a change in activity for the selected volume workload.
The performance pages of Unified Manager can only detect a limited number of change events.The health pages provide alerts for other events caused by configuration changes. You can searchfor the volume in Unified Manager to see the event history.
Related conceptsConfiguration changes detected by Unified Manager on page 70
Unified Manager monitors your clusters for configuration changes to help you determine whethera change might have caused or contributed to a performance event. The Performance Explorer
pages display a change event icon ( ) to indicate the date and time when the change wasdetected.
Roles of workloads involved in a performance event on page 603Unified Manager uses roles to identify the involvement of a workload in a performance event. Theroles include victims, bullies, and sharks. A user-defined workload can be a victim, bully, andshark at the same time.
How Unified Manager determines the performance impact for an event on page 599Unified Manager uses the deviation in activity, utilization, write throughput, cluster componentusage, or I/O latency (response time) for a workload to determine the level of impact to workloadperformance. This information determines the role of each workload in the event and how they areranked on the Event details page.
Related tasksIdentifying victim workloads involved in a dynamic performance event on page 177
In Unified Manager, you can identify which volume workloads have the highest deviation inresponse time (latency) caused by a storage component in contention. Identifying these workloadshelps you understand why the client applications accessing them have been performing slowerthan usual.
Identifying bully workloads involved in a dynamic performance event on page 178In Unified Manager, you can identify which workloads have the highest deviation in usage for acluster component in contention. Identifying these workloads helps you understand why certainvolumes on the cluster have slow response times (latency).
Identifying shark workloads involved in a dynamic performance event on page 179
191Resolving performance events
In Unified Manager, you can identify which workloads have the highest deviation in usage for astorage component in contention. Identifying these workloads helps you determine if theseworkloads should be moved to a less-utilized cluster.
Options for improving workload performance from the client-sideYou can check your client workloads, such as applications or databases, that are sending I/O tovolumes involved in a performance event to determine if a client-side change might correct theevent.
When the clients that are connected to volumes on a cluster increase their I/O requests, the clustermust work harder to meet the demand. If you know which clients have a high number of I/Orequests to a particular volume on the cluster, you can improve cluster performance by adjustingthe number of clients accessing the volume or decreasing the amount of I/O to the volume. Youcan also apply or increase a limit on the QoS policy group of which the volume is a member.
You can investigate clients and their applications to determine whether the clients are sendingmore I/O than usual, which might be causing contention on a cluster component. On the Eventdetails page, the System Diagnosis section displays the top volume workloads using thecomponent in contention. If you know which client is accessing a particular volume, you can go tothe client to determine whether the client hardware or an application is not operating as expectedor is doing more work than usual.
In a MetroCluster configuration, write requests to a volume on a local cluster are mirrored to avolume on the remote cluster. Keeping the source volume on the local cluster in sync with thedestination volume on the remote cluster can also increase the demand of both clusters in theMetroCluster configuration. By reducing write requests to these mirrored volumes, the clusters canperform fewer sync operations, which reduces the performance impact on other workloads.
Related conceptsTroubleshooting workloads using the workload analyzer on page 38
The workload analyzer provides a way to view important health and performance criteria for asingle workload on a single page to assist in troubleshooting. By viewing all current and pastevents for a workload you can get a better idea why the workload may be having a performance orcapacity issue now.
How storage QoS can control workload throughput on page 570You can create a Quality of Service (QoS) policy group to control the I/O per second (IOPS) orthroughput (MB/s) limit for the workloads it contains. If the workloads are in a policy group withno set limit, such as the default policy group, or the set limit does not meet your needs, you canincrease the limit or move the workloads to a new or existing policy group that has the desiredlimit.
Roles of workloads involved in a performance event on page 603Unified Manager uses roles to identify the involvement of a workload in a performance event. Theroles include victims, bullies, and sharks. A user-defined workload can be a victim, bully, andshark at the same time.
How Unified Manager determines the performance impact for an event on page 599Unified Manager uses the deviation in activity, utilization, write throughput, cluster componentusage, or I/O latency (response time) for a workload to determine the level of impact to workloadperformance. This information determines the role of each workload in the event and how they areranked on the Event details page.
Performance monitoring of MetroCluster configurations on page 592Unified Manager enables you to monitor the write throughput between clusters in a MetroClusterconfiguration to identify workloads with a high amount of write throughput. If these high-
192Resolving performance events

performing workloads are causing other volumes on the local cluster to have high I/O responsetimes, Unified Manager triggers performance events to notify you.
Related tasksIdentifying bully workloads involved in a dynamic performance event on page 178
In Unified Manager, you can identify which workloads have the highest deviation in usage for acluster component in contention. Identifying these workloads helps you understand why certainvolumes on the cluster have slow response times (latency).
Check for client or network issuesWhen the clients that are connected to volumes on a cluster increase their I/O requests, the clustermust work harder to meet the demand. The increased demand on the cluster can put a componentin contention, increase the latency of workloads that use it, and trigger an event in UnifiedManager.
On the Event details page, the System Diagnosis section displays the top volume workloads usingthe component in contention. If you know which client is accessing a particular volume, you cango to the client to determine whether the client hardware or an application is not operating asexpected or is doing more work than usual. You might need to contact your client administrator orapplication vendor for assistance.
You can check your network infrastructure to determine whether there are hardware issues,bottlenecks, or competing workloads that might have caused I/O requests between the cluster andconnected clients to perform slower than expected. You might need to contact your networkadministrator for assistance.
Verify whether other volumes in the QoS policy group have unusually highactivity
You can review the workloads in the Quality of Service (QoS) policy group with the highestchange in activity to determine whether more than one workload caused the event. You can alsosee whether other workloads are still exceeding the set throughput limit or whether they are backwithin their expected range of activity.
On the Event details page, in the System Diagnosis section, you can sort the workloads by peakdeviation in activity to display the workloads with the highest change in activity at the top of thetable. These workloads might be the "bullies" whose activity exceeded the set limit and might havecaused the event.
You can navigate to the Workload Analysis page for each volume workload to review its IOPSactivity. If the workload has periods of very high operations activity, it might have contributed tothe event. You can change the policy group settings for the workload or move the workload to adifferent policy group.
You can use ONTAP System Manager or the ONTAP CLI commands to manage policy groups, asfollows:
• Create a policy group.
• Add or remove workloads in a policy group.
• Move a workload between policy groups.
• Change the throughput limit of a policy group.
Related conceptsHow Unified Manager determines the performance impact for an event on page 599
Unified Manager uses the deviation in activity, utilization, write throughput, cluster componentusage, or I/O latency (response time) for a workload to determine the level of impact to workload
193Resolving performance events

performance. This information determines the role of each workload in the event and how they areranked on the Event details page.
Related tasksIdentifying victim workloads involved in a dynamic performance event on page 177
In Unified Manager, you can identify which volume workloads have the highest deviation inresponse time (latency) caused by a storage component in contention. Identifying these workloadshelps you understand why the client applications accessing them have been performing slowerthan usual.
Identifying bully workloads involved in a dynamic performance event on page 178In Unified Manager, you can identify which workloads have the highest deviation in usage for acluster component in contention. Identifying these workloads helps you understand why certainvolumes on the cluster have slow response times (latency).
Identifying shark workloads involved in a dynamic performance event on page 179In Unified Manager, you can identify which workloads have the highest deviation in usage for astorage component in contention. Identifying these workloads helps you determine if theseworkloads should be moved to a less-utilized cluster.
Move logical interfaces (LIFs)Moving logical interfaces (LIFs) to a less busy port can help improve load balancing, assist withmaintenance operations and performance tuning, and reduce indirect access.
Indirect access can reduce system efficiency. It occurs when a volume workload is using differentnodes for network processing and data processing. To reduce indirect access, you can rearrangeLIFs, which involves moving LIFs to use the same node for network processing and dataprocessing. You can configure load balancing to have ONTAP automatically move busy LIFs to adifferent port or you can move a LIF manually.
Benefits • Improve load balancing.
• Reduce indirect access.
Considerations Attention: When moving a LIF connected to CIFSshares, clients accessing the CIFS shares aredisconnected. Any read or write requests to the CIFSshares are disrupted.
You use the ONTAP commands to configure load balancing. For more information, see theONTAP networking documentation.
You use ONTAP System Manager and the ONTAP CLI commands to move LIFs manually.
Run storage efficiency operations at less busy timesYou can modify the policy or schedule that handles storage efficiency operations to run when theimpacted volume workloads are less busy.
Storage efficiency operations can use a high amount of cluster CPU resources and become a bullyto the volumes on which the operations are being run. If the victim volumes have high activity atthe same time when the storage efficiency operations are run, their latency can increase and triggeran event.
On the Event details page, the System Diagnosis section displays workloads in the QoS policygroup by peak deviation in activity to identify the bully workloads. If you see "storage efficiency"displayed near the top of the table, these operations are bullying the victim workloads. By
194Resolving performance events

modifying the efficiency policy or schedule to run when these workloads are less busy, you canprevent the storage efficiency operations from causing contention on a cluster.
You can use ONTAP System Manager to manage efficiency policies. You can use the ONTAPcommands to manage efficiency policies and schedules.
Related conceptsRoles of workloads involved in a performance event on page 603
Unified Manager uses roles to identify the involvement of a workload in a performance event. Theroles include victims, bullies, and sharks. A user-defined workload can be a victim, bully, andshark at the same time.
Related tasksIdentifying victim workloads involved in a dynamic performance event on page 177
In Unified Manager, you can identify which volume workloads have the highest deviation inresponse time (latency) caused by a storage component in contention. Identifying these workloadshelps you understand why the client applications accessing them have been performing slowerthan usual.
Identifying bully workloads involved in a dynamic performance event on page 178In Unified Manager, you can identify which workloads have the highest deviation in usage for acluster component in contention. Identifying these workloads helps you understand why certainvolumes on the cluster have slow response times (latency).
Identifying shark workloads involved in a dynamic performance event on page 179In Unified Manager, you can identify which workloads have the highest deviation in usage for astorage component in contention. Identifying these workloads helps you determine if theseworkloads should be moved to a less-utilized cluster.
What storage efficiency isStorage efficiency enables you to store the maximum amount of data for the lowest cost andaccommodates rapid data growth while consuming less space. NetApp strategy for storageefficiency is based on the built-in foundation of storage virtualization and unified storage providedby its core ONTAP operating system and Write Anywhere File Layout (WAFL) file system.
Storage efficiency includes using technologies such as thin provisioning, Snapshot copy,deduplication, data compression, FlexClone, thin replication with SnapVault and volumeSnapMirror, RAID-DP, Flash Cache, Flash Pool aggregate, and FabricPool-enabled aggregateswhich help to increase storage utilization and decrease storage costs.
The unified storage architecture allows you to efficiently consolidate a storage area network(SAN), network-attached storage (NAS), and secondary storage on a single platform.
High-density disk drives, such as serial advanced technology attachment (SATA) drives configuredwithin Flash Pool aggregate or with Flash Cache and RAID-DP technology, increase efficiencywithout affecting performance and resiliency.
A FabricPool-enabled aggregate includes an all SSD aggregate or HDD aggregate (starting withONTAP 9.8) as the local performance tier and an object store that you specify as the cloud tier.Configuring FabricPool helps you manage which storage tier (the local tier or the cloud tier) datashould be stored based on whether the data is frequently accessed.
Technologies such as thin provisioning, Snapshot copy, deduplication, data compression, thinreplication with SnapVault and volume SnapMirror, and FlexClone offer better savings. You canuse these technologies individually or together to achieve maximum storage efficiency.
195Resolving performance events

Add disks and reallocate dataYou can add disks to an aggregate to increase the storage capacity and the performance of thataggregate. After adding the disks, you will see an improvement in read performance only afterreallocating the data across the disks you added.
You can use these instructions when Unified Manager has received aggregate events triggered bydynamic thresholds or by system-defined performance thresholds:
• When you have received a dynamic threshold event, on the Event details page, the clustercomponent icon that represents the aggregate in contention is highlighted red.Beneath the icon, in parentheses, is the name of the aggregate, which identifies the aggregate towhich you can add disks.
• When you have received a system-defined threshold event, on the Event details page, the eventdescription text lists the name of the aggregate that is having the problem.You can add disks and reallocate data on this aggregate.
The disks you add to the aggregate must already exist in the cluster. If the cluster does not haveextra disks available, you might need to contact your administrator or purchase more disks. Youcan use ONTAP System Manager or the ONTAP commands to add disks to an aggregate.
Note: You should reallocate data when using HDD and Flash Pool aggregates only. Do notreallocate data on SSD or FabricPool aggregates.
How enabling Flash Cache on a node can improve workload performanceYou can improve workload performance by enabling Flash Cache™ intelligent data caching oneach node in the cluster.
A Flash Cache module, or Performance Acceleration Module PCIe-based memory module,optimizes the performance of random read-intensive workloads by functioning as an intelligentexternal read cache. This hardware works in tandem with the WAFL External Cache softwarecomponent of ONTAP.
In Unified Manager, on the Event details page, the cluster component icon that represents theaggregate in contention is highlighted red. Beneath the icon, in parentheses, is the name of theaggregate, which identifies the aggregate. You can enable Flash Cache on the node on which theaggregate resides.
You can use ONTAP System Manager or the ONTAP commands to see whether Flash Cache isinstalled or enabled, and to enable it if not already enabled. The following command indicateswhether Flash Cache is enabled on a specific node:
cluster::> run local options flexscale.enable
For more information about Flash Cache and the requirements for using it, see the followingtechnical report:
Technical Report 3832: Flash Cache Best Practices Guide
How enabling Flash Pool on a storage aggregate can improve workloadperformance
You can improve workload performance by enabling the Flash Pool feature on an aggregate. AFlash Pool is an aggregate that incorporates both HDDs and SSDs. The HDDs are used forprimary storage and the SSDs provide a high-performance read and write cache to boost aggregateperformance.
In Unified Manager, the Event details page displays the name of the aggregate in contention. Youcan use ONTAP System Manager or the ONTAP commands to see whether Flash Pool is enabled
196Resolving performance events
for an aggregate. If you have SSDs installed, you can use the command-line interface to enable it.If you have SSDs installed, you can run the following command on the aggregate to see whetherFlash Pool is enabled:
cluster::> storage aggregate show -aggregate aggr_name -field hybrid-enabled
In this command, aggr_name is the name of the aggregate, such as the aggregate in contention.
For more information about Flash Pool and the requirements for using it, see the Clustered DataONTAP Physical Storage Management Guide.
MetroCluster configuration health checkYou can use Unified Manager to review the health of the clusters in a MetroCluster configuration.The health status and events help you determine whether there are hardware or software issues thatmight be impacting the performance of your workloads.
If you configure Unified Manager to send email alerts, you can check your email for any healthissues on the local or remote cluster that might have contributed to a performance event. In theUnified Manager GUI, you can select Event Management to see a list current events and then usethe filters to display MetroCluster configuration events only.
Related conceptsPerformance monitoring of MetroCluster configurations on page 592
Unified Manager enables you to monitor the write throughput between clusters in a MetroClusterconfiguration to identify workloads with a high amount of write throughput. If these high-performing workloads are causing other volumes on the local cluster to have high I/O responsetimes, Unified Manager triggers performance events to notify you.
Performance event analysis for a MetroCluster configuration on page 180You can use Unified Manager to analyze a performance event for a MetroCluster configuration.You can identify the workloads involved in the event and review the suggested actions forresolving it.
Related tasksChecking the health of clusters in a MetroCluster configuration on page 208
You can use Unified Manager to check the operational health of clusters, and their components, ina MetroCluster configuration. If the clusters were involved in a performance event detected byUnified Manager, the health status can help you determine whether a hardware or software issuecontributed to the event.
MetroCluster configuration verificationYou can prevent performance issues for mirrored workloads in a MetroCluster configuration byensuring that the MetroCluster configuration is set up correctly. You can also improve workloadperformance by changing the configuration or upgrading software or hardware components.
The MetroCluster Installation and Configuration Guide provides instructions for setting up theclusters in the MetroCluster configuration, including the Fibre Channel (FC) switches, cables, andinter-switch links (ISLs). It also helps you configure the MetroCluster software so that the localand remote clusters can communicate with mirror volume data.
You can compare your MetroCluster configuration to the requirements in the MetroClusterInstallation and Configuration Guide to determine whether changing or upgrading components inyour MetroCluster configuration might improve workload performance. This comparison can helpyou answer the following questions:
• Are the controllers appropriate for your workloads?
• Do you need to upgrade your ISL bundles to a larger bandwidth to handle more throughput?
197Resolving performance events

• Can you adjust the buffer-to-buffer credits (BBC) on your switches to increase the bandwidth?
• If your workloads have high write throughput to solid state drive (SSD) storage, do you need toupgrade your FC-to-SAS bridges to accommodate the throughput?
For information about replacing or upgrading MetroCluster components, see the MetroClusterService Guide.
Related conceptsPerformance monitoring of MetroCluster configurations on page 592
Unified Manager enables you to monitor the write throughput between clusters in a MetroClusterconfiguration to identify workloads with a high amount of write throughput. If these high-performing workloads are causing other volumes on the local cluster to have high I/O responsetimes, Unified Manager triggers performance events to notify you.
Performance event analysis for a MetroCluster configuration on page 180You can use Unified Manager to analyze a performance event for a MetroCluster configuration.You can identify the workloads involved in the event and review the suggested actions forresolving it.
Related tasksAnalyzing a dynamic performance event on a cluster in a MetroCluster configuration on page181
You can use Unified Manager to analyze the cluster in a MetroCluster configuration on which aperformance event was detected. You can identify the cluster name, event detection time, and thebully and victim workloads involved.
Moving workloads to a different aggregateYou can use Unified Manager to help identify an aggregate that is less busy than the aggregatewhere your workloads currently reside, and then you can move selected volumes or LUNs to thataggregate. Moving high performing workloads to a less busy aggregate, or an aggregate with flashstorage enabled, allows the workload to perform more efficiently.
Before you begin
• You must have the Operator, Application Administrator, or Storage Administrator role.
• You must have recorded the name of the aggregate that is currently having a performanceissue.
• You must have recorded the date and time at which the aggregate received the event.
• Unified Manager must have collected and analyzed a month or more of performance data.
About this task
These steps help you identify the following resources so that you can move high-performingworkloads to a lower utilized aggregate:
• The aggregates on the same cluster that are less utilized
• The highest-performing volumes on the current aggregate
Steps
1. Identify the aggregate in the cluster that is the least utilized:
a. From the Event details page, click the name of the cluster on which the aggregate resides.The cluster details are displayed in the Performance/Cluster Landing page.
b. On the Summary page, click Aggregates from the Managed Objects pane.The list of aggregates on this cluster are displayed.
c. Click the Utilization column to sort the aggregates by least utilized.
198Resolving performance events

You can also identify those aggregates that have the greatest Free Capacity. This providesa list of potential aggregates to which you might want to move workloads.
d. Write down the name of the aggregate to which you want to move the workloads.
2. Identify the high-performing volumes from the aggregate that received the event:
a. Click the aggregate that is having the performance issue.The aggregate details are displayed in the Performance/Aggregate Explorer page.
b. From the Time Range selector, select Last 30 Days, and then click Apply Range.
This enables you to view a longer performance history period than the default 72 hours.You want to move a volume that is using a lot of resources on a consistent basis, not justover the past 72 hours.
c. From the View and Compare control, select Volumes on this Aggregate.A list of FlexVol volumes and FlexGroup constituent volumes on this aggregate aredisplayed.
d. Sort the volumes by highest MB/s, and then by highest IOPS, to see the highest performingvolumes.
e. Write down the names of the volumes that you want to move to a different aggregate.
3. Move the high-performing volumes to the aggregate you identified as having low utilization.
You can perform the move operation by using ONTAP System Manager, OnCommandWorkflow Automation, ONTAP commands, or a combination of these tools.
After you finish
After a few days, check to see whether you are receiving the same type of events from this node oraggregate.
Moving workloads to a different nodeYou can use Unified Manager to help identify an aggregate on a different node that is less busythan the node on which your workloads are currently running, and then you can move selectedvolumes to that aggregate. Moving high-performing workloads to an aggregate on a less busy nodeallows the workloads on both nodes to perform more efficiently.
Before you begin
• You must have the Operator, Application Administrator, or Storage Administrator role.
• You must have recorded the name of the node that is currently having a performance issue.
• You must have recorded the date and time at which the node received the performance event.
• Unified Manager must have collected and analyzed performance data for a month or longer.
About this task
This procedure helps you to identify the following resources so that you can move high-performing workloads to a lower utilized node:
• The nodes on the same cluster that have the greatest free performance capacity
• The aggregates on the new node that have the greatest free performance capacity
• The highest-performing volumes on the current node
Steps
1. Identify a node in the cluster that has the greatest free performance capacity:
a. On the Event Details page, click the name of the cluster on which the node resides.The cluster details are displayed in the Performance/Cluster Landing page.
b. On the Summary tab, click Nodes from the Managed Objects pane.The list of nodes on this cluster are displayed.
c. Click the Performance Capacity Used column to sort the nodes by least percentage used.
199Resolving performance events

This provides a list of potential nodes to which you might want to move workloads.
d. Write down the name of the node to which you want to move the workloads.
2. Identify an aggregate on the new node that is the least utilized:
a. In the left navigation pane, click Storage > Aggregates and select Performance > AllAggregates from the View menu.The Performance: All Aggregates view is displayed.
b. Click Filtering, select Node from the left drop-down menu, type the name of the node inthe text field, and then click Apply Filter.The Performance: All Aggregates view is redisplayed with the list of aggregates that areavailable on this node.
c. Click the Performance Capacity Used column to sort the aggregates by least used.
This provides a list of potential aggregates to which you might want to move workloads.
d. Write down the name of the aggregate to which you want to move the workloads.
3. Identify the high-performing workloads from the node that received the event:
a. Return to the Event Details page for the event.
b. In the Affected Volumes field, click the link for the number of volumes.The Performance: All Volumes view is displayed with a filtered list of the volumes on thatnode.
c. Click the Total Capacity column to sort the volumes by the largest allocated space.
This provides a list of potential volumes that you may want to move.
d. Write down the names of the volumes that you want to move, and the names of the currentaggregates on which they reside.
4. Move the volumes to the aggregates that you identified as having greatest free performancecapacity on the new node.
You can perform the move operation by using ONTAP System Manager, OnCommandWorkflow Automation, ONTAP commands, or a combination of these tools.
After you finish
After a few days, you can check whether you are receiving the same type of events from this nodeor aggregate.
Moving workloads to an aggregate on a different nodeYou can use Unified Manager to help identify an aggregate on a different node that is less busythan the node where your workloads are currently running, and then you can move selectedvolumes to that aggregate. Moving high-performing workloads to an aggregate on a less busy nodeallows workloads on both nodes to perform more efficiently.
Before you begin
• You must have the Operator, Application Administrator, or Storage Administrator role.
• You must have recorded the name of the node that is currently having a performance issue.
• You must have recorded the date and time at which the node received the performance event.
• Unified Manager must have collected and analyzed a month or more of performance data.
About this task
These steps help you identify the following resources so that you can move high-performingworkloads to a lower utilized node:
• The nodes on the same cluster that are less utilized
• The aggregates on the new node that are the least utilized
• The highest-performing volumes on the current node
200Resolving performance events

Steps
1. Identify a node in the cluster that is the least utilized:
a. From the Event details page, click the name of the cluster on which the node resides.The cluster details are displayed in the Performance/Cluster Landing page.
b. On the Summary page, click Nodes from the Managed Objects pane.The list of nodes on this cluster are displayed.
c. Click the Utilization column to sort the nodes by least utilized.
You can also identify those nodes that have the greatest Free Capacity. This provides a listof potential nodes to which you might want to move workloads.
d. Write down the name of the node to which you want to move the workloads.
2. Identify an aggregate on the new node that is the least utilized:
a. In the left navigation pane, click Storage > Aggregates and select Performance > AllAggregates from the View menu.The Performance: All Aggregates view is displayed.
b. Click Filtering, select Node from the left drop-down menu, type the name of the node inthe text field, and then click Apply Filter.The Performance: All Aggregates view is redisplayed with the list of aggregates that areavailable on this node.
c. Click the Utilization column to sort the aggregates by least utilized.
You can also identify those aggregates that have the greatest Free Capacity. This providesa list of potential aggregates to which you might want to move workloads.
d. Write down the name of the aggregate to which you want to move the workloads.
3. Identify the high-performing workloads from the node that received the event:
a. Return to the Event details page for the event.
b. In the Affected Volumes field, click the link for the number of volumes.The Performance: All Volumes view is displayed with a filtered list of the volumes on thatnode.
c. Click the Total Capacity column to sort the volumes by the largest allocated space.
This provides a list of potential volumes that you may want to move.
d. Write down the names of the volumes that you want to move, and the names of the currentaggregates on which they reside.
4. Move the volumes to the aggregates you identified as having low utilization on the new node.
You can perform the move operation by using ONTAP System Manager, OnCommandWorkflow Automation, ONTAP commands, or a combination of these tools.
After you finish
After a few days, check to see whether you are receiving the same type of events from this node oraggregate.
Moving workloads to a node in a different HA pairYou can use Unified Manager to help identify an aggregate on a node in a different high-availability (HA) pair that has more free performance capacity than the HA pair where yourworkloads are currently running. Then you can move selected volumes to aggregates on the newHA pair.
Before you begin
• You must have the Operator, Application Administrator, or Storage Administrator role.
• Your cluster must consist of a minimum of two HA pairs
You cannot use this remediation process if you have only one HA pair in your cluster.
201Resolving performance events

• You must have recorded the names of the two nodes in the HA pair that are currently having aperformance issue.
• You must have recorded the date and time at which the nodes received the performance event.
• Unified Manager must have collected and analyzed performance data for a month or longer.
About this task
Moving high-performing workloads to an aggregate on a node with more free performancecapacity allows workloads on both nodes to perform more efficiently. This procedure helps you toidentify the following resources so that you can move high-performing workloads to a node thathas more free performance capacity on a different HA pair:
• The nodes in a different HA pair on the same cluster that have the greatest free performancecapacity
• The aggregates on the new nodes that have the greatest free performance capacity
• The highest-performing volumes on the current nodes
Steps
1. Identify the nodes that are part of a different HA pair on the same cluster:
a. On the Event Details page, click the name of the cluster on which the nodes reside.The cluster details are displayed in the Performance/Cluster Landing page.
b. On the Summary page, click Nodes from the Managed Objects pane.The list of nodes on this cluster is displayed in the Performance: All Nodes view.
c. Write down the names of the nodes that are in different HA pairs from the HA pair that iscurrently having a performance issue.
2. Identify a node in the new HA pair that has the greatest free performance capacity:
a. On the Performance: All Nodes view, click the Performance Capacity Used column tosort the nodes by least percentage used.
This provides a list of potential nodes to which you might want to move workloads.
b. Write down the name of the node on a different HA pair to which you want to move theworkloads.
3. Identify an aggregate on the new node that has the greatest free performance capacity:
a. On the Performance: All Nodes view, click the node.The node details are displayed in the Performance/Node Explorer page.
b. In the View and Compare menu, select Aggregates on this Node.The aggregates on this node are displayed in the grid.
c. Click the Performance Capacity Used column to sort the aggregates by least used.
This provides a list of potential aggregates to which you might want to move workloads.
d. Write down the name of the aggregate to which you want to move the workloads.
4. Identify the high-performing workloads from the nodes that received the event:
a. Return to the Event details page for the event.
b. In the Affected Volumes field, click the link for the number of volumes for the first node.The Performance: All Volumes view is displayed with a filtered list of the volumes on thatnode.
c. Click the Total Capacity column to sort the volumes by the largest allocated space.
This provides a list of potential volumes that you might want to move.
d. Write down the names of the volumes that you want to move, and the names of the currentaggregates on which they reside.
e. Perform steps 4c and 4d for the second node that was part of this event to identify possiblevolumes that you want to move from that node as well.
202Resolving performance events

5. Move the volumes to the aggregates that you identified as having greatest free performancecapacity on the new node.
You can perform the move operation by using ONTAP System Manager, OnCommandWorkflow Automation, ONTAP commands, or a combination of these tools.
After you finish
After a few days, you can check whether you are receiving the same type of events from this nodeor aggregate.
Moving workloads to another node in a different HA pairYou can use Unified Manager to help identify an aggregate on a node in a different HA pair that isless busy than the HA pair where your workloads are currently running. Then you can moveselected volumes to aggregates on the new HA pair. Moving high-performing workloads to anaggregate on a less busy node allows workloads on both nodes to perform more efficiently.
Before you begin
• You must have the Operator, Application Administrator, or Storage Administrator role.
• Your cluster must consist of a minimum of two HA pairs; you cannot use this remediationprocess if you have only one HA pair in your cluster.
• You must have recorded the names of the two nodes in the HA pair that are currently havingthe performance issue.
• You must have recorded the date and time at which the nodes received the performance event.
• Unified Manager must have collected and analyzed a month or more of performance data.
About this task
These steps help you identify the following resources so that you can move high-performingworkloads to a lower utilized node on a different HA pair:
• The nodes in a different HA pair on the same cluster that are less utilized
• The aggregates on the new nodes that are the least utilized
• The highest-performing volumes on the current nodes
Steps
1. Identify the nodes that are part of a different HA pair on the same cluster:
a. In the left navigation pane, click Storage > Clusters and select Performance > AllClusters from the View menu.The Performance: All Clusters view is displayed.
b. Click the number in the Node Count field for the current cluster.The Performance: All Nodes view is displayed.
c. Write down the names of the nodes that are in different HA pairs from the HA pair that iscurrently having the performance issue.
2. Identify a node in the new HA pair that is the least utilized:
a. Click the Utilization column to sort the nodes by least utilized.
You can also identify those nodes that have the greatest Free Capacity. This provides a listof potential nodes to which you might want to move workloads.
b. Write down the name of the node to which you want to move the workloads.
3. Identify an aggregate on the new node that is the least utilized:
a. In the left navigation pane, click Storage > Aggregates and select Performance > AllAggregates from the View menu.The Performance: All Aggregates view is displayed.
203Resolving performance events

b. Click Filtering, select Node from the left drop-down menu, type the name of the node inthe text field, and then click Apply Filter.The Performance: All Aggregates view is redisplayed with the list of aggregates that areavailable on this node.
c. Click the Utilization column to sort the aggregates by least utilized.
You can also identify those aggregates that have the greatest Free Capacity. This providesa list of potential aggregates to which you might want to move workloads.
d. Write down the name of the aggregate to which you want to move the workloads.
4. Identify the high-performing workloads from the nodes that received the event:
a. Return to the Event details page for the event.
b. In the Affected Volumes field, click the link for the number of volumes for the first node.The Performance: All Volumes view is displayed with a filtered list of the volumes on thatnode.
c. Click the Total Capacity column to sort the volumes by the largest allocated space.
This provides a list of potential volumes that you might want to move.
d. Write down the names of the volumes that you want to move, and the names of the currentaggregates on which they reside.
e. Perform steps 4c and 4d for the second node that was part of this event to identify possiblevolumes that you want to move from that node as well.
5. Move the volumes to the aggregates you identified as having low utilization on the new node.
You can perform the move operation by using ONTAP System Manager, OnCommandWorkflow Automation, ONTAP commands, or a combination of these tools.
After you finish
After a few days, check to see whether you are receiving the same type of events from this node oraggregate.
Use QoS policy settings to prioritize the work on this nodeYou can set a limit on a QoS policy group to control the I/O per second (IOPS) or MBpsthroughput limit for the workloads it contains. If workloads are in a policy group with no set limit,such as the default policy group, or the set limit does not meet your needs, you can increase the setlimit or move the workloads to a new or existing policy group that has the desired limit.
If a performance event on a node is caused by workloads overusing the node resources, the eventdescription on the Event details page displays a link to the list of volumes involved. In thePerformance/Volumes page, you can sort the affected volumes by IOPS and MBps to see whichworkloads have the highest usage that might have contributed to the event.
By assigning the volumes that are overusing the node resources to a more restrictive policy groupsetting, the policy group throttles the workloads to restrict their activity, which can reduce the useof the resources on that node.
You can use ONTAP System Manager or the ONTAP commands to manage policy groups,including the following tasks:
• Creating a policy group
• Adding or removing workloads in a policy group
• Moving a workload between policy groups
• Changing the throughput limit of a policy group
204Resolving performance events

Remove inactive volumes and LUNsWhen aggregate free space has been identified as an issue, you can search for unused volumes andLUNs and delete them from the aggregate. This can help to alleviate the low disk space issue.
If a performance event on an aggregate is caused by low disk space, there are a few ways you candetermine which volumes and LUNs are no longer being used.
To identify unused volumes:
• On the Event details page, the Affected Objects Count field provides a link that displays thelist of affected volumes.
Click the link to display the volumes on the Performance: All Volumes view. From there youcan sort the affected volumes by IOPS to see which volumes have not been active.
To identify unused LUNs:
1. From the Event details page, write down the name of the aggregate on which the eventoccurred.
2. In the left navigation pane, click Storage > LUNs and select Performance > All LUNs fromthe View menu.
3. Click Filtering, select Aggregate from the left drop-down menu, type the name of theaggregate in the text field, and then click Apply Filter.
4. Sort the resulting list of affected LUNs by IOPS to view the LUNs that are not active.
After you have identified the unused volumes and LUNs, you can use ONTAP System Manager orthe ONTAP commands to delete those objects.
Add disks and perform aggregate layout reconstructionYou can add disks to an aggregate to increase the storage capacity and the performance of thataggregate. After adding the disks, you only see an improvement in performance afterreconstructing the aggregate.
When you receive a system-defined threshold event on the Event details page, the eventdescription text lists the name of the aggregate that is having the problem. You can add disks andreconstruct data on this aggregate.
The disks you add to the aggregate must already exist in the cluster. If the cluster does not haveextra disks available, you might need to contact your administrator or purchase more disks. Youcan use ONTAP System Manager or the ONTAP commands to add disks to an aggregate.
Technical Report 3838: Storage Subsystem Configuration Guide
205Resolving performance events

Managing and monitoring clusters and cluster object health
Unified Manager uses periodic API queries and a data collection engine to collect data from theclusters. By adding clusters to the Unified Manager database, you can monitor and manage theseclusters for any availability and capacity risks.
Understanding cluster monitoringYou can add clusters to the Unified Manager database to monitor clusters for availability, capacity,and other details, such as CPU usage, interface statistics, free disk space, qtree usage, and chassisenvironmental.
Events are generated if the status is abnormal or when a predefined threshold is breached. Ifconfigured to do so, Unified Manager sends a notification to a specified recipient when an eventtriggers an alert.
Understanding node root volumesYou can monitor the node root volume using Unified Manager. The best practice is that the noderoot volume should have sufficient capacity to prevent the node from going down.
When the used capacity of the node root volume exceeds 80 percent of the total node root volumecapacity, the Node Root Volume Space Nearly Full event is generated. You can configure an alertfor the event to get a notification. You can take appropriate actions to prevent the node from goingdown by using either ONTAP System Manager or the ONTAP CLI.
Understanding events and thresholds for node root aggregatesYou can monitor the node root aggregate by using Unified Manager. The best practice is to thicklyprovision the root volume in the root aggregate to prevent the node from halting.
By default, capacity and performance events are not generated for root aggregates. Also, thethreshold values used by Unified Manager are not applicable to the node root aggregates. Only atechnical support representative can modify the settings for these events to be generated. When thesettings are modified by the technical support representative, the capacity threshold values areapplied to the node root aggregate.
You can take appropriate actions to prevent the node from halting by using either ONTAP SystemManager or the ONTAP CLI.
Understanding quorum and epsilonQuorum and epsilon are important measures of cluster health and function that together indicatehow clusters address potential communications and connectivity challenges.
Quorum is a precondition for a fully functioning cluster. When a cluster is in quorum, a simplemajority of nodes are healthy and can communicate with each other. When quorum is lost, thecluster loses the ability to accomplish normal cluster operations. Only one collection of nodes canhave quorum at any one time because all of the nodes collectively share a single view of the data.Therefore, if two non-communicating nodes are permitted to modify the data in divergent ways, itis no longer possible to reconcile the data into a single data view.
Each node in the cluster participates in a voting protocol that elects one node master; eachremaining node is a secondary. The master node is responsible for synchronizing informationacross the cluster. When quorum is formed, it is maintained by continual voting. If the master nodegoes offline and the cluster is still in quorum, a new master is elected by the nodes that remainonline.
206Managing and monitoring clusters and cluster object health

Because there is the possibility of a tie in a cluster that has an even number of nodes, one node hasan extra fractional voting weight called epsilon. If the connectivity between two equal portions ofa large cluster fails, the group of nodes containing epsilon maintains quorum, assuming that all ofthe nodes are healthy. For example, the following illustration shows a four-node cluster in whichtwo of the nodes have failed. However, because one of the surviving nodes holds epsilon, thecluster remains in quorum even though there is not a simple majority of healthy nodes.
Epsilon is automatically assigned to the first node when the cluster is created. If the node thatholds epsilon becomes unhealthy, takes over its high-availability partner, or is taken over by itshigh-availability partner, then epsilon is automatically reassigned to a healthy node in a differentHA pair.
Taking a node offline can affect the ability of the cluster to remain in quorum. Therefore, ONTAPissues a warning message if you attempt an operation that will either take the cluster out ofquorum or else put it one outage away from a loss of quorum. You can disable the quorum warningmessages by using the cluster quorum-service options modify command at theadvanced privilege level.
In general, assuming reliable connectivity among the nodes of the cluster, a larger cluster is morestable than a smaller cluster. The quorum requirement of a simple majority of half the nodes plusepsilon is easier to maintain in a cluster of 24 nodes than in a cluster of two nodes.
A two-node cluster presents some unique challenges for maintaining quorum. Two-node clustersuse cluster HA, in which neither node holds epsilon; instead, both nodes are continuously polled toensure that if one node fails, the other has full read-write access to data, as well as access tological interfaces and management functions.
Viewing the cluster list and detailsYou can use the Health: All Clusters view to view your inventory of clusters. The Capacity: AllClusters view enables you to view summarized information about storage capacity and utilizationin all clusters.
Before you begin
You must have the Operator, Application Administrator, or Storage Administrator role.
About this task
You can also view details for individual clusters such as the cluster health, capacity, configuration,LIFs, nodes, and disks in that cluster by using the Cluster / Health details page.
The details in the Health: All Clusters view, Capacity: All Clusters view, and the Cluster / Healthdetails page help you plan your storage. For example, before provisioning a new aggregate, youcan select a specific cluster from the Health: All Clusters view and obtain capacity details todetermine if the cluster has the required space.
Steps
1. In the left navigation pane, click Storage > Clusters.
2. In the View menu, select Health: All Clusters view to view health information, or Capacity:All Clusters view to view details about storage capacity and utilization in all clusters.
3. Click the name of a cluster to view complete details of the cluster in the Cluster / Healthdetails page.
207Managing and monitoring clusters and cluster object health

Related tasksAdding users on page 625
You can add local users or database users by using the Users page. You can also add remote usersor groups that belong to an authentication server. You can assign roles to these users and, based onthe privileges of the roles, users can manage the storage objects and data with Unified Manager, orview the data in a database.
Exporting storage data as reports on page 27You can export storage data in a variety of output formats and then use the exported data to buildreports. For example, if there are 10 critical events that have not been resolved, you can export thedata from the Event Management inventory page to create a report, and then send the report toadmins who can resolve the issues.
Adding alerts on page 119You can configure alerts to notify you when a particular event is generated. You can configurealerts for a single resource, for a group of resources, or for events of a particular severity type. Youcan specify the frequency with which you want to be notified and associate a script to the alert.
Editing clusters on page 619You can modify the settings of an existing cluster, such as the host name or IP address, user name,password, and port, by using the Edit Cluster dialog box.
Related referenceCapacity: All Clusters view on page 222
The Capacity: All Clusters view enables you to view summarized information about storagecapacity and utilization in all clusters. This information helps you to understand possible capacityrisks and to take appropriate action to rebalance workloads.
Health: All Clusters view on page 220The Health: All Clusters view enables you to view health information about the clusters that youare monitoring.
Cluster / Health details page on page 224The Cluster / Health details page provides detailed information about a selected cluster, such ashealth, capacity, and configuration details. You can also view information about the networkinterfaces (LIFs), nodes, disks, related devices, and related alerts for the cluster.
Checking the health of clusters in a MetroCluster configurationYou can use Unified Manager to check the operational health of clusters, and their components, ina MetroCluster configuration. If the clusters were involved in a performance event detected byUnified Manager, the health status can help you determine whether a hardware or software issuecontributed to the event.
Before you begin
• You must have the Operator, Application Administrator, or Storage Administrator role.
• You must have analyzed a performance event for a MetroCluster configuration and obtainedthe name of the cluster involved.
• Both clusters in the MetroCluster configuration must be monitored by the same instance ofUnified Manager.
Steps
1. In the left navigation pane, click Event Management to display the event list.
2. In the filter panel, select all MetroCluster filters under the Source Type category.
3. Next to a MetroCluster event, click the name of the cluster.The Health: All Clusters view is displayed with detailed information about the event.
208Managing and monitoring clusters and cluster object health

Note: If no MetroCluster events are displayed, you can use the Search bar to search for thename of the cluster involved in the performance event.
4. Select the MetroCluster Connectivity tab to display the health of the connection between theselected cluster and its partner cluster.
In this example, the names and the components of the local cluster and its partner cluster aredisplayed. A yellow or red icon indicates a health event for the highlighted component. TheConnectivity icon represents the link between the clusters. You can point your mouse cursor toan icon to display event information or click the icon to display the events. A health issue oneither cluster might have contributed to the performance event.
Unified Manager monitors the NVRAM component of the link between the clusters. If the FCSwitches icon on the local or partner cluster or the Connectivity icon is red, a link health issuemight have caused the performance event.
5. Select the MetroCluster Replication tab.
In this example, if the NVRAM icon on the local or partner cluster is yellow or red, a healthissue with the NVRAM might have caused the performance event. If there are no red or yellowicons on the page, a performance issue on the partner cluster might have caused theperformance event.
Related conceptsPerformance monitoring of MetroCluster configurations on page 592
Unified Manager enables you to monitor the write throughput between clusters in a MetroClusterconfiguration to identify workloads with a high amount of write throughput. If these high-performing workloads are causing other volumes on the local cluster to have high I/O responsetimes, Unified Manager triggers performance events to notify you.
Roles of workloads involved in a performance event on page 603
209Managing and monitoring clusters and cluster object health

Unified Manager uses roles to identify the involvement of a workload in a performance event. Theroles include victims, bullies, and sharks. A user-defined workload can be a victim, bully, andshark at the same time.
Related tasksAnalyzing a dynamic performance event on a cluster in a MetroCluster configuration on page181
You can use Unified Manager to analyze the cluster in a MetroCluster configuration on which aperformance event was detected. You can identify the cluster name, event detection time, and thebully and victim workloads involved.
Analyzing a dynamic performance event for a remote cluster on a MetroCluster configuration onpage 183
You can use Unified Manager to analyze dynamic performance events on a remote cluster in aMetroCluster configuration. The analysis helps you determine whether an event on the remotecluster caused an event on its partner cluster.
Related referencePerformance event analysis and notification on page 597
Performance events notify you about I/O performance issues on a workload caused by contentionon a cluster component. Unified Manager analyzes the event to identify all workloads involved,the component in contention, and whether the event is still an issue that you might need to resolve.
Viewing the health and capacity status of All SAN Array clustersYou can use the Cluster inventory pages to display the health and capacity status of your All SANArray clusters.
Before you begin
You must have the Operator, Application Administrator, or Storage Administrator role.
About this task
You can view overview information for All SAN Array clusters in the Health: All Clusters viewand Capacity: All Clusters view. Additionally, you can view details in the Cluster / Health detailspage.
Steps
1. In the left navigation pane, click Storage > Clusters.
2. Make sure that the "Personality" column is displayed in the Health: All Clusters view, or addit using the Show / Hide control.This column displays "All SAN Array" for your All SAN Array clusters.
3. Review the information.
4. To view information about storage capacity in those clusters, select the Capacity: All Clustersview.
5. To view detailed information about health and storage capacity in those clusters, click the nameof an All SAN Array cluster.View the details in the Health, Capacity, and Nodes tabs in the Cluster / Health details page
210Managing and monitoring clusters and cluster object health

Viewing the node list and detailsYou can use the Health: All Nodes view to view the list of nodes in your clusters. You can use theCluster / Health details page to view detailed information about nodes that are part of the clusterthat is monitored.
Before you begin
You must have the Operator, Application Administrator, or Storage Administrator role.
About this task
You can view details such as the node state, cluster that contains the node, aggregate capacitydetails (used and total), and raw capacity details (usable, spare, and total). You can also obtaininformation about HA pairs, disks shelves, and ports.
Steps
1. In the left navigation pane, click Storage > Nodes.
2. On the Health: All Nodes view, click the node whose details you want to view.The detailed information for the selected node is displayed in the Cluster / Health details page.The left pane displays the list of HA pairs. By default, the HA Details is open, which displaysHA state details and events related to the selected HA pair.
3. To view other details about the node, perform the appropriate action:
To view... Click...
Details about the disk shelves Disk Shelves.
Port-related information Ports.
Related tasksAdding users on page 625
You can add local users or database users by using the Users page. You can also add remote usersor groups that belong to an authentication server. You can assign roles to these users and, based onthe privileges of the roles, users can manage the storage objects and data with Unified Manager, orview the data in a database.
Viewing the cluster list and details on page 207You can use the Health: All Clusters view to view your inventory of clusters. The Capacity: AllClusters view enables you to view summarized information about storage capacity and utilizationin all clusters.
Exporting storage data as reports on page 27You can export storage data in a variety of output formats and then use the exported data to buildreports. For example, if there are 10 critical events that have not been resolved, you can export thedata from the Event Management inventory page to create a report, and then send the report toadmins who can resolve the issues.
Adding alerts on page 119You can configure alerts to notify you when a particular event is generated. You can configurealerts for a single resource, for a group of resources, or for events of a particular severity type. Youcan specify the frequency with which you want to be notified and associate a script to the alert.
Generating a hardware inventory report for contract renewal on page 212You can generate a report that contains a complete list of cluster and node information; such ashardware model numbers and serial numbers, disk types and counts, installed licenses, and more.
211Managing and monitoring clusters and cluster object health

This report is helpful for contract renewal within secure sites ("dark" sites) that are not connectedto the NetApp Active IQ platform.
Related referenceHealth: All Nodes view on page 235
The Health: All Nodes view enables you to view detailed information about the nodes in allclusters being managed by Unified Manager.
Generating a hardware inventory report for contract renewalYou can generate a report that contains a complete list of cluster and node information; such ashardware model numbers and serial numbers, disk types and counts, installed licenses, and more.This report is helpful for contract renewal within secure sites ("dark" sites) that are not connectedto the NetApp Active IQ platform.
Before you begin
You must have the Operator, Application Administrator, or Storage Administrator role.
Steps
1. In the left navigation pane, click Storage > Nodes.
2. In the Health: All Nodes view, or the Performance: All Nodes view, click the HardwareInventory Report button.The hardware inventory report is downloaded as a .csv file with complete information as ofthe current date.
3. Provide this information to your NetApp support contact for contract renewal.
Viewing the Storage VM list and detailsFrom the Health: All Storage VMs view, you can monitor your inventory of storage virtualmachines (SVMs). You can use the Storage VM / Health details page to view detailed informationabout SVMs that are monitored.
Before you begin
You must have the Operator, Application Administrator, or Storage Administrator role.
About this task
You can view SVM details, such as the capacity, efficiency, and configuration of an SVM. You canalso view information about the related devices and related alerts for that SVM.
Steps
1. In the left navigation pane, click Storage > Storage VMs.
2. Choose one of the following ways to view the SVM details:
• To view information about the health of all SVMs in all clusters, in the View menu, selectHealth: All Storage VMs view.
• To view the complete details, click the Storage VM name.
You can also view the complete details by clicking View Details in the minimal detailsdialog box.
3. Optional: View the objects related to the SVM by clicking View Related in the minimal detailsdialog box.
Related tasksAdding users on page 625
You can add local users or database users by using the Users page. You can also add remote usersor groups that belong to an authentication server. You can assign roles to these users and, based on
212Managing and monitoring clusters and cluster object health

the privileges of the roles, users can manage the storage objects and data with Unified Manager, orview the data in a database.
Exporting storage data as reports on page 27You can export storage data in a variety of output formats and then use the exported data to buildreports. For example, if there are 10 critical events that have not been resolved, you can export thedata from the Event Management inventory page to create a report, and then send the report toadmins who can resolve the issues.
Adding alerts on page 119You can configure alerts to notify you when a particular event is generated. You can configurealerts for a single resource, for a group of resources, or for events of a particular severity type. Youcan specify the frequency with which you want to be notified and associate a script to the alert.
Related referenceHealth: All Storage VMs view on page 251
The Health: All Storage VMs view enables you to view detailed information about the storagevirtual machines (SVMs) that you are monitoring.
Storage VM / Health details page on page 253You can use the Storage VM / Health details page to view detailed information about the selectedSVM, such as its health, capacity, configuration, data policies, logical interfaces (LIFs), LUNs,qtrees, and user and user group quotas. You can also view information about the related objectsand related alerts for the SVM.
Viewing the aggregate list and detailsFrom the Health: All Aggregates view, you can monitor your inventory of aggregates. TheCapacity: All Aggregates view enables you to view information about the capacity and utilizationof aggregates in all clusters.
Before you begin
You must have the Operator, Application Administrator, or Storage Administrator role.
About this task
You can view details such as aggregate capacity and configuration, and disk information from theAggregate / Health details page. You can use these details before you configure the thresholdsettings if required.
Steps
1. In the left navigation pane, click Storage > Aggregates.
2. Choose one of the following ways to view the aggregate details:
• To view information about the health of all aggregates in all clusters, in the View menu,select Health: All Aggregates view.
• To view information about the capacity and utilization of all aggregates in all clusters, inthe View menu, select Capacity: All Aggregates view.
• To view the complete details, click the aggregate name.
You can also view the complete details by clicking View Details in the minimal detailsdialog box.
3. Optional: View the objects related to the aggregate by clicking View Related from the minimaldetails dialog box.
Related tasksAdding users on page 625
You can add local users or database users by using the Users page. You can also add remote usersor groups that belong to an authentication server. You can assign roles to these users and, based on
213Managing and monitoring clusters and cluster object health

the privileges of the roles, users can manage the storage objects and data with Unified Manager, orview the data in a database.
Exporting storage data as reports on page 27You can export storage data in a variety of output formats and then use the exported data to buildreports. For example, if there are 10 critical events that have not been resolved, you can export thedata from the Event Management inventory page to create a report, and then send the report toadmins who can resolve the issues.
Adding alerts on page 119You can configure alerts to notify you when a particular event is generated. You can configurealerts for a single resource, for a group of resources, or for events of a particular severity type. Youcan specify the frequency with which you want to be notified and associate a script to the alert.
Editing individual aggregate health threshold settings on page 137You can edit the health threshold settings for aggregate capacity, growth, and Snapshot copies ofone or more aggregates. When a threshold is crossed, alerts are generated and you receivenotifications. These notifications help you to take preventive measures based on the eventgenerated.
Related referenceCapacity: All Aggregates view on page 241
The Capacity: All Aggregates view enables you to view information about the capacity andutilization of aggregates in all clusters. This information enables you to understand possiblecapacity risks and also to view the configured, used, and unused capacity of aggregates.
Health: All Aggregates view on page 237The Health: All Aggregates view displays information about the aggregates that are monitored,and enables you to view and modify the threshold settings.
Aggregate / Health details page on page 243You can use the Aggregate / Health details page to view detailed information about the selectedaggregate, such as the capacity, disk information, configuration details, and events generated. Youcan also view information about the related objects and related alerts for that aggregate.
Viewing FabricPool capacity informationYou can view FabricPool capacity information for clusters, aggregates, and volumes on theCapacity and Performance inventory and details pages for these objects. These pages also displayFabricPool mirror information when a mirror tier has been configured.
About this task
These pages display information such as the available capacity on the local performance tier andon the cloud tier, how much capacity is being used in both tiers, which aggregates are attached to acloud tier, and which volumes are implementing the FabricPool features by moving certaininformation to the cloud tier.
When a cloud tier is mirrored to another cloud provider (the "mirror tier") then both cloud tiers aredisplayed in the Aggregate / Health details page.
Steps
1. Perform one of the following:
214Managing and monitoring clusters and cluster object health

To view capacity informationfor...
Do this...
Clusters a. On the Capacity: All Clusters view, click a cluster.
b. On the Cluster / Health details page, click the Configuration tab.
The display shows the names of any cloud tiers to which this cluster isconnected.
Aggregates a. On the Capacity: All Aggregates view, click an aggregate where the Typefield indicates "SSD (FabricPool)" or "HDD (FabricPool)".
b. On the Aggregate / Health details page, click the Capacity tab.
The display shows the total capacity used in the cloud tier.
c. Click the Disk Information tab.
The display shows the name of the cloud tier and the capacity used.
d. Click the Configuration tab.
The display shows the name of the cloud tier and other detailed informationabout the cloud tier.
Volumes a. On the Capacity: All Volumes view, click a volume where a policy nameappears in the "Tiering Policy" field.
b. On the Volume / Health details page, click the Configuration tab.
The display shows the name of the FabricPool tiering policy assigned to thevolume.
2. In the Workload Analysis page you can select "Cloud Tier View" in the Capacity Trend areato see the capacity being used in the local Performance Tier and in the Cloud Tier over theprevious month.
After you finish
For more information on FabricPool aggregates, see the ONTAP 9 Disks and Aggregates PowerGuide.
ONTAP 9 Disks and Aggregates Power Guide
Viewing storage pool detailsYou can view the details of the storage pool to monitor the storage pool health, total and availablecache, and used and available allocations.
Before you begin
You must have the Operator, Application Administrator, or Storage Administrator role.
Steps
1. In the left navigation pane, click Storage > Aggregates.
2. Click an aggregate name.The details of the selected aggregate are displayed.
3. Click the Disk Information tab.
Detailed disk information is displayed.
Note: The Cache table is displayed only when the selected aggregate is using a storage pool.
4. In the Cache table, move the pointer over the name of the required storage pool.The details of the storage pool are displayed.
215Managing and monitoring clusters and cluster object health

Viewing the volume list and detailsFrom the Health: All Volumes view, you can monitor your inventory of volumes. The Capacity:All Volumes view enables you to view information about the capacity and utilization of volumesin a cluster.
Before you begin
You must have the Operator, Application Administrator, or Storage Administrator role.
About this task
You can also use the Volume / Health details page to view detailed information about volumes thatare monitored, including the capacity, efficiency, configuration, and protection of the volumes.You can also view information about the related devices and related alerts for a specific volume.
Steps
1. In the left navigation pane, click Storage > Volumes.
2. Choose one of the following ways to view the volume details:
• To view detailed information about the health of volumes in a cluster, in the View menu,select Health: All Volumes view.
• To view detailed information about the capacity and utilization of volumes in a cluster, inthe View menu, select Capacity: All Volumes view.
• To view the complete details, click the volume name.
You can also view the complete details by clicking View Details in the minimal detailsdialog box.
3. Optional: View the objects related to the volume by clicking View Related from the minimaldetails dialog box.
Related tasksAdding users on page 625
You can add local users or database users by using the Users page. You can also add remote usersor groups that belong to an authentication server. You can assign roles to these users and, based onthe privileges of the roles, users can manage the storage objects and data with Unified Manager, orview the data in a database.
Exporting storage data as reports on page 27You can export storage data in a variety of output formats and then use the exported data to buildreports. For example, if there are 10 critical events that have not been resolved, you can export thedata from the Event Management inventory page to create a report, and then send the report toadmins who can resolve the issues.
Adding alerts on page 119You can configure alerts to notify you when a particular event is generated. You can configurealerts for a single resource, for a group of resources, or for events of a particular severity type. Youcan specify the frequency with which you want to be notified and associate a script to the alert.
Editing individual volume health threshold settings on page 138You can edit the health threshold settings for volume capacity, growth, quota, and space reserve ofone or more volumes. When a threshold is crossed, alerts are generated and you receivenotifications. These notifications help you to take preventive measures based on the eventgenerated.
Related referenceCapacity: All Volumes view on page 271
The Capacity: All Volumes view enables you to view information about the capacity andutilization of volumes in a cluster. This information enables you to understand possible capacityrisks and to view the configured, used, and unused capacity of volumes. Also, the information
216Managing and monitoring clusters and cluster object health

helps you to make decisions about enabling space-saving features such as deduplication and thinprovisioning.
Health: All Volumes view on page 266The Health: All Volumes view displays information about the volumes in the storage systems thatare monitored and enables you to modify the volume threshold settings.
Volume / Health details page on page 274You can use the Volume / Health details page to view detailed information about a selectedvolume, such as capacity, storage efficiency, configuration, protection, annotation, and eventsgenerated. You can also view information about the related objects and related alerts for thatvolume.
Viewing details about NFS sharesYou can view details about all NFS shares, such as its status, the path associated with the volume(FlexGroup volumes or FlexVol volumes), access levels of clients to the NFS shares, and theexport policy defined for the volumes that are exported. Use the Health: All NFS Shares view tosee all NFS shares on all monitored clusters, and use the Storage VM / Health details page to viewall NFS shares on a specific storage virtual machine (SVM).
Before you begin
• NFS license must be enabled on the cluster.
• Network interfaces serving the NFS shares must be configured.
• You must have the Operator, Application Administrator, or Storage Administrator role.
Step
In the left navigation pane, follow the steps below depending on whether you want to view all NFSshares or just the NFS shares for a particular SVM.
To... Follow these steps...
View all NFS shares Click Storage > NFS Shares
View NFS shares for single SVM a. Click Storage > Storage VMs
b. Click the SVM for which you want to view the NFS shares details.
c. In the Storage VM / Health details page, click the NFS Shares tab.
Viewing details about SMB/CIFS sharesYou can view details about all SMB/CIFS shares, such as the share name, junction path,containing objects, security settings, and export policies defined for the share. Use the Health: AllSMB Shares view to see all SMB shares on all monitored clusters, and use the Storage VM /Health details page to view all SMB shares on a specific storage virtual machine (SVM).
Before you begin
• CIFS license must be enabled on the cluster.
• Network interfaces serving the SMB/CIFS shares must be configured.
• You must have the Operator, Application Administrator, or Storage Administrator role.
About this task
Note: Shares in folders are not displayed.
217Managing and monitoring clusters and cluster object health

Step
In the left navigation pane, follow the steps below depending on whether you want to view allSMB/CIFS shares or just the shares for a particular SVM.
To... Follow these steps...
View all SMB/CIFS shares Click Storage > SMB Shares
View SMB/CIFS shares for single SVM a. Click Storage > Storage VMs
b. Click the SVM for which you want to view the SMB/CIFS sharedetails.
c. In the Storage VM / Health details page, click the SMB Shares tab.
Viewing the list of Snapshot copiesYou can view the list of Snapshot copies for a selected volume. You can use the list of Snapshotcopies to calculate the amount of disk space that can be reclaimed if one or more Snapshot copiesare deleted, and you can delete the Snapshot copies if required.
Before you begin
• You must have the Operator, Application Administrator, or Storage Administrator role.
• The volume containing the Snapshot copies must be online.
Steps
1. In the left navigation pane, click Storage > Volumes.
2. In the Health: All Volumes view, select the volume that contains the Snapshot copies youwant to view.
3. In the Volume / Health details page, click the Capacity tab.
4. In Details pane of the Capacity tab, in the Other Details section, click the link next toSnapshot Copies.
The number of Snapshot copies is a link that displays the list of Snapshot copies.
Related referenceHealth: All Volumes view on page 266
The Health: All Volumes view displays information about the volumes in the storage systems thatare monitored and enables you to modify the volume threshold settings.
Volume / Health details page on page 274You can use the Volume / Health details page to view detailed information about a selectedvolume, such as capacity, storage efficiency, configuration, protection, annotation, and eventsgenerated. You can also view information about the related objects and related alerts for thatvolume.
Deleting Snapshot copiesYou can delete a Snapshot copy to conserve space or to free disk space, or you can delete theSnapshot copy if it is no longer required.
Before you begin
You must have the Application Administrator or Storage Administrator role.
The volume must be online.
To delete a Snapshot copy that is busy or locked, you must have released the Snapshot copy fromthe application that was using it.
218Managing and monitoring clusters and cluster object health
About this task
• You cannot delete the base Snapshot copy in a parent volume if a FlexClone volume is usingthat Snapshot copy.
The base Snapshot copy is the Snapshot copy that is used to create the FlexClone volume anddisplays the status Busy and Application Dependency as Busy,Vclone in the parent volume.
• You cannot delete a locked Snapshot copy that is used in a SnapMirror relationship.
The Snapshot copy is locked and is required for the next update.
Steps
1. In the left navigation pane, click Storage > Volumes.
2. In the Health: All Volumes view, select the volume that contains the Snapshot copies youwant to view.The list of Snapshot copies is displayed.
3. In the Volume / Health details page, click the Capacity tab.
4. In Details pane of the Capacity tab, in the Other Details section, click the link next toSnapshot Copies.
The number of Snapshot copies is a link that displays the list of Snapshot copies.
5. In the Snapshot Copies view, select the Snapshot copies you want to delete, and then clickDelete Selected.
Calculating reclaimable space for Snapshot copiesYou can calculate the amount of disk space that can be reclaimed if one or more Snapshot copiesare deleted.
Before you begin
• You must have the Operator, Application Administrator, or Storage Administrator role.
• The volume must be online.
• The volume must be a FlexVol volume; this capability is not supported with FlexGroupvolumes.
Steps
1. In the left navigation pane, click Storage > Volumes.
2. In the Health: All Volumes view, select the volume that contains the Snapshot copies youwant to view.The list of Snapshot copies is displayed.
3. In the Volume / Health details page, click the Capacity tab.
4. In Details pane of the Capacity tab, in the Other Details section, click the link next toSnapshot Copies.
The number of Snapshot copies is a link that displays the list of Snapshot copies.
5. In the Snapshot Copies view, select the Snapshot copies for which you want to calculate thereclaimable space.
6. Click Calculate.The reclaimable space (in percentage, and KB, MB, GB, and so on) on the volume isdisplayed.
7. To recalculate the reclaimable space, select the required Snapshot copies and clickRecalculate.
219Managing and monitoring clusters and cluster object health

Description of cluster object windows and dialog boxesYou can view all your clusters and cluster objects from the respective storage object page. You canalso view the details from the corresponding storage object details page.
Health: All Clusters viewThe Health: All Clusters view enables you to view health information about the clusters that youare monitoring.
By default, objects in the view pages are sorted based on event criticality. Objects with criticalevents are listed first, and objects with warning events are listed second. This provides animmediate visual indication of issues that must be addressed.
The controls along the top of the page enable you to select a particular view (for health,performance, capacity, and so on), perform searches to locate specific objects, create and applyfilters to narrow the list of displayed data, add/remove/reorder columns on the page, and export thedata on the page to a .csv, .pdf, or .xlsx file. After you have customized the page, you cansave the results as a custom view and then schedule a report of this data to be generated andemailed on a regular basis.
You can associate a cluster to a predefined annotation by using the Annotate button.
See Cluster health fields for descriptions of all the fields on this page.
Related tasksExporting storage data as reports on page 27
You can export storage data in a variety of output formats and then use the exported data to buildreports. For example, if there are 10 critical events that have not been resolved, you can export thedata from the Event Management inventory page to create a report, and then send the report toadmins who can resolve the issues.
Scheduling a report on page 332After you have a view or Excel file that you want to schedule for regular generation anddistribution, you can schedule the report.
Rediscovering clusters on page 620You can manually rediscover a cluster from the Cluster Setup page in order to obtain the latestinformation about the health, monitoring status, and performance status of the cluster.
Adding clusters on page 617You can add a cluster to Active IQ Unified Manager so that you can monitor the cluster. Thisincludes the ability to obtain cluster information such as the health, capacity, performance, andconfiguration of the cluster so that you can find and resolve any issues that might occur.
Removing clusters on page 619You can remove a cluster from Unified Manager by using the Cluster Setup page. For example,you can remove a cluster if cluster discovery fails, or when you want to decommission a storagesystem.
Generating a hardware inventory report for contract renewal on page 212You can generate a report that contains a complete list of cluster and node information; such ashardware model numbers and serial numbers, disk types and counts, installed licenses, and more.
220Managing and monitoring clusters and cluster object health

This report is helpful for contract renewal within secure sites ("dark" sites) that are not connectedto the NetApp Active IQ platform.
Cluster health fieldsThe following fields are available in the Health: All Clusters view and can be used in customviews and in reports.
Status
An icon that identifies the current status of the cluster. The status can be Critical ( ),
Error ( ), Warning ( ), or Normal ( ).
Cluster
The name of the cluster. You can click the cluster name to navigate to that cluster's healthdetails page.
Cluster FQDN
The fully qualified domain name (FQDN) of the cluster.
Communication Status
Whether the cluster is reachable or not.
The status is displayed as Good if the cluster is reachable. If the cluster is not reachable orif the login credentials are invalid, the status is displayed as Not Reachable.
System Health
High-level information about the status of the cluster, which is calculated based on thestatus of various cluster subsystems.
Possible values are OK, OK with suppressed, Degraded, and Components not reachable.These values are determined by the health monitors in ONTAP software.
Last Refreshed Time
The timestamp of when the monitoring samples of the cluster were last collected.
FIPS Enabled
Whether FIPS mode is enabled on the cluster.
OS Version
The ONTAP version that the cluster is running.
If the nodes in the cluster are running different versions of ONTAP, then the earliestONTAP version is displayed.
Node Count
The number of nodes that belong to the cluster.
Host Name or IP Address
The FQDN, short name, or the IP address of the cluster-management LIF that is used toconnect to the cluster.
Logical Space Used
The real size of the data that is being stored on all aggregates on this cluster withoutapplying the savings from using ONTAP storage efficiency technologies.
Personality
Identifies if this is an All SAN Array configured cluster.
221Managing and monitoring clusters and cluster object health

Serial Number
The serial number of the cluster.
Contact
The contact information of the cluster.
Location
The location of the cluster.
Capacity: All Clusters viewThe Capacity: All Clusters view enables you to view summarized information about storagecapacity and utilization in all clusters. This information helps you to understand possible capacityrisks and to take appropriate action to rebalance workloads.
The controls along the top of the page enable you to select a particular view (for health,performance, capacity, and so on), perform searches to locate specific objects, create and applyfilters to narrow the list of displayed data, add/remove/reorder columns on the page, and export thedata on the page to a .csv, .pdf, or .xlsx file. After you have customized the page, you cansave the results as a custom view and then schedule a report of this data to be generated andemailed on a regular basis.
See Cluster capacity fields for descriptions of all the fields on this page.
Related tasksViewing the cluster list and details on page 207
You can use the Health: All Clusters view to view your inventory of clusters. The Capacity: AllClusters view enables you to view summarized information about storage capacity and utilizationin all clusters.
Exporting storage data as reports on page 27You can export storage data in a variety of output formats and then use the exported data to buildreports. For example, if there are 10 critical events that have not been resolved, you can export thedata from the Event Management inventory page to create a report, and then send the report toadmins who can resolve the issues.
Scheduling a report on page 332After you have a view or Excel file that you want to schedule for regular generation anddistribution, you can schedule the report.
Cluster capacity fieldsThe following fields are available in the Capacity: All Clusters view and can be used in customviews and in reports.
Cluster
The cluster name. You can click the cluster name to navigate to that cluster's capacitydetails page.
Cluster FQDN
The fully qualified domain name (FQDN) of the cluster.
HA Pair
The HA pair value obtained by forming two nodes.
Total Raw Capacity
Displays the total physical capacity of all disks in the array.
222Managing and monitoring clusters and cluster object health

Unconfigured Raw Capacity
The unconfigured capacity of disks whose container type is other than aggregate, broken,spare, or shared. This capacity is always higher than the physical capacity of the disk inONTAP. For example, consider a 2 TB disk. The physical capacity of the disk is 1.6 TB inONTAP whereas the unconfigured raw capacity in Unified Manager is 1.8 TB.
Aggregate Total Capacity
The total size of the available aggregates for the user. This includes the Snapshot copyreserve.
Aggregate Used Capacity
The capacity already in use on aggregates. This includes the capacity consumed byvolumes, LUNs, and other storage efficiency technology overheads.
Aggregate Unused Capacity
The capacity that might be available for storing additional data on the aggregate. Thisincludes the Snapshot copy reserve.
Logical Space Used
The real size of the data that is being stored on all aggregates on this cluster withoutapplying the savings from using ONTAP storage efficiency technologies.
Data Reduction
The data reduction ratio based on configured ONTAP storage efficiency settings.
Allocated LUN Capacity
The capacity of LUNs that are mapped.
Unallocated LUN Capacity
The capacity of all LUNs not mapped to the Host.
Volume Total Capacity
The total capacity of the volumes (used plus unused).
Volume Used Capacity
The used capacity of the volumes.
Volume Unused Capacity
The unused capacity of the volumes.
Volume Protection Capacity
The capacity of volumes that have SnapMirror and SnapVault enabled.
Cloud Tier Used (Licensed)
The space used by data in the cloud tier for storage providers that require a FabricPoollicense.
Cloud Tier Used (Others)
The space used by data in the cloud tier for StorageGRID systems and ONTAP S3 protocolstores that do not require a FabricPool license.
Model/Family
The model or family name of the cluster.
OS Version
The version of ONTAP installed on the system.
Contact
The contact information of the cluster.
223Managing and monitoring clusters and cluster object health

Location
The location of the cluster.
Cluster / Health details pageThe Cluster / Health details page provides detailed information about a selected cluster, such ashealth, capacity, and configuration details. You can also view information about the networkinterfaces (LIFs), nodes, disks, related devices, and related alerts for the cluster.
The status next to the cluster name, for example (Good), represents the communication status;whether Unified Manager can communicate with the cluster. It does not represent the failoverstatus or overall status of the cluster.
• Command buttons• Health tab• Capacity tab• Configuration tab• MetroCluster Connectivity tab• MetroCluster Replication tab• Network Interfaces tab• Nodes tab• Disks tab• Related Annotations pane• Related Devices pane• Related Groups pane• Related Alerts pane
Command buttons
The command buttons enable you to perform the following tasks for the selected cluster:
Switch to Performance View
Enables you to navigate to the Cluster / Performance details page.
Actions
• Add Alert: Opens the Add Alert dialog box, which enables you to add an alert to theselected cluster.
• Rediscover: Initiates a manual refresh of the cluster, which enables Unified Manager todiscover recent changes to the cluster.
If Unified Manager is paired with OnCommand Workflow Automation, the rediscoveryoperation also reacquires cached data from WFA, if any.
After the rediscovery operation is initiated, a link to the associated job details isdisplayed to enable tracking of the job status.
• Annotate: Enables you to annotate the selected cluster.
View Clusters
Enables you to navigate to the Health: All Clusters view.
Health tab
Displays detailed information about the data availability and data capacity issues of various clusterobjects such as nodes, SVMs, and aggregates. Availability issues are related to the data-servingcapability of the cluster objects. Capacity issues are related to the data-storing capability of thecluster objects.
You can click the graph of an object to view a filtered list of the objects. For example, you canclick the SVM capacity graph that displays warnings to view a filtered list of SVMs. This list
224Managing and monitoring clusters and cluster object health
contains SVMs that have volumes or qtrees that have capacity issues with a severity level ofWarning. You can also click the SVMs availability graph that displays warnings to view the list ofSVMs that have availability issues with a severity level of Warning.
Availability Issues
Graphically displays the total number of objects, including objects that have availabilityissues and objects that do not have any availability-related issues. The colors in the graphrepresent the different severity levels of the issues. The information below the graphprovides details about availability issues that can impact or have already impacted theavailability of data in the cluster. For example, information is displayed about disk shelvesthat are down and aggregates that are offline.
Note: The data displayed for the SFO bar graph is based on the HA state of the nodes.The data displayed for all other bar graphs is calculated based on the events generated.
Capacity Issues
Graphically displays the total number of objects, including objects that have capacity issuesand objects that do not have any capacity-related issues. The colors in the graph representthe different severity levels of the issues. The information below the graph provides detailsabout capacity issues that can impact or have already impacted the capacity of data in thecluster. For example, information is displayed about aggregates that are likely to breach theset threshold values.
Capacity tab
Displays detailed information about the capacity of the selected cluster.
Capacity
Displays the data capacity graph about the used capacity and available capacity from allallocated aggregates:
• Logical Space UsedThe real size of the data that is being stored on all aggregates on this cluster withoutapplying the savings from using ONTAP storage efficiency technologies.
• UsedThe physical capacity that is used by data on all aggregates. This does not include thecapacity that is used for parity, right-sizing, and reservation.
• AvailableDisplays the capacity available for data.
• SparesDisplays the storable capacity available for storage in all the spare disks.
• ProvisionedDisplays the capacity that is provisioned for all the underlying volumes.
Details
Displays detailed information about the used and available capacity.
• Total CapacityDisplays the total capacity of the cluster. This does not include the capacity that isassigned for parity.
• UsedDisplays the capacity that is used by data. This does not include the capacity that is usedfor parity, right-sizing, and reservation.
• AvailableDisplays the capacity available for data.
• ProvisionedDisplays the capacity that is provisioned for all the underlying volumes.
225Managing and monitoring clusters and cluster object health

• Spares
Displays the storable capacity available for storage in all the spare disks.
Cloud Tier
Displays the total cloud tier capacity used, and the capacity used for each connected cloudtier for FabricPool-enabled aggregates on the cluster. A FabricPool can be either licensed orunlicensed.
Physical Capacity Breakout by Disk Type
The Physical Capacity Breakout by Disk Type area displays detailed information about thedisk capacity of the various types of disks in the cluster. By clicking the disk type, you canview more information about the disk type from the Disks tab.
• Total Usable Capacity
Displays the available capacity and spare capacity of the data disks.
• HDD
Graphically displays the used capacity and available capacity of all the HDD data disksin the cluster. The dotted line represents the spare capacity of the data disks in the HDD.
• Flash
◦ SSD Data
Graphically displays the used capacity and available capacity of the SSD data disksin the cluster.
◦ SSD Cache
Graphically displays the storable capacity of the SSD cache disks in the cluster.
◦ SSD Spare
Graphically displays the spare capacity of the SSD, data, and cache disks in thecluster.
• Unassigned Disks
Displays the number of unassigned disks in the cluster.
Aggregates with Capacity Issues list
Displays in tabular format details about the used capacity and available capacity of theaggregates that have capacity risk issues.
• Status
Indicates that the aggregate has a capacity-related issue of a certain severity.
You can move the pointer over the status to view more information about the event orevents generated for the aggregate.
If the status of the aggregate is determined by a single event, you can view informationsuch as the event name, time and date when the event was triggered, the name of theadministrator to whom the event is assigned, and the cause of the event. You can clickthe View Details button to view more information about the event.
If the status of the aggregate is determined by multiple events of the same severity, thetop three events are displayed with information such as the event name, time and datewhen the events are triggered, and the name of the administrator to whom the event isassigned. You can view more details about each of these events by clicking the eventname. You can also click the View All Events link to view the list of generated events.
Note: An aggregate can have multiple capacity-related events of the same severity ordifferent severities. However, only the highest severity is displayed. For example, ifan aggregate has two events with severity levels of Error and Critical, only theCritical severity is displayed.
• Aggregate
Displays the name of the aggregate.
226Managing and monitoring clusters and cluster object health

• Used Data CapacityGraphically displays information about the aggregate capacity usage (in percentage).
• Days to FullDisplays the estimated number of days remaining before the aggregate reaches fullcapacity.
Configuration tab
Displays details about the selected cluster, such as IP address, serial number, contact, and location:
Cluster Overview
• Management InterfaceDisplays the cluster-management LIF that Unified Manager uses to connect to thecluster. The operational status of the interface is also displayed.
• Host Name or IP AddressDisplays the FQDN, short name, or the IP address of the cluster-management LIF thatUnified Manager uses to connect to the cluster.
• FQDNDisplays the fully qualified domain name (FQDN) of the cluster.
• OS VersionDisplays the ONTAP version that the cluster is running. If the nodes in the cluster arerunning different versions of ONTAP, then the earliest ONTAP version is displayed.
• Serial NumberDisplays the serial number of the cluster.
• ContactDisplays details about the administrator whom you should contact in case of issues withthe cluster.
• LocationDisplays the location of the cluster.
• PersonalityIdentifies if this is an All SAN Array configured cluster.
Remote Cluster Overview
Provides details about the remote cluster in a MetroCluster configuration. This informationis displayed only for MetroCluster configurations.
• ClusterDisplays the name of the remote cluster. You can click the cluster name to navigate tothe details page of the cluster.
• Host name or IP AddressDisplays the FQDN, short name, or IP address of the remote cluster.
• Serial NumberDisplays the serial number of the remote cluster.
• LocationDisplays the location of the remote cluster.
MetroCluster Overview
Provides details about the local cluster in a MetroCluster configuration. This information isdisplayed only for MetroCluster configurations.
• TypeDisplays whether the MetroCluster type is two-node or four-node.
• ConfigurationDisplays the MetroCluster configuration, which can have the following values:
227Managing and monitoring clusters and cluster object health

◦ Stretch Configuration with SAS cables
◦ Stretch Configuration with FC-SAS bridge
◦ Fabric Configuration with FC switches
Note: For a four-node MetroCluster, only Fabric Configuration with FC switches issupported.
• Automated Unplanned Switch Over (AUSO)
Displays whether automated unplanned switchover is enabled for the local cluster. Bydefault, AUSO is enabled for all clusters in a two-node MetroCluster configuration inUnified Manager. You can use the command-line interface to change the AUSO setting.
Nodes
• Availability
Displays the number of nodes that are up ( ) or down ( ) in the cluster.
• OS Versions
Displays the ONTAP versions that the nodes are running as well as the number of nodesrunning a particular version of ONTAP. For example, 9.6 (2), 9.3 (1) specifies that twonodes are running ONTAP 9.6, and one node is running ONTAP 9.3.
Storage Virtual Machines
• Availability
Displays the number of SVMs that are up ( ) or down ( ) in the cluster.
Network Interfaces
• Availability
Displays the number of non-data LIFs that are up ( ) or down ( ) in the cluster.
• Cluster-Management Interfaces
Displays the number of cluster-management LIFs.
• Node-Management Interfaces
Displays the number of node-management LIFs.
• Cluster Interfaces
Displays the number of cluster LIFs.
• Intercluster Interfaces
Displays the number of intercluster LIFs.
Protocols
• Data Protocols
Displays the list of licensed data protocols that are enabled for the cluster. The dataprotocols include iSCSI, CIFS, NFS, NVMe, and FC/FCoE.
Cloud Tiers
Lists the names of the cloud tiers to which this cluster is connected. It also lists the type(Amazon S3, Microsoft Azure Cloud, IBM Cloud Object Storage, Google Cloud Storage,Alibaba Cloud Object Storage, or StorageGRID), and the states of the cloud tiers (Availableor Unavailable).
MetroCluster Connectivity tab
Displays the issues and connectivity status of the cluster components in the MetroClusterconfiguration. A cluster is displayed in a red box when the disaster recovery partner of the clusterhas issues.
228Managing and monitoring clusters and cluster object health

Note: The MetroCluster Connectivity tab is displayed only for clusters that are in aMetroCluster configuration.
You can navigate to the details page of a remote cluster by clicking the name of the remote cluster.You can also view the details of the components by clicking the count link of a component. Forexample, clicking the count link of the node in the cluster displays the node tab in the details pageof the cluster. Clicking the count link of the disks in the remote cluster displays the disk tab in thedetails page of the remote cluster.
Note: When managing an eight-node MetroCluster configuration, clicking the count link of theDisk Shelves component displays only the local shelves of the default HA pair. Also, there is noway to display the local shelves on the other HA pair.
You can move the pointer over the components to view the details and the connectivity status ofthe clusters in case of any issue and to view more information about the event or events generatedfor the issue.
If the status of the connectivity issue between components is determined by a single event, you canview information such as the event name, time and date when the event was triggered, the name ofthe administrator to whom the event is assigned, and the cause of the event. The View Detailsbutton provides more information about the event.
If status of the connectivity issue between components is determined by multiple events of thesame severity, the top three events are displayed with information such as the event name, time anddate when the events are triggered, and the name of the administrator to whom the event isassigned. You can view more details about each of these events by clicking the event name. Youcan also click the View All Events link to view the list of generated events.
MetroCluster Replication tab
Displays the status of the data that is being replicated. You can use the MetroCluster Replicationtab to ensure data protection by synchronously mirroring the data with the already peered clusters.A cluster is displayed in a red box when the disaster recovery partner of the cluster has issues.
Note: The MetroCluster Replication tab is displayed only for clusters that are in a MetroClusterconfiguration.
In a MetroCluster environment, you can use this tab to verify the logical connections and peeringof the local cluster with the remote cluster. You can view the objective representation of the clustercomponents with their logical connections. This helps to identify the issues that might occurduring mirroring of metadata and data.
In the MetroCluster Replication tab, local cluster provides the detailed graphical representation ofthe selected cluster and MetroCluster partner refers to the remote cluster.
Network Interfaces tab
Displays details about all the non-data LIFs that are created on the selected cluster.
Network Interface
Displays the name of the LIF that is created on the selected cluster.
Operational Status
Displays the operational status of the interface, which can be Up ( ), Down ( ), or
Unknown ( ). The operational status of a network interface is determined by the status ofits physical ports.
229Managing and monitoring clusters and cluster object health

Administrative Status
Displays the administrative status of the interface, which can be Up ( ), Down ( ), or
Unknown ( ). You can control the administrative status of an interface when you makechanges to the configuration or during maintenance. The administrative status can bedifferent from the operational status. However, if the administrative status of a LIF is Down,the operational status is Down by default.
IP Address
Displays the IP address of the interface.
Role
Displays the role of the interface. Possible roles are Cluster-Management LIFs, Node-Management LIFs, Cluster LIFs, and Intercluster LIFs.
Home Port
Displays the physical port to which the interface was originally associated.
Current Port
Displays the physical port to which the interface is currently associated. After LIFmigration, the current port might be different from the home port.
Failover Policy
Displays the failover policy that is configured for the interface.
Routing Groups
Displays the name of the routing group. You can view more information about the routesand the destination gateway by clicking the routing group name.
Routing groups are not supported for ONTAP 8.3 or later and therefore a blank column isdisplayed for these clusters.
Failover Group
Displays the name of the failover group.
Nodes tab
Displays information about nodes in the selected cluster. You can view detailed information aboutthe HA pairs, disk shelves, and ports:
HA Details
Provides a pictorial representation of the HA state and the health status of the nodes in theHA pair. The health status of the node is indicated by the following colors:
Green
The node is in a working condition.
Yellow
The node has taken over the partner node or the node is facing some environmentalissues.
Red
The node is down.
You can view information about the availability of the HA pair and take required action toprevent any risks. For example, in the case of a possible takeover operation, the followingmessage is displayed: Storage failover possible.
230Managing and monitoring clusters and cluster object health

You can view a list of the events related to the HA pair and its environment, such as fans,power supplies, NVRAM battery, flash cards, service processor, and connectivity of diskshelves. You can also view the time when the events were triggered.
You can view other node-related information, such as the model number and the serialnumber.
If there are single-node clusters, you can also view details about the nodes.
Disk Shelves
Displays information about the disk shelves in the HA pair.
You can also view events generated for the disk shelves and the environmental components,and the time when the events were triggered.
Shelf ID
Displays the ID of the shelf where the disk is located.
Component Status
Displays environmental details of the disk shelves, such as power supplies, fans,temperature sensors, current sensors, disk connectivity, and voltage sensors. Theenvironmental details are displayed as icons in the following colors:
Green
The environmental components are in working properly.
Grey
No data is available for the environmental components.
Red
Some of the environmental components are down.
State
Displays the state of the disk shelf. The possible states are Offline, Online, No status,Initialization required, Missing, and Unknown.
Model
Displays the model number of the disk shelf.
Local Disk Shelf
Indicates whether the disk shelf is located on the local cluster or the remote cluster.This column is displayed only for clusters in a MetroCluster configuration.
Unique ID
Displays the unique identifier of the disk shelf.
Firmware Version
Displays the firmware version of the disk shelf.
Ports
Displays information about the associated FC, FCoE, and Ethernet ports. You can viewdetails about the ports and the associated LIFs by clicking the port icons.
You can also view the events generated for the ports.
You can view the following port details:
• Port ID
Displays the name of the port. For example, the port names can be e0M, e0a, and e0b.
• Role
231Managing and monitoring clusters and cluster object health

Displays the role of the port. The possible roles are Cluster, Data, Intercluster, Node-Management, and Undefined.
• Type
Displays the physical layer protocol used for the port. The possible types are Ethernet,Fibre Channel, and FCoE.
• WWPN
Displays the World Wide Port Name (WWPN) of the port.
• Firmware Rev
Displays the firmware revision of the FC/FCoE port.
• Status
Displays the current state of the port. The possible states are Up, Down, Link Not
Connected, or Unknown ( ).
You can view the port-related events from the Events list. You can also view the associatedLIF details, such as LIF name, operational status, IP address or WWPN, protocols, name ofthe SVM associated with the LIF, current port, failover policy and failover group.
Disks tab
Displays details about the disks in the selected cluster. You can view disk-related information suchas the number of used disks, spare disks, broken disks, and unassigned disks. You can also viewother details such as the disk name, disk type, and the owner node of the disk.
Disk Pool Summary
Displays the number of disks, which are categorized by effective types (FCAL, SAS, SATA,MSATA, SSD, NVMe SSD, SSD CAP, Array LUN, and VMDISK), and the state of thedisks. You can also view other details, such as the number of aggregates, shared disks, sparedisks, broken disks, unassigned disks, and unsupported disks. If you click the effective disktype count link, disks of the selected state and effective type are displayed. For example, ifyou click the count link for the disk state Broken and effective type SAS, all disks with thedisk state Broken and effective type SAS are displayed.
Disk
Displays the name of the disk.
RAID Groups
Displays the name of the RAID group.
Owner Node
Displays the name of the node to which the disk belongs. If the disk is unassigned, no valueis displayed in this column.
State
Displays the state of the disk: Aggregate, Shared, Spare, Broken, Unassigned, Unsupportedor Unknown. By default, this column is sorted to display the states in the following order:Broken, Unassigned, Unsupported, Spare, Aggregate, and Shared.
Local Disk
Displays either Yes or No to indicate whether the disk is located on the local cluster or theremote cluster. This column is displayed only for clusters in a MetroCluster configuration.
Position
Displays the position of the disk based on its container type: for example, Copy, Data, orParity. By default, this column is hidden.
232Managing and monitoring clusters and cluster object health

Impacted Aggregates
Displays the number of aggregates that are impacted due to the failed disk. You can movethe pointer over the count link to view the impacted aggregates and then click the aggregatename to view details of the aggregate. You can also click the aggregate count to view thelist of impacted aggregates in the Health: All Aggregates view.
No value is displayed in this column for the following cases:
• For broken disks when a cluster containing such disks is added to Unified Manager
• When there are no failed disks
Storage Pool
Displays the name of the storage pool to which the SSD belongs. You can move the pointerover the storage pool name to view details of the storage pool.
Storable Capacity
Displays the disk capacity that is available for use.
Raw Capacity
Displays the capacity of the raw, unformatted disk before right-sizing and RAIDconfiguration. By default, this column is hidden.
Type
Displays the types of disks: for example, ATA, SATA, FCAL, or VMDISK.
Effective Type
Displays the disk type assigned by ONTAP.
Certain ONTAP disk types are considered equivalent for the purposes of creating andadding to aggregates, and spare management. ONTAP assigns an effective disk type foreach disk type.
Spare Blocks Consumed %
Displays in percentage the spare blocks that are consumed in the SSD disk. This column isblank for disks other than SSD disks.
Rated Life Used %
Displays in percentage an estimate of the SSD life used, based on the actual SSD usage andthe manufacturer's prediction of SSD life. A value greater than 99 indicates that theestimated endurance has been consumed, but may not indicate SSD failure. If the value isunknown, then the disk is omitted.
Firmware
Displays the firmware version of the disk.
RPM
Displays the revolutions per minute (RPM) of the disk. By default, this column is hidden.
Model
Displays the model number of the disk. By default, this column is hidden.
Vendor
Displays the name of the disk vendor. By default, this column is hidden.
Shelf ID
Displays the ID of the shelf where the disk is located.
Bay
Displays the ID of the bay where the disk is located.
233Managing and monitoring clusters and cluster object health

Related Annotations pane
Enables you to view the annotation details associated with the selected cluster. The details includethe annotation name and the annotation values that are applied to the cluster. You can also removemanual annotations from the Related Annotations pane.
Related Devices pane
Enables you to view device details that are associated with the selected cluster.
The details include properties of the device that is connected to the cluster such as the device type,size, count, and health status. You can click on the count link for further analysis on that particulardevice.
You can use MetroCluster Partner pane to obtain count and also details on the remoteMetroCluster partner along with its associated cluster components such as nodes, aggregates, andSVMs. The MetroCluster Partner pane is displayed only for clusters in a MetroClusterconfiguration.
The Related Devices pane enables you to view and navigate to the nodes, SVMs, and aggregatesthat are related to the cluster:
MetroCluster Partner
Displays the health status of the MetroCluster partner. Using the count link, you cannavigate further and obtain information about the health and capacity of the clustercomponents.
Nodes
Displays the number, capacity, and health status of the nodes that belong to the selectedcluster. Capacity indicates the total usable capacity over available capacity.
Storage Virtual Machines
Displays the number of SVMs that belong to the selected cluster.
Aggregates
Displays the number, capacity, and the health status of the aggregates that belong to theselected cluster.
Related Groups pane
Enables you to view the list of groups that includes the selected cluster.
Related Alerts pane
The Related Alerts pane enables you to view the list of alerts for the selected cluster. You can alsoadd an alert by clicking the Add Alert link or edit an existing alert by clicking the alert name.
Related tasksViewing the cluster list and details on page 207
You can use the Health: All Clusters view to view your inventory of clusters. The Capacity: AllClusters view enables you to view summarized information about storage capacity and utilizationin all clusters.
Adding alerts on page 119You can configure alerts to notify you when a particular event is generated. You can configurealerts for a single resource, for a group of resources, or for events of a particular severity type. Youcan specify the frequency with which you want to be notified and associate a script to the alert.
Editing clusters on page 619
234Managing and monitoring clusters and cluster object health
You can modify the settings of an existing cluster, such as the host name or IP address, user name,password, and port, by using the Edit Cluster dialog box.
Related referenceStorage Pool dialog box on page 265
The Storage Pool dialog box enables you to view the details of the dedicated cache of SSDs, alsoknown as storage pools. You can monitor the storage pools and view details such as the storagepool health, total and available cache, and used and available allocations in the storage pool.
Health: All Nodes viewThe Health: All Nodes view enables you to view detailed information about the nodes in allclusters being managed by Unified Manager.
By default, objects in the view pages are sorted based on event criticality. Objects with criticalevents are listed first, and objects with warning events are listed second. This provides animmediate visual indication of issues that must be addressed.
The controls along the top of the page enable you to select a particular view (for health,performance, capacity, and so on), perform searches to locate specific objects, create and applyfilters to narrow the list of displayed data, add/remove/reorder columns on the page, and export thedata on the page to a .csv, .pdf, or .xlsx file. After you have customized the page, you cansave the results as a custom view and then schedule a report of this data to be generated andemailed on a regular basis.
The Hardware Inventory Report button is provided when Unified Manager, and the clusters it ismanaging, are installed in a site with no external network connectivity. This button generatesa .csv file that contains a complete list of cluster and node information; such as hardware modelnumbers and serial numbers, disk types and counts, installed licenses, and more. This reportingfunctionality is helpful for contract renewal within secure sites that are not connected to theNetApp Active IQ platform.
See Node health fields for descriptions of all the fields on this page.
Related tasksGenerating a hardware inventory report for contract renewal on page 212
You can generate a report that contains a complete list of cluster and node information; such ashardware model numbers and serial numbers, disk types and counts, installed licenses, and more.This report is helpful for contract renewal within secure sites ("dark" sites) that are not connectedto the NetApp Active IQ platform.
Exporting storage data as reports on page 27You can export storage data in a variety of output formats and then use the exported data to buildreports. For example, if there are 10 critical events that have not been resolved, you can export thedata from the Event Management inventory page to create a report, and then send the report toadmins who can resolve the issues.
Scheduling a report on page 332
235Managing and monitoring clusters and cluster object health

After you have a view or Excel file that you want to schedule for regular generation anddistribution, you can schedule the report.
Node health fieldsThe following fields are available in the Health: All Nodes view and can be used in custom viewsand in reports.
Status
An icon that identifies the current status of the node. The status can be Critical ( ),
Error ( ), Warning ( ), or Normal ( ).
Node
The name of the node. You can click the node name to navigate to that cluster's node detailspage.
State
The state of the node. The state can be Up or Down.
HA State
The state of the HA pair. The state can be Error, Warning, Normal, or Not applicable.
Down Time
The time that has elapsed or the timestamp since the node is offline. If the time elapsedexceeds a week, the timestamp when the node went offline is displayed.
All Flash Optimized
Whether the node is optimized to support only solid-state drives (SSDs).
Model/Family
The model of the node.
OS version
The ONTAP software version that the node is running.
Serial Number
The serial number of the node.
Firmware Version
The firmware version number of the node.
Aggregate Used Capacity
The amount of space used for data in the node's aggregates.
Aggregate Total Capacity
The total space available for data in the node's aggregates.
Usable Spare Capacity
The amount of available space in the node that can be used to enhance the aggregatecapacity.
Usable Raw Capacity
The amount of space that is usable in the node.
Total Raw Capacity
The capacity of every unformatted disk in the node before right-sizing and RAIDconfiguration.
236Managing and monitoring clusters and cluster object health

Storage VM Count
The number of SVMs contained by the cluster.
FC Port Count
The number of FC ports contained by the node.
FCoE Port Count
The number of FCoE ports contained by the node.
Ethernet Port Count
The number of ethernet ports contained by the node.
Flash Card Size
The size of the flash cards installed on the node.
Flash Card Count
The number of flash cards installed on the node.
Disk Shelves Count
The number of disk shelves contained by the node.
Disk Count
The number of disks in the node.
Cluster
The name of the cluster to which the node belongs. You can click the cluster name tonavigate to that cluster's health details page.
Cluster FQDN
The fully qualified domain name (FQDN) of the cluster.
Contact
The contact information of the node.
Location
The location of the node.
Health: All Aggregates viewThe Health: All Aggregates view displays information about the aggregates that are monitored,and enables you to view and modify the threshold settings.
By default, objects in the view pages are sorted based on event criticality. Objects with criticalevents are listed first, and objects with warning events are listed second. This provides animmediate visual indication of issues that must be addressed.
The controls along the top of the page enable you to select a particular view (for health,performance, capacity, and so on), perform searches to locate specific objects, create and applyfilters to narrow the list of displayed data, add/remove/reorder columns on the page, and export thedata on the page to a .csv, .pdf, or .xlsx file. After you have customized the page, you cansave the results as a custom view and then schedule a report of this data to be generated andemailed on a regular basis.
You can customize capacity threshold settings for one or more aggregates by using the EditThreshold button.
See Aggregate health fields for descriptions of all the fields on this page.
Related conceptsWhat storage efficiency is on page 195
237Managing and monitoring clusters and cluster object health

Storage efficiency enables you to store the maximum amount of data for the lowest cost andaccommodates rapid data growth while consuming less space. NetApp strategy for storageefficiency is based on the built-in foundation of storage virtualization and unified storage providedby its core ONTAP operating system and Write Anywhere File Layout (WAFL) file system.
Related tasksEditing individual aggregate health threshold settings on page 137
You can edit the health threshold settings for aggregate capacity, growth, and Snapshot copies ofone or more aggregates. When a threshold is crossed, alerts are generated and you receivenotifications. These notifications help you to take preventive measures based on the eventgenerated.
Exporting storage data as reports on page 27You can export storage data in a variety of output formats and then use the exported data to buildreports. For example, if there are 10 critical events that have not been resolved, you can export thedata from the Event Management inventory page to create a report, and then send the report toadmins who can resolve the issues.
Scheduling a report on page 332After you have a view or Excel file that you want to schedule for regular generation anddistribution, you can schedule the report.
Aggregate health fieldsThe following fields are available in the Health: All Aggregates view and can be used in customviews and in reports.
Status
The current status of the aggregate. The status can be Critical ( ), Error ( ), Warning
( ), or Normal ( ).
Aggregate
The name of the aggregate.
State
The current state of the aggregate:
• Offline
Read or write access is not allowed.
• Online
Read and write access to volumes hosted on this aggregate is allowed.
• Restricted
Limited operations, such as parity reconstruction, are allowed, but data access is notallowed.
• Creating
The aggregate is being created.
• Destroying
The aggregate is being destroyed.
• Failed
The aggregate cannot be brought online.
• Frozen
The aggregate is (temporarily) not serving requests.
• Inconsistent
The aggregate has been marked corrupted; contact technical support.
238Managing and monitoring clusters and cluster object health
• Iron Restricted
Diagnostic tools cannot be run on the aggregate.
• Mounting
The aggregate is being mounted.
• Partial
At least one disk was found for the aggregate, but two or more disks are missing.
• Quiesced
The aggregate is quiesced.
• Quiescing
The aggregate is being quiesced.
• Reverted
The revert operation of the aggregate is completed.
• Unmounted
The aggregate is offline.
• Unmounting
The aggregate is being taken offline.
• Unknown
Specifies that the aggregate is discovered, but the aggregate information is not yetretrieved by the Unified Manager server.
Node
The name of the node that contains the aggregate.
Mirror Status
The mirror status of the aggregate:
• Mirrored
The aggregate plex data is mirrored.
• Mirror degraded
The aggregate plex data cannot be mirrored.
• Mirror resynchronizing
The aggregate plex data is being mirrored.
• Failed
The aggregate plex data mirroring failed.
• Invalid configuration
The initial state before an aggregate is created.
• Uninitialized
The aggregate is being created.
• Unmirrored
The aggregate is not mirrored.
• CP count check in progress
The aggregate has been assimilated and Unified Manager is validating that the CPcounts for the plexes is similar.
• Limbo
There is an issue with the aggregate labels. The ONTAP system identifies the aggregatebut cannot accurately assimilate the aggregate.
• Needs CP count check
The aggregate is assimilated but the CP counts on both plexes are not yet validated to besimilar.
When an aggregate is in the mirror_resynchronizing state, then the resynchronizationpercentage is also shown.
239Managing and monitoring clusters and cluster object health

In Transition
Whether the aggregate has completed transition or not.
Type
The aggregate type:
• HDD
• Hybrid
Combines HDDs and SSDs, but Flash Pool has not been enabled.
• Hybrid (Flash Pool)
Combines HDDs and SSDs, and Flash Pool has been enabled.
• SSD
• SSD (FabricPool)
Combines SSDs and a cloud tier
• HDD (FabricPool)
Combines HDDs and a cloud tier
• VMDisk (SDS)
Virtual disks within a virtual machine
• VMDisk (FabricPool)
Combines virtual disks and a cloud tier
• LUN (FlexArray)
SnapLock Type
The aggregate SnapLock Type. The possible values are Compliance, Enterprise, Non-SnapLock.
Used Data %
The percentage of space used for data in the aggregate.
Available Data %
The percentage of space available for data in the aggregate.
Used Data Capacity
The amount of space used for data in the aggregate.
Available Data Capacity
The amount of space available for data in the aggregate.
Total Data Capacity
The total data size of the aggregate.
Committed Capacity
The total space committed for all of the volumes in the aggregate.
When Autogrow is enabled on volumes that reside on the aggregate, the committed capacityis based on the maximum volume size set by autogrow, not based on the original volumesize. For FabricPool aggregates, this value is relevant only to the local, or performance tier,capacity. The amount of space available in the cloud tier is not reflected in this value.
Logical Space Used
The real size of the data that is being stored on the aggregate without applying the savingsfrom using ONTAP storage efficiency technologies.
Space Savings
The storage efficiency ratio based on the total logical space that is being used to store thedata and the total physical space that would be required to store the data without usingONTAP storage efficiency technologies.
240Managing and monitoring clusters and cluster object health

This field is populated only for non-root aggregates.
Cloud Tier Space Used
The amount of space being used in the cloud tier; if the aggregate is a FabricPool aggregate.
RAID Type
The RAID configuration type:
• RAID 0: All the RAID groups are of type RAID 0.
• RAID 4: All the RAID groups are of type RAID 4.
• RAID-DP: All the RAID groups are of type RAID-DP.
• RAID-TEC: All the RAID groups are of type RAID-TEC.
• Mixed RAID: The aggregate contains RAID groups of different RAID types (RAID 0,RAID 4, RAID-DP, and RAID-TEC).
Cluster
The name of the cluster on which the aggregate resides. You can click the cluster name tonavigate to that cluster's health details page.
Cluster FQDN
The fully qualified domain name (FQDN) of the cluster.
Capacity: All Aggregates viewThe Capacity: All Aggregates view enables you to view information about the capacity andutilization of aggregates in all clusters. This information enables you to understand possiblecapacity risks and also to view the configured, used, and unused capacity of aggregates.
The controls along the top of the page enable you to select a particular view (for health,performance, capacity, and so on), perform searches to locate specific objects, create and applyfilters to narrow the list of displayed data, add/remove/reorder columns on the page, and export thedata on the page to a .csv, .pdf, or .xlsx file. After you have customized the page, you cansave the results as a custom view and then schedule a report of this data to be generated andemailed on a regular basis.
See Aggregate capacity fields for descriptions of all the fields on this page.
Related tasksViewing the aggregate list and details on page 213
From the Health: All Aggregates view, you can monitor your inventory of aggregates. TheCapacity: All Aggregates view enables you to view information about the capacity and utilizationof aggregates in all clusters.
Exporting storage data as reports on page 27You can export storage data in a variety of output formats and then use the exported data to buildreports. For example, if there are 10 critical events that have not been resolved, you can export thedata from the Event Management inventory page to create a report, and then send the report toadmins who can resolve the issues.
Scheduling a report on page 332After you have a view or Excel file that you want to schedule for regular generation anddistribution, you can schedule the report.
Editing individual aggregate health threshold settings on page 137You can edit the health threshold settings for aggregate capacity, growth, and Snapshot copies ofone or more aggregates. When a threshold is crossed, alerts are generated and you receive
241Managing and monitoring clusters and cluster object health

notifications. These notifications help you to take preventive measures based on the eventgenerated.
Aggregate capacity fieldsThe following fields are available in the Aggregate Capacity and Utilization report and can be usedin custom views and in reports.
Aggregate
The aggregate name.
Daily Growth Rate %
The growth rate that occurs every 24 hours in the aggregate.
Days To Full
The estimated number of days remaining before the aggregate reaches full capacity.
Overcommitted Capacity %
The aggregate overcommitment as a percentage.
Available Data %
The available data capacity as a percentage.
Available Data Capacity
The available data capacity.
Used Data %
The used data capacity as a percentage.
Used Data Capacity
The used data capacity.
Total Data Capacity
The total data capacity (used plus available).
Logical Space Used
The real size of the data that is being stored on the aggregate without applying the savingsfrom using ONTAP storage efficiency technologies.
Snapshot Reserve Available %
The amount of space available for Snapshot copies as a percentage.
Snapshot Reserve Available Capacity
The amount of space available for Snapshot copies.
Snapshot Reserve Used %
The amount of space used by Snapshot copies from the snapshot reserve as a percentage.
Snapshot Reserve Used Capacity
The amount of space used by snapshot copies from the snapshot reserve.
Snapshot Reserve Total Capacity
The total snapshot reserve capacity of the aggregate.
Cloud Tier Space Used
The amount of data capacity that is currently being used in the cloud tier.
Cloud Tier
The name of the cloud tier object store when it was created by ONTAP.
242Managing and monitoring clusters and cluster object health
State
The current state of the aggregate.
Type
The aggregate type:
• HDD
• Hybrid
Combines HDDs and SSDs, but Flash Pool has not been enabled.
• Hybrid (Flash Pool)
Combines HDDs and SSDs, and Flash Pool has been enabled.
• SSD
• SSD (FabricPool)
Combines SSDs and a cloud tier
• HDD (FabricPool)
Combines HDDs and a cloud tier
• VMDisk (SDS)
Virtual disks within a virtual machine
• VMDisk (FabricPool)
Combines virtual disks and a cloud tier
• LUN (FlexArray)
RAID Type
The RAID configuration type.
SnapLock Type
The aggregate SnapLock Type. The possible values are Compliance, Enterprise, Non-SnapLock.
HA Pair
The HA pair value obtained by forming two nodes.
Node
The name of the node that contains the aggregate.
Cluster
The cluster name. You can click the cluster name to navigate to that cluster's capacitydetails page.
Cluster FQDN
The fully qualified domain name (FQDN) of the cluster.
Aggregate / Health details pageYou can use the Aggregate / Health details page to view detailed information about the selectedaggregate, such as the capacity, disk information, configuration details, and events generated. Youcan also view information about the related objects and related alerts for that aggregate.
• Command buttons• Capacity tab• Disk Information tab• Configuration tab• History area• Events list• Related Devices pane
243Managing and monitoring clusters and cluster object health

• Related Alerts pane
Command buttons
Note: When monitoring a FabricPool-enabled aggregate, the committed and overcommittedvalues on this page are relevant only to the local, or performance tier, capacity. The amount ofspace available in the cloud tier is not reflected in the overcommitted values. Similarly, theaggregate threshold values are relevant only to the local performance tier.
The command buttons enable you to perform the following tasks for the selected aggregate:
Switch to Performance View
Enables you to navigate to the Aggregate / Performance details page.
Actions
• Add Alert
Enables you to add an alert to the selected aggregate.
• Edit Thresholds
Enables you to modify the threshold settings for the selected aggregate.
View Aggregates
Enables you to navigate to the Health: All Aggregates view.
Capacity tab
The Capacity tab displays detailed information about the selected aggregate, such as its capacity,thresholds, and daily growth rate.
By default, capacity events are not generated for root aggregates. Also, the threshold values usedby Unified Manager are not applicable to node root aggregates. Only a technical supportrepresentative can modify the settings for these events to be generated. When the settings aremodified by a technical support representative, the threshold values are applied to the node rootaggregate.
Capacity
Displays the data capacity graph and the Snapshot copies graph, which display capacitydetails about the aggregate:
• Logical Space Used
The real size of the data that is being stored on the aggregate without applying thesavings from using ONTAP storage efficiency technologies.
• Used
The physical capacity used by data in the aggregate.
• Overcommitted
When space in the aggregate is overcommitted, the chart displays a flag with theovercommitted amount.
• Warning
Displays a dotted line at the location where the warning threshold is set; meaning spacein the aggregate is nearly full. If this threshold is breached, the Space Nearly Full eventis generated.
• Error
Displays a solid line at the location where the error threshold is set; meaning space inthe aggregate is full. If this threshold is breached, the Space Full event is generated.
• Snapshot Copies graph
This graph is displayed only when the used Snapshot capacity or the Snapshot reserve isnot zero.
244Managing and monitoring clusters and cluster object health

Both of the graphs display the capacity by which the Snapshot capacity exceeds theSnapshot reserve if the used Snapshot capacity exceeds the Snapshot reserve.
Cloud Tier
Displays the space used by data in the cloud tier for FabricPool-enabled aggregates. AFabricPool can be either licensed or unlicensed.
When the cloud tier is mirrored to another cloud provider (the "mirror tier") then both cloudtiers are displayed here.
Details
Displays detailed information about capacity.
• Total CapacityDisplays the total capacity in the aggregate.
• Data CapacityDisplays the amount of space used by the aggregate (used capacity) and the amount ofavailable space in the aggregate (free capacity).
• Snapshot ReserveDisplays the used and free Snapshot capacity of the aggregate.
• Overcommitted CapacityDisplays the aggregate overcommitment. Aggregate overcommitment enables you toprovide more storage than is actually available from a given aggregate, as long as not allof that storage is currently being used. When thin provisioning is in use, the total size ofvolumes in the aggregate can exceed the total capacity of the aggregate.
Note: If you have overcommitted your aggregate, you must monitor its availablespace carefully and add storage as required to avoid write errors due to insufficientspace.
• Cloud TierDisplays the space used by data in the cloud tier for FabricPool-enabled aggregates. AFabricPool can be either licensed or unlicensed. When the cloud tier is mirrored toanother cloud provider (the mirror tier) then both cloud tiers are displayed here
• Total Cache SpaceDisplays the total space of the solid-state drives (SSDs) or allocation units that areadded to a Flash Pool aggregate. If you have enabled Flash Pool for an aggregate buthave not added any SSDs, then the cache space is displayed as 0 KB.
Note: This field is hidden if Flash Pool is disabled for an aggregate.
• Aggregate ThresholdsDisplays the following aggregate capacity thresholds:
◦ Nearly Full ThresholdSpecifies the percentage at which an aggregate is nearly full.
◦ Full ThresholdSpecifies the percentage at which an aggregate is full.
◦ Nearly Overcommitted ThresholdSpecifies the percentage at which an aggregate is nearly overcommitted.
◦ Overcommitted ThresholdSpecifies the percentage at which an aggregate is overcommitted.
• Other Details: Daily Growth RateDisplays the disk space used in the aggregate if the rate of change between the last twosamples continues for 24 hours.For example, if an aggregate uses 10 GB of disk space at 2 pm and 12 GB at 6 pm, thedaily growth rate (GB) for this aggregate is 2 GB.
245Managing and monitoring clusters and cluster object health

• Volume MoveDisplays the number of volume move operations that are currently in progress:
◦ Volumes OutDisplays the number and capacity of the volumes that are being moved out of theaggregate.You can click the link to view more details, such as the volume name, aggregate towhich the volume is moved, status of the volume move operation, and the estimatedend time.
◦ Volumes InDisplays the number and remaining capacity of the volumes that are being movedinto the aggregate.You can click the link to view more details, such as the volume name, aggregatefrom which the volume is moved, status of the volume move operation, and theestimated end time.
◦ Estimated used capacity after volume moveDisplays the estimated amount of used space (as a percentage, and in KB, MB, GB,and so on) in the aggregate after the volume move operations are complete.
Capacity Overview - Volumes
Displays graphs that provide information about the capacity of the volumes contained in theaggregate. The amount of space used by the volume (used capacity) and the amount ofavailable space (free capacity) in the volume is displayed. When the Thin-ProvisionedVolume Space At Risk event is generated for thinly provisioned volumes, the amount ofspace used by the volume (used capacity) and the amount of space that is available in thevolume but cannot be used (unusable capacity) because of aggregate capacity issues isdisplayed.
You can select the graph you want to view from the drop-down lists. You can sort the datadisplayed in the graph to display details such as the used size, provisioned size, availablecapacity, fastest daily growth rate, and slowest growth rate. You can filter the data based onthe storage virtual machines (SVMs) that contain the volumes in the aggregate. You canalso view details for thinly provisioned volumes. You can view the details of specific pointson the graph by positioning your cursor over the area of interest. By default, the graphdisplays the top 30 filtered volumes in the aggregate.
Disk Information tab
Displays detailed information about the disks in the selected aggregate, including the RAID typeand size, and the type of disks used in the aggregate. The tab also graphically displays the RAIDgroups, and the types of disks used (such as SAS, ATA, FCAL, SSD, or VMDISK). You can viewmore information, such as the disk's bay, shelf, and rotational speed, by positioning your cursorover the parity disks and data disks.
Data
Graphically displays details about dedicated data disks, shared data disks, or both. Whenthe data disks contain shared disks, graphical details of the shared disks are displayed.When the data disks contain dedicated disks and shared disks, graphical details of both thededicated data disks and the shared data disks are displayed.
RAID Details
RAID details are displayed only for dedicated disks.
• TypeDisplays the RAID type (RAID0, RAID4, RAID-DP, or RAID-TEC).
• Group SizeDisplays the maximum number of disks allowed in the RAID group.
246Managing and monitoring clusters and cluster object health

• Groups
Displays the number of RAID groups in the aggregate.
Disks Used
• Effective Type
Displays the types of data disks (for example, ATA, SATA, FCAL, SSD, orVMDISK) in the aggregate.
• Data Disks
Displays the number and capacity of the data disks that are assigned to anaggregate. Data disk details are not displayed when the aggregate contains onlyshared disks.
• Parity Disks
Displays the number and capacity of the parity disks that are assigned to anaggregate. Parity disk details are not displayed when the aggregate contains onlyshared disks.
• Shared Disks
Displays the number and capacity of the shared data disks that are assigned to anaggregate. Shared disk details are displayed only when the aggregate containsshared disks.
Spare Disks
Displays the disk effective type, number, and capacity of the spare data disks that areavailable for the node in the selected aggregate.
Note: When an aggregate is failed over to the partner node, Unified Manager doesnot display all of the spare disks that are compatible with the aggregate.
SSD Cache
Provides details about dedicated cache SSD disks and shared cache SSD disks.
The following details for the dedicated cache SSD disks are displayed:
RAID Details
• Type
Displays the RAID type (RAID0, RAID4, RAID-DP or RAID-TEC).
• Group Size
Displays the maximum number of disks allowed in the RAID group.
• Groups
Displays the number of RAID groups in the aggregate.
Disks Used
• Effective Type
Indicates that the disks used for cache in the aggregate are of type SSD.
• Data Disks
Displays the number and capacity of the data disks that are assigned to anaggregate for cache.
• Parity Disks
Displays the number and capacity of the parity disks that are assigned to anaggregate for cache.
Spare Disks
Displays the disk effective type, number, and capacity of the spare disks that areavailable for the node in the selected aggregate for cache.
247Managing and monitoring clusters and cluster object health
Note: When an aggregate is failed over to the partner node, Unified Manager doesnot display all of the spare disks that are compatible with the aggregate.
Provides the following details for the shared cache:
Storage Pool
Displays the name of the storage pool. You can move the pointer over the storagepool name to view the following details:
• Status
Displays the status of the storage pool, which can be healthy or unhealthy.
• Total Allocations
Displays the total allocation units and the size in the storage pool.
• Allocation Unit Size
Displays the minimum amount of space in the storage pool that can be allocatedto an aggregate.
• Disks
Displays the number of disks used to create the storage pool. If the disk count inthe storage pool column and the number of disks displayed in the DiskInformation tab for that storage pool do not match, then it indicates that one ormore disks are broken and the storage pool is unhealthy.
• Used Allocation
Displays the number and size of the allocation units used by the aggregates. Youcan click the aggregate name to view the aggregate details.
• Available Allocation
Displays the number and size of the allocation units available for the nodes. Youcan click the node name to view the aggregate details.
Allocated Cache
Displays the size of the allocation units used by the aggregate.
Allocation Units
Displays the number of allocation units used by the aggregate.
Disks
Displays the number of disks contained in the storage pool.
Details
• Storage Pool
Displays the number of storage pools.
• Total Size
Displays the total size of the storage pools.
Cloud Tier
Displays the name of the cloud tier, if you have configured a FabricPool-enabled aggregate,and shows the total space used. When the cloud tier is mirrored to another cloud provider(the mirror tier) then the details for both cloud tiers are displayed here
Configuration tab
The Configuration tab displays details about the selected aggregate, such as its cluster node, blocktype, RAID type, RAID size, and RAID group count:
Overview
• Node
Displays the name of the node that contains the selected aggregate.
248Managing and monitoring clusters and cluster object health

• Block Type
Displays the block format of the aggregate: either 32-bit or 64-bit.
• RAID Type
Displays the RAID type (RAID0, RAID4, RAID-DP, RAID-TEC or Mixed RAID).
• RAID Size
Displays the size of the RAID group.
• RAID Groups
Displays the number of RAID groups in the aggregate.
• SnapLock Type
Displays the SnapLock Type of the aggregate.
Cloud Tier
If this is a FabricPool-enabled aggregate, the details for the cloud tier are displayed. Somefields are different depending on the storage provider. When the cloud tier is mirrored toanother cloud provider (the "mirror tier") then both cloud tiers are displayed here.
• Provider
Displays the name of the storage provider, for example, StorageGRID, Amazon S3,IBM Cloud Object Storage, Microsoft Azure Cloud, Google Cloud Storage, or AlibabaCloud Object Storage.
• Name
Displays the name of the cloud tier when it was created by ONTAP.
• Server
Displays the FQDN of the cloud tier.
• Port
The port being used to communicate with the cloud provider.
• Access Key or Account
Displays the access key or account for the cloud tier.
• Container Name
Displays the bucket or container name of the cloud tier.
• SSL
Displays whether SSL encryption is enabled for the cloud tier.
History area
The History area displays graphs that provide information about the capacity of the selectedaggregate. Additionally, you can click the Export button to create a report in CSV format for thechart that you are viewing.
You can select a graph type from the drop-down list at the top of the History pane. You can alsoview details for a specific time period by selecting either 1 week, 1 month, or 1 year. Historygraphs can help you identify trends: for example, if the aggregate usage is consistently breachingthe Nearly Full threshold, you can take the appropriate action.
History graphs display the following information:
Aggregate Capacity Used (%)
Displays the used capacity in the aggregate and the trend in how aggregate capacity is usedbased on the usage history as line graphs, in percentage, on the vertical (y) axis. The timeperiod is displayed on the horizontal (x) axis. You can select a time period of a week, amonth, or a year. You can view the details for specific points on the graph by positioningyour cursor over a particular area. You can hide or display a line graph by clicking theappropriate legend. For example, when you click the Capacity Used legend, the CapacityUsed graph line is hidden.
249Managing and monitoring clusters and cluster object health

Aggregate Capacity Used vs Total Capacity
Displays the trend in how aggregate capacity is used based on the usage history, as well asthe used capacity and the total capacity, as line graphs, in bytes, kilobytes, megabytes, andso on, on the vertical (y) axis. The time period is displayed on the horizontal (x) axis. Youcan select a time period of a week, a month, or a year. You can view the details for specificpoints on the graph by positioning your cursor over a particular area. You can hide ordisplay a line graph by clicking the appropriate legend. For example, when you click theTrend Capacity Used legend, the Trend Capacity Used graph line is hidden.
Aggregate Capacity Used (%) vs Committed (%)
Displays the trend in how aggregate capacity is used based on the usage history, as well asthe committed space as line graphs, as a percentage, on the vertical (y) axis. The timeperiod is displayed on the horizontal (x) axis. You can select a time period of a week, amonth, or a year. You can view the details for specific points on the graph by positioningyour cursor over a particular area. You can hide or display a line graph by clicking theappropriate legend. For example, when you click the Space Committed legend, the SpaceCommitted graph line is hidden.
Events list
The Events list displays details about new and acknowledged events:
Severity
Displays the severity of the event.
Event
Displays the event name.
Triggered Time
Displays the time that has elapsed since the event was generated. If the time elapsedexceeds a week, the timestamp for when the event was generated is displayed.
Related Devices pane
The Related Devices pane enables you to view the cluster node, volumes, and disks that are relatedto the aggregate:
Node
Displays the capacity and the health status of the node that contains the aggregate. Capacityindicates the total usable capacity over available capacity.
Aggregates in the Node
Displays the number and capacity of all the aggregates in the cluster node that contains theselected aggregate. The health status of the aggregates is also displayed, based on thehighest severity level. For example, if a cluster node contains ten aggregates, five of whichdisplay the Warning status and the remaining five of which display the Critical status, thenthe status displayed is Critical.
Volumes
Displays the number and capacity of FlexVol volumes and FlexGroup volumes in theaggregate; the number does not include FlexGroup constituents. The health status of thevolumes is also displayed, based on the highest severity level.
Resource Pool
Displays the resource pools related to the aggregate.
Disks
Displays the number of disks in the selected aggregate.
250Managing and monitoring clusters and cluster object health

Related Alerts pane
The Related Alerts pane enables you to view the list of alerts that are created for the selectedaggregate. You can also add an alert by clicking the Add Alert link or edit an existing alert byclicking the alert name.
Related tasksAdding alerts on page 119
You can configure alerts to notify you when a particular event is generated. You can configurealerts for a single resource, for a group of resources, or for events of a particular severity type. Youcan specify the frequency with which you want to be notified and associate a script to the alert.
Editing individual aggregate health threshold settings on page 137You can edit the health threshold settings for aggregate capacity, growth, and Snapshot copies ofone or more aggregates. When a threshold is crossed, alerts are generated and you receivenotifications. These notifications help you to take preventive measures based on the eventgenerated.
Related referenceStorage Pool dialog box on page 265
The Storage Pool dialog box enables you to view the details of the dedicated cache of SSDs, alsoknown as storage pools. You can monitor the storage pools and view details such as the storagepool health, total and available cache, and used and available allocations in the storage pool.
Health: All Storage VMs viewThe Health: All Storage VMs view enables you to view detailed information about the storagevirtual machines (SVMs) that you are monitoring.
By default, objects in the view pages are sorted based on event criticality. Objects with criticalevents are listed first, and objects with warning events are listed second. This provides animmediate visual indication of issues that must be addressed.
The controls along the top of the page enable you to select a particular view (for health,performance, capacity, and so on), perform searches to locate specific objects, create and applyfilters to narrow the list of displayed data, add/remove/reorder columns on the page, and export thedata on the page to a .csv, .pdf, or .xlsx file. After you have customized the page, you cansave the results as a custom view and then schedule a report of this data to be generated andemailed on a regular basis.
You can associate an SVM to a predefined annotation by using the Annotate button.
See SVM health fields for descriptions of all the fields on this page.
Related tasksExporting storage data as reports on page 27
You can export storage data in a variety of output formats and then use the exported data to buildreports. For example, if there are 10 critical events that have not been resolved, you can export thedata from the Event Management inventory page to create a report, and then send the report toadmins who can resolve the issues.
Scheduling a report on page 332
251Managing and monitoring clusters and cluster object health

After you have a view or Excel file that you want to schedule for regular generation anddistribution, you can schedule the report.
SVM health fieldsThe following fields are available in the Health: All Storage VMs view and can be used in customviews and in reports.
Status
The current status of the SVM. The status can be Critical ( ), Error ( ), Warning
( ), or Normal ( ).
Storage VM
The name of the SVM.
State
The current administrative state of the SVM. The state can be Running, Stopped, Starting,or Stopping.
Allowed Volume Type
The type of volume that can be created in the SVM. The type can be FlexVol or FlexVol/FlexGroup.
Allowed Protocols
The type of protocols that can be configured on the SVM. The available protocols are FC/FCoE, iSCSI, HTTP, NDMP, NVMe, NFS, and CIFS.
Available Data Capacity
The available data capacity of all the volumes in the SVM.
Total Data Capacity
The total data capacity of all the volumes in the SVM.
Root Volume
The name of the root volume of the SVM.
NIS State
The state of the Network Information Service (NIS). The state can be Enabled, Disabled, orNot Configured.
NIS Domain
The NIS domain name. This column is blank when the NIS server is disabled or is notconfigured.
DNS State
The state of the Domain Name System (DNS). The state can be Enabled, Disabled, or NotConfigured.
DNS Domain
The DNS domain name.
Name Service Switch
The information type gathered from hosts. Possible values are file, LDAP, or NIS.
LDAP Enabled
Whether the LDAP protocol is enabled or not.
252Managing and monitoring clusters and cluster object health

Maximum Allowed Volumes
The maximum allowed volumes that can be configured on the SVM.
Volume Count
The number of volumes contained by the SVM.
Cluster
The name of the cluster to which the SVM belongs.
Cluster FQDN
The fully qualified domain name (FQDN) of the cluster.
Storage VM / Health details pageYou can use the Storage VM / Health details page to view detailed information about the selectedSVM, such as its health, capacity, configuration, data policies, logical interfaces (LIFs), LUNs,qtrees, and user and user group quotas. You can also view information about the related objectsand related alerts for the SVM.
Note: You can monitor only data SVMs.
• Command buttons• Health tab• Capacity tab• Configuration tab• Network Interfaces tab• Qtrees tab• User and Group Quotas tab• NFS Shares tab• SMB Shares tab• SAN tab• Related Annotations pane• Related Devices pane• Related Groups pane• Related Alerts pane
Command buttons
The command buttons enable you to perform the following tasks for the selected SVM:
Switch to Performance View
Enables you to navigate to the Storage VM / Performance details page.
Actions
• Add Alert
Enables you to add an alert to the selected SVM.
• Annotate
Enables you to annotate the selected SVM.
View Storage VMs
Enables you to navigate to the Health: All Storage VMs view.
Health tab
The Health tab displays detailed information about data availability, data capacity, and protectionissues of various objects such as volumes, aggregates, NAS LIFs, SAN LIFs, LUNs, protocols,services, NFS shares, and CIFS shares.
253Managing and monitoring clusters and cluster object health
You can click the graph of an object to view the filtered list of objects. For example, you can clickthe volume capacity graph that displays warnings to view the list of volumes that have capacityissues with severity as warning.
Availability Issues
Displays, as a graph, the total number of objects, including objects that have availabilityissues and objects that do not have any availability-related issues. The colors in the graphrepresent the different severity levels of the issues. The information below the graphprovides details about availability issues that can impact or have already impacted theavailability of data in the SVM. For example, information is displayed about the NAS LIFsand the SAN LIFs that are down and volumes that are offline.
You can also view information about the related protocols and services that are currentlyrunning, and the number and status of NFS and CIFS shares.
Capacity Issues
Displays, as a graph, the total number of objects, including objects that have capacity issuesand objects that do not have any capacity-related issues. The colors in the graph representthe different severity levels of the issues. The information below the graph provides detailsabout capacity issues that can impact or have already impacted the capacity of data in theSVM. For example, information is displayed about aggregates that are likely to breach theset threshold values.
Protection Issues
Provides a quick overview of SVM protection-related health by displaying, as a graph, thetotal number of relationships, including relationships that have protection issues andrelationships that do not have any protection-related issues. When unprotected volumesexist, clicking on the link takes you to the Health: All Volumes view where you can view afiltered list of the unprotected volumes on the SVM. The colors in the graph represent thedifferent severity levels of the issues. Clicking a graph takes you to the Relationship: AllRelationships view, where you can view a filtered list of protection relationship details. Theinformation below the graph provides details about protection issues that can impact or havealready impacted the protection of data in the SVM. For example, information is displayedabout volumes that have a Snapshot copy reserve that is almost full or about SnapMirrorrelationship lag issues.
If the selected SVM is a repository SVM, the Protection area does not display.
Capacity tab
The Capacity tab displays detailed information about the data capacity of the selected SVM.
The following information is displayed for an SVM with FlexVol volume or FlexGroup volume:
Capacity
The Capacity area displays details about the used and available capacity allocated from allvolumes:
• Total Capacity
Displays the total capacity of the SVM.
• Used
Displays the space used by data in the volumes that belong to the SVM.
• Guaranteed Available
Displays the guaranteed available space for data that is available for volumes in theSVM.
• Unguaranteed
Displays the available space remaining for data that is allocated for thinly provisionedvolumes in the SVM.
254Managing and monitoring clusters and cluster object health
Volumes with Capacity Issues
The Volumes with Capacity Issues list displays, in tabular format, details about the volumesthat have capacity issues:
• Status
Indicates that the volume has a capacity-related issue of an indicated severity.
You can move the pointer over the status to view more information about the capacity-related event or events generated for the volume.
If the status of the volume is determined by a single event, you can view informationsuch as the event name, time and date when the event was triggered, the name of theadministrator to whom the event is assigned, and the cause of the event. You can use theView Details button to view more information about the event.
If the status of the volume is determined by multiple events of the same severity, the topthree events are displayed with information such as the event name, time and date whenthe events were triggered, and the name of the administrator to whom the event isassigned. You can view more details about each of these events by clicking the eventname. You can also click the View All Events link to view the list of generated events.
Note: A volume can have multiple events of the same severity or different severities.However, only the highest severity is displayed. For example, if a volume has twoevents with severities of Error and Warning, only the Error severity is displayed.
• Volume
Displays the name of the volume.
• Used Data Capacity
Displays, as a graph, information about the volume capacity usage (in percentage).
• Days to Full
Displays the estimated number of days remaining before the volume reaches fullcapacity.
• Thin Provisioned
Displays whether space guarantee is set for the selected volume. Valid values are Yesand No.
• Aggregates
For FlexVol volumes, displays the name of the aggregate that contains the volume. ForFlexGroup volumes, displays the number of aggregates that are used in the FlexGroup.
Configuration tab
The Configuration tab displays configuration details about the selected SVM, such as its cluster,root volume, the type of volumes it contains (FlexVol volumes), and the policies created on theSVM:
Overview
• Cluster
Displays the name of the cluster to which the SVM belongs.
• Allowed Volume Type
Displays the type of volumes that can be created in the SVM. The type can be FlexVolor FlexVol/FlexGroup.
• Root Volume
Displays the name of the root volume of the SVM.
• Allowed Protocols
Displays the type of protocols that can be configured on the SVM. Also, indicates if a
protocol is up ( ), down ( ), or is not configured ( ).
255Managing and monitoring clusters and cluster object health

Data Network Interfaces
• NAS
Displays the number of NAS interfaces that are associated with the SVM. Also,
indicates if the interfaces are up ( ) or down ( ).
• SAN
Displays the number of SAN interfaces that are associated with the SVM. Also,
indicates if the interfaces are up ( ) or down ( ).
• FC-NVMe
Displays the number of FC-NVMe interfaces that are associated with the SVM. Also,
indicates if the interfaces are up ( ) or down ( ).
Management Network Interfaces
• Availability
Displays the number of management interfaces that are associated with the SVM. Also,
indicates if the management interfaces are up ( ) or down ( ).
Policies
• Snapshots
Displays the name of the Snapshot policy that is created on the SVM.
• Export Policies
Displays either the name of the export policy if a single policy is created or displays thenumber of export policies if multiple policies are created.
Services
• Type
Displays the type of service that is configured on the SVM. The type can be DomainName System (DNS) or Network Information Service (NIS).
• State
Displays the state of the service, which can be Up ( ), Down ( ), or Not
Configured ( ).
• Domain Name
Displays the fully qualified domain names (FQDNs) of the DNS server for the DNSservices or NIS server for the NIS services. When the NIS server is enabled, the activeFQDN of the NIS server is displayed. When the NIS server is disabled, the list of all theFQDNs are displayed.
• IP Address
Displays the IP addresses of the DNS or NIS server. When the NIS server is enabled, theactive IP address of the NIS server is displayed. When the NIS server is disabled, the listof all the IP addresses are displayed.
Network Interfaces tab
The Network Interfaces tab displays details about the data network interfaces (LIFs) that arecreated on the selected SVM:
Network Interface
Displays the name of the interface that is created on the selected SVM.
256Managing and monitoring clusters and cluster object health

Operational Status
Displays the operational status of the interface, which can be Up ( ), Down ( ), or
Unknown ( ). The operational status of an interface is determined by the status of itsphysical ports.
Administrative Status
Displays the administrative status of the interface, which can be Up ( ), Down ( ), or
Unknown ( ). The administrative status of an interface is controlled by the storageadministrator to make changes to the configuration or for maintenance purposes. Theadministrative status can be different from the operational status. However, if theadministrative status of an interface is Down, the operational status is Down by default.
IP Address / WWPN
Displays the IP address for Ethernet interfaces and the World Wide Port Name (WWPN) forFC LIFs.
Protocols
Displays the list of data protocols that are specified for the interface, such as CIFS, NFS,iSCSI, FC/FCoE, FC-NVMe, and FlexCache.
Role
Displays the interface role. The roles can be Data or Management.
Home Port
Displays the physical port to which the interface was originally associated.
Current Port
Displays the physical port to which the interface is currently associated. If the interface ismigrated, the current port might be different from the home port.
Port Set
Displays the port set to which the interface is mapped.
Failover Policy
Displays the failover policy that is configured for the interface. For NFS, CIFS, andFlexCache interfaces, the default failover policy is Next Available. Failover policy is notapplicable for FC and iSCSI interfaces.
Routing Groups
Displays the name of the routing group. You can view more information about the routesand the destination gateway by clicking the routing group name.
Routing groups are not supported for ONTAP 8.3 or later and therefore a blank column isdisplayed for these clusters.
Failover Group
Displays the name of the failover group.
Qtrees tab
The Qtrees tab displays details about qtrees and their quotas. You can click the Edit Thresholdsbutton if you want to edit the health threshold settings for qtree capacity for one or more qtrees.
Use the Export button to create a comma-separated values (.csv) file containing the details of allthe monitored qtrees. When exporting to a CSV file you can choose to create a qtrees report for thecurrent SVM, for all SVMs in the current cluster, or for all SVMs for all clusters in your datacenter. Some additional qtrees fields appear in the exported CSV file.
257Managing and monitoring clusters and cluster object health
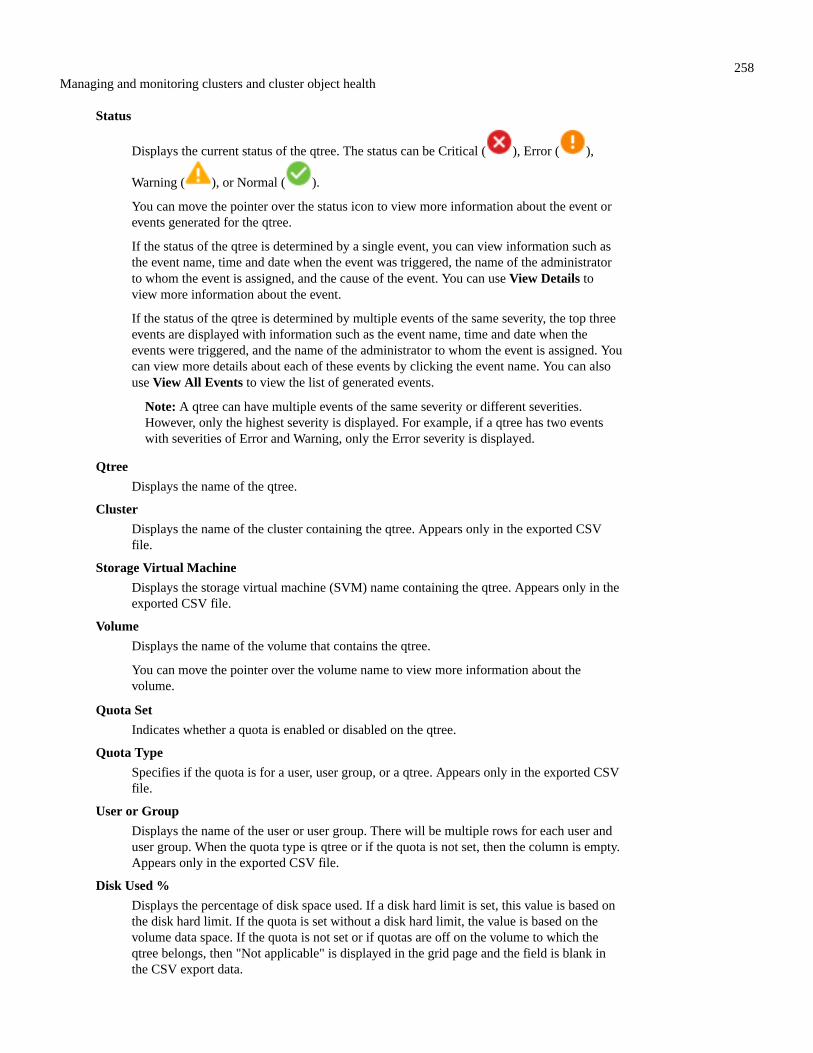
Status
Displays the current status of the qtree. The status can be Critical ( ), Error ( ),
Warning ( ), or Normal ( ).
You can move the pointer over the status icon to view more information about the event orevents generated for the qtree.
If the status of the qtree is determined by a single event, you can view information such asthe event name, time and date when the event was triggered, the name of the administratorto whom the event is assigned, and the cause of the event. You can use View Details toview more information about the event.
If the status of the qtree is determined by multiple events of the same severity, the top threeevents are displayed with information such as the event name, time and date when theevents were triggered, and the name of the administrator to whom the event is assigned. Youcan view more details about each of these events by clicking the event name. You can alsouse View All Events to view the list of generated events.
Note: A qtree can have multiple events of the same severity or different severities.However, only the highest severity is displayed. For example, if a qtree has two eventswith severities of Error and Warning, only the Error severity is displayed.
Qtree
Displays the name of the qtree.
Cluster
Displays the name of the cluster containing the qtree. Appears only in the exported CSVfile.
Storage Virtual Machine
Displays the storage virtual machine (SVM) name containing the qtree. Appears only in theexported CSV file.
Volume
Displays the name of the volume that contains the qtree.
You can move the pointer over the volume name to view more information about thevolume.
Quota Set
Indicates whether a quota is enabled or disabled on the qtree.
Quota Type
Specifies if the quota is for a user, user group, or a qtree. Appears only in the exported CSVfile.
User or Group
Displays the name of the user or user group. There will be multiple rows for each user anduser group. When the quota type is qtree or if the quota is not set, then the column is empty.Appears only in the exported CSV file.
Disk Used %
Displays the percentage of disk space used. If a disk hard limit is set, this value is based onthe disk hard limit. If the quota is set without a disk hard limit, the value is based on thevolume data space. If the quota is not set or if quotas are off on the volume to which theqtree belongs, then "Not applicable" is displayed in the grid page and the field is blank inthe CSV export data.
258Managing and monitoring clusters and cluster object health

Disk Hard Limit
Displays the maximum amount of disk space allocated for the qtree. Unified Managergenerates a critical event when this limit is reached and no further disk writes are allowed.The value is displayed as "Unlimited" for the following conditions: if the quota is setwithout a disk hard limit, if the quota is not set, or if quotas are off on the volume to whichthe qtree belongs.
Disk Soft Limit
Displays the amount of disk space allocated for the qtree before a warning event isgenerated. The value is displayed as "Unlimited" for the following conditions: if the quotais set without a disk soft limit, if the quota is not set, or if quotas are off on the volume towhich the qtree belongs. By default, this column is hidden.
Disk Threshold
Displays the threshold value set on the disk space. The value is displayed as "Unlimited" forthe following conditions: if the quota is set without a disk threshold limit, if the quota is notset, or if quotas are off on the volume to which the qtree belongs. By default, this column ishidden.
Files Used %
Displays the percentage of files used in the qtree. If the file hard limit is set, this value isbased on the file hard limit. No value is displayed if the quota is set without a file hardlimit. If the quota is not set or if quotas are off on the volume to which the qtree belongs,then "Not applicable" is displayed in the grid page and the field is blank in the CSV exportdata.
File Hard Limit
Displays the hard limit for the number of files permitted on the qtrees. The value isdisplayed as "Unlimited" for the following conditions: if the quota is set without a file hardlimit, if the quota is not set, or if quotas are off on the volume to which the qtree belongs.
File Soft Limit
Displays the soft limit for the number of files permitted on the qtrees. The value isdisplayed as "Unlimited" for the following conditions: if the quota is set without a file softlimit, if the quota is not set, or if quotas are off on the volume to which the qtree belongs.By default, this column is hidden.
User and Group Quotas tab
Displays details about the user and user group quotas for the selected SVM. You can viewinformation such as the status of the quota, name of the user or user group, soft and hard limits seton the disks and files, amount of disk space and number of files used, and the disk threshold value.You can also change the email address associated with a user or user group.
Edit Email Address command button
Opens the Edit Email Address dialog box, which displays the current email address of theselected user or user group. You can modify the email address. If the Edit Email Addressfield is blank, the default rule is used to generate an email address for the selected user oruser group.
If more than one user has the same quota, the names of the users are displayed as comma-separated values. Also, the default rule is not used to generate the email address; therefore,you must provide the required email address for notifications to be sent.
259Managing and monitoring clusters and cluster object health

Configure Email Rules command button
Enables you to create or modify rules to generate an email address for the user or usergroup quotas that are configured on the SVM. A notification is sent to the specified emailaddress when there is a quota breach.
Status
Displays the current status of the quota. The status can be Critical ( ), Warning ( ),
or Normal ( ).
You can move the pointer over the status icon to view more information about the event orevents generated for the quota.
If the status of the quota is determined by a single event, you can view information such asthe event name, time and date when the event was triggered, the name of the administratorto whom the event is assigned, and the cause of the event. You can use View Details toview more information about the event.
If the status of the quota is determined by multiple events of the same severity, the top threeevents are displayed with information such as the event name, time and date when theevents were triggered, and the name of the administrator to whom the event is assigned. Youcan view more details about each of these events by clicking the event name. You can alsouse View All Events to view the list of generated events.
Note: A quota can have multiple events of the same severity or different severities.However, only the highest severity is displayed. For example, if a quota has two eventswith severities of Error and Warning, only the Error severity is displayed.
User or Group
Displays the name of the user or user group. If more than one user has the same quota, thenames of the users are displayed as comma-separated values.
The value is displayed as "Unknown" when ONTAP does not provide a valid user namebecause of SecD errors.
Type
Specifies if the quota is for a user or a user group.
Volume or Qtree
Displays the name of the volume or qtree on which the user or user group quota is specified.
You can move the pointer over the name of the volume or qtree to view more informationabout the volume or qtree.
Disk Used %
Displays the percentage of disk space used. The value is displayed as "Not applicable" if thequota is set without a disk hard limit.
Disk Hard Limit
Displays the maximum amount of disk space allocated for the quota. Unified Managergenerates a critical event when this limit is reached and no further disk writes are allowed.The value is displayed as "Unlimited" if the quota is set without a disk hard limit.
Disk Soft Limit
Displays the amount of disk space allocated for the quota before a warning event isgenerated. The value is displayed as "Unlimited" if the quota is set without a disk soft limit.By default, this column is hidden.
260Managing and monitoring clusters and cluster object health

Disk Threshold
Displays the threshold value set on the disk space. The value is displayed as "Unlimited" ifthe quota is set without a disk threshold limit. By default, this column is hidden.
Files Used %
Displays the percentage of files used in the qtree. The value is displayed as "Not applicable"if the quota is set without a file hard limit.
File Hard Limit
Displays the hard limit for the number of files permitted on the quota. The value isdisplayed as "Unlimited" if the quota is set without a file hard limit.
File Soft Limit
Displays the soft limit for the number of files permitted on the quota. The value is displayedas "Unlimited" if the quota is set without a file soft limit. By default, this column is hidden.
Email Address
Displays the email address of the user or user group to which notifications are sent whenthere is a breach in the quotas.
NFS Shares tab
The NFS Shares tab displays information about NFS shares such as its status, the path associatedwith the volume (FlexGroup volumes or FlexVol volumes), access levels of clients to the NFSshares, and the export policy defined for the volumes that are exported. NFS shares will not bedisplayed in the following conditions: if the volume is not mounted or if the protocols associatedwith the export policy for the volume do not contain NFS shares.
Status
Displays the current status of the NFS shares. The status can be Error ( ) or Normal
( ).
Junction Path
Displays the path to which the volume is mounted. If an explicit NFS exports policy isapplied to a qtree, the column displays the path of the volume through which the qtree canbe accessed.
Junction Path Active
Displays whether the path to access the mounted volume is active or inactive.
Volume or Qtree
Displays the name of the volume or qtree to which the NFS export policy is applied. If anNFS export policy is applied to a qtree in the volume, the column displays both the namesof the volume and the qtree.
You can click the link to view details about the object in the respective details page. If theobject is a qtree, links are displayed for both the qtree and the volume.
Volume State
Displays the state of the volume that is being exported. The state can be Offline, Online,Restricted, or Mixed.
• Offline
Read or write access to the volume is not allowed.
• Online
Read and write access to the volume is allowed.
261Managing and monitoring clusters and cluster object health

• Restricted
Limited operations, such as parity reconstruction, are allowed, but data access is notallowed.
• Mixed
The constituents of a FlexGroup volume are not all in the same state.
Security Style
Displays the access permission for the volumes that are exported. The security style can beUNIX, Unified, NTFS, or Mixed.
• UNIX (NFS clients)
Files and directories in the volume have UNIX permissions.
• Unified
Files and directories in the volume have a unified security style.
• NTFS (CIFS clients)
Files and directories in the volume have Windows NTFS permissions.
• Mixed
Files and directories in the volume can have either UNIX permissions or WindowsNTFS permissions.
UNIX Permission
Displays the UNIX permission bits in an octal string format, which is set for the volumesthat are exported. It is similar to the UNIX style permission bits.
Export Policy
Displays the rules that define the access permission for volumes that are exported. You canclick the link to view details about the rules associated with the export policy such as theauthentication protocols and the access permission.
SMB Shares tab
Displays information about the SMB shares on the selected SVM. You can view information suchas the status of the SMB share, share name, path associated with the SVM, the status of thejunction path of the share, containing object, state of the containing volume, security data of theshare, and export policies defined for the share. You can also determine whether an equivalentNFS path for the SMB share exists.
Note: Shares in folders are not displayed in the SMB Shares tab.
View User Mapping command button
Launches the User Mapping dialog box.
You can view the details of user mapping for the SVM.
Show ACL command button
Launches the Access Control dialog box for the share.
You can view user and permission details for the selected share.
Status
Displays the current status of the share. The status can be Normal ( ) or Error ( ).
Share Name
Displays the name of the SMB share.
Path
Displays the junction path on which the share is created.
262Managing and monitoring clusters and cluster object health

Junction Path Active
Displays whether the path to access the share is active or inactive.
Containing Object
Displays the name of the containing object to which the share belongs. The containingobject can be a volume or a qtree.
By clicking the link, you can view details about the containing object in the respectiveDetails page. If the containing object is a qtree, links are displayed for both qtree andvolume.
Volume State
Displays the state of the volume that is being exported. The state can be Offline, Online,Restricted, or Mixed.
• Offline
Read or write access to the volume is not allowed.
• Online
Read and write access to the volume is allowed.
• Restricted
Limited operations, such as parity reconstruction, are allowed, but data access is notallowed.
• Mixed
The constituents of a FlexGroup volume are not all in the same state.
Security
Displays the access permission for the volumes that are exported. The security style can beUNIX, Unified, NTFS, or Mixed.
• UNIX (NFS clients)
Files and directories in the volume have UNIX permissions.
• Unified
Files and directories in the volume have a unified security style.
• NTFS (CIFS clients)
Files and directories in the volume have Windows NTFS permissions.
• Mixed
Files and directories in the volume can have either UNIX permissions or WindowsNTFS permissions.
Export Policy
Displays the name of the export policy applicable to the share. If an export policy is notspecified for the SVM, the value is displayed as Not Enabled.
You can click the link to view details about the rules associated with the export policy, suchas access protocols and permissions. The link is disabled if the export policy is disabled forthe selected SVM.
NFS Equivalent
Specifies whether there is an NFS equivalent for the share.
SAN tab
Displays details about LUNs, initiator groups, and initiators for the selected SVM. By default, theLUNs view is displayed. You can view details about the initiator groups in the Initiator Groups taband details about initiators in the Initiators tab.
263Managing and monitoring clusters and cluster object health

LUNs tab
Displays details about the LUNs that belong to the selected SVM. You can viewinformation such as the LUN name, LUN state (online or offline), the name of the filesystem (volume or qtree) that contains the LUN, the type of host operating system, the totaldata capacity and serial number of the LUN. The LUN Performance column provides a linkto the LUN/Performance details page.
You can also view information whether thin provisioning is enabled on the LUN and if theLUN is mapped to an initiator group. If it is mapped to an initiator, you can view theinitiator groups and initiators that are mapped to the selected LUN.
Initiator Groups tab
Displays details about initiator groups. You can view details such as the name of theinitiator group, the access state, the type of host operating system that is used by all theinitiators in the group, and the supported protocol. When you click the link in the accessstate column, you can view the current access state of the initiator group.
Normal
The initiator group is connected to multiple access paths.
Single Path
The initiator group is connected to a single access path.
No Paths
There is no access path connected to the initiator group.
You can view whether initiator groups are mapped to all the interfaces or specific interfacesthrough a port set. When you click the count link in the Mapped interfaces column, eitherall interfaces are displayed or specific interfaces for a port set are displayed. Interfaces thatare mapped through the target portal are not displayed. The total number of initiators andLUNs that are mapped to an initiator group is displayed.
You can also view the LUNs and initiators that are mapped to the selected initiator group.
Initiators tab
Displays the name and type of the initiator and the total number of initiator groups mappedto this initiator for the selected SVM.
You can also view the LUNs and initiator groups that are mapped to the selected initiatorgroup.
Related Annotations pane
The Related Annotations pane enables you to view the annotation details associated with theselected SVM. Details include the annotation name and the annotation values that are applied tothe SVM. You can also remove manual annotations from the Related Annotations pane.
Related Devices pane
The Related Devices pane enables you to view the cluster, aggregates, and volumes that are relatedto the SVM:
Cluster
Displays the health status of the cluster to which the SVM belongs.
Aggregates
Displays the number of aggregates that belong to the selected SVM. The health status of theaggregates is also displayed, based on the highest severity level. For example, if an SVMcontains ten aggregates, five of which display the Warning status and the remaining fivedisplay the Critical status, then the status displayed is Critical.
264Managing and monitoring clusters and cluster object health
Assigned Aggregates
Displays the number of aggregates that are assigned to an SVM. The health status of theaggregates is also displayed, based on the highest severity level.
Volumes
Displays the number and capacity of the volumes that belong to the selected SVM. Thehealth status of the volumes is also displayed, based on the highest severity level. Whenthere are FlexGroup volumes in the SVM, the count also includes FlexGroups; it does notinclude FlexGroup constituents.
Related Groups pane
The Related Groups pane enables you to view the list of groups associated with the selected SVM.
Related Alerts pane
The Related Alerts pane enables you to view the list of alerts that are created for the selectedSVM. You can also add an alert by clicking the Add Alert link or edit an existing alert by clickingthe alert name.
Related tasksAdding alerts on page 119
You can configure alerts to notify you when a particular event is generated. You can configurealerts for a single resource, for a group of resources, or for events of a particular severity type. Youcan specify the frequency with which you want to be notified and associate a script to the alert.
Related referenceExport Policy Rules dialog box on page 292
The Export Policy Rules dialog box displays details about the export policies, authenticationprotocols, and access enabled on the volumes that belong to the storage virtual machine (SVM).You can use the filters to customize the display of information in the export policy rules list. Bydefault, the information is sorted based on the index column.
Storage Pool dialog boxThe Storage Pool dialog box enables you to view the details of the dedicated cache of SSDs, alsoknown as storage pools. You can monitor the storage pools and view details such as the storagepool health, total and available cache, and used and available allocations in the storage pool.
You can view the following storage pool details:
Status
Displays the status of the storage pool, which can be healthy or unhealthy.
Total Allocations
Displays the total allocation units and the size in the storage pool.
Allocation Unit Size
Displays the minimum amount of space in the storage pool that can be allocated to anaggregate.
Disks
Displays the number of disks used to create the storage pool. If the disk count in the storagepool column and the number of disks displayed in the Disk Information tab for that storagepool do not match, then it indicates that one or more disks are broken and the storage poolis unhealthy.
Cache Allocations
• Used Allocations
265Managing and monitoring clusters and cluster object health

Displays the number and size of the allocation units used by the aggregates. You canclick the aggregate name to view the aggregate details.
• Available Allocations
Displays the number and size of the allocation units available for the nodes. You canclick the node name to view the aggregate details.
Health: All Volumes viewThe Health: All Volumes view displays information about the volumes in the storage systems thatare monitored and enables you to modify the volume threshold settings.
By default, objects in the view pages are sorted based on event criticality. Objects with criticalevents are listed first, and objects with warning events are listed second. This provides animmediate visual indication of issues that must be addressed.
The controls along the top of the page enable you to select a particular view (for health,performance, capacity, and so on), perform searches to locate specific objects, create and applyfilters to narrow the list of displayed data, add/remove/reorder columns on the page, and export thedata on the page to a .csv, .pdf, or .xlsx file. After you have customized the page, you cansave the results as a custom view and then schedule a report of this data to be generated andemailed on a regular basis.
If you want to analyze the latency and throughput of a specific object, click the more icon ,then Analyze Workload and you can view performance and capacity charts on the WorkloadAnalysis page.
See Volume health fields for descriptions of all the fields on this page.
Command buttons
Edit Threshold
Displays the Edit Thresholds dialog box, which enables you to edit the health thresholdsettings for one or more volumes.
Protect
Displays the following submenus:
• SnapMirror
Enables you to create a SnapMirror relationship for the selected volumes.
• SnapVault
Enables you to create a SnapVault relationship for the selected volumes.
Restore
Displays the Restore dialog box, which enables you to restore directories or files from onevolume at a time.
Annotate
Enables you to annotate the selected volume.
Related tasksEditing individual volume health threshold settings on page 138
You can edit the health threshold settings for volume capacity, growth, quota, and space reserve ofone or more volumes. When a threshold is crossed, alerts are generated and you receivenotifications. These notifications help you to take preventive measures based on the eventgenerated.
Exporting storage data as reports on page 27You can export storage data in a variety of output formats and then use the exported data to buildreports. For example, if there are 10 critical events that have not been resolved, you can export the
266Managing and monitoring clusters and cluster object health

data from the Event Management inventory page to create a report, and then send the report toadmins who can resolve the issues.
Scheduling a report on page 332After you have a view or Excel file that you want to schedule for regular generation anddistribution, you can schedule the report.
Volume health fieldsThe following fields are available in the Health: All Volumes view and can be used in customviews and in reports.
Status
The current status of a volume. The status can be Critical ( ), Error ( ), Warning
( ), or Normal ( ).
Volume
The name of the volume.
Storage VM
The SVM that contains the volume.
State
The current state of the volume:
• Offline
Read or write access to the volume is not allowed.
• Online
Read and write access to the volume is allowed.
• Restricted
Limited operations, such as parity reconstruction, are allowed, but data access is notallowed.
• Mixed
The constituents of a FlexGroup volume are not all in the same state.
Protection Role
The protection role of a volume:
• Unprotected
A read/write volume with no outgoing or incoming SnapMirror or SnapVaultrelationships
• Protected
A read/write volume with an outgoing SnapMirror or SnapVault relationship
• Destination
A data protection (DP) volume or read/write volume with an incoming SnapMirror orSnapVault relationship
• Not Applicable
A volume for which protection roles do not apply, such as a load sharing volume, dataconstituent, or temporary volume
Clicking the role displays the Protection tab of the Volume / Health details page.
Style
The style of volume; FlexVol or FlexGroup.
267Managing and monitoring clusters and cluster object health
Mount Path
The path to which the volume is mounted.
Available Data %
The percentage of physical space currently available for data in the volume.
Available Data Capacity
The amount of physical space currently available for data in the volume.
Used Data %
The percentage of physical space used by data in the volume based on the total availabledata capacity.
Used Data Capacity
The amount of physical space used by data in the volume.
Total Data Capacity
The total physical space available for data in the volume.
Logical Space Reporting
Whether the volume has logical space reporting configured. The value can be Enabled,Disabled, or Not applicable.
Logical space indicates the real size of the data that is being stored on the volume withoutapplying the savings from using ONTAP storage efficiency technologies.
Logical Space Used %
The percentage of logical space used by data in the volume based on the total available datacapacity.
Logical Space Used
The logical space used by data in the volume.
Move Status
The current status of the volume move operation. The status can be In Progress, Paused,Failed, or Completed.
Type
The volume type. The volume type can be Read-write or Data-protection, Load-sharing, orData-cache.
Thin Provisioned
Whether space guarantee is set for the selected volume. Valid values are Yes and No.
Deduplication
Whether deduplication is enabled on the volume. The column displays either Enabled orDisabled.
Compression
Whether compression is enabled on the volume. The column displays either Enabled orDisabled.
In Transition
Whether the volume has completed transition or not.
SnapLock Type
The SnapLock Type of the aggregate that contains the volume. The available options areCompliance, Enterprise, Non-SnapLock.
268Managing and monitoring clusters and cluster object health

Local Snapshot Policy
The local Snapshot copy policies for the volumes listed. The default policy name is Default.
Tiering Policy
The tiering policy set on the volume. The policy takes affect only when the volume isdeployed on a FabricPool aggregate:
• None - The data for this volume always remains on the performance tier.
• Snapshot-Only - Only Snapshot data is moved automatically to the cloud tier. All otherdata remains on the performance tier.
• Backup - On data protection volumes, all transferred user data starts in the cloud tier,but later client reads can cause hot data to move to the performance tier.
• Auto - Data on this volume is moved between the performance tier and the cloud tierautomatically when ONTAP determines that the data is "hot" or "cold".
• All - The data for this volume always remains on the cloud tier.
Caching Policy
The caching policy that is associated with the selected volume. The policy providesinformation about how the Flash Pool caching occurs for the volume.
Cache policy Description
Auto Read caches all the metadata blocks and randomly read user data blocks,and write caches all the randomly overwritten user data blocks.
None Does not cache any user data or metadata blocks.
All Read caches all the user data blocks that are read and written. The policydoes not perform any write caching.
All-Random Write This policy is a combination of the All and No Read-Random Writepolicies and performs the following actions:
• Read caches all the user data blocks that are read and written.
• Write caches all the randomly overwritten user data blocks.
All Read Read caches all the metadata, randomly read, and sequentially read userdata blocks.
All Read-Random Write This policy is a combination of the All Read and No Read-Random Writepolicies and performs the following actions:
• Read caches all the metadata, randomly read, and sequentially readuser data blocks.
• Write caches all the randomly overwritten user data blocks.
All Read Random Write Read caches all the metadata, randomly read, sequentially read, andrandomly written user data blocks.
All Read Random Write-RandomWrite
This policy is a combination of the All Read Random Write and No Read-Random Write policies and does the following:
• Read caches all the metadata, randomly read, and sequentially read,and randomly written user data blocks.
• Write caches all the randomly overwritten user data blocks.
Meta Read caches only metadata blocks.
269Managing and monitoring clusters and cluster object health
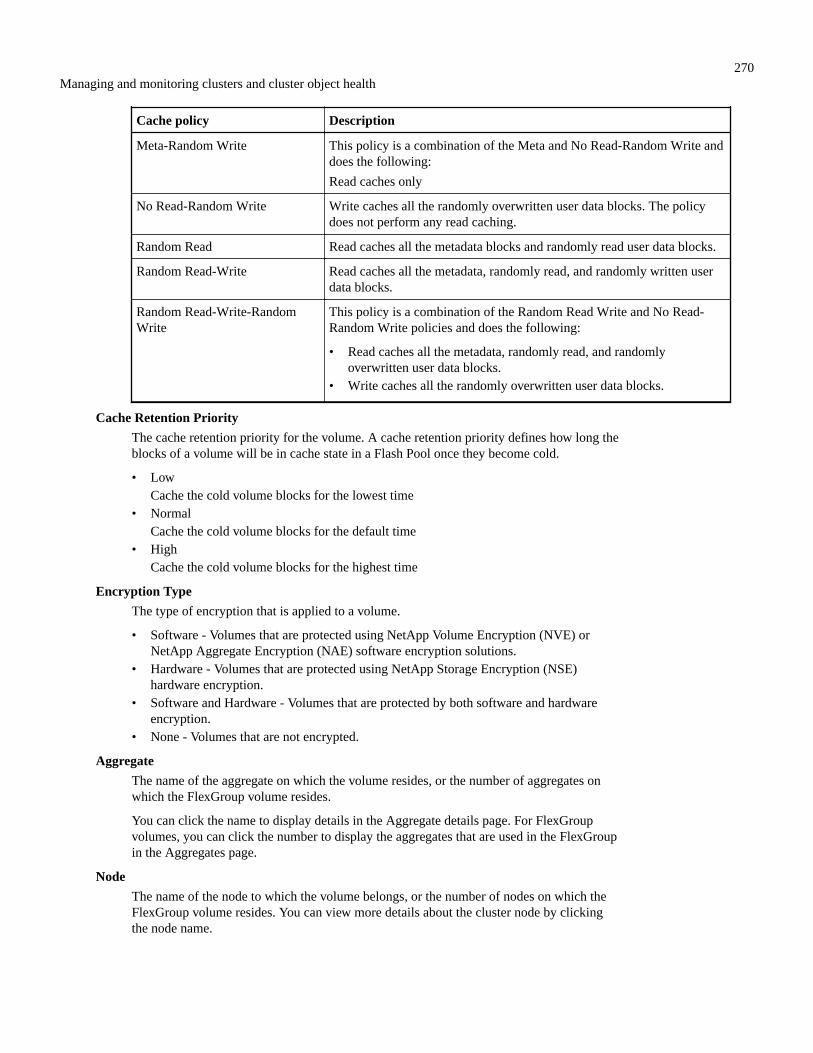
Cache policy Description
Meta-Random Write This policy is a combination of the Meta and No Read-Random Write anddoes the following:
Read caches only
No Read-Random Write Write caches all the randomly overwritten user data blocks. The policydoes not perform any read caching.
Random Read Read caches all the metadata blocks and randomly read user data blocks.
Random Read-Write Read caches all the metadata, randomly read, and randomly written userdata blocks.
Random Read-Write-RandomWrite
This policy is a combination of the Random Read Write and No Read-Random Write policies and does the following:
• Read caches all the metadata, randomly read, and randomlyoverwritten user data blocks.
• Write caches all the randomly overwritten user data blocks.
Cache Retention Priority
The cache retention priority for the volume. A cache retention priority defines how long theblocks of a volume will be in cache state in a Flash Pool once they become cold.
• Low
Cache the cold volume blocks for the lowest time
• Normal
Cache the cold volume blocks for the default time
• High
Cache the cold volume blocks for the highest time
Encryption Type
The type of encryption that is applied to a volume.
• Software - Volumes that are protected using NetApp Volume Encryption (NVE) orNetApp Aggregate Encryption (NAE) software encryption solutions.
• Hardware - Volumes that are protected using NetApp Storage Encryption (NSE)hardware encryption.
• Software and Hardware - Volumes that are protected by both software and hardwareencryption.
• None - Volumes that are not encrypted.
Aggregate
The name of the aggregate on which the volume resides, or the number of aggregates onwhich the FlexGroup volume resides.
You can click the name to display details in the Aggregate details page. For FlexGroupvolumes, you can click the number to display the aggregates that are used in the FlexGroupin the Aggregates page.
Node
The name of the node to which the volume belongs, or the number of nodes on which theFlexGroup volume resides. You can view more details about the cluster node by clickingthe node name.
270Managing and monitoring clusters and cluster object health

You can click the node name to display details in the Node details page. For FlexGroupvolumes, you can click the number to display the nodes that are used in the FlexGroup inthe Nodes page.
Cluster
The cluster that contains the destination volume. You can view more details about thecluster by clicking the cluster name.
Cluster FQDN
The fully qualified domain name (FQDN) of the cluster.
Capacity: All Volumes viewThe Capacity: All Volumes view enables you to view information about the capacity andutilization of volumes in a cluster. This information enables you to understand possible capacityrisks and to view the configured, used, and unused capacity of volumes. Also, the informationhelps you to make decisions about enabling space-saving features such as deduplication and thinprovisioning.
The controls along the top of the page enable you to select a particular view (for health,performance, capacity, and so on), perform searches to locate specific objects, create and applyfilters to narrow the list of displayed data, add/remove/reorder columns on the page, and export thedata on the page to a .csv, .pdf, or .xlsx file. After you have customized the page, you cansave the results as a custom view and then schedule a report of this data to be generated andemailed on a regular basis.
If you want to analyze the latency and throughput of a specific object, click the more icon ,then Analyze Workload and you can view performance and capacity charts on the WorkloadAnalysis page.
See Volume capacity fields for descriptions of all the fields on this page.
Related tasksViewing the volume list and details on page 216
From the Health: All Volumes view, you can monitor your inventory of volumes. The Capacity:All Volumes view enables you to view information about the capacity and utilization of volumesin a cluster.
Exporting storage data as reports on page 27You can export storage data in a variety of output formats and then use the exported data to buildreports. For example, if there are 10 critical events that have not been resolved, you can export thedata from the Event Management inventory page to create a report, and then send the report toadmins who can resolve the issues.
Scheduling a report on page 332After you have a view or Excel file that you want to schedule for regular generation anddistribution, you can schedule the report.
Editing individual volume health threshold settings on page 138You can edit the health threshold settings for volume capacity, growth, quota, and space reserve ofone or more volumes. When a threshold is crossed, alerts are generated and you receive
271Managing and monitoring clusters and cluster object health

notifications. These notifications help you to take preventive measures based on the eventgenerated.
Volume capacity fieldsThe following fields are available in the Capacity: All Volumes view and can be used in customviews and in reports.
Volume
The volume name.
Daily Growth Rate %
The growth rate that occurs every 24 hours in the volume.
Days To Full
The estimated number of days remaining before the volume reaches full capacity.
Available Data %
The available data capacity in a volume as a percentage.
Available Data Capacity
The available data capacity in a volume.
Used Data %
The used data in a volume as a percentage.
Used Data Capacity
The used data capacity in a volume.
Total Data Capacity
The total data capacity (used plus available) in a volume.
Logical Space Used
The logical space used by data in this volume without applying the savings from usingONTAP storage efficiency technologies.
Snapshot Overflow %
The percentage of the data space that is consumed by Snapshot copies.
Snapshot Reserve Available %
The amount of space available for Snapshot copies in the volume as a percentage.
Snapshot Reserve Available Capacity
The amount of space available for Snapshot copies in the volume.
Snapshot Reserve Used %
The amount of space used by Snapshot copies in the volume as a percentage.
Snapshot Reserve Used Capacity
The amount of space used by Snapshot copies in the volume.
Snapshot Reserve Total Capacity
Displays the total Snapshot copy capacity in the volume.
Quota Committed Capacity
The space reserved for quotas in the volume.
Quota Overcommitted Capacity
The amount of space that can be used for quotas before the system generates the VolumeQuota Overcommitted event.
272Managing and monitoring clusters and cluster object health

Total Number Of Inodes
The number of inodes in the volume.
Inode Utilization %
The percentage of inode space used in the volume.
Thin Provisioned
Whether space guarantee is set for the selected volume. Valid values are Yes and No.
Space Guarantee
The storage guarantee option that is associated with the volume.
Autogrow
Whether the volume automatically grows in size when it is out of space.
Snapshot Autodelete
Whether automatic deletion of Snapshot copies is enabled or disabled.
Deduplication
Whether deduplication is enabled or disabled for the volume.
Deduplication Space Savings
The amount of space saved in a volume by using deduplication.
Compression
Whether compression is enabled or disabled for the volume.
Compression Space Savings
The amount of space saved in a volume by using compression.
State
The state of the volume that is being exported.
Protection Role
The protection role that is set for the volume.
SnapLock Type
Whether the volume is a SnapLock or non-SnapLock volume.
SnapLock Expiry Date
The SnapLock expiration date.
Tiering Policy
The tiering policy set for the volume. Valid when deployed on FabricPool-enabledaggregates only.
Caching Policy
The caching policy that is associated with the selected volume.
The policy provides information about how Flash Pool caching occurs for the volume. Seethe Health: All Volumes view for more information on caching policies.
Cache Retention Priority
The priority used for retaining cached pools.
Storage VM
The name of the storage virtual machine (SVM) that contains the volume.
273Managing and monitoring clusters and cluster object health

Cluster
The name of the cluster on which the volume resides. You can click the cluster name tonavigate to that cluster's health details page.
Cluster FQDN
The fully qualified domain name (FQDN) of the cluster.
Volume / Health details pageYou can use the Volume / Health details page to view detailed information about a selectedvolume, such as capacity, storage efficiency, configuration, protection, annotation, and eventsgenerated. You can also view information about the related objects and related alerts for thatvolume.
You must have the Application Administrator or Storage Administrator role.
• Command buttons• Capacity tab• Configuration tab• Protection tab• History area• Events list• Related Annotations pane• Related Devices pane• Related Groups pane• Related Alerts pane
Command buttons
The command buttons enable you to perform the following tasks for the selected volume:
Switch to Performance View
Enables you to navigate to the Volume / Performance details page.
Actions
• Add Alert
Enables you to add an alert to the selected volume.
• Edit Thresholds
Enables you to modify the threshold settings for the selected volume.
• Annotate
Enables you to annotate the selected volume.
• Protect
Enables you to create either SnapMirror or SnapVault relationships for the selectedvolume.
• Relationship
Enables you to execute the following protection relationship operations:
◦ Edit
Launches the Edit Relationship dialog box which enables you to change existingSnapMirror policies, schedules, and maximum transfer rates for an existingprotection relationship.
◦ Abort
Aborts transfers that are in progress for a selected relationship. Optionally, it enablesyou to remove the restart checkpoint for transfers other than the baseline transfer.You cannot remove the checkpoint for a baseline transfer.
274Managing and monitoring clusters and cluster object health

◦ QuiesceTemporarily disables scheduled updates for a selected relationship. Transfers that arealready in progress must complete before the relationship is quiesced.
◦ BreakBreaks the relationship between the source and destination volumes and changes thedestination to a read-write volume.
◦ RemovePermanently deletes the relationship between the selected source and destination.The volumes are not destroyed and the Snapshot copies on the volumes are notremoved. This operation cannot be undone.
◦ ResumeEnables scheduled transfers for a quiesced relationship. At the next scheduledtransfer interval, a restart checkpoint is used, if one exists.
◦ ResynchronizeEnables you to resynchronize a previously broken relationship.
◦ Initialize/UpdateEnables you to perform a first-time baseline transfer on a new protectionrelationship, or to perform a manual update if the relationship is already initialized.
◦ Reverse ResyncEnables you to reestablish a previously broken protection relationship, reversing thefunction of the source and destination by making the source a copy of the originaldestination. The contents on the source are overwritten by the contents on thedestination, and any data that is newer than the data on the common Snapshot copyis deleted.
• RestoreEnables you to restore data from one volume to another volume.
Note: The Restore button and the Relationship operation buttons are not available forvolumes that are in synchronous protection relationships.
View Volumes
Enables you to navigate to the Health: All Volumes view.
Capacity tab
The Capacity tab displays details about the selected volume, such as its physical capacity, logicalcapacity, threshold settings, quota capacity, and information about any volume move operation:
Capacity Physical
Details the physical capacity of the volume:
• Snapshot OverflowDisplays the data space that is consumed by the Snapshot copies.
• UsedDisplays the space used by data in the volume.
• WarningIndicates that the space in the volume is nearly full. If this threshold is breached, theSpace Nearly Full event is generated.
• ErrorIndicates that the space in the volume is full. If this threshold is breached, the Space Fullevent is generated.
• UnusableIndicates that the Thin-Provisioned Volume Space At Risk event is generated and thatthe space in the thinly provisioned volume is at risk because of aggregate capacityissues. The unusable capacity is displayed only for thinly provisioned volumes.
275Managing and monitoring clusters and cluster object health

• Data graph
Displays the total data capacity and the used data capacity of the volume.
If autogrow is enabled, the data graph also displays the space available in the aggregate.The data graph displays the effective storage space that can be used by data in thevolume, which can be one of the following:
◦ Actual data capacity of the volume for the following conditions:
⁃ Autogrow is disabled.
⁃ Autogrow-enabled volume has reached the maximum size.
⁃ Autogrow-enabled thickly provisioned volume cannot grow further.
◦ Data capacity of the volume after considering the maximum volume size (for thinlyprovisioned volumes and for thickly provisioned volumes when the aggregate hasspace for the volume to reach maximum size)
◦ Data capacity of the volume after considering the next possible autogrow size (forthickly provisioned volumes that have an autogrow percentage threshold)
• Snapshot copies graph
This graph is displayed only when the used Snapshot capacity or the Snapshot reserve isnot zero.
Both the graphs display the capacity by which the Snapshot capacity exceeds the Snapshotreserve if the used Snapshot capacity exceeds the Snapshot reserve.
Capacity Logical
Displays the logical space characteristics of the volume. The logical space indicates the realsize of the data that is being stored on disk without applying the savings from using ONTAPstorage efficiency technologies.
• Logical Space Reporting
Displays if the volume has logical space reporting configured. The value can beEnabled, Disabled, or Not applicable. "Not applicable" is displayed for volumes onolder versions of ONTAP or on volumes that do not support logical space reporting.
• Used
Displays the amount of logical space that is being used by data in the volume, and thepercentage of logical space used based on the total data capacity.
• Logical Space Enforcement
Displays whether logical space enforcement is configured for thinly provisionedvolumes. When set to Enabled, the logical used size of the volume cannot be greaterthan the currently set physical volume size.
Autogrow
Displays whether the volume automatically grows when it is out of space.
Space Guarantee
Displays the FlexVol volume setting control when a volume removes free blocks from anaggregate. These blocks are then guaranteed to be available for writes to files in the volume.The space guarantee can be set to one of the following:
• None
No space guarantee is configured for the volume.
• File
Full size of sparsely written files (for example, LUNs) is guaranteed.
• Volume
Full size of the volume is guaranteed.
• Partial
276Managing and monitoring clusters and cluster object health

The FlexCache volume reserves space based on its size. If the FlexCache volume’s sizeis 100 MB or more, the minimum space guarantee is set to 100 MB by default. If theFlexCache volume’s size is less than 100 MB, the minimum space guarantee is set to theFlexCache volume’s size. If the FlexCache volume’s size is grown later, the minimumspace guarantee is not incremented.
Note: The space guarantee is Partial when the volume is of type Data-Cache.
Details (Physical)
Displays the physical characteristics of the volume.
Total Capacity
Displays the total physical capacity in the volume.
Data Capacity
Displays the amount of physical space used by the volume (used capacity) and the amountof physical space that is still available (free capacity) in the volume. These values are alsodisplayed as a percentage of the total physical capacity.
When the Thin-Provisioned Volume Space At Risk event is generated for thinly provisionedvolumes, the amount of space used by the volume (used capacity) and the amount of spacethat is available in the volume but cannot be used (unusable capacity) because of aggregatecapacity issues is displayed.
Snapshot Reserve
Displays the amount of space used by the Snapshot copies (used capacity) and amount ofspace available for Snapshot copies (free capacity) in the volume. These values are alsodisplayed as a percentage of the total snapshot reserve.
When the Thin-Provisioned Volume Space At Risk event is generated for thinly provisionedvolumes, the amount of space used by the Snapshot copies (used capacity) and the amountof space that is available in the volume but cannot be used for making Snapshot copies(unusable capacity) because of aggregate capacity issues is displayed.
Volume Thresholds
Displays the following volume capacity thresholds:
• Nearly Full Threshold
Specifies the percentage at which a volume is nearly full.
• Full Threshold
Specifies the percentage at which a volume is full.
Other Details
• Autogrow Max Size
Displays the maximum size up to which the volume can automatically grow. The defaultvalue is 120% of the volume size on creation. This field is displayed only whenautogrow is enabled for the volume.
• Qtree Quota Committed Capacity
Displays the space reserved in the quotas.
• Qtree Quota Overcommitted Capacity
Displays the amount of space that can be used before the system generates the VolumeQtree Quota Overcommitted event.
• Fractional Reserve
Controls the size of the overwrite reserve. By default, the fractional reserve is set to 100,indicating that 100 percent of the required reserved space is reserved so that the objectsare fully protected for overwrites. If the fractional reserve is less than 100 percent, the
277Managing and monitoring clusters and cluster object health

reserved space for all the space-reserved files in that volume is reduced to the fractionalreserve percentage.
• Snapshot Daily Growth RateDisplays the change (in percentage, or in KB, MB, GB, and so on) that occurs every 24hours in the Snapshot copies in the selected volume.
• Snapshot Days to FullDisplays the estimated number of days remaining before the space reserved for theSnapshot copies in the volume reaches the specified threshold.The Snapshot Days to Full field displays a Not Applicable value when the growth rateof the Snapshot copies in the volume is zero or negative, or when there is insufficientdata to calculate the growth rate.
• Snapshot AutodeleteSpecifies whether Snapshot copies are automatically deleted to free space when a writeto a volume fails because of lack of space in the aggregate.
• Snapshot CopiesDisplays information about the Snapshot copies in the volume.The number of Snapshot copies in the volume is displayed as a link. Clicking the linkopens the Snapshot Copies on a Volume dialog box, which displays details of theSnapshot copies.The Snapshot copy count is updated approximately every hour; however, the list ofSnapshot copies is updated at the time that you click the icon. This might result in adifference between the Snapshot copy count displayed in the topology and the numberof Snapshot copies listed when you click the icon.
Volume Move
Displays the status of either the current or the last volume move operation that wasperformed on the volume, and other details, such as the current phase of the volume moveoperation which is in progress, source aggregate, destination aggregate, start time, end time,and estimated end time.
Also displays the number of volume move operations that are performed on the selectedvolume. You can view more information about the volume move operations by clicking theVolume Move History link.
Configuration tab
The Configuration tab displays details about the selected volume, such as the export policy, RAIDtype, capacity and storage efficiency related features of the volume:
Overview
• Full NameDisplays the full name of the volume.
• AggregatesDisplays the name of the aggregate on which the volume resides, or the number ofaggregates on which the FlexGroup volume resides.
• Tiering PolicyDisplays the tiering policy set for the volume; if the volume is deployed on aFabricPool-enabled aggregate. The policy can be None, Snapshot Only, Backup, Auto,or All.
• Storage VMDisplays the name of the SVM that contains the volume.
• Junction PathDisplays the status of the path, which can be active or inactive. The path in the SVM towhich the volume is mounted is also displayed. You can click the History link to viewthe most recent five changes to the junction path.
278Managing and monitoring clusters and cluster object health

• Export PolicyDisplays the name of the export policy that is created for the volume. You can click thelink to view details about the export policies, authentication protocols, and accessenabled on the volumes that belong to the SVM.
• StyleDisplays the volume style. The volume style can be FlexVol or FlexGroup.
• TypeDisplays the type of the selected volume. The volume type can be Read-write, Load-sharing, Data-Protection, Data-cache, or Temporary.
• RAID TypeDisplays the RAID type of the selected volume. The RAID type can be RAID0, RAID4,RAID-DP, or RAID-TEC.
Note: Multiple RAID types may display for FlexGroup volumes because theconstituent volumes for FlexGroups can be on aggregates of different types.
• SnapLock TypeDisplays the SnapLock Type of the aggregate that contains the volume.
• SnapLock ExpiryDisplays the expiry date of SnapLock volume.
Capacity
• Thin ProvisioningDisplays whether thin provisioning is configured for the volume.
• AutogrowDisplays whether the flexible volume grows automatically within an aggregate.
• Snapshot AutodeleteSpecifies whether Snapshot copies are automatically deleted to free space when a writeto a volume fails because of lack of space in the aggregate.
• QuotasSpecifies whether the quotas are enabled for the volume.
Efficiency
• CompressionSpecifies whether compression is enabled or disabled.
• DeduplicationSpecifies whether deduplication is enabled or disabled.
• Deduplication ModeSpecifies whether the deduplication operation enabled on a volume is a manual,scheduled, or policy-based operation. If the mode is set to Scheduled, the operationschedule is displayed, and if the mode is set to a policy, the policy name is displayed.
• Deduplication TypeSpecifies the type of deduplication operation running on the volume. If the volume is ina SnapVault relationship, the type displayed is SnapVault. For any other volume, thetype is displayed as Regular.
• Storage Efficiency PolicySpecifies the name of the storage efficiency policy that has been assigned throughUnified Manager to this volume. This policy can control the compression anddeduplication settings.
Protection
• Snapshot CopiesSpecifies whether automatic Snapshot copies are enabled or disabled.
279Managing and monitoring clusters and cluster object health

Protection tab
The Protection tab displays protection details about the selected volume, such as lag information,relationship type, and topology of the relationship.
Summary
Displays SnapMirror and SnapVault relationships properties for a selected volume. For anyother relationship type, only the Relationship Type property is displayed. If a primaryvolume is selected, only the Managed and Local Snapshot copy Policy are displayed.Properties displayed for SnapMirror and SnapVault relationships include the following:
• Source VolumeDisplays the name of the selected volume's source if the selected volume is adestination.
• Lag StatusDisplays the update or transfer lag status for a protection relationship. The status can beError, Warning, or Critical.The lag status is not applicable for synchronous relationships.
• Lag DurationDisplays the time by which the data on the mirror lags behind the source.
• Last Successful UpdateDisplays the date and time of the most recent successful protection update.The last successful update is not applicable for synchronous relationships.
• Storage Service MemberDisplays either Yes or No to indicate whether or not the volume belongs to and ismanaged by a storage service.
• Version Flexible ReplicationDisplays either Yes, Yes with backup option, or None. Yes indicates that SnapMirrorreplication is possible even if source and destination volumes are running differentversions of ONTAP software. Yes with backup option indicates the implementation ofSnapMirror protection with the ability to retain multiple versions of backup copies onthe destination. None indicates that Version Flexible Replication is not enabled.
• Relationship CapabilityIndicates the ONTAP capabilities available to the protection relationship.
• Protection ServiceDisplays the name of the protection service if the relationship is managed by aprotection partner application.
• Relationship TypeDisplays any relationship type, including Asynchronous Mirror, Asynchronous Vault,Asynchronous MirrorVault, StrictSync, and Sync.
• Relationship StateDisplays the state of the SnapMirror or SnapVault relationship. The state can beUninitialized, SnapMirrored, or Broken-Off. If a source volume is selected, therelationship state is not applicable and is not displayed.
• Transfer StatusDisplays the transfer status for the protection relationship. The transfer status can be oneof the following:
◦ AbortingSnapMirror transfers are enabled; however, a transfer abort operation that mightinclude removal of the checkpoint is in progress.
◦ CheckingThe destination volume is undergoing a diagnostic check and no transfer is inprogress.
280Managing and monitoring clusters and cluster object health

◦ FinalizingSnapMirror transfers are enabled. The volume is currently in the post-transfer phasefor incremental SnapVault transfers.
◦ IdleTransfers are enabled and no transfer is in progress.
◦ In-SyncThe data in the two volumes in the synchronous relationship are synchronized.
◦ Out-of-SyncThe data in the destination volume is not synchronized with the source volume.
◦ PreparingSnapMirror transfers are enabled. The volume is currently in the pre-transfer phasefor incremental SnapVault transfers.
◦ QueuedSnapMirror transfers are enabled. No transfers are in progress.
◦ QuiescedSnapMirror transfers are disabled. No transfer is in progress.
◦ QuiescingA SnapMirror transfer is in progress. Additional transfers are disabled.
◦ TransferringSnapMirror transfers are enabled and a transfer is in progress.
◦ TransitioningThe asynchronous transfer of data from the source to the destination volume iscomplete, and the transition to synchronous operation has started.
◦ WaitingA SnapMirror transfer has been initiated, but some associated tasks are waiting to bequeued.
• Max Transfer RateDisplays the maximum transfer rate for the relationship. The maximum transfer rate canbe a numerical value in either kilobytes per second (Kbps), Megabytes per second(Mbps), Gigabytes per second (Gbps), or Terabytes per second (Tbps). If No Limit isdisplayed, the baseline transfer between relationships is unlimited.
• SnapMirror PolicyDisplays the protection policy for the volume. DPDefault indicates the defaultAsynchronous Mirror protection policy, XDPDefault indicates the default AsynchronousVault policy, and DPSyncDefault indicates the default Asynchronous MirrorVaultpolicy. StrictSync indicates the default Synchronous Strict protection policy, and Syncindicates the default Synchronous policy. You can click the policy name to view detailsassociated with that policy, including the following information:
◦ Transfer priority
◦ Ignore access time setting
◦ Tries limit
◦ Comments
◦ SnapMirror labels
◦ Retention settings
◦ Actual Snapshot copies
◦ Preserve Snapshot copies
◦ Retention warning threshold
◦ Snapshot copies with no retention settings
In a cascading SnapVault relationship where the source is a data protection (DP)volume, only the rule "sm_created" applies.
281Managing and monitoring clusters and cluster object health

• Update Schedule
Displays the SnapMirror schedule assigned to the relationship. Positioning your cursorover the information icon displays the schedule details.
• Local Snapshot Policy
Displays the Snapshot copy policy for the volume. The policy is Default, None, or anyname given to a custom policy.
Views
Displays the protection topology of the selected volume. The topology includes graphicalrepresentations of all volumes that are related to the selected volume. The selected volumeis indicated by a dark gray border, and lines between volumes in the topology indicate theprotection relationship type. The direction of the relationships in the topology are displayedfrom left to right, with the source of each relationship on the left and the destination on theright.
Double bold lines specify an Asynchronous Mirror relationship, a single bold line specifiesan Asynchronous Vault relationship, double single lines specify an AsynchronousMirrorVault relationship, and a bold line and non-bold line specifies a Synchronousrelationship. The table below indicates if the Synchronous relationship is StrictSync orSync.
Right-clicking a volume displays a menu from which you can choose either to protect thevolume or restore data to it. Right-clicking a relationship displays a menu from which youcan choose to either edit, abort, quiesce, break, remove, or resume a relationship.
The menus will not display in the following instances:
• If RBAC settings do not allow this action, for example, if you have only operatorprivileges
• If the volume is in a synchronous protection relationship
• When the volume ID is unknown, for example, when you have an interclusterrelationship and the destination cluster has not yet been discovered
Clicking another volume in the topology selects and displays information for that volume.
A question mark ( ) in the upper-left corner of a volume indicates that either the volumeis missing or that it has not yet been discovered. It might also indicate that the capacityinformation is missing. Positioning your cursor over the question mark displays additionalinformation, including suggestions for remedial action.
The topology displays information about volume capacity, lag, Snapshot copies, and lastsuccessful data transfer if it conforms to one of several common topology templates. If atopology does not conform to one of those templates, information about volume lag and lastsuccessful data transfer is displayed in a relationship table under the topology. In that case,the highlighted row in the table indicates the selected volume, and, in the topology view,bold lines with a blue dot indicate the relationship between the selected volume and itssource volume.
Topology views include the following information:
• Capacity
Displays the total amount of capacity used by the volume. Positioning your cursor overa volume in the topology displays the current warning and critical threshold settings forthat volume in the Current Threshold Settings dialog box. You can also edit thethreshold settings by clicking the Edit Thresholds link in the Current ThresholdSettings dialog box. Clearing the Capacity check box hides all capacity information forall volumes in the topology.
• Lag
282Managing and monitoring clusters and cluster object health

Displays the lag duration and the lag status of the incoming protection relationships.Clearing the Lag check box hides all lag information for all volumes in the topology.When the Lag check box is dimmed, then the lag information for the selected volume isdisplayed in the relationship table below the topology, as well as the lag information forall related volumes.
• Snapshot
Displays the number of Snapshot copies available for a volume. Clearing the Snapshotcheck box hides all Snapshot copy information for all volumes in the topology. Clicking
a Snapshot copy icon ( ) displays the Snapshot copy list for a volume. TheSnapshot copy count displayed next to the icon is updated approximately every hour;however, the list of Snapshot copies is updated at the time that you click the icon. Thismight result in a difference between the Snapshot copy count displayed in the topologyand the number of Snapshot copies listed when you click the icon.
• Last Successful Transfer
Displays the amount, duration, time, and date of the last successful data transfer. Whenthe Last Successful Transfer check box is dimmed, then the last successful transferinformation for the selected volume is displayed in the relationship table below thetopology, as well as the last successful transfer information for all related volumes.
History
Displays in a graph the history of incoming SnapMirror and SnapVault protectionrelationships for the selected volume. There are three history graphs available: incomingrelationship lag duration, incoming relationship transfer duration, and incoming relationshiptransferred size. History information is displayed only when you select a destinationvolume. If you select a primary volume, the graphs are empty, and the message No datafound is displayed.
You can select a graph type from the drop-down list at the top of the History pane. You canalso view details for a specific time period by selecting either 1 week, 1 month, or 1 year.History graphs can help you identify trends: for example, if large amounts of data are beingtransferred at the same time of the day or week, or if the lag warning or lag error thresholdis consistently being breached, you can take the appropriate action. Additionally, you canclick the Export button to create a report in CSV format for the chart that you are viewing.
Protection history graphs display the following information:
Relationship Lag Duration
Displays seconds, minutes, or hours on the vertical (y) axis, and displays days,months, or years on the horizontal (x) axis, depending on the selected durationperiod. The upper value on the y axis indicates the maximum lag duration reached inthe duration period shown in the x axis. The horizontal orange line on the graphdepicts the lag error threshold, and the horizontal yellow line depicts the lag warningthreshold. Positioning your cursor over these lines displays the threshold setting. Thehorizontal blue line depicts the lag duration. You can view the details for specificpoints on the graph by positioning your cursor over an area of interest.
Relationship Transfer Duration
Displays seconds, minutes, or hours on the vertical (y) axis, and displays days,months, or years on the horizontal (x) axis, depending on the selected durationperiod. The upper value on the y axis indicates the maximum transfer durationreached in the duration period shown in the x axis. You can view the details ofspecific points on the graph by positioning your cursor over the area of interest.
Note: This chart is not available for volumes that are in synchronous protectionrelationships.
283Managing and monitoring clusters and cluster object health

Relationship Transferred Size
Displays bytes, kilobytes, megabytes, and so on, on the vertical (y) axis dependingon the transfer size, and displays days, months, or years on the horizontal (x) axisdepending on the selected time period. The upper value on the y axis indicates themaximum transfer size reached in the duration period shown in the x axis. You canview the details for specific points on the graph by positioning your cursor over anarea of interest.
Note: This chart is not available for volumes that are in synchronous protectionrelationships.
History area
The History area displays graphs that provide information about the capacity and spacereservations of the selected volume. Additionally, you can click the Export button to create areport in CSV format for the chart that you are viewing.
Graphs might be empty and the message No data found displayed when the data or the state ofthe volume remains unchanged for a period of time.
You can select a graph type from the drop-down list at the top of the History pane. You can alsoview details for a specific time period by selecting either 1 week, 1 month, or 1 year. Historygraphs can help you identify trends—for example, if the volume usage is consistently breachingthe Nearly Full threshold, you can take the appropriate action.
History graphs display the following information:
Volume Capacity Used
Displays the used capacity in the volume and the trend in how volume capacity is usedbased on the usage history, as line graphs in bytes, kilobytes, megabytes, and so on, on thevertical (y) axis. The time period is displayed on the horizontal (x) axis. You can select atime period of a week, a month, or a year. You can view the details for specific points on thegraph by positioning your cursor over a particular area. You can hide or display a line graphby clicking the appropriate legend. For example, when you click the Volume Used Capacitylegend, the Volume Used Capacity graph line is hidden.
Volume Capacity Used vs Total
Displays the trend in how volume capacity is used based on the usage history, as well as theused capacity, total capacity, and details of the space savings from deduplication andcompression, as line graphs, in bytes, kilobytes, megabytes, and so on, on the vertical (y)axis. The time period is displayed on the horizontal (x) axis. You can select a time period ofa week, a month, or a year. You can view the details for specific points on the graph bypositioning your cursor over a particular area. You can hide or display a line graph byclicking the appropriate legend. For example, when you click the Trend Capacity Usedlegend, the Trend Capacity Used graph line is hidden.
Volume Capacity Used (%)
Displays the used capacity in the volume and the trend in how volume capacity is usedbased on the usage history, as line graphs, in percentage, on the vertical (y) axis. The timeperiod is displayed on the horizontal (x) axis. You can select a time period of a week, amonth, or a year. You can view the details for specific points on the graph by positioningyour cursor over a particular area. You can hide or display a line graph by clicking theappropriate legend. For example, when you click the Volume Used Capacity legend, theVolume Used Capacity graph line is hidden.
Snapshot Capacity Used (%)
Displays the Snapshot reserve and Snapshot warning threshold as line graphs, and thecapacity used by the Snapshot copies as an area graph, in percentage, on the vertical (y)
284Managing and monitoring clusters and cluster object health
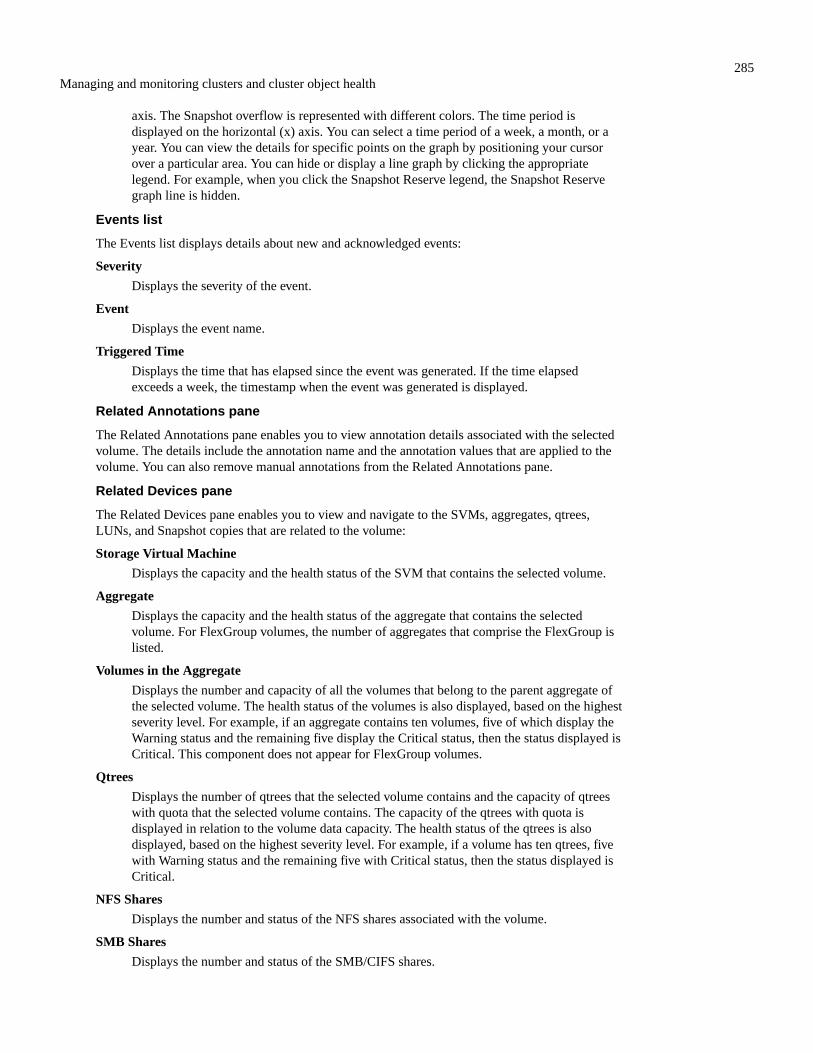
axis. The Snapshot overflow is represented with different colors. The time period isdisplayed on the horizontal (x) axis. You can select a time period of a week, a month, or ayear. You can view the details for specific points on the graph by positioning your cursorover a particular area. You can hide or display a line graph by clicking the appropriatelegend. For example, when you click the Snapshot Reserve legend, the Snapshot Reservegraph line is hidden.
Events list
The Events list displays details about new and acknowledged events:
Severity
Displays the severity of the event.
Event
Displays the event name.
Triggered Time
Displays the time that has elapsed since the event was generated. If the time elapsedexceeds a week, the timestamp when the event was generated is displayed.
Related Annotations pane
The Related Annotations pane enables you to view annotation details associated with the selectedvolume. The details include the annotation name and the annotation values that are applied to thevolume. You can also remove manual annotations from the Related Annotations pane.
Related Devices pane
The Related Devices pane enables you to view and navigate to the SVMs, aggregates, qtrees,LUNs, and Snapshot copies that are related to the volume:
Storage Virtual Machine
Displays the capacity and the health status of the SVM that contains the selected volume.
Aggregate
Displays the capacity and the health status of the aggregate that contains the selectedvolume. For FlexGroup volumes, the number of aggregates that comprise the FlexGroup islisted.
Volumes in the Aggregate
Displays the number and capacity of all the volumes that belong to the parent aggregate ofthe selected volume. The health status of the volumes is also displayed, based on the highestseverity level. For example, if an aggregate contains ten volumes, five of which display theWarning status and the remaining five display the Critical status, then the status displayed isCritical. This component does not appear for FlexGroup volumes.
Qtrees
Displays the number of qtrees that the selected volume contains and the capacity of qtreeswith quota that the selected volume contains. The capacity of the qtrees with quota isdisplayed in relation to the volume data capacity. The health status of the qtrees is alsodisplayed, based on the highest severity level. For example, if a volume has ten qtrees, fivewith Warning status and the remaining five with Critical status, then the status displayed isCritical.
NFS Shares
Displays the number and status of the NFS shares associated with the volume.
SMB Shares
Displays the number and status of the SMB/CIFS shares.
285Managing and monitoring clusters and cluster object health

LUNs
Displays the number and total size of all the LUNs in the selected volume. The health statusof the LUNs is also displayed, based on the highest severity level.
User and Group Quotas
Displays the number and status of the user and user group quotas associated with thevolume and its qtrees.
FlexClone Volumes
Displays the number and capacity of all the cloned volumes of the selected volume. Thenumber and capacity are displayed only if the selected volume contains any clonedvolumes.
Parent Volume
Displays the name and capacity of the parent volume of a selected FlexClone volume. Theparent volume is displayed only if the selected volume is a FlexClone volume.
Related Groups pane
The Related Groups pane enables you to view the list of groups associated with the selectedvolume.
Related Alerts pane
The Related Alerts pane enables you to view the list of alerts that are created for the selectedvolume. You can also add an alert by clicking the Add Alert link or edit an existing alert byclicking the alert name.
Related tasksAdding alerts on page 119
You can configure alerts to notify you when a particular event is generated. You can configurealerts for a single resource, for a group of resources, or for events of a particular severity type. Youcan specify the frequency with which you want to be notified and associate a script to the alert.
Editing individual volume health threshold settings on page 138You can edit the health threshold settings for volume capacity, growth, quota, and space reserve ofone or more volumes. When a threshold is crossed, alerts are generated and you receivenotifications. These notifications help you to take preventive measures based on the eventgenerated.
Capacity: All Qtrees viewThe Capacity: All Qtrees view enables you to view information about the capacity and utilizationof qtrees in all clusters. This information enables you to understand possible capacity risks andalso to view the configured and used disk percentage and number of files.
By default, objects in the view pages are sorted based on event criticality. Objects with criticalevents are listed first, and objects with warning events are listed second. This provides animmediate visual indication of issues that must be addressed.
The controls along the top of the page enable you to select a particular view (for health,performance, capacity, and so on), perform searches to locate specific objects, create and applyfilters to narrow the list of displayed data, add/remove/reorder columns on the page, and export thedata on the page to a .csv, .pdf, or .xlsx file. After you have customized the page, you cansave the results as a custom view and then schedule a report of this data to be generated andemailed on a regular basis.
You can customize capacity threshold settings for one or more qtrees by using the Edit Thresholdbutton.
See Qtree capacity fields for descriptions of all the fields on this page.
286Managing and monitoring clusters and cluster object health

Related tasksEditing individual qtree health threshold settings on page 139
You can edit the health threshold settings for qtree capacity for one or more qtrees. When athreshold is crossed, alerts are generated and you receive notifications. These notifications helpyou to take preventive measures based on the event generated.
Exporting storage data as reports on page 27You can export storage data in a variety of output formats and then use the exported data to buildreports. For example, if there are 10 critical events that have not been resolved, you can export thedata from the Event Management inventory page to create a report, and then send the report toadmins who can resolve the issues.
Scheduling a report on page 332After you have a view or Excel file that you want to schedule for regular generation anddistribution, you can schedule the report.
Qtree capacity fieldsThe following fields are available in the Capacity: All Qtrees view and can be used in customviews and in reports.
Status
Displays the current status of the qtree. The status can be Critical ( ), Error ( ),
Warning ( ), or Normal ( ).
Qtree
Displays the name of the qtree.
Volume
Displays the name of the volume that contains the qtree.
You can click the volume name to view more information about the volume.
Quota Type
If a quota is set for the qtree, specifies if the quota is for a User, User Group, or a Tree.
User or Group
Displays the name of the user or user group. There will be multiple rows for each user anduser group. When the quota type is qtree or if the quota is not set, then the column is empty.
Disk Used %
Displays the percentage of disk space used. If a disk hard limit is set, this value is based onthe disk hard limit. If the quota is set without a disk hard limit, the value is based on thevolume data space. If the quota is not set or if quotas are off on the volume to which theqtree belongs, then "Not applicable" is displayed in the grid page and the field is blank inthe CSV export data.
Disk Hard Limit
Displays the maximum amount of disk space allocated for the qtree. Unified Managergenerates a critical event when this limit is reached and no further disk writes are allowed.The value is displayed as "Unlimited" for the following conditions: if the quota is setwithout a disk hard limit, if the quota is not set, or if quotas are off on the volume to whichthe qtree belongs.
Disk Soft Limit
Displays the amount of disk space allocated for the qtree before a warning event isgenerated. The value is displayed as "Unlimited" for the following conditions: if the quota
287Managing and monitoring clusters and cluster object health

is set without a disk soft limit, if the quota is not set, or if quotas are off on the volume towhich the qtree belongs.
Files Used %
Displays the percentage of files used in the qtree. If the file hard limit is set, this value isbased on the file hard limit. No value is displayed if the quota is set without a file hardlimit. If the quota is not set or if quotas are off on the volume to which the qtree belongs,then "Not applicable" is displayed in the grid page and the field is blank in the CSV exportdata.
File Hard Limit
Displays the hard limit for the number of files permitted on the qtrees. The value isdisplayed as "Unlimited" for the following conditions: if the quota is set without a file hardlimit, if the quota is not set, or if quotas are off on the volume to which the qtree belongs.
File Soft Limit
Displays the soft limit for the number of files permitted on the qtrees. The value isdisplayed as "Unlimited" for the following conditions: if the quota is set without a file softlimit, if the quota is not set, or if quotas are off on the volume to which the qtree belongs.
SVM
Displays the storage virtual machine (SVM) name containing the qtree.
Cluster
Displays the name of the cluster containing the qtree.
Cluster FQDN
Displays the fully qualified domain name (FQDN) of the cluster.
Health: All NFS Shares viewThe Health: All NFS Shares view displays information about NFS shares such as its status, thepath associated with the volume (FlexGroup volumes or FlexVol volumes), access levels of clientsto the NFS shares, and the export policy defined for the volumes that are exported.
By default, objects on this page are sorted based on status. Objects with Errors are listed first, andobjects that have Normal status are listed next. This provides an immediate visual indication ofissues that must be addressed.
The controls along the top of the page enable you to select a particular view (for health,performance, capacity, and so on), perform searches to locate specific objects, create and applyfilters to narrow the list of displayed data, add/remove/reorder columns on the page, and export thedata on the page to a .csv, .pdf, or .xlsx file. After you have customized the page, you cansave the results as a custom view and then schedule a report of this data to be generated andemailed on a regular basis.
If you want to analyze the latency and throughput of a specific object, click the more icon ,then Analyze Workload and you can view performance and capacity charts on the WorkloadAnalysis page.
See NFS Shares health fields for descriptions of all the fields on this page.
Related tasksExporting storage data as reports on page 27
You can export storage data in a variety of output formats and then use the exported data to buildreports. For example, if there are 10 critical events that have not been resolved, you can export the
288Managing and monitoring clusters and cluster object health

data from the Event Management inventory page to create a report, and then send the report toadmins who can resolve the issues.
Scheduling a report on page 332After you have a view or Excel file that you want to schedule for regular generation anddistribution, you can schedule the report.
NFS Shares health fieldsThe following fields are available in the Health: All NFS Shares view and can be used in customviews and in reports.
Status
Displays the current status of the NFS shares. The status can be Error ( ) or Normal
( ).
Mount Path
Displays the path to which the volume is mounted. If an explicit NFS exports policy isapplied to a qtree, the column displays the path of the volume through which the qtree canbe accessed.
Mount Path Active
Displays whether the path to access the mounted volume is active or inactive.
Qtree
Displays the name of the qtree to which the NFS export policy is applied.
Volume
Displays the name of the volume to which the NFS export policy is applied.
Volume State
Displays the state of the volume that is being exported. The state can be Offline, Online,Restricted, or Mixed.
• Offline
Read or write access to the volume is not allowed.
• Online
Read and write access to the volume is allowed.
• Restricted
Limited operations, such as parity reconstruction, are allowed, but data access is notallowed.
• Mixed
The constituents of a FlexGroup volume are not all in the same state.
Security Style
Displays the access permission for the volumes that are exported. The security style can beUNIX, Unified, NTFS, or Mixed.
• UNIX (NFS clients)
Files and directories in the volume have UNIX permissions.
• Unified
Files and directories in the volume have a unified security style.
• NTFS (CIFS clients)
Files and directories in the volume have Windows NTFS permissions.
• Mixed
289Managing and monitoring clusters and cluster object health

Files and directories in the volume can have either UNIX permissions or WindowsNTFS permissions.
UNIX Permission
Displays the UNIX permission bits in an octal string format, which is set for the volumesthat are exported. It is similar to the UNIX style permission bits.
Export Policy
Displays the rules that define the access permission for volumes that are exported.
When you generate a report for the Health: All NFS Shares view, all rules that belong to theexport policy are exported to the CSV or PDF file.
Rule Index
Displays the rules associated with the export policy such as the authentication protocols andthe access permission.
Access Protocols
Displays the protocols that are enabled for the export policy rules.
Client Match
Displays the clients that have permission to access data on the volumes.
Read Only Access
Displays the authentication protocol used to read data on the volumes.
Read Write Access
Displays the authentication protocol used to read or write data on the volumes.
Storage VM
Displays the name of the SVM with NFS share policies.
Cluster
Displays the name of the cluster.
Cluster FQDN
Displays the fully qualified domain name (FQDN) of the cluster.
Health: All SMB Shares viewThe Health: All SMB Shares view displays information about SMB/CIFS shares such as its status,the share name, junction path, containing objects, security settings, and export policies defined forthe share.
By default, objects on this page are sorted based on status. Objects with Errors are listed first, andobjects that have Normal status are listed next. This provides an immediate visual indication ofissues that must be addressed.
The controls along the top of the page enable you to select a particular view (for health,performance, capacity, and so on), perform searches to locate specific objects, create and applyfilters to narrow the list of displayed data, add/remove/reorder columns on the page, and export thedata on the page to a .csv, .pdf, or .xlsx file. After you have customized the page, you cansave the results as a custom view and then schedule a report of this data to be generated andemailed on a regular basis.
If you want to analyze the latency and throughput of a specific object, click the more icon ,then Analyze Workload and you can view performance and capacity charts on the WorkloadAnalysis page.
See SMB/CIFS Shares health fields for descriptions of all the fields on this page.
290Managing and monitoring clusters and cluster object health

Related tasksExporting storage data as reports on page 27
You can export storage data in a variety of output formats and then use the exported data to buildreports. For example, if there are 10 critical events that have not been resolved, you can export thedata from the Event Management inventory page to create a report, and then send the report toadmins who can resolve the issues.
Scheduling a report on page 332After you have a view or Excel file that you want to schedule for regular generation anddistribution, you can schedule the report.
SMB/CIFS Shares health fieldsThe following fields are available in the Health: All SMB Shares view and can be used in customviews and in reports.
View User Mapping button
Launches the User Mapping dialog box.
You can view the details of user mapping for the SVM.
View ACL button
Launches the Access Control dialog box for the share.
You can view user and permission details for the selected share.
Status
Displays the current status of the share. The status can be Normal ( ) or Error ( ).
Name
Displays the name of the CIFS share.
Path
Displays the junction path on which the share is created.
Qtree
Displays the name of the qtree to which the CIFS share is applied.
Volume
Displays the name of the volume to which the CIFS share is applied.
Volume State
Displays the state of the volume that is being exported. The state can be Offline, Online,Restricted, Mixed, or Unknown.
• Offline
Read or write access to the volume is not allowed.
• Online
Read and write access to the volume is allowed.
• Restricted
Limited operations, such as parity reconstruction, are allowed, but data access is notallowed.
• Mixed
The constituents of a FlexGroup volume are not all in the same state.
Properties
List the optional properties set when the share was created.
291Managing and monitoring clusters and cluster object health

User
The users who can access the share.
Permission
The permissions users have on the share.
Security Style
Displays the access permission for the volumes that are shared. The security style can beUNIX, Unified, NTFS, or Mixed.
• UNIX (NFS clients)Files and directories in the volume have UNIX permissions.
• UnifiedFiles and directories in the volume have a unified security style.
• NTFS (CIFS clients)Files and directories in the volume have Windows NTFS permissions.
• MixedFiles and directories in the volume can have either UNIX permissions or WindowsNTFS permissions.
Export Policy
Displays the name of the export policy applicable to the share. If an export policy is notspecified for the SVM, the value is displayed as Not Enabled.
Mount Path Active
Displays whether the path to access the share is active or inactive.
NFS Equivalent
Specifies whether there is an NFS equivalent for the share.
Storage VM
Displays the name of the SVM with to which the CIFS share belongs.
Cluster
Displays the name of the cluster.
Cluster FQDN
Displays the fully qualified domain name (FQDN) of the cluster.
Export Policy Rules dialog boxThe Export Policy Rules dialog box displays details about the export policies, authenticationprotocols, and access enabled on the volumes that belong to the storage virtual machine (SVM).You can use the filters to customize the display of information in the export policy rules list. Bydefault, the information is sorted based on the index column.
Index
Displays the index assigned to the export policy rules. It is a unique number.
Access Protocols
Displays the protocols that are enabled for the export policy rules.
Client Match
Displays the clients that have permission to access data on the volumes that belong to theSVM.
Read Only Access
Displays the authentication protocol used to read data on the volumes that belong to theSVM.
292Managing and monitoring clusters and cluster object health
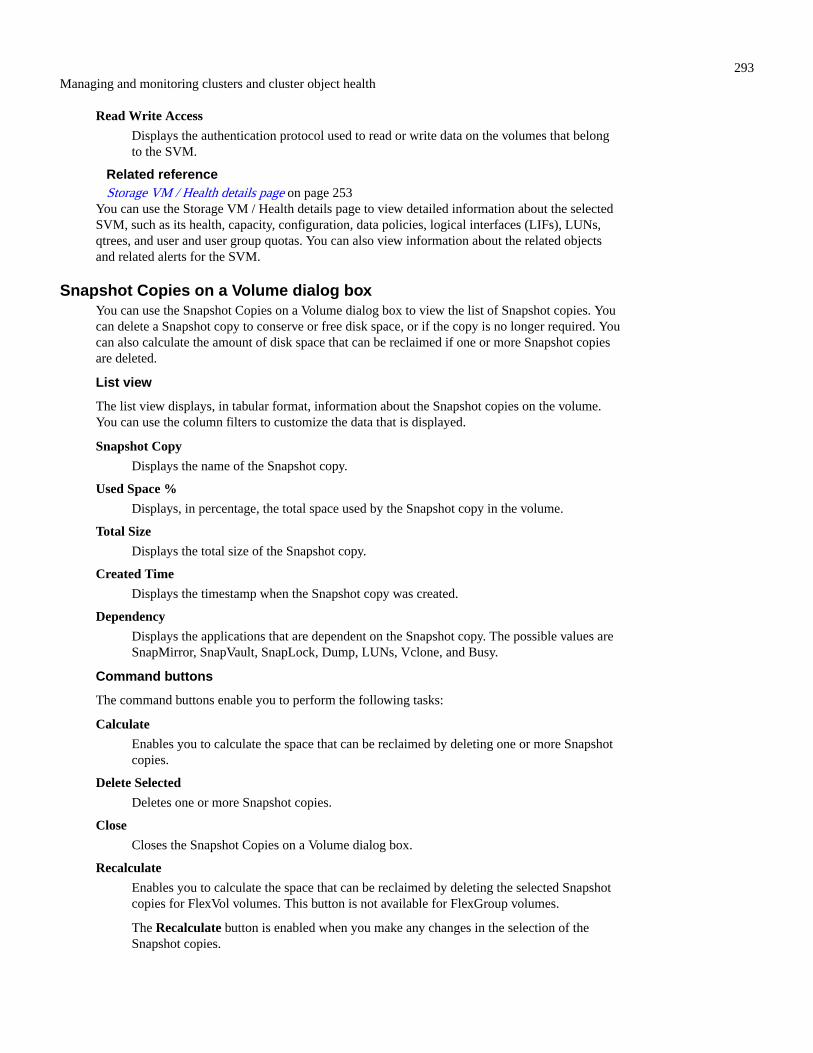
Read Write Access
Displays the authentication protocol used to read or write data on the volumes that belongto the SVM.
Related referenceStorage VM / Health details page on page 253
You can use the Storage VM / Health details page to view detailed information about the selectedSVM, such as its health, capacity, configuration, data policies, logical interfaces (LIFs), LUNs,qtrees, and user and user group quotas. You can also view information about the related objectsand related alerts for the SVM.
Snapshot Copies on a Volume dialog boxYou can use the Snapshot Copies on a Volume dialog box to view the list of Snapshot copies. Youcan delete a Snapshot copy to conserve or free disk space, or if the copy is no longer required. Youcan also calculate the amount of disk space that can be reclaimed if one or more Snapshot copiesare deleted.
List view
The list view displays, in tabular format, information about the Snapshot copies on the volume.You can use the column filters to customize the data that is displayed.
Snapshot Copy
Displays the name of the Snapshot copy.
Used Space %
Displays, in percentage, the total space used by the Snapshot copy in the volume.
Total Size
Displays the total size of the Snapshot copy.
Created Time
Displays the timestamp when the Snapshot copy was created.
Dependency
Displays the applications that are dependent on the Snapshot copy. The possible values areSnapMirror, SnapVault, SnapLock, Dump, LUNs, Vclone, and Busy.
Command buttons
The command buttons enable you to perform the following tasks:
Calculate
Enables you to calculate the space that can be reclaimed by deleting one or more Snapshotcopies.
Delete Selected
Deletes one or more Snapshot copies.
Close
Closes the Snapshot Copies on a Volume dialog box.
Recalculate
Enables you to calculate the space that can be reclaimed by deleting the selected Snapshotcopies for FlexVol volumes. This button is not available for FlexGroup volumes.
The Recalculate button is enabled when you make any changes in the selection of theSnapshot copies.
293Managing and monitoring clusters and cluster object health

Related tasksDeleting Snapshot copies on page 218
You can delete a Snapshot copy to conserve space or to free disk space, or you can delete theSnapshot copy if it is no longer required.
Calculating reclaimable space for Snapshot copies on page 219You can calculate the amount of disk space that can be reclaimed if one or more Snapshot copiesare deleted.
294Managing and monitoring clusters and cluster object health

Managing cluster security objectives
Unified Manager provides a dashboard that identifies how secure your ONTAP clusters, storagevirtual machines (SVMs), and volumes are based on recommendations defined in the NetAppSecurity Hardening Guide for ONTAP 9.
The goal of the security dashboard is to show any areas where your ONTAP clusters do not alignwith the NetApp recommended guidelines so that you can fix these potential issues. In most casesyou will fix the issues using ONTAP System Manager or the ONTAP CLI. Your organization maynot follow all of the recommendations, so in some cases you will not need to make any changes.
See the NetApp Security Hardening Guide for ONTAP 9 (TR-4569) for detailed recommendationsand resolutions.
In addition to reporting security status, Unified Manager also generates security events for anycluster or SVM that has security violations. You can track these issues in the Event Managementinventory page and you can configure alerts for these events so that your storage administrator isnotified when new security events occur.
Related referenceSecurity events on page 302
Security events provide you with information about the security status of ONTAP clusters, storagevirtual machines (SVMs), and volumes based on parameters defined in the NetApp SecurityHardening Guide for ONTAP 9. These events notify you of potential issues so that you canevaluate their severity and fix the issue if necessary.
What security criteria is being evaluatedIn general, security criteria for your ONTAP clusters, storage virtual machines (SVMs), andvolumes are being evaluated against the recommendations defined in the NetApp SecurityHardening Guide for ONTAP 9.
Some of the security checks include:
• whether a cluster is using a secure authentication method, such as SAML
• whether peered clusters have their communication encrypted
• whether a storage VM has its audit log enabled
• whether your volumes have software or hardware encryption enabled
See the topics on compliance categories and the NetApp Security Hardening Guide for ONTAP 9for detailed information.
Note: Upgrade events that are reported from the Active IQ platform are also considered securityevents. These events identify issues where the resolution requires you to upgrade ONTAPsoftware, node firmware, or operating system software (for security advisories). These eventsare not displayed in the Security panel, but they are available from the Event Managementinventory page.
Related conceptsWhat Active IQ platform events are on page 48
295Managing cluster security objectives
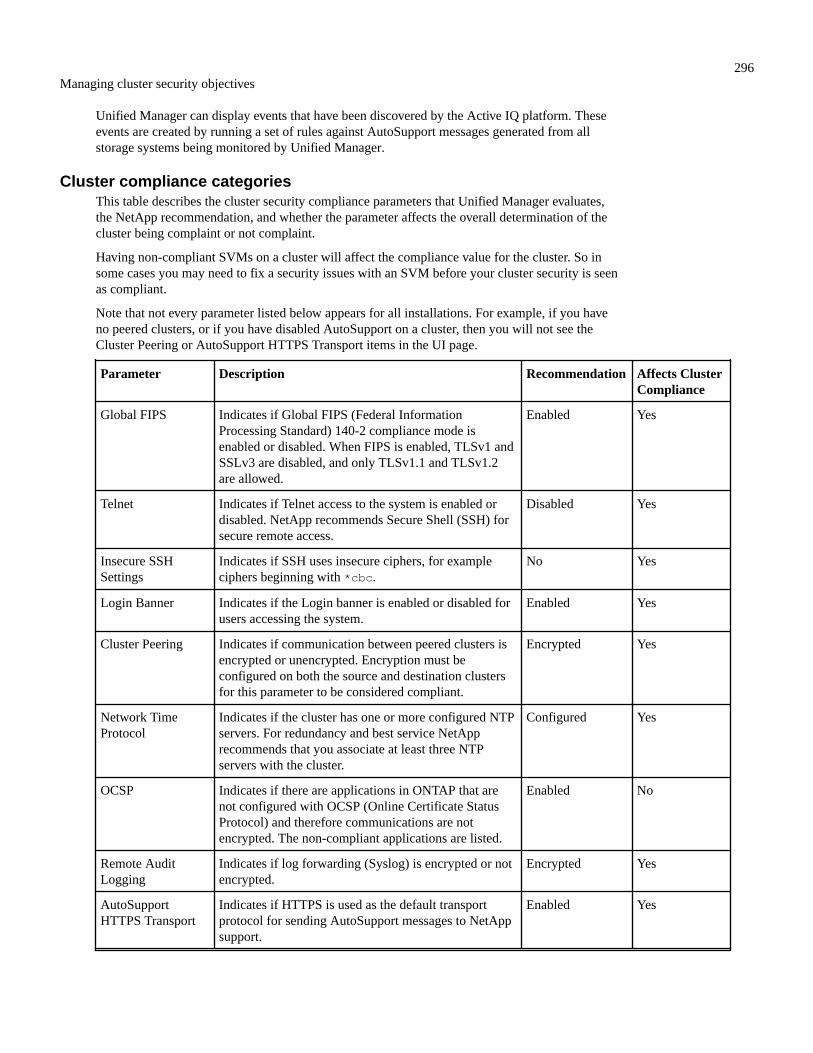
Unified Manager can display events that have been discovered by the Active IQ platform. Theseevents are created by running a set of rules against AutoSupport messages generated from allstorage systems being monitored by Unified Manager.
Cluster compliance categoriesThis table describes the cluster security compliance parameters that Unified Manager evaluates,the NetApp recommendation, and whether the parameter affects the overall determination of thecluster being complaint or not complaint.
Having non-compliant SVMs on a cluster will affect the compliance value for the cluster. So insome cases you may need to fix a security issues with an SVM before your cluster security is seenas compliant.
Note that not every parameter listed below appears for all installations. For example, if you haveno peered clusters, or if you have disabled AutoSupport on a cluster, then you will not see theCluster Peering or AutoSupport HTTPS Transport items in the UI page.
Parameter Description Recommendation Affects ClusterCompliance
Global FIPS Indicates if Global FIPS (Federal InformationProcessing Standard) 140-2 compliance mode isenabled or disabled. When FIPS is enabled, TLSv1 andSSLv3 are disabled, and only TLSv1.1 and TLSv1.2are allowed.
Enabled Yes
Telnet Indicates if Telnet access to the system is enabled ordisabled. NetApp recommends Secure Shell (SSH) forsecure remote access.
Disabled Yes
Insecure SSHSettings
Indicates if SSH uses insecure ciphers, for exampleciphers beginning with *cbc.
No Yes
Login Banner Indicates if the Login banner is enabled or disabled forusers accessing the system.
Enabled Yes
Cluster Peering Indicates if communication between peered clusters isencrypted or unencrypted. Encryption must beconfigured on both the source and destination clustersfor this parameter to be considered compliant.
Encrypted Yes
Network TimeProtocol
Indicates if the cluster has one or more configured NTPservers. For redundancy and best service NetApprecommends that you associate at least three NTPservers with the cluster.
Configured Yes
OCSP Indicates if there are applications in ONTAP that arenot configured with OCSP (Online Certificate StatusProtocol) and therefore communications are notencrypted. The non-compliant applications are listed.
Enabled No
Remote AuditLogging
Indicates if log forwarding (Syslog) is encrypted or notencrypted.
Encrypted Yes
AutoSupportHTTPS Transport
Indicates if HTTPS is used as the default transportprotocol for sending AutoSupport messages to NetAppsupport.
Enabled Yes
296Managing cluster security objectives
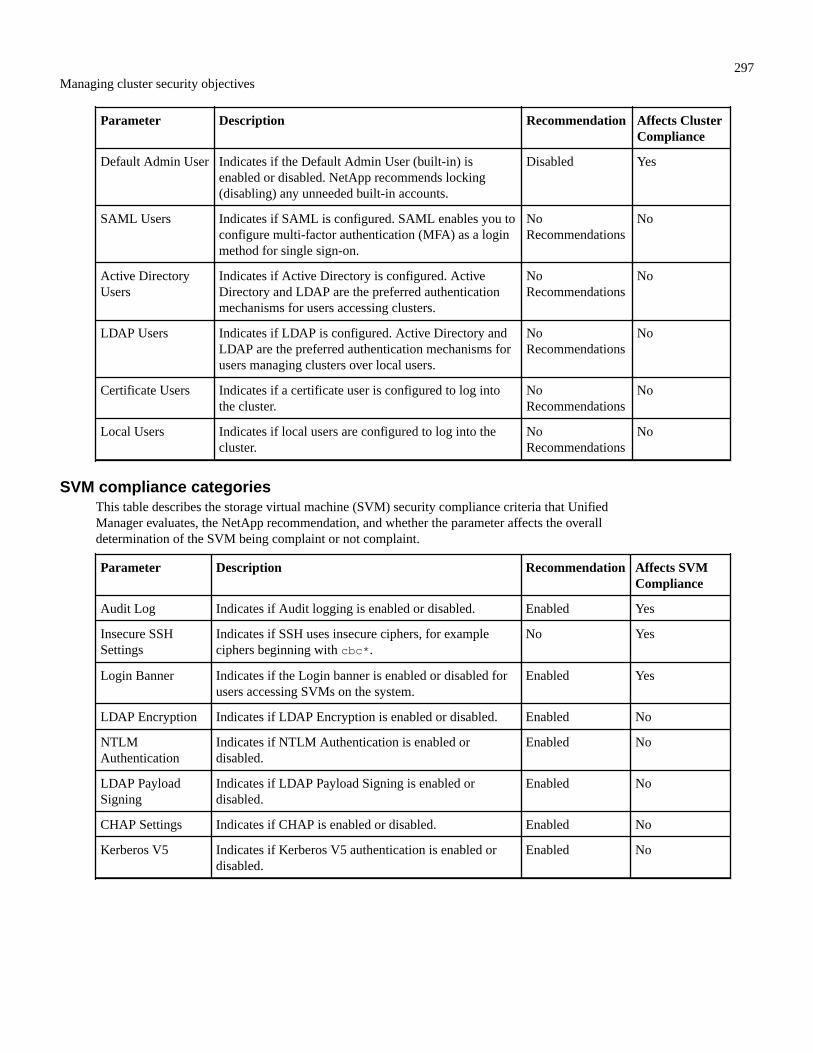
Parameter Description Recommendation Affects ClusterCompliance
Default Admin User Indicates if the Default Admin User (built-in) isenabled or disabled. NetApp recommends locking(disabling) any unneeded built-in accounts.
Disabled Yes
SAML Users Indicates if SAML is configured. SAML enables you toconfigure multi-factor authentication (MFA) as a loginmethod for single sign-on.
NoRecommendations
No
Active DirectoryUsers
Indicates if Active Directory is configured. ActiveDirectory and LDAP are the preferred authenticationmechanisms for users accessing clusters.
NoRecommendations
No
LDAP Users Indicates if LDAP is configured. Active Directory andLDAP are the preferred authentication mechanisms forusers managing clusters over local users.
NoRecommendations
No
Certificate Users Indicates if a certificate user is configured to log intothe cluster.
NoRecommendations
No
Local Users Indicates if local users are configured to log into thecluster.
NoRecommendations
No
SVM compliance categoriesThis table describes the storage virtual machine (SVM) security compliance criteria that UnifiedManager evaluates, the NetApp recommendation, and whether the parameter affects the overalldetermination of the SVM being complaint or not complaint.
Parameter Description Recommendation Affects SVMCompliance
Audit Log Indicates if Audit logging is enabled or disabled. Enabled Yes
Insecure SSHSettings
Indicates if SSH uses insecure ciphers, for exampleciphers beginning with cbc*.
No Yes
Login Banner Indicates if the Login banner is enabled or disabled forusers accessing SVMs on the system.
Enabled Yes
LDAP Encryption Indicates if LDAP Encryption is enabled or disabled. Enabled No
NTLMAuthentication
Indicates if NTLM Authentication is enabled ordisabled.
Enabled No
LDAP PayloadSigning
Indicates if LDAP Payload Signing is enabled ordisabled.
Enabled No
CHAP Settings Indicates if CHAP is enabled or disabled. Enabled No
Kerberos V5 Indicates if Kerberos V5 authentication is enabled ordisabled.
Enabled No
297Managing cluster security objectives

Volume compliance categoriesThis table describes the volume encryption parameters that Unified Manager evaluates todetermine whether the data on your volumes is adequately protected from being accessed byunauthorized users.
Note that the volume encryption parameters do not affect whether the cluster or storage VM isconsidered compliant.
Parameter Description
Software Encrypted Displays the number of volumes that are protected using NetApp VolumeEncryption (NVE) or NetApp Aggregate Encryption (NAE) software encryptionsolutions.
Hardware Encrypted Displays the number of volumes that are protected using NetApp StorageEncryption (NSE) hardware encryption.
Software and Hardware Encrypted Displays the number of volumes that are protected by both software andhardware encryption.
Not Encrypted Displays the number of volumes that are not encrypted.
What does not compliant meanClusters and storage virtual machines (SVMs) are considered not compliant when any of thesecurity criteria that is being evaluated against the recommendations defined in the NetAppSecurity Hardening Guide for ONTAP 9 are not met. Additionally, a cluster is considered notcompliant when any SVM is flagged as being not compliant.
The status icons in the security cards have the following meanings in relation to their compliance:
• - The parameter is configured as recommended.
• - The parameter is not configured as recommended.
• - Either the functionality is not enabled on the cluster, or the parameter is not configuredas recommended, but this parameter does not contribute to the compliance of the object.
Note that volume encryption status does not contribute to whether the cluster or SVM areconsidered compliant.
Viewing high-level cluster security statusThe Security panel on the Unified Manager Dashboard shows high-level security status for allclusters or for a single cluster, depending on your current view.
Steps
1. In the left navigation pane, click Dashboard.
2. Depending on whether you want to view security status for all monitored clusters or for asingle cluster, select All Clusters or select a single cluster from the drop-down menu.
3. View the Security panel to see the overall status.This panel displays:
• a list of the security events received in the past 24 hours
• a link from each of these events to the Event details page
• a link so that you can view all active security events in the Event Management inventorypage
298Managing cluster security objectives

• the cluster security status (number of clusters that are compliant or not compliant)
• the SVM security status (number of SVMs that are compliant or not compliant)
• the volume encryption status (number of volumes that are encrypted or not encrypted)
4. Click the right-arrow at the top of the panel to view security details in the Security page.
Viewing detailed security status for clusters and SVMsThe Security page shows high-level security status for all clusters, and detailed security status forindividual clusters. The detailed cluster status includes cluster compliance, SVM compliance, andvolume encryption compliance.
Steps
1. In the left navigation pane, click Dashboard.
2. Depending on whether you want to view security status for all monitored clusters or for asingle cluster, select All Clusters or select a single cluster from the drop-down menu.
3. Click the right-arrow in the Security panel.The Security page displays the following information:
• the cluster security status (number of clusters that are compliant or not compliant)
• the SVM security status (number of SVMs that are compliant or not compliant)
• the volume encryption status (number of volumes that are encrypted or not encrypted)
• the cluster authentication methods being used on each cluster
4. Refer to the NetApp Security Hardening Guide for ONTAP 9 for instructions on how to makeall of your clusters, SVMs, and volumes compliant with NetApp security recommendations.
Viewing security events that may require software or firmware updatesThere are certain security events that have an impact area of "Upgrade". These events are reportedfrom the Active IQ platform, and they identify issues where the resolution requires you to upgradeONTAP software, node firmware, or operating system software (for security advisories).
Before you begin
You must have the Operator, Application Administrator, or Storage Administrator role.
About this task
You may want to perform immediate corrective action for some of these issues, whereas otherissues may be able to wait until your next scheduled maintenance. You can view all of these eventsand assign them to users who can resolve the issues. Additionally, if there are certain securityupgrade events that you do not want to be notified about, this list can help you identify thoseevents so that you can disable them.
Steps
1. In the left navigation pane, click Event Management.
By default, all Active (New and Acknowledged) events are displayed on the EventManagement inventory page.
2. From the View menu, select Upgrade events.The page displays all active upgrade security events.
Related referenceEvent Management inventory page on page 104
299Managing cluster security objectives

The Event Management inventory page enables you to view a list of current events and theirproperties. You can perform tasks such as acknowledging, resolving, and assigning events. Youcan also add an alert for specific events.
Viewing how user authentication is being managed on all clustersThe Security page displays the types of authentication being used to authenticate users on eachcluster, and the number of users who are accessing the cluster using each type. This enables you toverify that user authentication is being performed securely as defined by your organization.
Steps
1. In the left navigation pane, click Dashboard.
2. At the top of the dashboard, select All Clusters from the drop-down menu.
3. Click the right-arrow in the Security panel and the Security page is displayed.
4. View the Cluster Authentication card to see the number of users who are accessing thesystem using each authentication type.
5. View the Cluster Security card to view the authentication mechanisms being used toauthenticate users on each cluster.
Result
If there are some users accessing the system using an insecure method, or using a method that isnot recommended by NetApp, you can disable the method.
Viewing the encryption status of all volumesYou can view a list of all the volumes and their current encryption status so you can determinewhether the data on your volumes is adequately protected from being accessed by unauthorizedusers.
Before you begin
You must have the Operator, Application Administrator, or Storage Administrator role.
About this task
The types of encryption that can be applied to a volume are:
• Software - Volumes that are protected using NetApp Volume Encryption (NVE) or NetAppAggregate Encryption (NAE) software encryption solutions.
• Hardware - Volumes that are protected using NetApp Storage Encryption (NSE) hardwareencryption.
• Software and Hardware - Volumes that are protected by both software and hardwareencryption.
• None - Volumes that are not encrypted.
Steps
1. In the left navigation pane, click Storage > Volumes.
2. In the View menu, select Health > Volumes Encryption
3. Optional: In the Health: Volumes Encryption view, sort on the Encryption Type field, or usethe Filter to display volumes that have a specific encryption type, or that are not encrypted(Encryption Type of "None").
300Managing cluster security objectives

Viewing all active security eventsYou can view all the active security events and then assign each of them to a user who can resolvethe issue. Additionally, if there are certain security events that you do not want to receive, this listcan help you identify the events that you want to disable.
Before you begin
You must have the Operator, Application Administrator, or Storage Administrator role.
Steps
1. In the left navigation pane, click Event Management.
By default, New and Acknowledged events are displayed on the Event Management inventorypage.
2. From the View menu, select Active security events.The page displays all New and Acknowledged Security events that have been generated in thepast 7 days.
Related tasksAdding alerts for security events on page 301
You can configure alerts for individual security events just like any other events received byUnified Manager. Additionally, if you want to treat all security events alike and have email sent tothe same person, you can create a single alert to notify you when any security events are triggered.
Disabling specific security events on page 302All events are enabled by default. You can disable specific events to prevent the generation ofnotifications for those events that are not important in your environment. You can enable eventsthat are disabled if you want to resume receiving notifications for them.
Adding alerts for security eventsYou can configure alerts for individual security events just like any other events received byUnified Manager. Additionally, if you want to treat all security events alike and have email sent tothe same person, you can create a single alert to notify you when any security events are triggered.
Before you begin
You must have the Application Administrator or Storage Administrator role.
About this task
The example below shows how to create an alert for the "Telnet Protocol Enabled" security event.This will send an alert if Telnet access is configured for remote administrative access into thecluster. You can use this same methodology to create alerts for all security events.
Steps
1. In the left navigation pane, click Storage Management > Alert Setup.
2. In the Alert Setup page, click Add.
3. In the Add Alert dialog box, click Name, and enter a name and description for the alert.
4. Click Resources and select the cluster or cluster on which you want to enable this alert.
5. Click Events and perform the following actions:
a. In the Event Severity list, select Warning.
b. In the Matching Events list, select Telnet Protocol Enabled.
6. Click Actions and then select the name of the user who will receive the alert email in the Alertthese users field.
301Managing cluster security objectives
7. Configure any other options on this page for notification frequency, issuing SNMP taps, andexecuting a script.
8. Click Save.
Related tasksViewing all active security events on page 301
You can view all the active security events and then assign each of them to a user who can resolvethe issue. Additionally, if there are certain security events that you do not want to receive, this listcan help you identify the events that you want to disable.
Disabling specific security eventsAll events are enabled by default. You can disable specific events to prevent the generation ofnotifications for those events that are not important in your environment. You can enable eventsthat are disabled if you want to resume receiving notifications for them.
Before you begin
You must have the Application Administrator or Storage Administrator role.
About this task
When you disable events, the previously generated events in the system are marked obsolete, andthe alerts that are configured for these events are not triggered. When you enable events that aredisabled, the notifications for these events are generated starting with the next monitoring cycle.
Steps
1. In the left navigation pane, click Storage Management > Event Setup.
2. In the Event Setup page, disable or enable events by choosing one of the following options:
If you want to... Then do this...
Disable events a. Click Disable.
b. In the Disable Events dialog box, select the Warning severity. This is thecategory for all security events.
c. In the Matching Events column, select the security events that you want todisable, and then click the right arrow to move those events to the DisableEvents column.
d. Click Save and Close.
e. Verify that the events that you disabled are displayed in the list view of theEvent Setup page.
Enable events a. From the list of disabled events, select the check box for the event, or events,that you want to reenable.
b. Click Enable.
Related tasksViewing all active security events on page 301
You can view all the active security events and then assign each of them to a user who can resolvethe issue. Additionally, if there are certain security events that you do not want to receive, this listcan help you identify the events that you want to disable.
Security eventsSecurity events provide you with information about the security status of ONTAP clusters, storagevirtual machines (SVMs), and volumes based on parameters defined in the NetApp Security
302Managing cluster security objectives
Hardening Guide for ONTAP 9. These events notify you of potential issues so that you canevaluate their severity and fix the issue if necessary.
Security events are grouped by source type and include the event and trap name, impact level, andseverity. These events appear in the cluster and storage VM event categories.
Related conceptsManaging cluster security objectives on page 295
Unified Manager provides a dashboard that identifies how secure your ONTAP clusters, storagevirtual machines (SVMs), and volumes are based on recommendations defined in the NetAppSecurity Hardening Guide for ONTAP 9.
Related referenceCluster events on page 73
Cluster events provide information about the status of clusters, which enables you to monitor theclusters for potential problems. The events are grouped by impact area, and include the eventname, trap name, impact level, source type, and severity.
Storage VM events on page 95Storage VM events provide you with information about the status of your SVMs so that you canmonitor for potential problems. Events are grouped by impact area and include the event and trapname, impact level, source type, and severity.
303Managing cluster security objectives

Monitoring VMware virtual infrastructure
Active IQ Unified Manager provides visibility into the virtual machines (VMs) in your virtualinfrastructure, and enables monitoring and troubleshooting storage and performance issues in yourvirtual environment. You can use this feature to determine any latency issues in your storageenvironment or when there is a reported performance event on your vCenter Server.
A typical virtual infrastructure deployment on ONTAP has various components that are spreadacross compute, network, and storage layers. Any performance lag in a VM application mightoccur due to a combination of latencies faced by the various components at the respective layers.This feature is useful for storage and vCenter Server admins and IT generalists who need toanalyze a performance issue in a virtual environment and understand in which component theissue has occurred.
Unified Manager presents the underlying sub-system of a virtual environment in a topologicalview for determining whether a latency issue has occurred in the compute node, network, orstorage. The view also highlights the specific object that causes the performance lag for takingremedial steps and addressing the underlying issue.
A virtual infrastructure deployed on ONTAP storage includes the following objects:
• vCenter Server: A centralized control plane for managing the VMware VMs, ESXi hosts, andall related components in a virtual environment. For more information about vCenter Server,see VMware documentation.
• Host: A physical or virtual system that runs ESXi, the virtualization software from VMware,and hosts the VM.
• Datastore: Datastores are virtual storage objects that are connected to the ESXi hosts.Datastores are manageable storage entities of ONTAP, such as LUNs or volumes, used as arepository for VM files, such as log files, scripts, configuration files, and virtual disks. Theyare connected to the hosts in the environment via a SAN or IP network connection. Datastoresoutside of ONTAP that are mapped to vCenter Server are not supported or displayed onUnified Manager.
• VM: A VMware virtual machine.
• Virtual disks: The virtual disks on datastores belonging to the VMs that have an extension asVMDK. Data from a virtual disk is stored on the corresponding VMDK.
• VMDK: A virtual machine disk on the datastore that provides storage space for virtual disks.For each virtual disk, there is a corresponding VMDK.
These objects are represented in a VM topology view.
VMware virtualization on ONTAP
304Monitoring VMware virtual infrastructure

User workflow
The following diagram displays a typical use case of using the VM topology view:
305Monitoring VMware virtual infrastructure

What is not supported
• Datastores that are outside of ONTAP and are mapped to the vCenter Server instances are notsupported on Unified Manager. Any VMs with virtual disks on those datastores are also notsupported.
• A datastore that spans across multiple LUNs is not supported.
• Datastores using Network address translation (NAT) for mapping data LIF (access endpoint)are not supported.
• A configuration with multiple LIFs with the same IP address, that is, multiple datastoresexported with identical IP addresses is not supported.
• Only NAS and SAN volumes (iSCSI and FCP for VMFS) are supported as datastores, virtualvolumes (vVoLs) are not supported.
• Only iSCSI virtual disks are supported. Virtual disks of NVMe and SATA types are notsupported.
• The views do not allow you to generate reports for analysing the performance of the variouscomponents.
• For the storage virtual machine (storage VM) disaster recovery (DR) setup that is supported foronly virtual infrastructure on Unified Manager, the configuration has to be manually changedin vCenter Server to point to the active LUNs in switchover and switchback scenarios. Withouta manual intervention, their datastores become inaccessible.
Viewing and adding vCenter ServerFor viewing and troubleshooting the performance of the virtual machines (VMs), the associatedvCenter Servers must be added on your Active IQ Unified Manager instance.
Before you begin
Before adding or viewing vCenter Servers, ensure the following:
• You are aware of the vCenter Server names.
306Monitoring VMware virtual infrastructure

• You know the IP address of vCenter Server and have the required credentials. The credentialsmust be of a vCenter Server administrator or a root user with read-only access to vCenterServer.
• The vCenter Server that you want to add runs vSphere 6.5 or later.
• The data collection setting in vCenter Server is set to the statistics level of Level 3, ensuringthe required level of metrics collection for all the monitored objects. The interval durationshould be 5 minutes, and the save period should be 1 day.
• The latency values in vCenter Server are configured in milliseconds, and not in microseconds,for successful calculations of the latency values.
• The current time of vCenter Server is in sync with the vCenter Server time zone.
• vCenter Server is reachable for a successful discovery.
About this task
For every vCenter Server added and discovered, Unified Manager collects the configuration data,such as the vCenter Server and ESXi server details, ONTAP mapping, datastore details, andnumber of VMs hosted. It further collects the performance metrics of the components.
Steps
1. Go to VMWARE > vCenter, and check whether your vCenter Server is available on the list.
Note: If your vCenter Server is not available, you must add vCenter Server.
a. Click Add.
b. Add the correct IP address for vCenter Server and ensure that the device is reachable.
c. Add the user name and password of the administrator or root user with read-only access tovCenter Server.
d. Add the custom port number if you are using any port other than the default 443.
e. Click Save.
Upon successful discovery, a server certificate is displayed for you to accept.
When you accept the certificate, vCenter Server is added to the list of available vCenterServers. Adding the device does not result into data collection for the associated VMs, andthe collection occurs at the scheduled intervals.
2. If your vCenter Server is available on the vCenters page, check its status by hovering yourmouse over the Status field to display whether your vCenter Server is performing as expectedor whether there is a warning or error.
Note: Adding vCenter Server allows you to view the following statuses. However, theperformance and latency data of the corresponding VMs might take up to an hour afteradding vCenter Server to be accurately reflected.
• Green: "Normal", indicating that vCenter Server has been discovered, and performancemetrics have been successfully collected
• Yellow: "Warning" (for example, when the statistics level for vCenter Server has not beenset to 3 or above to obtain statistics for each object)
• Orange: "Error" (indicates any internal errors, such as exception, failure in configurationdata collection, or vCenter Server being unreachable)
You can click the column display icon (Show/Hide) to view the status message for a vCenterServer status and troubleshoot the issue.
3. In case vCenter Server is unreachable or the credentials have changed, edit the vCenter Serverdetails by selecting vCenter > Edit.
4. Make the necessary changes on the Edit VMware vCenter Server page.
5. Click Save.
307Monitoring VMware virtual infrastructure

Result
vCenter Server data collection begins
vCenter Server collects real-time 20-second performance data samples and rolls them up to 5-minute samples. The schedule for performance data collection of Unified Manager is based on thedefault settings of vCenter Server. Unified Manager processes the 5-minute samples obtained fromvCenter Server and calculates an hourly average of the IOPS and latency for the virtual disks,VMs, and hosts. For datastores, Unified Manager calculates an hourly average of the IOPS andlatency from samples obtained from ONTAP. These values are available at the top of the hour. Theperformance metrics are not available immediately after vCenter Server is added, and is availableonly when the next hour starts. Performance data polling begins on completing a cycle ofconfiguration data collection.
For polling vCenter Server configuration data, Unified Manager follows the same schedule as forcollecting cluster configuration data. For information about vCenter Server configuration andperformance data collection schedule, see " Cluster configuration and performance data collectionactivity".
Related conceptsCluster configuration and performance data collection activity on page 20
The collection interval for cluster configuration data is 15 minutes. For example, after you haveadded a cluster, it takes 15 minutes to display the cluster details in the Unified Manager UI. Thisinterval applies when making changes to a cluster too.
Monitoring virtual machinesFor any latency issue on the virtual machine (VM) applications, you might need to monitor theVMs to analyze and troubleshoot the cause. The VMs are available when their vCenter Server andthe ONTAP clusters hosting the VM storage are added to Unified Manager.
You see the details of the VMs on the VMWARE > > Virtual Machines page. Information, suchas the availability, status, used and allocated capacity, network latency, and the IOPS and latencyof the VM, datastore, and host is displayed. For a VM supporting multiple datastores, the gridshows the metrics of the datastore with the worst latency, with an asterisk icon (*) indicatingadditional datastores. If you click on the icon, the metrics of the additional datastore is displayed.Some of these columns are not available for sorting and filtering.
Note: For viewing a VM and its details, the discovery (polling or metrics collection) of theONTAP cluster must be complete. If the cluster is removed from Unified Manager, the VM isno longer available, after the next cycle of discovery.
From this page, you can also view the detailed topology of a VM, displaying the components towhich the VM is related, for example, the host, virtual disk, and datastore connected to it. Thetopology view displays the underlying components in their specific layers, in the following order:Virtual Disk > VM > Host > Network > Datastore > VMDK.
You can determine the I/O path and component-level latencies from a topological aspect andidentify whether storage is the cause of the performance issue. The summary view of the topologydisplays the I/O path, and highlights the component that has IOPS and latency issues for you todecide on the troubleshooting steps. You can also have an expanded view of the topology thatdepicts each component separately along with latency of that component. You can select acomponent to determine the I/O path highlighted through the layers.
Viewing summary topology
To determine performance issues by viewing the VMs in a summary topology
1. Go to VMWARE > Virtual Machines.
308Monitoring VMware virtual infrastructure
2. Search for your VM by typing its name in the search box. You can also filter your searchresults based on specific criteria by clicking on the Filter button. However, If you cannot findyour VM, ensure that the corresponding vCenter Server has been added and discovered.
Note: vCenter Servers allow special characters (such as %, &, *, $, #, @, !, \, /, :, *, ?, “, <,>, |, ;, ') in the names of vSphere entities, such as VM, cluster, datastore, folder, or file. TheVMware vCenter Server and ESX/ESXi Server do not escape special characters used in thedisplay names. However, when the name is processed in Unified Manager, it is displayeddifferently. For example, a VM named as %$VC_AIQUM_clone_191124% in vCenter Serveris displayed as %25$VC_AIQUM_clone_191124%25 in Unified Manager. You must keep anote of this issue when you query a VM with a name having a special characters in it.
3. Check the status of the VM. The VM statuses are retrieved from vCenter Server. The followingstatuses are available. For more information about these statuses, see VMware documentation.
• Normal
• Warning
• Alert
• Not monitored
• Unknown
4. Click the down arrow beside the VM to see the summary view of the topology of thecomponents across the compute, network, and storage layers. The node that has latency issuesis highlighted. The summary view displays the worst latency of the components. For example,if a VM has more than one virtual disk, this view displays the virtual disk that has the worstlatency among all the virtual disks.
5. To analyze the latency and throughput of the datastore over a period of time, click theWorkload Analyzer button on top of the datastore object icon. You go to the WorkloadAnalysis page, where you can select a time range and view the performance charts of thedatastore. For more information about workload analyzer, see Troubleshooting workloadsusing the workload analyzer.Troubleshooting workloads using the workload analyzer
Viewing expanded topology
You can drill down to each component separately by viewing the expanded topology of the VM.
1. From the summary topology view, click Expand Topology. You can see the detailed topologyof each component separately with the latency numbers for each object. If there are multiplenodes in a category, for example multiple nodes in the datastore or VMDK, the node withworst latency is highlighted in red.
2. To check the IO path of a specific object, click on that object to see the IO path and thecorresponding mapping. For example, to see the mapping of a virtual disk, click the virtualdisk to view its highlighted mapping to the respective VMDK. In case of a performance lag ofthese components, you can collect more data from ONTAP and troubleshoot the issue.
Note: Metrics are not reported for VMDKs. In the topology, only the VMDK names aredisplayed, and not metrics.
Related conceptsTroubleshooting workloads using the workload analyzer on page 38
The workload analyzer provides a way to view important health and performance criteria for asingle workload on a single page to assist in troubleshooting. By viewing all current and past
309Monitoring VMware virtual infrastructure

events for a workload you can get a better idea why the workload may be having a performance orcapacity issue now.
Viewing virtual infrastructure in a disaster recovery setupYou can view the configuration and performance metrics of the datastores hosted in aMetroCluster configuration or storage virtual machine (storage VM) disaster recovery (SVM DR)setup.
On Unified Manager, you can view the NAS volumes or LUNs in a MetroCluster configurationthat are attached as datastores in vCenter Server. The datastores hosted in a MetroClusterconfiguration are represented in the same topological view as a datastore in a standardenvironment.
You can also view the NAS volumes or LUNs in a storage VM disaster recovery configuration thatare mapped to the datastores in vCenter Server.
Viewing datastores in MetroCluster configuration
Note the following prerequisites before viewing datastores in a MetroCluster configuration:
• In an event of switchover and switchback, the discovery of the primary and secondary clustersof the HA pair, and vCenter Servers should be complete.
• The primary and secondary clusters of the HA pair, and vCenter Servers must be managed byUnified Manager. For information about MetroCluster support, see
Managing and monitoring MetroCluster configurations on page 336
• The required setup must be completed on ONTAP and vCenter Server. For information, seeONTAP and vCenter documentation.
ONTAP 9 Documentation Center
Follow these steps for viewing datastores:
1. On the VMWARE > Virtual Machines page, click the VM that hosts the datastore. Click theWorkload Analyzer or the datastore object link. In the standard scenario when the primarysite hosting the volume or LUN is functioning as expected, you can see the vServer clusterdetails of the primary site.
2. In case of a disaster, and a consecutive switchover to the secondary site, the datastore linkpoints to the performance metrics of the volume or LUN in the secondary cluster. This isreflected after the next cycle of clusters and vServer discovery (acquisition) is complete.
3. After a successful switchback, the datastore link again reflects the performance metrics of thevolume or LUN in the primary cluster. This is reflected after the next cycle of clusters andvServer discovery is complete.
Viewing datastores in storage VM disaster recovery configuration
Note the following prerequisites before viewing datastores in a storage VM disaster recoveryconfiguration:
• In an event of switchover and switchback, the discovery of the primary and secondary clustersof the HA pair, and vCenter Servers should be complete.
• Both the source and destination cluster and storage VM peers should be managed by UnifiedManager.
• The required setup must be completed on ONTAP and vCenter Server.
◦ For NAS (NFS and VMFS) datastores, in case of a disaster, the steps include bringing upthe secondary storage VM, verifying the data LIFs and routes, establishing lost connectionson vCenter Server, and starting the VMs.
For a switchback to the primary site, the data between the volumes should be synced beforethe primary site starts serving the data.
310Monitoring VMware virtual infrastructure

◦ For SAN (iSCSI and FC for VMFS) datastores, vCenter Server formats the mounted LUNin a VMFS format. In case of a disaster, the steps include bringing up the secondary storageVM, verifying the data LIFs and routes. If the iSCSI target IPs are different from theprimary LIFs, they need to be manually added. The new LUNs should be available asdevices under the iSCSI adapter of the storage adapter of the host. Thereafter, new VMFSdatastores with the new LUNs should be created and the old VMs registered with newnames. The VMs must be up and running.
In case of a recovery, the data between the volumes should be synced. New VMFSdatastores should again be created using the LUNs and the old VMs registered with newnames.
For information about the setup, see ONTAP and vCenter Server documentation.
ONTAP 9 Documentation Center
Follow these steps for viewing datastores:
1. On the VMWARE > Virtual Machines page, click the VM inventory that hosts the datastore.Click the datastore object link. In the standard scenario, you can see the performance data ofthe volumes and LUNs in the primary storage VM.
2. In case of a disaster, and a consecutive switchover to the secondary storage VM, the datastorelink points to the performance metrics of the volume or LUN in the secondary storage VM.This is reflected after the next cycle of clusters and vServer discovery (acquisition) iscomplete.
3. After a successful switchback, the datastore link again reflects the performance metrics of thevolume or LUN in the primary storage VM. This is reflected after the next cycle of clusters andvServer discovery is complete.
Unsupported scenarios
• For a MetroCluster configuration, note the following limitations:
◦ Clusters in only the NORMAL and SWITCHOVER states are taken up. Other states, such asPARTIAL_SWITCHOVER, PARTIAL_SWITCHBACK, and NOT_REACHABLE are not supported.
◦ Unless Automatic Switch Over (ASO) is enabled, if the primary cluster goes down, thesecondary cluster cannot be discovered, and the topology continues to point to the volumeor LUN in the primary cluster.
• For a storage VM disaster recovery configuration, note the following limitation:
◦ A configuration with Site Recovery Manager (SRM) or Storage Replication Adapter (SRA)enabled for a SAN storage environment is not supported.
311Monitoring VMware virtual infrastructure

Provisioning and managing workloads
The active management feature of Active IQ Unified Manager provides Performance ServiceLevels, Storage Efficiency Policies, and storage provider APIs for provisioning, monitoring, andmanaging storage workloads in a data center.
Note: Unified Manager provides this functionality by default. You can disable it from StorageManagement > Feature Settings if you do not plan to use this functionality.
When enabled, you can provision workloads on the ONTAP clusters managed by your instance ofUnified Manager. You can also assign policies, such as Performance Service Levels and StorageEfficiency Policies on the workloads and manage your storage environment based on thosepolicies.
This feature enables the following functions:
• Automatic discovery of storage workloads on the added clusters enabling easy storageworkload evaluation and deployment
• Provisioning NAS workloads supporting NFS and CIFS protocols
• Provisioning SAN workloads supporting iSCSI and FCP protocols
• Support for both NFS and CIFS protocols on the same file share
• Management of Performance Service Levels and Storage Efficiency Policies
• Assigning Performance Service Levels and Storage Efficiency Policies to storage workloads
The Provisioning, Storage > Workloads, and Policies options on the left pane of the UI enableyou to modify various configurations.
You can perform the following functions by using these options:
• View storage workloads on the Storage > Workloads page
• Create storage workloads from the Provision Workload page
• Create and manage Performance Service Levels from Policies
• Create and manage Storage Efficiency Policies from Policies
• Assign policies to storage workloads from the Workloads page
Related conceptsPolicy-based storage management on page 656
The Policy-based storage management option allows storage management based on service levelobjectives (SLOs). This option is enabled by default.
Related referenceDashboard page on page 34
The Dashboard page has "panels" that display the high level capacity, performance, and securityhealth of the clusters you are monitoring. This page also provides a Management Actions panelthat lists fixes that Unified Manager can make to resolve certain events.
Workloads overviewA workload represents the input/output (I/O) operations of a storage object, such as a volume orLUN. The way the storage is provisioned is based on the expected workload requirements.Workload statistics are tracked by Active IQ Unified Manager only after there is traffic to andfrom the storage object. For example, the workload IOPS and latency values are available afterusers start using a database or email application.
The Workloads page displays a summary of the storage workloads of the ONTAP clustersmanaged by Unified Manager. It provides cumulative at-a-glance information about the storage
312Provisioning and managing workloads

workloads that conform to the Performance Service Level, as well as the non-conforming storageworkloads. It also enables you to assess the total, available, and used capacity and performance(IOPS) of the clusters across your data center.
Note: It is recommended that you assess the number of storage workloads that are non-conforming, unavailable, or not managed by any Performance Service Level, and take thenecessary actions to ensure their conformance, capacity usage, and IOPS.
The Workloads page has the following two sections:
• Workloads overview: Provides an overview of the number of storage workloads on the ONTAPclusters managed by Unified Manager.
• Data center overview: Provides an overview of the capacity and IOPS of the storage workloadsin the data center. The relevant data is displayed at a data center level and for individual .
Workloads overview section
The workloads overview section provides cumulative at-a-glance information of the storageworkloads. The status of the storage workloads is displayed based on assigned and unassignedPerformance Service Levels.
• Assigned: The following statuses are reported for storage workloads on which PerformanceService Levels have been assigned:
◦ Conforming: Performance of storage workloads is based on the Performance ServiceLevels assigned to them. If the storage workloads are within the threshold latency definedin the associated Performance Service Levels, they are marked as "conforming". Theconforming workloads are marked in blue.
◦ Non-conforming: During performance monitoring, storage workloads are marked as "non-conforming" if the storage workloads latency exceeds the threshold latency defined in theassociated Performance Service Level. The non-conforming workloads are marked inorange.
◦ Unavailable: Storage workloads are marked as "unavailable" if they are offline, or if thecorresponding cluster is unreachable. The unavailable workloads are marked in red.
• Unassigned: Storage workloads that do not have a Performance Service Level assigned tothem, are reported as "unassigned". The number is conveyed by the information icon.
The total workload count is the sum total of the assigned and unassigned workloads.
You can click the total number of workloads displayed in this section, and view them on theWorkloads page.
The Conformance by Performance Service Levels subsection displays the total number ofavailable storage workloads:
• Conforming to each type of Performance Service Level
• For which there is a mismatch between the assigned and the recommended PerformanceService Levels
Data center overview section
The data center overview section graphically represents the available and used capacity, and IOPSfor all of the clusters in the data center. By using this data, you should manage the capacity andIOPS of the storage workloads. The section also displays the following information for the storageworkloads across all of the clusters:
• The total, available, and used capacity for all of the clusters in your data center
• The total, available, and used IOPS for all of the clusters in your data center
• The available and used capacity based on each Performance Service Level
• The available and used IOPS based on each Performance Service Level
313Provisioning and managing workloads

• The total space and IOPS used by the workloads that have no Performance Service Levelassigned
How data center capacity and performance is calculated based on Performance ServiceLevels
The used capacity and IOPS is retrieved in terms of the total used capacity and performance of allof the storage workloads in the clusters.
The available IOPS is calculated based on the expected latency and recommended PerformanceService Levels on the nodes. It includes the available IOPS for all of the Performance ServiceLevels whose expected latency is less than or equal to their own expected latency.
The available capacity is calculated based on the expected latency and recommended PerformanceService Levels on aggregates. It includes the available capacity for all of the Performance ServiceLevels whose expected latency is less than or equal to their own expected latency.
Viewing workloadsThe All Workloads view displays the list of all the workloads available on the clusters in a datacenter.
The All Workloads view lists the storage workloads associated with the ONTAP clusters managedby Unified Manager. The page also enables you to assign Storage Efficiency Policies (SEPs) andPerformance Service Levels (PSLs) to storage workloads.
When you add clusters to Unified Manager, the storage workloads on each cluster areautomatically discovered and displayed on this page, except FlexGroup volumes and itsconstituents.
Unified Manager begins to analyze the workloads for recommendation (recommended PSLs) onlyafter I/O operations start on the storage workloads. For the newly-discovered storage workloads onwhich there have been no I/O operations, the status is "Waiting for I/O". After I/O operationsbegin on the storage workloads, Unified Manager begins the analysis and the workload statuschanges to "Learning...". After the analysis is complete (within 24 hours from the beginning of theI/O operations), the recommended PSLs are displayed for the storage workloads.
Using the Workloads > All Workloads option, you can perform multiple tasks:
• Add or provision storage workloads
• View and filter the list of workloads
• Assign PSLs to storage workloads
• Evaluate system-recommended PSLs and assign them to workloads
• Assign SEPs to storage workloads
Adding or provisioning storage workloads
You can add or provision the storage workloads to supported LUNs (supporting both iSCSI andFCP protocols), NFS file shares, and SMB shares.
Viewing and filtering workloads
On the All Workloads screen, you can view all the workloads in your data center or search forspecific storage workloads based on either their PSLs or names. You can use the filter icon to enterspecific conditions for your search. You can search by different filter conditions, such as by thehost cluster or storage VM. The Capacity Total option allows filtering by the total capacity of theworkloads (by MB). However, in this case, the number of workloads returned might vary, becausethe total capacity is compared at a byte level.
For each workload, information, such as the host cluster and storage VM is displayed, along withthe assigned PSL and SEP.
314Provisioning and managing workloads

The page also enables you to view the performance details of a workload. You can view detailedinformation about the IOPS, capacity, and latency of the workload by clicking the Choose / OrderColumns button and selecting specific columns to view. The Performance View column displaysthe average and peak IOPS for a workload, and you can click the workload analyser icon to viewthe detailed IOPS analysis. The Analyze Workload button on the IOPS Analysis pop-up takes youto the Workload Analysis page, where you can select a time range and view the latency,throughput, and capacity trends for the selected workload. For more information about workloadanalyzer, see Troubleshooting workloads using the workload analyzer
Troubleshooting workloads using the workload analyzer
Analyzing performance and capacity criteria for a workload
You can view performance information about a workload to help with troubleshooting by clickingthe bar chart icon in the Performance View column. To view performance and capacity charts onthe Workload Analysis page to analyze the object, click the Analyze Workload button.
Related tasksCreating and editing Performance Service Levels on page 321
When the system-defined Performance Service Levels do not match your workload requirements,you can create your own Performance Service Levels that are optimized for your workloads.
Creating and editing Storage Efficiency Policies on page 323When the system-defined Storage Efficiency Policies do not match your workload requirements,you can create your own Storage Efficiency Policies that are optimized for your workloads.
Assigning policies to workloadsYou can assign Storage Efficiency Policies (SEPs) and Performance Service Levels (PSLs) tostorage workloads from the All Workloads page by using the different navigation options.
Assigning policies to a single workload
You can assign either a PSL or an SEP or both, to a single workload. Follow these steps:
1. Select the workload.
2. Click the edit icon next to the row, and then click Edit.
The Assigned Performance Service Level and Storage Efficiency Policy fields are enabled.
3. Select the required PSL or SEP, or both.
4. Click the check icon to apply the changes.
Note: You can also select a workload and click More Actions to assign the policies.
Assigning policies to multiple storage workloads
You can assign a PSL or an SEP to multiple storage workloads together. Follow these steps:
1. Select the check boxes for the workloads to which you want to assign the policy, or select allthe workloads in your data center.
2. Click More Actions.
3. For assigning a PSL, select Assign Performance Service Level. For assigning an SEP, selectAssign Storage Efficiency Policy. A pop-up is displayed for you to select the policy.
4. Select the appropriate policy and click Apply. The number of workloads on which the policiesare assigned are displayed. The workloads on which the policies are not assigned are alsolisted, with the cause.
Note: Applying policies on workloads in bulk might take some time depending on thenumber of workloads selected. You can click the Run in background button and continuewith other tasks while the operation runs in the background. When the bulk assignment iscomplete, you can view the completion status. If you are applying a PSL on multiple
315Provisioning and managing workloads

workloads, you cannot trigger another request when the previous job of bulk assignment isrunning.
Assigning system-recommended PSLs to workloads
You can assign system-recommended PSLs to those storage workloads in a data center that haveno PSLs assigned, or the assigned PSLs do not match the system recommendation. To use thisfunctionality, click the Assign System Recommended PSLs button. You do not have to selectspecific workloads.
The recommendation is internally determined by system analytics, and is skipped for thoseworkloads whose IOPS and other parameters do not coincide with the definitions of any availablePSL. Storage workloads with Waiting for I/O and Learning statuses are also excluded.
Note: There are special keywords that Unified Manager looks for in the workload name tooverride the system analytics and recommend a different PSL for the workload. When theworkload has the letters "ora" in the name, the Extreme Performance PSL is recommended.And when the workload has the letters "vm" in the name, the Performance PSL isrecommended.
Provisioning file share volumesYou can create file share volumes that support CIFS/SMB and NFS protocols, on an existingcluster and Storage Virtual Machine (storage VM) from the Provision Workload page.
Before you begin
• The storage VM must have space for provisioning the file share volume.
• Either or both of the SMB and NFS services should be enabled on your storage VM.
• For selecting and assigning the Performance Service Level (PSL) and Storage EfficiencyPolicy (SEP) on the workload, the policies must have been created before you start creating theworkload.
Steps
1. On the Provision Workload page, add the name of the workload that you want to create, andthen select the cluster from the available list.
2. Based on the cluster that you have selected, the STORAGE VM field filters the availablestorage VMs for that cluster. Select the required storage VM from the list.Based on the SMB and NFS services supported on the storage VM, the NAS option is enabledin the Host Information section.
3. In the Storage and Optimization section, assign the storage capacity and PSL, and optionally,an SEP for the workload.
The specifications for the SEP are assigned to the LUN and the definitions for the PSL areapplied to the workload when it is created.
4. Select the Enforce performance limits check box if you want to enforce the PSL that youhave assigned to the workload.
Assigning a PSL to a workload ensures that the aggregate on which the workload is created cansupport the performance and capacity objectives defined in the respective policy. For example,if a workload is assigned "Extreme Performance" PSL, the aggregate on which the workload isto be provisioned should have the capability of supporting the performance and capacityobjectives of the "Extreme Performance" policy, such as SSD storage.
Note: Unless you select this check box, the PSL is not applied to the workload, and thestatus of the workload on the dashboard appears as unassigned.
5. Select the NAS option.
316Provisioning and managing workloads

If you cannot see the NAS option enabled, verify whether the storage VM that you haveselected supports either SMB or NFS, or both.
Note: If your storage VM is enabled for both SMB and NFS services, you can select theShare by NFS and Share by SMB check boxes and create a file share that supports bothNFS and SMB protocols. If you want to create either an SMB or a CIFS share, select onlythe respective check box.
6. For NFS file share volumes, specify the IP address of the host or network to access the fileshare volume. You can enter comma-separated values for multiple hosts.On adding the host IP address, an internal check runs for matching the host details with thestorage VM and the export policy for that host is created, or in case there is an existing policy,it is reused. If there are several NFS shares created for the same host, then an available exportpolicy for the same host with matching rules is reused for all the files shares. The function ofspecifying rules of individual policies or reusing policies by providing specific policy keys isavailable when you provision the NFS share by using APIs.
7. For an SMB share, specify which users or user groups can access the SMB share and assign therequired permissions. For each group of users, a new access control list (ACL) is generatedduring the file share creation.
8. Click Save.The workload is added to the list of storage workloads.
Related tasksCreating and editing Performance Service Levels on page 321
When the system-defined Performance Service Levels do not match your workload requirements,you can create your own Performance Service Levels that are optimized for your workloads.
Creating and editing Storage Efficiency Policies on page 323When the system-defined Storage Efficiency Policies do not match your workload requirements,you can create your own Storage Efficiency Policies that are optimized for your workloads.
Provisioning LUNsYou can create LUNs that support CIFS/SMB and NFS protocols, on an existing cluster andStorage Virtual Machine (storage VM) from the Provision Workload page.
Before you begin
• The storage VM must have space for provisioning the LUN.
• Both iSCSI and FCP must be enabled on the storage VM on which you create the LUN.
• For selecting and assigning the Performance Service Level (PSL) and Storage EfficiencyPolicy (SEP) on the workload, the policies must have been created before you start creating theworkload.
Steps
1. On the Provision Workload page, add the name of the workload that you want to create, andthen select the cluster from the available list.Based on the cluster that you have selected, the STORAGE VM field filters the availablestorageVMs for that cluster.
2. Select the storage VM from the list that supports the iSCSI and FCP services.Based on your selection, the SAN option is enabled in the Host Information section.
3. In the Storage and Optimization section, assign the storage capacity and PSL, and optionally,the SEP for the workload.
The specifications for the SEP are assigned to the LUN and the definitions for the PSL areapplied to the workload when it is created.
317Provisioning and managing workloads

4. Select the Enforce performance limits check box if you want to enforce the assigned PSL onthe workload.
Assigning a PSL to a workload ensures that the aggregate on which the workload is created cansupport the performance and capacity objectives defined in the respective policy. For example,if a workload is assigned the "Extreme Performance" PSL, the aggregate on which theworkload is to be provisioned should have the capability of supporting the performance andcapacity objectives of the "Extreme Performance" policy, such as SSD storage.
Note: Unless you select this check box, the PSL is not applied to the workload, and thestatus of the workload on the dashboard appears as unassigned.
5. Select the SAN option. If you cannot see the SAN option enabled, verify whether the storageVM that you have selected supports iSCSI and FCP.
6. Select the host OS.
7. Specify the host mapping to control access of the initiators to the LUN. You can assign existinginitiator groups (igroups), or define and map new igroups.
Note: If you create a new igroup while provisioning the LUN, you need to wait till the nextdiscovery cycle (up to 15 minutes) for using it. It is therefore recommended that you use anexisting igroup from the list of available igroups.
If you want to create a new igroup, select the Create a new initiator group button, and enterthe information for the igroup.
8. Click Save.The LUN is added to the list of storage workloads.
Related tasksCreating and editing Performance Service Levels on page 321
When the system-defined Performance Service Levels do not match your workload requirements,you can create your own Performance Service Levels that are optimized for your workloads.
Creating and editing Storage Efficiency Policies on page 323When the system-defined Storage Efficiency Policies do not match your workload requirements,you can create your own Storage Efficiency Policies that are optimized for your workloads.
Managing Performance Service LevelsA Performance Service Level enables you to define the performance and storage objectives for aworkload. You can assign a Performance Service Level to a workload when initially creating theworkload, or afterwards by editing the workload.
The management and monitoring of storage resources are based on Service Level Objectives(SLOs). SLOs are defined by service level agreements that are based on required performance andcapacity. In Unified Manager, SLOs refer to the PSL definitions of the applications that arerunning on NetApp storage. Storage services are differentiated based on the performance andutilization of the underlying resources. A PSL is a description of the storage service objectives. APSL enables the storage provider to specify the performance and capacity objectives for theworkload.
Unified Manager provides a few canned policies that cannot be changed. These predefinedPerformance Service Levels are: Extreme Performance, Performance, and Value. The ExtremePerformance, Performance, and Value PSLs are applicable for most of the common storageworkloads in a data center. Unified Manager also offers three PSLs for database applications:Extreme for Database Logs, Extreme for Database Shared Data, and Extreme for Database Data.These are extremely high-performance PSLs that support bursty IOPS and are appropriate fordatabase applications with the highest throughput demand. If these predefined PSLs do not meetyour requirements, then you can create new PSLs to meet your needs.
318Provisioning and managing workloads

You can access the PSLs from the Policies > Performance Service Levels page and by using thestorage provider APIs. Managing storage workloads by assigning PSLs to them is convenient asyou do not have to individually manage the storage workloads. Any modifications can also bemanaged by reassigning another PSL rather than managing them individually.
You cannot modify a PSL that is system-defined or that is currently assigned to a workload. Youcannot delete a PSL that is assigned to a workload, or if it is the only available PSL.
The Performance Service Levels page lists the available PSL policies and enables you to add, edit,and delete them. This page displays the following information:
Field Description
Name Name of the Performance Service Level.
Type Whether the policy is system-defined or user-defined.
Expected IOPS Minimum number of IOPS that an application is expected to perform on a LUN orfile share. Expected IOPS specifies the minimum expected IOPS allocated, basedon the storage object allocated size.
Peak IOPS Maximum number of IOPS that an application can perform on a LUN or file share.Peak IOPS specifies the maximum possible IOPS allocated, based on the storageobject allocated size or the storage object used size.
Peak IOPS are based on an allocation policy. The allocation policy is eitherallocated-space or used-space. When the allocation policy is set to allocated-space,the peak IOPS is calculated based on the size of the storage object. When theallocation policy is set to used-space, the peak IOPS is calculated based on theamount of data stored in the storage object, taking into account storage efficiencies.By default, the allocation policy is set to used-space.
Absolute minimum IOPS The absolute minimum IOPS is used as an override, when the expected IOPS is lessthan this value. The default values of the system-defined PSLs are the following:
• Extreme Performance: If expected IOPS >= 6144/TB, then absolute minimumIOPS = 1000
• Performance: If expected IOPS >= 2048/TB and < 6144/TB, then absoluteminimum IOPS = 500
• Value: If expected IOPS >= 128/TB and < 2048/TB, then absolute minimumIOPS = 75
The default values of the system-defined database PSLs are the following:
• Extreme for Database Logs: If expected IOPS >= 22528, then absoluteminimum IOPS = 4000
• Extreme for Database Shared Data: If expected IOPS >= 16384, then absoluteminimum IOPS = 2000
• Extreme for Database Data: If expected IOPS >= 12288, then absoluteminimum IOPS = 2000
The higher value of the absolute minimum IOPS for custom PSLs can be amaximum of 75000. The lower value is calculated as the following:
1000/expected latency
Expected latency Expected latency for storage IOPS in milliseconds per operation (ms/op).
Capacity Total available and used capacity in the clusters.
Workloads Number of storage workloads that have been assigned the PSL.
319Provisioning and managing workloads

For information about how the peak IOPS and expected IOPs help in achieving consistentdifferentiated performance on ONTAP clusters, see the following KB article:
What is Performance Budgeting?
Note that if workloads exceed the expected latency value for 30% of the time during the previoushour, Unified Manager will generate one of the following events to notify you of a potentialperformance issue: "Workload Volume Latency Threshold Breached as defined by PerformanceService Level Policy" or "Workload LUN Latency Threshold Breached as defined by PerformanceService Level Policy". You may want to analyze the workload to see what may be causing thehigher latency values.
The following table provides information about the system-defined PSLs:
PerformanceService Level
Description and use case Expectedlatency(ms/op)
Peak IOPS ExpectedIOPS
Absoluteminimum IOPS
ExtremePerformance
Provides extremely highthroughput at a very lowlatency
Ideal for latency-sensitiveapplications
1 12288 6144 1000
Performance Provides high throughput ata low latency
Ideal for database andvirtualized applications
2 4096 2048 500
Value Provides high storagecapacity and moderatelatency
Ideal for high-capacityapplications such as email,web content, file shares,and backup targets
17 512 128 75
Extreme forDatabase Logs
Provides maximumthroughput at the lowestlatency.
Ideal for databaseapplications supportingdatabase logs. This PSLprovides the highestthroughput becausedatabase logs are extremelybursty and logging isconstantly in demand.
1 45056 22528 4000
Extreme forDatabase SharedData
Provides very highthroughput at the lowestlatency.
Ideal for databaseapplications data that isstored in a common datastore, but is shared acrossdatabases.
1 32768 16384 2000
320Provisioning and managing workloads

PerformanceService Level
Description and use case Expectedlatency(ms/op)
Peak IOPS ExpectedIOPS
Absoluteminimum IOPS
Extreme forDatabase Data
Provides high throughput atthe lowest latency.
Ideal for databaseapplications data, such asdatabase table informationand metadata.
1 24576 12288 2000
Related tasksCreating and editing Performance Service Levels on page 321
When the system-defined Performance Service Levels do not match your workload requirements,you can create your own Performance Service Levels that are optimized for your workloads.
Creating and editing Performance Service LevelsWhen the system-defined Performance Service Levels do not match your workload requirements,you can create your own Performance Service Levels that are optimized for your workloads.
Before you begin
• You must have the Application Administrator role.
• The Performance Service Level name must be unique, and you cannot use the followingreserved keywords:
Prime, Extreme, Performance, Value, Unassigned, Learning, Idle, Default,and None.
About this task
You create and edit custom Performance Service Levels from the Performance Service Levelspage by defining the service level objectives you require for the applications that will accessstorage.
Note: You cannot modify a Performance Service Level if it is currently assigned to a workload.
Steps
1. In the left navigation pane under Settings, select Policies > Performance Service Levels.
2. In the Performance Service Levels page, click the appropriate button depending on whetheryou want to create a new Performance Service Level or if you want to edit an existingPerformance Service Level.
To... Follow these steps...
Create a new Performance Service Level Click Add.
Edit an existing Performance ServiceLevel
Select an existing Performance Service Level, and then click Edit.
The page to add or edit a Performance Service Level is displayed.
3. Customize the Performance Service Level by specifying the performance objectives, and thenclick Submit to save the Performance Service Level.
After you finish
You can apply the new or changed Performance Service Level to workloads (LUNs, NFS FileShares, CIFS Shares) from the Workloads page or when provisioning a new workload.
321Provisioning and managing workloads

Related conceptsManaging Performance Service Levels on page 318
A Performance Service Level enables you to define the performance and storage objectives for aworkload. You can assign a Performance Service Level to a workload when initially creating theworkload, or afterwards by editing the workload.
Viewing workloads on page 314The All Workloads view displays the list of all the workloads available on the clusters in a datacenter.
Related tasksProvisioning LUNs on page 317
You can create LUNs that support CIFS/SMB and NFS protocols, on an existing cluster andStorage Virtual Machine (storage VM) from the Provision Workload page.
Provisioning file share volumes on page 316You can create file share volumes that support CIFS/SMB and NFS protocols, on an existingcluster and Storage Virtual Machine (storage VM) from the Provision Workload page.
Managing Storage Efficiency PoliciesA Storage Efficiency Policy (SEP) enables you to define the storage efficiency characteristics of aworkload. You can assign an SEP to a workload when initially creating the workload, orafterwards by editing the workload.
Storage efficiency includes using technologies, such as thin provisioning, deduplication, and datacompression that increase storage utilization and decrease storage costs. While creating SEPs, youcan use these space-saving technologies either individually or together to achieve maximumstorage efficiency. When you associate the policies with your storage workloads, the specifiedpolicy settings are assigned to them. Unified Manager enables you to assign system-defined anduser-defined SEPs to optimize storage resources in your data center.
Unified Manager provides two system-defined SEPs: High and Low. These SEPs are applicable tomost of the storage workloads in a data center, however, you can create your own policies if thesystem-defined SEPs do not meet your requirements.
You cannot modify an SEP that is system-defined or that is currently assigned to a workload. Youcannot delete an SEP that is assigned to a workload, or if it is the only available SEP.
The Storage Efficiency Policies page lists the available SEPs and enables you to add, edit, anddelete customized SEPs. This page displays the following information:
Field Description
Name Name of the SEP.
Type Whether the policy is system-defined or user-defined.
Space Reserve Whether the volume is thin-provisioned or thick-provisioned.
Deduplication Whether deduplication is enabled on the workload:
• Inline: Deduplication occurs while being written on the workload
• Background: Deduplication occurs in the workload
• Disable: Deduplication is disabled on the workload
322Provisioning and managing workloads

Field Description
Compression Whether data compression is enabled on the workload:
• Inline: Data compression occurs while being written on the workload
• Background: Data compression occurs in the workload
• Disable: Data compression is disabled on the workload
Workloads Number of storage workloads that have been assigned the SEP
Guidelines for creating a custom Storage Efficiency Policy
If the existing SEPs do not meet policy requirements for your storage workloads, you can create acustom SEP. However, it is recommended that you attempt to use the system-defined SEPs foryour storage workloads, and only create custom SEPs if necessary.
You can view the SEP assigned to workloads in the All Workloads page and in the Volume /Health details page. You can view the cluster-level data reduction ratio based on these storageefficiencies in the Capacity panel on the Dashboard and in the Capacity: All Clusters view.
Related tasksCreating and editing Storage Efficiency Policies on page 323
When the system-defined Storage Efficiency Policies do not match your workload requirements,you can create your own Storage Efficiency Policies that are optimized for your workloads.
Creating and editing Storage Efficiency PoliciesWhen the system-defined Storage Efficiency Policies do not match your workload requirements,you can create your own Storage Efficiency Policies that are optimized for your workloads.
Before you begin
• You must have the Application Administrator role.
• The Storage Efficiency Policy name must be unique, and you cannot use the followingreserved keywords:
High, Low, Unassigned, Learning, Idle, Default, and None.
About this task
You create and edit custom Storage Efficiency Policies from the Storage Efficiency Policies pageby defining the storage efficiency characteristics you require for the applications that will accessstorage.
Note: You cannot modify a Storage Efficiency Policy if it is currently assigned to a workload.
Steps
1. In the left navigation pane under Settings, select Policies > Storage Efficiency.
2. In the Storage Efficiency Policies page, click the appropriate button depending on whetheryou want to create a new Storage Efficiency Policy or if you want to edit an existing StorageEfficiency Policy.
To... Follow these steps...
Create a new Storage Efficiency Policy Click Add
Edit an existing Storage Efficiency Policy Select an existing Storage Efficiency Policy and click Edit
The page to add or edit a Storage Efficiency Policy is displayed.
323Provisioning and managing workloads

3. Customize the Storage Efficiency Policy by specifying the storage efficiency characteristics,and then click Submit to save the Storage Efficiency Policy.
After you finish
You can apply the new or changed Storage Efficiency Policy to workloads (LUNs, NFS FileShares, CIFS Shares) from the Workloads page or when provisioning a new workload.
Related conceptsManaging Storage Efficiency Policies on page 322
A Storage Efficiency Policy (SEP) enables you to define the storage efficiency characteristics of aworkload. You can assign an SEP to a workload when initially creating the workload, orafterwards by editing the workload.
Viewing workloads on page 314The All Workloads view displays the list of all the workloads available on the clusters in a datacenter.
Related tasksProvisioning LUNs on page 317
You can create LUNs that support CIFS/SMB and NFS protocols, on an existing cluster andStorage Virtual Machine (storage VM) from the Provision Workload page.
Provisioning file share volumes on page 316You can create file share volumes that support CIFS/SMB and NFS protocols, on an existingcluster and Storage Virtual Machine (storage VM) from the Provision Workload page.
324Provisioning and managing workloads

Managing reports
Active IQ Unified Manager enables you to create and manage reports directly from the UnifiedManager user interface so that you can view information about the health, capacity, performance,and protection relationships of storage objects in your clusters. Reviewing this information canhelp you to identify potential problems before they occur.
You can download reports as comma-separated values (.csv), Microsoft Excel (.xlsx), or PDF files.You can also schedule a report to be sent using email to a group of recipients. The reports are sentas email attachments.
In addition to generating reports from the user interface, you can extract health and performancedata from Unified Manager using these additional methods:
• Using Open Database Connectivity (ODBC) and ODBC tools to directly access the databasefor cluster information
• Executing Unified Manager REST APIs to return the information you are interested inreviewing
Related conceptsUnified Manager databases accessible for custom reporting on page 334
Unified Manager uses a MySQL database to store data from the clusters that it is monitoring. Datais persisted into various schemas in the MySQL database.
Using Unified Manager REST APIs on page 19Active IQ Unified Manager provides you with REST APIs to view the information aboutmonitoring and managing your storage environment. APIs also allow provisioning and managingstorage objects based on policies.
Related tasksExporting storage data as reports on page 27
You can export storage data in a variety of output formats and then use the exported data to buildreports. For example, if there are 10 critical events that have not been resolved, you can export thedata from the Event Management inventory page to create a report, and then send the report toadmins who can resolve the issues.
Understanding the view and report relationshipViews and inventory pages become reports when you download or schedule them.
You can customize and save views and inventory pages for reuse. Almost everything you can viewin Unified Manager can be saved, reused, customized, scheduled, and shared as a report.
In the view drop down, items with the delete icon are existing custom views that you or anotheruser have created. Items without an icon are default views provided with Unified Manager. Defaultviews cannot be modified or deleted.
Note:
• If you delete a custom view from the list, it also deletes any Excel files or scheduled reportsthat use that view.
• If you change a custom view, reports that use that view will reflect the change the next timethe report is generated and sent by email according to the report schedule. When changingviews, make sure your changes work with any associated Excel customizations used for thereports. If needed, you can update the Excel file by downloading it, making the requiredchanges, and uploading it as a new Excel customization for the view.
325Managing reports

Only users with the Application Administrator or Storage Administrator role can see the deleteicon, change or delete a view, or change or delete a scheduled report.
Types of reportsThis table provides a comprehensive list of the views and inventory pages that are available asreports that you can customize, download, and schedule.
Active IQ Unified Manager reports
Type Storage or network object
Capacity Clusters
Aggregates
Volumes
Qtrees
Health Clusters
Nodes
Aggregates
Storage VMs
Volumes
SMB/CIFS shares
NFS shares
Performance Clusters
Nodes
Aggregates
Storage VMs
Volumes
LUNs
NVMe namespaces
Network Interfaces (LIFs)
Ports
Quality of Service Traditional QoS policy groups
Adaptive QoS policy groups
Performance Service Level policy groups
326Managing reports

Type Storage or network object
Volume protection relationships
(available from the Volumes page)
All relationships
Last 1 month transfer status
Last 1 month transfer rate
Report workflowDecision tree that describes the report workflow.
Reporting quick startCreate a sample custom report to experience exploring views and scheduling reports. This quickstart report finds a list of volumes that you might want to move to the cloud tier because there is afair amount of inactive (cold) data. You will open the Performance: All Volumes view, customizethe view using filters and columns, save the custom view as a report, and schedule the report toshare once a week.
327Managing reports

Before you begin
• You must have the Application Administrator or Storage Administrator role.
• You must have configured FabricPool aggregates and have volumes on those aggregates.
About this task
Follow the steps below to:
• Open the default view
• Customize the columns by filtering and sorting the data
• Save the view
• Schedule a report to be generated for the custom view
Steps
1. In the left navigation pane, click Storage > Volumes.
2. In the View menu, select Performance > All Volumes.
3. Click Show/Hide to make sure the "Disk Types" column appears in the view.
Add or remove other columns to create a view that contains the fields that are important foryour report.
4. Drag the "Disk Types" column next to the "Cloud Recommendation" column.
5. Click the filter icon to add the following three filters, and then click Apply Filter:
• Disk Types contains fabricpool
• Cloud Recommendation contains tier
• Cold Data greater than 10 GB
328Managing reports

Note that each filter is joined with a logical AND so that all volumes returned must meet allthe criteria. You can add a maximum of five filters.
6. Click the top of the Cold Data column to sort the results so that the volumes with the mostcold data appear at the top of the view.
7. When the view is customized, the view name is Unsaved View. Name the view to reflectwhat the view is showing, for example "Vols change tiering policy". When done, click thecheck mark or press Enter to save the view with the new name.
8. Download the report as a CSV, Excel, or PDF file to see the output before you schedule orshare it.Open the file with an installed application, such as Microsoft Excel (CSV or Excel) or AdobeAcrobat (PDF), or save the file.
Note: You can further customize your report using complex filters, sorts, pivot tables, orcharts by downloading the view as an Excel file. After you open the file in Excel, use theadvanced features to customize your report. When satisfied, upload the Excel file. Thisfile, with its customizations, is applied to the view when the report is run.
For more information on customizing reports using Excel, see Sample Microsoft Excelreports.
9. Click the Scheduled Reports button on the inventory page. All scheduled reports relating tothe object, in this case volumes, appear in the list.
329Managing reports
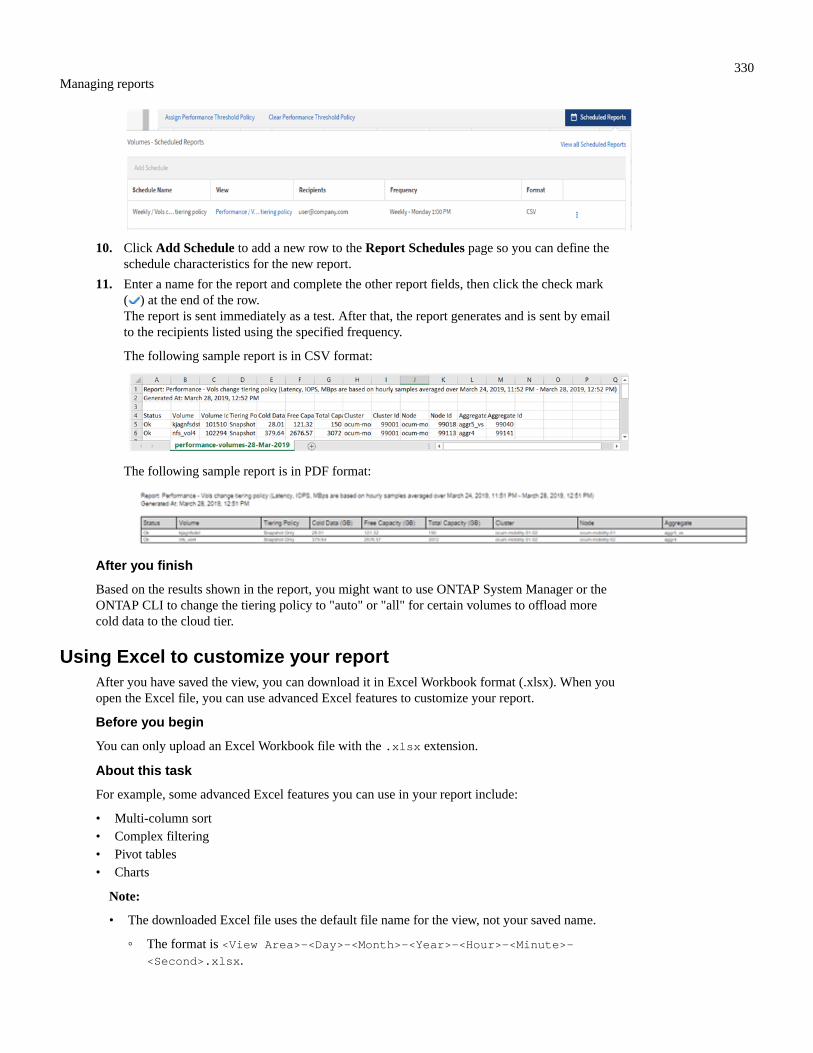
10. Click Add Schedule to add a new row to the Report Schedules page so you can define theschedule characteristics for the new report.
11. Enter a name for the report and complete the other report fields, then click the check mark( ) at the end of the row.The report is sent immediately as a test. After that, the report generates and is sent by emailto the recipients listed using the specified frequency.
The following sample report is in CSV format:
The following sample report is in PDF format:
After you finish
Based on the results shown in the report, you might want to use ONTAP System Manager or theONTAP CLI to change the tiering policy to "auto" or "all" for certain volumes to offload morecold data to the cloud tier.
Using Excel to customize your reportAfter you have saved the view, you can download it in Excel Workbook format (.xlsx). When youopen the Excel file, you can use advanced Excel features to customize your report.
Before you begin
You can only upload an Excel Workbook file with the .xlsx extension.
About this task
For example, some advanced Excel features you can use in your report include:
• Multi-column sort
• Complex filtering
• Pivot tables
• Charts
Note:
• The downloaded Excel file uses the default file name for the view, not your saved name.
◦ The format is <View Area>-<Day>-<Month>-<Year>-<Hour>-<Minute>-<Second>.xlsx.
330Managing reports

◦ For example, a custom saved view named Volumes-not online has a file name ofhealth-volumes-05-May-2020-19-18-00.xlsx if saved at that day and time.
• You can add sheets to the Excel file, but do not change existing sheets.
◦ Do not change the existing sheets, data and info. Instead, copy the data to a new pagethat you create.
◦ One exception to the above rule is that you can create formulas on the "data" page. Usethe data page formulas to create charts on new pages.
◦ Do not name a new sheet data or info.
• If a customized Excel file exists, there is a check mark beside the Reports > Upload Excelmenu item. When you download the Excel file, the version with the customizations is used.
Steps
1. Open the default, custom, or saved view that you want to use as the basis of your report.
2. Select Reports > Download Excel.
3. Save the file.The file is saved to your downloads folder.
4. Open the saved file in Excel.Do not move the file to a new location, or if you do your work in another location, save the fileback to the original location using the original file name before uploading the file.
5. Customize the file using Excel features, such as complex sorts, layered filters, pivot tables, orcharts. For more information, see the Microsoft® Excel documentation.
6. Select Reports > Upload Excel and select the file that you modified.The most recently downloaded file is uploaded from the same file location.
7. Send yourself a test report using the Scheduled Reports feature.
Searching for a scheduled reportYou can search for scheduled reports by name, view name, object type, or recipients.
Steps
1. In the left navigation pane, click Storage Management > Report Schedules.
2. Use the Search Scheduled Reports text field.
To find reports by ... Try ...
Schedule name Type part of the report schedule name.
View name Type part of the report view name. Default views and custom views appear in theview list.
331Managing reports
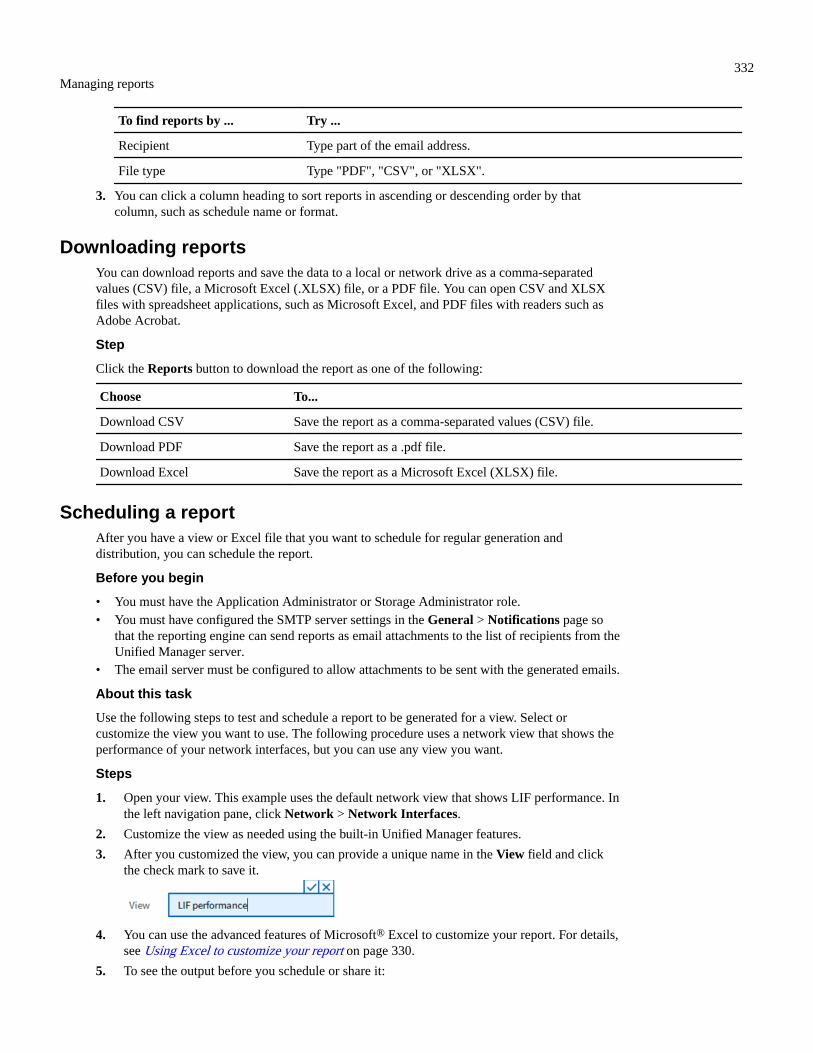
To find reports by ... Try ...
Recipient Type part of the email address.
File type Type "PDF", "CSV", or "XLSX".
3. You can click a column heading to sort reports in ascending or descending order by thatcolumn, such as schedule name or format.
Downloading reportsYou can download reports and save the data to a local or network drive as a comma-separatedvalues (CSV) file, a Microsoft Excel (.XLSX) file, or a PDF file. You can open CSV and XLSXfiles with spreadsheet applications, such as Microsoft Excel, and PDF files with readers such asAdobe Acrobat.
Step
Click the Reports button to download the report as one of the following:
Choose To...
Download CSV Save the report as a comma-separated values (CSV) file.
Download PDF Save the report as a .pdf file.
Download Excel Save the report as a Microsoft Excel (XLSX) file.
Scheduling a reportAfter you have a view or Excel file that you want to schedule for regular generation anddistribution, you can schedule the report.
Before you begin
• You must have the Application Administrator or Storage Administrator role.
• You must have configured the SMTP server settings in the General > Notifications page sothat the reporting engine can send reports as email attachments to the list of recipients from theUnified Manager server.
• The email server must be configured to allow attachments to be sent with the generated emails.
About this task
Use the following steps to test and schedule a report to be generated for a view. Select orcustomize the view you want to use. The following procedure uses a network view that shows theperformance of your network interfaces, but you can use any view you want.
Steps
1. Open your view. This example uses the default network view that shows LIF performance. Inthe left navigation pane, click Network > Network Interfaces.
2. Customize the view as needed using the built-in Unified Manager features.
3. After you customized the view, you can provide a unique name in the View field and clickthe check mark to save it.
4. You can use the advanced features of Microsoft® Excel to customize your report. For details,see Using Excel to customize your report on page 330.
5. To see the output before you schedule or share it:
332Managing reports

Option Description
If you used Excel to customizethe report
View the existing downloaded Excel file.
If you did not use Excel tocustomize the report
Download the report as a CSV, PDF or XLSX file.
Open the file with an installed application, such as Microsoft Excel (CSV/XSLX) or AdobeAcrobat (PDF).
6. If you are satisfied with the report, click Scheduled Reports.
7. In the Report Schedules page, click Add Schedule.
8. Accept the default name, which is a combination of the view name and the frequency, orcustomize the schedule name.
9. To test the scheduled report the first time, only add yourself as the recipient. When satisfied,add the email addresses for all report recipients.
10. Specify how frequently the report will be generated and sent to the recipients. You canchoose Daily, Weekly, or Monthly.
11. Select the format, either PDF, CSV, or XSLX.
Note: For reports where you used Excel to customize the content, always select XSLX.
12. Click the checkmark ( ) to save the report schedule.
The report is sent immediately as a test. After that, the report generates and is sent by emailto the recipients listed using the scheduled frequency.
Managing report schedulesYou can manage your report schedules from the Report Schedules page. You can view, modify, ordelete existing schedules.
Before you begin
Note: You cannot schedule new reports from the Report Schedules page. You can only addscheduled reports from the object inventory pages.
• You must have the Application Administrator or Storage Administrator role.
Steps
1. In the left navigation pane, click Storage Management > Report Schedules.
2. On the Report Schedules page:
If you want to... Then...
View an existing schedule Scroll through the list of existing reports using the scroll bars and page controls.
333Managing reports
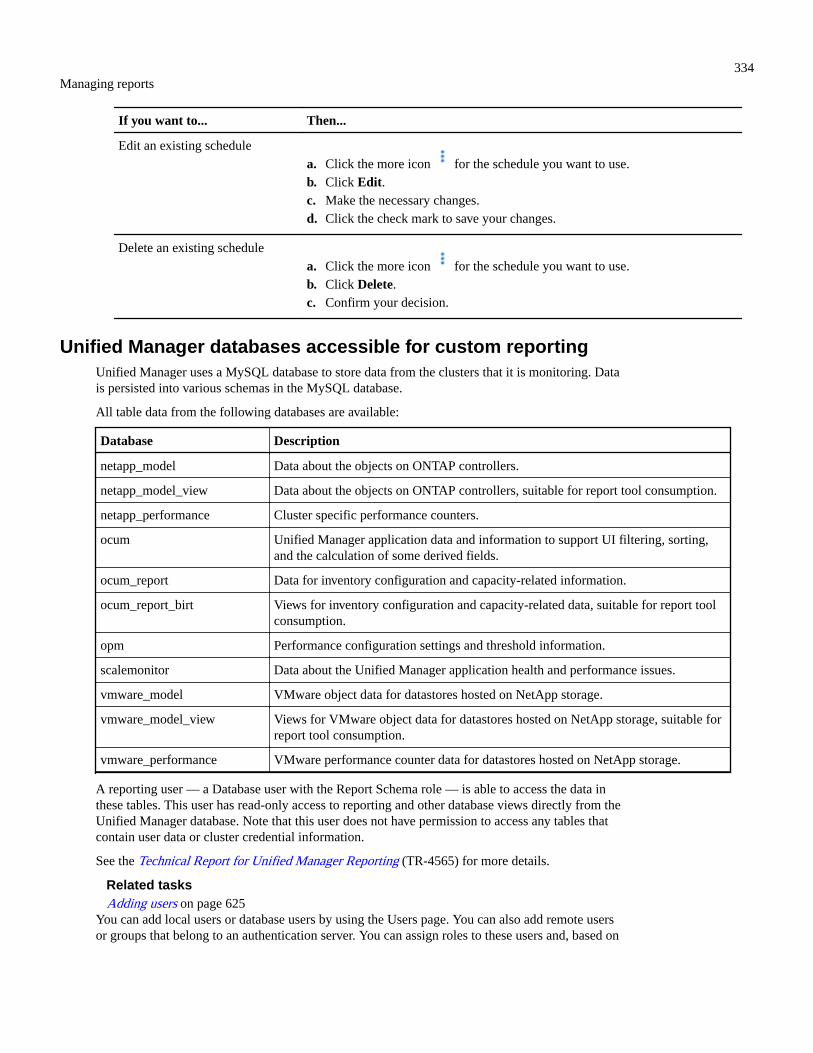
If you want to... Then...
Edit an existing schedule
a. Click the more icon for the schedule you want to use.
b. Click Edit.
c. Make the necessary changes.
d. Click the check mark to save your changes.
Delete an existing schedule
a. Click the more icon for the schedule you want to use.
b. Click Delete.
c. Confirm your decision.
Unified Manager databases accessible for custom reportingUnified Manager uses a MySQL database to store data from the clusters that it is monitoring. Datais persisted into various schemas in the MySQL database.
All table data from the following databases are available:
Database Description
netapp_model Data about the objects on ONTAP controllers.
netapp_model_view Data about the objects on ONTAP controllers, suitable for report tool consumption.
netapp_performance Cluster specific performance counters.
ocum Unified Manager application data and information to support UI filtering, sorting,and the calculation of some derived fields.
ocum_report Data for inventory configuration and capacity-related information.
ocum_report_birt Views for inventory configuration and capacity-related data, suitable for report toolconsumption.
opm Performance configuration settings and threshold information.
scalemonitor Data about the Unified Manager application health and performance issues.
vmware_model VMware object data for datastores hosted on NetApp storage.
vmware_model_view Views for VMware object data for datastores hosted on NetApp storage, suitable forreport tool consumption.
vmware_performance VMware performance counter data for datastores hosted on NetApp storage.
A reporting user — a Database user with the Report Schema role — is able to access the data inthese tables. This user has read-only access to reporting and other database views directly from theUnified Manager database. Note that this user does not have permission to access any tables thatcontain user data or cluster credential information.
See the Technical Report for Unified Manager Reporting (TR-4565) for more details.
Related tasksAdding users on page 625
You can add local users or database users by using the Users page. You can also add remote usersor groups that belong to an authentication server. You can assign roles to these users and, based on
334Managing reports

the privileges of the roles, users can manage the storage objects and data with Unified Manager, orview the data in a database.
Report Schedules pageThe Report Schedules page enables you to view detailed information about the reports that youhave created and the schedule at which they are generated. You can search for a specific report,modify certain attributes of a report schedule, and delete a report schedule.
The Report Schedules page displays the list of reports that have been created on the system.
Schedule Name
The name of the scheduled report. Initially this name includes the View name and thefrequency. You can change this name to better reflect the report contents.
View
The View that was used to create the report.
Recipients
The email addresses of users who will receive the generated report. Each email addressmust be separated by a comma.
Frequency
How frequently the report is generated and sent to the recipients.
Format
Whether the report is generated as a PDF file or in XLSX or CSV format.
Action button
Options available to edit or delete the report schedule.
Related conceptsUnified Manager databases accessible for custom reporting on page 334
Unified Manager uses a MySQL database to store data from the clusters that it is monitoring. Datais persisted into various schemas in the MySQL database.
Using Unified Manager REST APIs on page 19Active IQ Unified Manager provides you with REST APIs to view the information aboutmonitoring and managing your storage environment. APIs also allow provisioning and managingstorage objects based on policies.
Related tasksExporting storage data as reports on page 27
You can export storage data in a variety of output formats and then use the exported data to buildreports. For example, if there are 10 critical events that have not been resolved, you can export thedata from the Event Management inventory page to create a report, and then send the report toadmins who can resolve the issues.
Scheduling a report on page 332After you have a view or Excel file that you want to schedule for regular generation anddistribution, you can schedule the report.
335Managing reports

Managing and monitoring MetroCluster configurations
The monitoring support for MetroCluster configurations in the Unified Manager web UI enablesyou to check for any connectivity issues in your MetroCluster configuration. Discovering aconnectivity issue early enables you to manage your MetroCluster configurations effectively.
Parts of a fabric MetroCluster configurationAs you plan your MetroCluster configuration, you should understand the hardware componentsand how they interconnect.
Disaster Recovery (DR) groups
A fabric MetroCluster configuration consists of one or two DR groups, depending on the numberof nodes in the MetroCluster configuration. Each DR group consists of four nodes.
• An eight-node MetroCluster configuration consists of two DR groups.
• A four-node MetroCluster configuration consists of one DR group.
The following illustration shows the organization of nodes in an eight-node MetroClusterconfiguration:
cluster_Bcluster_A
DR Group One
DR Group Two
node_A_1
node_A_2
node_B_1
node_B_2
HA pairHA pair
DR pair
DR pair
node_A_3
node_A_4
node_B_3
node_B_4
HA pairHA pair
DR pair
DR pair
336Managing and monitoring MetroCluster configurations

The following illustration shows the organization of nodes in a four-node MetroClusterconfiguration:
cluster_Bcluster_A
DR Group One
node_A_1
node_A_2
node_B_1
node_B_2
HA pairHA pair
DR pair
DR pair
Key hardware elements
A MetroCluster configuration includes the following key hardware elements:
• Storage controllers
The storage controllers are not connected directly to the storage but connect to two redundantFC switch fabrics.
• FC-to-SAS bridges
The FC-to-SAS bridges connect the SAS storage stacks to the FC switches, providing bridgingbetween the two protocols.
• FC switches
The FC switches provide the long-haul backbone ISL between the two sites. The FC switchesprovide the two storage fabrics that allow data mirroring to the remote storage pools.
• Cluster peering network
The cluster peering network provides connectivity for mirroring of the cluster configuration,which includes storage virtual machine (SVM) configuration. The configuration of all of theSVMs on one cluster is mirrored to the partner cluster.
Eight-node fabric MetroCluster configuration
An eight-node configuration consists of two clusters, one at each geographically separated site.cluster_A is located at the first MetroCluster site. cluster_B is located at the second MetroClustersite. Each site has one SAS storage stack. Additional storage stacks are supported, but only one isshown at each site. The HA pairs are configured as switchless clusters, without clusterinterconnect switches. A switched configuration is supported, but is not shown.
An eight-node configuration includes the following connections:
• FC connections from each controller's HBAs and FC-VI adapters to each of the FC switches
• An FC connection from each FC-to-SAS bridge to an FC switch
• SAS connections between each SAS shelf and from the top and bottom of each stack to an FC-to-SAS bridge
• An HA interconnect between each controller in the local HA pair
337Managing and monitoring MetroCluster configurations

If the controllers support a single-chassis HA pair, the HA interconnect is internal, occurringthrough the backplane, meaning that an external interconnect is not required.
• Ethernet connections from the controllers to the customer-provided network that is used forcluster peering
SVM configuration is replicated over the cluster peering network.
• A cluster interconnect between each controller in the local cluster
Four-node fabric MetroCluster configuration
The following illustration shows a simplified view of a four-node fabric MetroClusterconfiguration. For some connections, a single line represents multiple, redundant connectionsbetween the components. Data and management network connections are not shown.
HA
inte
rcon
nect
HA
inte
rcon
nect
clus
ter i
nter
conn
ect
clus
ter i
nter
conn
ect
Long-haul ISLs
Long-haul ISLs
cluster_A
FC_bridge_A_2
FC_bridge_A_1
Cluster peering network
FC_switch_A_1FC
FC_switch_A_2FC
controller_A_1
controller_A_2
FC_switch_B_1FC
FC_switch_B_2FC
SAS stack or stacksSAS stack or stacks
FC_bridge_B_2
FC_bridge_B_1
controller_B_1
controller_B_2
cluster_B
The following illustration shows a more detailed view of the connectivity in a single MetroClustercluster (both clusters have the same configuration):
338Managing and monitoring MetroCluster configurations

FC_switch_A_1FC
FC_switch_A_2FC
Long-haulISL
Long-haulISL
SAS-attached shelf
SAS-attached shelf
SAS-attached shelf
SAS-attached shelf
SAS-attached shelf
SAS-attached shelf
SAS-attached shelf
SAS-attached shelf
FC_bridge_A_1
FC_bridge_A_2
controller_A_2
controller_A_1
Cluster peering network
to partnersite
10-GbE Cluster Interconnect
Ethernet (controller_A_1)
Fibre Channel (controller_A_1)Fibre Channel (controller_A_2)
Ethernet (controller_A_2)
HA Interconnect
Fibre Channel (bridge to switch)
Two-node fabric MetroCluster configuration
The following illustration shows a simplified view of a two-node fabric MetroClusterconfiguration. For some connections, a single line represents multiple, redundant connectionsbetween the components. Data and management network connections are not shown.
Long-haul ISLs
Long-haul ISLs
cluster_A
SAS stack or stacks
FC_bridge_A_2
FC_bridge_A_1
Cluster peering network
FC_switch_A_1FC
FC_switch_A_2FC
controller_A_1FC_switch_B_1
FC
FC_switch_B_2FC
SAS stackor stacks
FC_bridge_B_2
FC_bridge_B_1
controller_B_1
cluster_B
A two-node configuration consists of two clusters, one at each geographically separated site.cluster_A is located at the first MetroCluster site. cluster_B is located at the second MetroClustersite. Each site has one SAS storage stack. Additional storage stacks are supported, but only one isshown at each site.
339Managing and monitoring MetroCluster configurations

Note: In a two-node configuration, the nodes are not configured as an HA pair.
The following illustration shows a more detailed view of the connectivity in a single MetroClustercluster (both clusters have the same configuration):
FC_switch_A_1FC
FC_switch_A_2FC
Long-haulISL
Long-haulISL
SAS-attached shelf
SAS-attached shelf
SAS-attached shelf
SAS-attached shelf
SAS-attached shelf
SAS-attached shelf
SAS-attached shelf
SAS-attached shelf
FC_bridge_A_1
FC_bridge_A_2
controller_A_1
Cluster peering network
to partnersite
Ethernet (controller_A_1)
Fibre Channel (controller_A_1)
Fibre Channel (bridge to switch)
A two-node configuration includes the following connections:
• FC connections between the FC-VI adapter on each controller module
• FC connections from each controller module's HBAs to the FC-to-SAS bridge for each SASshelf stack
• SAS connections between each SAS shelf and from the top and bottom of each stack to an FC-to-SAS bridge
• Ethernet connections from the controllers to the customer-provided network that is used forcluster peeringSVM configuration is replicated over the cluster peering network.
Parts of a two-node SAS-attached stretch MetroCluster configurationThe two-node MetroCluster SAS-attached configuration requires a number of parts, including twosingle-node clusters in which the storage controllers are directly connected to the storage usingSAS cables.
The MetroCluster configuration includes the following key hardware elements:
• Storage controllersThe storage controllers connect directly to the storage using SAS cables.Each storage controller is configured as a DR partner to a storage controller on the partner site.
◦ Copper SAS cables can be used for shorter distances.
◦ Optical SAS cables can be used for longer distances.
Note: In systems using E-Series array LUNs, the storage controllers can be directlyconnected to the E-Series storage arrays. For other array LUNs, connections via FC switchesare required.
340Managing and monitoring MetroCluster configurations

NetApp Interoperability Matrix ToolIn the IMT, you can use the Storage Solution field to select your MetroCluster solution. Youuse the Component Explorer to select the components and ONTAP version to refine yoursearch. You can click Show Results to display the list of supported configurations that matchthe criteria.
• Cluster peering network
The cluster peering network provides connectivity for mirroring of the storage virtual machine(SVM) configuration. The configuration of all SVMs on one cluster is mirrored to the partnercluster.
Parts of a two-node bridge-attached stretch MetroCluster configurationAs you plan your MetroCluster configuration, you should understand the parts of the configurationand how they work together.
The MetroCluster configuration includes the following key hardware elements:
• Storage controllers
The storage controllers are not connected directly to the storage but connected to FC-to-SASbridges. The storage controllers are connected to each other by FC cables between eachcontroller's FC-VI adapters.
Each storage controller is configured as a DR partner to a storage controller on the partner site.
• FC-to-SAS bridges
The FC-to-SAS bridges connect the SAS storage stacks to the FC initiator ports on thecontrollers, providing bridging between the two protocols.
• Cluster peering network
The cluster peering network provides connectivity for mirroring of the storage virtual machine(SVM) configuration. The configuration of all SVMs on one cluster is mirrored to the partnercluster.
The following illustration shows a simplified view of the MetroCluster configuration. For someconnections, a single line represents multiple, redundant connections between the components.Data and management network connections are not shown.
FC-VI links
cluster_A
Cluster peering network
FC_bridge_B_2
FC_bridge_B_1
cluster_B
SAS stack or stacks
FC_bridge_A_2
FC_bridge_A_1
controller_B_1controller_A_1
SAS stack or stacks
• The configuration consists of two single-node clusters.
• Each site has one or more stacks of SAS storage.
Note: SAS shelves in MetroCluster configurations are not supported with ACP cabling.
Additional storage stacks are supported, but only one is shown at each site.
341Managing and monitoring MetroCluster configurations

Cluster connectivity status definitionsConnectivity between the clusters in a MetroCluster configuration can be one of the followingstatuses: Optimal, Impacted, or Down. Understanding the connectivity statuses enables you tomanage your MetroCluster configurations effectively.
Connectivitystatus
Description Icon displayed
Optimal Connectivity between the clusters in the MetroCluster configuration isnormal.
Impacted One or more errors compromise the status of failover availability;however, both of the clusters in the MetroCluster configuration are still up.For example, when the ISL link is down, when the intercluster IP link isdown, or when the partner cluster is not reachable.
Down Connectivity between the clusters in the MetroCluster configuration isdown because one or both of the clusters are down or the clusters are infailover mode. For example, when the partner cluster is down because of adisaster or when there is a planned switchover for testing purposes.
Switchover with errors:
Switchover successful:
Data mirroring status definitionsMetroCluster configurations provide data mirroring and the additional ability to initiate a failoverif an entire site becomes unavailable. The status of data mirroring between the clusters in aMetroCluster configuration can either be Normal or Mirroring Unavailable. Understanding thestatus enables you to manage your MetroCluster configurations effectively.
Data mirroringstatus
Description Icon displayed
Normal Data mirroring between the clusters in the MetroCluster configurationis normal.
342Managing and monitoring MetroCluster configurations

Data mirroringstatus
Description Icon displayed
MirroringUnavailable
Data mirroring between the clusters in the MetroCluster configurationis unavailable because of switchover. For example, when the partnercluster is down because of a disaster or when there is a plannedswitchover for testing purposes.
Switchover with errors:
Switchover successful:
Monitoring MetroCluster configurationsYou can monitor connectivity issues in your MetroCluster configuration. The details include thestatus of the components and connectivity within a cluster and the connectivity status between theclusters in the MetroCluster configuration.
Before you begin
• Both the local and remote clusters in the MetroCluster configuration must be added to ActiveIQ Unified Manager.
• You must have the Operator, Application Administrator, or Storage Administrator role.
About this task
You can use the information displayed in the Cluster / Health details page to rectify anyconnectivity issues. For example, if the connectivity between the node and the switch in a clusteris down, the following icon is displayed:
If you move the pointer over the icon, you can view detailed information about the generatedevent.
Unified Manager uses system health alerts to monitor the status of the components andconnectivity in the MetroCluster configuration.
The MetroCluster Connectivity tab is displayed only for clusters in a MetroCluster configuration.
Steps
1. In the left navigation pane, click Storage > Clusters.A list of all of the monitored clusters is displayed.
2. From the Health: All Clusters view, click the name of the cluster for which you want to viewMetroCluster configuration details.
3. In the Cluster / Health details page, click the MetroCluster Connectivity tab.The topology of the MetroCluster configuration is displayed in the corresponding cluster objectarea.
After you finish
If you discover connectivity issues in your MetroCluster configuration, you must log in to SystemManager or access the ONTAP CLI to resolve the issues.
343Managing and monitoring MetroCluster configurations
Related referenceHealth: All Clusters view on page 220
The Health: All Clusters view enables you to view health information about the clusters that youare monitoring.
Cluster / Health details page on page 224The Cluster / Health details page provides detailed information about a selected cluster, such ashealth, capacity, and configuration details. You can also view information about the networkinterfaces (LIFs), nodes, disks, related devices, and related alerts for the cluster.
Cluster connectivity status definitions on page 342Connectivity between the clusters in a MetroCluster configuration can be one of the followingstatuses: Optimal, Impacted, or Down. Understanding the connectivity statuses enables you tomanage your MetroCluster configurations effectively.
Monitoring MetroCluster replicationYou can monitor and diagnose the overall health condition of the logical connections whilemirroring the data. You can identify the issues or any risk that interrupts mirroring of clustercomponents such as aggregates, nodes, and storage virtual machines.
Before you begin
Both the local and remote cluster in the MetroCluster configuration must be added to UnifiedManager
About this task
You can use the information displayed in the Cluster / Health details page to rectify any replicationissues.
If you move the pointer over the icon, you can view detailed information about the generatedevent.
Unified Manager uses system health alerts to monitor the status of the components andconnectivity in the MetroCluster configuration.
Steps
1. In the left navigation pane, click Storage > Clusters.
A list of the monitored clusters is displayed.
2. From the Health: All Clusters view, click the name of the cluster for which you want to viewMetroCluster replication details, and then click the MetroCluster Replication tab.
The topology of the MetroCluster configuration to be replicated is displayed at the local site inthe corresponding cluster object area with the information about the remote site where the datais being mirrored.
After you finish
If you discover mirroring issues in your MetroCluster configuration, you must log in to SystemManager or access the ONTAP CLI to resolve the issues.
Related referenceData mirroring status definitions on page 342
MetroCluster configurations provide data mirroring and the additional ability to initiate a failoverif an entire site becomes unavailable. The status of data mirroring between the clusters in aMetroCluster configuration can either be Normal or Mirroring Unavailable. Understanding thestatus enables you to manage your MetroCluster configurations effectively.
Health: All Clusters view on page 220
344Managing and monitoring MetroCluster configurations

The Health: All Clusters view enables you to view health information about the clusters that youare monitoring.
Cluster / Health details page on page 224The Cluster / Health details page provides detailed information about a selected cluster, such ashealth, capacity, and configuration details. You can also view information about the networkinterfaces (LIFs), nodes, disks, related devices, and related alerts for the cluster.
345Managing and monitoring MetroCluster configurations

Managing quotas
You can use user and group quotas to limit the amount of disk space or the number of files that auser or a user group can use. You can view user and user group quota information, such as the diskand file usage and the various limits set on disks.
What quota limits areUser quota limits are values that the Unified Manager server uses to evaluate whether spaceconsumption by a user is nearing the limit or has reached the limit that is set by the user’s quota. Ifthe soft limit is crossed or if the hard limit is reached, the Unified Manager server generates userquota events.
By default, the Unified Manager server sends a notification email to users who have crossed thequota soft limit or have reached the quota hard limit and for which user quota events areconfigured. Users with the Application Administrator role can configure alerts that notify thespecified recipients of the user or user group quota events.
You can specify quota limits by using either ONTAP System Manager or the ONTAP CLI.
Viewing user and user group quotasThe Storage VM / Health details page displays information about the user and user group quotasthat are configured on the SVM. You can view the name of the user or user group, limits set on thedisks and files, used disk and file space, and email address for notification.
Before you begin
You must have the Operator, Application Administrator, or Storage Administrator role.
Steps
1. In the left navigation pane, click Storage > Storage VMs.
2. In the Health: All Storage VMs view, select a Storage VM and then click the User andGroup Quotas tab.
Related conceptsOverview of the quota process on page 349
Quotas can be soft or hard. Soft quotas cause ONTAP to send a notification when specified limitsare exceeded, and hard quotas prevent a write operation from succeeding when specified limits areexceeded.
Related tasksAdding users on page 625
You can add local users or database users by using the Users page. You can also add remote usersor groups that belong to an authentication server. You can assign roles to these users and, based on
346Managing quotas

the privileges of the roles, users can manage the storage objects and data with Unified Manager, orview the data in a database.
Creating rules to generate email addressesYou can create rules to specify the email address based on the user quota associated with clusters,storage virtual machines (SVMs), volumes, qtrees, users, or user groups. A notification is sent tothe specified email address when there is a quota breach.
Before you begin
• You must have the Application Administrator or Storage Administrator role.
• You must have reviewed the guidelines on the Rules to Generate User and Group Quota EmailAddress page.
About this task
You must define the rules for quota email addresses and enter them in the order in which you wantto execute them. For example, if you want to use the email address [email protected] to receivenotifications about quota breaches for qtree1 and use the email address [email protected] for all theother qtrees, the rules must be listed in the following order:
if ( $QTREE == 'qtree1' ) then [email protected]
if ( $QTREE == * ) then [email protected]
If none of the criteria for the rules you specified are met, then the default rule is used:
if ( $USER_OR_GROUP == * ) then $USER_OR_GROUP@$DOMAIN
Steps
1. In the left navigation pane, click General > Quota Email Rules.
2. Enter the rule based on your criteria.
3. Click Validate to validate the syntax of the rule.
An error message is displayed if the syntax of the rule is incorrect. You must correct the syntaxand click Validate again.
4. Click Save.
5. Verify that the email address you created is displayed in the User and Group Quotas tab ofthe Storage VM / Health details page.
Related tasksEditing user and group quota email addresses on page 348
You can modify the email addresses based on the user quota associated with clusters, storagevirtual machines (SVMs), volumes, qtrees, users, or user groups. You can modify the emailaddress when you want to override the email address generated by rules specified in the Rules toGenerate User and Group Quota Email Address dialog box.
Creating an email notification format for user and user group quotas on page 348You can create a notification format for the emails that are sent to a user or a user group whenthere is a quota-related issue (soft limit breached or hard limit reached).
Related referenceRules to Generate User and Group Quota Email Address page on page 351
The Rules to Generate User and Group Quota Email Address page enables you to create rules tospecify email addresses based on the user quota associated with clusters, SVMs, volumes, qtrees,
347Managing quotas

users, or user groups. A notification is sent to the specified email address when a quota isbreached.
Creating an email notification format for user and user group quotasYou can create a notification format for the emails that are sent to a user or a user group whenthere is a quota-related issue (soft limit breached or hard limit reached).
Before you begin
You must have the Application Administrator or Storage Administrator role.
Steps
1. In the left navigation pane, click General > Quota Email Format.
2. Enter or modify the details in the From, Subject, and Email Details fields.
3. Click Preview to preview the email notification.
4. Click Close to close the preview window.
5. Modify the content of the email notification, if required.
6. Click Save.
Related tasksCreating rules to generate email addresses on page 347
You can create rules to specify the email address based on the user quota associated with clusters,storage virtual machines (SVMs), volumes, qtrees, users, or user groups. A notification is sent tothe specified email address when there is a quota breach.
Editing user and group quota email addressesYou can modify the email addresses based on the user quota associated with clusters, storagevirtual machines (SVMs), volumes, qtrees, users, or user groups. You can modify the emailaddress when you want to override the email address generated by rules specified in the Rules toGenerate User and Group Quota Email Address dialog box.
Before you begin
• You must have the Operator, Application Administrator, or Storage Administrator role.
• You must have reviewed the guidelines for creating rules.
About this task
If you edit an email address, the rules to generate the user and group quota email addresses are nolonger applicable to the quota. For notifications to be sent to the email address generated by therules specified, you must delete the email address and save the change.
Steps
1. In the left navigation pane, click Storage > SVMs.
2. In the Health: All Storage VMs view, select an SVM and then click the User and GroupQuotas tab.
3. Click Edit Email Address below the row of tabs.
4. In the Edit Email Address dialog box, perform the appropriate action:
348Managing quotas

If... Then...
You want notifications to be sentto the email address generated bythe rules specified
a. Delete the email address in the Email Address field.
b. Click Save.
c. Refresh the browser by pressing F5 to reload the Edit Email Address dialogbox.
The email address generated by the specified rule is displayed in the EmailAddress field.
You want notifications to be sentto a specified email address
a. Modify the email address in the Email Address field.
b. Click Save.
The rules to generate the user and group quota email addresses are no longerapplicable to the quota.
Related tasksCreating rules to generate email addresses on page 347
You can create rules to specify the email address based on the user quota associated with clusters,storage virtual machines (SVMs), volumes, qtrees, users, or user groups. A notification is sent tothe specified email address when there is a quota breach.
Understanding more about quotasUnderstanding the concepts about quotas helps you to manage your user quotas and user groupquotas efficiently.
Overview of the quota processQuotas can be soft or hard. Soft quotas cause ONTAP to send a notification when specified limitsare exceeded, and hard quotas prevent a write operation from succeeding when specified limits areexceeded.
When ONTAP receives a request from a user or user group to write to a FlexVol volume, it checksto see whether quotas are activated on that volume for the user or user group and determines thefollowing:
• Whether the hard limit will be reached
If yes, the write operation fails when the hard limit is reached and the hard quota notification issent.
• Whether the soft limit will be breached
If yes, the write operation succeeds when the soft limit is breached and the soft quotanotification is sent.
• Whether a write operation will not exceed the soft limit
If yes, the write operation succeeds and no notification is sent.
Related conceptsAbout quotas on page 350
Quotas provide a way to restrict or track the disk space and number of files used by a user, group,or qtree. You specify quotas using the /etc/quotas file. Quotas are applied to a specific volumeor qtree.
Why you use quotas on page 350
349Managing quotas

You can use quotas to limit resource usage in FlexVol volumes, to provide notification whenresource usage reaches specific levels, or to track resource usage.
About quotasQuotas provide a way to restrict or track the disk space and number of files used by a user, group,or qtree. You specify quotas using the /etc/quotas file. Quotas are applied to a specific volumeor qtree.
Why you use quotasYou can use quotas to limit resource usage in FlexVol volumes, to provide notification whenresource usage reaches specific levels, or to track resource usage.
You specify a quota for the following reasons:
• To limit the amount of disk space or the number of files that can be used by a user or group, orthat can be contained by a qtree
• To track the amount of disk space or the number of files used by a user, group, or qtree,without imposing a limit
• To warn users when their disk usage or file usage is high
Description of quotas dialog boxesYou can use the appropriate option in the User and Group Quotas tab in the Health: All StorageVMs view to configure the format of the email notification that is sent when a quota-related issueoccurs and to configure rules to specify email addresses based on the user quota.
Email Notification Format pageThe Email Notification Format page displays the rules of the email that is sent to a user or a usergroup when there is a quota-related issue (soft limit breached or hard limit reached).
The email notification is sent only when the following user or user group quota events aregenerated: User or Group Quota Disk Space Soft Limit Breached, User or Group Quota File CountSoft Limit Breached, User or Group Quota Disk Space Hard Limit Reached, or User or GroupQuota File Count Hard Limit Reached.
From
Displays the email address from which the email is sent, which you can modify. By default,this is the email address that is specified Notifications page.
Subject
Displays the subject of the notification email.
Email Details
Displays the text of the notification email. You can modify the text based on yourrequirements. For example, you can provide information related to the quota attributes andreduce the number of keywords. However, you should not modify the keywords.
Valid keywords are as follows:
• $EVENT_NAME
Specifies the event name that caused the email notification.
• $QUOTA_TARGET
Specifies the qtree or volume on which the quota is applicable.
• $QUOTA_USED_PERCENT
Specifies the percentage of disk hard limit, disk soft limit, file hard limit, or file softlimit that is used by the user or user group.
350Managing quotas

• $QUOTA_LIMIT
Specifies the disk hard limit or file hard limit that is reached by the user or user groupand one of the following events is generated:
◦ User or Group Quota Disk Space Hard Limit Reached
◦ User or Group Quota Disk Space Soft Limit Reached
◦ User or Group Quota File Count Hard Limit Reached
◦ User or Group Quota File Count Soft Limit Reached
• $QUOTA_USED
Specifies the disk space used or the number of files created by the user or user group.
• $QUOTA_USER
Specifies the user or user group name.
Command buttons
The command buttons enable you to preview, save, or cancel the changes made to the emailnotification format:
Preview
Displays a preview of the notification email.
Restore to Factory Defaults
Enables you to restore the notification format to the factory default values.
Save
Saves the changes made to the notification format.
Related tasksCreating rules to generate email addresses on page 347
You can create rules to specify the email address based on the user quota associated with clusters,storage virtual machines (SVMs), volumes, qtrees, users, or user groups. A notification is sent tothe specified email address when there is a quota breach.
Related referenceRules to Generate User and Group Quota Email Address page on page 351
The Rules to Generate User and Group Quota Email Address page enables you to create rules tospecify email addresses based on the user quota associated with clusters, SVMs, volumes, qtrees,users, or user groups. A notification is sent to the specified email address when a quota isbreached.
Rules to Generate User and Group Quota Email Address pageThe Rules to Generate User and Group Quota Email Address page enables you to create rules tospecify email addresses based on the user quota associated with clusters, SVMs, volumes, qtrees,users, or user groups. A notification is sent to the specified email address when a quota isbreached.
Rules area
You must define the rules for a quota email address. You can also add comments to explain therules.
How you define rules
You must enter the rules in the order in which you want to execute them. If the first rule’s criterionis met, then the email address is generated based on this rule. If the criterion is not met, then thecriterion for the next rule is considered, and so on. Each line lists a separate rule. The default ruleis the last rule in the list. You can change the priority order of rules. However, you cannot changethe order of the default rule.
351Managing quotas

For example, if you want to use the email address [email protected] to receive notifications aboutquota breaches for qtree1 and use the email address [email protected] for all the other qtrees, therules must be listed in the following order:
if ( $QTREE == 'qtree1' ) then [email protected]
if ( $QTREE == * ) then [email protected]
If none of the criteria for the rules you specified are met, then the default rule is used:
if ( $USER_OR_GROUP == * ) then $USER_OR_GROUP@$DOMAIN
If more than one user has the same quota, the names of the users are displayed as comma-separated values and the rules are not applicable for the quota.
How you add comments
You can add comments to explain the rules. You should use # at the start of each comment andeach line lists a separate comment.
Rules syntax
The syntax of the rule must be one of the following:
• if ( valid variable operator *) then email ID@domain name
if is a keyword and is in lowercase. The operator is ==. The email ID can contain anycharacter, the valid variables $USER_OR_GROUP, $USER, or $GROUP, or a combination ofany character and the valid variables $USER_OR_GROUP, $USER, or $GROUP. The domainname can contain any character, the valid variable $DOMAIN, or a combination of anycharacter and the valid variable $DOMAIN. Valid variables can be in uppercase or lowercasebut must not be a combination of both. For example, $domain and $DOMAIN are valid, but$Domain is not a valid variable.
• if ( valid variable operator 'string ') then email ID@domain name
if is a keyword and is lowercase. The operator can be contains or ==. The email ID cancontain any character, the valid variables $USER_OR_GROUP, $USER, or $GROUP, or acombination of any character and the valid variables $USER_OR_GROUP, $USER, or$GROUP. The domain name can contain any character, the valid variable $DOMAIN, or acombination of any character and the valid variable $DOMAIN. Valid variables can be inuppercase or lowercase but must not be a combination of both. For example, $domain and$DOMAIN are valid, but $Domain is not a valid variable.
Command buttons
The command buttons enable you to save, validate, or cancel the created rules:
Validate
Validates the syntax of the created rule. If there are errors during validation, the rule thatgenerates the error is displayed along with an error message.
Restore to Factory Defaults
Enables you to restore the address rules to the factory default values.
Save
Validates the syntax of the rule and saves the rule if there are no errors. If there are errorsduring validation, the rule that generates the error is displayed along with an error message.
Related tasksCreating rules to generate email addresses on page 347
352Managing quotas

You can create rules to specify the email address based on the user quota associated with clusters,storage virtual machines (SVMs), volumes, qtrees, users, or user groups. A notification is sent tothe specified email address when there is a quota breach.
Related referenceEmail Notification Format page on page 350
The Email Notification Format page displays the rules of the email that is sent to a user or a usergroup when there is a quota-related issue (soft limit breached or hard limit reached).
353Managing quotas

Managing scripts
You can use scripts to automatically modify or update multiple storage objects in UnifiedManager. The script is associated with an alert. When an event triggers an alert, the script isexecuted. You can upload custom scripts and test their execution when an alert is generated.
The ability to upload scripts to Unified Manager and run them is enabled by default. If yourorganization does not want to allow this functionality because of security reasons, you can disablethis functionality from Storage Management > Feature Settings.
Related tasksEnabling and disabling the ability to upload scripts on page 357
The ability to upload scripts to Unified Manager and run them is enabled by default. If yourorganization does not want to allow this activity because of security reasons, you can disable thisfunctionality.
How scripts work with alertsYou can associate an alert with your script so that the script is executed when an alert is raised foran event in Unified Manager. You can use the scripts to resolve issues with storage objects oridentify which storage objects are generating the events.
When an alert is generated for an event in Unified Manager, an alert email is sent to the specifiedrecipients. If you have associated an alert with a script, the script is executed. You can get thedetails of the arguments passed to the script from the alert email.
The script uses the following arguments for execution:
• -eventID
• -eventName
• -eventSeverity
• -eventSourceID
• -eventSourceName
• -eventSourceType
• -eventState
• -eventArgs
You can use the arguments in your scripts and gather related event information or modify storageobjects.
Example for obtaining arguments from scripts
print "$ARGV[0] : $ARGV[1]\n"print "$ARGV[7] : $ARGV[8]\n"
When an alert is generated, this script is executed and the following output is displayed:
-eventID : 290 -eventSourceID : 4138
Related tasksAdding alerts on page 119
354Managing scripts

You can configure alerts to notify you when a particular event is generated. You can configurealerts for a single resource, for a group of resources, or for events of a particular severity type. Youcan specify the frequency with which you want to be notified and associate a script to the alert.
Related referenceScripts page on page 362
The Scripts page enables you to add your custom scripts to Unified Manager. You can associatethese scripts with alerts to enable automatic reconfiguration of storage objects.
Supported Unified Manager CLI commands on page 358As a storage administrator you can use the CLI commands to perform queries on the storageobjects; for example, on clusters, aggregates, volumes, qtrees, and LUNs. You can use the CLIcommands to query the Unified Manager internal database and the ONTAP database. You can alsouse CLI commands in scripts that are executed at the beginning or end of an operation or areexecuted when an alert is triggered.
Adding scriptsYou can add scripts in Unified Manager, and associate the scripts with alerts. These scripts areexecuted automatically when an alert is generated, and enable you to obtain information aboutstorage objects for which the event is generated.
Before you begin
• You must have created and saved the scripts that you want to add to the Unified Managerserver.
• The supported file formats for scripts are Perl, Shell, PowerShell, and .bat files.
Platform on which Unified Manager is installed Supported languages
VMware Perl and Shell scripts
Linux Perl and Shell scripts
Windows PowerShell, Perl, and .bat scripts
◦ For Perl scripts, Perl must be installed on the Unified Manager server. For VMwareinstallations, Perl 5 is installed by default and scripts will support only what Perl 5supports. If Perl was installed after Unified Manager, you must restart the Unified Managerserver.
◦ For PowerShell scripts, the appropriate PowerShell execution policy must be set on theWindows server so that the scripts can be executed.
Important: If your script creates log files to track the alert script progress, you must makesure that the log files are not created anywhere within the Unified Manager installationfolder.
• You must have the Application Administrator or Storage Administrator role.
About this task
You can upload custom scripts and gather event details about the alert.
Note: If you do not see this capability available in the user interface it is because thefunctionality has been disabled by your administrator. If required, you can enable thisfunctionality from Storage Management > Feature Settings.
Steps
1. In the left navigation pane, click Storage Management > Scripts.
355Managing scripts

2. In the Scripts page, click Add.
3. In the Add Script dialog box, click Browse to select your script file.
4. Enter a description for the script that you select.
5. Click Add.
Related tasksTesting script execution on page 356
You can verify that your script is executed correctly when an alert is generated for a storage object.
Enabling and disabling the ability to upload scripts on page 357The ability to upload scripts to Unified Manager and run them is enabled by default. If yourorganization does not want to allow this activity because of security reasons, you can disable thisfunctionality.
Related referenceSupported Unified Manager CLI commands on page 358
As a storage administrator you can use the CLI commands to perform queries on the storageobjects; for example, on clusters, aggregates, volumes, qtrees, and LUNs. You can use the CLIcommands to query the Unified Manager internal database and the ONTAP database. You can alsouse CLI commands in scripts that are executed at the beginning or end of an operation or areexecuted when an alert is triggered.
Scripts page on page 362The Scripts page enables you to add your custom scripts to Unified Manager. You can associatethese scripts with alerts to enable automatic reconfiguration of storage objects.
Add Script dialog box on page 363The Add Script dialog box enables you to add scripts to Unified Manager. You can configure alertswith your scripts to automatically resolve events that are generated for storage objects.
Deleting scriptsYou can delete a script from Unified Manager when the script is no longer required or valid.
Before you begin
• You must have the Application Administrator or Storage Administrator role.
• The script must not be associated with an alert.
Steps
1. In the left navigation pane, click Storage Management > Scripts.
2. In the Scripts page, select the script that you want to delete, and then click Delete.
3. In the Warning dialog box, confirm the deletion by clicking Yes.
Related referenceScripts page on page 362
The Scripts page enables you to add your custom scripts to Unified Manager. You can associatethese scripts with alerts to enable automatic reconfiguration of storage objects.
Testing script executionYou can verify that your script is executed correctly when an alert is generated for a storage object.
Before you begin
• You must have the Application Administrator or Storage Administrator role.
• You must have uploaded a script in the supported file format to Unified Manager.
356Managing scripts

Steps
1. In the left navigation pane, click Storage Management > Scripts.
2. In the Scripts page, add your test script.
3. In the left navigation pane, click Storage Management > Alert Setup.
4. In the Alert Setup page, perform one of the following actions:
To... Do this...
Add an alert a. Click Add.
b. In the Actions section, associate the alert with your test script.
Edit an alert a. Select an alert, and then click Edit.
b. In the Actions section, associate the alert with your test script.
5. Click Save.
6. In the Alert Setup page, select the alert that you added or modified, and then click Test.The script is executed with the "-test" argument, and a notification alert is sent to the emailaddresses that were specified when the alert was created.
Related tasksAdding scripts on page 355
You can add scripts in Unified Manager, and associate the scripts with alerts. These scripts areexecuted automatically when an alert is generated, and enable you to obtain information aboutstorage objects for which the event is generated.
Editing alerts on page 126You can edit alert properties such as the resource with which the alert is associated, events,recipients, notification options, notification frequency, and associated scripts.
Enabling and disabling the ability to upload scriptsThe ability to upload scripts to Unified Manager and run them is enabled by default. If yourorganization does not want to allow this activity because of security reasons, you can disable thisfunctionality.
Before you begin
You must have the Application Administrator role.
Steps
1. In the left navigation pane, click General > Feature Settings.
2. In the Feature Settings page, disable or enable scripting by choosing one of the followingoptions:
If you want to... Then do this...
Disable scripts In the Script Upload panel, move the slider button to the left.
Enable scripts In the Script Upload panel, move the slider button to the right.
Related conceptsManaging scripts on page 354
357Managing scripts

You can use scripts to automatically modify or update multiple storage objects in UnifiedManager. The script is associated with an alert. When an event triggers an alert, the script isexecuted. You can upload custom scripts and test their execution when an alert is generated.
Related tasksAdding scripts on page 355
You can add scripts in Unified Manager, and associate the scripts with alerts. These scripts areexecuted automatically when an alert is generated, and enable you to obtain information aboutstorage objects for which the event is generated.
Supported Unified Manager CLI commandsAs a storage administrator you can use the CLI commands to perform queries on the storageobjects; for example, on clusters, aggregates, volumes, qtrees, and LUNs. You can use the CLIcommands to query the Unified Manager internal database and the ONTAP database. You can alsouse CLI commands in scripts that are executed at the beginning or end of an operation or areexecuted when an alert is triggered.
All commands must be preceded with the command um cli login and a valid user name andpassword for authentication.
CLI command Description Output
um cli login -u <username> [-p
<password>]
Logs in to the CLI. Because of securityimplications, you should enter only the username following the "-u" option. When usedin this manner you will be prompted for thepassword, and the password will not becaptured in the history or process table.
The session expires after three hours fromthe time of login, after which the user mustlogin again.
Displays the correspondingmessage.
um cli logout Logs out of the CLI. Displays the correspondingmessage.
um help Displays all first level subcommands. Displays all first levelsubcommands.
um run cmd [ -t <timeout> ]
<cluster> <command>
The simplest way to run a command on oneor more hosts. Mainly used for alertscripting to get or perform an operation onONTAP. The optional timeout argumentsets a maximum time limit (in seconds) forthe command to complete on the client. Thedefault is 0 (wait forever).
As received from ONTAP.
um run query <sql command> Executes an SQL query. Only queries thatread from the database are allowed. Anyupdate, insert, or delete operations are notsupported.
Results are displayed in atabular form. If an emptyset is returned, or if there isany syntax error or badrequest, it displays theappropriate error message.
358Managing scripts

CLI command Description Output
um datasource add -u <username>
-P <password> [ -t <protocol> ]
[ -p <port> ] <hostname-or-ip>
Adds a datasource to the list of managedstorage systems. A datasource describeshow connections to storage systems aremade. The options -u (username) and -P(password) must be specified when addinga datasource. The option -t (protocol)specifies the protocol used to communicatewith the cluster (http or https). If theprotocol is not specified, then bothprotocols will be attempted The option -p(port) specifies the port used tocommunicate with the cluster. If the port isnot specified, then the default value of theappropriate protocol will be attempted. Thiscommand can be executed only by thestorage admin.
Prompts for the user acceptthe certificate and printsthe corresponding message.
um datasource list
[ <datasource-id>]
Displays the datasources for managedstorage systems.
Displays the followingvalues in tabular format:ID Address Port,ProtocolAcquisition Status,Analysis Status,Communicationstatus, AcquisitionMessage, andAnalysis Message
.
um datasource modify [ -h
<hostname-or-ip> ] [ -u
<username> ] [ -P <password> ]
[ -t <protocol> ] [ -p <port> ]
<datasource-id>
Modifies one or more datasource options.Can be executed only by the storage admin.
Displays the correspondingmessage.
um datasource remove
<datasource-id>
Removes the datasource (cluster) fromUnified Manager.
Displays the correspondingmessage.
um option list [ <option> .. ] Lists all the options that you can configureusing the set command.
Displays the followingvalues in tabular format:Name, Value,Default Value, andRequires Restart.
um option set <option-
name>=<option-value> [ <option-
name>=<option-value> ... ]
Sets one or more options. The commandcan be executed only by the storage admin.
Displays the correspondingmessage.
um version Displays the Unified Manager softwareversion.
Version ("9.6")
359Managing scripts

CLI command Description Output
um lun list [-q] [ -ObjectType
<object-id>]
Lists the LUNs after filtering on thespecified object. -q is applicable for allcommands to show no header. ObjectTypecan be lun, qtree, cluster, volume, quota, orsvm.
For example:
um lun list -cluster 1
In this example, "-cluster" is the objectTypeand "1" is the objectId. The command listsall the LUNs within the cluster with ID 1.
Displays the followingvalues in tabular format:ID and LUN path
.
um svm list [-q] [ -ObjectType
<object-id>]
Lists the storage VMs after filtering on thespecified object. ObjectType can be lun,qtree, cluster, volume, quota, or svm.
For example:
um svm list -cluster 1
In this example, "-cluster" is the objectTypeand "1" is the objectId. The command listsall the storage VMs within the cluster withID 1.
Displays the followingvalues in tabular format:Name and Cluster ID
.
um qtree list [-q] [ -ObjectType
<object-id>]
Lists the qtrees after filtering on thespecified object. -q is applicable for allcommands to show no header. ObjectTypecan be lun, qtree, cluster, volume, quota, orsvm.
For example:
um qtree list -cluster 1
In this example, "-cluster" is the objectTypeand "1" is the objectId. The command listsall the qtrees within the cluster with ID 1.
Displays the followingvalues in tabular format:Qtree ID and QtreeName
.
um disk list [-q] [-ObjectType
<object-id>]
Lists the disks after filtering on thespecified object. ObjectType can be disk,aggr, node, or cluster.
For example:
um disk list -cluster 1
In this example, "-cluster" is the objectTypeand "1" is the objectId. The command listsall the disks within the cluster with ID 1.
Displays the followingvalues in tabular formatObjectType andobject-id.
360Managing scripts

CLI command Description Output
um cluster list [-q] [-
ObjectType <object-id>]
Lists the clusters after filtering on thespecified object. ObjectType can be disk,aggr, node, cluster, lun, qtree, volume,quota, or svm.
For example:
um cluster list -aggr 1
In this example, "-aggr" is the objectTypeand "1" is the objectId. The command liststhe cluster to which the aggregate with ID 1belongs.
Displays the followingvalues in tabular format:Name, Full Name,Serial Number,Datasource Id, LastRefresh Time, andResource Key.
um cluster node list [-q] [-
ObjectType <object-id>]
Lists the cluster nodes after filtering on thespecified object. ObjectType can be disk,aggr, node, or cluster.
For example:
um cluster node list -cluster 1
In this example, "-cluster" is the objectTypeand "1" is the objectId. The command listsall the nodes within the cluster with ID 1.
Displays the followingvalues in tabular formatName and ClusterID.
um volume list [-q] [-ObjectType
<object-id>]
Lists the volumes after filtering on thespecified object. ObjectType can be lun,qtree, cluster, volume, quota, svm, oraggregate.
For example:
um volume list -cluster 1
In this example, "-cluster" is the objectTypeand "1" is the objectId. The command listsall the volumes within the cluster with ID 1.
Displays the followingvalues in tabular formatVolume ID andVolume Name.
um quota user list [-q] [-
ObjectType <object-id>]
Lists the quota users after filtering on thespecified object. ObjectType can be qtree,cluster, volume, quota, or svm.
For example:
um quota user list -cluster 1
In this example, "-cluster" is the objectTypeand "1" is the objectId. The command listsall the quota users within the cluster withID 1.
Displays the followingvalues in tabular formatID, Name, SID andEmail.
361Managing scripts

CLI command Description Output
um aggr list [-q] [-ObjectType
<object-id>]
Lists the aggregates after filtering on thespecified object. ObjectType can be disk,aggr, node, cluster, or volume.
For example:
um aggr list -cluster 1
In this example, "-cluster" is the objectTypeand "1" is the objectId. The command listsall the aggregates within the cluster with ID1.
Displays the followingvalues in tabular formatAggr ID, and AggrName.
um event ack <event-ids> Acknowledges one or more events. Displays the correspondingmessage.
um event resolve <event-ids> Resolves one or more events. Displays the correspondingmessage.
um event assign -u <username>
<event-id>
Assigns an event to a user. Displays the correspondingmessage.
um event list [ -s <source> ]
[ -S <event-state-filter-
list>.. ] [ <event-id> .. ]
Lists the events generated by the system oruser. Filters events based on source, state,and IDs.
Displays the followingvalues in tabular formatSource, Sourcetype, Name,Severity, State,User and Timestamp.
um backup restore -f
<backup_file_path_and_name>
Restores a MySQL database backup using .7z files.
Displays the correspondingmessage.
Related conceptsHow scripts work with alerts on page 354
You can associate an alert with your script so that the script is executed when an alert is raised foran event in Unified Manager. You can use the scripts to resolve issues with storage objects oridentify which storage objects are generating the events.
Related tasksAdding scripts on page 355
You can add scripts in Unified Manager, and associate the scripts with alerts. These scripts areexecuted automatically when an alert is generated, and enable you to obtain information aboutstorage objects for which the event is generated.
Description of script windows and dialog boxesThe Scripts page enables you to add scripts to Unified Manager.
Scripts pageThe Scripts page enables you to add your custom scripts to Unified Manager. You can associatethese scripts with alerts to enable automatic reconfiguration of storage objects.
The Scripts page enables you to add or delete scripts from Unified Manager.
362Managing scripts

Command buttons
Add
Displays the Add Script dialog box, which enables you to add scripts.
Delete
Deletes the selected script.
List view
The list view displays, in tabular format, the scripts that you added to Unified Manager.
Name
Displays the name of the script.
Description
Displays the description of the script.
Related conceptsHow scripts work with alerts on page 354
You can associate an alert with your script so that the script is executed when an alert is raised foran event in Unified Manager. You can use the scripts to resolve issues with storage objects oridentify which storage objects are generating the events.
Related tasksAdding scripts on page 355
You can add scripts in Unified Manager, and associate the scripts with alerts. These scripts areexecuted automatically when an alert is generated, and enable you to obtain information aboutstorage objects for which the event is generated.
Deleting scripts on page 356You can delete a script from Unified Manager when the script is no longer required or valid.
Add Script dialog boxThe Add Script dialog box enables you to add scripts to Unified Manager. You can configure alertswith your scripts to automatically resolve events that are generated for storage objects.
You must have the Application Administrator or Storage Administrator role.
Select Script File
Enables you to select a script for the alert.
Description
Enables you to specify a description for the script.
Related tasksAdding scripts on page 355
You can add scripts in Unified Manager, and associate the scripts with alerts. These scripts areexecuted automatically when an alert is generated, and enable you to obtain information aboutstorage objects for which the event is generated.
363Managing scripts

Managing annotations for storage objects
You can create annotations in Unified Manager to annotate storage objects. Annotations enableyou to easily identify critical resources and to take appropriate actions; for example, addingcritical resources to a group and assigning a group action, or creating a report of annotatedresources.
What annotations areAn annotation is a text string (the name) that is assigned to another text string (the value). Eachannotation name-value pair can be dynamically associated with storage objects using annotationrules. When you associate storage objects with predefined annotations, you can filter and view theevents that are related to them. You can apply annotations to clusters, volumes, and storage virtualmachines (SVMs).
Each annotation name can have multiple values; each name-value pair can be associated with astorage object through rules.
For example, you can create an annotation named "data-center" with the values "Boston" and"Canada". You can then apply the annotation "data-center" with the value "Boston" to volume v1.When an alert is generated for any event on a volume v1 that is annotated with "data-center", thegenerated email indicates the location of the volume, "Boston", and this enables you to prioritizeand resolve the issue.
Related tasksViewing the annotation list and details on page 366
You can view the list of annotations that are dynamically associated with clusters, volumes, andstorage virtual machines (SVMs). You can also view details such as the description, created by,created date, values, rules, and the objects associated with the annotation.
Deleting annotations on page 372You can delete custom annotations and their values when they are no longer required.
Related referenceAdd Annotation dialog box on page 377
The Add Annotation dialog box enables you to create custom annotations that you can associatewith clusters, volumes, and storage virtual machines (SVMs) through annotation rules.
Add Annotation Rule dialog box on page 378The Add Annotation Rule dialog box enables you to create annotation rules in Unified Manager todynamically annotate storage objects.
How annotation rules work in Unified ManagerAn annotation rule is a criterion that you define to annotate storage objects (volumes, clusters, orstorage virtual machines (SVMs)). You can use either condition groups or conditions for definingannotation rules.
• You must associate an annotation rule to an annotation.
• You must associate an object type for an annotation rule; only one object type can beassociated for an annotation rule.
• Unified Manager adds or removes annotations from storage objects after each monitoring cycleor when a rule is created, edited, deleted, or reordered.
• An annotation rule can have one or more condition groups, and each condition group can haveone or more conditions.
364Managing annotations for storage objects

• Storage objects can have multiple annotations. An annotation rule for a particular annotationcan also use different annotations in the rule conditions to add another annotation to alreadyannotated objects.
Conditions
You can create multiple condition groups, and each condition group can have one or moreconditions. You can apply all the defined condition groups in an annotation rule of an annotationin order to annotate storage objects.
Conditions within a condition group are executed using logical AND. All the conditions in acondition group must be met. When you create or modify an annotation rule, a condition is createdthat applies, selects, and annotates only those storage objects that meet all the conditions in thecondition group. You can use multiple conditions within a condition group when you want tonarrow the scope of which storage objects to annotate.
You can create conditions with storage objects by using the following operands and operator andspecifying the required value.
Storage object type Applicable operands
Volume • Object name
• Owning cluster name
• Owning SVM name
• Annotations
SVM • Object name
• Owning cluster name
• Annotations
Cluster • Object name
• Annotations
When you select annotation as an operand for any storage object, the "Is" operator is available. Forall other operands, you can select either "Is" or "Contains" as operator. When you select the "Is"operator, the condition is evaluated for an exact match of the operand value with the valueprovided for the selected operand. When you select the "Contains" operator, the condition isevaluated to meet one of the following criteria:
• The operand value is an exact match to the value of the selected operand.
• The operand value contains the value provided for the selected operand.
Example of an annotation rule with conditions
Consider an annotation rule with one condition group for a volume with the following twoconditions:
• Name contains "vol"
• SVM name is "data_svm"
This annotation rule annotates all volumes that include "vol" in their names and that are hosted onSVMs with the name "data_svm" with the selected annotation and the annotation type.
Condition groups
Condition groups are executed using logical OR, and then applied to storage objects. The storageobjects must meet the requirements of one of the condition groups to be annotated. The storage
365Managing annotations for storage objects

objects that meet the conditions of all the condition groups are annotated. You can use conditiongroups to increase the scope of storage objects to be annotated.
Example of an annotation rule with condition groups
Consider an annotation rule with two condition groups for a volume; each group contains thefollowing two conditions:
• Condition group 1
◦ Name contains "vol"
◦ SVM name is "data_svm"
This condition group annotates all volumes that include "vol" in their names and that arehosted on SVMs with the name "data_svm".
• Condition group 2
◦ Name contains "vol"
◦ The annotation value of data-priority is "critical"
This condition group annotates all volumes that include "vol" in their names and that areannotated with the data-priority annotation value as "critical".
When an annotation rule containing these two condition groups is applied on storage objects, thenthe following storage objects are annotated:
• All volumes that include "vol" in their names and that are hosted on SVM with the name"data_svm".
• All volumes that include "vol" in their names and that are annotated with the data-priorityannotation value as "critical".
Description of predefined annotation valuesData-priority is a predefined annotation that has the values Mission critical, High, and Low.These values enable you to annotate storage objects based on the priority of data that they contain.You cannot edit or delete the predefined annotation values.
Data-priority:Mission critical
This annotation is applied to storage objects that contain mission-critical data. For example,objects that contain production applications can be considered as mission critical.
Data-priority:High
This annotation is applied to storage objects that contain high-priority data. For example,objects that are hosting business applications can be considered high priority.
Data-priority:Low
This annotation is applied to storage objects that contain low-priority data. For example,objects that are on secondary storage, such as backup and mirror destinations, might be oflow priority.
Viewing the annotation list and detailsYou can view the list of annotations that are dynamically associated with clusters, volumes, andstorage virtual machines (SVMs). You can also view details such as the description, created by,created date, values, rules, and the objects associated with the annotation.
Steps
1. In the left navigation pane, click Storage Management > Annotations.
366Managing annotations for storage objects

2. In the Annotations tab, click the annotation name to view the associated details.
Related referenceAnnotations page on page 374
The Annotations page enables you to create annotations in Unified Manager that can be used toannotate storage objects, or you can edit or delete annotations. You can either manually annotatestorage objects with an annotation=value pair or configure annotation rules. Storage objects areannotated dynamically based on the annotation you apply.
Adding annotations dynamicallyWhen you create custom annotations, Unified Manager dynamically associates clusters, storagevirtual machines (SVMs), and volumes with the annotations by using rules. These rulesautomatically assign the annotations to storage objects.
Before you begin
You must have the Application Administrator or Storage Administrator role.
Steps
1. In the left navigation pane, click Storage Management > Annotations.
2. In the Annotations page, click Add Annotation.
3. In the Add Annotation dialog box, type a name and description for the annotation.
4. Optional: In the Annotation Values section, click Add to add values to the annotation.
5. Click Save.
Related tasksAdding values to annotations on page 368
You can add values to annotations, and then associate storage objects with a particular annotationname-value pair. Adding values to annotations helps you to manage storage objects moreeffectively.
Related referenceAnnotations page on page 374
The Annotations page enables you to create annotations in Unified Manager that can be used toannotate storage objects, or you can edit or delete annotations. You can either manually annotatestorage objects with an annotation=value pair or configure annotation rules. Storage objects areannotated dynamically based on the annotation you apply.
Add Annotation dialog box on page 377The Add Annotation dialog box enables you to create custom annotations that you can associatewith clusters, volumes, and storage virtual machines (SVMs) through annotation rules.
Adding annotations manually to individual storage objectsYou can manually annotate selected volumes, clusters, and SVMs without using annotation rules.You can annotate a single storage object or multiple storage objects, and specify the requiredname-value pair combination for the annotation.
Before you begin
You must have the Application Administrator or Storage Administrator role.
Steps
1. Navigate to the storage objects you want to annotate:
367Managing annotations for storage objects

To add annotation to… Do this…
Clusters a. Click Storage > Clusters.
b. Select one or more clusters.
Volumes a. Click Storage > Volumes.
b. Select one or more volumes.
SVMs a. Click Storage > SVMs.
b. Select one or more SVMs.
2. Click Annotate and select a name-value pair.
3. Click Apply.
Adding values to annotationsYou can add values to annotations, and then associate storage objects with a particular annotationname-value pair. Adding values to annotations helps you to manage storage objects moreeffectively.
Before you begin
You must have the Application Administrator or Storage Administrator role.
About this task
You cannot add values to predefined annotations.
Steps
1. In the left navigation pane, click Storage Management > Annotations.
2. In the Annotations page, select the annotation to which you want to add a value and then clickAdd in the Values section.
3. In the Add Annotation Value dialog box, specify a value for the annotation.
The value that you specify must be unique for the selected annotation.
4. Click Add.
Related tasksAdding annotations dynamically on page 367
When you create custom annotations, Unified Manager dynamically associates clusters, storagevirtual machines (SVMs), and volumes with the annotations by using rules. These rulesautomatically assign the annotations to storage objects.
Related referenceAnnotations page on page 374
The Annotations page enables you to create annotations in Unified Manager that can be used toannotate storage objects, or you can edit or delete annotations. You can either manually annotate
368Managing annotations for storage objects

storage objects with an annotation=value pair or configure annotation rules. Storage objects areannotated dynamically based on the annotation you apply.
Creating annotation rulesYou can create annotation rules that Unified Manager uses to dynamically annotate storage objectssuch as volumes, clusters, or storage virtual machines (SVMs).
Before you begin
You must have the Application Administrator or Storage Administrator role.
About this task
Storage objects that are currently monitored are annotated as soon as the annotation rule is created.New objects are annotated only after the monitoring cycle is completed.
Steps
1. In the left navigation pane, click Storage Management > Annotations.
2. In the Annotation Rules tab, click Add.
3. In the Add Annotation Rule dialog box, specify a name for the annotation rule.
4. In the Target Object Type field, select the type of storage object that you want to annotate.
5. In the Apply Annotation fields, select the annotation and annotation value that you want touse.
6. In the Conditions section, perform the appropriate action to create a condition, a conditiongroup, or both:
To create... Do this...
A condition a. Select an operand from the list of operands.
b. Select either Contains or Is as the operator.
c. Enter a value, or select a value from the available list.
A condition group a. Click Add Condition Group.
b. Select an operand from the list of operands.
c. Select either Contains or Is as the operator.
d. Enter a value, or select a value from the available list.
e. Click Add condition to create more conditions if required, and repeat steps athrough d for each condition.
7. Click Add.
Example of creating an annotation rule
Perform the following steps in the Add Annotation Rule dialog box to create an annotation rule,including configuring a condition and adding a condition group:
1. Specify a name for the annotation rule.
2. Select the target object type as storage virtual machine (SVM).
3. Select an annotation from the list of annotations, and specify a value.
4. In the Conditions section, select Object Name as the operand.
5. Select Contains as the operator.
6. Enter the value as svm_data.
7. Click Add condition group.
369Managing annotations for storage objects

8. Select Object Name as the operand.
9. Select Contains as the operator.
10. Enter the value as vol.
11. Click Add condition.
12. Repeat steps 8 through 10 by selecting data-priority as the operand in step 8, Is as theoperator in step 9, and mission-critical as the value in step 10.
13. Click Add.
Related conceptsHow annotation rules work in Unified Manager on page 364
An annotation rule is a criterion that you define to annotate storage objects (volumes, clusters, orstorage virtual machines (SVMs)). You can use either condition groups or conditions for definingannotation rules.
Related tasksEditing annotation rules on page 371
You can edit annotation rules to modify the condition groups and conditions within the conditiongroup to add annotations to or remove annotations from storage objects.
Reordering annotation rules on page 371You can change the order in which Unified Manager applies annotation rules to storage objects.Annotation rules are applied to storage objects sequentially based on their rank. When youconfigure an annotation rule, the rank is least. But you can change the rank of the annotation ruledepending on your requirements.
Deleting annotation rules on page 373You can delete annotation rules from Active IQ Unified Manager when the rules are no longerrequired.
Related referenceReorder Annotation Rule dialog box on page 380
You can use the Reorder Annotation Rule dialog box to specify the order in which you wantannotation rules to be applied to storage objects.
Configuring conditions for annotation rulesYou can configure one or more conditions to create annotation rules that Unified Manager applieson the storage objects. The storage objects that satisfy the annotation rule are annotated with thevalue specified in the rule.
Before you begin
You must have the Application Administrator or Storage Administrator role.
Steps
1. In the left navigation pane, click Storage Management > Annotations.
2. In the Annotation Rules tab, click Add.
3. In the Add Annotation Rule dialog box, enter a name for the rule.
4. Select one object type from the Target Object Type list, and then select an annotation name andvalue from the list.
5. In the Conditions section of the dialog box, select an operand and an operator from the list andenter a condition value, or click Add Condition to create a new condition.
6. Click Save and Add.
370Managing annotations for storage objects

Example of configuring a condition for an annotation rule
Consider a condition for the object type SVM, where the object name contains "svm_data".
Perform the following steps in the Add Annotation Rule dialog box to configure the condition:
1. Enter a name for the annotation rule.
2. Select the target object type as SVM.
3. Select an annotation from the list of annotations and a value.
4. In the Conditions field, select Object Name as the operand.
5. Select Contains as the operator.
6. Enter the value as svm_data.
7. Click Add.
Editing annotation rulesYou can edit annotation rules to modify the condition groups and conditions within the conditiongroup to add annotations to or remove annotations from storage objects.
Before you begin
You must have the Application Administrator or Storage Administrator role.
About this task
Annotations are dissociated from storage objects when you edit the associated annotation rules.
Steps
1. In the left navigation pane, click Storage Management > Annotations.
2. In the Annotation Rules tab, select the annotation rule you want to edit, and then clickActions > Edit.
3. In the Edit Annotation Rule dialog box, change the rule name, annotation name and value,condition groups, and conditions as required.
You cannot change the target object type for an annotation rule.
4. Click Save.
Related conceptsHow annotation rules work in Unified Manager on page 364
An annotation rule is a criterion that you define to annotate storage objects (volumes, clusters, orstorage virtual machines (SVMs)). You can use either condition groups or conditions for definingannotation rules.
Related tasksCreating annotation rules on page 369
You can create annotation rules that Unified Manager uses to dynamically annotate storage objectssuch as volumes, clusters, or storage virtual machines (SVMs).
Deleting annotation rules on page 373You can delete annotation rules from Active IQ Unified Manager when the rules are no longerrequired.
Reordering annotation rulesYou can change the order in which Unified Manager applies annotation rules to storage objects.Annotation rules are applied to storage objects sequentially based on their rank. When you
371Managing annotations for storage objects

configure an annotation rule, the rank is least. But you can change the rank of the annotation ruledepending on your requirements.
Before you begin
You must have the Application Administrator or Storage Administrator role.
About this task
You can select either a single row or multiple rows and perform many drag-and-drop operations tochange the rank of annotation rules. However, you must save the changes for the reprioritization tobe displayed in the Annotation Rules tab.
Steps
1. In the left navigation pane, click Storage Management > Annotations.
2. In the Annotation Rules tab, click Reorder.
3. In the Reorder Annotation Rule dialog box, drag and drop single or multiple rows torearrange the sequence of the annotation rules.
4. Click Save.
You must save the changes for the reorder to be displayed.
Deleting annotationsYou can delete custom annotations and their values when they are no longer required.
Before you begin
• You must have the Application Administrator or Storage Administrator role.
• The annotation values must not be used in other annotations or group rules.
Steps
1. In the left navigation pane, click Storage Management > Annotations.
2. In the Annotations tab, select the annotation that you want to delete.The details of the selected annotation are displayed.
3. Click Actions > Delete to delete the selected annotation and its value.
4. In the warning dialog box, click Yes to confirm the deletion.
Related tasksDeleting values from annotations on page 372
You can delete values associated with custom annotations when that value no longer applies to theannotation.
Related referenceAnnotations page on page 374
The Annotations page enables you to create annotations in Unified Manager that can be used toannotate storage objects, or you can edit or delete annotations. You can either manually annotatestorage objects with an annotation=value pair or configure annotation rules. Storage objects areannotated dynamically based on the annotation you apply.
Deleting values from annotationsYou can delete values associated with custom annotations when that value no longer applies to theannotation.
Before you begin
• You must have the Application Administrator or Storage Administrator role.
372Managing annotations for storage objects

• The annotation value must not be associated with any annotation rules or group rules.
About this task
You cannot delete values from predefined annotations.
Steps
1. In the left navigation pane, click Storage Management > Annotations.
2. In the annotations list in the Annotations tab, select the annotation from which you want todelete a value.
3. In the Values area of the Annotations tab, select the value you want to delete, and then clickDelete.
4. In the Warning dialog box, click Yes.The value is deleted and no longer displayed in the list of values for the selected annotation.
Related tasksDeleting annotations on page 372
You can delete custom annotations and their values when they are no longer required.
Related referenceAnnotations page on page 374
The Annotations page enables you to create annotations in Unified Manager that can be used toannotate storage objects, or you can edit or delete annotations. You can either manually annotatestorage objects with an annotation=value pair or configure annotation rules. Storage objects areannotated dynamically based on the annotation you apply.
Deleting annotation rulesYou can delete annotation rules from Active IQ Unified Manager when the rules are no longerrequired.
Before you begin
You must have the Application Administrator or Storage Administrator role.
About this task
When you delete an annotation rule, the annotation is disassociated and removed from the storageobjects.
Steps
1. In the left navigation pane, click Storage Management > Annotations.
2. In the Annotation Rules tab, select the annotation rule that you want to delete, and then clickDelete.
3. In the Warning dialog box, click Yes to confirm the deletion.
Related conceptsHow annotation rules work in Unified Manager on page 364
An annotation rule is a criterion that you define to annotate storage objects (volumes, clusters, orstorage virtual machines (SVMs)). You can use either condition groups or conditions for definingannotation rules.
Related tasksCreating annotation rules on page 369
You can create annotation rules that Unified Manager uses to dynamically annotate storage objectssuch as volumes, clusters, or storage virtual machines (SVMs).
Editing annotation rules on page 371
373Managing annotations for storage objects

You can edit annotation rules to modify the condition groups and conditions within the conditiongroup to add annotations to or remove annotations from storage objects.
Description of Annotations windows and dialog boxesYou can view and manage all your annotations from the Management/Annotations page. You canalso configure annotation rules for your storage objects from the Annotation Rules tab.
Annotations pageThe Annotations page enables you to create annotations in Unified Manager that can be used toannotate storage objects, or you can edit or delete annotations. You can either manually annotatestorage objects with an annotation=value pair or configure annotation rules. Storage objects areannotated dynamically based on the annotation you apply.
When you log in as an operator, you will have only read access to the page. You can access theadd, edit, or delete buttons in each tab when you log in as a Storage Administrator or ApplicationAdministrator.
• Annotations tab• Annotation Rules tab
Annotations tab
The Annotations tab enables you to view, create, edit, or delete annotations in Unified Manager.
Annotations list
Displays the names of the predefined and custom annotations. The count of the annotationvalues associated with each annotation is also displayed. You can click the annotation nameto view the details of the annotation.
Summary area
You can view the following details of the selected annotation:
Description
Displays the description provided for the annotation.
Created by
Displays the name of the user who created the annotation.
Creation date
Displays the date when the annotation was created.
Annotation=Values Pairs
Displays the list of annotation-value pairs and associated storage objects that are available for theselected annotation.
Value
Displays the name of the annotation=value pair.
Applicable Clusters
Displays the number of clusters that are annotated with a particular annotation=value pair.You can click the number to view the clusters page, which displays a filtered list of theclusters associated with a specific value.
374Managing annotations for storage objects

Applicable storage virtual machines (SVMs)
Displays the number of SVMs that are annotated with a particular annotation=value pair.You can click the number to view the SVMs page, which displays a filtered list of SVMsassociated with a specific value.
Applicable Volumes
Displays the number of volumes that are annotated with a particular annotation=value pair.You can click the number to view the volumes page, which displays a filtered list of thevolumes associated with a specific value.
Object Associations via Rules
Displays the list of annotation rules and the associated storage objects for the selected annotation.
Rank
Displays the order of the annotation rules to be applied on the storage objects.
Rules
Displays the name of the annotation rule.
Target Object Type
Displays the type of storage object to which the annotation rule is applied.
Associated Annotation Value
Displays the annotation=value pair applied to the storage object.
Applicable Objects
Displays the count of the storage objects that are annotated based on the annotation rule.
Manual Object Associations
Displays the list of annotations that you have manually configured and associated with storageobjects.
Annotation=Value Pair
Displays the name of the manual annotation and the value.
Applicable Clusters
Displays the number of clusters that are annotated with a particular manual annotationvalue. You can click the number to view the clusters page, which displays a filtered list ofthe clusters associated with a specific value.
Applicable storage virtual machines (SVMs)
Displays the number of SVMs that are annotated with a particular manual annotation value.You can click the number to view the SVMs page, which displays a filtered list of SVMsassociated with a specific value.
Applicable Volumes
Displays the number of volumes that are annotated with a particular manual annotationvalue. You can click the number to view the volumes page, which displays a filtered list ofthe volumes associated with a specific value.
Command buttons
You must have the Application Administrator or Storage Administrator role. For predefinedannotations, you cannot add or delete values.
375Managing annotations for storage objects

Add Annotation
Opens the Add Annotation dialog box, which enables you to create new custom annotationsand assign values to the annotation.
Actions
Enables you to edit or delete the selected annotation description.
Edit
Opens the Edit Annotation dialog box, which enables you to modify the annotation nameand description.
Delete
Enables you to delete the annotation value. You can delete the value only when it is notassociated with any annotation rules or group rules.
Annotation Rules tab
The Annotations Rules tab displays the annotation rules you created to annotate storage objects.You can perform tasks such as adding, editing, deleting, or reordering an annotation rule. You canalso view the number of storage objects that satisfy the annotation rule.
Command buttons
You must have the Application Administrator or Storage Administrator role.
Add
Displays the Add Annotation Rule dialog box, which enables you to create annotation rulesfor storage objects.
Edit
Displays the Edit Annotation Rule dialog box, which enables you to reconfigure previouslyconfigured annotation rules.
Delete
Deletes the selected annotation rules.
Reorder
Displays the Reorder Annotation Rule dialog box, which enables you to rearrange the orderof the annotation rules.
List View
The list view displays, in tabular format, the annotation rules you created in the Unified Managerserver. You can use the column filters to customize the data that is displayed. The list view of theAnnotation Rules tab and the list view of the Associated Rules section in the Annotation tabcontains the following columns:
• Rank
• Name
• Target Object type
• Associated Annotation Value
• Applicable Objects
An additional column is displayed for the Annotation Rules tab, Associated Annotation, whichdisplays the name of the annotation applied to the storage object.
Related tasksAdding annotations dynamically on page 367
376Managing annotations for storage objects
When you create custom annotations, Unified Manager dynamically associates clusters, storagevirtual machines (SVMs), and volumes with the annotations by using rules. These rulesautomatically assign the annotations to storage objects.
Deleting annotations on page 372You can delete custom annotations and their values when they are no longer required.
Adding values to annotations on page 368You can add values to annotations, and then associate storage objects with a particular annotationname-value pair. Adding values to annotations helps you to manage storage objects moreeffectively.
Deleting values from annotations on page 372You can delete values associated with custom annotations when that value no longer applies to theannotation.
Related referenceDescription of predefined annotation values on page 366
Data-priority is a predefined annotation that has the values Mission critical, High, and Low.These values enable you to annotate storage objects based on the priority of data that they contain.You cannot edit or delete the predefined annotation values.
Add Annotation dialog boxThe Add Annotation dialog box enables you to create custom annotations that you can associatewith clusters, volumes, and storage virtual machines (SVMs) through annotation rules.
You must have the Application Administrator or Storage Administrator role.
Annotation Name
Specifies the name of the annotation. You must enter a unique name for the annotation.
Description
Specifies a meaningful description of the annotation.
Annotation Values
Add
Adds a new value to the selected annotation.
Delete
Deletes the selected value for an annotation.
Command buttons
Save and Close
Saves the new annotation and closes the Add Annotation dialog box dialog box.
Cancel
Closes the Add Annotation dialog box without saving your changes.
Related tasksAdding annotations dynamically on page 367
When you create custom annotations, Unified Manager dynamically associates clusters, storagevirtual machines (SVMs), and volumes with the annotations by using rules. These rulesautomatically assign the annotations to storage objects.
Related referenceAnnotations page on page 374
The Annotations page enables you to create annotations in Unified Manager that can be used toannotate storage objects, or you can edit or delete annotations. You can either manually annotate
377Managing annotations for storage objects

storage objects with an annotation=value pair or configure annotation rules. Storage objects areannotated dynamically based on the annotation you apply.
Edit Annotation dialog boxThe Edit Annotation dialog box enables you to change the description of an existing annotation.
You must have the Application Administrator or Storage Administrator role.
Annotation Name
Displays the name of the annotation. This field cannot be edited.
Description
Provides a meaningful description of the annotation. You can edit this field when you wantto change the current description of the annotation.
Command buttons
Save and Close
Saves the annotation description changes and closes the dialog box.
Cancel
Closes the Edit Annotation dialog box without saving your changes.
Related referenceAnnotations page on page 374
The Annotations page enables you to create annotations in Unified Manager that can be used toannotate storage objects, or you can edit or delete annotations. You can either manually annotatestorage objects with an annotation=value pair or configure annotation rules. Storage objects areannotated dynamically based on the annotation you apply.
Add Annotation Rule dialog boxThe Add Annotation Rule dialog box enables you to create annotation rules in Unified Manager todynamically annotate storage objects.
You must have the Application Administrator or Storage Administrator role.
Name
Specifies the name of the annotation rule.
Target Object Type
Specifies the type of storage objects (storage virtual machines (SVMs), volumes, orclusters) that you want to annotate.
Apply Annotation
Specifies the annotation and the value you can use to annotate storage objects when allconditions are met.
Conditions
Specifies conditions that determine which storage objects you can annotate.
Command buttons
Save and Add
Adds the annotation rule you created and enables you to add another annotation rulewithout closing the dialog box.
Add
Adds the annotation rule and closes the Add Annotation Rule dialog box.
378Managing annotations for storage objects

Cancel
Cancels the changes and closes the Add Annotation Rule dialog box.
Add Condition
Adds a condition to define the annotation rule.
Add Condition Group
Adds a condition group to define conditions for the annotation rule.
Related conceptsHow annotation rules work in Unified Manager on page 364
An annotation rule is a criterion that you define to annotate storage objects (volumes, clusters, orstorage virtual machines (SVMs)). You can use either condition groups or conditions for definingannotation rules.
Related referenceEdit Annotation Rule dialog box on page 379
You can edit the annotation rules you created to add or remove annotations on storage objects.
Edit Annotation Rule dialog boxYou can edit the annotation rules you created to add or remove annotations on storage objects.
You must have the Application Administrator or Storage Administrator role.
Name
Displays the name of the annotation rule.
Target Object Type
Displays the type of storage object that you want to annotate. You cannot change the objecttype.
Apply Annotation
Displays the annotation and the value you can use to annotate storage objects when allconditions are met.
Conditions
Displays the list of conditions for the annotation rule. You can edit the conditions to add orremove the annotation on storage objects.
Command buttons
Save
Saves the changes you made and closes the Edit Annotation Rule dialog box.
Cancel
Closes the Edit Annotation Rule dialog box without saving your changes.
Related conceptsHow annotation rules work in Unified Manager on page 364
An annotation rule is a criterion that you define to annotate storage objects (volumes, clusters, orstorage virtual machines (SVMs)). You can use either condition groups or conditions for definingannotation rules.
Related referenceAdd Annotation Rule dialog box on page 378
379Managing annotations for storage objects

The Add Annotation Rule dialog box enables you to create annotation rules in Unified Manager todynamically annotate storage objects.
Reorder Annotation Rule dialog boxYou can use the Reorder Annotation Rule dialog box to specify the order in which you wantannotation rules to be applied to storage objects.
Command buttons
You must have the Application Administrator or Storage Administrator role.
Save
Saves the changes you made to the annotation rules and closes the Reorder Annotation Ruledialog box.
Cancel
Closes the Reorder Annotation Rule dialog box without saving the changes you made.
List View
Rank
Displays the order in which the annotation rules will be applied to the storage objects.
Name
Displays the name of the annotation rule.
Target Object Type
Displays the type of storage object to which the annotation rule is applied.
Associated Annotation
Displays the name of the annotation that is applied to the storage object.
Associated Annotation Value
Displays the annotation value for the storage object.
Annotate Cluster dialog boxThe Annotate Cluster dialog box enables you to manually annotate storage objects. You can selecteither a single cluster or multiple clusters and annotate with a specific value pair from the existinglist of annotations.
You must have the Application Administrator or Storage Administrator role.
Annotation=Value Pairs
Enables you to select the required annotation for the selected cluster.
Apply
Applies the selected annotation to the cluster.
Cancel
Closes the Annotate Cluster dialog box without saving your changes.
Annotate SVM dialog boxThe Annotate Storage VM dialog box enables you to manually annotate storage objects. You canselect either a single SVM or multiple SVMs and annotate with a specific value pair from theexisting list of annotations.
You must have the Application Administrator or Storage Administrator role.
380Managing annotations for storage objects

Annotation=Value Pairs
Enables you to select the required annotation for the selected SVM.
Apply
Applies the selected annotation to the SVM.
Cancel
Closes the Annotate Storage VM dialog box without saving your changes.
Annotate Volume dialog boxThe Annotate Volume dialog box enables you to manually annotate storage objects. You can selecteither a single volume or multiple volumes and annotate with a specific value pair from theexisting list of annotations.
You must have the Application Administrator or Storage Administrator role.
Annotation=Value Pairs
Enables you to select the required annotation for the selected volume.
Apply
Applies the selected annotation to the volume.
Cancel
Closes the Annotate Volume dialog box without saving your changes.
381Managing annotations for storage objects

Managing and monitoring groups
You can create groups in Unified Manager to manage storage objects.
Understanding groupsYou can create groups in Unified Manager to manage storage objects. Understanding the conceptsabout groups and how group rules enable you to add storage objects to a group will help you tomanage the storage objects in your environment.
What a group isA group is a dynamic collection of heterogeneous storage objects (clusters, SVMs, or volumes).You can create groups in Unified Manager to easily manage a set of storage objects. The membersin a group might change, depending on the storage objects that are monitored by Unified Managerat a point in time.
• Each group has a unique name.
• You must configure a minimum of one group rule for each group.
• You can associate a group with more than one group rule.
• Each group can include multiple types of storage objects such as clusters, SVMs, or volumes.
• Storage objects are dynamically added to a group based on when a group rule is created orwhen Unified Manager completes a monitoring cycle.
• You can simultaneously apply actions on all the storage objects in a group such as settingthresholds for volumes.
Related referenceAdd Group dialog box on page 394
The Add Group dialog box enables you to create groups to include clusters, volumes, and SVMsbased on the group rules.
Add Group Rule dialog box on page 395The Add Group Rule dialog box enables you to create group rules in Unified Manager todynamically group storage objects. You can later configure and apply group actions for the group.
Add Group Action dialog box on page 397The Add Group Action dialog box enables you to configure group actions that can be applied tostorage objects of a selected group.
How group rules work for groupsA group rule is a criterion that you define to enable storage objects (volumes, clusters, or SVMs)to be included in a specific group. You can use condition groups or conditions for defining grouprule for a group.
• You must associate a group rule to a group.
• You must associate an object type for a group rule; only one object type is associated for agroup rule.
• Storage objects are added or removed from the group after each monitoring cycle or when arule is created, edited, or deleted.
• A group rule can have one or more condition groups, and each condition group can have one ormore conditions.
• Storage objects can belong to multiple groups based on group rules you create.
382Managing and monitoring groups

Conditions
You can create multiple condition groups, and each condition group can have one or moreconditions. You can apply all the defined condition groups in a group rule for groups in order tospecify which storage objects are included in the group.
Conditions within a condition group are executed using logical AND. All the conditions in acondition group must be met. When you create or modify a group rule, a condition is created thatapplies, selects, and groups only those storage objects that satisfy all conditions in the conditiongroup. You can use multiple conditions within a condition group when you want to narrow thescope of which storage objects to include in a group.
You can create conditions with storage objects by using the following operands and operator andspecifying the required value.
Storage object type Applicable operands
Volume • Object name
• Owning cluster name
• Owning SVM name
• Annotations
SVM • Object name
• Owning cluster name
• Annotations
Cluster • Object name
• Annotations
When you select annotation as an operand for any storage object, the "Is" operator is available. Forall other operands, you can select either "Is" or "Contains" as operator.
• Operand
The list of operands in Unified Manager changes based on the selected object type. The listincludes the object name, owning cluster name, owning SVM name, and annotations that youdefine in Unified Manager.
• Operator
The list of operators changes based on the selected operand for a condition. The operatorssupported in Unified Manager are "Is" and "Contains".
When you select the "Is" operator, the condition is evaluated for exact match of operand valueto the value provided for the selected operand.
When you select the "Contains" operator, the condition is evaluated to meet one of thefollowing criteria:
◦ The operand value is an exact match to the value provided for the selected operand
◦ The operand value contains the value provided for the selected operand
• Value
The value field changes based on the operand selected.
Example of a group rule with conditions
Consider a condition group for a volume with the following two conditions:
• Name contains "vol"
• SVM name is "data_svm"
383Managing and monitoring groups
This condition group selects all volumes that include "vol" in their names and that are hosted onSVMs with the name "data_svm".
Condition groups
Condition groups are executed using logical OR, and then applied to storage objects. The storageobjects must satisfy one of the condition groups to be included in a group. The storage objects ofall the condition groups are combined. You can use condition groups to increase the scope ofstorage objects to include in a group.
Example of a group rule with condition groups
Consider two condition groups for a volume, with each group containing the following twoconditions:
• Condition group 1
◦ Name contains "vol"
◦ SVM name is "data_svm"
Condition group 1 selects all volumes that include "vol" in their names and that are hosted onSVMs with the name "data_svm".
• Condition group 2
◦ Name contains "vol"
◦ The annotation value of data-priority is "critical"
Condition group 2 selects all volumes that include "vol" in their names and that are annotatedwith the data-priority annotation value as "critical".
When a group rule containing these two condition groups is applied on storage objects, then thefollowing storage objects are added to a selected group:
• All volumes that include "vol" in their names and that are hosted on the SVM with the name"data_svm".
• All volumes that include "vol" in their names and that are annotated with the data-priorityannotation value "critical".
How group actions work on storage objectsA group action is an operation that is performed on all the storage objects in a group. For example,you can configure volume threshold group action to simultaneously change the volume thresholdvalues of all volumes in a group.
Groups support unique group action types. You can have a group with only one volume healththreshold group action type. However, you can configure a different type of group action, ifavailable, for the same group. The rank of a group action determines the order in which the actionis applied to storage objects. The details page of a storage object provides information about whichgroup action is applied on the storage object.
Example of unique group actions
Consider a volume A that belongs to groups G1 and G2, and the following volume healththreshold group actions are configured for these groups:
• Change_capacity_threshold group action with rank 1, for configuring the capacity ofthe volume
• Change_snapshot_copies group action with rank 2, for configuring the Snapshot copiesof the volume
384Managing and monitoring groups

The Change_capacity_threshold group action always takes priority over theChange_snapshot_copies group action and is applied to volume A. When Unified Managercompletes one cycle of monitoring, the health threshold related events of volume A are re-evaluated per the Change_capacity_threshold group action. You cannot configureanother volume threshold type of group action for either G1 or G2 group.
Managing groups of storage objectsYou can manage storage objects in your environment by creating groups of storage objects. Thesestorage objects must satisfy the group rules associated with the group.
Adding groupsYou can create groups to combine clusters, volumes, and storage virtual machines (SVMs) for easeof management.
Before you begin
You must have the Application Administrator or Storage Administrator role.
About this task
You can define group rules to add or remove members from the group and to modify group actionsfor the group.
Steps
1. In the left navigation pane, click Storage Management > Groups.
2. In the Groups tab, click Add.
3. In the Add Group dialog box, enter a name and description for the group.
4. Click Add.
Related tasksAdding group rules on page 386
You can create group rules for a group to dynamically add storage objects such as volumes,clusters, or storage virtual machines (SVMs) to the group. You must configure at least onecondition group with at least one condition to create a group rule.
Adding group actions on page 389You can configure group actions that you want to apply to storage objects in a group. Configuringactions for a group enables you to save time, because you do not have to add these actions to eachobject individually.
Deleting groupsYou can delete a group from Unified Manager when the group is no longer required.
Before you begin
• None of the storage objects (clusters, SVMs, or volumes) must be associated with any grouprule that is associated with the group that you want to delete.
• You must have the Application Administrator or Storage Administrator role.
Steps
1. In the left navigation pane, click Storage Management > Groups.
2. In the Groups tab, select the group that you want to delete, and then click Delete.
3. In the Warning dialog box, confirm the deletion by clicking Yes.
Deleting a group does not delete the group actions that are associated with the group. However,these group actions will be unmapped after the group is deleted.
385Managing and monitoring groups

Editing groupsYou can edit the name and description of a group that you created in Unified Manager.
Before you begin
You must have the Application Administrator or Storage Administrator role.
About this task
When you edit a group to update the name, you must specify a unique name; you cannot use anexisting group name.
Steps
1. In the left navigation pane, click Storage Management > Groups.
2. In the Groups tab, select the group that you want to edit, and then click Edit.
3. In the Edit Group dialog box, change the name, description, or both for the group.
4. Click Save.
Adding group rulesYou can create group rules for a group to dynamically add storage objects such as volumes,clusters, or storage virtual machines (SVMs) to the group. You must configure at least onecondition group with at least one condition to create a group rule.
Before you begin
You must have the Application Administrator or Storage Administrator role.
About this task
Storage objects that are currently monitored are added as soon as the group rule is created. Newobjects are added only after the monitoring cycle is completed.
Steps
1. In the left navigation pane, click Storage Management > Groups.
2. In the Group Rules tab, click Add.
3. In the Add Group Rule dialog box, specify a name for the group rule.
4. In the Target Object Type field, select the type of storage object that you want to group.
5. In the Group field, select the required group for which you want to create group rules.
6. In the Conditions section, perform the following steps to create a condition, a condition group,or both:
To create.... Do this...
A condition a. Select an operand from the list of operands.
b. Select either Contains or Is as the operator.
c. Enter a value, or select a value from the available list.
A condition group a. Click Add Condition Group
b. Select an operand from the list of operands.
c. Select either Contains or Is as the operator.
d. Enter a value, or select a value from the available list.
e. Click Add condition to create more conditions if required, and repeat steps athrough d for each condition.
7. Click Add.
386Managing and monitoring groups

Example for creating a group rule
Perform the following steps in the Add Group Rule dialog box to create a group rule, includingconfiguring a condition and adding a condition group:
1. Specify a name for the group rule.
2. Select the object type as storage virtual machine (SVM).
3. Select a group from the list of groups.
4. In the Conditions section, select Object Name as the operand.
5. Select Contains as the operator.
6. Enter the value as svm_data.
7. Click Add condition group.
8. Select Object Name as the operand.
9. Select Contains as the operator.
10. Enter the value as vol.
11. Click Add condition.
12. Repeat steps 8 through 10 by selecting data-priority as the operand in step 8, Is as theoperator in step 9, and critical as the value in step 10.
13. Click Add to create the condition for the group rule.
Related conceptsHow group rules work for groups on page 382
A group rule is a criterion that you define to enable storage objects (volumes, clusters, or SVMs)to be included in a specific group. You can use condition groups or conditions for defining grouprule for a group.
Related tasksEditing group rules on page 387
You can edit group rules to modify the condition groups and the conditions within a conditiongroup to add or remove storage objects to or from a specific group.
Deleting group rules on page 388You can delete a group rule from Active IQ Unified Manager when the group rule is no longerrequired.
Editing group rulesYou can edit group rules to modify the condition groups and the conditions within a conditiongroup to add or remove storage objects to or from a specific group.
Before you begin
You must have the Application Administrator or Storage Administrator role.
Steps
1. In the left navigation pane, click Storage Management > Groups.
2. In the Group Rules tab, select the group rule that you want to edit, and then click Edit.
3. In the Edit Group Rule dialog box, change the group rule name, associated group name,condition groups, and conditions as required.
Note: You cannot change the target object type for a group rule.
4. Click Save.
Related conceptsHow group rules work for groups on page 382
387Managing and monitoring groups

A group rule is a criterion that you define to enable storage objects (volumes, clusters, or SVMs)to be included in a specific group. You can use condition groups or conditions for defining grouprule for a group.
Related tasksAdding group rules on page 386
You can create group rules for a group to dynamically add storage objects such as volumes,clusters, or storage virtual machines (SVMs) to the group. You must configure at least onecondition group with at least one condition to create a group rule.
Deleting group rules on page 388You can delete a group rule from Active IQ Unified Manager when the group rule is no longerrequired.
Deleting group rulesYou can delete a group rule from Active IQ Unified Manager when the group rule is no longerrequired.
Before you begin
You must have the Application Administrator or Storage Administrator role.
About this task
When a group rule is deleted, the associated storage objects will be removed from the group.
Steps
1. In the left navigation pane, click Storage Management > Groups.
2. In the Group Rules tab, select the group rule that you want to delete, and then click Delete.
3. In the Warning dialog box, confirm the deletion by clicking Yes.
Related conceptsHow group rules work for groups on page 382
A group rule is a criterion that you define to enable storage objects (volumes, clusters, or SVMs)to be included in a specific group. You can use condition groups or conditions for defining grouprule for a group.
Related tasksAdding group rules on page 386
You can create group rules for a group to dynamically add storage objects such as volumes,clusters, or storage virtual machines (SVMs) to the group. You must configure at least onecondition group with at least one condition to create a group rule.
Editing group rules on page 387You can edit group rules to modify the condition groups and the conditions within a conditiongroup to add or remove storage objects to or from a specific group.
Configuring conditions for group rulesYou can configure one or more conditions to create group rules in Unified Manager that areapplied on the storage objects. The storage objects that satisfy the group rule are combined into agroup.
Before you begin
You must have the Application Administrator or Storage Administrator role.
Steps
1. In the left navigation pane, click Storage Management > Groups.
388Managing and monitoring groups
2. Click Add.
3. In the Add Group Rule dialog box, select one operand from the list of operands.
4. Select an operator for the condition.
5. Enter a required value or select one from the available list.
6. Click Add.
Example of configuring a condition for a group rule
Consider a condition for the object type SVM, where the object name contains "svm_data".
Perform the following steps in the Add Group Rule dialog box to configure the condition:
1. Enter a name for the group rule.
2. Select the object type as SVM.
3. Select a group from the list of groups.
4. In the Conditions field, select Object Name as the operand.
5. Select Contains as the operator.
6. Enter the value as svm_data.
7. Click Add.
Adding group actionsYou can configure group actions that you want to apply to storage objects in a group. Configuringactions for a group enables you to save time, because you do not have to add these actions to eachobject individually.
Before you begin
You must have the Application Administrator or Storage Administrator role.
Steps
1. In the left navigation pane, click Storage Management > Groups.
2. In the Group Actions tab, click Add.
3. In the Add Group Action dialog box, enter a name and description for the action.
4. From the Group menu, select a group for which you want to configure the action.
5. From the Action Type menu, select an action type.The dialog box expands, enabling you to configure the selected action type with requiredparameters.
6. Enter appropriate values for the required parameters to configure a group action.
7. Click Add.
Related tasksEditing group actions on page 389
You can edit the group action parameters that you configured in Unified Manager, such as thegroup action name, description, associated group name, and parameters of the action type.
Editing group actionsYou can edit the group action parameters that you configured in Unified Manager, such as thegroup action name, description, associated group name, and parameters of the action type.
Before you begin
You must have the Application Administrator or Storage Administrator role.
389Managing and monitoring groups

Steps
1. In the left navigation pane, click Storage Management > Groups.
2. In the Group Actions tab, select the group action that you want to edit, and then click Edit.
3. In the Edit Group Action dialog box, change the group action name, description, associatedgroup name, and parameters of the action type, as required.
4. Click Save.
Related tasksDeleting group actions on page 390
You can delete a group action from Unified Manager when the group action is no longer required.
Configuring volume health thresholds for groupsYou can configure group-level volume health thresholds for capacity, Snapshot copies, qtreequotas, growth, and inodes.
Before you begin
You must have the Application Administrator or Storage Administrator role.
About this task
The volume health threshold type of group action is applied only on volumes of a group.
Steps
1. In the left navigation pane, click Storage Management > Groups.
2. In the Group Actions tab, click Add.
3. Enter a name and description for the group action.
4. From the Group drop-down box, select a group for which you want to configure group action.
5. Select Action Type as the volume health threshold.
6. Select the category for which you want to set the threshold.
7. Enter the required values for the health threshold.
8. Click Add.
Deleting group actionsYou can delete a group action from Unified Manager when the group action is no longer required.
Before you begin
You must have the Application Administrator or Storage Administrator role.
About this task
When you delete the group action for the volume health threshold, global thresholds are applied tothe storage objects in that group. Any object-level health thresholds that are set on the storageobject are not impacted.
Steps
1. In the left navigation pane, click Storage Management > Groups.
2. In the Group Actions tab, select the group action that you want to delete, and then clickDelete.
3. In the Warning dialog box, confirm the deletion by clicking Yes.
390Managing and monitoring groups

Reordering group actionsYou can change the order of the group actions that are to be applied to the storage objects in agroup. Group actions are applied to storage objects sequentially based on their rank. The lowestrank is assigned to the group action that you configured last. You can change the rank of the groupaction depending on your requirements.
Before you begin
You must have the Application Administrator or Storage Administrator role.
About this task
You can select either a single row or multiple rows, and then perform multiple drag-and-dropoperations to change the rank of group actions. However, you must save the changes for the re-prioritization to be reflected in the group actions grid.
Steps
1. In the left navigation pane, click Storage Management > Groups.
2. In the Group Actions tab, click Reorder.
3. In the Reorder Group Actions dialog box, drag and drop the rows to rearrange the sequenceof group actions as required.
4. Click Save.
Description of groups windows and dialog boxesYou can use the Groups page to view and manage all your groups. You can also configure grouprules and actions for your storage objects from the Group Rules tab and Group Actions tab.
Groups pageThe Groups page enables you to create groups in Unified Manager to easily manage storageobjects. A group is a dynamic collection of storage objects (clusters, volumes, and SVMs), whichis defined by the group rules you create for the group.
The Groups page includes tabs that enable you to add, delete, or edit a group, group rules, andgroup actions. When you log in as an operator, you will have only read access to the page. You canaccess the add, edit, or delete buttons in each tab when you log in as a Storage Administrator orApplication Administrator.
• Groups tab• Group Rules tab• Group Actions tab
Groups tab
The Groups tab displays the name and description of the groups you created. You can performtasks such as adding, editing, or deleting a group. The tab also displays the number of group rulesand group actions associated with a group, the number of clusters, SVMs, and volumes in thegroup.
Command buttons
Add
Displays the Add Group dialog box, which enables you to add a group and provide a nameand description for the group.
You can also apply group rules later to the group to include storage objects.
391Managing and monitoring groups

Edit
Displays the Edit Group dialog box, which enables you to edit the name and description forthe selected group.
Delete
Deletes the selected group.
List view
The list view displays, in tabular format, the groups you created in Unified Manager. You can usethe column filters to customize the data that is displayed. By default, the list is sorted by groupname.
Name
Displays the name of the group.
Description
Displays the description of the group.
Associated Rules
Displays the number of rules added to the group.
Associated Actions
Displays the number of group actions added to the group.
Applicable Clusters
Displays the number of clusters included in the group.
Applicable SVMs
Displays the number of SVMs included in the group.
Applicable Volumes
Displays the number of volumes included in the group.
Group Rules tab
The Group Rules tab displays the group rules you created for groups to contain storage objects.You can perform tasks such as adding, editing, or deleting a group rule. The tab also displays thegroup name for which the group rule is created and the storage object for which the rule is applied.You can also view the number of storage objects that satisfy the group rule.
Command buttons
Add
Displays the Add Group Rule dialog box, which enables you to create group rules forstorage objects.
Edit
Displays the Edit Group Rule dialog box, which enables you to reconfigure previouslyconfigured group rules.
Delete
Deletes the selected group rule.
List view
The list view displays, in tabular format, the group rules you created for a specific storage object(clusters, volumes, or SVMs) and the count of storage objects that satisfy the defined group rule.
Name
Displays the name of the rule.
392Managing and monitoring groups

Associated Group
Displays the name of the group for which the group rule is defined.
Target Object Type
Displays the type of storage object to which the group rule is applied.
Applicable Objects
Displays the count of the storage objects included in the group based on the group rule.
Group Actions tab
The Group Actions tab displays the name and type of group actions you define for groups. Youcan perform tasks such as adding, editing, deleting, or reordering the group actions. The tab alsodisplays the name of the group on which the group action is applied.
Command buttons
Add
Displays the Add Action dialog box, which enables you to create group actions for a groupof storage objects. For example, you can set the threshold levels of storage objects in agroup.
Edit
Displays the Edit Action dialog box, which enables you to reconfigure previouslyconfigured group actions.
Delete
Deletes the selected group action.
Reorder
Displays the Reorder Group Actions dialog box to rearrange the order of the group actions.
List view
The list view displays, in tabular format, the group actions you created for the groups in theUnified Manager server. You can use the column filters to customize the data that is displayed.
Rank
Displays the order of the group actions to be applied on the storage objects in a group.
Name
Displays the name of the group action.
Associated Group
Displays the name of the group for which the group action is defined.
Action Type
Displays the type of group action that you can perform on the storage objects in a group.
You cannot create multiple group actions of the same action type for a group. For example,you can create a group action of setting volume thresholds for a group. However, youcannot create another group action for the same group to change volume thresholds.
Description
Displays the description of the group action.
Related conceptsHow group rules work for groups on page 382
393Managing and monitoring groups

A group rule is a criterion that you define to enable storage objects (volumes, clusters, or SVMs)to be included in a specific group. You can use condition groups or conditions for defining grouprule for a group.
Add Group dialog boxThe Add Group dialog box enables you to create groups to include clusters, volumes, and SVMsbased on the group rules.
You must have the Application Administrator or Storage Administrator role.
Name
Specifies the name of the group. You must enter a unique name for the group.
Description
Specifies a meaningful description of the group.
Command buttons
The command buttons enable you to add or cancel the creation of a new group.
Add
Creates the new group.
Cancel
Closes the Add Group dialog box without saving your changes.
Edit Group dialog boxThe Edit Group dialog box enables you to change the name and description of a group.
You must have the Application Administrator or Storage Administrator role.
Group Name
Displays the name of the group. When changing the group name, you must not use anexisting group name.
Description
Provides a meaningful description of the group. You can edit this field when you want tochange the current description of the group.
Command buttons
The command buttons enable you to save or cancel changes you make to the group.
Save
Saves the changes you made and closes the dialog box.
Cancel
Closes the Edit Group dialog box without saving your changes.
Groups details pageFrom the Groups details page, you can view the details of a selected group. You can also viewadditional information such as the group rules and group actions associated with the selectedgroup.
• Command buttons• Summary area
394Managing and monitoring groups
Command buttons
View Groups
Enables you to navigate to the Groups page.
Actions
Enables you to edit or delete the group, based on your role. You must have the ApplicationAdministrator or Storage Administrator role.
Manage Group Rules
Enables you to navigate to the Group Rules page, which displays rules for this group.
Manage Group Actions
Enables you to navigate to the Group Actions page, which displays actions for this group.
Summary area
You can view the following group details:
Description
Displays the description provided for the group.
Created by
Displays the name of the user who created the group.
Creation Date
Displays the date when the group was created.
Associated Rules
Displays all the group rules created for a group, in tabular format. You can view the detailsof each group rule, such as the rule name, associated object type, and the count of storageobjects of the associated object type.
Associated Actions
Displays all the group actions, configured for a group, in tabular format. You can view thedetails of each group action, such as the rank, name, action type, and description.
Add Group Rule dialog boxThe Add Group Rule dialog box enables you to create group rules in Unified Manager todynamically group storage objects. You can later configure and apply group actions for the group.
You must have the Application Administrator or Storage Administrator role.
Name
Specifies the name of the group rule.
Target Object Type
Specifies the type of storage objects to include in the group.
Group
Specifies the name of the group for which the group rule is created.
Conditions
Specifies conditions that determine which storage objects can be included in a group.
Condition group
Specifies condition groups which have one or more conditions defined for including storageobjects in a group.
395Managing and monitoring groups

Command buttons
Save and Add
Adds the group rule and enables you to add another group rule without closing the dialogbox.
Add
Adds the group rule and closes the Add Group Rule dialog box.
Cancel
Cancels the changes and closes the Add Group Rule dialog box.
Add Condition
Adds a condition to define the group rule.
Add Condition Group
Adds a condition group to define conditions for the group rule.
Related conceptsHow group rules work for groups on page 382
A group rule is a criterion that you define to enable storage objects (volumes, clusters, or SVMs)to be included in a specific group. You can use condition groups or conditions for defining grouprule for a group.
Edit Group Rule dialog boxYou can edit the group rules you created to include the maximum number of storage objects in agroup.
You must have the Application Administrator or Storage Administrator role.
Rule Name
Displays the name of the rule.
Target Object Type
Displays the storage object to be added to a selected group. You cannot change the objecttype.
Associated Group
Displays the associated group. You can select a different group for the group rule.
Condition
Displays the list of conditions for a selected group. You can edit the conditions. The storageobjects are either removed or added to a selected group based on the changes.
Command buttons
Save
Saves the changes you made and closes the dialog box.
Cancel
Closes the Edit Group Rule dialog box without saving your changes.
Related conceptsHow group rules work for groups on page 382
396Managing and monitoring groups

A group rule is a criterion that you define to enable storage objects (volumes, clusters, or SVMs)to be included in a specific group. You can use condition groups or conditions for defining grouprule for a group.
Add Group Action dialog boxThe Add Group Action dialog box enables you to configure group actions that can be applied tostorage objects of a selected group.
You must have the Application Administrator or Storage Administrator role.
Name
Specifies the name of the action.
Description
Specifies the description of the action.
Group
Specifies the group for which the action is configured.
Action type
Specifies the type of action configured. Based on the selected action type, the Add GroupAction dialog box expands, enabling you to configure a group action by providing therequired values.
Unified Manager currently supports only volume threshold action type.
Command buttons
Add
Adds the new action and closes the dialog box.
Cancel
Closes the Add Group Action dialog box dialog box without saving your changes.
Related tasksConfiguring volume health thresholds for groups on page 390
You can configure group-level volume health thresholds for capacity, Snapshot copies, qtreequotas, growth, and inodes.
Related referenceGroup action-volume thresholds section on page 397
The group action-volume thresholds section enables you to configure group-level health thresholdsfor volumes. These thresholds are applied to all the volumes in a group. When the volume healththresholds are configured at the group level, the global health threshold values are not affected.
Group action-volume thresholds sectionThe group action-volume thresholds section enables you to configure group-level health thresholdsfor volumes. These thresholds are applied to all the volumes in a group. When the volume healththresholds are configured at the group level, the global health threshold values are not affected.
You can configure volume health thresholds for the following to configure a group action:
• Capacity
• Growth
• Qtree quota
• Snapshot copies
• Inodes
397Managing and monitoring groups

Global default values are used if volume health thresholds are not configured for any of thesecategories. You can set health thresholds for the following:
• Capacity
• Growth
• Qtree quota
• Snapshot copies
• Inodes
Capacity section
You can set conditions for the following volume capacity health thresholds:
Space Nearly Full
Specifies the percentage at which a volume is considered to be nearly full:
• Default value: 80 percentThe value for this threshold must be lower than the value for the Volume Full thresholdfor the management server to generate an event.
• Event generated: Volume Nearly Full
• Event severity: Warning
Space Full
Specifies the percentage at which a volume is considered full:
• Default value: 90 percent
• Event generated: Volume Full
• Event severity: Error
Overcommitted
Specifies the percentage at which a volume is considered to be overcommitted:
• Default value: 100 percent
• Event generated: Volume Overcommitted
• Event severity: Error
Growth section
You can set the following health threshold conditions for volume growth:
Growth Rate
Specifies the percentage at which a volume's growth rate is considered to be normal beforethe system generates a Volume Growth Rate Abnormal event:
• Default value: 1 percent
• Event generated: Volume Growth Rate Abnormal
• Event severity: Warning
Growth Rate Sensitivity
Specifies the factor that is applied to the standard deviation of a volume's growth rate. If thegrowth rate exceeds the factored standard deviation, a Volume Growth Rate Abnormal eventis generated.
A lower value for growth rate sensitivity indicates that the aggregate is highly sensitive tochanges in the growth rate. The range for the growth rate sensitivity is 1 through 5.
• Default value: 2
Qtree Quota section
You can set the following health threshold conditions for volume quotas:
398Managing and monitoring groups
Nearly Overcommitted
Specifies the percentage at which a volume is considered to be nearly overcommitted byqtree quotas:
• Default value: 95 percent
• Event generated: Volume Qtree Quota Nearly Overcommitted
• Event severity: Warning
Overcommitted
Specifies the percentage at which a volume is considered to be overcommitted by qtreequotas:
• Default value: 100 percent
• Event generated: Volume Qtree Quota Overcommitted
• Event severity: Error
Snapshot Copies section
You can set the following health threshold conditions for the Snapshot copies in the volume:
Snapshot Reserve Full
Specifies the percentage at which the space reserved for Snapshot copies is considered full:
• Default value: 90 percent
• Event generated: Volume Snapshot Reserve Full
• Event severity: Error
Days Until Full
Specifies the number of days remaining before the space reserved for Snapshot copiesreaches full capacity:
• Default value: 7
• Event generated: Volume Snapshot Reserve Days Until Full
• Event severity: Error
Count
Specifies the number of Snapshot copies on a volume that are considered to be too many:
• Default value: 250
• Event generated: Too Many Snapshot Copies
• Event severity: Error
Inodes section
You can set the following health threshold conditions for inodes:
Nearly Full
Specifies the percentage at which a volume is considered to have consumed most of itsinodes:
• Default value: 80 percent
• Event generated: Inodes Nearly Full
• Event severity: Warning
Full
Specifies the percentage at which a volume is considered to have consumed all of its inodes:
• Default value: 90 percent
• Event generated: Inodes Full
399Managing and monitoring groups

• Event severity: Error
Edit Group Action dialog boxYou can edit the group action that you created for groups by using the Edit Group Action dialogbox.
You must have the Application Administrator or Storage Administrator role.
Action Name
Displays the name of the group action.
Description
Displays the description of the group action.
Group
Displays the name of the group selected.
Action type
Displays the type of group action. You cannot change the action type. However, you canmodify the parameters that you used to configure the group action.
Command buttons
Save
Saves the changes you made to the group action.
Cancel
Closes the Edit Group Action dialog box without saving your changes.
Reorder Group Actions dialog boxYou can use the Reorder Group Actions dialog box to change the ranks of one or more groupactions. The position of a group action in the grid determines the rank for the group action.
You must have the Application Administrator or Storage Administrator role.
Rank
Specifies the order of the group action to be applied on storage objects in a group.
Name
Specifies the name of the group action.
Action Type
Specifies the type of action that you can perform on the storage objects in a group.
Associated Group
Specifies the name of the group for which the group actions are defined.
Related tasksReordering group actions on page 391
You can change the order of the group actions that are to be applied to the storage objects in agroup. Group actions are applied to storage objects sequentially based on their rank. The lowestrank is assigned to the group action that you configured last. You can change the rank of the groupaction depending on your requirements.
400Managing and monitoring groups

Managing and monitoring protection relationships
Active IQ Unified Manager enables you to create protection relationships, to monitor andtroubleshoot SnapMirror and SnapVault relationships on managed clusters, and to restore datawhen it is overwritten or lost.
For SnapMirror operations there are two replication types:
• Asynchronous
Replication from the primary to the secondary volume is determined by a schedule.
• Synchronous
Replication is performed simultaneously on the primary and secondary volume.
You can perform up to 10 protection jobs simultaneously with no performance impact. You mightexperience some performance impact when you run between 11 and 30 jobs simultaneously.Running more than 30 jobs simultaneously is not recommended.
Types of SnapMirror protectionDepending on the deployment of your data storage topology, Unified Manager enables you toconfigure multiple types of SnapMirror protection relationships. All variations of SnapMirrorprotection offer failover disaster recovery protection, but offer differing capabilities inperformance, version flexibility, and multiple backup copy protection.
Traditional SnapMirror Asynchronous protection relationships
Traditional SnapMirror Asynchronous protection provides block replication mirror protectionbetween source and destination volumes.
In traditional SnapMirror relationships, mirror operations execute faster than they would inalternative SnapMirror relationships because the mirror operation is based on block replication.However, traditional SnapMirror protection requires that the destination volume run under thesame or later minor version of ONTAP software as the source volume within the same majorrelease (for example, version 8.x to 8.x, or 9.x to 9.x). Replication from a 9.1 source to a 9.0destination is not supported because the destination is running an earlier major version.
SnapMirror Asynchronous protection with version-flexible replication
SnapMirror Asynchronous protection with version-flexible replication provides logical replicationmirror protection between source and destination volumes, even if those volumes are runningunder different versions of ONTAP 8.3 or later software (for example, version 8.3 to 8.3.1, or 8.3to 9.1, or 9.2.2 to 9.2).
In SnapMirror relationships with version-flexible replication, mirror operations do not execute asquickly as they would in traditional SnapMirror relationships.
Because of slower execution, SnapMirror with version-flexible replication protection is notsuitable to implement in either of the following circumstances:
• The source object contains more than 10 million files to protect.
• The recovery point objective for the protected data is two hours or less. (That is, the destinationmust always contain mirrored, recoverable data that is no more than two hours older than dataat the source.)
In either of the listed circumstances, the faster block-replication based execution of defaultSnapMirror protection is required.
401Managing and monitoring protection relationships

SnapMirror Asynchronous protection with version-flexible replication and backup option
SnapMirror Asynchronous protection with version-flexible replication and backup option providesmirror protection between source and destination volumes and the capability to store multiplecopies of the mirrored data at the destination.
The storage administrator can specify which Snapshot copies are mirrored from source todestination and can also specify how long to retain those copies at the destination, even if they aredeleted at the source.
In SnapMirror relationships with version-flexible replication and backup option, mirror operationsdo not execute as quickly as they would in traditional SnapMirror relationships.
SnapMirror Unified Replication (mirror and vault)
SnapMirror unified replication allows you to configure disaster recovery and archiving on thesame destination volume. As with SnapMirror, unified data protection performs a baseline transferthe first time you invoke it. A baseline transfer under the default unified data protection policy"MirrorAndVault" makes a Snapshot copy of the source volume, then transfers that copy and thedata blocks it references to the destination volume. Like SnapVault, unified data protection doesnot include older Snapshot copies in the baseline.
SnapMirror Synchronous protection with strict synchronization
SnapMirror Synchronous protection with "strict" synchronization ensures that the primary andsecondary volumes are always a true copy of each other. If a replication failure occurs whenattempting to write data to the secondary volume, then the client I/O to the primary volume isdisrupted.
SnapMirror Synchronous protection with regular synchronization
SnapMirror Synchronous protection with "regular" synchronization does not require that theprimary and secondary volume are always a true copy of each other; thereby ensuring availabilityof the primary volume. If a replication failure occurs when attempting to write data to thesecondary volume, the primary and secondary volumes fall out of sync and client I/O will continueto the primary volume.
Note: The Restore button and the Relationship operation buttons are not available whenmonitoring synchronous protection relationships from the Health: All Volumes view or theVolume / Health details page.
Viewing volume protection relationshipsFrom the Relationship: All Relationships view, and from the Volume Relationships page, you canview the status of existing volume SnapMirror and SnapVault relationships. You can also examinedetails about protection relationships, including transfer and lag status, source and destinationdetails, schedule and policy information, and so on.
Before you begin
You must have the Application Administrator or Storage Administrator role.
About this task
You can also initiate relationship commands from this page.
Steps
1. In the left navigation pane, click Storage > Volumes.
2. From the View menu, select Relationship > All Relationships.The Relationship: All Relationships view is displayed.
3. Choose one of the following ways to view the volume protection details:
402Managing and monitoring protection relationships

• To view current information about all the volume relationships, remain on the default AllRelationships page.
• To view detailed information about the volume transfer trends over a period of time, in theView menu, select Relationship: Last 1 month Transfer Status view.
• To view detailed information about the volume transfer activity on a day to day basis, in theView menu, select Relationship: Last 1 month Transfer Rate view.
Note: The volume transfer views display information for volumes in asynchronousrelationships only - volumes in synchronous relationships are not shown.
Related tasksExporting storage data as reports on page 27
You can export storage data in a variety of output formats and then use the exported data to buildreports. For example, if there are 10 critical events that have not been resolved, you can export thedata from the Event Management inventory page to create a report, and then send the report toadmins who can resolve the issues.
Adding users on page 625You can add local users or database users by using the Users page. You can also add remote usersor groups that belong to an authentication server. You can assign roles to these users and, based onthe privileges of the roles, users can manage the storage objects and data with Unified Manager, orview the data in a database.
Related referenceRelationship: All Relationships view on page 468
The Relationship: All Relationships view displays information about protection relationships onthe storage system.
Relationship: Last 1 month Transfer Status view on page 471The Relationship: Last 1 month Transfer Status view enables you to analyze the volume transfertrends over a period of time for volumes in asynchronous relationships. This page also displayswhether the volume transfer was a success or a failure.
Relationship: Last 1 month Transfer Rate view on page 472The Relationship: Last 1 month Transfer Rate view enables you to analyze the amount of datavolume that is transferred on a day-to-day basis for volumes in asynchronous relationships. Thispage also provides details about daily volume transfers and the time required to complete thetransfer operation.
Creating a SnapVault protection relationship from the Health: All Volumesview
You can use the Health: All Volumes view to create SnapVault relationships for one or morevolumes on the same Storage VM to enable data backups for protection purposes.
Before you begin
• You must have the Application Administrator or Storage Administrator role.
• You must have set up Workflow Automation.
About this task
The Protect menu does not display in the following instances:
• If RBAC settings do not allow this action: for example, if you have only operator privileges
• When the volume ID is unknown: for example, when you have an intercluster relationship andthe destination cluster has not yet been discovered
403Managing and monitoring protection relationships

Steps
1. In the left navigation pane, click Storage > Volumes.
2. In the Health: All Volumes view, select a volume you want to protect and click Protect.
Alternatively, to create multiple protection relationships on the same storage virtual machine(SVM), select one or more volumes in the Health: All Volumes view, and click Protect on thetoolbar.
3. Select SnapVault from the menu.The Configure Protection dialog box is launched.
4. Click SnapVault to view the SnapVault tab and to configure the secondary volumeinformation.
5. Click Advanced to set deduplication, compression, autogrow, and space guarantee as needed,and then click Apply.
6. Complete the Destination Information area and the Relationship Settings area in theSnapVault tab.
7. Click Apply.You are returned to the Health: All Volumes view.
8. Click the protection configuration job link at the top of the Health: All Volumes view.If you are creating only one protection relationship, the Job details page is displayed; however,if you are creating more than one protection relationship, a filtered list of all the jobs associatedwith the protection operation is displayed.
9. Do one of the following:
• If you have only one job, click Refresh to update the tasks list and task details associatedwith the protection configuration job and to determine when the job is complete.
• If you have more than one job:
a. Click a job in the jobs list.
b. Click Refresh to update the tasks list and task details associated with the protectionconfiguration job and to determine when the job is complete.
c. Use the Back button to return to the filtered list and view another job.
Related conceptsExecuting protection workflows using OnCommand Workflow Automation on page 474
You can integrate OnCommand Workflow Automation with Unified Manager to executeworkflows for monitoring and managing protection relationships.
Related referenceConfigure Protection dialog box on page 453
You can use the Configure Protection dialog box to create SnapMirror and SnapVault relationshipsfor all read, write, and data protection volumes on clusters to ensure that the data on a sourcevolume or primary volume is replicated.
Advanced Secondary Settings dialog box on page 448You can use the Advanced Secondary Settings dialog box to enable version-flexible replication,multiple copy backup, and space-related settings on a secondary volume. You might use the
404Managing and monitoring protection relationships

Advanced Secondary Settings dialog box when you want to change enable or disable the currentsettings.
Creating a SnapVault protection relationship from the Volume / Health detailspage
You can create a SnapVault relationship using the Volume / Health details page so that databackups are enabled for protection purposes on volumes.
Before you begin
• You must have the Application Administrator or Storage Administrator role.
• You must have set up Workflow Automation to perform this task.
About this task
The Protect menu does not display in the following instances:
• If RBAC settings do not allow this action: for example, if you have only operator privileges
• When the volume ID is unknown: for example, when you have an intercluster relationship andthe destination cluster has not yet been discovered
Steps
1. In the Protection tab of the Volume / Health details page, right-click a volume in the topologyview that you want to protect.
2. Select Protect > SnapVault from the menu.The Configure Protection dialog box is launched.
3. Click SnapVault to view the SnapVault tab and to configure the secondary resourceinformation.
4. Click Advanced to set deduplication, compression, autogrow, and space guarantee as needed,and then click Apply.
5. Complete the Destination Information area and the Relationship Settings area in theConfigure Protection dialog box.
6. Click Apply.You are returned to the Volume / Health details page.
7. Click the protection configuration job link at the top of the Volume / Health details page.The Job details page is displayed.
8. Click Refresh to update the tasks list and task details associated with the protectionconfiguration job and to determine when the job is complete.When the job tasks are complete, the new relationships are displayed in the Volume / Healthdetails page topology view.
Related conceptsExecuting protection workflows using OnCommand Workflow Automation on page 474
You can integrate OnCommand Workflow Automation with Unified Manager to executeworkflows for monitoring and managing protection relationships.
Related tasksConfiguring a connection between Workflow Automation and Unified Manager on page 474
You can configure a secure connection between OnCommand Workflow Automation (WFA) andUnified Manager. Connecting to Workflow Automation enables you to use protection featuressuch as SnapMirror and SnapVault configuration workflows, as well as commands for managingSnapMirror relationships.
Related referenceConfigure Protection dialog box on page 453
405Managing and monitoring protection relationships

You can use the Configure Protection dialog box to create SnapMirror and SnapVault relationshipsfor all read, write, and data protection volumes on clusters to ensure that the data on a sourcevolume or primary volume is replicated.
Advanced Secondary Settings dialog box on page 448You can use the Advanced Secondary Settings dialog box to enable version-flexible replication,multiple copy backup, and space-related settings on a secondary volume. You might use theAdvanced Secondary Settings dialog box when you want to change enable or disable the currentsettings.
Creating a SnapMirror protection relationship from the Health: All Volumesview
Using the Health: All Volumes view enables you to create several SnapMirror protectionrelationships at one time by selecting more than one volume on the same storage VM.
Before you begin
• You must have the Application Administrator or Storage Administrator role.
• You must have set up Workflow Automation.
About this task
The Protect menu does not display in the following instances:
• If RBAC settings do not allow this action: for example, if you have only operator privileges
• When the volume ID is unknown: for example, when you have an intercluster relationship andthe destination cluster has not yet been discovered
Steps
1. In the Health: All Volumes view, select a volume that you want to protect.
Alternatively, to create multiple protection relationships on the same SVM, select one or morevolumes in the Health: All Volumes view, and click Protect > SnapMirror on the toolbar.
The Configure Protection dialog box is displayed.
2. Click SnapMirror to view the SnapMirror tab and to configure the destination information.
3. Click Advanced to set the space guarantee, as needed, and then click Apply.
4. Complete the Destination Information area and the Relationship Settings area in theSnapMirror tab.
5. Click Apply.You are returned to the Health: All Volumes view.
6. Click the protection configuration job link at the top of the Health: All Volumes view.If you are creating only one protection relationship, the Job details page is displayed; however,if you are creating more than one protection relationship, a list of all the jobs associated withthe protection operation is displayed.
7. Do one of the following:
• If you have only one job, click Refresh to update the tasks list and task details associatedwith the protection configuration job and to determine when the job is complete.
• If you have more than one job:
a. Click a job in the jobs list.
b. Click Refresh to update the tasks list and task details associated with the protectionconfiguration job and to determine when the job is complete.
c. Use the Back button to return to the filtered list and view another job.
406Managing and monitoring protection relationships
Result
Depending on the destination SVM you specified during configuration or on the options youenabled in your Advanced settings, the resulting SnapMirror relationship might be one of severalpossible variations:
• If you specified a destination SVM that runs under the same or a newer version of ONTAPcompared to that of the source volume, a block-replication-based SnapMirror relationship isthe default result.
• If you specified a destination SVM that runs under the same or a newer version of ONTAPcompared to that of the source volume, but you enabled version-flexible replication in theAdvanced settings, a SnapMirror relationship with version-flexible replication is the result.
• If you specified a destination SVM that runs under an earlier version of ONTAP than that ofthe source volume, and the earlier version supports version-flexible replication, a SnapMirrorrelationship with version-flexible replication is the automatic result.
Related conceptsExecuting protection workflows using OnCommand Workflow Automation on page 474
You can integrate OnCommand Workflow Automation with Unified Manager to executeworkflows for monitoring and managing protection relationships.
Related referenceConfigure Protection dialog box on page 453
You can use the Configure Protection dialog box to create SnapMirror and SnapVault relationshipsfor all read, write, and data protection volumes on clusters to ensure that the data on a sourcevolume or primary volume is replicated.
Advanced Destination Settings dialog box on page 449You can use the Advanced Destination Settings dialog box to enable space guarantee settings on adestination volume. You might select advanced settings when space guarantee is disabled on thesource, but you want it enabled on the destination. The settings for deduplication, compression,and autogrow in a SnapMirror relationship are inherited from the source volume and cannot bechanged.
Creating a SnapMirror protection relationship from the Volume / Health detailspage
You can use the Volume / Health details page to create a SnapMirror relationship so that datareplication is enabled for protection purposes. SnapMirror replication enables you to restore datafrom the destination volume in the event of data loss on the source.
Before you begin
• You must have the Application Administrator or Storage Administrator role.
• You must have set up Workflow Automation.
About this task
The Protect menu does not display in the following instances:
• If RBAC settings do not allow this action: for example, if you have only operator privileges
• When the volume ID is unknown: for example, when you have an intercluster relationship andthe destination cluster has not yet been discovered
You can perform up to 10 protection jobs simultaneously with no performance impact. You mightexperience some performance impact when you run between 11 and 30 jobs simultaneously.Running more than 30 jobs simultaneously is not recommended.
407Managing and monitoring protection relationships

Steps
1. In the Protection tab of the Volume / Health details page, right-click in the topology view thename of a volume that you want to protect.
2. Select Protect > SnapMirror from the menu.The Configure Protection dialog box is displayed.
3. Click SnapMirror to view the SnapMirror tab and to configure the destination information.
4. Click Advanced to set the space guarantee, as needed, and then click Apply.
5. Complete the Destination Information area and the Relationship Settings area in theConfigure Protection dialog box.
6. Click Apply.You are returned to the Volume / Health details page.
7. Click the protection configuration job link at the top of the Volume / Health details page.The job's tasks and details are displayed in the Job details page.
8. In the Job details page, click Refresh to update the tasks list and task details associated withthe protection configuration job and to determine when the job is complete.
9. When the job tasks are complete, click Back on your browser to return to the Volume / Healthdetails page.The new relationship is displayed in the Volume / Health details page topology view.
Result
Depending on the destination SVM you specified during configuration or on the options youenabled in your Advanced settings, the resulting SnapMirror relationship might be one of severalpossible variations:
• If you specified a destination SVM that runs under the same or a newer version of ONTAPcompared to that of the source volume, a block-replication-based SnapMirror relationship isthe default result.
• If you specified a destination SVM that runs under the same or a newer version of ONTAPcompared to that of the source volume, but you enabled version-flexible replication in theAdvanced settings, a SnapMirror relationship with version-flexible replication is the result.
• If you specified a destination SVM that runs under an earlier version of ONTAP, or a versionthat is higher than that of the source volume and the earlier version supports version-flexiblereplication, a SnapMirror relationship with version-flexible replication is the automatic result.
Related conceptsExecuting protection workflows using OnCommand Workflow Automation on page 474
You can integrate OnCommand Workflow Automation with Unified Manager to executeworkflows for monitoring and managing protection relationships.
Related tasksConfiguring a connection between Workflow Automation and Unified Manager on page 474
You can configure a secure connection between OnCommand Workflow Automation (WFA) andUnified Manager. Connecting to Workflow Automation enables you to use protection featuressuch as SnapMirror and SnapVault configuration workflows, as well as commands for managingSnapMirror relationships.
Related referenceConfigure Protection dialog box on page 453
You can use the Configure Protection dialog box to create SnapMirror and SnapVault relationshipsfor all read, write, and data protection volumes on clusters to ensure that the data on a sourcevolume or primary volume is replicated.
Advanced Destination Settings dialog box on page 449
408Managing and monitoring protection relationships

You can use the Advanced Destination Settings dialog box to enable space guarantee settings on adestination volume. You might select advanced settings when space guarantee is disabled on thesource, but you want it enabled on the destination. The settings for deduplication, compression,and autogrow in a SnapMirror relationship are inherited from the source volume and cannot bechanged.
Creating a SnapMirror relationship with version-flexible replicationYou can create a SnapMirror relationship with version-flexible replication. Version-flexiblereplication enables you to implement SnapMirror protection even if source and destinationvolumes run under different versions of ONTAP.
Before you begin
• You must have the Application Administrator or Storage Administrator role.
• You must have set up Workflow Automation.
• The source and destination SVMs must each have a SnapMirror license enabled.
• The source and destination SVMs must each run under a version of ONTAP software thatsupports version-flexible replication.
About this task
SnapMirror with version-flexible replication enables you to implement SnapMirror protectioneven in heterogeneous storage environments in which not all storage is running under one versionof ONTAP; however, mirror operations performed under SnapMirror with version-flexiblereplication do not execute as quickly as they would under traditional block replication SnapMirror.
Steps
1. Display the Configure Protection dialog box for the volume that you want to protect.
• If you are viewing the Protection tab of the Volume / Health details page, right-click in thetopology view that has the name of a volume that you want to protect and select Protect >SnapMirror from the menu.
• If you are viewing the Health: All Volumes view, locate a volume that you want to protectand right-click it; then select Protect > SnapMirror from the menu.
The Configure Protection dialog box is displayed.
2. Click SnapMirror to view the SnapMirror tab.
3. Complete the Destination Information area and the Relationship Settings area in theConfigure Protection dialog box.
If you specify a destination SVM that runs under an earlier version of ONTAP than the sourcevolume you are protecting, and if that earlier version supports version-flexible replication, thistask automatically configures SnapMirror with version-flexible replication.
4. If you specify a destination SVM that runs under the same version of ONTAP as that of thesource volume, but you still want to configure SnapMirror with version-flexible replication,click Advanced to enable version-flexible replication and then click Apply.
5. Click Apply.You are returned to the Volume / Health details page.
6. Click the protection configuration job link at the top of the Volume / Health details page.The jobs tasks and details are displayed in the Job details page.
7. In the Job details page, click Refresh to update the tasks list and task details associated withthe protection configuration job and to determine when the job is complete.
8. When the job tasks are complete, click Back on your browser to return to the Volume / Healthdetails page.The new relationship is displayed in the Volume / Health details page topology view.
409Managing and monitoring protection relationships

Related tasksConfiguring a connection between Workflow Automation and Unified Manager on page 474
You can configure a secure connection between OnCommand Workflow Automation (WFA) andUnified Manager. Connecting to Workflow Automation enables you to use protection featuressuch as SnapMirror and SnapVault configuration workflows, as well as commands for managingSnapMirror relationships.
Creating SnapMirror relationships with version-flexible replication withbackup option
You can create a SnapMirror relationship with version-flexible replication and backup optioncapability. Backup option capability enables you to implement SnapMirror protection and alsoretain multiple versions of backup copies at the destination location.
Before you begin
• You must have the Application Administrator or Storage Administrator role.
• You must have set up Workflow Automation.
• The source and destination SVMs must each have a SnapMirror license enabled.
• The source and destination SVMs must each have a SnapVault license enabled.
• The source and destination SVMs must each run under a version of ONTAP software thatsupports version-flexible replication.
About this task
Configuring SnapMirror with backup option capability enables you to protect your data withSnapMirror disaster recovery capabilities, such as volume failover ability, and at the same timeprovide SnapVault capabilities, such as multiple backup copy protection.
Steps
1. Display the Configure Protection dialog box for the volume that you want to protect.
• If you are viewing the Protection tab of the Volume / Health details page, right-click inthe topology view the name of a volume that you want to protect and select Protect >SnapMirror from the menu.
• If you are viewing the Health: All Volumes view, locate a volume you want to protect andright-click it; then select Protect > SnapMirror from the menu.
The Configure Protection dialog box is displayed.
2. Click SnapMirror to view the SnapMirror tab.
3. Complete the Destination Information area and the Relationship Settings area in theConfigure Protection dialog box.
4. Click Advanced to display the Advanced Destination Settings dialog box.
5. If the Version-Flexible Replication check box is not already selected, select it now.
6. Select the With backup option check box to enable backup option capability; then clickApply.
7. Click Apply.You are returned to the Volume / Health details page.
8. Click the protection configuration job link at the top of the Volume / Health details page.The jobs tasks and details are displayed in the Job details page.
9. In the Job details page, click Refresh to update the task list and task details associated withthe protection configuration job and to determine when the job is complete.
10. When the job tasks are complete, click Back on your browser to return to the Volume /Health details page.
410Managing and monitoring protection relationships
The new relationship is displayed in the Volume / Health details page topology view.
Configuring destination efficiency settingsYou can configure destination efficiency settings such as deduplication, compression, autogrow,and space guarantee on a protection destination using the Advanced Destination Settings dialogbox. You use these settings when you want to maximize space utilization on a destination orsecondary volume.
Before you begin
You must have the Application Administrator or Storage Administrator role.
About this task
By default, efficiency settings match those of the source volume, except for compression settingsin a SnapVault relationship, which are disabled by default.
Steps
1. Click either the SnapMirror tab or the SnapVault tab in the Configure Protection dialogbox, depending on the type of relationship you are configuring.
2. Click Advanced in the Destination Information area.The Advanced Destination Settings dialog box is opened.
3. Enable or disable the efficiency settings for deduplication, compression, autogrow, and spaceguarantee, as required.
4. Click Apply to save your selections and return to the Configure Protection dialog box.
Creating SnapMirror and SnapVault schedulesYou can create basic or advanced SnapMirror and SnapVault schedules to enable automatic dataprotection transfers on a source or primary volume so that transfers take place more frequently orless frequently, depending on how often the data changes on your volumes.
Before you begin
• You must have the Application Administrator or Storage Administrator role.
• You must have already completed the Destination Information area in the Configure Protectiondialog box.
• You must have set up Workflow Automation to perform this task.
Steps
1. From the SnapMirror tab or SnapVault tab of the Configure Protection dialog box, click theCreate Schedule link in the Relationship Settings area.The Create Schedule dialog box is displayed.
2. In the Schedule Name field, type the name you want to give to the schedule.
3. Select one of the following:
• Basic
Select if you want to create a basic interval-style schedule.
• Advanced
Select if you want to create a cron-style schedule.
4. Click Create.The new schedule is displayed in the SnapMirror Schedule or SnapVault Schedule drop-downlist.
411Managing and monitoring protection relationships

Related tasksConfiguring a connection between Workflow Automation and Unified Manager on page 474
You can configure a secure connection between OnCommand Workflow Automation (WFA) andUnified Manager. Connecting to Workflow Automation enables you to use protection featuressuch as SnapMirror and SnapVault configuration workflows, as well as commands for managingSnapMirror relationships.
Related referenceCreate Schedule dialog box on page 457
The Create Schedule dialog box enables you to create a basic or advanced protection schedule forSnapMirror and SnapVault relationship transfers. You might create a new schedule to increase thefrequency of data transfers due to frequent data updates, or you might create a less frequentschedule when data changes infrequently.
Creating cascade or fanout relationships to extend protection from an existingprotection relationship
You can extend protection from an existing relationship by creating either a fanout from the sourcevolume or a cascade from the destination volume of an existing relationship. You might do thiswhen you need to copy data from one site to many sites or to provide additional protection bycreating more backups.
Before you begin
• You must have the Application Administrator or Storage Administrator role.
• You must have set up Workflow Automation.
Steps
1. Click Protection > Volume Relationships.
2. From the Volume Relationships page, select the SnapMirror relationship from which youwant to extend protection.
3. On the action bar, click Extend Protection.
4. In the menu, select either From Source or From Destination, depending on whether you arecreating a fanout relationship from the source or a cascade relationship from the destination.
5. Select either With SnapMirror or With SnapVault, depending on the type of protectionrelationship you are creating.The Configure Protection dialog box is displayed.
6. Complete the information as indicated in the Configure Protection dialog box.
Related referenceConfigure Protection dialog box on page 453
You can use the Configure Protection dialog box to create SnapMirror and SnapVault relationshipsfor all read, write, and data protection volumes on clusters to ensure that the data on a sourcevolume or primary volume is replicated.
Editing protection relationships from the Volume Relationships pageYou can edit existing protection relationships to change the maximum transfer rate, the protectionpolicy, or the protection schedule. You might edit a relationship to decrease the bandwidth used fortransfers, or to increase the frequency of scheduled transfers because data is changing often.
Before you begin
You must have the Application Administrator or Storage Administrator role.
412Managing and monitoring protection relationships

About this task
The selected volumes must be protection relationship destinations. You cannot edit relationshipswhen source volumes, load-sharing volumes, or volumes that are not the destination of aSnapMirror or SnapVault relationship are selected.
Steps
1. From the Volume Relationships page, select in the volumes list one or more volumes in thesame SVM for which you want to edit relationship settings, and then select Edit from thetoolbar.The Edit Relationship dialog box is displayed.
2. In the Edit Relationship dialog box, edit the maximum transfer rate, protection policy, orprotection schedule, as needed.
3. Click Apply.The changes are applied to the selected relationships.
Editing protection relationships from the Volume / Health details pageYou can edit existing protection relationships to change the current maximum transfer rate,protection policy, or protection schedule. You might edit a relationship to decrease the bandwidthused for transfers, or to increase the frequency of scheduled transfers because data is changingoften.
Before you begin
• You must have the Application Administrator or Storage Administrator role.
• You must have installed and configured Workflow Automation.
About this task
The selected volumes must be protection relationship destinations. You cannot edit relationshipswhen source volumes, load-sharing volumes, or volumes that are not the destination of aSnapMirror or SnapVault relationship are selected.
Steps
1. From the Protection tab of the Volume / Health details page, locate in the topology theprotection relationship you want to edit and right-click it.
2. Select Edit from the menu.
Alternatively, from the Actions menu, select Relationship > Edit to edit the relationship forwhich you are currently viewing the details.
The Edit Relationship dialog box is displayed.
3. In the Edit Relationship dialog box, edit the maximum transfer rate, protection policy, orprotection schedule, as needed.
4. Click Apply.The changes are applied to the selected relationships.
Creating a SnapMirror policy to maximize transfer efficiencyYou can create a SnapMirror policy to specify the SnapMirror transfer priority for protectionrelationships. SnapMirror policies enable you to maximize transfer efficiency from the source tothe destination by assigning priorities so that lower-priority transfers are scheduled to run afternormal-priority transfers.
Before you begin
• You must have the Application Administrator or Storage Administrator role.
413Managing and monitoring protection relationships

• You must have set up Workflow Automation.
• This task assumes that you have already completed the Destination Information area in theConfigure Protection dialog box.
Steps
1. From the SnapMirror tab of the Configure Protection dialog box, click the Create Policylink in the Relationship Settings area.The Create SnapMirror Policy dialog box is displayed.
2. In the Policy Name field, type a name you want to give the policy.
3. In the Transfer Priority field, select the transfer priority you want to assign to the policy.
4. In the Comment field, enter an optional comment for the policy.
5. Click Create.The new policy is displayed in the SnapMirror Policy drop-down list.
Related tasksConfiguring a connection between Workflow Automation and Unified Manager on page 474
You can configure a secure connection between OnCommand Workflow Automation (WFA) andUnified Manager. Connecting to Workflow Automation enables you to use protection featuressuch as SnapMirror and SnapVault configuration workflows, as well as commands for managingSnapMirror relationships.
Related referenceCreate SnapMirror Policy dialog box on page 458
The Create SnapMirror Policy dialog box enables you to create a policy to set the priority forSnapMirror transfers. You use policies to maximize the efficiency of transfers from the source tothe destination.
Creating a SnapVault policy to maximize transfer efficiencyYou can create a new SnapVault policy to set the priority for a SnapVault transfer. You use policiesto maximize the efficiency of transfers from the primary to the secondary in a protectionrelationship.
Before you begin
• You must have the Application Administrator or Storage Administrator role.
• You must have set up Workflow Automation.
• You must have already completed Destination Information area in the Configure Protectiondialog box.
Steps
1. From the SnapVault tab of the Configure Protection dialog box, click the Create Policy linkin the Relationship Settings area.The SnapVault tab is displayed.
2. In the Policy Name field, type the name that you want to give the policy.
3. In the Transfer Priority field, select the transfer priority that you want to assign to the policy.
4. Optional: In the Comment field, enter a comment for the policy.
5. In the Replication Label area, add or edit a replication label, as necessary.
6. Click Create.The new policy is displayed in the Create Policy drop-down list.
Related tasksConfiguring a connection between Workflow Automation and Unified Manager on page 474
414Managing and monitoring protection relationships

You can configure a secure connection between OnCommand Workflow Automation (WFA) andUnified Manager. Connecting to Workflow Automation enables you to use protection featuressuch as SnapMirror and SnapVault configuration workflows, as well as commands for managingSnapMirror relationships.
Related referenceCreate SnapVault Policy dialog box on page 459
The Create SnapVault Policy dialog box enables you to create a policy to set the priority forSnapVault transfers. You use policies to maximize the efficiency of transfers from the primary tothe secondary volume.
Aborting an active data protection transfer from the Volume Relationshipspage
You can abort an active data protection transfer when you want to stop a SnapMirror replicationthat is in progress. You can also clear the restart checkpoint for transfers subsequent to the baselinetransfer. You might abort a transfer when it conflicts with another operation, such as a volumemove.
Before you begin
• You must have the Application Administrator or Storage Administrator role.
• You must have set up Workflow Automation.
About this task
The abort action does not display in the following instances:
• If RBAC settings do not allow this action: for example, if you have only operator privileges
• When the volume ID is unknown: for example, when you have an intercluster relationship andthe destination cluster has not yet been discovered
You cannot clear the restart checkpoint for a baseline transfer.
Steps
1. To abort transfers for one or more protection relationships, from the Volume Relationshipspage, select one or more volumes and, on the toolbar, click Abort.The Abort Transfer dialog box is displayed.
2. If you want to clear the restart checkpoint for a transfer that is not a baseline transfer, selectClear Checkpoints.
3. Click Continue.The Abort Transfer dialog box is closed, and the status of the abort job displays at the top ofthe Volume Relationships page, along with a link to the job details.
4. Optional: Click the View details link to go to the Job details page for additional details and toview job progress.
Aborting an active data protection transfer from the Volume / Health detailspage
You can abort an active data protection transfer when you want to stop a SnapMirror replicationthat is in progress. You can also clear the restart checkpoint for a transfer if it is not a baselinetransfer. You might abort a transfer when it conflicts with another operation, such as a volumemove.
Before you begin
• You must have the Application Administrator or Storage Administrator role.
415Managing and monitoring protection relationships

• You must have set up Workflow Automation.
About this task
The abort action does not display in the following instances:
• If RBAC settings do not allow this action: for example, if you have only operator privileges
• When the volume ID is unknown: for example, when you have an intercluster relationship andthe destination cluster has not yet been discovered
You cannot clear the restart checkpoint for a baseline transfer.
Steps
1. In the Protection tab of the Volume / Health details page, right-click the relationship in thetopology view for the data transfer you want to abort and select Abort.The Abort Transfer dialog box is displayed.
2. If you want to clear the restart checkpoint for a transfer that is not a baseline transfer, selectClear Checkpoints.
3. Click Continue.The Abort Transfer dialog box is closed, and the status of the abort operation displays at thetop of the Volume / Health details page along with a link to the job details.
4. Optional: Click the View details link to go to the Job details page for additional details and toview job progress.
5. Click each job task to view its details.
6. Click the Back arrow on your browser to return to the Volume / Health details page.The abort operation is finished when all job tasks successfully complete.
Quiescing a protection relationship from the Volume Relationships pageFrom the Volume Relationships page, you can quiesce a protection relationship to temporarilyprevent data transfers from occurring. You might quiesce a relationship when you want to create aSnapshot copy of a SnapMirror destination volume that contains a database, and you want toensure that its contents are stable during the Snapshot copy operation.
Before you begin
• You must have the Application Administrator or Storage Administrator role.
• You must have set up Workflow Automation.
About this task
The quiesce action does not display in the following instances:
• If RBAC settings do not allow this action; for example, if you have only operator privileges
• When the volume ID is unknown; for example, when you have an intercluster relationship andthe destination cluster has not yet been discovered
• When you have not paired Workflow Automation and Unified Manager
Steps
1. To quiesce transfers for one or more protection relationships, from the Volume Relationshipspage, select one or more volumes and, on the toolbar, click Quiesce.The Quiesce dialog box is displayed.
2. Click Continue.The status of the quiesce job is displayed at the top of the Volume / Health details page, alongwith a link to the job details.
3. Click the View details link to go to the Job details page for additional details and job progress.
416Managing and monitoring protection relationships

4. Optional: Click the Back arrow on your browser to return to the Volume Relationships page.The quiesce job is finished when all job tasks are successfully completed.
Quiescing a protection relationship from the Volume / Health details pageYou can quiesce a protection relationship to temporarily prevent data transfers from occurring.You might quiesce a relationship when you want to create a Snapshot copy of a SnapMirrordestination volume that contains a database, and you want to ensure that its contents are stableduring the Snapshot copy.
Before you begin
• You must have the Application Administrator or Storage Administrator role.
• You must have set up Workflow Automation.
About this task
The quiesce action does not display in the following instances:
• If RBAC settings do not allow this action, for example, if you have only operator privileges
• When the volume ID is unknown, for example, when you have an intercluster relationship andthe destination cluster has not yet been discovered
• When you have not paired Workflow Automation and Unified Manager
Steps
1. In the Protection tab of the Volume / Health details page, right-click the relationship in thetopology view for the protection relationship that you want to quiesce.
2. Select Quiesce from the menu.
3. Click Yes to continue.The status of the quiesce job is displayed at the top of the Volume / Health details page, alongwith a link to the job details.
4. Click the View details link to go to the Job details page for additional details and job progress.
5. Optional: Click the Back arrow on your browser to return to the Volume / Health details page.The quiesce job is finished when all job tasks are successfully completed.
Breaking a SnapMirror relationship from the Volume Relationships pageYou can break a protection relationship to stop data transfers between a source volume and adestination volume in a SnapMirror relationship. You might break a relationship when you want tomigrate data, for disaster recovery, or for application testing. The destination volume is changed toa read/write volume. You cannot break a SnapVault relationship.
Before you begin
• You must have the Application Administrator or Storage Administrator role.
• You must have set up Workflow Automation.
Steps
1. From the Volume Relationships page, select one or more volumes with protectionrelationships for which you want to stop data transfers and, on the toolbar, click Break.The Break Relationship dialog box is displayed.
2. Click Continue to break the relationship.
3. In the Volume Relationships page, verify in the Relationship State column that therelationship is broken.
417Managing and monitoring protection relationships

The Relationship State column is hidden by default, so you might need to select it in the show/
hide column list .
Breaking a SnapMirror relationship from the Volume / Health details pageYou can break a protection relationship from the Volume / Health details page and stop datatransfers between a source and destination volume in a SnapMirror relationship. You might breaka relationship when you want to migrate data, for disaster recovery, or for application testing. Thedestination volume is changed to a read-write volume. You cannot break a SnapVault relationship.
Before you begin
• You must have the Application Administrator or Storage Administrator role.
• You must have set up Workflow Automation.
Steps
1. In the Protection tab of the Volume / Health details page, select from the topology theSnapMirror relationship you want to break.
2. Right-click the destination and select Break from the menu.The Break Relationship dialog box is displayed.
3. Click Continue to break the relationship.
4. In the topology, verify that the relationship is broken.
Related tasksConfiguring a connection between Workflow Automation and Unified Manager on page 474
You can configure a secure connection between OnCommand Workflow Automation (WFA) andUnified Manager. Connecting to Workflow Automation enables you to use protection featuressuch as SnapMirror and SnapVault configuration workflows, as well as commands for managingSnapMirror relationships.
Removing a protection relationship from the Volume Relationships pageFrom the Volume Relationships page, you can remove a protection relationship to permanentlydelete an existing relationship between the selected source and destination: for example, when youwant to create a relationship using a different destination. This operation removes all metadata andcannot be undone.
Before you begin
• You must have the Application Administrator or Storage Administrator role.
• You must have set up Workflow Automation.
Steps
1. From the Volume Relationships page, select one or more volumes with protectionrelationships you want to remove and, on the toolbar, click Remove.The Remove Relationship dialog box is displayed.
2. Click Continue to remove the relationship.The relationship is removed from the Volume Relationships page.
418Managing and monitoring protection relationships

Removing a protection relationship from the Volume / Health details pageYou can remove a protection relationship to permanently delete an existing relationship betweenthe selected source and destination: for example, when you want to create a relationship using adifferent destination. This operation removes all metadata and cannot be undone.
Before you begin
• You must have the Application Administrator or Storage Administrator role.
• You must have set up Workflow Automation.
Steps
1. In the Protection tab of the Volume / Health details page, select from the topology theSnapMirror relationship you want to remove.
2. Right-click the name of the destination and select Remove from the menu.The Remove Relationship dialog box is displayed.
3. Click Continue to remove the relationship.The relationship is removed from the Volume / Health details page.
Resuming scheduled transfers on a quiesced relationship from the VolumeRelationships page
After you have quiesced a relationship to stop scheduled transfers from occurring, you can useResume to re-enable scheduled transfers so that data on the source or primary volume is protected.Transfers resume from a checkpoint, if one exists, at the next scheduled transfer interval.
Before you begin
• You must have the Application Administrator or Storage Administrator role.
• You must have set up Workflow Automation.
About this task
You can select no more than 10 quiesced relationships on which to resume transfers.
Steps
1. From the Volume Relationships page, select one or more volumes with quiesced relationships,and, on the toolbar, click Resume.
2. In the Resume dialog box, click Continue.You are returned to the Volume Relationships page.
3. To view the related job tasks and to track their progress, click the job link that is displayed atthe top of the Volume Relationships page.
4. Do one of the following:
• If only one job is displayed, in the Job details page click Refresh to update the tasks listand task details associated with the protection configuration job and to determine when thejob is complete.
• If more than one job is displayed,
a. In the Jobs page, click the job for which you want to view the details.
b. In the Job details page, click Refresh to update the tasks list and task details associatedwith the protection configuration job and to determine when the job is complete.
After the jobs finish, data transfers are resumed at the next scheduled transfer interval.
419Managing and monitoring protection relationships
Resuming scheduled transfers on a quiesced relationship from the Volume /Health details page
After you have quiesced a relationship to stop scheduled transfers from occurring, you can useResume on the Volume / Health details page to reenable scheduled transfers so that data on thesource or primary volume is protected. Transfers resume from a checkpoint, if one exists, at thenext scheduled transfer interval.
Before you begin
• You must have the Application Administrator or Storage Administrator role.
• You must have set up Workflow Automation.
Steps
1. In the Protection tab of the Volume / Health details page, right-click in the topology view aquiesced relationship that you want to resume.
Alternatively, select Resume from the Actions > Relationship menu.
2. In the Resume dialog box, click Continue.You are returned to the Volume / Health details page.
3. To view the related job tasks and to track their progress, click the job link that is displayed atthe top of the Volume / Health details page.
4. In the Job details page, click Refresh to update the tasks list and task details associated withthe protection configuration job and to determine when the job is complete.After the jobs are complete, data transfers are resumed at the next scheduled transfer interval.
Initializing or updating protection relationships from the Volume Relationshipspage
From the Volume Relationships page, you can perform a first-time baseline transfer on a newprotection relationship, or update a relationship if it is already initialized and you want to performa manual, unscheduled incremental update to transfer immediately.
Before you begin
• You must have the Application Administrator or Storage Administrator role.
• You must have set up OnCommand Workflow Automation.
Steps
1. From the Volume Relationships page, right-click a volume and select one or more volumeswith relationships that you want to update or initialize, and then, on the toolbar, clickInitialize/Update.The Initialize/Update dialog box is displayed.
2. In the Transfer Options tab, select a transfer priority and the maximum transfer rate.
3. Click Source Snapshot Copies; then, in the Snapshot Copy column, click Default.The Select Source Snapshot Copy dialog box is displayed.
4. If you want to specify an existing Snapshot copy rather than transferring the default Snapshotcopy, click Existing Snapshot Copy and select a Snapshot copy from the list.
5. Click Submit.You are returned to the Initialize/Update dialog box.
6. If you selected more than one source to initialize or update, click Default for the next sourcefor which you want to specify an existing Snapshot copy.
7. Click Submit to begin the initialization or update job.
420Managing and monitoring protection relationships

The initialization or update job is started, you are returned to the Volume Relationships page,and a jobs link is displayed at the top of the page.
8. Optional: Click View Jobs on the Health: All Volumes view to track the status of eachinitialization or update job.A filtered list of jobs is displayed.
9. Optional: Click each job to see its details.
10. Optional: Click the Back arrow on your browser to return to the Volume Relationships page.The initialization or update operation is finished when all tasks successfully finish.
Initializing or updating protection relationships from the Volume / Healthdetails page
You can perform a first-time baseline transfer on a new protection relationship, or update arelationship if it is already initialized and you want to perform a manual, unscheduled incrementalupdate to transfer data immediately.
Before you begin
• You must have the Application Administrator or Storage Administrator role.
• You must have set up OnCommand Workflow Automation.
Steps
1. From the Protection tab of the Volume / Health details page, locate in the topology theprotection relationship that you want to initialize or update, and then right-click it.
2. Select Initialize/Update from the menu.
Alternatively, from the Actions menu, select Relationship > Initialize/Update to initializeor update the relationship for which you are currently viewing the details.
The Initialize/Update dialog box is displayed.
3. In the Transfer Options tab, select a transfer priority and the maximum transfer rate.
4. Click Source Snapshot Copies; then, in the Snapshot Copy column, click Default.The Select Source Snapshot Copy dialog box is displayed.
5. If you want to specify an existing Snapshot copy rather than transferring the default Snapshotcopy, click Existing Snapshot Copy and select a Snapshot copy from the list.
6. Click Submit.You are returned to the Initialize/Update dialog box.
7. If you selected more than one source to initialize or update, click Default for the next read/write source for which you want to specify an existing Snapshot copy.
You cannot select a different Snapshot copy for data protection volumes.
8. Click Submit to begin the initialization or update job.The initialization or update job is started, you are returned to the Volume / Health detailspage, and a jobs link is displayed at the top of the page.
9. Optional: Click View Jobs on the Volume / Health details page to track the status of eachinitialization or update job.A filtered list of jobs is displayed.
10. Optional: Click each job to see its details.
11. Optional: Click the Back arrow on your browser to return to the Volume / Health detailspage.The initialization or update operation is finished when all job tasks successfully complete.
421Managing and monitoring protection relationships

Resynchronizing protection relationships from the Volume Relationships pageFrom the Volume Relationships page, you can resynchronize a relationship either to recover froman event that disabled your source volume or when you want to change the current source to adifferent volume.
Before you begin
• You must have the Application Administrator or Storage Administrator role.
• You must have set up Workflow Automation.
Steps
1. From the Volume Relationships page, select one or more volumes with quiesced relationshipsand, from the toolbar, click Resynchronize.The Resynchronize dialog box is displayed.
2. In the Resynchronization Options tab, select a transfer priority and the maximum transferrate.
3. Click Source Snapshot Copies; then, in the Snapshot Copy column, click Default.The Select Source Snapshot Copy dialog box is displayed.
4. If you want to specify an existing Snapshot copy rather than transferring the default Snapshotcopy, click Existing Snapshot Copy and select a Snapshot copy from the list.
5. Click Submit.You are returned to the Resynchronize dialog box.
6. If you selected more than one source to resynchronize, click Default for the next source forwhich you want to specify an existing Snapshot copy.
7. Click Submit to begin the resynchronization job.The resynchronization job is started, you are returned to the Volume Relationships page, and ajobs link is displayed at the top of the page.
8. Optional: Click View Jobs on the Volume Relationships page to track the status of eachresynchronization job.A filtered list of jobs is displayed.
9. Optional: Click the Back arrow on your browser to return to the Volume Relationships page.The resynchronization operation is finished when all job tasks successfully finish.
Related conceptsExecuting protection workflows using OnCommand Workflow Automation on page 474
You can integrate OnCommand Workflow Automation with Unified Manager to executeworkflows for monitoring and managing protection relationships.
Resynchronizing protection relationships from the Volume / Health detailspage
You can resynchronize data on a SnapMirror or SnapVault relationship that was broken and thenthe destination was made read/write so that data on the source matches the data on the destination.You might also resynchronize when a required common Snapshot copy on the source volume isdeleted causing SnapMirror or SnapVault updates to fail.
Before you begin
• You must have the Application Administrator or Storage Administrator role.
• You must have set up OnCommand Workflow Automation.
422Managing and monitoring protection relationships

Steps
1. From the Protection tab of the Volume / Health details page, locate in the topology theprotection relationship that you want to resynchronize and right-click it.
2. Select Resynchronize from the menu.
Alternatively, from the Actions menu, select Relationship > Resynchronize toresynchronize the relationship for which you are currently viewing the details.
The Resynchronize dialog box is displayed.
3. In the Resynchronization Options tab, select a transfer priority and the maximum transferrate.
4. Click Source Snapshot Copies; then, in the Snapshot Copy column, click Default.The Select Source Snapshot Copy dialog box is displayed.
5. If you want to specify an existing Snapshot copy rather than transferring the default Snapshotcopy, click Existing Snapshot Copy and select a Snapshot copy from the list.
6. Click Submit.You are returned to the Resynchronize dialog box.
7. If you selected more than one source to resynchronize, click Default for the next source forwhich you want to specify an existing Snapshot copy.
8. Click Submit to begin the resynchronization job.The resynchronization job is started, you are returned to the Volume / Health details page anda jobs link is displayed at the top of the page.
9. Optional: Click View Jobs on the Volume / Health details page to track the status of eachresynchronization job.A filtered list of jobs is displayed.
10. Optional: Click the Back arrow on your browser to return to the Volume / Health detailspage.The resynchronization job is finished when all job tasks successfully complete.
Related tasksConfiguring a connection between Workflow Automation and Unified Manager on page 474
You can configure a secure connection between OnCommand Workflow Automation (WFA) andUnified Manager. Connecting to Workflow Automation enables you to use protection featuressuch as SnapMirror and SnapVault configuration workflows, as well as commands for managingSnapMirror relationships.
Reversing protection relationships from the Volume Relationships pageWhen a disaster disables the source volume in your protection relationship, you can use thedestination volume to serve data by converting it to a read/write volume while you repair orreplace the source. When the source is again available to receive data, you can use the reverseresynchronization operation to establish the relationship in the reverse direction, synchronizing thedata on the source with the data on the read/write destination.
Before you begin
• You must have the Application Administrator or Storage Administrator role.
• You must have set up Workflow Automation.
• The relationship must not be a SnapVault relationship.
• A protection relationship must already exist.
• The protection relationship must be broken.
• Both the source and destination must be online.
• The source must not be the destination of another data protection volume.
423Managing and monitoring protection relationships

About this task
• When you perform this task, data on the source that is newer than the data on the commonSnapshot copy is deleted.
• Policies and schedules created on reverse resynchronization relationships are the same as thoseon the original protection relationship.
If policies and schedules do not exist, they are created.
Steps
1. From the Volume Relationships page, select one or more volumes with relationships that youwant to reverse, and, on the toolbar, click Reverse Resync.The Reverse Resync dialog box is displayed.
2. Verify that the relationships displayed in the Reverse Resync dialog box are the ones forwhich you want to perform the reverse resynchronization operation, and then click Submit.The reverse resynchronization operation is started, you are returned to the VolumeRelationships page, and a jobs link is displayed at the top of the page.
3. Optional: Click View Jobs on the Volume Relationships page to track the status of eachreverse resynchronization job.A filtered list of jobs related to this operation is displayed.
4. Optional: Click the Back arrow on your browser to return to the Volume Relationships page.The reverse resynchronization operation is finished when all job tasks successfully complete.
Related conceptsExecuting protection workflows using OnCommand Workflow Automation on page 474
You can integrate OnCommand Workflow Automation with Unified Manager to executeworkflows for monitoring and managing protection relationships.
Related referenceReverse Resync dialog box on page 467
When you have a protection relationship that is broken because the source volume is disabled andthe destination is made a read/write volume, reverse resynchronization enables you to reverse thedirection of the relationship so that the destination becomes the new source and the sourcebecomes the new destination.
Reversing protection relationships from the Volume / Health details pageWhen a disaster disables the source volume in your protection relationship, you can use thedestination volume to serve data by converting it to read/write while you repair or replace thesource. When the source is again available to receive data, you can use the reverseresynchronization operation to establish the relationship in the reverse direction, synchronizing thedata on the source with the data on the read/write destination.
Before you begin
• You must have the Application Administrator or Storage Administrator role.
• You must have set up Workflow Automation.
• The relationship must not be a SnapVault relationship.
• A protection relationship must already exist.
• The protection relationship must be broken.
• Both the source and destination must be online.
• The source must not be the destination of another data protection volume.
About this task
• When you perform this task, data on the source that is newer than the data on the commonSnapshot copy is deleted.
424Managing and monitoring protection relationships

• Policies and schedules created on the reverse resynchronization relationship are the same asthose on the original protection relationship.
If policies and schedules do not exist, they are created.
Steps
1. From the Protection tab of the Volume / Health details page, locate in the topology theSnapMirror relationship on which you want to reverse the source and destination, and right-click it.
2. Select Reverse Resync from the menu.The Reverse Resync dialog box is displayed.
3. Verify that the relationship displayed in the Reverse Resync dialog box is the one for whichyou want to perform the reverse resynchronization operation, and then click Submit.The Reverse Resync dialog box is closed and a job link is displayed at the top of the Volume /Health details page.
4. Optional: Click View Jobs on the Volume / Health details page to track the status of eachreverse resynchronization job.A filtered list of jobs is displayed.
5. Optional: Click the Back arrow on your browser to return to the Volume / Health details page.The reverse resynchronization operation is finished when all job tasks are completedsuccessfully.
Related conceptsExecuting protection workflows using OnCommand Workflow Automation on page 474
You can integrate OnCommand Workflow Automation with Unified Manager to executeworkflows for monitoring and managing protection relationships.
Related tasksConfiguring a connection between Workflow Automation and Unified Manager on page 474
You can configure a secure connection between OnCommand Workflow Automation (WFA) andUnified Manager. Connecting to Workflow Automation enables you to use protection featuressuch as SnapMirror and SnapVault configuration workflows, as well as commands for managingSnapMirror relationships.
Related referenceReverse Resync dialog box on page 467
When you have a protection relationship that is broken because the source volume is disabled andthe destination is made a read/write volume, reverse resynchronization enables you to reverse thedirection of the relationship so that the destination becomes the new source and the sourcebecomes the new destination.
Restoring data using the Health: All Volumes viewYou can restore overwritten or deleted files, directories, or an entire volume from a Snapshot copyby using the restore feature on the Health: All Volumes view.
Before you begin
You must have the Application Administrator or Storage Administrator role.
About this task
You cannot restore NTFS file streams.
The restore option is not available when:
• The volume ID is unknown: for example, when you have an intercluster relationship and thedestination cluster has not yet been discovered.
425Managing and monitoring protection relationships

• The volume is configured for SnapMirror Synchronous replication.
Steps
1. In the Health: All Volumes view, select a volume from which you want to restore data.
2. From the toolbar, click Restore.The Restore dialog box is displayed.
3. Select the volume and Snapshot copy from which you want to restore data, if different from thedefault.
4. Select the items you want to restore.
You can restore the entire volume, or you can specify folders and files you want to restore.
5. Select the location to which you want the selected items restored; either Original Location orAlternate Location.
6. Click Restore.The restore process begins.
Related conceptsExecuting protection workflows using OnCommand Workflow Automation on page 474
You can integrate OnCommand Workflow Automation with Unified Manager to executeworkflows for monitoring and managing protection relationships.
Related referenceRestore dialog box on page 450
You can use the Restore dialog box to restore data to a volume from a specific Snapshot copy.
Restoring data using the Volume / Health details pageYou can restore overwritten or deleted files, directories, or an entire volume from a Snapshot copyby using the restore feature on the Volume / Health details page.
Before you begin
You must have the Application Administrator or Storage Administrator role.
About this task
You cannot restore NTFS file streams.
The restore option is not available when:
• The volume ID is unknown: for example, when you have an intercluster relationship and thedestination cluster has not yet been discovered.
• The volume is configured for SnapMirror Synchronous replication.
Steps
1. In the Protection tab of the Volume / Health details page, right-click in the topology view thename of the volume that you want to restore.
2. Select Restore from the menu.
Alternatively, select Restore from the Actions menu to protect the current volume for whichyou are viewing the details.
The Restore dialog box is displayed.
3. Select the volume and Snapshot copy from which you want to restore data, if different from thedefault.
4. Select the items you want to restore.
You can restore the entire volume, or you can specify folders and files you want to restore.
426Managing and monitoring protection relationships

5. Select the location to which you want the selected items restored: either Original Location orAlternate Existing Location.
6. If you select an alternate existing location, do one of the following:
• In the Restore Path text field, type the path of the location to which you want to restore thedata and then click Select Directory.
• Click Browse to launch the Browse Directories dialog box and complete the followingsteps:
a. Select the cluster, SVM, and volume to which you want to restore.
b. In the Name table, select a directory name.
c. Click Select Directory.
7. Click Restore.The restore process begins.
Note: If a restore operation fails between Cloud Volumes ONTAP HA clusters with anNDMP error, you may need to add an explicit AWS route in the destination cluster so thatthe destination can communicate with the source system's cluster management LIF. Youperform this configuration step using OnCommand Cloud Manager.
Related conceptsExecuting protection workflows using OnCommand Workflow Automation on page 474
You can integrate OnCommand Workflow Automation with Unified Manager to executeworkflows for monitoring and managing protection relationships.
Related referenceRestore dialog box on page 450
You can use the Restore dialog box to restore data to a volume from a specific Snapshot copy.
What resource pools areResource pools are groups of aggregates that are created by a storage administrator using UnifiedManager to provide provisioning to partner applications for backup management.
You might pool your resources based on attributes such as performance, cost, physical location, oravailability. By grouping related resources into a pool, you can treat the pool as a single unit formonitoring and provisioning. This simplifies the management of these resources and allows for amore flexible and efficient use of the storage.
During secondary storage provisioning, Unified Manager determines the most suitable aggregatein the resource pool for protection using the following criteria:
• The aggregate is a data aggregate (not a root aggregate) and it is ONLINE.
• The aggregate is on a destination cluster node whose ONTAP version is the same or greaterthan the source cluster major version.
• The aggregate has the largest available space of all the aggregates in the resource pool.
• After provisioning the destination volume, the aggregate space is within the nearly-full andnearly overcommitted threshold defined for the aggregate (global or local threshold, whicheveris applicable).
• The number of FlexVol volumes on the destination node must not exceed the platform limit.
Creating resource poolsYou can use the Create Resource Pool dialog box to group aggregates for provisioning purposes.
Before you begin
You must have the Application Administrator or Storage Administrator role.
427Managing and monitoring protection relationships

About this task
Resource pools can contain aggregates from different clusters, but the same aggregate cannotbelong to different resource pools.
Steps
1. In the left navigation pane, click Protection > Resource Pools.
2. In the Resource Pools page, click Create.
3. Follow the instructions in the Create Resource Pool dialog box to provide a name anddescription and to add aggregates as members to the resource pool you want to create.
Related tasksAdding users on page 625
You can add local users or database users by using the Users page. You can also add remote usersor groups that belong to an authentication server. You can assign roles to these users and, based onthe privileges of the roles, users can manage the storage objects and data with Unified Manager, orview the data in a database.
Related referenceCreate Resource Pool dialog box on page 439
You can use the Create Resource Pool dialog box to name and describe a new resource pool and toadd aggregates to and delete aggregates from that resource pool.
Editing resource poolsYou can edit an existing resource pool when you want to change the resource pool name and thedescription.
Before you begin
You must have the Application Administrator or Storage Administrator role.
About this task
The Edit button is enabled only when one resource pool is selected. If more than one resourcepool is selected, the Edit button is disabled.
Steps
1. In the left navigation pane, click Protection > Resource Pools.
2. Select one resource pool from the list.
3. Click Edit.The Edit Resource Pool window is displayed.
4. Edit the resource pool name and description as needed.
5. Click Save.The new name and description are displayed in the resource pool list.
Related tasksAdding users on page 625
You can add local users or database users by using the Users page. You can also add remote usersor groups that belong to an authentication server. You can assign roles to these users and, based on
428Managing and monitoring protection relationships
the privileges of the roles, users can manage the storage objects and data with Unified Manager, orview the data in a database.
Viewing resource pools inventoryYou can use the Resource Pools page to view the resource pool inventory and to monitor theremaining capacity for each resource pool.
Before you begin
You must have the Application Administrator or Storage Administrator role.
Step
In the left navigation pane, click Protection > Resource Pools.The resource pool inventory is displayed.
Related tasksAdding users on page 625
You can add local users or database users by using the Users page. You can also add remote usersor groups that belong to an authentication server. You can assign roles to these users and, based onthe privileges of the roles, users can manage the storage objects and data with Unified Manager, orview the data in a database.
Related referenceResource Pools page on page 436
The Resource Pools page displays existing resource pools and their members, and enables you tocreate, monitor, and manage resource pools for provisioning purposes.
Adding resource pool membersA resource pool consists of a number of member aggregates. You can add aggregates to existingresource pools to increase the amount of space available for secondary volume provisioning.
Before you begin
You must have the Application Administrator or Storage Administrator role.
About this task
You can add no more than 200 aggregates to a resource pool at one time. Aggregates shown in theAggregates dialog box do not belong to any other resource pool.
Steps
1. In the left navigation pane, click Protection > Resource Pools.
2. Select a resource pool from the Resource Pools list.The resource pool members are displayed in the area below the resource pool list.
3. In the resource pool member area, click Add.The Aggregates dialog box is displayed.
4. Select one or more aggregates.
5. Click Add.The dialog box is closed and the aggregates are displayed in the member list for the selectedresource pool.
Related tasksAdding users on page 625
You can add local users or database users by using the Users page. You can also add remote usersor groups that belong to an authentication server. You can assign roles to these users and, based on
429Managing and monitoring protection relationships

the privileges of the roles, users can manage the storage objects and data with Unified Manager, orview the data in a database.
Removing aggregates from resource poolsYou can remove aggregates from an existing resource pool: for example, when you want to use anaggregate for some other purpose.
Before you begin
You must have the Application Administrator or Storage Administrator role.
About this task
Resource pool members are displayed only when a resource pool is selected.
Steps
1. In the left navigation pane, click Protection > Resource Pools.
2. Select the resource pool from which you want to remove member aggregates.The list of member aggregates is displayed in the Members pane.
3. Select one or more aggregates.The Remove button is enabled.
4. Click Remove.A warning dialog box is displayed.
5. Click Yes to continue.The selected aggregates are removed from the Members pane.
Related tasksAdding users on page 625
You can add local users or database users by using the Users page. You can also add remote usersor groups that belong to an authentication server. You can assign roles to these users and, based onthe privileges of the roles, users can manage the storage objects and data with Unified Manager, orview the data in a database.
Deleting resource poolsYou can delete resource pools when they are no longer needed. For example, you might want toredistribute the member aggregates from one resource pool to several other resource pools, makingthe original resource pool obsolete.
Before you begin
You must have the Application Administrator or Storage Administrator role.
About this task
The Delete button is enabled only when at least one resource pool is selected.
Steps
1. In the left navigation pane, click Protection > Resource Pools.
2. Select the resource pool you want to delete.
3. Click Delete.The resource pool is removed from the resource pool list and its aggregates are removed fromthe members list.
Related tasksAdding users on page 625
430Managing and monitoring protection relationships
You can add local users or database users by using the Users page. You can also add remote usersor groups that belong to an authentication server. You can assign roles to these users and, based onthe privileges of the roles, users can manage the storage objects and data with Unified Manager, orview the data in a database.
Related referenceResource Pools page on page 436
The Resource Pools page displays existing resource pools and their members, and enables you tocreate, monitor, and manage resource pools for provisioning purposes.
Understanding SVM associationsStorage virtual machine (SVM) associations are mappings from a source SVM to a destinationSVM that are used by partner applications for resource selection and secondary volumeprovisioning.
Associations are always created between a source SVM and a destination SVM, regardless ofwhether the destination SVM is a secondary destination or a tertiary destination. You cannot use asecondary destination SVM as a source to create an association with a tertiary destination SVM.
You can associate SVMs in three ways:
• Associate any SVM
You can create an association between any primary source SVM and one or more destinationSVMs. This means that all existing SVMs that currently require protection, as well as anySVMs that are created in the future, are associated with the specified destination SVMs. Forexample, you might want applications from several different sources at different locations to bebacked up to one or more destination SVMs in one location.
• Associate a particular SVM
You can create an association between a specific source SVM and one or more specificdestination SVMs. For example, if you are providing storage services to many clients whosedata must be separate from one another, you can choose this option to associate a specificsource SVM to a specific destination SVM that is assigned to only that client.
• Associate with an external SVM
You can create an association between a source SVM and an external flexible volume of adestination SVM.
SVM and resource pool requirements to support storage servicesYou can better ensure conformance in partner applications if you observe some SVM associationand resource pool requirements that are specific to storage services: for example, when youassociate SVM and create resource pools in Unified Manager to support a protection topology in astorage service provided by a partner application.
Some applications partner with the Unified Manager server to provide services that automaticallyconfigure and execute SnapMirror or SnapVault backup protection between source volumes andprotection volumes in secondary or tertiary locations. To support these protection storage services,you must use Unified Manager to configure the necessary SVM associations and resource pools.
To support storage service single-hop or cascaded protection, including replication from aSnapMirror source or SnapVault primary volume to either destination SnapMirror or to SnapVaultbackup volumes that reside in secondary or tertiary locations, observe the following requirements:
• SVM associations must be configured between the SVM containing the SnapMirror source orSnapVault primary volume and any SVM on which either a secondary volume or a tertiaryvolume resides.
431Managing and monitoring protection relationships

◦ For example, to support a protection topology in which source volume Vol_A resides onSVM_1, and SnapMirror secondary destination volume Vol_B resides on SVM_2, andtertiary SnapVault backup volume Vol_ C resides on SVM_3, you must use the UnifiedManager web UI to configure a SnapMirror association between SVM_1 and SVM_2 and aSnapVault backup association between SVM_1 and SVM_3.
In this example, any SnapMirror association or SnapVault backup association betweenSVM_2 and SVM_3 is not necessary and is not used.
◦ To support a protection topology in which both source volume Vol_A and SnapMirrordestination volume Vol_B reside on SVM_1, you must configure a SnapMirror associationbetween SVM_1 and SVM_1.
• The resource pools must include cluster aggregate resources available to the associated SVMs.
You configure resource pools through the Unified Manager web UI and then assign through thepartner application the storage service secondary target and tertiary target nodes.
Related tasksCreating resource pools on page 427
You can use the Create Resource Pool dialog box to group aggregates for provisioning purposes.
Creating SVM associations on page 432The Create Storage Virtual Machine Associations wizard enables partner protection applications toassociate a source storage virtual machine (SVM) with a destination SVM for use withSnapMirror and SnapVault relationships. Partner applications use these associations at the time ofinitial provisioning of destination volumes to determine which resources to select.
Creating SVM associationsThe Create Storage Virtual Machine Associations wizard enables partner protection applications toassociate a source storage virtual machine (SVM) with a destination SVM for use withSnapMirror and SnapVault relationships. Partner applications use these associations at the time ofinitial provisioning of destination volumes to determine which resources to select.
Before you begin
• The SVM you are associating must already exist.
• You must have the Application Administrator or Storage Administrator role.
About this task
For any source SVM and relationship type, you can choose only one destination SVM on eachdestination cluster.
Changing associations using the delete and create functions affects only future provisioningoperations. It does not move existing destination volumes.
Steps
1. In the left navigation pane, click Protection > SVM Associations.
2. In the Storage VM Associations page, click Create.The Create Storage Virtual Machine Associations wizard is launched.
3. Select one of the following sources:
• Any
Choose this option when you want to create an association between any primary SVMsource to one or more destination SVM. This means that all existing SVMs that currentlyrequire protection, as well as any SVMs that are created in the future, are associated withthe specified destination SVM. For example, you might want applications from severaldifferent sources at different locations backed up to one or more destination SVM in onelocation.
432Managing and monitoring protection relationships
• Single
Choose this option when you want to select a specific source SVM associated with one ormore destination SVMs. For example, if you are providing storage services to many clientswhose data must be separate from one another, choose this option to associate a specificSVM source to a specific SVM destination that is assigned only to that client.
• None (External)
Choose this option when you want to create an association between a source SVM and anexternal flexible volume of a destination SVM.
4. Select one or both of the protection relationship types you want to create:
• SnapMirror
• SnapVault
5. Click Next.
6. Select one or more SVM protection destination.
7. Click Finish.
Related tasksAdding users on page 625
You can add local users or database users by using the Users page. You can also add remote usersor groups that belong to an authentication server. You can assign roles to these users and, based onthe privileges of the roles, users can manage the storage objects and data with Unified Manager, orview the data in a database.
Viewing SVM associationsYou can use the Storage VM Associations page to view existing SVM associations and theirproperties and to determine if additional SVM associations are required.
Before you begin
You must have the Application Administrator or Storage Administrator role.
Step
In the left navigation pane, click Protection > SVM Associations.The list of SVM associations and their properties is displayed.
Related tasksAdding users on page 625
You can add local users or database users by using the Users page. You can also add remote usersor groups that belong to an authentication server. You can assign roles to these users and, based onthe privileges of the roles, users can manage the storage objects and data with Unified Manager, orview the data in a database.
Deleting SVM associationsYou can delete SVM associations for partner applications to remove the secondary provisioningrelationship between source and destination SVMs; for example, you might do this when thedestination SVM is full and you want to create a new SVM protection association.
Before you begin
You must have the Application Administrator or Storage Administrator role.
433Managing and monitoring protection relationships

About this task
The Delete button is disabled until at least one SVM association is selected. Changing associationsusing the delete and create functions affects only future provisioning operations; it does not moveexisting destination volumes.
Steps
1. In the left navigation pane, click Protection > SVM Associations.
2. Select at least one SVM association.The Delete button is enabled.
3. Click Delete.A warning dialog box is displayed.
4. Click Yes to continue.The selected SVM association is removed from the list.
Related tasksAdding users on page 625
You can add local users or database users by using the Users page. You can also add remote usersor groups that belong to an authentication server. You can assign roles to these users and, based onthe privileges of the roles, users can manage the storage objects and data with Unified Manager, orview the data in a database.
What jobs areA job is a series of tasks that you can monitor using Unified Manager. Viewing jobs and theirassociated tasks enables you to determine if they have completed successfully.
Jobs are initiated when you create SnapMirror and SnapVault relationships, when you perform anyrelationship operation (break, edit, quiesce, remove, resume, resynchronize, and reverse resync),when you perform data restoration tasks, when you log in to a cluster, and so on.
When you initiate a job, you can use the Jobs page and the Job details page to monitor the job andthe progress of the associated job tasks.
Monitoring jobsYou can use the Jobs page to monitor job status and to view job properties such as storage servicetype, state, submitted time, and completed time to determine whether or not a job has successfullycompleted.
Before you begin
You must have the Application Administrator or Storage Administrator role.
Steps
1. In the left navigation pane, click Protection > Jobs.The Jobs page is displayed.
2. View the State column to determine the status of those jobs currently running.
3. Click on a job name to view details about that particular job.The Job details page is displayed.
Related tasksAdding users on page 625
You can add local users or database users by using the Users page. You can also add remote usersor groups that belong to an authentication server. You can assign roles to these users and, based on
434Managing and monitoring protection relationships

the privileges of the roles, users can manage the storage objects and data with Unified Manager, orview the data in a database.
Viewing job detailsAfter you start a job, you can track its progress from the Job details page and monitor theassociated tasks for possible errors.
Before you begin
You must have the Application Administrator or Storage Administrator role.
Steps
1. In the left navigation pane, click Protection > Jobs.
2. In the Jobs page, click a job name in the Name column to display the list of tasks associatedwith the job.
3. Click on a task to display additional information in the Task Details pane and the TaskMessages pane to the right of the task list.
Related tasksAdding users on page 625
You can add local users or database users by using the Users page. You can also add remote usersor groups that belong to an authentication server. You can assign roles to these users and, based onthe privileges of the roles, users can manage the storage objects and data with Unified Manager, orview the data in a database.
Aborting jobsYou can use the Jobs page to abort a job if it is taking too long to finish, is encountering too manyerrors, or is no longer needed. You can abort a job only if its status and type allow it. You can abortany running job.
Before you begin
You must have the Application Administrator or Storage Administrator role.
Steps
1. In the left navigation pane, click Protection > Jobs.
2. From the list of jobs, select one job, and then click Abort.
3. At the confirmation prompt, click Yes to abort the selected job.
Related tasksAdding users on page 625
You can add local users or database users by using the Users page. You can also add remote usersor groups that belong to an authentication server. You can assign roles to these users and, based onthe privileges of the roles, users can manage the storage objects and data with Unified Manager, orview the data in a database.
Retrying a failed protection jobAfter you have taken measures to fix a failed protection job, you can use Retry to run the jobagain. Retrying a job creates a new job using the original job ID.
Before you begin
You must have the Application Administrator or Storage Administrator role.
435Managing and monitoring protection relationships

About this task
You can retry only one failed job at a time. Selecting more than one job disables the Retry button.Only jobs of the type Protection Configuration and Protection Relationship Operation can beretried.
Steps
1. In the left navigation pane, click Protection > Jobs.
2. From the list of jobs, select a single failed Protection Configuration or Protection RelationshipOperation type job.The Retry button is enabled.
3. Click Retry.The job is restarted.
Related referenceJob details page on page 446
The Job details page enables you to view status and other information about specific protection jobtasks that are running, that are queued, or that have completed. You can use this information tomonitor protection job progress and to troubleshoot job failures.
Description of Protection relationships windows and dialog boxesYou can view and manage protection-related details such as resource pools, SVM associations,and protection jobs. You can use the appropriate Health Thresholds page to configure global healththreshold values for aggregates, volumes, and relationships.
Resource Pools pageThe Resource Pools page displays existing resource pools and their members, and enables you tocreate, monitor, and manage resource pools for provisioning purposes.
• Command buttons• Resource Pools list• Members list command buttons• Members list
Command buttons
The command buttons enable you to perform the following tasks:
Create
Launches the Create Resource Pool dialog box, which you can use to create resource pools.
Edit
Enables you to edit the name and description of the resource pools that you create.
Delete
Enables you to delete one or more resource pools.
Resource Pools list
The Resource Pools list displays (in tabular format) the properties of existing resource pools.
Resource Pool
Displays the name of the resource pool.
Description
Describes the resource pool.
436Managing and monitoring protection relationships

SnapLock Type
Displays the SnapLock type that is being used by the aggregates in the resource pool. Validvalues for SnapLock type are Compliance, Enterprise, and Non-SnapLock. A resource poolcan contain aggregates of only one SnapLock type.
Total Capacity
Displays the total capacity (in MB, GB, and so on) of the resource pool.
Used Capacity
Displays the amount of space (in MB, GB, and so on) that is used in the resource pool.
Available Capacity
Displays the amount of space (in MB, GB, and so on) that is available in the resource pool.
Used %
Displays the percentage of space that is used in the resource pool.
Members list command buttons
The Members list command buttons enable you to perform the following tasks:
Add
Enables you to add members to the resource pool.
Delete
Enables you to delete one or more members from the resource pool.
Members list
The Members list displays (in tabular format) the resource pool members and their propertieswhen a resource pool is selected.
Status
Displays the current status of the member aggregate. The status can be Critical ( ),
Error ( ), Warning ( ), or Normal ( ).
Aggregate Name
Displays the name of the member aggregate.
State
Displays the current state of the aggregate, which can be one of the following:
• OfflineRead or write access is not allowed.
• OnlineRead and write access to the volumes that are hosted on this aggregate is allowed.
• RestrictedLimited operations (such as parity reconstruction) are allowed, but data access is notallowed.
• CreatingThe aggregate is being created.
• DestroyingThe aggregate is being destroyed.
• FailedThe aggregate cannot be brought online.
• FrozenThe aggregate is (temporarily) not serving requests.
437Managing and monitoring protection relationships

• Inconsistent
The aggregate has been marked corrupted; you should contact technical support.
• Iron Restricted
Diagnostic tools cannot be run on the aggregate.
• Mounting
The aggregate is in the process of mounting.
• Partial
At least one disk was found for the aggregate, but two or more disks are missing.
• Quiescing
The aggregate is being quiesced.
• Quiesced
The aggregate is quiesced.
• Reverted
The revert of an aggregate is completed.
• Unmounted
The aggregate has been unmounted.
• Unmounting
The aggregate is being taken offline.
• Unknown
The aggregate is discovered, but the aggregate information is not yet retrieved by theUnified Manager server.
By default, this column is hidden.
Cluster
Displays the name of the cluster to which the aggregate belongs.
Node
Displays the name of the node on which the aggregate resides.
Total Capacity
Displays the total capacity (in MB, GB, and so on) of the aggregate.
Used Capacity
Displays the amount of space (in MB, GB, and so on) that is used in the aggregate.
Available Capacity
Displays the amount of space (in MB, GB, and so on) that is available in the aggregate.
Used %
Displays the percentage of space that is used in the aggregate.
Disk Type
Displays the RAID configuration type, which can be one of the following:
• RAID0: All the RAID groups are of type RAID0.
• RAID4: All the RAID groups are of type RAID4.
• RAID-DP: All the RAID groups are of type RAID-DP.
• RAID-TEC: All the RAID groups are of type RAID-TEC.
• Mixed RAID: The aggregate contains RAID groups of different RAID types (RAID0,RAID4, RAID-DP, and RAID-TEC).
By default, this column is hidden.
Related tasksViewing resource pools inventory on page 429
438Managing and monitoring protection relationships

You can use the Resource Pools page to view the resource pool inventory and to monitor theremaining capacity for each resource pool.
Deleting resource pools on page 430You can delete resource pools when they are no longer needed. For example, you might want toredistribute the member aggregates from one resource pool to several other resource pools, makingthe original resource pool obsolete.
Creating resource pools on page 427You can use the Create Resource Pool dialog box to group aggregates for provisioning purposes.
Editing resource pools on page 428You can edit an existing resource pool when you want to change the resource pool name and thedescription.
Adding resource pool members on page 429A resource pool consists of a number of member aggregates. You can add aggregates to existingresource pools to increase the amount of space available for secondary volume provisioning.
Removing aggregates from resource pools on page 430You can remove aggregates from an existing resource pool: for example, when you want to use anaggregate for some other purpose.
Create Resource Pool dialog boxYou can use the Create Resource Pool dialog box to name and describe a new resource pool and toadd aggregates to and delete aggregates from that resource pool.
Resource Pool Name
The text boxes enable you to add the following information to create a resource pool:
Enables you to specify a resource pool name.
Description
Enables you to describe a resource pool.
Members
Displays the members of the resource pool. You can also add and delete members.
Command buttons
The command buttons enable you to perform the following tasks:
Add
Opens the Aggregates dialog box so that you can add aggregates from a specific cluster tothe resource pool. You can add aggregates from different clusters, but the same aggregatescannot be added to more than one resource pool.
Remove
Enables you to remove selected aggregates from the resource pool.
Create
Creates the resource pool. This button is not enabled until information has been entered inthe Resource Pool Name or Description fields.
Cancel
Discards the changes and closes the Create Resource Pool dialog box.
Related conceptsSVM and resource pool requirements to support storage services on page 431
439Managing and monitoring protection relationships

You can better ensure conformance in partner applications if you observe some SVM associationand resource pool requirements that are specific to storage services: for example, when youassociate SVM and create resource pools in Unified Manager to support a protection topology in astorage service provided by a partner application.
Related tasksCreating resource pools on page 427
You can use the Create Resource Pool dialog box to group aggregates for provisioning purposes.
Adding resource pool members on page 429A resource pool consists of a number of member aggregates. You can add aggregates to existingresource pools to increase the amount of space available for secondary volume provisioning.
Edit Resource Pool dialog boxYou can use the Edit Resource Pool dialog box to change the name and description of an existingresource pool. For example, if the original name and description is inaccurate or incorrect, you canchange them so they are more precise.
Text boxes
The text boxes enable you to change the following information for the selected resource pool:
Resource Pool Name
Enables you to enter a new name.
Description
Enables you to enter a new description.
Command buttons
The command buttons enable you to perform the following tasks:
Save
Saves the changes to the resource pool name and description.
Cancel
Discards the changes and closes the Edit Resource Pool dialog box.
Related tasksEditing resource pools on page 428
You can edit an existing resource pool when you want to change the resource pool name and thedescription.
Aggregates dialog boxYou can use the Aggregates dialog box to select the aggregates that you want to add to yourresource pool.
• Command buttons• Aggregates list
Command buttons
The command buttons enable you to perform the following tasks:
Add
Adds the selected aggregates to the resource pool. The Add button is not enabled until atleast one aggregate is selected.
Cancel
Discards the changes, and closes the Aggregates dialog box.
440Managing and monitoring protection relationships

Aggregates list
The Aggregates list displays (in tabular format) the names and properties of monitored aggregates.
Status
Displays the current status of a volume. The status can be Critical ( ), Error ( ),
Warning ( ), or Normal ( ).
You can move the pointer over the status to view more information about the event or eventsgenerated for the volume.
Aggregate Name
Displays the name of the aggregate.
State
Displays the current state of the aggregate, which can be one of the following:
• Offline
Read or write access is not allowed.
• Restricted
Limited operations (such as parity reconstruction) are allowed, but data access is notallowed.
• Online
Read and write access to the volumes that are hosted on this aggregate is allowed.
• Creating
The aggregate is being created.
• Destroying
The aggregate is being destroyed.
• Failed
The aggregate cannot be brought online.
• Frozen
The aggregate is (temporarily) not serving requests.
• Inconsistent
The aggregate has been marked corrupted; you should contact technical support.
• Iron Restricted
Diagnostic tools cannot be run on the aggregate.
• Mounting
The aggregate is in the process of mounting.
• Partial
At least one disk was found for the aggregate, but two or more disks are missing.
• Quiescing
The aggregate is being quiesced.
• Quiesced
The aggregate is quiesced.
• Reverted
The revert of an aggregate is completed.
• Unmounted
The aggregate is offline.
• Unmounting
The aggregate is being taken offline.
• Unknown
441Managing and monitoring protection relationships

The aggregate is discovered, but the aggregate information is not yet retrieved by theUnified Manager server.
Cluster
Displays the name of the cluster on which the aggregate resides.
Node
Displays the name of the storage controller that contains the aggregate.
Total Capacity
Displays the total data size (in MB, GB, and so on) of the aggregate. By default, thiscolumn is hidden.
Committed Capacity
Displays the total space (in MB, GB, and so on) that is committed for all the volumes in theaggregate. By default, this column is hidden.
Used Capacity
Displays the amount of space (in MB, GB, and so on) that is used in the aggregate.
Available Capacity
Displays the amount of space (in MB, GB, and so on) that is available for data in theaggregate. By default, this column is hidden.
Available %
Displays the percentage of space that is available for data in the aggregate. By default, thiscolumn is hidden.
Used %
Displays the percentage of space that is used by data in the aggregate.
RAID Type
Displays the RAID type of the selected volume. The RAID type can be RAID0, RAID4,RAID-DP, RAID-TEC, or Mixed RAID.
Related tasksAdding resource pool members on page 429
A resource pool consists of a number of member aggregates. You can add aggregates to existingresource pools to increase the amount of space available for secondary volume provisioning.
Storage VM Associations pageThe Storage VM Associations page enables you to view existing SVM associations betweensource and destination SVMs and to create new SVM associations for use by partner applicationsto create SnapMirror and SnapVault relationships.
Command buttons
The command buttons enable you to perform the following tasks:
Create
Opens the Create Storage Virtual Machine Associations wizard.
Delete
Enables you to delete the selected SVM associations.
SVM Associations list
The Storage Virtual Machine Associations list displays in a table the source and destination SVMassociations that have been created and the type of protection relationship allowed for eachassociation.
442Managing and monitoring protection relationships

Source Storage Virtual Machine
Displays the name of the source SVM.
Source Cluster
Displays the name of the source cluster.
Destination Storage Virtual Machine
Displays the name of the destination SVM.
Destination Cluster
Displays the name of the destination cluster.
Type
Displays the type of protection relationship. Relationship types are either SnapMirror orSnapVault.
Related tasksViewing SVM associations on page 433
You can use the Storage VM Associations page to view existing SVM associations and theirproperties and to determine if additional SVM associations are required.
Creating SVM associations on page 432The Create Storage Virtual Machine Associations wizard enables partner protection applications toassociate a source storage virtual machine (SVM) with a destination SVM for use withSnapMirror and SnapVault relationships. Partner applications use these associations at the time ofinitial provisioning of destination volumes to determine which resources to select.
Deleting SVM associations on page 433You can delete SVM associations for partner applications to remove the secondary provisioningrelationship between source and destination SVMs; for example, you might do this when thedestination SVM is full and you want to create a new SVM protection association.
Create Storage Virtual Machine Associations wizardThe Create Storage Virtual Machine Associations wizard enables you to associate source anddestination storage virtual machines (SVMs) for use in SnapMirror and SnapVault protectionrelationships.
Select Source SVM
The Select Source Storage Virtual Machine panel enables you to select the source, or primary,SVM in the SVM association.
Any
Enables you to create an association between any SVM source to one or more destination,or secondary, SVM. This means that all existing SVMs that currently require protection, aswell as any SVMs that are created in the future, are associated with the specified destinationSVM. For example, you might want applications from several different sources at differentlocations backed up to one or more destination SVM in one location.
Single
Enables you to associate a specific source SVM with one or more destination SVMs. Forexample, if you are providing storage services to many clients whose data must be separatefrom one another, choose this option to associate a specific SVM source to a specific SVMdestination that is assigned only to that client.
None (External)
Enables you to create an association between a source SVM and an external flexible volumeof a destination SVM.
443Managing and monitoring protection relationships

• Storage Virtual Machine
Lists the names of the available source SVMs
• Cluster
Lists the clusters on which each SVM resides
Allow these kinds of relationships
Enables you to select the relationship type for the association:
• SnapMirror
Specifies a SnapMirror relationship as the association type. Selecting this option enablesdata replication from the selected sources to the selected destinations.
• SnapVault
Specifies a SnapVault relationship as the association type. Selecting this option enablesbackups from the selected primary locations to the selected secondary locations.
Select Protection Destinations
The Select Protection Destinations panel of the Create Storage Virtual Machine Associationswizard enables you to select where to copy or replicate the data. You can create an association ononly one destination SVM per cluster.
Command buttons
The command buttons enable you to perform the following tasks:
Next
Advances you to the next page in the wizard.
Back
Returns you to the previous page in the wizard.
Finish
Applies your selections and creates the association.
Cancel
Discards the selections and closes the Create Storage Virtual Machine Associations wizard.
Jobs pageThe Jobs page enables you to view the current status and other information about all partnerapplication protection jobs that are currently running, as well as jobs that have completed. You canuse this information to see which jobs are still running and whether a job has succeeded or failed.
• Command buttons• Jobs list
Command buttons
The command buttons enable you to perform the following tasks:
Abort
Aborts the selected job. This option is available only if the selected job is running.
Retry
Restarts a failed job of type Protection Configuration or Protection Relationship Operation.You can retry only one failed job at a time. If more than one failed job is selected, the Retrybutton is disabled. You cannot retry failed storage service jobs.
Refresh
Refreshes the list of jobs and the information associated with them.
444Managing and monitoring protection relationships

Jobs list
The Jobs list displays, in tabular format, a list of the jobs that are in progress. By default, the listdisplays only the jobs generated within the past week. You can use column sorting and filtering tocustomize which jobs are displayed.
Status
Displays the current status of a job. The status can be Error ( ) or Normal ( ).
Job Id
Displays the identification number of the job. By default, this column is hidden.
The job identification number is unique and is assigned by the server when it starts the job.You can search for a particular job by entering the job identification number in the text boxprovided by the column filter.
Name
Displays the name of the job.
Type
Displays the job type. The job types are as follows:
Cluster Acquisition
A Workflow Automation job is rediscovering a cluster.
Protection Configuration
A protection job is initiating Workflow Automation workflows, such as cronschedules, SnapMirror policy creation, and so on.
Protection Relationship Operation
A protection job is running SnapMirror operations.
Protection Workflow Chain
A Workflow Automation job is executing multiple workflows.
Restore
A restore job is running.
Cleanup
The job is cleaning up storage service member artifacts that are no longer needed forrestore purposes.
Conform
The job is checking the configuration of storage service members to ensure that theyconform.
Destroy
The job is destroying a storage service.
Import
The job is importing unmanaged storage objects into an existing storage service.
Modify
The job is modifying attributes of an existing storage service.
Subscribe
The job is subscribing members to a storage service.
Unsubscribe
The job is unsubscribing members from a storage service.
445Managing and monitoring protection relationships

Update
A protection update job is running.
WFA Configuration
A Workflow Automation job is pushing cluster credentials and synchronizingdatabase caches.
State
Displays the running state of the job. State options are as follows:
Aborted
The job has been aborted.
Aborting
The job is in the process of aborting.
Completed
The job has finished.
Running
The job is running.
Submitted Time
Displays the time the job was submitted.
Duration
Displays the amount of time the job took to complete. This column is displayed by default.
Completed Time
Displays the time the job finished. By default, this column is hidden.
Related tasksMonitoring jobs on page 434
You can use the Jobs page to monitor job status and to view job properties such as storage servicetype, state, submitted time, and completed time to determine whether or not a job has successfullycompleted.
Viewing job details on page 435After you start a job, you can track its progress from the Job details page and monitor theassociated tasks for possible errors.
Aborting jobs on page 435You can use the Jobs page to abort a job if it is taking too long to finish, is encountering too manyerrors, or is no longer needed. You can abort a job only if its status and type allow it. You can abortany running job.
Job details pageThe Job details page enables you to view status and other information about specific protection jobtasks that are running, that are queued, or that have completed. You can use this information tomonitor protection job progress and to troubleshoot job failures.
Job summary
The job summary displays the following information:
• Job ID
• Type
• State
• Submitted Time
446Managing and monitoring protection relationships

• Completed Time
• Duration
Command buttons
The command buttons enable you to perform the following tasks:
Refresh
Refreshes the task list and the properties associated with each task.
View Jobs
Returns you to the Jobs page.
Job tasks list
The Job tasks list displays in a table all the tasks associated with a specific job and the propertiesrelated to each task.
Started Time
Displays the day and time the task started. By default, the most recent tasks are displayed atthe top of the column and older tasks are displayed at the bottom.
Type
Displays the type of task.
State
The state of a particular task:
Completed
The task has finished.
Queued
The task is about to run.
Running
The task is running.
Waiting
A job has been submitted and some associated tasks are waiting to be queued andexecuted.
Status
Displays the task status:
Error ( )
The task failed.
Normal ( )
The task succeeded.
Skipped ( )
A task failed, resulting in subsequent tasks being skipped.
Duration
Displays the elapsed time since the task began.
Completed Time
Displays the time the task completed. By default, this column is hidden.
447Managing and monitoring protection relationships

Task ID
Displays the GUID that identifies an individual task for a job. The column can be sorted andfiltered. By default, this column is hidden.
Dependency order
Displays an integer representing the sequence of tasks in a graph, with zero being assignedto the first task. By default, this column is hidden.
Task Details pane
Displays additional information about each job task, including the task name, taskdescription, and, if the task failed, a reason for the failure.
Task Messages pane
Displays messages specific to the selected task. Messages might include a reason for theerror and suggestions for resolving it. Not all tasks display task messages.
Related tasksViewing job details on page 435
After you start a job, you can track its progress from the Job details page and monitor theassociated tasks for possible errors.
Advanced Secondary Settings dialog boxYou can use the Advanced Secondary Settings dialog box to enable version-flexible replication,multiple copy backup, and space-related settings on a secondary volume. You might use theAdvanced Secondary Settings dialog box when you want to change enable or disable the currentsettings.
Space-related settings maximize the amount of data being stored, including the following:deduplication, data compression, autogrow, and space guarantee.
The dialog box includes the following fields:
Enable Version-Flexible Replication
Enables SnapMirror with version-flexible replication. Version-flexible replication enablesSnapMirror protection of a source volume even if the destination volume is running underan earlier version of ONTAP than that of the source volume.
• Enable Backup
If version-flexible replication is enabled, also enables multiple Snapshot copies of theSnapMirror source data to be transferred to and retained at the SnapMirror destination.
Enable Deduplication
Enables deduplication on the secondary volume in a SnapVault relationship so thatduplicate data blocks are eliminated to achieve space savings. You might use deduplicationwhen space savings are at least 10 percent and when data overwrite rate is not rapid.Deduplication is often used for virtualized environments, file shares, and backup data. Thissetting is disabled by default. When enabled, this operation is initiated after each transfer.
• Enable Compression
Enables transparent data compression. You might use compression when space savingsare at least 10 percent, when the potential overhead is acceptable, and when there aresufficient system resources for compression to complete during nonpeak hours. In aSnapVault relationship, this setting is disabled by default. Compression is available onlywhen deduplication is selected.
• Compress Inline
Enables immediate space savings by compressing data before writing data to disk. Youmight use inline compression when your system has no more than 50 percent utilization
448Managing and monitoring protection relationships

during peak hours, and when the system can accommodate new writes and additionalCPU during peak hours. This setting is available only when "Enable Compression" isselected.
Enable Autogrow
Enables you to automatically grow the destination volume when the free space percentageis below the specified threshold, as long as space is available on the associated aggregate.
Maximum Size
Sets the maximum percentage to which a volume can grow. The default is 20 percentgreater than the source volume size. A volume does not grow automatically if the currentsize is greater than or equal to the maximum autogrow percentage. This field is enabledonly when the autogrow setting is enabled.
Increment Size
Specifies the percentage increment by which the volume automatically grows beforereaching the maximum percentage of the source volume.
Space Guarantee
Ensures that enough space is allocated on the secondary volume so that data transfersalways succeed. The space guarantee setting can be one of the following:
• File
• Volume
• None
For example, you might have a 200 GB volume that contains files totaling 50 GB; however,those files hold only 10 GB of data. Volume guarantee allocates 200 GB to the destinationvolume, regardless of contents on the source. File guarantee allocates 50 GB to ensure thatenough space is reserved for files on the source; selecting None in this scenario means thatonly 10 GB is allocated on the destination for the actual space used by file data on thesource.
The space guarantee is set to Volume by default.
Command buttons
The command buttons enable you to perform the following tasks:
Apply
Saves the selected efficiency settings and applies them when you click Apply in theConfigure Protection dialog box.
Cancel
Discards your selections and closes the Advanced Destination Settings dialog box.
Related referenceConfigure Protection dialog box on page 453
You can use the Configure Protection dialog box to create SnapMirror and SnapVault relationshipsfor all read, write, and data protection volumes on clusters to ensure that the data on a sourcevolume or primary volume is replicated.
Related informationNetApp Technical Report 3966: NetApp Data Compression and Deduplication Deployment andImplementation Guide (Clustered Data ONTAP)
Advanced Destination Settings dialog boxYou can use the Advanced Destination Settings dialog box to enable space guarantee settings on adestination volume. You might select advanced settings when space guarantee is disabled on the
449Managing and monitoring protection relationships

source, but you want it enabled on the destination. The settings for deduplication, compression,and autogrow in a SnapMirror relationship are inherited from the source volume and cannot bechanged.
Space Guarantee
Ensures that enough space is allocated on the destination volume so that data transfers alwayssucceed. The space guarantee setting can be one of the following:
• File
• Volume
• None
For example, you might have a 200-GB volume that contains files totaling 50 GB; however, thosefiles hold only 10 GB of data. Volume guarantee allocates 200 GB to the destination volume,regardless of contents on the source. File guarantee allocates 50 GB to ensure that enough space isreserved for source files on the destination; selecting None in this scenario means that only 10 GBis allocated on the destination for the actual space used by file data on the source.
The space guarantee is set to Volume by default.
Related referenceConfigure Protection dialog box on page 453
You can use the Configure Protection dialog box to create SnapMirror and SnapVault relationshipsfor all read, write, and data protection volumes on clusters to ensure that the data on a sourcevolume or primary volume is replicated.
Restore dialog boxYou can use the Restore dialog box to restore data to a volume from a specific Snapshot copy.
Restore from
The Restore from area enables you to specify from where you want to restore data.
Volume
Specifies the volume from which you want to restore data. By default, the volume on whichyou initiated the restore action is selected. You can select a different volume from the drop-down list that contains all the volumes with protection relationships to the volume on whichyou initiated the restore action.
Snapshot copy
Specifies which Snapshot copy you want to use to restore data. By default, the most recentSnapshot copy is selected. You can also select a different Snapshot copy from the drop-down list. The Snapshot copy list changes according to which volume is selected.
List maximum of 995 files and directories
By default a maximum of 995 objects are shown in the list. You can deselect this checkboxif you want to view all objects within the selected volume. This operation may take sometime if the number of items is very large.
Select items to restore
The Select items to restore area enables you to select either the entire volume or specific files andfolders you want to restore. You can select a maximum of 10 files, folders, or a combination ofboth. When the maximum number of items is selected, the item selection check boxes aredisabled.
Path field
Displays the path to the data you want to restore. You can either navigate to the folder andfiles you want to restore, or you can type the path. This field is empty until you select or
450Managing and monitoring protection relationships

type a path. Clicking after you have chosen a path moves you up one level in thedirectory structure.
Folders and files list
Displays the contents of the path you entered. By default, the root folder is initiallydisplayed. Clicking a folder name displays the contents of the folder.
You can select items to restore as follows:
• When you enter the path with a particular file name specified in the path field, the specified fileis displayed in the Folders and Files.
• When you enter a path without specifying a particular file, the contents of the folder aredisplayed in the Folders and Files list, and you can select up to 10 files, folders, or acombination of both to restore.
If a folder contains more than 995 items, a message displays to indicate there are too manyitems to display, and if you proceed with the operation all items in the specified folder arerestored. You can deselect the "List maximum of 995 files and directories" checkbox if youwant to view all objects within the selected volume.
Note: You cannot restore NTFS file streams.
Restore to
The Restore to area enables you to specify where you want to restore the data.
Original Location in Volume_Name
Restores the selected data to the directory on the source from which the data was originallybacked up.
Alternate Location
Restores the selected data to a new location:
• Restore Path
Specifies an alternate path for restoring the selected data. The path must already exist.You can use the Browse button to navigate to the location where you want the datarestored, or you can enter the path manually using the format cluster://svm/volume/path.
• Preserve directory hierarchy
When checked, preserves the structure of the original file or directory. For example, ifthe source is /A/B/C/myFile.txt and the destination is /X/Y/Z, Unified Manager restoresthe data using the following directory structure on the destination: /X/Y/Z/A/B/C/myFile.txt.
Command buttons
The command buttons enable you to perform the following tasks:
Cancel
Discards your selections and closes the Restore dialog box.
Restore
Applies your selections and begins the restore process.
Related tasksRestoring data using the Health: All Volumes view on page 425
You can restore overwritten or deleted files, directories, or an entire volume from a Snapshot copyby using the restore feature on the Health: All Volumes view.
Restoring data using the Volume / Health details page on page 426
451Managing and monitoring protection relationships

You can restore overwritten or deleted files, directories, or an entire volume from a Snapshot copyby using the restore feature on the Volume / Health details page.
Related referenceBrowse Directories dialog box on page 452
You can use the Browse Directories dialog box when you want to restore data to a directory on acluster and SVM that is different from the original source. The original source cluster and volumeare selected by default.
Browse Directories dialog boxYou can use the Browse Directories dialog box when you want to restore data to a directory on acluster and SVM that is different from the original source. The original source cluster and volumeare selected by default.
The Browse Directories dialog box enables you to select the cluster, SVM, volume, and directorypath to which you want data restored.
Cluster
Lists the available cluster destinations to which you can restore. By default, the cluster ofthe original source volume is selected.
SVM drop-down list
Lists the available SVM available for the selected cluster. By default, the SVM of theoriginal source volume is selected.
Volume
Lists all of the read/write volumes in a selected SVM. You can filter the volumes by nameand by space available. The volume with the most space is listed first, and so on, indescending order. By default, the original source volume is selected.
File path text box
Enables you to type the file path to which you want data restored. The path you enter mustalready exist.
Name
Displays the names of the available folders for the selected volume. Clicking a folder in theName list displays the subfolders, if any exist. Files contained in the folders are not
displayed. Clicking after you have selected a folder moves you up one level in thedirectory structure.
Command buttons
The command buttons enable you to perform the following tasks:
Select Directory
Applies your selections and closes the Browse Directories dialog box. If no directory isselected, this button is disabled.
Cancel
Discards your selections and closes the Browse Directories dialog box.
Related referenceRestore dialog box on page 450
452Managing and monitoring protection relationships

You can use the Restore dialog box to restore data to a volume from a specific Snapshot copy.
Configure Protection dialog boxYou can use the Configure Protection dialog box to create SnapMirror and SnapVault relationshipsfor all read, write, and data protection volumes on clusters to ensure that the data on a sourcevolume or primary volume is replicated.
• Source tab• SnapMirror tab• SnapVault tab• Command buttons
Source tab
Topology view
Displays a visual representation of the relationship that you are creating. The source in thetopology is highlighted by default.
Source Information
Displays details about the selected source volumes, including the following information:
• Source cluster name
• Source SVM name
• Cumulative volume total size
Displays the total size of all the source volumes that are selected.
• Cumulative volume used size
Displays the cumulative volume used size for all the selected source volumes.
• Source volume
Displays the following information in a table:
◦ Source Volume
Displays the names of the selected source volumes.
◦ Type
Displays the volume type.
◦ SnapLock Type
Displays the SnapLock type of the volume. The options are Compliance, Enterprise,and Non-SnapLock.
◦ Snapshot Copy
Displays the Snapshot copy that is used for the baseline transfer. If the sourcevolume is read/write, the value of Default in the Snapshot copy column indicates thata new Snapshot copy is created by default, and is used for the baseline transfer. If thesource volume is a data protection volume, the value of Default in the Snapshot copycolumn indicates that no new Snapshot copy is created, and all existing Snapshotcopies are transferred to the destination. Clicking the Snapshot copy value displays alist of Snapshot copies from which you can select an existing Snapshot copy to usefor the baseline transfer. You cannot select a different default Snapshot copy if thesource type is data protection.
SnapMirror tab
Enables you to specify a destination cluster, storage virtual machine (SVM), and aggregate for aprotection relationship, as well as a naming convention for destinations while creating aSnapMirror relationship. You can also specify a SnapMirror policy and schedule.
453Managing and monitoring protection relationships

Topology view
Displays a visual representation of the relationship that you are creating. The SnapMirrordestination resource in the topology is highlighted by default.
Destination Information
Enables you to select the destination resources for a protection relationship:
• Advanced link
Launches the Advanced Destination Settings dialog box when you are creating aSnapMirror relationship.
• Cluster
Lists the clusters that are available as protection destination hosts. This field is required.
• storage virtual machine (SVM)
Lists the SVMs that are available on the selected cluster. A cluster must be selectedbefore the SVM list is populated. This field is required.
• Aggregate
Lists the aggregates that are available on the selected SVM. A cluster must be selectedbefore the Aggregate list is populated. This field is required. The Aggregate list displaysthe following information:
◦ Rank
When multiple aggregates satisfy all the requirements for a destination, the rankindicates the priority in which the aggregate is listed, according to the followingconditions:
1. An aggregate that is located on a different node than the source volume node ispreferred to enable fault domain separation.
2. An aggregate on a node with fewer volumes is preferred to enable load balancingacross nodes in a cluster.
3. An aggregate that has more free space than other aggregates is preferred toenable capacity balancing.
A rank of 1 means that the aggregate is the most preferred according to the threecriteria.
◦ Aggregate Name
Name of the aggregate
◦ Available Capacity
◦ Amount of space that is available on the aggregate for data
◦ Resource Pool
Name of the resource pool to which the aggregate belongs
• Naming Convention
Specifies the default naming convention that is applied to the destination volume. Youcan accept the naming convention that is provided, or you can create a custom one. Thenaming convention can have the following attributes: %C, %M, %V, and %N, where%C is the cluster name, %M is the SVM name, %V is the source volume, and %N is thetopology destination node name.
The naming convention field is highlighted in red if your entry is invalid. Clicking the"Preview Name" link displays a preview of the naming convention that you entered, andthe preview text updates dynamically as you type a naming convention in the text field.A suffix between 001 and 999 is appended to the destination name when the relationshipis created, replacing the nnn that displays in the preview text, with 001 being assignedfirst, 002 assigned second, and so on.
454Managing and monitoring protection relationships
Relationship Settings
Enables you to specify the maximum transfer rate, SnapMirror policy, and schedule that theprotection relationship uses:
• Max Transfer Rate
Specifies the maximum rate at which data is transferred between clusters over thenetwork. If you choose not to use a maximum transfer rate, the baseline transferbetween relationships is unlimited.
• SnapMirror Policy
Specifies the ONTAP SnapMirror policy for the relationship. The default is DPDefault.
• Create Policy
Launches the Create SnapMirror Policy dialog box, which enables you to create and usea new SnapMirror policy.
• SnapMirror Schedule
Specifies the ONTAP SnapMirror policy for the relationship. Available schedulesinclude None, 5min, 8hour, daily, hourly, and weekly. The default is None, indicatingthat no schedule is associated with the relationship. Relationships without scheduleshave no lag status values unless they belong to a storage service.
• Create Schedule
Launches the Create Schedule dialog box, which enables you to create a newSnapMirror schedule.
SnapVault tab
Enables you to specify a secondary cluster, SVM, and aggregate for a protection relationship, aswell as a naming convention for secondary volumes while creating a SnapVault relationship. Youcan also specify a SnapVault policy and schedule.
Topology view
Displays a visual representation of the relationship that you are creating. The SnapVaultsecondary resource in the topology is highlighted by default.
Secondary Information
Enables you to select the secondary resources for a protection relationship:
• Advanced link
Launches the Advanced Secondary Settings dialog box.
• Cluster
Lists the clusters that are available as secondary protection hosts. This field is required.
• storage virtual machine (SVM)
Lists the SVMs that are available on the selected cluster. A cluster must be selectedbefore the SVM list is populated. This field is required.
• Aggregate
Lists the aggregates that are available on the selected SVM. A cluster must be selectedbefore the Aggregate list is populated. This field is required. The Aggregate list displaysthe following information:
◦ Rank
When multiple aggregates satisfy all the requirements for a destination, the rankindicates the priority in which the aggregate is listed, according to the followingconditions:
1. An aggregate that is located on a different node than the primary volume node ispreferred to enable fault domain separation.
2. An aggregate on a node with fewer volumes is preferred to enable load balancingacross nodes in a cluster.
455Managing and monitoring protection relationships

3. An aggregate that has more free space than other aggregates is preferred toenable capacity balancing.
A rank of 1 means that the aggregate is the most preferred according to the threecriteria.
◦ Aggregate NameName of the aggregate
◦ Available Capacity
◦ Amount of space that is available on the aggregate for data
◦ Resource PoolName of the resource pool to which the aggregate belongs
• Naming ConventionSpecifies the default naming convention that is applied to the secondary volume. Youcan accept the naming convention that is provided, or you can create a custom one. Thenaming convention can have the following attributes: %C, %M, %V, and %N, where%C is the cluster name, %M is the SVM name, %V is the source volume, and %N is thetopology secondary node name.The naming convention field is highlighted in red if your entry is invalid. Clicking the"Preview Name" link displays a preview of the naming convention that you entered, andthe preview text updates dynamically as you type a naming convention in the text field.If you type an invalid value, the invalid information displays as red question marks inthe preview area. A suffix between 001 and 999 is appended to the secondary namewhen the relationship is created, replacing the nnn that displays in the preview text, with001 being assigned first, 002 assigned second, and so on.
Relationship Settings
Enables you to specify the maximum transfer rate, SnapVault policy, and SnapVaultschedule that the protection relationship uses:
• Max Transfer RateSpecifies the maximum rate at which data is transferred between clusters over thenetwork. If you choose not to use a maximum transfer rate, the baseline transferbetween relationships is unlimited.
• SnapVault PolicySpecifies the ONTAP SnapVault policy for the relationship. The default is XDPDefault.
• Create PolicyLaunches the Create SnapVault Policy dialog box, which enables you to create and use anew SnapVault policy.
• SnapVault ScheduleSpecifies the ONTAP SnapVault schedule for the relationship. Available schedulesinclude None, 5min, 8hour, daily, hourly, and weekly. The default is None, indicatingthat no schedule is associated with the relationship. Relationships without scheduleshave no lag status values unless they belong to a storage service.
• Create ScheduleLaunches the Create Schedule dialog box, which enables you to create a SnapVaultschedule.
Command buttons
The command buttons enable you to perform the following tasks:
Cancel
Discards your selections, and closes the Configure Protection dialog box.
Apply
Applies your selections, and begins the protection process.
456Managing and monitoring protection relationships

Related tasksCreating a SnapVault protection relationship from the Health: All Volumes view on page 403
You can use the Health: All Volumes view to create SnapVault relationships for one or morevolumes on the same Storage VM to enable data backups for protection purposes.
Creating a SnapVault protection relationship from the Volume / Health details page on page 405You can create a SnapVault relationship using the Volume / Health details page so that databackups are enabled for protection purposes on volumes.
Creating a SnapMirror protection relationship from the Health: All Volumes view on page 406Using the Health: All Volumes view enables you to create several SnapMirror protectionrelationships at one time by selecting more than one volume on the same storage VM.
Creating a SnapMirror protection relationship from the Volume / Health details page on page407
You can use the Volume / Health details page to create a SnapMirror relationship so that datareplication is enabled for protection purposes. SnapMirror replication enables you to restore datafrom the destination volume in the event of data loss on the source.
Creating cascade or fanout relationships to extend protection from an existing protectionrelationship on page 412
You can extend protection from an existing relationship by creating either a fanout from the sourcevolume or a cascade from the destination volume of an existing relationship. You might do thiswhen you need to copy data from one site to many sites or to provide additional protection bycreating more backups.
Related referenceAdvanced Secondary Settings dialog box on page 448
You can use the Advanced Secondary Settings dialog box to enable version-flexible replication,multiple copy backup, and space-related settings on a secondary volume. You might use theAdvanced Secondary Settings dialog box when you want to change enable or disable the currentsettings.
Advanced Destination Settings dialog box on page 449You can use the Advanced Destination Settings dialog box to enable space guarantee settings on adestination volume. You might select advanced settings when space guarantee is disabled on thesource, but you want it enabled on the destination. The settings for deduplication, compression,and autogrow in a SnapMirror relationship are inherited from the source volume and cannot bechanged.
Create Schedule dialog boxThe Create Schedule dialog box enables you to create a basic or advanced protection schedule forSnapMirror and SnapVault relationship transfers. You might create a new schedule to increase thefrequency of data transfers due to frequent data updates, or you might create a less frequentschedule when data changes infrequently.
Schedules cannot be configured for SnapMirror Synchronous relationships.
Destination Cluster
The name of the cluster you selected in the SnapVault tab or SnapMirror tab of theConfigure Protection dialog box.
Schedule Name
The name you provide for the schedule. Schedule names can consist of the characters Athrough Z, a through z, 0 through 9, as well as any of the following special characters: ! @# $ % ^ & * ( ) _ -. Schedule names may not include the following characters: < >.
457Managing and monitoring protection relationships

Basic or Advanced
The schedule mode you want to use.
Basic mode includes the following elements:
• Repeat
How often a scheduled transfer occurs. Choices include hourly, daily, and weekly.
• Day
When a repeat of weekly is selected, the day of the week a transfer occurs.
• Time
When Daily or Weekly is selected, the time of day a transfer occurs.
Advanced mode includes the following elements:
• Months
A comma-separated numerical list representing the months of the year. Valid values are0 through 11, with zero representing January, and so on. This element is optional.Leaving the field blank implies that transfers occur every month.
• Days
A comma-separated numerical list representing the day of the month. Valid values are 1through 31. This element is optional. Leaving the field blank implies that a transferoccurs every day of the month.
• Weekdays
A comma-separated numerical list representing the days of the week. Valid values are 0through 6, with 0 representing Sunday, and so on. This element is optional. Leaving thefield blank implies that a transfer occurs every day of the week. If a day of the week isspecified but a day of the month is not specified, a transfer occurs only on the specifiedday of the week and not every day.
• Hours
A comma-separated numerical list representing the number of hours in a day. Validvalues are 0 through 23, with 0 representing midnight. This element is optional.
• Minutes
A comma-separated numerical list representing the minutes in an hour. Valid values are0 through 59. This element is required.
Related tasksCreating SnapMirror and SnapVault schedules on page 411
You can create basic or advanced SnapMirror and SnapVault schedules to enable automatic dataprotection transfers on a source or primary volume so that transfers take place more frequently orless frequently, depending on how often the data changes on your volumes.
Create SnapMirror Policy dialog boxThe Create SnapMirror Policy dialog box enables you to create a policy to set the priority forSnapMirror transfers. You use policies to maximize the efficiency of transfers from the source tothe destination.
Destination Cluster
The name of the cluster you selected in the SnapMirror tab of the Configure Protectiondialog box.
Destination SVM
The name of the SVM you selected in the SnapMirror tab of the Configure Protectiondialog box.
458Managing and monitoring protection relationships

Policy Name
The name you provide for the new policy. Policy names can consist of the characters Athrough Z, a through z, 0 through 9, period (.), hyphen (-), and underscore (_).
Transfer Priority
The priority at which a transfer runs for asynchronous operations. You can select eitherNormal or Low. Transfer relationships with policies that specify a normal transfer priorityrun before those with policies that specify a low transfer priority.
Comment
An optional field in which you can add comments about the policy.
Transfer Restart
Indicates what restart action to take when a transfer is interrupted by an abort operation orany type of failure, such as a network outage. You can select one of the following:
• Always
Specifies that a new Snapshot copy is created before restarting a transfer, then, if oneexists, the transfer is restarted from a checkpoint, followed by an incremental transferfrom the newly created Snapshot copy.
• Never
Specifies that interrupted transfers are never restarted.
Command buttons
The command buttons enable you to perform the following tasks:
Cancel
Discards the selections and closes the Configure Protection dialog box.
Apply
Applies your selections and begins the protection process.
Related tasksCreating a SnapMirror policy to maximize transfer efficiency on page 413
You can create a SnapMirror policy to specify the SnapMirror transfer priority for protectionrelationships. SnapMirror policies enable you to maximize transfer efficiency from the source tothe destination by assigning priorities so that lower-priority transfers are scheduled to run afternormal-priority transfers.
Create SnapVault Policy dialog boxThe Create SnapVault Policy dialog box enables you to create a policy to set the priority forSnapVault transfers. You use policies to maximize the efficiency of transfers from the primary tothe secondary volume.
Destination Cluster
The name of the cluster that you selected in the SnapVault tab of the Configure Protectiondialog box.
Destination SVM
The name of the SVM that you selected in the SnapVault tab of the Configure Protectiondialog box.
Policy Name
The name you provide for the new policy. Policy names can consist of the characters Athrough Z, a through z, 0 through 9, period (.), hyphen (-), and underscore (_).
459Managing and monitoring protection relationships

Transfer Priority
The priority at which the transfer is run. You can select either Normal or Low. Transferrelationships with policies that specify a normal transfer priority run before those withpolicies that specify a low transfer priority. The default setting is Normal.
Comment
An optional field in which you can a add comment of up to 255 characters about theSnapVault policy.
Ignore Access Time
Specifies whether incremental transfers are ignored for files that have only their access timechanged.
Replication Label
Lists in a table the rules associated with Snapshot copies selected by ONTAP that have aspecific replication label in a policy. The following information and actions are alsoavailable:
• Command buttons
The command buttons enable you to perform the following actions:
◦ Add
Enables you to create a Snapshot copy label and retention count.
◦ Edit Retention Count
Enables you to change the retention count for an existing Snapshot copy label. Theretention count must be a number between 1 and 251. The sum of all retentioncounts for all rules cannot exceed 251.
◦ Delete
Enables you to delete an existing Snapshot copy label.
• Snapshot Copy Label
Displays the Snapshot copy label. If you select one or more volumes with the same localSnapshot copy policy, an entry for each label in the policy is displayed. If you selectmultiple volumes that have two or more local Snapshot copy policies, the table displaysall labels from all policies
• Schedule
Displays the schedule associated with each Snapshot copy label. If a label has more thanone schedule associated with it, the schedules for that label are displayed in a comma-separated list. If you select multiple volumes with the same label but with differentschedules, the schedule displays "Various" to indicate that more than one schedule isassociated with the selected volumes.
• Destination Retention Count
Displays the number of Snapshot copies with the specified label that are retained on theSnapVault secondary. Retention counts for labels with multiple schedules displays thesum of retention counts of each label and schedule pair. If you select multiple volumeswith two or more local Snapshot copy policies, the retention count is empty.
Related tasksCreating a SnapVault policy to maximize transfer efficiency on page 414
460Managing and monitoring protection relationships

You can create a new SnapVault policy to set the priority for a SnapVault transfer. You use policiesto maximize the efficiency of transfers from the primary to the secondary in a protectionrelationship.
Edit Relationship dialog boxYou can edit an existing protection relationship to change the maximum transfer rate, theprotection policy, or the protection schedule.
Destination Information
Destination Cluster
The name of the selected destination cluster.
Destination SVM
The name of the selected SVM
Relationship Settings
Enables you to specify the maximum transfer rate, SnapMirror policy, and schedule that theprotection relationship uses:
• Max Transfer Rate
Specifies the maximum rate at which baseline data is transferred between clusters overthe network. When selected, network bandwidth is limited to the value you specify. Youcan enter a numerical value and then select either kilobytes per second (KBps),megabytes per second (MBps), gigabytes per second (GBps), or terabytes per second(TBps). The maximum transfer rate that you specify must be greater than 1 KBps andless than 4 TBps. If you choose not to use a maximum transfer rate, the baseline transferbetween relationships is unlimited. If the primary cluster and the secondary cluster arethe same, this setting is disabled.
• SnapMirror Policy
Specifies the ONTAP SnapMirror policy for the relationship. The default is DPDefault.
• Create Policy
Launches the Create SnapMirror Policy dialog box, which enables you to create and usea new SnapMirror policy.
• SnapMirror Schedule
Specifies the ONTAP SnapMirror policy for the relationship. Available schedulesinclude None, 5min, 8hour, daily, hourly, and weekly. The default is None, indicatingthat no schedule is associated with the relationship. Relationships without scheduleshave no lag status values unless they belong to a storage service.
• Create Schedule
Launches the Create Schedule dialog box, which enables you to create a newSnapMirror schedule.
Command buttons
The command buttons enable you to perform the following tasks:
Cancel
Discards the selections and closes the Configure Protection dialog box.
Submit
Applies your selections and closes the Edit Relationship dialog box.
Related tasksEditing protection relationships from the Volume Relationships page on page 412
461Managing and monitoring protection relationships

You can edit existing protection relationships to change the maximum transfer rate, the protectionpolicy, or the protection schedule. You might edit a relationship to decrease the bandwidth used fortransfers, or to increase the frequency of scheduled transfers because data is changing often.
Editing protection relationships from the Volume / Health details page on page 413You can edit existing protection relationships to change the current maximum transfer rate,protection policy, or protection schedule. You might edit a relationship to decrease the bandwidthused for transfers, or to increase the frequency of scheduled transfers because data is changingoften.
Initialize/Update dialog boxThe Initialize/Update dialog box enables you to perform a first-time baseline transfer on a newprotection relationship, or to update a relationship if it is already initialized and you want toperform a manual, unscheduled, incremental update.
Transfer Options tab
The Transfer Options tab enables you to change the initialization priority of a transfer and tochange the bandwidth used during transfers.
Transfer Priority
The priority at which the transfer is run. You can select either Normal or Low. Relationshipswith policies that specify a normal transfer priority run before those that specify a lowtransfer priority. Normal is selected by default.
Max Transfer Rate
Specifies the maximum rate at which data is transferred between clusters over the network.If you choose not to use a maximum transfer rate, the baseline transfer betweenrelationships is unlimited. If you select more than one relationship with different maximumtransfer rates, you can specify one of the following maximum transfer rate settings:
• Use values specified during individual relationship setup or edit
When selected, initialization and update operations use the maximum transfer ratespecified at the time of each relationship's creation or edit. This field is available onlywhen multiple relationships with different transfer rates are being initialized or updated.
• Unlimited
Indicates that there is no bandwidth limitation on transfers between relationships. Thisfield is available only when multiple relationships with different transfer rates are beinginitialized or updated.
• Limit bandwidth to
When selected, network bandwidth is limited to the value you specify. You can enter anumerical value and then select either kilobytes per second (KBps), Megabytes persecond (MBps), Gigabytes per second (GBps), or Terabytes per second (TBps). Themaximum transfer rate that you specify must be greater than 1 KBps and less than 4TBps.
Source Snapshot Copies tab
The Source Snapshot Copies tab displays the following information about the source Snapshotcopy that is used for the baseline transfer:
Source Volume
Displays the names of the corresponding source volumes.
Destination Volume
Displays the names of the selected destination volumes.
462Managing and monitoring protection relationships

Source Type
Displays the volume type. The type can be either Read/write or Data Protection.
Snapshot Copy
Displays the Snapshot copy that is used for the data transfer. Clicking the Snapshot copyvalue displays the Select Source Snapshot Copy dialog box, in which you can select aspecific Snapshot copy for your transfer, depending on the type of protection relationshipthat you have and the operation that you are performing. The option to specify a differentSnapshot copy is not available for data protection type sources.
Command buttons
The command buttons enable you to perform the following tasks:
Cancel
Discards your selections and closes the Initialize/Update dialog box.
Submit
Saves your selections and starts the initialize or update job.
Related tasksInitializing or updating protection relationships from the Volume / Health details page on page421
You can perform a first-time baseline transfer on a new protection relationship, or update arelationship if it is already initialized and you want to perform a manual, unscheduled incrementalupdate to transfer data immediately.
Initializing or updating protection relationships from the Volume Relationships page on page420
From the Volume Relationships page, you can perform a first-time baseline transfer on a newprotection relationship, or update a relationship if it is already initialized and you want to performa manual, unscheduled incremental update to transfer immediately.
Related referenceSelect Source Snapshot Copy dialog box on page 464
You use the Select Source Snapshot Copy dialog box to select a specific Snapshot copy to transferdata between protection relationships, or you select the default behavior, which varies dependingon whether you are initializing, updating, or resynchronizing a relationship, and whether therelationship is a SnapMirror or SnapVault.
Resynchronize dialog boxThe Resynchronize dialog box enables you to resynchronize data on a SnapMirror or SnapVaultrelationship that was previously broken and then the destination was made a read/write volume.You might also resynchronize when a required common Snapshot copy on the source volume isdeleted causing SnapMirror or SnapVault updates to fail.
Resynchronization Options tab
The Resynchronization Options tab enables you to set the transfer priority and the maximumtransfer rate for the protection relationship that you are resynchronizing.
Transfer Priority
The priority at which the transfer is run. You can select either Normal or Low. Relationshipswith policies that specify a normal transfer priority run before those with policies thatspecify a low transfer priority.
Max Transfer Rate
Specifies the maximum rate at which data is transferred between clusters over the network.When selected, network bandwidth is limited to the value that you specify. You can enter a
463Managing and monitoring protection relationships

numerical value and then select either kilobytes per second (KBps), megabytes per second(MBps), gigabytes per second (GBps), or TBps. If you choose not to use a maximumtransfer rate, the baseline transfer between relationships is unlimited.
Source Snapshot Copies tab
The Source Snapshot Copies tab displays the following information about the source Snapshotcopy that is used for the baseline transfer:
Source Volume
Displays the names of the corresponding source volumes.
Destination Volume
Displays the names of the selected destination volumes.
Source Type
Displays the volume type: either Read/write or Data Protection.
Snapshot Copy
Displays the Snapshot copy that is used for the data transfer. Clicking the Snapshot copyvalue displays the Select Source Snapshot Copy dialog box, in which can select a specificSnapshot copy for your transfer, depending on the type of protection relationship you haveand the operation you are performing.
Command buttons
Submit
Begins the resynchronization process and closes the Resynchronize dialog box.
Cancel
Cancels your selections and closes the Resynchronize dialog box.
Related tasksResynchronizing protection relationships from the Volume / Health details page on page 422
You can resynchronize data on a SnapMirror or SnapVault relationship that was broken and thenthe destination was made read/write so that data on the source matches the data on the destination.You might also resynchronize when a required common Snapshot copy on the source volume isdeleted causing SnapMirror or SnapVault updates to fail.
Resynchronizing protection relationships from the Volume Relationships page on page 422From the Volume Relationships page, you can resynchronize a relationship either to recover froman event that disabled your source volume or when you want to change the current source to adifferent volume.
Related referenceSelect Source Snapshot Copy dialog box on page 464
You use the Select Source Snapshot Copy dialog box to select a specific Snapshot copy to transferdata between protection relationships, or you select the default behavior, which varies dependingon whether you are initializing, updating, or resynchronizing a relationship, and whether therelationship is a SnapMirror or SnapVault.
Select Source Snapshot Copy dialog boxYou use the Select Source Snapshot Copy dialog box to select a specific Snapshot copy to transferdata between protection relationships, or you select the default behavior, which varies depending
464Managing and monitoring protection relationships

on whether you are initializing, updating, or resynchronizing a relationship, and whether therelationship is a SnapMirror or SnapVault.
Default
Enables you to select the default behavior for determining which Snapshot copy is used forinitialize, update, and resynchronize transfers for SnapVault and SnapMirror relationships.
If you are performing a SnapVault transfer, the default behavior for each operation is as follows:
Operation Default SnapVault behavior whensource is read/write
Default SnapVault behavior whensource is Data Protection (DP)
Initialize Creates a new Snapshot copy andtransfers it.
Transfers the last exported Snapshotcopy.
Update Transfers only labeled Snapshotcopies, as specified in the policy.
Transfers the last exported Snapshotcopy.
Resynchronize Transfers all labeled Snapshot copiescreated after the newest commonSnapshot copy.
Transfers the newest labeledSnapshot copy.
If you are performing a SnapMirror transfer, the default behavior for each operation is as follows:
Operation Default SnapMirror behavior Default SnapMirror behavior whenrelationship is second hop in aSnapMirror to SnapMirrorcascade
Initialize Creates a new Snapshot copy andtransfers it and all Snapshot copiescreated prior to the new Snapshotcopy.
Transfers all Snapshot copies fromthe source.
Update Creates a new Snapshot copy andtransfers it and all Snapshot copiescreated prior to the new Snapshotcopy.
Transfers all Snapshot copies.
Resynchronize Creates a new Snapshot copy andthen transfers all Snapshot copiesfrom the source.
Transfers all Snapshot copies fromthe secondary volume to the tertiaryvolume, and deletes any data addedafter creation of the newest commonSnapshot copy.
Existing Snapshot Copy
Enables you to select an existing Snapshot copy from the list if Snapshot copy selection is allowedfor that operation.
Snapshot Copy
Displays the existing Snapshot copies from which you can select for a transfer.
Date Created
Displays the date and time the Snapshot copy was created. Snapshot copies are listed frommost recent to least recent, with the most recent at the top of the list.
If you are performing a SnapVault transfer and you want to select an existing Snapshot copy totransfer from a source to a destination, the behavior for each operation is as follows:
465Managing and monitoring protection relationships

Operation SnapVault behavior whenspecifying a Snapshot copy
SnapVault behavior whenspecifying a Snapshot copy in acascade
Initialize Transfers the specified Snapshotcopy.
Source Snapshot copy selection is notsupported for data protectionvolumes.
Update Transfers the specified Snapshotcopy.
Source Snapshot copy selection is notsupported for data protectionvolumes.
Resynchronize Transfers the selected Snapshot copy. Source Snapshot copy selection is notsupported for data protectionvolumes.
If you are performing a SnapMirror transfer and you want to select an existing Snapshot copy totransfer from a source to a destination, the behavior for each operation is as follows:
Operation SnapMirror behavior whenspecifying a Snapshot copy
SnapMirror behavior whenspecifying a Snapshot copy in acascade
Initialize Transfers all Snapshot copies on thesource, up to the specified Snapshotcopy.
Source Snapshot copy selection is notsupported for data protectionvolumes.
Update Transfers all Snapshot copies on thesource, up to the specified Snapshotcopy.
Source Snapshot copy selection is notsupported for data protectionvolumes.
Resynchronize Transfers all Snapshot copies fromthe source, up to the selectedSnapshot copy, and then deletes anydata added after creation of thenewest common Snapshot copy.
Source Snapshot copy selection is notsupported for data protectionvolumes.
Command buttons
The command buttons enable you to perform the following tasks:
Submit
Submits your selections and closes the Select Source Snapshot Copy dialog box.
Cancel
Discards your selections and closes the Select Source Snapshot Copy dialog box.
Related tasksResynchronizing protection relationships from the Volume / Health details page on page 422
You can resynchronize data on a SnapMirror or SnapVault relationship that was broken and thenthe destination was made read/write so that data on the source matches the data on the destination.You might also resynchronize when a required common Snapshot copy on the source volume isdeleted causing SnapMirror or SnapVault updates to fail.
Resynchronizing protection relationships from the Volume Relationships page on page 422
466Managing and monitoring protection relationships

From the Volume Relationships page, you can resynchronize a relationship either to recover froman event that disabled your source volume or when you want to change the current source to adifferent volume.
Related referenceResynchronize dialog box on page 463
The Resynchronize dialog box enables you to resynchronize data on a SnapMirror or SnapVaultrelationship that was previously broken and then the destination was made a read/write volume.You might also resynchronize when a required common Snapshot copy on the source volume isdeleted causing SnapMirror or SnapVault updates to fail.
Initialize/Update dialog box on page 462The Initialize/Update dialog box enables you to perform a first-time baseline transfer on a newprotection relationship, or to update a relationship if it is already initialized and you want toperform a manual, unscheduled, incremental update.
Reverse Resync dialog boxWhen you have a protection relationship that is broken because the source volume is disabled andthe destination is made a read/write volume, reverse resynchronization enables you to reverse thedirection of the relationship so that the destination becomes the new source and the sourcebecomes the new destination.
When a disaster disables the source volume in your protection relationship, you can use thedestination volume to serve data by converting it to read/write, while you repair or replace thesource, update the source, and reestablish the relationship. When you perform a reverse resyncoperation, data on the source that is newer than the data on the common Snapshot copy is deleted.
Before reverse resync
Displays the source and destination of a relationship before a reverse resync operation.
Source Volume
The name and location of the source volume before a reverse resync operation.
Destination Volume
The name and location of the destination volume before a reverse resync operation.
After reverse resync
Displays what the source and destination of a relationship is after a reserve resync operation.
Source Volume
The name and location of the source volume after a reverse resync operation.
Destination Volume
The name and location of the destination volume after a reverse resync operation.
Command buttons
The command buttons enable you to perform the following actions:
Submit
Begins the reverse resynchronization process.
Cancel
Closes the Reverse Resync dialog box without initiating a reverse resync operation.
Related tasksReversing protection relationships from the Volume / Health details page on page 424
When a disaster disables the source volume in your protection relationship, you can use thedestination volume to serve data by converting it to read/write while you repair or replace the
467Managing and monitoring protection relationships

source. When the source is again available to receive data, you can use the reverseresynchronization operation to establish the relationship in the reverse direction, synchronizing thedata on the source with the data on the read/write destination.
Reversing protection relationships from the Volume Relationships page on page 423When a disaster disables the source volume in your protection relationship, you can use thedestination volume to serve data by converting it to a read/write volume while you repair orreplace the source. When the source is again available to receive data, you can use the reverseresynchronization operation to establish the relationship in the reverse direction, synchronizing thedata on the source with the data on the read/write destination.
Relationship: All Relationships viewThe Relationship: All Relationships view displays information about protection relationships onthe storage system.
The controls along the top of the page enable you to select a particular view (for health,performance, capacity, and so on), perform searches to locate specific objects, create and applyfilters to narrow the list of displayed data, add/remove/reorder columns on the page, and export thedata on the page to a .csv, .pdf, or .xlsx file. After you have customized the page, you cansave the results as a custom view and then schedule a report of this data to be generated andemailed on a regular basis.
Status
Displays the current status of the protection relationship.
The status can be one of Error ( ), Warning ( ), or OK ( ).
Source Storage VM
Displays the name of the source SVM. You can view more details about the source SVM byclicking the SVM name.
If the message Resource-key not discovered is displayed, this might indicate that theSVM exists on the cluster but has not yet been added to the Unified Manager inventory, orthat the SVM was created after the cluster's last refresh. You must ensure that the SVMexists, or perform a rediscovery on the cluster to refresh the list of resources.
Source
Displays the source volume being protected. You can view more details about the sourcevolume by clicking the volume name.
If the message Resource-key not discovered is displayed, this might indicate that thevolume exists on the cluster but has not yet been added to the Unified Manager inventory, orthat the volume was created after the cluster's last refresh. You must ensure that the volumeexists, or perform a rediscovery on the cluster to refresh the list of resources.
Destination Storage VM
Displays the name of the destination SVM. You can view more details about the destinationSVM by clicking the SVM name.
Destination
Displays the name of the destination volume. You can view more details about thedestination volume by clicking the volume name.
Policy
Displays the name of the protection policy for the volume. You can click the policy name toview details associated with that policy, including the following information:
• Transfer Priority
468Managing and monitoring protection relationships

Specifies the priority at which a transfer runs for asynchronous operations. The transferpriority is Normal or Low. Normal priority transfers are scheduled before low prioritytransfers. The default is Normal.
• Ignore Access TimeApplies only to SnapVault relationships. This specifies whether incremental transfersignore files which have only their access time changed. The values are either True orFalse. The default is False.
• When Relationship is Out of SyncSpecifies the action ONTAP performs when a synchronous relationship is not able to besynchronized. StrictSync relationships will restrict access to the primary volume if thereis a failure to synchronize with the secondary volume. Sync relationships do not restrictaccess to the primary if there is a failure to synchronize with the secondary.
• Tries LimitSpecifies the maximum number of times to attempt each manual or scheduled transferfor a SnapMirror relationship. The default is 8.
• CommentsProvides a text field for comments for specific to the selected policy.
• SnapMirror LabelSpecifies the SnapMirror label for the first schedule associated with the Snapshot copypolicy. The SnapMirror label is used by the SnapVault subsystem when you back upSnapshot copies to a SnapVault destination.
• Retention SettingSpecifies how long backups are kept, based on the time or the number of backups.
• Actual Snapshot CopiesSpecifies the number of Snapshot copies on this volume that match the specified label.
• Preserve Snapshot CopiesSpecifies the number of SnapVault Snapshot copies that are not deleted automaticallyeven if the maximum limit for the policy is reached. The values are either True or False.The default is False.
• Retention Warning ThresholdSpecifies the Snapshot copy limit at which a warning is sent to indicate that themaximum retention limit is nearly reached.
Lag Duration
Displays the amount of time that the data on the mirror lags behind the source.
The lag duration should be close to, or equal to, 0 seconds for StrictSync relationships.
Lag Status
Displays the lag status for managed relationships, and for unmanaged relationships thathave a schedule associated with that relationship. Lag status can be:
• ErrorThe lag duration is greater than or equal to the lag error threshold.
• WarningThe lag duration is greater than or equal to the lag warning threshold.
• OKThe lag duration is within normal limits.
• Not ApplicableThe lag status is not applicable for synchronous relationships because a schedule cannotbe configured.
Last Successful Update
Displays the time of the last successful SnapMirror or SnapVault operation.
469Managing and monitoring protection relationships

The last successful update is not applicable for synchronous relationships.
Relationship Type
Displays the relationship type used to replicate a volume. Relationship types include:
• Asynchronous Mirror
• Asynchronous Vault
• Asynchronous MirrorVault
• StrictSync
• Sync
Transfer Status
Displays the transfer status for the protection relationship. The transfer status can be one ofthe following:
• Aborting
SnapMirror transfers are enabled; however, a transfer abort operation that might includeremoval of the checkpoint is in progress.
• Checking
The destination volume is undergoing a diagnostic check and no transfer is in progress.
• Finalizing
SnapMirror transfers are enabled. The volume is currently in the post-transfer phase forincremental SnapVault transfers.
• Idle
Transfers are enabled and no transfer is in progress.
• In-Sync
The data in the two volumes in the synchronous relationship are synchronized.
• Out-of-Sync
The data in the destination volume is not synchronized with the source volume.
• Preparing
SnapMirror transfers are enabled. The volume is currently in the pre-transfer phase forincremental SnapVault transfers.
• Queued
SnapMirror transfers are enabled. No transfers are in progress.
• Quiesced
SnapMirror transfers are disabled. No transfer is in progress.
• Quiescing
A SnapMirror transfer is in progress. Additional transfers are disabled.
• Transferring
SnapMirror transfers are enabled and a transfer is in progress.
• Transitioning
The asynchronous transfer of data from the source to the destination volume iscomplete, and the transition to synchronous operation has started.
• Waiting
A SnapMirror transfer has been initiated, but some associated tasks are waiting to bequeued.
Last Transfer Duration
Displays the time taken for the last data transfer to complete.
The transfer duration is not applicable for StrictSync relationships because the transfershould be simultaneous.
470Managing and monitoring protection relationships

Last Transfer Size
Displays the size, in bytes, of the last data transfer.
The transfer size is not applicable for StrictSync relationships.
State
Displays the state of the SnapMirror or SnapVault relationship. The state can beUninitialized, SnapMirrored, or Broken-Off. If a source volume is selected, the relationshipstate is not applicable and is not displayed.
Relationship Health
Displays the relationship heath of the cluster.
Unhealthy Reason
The reason the relationship is in an unhealthy state.
Transfer Priority
Displays the priority at which a transfer runs. The transfer priority is Normal or Low.Normal priority transfers are scheduled before low priority transfers.
The transfer priority is not applicable for synchronous relationships because all transfers aretreated with the same priority.
Schedule
Displays the name of the protection schedule assigned to the relationship.
The schedule is not applicable for synchronous relationships.
Version Flexible Replication
Displays either Yes, Yes with backup option, or None.
Source Cluster
Displays the FQDN, short name, or IP address of the source cluster for the SnapMirrorrelationship.
Source Cluster FQDN
Displays the name of the source cluster for the SnapMirror relationship.
Source Node
Displays the name of the source node for the SnapMirror relationship.
Destination Node
Displays the name of the destination node for the SnapMirror relationship.
Destination Cluster
Displays the name of the destination cluster for the SnapMirror relationship.
Destination Cluster FQDN
Displays the FQDN, short name, or IP address of the destination cluster for the SnapMirrorrelationship.
Relationship: Last 1 month Transfer Status viewThe Relationship: Last 1 month Transfer Status view enables you to analyze the volume transfertrends over a period of time for volumes in asynchronous relationships. This page also displayswhether the volume transfer was a success or a failure.
The controls along the top of the page enable you to select a particular view (for health,performance, capacity, and so on), perform searches to locate specific objects, create and applyfilters to narrow the list of displayed data, add/remove/reorder columns on the page, and export the
471Managing and monitoring protection relationships

data on the page to a .csv, .pdf, or .xlsx file. After you have customized the page, you cansave the results as a custom view and then schedule a report of this data to be generated andemailed on a regular basis.
Source Volume
Displays the source volume name.
Destination Volume
Displays the destination volume name.
Operation Type
Displays the type of volume transfer.
Operation Result
Displays whether volume transfer was successful.
Transfer Start Time
Displays the volume transfer start time.
Transfer End Time
Displays the volume transfer end time.
Transfer Duration
Displays the time taken (in hours) to complete the volume transfer.
Transfer Size
Displays the size (in MB) of the transferred volume.
Source SVM
Displays the storage virtual machine (SVM) name.
Source Cluster
Displays the source cluster name.
Destination SVM
Displays the destination SVM name.
Destination Cluster
Displays the destination cluster name.
Relationship: Last 1 month Transfer Rate viewThe Relationship: Last 1 month Transfer Rate view enables you to analyze the amount of datavolume that is transferred on a day-to-day basis for volumes in asynchronous relationships. Thispage also provides details about daily volume transfers and the time required to complete thetransfer operation.
The controls along the top of the page enable you to select a particular view (for health,performance, capacity, and so on), perform searches to locate specific objects, create and applyfilters to narrow the list of displayed data, add/remove/reorder columns on the page, and export thedata on the page to a .csv, .pdf, or .xlsx file. After you have customized the page, you cansave the results as a custom view and then schedule a report of this data to be generated andemailed on a regular basis.
Total Transfer Size
Displays the total size of the volume transfer in gigabytes.
Day
Displays the day on which the volume transfer was initiated.
472Managing and monitoring protection relationships

End Time
Displays the volume transfer end time with date.
473Managing and monitoring protection relationships

Executing protection workflows using OnCommandWorkflow Automation
You can integrate OnCommand Workflow Automation with Unified Manager to executeworkflows for monitoring and managing protection relationships.
Configuring a connection between Workflow Automation and Unified ManagerYou can configure a secure connection between OnCommand Workflow Automation (WFA) andUnified Manager. Connecting to Workflow Automation enables you to use protection featuressuch as SnapMirror and SnapVault configuration workflows, as well as commands for managingSnapMirror relationships.
Before you begin
• The installed version of Workflow Automation must be 5.1 or greater.
Note: The "WFA pack for managing Clustered Data ONTAP" is included in WFA 5.1 sothere is no need to download this pack from the NetApp Storage Automation Store andinstall it separately onto your WFA server as was required in the past.
WFA pack for managing ONTAP
• You must have the name of the database user that you created in Unified Manager to supportWFA and Unified Manager connections.
This database user must have been assigned the Integration Schema user role.
• You must be assigned either the Administrator role or the Architect role in WorkflowAutomation.
• You must have the host address, port number 443, user name, and password for the WorkflowAutomation setup.
• You must have the Application Administrator or Storage Administrator role.
Steps
1. In the left navigation pane, click General > Workflow Automation.
2. In the Database User area of the Workflow Automation page, select the name, and enter thepassword for the database user that you created to support Unified Manager and WorkflowAutomation connections.
3. In the Workflow Automation Credentials area of the page, enter the host name or IP address(IPv4 or IPv6), and the user name and password for the Workflow Automation setup.
You must use the Unified Manager server port (port 443).
4. Click Save.
5. If you use a self-signed certificate, click Yes to authorize the security certificate.The Workflow Automation page displays.
6. Click Yes to reload the web UI, and add the Workflow Automation features.
Related tasksAdding users on page 625
You can add local users or database users by using the Users page. You can also add remote usersor groups that belong to an authentication server. You can assign roles to these users and, based on
474Executing protection workflows using OnCommand Workflow Automation

the privileges of the roles, users can manage the storage objects and data with Unified Manager, orview the data in a database.
Related referenceWorkflow Automation page on page 475
The Workflow Automation page enables you to configure the settings to integrate OnCommandWorkflow Automation with Unified Manager. You can also add, modify, or delete the settings.
Related informationNetApp Documentation: OnCommand Workflow Automation (current releases)
Removing OnCommand Workflow Automation setup from Unified ManagerYou can remove the OnCommand Workflow Automation setup from Unified Manager when youno longer want to use Workflow Automation.
Before you begin
You must have the Application Administrator or Storage Administrator role.
Steps
1. In the left navigation pane, click General > Workflow Automation in the left Setup menu.
2. In the Workflow Automation page, click Remove Setup.
Related referenceWorkflow Automation page on page 475
The Workflow Automation page enables you to configure the settings to integrate OnCommandWorkflow Automation with Unified Manager. You can also add, modify, or delete the settings.
What happens when OnCommand Workflow Automation is reinstalled orupgraded
Before reinstalling or upgrading OnCommand Workflow Automation, you must first remove theconnection between OnCommand Workflow Automation and Unified Manager, and ensure that allOnCommand Workflow Automation currently running or scheduled jobs are stopped.
You must also manually delete Unified Manager from OnCommand Workflow Automation.
After you reinstall or upgrade OnCommand Workflow Automation, you must set up theconnection with Unified Manager again.
Description of OnCommand Workflow Automation setup windows and dialogboxes
You can set up OnCommand Workflow Automation in Unified Manager by using the WorkflowAutomation page.
Workflow Automation pageThe Workflow Automation page enables you to configure the settings to integrate OnCommandWorkflow Automation with Unified Manager. You can also add, modify, or delete the settings.
You must have the Application Administrator or Storage Administrator role.
Unified Manager Database User
This area enables you to enter the credentials of a database user that is required for pairing UnifiedManager with Workflow Automation:
475Executing protection workflows using OnCommand Workflow Automation

Name
Enables you to specify the user name of a database user that can be used to access data inthe Unified Manager database. By default, no database user is selected. You can select adatabase user from the drop-down list.
Password
Enables you to specify a password for the specified user name.
OnCommand Workflow Automation Credentials
This area enables you to enter the credentials of a Workflow Automation account that is requiredfor pairing with Unified Manager:
Hostname or IP Address
Specifies the name or IP address of the Workflow Automation host server, which is used topair with Unified Manager.
Port
Displays the required the port number of the Workflow Automation host server, which is443.
Username
Enables you to specify a user name that can be used to log in to Workflow Automation.
Password
Enables you to specify a password for the specified user name.
Command buttons
The command buttons enable you to remove, save, or cancel the setup options:
Remove Setup
Removes the Workflow Automation setup from Unified Manager.
Save
Saves the configuration settings for the selected option.
Related tasksConfiguring a connection between Workflow Automation and Unified Manager on page 474
You can configure a secure connection between OnCommand Workflow Automation (WFA) andUnified Manager. Connecting to Workflow Automation enables you to use protection featuressuch as SnapMirror and SnapVault configuration workflows, as well as commands for managingSnapMirror relationships.
Removing OnCommand Workflow Automation setup from Unified Manager on page 475You can remove the OnCommand Workflow Automation setup from Unified Manager when youno longer want to use Workflow Automation.
476Executing protection workflows using OnCommand Workflow Automation

Managing performance using performance capacity andavailable IOPS information
Performance capacity indicates how much throughput you can get out of a resource withoutsurpassing the useful performance of that resource. When viewed using existing performancecounters, performance capacity is the point at which you get the maximum utilization from a nodeor aggregate before latency becomes an issue.
Unified Manager collects performance capacity statistics from nodes and aggregates in eachcluster. Performance capacity used is the percentage of performance capacity that is currentlybeing used, and performance capacity free is the percentage of performance capacity that is stillavailable.
While performance capacity free provides a percentage of the resource that is still available,available IOPS tells you the number of IOPS that can be added to the resource before reaching themaximum performance capacity. By using this metric, you can be sure that you can add workloadsof a predetermined number of IOPS to a resource.
Monitoring the performance capacity information has the following benefits:
• Assists with workflow provisioning and balancing.
• Helps you prevent overloading a node or pushing its resources beyond the optimal point, thusreducing the need to troubleshoot.
• Helps you determine with greater precision where additional storage equipment might beneeded.
What performance capacity used isThe performance capacity used counter helps you to identify whether the performance of a node oran aggregate is reaching a point where the performance might degrade if the workloads increase. Itcan also show you if a node or aggregate is currently being overused during specific periods oftime. Performance capacity used is similar to utilization, but the former provides more insightabout the available performance capabilities in a physical resource for a specific workload.
The optimal used performance capacity is the point at which a node or an aggregate has optimalutilization and latency (response time), and is being used efficiently. A sample latency versusutilization curve is shown for an aggregate in the following figure.
In this example, the operational point identifies that the aggregate is currently operating at 50%utilization with latency of 1.0 ms/op. Based on the statistics captured from the aggregate, Unified
477Managing performance using performance capacity and available IOPS information

Manager determines that additional performance capacity is available for this aggregate. In thisexample, the optimal point is identified as the point when the aggregate is at 80% utilization withlatency of 2.0 ms/op. Therefore, you can add more volumes and LUNs to this aggregate so thatyour systems are used more efficiently.
The performance capacity used counter is expected to be a larger number than the "utilization"counter because performance capacity adds in the impact on latency. For example, if a node oraggregate is 70% used, the performance capacity value may be in the 80% to 100% range,depending on the latency value.
In some cases, however, the utilization counter may be higher on the Dashboard page. This isnormal because the dashboard refreshes the current counter values at each collection period; itdoes not display averages over a period of time like the other pages in the Unified Manager userinterface. The performance capacity used counter is best used as an indicator of performanceaveraged over a period of time, whereas the utilization counter is best used for determining theinstantaneous usage of a resource.
What the performance capacity used value meansThe performance capacity used value helps you identify the nodes and aggregates that arecurrently being overutilized or underutilized. This enables you to redistribute workloads in orderto make your storage resources more efficient.
The following figure shows the latency versus utilization curve for a resource and identifies, withcolored dots, three areas where the current operational point could be located.
• A performance capacity used percentage equal to 100 is at the optimal point.
Resources are being used efficiently at this point.
• A performance capacity used percentage above 100 indicates that the node or aggregate isoverutilized, and that workloads are receiving sub-optimal performance.
No new workloads should be added to the resource, and the existing workloads may need to beredistributed.
• A performance capacity used percentage below 100 indicates that the node or aggregate isunderutilized, and that resources are not being used effectively.
More workloads can be added to the resource.
Note: Unlike utilization, the performance capacity used percentage can be above 100%. Thereis no maximum percentage, but resources will typically be in the 110% to 140% range whenthey are being overutilized. Higher percentages would indicate a resource with serious issues.
What available IOPS isThe available IOPS counter identifies the remaining number of IOPS that can be added to a nodeor an aggregate before the resource reaches its limit. The total IOPS that a node can provide is
478Managing performance using performance capacity and available IOPS information

based on the physical characteristics of the node—for example, the number of CPUs, the CPUspeed, and the amount of RAM. The total IOPS that an aggregate can provide is based on thephysical properties of the disks—for example, a SATA, SAS, or SSD disk.
While the performance capacity free counter provides the percentage of a resource that is stillavailable, the available IOPS counter tells you the exact number of IOPS (workloads) can be addedto a resource before reaching the maximum performance capacity.
For example, if you are using a pair of FAS2520 and FAS8060 storage systems, a performancecapacity free value of 30% means that you have some free performance capacity. However, thatvalue does not provide visibility into how many more workloads you can deploy to those nodes.The available IOPS counter may show that you have 500 available IOPS on the FAS8060, but only100 available IOPS on the FAS2520.
A sample latency versus IOPS curve for a node is shown in the following figure.
The maximum number of IOPS that a resource can provide is the number of IOPS when theperformance capacity used counter is at 100% (the optimal point). The operational point identifiesthat the node is currently operating at 100K IOPS with latency of 1.0 ms/op. Based on thestatistics captured from the node, Unified Manager determines that the maximum IOPS for thenode is 160K, which means that there are 60K free or available IOPS. Therefore, you can addmore workloads to this node so that your systems are used more efficiently.
Note: When there is minimal user activity in the resource, the available IOPS value is calculatedassuming a generic workload based on approximately 4,500 IOPS per CPU core. This isbecause Unified Manager lacks the data to accurately estimate the characteristics of theworkload being served.
Viewing node and aggregate performance capacity used valuesYou can monitor the performance capacity used values for all nodes or for all aggregates in acluster, or you can view details for a single node or aggregate.
Performance capacity used values appear in the Dashboard, Performance Inventory pages, TopPerformers page, Create Threshold Policy page, Performance Explorer pages, and in detail charts.For example, the Performance: All Aggregates page provides a column Performance CapacityUsed to view the performance capacity used value for all aggregates.
479Managing performance using performance capacity and available IOPS information

Monitoring the performance capacity used counter enables you to identify the following:
• Whether any nodes or aggregates on any clusters have a high performance capacity used value
• Whether any nodes or aggregates on any clusters have active performance capacity used events
• The nodes and aggregates that have the highest and lowest performance capacity used value ina cluster
• Latency and utilization counter values in conjunction with nodes or aggregates that have highperformance capacity used values
• How the performance capacity used values for nodes in an HA pair will be affected if one ofthe nodes fails
• The busiest volumes and LUNs on an aggregate that has a high performance capacity usedvalue
Viewing node and aggregate available IOPS valuesYou can monitor the available IOPS values for all nodes or for all aggregates in a cluster, or youcan view details for a single node or aggregate.
Available IOPS values appear in the Performance Inventory pages and in the PerformanceExplorer page charts for nodes and aggregates. For example, when viewing a node in the Node/Performance Explorer page, you can select the "Available IOPS" counter chart from the list so youcan compare the available IOPS values for the node and multiple aggregates on that node.
480Managing performance using performance capacity and available IOPS information

Monitoring the available IOPS counter enables you to identify:
• The nodes or aggregates that have the greatest available IOPS values to help determine wherefuture workloads can be deployed.
• The nodes or aggregates that have the smallest available IOPS values to identify the resourcesyou should monitor for potential future performance issues.
• The busiest volumes and LUNs on an aggregate that has a small available IOPS value.
Viewing performance capacity counter charts to identify issuesYou can view performance capacity used charts for nodes and aggregates on the PerformanceExplorer page. This enables you to view detailed performance capacity data for the selected nodesand aggregates for a specific timeframe.
About this task
The standard counter chart displays the performance capacity used values for the selected nodes oraggregates. The Breakdown counter chart displays the total performance capacity values for theroot object separated into usage based on user protocols versus background system processes.Additionally, the amount of free performance capacity is also shown.
Note: Because some background activities associated with system and data management areidentified as user workloads and categorized as user protocols, the user protocols percentagemay appear artificially high when those processes run. These processes typically run aroundmidnight when cluster usage is low. If you see a spike in user protocol activity around midnight,verify if cluster backup jobs or other background activities are configured to run at that time.
Steps
1. Select the Explorer tab from a node or aggregate Landing page.
2. In the Counter Charts pane, click Choose charts, and then select the Perf. Capacity Usedchart.
3. Scroll down until you can view the chart.
481Managing performance using performance capacity and available IOPS information

The colors of the standard chart show when the object is in the optimal range (yellow), whenthe object is underutilized (green), and when the object is overutilized (red). The Breakdownchart shows detailed performance capacity details for the root object only.
4. If you want to view either chart in a full size format, click Zoom View.
In this manner you can open multiple counter charts in a separate windows to compareperformance capacity used values with IOPS or MBps values over the same timeframe.
Performance capacity used performance threshold conditionsYou can create user-defined performance threshold policies so that events are triggered when theperformance capacity used value for a node or aggregate exceeds the defined performance capacityused threshold setting.
Additionally, nodes can be configured with a "Performance capacity used takeover" thresholdpolicy. This threshold policy totals the performance capacity used statistics for both nodes in anHA pair to determine whether either node would lack sufficient capacity if the other node fails.Because the workload during failover is the combination of the two partner nodes’ workloads, thesame performance capacity used takeover policy can be applied to both nodes.
Note: This performance capacity used equivalency is generally true between nodes. However, ifthere is significantly more cross-node traffic destined for one of the nodes through its failoverpartner, the total performance capacity used when running all workloads on one partner nodeversus the other partner node could be slightly different depending on which node has failed.
The performance capacity used conditions can also be used as secondary performance thresholdsettings to create a combination threshold policy when defining thresholds for LUNs and volumes.The performance capacity used condition is applied to the aggregate or node on which the volume
482Managing performance using performance capacity and available IOPS information

or LUN resides. For example, you can create a combination threshold policy using the followingcriteria:
Storage object Performancecounter
Warning threshold Critical threshold Duration
Volume Latency 15 ms/op 25 ms/op 20 minutes
Aggregate Performance capacityused
80% 95%
Combination threshold policies cause an event to be generated only when both conditions arebreached for the entire duration.
Related tasksCreating user-defined performance threshold policies on page 157
You create performance threshold policies for storage objects so that notifications are sent when aperformance counter exceeds a specific value. The event notification identifies that the cluster isexperiencing a performance issue.
Assigning performance threshold policies to storage objects on page 158You assign a user-defined performance threshold policy to a storage object so that UnifiedManager reports an event if the value of the performance counter exceeds the policy setting.
Related referenceWhat performance counters can be tracked using thresholds on page 154
Some common performance counters, such as IOPS and MB/s, can have thresholds set for allstorage objects. There are other counters that can have thresholds set for only certain storageobjects.
What objects and counters can be used in combination threshold policies on page 156Only some performance counters can be used together in combination policies. When primary andsecondary performance counters are specified, both performance counters must exceed theirmaximum limits before an event is generated.
Using the performance capacity used counter to manage performanceTypically, organizations want to operate with a performance capacity used percentage below 100so that resources are being efficiently used while reserving some additional performance capacityto support peak period demands. You can use threshold policies to customize when alerts are sentfor high performance capacity used values.
You can establish specific goals based on your performance requirements. For example, financialservices firms might reserve more performance capacity to guarantee the timely execution oftrades. These companies might want to set performance capacity used thresholds in the 70-80percent range. Manufacturing companies with smaller margins might choose to reserve lessperformance capacity if they are willing to risk performance to better manage IT costs. Thesecompanies might set performance capacity used thresholds in the 85-95 percent range.
When the performance capacity used value exceeds the percentage set in a user-defined thresholdpolicy, Unified Manager sends an alert email and adds the event to the Event Inventory page. Thisenables you to manage potential problems before they impact performance. These events can alsobe used as indicators that you need to make workload moves and changes within your nodes andaggregates.
483Managing performance using performance capacity and available IOPS information

Monitoring performance using the Performance Inventorypages
The object inventory performance pages display performance information, performance events,and object health for all objects within an object type category. This provides you with an at-a-glance overview of the performance status of each object within a cluster, for example, for allnodes or all volumes.
Object inventory performance pages provide a high-level overview of object status, enabling youto assess the overall performance of all objects and compare object performance data. You canrefine the content of object inventory pages by searching, sorting, and filtering. This is beneficialwhen monitoring and managing object performance, because it enables you to quickly locateobjects with performance issues and to begin the troubleshooting process.
By default, objects on the performance inventory pages are sorted based on object performancecriticality. Objects with new critical performance events are listed first, and objects with warningevents are listed second. This provides an immediate visual indication of issues that must beaddressed. All performance data is based on a 72-hour average.
You can easily navigate from the object inventory performance page to an object details page byclicking the object name in the object name column. For example, on the Performance/All Nodesinventory page, you would click a node object in the Nodes column. The object details pageprovides in-depth information and detail about the selected object, including side-by-sidecomparison of active events.
Object monitoring using the Performance object inventory pagesThe Performance object inventory pages enable you to monitor object performance based on thevalues of specific performance counters or based on performance events. This is beneficialbecause identifying objects with performance events enables you to investigate the cause of clusterperformance issues.
The Performance object inventory pages display the associated counters, associated objects, andperformance threshold policies for all objects in all clusters. These pages also enable you to applyperformance threshold policies to objects. You can sort the page based on any column, filter theresults to reduce the number of returned objects, and you can search across all object names ordata.
You can export data from these pages to a comma-separated values (.csv) file, Microsoft Excelfile (.xlsx), or (.pdf) document by using the Reports button, and then use the exported data tobuild reports. Additionally, you can customize the page and then schedule a report to be createdand emailed on a regular basis by using the Scheduled Reports button.
484Monitoring performance using the Performance Inventory pages

Refining Performance inventory page contentsThe inventory pages for performance objects contain tools to help you refine object inventory datacontent, enabling you to locate specific data quickly and easily.
Information contained within the Performance object inventory pages can be extensive, oftenspanning multiple pages. This kind of comprehensive data is excellent for monitoring, tracking,and improving performance; however, locating specific data requires tools to enable you to quicklylocate the data for which you are looking. Therefore, the Performance object inventory pagescontain functionality for searching, sorting, and filtering. Additionally, searching and filtering canwork together to further narrow your results.
Searching on Object Inventory Performance pagesYou can search strings on Object Inventory Performance pages. Use the Search field located at thetop right of the page to quickly locate data based on either object name or policy name. Thisenables you to quickly locate specific objects and their associated data, or to quickly locatepolicies and view associated policy object data.
Step
Perform one of the following options, based on your search requirements:
To locate this... Type this...
A specific object The object name into the Search field, and click Search.
The object for which you searched and its related data is displayed.
A user-defined performancethreshold policy
All or part of the policy name into the Search field, and click Search.
The objects assigned to the policy for which you searched are displayed.
Sorting on the Object Inventory Performance pagesYou can sort all data on Object Inventory Performance pages by any column in ascending ordescending order. This enables you to quickly locate object inventory data, which is helpful whenexamining performance or beginning a troubleshooting process.
About this task
The selected column for sorting is indicated by a highlighted column heading name and an arrowicon indicating the sorting direction at the right of the name. An up arrow indicates ascendingorder; a down arrow indicates descending order. The default sort order is by Status (eventcriticality) in descending order, with the most critical performance events listed first.
Step
You can click a column name to toggle the sort order of the column in ascending or descendingorder.The Object Inventory Performance page contents are sorted in ascending or descending order,based on the selected column.
Filtering data in the Object Inventory Performance pagesYou can filter data in the Object Inventory Performance pages to quickly locate data based onspecific criteria. You can use filtering to narrow the contents of the Object Inventory Performance
485Monitoring performance using the Performance Inventory pages

pages to show only the results you have specified. This provides a very efficient method ofdisplaying only the performance data in which you are interested.
About this task
You can use the Filtering panel to customize the grid view based on your preferences. Availablefilter options are based on the object type being viewed in the grid. If filters are currently applied,the number of applied filters displays at the right of the Filter button.
Three types of filter parameters are supported.
Parameter Validation
String (text) The operators are contains and starts with.
Number The operators are greater than and less than.
Enum (text) The operators are is and is not.
The Column, Operator, and Value fields are required for each filter; the available filters reflect thefilterable columns on the current page. The maximum number of filters you can apply is four.Filtered results are based on combined filter parameters. Filtered results apply to all pages in yourfiltered search, not just the page currently displayed.
You can add filters using the Filtering panel.
1. At the top of the page, click the Filter button. The Filtering panel displays.
2. Click the left drop-down list and select an object; for example, Cluster, or a performancecounter.
3. Click the center drop-down list, and select the operator you want to use.
4. In the last list, select or enter a value to complete the filter for that object.
5. To add another filter, click +Add Filter. An additional filter field displays. Complete this filterusing the process described in the preceding steps. Note that upon adding your fourth filter, the+Add Filter button no longer displays.
6. Click Apply Filter. The filter options are applied to the grid and the number of filters isdisplayed to the right of the Filter button.
7. Use the Filtering panel to remove individual filters by clicking the trash icon at the right of thefilter to be removed.
8. To remove all filters, click Reset at the bottom of the filtering panel.
Filtering example
The illustration shows the Filtering panel with three filters. The +Add Filter button displays whenyou have fewer than the maximum of four filters.
After clicking Apply Filter, the Filtering panel closes, applies your filters, and shows the number
of filters applied ( ).
486Monitoring performance using the Performance Inventory pages

Understanding the Unified Manager recommendations to tier data to the cloudThe Performance: All Volumes view displays information related to the size of the user data storedon the volume that is inactive (cold). In some cases, Unified Manager identifies certain volumesthat would benefit by tiering the inactive data to the cloud tier (cloud provider or StorageGRID) ofa FabricPool-enabled aggregate.
Important: FabricPool was introduced in ONTAP 9.2, so if you are using a version of ONTAPsoftware prior to 9.2, the Unified Manager recommendation to tier data requires upgrading yourONTAP software. Additionally, the auto tiering policy was introduced in ONTAP 9.4, and theall tiering policy was introduced in ONTAP 9.6, so if the recommendation is to use the autotiering policy, you must upgrade to ONTAP 9.4 or greater.
The following three fields on Performance: All Volumes view provide information about whetheryou can improve your storage system's disk utilization and save space on the performance tier bymoving inactive data to the cloud tier.
Tiering Policy
The tiering policy determines whether the data on the volume remains on the performancetier or whether some of the data is moved from the performance tier to the cloud tier.
The value in this field indicates the tiering policy set on the volume, even if the volumedoes not currently reside on a FabricPool aggregate. The tiering policy takes effect onlywhen the volume is on a FabricPool aggregate.
Cold Data
The cold data displays the size of the user data stored on the volume that is inactive (cold).
A value is displayed here only when using ONTAP 9.4 or greater software because itrequires that the aggregate on which the volume is deployed has the inactive datareporting parameter set to enabled, and that the minimum number of cooling daysthreshold has been met (for volumes that use the snapshot-only or auto tiering policy).Otherwise the value is listed as "N/A".
Cloud Recommendation
After enough information has been captured about the data activity on the volume, UnifiedManager may determine there is no action required, or that you could save space on theperformance tier by tiering inactive data to the cloud tier.
Note: The Cold Data field is updated every 15 minutes, but the Cloud Recommendation field isupdated every 7 days when the cold data analysis is performed on the volume. Therefore, theexact amount of cold data may differ between the fields. The Cloud Recommendation fielddisplays the date when the analysis was run.
When Inactive Data Reporting is enabled, the Cold Data field displays the exact amount ofinactive data. Without the inactive data reporting capability Unified Manager uses performancestatistics to determine if data is inactive on a volume. The amount of inactive data is not displayedin the Cold Data field in this case, but it is displayed when you hover your cursor over the wordTier to view the cloud recommendation.
The cloud recommendations you will see are:
• Learning. Not enough data has been collected to make a recommendation.
• Tier. Analysis has determined that the volume contains inactive (cold) data and that youshould configure the volume to move that data to the cloud tier. In some cases this may requirethat you move the volume to a FabricPool-enabled aggregate first. In other cases where thevolume is already on a FabricPool aggregate, you just have to change the tiering policy.
487Monitoring performance using the Performance Inventory pages

• No Action. Either the volume has very little inactive data, the volume is already set to the"auto" tiering policy on a FabricPool aggregate, or the volume is a data protection volume.This value is also displayed when the volume is offline or when it is being used in aMetroCluster configuration.
To move a volume, or to change the volume tiering policy or the aggregate inactive data reportingsettings, use ONTAP System Manager, the ONTAP CLI commands, or a combination of thesetools.
If you are logged in to Unified Manager with the Application Administrator or StorageAdministrator role, the Configure Volume link is available in the cloud recommendation whenyou hover your cursor over the word Tier. Click this button to open the Volumes page in SystemManager to make the recommended change.
Related conceptsPerformance: All Volumes view on page 496
The Performance: All Volumes view displays an overview of the performance events, counter data,and configuration information for each FlexVol volume and FlexGroup volume that is beingmonitored by an instance of Unified Manager. This enables you to quickly monitor theperformance of your volumes, and to troubleshoot performance issues and threshold events.
Related tasksViewing FabricPool capacity information on page 214
You can view FabricPool capacity information for clusters, aggregates, and volumes on theCapacity and Performance inventory and details pages for these objects. These pages also displayFabricPool mirror information when a mirror tier has been configured.
Related referencePerformance: All Aggregates view on page 492
The Performance: All Aggregates view displays an overview of the performance events, data, andconfiguration information for each aggregate that is monitored by an instance of Unified Manager.This page enables you to monitor the performance of your aggregates, and to troubleshootperformance issues and threshold events.
Descriptions of the Performance inventory pagesYou use the Performance inventory pages to see a summary of performance information abouteach of the available storage objects, such as clusters, aggregates, volumes, and so on. You canlink to the Performance object detail pages to view detailed information for a particular object.
Performance: All Clusters viewThe Performance: All Clusters view displays an overview of the performance events, data, andconfiguration information for each cluster that is monitored by an instance of Unified Manager.This page enables you to monitor the performance of your clusters, and to troubleshootperformance issues and threshold events.
By default, objects in the view pages are sorted based on event criticality. Objects with criticalevents are listed first, and objects with warning events are listed second. This provides animmediate visual indication of issues that must be addressed.
The controls along the top of the page enable you to select a particular view (for health,performance, capacity, and so on), perform searches to locate specific objects, create and applyfilters to narrow the list of displayed data, add/remove/reorder columns on the page, and export thedata on the page to a .csv, .pdf, or .xlsx file. After you have customized the page, you cansave the results as a custom view and then schedule a report of this data to be generated andemailed on a regular basis.
488Monitoring performance using the Performance Inventory pages

You can assign performance threshold policies to, or clear threshold policies from, any object onthe object inventory pages using the Assign Performance Threshold Policy and ClearPerformance Threshold Policy buttons.
See Cluster performance fields for descriptions of all the fields on this page.
Related conceptsRefining Performance inventory page contents on page 485
The inventory pages for performance objects contain tools to help you refine object inventory datacontent, enabling you to locate specific data quickly and easily.
Related tasksAssigning performance threshold policies to storage objects on page 158
You assign a user-defined performance threshold policy to a storage object so that UnifiedManager reports an event if the value of the performance counter exceeds the policy setting.
Removing performance threshold policies from storage objects on page 161You can remove a user-defined performance threshold policy from a storage object when you nolonger want Unified Manager to monitor the value of the performance counter.
Filtering data in the Object Inventory Performance pages on page 485You can filter data in the Object Inventory Performance pages to quickly locate data based onspecific criteria. You can use filtering to narrow the contents of the Object Inventory Performancepages to show only the results you have specified. This provides a very efficient method ofdisplaying only the performance data in which you are interested.
Exporting storage data as reports on page 27You can export storage data in a variety of output formats and then use the exported data to buildreports. For example, if there are 10 critical events that have not been resolved, you can export thedata from the Event Management inventory page to create a report, and then send the report toadmins who can resolve the issues.
Scheduling a report on page 332After you have a view or Excel file that you want to schedule for regular generation anddistribution, you can schedule the report.
Cluster performance fieldsThe following fields are available in the Performance: All Clusters view and can be used in customviews and in reports.
Status
A healthy object with no active events displays a green check mark icon ( ). If theobject has an active event, the event indicator icon identifies the event severity: critical
events are red ( ), error events are orange ( ), and warning events are yellow ( ).
Cluster
The name of the cluster. You can click the cluster name to navigate to that cluster'sperformance details page.
Cluster FQDN
The fully qualified domain name (FQDN) of the cluster.
IOPS
The input/output operations per second on the cluster.
MB/s
The throughput on the cluster, measured in megabytes per second.
489Monitoring performance using the Performance Inventory pages
Free Capacity
The unused storage capacity for this cluster, in gigabytes.
Total Capacity
The total storage capacity for this cluster, in gigabytes.
Node Count
The number of nodes in the cluster. You can click the number to navigate to thePerformance: All Nodes view.
Host Name or IP Address
The host name or IP address (IPv4 or IPv6) of the cluster management LIF.
Serial #
The unique identification number of the cluster.
OS Version
The version of ONTAP software that is installed on the cluster.
Note: If different versions of ONTAP software are installed on the nodes in the cluster,the lowest version number is listed. You can view the ONTAP version that is installed oneach node from the Performance: All Nodes view.
Threshold Policy
The user-defined performance threshold policy, or policies, that are active on this storageobject. You can position your cursor over policy names containing an ellipsis (...) to viewthe full policy name or the list of assigned policy names. The Assign PerformanceThreshold Policy and Clear Performance Threshold Policy buttons remain disabled untilyou select one or more objects by clicking the check boxes located at the far left.
Performance: All Nodes viewThe Performance: All Nodes view displays an overview of the performance events, data, andconfiguration information for each node that is being monitored by an instance of UnifiedManager. This enables you to quickly monitor the performance of your nodes, and to troubleshootperformance issues and threshold events.
By default, objects in the view pages are sorted based on event criticality. Objects with criticalevents are listed first, and objects with warning events are listed second. This provides animmediate visual indication of issues that must be addressed.
The controls along the top of the page enable you to select a particular view (for health,performance, capacity, and so on), perform searches to locate specific objects, create and applyfilters to narrow the list of displayed data, add/remove/reorder columns on the page, and export thedata on the page to a .csv, .pdf, or .xlsx file. After you have customized the page, you cansave the results as a custom view and then schedule a report of this data to be generated andemailed on a regular basis.
The Hardware Inventory Report button is provided when Unified Manager, and the clusters it ismanaging, are installed in a site with no external network connectivity. This button generatesa .csv file that contains a complete list of cluster and node information; such as hardware modelnumbers and serial numbers, disk types and counts, installed licenses, and more. This reportingfunctionality is helpful for contract renewal within secure sites that are not connected to theNetApp Active IQ platform.
You can assign performance threshold policies to, or clear threshold policies from, any object onthe object inventory pages using the Assign Performance Threshold Policy and ClearPerformance Threshold Policy buttons.
490Monitoring performance using the Performance Inventory pages

See Node performance fields for descriptions of all the fields on this page.
Related conceptsRefining Performance inventory page contents on page 485
The inventory pages for performance objects contain tools to help you refine object inventory datacontent, enabling you to locate specific data quickly and easily.
Related tasksAssigning performance threshold policies to storage objects on page 158
You assign a user-defined performance threshold policy to a storage object so that UnifiedManager reports an event if the value of the performance counter exceeds the policy setting.
Removing performance threshold policies from storage objects on page 161You can remove a user-defined performance threshold policy from a storage object when you nolonger want Unified Manager to monitor the value of the performance counter.
Filtering data in the Object Inventory Performance pages on page 485You can filter data in the Object Inventory Performance pages to quickly locate data based onspecific criteria. You can use filtering to narrow the contents of the Object Inventory Performancepages to show only the results you have specified. This provides a very efficient method ofdisplaying only the performance data in which you are interested.
Exporting storage data as reports on page 27You can export storage data in a variety of output formats and then use the exported data to buildreports. For example, if there are 10 critical events that have not been resolved, you can export thedata from the Event Management inventory page to create a report, and then send the report toadmins who can resolve the issues.
Scheduling a report on page 332After you have a view or Excel file that you want to schedule for regular generation anddistribution, you can schedule the report.
Generating a hardware inventory report for contract renewal on page 212You can generate a report that contains a complete list of cluster and node information; such ashardware model numbers and serial numbers, disk types and counts, installed licenses, and more.This report is helpful for contract renewal within secure sites ("dark" sites) that are not connectedto the NetApp Active IQ platform.
Node performance fieldsThe following fields are available in the Performance: All Nodes view and can be used in customviews and in reports.
Status
A healthy object with no active events displays a green check mark icon ( ). If theobject has an active event, the event indicator icon identifies the event severity: critical
events are red ( ), error events are orange ( ), and warning events are yellow ( ).
Node
The name of the node. You can click the node name to navigate to that node's performancedetails page.
Latency
The average response time for all I/O requests on the node, expressed in milliseconds peroperation.
IOPS
The average input/output operations per second on the node.
491Monitoring performance using the Performance Inventory pages

MB/s
The throughput on the node, measured in megabytes per second.
Flash Cache Reads
The percentage of read operations on the node that are satisfied by cache, instead of beingreturned from the disk.
Note: Flash Cache data is displayed only for nodes, and only when a Flash Cachemodule is installed in the node.
Performance Capacity Used
The percentage of performance capacity that is being consumed by the node.
Utilization
Indicates whether the CPU or memory on the node is being overused.
Available IOPS
The number of input/output operations per second that are currently available (free) on thisnode for additional workloads.
Free Capacity
The unused storage capacity of the node, in gigabytes.
Total Capacity
The total storage capacity of the node, in gigabytes.
Cluster
The cluster to which the node belongs. You can click the cluster's name to navigate to thatcluster's details page.
Cluster FQDN
The fully qualified domain name (FQDN) of the cluster.
Threshold Policy
The user-defined performance threshold policy, or policies, that are active on this storageobject. You can position your cursor over policy names containing an ellipsis (...) to viewthe full policy name or the list of assigned policy names. The Assign PerformanceThreshold Policy and Clear Performance Threshold Policy buttons remain disabled untilyou select one or more objects by clicking the check boxes located at the far left.
Performance: All Aggregates viewThe Performance: All Aggregates view displays an overview of the performance events, data, andconfiguration information for each aggregate that is monitored by an instance of Unified Manager.This page enables you to monitor the performance of your aggregates, and to troubleshootperformance issues and threshold events.
By default, objects in the view pages are sorted based on event criticality. Objects with criticalevents are listed first, and objects with warning events are listed second. This provides animmediate visual indication of issues that must be addressed.
The controls along the top of the page enable you to select a particular view (for health,performance, capacity, and so on), perform searches to locate specific objects, create and applyfilters to narrow the list of displayed data, add/remove/reorder columns on the page, and export thedata on the page to a .csv, .pdf, or .xlsx file. After you have customized the page, you cansave the results as a custom view and then schedule a report of this data to be generated andemailed on a regular basis.
492Monitoring performance using the Performance Inventory pages

You can assign performance threshold policies to, or clear threshold policies from, any object onthe object inventory pages using the Assign Performance Threshold Policy and ClearPerformance Threshold Policy buttons.
Note: Root aggregates are not displayed on this page.
See Aggregate performance fields for descriptions of all the fields on this page.
Related conceptsRefining Performance inventory page contents on page 485
The inventory pages for performance objects contain tools to help you refine object inventory datacontent, enabling you to locate specific data quickly and easily.
Related tasksAssigning performance threshold policies to storage objects on page 158
You assign a user-defined performance threshold policy to a storage object so that UnifiedManager reports an event if the value of the performance counter exceeds the policy setting.
Removing performance threshold policies from storage objects on page 161You can remove a user-defined performance threshold policy from a storage object when you nolonger want Unified Manager to monitor the value of the performance counter.
Filtering data in the Object Inventory Performance pages on page 485You can filter data in the Object Inventory Performance pages to quickly locate data based onspecific criteria. You can use filtering to narrow the contents of the Object Inventory Performancepages to show only the results you have specified. This provides a very efficient method ofdisplaying only the performance data in which you are interested.
Exporting storage data as reports on page 27You can export storage data in a variety of output formats and then use the exported data to buildreports. For example, if there are 10 critical events that have not been resolved, you can export thedata from the Event Management inventory page to create a report, and then send the report toadmins who can resolve the issues.
Scheduling a report on page 332After you have a view or Excel file that you want to schedule for regular generation anddistribution, you can schedule the report.
Aggregate performance fieldsThe following fields are available in the Performance: All Aggregates view and can be used incustom views and in reports.
Status
A healthy object with no active events displays a green check mark icon ( ). If theobject has an active event, the event indicator icon identifies the event severity: critical
events are red ( ), error events are orange ( ), and warning events are yellow ( ).
Aggregate
You can click the aggregate name to navigate to that aggregate's performance details page.
Type
The type of aggregate:
• HDD
• Hybrid
Combines HDDs and SSDs, but Flash Pool has not been enabled.
• Hybrid (Flash Pool)
493Monitoring performance using the Performance Inventory pages

Combines HDDs and SSDs, and Flash Pool has been enabled.
• SSD
• SSD (FabricPool)
Combines SSDs and a cloud tier
• HDD (FabricPool)
Combines HDDs and a cloud tier
• VMDisk (SDS)
Virtual disks within a virtual machine
• VMDisk (FabricPool)
Combines virtual disks and a cloud tier
• LUN (FlexArray)
Latency
The average response time for all I/O requests on the aggregate, expressed in millisecondsper operation.
IOPS
The input/output operations per second on the aggregate.
MB/s
The throughput on the aggregate, measured in megabytes per second.
Performance Capacity Used
The percentage of performance capacity that is being used by the aggregate.
Utilization
The percentage of the aggregate's disks that are currently being used.
Available IOPS
The number of input/output operations per second that are currently available (free) on thisaggregate for additional workloads.
Free Capacity
The unused storage capacity for this aggregate, in gigabytes.
Total Capacity
The total storage capacity for this aggregate, in gigabytes.
Inactive Data Reporting
Whether the inactive data reporting capability is enabled or disabled on this aggregate.When enabled, volumes on this aggregate display the amount of cold data in thePerformance: All Volumes view.
The value in this field is "N/A" when the version of ONTAP does not support inactive datareporting.
Cluster
The cluster to which the aggregate belongs. You can click the cluster name to navigate tothat cluster's details page.
Cluster FQDN
The fully qualified domain name (FQDN) of the cluster.
Node
The node to which the aggregate belongs. You can click the node name to navigate to thatnode's details page.
494Monitoring performance using the Performance Inventory pages

Threshold Policy
The user-defined performance threshold policy, or policies, that are active on this storageobject. You can position your cursor over policy names containing an ellipsis (...) to viewthe full policy name or the list of assigned policy names. The Assign PerformanceThreshold Policy and Clear Performance Threshold Policy buttons remain disabled untilyou select one or more objects by clicking the check boxes located at the far left.
Performance: All Storage VMs viewThe Performance: All Storage VMs view displays an overview of the performance events, data,and configuration information for each storage virtual machine (SVM) that is being monitored byan instance of Unified Manager. This enables you to quickly monitor the performance of yourSVMs, and to troubleshoot performance issues and threshold events.
By default, objects in the view pages are sorted based on event criticality. Objects with criticalevents are listed first, and objects with warning events are listed second. This provides animmediate visual indication of issues that must be addressed.
The controls along the top of the page enable you to select a particular view (for health,performance, capacity, and so on), perform searches to locate specific objects, create and applyfilters to narrow the list of displayed data, add/remove/reorder columns on the page, and export thedata on the page to a .csv, .pdf, or .xlsx file. After you have customized the page, you cansave the results as a custom view and then schedule a report of this data to be generated andemailed on a regular basis.
You can assign performance threshold policies to, or clear threshold policies from, any object onthe object inventory pages using the Assign Performance Threshold Policy and ClearPerformance Threshold Policy buttons.
Note: The SVMs that are listed on this page include only Data and Cluster SVMs. UnifiedManager does not use or display Admin or Node SVMs.
See SVM performance fields for descriptions of all the fields on this page.
Related conceptsRefining Performance inventory page contents on page 485
The inventory pages for performance objects contain tools to help you refine object inventory datacontent, enabling you to locate specific data quickly and easily.
Related tasksAssigning performance threshold policies to storage objects on page 158
You assign a user-defined performance threshold policy to a storage object so that UnifiedManager reports an event if the value of the performance counter exceeds the policy setting.
Removing performance threshold policies from storage objects on page 161You can remove a user-defined performance threshold policy from a storage object when you nolonger want Unified Manager to monitor the value of the performance counter.
Filtering data in the Object Inventory Performance pages on page 485You can filter data in the Object Inventory Performance pages to quickly locate data based onspecific criteria. You can use filtering to narrow the contents of the Object Inventory Performancepages to show only the results you have specified. This provides a very efficient method ofdisplaying only the performance data in which you are interested.
Exporting storage data as reports on page 27You can export storage data in a variety of output formats and then use the exported data to buildreports. For example, if there are 10 critical events that have not been resolved, you can export the
495Monitoring performance using the Performance Inventory pages

data from the Event Management inventory page to create a report, and then send the report toadmins who can resolve the issues.
Scheduling a report on page 332After you have a view or Excel file that you want to schedule for regular generation anddistribution, you can schedule the report.
Storage VM performance fieldsThe following fields are available in the Performance: All Storage VMs view and can be used incustom views and in reports.
Status
A healthy object with no active events displays a green check mark icon ( ). If theobject has an active event, the event indicator icon identifies the event severity: critical
events are red ( ), error events are orange ( ), and warning events are yellow ( ).
Storage VM
You can click the SVM name to navigate to that SVM's performance details page.
Latency
The average response time for all I/O requests, expressed in milliseconds per operation.
IOPS
The input/output operations per second for the SVM.
MB/s
The throughput on the SVM, measured in megabytes per second.
Free Capacity
The unused storage capacity of the SVM, in gigabytes.
Total Capacity
The total storage capacity of the SVM, in gigabytes.
Cluster
The cluster to which the SVM belongs. You can click the cluster name to navigate to thatcluster's details page.
Cluster FQDN
The fully qualified domain name (FQDN) of the cluster.
Threshold Policy
The user-defined performance threshold policy, or policies, that are active on this storageobject. You can position your cursor over policy names containing an ellipsis (...) to viewthe full policy name or the list of assigned policy names. The Assign PerformanceThreshold Policy and Clear Performance Threshold Policy buttons remain disabled untilyou select one or more objects by clicking the check boxes located at the far left.
Performance: All Volumes viewThe Performance: All Volumes view displays an overview of the performance events, counter data,and configuration information for each FlexVol volume and FlexGroup volume that is beingmonitored by an instance of Unified Manager. This enables you to quickly monitor theperformance of your volumes, and to troubleshoot performance issues and threshold events.
496Monitoring performance using the Performance Inventory pages

By default, objects in the view pages are sorted based on event criticality. Objects with criticalevents are listed first, and objects with warning events are listed second. This provides animmediate visual indication of issues that must be addressed.
The controls along the top of the page enable you to select a particular view (for health,performance, capacity, and so on), perform searches to locate specific objects, create and applyfilters to narrow the list of displayed data, add/remove/reorder columns on the page, and export thedata on the page to a .csv, .pdf, or .xlsx file. After you have customized the page, you cansave the results as a custom view and then schedule a report of this data to be generated andemailed on a regular basis.
You can assign performance threshold policies to, or clear threshold policies from, any object onthe object inventory pages using the Assign Performance Threshold Policy and ClearPerformance Threshold Policy buttons.
If you want to analyze the latency and throughput of a specific object, click the more icon ,then Analyze Workload and you can view performance and capacity charts on the WorkloadAnalysis page.
Note: For data protection (DP) volumes, only counter values for user-generated traffic aredisplayed.
Note: Root volumes are not displayed on this page.
See Volume performance fields for descriptions of all the fields on this page.
Related conceptsRefining Performance inventory page contents on page 485
The inventory pages for performance objects contain tools to help you refine object inventory datacontent, enabling you to locate specific data quickly and easily.
Understanding the Unified Manager recommendations to tier data to the cloud on page 487The Performance: All Volumes view displays information related to the size of the user data storedon the volume that is inactive (cold). In some cases, Unified Manager identifies certain volumesthat would benefit by tiering the inactive data to the cloud tier (cloud provider or StorageGRID) ofa FabricPool-enabled aggregate.
Types of workloads monitored by Unified Manager on page 584You can use Unified Manager to monitor the performance of two types of workloads: user-definedand system-defined.
Related tasksAssigning performance threshold policies to storage objects on page 158
You assign a user-defined performance threshold policy to a storage object so that UnifiedManager reports an event if the value of the performance counter exceeds the policy setting.
Removing performance threshold policies from storage objects on page 161You can remove a user-defined performance threshold policy from a storage object when you nolonger want Unified Manager to monitor the value of the performance counter.
Filtering data in the Object Inventory Performance pages on page 485You can filter data in the Object Inventory Performance pages to quickly locate data based onspecific criteria. You can use filtering to narrow the contents of the Object Inventory Performancepages to show only the results you have specified. This provides a very efficient method ofdisplaying only the performance data in which you are interested.
Exporting storage data as reports on page 27You can export storage data in a variety of output formats and then use the exported data to buildreports. For example, if there are 10 critical events that have not been resolved, you can export the
497Monitoring performance using the Performance Inventory pages

data from the Event Management inventory page to create a report, and then send the report toadmins who can resolve the issues.
Scheduling a report on page 332After you have a view or Excel file that you want to schedule for regular generation anddistribution, you can schedule the report.
Performance: Volumes in QoS Policy Group viewThe Performance: Volumes in QoS Policy Group view displays an overview of the performanceevents, data, and configuration information for each volume that has a QoS policy assigned to it.This includes traditional QoS policies, adaptive QoS policies, and QoS policies assigned usingperformance service levels (PSLs).
By default, objects in the view pages are sorted based on event criticality. Objects with criticalevents are listed first, and objects with warning events are listed second. This provides animmediate visual indication of issues that must be addressed.
The controls along the top of the page enable you to select a particular view (for health,performance, capacity, and so on), perform searches to locate specific objects, create and applyfilters to narrow the list of displayed data, add/remove/reorder columns on the page, and export thedata on the page to a .csv, .pdf, or .xlsx file. After you have customized the page, you cansave the results as a custom view and then schedule a report of this data to be generated andemailed on a regular basis.
You can assign performance threshold policies to, or clear threshold policies from, any object onthe object inventory pages using the Assign Performance Threshold Policy and ClearPerformance Threshold Policy buttons.
If you want to analyze the latency and throughput of a specific object, click the more icon ,then Analyze Workload and you can view performance and capacity charts on the WorkloadAnalysis page.
See Volume performance fields for descriptions of all the fields on this page.
Related conceptsRefining Performance inventory page contents on page 485
The inventory pages for performance objects contain tools to help you refine object inventory datacontent, enabling you to locate specific data quickly and easily.
Understanding the Unified Manager recommendations to tier data to the cloud on page 487The Performance: All Volumes view displays information related to the size of the user data storedon the volume that is inactive (cold). In some cases, Unified Manager identifies certain volumesthat would benefit by tiering the inactive data to the cloud tier (cloud provider or StorageGRID) ofa FabricPool-enabled aggregate.
Types of workloads monitored by Unified Manager on page 584You can use Unified Manager to monitor the performance of two types of workloads: user-definedand system-defined.
Related tasksAssigning performance threshold policies to storage objects on page 158
You assign a user-defined performance threshold policy to a storage object so that UnifiedManager reports an event if the value of the performance counter exceeds the policy setting.
Removing performance threshold policies from storage objects on page 161You can remove a user-defined performance threshold policy from a storage object when you nolonger want Unified Manager to monitor the value of the performance counter.
Filtering data in the Object Inventory Performance pages on page 485
498Monitoring performance using the Performance Inventory pages
You can filter data in the Object Inventory Performance pages to quickly locate data based onspecific criteria. You can use filtering to narrow the contents of the Object Inventory Performancepages to show only the results you have specified. This provides a very efficient method ofdisplaying only the performance data in which you are interested.
Exporting storage data as reports on page 27You can export storage data in a variety of output formats and then use the exported data to buildreports. For example, if there are 10 critical events that have not been resolved, you can export thedata from the Event Management inventory page to create a report, and then send the report toadmins who can resolve the issues.
Scheduling a report on page 332After you have a view or Excel file that you want to schedule for regular generation anddistribution, you can schedule the report.
Volume performance fieldsThe following fields are available in the Performance: All Volumes view and can be used incustom views and in reports.
Status
A healthy object with no active events displays a green check mark icon ( ). If theobject has an active event, the event indicator icon identifies the event severity: critical
events are red ( ), error events are orange ( ), and warning events are yellow ( ).
Volume
The volume name. You can click the volume name to navigate to the volume's performancedetails page.
Style
The style of volume; either FlexVol or FlexGroup.
Latency
For FlexVol volumes, this is the average response time of the volume for all I/O requests,expressed in milliseconds per operation. For FlexGroup volumes, this is the average latencyof all constituent volumes.
IOPS
For FlexVol volumes, this is the number of input/output operations per second for thevolume. For FlexGroup volumes, this is the sum of IOPS for all constituent volumes.
MB/s
For FlexVol volumes, this is the throughput on the volume, measured in megabytes persecond. For FlexGroup volumes, this is the sum of MB/s for all constituent volumes.
IOPS/TB
The number of input/output operations processed per second based on the total space that isbeing consumed by the workload, in terabytes. This counter measures how muchperformance can be delivered by a given amount of storage capacity.
Free Capacity
The unused storage capacity of the volume, expressed in gigabytes.
Total Capacity
The total storage capacity of the volume, expressed in gigabytes.
499Monitoring performance using the Performance Inventory pages

QoS Policy Group
The name of the QoS Policy Group that is assigned to the volume. You can click the policygroup name to navigate to the QoS details page to learn more about the policy groupsettings.
Tiering Policy
The tiering policy set on the volume. The policy takes affect only when the volume isdeployed on a FabricPool aggregate. The available policies are:
• None. The data for this volume always remains on the performance tier.
• Snapshot Only. Only Snapshot data is moved automatically to the cloud tier. All otherdata remains on the performance tier.
• Backup. On data protection volumes, all transferred user data starts in the cloud tier, butlater client reads can cause hot data to move back to the performance tier.
• Auto. Data on this volume is moved between the performance tier and the cloud tierautomatically when ONTAP determines that the data is "hot" or "cold".
• All. The data for this volume always remains on the cloud tier.
Cold Data
The size of the user data stored on the volume that is inactive (cold).
The value is listed as "N/A" in the following situations:
• When "inactive data reporting" is disabled on the aggregate on which the volumeresides.
• When "inactive data reporting" is enabled, but the minimum number of days forcollecting data has not been reached.
• When using the "backup" tiering policy, or when using a version of ONTAP prior to 9.4(when inactive data reporting is not available).
Cloud Recommendation
Unified Manager runs capacity analysis on each volume to determine if you can improveyour storage system's disk utilization and save space on the performance tier by movinginactive (cold) data to the cloud tier. When the recommendation is "Tier", hover your cursorover the word Tier to view the recommendation. Possible recommendations are:
• Learning. Not enough data has been collected to make a recommendation.
• Tier. Analysis has determined that the volume contains inactive (cold) data and that youshould configure the volume to move that data to the cloud tier.
• No Action. Either the volume has very little inactive data, or the volume is already set tothe "auto" or "all" tiering policy, or the version of ONTAP does not support FabricPool.
If you are logged in to Unified Manager with the Application Administrator or StorageAdministrator role, when you hover your cursor over the word Tier the Configure Volumelink is available to launch System Manager so you can make the recommended change.
Cluster
The cluster to which the volume belongs. You can click the cluster name to navigate to thatcluster's details page.
Cluster FQDN
The fully qualified domain name (FQDN) of the cluster.
Node
The name of the node on which the FlexVol volume resides, or the number of nodes onwhich the FlexGroup volume resides.
500Monitoring performance using the Performance Inventory pages
For FlexVol volumes, you can click the name to display node details in the Node detailspage. For FlexGroup volumes, you can click the number to display the nodes that are usedin the FlexGroup in the Nodes inventory page.
Storage VM
The storage virtual machine (SVM) to which the volume belongs. You can click the SVMname to navigate to that SVM's details page.
Aggregate
The name of the aggregate on which the FlexVol volume resides, or the number ofaggregates on which the FlexGroup volume resides.
For FlexVol volumes, you can click the name to display aggregate details in the Aggregatedetails page. For FlexGroup volumes, you can click the number to display the aggregatesthat are used in the FlexGroup in the Aggregates inventory page.
Disk Types
Displays the type of disk on which the volume resides.
Threshold Policy
The user-defined performance threshold policy, or policies, that are active on this storageobject. You can position your cursor over policy names containing an ellipsis (...) to viewthe full policy name or the list of assigned policy names. The Assign PerformanceThreshold Policy and Clear Performance Threshold Policy buttons remain disabled untilyou select one or more objects by clicking the check boxes located at the far left.
QoS Policy Group
The name of the QoS Policy Group that is assigned to the volume. You can click the policygroup name to navigate to the QoS details page to learn more about the policy groupsettings.
Performance: All LUNs viewThe Performance: All LUNs view displays an overview of the performance events, data, andconfiguration information for each LUN that is being monitored by an instance of UnifiedManager. This enables you to quickly monitor the performance of your LUNs, and to troubleshootperformance issues and threshold events.
By default, objects in the view pages are sorted based on event criticality. Objects with criticalevents are listed first, and objects with warning events are listed second. This provides animmediate visual indication of issues that must be addressed.
The controls along the top of the page enable you to select a particular view (for health,performance, capacity, and so on), perform searches to locate specific objects, create and applyfilters to narrow the list of displayed data, add/remove/reorder columns on the page, and export thedata on the page to a .csv, .pdf, or .xlsx file. After you have customized the page, you cansave the results as a custom view and then schedule a report of this data to be generated andemailed on a regular basis.
You can assign performance threshold policies to, or clear threshold policies from, any object onthe object inventory pages using the Assign Performance Threshold Policy and ClearPerformance Threshold Policy buttons.
If you want to analyze the latency and throughput of a specific object, click the more icon ,then Analyze Workload and you can view performance and capacity charts on the WorkloadAnalysis page.
See LUN performance fields for descriptions of all the fields on this page.
501Monitoring performance using the Performance Inventory pages

Related conceptsRefining Performance inventory page contents on page 485
The inventory pages for performance objects contain tools to help you refine object inventory datacontent, enabling you to locate specific data quickly and easily.
Related tasksAssigning performance threshold policies to storage objects on page 158
You assign a user-defined performance threshold policy to a storage object so that UnifiedManager reports an event if the value of the performance counter exceeds the policy setting.
Removing performance threshold policies from storage objects on page 161You can remove a user-defined performance threshold policy from a storage object when you nolonger want Unified Manager to monitor the value of the performance counter.
Filtering data in the Object Inventory Performance pages on page 485You can filter data in the Object Inventory Performance pages to quickly locate data based onspecific criteria. You can use filtering to narrow the contents of the Object Inventory Performancepages to show only the results you have specified. This provides a very efficient method ofdisplaying only the performance data in which you are interested.
Exporting storage data as reports on page 27You can export storage data in a variety of output formats and then use the exported data to buildreports. For example, if there are 10 critical events that have not been resolved, you can export thedata from the Event Management inventory page to create a report, and then send the report toadmins who can resolve the issues.
Scheduling a report on page 332After you have a view or Excel file that you want to schedule for regular generation anddistribution, you can schedule the report.
Performance: LUNs in QoS Policy Group viewThe Performance: LUNs in QoS Policy Group view displays an overview of the performanceevents, data, and configuration information for each volume that has a QoS policy assigned to it.This includes traditional QoS policies, adaptive QoS policies, and QoS policies assigned byNetApp Service Level Manager (SLM).
By default, objects in the view pages are sorted based on event criticality. Objects with criticalevents are listed first, and objects with warning events are listed second. This provides animmediate visual indication of issues that must be addressed.
The controls along the top of the page enable you to select a particular view (for health,performance, capacity, and so on), perform searches to locate specific objects, create and applyfilters to narrow the list of displayed data, add/remove/reorder columns on the page, and export thedata on the page to a .csv, .pdf, or .xlsx file. After you have customized the page, you cansave the results as a custom view and then schedule a report of this data to be generated andemailed on a regular basis.
You can assign performance threshold policies to, or clear threshold policies from, any object onthe object inventory pages using the Assign Performance Threshold Policy and ClearPerformance Threshold Policy buttons.
If you want to analyze the latency and throughput of a specific object, click the more icon ,then Analyze Workload and you can view performance and capacity charts on the WorkloadAnalysis page.
See LUN performance fields for descriptions of all the fields on this page.
502Monitoring performance using the Performance Inventory pages

Related conceptsRefining Performance inventory page contents on page 485
The inventory pages for performance objects contain tools to help you refine object inventory datacontent, enabling you to locate specific data quickly and easily.
Related tasksAssigning performance threshold policies to storage objects on page 158
You assign a user-defined performance threshold policy to a storage object so that UnifiedManager reports an event if the value of the performance counter exceeds the policy setting.
Removing performance threshold policies from storage objects on page 161You can remove a user-defined performance threshold policy from a storage object when you nolonger want Unified Manager to monitor the value of the performance counter.
Filtering data in the Object Inventory Performance pages on page 485You can filter data in the Object Inventory Performance pages to quickly locate data based onspecific criteria. You can use filtering to narrow the contents of the Object Inventory Performancepages to show only the results you have specified. This provides a very efficient method ofdisplaying only the performance data in which you are interested.
Exporting storage data as reports on page 27You can export storage data in a variety of output formats and then use the exported data to buildreports. For example, if there are 10 critical events that have not been resolved, you can export thedata from the Event Management inventory page to create a report, and then send the report toadmins who can resolve the issues.
Scheduling a report on page 332After you have a view or Excel file that you want to schedule for regular generation anddistribution, you can schedule the report.
LUN performance fieldsThe following fields are available in the Performance: All LUNs view and can be used in customviews and in reports.
Status
A healthy object with no active events displays a green check mark icon ( ). If theobject has an active event, the event indicator icon identifies the event severity: critical
events are red ( ), error events are orange ( ), and warning events are yellow ( ).
LUN
You can click the LUN name to navigate to that LUN's performance details page.
Latency
The average response time for all I/O requests, expressed in milliseconds per operation.
IOPS
The input/output operations per second for the LUN.
MB/s
The throughput on the LUN, measured in megabytes per second.
Free Capacity
The unused storage capacity of the LUN, in gigabytes.
Total Capacity
The total storage capacity of the LUN, in gigabytes.
503Monitoring performance using the Performance Inventory pages

Cluster
The cluster to which the LUN belongs. You can click the cluster name to navigate to thatcluster's details page.
Cluster FQDN
The fully qualified domain name (FQDN) of the cluster.
Node
The node to which the LUN belongs. You can click the node name to navigate to that node'sdetails page.
Storage VM
The storage virtual machine (SVM) to which the LUN belongs. You can click the SVMname to navigate to that SVM's details page.
Aggregate
The aggregate to which the LUN belongs. You can click the aggregate name to navigate tothat aggregate's details page.
Volume
The volume to which the LUN belongs. You can click the volume name to navigate to thatvolume's details page.
Threshold Policy
The user-defined performance threshold policy, or policies, that are active on this storageobject. You can position your cursor over policy names containing an ellipsis (...) to viewthe full policy name or the list of assigned policy names. The Assign PerformanceThreshold Policy and Clear Performance Threshold Policy buttons remain disabled untilyou select one or more objects by clicking the check boxes located at the far left.
QoS Policy Group
The name of the QoS Policy Group that is assigned to the LUN. You can click the policygroup name to navigate to the QoS details page to learn more about the policy groupsettings.
Performance: All NVMe Namespaces viewThe Performance: All NVMe Namespaces view displays an overview of the performance events,data, and configuration information for each NVMe Namespace that is being monitored by aninstance of Unified Manager. This enables you to quickly monitor the performance and health ofyour Namespaces, and to troubleshoot issues and threshold events.
By default, objects in the view pages are sorted based on event criticality. Objects with criticalevents are listed first, and objects with warning events are listed second. This provides animmediate visual indication of issues that must be addressed.
The controls along the top of the page enable you to select a particular view (for health,performance, capacity, and so on), perform searches to locate specific objects, create and applyfilters to narrow the list of displayed data, add/remove/reorder columns on the page, and export thedata on the page to a .csv, .pdf, or .xlsx file. After you have customized the page, you cansave the results as a custom view and then schedule a report of this data to be generated andemailed on a regular basis.
You can assign performance threshold policies to, or clear threshold policies from, any object onthe object inventory pages using the Assign Performance Threshold Policy and ClearPerformance Threshold Policy buttons.
See NVMe Namespace performance fields for descriptions of all the fields on this page.
504Monitoring performance using the Performance Inventory pages
Related conceptsRefining Performance inventory page contents on page 485
The inventory pages for performance objects contain tools to help you refine object inventory datacontent, enabling you to locate specific data quickly and easily.
Related tasksAssigning performance threshold policies to storage objects on page 158
You assign a user-defined performance threshold policy to a storage object so that UnifiedManager reports an event if the value of the performance counter exceeds the policy setting.
Removing performance threshold policies from storage objects on page 161You can remove a user-defined performance threshold policy from a storage object when you nolonger want Unified Manager to monitor the value of the performance counter.
Filtering data in the Object Inventory Performance pages on page 485You can filter data in the Object Inventory Performance pages to quickly locate data based onspecific criteria. You can use filtering to narrow the contents of the Object Inventory Performancepages to show only the results you have specified. This provides a very efficient method ofdisplaying only the performance data in which you are interested.
Exporting storage data as reports on page 27You can export storage data in a variety of output formats and then use the exported data to buildreports. For example, if there are 10 critical events that have not been resolved, you can export thedata from the Event Management inventory page to create a report, and then send the report toadmins who can resolve the issues.
Scheduling a report on page 332After you have a view or Excel file that you want to schedule for regular generation anddistribution, you can schedule the report.
NVMe Namespace performance fieldsThe following fields are available in the Performance: All NVMe Namespaces view and can beused in custom views and in reports.
Subsystem
The subsystem of the Namespace.
Status
A healthy object with no active events displays a green check mark icon ( ). If theobject has an active event, the event indicator icon identifies the event severity: critical
events are red ( ), error events are orange ( ), and warning events are yellow ( ).
Namespace
You can click the Namespace name to navigate to that Namespace's performance detailspage.
State
The current state of the Namespace.
• Offline - Read or write access to the Namespace is not allowed.
• Online - Read and write access to the Namespace is allowed.
• NVFail - The Namespace was automatically taken offline due to an NVRAM failure.
• Space Error - The Namespace has run out of space.
505Monitoring performance using the Performance Inventory pages

Storage VM
The storage virtual machine (SVM) to which the Namespace belongs. You can click theSVM name to navigate to that SVM's details page.
Cluster
The cluster to which the Namespace belongs. You can click the cluster name to navigate tothat cluster's details page.
Cluster FQDN
The fully qualified domain name (FQDN) of the cluster.
Volume
The volume to which the Namespace belongs. You can click the volume name to navigateto that volume's details page.
Total Capacity
The total storage capacity of the Namespace, in gigabytes.
Free Capacity
The unused storage capacity of the Namespace, in gigabytes.
IOPS
The input/output operations per second for the Namespace.
Latency
The average response time for all I/O requests on the Namespace, expressed in millisecondsper operation.
MB/s
The throughput on the Namespace, measured in megabytes per second.
Threshold Policy
The user-defined performance threshold policy, or policies, that are active on this storageobject. You can position your cursor over policy names containing an ellipsis (...) to viewthe full policy name or the list of assigned policy names. The Assign PerformanceThreshold Policy and Clear Performance Threshold Policy buttons remain disabled untilyou select one or more objects by clicking the check boxes located at the far left.
Performance: All Network Interfaces viewThe Performance: All Network Interfaces view displays an overview of the performance events,data, and configuration information for each network interface (LIF) that is being monitored bythis instance of Unified Manager. This page enables you to quickly monitor the performance ofyour interfaces, and to troubleshoot performance issues and threshold events.
By default, objects in the view pages are sorted based on event criticality. Objects with criticalevents are listed first, and objects with warning events are listed second. This provides animmediate visual indication of issues that must be addressed.
The controls along the top of the page enable you to select a particular view (for health,performance, capacity, and so on), perform searches to locate specific objects, create and applyfilters to narrow the list of displayed data, add/remove/reorder columns on the page, and export thedata on the page to a .csv, .pdf, or .xlsx file. After you have customized the page, you cansave the results as a custom view and then schedule a report of this data to be generated andemailed on a regular basis.
You can assign performance threshold policies to, or clear threshold policies from, any object onthe object inventory pages using the Assign Performance Threshold Policy and ClearPerformance Threshold Policy buttons.
506Monitoring performance using the Performance Inventory pages

Note: The interfaces that are listed on this page include Data LIFs, Cluster LIFs, NodeManagement LIFs, and Intercluster LIFs. Unified Manager does not use or display System LIFs.
See Network Interface performance fields for descriptions of all the fields on this page.
Related conceptsRefining Performance inventory page contents on page 485
The inventory pages for performance objects contain tools to help you refine object inventory datacontent, enabling you to locate specific data quickly and easily.
Related tasksAssigning performance threshold policies to storage objects on page 158
You assign a user-defined performance threshold policy to a storage object so that UnifiedManager reports an event if the value of the performance counter exceeds the policy setting.
Removing performance threshold policies from storage objects on page 161You can remove a user-defined performance threshold policy from a storage object when you nolonger want Unified Manager to monitor the value of the performance counter.
Filtering data in the Object Inventory Performance pages on page 485You can filter data in the Object Inventory Performance pages to quickly locate data based onspecific criteria. You can use filtering to narrow the contents of the Object Inventory Performancepages to show only the results you have specified. This provides a very efficient method ofdisplaying only the performance data in which you are interested.
Exporting storage data as reports on page 27You can export storage data in a variety of output formats and then use the exported data to buildreports. For example, if there are 10 critical events that have not been resolved, you can export thedata from the Event Management inventory page to create a report, and then send the report toadmins who can resolve the issues.
Scheduling a report on page 332After you have a view or Excel file that you want to schedule for regular generation anddistribution, you can schedule the report.
Network Interface performance fieldsThe following fields are available in the Performance: All Network Interfaces view and can beused in custom views and in reports.
Status
A healthy object with no active events displays a green check mark icon ( ). If theobject has an active event, the event indicator icon identifies the event severity: critical
events are red ( ), error events are orange ( ), and warning events are yellow ( ).
Network Interface
You can click the network interface (LIF) name to navigate to the performance details pageof that LIF.
Type
The interface type: Network (iSCSI, NFS, CIFS), FCP, or NVMf FC.
Latency
The average response time for all I/O requests, expressed in milliseconds per operation.Latency is not applicable to NFS LIFs and CIFS LIFs, and is displayed as N/A for thesetypes.
507Monitoring performance using the Performance Inventory pages

IOPS
The input/output operations per second. IOPS is not applicable to NFS LIFs and CIFS LIFs,and is displayed as N/A for these types.
MB/s
The throughput on the interface, measured in megabytes per second.
Cluster
The cluster to which the interface belongs. You can click the cluster's name to navigate tothat cluster's details page.
Cluster FQDN
The fully qualified domain name (FQDN) of the cluster.
SVM
The storage virtual machine to which the interface belongs. You can click the SVM name tonavigate to that SVM's details page.
Home Location
The home location for the interface, displayed as node name and port name, separated by acolon (:). If the location is displayed with an ellipsis (...), you can position your cursor overthe location name to view the full location.
Current Location
The current location for the interface, displayed as node name and port name, separated bya colon (:). If the location is displayed with an ellipsis (...), you can position your cursorover the location name to view the full location.
Role
The interface role: Data, Cluster, Node Management, or Intercluster.
Threshold Policy
The user-defined performance threshold policy, or policies, that are active on this storageobject. You can position your cursor over policy names containing an ellipsis (...) to viewthe full policy name or the list of assigned policy names. The Assign PerformanceThreshold Policy and Clear Performance Threshold Policy buttons remain disabled untilyou select one or more objects by clicking the check boxes located at the far left.
Performance: All Ports viewThe Performance: All Ports view displays an overview of the performance events, data, andconfiguration information for each port that is being monitored by an instance of Unified Manager.This enables you to quickly monitor the performance of your ports, and to troubleshootperformance issues and threshold events.
Note: Performance counter values are displayed for physical ports only. Counter values are notdisplayed for VLANs or interface groups.
By default, objects in the view pages are sorted based on event criticality. Objects with criticalevents are listed first, and objects with warning events are listed second. This provides animmediate visual indication of issues that must be addressed.
The controls along the top of the page enable you to select a particular view (for health,performance, capacity, and so on), perform searches to locate specific objects, create and applyfilters to narrow the list of displayed data, add/remove/reorder columns on the page, and export thedata on the page to a .csv, .pdf, or .xlsx file. After you have customized the page, you cansave the results as a custom view and then schedule a report of this data to be generated andemailed on a regular basis.
508Monitoring performance using the Performance Inventory pages
You can assign performance threshold policies to, or clear threshold policies from, any object onthe object inventory pages using the Assign Performance Threshold Policy and ClearPerformance Threshold Policy buttons.
See Port performance fields for descriptions of all the fields on this page.
Related conceptsRefining Performance inventory page contents on page 485
The inventory pages for performance objects contain tools to help you refine object inventory datacontent, enabling you to locate specific data quickly and easily.
Related tasksAssigning performance threshold policies to storage objects on page 158
You assign a user-defined performance threshold policy to a storage object so that UnifiedManager reports an event if the value of the performance counter exceeds the policy setting.
Removing performance threshold policies from storage objects on page 161You can remove a user-defined performance threshold policy from a storage object when you nolonger want Unified Manager to monitor the value of the performance counter.
Filtering data in the Object Inventory Performance pages on page 485You can filter data in the Object Inventory Performance pages to quickly locate data based onspecific criteria. You can use filtering to narrow the contents of the Object Inventory Performancepages to show only the results you have specified. This provides a very efficient method ofdisplaying only the performance data in which you are interested.
Exporting storage data as reports on page 27You can export storage data in a variety of output formats and then use the exported data to buildreports. For example, if there are 10 critical events that have not been resolved, you can export thedata from the Event Management inventory page to create a report, and then send the report toadmins who can resolve the issues.
Scheduling a report on page 332After you have a view or Excel file that you want to schedule for regular generation anddistribution, you can schedule the report.
Port performance fieldsThe following fields are available in the Performance: All Ports view and can be used in customviews and in reports.
Status
A healthy object with no active events displays a green check mark icon ( ). If theobject has an active event, the event indicator icon identifies the event severity: critical
events are red ( ), error events are orange ( ), and warning events are yellow ( ).
Port
You can click the port name to navigate to that port's performance details page.
Type
The port type is either Network or Fibre Channel Protocol (FCP).
MB/s
The throughput on the port, measured in megabytes per second.
Utilization
The percentage of the port's available bandwidth that is currently being used.
509Monitoring performance using the Performance Inventory pages

Cluster
The cluster to which the port belongs. You can click the cluster name to navigate to thatcluster's details page.
Cluster FQDN
The fully qualified domain name (FQDN) of the cluster.
Node
The node to which the port belongs. You can click the node name to navigate to that node'sdetails page.
Speed
The maximum data transfer rate for the port.
Role
The network port function: either Data or Cluster. FCP ports cannot have a role, and the roleis displayed as N/A.
Threshold Policy
The user-defined performance threshold policy, or policies, that are active on this storageobject. You can position your cursor over policy names containing an ellipsis (...) to viewthe full policy name or the list of assigned policy names. The Assign PerformanceThreshold Policy and Clear Performance Threshold Policy buttons remain disabled untilyou select one or more objects by clicking the check boxes located at the far left.
Performance: QoS Policy Groups viewThe QoS Policy Groups view displays the QoS policy groups available on the clusters that UnifiedManager is monitoring. This includes traditional QoS policies, adaptive QoS policies, and QoSpolicies assigned by using Performance Service Levels.
The controls along the top of the page enable you to select a particular view based on the type ofQoS policy you are interested in, perform searches to locate specific objects, create and applyfilters to narrow the list of displayed data, add/remove/reorder columns on the page, and export thedata on the page to a .csv or .pdf file.
After you have customized the page, you can save the results as a custom view and then schedule areport of this data to be generated and emailed on a regular basis.
See QoS Policy Group fields for descriptions of all the fields on this page.
Related conceptsHow storage QoS can control workload throughput on page 570
You can create a Quality of Service (QoS) policy group to control the I/O per second (IOPS) orthroughput (MB/s) limit for the workloads it contains. If the workloads are in a policy group withno set limit, such as the default policy group, or the set limit does not meet your needs, you canincrease the limit or move the workloads to a new or existing policy group that has the desiredlimit.
How different types of QoS policies are displayed in the throughput charts on page 574You can view the ONTAP-defined quality of service (QoS) policy settings that have been appliedto a volume or LUN in the Performance Explorer and Workload Analysis IOPS, IOPS/TB, andMB/s charts. The information displayed in the charts is different depending on the type of QoSpolicy that has been applied to the workload.
Understanding events from adaptive QoS policies that have a defined block size on page 173Adaptive QoS policy groups automatically scale a throughput ceiling or floor based on the volumesize, maintaining the ratio of IOPS to TBs as the size of the volume changes. Starting with
510Monitoring performance using the Performance Inventory pages

ONTAP 9.5 you can specify the block size in the QoS policy to effectively apply a MB/s thresholdat the same time.
Refining Performance inventory page contents on page 485The inventory pages for performance objects contain tools to help you refine object inventory datacontent, enabling you to locate specific data quickly and easily.
Related tasksViewing workload QoS minimum and maximum settings in the Performance Explorer on page575
You can view the ONTAP-defined quality of service (QoS) policy settings on a volume or LUN inthe Performance Explorer charts. A throughput maximum setting limits the impact of competingworkloads on system resources. A throughput minimum setting ensures that a critical workloadmeets minimum throughput targets regardless of demand by competing workloads.
Responding to QoS policy group performance events on page 172Unified Manager generates QoS policy warning events when workload throughput (IOPS,IOPS/TB, or MBps) has exceeded the defined ONTAP QoS policy setting and workload latency isbecoming affected. These system-defined events provide the opportunity to correct potentialperformance issues before many workloads are affected by latency.
Filtering data in the Object Inventory Performance pages on page 485You can filter data in the Object Inventory Performance pages to quickly locate data based onspecific criteria. You can use filtering to narrow the contents of the Object Inventory Performancepages to show only the results you have specified. This provides a very efficient method ofdisplaying only the performance data in which you are interested.
Exporting storage data as reports on page 27You can export storage data in a variety of output formats and then use the exported data to buildreports. For example, if there are 10 critical events that have not been resolved, you can export thedata from the Event Management inventory page to create a report, and then send the report toadmins who can resolve the issues.
Scheduling a report on page 332After you have a view or Excel file that you want to schedule for regular generation anddistribution, you can schedule the report.
QoS Policy Group fieldsThe following fields are available in the Performance: QoS Policy Groups page and can be used incustom views and in reports.
QoS Policy Group
The name of the QoS policy group.
For NetApp Service Level Manager (NSLM) 1.3 policies that have been imported intoUnified Manager 9.7 or greater, the name displayed here includes the SVM name and otherinformation that is not in the name when the Performance Service Levelwas defined inNSLM. For example, the name "NSLM_vs6_Performance_2_0" means this is the NSLMsystem-defined "Performance" PSL policy created on SVM "vs6" with an expected latencyof "2 ms/op".
Cluster
The cluster to which the QoS policy group belongs. You can click the cluster name tonavigate to that cluster's details page.
Cluster FQDN
The fully qualified domain name (FQDN) of the cluster.
511Monitoring performance using the Performance Inventory pages

SVM
The storage virtual machine (SVM) to which the QoS policy group belongs. You can clickthe SVM name to navigate to that SVM's details page.
Note: This field is blank if the QoS policy has been created on the Admin SVM as thisSVM type represents the cluster.
Min Throughput
The minimum throughput, in IOPS, that the policy group will be guaranteed to provide.
For adaptive policies this is the minimum expected IOPS per TB allocated to the volume orLUN, based on the storage object allocated size.
Max Throughput
The throughput, in IOPS and/or MB/s, that the policy group must not exceed. When thisfield is blank it means the max throughout defined in ONTAP is infinite.
For adaptive policies this is the maximum (peak) possible IOPS per TB allocated to thevolume or LUN, based on either the storage object allocated size or the storage object usedsize.
Absolute Minimum IOPS
For adaptive policies this is the absolute minimum IOPS value that is used as an overridewhen the expected IOPS is less than this value.
Block Size
The block size specified for the QoS adaptive policy.
Min Allocation
Whether "allocated space" or "used space" is used to determine the maximum throughput(peak) IOPS.
Expected Latency
The expected average latency for storage input/output operations.
Shared
For traditional QoS policies, whether the throughput values defined in the policy group areshared among multiple objects.
Associated Objects
The number of workloads that are assigned to the QoS policy group.
You can click the expand button ( ) next to the QoS Policy Group Name to view more detailsabout the policy group.
Allocated Capacity
The amount of space that the objects that are in the QoS policy group are currently using.
Associated Objects
The number of workloads that are assigned to the QoS policy group, separated into volumesand LUNs.
You can click the number to navigate to a page that provides more details about the selectedvolumes or LUNs.
Events
If an object, or objects, that are assigned to the QoS policy group have caused a QoS policybreach, the event indicator icon identifies the event severity (critical, error, or warning) anddisplays an error message.
512Monitoring performance using the Performance Inventory pages

You can click the message to navigate to the Events page that is filtered to show the objectsinvolved in the event.
513Monitoring performance using the Performance Inventory pages

Monitoring cluster performance from the PerformanceCluster Landing page
The Performance Cluster Landing page displays the high-level performance status of a selectedcluster that is being monitored by an instance of Unified Manager. This page enables you to assessthe overall performance of a specific cluster, and to quickly note, locate, or assign for resolutionany cluster-specific events that are identified.
Understanding the Performance Cluster Landing pageThe Performance Cluster Landing page provides a high-level performance overview of a selectedcluster, with an emphasis on the performance status of the top 10 objects within the cluster.Performance issues are displayed at the top of the page, in the All Events on this Cluster panel.
The Performance Cluster Landing page provides a high-level overview of each cluster that ismanaged by an instance of Unified Manager. This page provides you with information aboutevents and performance, and enables you to monitor and troubleshoot clusters. The followingimage shows an example of the Performance Cluster Landing page for the cluster called opm-mobility:
The event count on the Cluster Summary page may not match the event count on the PerformanceEvent Inventory page. This is because the Cluster Summary page can show one event each in theLatency and Utilization bars when combination threshold policies have been breached, whereasthe Performance Event Inventory page shows only one event when a combination policy has beenbreached.
Note: If a cluster was removed from being managed by Unified Manager, the status Removedis displayed at the right of the cluster name at the top of the page.
Performance Cluster Landing pageThe Performance Cluster Landing page displays the high-level performance status of a selectedcluster. The page enables you to access complete details of each performance counter for thestorage objects on the selected cluster.
The Performance Cluster Landing page includes four tabs that separate the cluster details into fourareas of information:
• Summary page
514Monitoring cluster performance from the Performance Cluster Landing page

◦ Cluster Events pane
◦ MB/s and IOPS performance charts
◦ Managed Objects pane
• Top Performers page
• Explorer page
• Information page
Related conceptsComponents of the Performance Explorer page on page 538
The Performance Explorer page enables you to compare the performance of similar objects in acluster—for example, all the volumes in a cluster. This is beneficial when troubleshootingperformance events and fine-tuning object performance. You can also compare objects with theroot object, which is the baseline against which other object comparisons are made.
Related referencePerformance Cluster Summary page on page 515
The Performance Cluster Summary page provides a summary of the active events, IOPSperformance, and MB/s performance for a cluster. This page also includes the total count of thestorage objects in the cluster.
Top Performers page on page 517The Top Performers page displays the storage objects that have the highest performance or thelowest performance, based on the performance counter you select. For example, in the StorageVMs category, you can display the SVMs that have the highest IOPS, or the highest latency, or thelowest MB/s. This page also shows if any of the top performers have any active performanceevents (New or Acknowledged).
Cluster/Performance Information page on page 560Use the Cluster/Performance Information page to view a list of the physical and logical attributesof the cluster. This information might help in answering performance-related questions.
Performance Cluster Summary pageThe Performance Cluster Summary page provides a summary of the active events, IOPSperformance, and MB/s performance for a cluster. This page also includes the total count of thestorage objects in the cluster.
Cluster performance events paneThe Cluster performance events pane displays performance statistics and all active events for thecluster. This is most helpful when monitoring your clusters and all cluster-related performance andevents.
All Events on this Cluster pane
The All Events on this Cluster pane displays all active cluster performance events for thepreceding 72 hours. The Total Active Events is displayed at the far left; this number represents thetotal of all New and Acknowledged events for all storage objects in this cluster. You can click theTotal Active Events link to navigate to the Events Inventory page, which is filtered to display theseevents.
The Total Active Events bar graph for the cluster displays the total number of active critical andwarning events:
• Latency (total for nodes, aggregates, SVMs, volumes, LUNs, and namespaces)
• IOPS (total for clusters, nodes, aggregates, SVMs, volumes, LUNs, and namespaces)
• MB/s (total for clusters, nodes, aggregates, SVMs, volumes, LUNs, namespaces, ports, andLIFs)
• Performance Capacity Used (total for nodes and aggregates)
515Monitoring cluster performance from the Performance Cluster Landing page

• Utilization (total for nodes, aggregates, and ports)
• Other (cache miss ratio for volumes)
The list contains active performance events triggered from user-defined threshold policies, system-defined threshold policies, and dynamic thresholds.
Graph data (vertical counter bars) is displayed in red ( ) for critical events, and yellow ( ) forwarning events. Position your cursor over each vertical counter bar to view the actual type andnumber of events. You can click Refresh to update the counter panel data.
You can show or hide critical and warning events in the Total Active Events performance graph byclicking the Critical and Warning icons in the legend. If you hide certain event types, the legendicons are displayed in gray.
Counter panels
The counter panels display cluster activity and performance events for the preceding 72 hours, andincludes the following counters:
IOPS counter panel
IOPS indicates the operating speed of the cluster in number of input/output operations persecond. This counter panel provides a high-level overview of the cluster's IOPS health forthe preceding 72-hour period. You can position your cursor over the graph trend line toview the IOPS value for a specific time.
MB/s counter panel
MB/s indicates how much data has been transferred to and from the cluster in megabytesper second. This counter panel provides a high-level overview of the cluster's MB/s healthfor the preceding 72-hour period. You can position your cursor over the graph trend line toview the MB/s value for a specific time.
The number at the top right of the chart in the gray bar is the average value from the last 72-hourperiod. Numbers shown at the bottom and top of the trend line graph are the minimum andmaximum values for the last 72-hour period. The gray bar below the chart contains the count ofactive (new and acknowledged) events and obsolete events from the last 72-hour period.
The counter panels contain two types of events:
Active
Indicates that the performance event is currently active (new or acknowledged). The issuecausing the event has not corrected itself or has not been resolved. The performance counterfor the storage object remains above the performance threshold.
Obsolete
Indicates that the event is no longer active. The issue causing the event has corrected itselfor has been resolved. The performance counter for the storage object is no longer above theperformance threshold.
For Active Events, if there is one event, you can position your cursor over the event icon and clickthe event number to link to the appropriate Event Details page. If there is more than one event, youcan click View all Events to display the Events Inventory page, which is filtered to show all eventsfor the selected object counter type.
516Monitoring cluster performance from the Performance Cluster Landing page
Managed Objects paneThe Managed Objects pane in the Performance Summary tab provides a top-level overview of thestorage object types and counts for the cluster. This pane enables you to track the status of theobjects in each cluster.
The managed objects count is point-in-time data as of the last collection period. New objects arediscovered at 15-minute intervals.
Clicking the linked number for any object type displays the object performance inventory page forthat object type. The object inventory page is filtered to show only the objects on this cluster.
The managed objects are:
Nodes
A physical system in a cluster.
Aggregates
A set of multiple redundant array of independent disks (RAID) groups that can be managedas a single unit for protection and provisioning.
Ports
A physical connection point on nodes that is used to connect to other devices on a network.
Storage VMs
A virtual machine providing network access through unique network addresses. An SVMmight serve data out of a distinct namespace, and is separately administrable from the restof the cluster.
Volumes
A logical entity holding accessible user data through one or more of the supported accessprotocols. The count includes both FlexVol volumes and FlexGroup volumes; it does notinclude FlexGroup constituents.
LUNs
The identifier of a Fibre Channel (FC) logical unit or an iSCSI logical unit. A logical unittypically corresponds to a storage volume, and is represented within a computer operatingsystem as a device.
Network Interfaces
A logical network interface representing a network access point to a node. The countincludes all interface types.
Top Performers pageThe Top Performers page displays the storage objects that have the highest performance or thelowest performance, based on the performance counter you select. For example, in the StorageVMs category, you can display the SVMs that have the highest IOPS, or the highest latency, or thelowest MB/s. This page also shows if any of the top performers have any active performanceevents (New or Acknowledged).
The Top Performers page displays a maximum of 10 of each object. Note that the Volume objectincludes both FlexVol volumes and FlexGroup volumes.
Time Range
You can select a time range for viewing the top performers; the selected time range appliesto all storage objects. Available time ranges:
• Last Hour
• Last 24 Hours
• Last 72 Hours (default)
517Monitoring cluster performance from the Performance Cluster Landing page

• Last 7 Days
Metric
Click the Metric menu to select a different counter. Counter options are unique to theobject type. For example, available counters for the Volumes object are Latency, IOPS,and MB/s. Changing the counter reloads the panel data with the top performers based onthe selected counter.
Available counters:
• Latency
• IOPS
• MB/s
• Performance Capacity Used (for nodes and aggregates)
• Utilization (for nodes and aggregates)
Sort
Click the Sort menu to select an ascending or descending sort for the selected object andcounter. The options are Highest to lowest and Lowest to highest. These options enableyou to view the objects with the highest performance or the lowest performance.
Counter bar
The counter bar in the graph shows the performance statistics for each object, representedas a bar for that item. The bar graphs are color-coded. If the counter is not breaching aperformance threshold, the counter bar is displayed in blue. If a threshold breach is active (anew or acknowledged event), the bar is displayed in the color for the event: warning events
are displayed in yellow ( ), and critical events are displayed in red ( ). Thresholdbreaches are further indicated by severity event indicator icons for warning and criticalevents.
For each graph, the X axis displays the top performers for the selected object type. The Yaxis displays units applicable to the selected counter. Clicking the object name link beloweach vertical bar graph element navigates to the Performance Landing page for the selectedobject.
Severity Event indicator
The Severity Event indicator icon is displayed at the left of an object name for active
critical ( ) or warning ( ) events in the top performers graphs. Click the SeverityEvent indicator icon to view:
One event
Navigates to the Event details page for that event.
Two or more events
Navigates to the Event inventory page, which is filtered to display all events for theselected object.
518Monitoring cluster performance from the Performance Cluster Landing page

Export button
Creates a .csv file that contains the data that appears in the counter bar. You can choose tocreate the file for the single cluster you are viewing or for all clusters in the data center.
519Monitoring cluster performance from the Performance Cluster Landing page

Monitoring performance using the Performance Explorerpages
The Performance Explorer pages display detailed information about the performance of eachobject in a cluster. The page provides a detailed view into the performance of all cluster objects,enabling you to select and compare the performance data of specific objects across various timeperiods.
You can also assess the overall performance of all objects, and compare object performance data ina side-by-side format.
Understanding the root objectThe root object is the baseline against which other object comparisons are made. This enables youto view and compare the data from other objects to the root object, providing performance dataanalysis that helps you to troubleshoot and improve object performance.
The root object name displays at the top of the Comparing pane. Additional objects display belowthe root object. Although there is no limit to the number of additional objects you can add to theComparing pane, only one root object is allowed. Data for the root object automatically displays inthe graphs in the Counter Charts pane.
You cannot change the root object; it is always set to the object page you are viewing. Forexample, if you open the Volume Performance Explorer page of Volume1, then Volume1 is theroot object and cannot be changed. If you want to compare against a different root object, then youmust click the link for an object and open its landing page.
Note: Events and Thresholds are displayed only for root objects.
Apply filtering to reduce the list of correlated objects in the gridFiltering enables you to display a smaller, more well-defined subset of objects in the grid. Forexample, if you have 25 volumes in the grid, filtering enables you to view only those volumes thathave throughput less than 90 MBps, or latency greater than 1 ms/op.
Related tasksFiltering inventory page content on page 28
You can filter inventory page data in Unified Manager to quickly locate data based on specificcriteria. You can use filtering to narrow the contents of the Unified Manager pages to show onlythe results in which you are interested. This provides a very efficient method of displaying onlythe data in which you are interested.
Specifying a time range for correlated objectsThe Time Range selector on the Performance Explorer page enables you to specify the time rangefor object data comparison. Specifying a time range refines the contents of the PerformanceExplorer pages to show only the object data within the time range you have specified.
About this task
Refining the time range provides an efficient method of displaying only the performance data inwhich you are interested. You can select a predefined time range or specify a custom time range.The default time range is the preceding 72 hours.
520Monitoring performance using the Performance Explorer pages

Selecting a predefined time rangeSelecting a predefined time range is a quick and efficient way for you to customize and focus dataoutput when viewing cluster object performance data. When selecting a predefined time range,data for up to 13 months is available.
Steps
1. At the top right of the Performance Explorer page, click Time Range.
2. From the right side of the Time Range Selection panel, select a predefined time range.
3. Click Apply Range.
Specifying a custom time rangeThe Performance Explorer page enables you to specify the date and time range for yourperformance data. Specifying a custom time range provides greater flexibility than usingpredefined time ranges when refining cluster object data.
About this task
You can select a time range between one hour and 390 days. 13 months equals 390 days becauseeach month is counted as 30 days. Specifying a date and time range provides more detail andenables you to zoom in on specific performance events or series of events. Specifying a time rangealso aids in troubleshooting potential performance issues, as specifying a date and time rangedisplays data surrounding the performance event in finer detail. Use the Time Range control toselect predefined date and time ranges, or specify your own custom date and time range of up to390 days. Buttons for predefined time ranges vary from the Last Hour through the Last 13Months.
Selecting the Last 13 Months option or specifying a custom date range greater than 30 daysdisplays a dialog box alerting you that performance data displayed for a period greater than 30days is charted using hourly averages and not 5-minute data polling. Therefore, a loss of timelinevisual granularity might occur. If you click the Do not show again option in the dialog box, themessage does not appear when you select the Last 13 Months option or specify a custom daterange greater than 30 days. Summary data also applies on a smaller time range, if the time rangeincludes a time/date that is more than 30 days from today.
When selecting a time range (either custom or predefined), time ranges of 30 days or fewer arebased on 5-minute interval data samples. Time ranges greater than 30 days are based on one-hourinterval data samples.
1. Click the Time Range drop-down box and the Time Range panel displays.
2. To select a predefined time range, click one of the Last... buttons at the right of the TimeRange panel. When selecting a predefined time range, data for up to 13 months is available.The predefined time range button you selected is highlighted, and the corresponding days andtime display in the calendars and time selectors.
521Monitoring performance using the Performance Explorer pages

3. To select a custom date range, click the start date in the From calendar on the left. Click < or >to navigate forward or backward in the calendar. To specify the end date, click a date in the Tocalendar on the right. Note that the default end date is today unless you specify a different enddate. The Custom Range button at the right of the Time Range panel is highlighted, indicatingthat you have selected a custom date range.
4. To select a custom time range, click the Time control below the From calendar and select thestart time. To specify the end time, click the Time control below the To calendar on the rightand select the end time. The Custom Range button at the right of the Time Range panel ishighlighted, indicating that you have selected a custom time range.
5. Optionally, you can specify the start and end times when selecting a predefined date range.Select the predefined date range as previously described, then select the start and end times aspreviously described. The selected dates are highlighted in the calendars, your specified startand end times display in the Time controls, and the Custom Range button is highlighted.
6. After selecting the date and time range, click Apply Range. The performance statistics for thattime range display in the charts and in the Events timeline.
Defining the list of correlated objects for comparison graphingYou can define a list of correlated objects for data and performance comparison in the CounterChart pane. For example, if your storage virtual machine (SVM) is experiencing a performanceissue, you can compare all volumes in the SVM to identify which volume might be causing theissue.
About this task
You can add any object in the correlated objects grid to the Comparing and Counter Chart panes.This enables you to view and compare data of multiple objects and with the root object. You canadd and remove objects to and from the correlated objects grid; however, the root object in theComparing pane is not removable.
Note: Adding many objects to the Comparing pane may have a negative impact onperformance. To maintain performance, you should select a limited number of charts for datacomparison.
Steps
1. In the objects grid, locate the object that you want to add, and click the Add button.The Add button turns gray, and the object is added to the additional objects list in theComparing pane. The object's data is added to the graphs in the Counter Charts panes. The
color of the object's eye icon ( ) matches the color of the object's data trend line in thegraphs.
2. Optional: Hide or show data for selected objects:
To do this... Take this action...
Hide a selected object Click the selected object's eye icon ( ) in the Comparing pane.
The object's data is hidden, and the eye icon for that object turns gray.
Show a hidden object Click the gray eye icon of the selected object in the Comparing pane.
The eye icon returns to its original color, and the object data is added back intothe graphs in the Counter Charts pane.
3. Optional: Remove selected objects from the Comparing pane:
522Monitoring performance using the Performance Explorer pages

To do this... Take this action...
Remove a selected object Hover over the selected object's name in the Comparing pane to show theremove object button (X), and then click the button.
The object is removed from the Comparing pane, and its data is cleared from thecounter charts.
Remove all selected objects Click the remove all object's button (X) at the top of the Comparing pane.
All selected objects and their data are removed, leaving only the root object.
Understanding counter chartsCharts in the Counter Charts pane enable you to view and compare performance data for the rootobject and for objects you have added from the correlated objects grid. This can help youunderstand performance trends and isolate and resolve performance issues.
Counter charts displayed by default are Events, Latency, IOPS, and MBps. Optional charts thatyou can choose to display are Utilization, Performance Capacity Used, Available IOPS, IOPS/TB,and Cache Miss Ratio. Additionally, you can choose to view total values or breakdown values forthe Latency, IOPS, MBps, and Performance Capacity Used charts.
The Performance Explorer displays certain counter charts by default; whether the storage objectsupports them all or not. When a counter is not supported, the counter chart is empty and themessage Not applicable for <object> is displayed.
The charts display performance trends for the root object and for all objects you have selected inthe Comparing pane. Data in each chart is arranged as follows:
X axis
Displays the specified time period. If you have not specified a time range, the default is thepreceding 72-hour period.
Y axis
Displays counter units unique to the selected object, or objects.
Trend line colors match the color of the object name as displayed in the Comparing pane. You canposition your cursor over a point on any trend line to view details for time and value for that point.
If you want to investigate a specific period of time within a chart, you can use one of the followingmethods:
• Use the < button to expand the Counter Charts pane to span the width of the page.
• Use the cursor (when it transitions to a magnifying glass) to select a portion of the timeframein the chart to focus and enlarge that area. You can click Reset Chart Zoom to return the chartto the default timeframe.
• Use the Zoom View button to display a large single counter chart that contains expandeddetails and threshold indicators.
Note: Occasionally, gaps in the trend lines display. Gaps mean that either Unified Managerfailed to collect performance data from the storage system or that Unified Manager might havebeen down.
Related tasksSelecting performance charts to display on page 526
523Monitoring performance using the Performance Explorer pages

The Choose charts drop-down list enables you to select the types of performance counter charts todisplay in the Counter Charts pane. This enables you to view specific data and counters, based onyour performance requirements.
Expanding the Counter Charts pane on page 527You can expand the Counter Charts pane so that the charts are larger and more readable.
Changing the Counter Charts focus to a shorter period of time on page 527You can use your mouse to reduce the time range to focus on a specific period of time in theCounter Chart pane or in the Counter Charts Zoom View window. This enables you to see a moregranular and microscopic view of any part of the timeline of performance data, events, andthresholds.
Displaying the Counter Charts Zoom View on page 529The Counter Charts Zoom View provides a finer level of detail for the selected counter chart andits associated timeline. This magnifies the counter chart data, enabling you to have a sharper viewinto performance events and their underlying causes.
Related referenceTypes of performance counter charts on page 524
There are standard performance charts that display the counter values for the selected storageobject. Each of the Breakdown counter charts display the total values separated out into read,write, and other categories. Furthermore, some Breakdown counter charts display additional detailwhen the chart is displayed in Zoom view.
Types of performance counter chartsThere are standard performance charts that display the counter values for the selected storageobject. Each of the Breakdown counter charts display the total values separated out into read,write, and other categories. Furthermore, some Breakdown counter charts display additional detailwhen the chart is displayed in Zoom view.
The following table shows the available performance counter charts.
Available charts Chart description
Events Displays critical, error, warning, and information events in correlation with thestatistical charts for the root object. Health events display in addition toperformance events to provide a complete picture of the reasons performance maybe affected.
Latency - Total Number of milliseconds required to respond to application requests.
Note that the average latency values are I/O weighted.
Latency - Breakdown The same information shown in Latency Total, but with the performance dataseparated into read, write, and other latency.
This chart option applies only when the selected object is an SVM, node, aggregate,volume, LUN, or namespace.
Latency - Cluster Components The same information shown in Latency Total, but with the performance dataseparated into latency by cluster component.
This chart option applies only when the selected object is a volume.
IOPS - Total Number of input/output operations processed per second.
When displayed for a node, selecting "Total" displays the IOPS for data movingthrough this node that may reside on the local or the remote node, and selecting"Total (Local)" displays the IOPS for data that resides only on the current node.
524Monitoring performance using the Performance Explorer pages
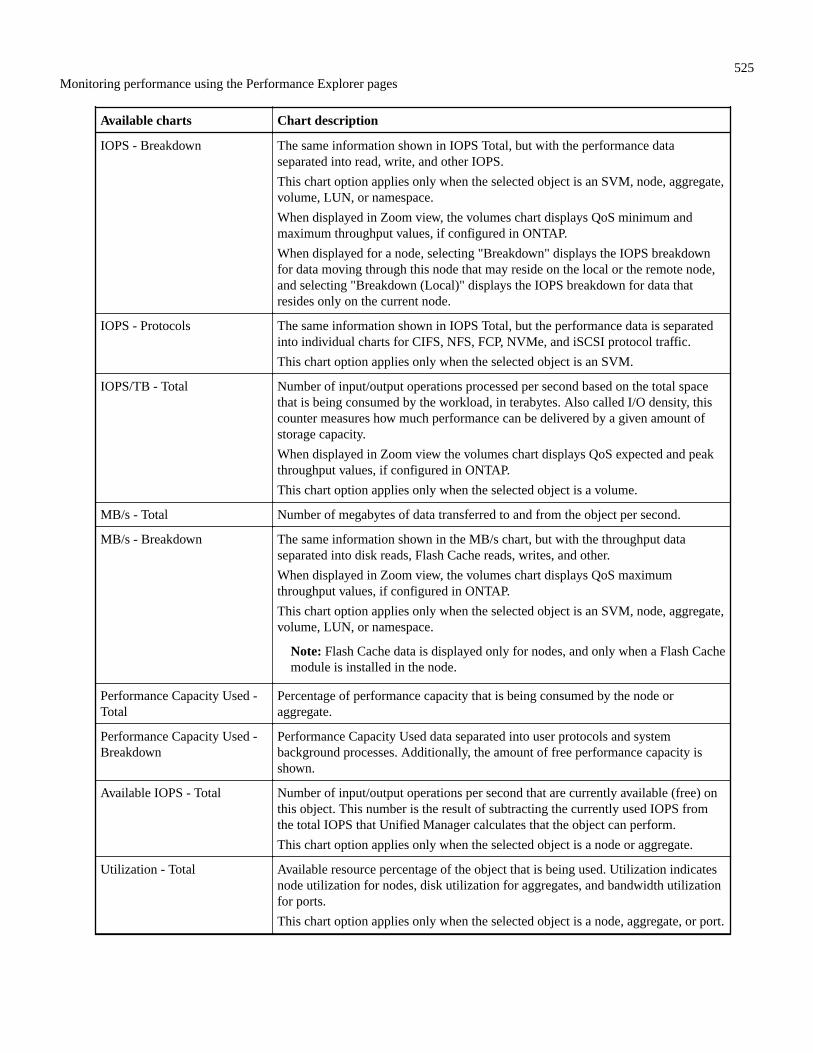
Available charts Chart description
IOPS - Breakdown The same information shown in IOPS Total, but with the performance dataseparated into read, write, and other IOPS.
This chart option applies only when the selected object is an SVM, node, aggregate,volume, LUN, or namespace.
When displayed in Zoom view, the volumes chart displays QoS minimum andmaximum throughput values, if configured in ONTAP.
When displayed for a node, selecting "Breakdown" displays the IOPS breakdownfor data moving through this node that may reside on the local or the remote node,and selecting "Breakdown (Local)" displays the IOPS breakdown for data thatresides only on the current node.
IOPS - Protocols The same information shown in IOPS Total, but the performance data is separatedinto individual charts for CIFS, NFS, FCP, NVMe, and iSCSI protocol traffic.
This chart option applies only when the selected object is an SVM.
IOPS/TB - Total Number of input/output operations processed per second based on the total spacethat is being consumed by the workload, in terabytes. Also called I/O density, thiscounter measures how much performance can be delivered by a given amount ofstorage capacity.
When displayed in Zoom view the volumes chart displays QoS expected and peakthroughput values, if configured in ONTAP.
This chart option applies only when the selected object is a volume.
MB/s - Total Number of megabytes of data transferred to and from the object per second.
MB/s - Breakdown The same information shown in the MB/s chart, but with the throughput dataseparated into disk reads, Flash Cache reads, writes, and other.
When displayed in Zoom view, the volumes chart displays QoS maximumthroughput values, if configured in ONTAP.
This chart option applies only when the selected object is an SVM, node, aggregate,volume, LUN, or namespace.
Note: Flash Cache data is displayed only for nodes, and only when a Flash Cachemodule is installed in the node.
Performance Capacity Used -Total
Percentage of performance capacity that is being consumed by the node oraggregate.
Performance Capacity Used -Breakdown
Performance Capacity Used data separated into user protocols and systembackground processes. Additionally, the amount of free performance capacity isshown.
Available IOPS - Total Number of input/output operations per second that are currently available (free) onthis object. This number is the result of subtracting the currently used IOPS fromthe total IOPS that Unified Manager calculates that the object can perform.
This chart option applies only when the selected object is a node or aggregate.
Utilization - Total Available resource percentage of the object that is being used. Utilization indicatesnode utilization for nodes, disk utilization for aggregates, and bandwidth utilizationfor ports.
This chart option applies only when the selected object is a node, aggregate, or port.
525Monitoring performance using the Performance Explorer pages

Available charts Chart description
Cache Miss Ratio - Total Percentage of read requests from client applications that are returned from the diskinstead of being returned from the cache.
This chart option applies only when the selected object is a volume.
Related tasksSelecting performance charts to display on page 526
The Choose charts drop-down list enables you to select the types of performance counter charts todisplay in the Counter Charts pane. This enables you to view specific data and counters, based onyour performance requirements.
Selecting performance charts to displayThe Choose charts drop-down list enables you to select the types of performance counter charts todisplay in the Counter Charts pane. This enables you to view specific data and counters, based onyour performance requirements.
Steps
1. In the Counter Charts pane, click the Choose charts drop-down list.
2. Add or remove charts:
To... Do this...
Add or remove individual charts Click the check boxes next to the charts you want to show or hide
Add all charts Click Select All
Remove all charts Click Unselect All
Your chart selections are displayed in the Counter Charts pane. Note that as you add charts, thenew charts are inserted into the Counter Charts pane to match the order of the charts listed inthe Choose charts drop-down list. Selecting additional charts might require additionalscrolling.
Related conceptsSources of performance events on page 45
Performance events are issues related to workload performance on a cluster. They help youidentify storage objects with slow response times, also known as high latency. Together with otherhealth events that occurred at the same time, you can determine the issues that might have caused,or contributed to, the slow response times.
Related referenceTypes of performance counter charts on page 524
There are standard performance charts that display the counter values for the selected storageobject. Each of the Breakdown counter charts display the total values separated out into read,write, and other categories. Furthermore, some Breakdown counter charts display additional detailwhen the chart is displayed in Zoom view.
Types of system-defined performance threshold policies on page 46
526Monitoring performance using the Performance Explorer pages

Unified Manager provides some standard threshold policies that monitor cluster performance andgenerate events automatically. These policies are enabled by default, and they generate warning orinformation events when the monitored performance thresholds are breached.
Expanding the Counter Charts paneYou can expand the Counter Charts pane so that the charts are larger and more readable.
About this task
After you have defined the comparison objects and the time range for counters, you can view alarger Counter Charts pane. You use the < button in the middle of the Performance Explorerwindow to expand the pane.
Step
Expand or reduce the Counter Charts pane.
To... Do this...
Expand the Counter Charts pane to fit the width of the page Click the < button
Reduce the Counter Charts pane to the right half of the page Click the > button
Changing the Counter Charts focus to a shorter period of timeYou can use your mouse to reduce the time range to focus on a specific period of time in theCounter Chart pane or in the Counter Charts Zoom View window. This enables you to see a moregranular and microscopic view of any part of the timeline of performance data, events, andthresholds.
Before you begin
The cursor must have changed to a magnifying glass to indicate that this functionality is active.
Note: When using this feature, which alters the timeline to display values that correspond to themore granular display, the time and date range on the Time Range selector does not changefrom the original values for the chart.
Steps
1. To zoom into a specific period of time, click using the magnifying glass and drag the mouse tohighlight the area that you want to see in detail.The counter values for the time period you select fills the counter chart.
2. To return to the original period of time as set in the Time Range selector, click the ResetChart Zoom button.The counter chart displays in its original state.
Viewing event details in the Events TimelineYou can view all events and their related details in the Events Timeline pane of PerformanceExplorer. This is a quick and efficient method of viewing all the health and performance eventsthat occurred on the root object during a specified time range, which can be helpful whentroubleshooting performance issues.
About this task
The Events Timeline pane shows critical, error, warning, and informational events that occurred onthe root object during the selected time range. Each event severity has its own timeline. Single andmultiple events are represented by an event dot on the timeline. You can position your cursor over
527Monitoring performance using the Performance Explorer pages
an event dot to see the event details. To increase the visual granularity of multiple events, you candecrease the time range. This spreads out multiple events into single events, enabling you toseparately view and investigate each event.
Each performance event dot on the Events Timeline lines up vertically with a corresponding spikein the counter charts trend lines that are displayed below the Events Timeline. This provides adirect visual correlation between events and overall performance. Health events are displayed onthe timeline as well, but these types of events do not necessarily line up with a spike in one of theperformance charts.
Steps
1. On the Events Timeline pane, position the cursor over an event dot on a timeline to view asummary of the event or events at that event point.A pop-up dialog displays information about the event types, the date and time when the eventsoccurred, the state, and the event duration.
2. View full event details for one event or multiple events:
To do this... Click this...
View details for a single event View Event Detail in the pop-up dialog.
View details for multiple events View Event Details in the pop-up dialog.
Note: Clicking a single event on the multiple events dialogdisplays the appropriate Event Details page.
Related conceptsSources of performance events on page 45
Performance events are issues related to workload performance on a cluster. They help youidentify storage objects with slow response times, also known as high latency. Together with otherhealth events that occurred at the same time, you can determine the issues that might have caused,or contributed to, the slow response times.
Counter Charts Zoom ViewThe Counter Charts provide a Zoom View that enables you to zoom in on performance details overyour specified time period. This enables you to see performance details and events with muchhigher granularity, which is beneficial when troubleshooting performance issues.
When displayed in Zoom View, some of the breakdown charts provide additional information thanwhat appears when the chart is not in Zoom View. For example, the IOPS, IOPS/TB, and MBpsBreakdown chart Zoom View pages display QoS policy values for volumes and LUNs if they havebeen set in ONTAP.
Note: For system-defined performance threshold policies, only the "Node resources over-utilized" and "QoS throughput limit breached" policies are available from the Policies list. Theother system-defined threshold policies are not available at this time.
Related conceptsUnderstanding counter charts on page 523
528Monitoring performance using the Performance Explorer pages
Charts in the Counter Charts pane enable you to view and compare performance data for the rootobject and for objects you have added from the correlated objects grid. This can help youunderstand performance trends and isolate and resolve performance issues.
Displaying the Counter Charts Zoom ViewThe Counter Charts Zoom View provides a finer level of detail for the selected counter chart andits associated timeline. This magnifies the counter chart data, enabling you to have a sharper viewinto performance events and their underlying causes.
About this task
You can display the Counter Charts Zoom View for any counter chart.
Steps
1. Click Zoom View to open the selected chart a new browser window.
2. If you are viewing a Breakdown chart and then click Zoom View the Breakdown chart isshown in Zoom View. You can select Total while in Zoom View if you want to change theview option.
Specifying the time range in Zoom ViewThe Time Range control in the Counter Charts Zoom View window enables you to specify a dateand time range for the selected chart. This enables you to quickly locate specific data based oneither a preset time range or your own custom time range.
About this task
You can select a time range between one hour and 390 days. 13 months equals 390 days becauseeach month is counted as 30 days. Specifying a date and time range provides more detail andenables you to zoom in on specific performance events or series of events. Specifying a time rangealso aids in troubleshooting potential performance issues, as specifying a date and time rangedisplays data surrounding the performance event in finer detail. Use the Time Range control toselect predefined date and time ranges, or specify your own custom date and time range of up to390 days. Buttons for predefined time ranges vary from the Last Hour through the Last 13Months.
Selecting the Last 13 Months option or specifying a custom date range greater than 30 daysdisplays a dialog box alerting you that performance data displayed for a period greater than 30days is charted using hourly averages and not 5-minute data polling. Therefore, a loss of timelinevisual granularity might occur. If you click the Do not show again option in the dialog box, themessage does not appear when you select the Last 13 Months option or specify a custom daterange greater than 30 days. Summary data also applies on a smaller time range, if the time rangeincludes a time/date that is more than 30 days from today.
When selecting a time range (either custom or predefined), time ranges of 30 days or fewer arebased on 5-minute interval data samples. Time ranges greater than 30 days are based on one-hourinterval data samples.
529Monitoring performance using the Performance Explorer pages

1. Click the Time Range drop-down box and the Time Range panel displays.
2. To select a predefined time range, click one of the Last... buttons at the right of the TimeRange panel. When selecting a predefined time range, data for up to 13 months is available.The predefined time range button you selected is highlighted, and the corresponding days andtime display in the calendars and time selectors.
3. To select a custom date range, click the start date in the From calendar on the left. Click < or >to navigate forward or backward in the calendar. To specify the end date, click a date in the Tocalendar on the right. Note that the default end date is today unless you specify a different enddate. The Custom Range button at the right of the Time Range panel is highlighted, indicatingthat you have selected a custom date range.
4. To select a custom time range, click the Time control below the From calendar and select thestart time. To specify the end time, click the Time control below the To calendar on the rightand select the end time. The Custom Range button at the right of the Time Range panel ishighlighted, indicating that you have selected a custom time range.
5. Optionally, you can specify the start and end times when selecting a predefined date range.Select the predefined date range as previously described, then select the start and end times aspreviously described. The selected dates are highlighted in the calendars, your specified startand end times display in the Time controls, and the Custom Range button is highlighted.
6. After selecting the date and time range, click Apply Range. The performance statistics for thattime range display in the charts and in the Events timeline.
Selecting performance thresholds in Counter Charts Zoom ViewApplying thresholds in the Counter Charts Zoom View provides a detailed view of occurrences ofperformance threshold events. This enables you to apply or remove thresholds, and immediatelyview the results, which can be helpful while deciding whether troubleshooting should be your nextstep.
About this task
Selecting thresholds in the Counter Charts Zoom View enables you to view precise data aboutperformance threshold events. You can apply any threshold that appears under the Policies area ofthe Counter Charts Zoom View.
Only one policy at a time can be applied to the object in the Counter Charts Zoom View.
Step
Select or deselect the that is associated with a policy.The selected threshold is applied to the Counter Charts Zoom View. Critical thresholds aredisplayed as a red line; warning thresholds are displayed as a yellow line.
530Monitoring performance using the Performance Explorer pages

Viewing volume latency by cluster componentYou can view detailed latency information for a volume by using the Volume PerformanceExplorer page. The Latency - Total counter chart shows total latency on the volume, and theLatency - Breakdown counter chart is useful for determining the impact of read and write latencyon the volume.
About this task
Additionally, the Latency - Cluster Components chart shows a detailed comparison of the latencyof each cluster component to help determine how each component contributes to the total latencyon the volume. The following cluster components are displayed:
• Network
• QoS Limit Max
• QoS Limit Min
• Network Processing
• Cluster Interconnect
• Data Processing
• Aggregate Operations
• Volume Activation
• MetroCluster Resources
• Cloud Latency
• Sync SnapMirror
Steps
1. In the Volume Performance Explorer page for your selected volume, from the Latency chart,select Cluster Components from the drop-down menu.The Latency - Cluster Components chart is displayed.
2. To view a larger version of the chart, select Zoom View.
The cluster component comparative chart is displayed. You can restrict the comparison by
deselecting or selecting the that is associated with each cluster component.
3. To view the specific values, move your cursor into the chart area to see the popup window.
Related conceptsCluster components and why they can be in contention on page 600
You can identify cluster performance issues when a cluster component goes into contention. Theperformance of workloads that use the component slow down and their response time (latency) forclient requests increases, which triggers an event in Unified Manager.
Viewing SVM IOPS traffic by protocolYou can view detailed IOPS information for an SVM by using the Performance/SVM Explorerpage. The IOPS - Total counter chart shows total IOPS usage on the SVM, and the IOPS -Breakdown counter chart is useful for determining the impact of read, write, and other IOPS onthe SVM.
About this task
Additionally, the IOPS - Protocols chart shows a detailed comparison of the IOPS traffic for eachprotocol that is being used on the SVM. The following protocols are available:
• CIFS
• NFS
• FCP
531Monitoring performance using the Performance Explorer pages

• iSCSI
• NVMe
Steps
1. In the Performance/SVM Explorer page for your selected SVM, from the IOPS chart, selectProtocols from the drop-down menu.The IOPS - Protocols chart is displayed.
2. To view a larger version of the chart, select Zoom View.
The IOPS advanced protocol comparative chart is displayed. You can restrict the comparison
by deselecting or selecting the that is associated with a protocol.
3. To view the specific values, move your cursor into the chart area of either chart to see thepopup window.
Viewing volume and LUN latency charts to verify performance guaranteeYou can view the volumes and LUNs that you have subscribed to the "Performance Guarantee"program to verify that latency has not exceeded the level you have been guaranteed.
About this task
The latency performance guarantee is a millisecond per operation value that should not beexceeded. It is based on an hourly average, not on the default five minute performance collectionperiod.
Steps
1. In the Performance: All Volumes view or Performance: All LUNs view, select the volume orLUN that you are interested in.
2. In the Performance Explorer page for your selected volume or LUN, choose Hourly Averagefrom the View statistics in selector.The horizontal line in the Latency chart will show a smoother line as the five-minutecollections are replaced with the hourly average.
3. If you have other volumes on the same aggregate that are under the performance guarantee,you can add those volumes to view their latency value in the same chart.
Viewing the performance for All SAN Array clustersYou can use the Performance: All Clusters view to display the performance status of your All SANArray clusters.
Before you begin
You must have the Operator, Application Administrator, or Storage Administrator role.
About this task
You can view overview information for All SAN Array clusters in the Performance: All Clustersview, and details in the Cluster / Performance Explorer page.
Steps
1. In the left navigation pane, click Storage > Clusters.
2. Make sure that the "Personality" column is displayed in the Health: All Clusters view, or addit using the Show / Hide control.This column displays "All SAN Array" for your All SAN Array clusters.
3. To view information about the performance in those clusters, select the Performance: AllClusters view.
532Monitoring performance using the Performance Explorer pages

View the performance information for the All SAN Array cluster.
4. To view detailed information about performance in those clusters, click the name of an AllSAN Array cluster.
5. Click the Explorer tab.
6. On the Cluster / Performance Explorer page, select Nodes on this Cluster from the Viewand Compare menu.You can compare the performance statistics of both nodes on this cluster to make sure the loadis almost identical on both nodes. If there are large discrepancies between the two nodes youcan add the second node to the charts and compare the values over a longer timeframe toidentify any configuration issues.
Viewing node IOPS based on workloads that reside only on the local nodeThe node IOPS counter chart can highlight where operations are only passing through the localnode using a network LIF to perform read/write operations on volumes on a remote node. TheIOPS - "Total (Local)" and "Breakdown (Local)" charts display the IOPS for data that resides inlocal volumes only on the current node.
About this task
The "Local" versions of these counter charts are similar to the node charts for PerformanceCapacity and Utilization because they also show only the statistics for data that resides on localvolumes.
By comparing the "Local" versions of these counter charts to the regular Total versions of thesecounter charts you can see if there is a lot of traffic moving through the local node to accessvolumes on the remote node. This situation could cause performance issues, possibly indicated byhigh utilization on the node, if there are too many operations passing through the local node toreach a volume on a remote node. In these cases you may want to move a volume to the localnode, or to create a LIF on the remote node where traffic from hosts accessing that volume can beconnected.
Steps
1. In the Performance/Node Explorer page for your selected node, from the IOPS chart, selectTotal from the drop-down menu.The IOPS - Total chart is displayed.
2. Click Zoom View to display a larger version of the chart in a new browser tab.
3. Back in the Performance/Node Explorer page, from the IOPS chart, select Total (Local)from the drop-down menu.The IOPS - Total (Local) chart is displayed.
4. Click Zoom View to display a larger version of the chart in a new browser tab.
5. View both of the charts next to each other and identify areas where the IOPS values appear tobe quite different.
6. Move your cursor over these areas to compare the local and total IOPS for a specific point intime.
533Monitoring performance using the Performance Explorer pages

Components of the Object Landing pagesThe Object Landing pages provide details about all critical, warning, and informational events.They provide a detailed view into the performance of all cluster objects, enabling you to select andcompare individual objects across various time periods.
The Object Landing pages enable you to examine the overall performance of all objects, and tocompare object performance data in a side-by-side format. This is beneficial when assessingperformance and when troubleshooting events.
Note: The data displayed in the counter summary panels and in the Counter Charts are based ona five-minute sampling interval. The data displayed in the objects inventory grid in the left sideof the page is based on a one-hour sampling interval.
The following image shows an example of an Object Landing page displaying the Explorerinformation:
Depending on the storage object that is being viewed, the Object Landing page can have thefollowing tabs that provide performance data about the object:
• Summary
Displays three or four counter charts containing the events and performance per object for thepreceding 72-hour period, including a trend line that shows the high and low values during thatperiod.
• Explorer
Displays a grid of storage objects that are related to the current object, which enables you tocompare the performance values of the current object with those of the related objects. This tabincludes up to eleven counter charts and a time range selector, which enable you to perform avariety of comparisons.
• Information
Displays values for non-performance configuration attributes about the storage object,including the installed version of ONTAP software, HA partner name, and number of ports andLIFs.
534Monitoring performance using the Performance Explorer pages

• Top Performers
For clusters: Displays the storage objects that have the highest performance or the lowestperformance, based on the performance counter that you select.
• Failover Planning
For nodes: Displays the estimate of the performance impact on a node if the HA partner of thenode fails.
• Details
For volumes: Displays detailed performance statistics for all I/O activity and operations for theselected volume workload. This tab is available for FlexVol volumes, FlexGroup volumes, andconstituents of FlexGroups.
Related conceptsSources of performance events on page 45
Performance events are issues related to workload performance on a cluster. They help youidentify storage objects with slow response times, also known as high latency. Together with otherhealth events that occurred at the same time, you can determine the issues that might have caused,or contributed to, the slow response times.
Components of the Performance Explorer page on page 538The Performance Explorer page enables you to compare the performance of similar objects in acluster—for example, all the volumes in a cluster. This is beneficial when troubleshootingperformance events and fine-tuning object performance. You can also compare objects with theroot object, which is the baseline against which other object comparisons are made.
Related tasksViewing event details in the Events Timeline on page 527
You can view all events and their related details in the Events Timeline pane of PerformanceExplorer. This is a quick and efficient method of viewing all the health and performance eventsthat occurred on the root object during a specified time range, which can be helpful whentroubleshooting performance issues.
Related referenceSummary page on page 536
The Summary page displays counter charts that contain details about the events and performanceper object for the preceding 72-hour period. This data is not automatically refreshed, but is currentas of the last page load. The charts in the Summary page answer the question Do I need to lookfurther?
Performance Cluster Summary page on page 515The Performance Cluster Summary page provides a summary of the active events, IOPSperformance, and MB/s performance for a cluster. This page also includes the total count of thestorage objects in the cluster.
Top Performers page on page 517The Top Performers page displays the storage objects that have the highest performance or thelowest performance, based on the performance counter you select. For example, in the StorageVMs category, you can display the SVMs that have the highest IOPS, or the highest latency, or thelowest MB/s. This page also shows if any of the top performers have any active performanceevents (New or Acknowledged).
Understanding and using the Node Failover Planning page on page 578
535Monitoring performance using the Performance Explorer pages

The Performance/Node Failover Planning page estimates the performance impact on a node if thenode's high-availability (HA) partner node fails. Unified Manager bases the estimates on thehistorical performance of the nodes in the HA pair.
Summary pageThe Summary page displays counter charts that contain details about the events and performanceper object for the preceding 72-hour period. This data is not automatically refreshed, but is currentas of the last page load. The charts in the Summary page answer the question Do I need to lookfurther?
Charts and counter statistics
The summary charts provide a quick, high-level overview for the last 72-hour period, and help youto identify possible issues that require further investigation.
The Summary page counter statistics are displayed in graphs.
You can position your cursor over the trend line in a graph to view the counter values for aparticular point in time. The summary charts also display the total number of active critical andwarning events for the preceding 72-hour period for the following counters:
Latency
Average response time for all I/O requests; expressed in milliseconds per operation.
Displayed for all object types.
IOPS
Average operating speed; expressed in input/output operations per second.
Displayed for all object types.
MB/s
Average throughput; expressed in megabytes per second.
Displayed for all object types.
Performance Capacity Used
Percentage of performance capacity that is being consumed by a node or aggregate.
Displayed for nodes and aggregates only.
Utilization
Percentage of object utilization for nodes and aggregates, or bandwidth utilization for ports.
Displayed for nodes, aggregates, and ports only.
Positioning the cursor over the event count for Active events shows the type and number of events.
Critical events are displayed in red ( ), and warning events are displayed in yellow ( ).
The number at the top right of the chart in the gray bar is the average value from the last 72-hourperiod. Numbers shown at the bottom and top of the trend line graph are the minimum andmaximum values for the last 72-hour period. The gray bar below the chart contains the count ofactive (new and acknowledged) events and obsolete events from the last 72-hour period.
536Monitoring performance using the Performance Explorer pages

Latency counter chart
The Latency counter chart provides a high-level overview of the object latency for thepreceding 72-hour period. Latency refers to the average response time for all I/O requests;expressed in milliseconds per operation, the service time, wait time, or both experienced bya data packet or block in the cluster storage component under consideration.
Top (counter value): The number in the header displays the average for the preceding 72-hour period.
Middle (performance graph): The number at the bottom of the graph displays the lowestlatency, and the number at the top of the graph displays the highest latency for thepreceding 72-hour period. Position your cursor over the graph trend line to view the latencyvalue for a specific time.
Bottom (events): On hover, the pop-up displays the details of the events. Click the ActiveEvents link below the graph to navigate to the Events Inventory page to view completeevent details.
IOPS counter chart
The IOPS counter chart provides a high-level overview of the object IOPS health for thepreceding 72-hour period. IOPS indicates the speed of the storage system in number ofinput/output operations per second.
Top (counter value): The number in the header displays the average for the preceding 72-hour period.
Middle (performance graph): The number at the bottom of the graph displays the lowestIOPS, and the number at the top of the graph displays the highest IOPS for the preceding72-hour period. Position your cursor over the graph trend line to view the IOPS value for aspecific time.
Bottom (events): On hover, the pop-up displays the details of the events. Click the ActiveEvents link below the graph to navigate to the Events Inventory page to view completeevent details.
MB/s counter chart
The MB/s counter chart displays the object MB/s performance, and indicates how muchdata has been transferred to and from the object in megabytes per second. The MB/scounter chart provides a high-level overview of the object's MB/s health for the preceding72-hour period.
Top (counter value): The number in the header displays the average number of MB/s forthe preceding 72-hour period.
Middle (performance graph): The value at the bottom of the graph displays the lowestnumber of MB/s, and the value at the top of the graph displays the highest number of MB/sfor the preceding 72-hour period. Position your cursor over the graph trend line to view theMB/s value for a specific time.
537Monitoring performance using the Performance Explorer pages

Bottom (events): On hover, the pop-up displays the details of the events. Click the ActiveEvents link below the graph to navigate to the Events Inventory page to view completeevent details.
Performance Capacity Used counter chart
The Performance Capacity Used counter chart displays the percentage of performancecapacity that is being consumed by the object.
Top (counter value): The number in the header displays the average used performancecapacity for the preceding 72-hour period.
Middle (performance graph): The value at the bottom of the graph displays the lowestused performance capacity percentage, and the value at the top of the graph displays thehighest used performance capacity percentage for the preceding 72-hour period. Positionyour cursor over the graph trend line to view the used performance capacity value for aspecific time.
Bottom (events): On hover, the pop-up displays the details of the events. Click the ActiveEvents link below the graph to navigate to the Events Inventory page to view completeevent details.
Utilization counter chart
The Utilization counter chart displays the object utilization percentage. The Utilizationcounter chart provides a high-level overview of the percentage of the object or bandwidthutilization for the preceding 72-hour period.
Top (counter value): The number in the header displays the average utilization percentagefor the preceding 72-hour period.
Middle (performance graph): The value at the bottom of the graph displays the lowestutilization percentage, and the value at the top of the graph displays the highest utilizationpercentage for the preceding 72-hour period. Position your cursor over the graph trend lineto view the utilization value for a specific time.
Bottom (events): On hover, the pop-up displays the details of the events. Click the ActiveEvents link below the graph to navigate to the Events Inventory page to view completeevent details.
Events
The events history table, where applicable, lists the most recent events that occurred on that object.Clicking the event name displays details of the event on the Event Details page.
Components of the Performance Explorer pageThe Performance Explorer page enables you to compare the performance of similar objects in acluster—for example, all the volumes in a cluster. This is beneficial when troubleshootingperformance events and fine-tuning object performance. You can also compare objects with theroot object, which is the baseline against which other object comparisons are made.
You can click the Switch to Health View button to display the Health details page for this object.In some cases you can learn important information about the storage configuration settings for thisobject that may help when troubleshooting an issue.
The Performance Explorer page displays a list of cluster objects and their performance data. Thispage displays all the cluster objects of the same type (for example, volumes and their object-specific performance statistics) in a tabular format. This view provides an efficient overview ofcluster object performance.
Note: If "N/A" appears in any cell of the table, it means that a value for that counter is notavailable because there is no I/O on that object at this time.
538Monitoring performance using the Performance Explorer pages

The Performance Explorer page contains the following components:
Time Range
Enables you to select a time range for the object data.
You can choose a predefined range, or specify your own custom time range.
View and Compare
Enables you to select which type of correlated object is displayed in the grid.
The options available depend on the root object type and its available data. You can clickthe View and Compare drop-down list to select an object type. The object type that youselect is displayed in the list.
Filtering
Enables you to narrow the amount of data you receive, based on your preferences.
You can create filters that apply to the object data—for example, IOPS greater than 4. Youcan add up to four simultaneous filters.
Comparing
Displays a list of the objects that you have selected for comparison with the root object.
Data for the objects in the Comparing pane is displayed in the Counter Charts.
View Statistics In
For volume and LUNs, enables you to select whether the statistics are displayed after eachcollection cycle (default 5 minutes), or whether the statistics are shown as an hourlyaverage. This functionality enables you to view the latency chart in support of the NetApp"Performance Guarantee" program.
Counter Charts
Displays graphed data for each object performance category.
Typically, only three or four charts are displayed by default. The Choose charts componentenables you to display additional charts, or hide specific charts. You can also choose toshow or hide the Events Timeline.
Events Timeline
Displays performance and health events occurring across the timeline that you selected inthe Time Range component.
Related conceptsUnderstanding counter charts on page 523
Charts in the Counter Charts pane enable you to view and compare performance data for the rootobject and for objects you have added from the correlated objects grid. This can help youunderstand performance trends and isolate and resolve performance issues.
Related tasksSelecting a predefined time range on page 521
Selecting a predefined time range is a quick and efficient way for you to customize and focus dataoutput when viewing cluster object performance data. When selecting a predefined time range,data for up to 13 months is available.
Specifying a custom time range on page 521The Performance Explorer page enables you to specify the date and time range for yourperformance data. Specifying a custom time range provides greater flexibility than usingpredefined time ranges when refining cluster object data.
Filtering inventory page content on page 28
539Monitoring performance using the Performance Explorer pages

You can filter inventory page data in Unified Manager to quickly locate data based on specificcriteria. You can use filtering to narrow the contents of the Unified Manager pages to show onlythe results in which you are interested. This provides a very efficient method of displaying onlythe data in which you are interested.
Viewing event details in the Events Timeline on page 527You can view all events and their related details in the Events Timeline pane of PerformanceExplorer. This is a quick and efficient method of viewing all the health and performance eventsthat occurred on the root object during a specified time range, which can be helpful whentroubleshooting performance issues.
Defining the list of correlated objects for comparison graphing on page 522You can define a list of correlated objects for data and performance comparison in the CounterChart pane. For example, if your storage virtual machine (SVM) is experiencing a performanceissue, you can compare all volumes in the SVM to identify which volume might be causing theissue.
Selecting performance charts to display on page 526The Choose charts drop-down list enables you to select the types of performance counter charts todisplay in the Counter Charts pane. This enables you to view specific data and counters, based onyour performance requirements.
Related referenceTypes of performance counter charts on page 524
There are standard performance charts that display the counter values for the selected storageobject. Each of the Breakdown counter charts display the total values separated out into read,write, and other categories. Furthermore, some Breakdown counter charts display additional detailwhen the chart is displayed in Zoom view.
Descriptions of the counter chartsYou use the Performance Explorer counter charts to view and compare performance data forselected storage objects. These charts can help you to understand performance trends and isolateand resolve performance issues.
Latency performance counter chartsThe Latency counter charts display the number of milliseconds that are required for the selectedstorage object to respond to application requests.
The popup window that is displayed when your cursor is in the chart area shows the specificcounter values at specific times.
The bottom of the chart page displays information for the minimum, maximum, average, and 95thpercentile latency for the selected time range.
There are three types of Latency charts available:
Latency - Total counter chart
Displays the number of milliseconds required to respond to application requests. The averagelatency values are I/O weighted.
Latency - Breakdown counter chart
Displays the same latency data separated into read, write, and other latency.
This chart option applies when the selected object is an SVM, node, aggregate, volume, or LUN.
540Monitoring performance using the Performance Explorer pages

Latency - Cluster Components counter chart
Displays the latency data by cluster component. This enables you to identify the clustercomponent that is responsible for the latency. By hovering your cursor in the chart you can viewthe exact latency contribution for each component.
This chart option applies when the selected object is an SVM, node, aggregate, volume, or LUN.
Zoom View button
Displays a magnified view of the counter chart data.
• Events
The occurrence of critical, warning, and informational events are indicated on the time linesabove the charts.
• Thresholds
The dashed, horizontal line indicates the utilization warning threshold value set in UnifiedManager.
The solid red line indicates the utilization critical threshold value set in Unified Manager.
• Counters
The counters in the left pane show which counter values are being displayed. Deselecting or
selecting the that is associated with a counter hides and shows that counter informationfrom the chart and can help when comparing object latency.
Related conceptsUnderstanding counter charts on page 523
Charts in the Counter Charts pane enable you to view and compare performance data for the rootobject and for objects you have added from the correlated objects grid. This can help youunderstand performance trends and isolate and resolve performance issues.
Related tasksSpecifying the time range in Zoom View on page 529
The Time Range control in the Counter Charts Zoom View window enables you to specify a dateand time range for the selected chart. This enables you to quickly locate specific data based oneither a preset time range or your own custom time range.
Selecting performance thresholds in Counter Charts Zoom View on page 530Applying thresholds in the Counter Charts Zoom View provides a detailed view of occurrences ofperformance threshold events. This enables you to apply or remove thresholds, and immediatelyview the results, which can be helpful while deciding whether troubleshooting should be your nextstep.
Viewing volume latency by cluster component on page 531You can view detailed latency information for a volume by using the Volume PerformanceExplorer page. The Latency - Total counter chart shows total latency on the volume, and theLatency - Breakdown counter chart is useful for determining the impact of read and write latencyon the volume.
Related referenceWhat data does the workload analyzer display on page 39
541Monitoring performance using the Performance Explorer pages

The workload analyzer page displays information about any current events that could be affectingthe workload, recommendations to potentially fix the issue causing the event, and charts foranalyzing performance and capacity history.
IOPS performance counter chartsThe IOPS counter charts display the number of input/output operations processed per second bythe selected storage object.
The popup window that displays when you move the cursor across the chart area shows thecounter values at specific times.
When displayed in Zoom view, the volume and LUN IOPS charts also display Quality of Service(QoS) maximum and minimum throughput threshold settings, if configured. The IOPS/TB chartsdisplay QoS peak and expected throughput threshold settings, if adaptive QoS policies areconfigured.
Note: In some cases when using adaptive QoS policies, the Max and Min values are set to thesame value in the charts. This happens either on large volumes where very little space is beingused, or on very small volumes.
When viewing a volume or LUN that is sharing the IOPS of a shared QoS policy, a line for "TotalWorkload IOPS" is displayed to show the IOPS that are being used by all other workloads sharingthis policy.
The bottom of the chart page displays information for the minimum, maximum, average, and 95thpercentile IOPS for this object over the selected time range.
There are four types of IOPS charts available:
IOPS - Total counter chart
Displays the number of input/output operations processed per second.
When displayed for a node, selecting "Total" displays the IOPS for data moving through this nodethat may reside on either the local or the remote node, and selecting "Total (Local)" displays theIOPS for data that resides only on the current node.
IOPS - Breakdown counter chart
Displays the same IOPS data separated into read, write, and other IOPS.
This chart option applies when the selected object is an SVM, node, aggregate, volume, or LUN.
When displayed for a node, selecting "Breakdown" displays the IOPS breakdown for data movingthrough this node that may reside on either the local or the remote node, and selecting "Breakdown(Local)" displays the IOPS breakdown for data that resides only on the current node.
IOPS - Protocols counter chart
Displays the same IOPS data, but for SVMs the performance data is separated into individualcomponents for CIFS, NFS, FCP, NVMe, and iSCSI protocol traffic.
IOPS/TB - Total counter chart
Displays the number of input/output operations processed per second based on the total logicalspace that is being consumed by the volume, in terabytes. Also called I/O density, this countermeasures how much performance can be delivered by a given amount of storage capacity.
This chart option is available only when the selected object is a volume. It displays performancedata only when the logical capacity used by the volume is greater than or equal to 128 GB. Gapswill be displayed in the chart when the used capacity falls below 128 GB during the selectedtimeframe.
542Monitoring performance using the Performance Explorer pages

Zoom View button
Displays a magnified view of the counter chart data.
• Events
The occurrence of critical, error, warning, and informational events are indicated on the timelines above the charts.
• Thresholds
The dashed, horizontal line indicates the utilization warning threshold value set in UnifiedManager.
The solid red line indicates the utilization critical threshold value set in Unified Manager.
• Counters
The counters in the left pane show which counter values are being displayed. Deselecting or
selecting the that is associated with a counter hides and shows that counter informationfrom the chart and can help when comparing object IOPS.
Related conceptsUnderstanding counter charts on page 523
Charts in the Counter Charts pane enable you to view and compare performance data for the rootobject and for objects you have added from the correlated objects grid. This can help youunderstand performance trends and isolate and resolve performance issues.
Related tasksSpecifying the time range in Zoom View on page 529
The Time Range control in the Counter Charts Zoom View window enables you to specify a dateand time range for the selected chart. This enables you to quickly locate specific data based oneither a preset time range or your own custom time range.
Selecting performance thresholds in Counter Charts Zoom View on page 530Applying thresholds in the Counter Charts Zoom View provides a detailed view of occurrences ofperformance threshold events. This enables you to apply or remove thresholds, and immediatelyview the results, which can be helpful while deciding whether troubleshooting should be your nextstep.
Viewing workload QoS minimum and maximum settings in the Performance Explorer on page575
You can view the ONTAP-defined quality of service (QoS) policy settings on a volume or LUN inthe Performance Explorer charts. A throughput maximum setting limits the impact of competingworkloads on system resources. A throughput minimum setting ensures that a critical workloadmeets minimum throughput targets regardless of demand by competing workloads.
Viewing SVM IOPS traffic by protocol on page 531You can view detailed IOPS information for an SVM by using the Performance/SVM Explorerpage. The IOPS - Total counter chart shows total IOPS usage on the SVM, and the IOPS -Breakdown counter chart is useful for determining the impact of read, write, and other IOPS onthe SVM.
Viewing node IOPS based on workloads that reside only on the local node on page 533The node IOPS counter chart can highlight where operations are only passing through the localnode using a network LIF to perform read/write operations on volumes on a remote node. TheIOPS - "Total (Local)" and "Breakdown (Local)" charts display the IOPS for data that resides inlocal volumes only on the current node.
Related referenceWhat data does the workload analyzer display on page 39
543Monitoring performance using the Performance Explorer pages

The workload analyzer page displays information about any current events that could be affectingthe workload, recommendations to potentially fix the issue causing the event, and charts foranalyzing performance and capacity history.
MB/s performance counter chartsThe MB/s counter charts display the number of megabytes of data transferred to and from theselected object per second.
The popup window that is displayed when your cursor is in the chart area shows the specificcounter values at specific times.
When displayed in Zoom view, the volume and LUN charts also display Quality of Service (QoS)maximum MB/s throughput threshold settings, if configured.
When viewing a volume or LUN that is sharing the MB/s of a shared QoS policy, a line for "TotalWorkload MB/s" is displayed to show the MB/s that are being used by all other workloads sharingthis policy.
The bottom of the chart page displays information for the minimum, maximum, average, and 95thpercentile MB/s for the selected time range.
There are two types of MB/s charts available:
MB/s - Total counter chart
Displays the number of megabytes of data transferred to and from the selected object per second.
MB/s - Breakdown counter chart
Displays the same MB/s data separated into disk read, Flash Cache read, write, and otheroperations.
This chart option applies when the selected object is an SVM, node, aggregate, volume, or LUN.
Note: Flash Cache data is displayed only for nodes, and only when a Flash Cache module isinstalled in the node.
Zoom View button
Displays a magnified view of the counter chart data.
• Events
The occurrence of critical, error, warning, and informational events are indicated on the timelines above the charts.
• Thresholds
The dashed, horizontal line indicates the utilization warning threshold value set in UnifiedManager.
The solid red line indicates the utilization critical threshold value set in Unified Manager.
• Counters
The counters in the left pane show which counter values are being displayed. Deselecting or
selecting the that is associated with a counter hides and shows that counter informationfrom the chart and can help when comparing object MB/s.
Related conceptsUnderstanding counter charts on page 523
Charts in the Counter Charts pane enable you to view and compare performance data for the rootobject and for objects you have added from the correlated objects grid. This can help youunderstand performance trends and isolate and resolve performance issues.
Related tasksSpecifying the time range in Zoom View on page 529
544Monitoring performance using the Performance Explorer pages

The Time Range control in the Counter Charts Zoom View window enables you to specify a dateand time range for the selected chart. This enables you to quickly locate specific data based oneither a preset time range or your own custom time range.
Selecting performance thresholds in Counter Charts Zoom View on page 530Applying thresholds in the Counter Charts Zoom View provides a detailed view of occurrences ofperformance threshold events. This enables you to apply or remove thresholds, and immediatelyview the results, which can be helpful while deciding whether troubleshooting should be your nextstep.
Viewing workload QoS minimum and maximum settings in the Performance Explorer on page575
You can view the ONTAP-defined quality of service (QoS) policy settings on a volume or LUN inthe Performance Explorer charts. A throughput maximum setting limits the impact of competingworkloads on system resources. A throughput minimum setting ensures that a critical workloadmeets minimum throughput targets regardless of demand by competing workloads.
Related referenceWhat data does the workload analyzer display on page 39
The workload analyzer page displays information about any current events that could be affectingthe workload, recommendations to potentially fix the issue causing the event, and charts foranalyzing performance and capacity history.
Utilization performance counter chartThe Utilization counter chart displays the average percentage of the selected resource that is beingused.
The popup window that is displayed when your cursor is in the chart area shows the specificcounter values at specific times.
The bottom of the chart page displays information for the minimum, maximum, average, and 95thpercentile utilization for the selected time range.
Utilization - Total counter chart
Displays the average percentage of the selected resource that is being used. For nodes thisindicates utilization of node resources (CPU and RAM), for aggregates this indicates utilization ofthe disks in the aggregate, and for ports this indicates the bandwidth utilization of the port.
This chart option applies when the selected object is a node, aggregate, or port.
Zoom View button
Displays a magnified view of the counter chart data.
• Events
The occurrence of critical, warning, and informational events are indicated on the time linesabove the charts.
• Thresholds
The dashed, horizontal line indicates the utilization warning threshold value set in UnifiedManager.
The solid red line indicates the utilization critical threshold value set in Unified Manager.
• Counters
The counters in the left pane show which counter values are being displayed. Deselecting or
selecting the that is associated with a counter hides and shows that counter informationfrom the chart and can help when comparing object utilization.
Related conceptsUnderstanding counter charts on page 523
545Monitoring performance using the Performance Explorer pages
Charts in the Counter Charts pane enable you to view and compare performance data for the rootobject and for objects you have added from the correlated objects grid. This can help youunderstand performance trends and isolate and resolve performance issues.
Related tasksSpecifying the time range in Zoom View on page 529
The Time Range control in the Counter Charts Zoom View window enables you to specify a dateand time range for the selected chart. This enables you to quickly locate specific data based oneither a preset time range or your own custom time range.
Selecting performance thresholds in Counter Charts Zoom View on page 530Applying thresholds in the Counter Charts Zoom View provides a detailed view of occurrences ofperformance threshold events. This enables you to apply or remove thresholds, and immediatelyview the results, which can be helpful while deciding whether troubleshooting should be your nextstep.
Related referenceWhat data does the workload analyzer display on page 39
The workload analyzer page displays information about any current events that could be affectingthe workload, recommendations to potentially fix the issue causing the event, and charts foranalyzing performance and capacity history.
Performance Capacity Used performance counter chartsThe Performance Capacity Used counter charts display the percentage of performance capacitythat is being consumed by the node or aggregate.
These charts apply only when the selected object is a node or aggregate.
The popup window that is displayed when your cursor is in the chart area shows the specificcounter values at specific times.
The bottom of the chart page displays information for the minimum, maximum, average, and 95thpercentile performance capacity used for the selected time range.
There are two types of Performance Capacity Used charts available:
Performance Capacity Used - Total counter chart
Displays the percentage of performance capacity that is being consumed by the node or aggregate.
• Green zone
The capacity value is under the warning threshold set in Unified Manager.
• Yellow zone
The capacity value is approaching the warning threshold set in Unified Manager.
• Red zone
The capacity value is above the warning threshold and approaching the maximum threshold setin Unified Manager.
Performance Capacity Used - Breakdown counter chart
Displays the same percentage of performance capacity separated into user protocols, systembackground processes, and the amount of free performance capacity.
Zoom View button
Displays a magnified view of the counter chart data.
• Events
The occurrence of critical, warning, and informational events are indicated on the time linesabove the charts.
546Monitoring performance using the Performance Explorer pages

• Thresholds
The dashed, horizontal line indicates the capacity warning threshold value set in UnifiedManager.
The solid red line indicates the capacity critical threshold value set in Unified Manager.
The solid black line at 100% is the recommended maximum performance capacity used value.
• Counters
The counters in the left pane show which counter values are being displayed. Deselecting or
selecting the that is associated with a counter can restrict the comparison.
Related conceptsUnderstanding counter charts on page 523
Charts in the Counter Charts pane enable you to view and compare performance data for the rootobject and for objects you have added from the correlated objects grid. This can help youunderstand performance trends and isolate and resolve performance issues.
Managing performance using performance capacity and available IOPS information on page 477Performance capacity indicates how much throughput you can get out of a resource withoutsurpassing the useful performance of that resource. When viewed using existing performancecounters, performance capacity is the point at which you get the maximum utilization from a nodeor aggregate before latency becomes an issue.
Related tasksSpecifying the time range in Zoom View on page 529
The Time Range control in the Counter Charts Zoom View window enables you to specify a dateand time range for the selected chart. This enables you to quickly locate specific data based oneither a preset time range or your own custom time range.
Selecting performance thresholds in Counter Charts Zoom View on page 530Applying thresholds in the Counter Charts Zoom View provides a detailed view of occurrences ofperformance threshold events. This enables you to apply or remove thresholds, and immediatelyview the results, which can be helpful while deciding whether troubleshooting should be your nextstep.
Available IOPS performance counter chartThe Available IOPS counter chart displays the number of input/output operations per second thatare currently available (free) on the selected storage object.
The popup window that is displayed when your cursor is in the chart area shows the specificcounter values at specific times.
This chart option applies only when the selected object is a node or aggregate.
The bottom of the chart page displays information for the minimum, maximum, average, and 95thpercentile performance capacity used for the selected time range.
Available IOPS - Total counter chart
Displays the number of input/output operations per second that are currently available (free) on theselected storage object. This number is the result of subtracting the currently used IOPS from thetotal IOPS that Unified Manager calculates that the object can perform.
Zoom View button
Displays a magnified view of the counter chart data.
• Events
The occurrence of critical, warning, and informational events are indicated on the time linesabove the charts.
• Counters
547Monitoring performance using the Performance Explorer pages

The counters in the left pane show which counter values are being displayed. Deselecting or
selecting the that is associated with a counter hides and shows that counter informationfrom the chart and can help when comparing objects.
Related conceptsUnderstanding counter charts on page 523
Charts in the Counter Charts pane enable you to view and compare performance data for the rootobject and for objects you have added from the correlated objects grid. This can help youunderstand performance trends and isolate and resolve performance issues.
Managing performance using performance capacity and available IOPS information on page 477Performance capacity indicates how much throughput you can get out of a resource withoutsurpassing the useful performance of that resource. When viewed using existing performancecounters, performance capacity is the point at which you get the maximum utilization from a nodeor aggregate before latency becomes an issue.
Related tasksSpecifying the time range in Zoom View on page 529
The Time Range control in the Counter Charts Zoom View window enables you to specify a dateand time range for the selected chart. This enables you to quickly locate specific data based oneither a preset time range or your own custom time range.
Selecting performance thresholds in Counter Charts Zoom View on page 530Applying thresholds in the Counter Charts Zoom View provides a detailed view of occurrences ofperformance threshold events. This enables you to apply or remove thresholds, and immediatelyview the results, which can be helpful while deciding whether troubleshooting should be your nextstep.
Cache Miss Ratio performance counter chartThe Cache Miss Ratio counter chart displays the percentage of read requests from clientapplications that are returned from the disk instead of being returned from the cache.
The popup window that is displayed when your cursor is in the chart area shows the specificcounter values at specific times.
The bottom of the chart page displays information for the minimum, maximum, average, and 95thpercentile cache miss ratio for the selected time range.
Cache Miss Ratio - Total counter chart
Displays the percentage of read requests from client applications that are returned from the diskinstead of being returned from the cache.
This chart option applies only when the selected object is a volume.
Zoom View button
Displays a magnified view of the counter chart data.
• Events
The occurrence of critical, warning, and informational events are indicated on the time linesabove the charts.
• Counters
The counters in the left pane show which counter values are being displayed. Deselecting or
selecting the that is associated with a counter hides and shows that counter informationfrom the chart and can help when comparing objects.
Related conceptsUnderstanding counter charts on page 523
548Monitoring performance using the Performance Explorer pages

Charts in the Counter Charts pane enable you to view and compare performance data for the rootobject and for objects you have added from the correlated objects grid. This can help youunderstand performance trends and isolate and resolve performance issues.
Related tasksSpecifying the time range in Zoom View on page 529
The Time Range control in the Counter Charts Zoom View window enables you to specify a dateand time range for the selected chart. This enables you to quickly locate specific data based oneither a preset time range or your own custom time range.
Selecting performance thresholds in Counter Charts Zoom View on page 530Applying thresholds in the Counter Charts Zoom View provides a detailed view of occurrences ofperformance threshold events. This enables you to apply or remove thresholds, and immediatelyview the results, which can be helpful while deciding whether troubleshooting should be your nextstep.
Descriptions of the Performance Explorer pagesYou use the Performance Explorer pages to view detailed performance information about each ofthe available storage object; such as clusters, aggregates, volumes, and so on. These pages enableyou to assess the overall performance of all objects and compare object performance data in aside-by-side format.
Cluster/Performance Explorer pageThe Cluster/Performance Explorer page provides a detailed performance overview of all theclusters that are managed by Unified Manager.
The Cluster/Performance Explorer page enables you to track cluster performance and compare theobjects within that cluster during a specific time period, which helps in troubleshooting and fine-tuning the performance of a cluster.
Using the View and Compare functionality you can compare the performance of the cluster with:
• the nodes on this cluster
• the storage VMs of this cluster
• the aggregates on this cluster
The Cluster/Performance Explorer page enables you to:
• View threshold-related issues and their details
• Track cluster performance data
• Investigate and troubleshoot threshold-related issues
• Investigate and troubleshoot performance issues
Related conceptsComponents of the Performance Explorer page on page 538
The Performance Explorer page enables you to compare the performance of similar objects in acluster—for example, all the volumes in a cluster. This is beneficial when troubleshootingperformance events and fine-tuning object performance. You can also compare objects with theroot object, which is the baseline against which other object comparisons are made.
Counter Charts Zoom View on page 528The Counter Charts provide a Zoom View that enables you to zoom in on performance details overyour specified time period. This enables you to see performance details and events with muchhigher granularity, which is beneficial when troubleshooting performance issues.
Related tasksDefining the list of correlated objects for comparison graphing on page 522
549Monitoring performance using the Performance Explorer pages

You can define a list of correlated objects for data and performance comparison in the CounterChart pane. For example, if your storage virtual machine (SVM) is experiencing a performanceissue, you can compare all volumes in the SVM to identify which volume might be causing theissue.
Selecting performance charts to display on page 526The Choose charts drop-down list enables you to select the types of performance counter charts todisplay in the Counter Charts pane. This enables you to view specific data and counters, based onyour performance requirements.
Related referenceSummary page on page 536
The Summary page displays counter charts that contain details about the events and performanceper object for the preceding 72-hour period. This data is not automatically refreshed, but is currentas of the last page load. The charts in the Summary page answer the question Do I need to lookfurther?
Types of performance counter charts on page 524There are standard performance charts that display the counter values for the selected storageobject. Each of the Breakdown counter charts display the total values separated out into read,write, and other categories. Furthermore, some Breakdown counter charts display additional detailwhen the chart is displayed in Zoom view.
Node/Performance Explorer pageThe Node/Performance Explorer page provides a detailed performance overview of all nodeswithin a cluster.
The Node/Performance Explorer page enables you to track and compare node performance duringa specific time period, which helps you to troubleshoot and fine-tune the performance of yournodes.
Using the View and Compare functionality you can compare the performance of this node with:
• other nodes on the same cluster
• the aggregates on the node
• the ports on the node
The Node/Performance Explorer page enables you to:
• View threshold-related issues and their details
• Track and compare node performance data
• Investigate and troubleshoot threshold-related issues
• Investigate and troubleshoot performance issues
Related conceptsComponents of the Performance Explorer page on page 538
The Performance Explorer page enables you to compare the performance of similar objects in acluster—for example, all the volumes in a cluster. This is beneficial when troubleshootingperformance events and fine-tuning object performance. You can also compare objects with theroot object, which is the baseline against which other object comparisons are made.
Counter Charts Zoom View on page 528The Counter Charts provide a Zoom View that enables you to zoom in on performance details overyour specified time period. This enables you to see performance details and events with muchhigher granularity, which is beneficial when troubleshooting performance issues.
Related tasksDefining the list of correlated objects for comparison graphing on page 522
550Monitoring performance using the Performance Explorer pages

You can define a list of correlated objects for data and performance comparison in the CounterChart pane. For example, if your storage virtual machine (SVM) is experiencing a performanceissue, you can compare all volumes in the SVM to identify which volume might be causing theissue.
Selecting performance charts to display on page 526The Choose charts drop-down list enables you to select the types of performance counter charts todisplay in the Counter Charts pane. This enables you to view specific data and counters, based onyour performance requirements.
Related referenceSummary page on page 536
The Summary page displays counter charts that contain details about the events and performanceper object for the preceding 72-hour period. This data is not automatically refreshed, but is currentas of the last page load. The charts in the Summary page answer the question Do I need to lookfurther?
Understanding and using the Node Failover Planning page on page 578The Performance/Node Failover Planning page estimates the performance impact on a node if thenode's high-availability (HA) partner node fails. Unified Manager bases the estimates on thehistorical performance of the nodes in the HA pair.
Types of performance counter charts on page 524There are standard performance charts that display the counter values for the selected storageobject. Each of the Breakdown counter charts display the total values separated out into read,write, and other categories. Furthermore, some Breakdown counter charts display additional detailwhen the chart is displayed in Zoom view.
Aggregate/Performance Explorer pageThe Aggregate/Performance Explorer page provides a detailed performance overview of all theaggregates in a cluster.
The Aggregate/Performance Explorer page enables you to track and compare aggregateperformance during a specific time period, which helps in troubleshooting and fine-tuning theperformance of an aggregate.
Note: Root aggregates are not displayed on this page.
Using the View and Compare functionality you can compare the performance of this aggregatewith:
• other aggregates on the same node
• other aggregates on the same cluster
• the node on which the aggregate resides
• all nodes on the cluster that is using this aggregate
• the volumes that reside on this aggregate
The Aggregate/Performance Explorer page enables you to:
• View threshold-related issues and their details
• Track and compare aggregate performance data
• Investigate and troubleshoot threshold-related issues
• Investigate and troubleshoot performance issues
Related conceptsComponents of the Performance Explorer page on page 538
The Performance Explorer page enables you to compare the performance of similar objects in acluster—for example, all the volumes in a cluster. This is beneficial when troubleshooting
551Monitoring performance using the Performance Explorer pages

performance events and fine-tuning object performance. You can also compare objects with theroot object, which is the baseline against which other object comparisons are made.
Counter Charts Zoom View on page 528The Counter Charts provide a Zoom View that enables you to zoom in on performance details overyour specified time period. This enables you to see performance details and events with muchhigher granularity, which is beneficial when troubleshooting performance issues.
Related tasksDefining the list of correlated objects for comparison graphing on page 522
You can define a list of correlated objects for data and performance comparison in the CounterChart pane. For example, if your storage virtual machine (SVM) is experiencing a performanceissue, you can compare all volumes in the SVM to identify which volume might be causing theissue.
Selecting performance charts to display on page 526The Choose charts drop-down list enables you to select the types of performance counter charts todisplay in the Counter Charts pane. This enables you to view specific data and counters, based onyour performance requirements.
Related referenceSummary page on page 536
The Summary page displays counter charts that contain details about the events and performanceper object for the preceding 72-hour period. This data is not automatically refreshed, but is currentas of the last page load. The charts in the Summary page answer the question Do I need to lookfurther?
Types of performance counter charts on page 524There are standard performance charts that display the counter values for the selected storageobject. Each of the Breakdown counter charts display the total values separated out into read,write, and other categories. Furthermore, some Breakdown counter charts display additional detailwhen the chart is displayed in Zoom view.
Storage VM/Performance Explorer pageThe Storage VM/Performance Explorer page provides a detailed performance overview of all thestorage virtual machines (SVMs) in a cluster.
This page enables you to track and compare storage VM performance during a specific timeperiod, which helps you to troubleshoot and fine-tune your SVM performance.
Using the View and Compare functionality you can compare the performance of this storage VMwith:
• other SVMs on the same cluster
• the volumes on this SVM
• the network interfaces on this SVM
The Storage VM/Performance page enables you to:
• View threshold-related issues and their details
• Track and compare SVM performance data
• Investigate and troubleshoot threshold-related issues
• Investigate and troubleshoot performance issues
Related conceptsComponents of the Performance Explorer page on page 538
The Performance Explorer page enables you to compare the performance of similar objects in acluster—for example, all the volumes in a cluster. This is beneficial when troubleshooting
552Monitoring performance using the Performance Explorer pages

performance events and fine-tuning object performance. You can also compare objects with theroot object, which is the baseline against which other object comparisons are made.
Counter Charts Zoom View on page 528The Counter Charts provide a Zoom View that enables you to zoom in on performance details overyour specified time period. This enables you to see performance details and events with muchhigher granularity, which is beneficial when troubleshooting performance issues.
Related tasksDefining the list of correlated objects for comparison graphing on page 522
You can define a list of correlated objects for data and performance comparison in the CounterChart pane. For example, if your storage virtual machine (SVM) is experiencing a performanceissue, you can compare all volumes in the SVM to identify which volume might be causing theissue.
Selecting performance charts to display on page 526The Choose charts drop-down list enables you to select the types of performance counter charts todisplay in the Counter Charts pane. This enables you to view specific data and counters, based onyour performance requirements.
Related referenceSummary page on page 536
The Summary page displays counter charts that contain details about the events and performanceper object for the preceding 72-hour period. This data is not automatically refreshed, but is currentas of the last page load. The charts in the Summary page answer the question Do I need to lookfurther?
Types of performance counter charts on page 524There are standard performance charts that display the counter values for the selected storageobject. Each of the Breakdown counter charts display the total values separated out into read,write, and other categories. Furthermore, some Breakdown counter charts display additional detailwhen the chart is displayed in Zoom view.
Volume/Performance Explorer pageThis page provides detailed performance information for a volume in a cluster. The title of thispage depends on whether you are viewing a FlexVol volume or a FlexGroup volume.
The Volume/Performance Explorer page enables you to track and compare volume performanceduring a specific time period, which helps you to troubleshoot and fine-tune your volumeperformance.
Note: Root volumes are not displayed on this page.
Using the View and Compare functionality:
• For FlexVol volumes, you can compare the performance of this volume with:
◦ other volumes on the same aggregate
◦ other volumes that are in the same QoS policy group
◦ the aggregate on which this volume resides
◦ the storage VM on which this volume resides
◦ the LUNs that are on this volume
• For FlexGroup volumes, you can compare the performance of this FlexGroup with:
◦ the aggregates on which the FlexGroup resides
◦ the storage VM on which the FlexGroup resides
◦ the constituent volumes of the FlexGroup
553Monitoring performance using the Performance Explorer pages

The statistics in the charts are updated after each collection period; which by default is every 5minutes. The View statistics in selector provides an option to show statistics averaged over theprevious hour. This functionality enables you to view the latency chart in support of the NetApp"Performance Guarantee" program.
The Volume/Performance Explorer page enables you to:
• View threshold-related issues and their details
• Track and compare volume performance data
• Investigate and troubleshoot threshold-related issues
• Investigate and troubleshoot performance issues
• Launch System Manager to make a configuration change to the volume
The Configure Volume button is available if you are logged in to Unified Manager with theApplication Administrator or Storage Administrator role, and when using ONTAP 9.5 orgreater.
Note: For data protection (DP) volumes, only counter values for user-generated traffic aredisplayed.
Related conceptsComponents of the Performance Explorer page on page 538
The Performance Explorer page enables you to compare the performance of similar objects in acluster—for example, all the volumes in a cluster. This is beneficial when troubleshootingperformance events and fine-tuning object performance. You can also compare objects with theroot object, which is the baseline against which other object comparisons are made.
Counter Charts Zoom View on page 528The Counter Charts provide a Zoom View that enables you to zoom in on performance details overyour specified time period. This enables you to see performance details and events with muchhigher granularity, which is beneficial when troubleshooting performance issues.
Types of workloads monitored by Unified Manager on page 584You can use Unified Manager to monitor the performance of two types of workloads: user-definedand system-defined.
Related tasksDefining the list of correlated objects for comparison graphing on page 522
You can define a list of correlated objects for data and performance comparison in the CounterChart pane. For example, if your storage virtual machine (SVM) is experiencing a performanceissue, you can compare all volumes in the SVM to identify which volume might be causing theissue.
Selecting performance charts to display on page 526The Choose charts drop-down list enables you to select the types of performance counter charts todisplay in the Counter Charts pane. This enables you to view specific data and counters, based onyour performance requirements.
Related referenceSummary page on page 536
The Summary page displays counter charts that contain details about the events and performanceper object for the preceding 72-hour period. This data is not automatically refreshed, but is currentas of the last page load. The charts in the Summary page answer the question Do I need to lookfurther?
Types of performance counter charts on page 524There are standard performance charts that display the counter values for the selected storageobject. Each of the Breakdown counter charts display the total values separated out into read,
554Monitoring performance using the Performance Explorer pages

write, and other categories. Furthermore, some Breakdown counter charts display additional detailwhen the chart is displayed in Zoom view.
Constituent Volume/Performance Explorer pageThe Constituent Volume/Performance Explorer page provides detailed performance informationfor the selected FlexGroup constituent.
The Constituent Volume/Performance Explorer page enables you to track and compare constituentperformance during a specific time period, which helps in troubleshooting and fine-tuning theperformance of a FlexGroup volume and its constituent volumes.
Using the View and Compare functionality you can compare the performance of this constituentvolume with:
• the aggregate on which this constituent volume resides
• the storage VM on which this constituent volume resides
• the FlexGroup volume to which the constituent volume belongs
• other volumes that are on the same aggregate
The Constituent Volume/Performance Explorer page enables you to:
• View threshold-related issues and their details
• Track and compare constituent performance data
• Investigate and troubleshoot threshold-related issues
• Investigate and troubleshoot performance issues
Note: For data protection (DP) volumes, only counter values for user-generated traffic aredisplayed.
Related conceptsComponents of the Performance Explorer page on page 538
The Performance Explorer page enables you to compare the performance of similar objects in acluster—for example, all the volumes in a cluster. This is beneficial when troubleshootingperformance events and fine-tuning object performance. You can also compare objects with theroot object, which is the baseline against which other object comparisons are made.
Counter Charts Zoom View on page 528The Counter Charts provide a Zoom View that enables you to zoom in on performance details overyour specified time period. This enables you to see performance details and events with muchhigher granularity, which is beneficial when troubleshooting performance issues.
Types of workloads monitored by Unified Manager on page 584You can use Unified Manager to monitor the performance of two types of workloads: user-definedand system-defined.
Related tasksDefining the list of correlated objects for comparison graphing on page 522
You can define a list of correlated objects for data and performance comparison in the CounterChart pane. For example, if your storage virtual machine (SVM) is experiencing a performanceissue, you can compare all volumes in the SVM to identify which volume might be causing theissue.
Selecting performance charts to display on page 526The Choose charts drop-down list enables you to select the types of performance counter charts todisplay in the Counter Charts pane. This enables you to view specific data and counters, based onyour performance requirements.
Related referenceSummary page on page 536
555Monitoring performance using the Performance Explorer pages

The Summary page displays counter charts that contain details about the events and performanceper object for the preceding 72-hour period. This data is not automatically refreshed, but is currentas of the last page load. The charts in the Summary page answer the question Do I need to lookfurther?
Types of performance counter charts on page 524There are standard performance charts that display the counter values for the selected storageobject. Each of the Breakdown counter charts display the total values separated out into read,write, and other categories. Furthermore, some Breakdown counter charts display additional detailwhen the chart is displayed in Zoom view.
LUN/Performance Explorer pageThe LUN/Performance Explorer page provides a detailed overview of the performance of all theLUNs within a cluster.
The LUN/Performance Explorer page enables you to track and compare LUN performance duringa specific time period, which helps you to troubleshoot and fine-tune the performance of yourLUNs.
Using the View and Compare functionality you can compare the performance of this LUN with:
• other LUNs that are on the same volume
• other LUNs that are in the same QoS policy group
• the volume on which the LUN resides
The statistics in the charts are updated after each collection period; which by default is every 5minutes. The View statistics in selector provides an option to show statistics averaged over theprevious hour. This functionality enables you to view the latency chart in support of the NetApp"Performance Guarantee" program.
The LUN/Performance Explorer page enables you to:
• View threshold-related issues and their details
• Track and compare LUN performance data
• Investigate and troubleshoot threshold-related issues
• Investigate and troubleshoot performance issues
Related conceptsComponents of the Performance Explorer page on page 538
The Performance Explorer page enables you to compare the performance of similar objects in acluster—for example, all the volumes in a cluster. This is beneficial when troubleshootingperformance events and fine-tuning object performance. You can also compare objects with theroot object, which is the baseline against which other object comparisons are made.
Counter Charts Zoom View on page 528The Counter Charts provide a Zoom View that enables you to zoom in on performance details overyour specified time period. This enables you to see performance details and events with muchhigher granularity, which is beneficial when troubleshooting performance issues.
Related tasksDefining the list of correlated objects for comparison graphing on page 522
You can define a list of correlated objects for data and performance comparison in the CounterChart pane. For example, if your storage virtual machine (SVM) is experiencing a performanceissue, you can compare all volumes in the SVM to identify which volume might be causing theissue.
Selecting performance charts to display on page 526
556Monitoring performance using the Performance Explorer pages

The Choose charts drop-down list enables you to select the types of performance counter charts todisplay in the Counter Charts pane. This enables you to view specific data and counters, based onyour performance requirements.
Related referenceSummary page on page 536
The Summary page displays counter charts that contain details about the events and performanceper object for the preceding 72-hour period. This data is not automatically refreshed, but is currentas of the last page load. The charts in the Summary page answer the question Do I need to lookfurther?
Types of performance counter charts on page 524There are standard performance charts that display the counter values for the selected storageobject. Each of the Breakdown counter charts display the total values separated out into read,write, and other categories. Furthermore, some Breakdown counter charts display additional detailwhen the chart is displayed in Zoom view.
NVMe Namespace/Performance Explorer pageThe NVMe Namespace/Performance Explorer page provides a detailed overview of theperformance of all the NVMe Namespaces within a cluster.
The NVMe Namespace/Performance Explorer page enables you to track and compare NVMeNamespace performance during a specific time period, which helps you to troubleshoot and fine-tune the performance of your Namespaces.
Using the View and Compare functionality you can compare the performance of this NVMeNamespace with:
• the volume on which the Namespace resides
• other Namespaces that are on the same volume
• other Namespaces that are on the same storage VM
The NVMe Namespace/Performance Explorer page enables you to:
• View threshold-related issues and their details
• Track and compare Namespace performance data
• Investigate and troubleshoot threshold-related issues
• Investigate and troubleshoot performance issues
• Launch System Manager to make a configuration change to the Namespace
The Configure NVMe Namespace button is available if you are logged in to Unified Managerwith the Application Administrator or Storage Administrator role, and when using ONTAP 9.5or greater.
Related conceptsComponents of the Performance Explorer page on page 538
The Performance Explorer page enables you to compare the performance of similar objects in acluster—for example, all the volumes in a cluster. This is beneficial when troubleshootingperformance events and fine-tuning object performance. You can also compare objects with theroot object, which is the baseline against which other object comparisons are made.
Counter Charts Zoom View on page 528The Counter Charts provide a Zoom View that enables you to zoom in on performance details overyour specified time period. This enables you to see performance details and events with muchhigher granularity, which is beneficial when troubleshooting performance issues.
Related tasksDefining the list of correlated objects for comparison graphing on page 522
557Monitoring performance using the Performance Explorer pages

You can define a list of correlated objects for data and performance comparison in the CounterChart pane. For example, if your storage virtual machine (SVM) is experiencing a performanceissue, you can compare all volumes in the SVM to identify which volume might be causing theissue.
Selecting performance charts to display on page 526The Choose charts drop-down list enables you to select the types of performance counter charts todisplay in the Counter Charts pane. This enables you to view specific data and counters, based onyour performance requirements.
Related referenceSummary page on page 536
The Summary page displays counter charts that contain details about the events and performanceper object for the preceding 72-hour period. This data is not automatically refreshed, but is currentas of the last page load. The charts in the Summary page answer the question Do I need to lookfurther?
Types of performance counter charts on page 524There are standard performance charts that display the counter values for the selected storageobject. Each of the Breakdown counter charts display the total values separated out into read,write, and other categories. Furthermore, some Breakdown counter charts display additional detailwhen the chart is displayed in Zoom view.
Network Interface/Performance Explorer pageThe Network Interface/Performance Explorer page provides a detailed performance overview forall of the network interfaces (LIFs) within a cluster.
The Network Interface/Performance Explorer page enables you to track and compare networkinterface performance during a specific time period, which helps you to troubleshoot and fine-tuneyour network interface performance.
Using the View and Compare functionality you can compare the performance of this networkinterface with:
• other network interfaces that are on the same port
• other network interfaces that are on the same storage VM
• the port on which the network interface resides
• the storage VM on which the network interface resides
The Network Interface/Performance Explorer page enables you to:
• View threshold-related issues and their details
• Track and compare network interface performance data
• Investigate and troubleshoot threshold-related issues
• Investigate and troubleshoot performance issues
Related conceptsComponents of the Performance Explorer page on page 538
The Performance Explorer page enables you to compare the performance of similar objects in acluster—for example, all the volumes in a cluster. This is beneficial when troubleshootingperformance events and fine-tuning object performance. You can also compare objects with theroot object, which is the baseline against which other object comparisons are made.
Counter Charts Zoom View on page 528
558Monitoring performance using the Performance Explorer pages

The Counter Charts provide a Zoom View that enables you to zoom in on performance details overyour specified time period. This enables you to see performance details and events with muchhigher granularity, which is beneficial when troubleshooting performance issues.
Related tasksDefining the list of correlated objects for comparison graphing on page 522
You can define a list of correlated objects for data and performance comparison in the CounterChart pane. For example, if your storage virtual machine (SVM) is experiencing a performanceissue, you can compare all volumes in the SVM to identify which volume might be causing theissue.
Selecting performance charts to display on page 526The Choose charts drop-down list enables you to select the types of performance counter charts todisplay in the Counter Charts pane. This enables you to view specific data and counters, based onyour performance requirements.
Related referenceSummary page on page 536
The Summary page displays counter charts that contain details about the events and performanceper object for the preceding 72-hour period. This data is not automatically refreshed, but is currentas of the last page load. The charts in the Summary page answer the question Do I need to lookfurther?
Types of performance counter charts on page 524There are standard performance charts that display the counter values for the selected storageobject. Each of the Breakdown counter charts display the total values separated out into read,write, and other categories. Furthermore, some Breakdown counter charts display additional detailwhen the chart is displayed in Zoom view.
Port/Performance Explorer pageThe Port/Performance Explorer page provides a detailed performance overview of all ports in acluster.
Note: Performance counter values are displayed for physical ports only. Counter values are notdisplayed for VLANs or interface groups.
The Port/Performance Explorer page enables you to track and compare port performance during aspecific time period, which helps you to troubleshoot and fine-tune your port performance.
Using the View and Compare functionality you can compare the performance of this port with:
• other ports on the same node
• the node on which the port resides
• network interfaces that are on the port
Note: Only cluster and data LIFs are displayed when filtering using the "network interfaces onthis port" option. No intercluster LIFs are shown.
The Port/Performance Explorer page enables you to:
• View threshold-related issues and their details
• Track and compare port performance data
• Investigate and troubleshoot threshold-related issues
• Investigate and troubleshoot performance issues
Related conceptsComponents of the Performance Explorer page on page 538
The Performance Explorer page enables you to compare the performance of similar objects in acluster—for example, all the volumes in a cluster. This is beneficial when troubleshooting
559Monitoring performance using the Performance Explorer pages

performance events and fine-tuning object performance. You can also compare objects with theroot object, which is the baseline against which other object comparisons are made.
Counter Charts Zoom View on page 528The Counter Charts provide a Zoom View that enables you to zoom in on performance details overyour specified time period. This enables you to see performance details and events with muchhigher granularity, which is beneficial when troubleshooting performance issues.
Related tasksDefining the list of correlated objects for comparison graphing on page 522
You can define a list of correlated objects for data and performance comparison in the CounterChart pane. For example, if your storage virtual machine (SVM) is experiencing a performanceissue, you can compare all volumes in the SVM to identify which volume might be causing theissue.
Selecting performance charts to display on page 526The Choose charts drop-down list enables you to select the types of performance counter charts todisplay in the Counter Charts pane. This enables you to view specific data and counters, based onyour performance requirements.
Related referenceSummary page on page 536
The Summary page displays counter charts that contain details about the events and performanceper object for the preceding 72-hour period. This data is not automatically refreshed, but is currentas of the last page load. The charts in the Summary page answer the question Do I need to lookfurther?
Types of performance counter charts on page 524There are standard performance charts that display the counter values for the selected storageobject. Each of the Breakdown counter charts display the total values separated out into read,write, and other categories. Furthermore, some Breakdown counter charts display additional detailwhen the chart is displayed in Zoom view.
Cluster/Performance Information pageUse the Cluster/Performance Information page to view a list of the physical and logical attributesof the cluster. This information might help in answering performance-related questions.
Cluster attributes
Management Network Interface
The name of the cluster management LIF, and whether the LIF is currently available (Up),or not (Down).
IP Address
The IPv4 or IPv6 address of the cluster management LIF.
FQDN
The fully qualified domain name (FQDN) of the cluster management LIF.
OS Version
The version of ONTAP software installed on the cluster.
Note: If different versions of ONTAP software are installed on the nodes in the cluster,the listed version is the lowest version number. Check the Node/Performance Informationpage to view the version of ONTAP software installed on each node.
Serial Number
The unique identification number of the cluster.
560Monitoring performance using the Performance Explorer pages

Model / Family
The platform model number and model family of all the nodes in the cluster.
Capacity (free/total)
The total storage available to the cluster, in gigabytes, and the amount of storage currentlyavailable.
Logical Space Used
The real size of the data that is being stored on this aggregates of this cluster withoutapplying the savings from using ONTAP storage efficiency technologies.
Allowed Protocols
The list of all protocols that can be serviced by this cluster. The available protocols are FC/FCoE, iSCSI, HTTP, NVMe, NDMP, NFS, and CIFS.
Nodes
The number of nodes in this cluster. You can click the number to display the nodes in thePerformance/Nodes Inventory page.
Storage VM
The number of SVMs in this cluster. You can click the number to display the SVMs in thePerformance/Storage VMs Inventory page.
Network Interfaces
The number of LIFs in this cluster. You can click the number to display the LIFs in thePerformance/LIFs Inventory page.
Contact / Location
If available, the name of the storage administrator to contact regarding this cluster, and thelocation of the cluster.
Node/Performance Information pageUse the Node/Performance Information page to view a list of the physical and logical attributes ofthe node. This information might help in answering performance-related questions.
Node attributes
IP Address
The IPv4 or IPv6 address of the node management LIF.
FQDN
The fully qualified domain name (FQDN) of the node management LIF.
OS Version
The version of ONTAP software installed on the node.
Model / Family
The platform model number of the node.
Capacity (free/total)
The total storage available to the node, in gigabytes, and the amount of storage currentlyavailable.
Cluster
The name of the cluster to which this node belongs. You can click the name to displaycluster details the Cluster/Performance Explorer page.
561Monitoring performance using the Performance Explorer pages

HA Partner
The name of the HA partner node, if applicable. You can click the name to display partnernode details in the Node/Performance Explorer page.
Aggregates
The number of aggregates on this node. You can click the number to display the aggregatesin the Performance/Aggregates Inventory page.
Note: The number listed here may not match the number in the Performance/AggregatesInventory page because the inventory page does not include root aggregates.
Ports
The number of ports on this node. You can click the number to display the ports in thePerformance/Ports Inventory page.
Note: The number listed here may not match the number in the Performance/PortsInventory page because the inventory page does not include node management ports.
Contact / Location
If available, the name of the administrator to contact regarding this node, and the location ofthe node.
# of Cores / Speed
If available, the number of CPU cores on the controller, and the speed of the CPU cores.
RAM
If available, the total memory available on the controller.
Flash Devices
Note: Flash Cache data is displayed only for nodes, and only when a Flash Cache module isinstalled in the node.
Slot Number
The slot number in which the Flash Cache module is installed.
Status
The operational status of the module. Valid values:
• Online
• Offline_failed
• Offline_threshold
Model / Family
The model number of the module.
Firmware Rev
The version of firmware installed on the module.
Capacity
The size of the installed Flash Cache module.
562Monitoring performance using the Performance Explorer pages

Aggregate/Performance Information pageUse the Aggregate/Performance Information page to view a list of the physical and logicalattributes of the aggregate. This information might help in answering performance-relatedquestions.
Aggregate attributes
Type
The type of aggregate:
• HDD
• Hybrid
Combines HDDs and SSDs, but Flash Pool has not been enabled.
• Hybrid (Flash Pool)
Combines HDDs and SSDs, and Flash Pool has been enabled.
• SSD
• SSD (FabricPool)
Combines SSDs and a cloud tier
• HDD (FabricPool)
Combines HDDs and a cloud tier
• VMDisk (SDS)
Virtual disks within a virtual machine
• VMDisk (FabricPool)
Combines virtual disks and a cloud tier
• LUN (FlexArray)
Cluster
The name of the cluster to which the aggregate belongs. You can click the name to displaycluster details in the Cluster/Performance Explorer page.
Node
The name of the node to which the disks of the aggregate belong. You can click the name todisplay node details in the Node/Performance Explorer page.
Flash Pool
Whether this is a Flash Pool aggregate: Yes or No.
A Flash Pool aggregate is a hybrid aggregate that consists of both SSDs and HDDs.
FabricPool
Whether this is a FabricPool aggregate: Yes or No.
A FabricPool aggregate is an aggregate that consists of either SSDs and a cloud tier, orHDDs and a cloud tier (starting with ONTAP 9.8).
Inactive Data Reporting
Whether the inactive data reporting capability is enabled or disabled on this aggregate.When enabled, volumes on this aggregate display the amount of cold data in thePerformance/Volumes inventory page.
The value in this field is "N/A" when the version of ONTAP does not support inactive datareporting.
Logical Space Used
The real size of the data that is being stored on this aggregate without applying the savingsfrom using ONTAP storage efficiency technologies.
563Monitoring performance using the Performance Explorer pages
Storage VM/Performance Information pageUse the Storage VM/Performance Information page to view a list of the configured attributes ofthe SVM. This information might help in answering performance-related questions.
Storage VM attributes
IP Address
The IPv4 or IPv6 addresses of all interfaces connected to this SVM.
IPspace
The IPspace in which this SVM resides.
Domain Name
The fully qualified domain names (FQDNs) of the interfaces connected to this SVM.
Service Type
The type of SVM.
Possible values include: "Admin" for the cluster-wide management SVM, "System" forcluster-level communications in an IPspace, "Data" for data serving SVM, and "Node" fornode management SVM.
Capacity (free/total)
The total storage available to the SVM, in gigabytes, and the amount of storage currentlyavailable.
Cluster
The name of the cluster to which the SVM belongs. You can click the name to displaycluster details in the Cluster/Performance Explorer page.
Volumes
The number of volumes in the SVM. You can click the number to display the volumes inthe Performance/Volumes Inventory page.
Network Interfaces
The number of network interfaces available to the SVM.
Data Network Interfaces
The number and type of Data network interfaces available to the SVM.
Allowed Volume Type
The type of volume that can be created on the SVM.
SVMs can contain one or more FlexVol volumes or FlexGroup volumes.
Allowed Protocols
The list of all protocols that can be serviced by this SVM. The available protocols are FC/FCoE, iSCSI, HTTP, NDMP, NVMe, NFS, and CIFS.
Port Set
If defined for FCP or iSCSI protocols, the port set that is assigned to this SVM.
564Monitoring performance using the Performance Explorer pages
Volume/Performance Information pageUse this page to view a list of the physical and logical attributes of the volume. This informationmight help in answering performance-related questions. The title of this page depends on whetheryou are viewing a FlexVol volume or a FlexGroup volume.
Volume attributes
Type
The volume's type; either read-write (RW) or data-protection (DP).
Style
The style of volume; either FlexVol or FlexGroup.
Cluster
The name of the cluster to which this FlexVol volume or FlexGroup volume belongs. Youcan click the name to display cluster details in the Cluster/Performance Explorer page.
Aggregates
The name of the aggregate on which this FlexVol volume resides, or the number ofaggregates on which this FlexGroup volume resides.
For FlexVol volumes, you can click the name to display aggregate details in the Aggregate/Performance Explorer page. For FlexGroup volumes, you can click the number to displaythe aggregates that are used in this FlexGroup volume in the Performance/AggregatesInventory page.
Storage VM
The name of the SVM to which this FlexVol volume or FlexGroup volume belongs. Youcan click the name to display SVM details in the Storage VM/Performance Explorer page.
Tiering Policy
The tiering policy set on the volume. The policy takes affect only when the volume isdeployed on a FabricPool aggregate. The available policies are:
• None. The data for this volume always remains on the performance tier.
• Snapshot Only. Only Snapshot data is moved automatically to the cloud tier. All otherdata remains on the performance tier.
• Backup. On data protection volumes, all transferred user data starts in the cloud tier, butlater client reads can cause hot data to move to the performance tier.
• Auto. Data on this volume is moved between the performance tier and the cloud tierautomatically when ONTAP determines that the data is "hot" or "cold".
• All. The data for this volume always remains on the cloud tier.
RAID Type
The redundancy type that is being used on the performance tier of the aggregate where thisvolume resides. Possible types:
• RAID0
• RAID4
• RAID-DP
• RAID-TEC
Note: The value "Not Applicable" is displayed for FlexGroup volumes because theconstituent volumes can be on aggregates of different RAID types.
Capacity (free/total)
The total storage available on the volume, in gigabytes, and the amount of storage currentlyavailable.
565Monitoring performance using the Performance Explorer pages

Logical Space Used
The real size of the data that is being stored on this volume without applying the savingsfrom using ONTAP storage efficiency technologies.
Constituent Volume/Performance Information pageUse the Constituent Volume/Performance Information page to view a list of the physical andlogical attributes of the FlexGroup constituent volume. This information might help in answeringperformance-related questions.
Constituent Volume attributes
Type
The constituent's type; either read-write (RW) or data-protection (DP).
Style
The style of volume; this is a constituent volume of a FlexGroup volume.
Cluster
The name of the cluster to which this FlexGroup constituent volume belongs. You can clickthe name to display cluster details in the Cluster/Performance Explorer page.
Aggregate
The name of the aggregate on which this FlexGroup constituent volume resides. You canclick the name to display aggregate details in the Aggregate/Performance Explorer page.
FlexGroup
The name of the FlexGroup volume to which this constituent belongs. You can click thename to display FlexGroup volume details in the Constituent Volume/Performance Explorerpage.
Storage VM
The name of the SVM to which this FlexGroup constituent volume belongs. You can clickthe name to display SVM details in the Performance/SVM Explorer page.
Tiering Policy
The tiering policy set on the volume. The policy takes affect only when the volume isdeployed on a FabricPool aggregate. The available policies are:
• None. The data for this volume always remains on the performance tier.
• Snapshot Only. Only Snapshot data is moved automatically to the cloud tier. All otherdata remains on the performance tier.
• Backup. On data protection volumes, all transferred user data starts in the cloud tier, butlater client reads can cause hot data to move to the performance tier.
• Auto. Data on this volume is moved between the performance tier and the cloud tierautomatically when ONTAP determines that the data is "hot" or "cold".
• All. The data for this volume always remains on the cloud tier.
RAID Type
The redundancy type that is being used on the aggregate where this constituent resides.Possible types:
• RAID0
• RAID4
• RAID-DP
• RAID-TEC
566Monitoring performance using the Performance Explorer pages

Capacity (free/total)
The total storage available on the constituent, in gigabytes, and the amount of storagecurrently available.
LUN/Performance Information pageUse the LUN/Performance Information page to view a list of the physical and logical attributes ofthe LUN. This information might help in answering performance-related questions.
LUN attributes
WWN
The WWN (World Wide Name) of the LUN.
Path
The full path of the LUN, for example, /vol/vol1/lun1.
Alignment
Indicates the alignment state of the LUN. Possible values:
• Not mapped
• Aligned
• Misaligned
• Possibly misaligned
• Indeterminate
Capacity (free/total)
The total storage available on the LUN, in gigabytes, and the amount of storage currentlyavailable.
Volume
The name of the volume to which the LUN belongs. You can click the name to displayvolume details in the Volume/Performance Explorer page.
Storage VM
The name of the SVM to which the LUN belongs. You can click the name to display SVMdetails in the Storage VM/Performance Explorer page.
Node
The name of the node on which the LUN resides. You can click the name to display nodedetails in the Node/Performance Explorer page.
Cluster
The name of the cluster to which the LUN belongs. You can click the name to displaycluster details in the Cluster/Performance Explorer page.
State
The state of the LUN. Valid states can be online, offline, nvfail, space-error, and foreign-lun-error.
Mapped
Whether the LUN is mapped to an initiator group (true), or not (false).
567Monitoring performance using the Performance Explorer pages

NVMe Namespace/Performance Information pageUse the NVMe Namespace/Performance Information page to view a list of the physical andlogical attributes of the Namespace. This information might help in answering performance-related questions.
NVMe Namespace attributes
Cluster
The name of the cluster to which the Namespace belongs. You can click the name to displaycluster details in the Cluster/Performance Explorer page.
Capacity (free/total)
The total storage capacity of the Namespace and the amount of storage currently available.
Node
The name of the node on which the Namespace resides. You can click the name to displaynode details in the Node/Performance Explorer page.
Path
The full path of the NVMe Namespace, for example, /vol/vol1/namespace1.
State
The state of the Namespace. Valid states can be online, offline, nvfail, and space-error.
Subsystem
The subsystem of the Namespace.
Storage VM
The name of the SVM to which the Namespace belongs. You can click the name to displaySVM details in the Storage VM/Performance Explorer page.
Volume
The name of the volume to which the Namespace belongs. You can click the name todisplay volume details in the Volume/Performance Explorer page.
Network Interface/Performance Information pageUse the Network Interface/Performance Information page to view a list of the configured attributesof the network interface (LIF). This information might help in answering performance-relatedquestions.
Network Interface attributes
IP Address
The IPv4 or IPv6 address assigned to the LIF. There can be multiple IP addresses assignedto a LIF.
Role
The role determines the kind of traffic that is supported over the LIF.
LIFs can have one of the following roles:
• Data
• Cluster
• Node Management
• Intercluster
Failover Group
The name of the failover group that is assigned to the network interface.
568Monitoring performance using the Performance Explorer pages

This field applies only to network LIFs, not to SAN (FC/ISCSI) and NVMe LIFs.
Failover Policy
The name of the failover policy that is assigned to the LIF.
This field applies only to network LIFs, not to SAN (FC/ISCSI) and NVMe LIFs.
Home Port
The name of the node and port that has been defined as the home port for this interface. Youcan click the name to display port details in the Port/Performance Explorer page.
Current Port
The name of the node and port on which the interface is currently hosted. You can click thename to display port details in the Port/Performance Explorer page.
Port/Performance Information pageUse the Port/Performance Information page to view a list of the physical and logical attributes ofthe port. This information might help in answering performance-related questions.
Port attributes
WWN
The WWN (World Wide Name) of the port.
Node
The name of the node on which the physical port resides. You can click the name to displaynode details in the Node/Performance Explorer page.
Cluster
The name of the cluster to which the port belongs. You can click the name to display clusterdetails the Cluster/Performance Explorer page.
Operational Speed
The actual speed at which the port is configured to run.
FCP ports are auto-sensing and display as "Auto".
Role
The network port function: either Data or Cluster.
FCP ports cannot have a role, and this field is not displayed.
Type
The port type: either Network or FCP (Fibre Channel Protocol).
State
The link status of the port.
• For network ports, an active port is listed as "Up" and an inactive port is listed as"Down".
• For FCP ports, an active port is listed as "Online" and an inactive port is listed as "Linknot connected".
569Monitoring performance using the Performance Explorer pages

Managing performance using QoS policy group information
Unified Manager enables you to view the quality of service (QoS) policy groups that are availableon all the clusters you are monitoring. The policies may have been defined using ONTAP software(System Manager or the ONTAP CLI) or by Unified Manager Performance Service Level policies.Unified Manager also displays which volumes and LUNs have a QoS policy group assigned.
For more information on adjusting QoS settings, see the ONTAP 9 Performance Monitoring PowerGuide.
ONTAP 9 Performance Monitoring Power Guide
How storage QoS can control workload throughputYou can create a Quality of Service (QoS) policy group to control the I/O per second (IOPS) orthroughput (MB/s) limit for the workloads it contains. If the workloads are in a policy group withno set limit, such as the default policy group, or the set limit does not meet your needs, you canincrease the limit or move the workloads to a new or existing policy group that has the desiredlimit.
"Traditional" QoS policy groups can be assigned to individual workloads; for example, a singlevolume or LUN. In this case the workload can use the full throughput limit. QoS policy groupsalso can be assigned to multiple workloads; in which case the throughput limit is "shared" amongthe workloads. For example, a QoS limit of 9,000 IOPS assigned to three workloads would restrictthe combined IOPS from exceeding 9,000 IOPS.
"Adaptive" QoS policy groups can also be assigned to individual workloads or multipleworkloads. However, even when assigned to multiple workloads, each workload gets the fullthroughput limit instead of sharing the throughput value with other workloads. Additionally,adaptive QoS policies automatically adjust the throughput setting based on the volume size, perworkload, thereby maintaining the ratio of IOPS to terabytes as the size of the volume changes.For example, if the peak is set to 5,000 IOPS/TB in an adaptive QoS policy, a 10 TB volume willhave a throughput maximum of 50,000 IOPS. If the volume is resized later to 20 TB, adaptive QoSadjusts the maximum to 100,000 IOPS.
Starting with ONTAP 9.5 you can include the block size when defining an adaptive QoS policy.This effectively converts the policy from an IOPS/TB threshold to a MB/s threshold for caseswhen workloads are using very large block sizes and ultimately using a large percentage ofthroughput.
For shared group QoS policies, when the IOPS or MB/s of all workloads in a policy group exceedsthe set limit, the policy group throttles the workloads to restrict their activity, which can decreasethe performance of all workloads in the policy group. If a dynamic performance event is generatedby policy group throttling, the event description displays the name of the policy group involved.
In the Performance: All Volumes view, you can sort the affected volumes by IOPS and MB/s tosee which workloads have the highest usage that might have contributed to the event. In thePerformance/Volumes Explorer page, you can select other volumes, or LUNs on the volume, tocompare to the affected workload IOPS or MBps throughput usage.
By assigning the workloads that are overusing the node resources to a more restrictive policygroup setting, the policy group throttles the workloads to restrict their activity, which can reducethe use of the resources on that node. However, if you want the workload to be able to use more ofthe node resources, you can increase the value of the policy group.
You can use System Manager, the ONTAP commands, or Unified Manager Performance ServiceLevels to manage policy groups, including the following tasks:
570Managing performance using QoS policy group information

• Creating a policy group
• Adding or removing workloads in a policy group
• Moving a workload between policy groups
• Changing the throughput limit of a policy group
• Moving a workload to a different aggregate and/or node
Related conceptsTroubleshooting workloads using the workload analyzer on page 38
The workload analyzer provides a way to view important health and performance criteria for asingle workload on a single page to assist in troubleshooting. By viewing all current and pastevents for a workload you can get a better idea why the workload may be having a performance orcapacity issue now.
Roles of workloads involved in a performance event on page 603Unified Manager uses roles to identify the involvement of a workload in a performance event. Theroles include victims, bullies, and sharks. A user-defined workload can be a victim, bully, andshark at the same time.
How Unified Manager determines the performance impact for an event on page 599Unified Manager uses the deviation in activity, utilization, write throughput, cluster componentusage, or I/O latency (response time) for a workload to determine the level of impact to workloadperformance. This information determines the role of each workload in the event and how they areranked on the Event details page.
Understanding events from adaptive QoS policies that have a defined block size on page 173Adaptive QoS policy groups automatically scale a throughput ceiling or floor based on the volumesize, maintaining the ratio of IOPS to TBs as the size of the volume changes. Starting withONTAP 9.5 you can specify the block size in the QoS policy to effectively apply a MB/s thresholdat the same time.
Verify whether other volumes in the QoS policy group have unusually high activity on page 193You can review the workloads in the Quality of Service (QoS) policy group with the highestchange in activity to determine whether more than one workload caused the event. You can alsosee whether other workloads are still exceeding the set throughput limit or whether they are backwithin their expected range of activity.
Performance monitoring of MetroCluster configurations on page 592Unified Manager enables you to monitor the write throughput between clusters in a MetroClusterconfiguration to identify workloads with a high amount of write throughput. If these high-performing workloads are causing other volumes on the local cluster to have high I/O responsetimes, Unified Manager triggers performance events to notify you.
Viewing all QoS policy groups available on all clustersYou can display a list of all the QoS policy groups available on the clusters that Unified Manageris monitoring. This includes traditional QoS policies, adaptive QoS policies, and QoS policiesmanaged by Unified Manager Performance Service Level policies.
Steps
1. In the left navigation pane, click Storage > QoS Policy Groups.The Performance: Traditional QoS Policy Groups view is displayed by default.
2. View the detailed configuration settings for each available traditional QoS policy group.
3. Click the expand button ( ) next to the QoS Policy Group name to view more details aboutthe policy group.
571Managing performance using QoS policy group information

4. In the View menu, select one of the additional options to view all the adaptive QoS policygroups or to view all the QoS policy groups that were created using Unified ManagerPerformance Service Levels.
Viewing volumes or LUNs that are in the same QoS policy groupYou can display a list of the volumes and LUNs that have been assigned to the same QoS policygroup.
About this task
In the case of traditional QoS policy groups that are "shared" among multiple volumes, this can behelpful to see if certain volumes are overusing the throughput defined for the policy group. It canalso help you decide if you can add other volumes to the policy group without a negative affect tothe other volumes.
In the case of adaptive QoS policies and Unified Manager Performance Service Levels policies,this can be helpful to view all the volumes or LUNs that are using a policy group so that you cansee which objects would be affected if you changed the configuration settings for the QoS policy.
Steps
1. In the left navigation pane, click Storage > QoS Policy Groups.The Performance: Traditional QoS Policy Groups view is displayed by default.
2. If you are interested in traditional policy group, stay on this page. Otherwise, select one of theadditional View options to display all the adaptive QoS policy groups or all the QoS policygroups that were created by Unified Manager Performance Service Levels.
3. In the QoS policy that you are interested in, click the expand button ( ) next to the QoSPolicy Group name to view more details.
4. Click the Volumes or the LUNs link to view the objects using this QoS policy.The Performance inventory page for Volumes or LUNs is displayed with the sorted list ofobjects that are using the QoS policy.
Related conceptsTroubleshooting workloads using the workload analyzer on page 38
The workload analyzer provides a way to view important health and performance criteria for asingle workload on a single page to assist in troubleshooting. By viewing all current and past
572Managing performance using QoS policy group information

events for a workload you can get a better idea why the workload may be having a performance orcapacity issue now.
Viewing the QoS policy group settings applied to specific volumes or LUNsYou can view the QoS policy groups that have been applied to your volumes and LUNs, and youcan link to the Performance/QoS Policy Groups view to display the detailed configuration settingsfor each QoS policy.
About this task
The steps to view the QoS policy that is applied to a volume are shown below. The steps to viewthis information for a LUN are similar.
Steps
1. In the left navigation pane, click Storage > Volumes.The Health: All Volumes view is displayed by default.
2. In the View menu, select Performance: Volumes in QoS Policy Group.
3. Locate the volume that you want to review and scroll to the right until you see the QoS PolicyGroup column.
4. Click the QoS Policy Group name.The corresponding Quality of Service page is displayed depending on whether it is a traditionalQoS policy, an adaptive QoS policy, or a QoS policy that was created using Unified ManagerPerformance Service Levels.
5. View the detailed configuration settings for the QoS policy group.
6. Click the expand button ( ) next to the QoS Policy Group name to view more details aboutthe policy group.
Related conceptsTroubleshooting workloads using the workload analyzer on page 38
The workload analyzer provides a way to view important health and performance criteria for asingle workload on a single page to assist in troubleshooting. By viewing all current and pastevents for a workload you can get a better idea why the workload may be having a performance orcapacity issue now.
Viewing performance charts to compare volumes or LUNs that are in the sameQoS policy group
You can view the volumes and LUNs that are in the same QoS policy groups and then compare theperformance on a single IOPS, MB/s, or IOPS/TB chart to identify any issues.
About this task
The steps to compare the performance of volumes in the same QoS policy group are shown below.The steps to view this information for a LUN are similar.
Steps
1. In the left navigation pane, click Storage > Volumes.The Health: All Volumes view is displayed by default.
2. In the View menu, select Performance: Volumes in QoS Policy Group.
3. Click the name of the volume that you want to review.The Performance Explorer page is displayed for the volume.
4. In the View and Compare menu, select Volumes in same QoS Policy Group.The other volumes that share the same QoS policy are listed in the table below.
573Managing performance using QoS policy group information

5. Click the Add button to add those volumes to the charts so that you can compare the IOPS,MB/s, IOPS/TB, and other performance counters for all the selected volumes in the charts.
You can change the time range to view the performance over different time intervals other thanthe default of 72 hours.
Related conceptsTroubleshooting workloads using the workload analyzer on page 38
The workload analyzer provides a way to view important health and performance criteria for asingle workload on a single page to assist in troubleshooting. By viewing all current and pastevents for a workload you can get a better idea why the workload may be having a performance orcapacity issue now.
How different types of QoS policies are displayed in the throughput chartsYou can view the ONTAP-defined quality of service (QoS) policy settings that have been appliedto a volume or LUN in the Performance Explorer and Workload Analysis IOPS, IOPS/TB, andMB/s charts. The information displayed in the charts is different depending on the type of QoSpolicy that has been applied to the workload.
A throughput maximum (or "peak") setting defines the maximum throughput that the workloadcan consume, and thereby limits the impact on competing workloads for system resources. Athroughput minimum (or "expected") setting defines the minimum throughput that must beavailable to the workload so that a critical workload meets minimum throughput targets regardlessof demand by competing workloads.
Shared and non-shared QoS policies for IOPS and MB/s use the terms "minimum" and"maximum" to define the floor and ceiling. Adaptive QoS policies for IOPS/TB, which wereintroduced in ONTAP 9.3, use the terms "expected" and "peak" to define the floor and ceiling.
While ONTAP enables you to create these two types of QoS policies, depending on how they areapplied to workloads there are three ways that the QoS policy will be displayed in the performancecharts.
Type of policy Functionality Indicator in Unified Managerinterface
QoS shared policy assigned to asingle workload, or QoS non-sharedpolicy assigned to a single workloador multiple workloads
Each workload can consume thespecified throughput setting
Displays "(QoS)"
QoS shared policy assigned tomultiple workloads
All workloads share the specifiedthroughput setting
Displays "(QoS Shared)"
Adaptive QoS policy assigned to asingle workload or multipleworkloads
Each workload can consume thespecified throughput setting
Displays "(QoS Adaptive)"
The following figure shows an example of how the three options are shown in the counter charts.
574Managing performance using QoS policy group information

When a normal QoS policy that has been defined in IOPS appears in the IOPS/TB chart for aworkload, ONTAP converts the IOPS value to an IOPS/TB value and Unified Manager displaysthat policy in the IOPS/TB chart along with the text "QoS, defined in IOPS".
When an adaptive QoS policy that has been defined in IOPS/TB appears in the IOPS chart for aworkload, ONTAP converts the IOPS/TB value to an IOPS value and Unified Manager displaysthat policy in the IOPS chart along with the text "QoS Adaptive - Used, defined in IOPS/TB" or"QoS Adaptive - Allocated, defined in IOPS/TB" depending on how the peak IOPS allocationsetting is configured. When the allocation setting is set to "allocated-space", the peak IOPS iscalculated based on the size of the volume. When the allocation setting is set to "used-space", thepeak IOPS is calculated based on the amount of data stored in the volume, taking into accountstorage efficiencies.
Note: The IOPS/TB chart displays performance data only when the logical capacity used by thevolume is greater than or equal to 128 GB. Gaps are displayed in the chart when the usedcapacity falls below 128 GB during the selected timeframe.
Related tasksViewing workload QoS minimum and maximum settings in the Performance Explorer on page575
You can view the ONTAP-defined quality of service (QoS) policy settings on a volume or LUN inthe Performance Explorer charts. A throughput maximum setting limits the impact of competingworkloads on system resources. A throughput minimum setting ensures that a critical workloadmeets minimum throughput targets regardless of demand by competing workloads.
Related referenceWhat data does the workload analyzer display on page 39
The workload analyzer page displays information about any current events that could be affectingthe workload, recommendations to potentially fix the issue causing the event, and charts foranalyzing performance and capacity history.
Viewing workload QoS minimum and maximum settings in the PerformanceExplorer
You can view the ONTAP-defined quality of service (QoS) policy settings on a volume or LUN inthe Performance Explorer charts. A throughput maximum setting limits the impact of competing
575Managing performance using QoS policy group information
workloads on system resources. A throughput minimum setting ensures that a critical workloadmeets minimum throughput targets regardless of demand by competing workloads.
About this task
QoS throughput "minimum" and "maximum" IOPS and MB/s settings are displayed in the countercharts only if they have been configured in ONTAP. Throughput minimum settings are availableonly on systems running ONTAP 9.2 or later software, only on AFF systems, and they can be setonly for IOPS at this time.
Adaptive QoS policies are available starting with ONTAP 9.3 and are expressed using IOPS/TBinstead of IOPS. These policies automatically adjust the QoS policy value based on the volumesize, per workload, thereby maintaining the ratio of IOPS to terabytes as the size of the volumechanges. You can apply an adaptive QoS policy group to volumes only. The QoS terminology"expected" and "peak" are used for adaptive QoS policies instead of minimum and maximum.
Unified Manager generates warning events for QoS policy breaches when workload throughputhas exceeded the defined QoS maximum policy setting during each performance collection periodfor the previous hour. Workload throughput may exceed the QoS threshold for only a short periodof time during each collection period, but Unified Manager displays the "average" throughputduring the collection period on the chart. For this reason you may see QoS events while thethroughput for a workload might not have crossed the policy threshold shown in the chart.
Steps
1. In the Performance Explorer page for your selected volume or LUN, perform the followingactions to view the QoS ceiling and floor settings:
If you want to... Do this...
View the IOPS ceiling (the QoSmax)
In the IOPS Total or Breakdown chart, click Zoom View.
View the MB/s ceiling (the QoSmax)
In the MB/s Total or Breakdown chart, click Zoom View.
View the IOPS floor (the QoSmin)
In the IOPS Total or Breakdown chart, click Zoom View.
View the IOPS/TB ceiling (theQoS peak)
For volumes, in the IOPS/TB chart, click Zoom View.
View the IOPS/TB floor (the QoSexpected)
For volumes, in the IOPS/TB chart, click Zoom View.
The dashed, horizontal line indicates the maximum or minimum throughput value set inONTAP. You can also view when changes to the QoS values were implemented.
2. To view the specific IOPS and MB/s values compared to the QoS setting, move your cursorinto the chart area to see the popup window.
After you finish
If you notice that certain volumes or LUNs have very high IOPS or MB/s and are stressing systemresources, you can use System Manager or the ONTAP CLI to adjust the QoS settings so that theseworkloads do not affect the performance of other workloads.
For more information on adjusting QoS settings, see the ONTAP 9 Performance Monitoring PowerGuide.
ONTAP 9 Performance Monitoring Power Guide
576Managing performance using QoS policy group information

Related conceptsHow storage QoS can control workload throughput on page 570
You can create a Quality of Service (QoS) policy group to control the I/O per second (IOPS) orthroughput (MB/s) limit for the workloads it contains. If the workloads are in a policy group withno set limit, such as the default policy group, or the set limit does not meet your needs, you canincrease the limit or move the workloads to a new or existing policy group that has the desiredlimit.
How different types of QoS policies are displayed in the throughput charts on page 574You can view the ONTAP-defined quality of service (QoS) policy settings that have been appliedto a volume or LUN in the Performance Explorer and Workload Analysis IOPS, IOPS/TB, andMB/s charts. The information displayed in the charts is different depending on the type of QoSpolicy that has been applied to the workload.
Understanding events from adaptive QoS policies that have a defined block size on page 173Adaptive QoS policy groups automatically scale a throughput ceiling or floor based on the volumesize, maintaining the ratio of IOPS to TBs as the size of the volume changes. Starting withONTAP 9.5 you can specify the block size in the QoS policy to effectively apply a MB/s thresholdat the same time.
Related tasksResponding to QoS policy group performance events on page 172
Unified Manager generates QoS policy warning events when workload throughput (IOPS,IOPS/TB, or MBps) has exceeded the defined ONTAP QoS policy setting and workload latency isbecoming affected. These system-defined events provide the opportunity to correct potentialperformance issues before many workloads are affected by latency.
577Managing performance using QoS policy group information

Understanding and using the Node Failover Planning page
The Performance/Node Failover Planning page estimates the performance impact on a node if thenode's high-availability (HA) partner node fails. Unified Manager bases the estimates on thehistorical performance of the nodes in the HA pair.
Estimating the performance impact of a failover helps you to plan in the following scenarios:
• If a failover consistently degrades the takeover node's estimated performance to anunacceptable level, you can consider taking corrective actions to reduce the performanceimpact due to a failover.
• Before initiating a manual failover to perform hardware maintenance tasks, you can estimatehow the failover affects the performance of the takeover node in order to determine the besttime to perform the task.
Related conceptsUsing the Node Failover Planning page to determine corrective actions on page 578
Based on the information that is displayed in the Performance/Node Failover Planning page, youcan take actions to ensure that a failover does not cause the performance of an HA pair to dropbelow an acceptable level.
Using a threshold policy with the Node Failover Planning page on page 580You can create a node threshold policy so that you can be notified in the Performance/NodeFailover Planning page when a potential failover would degrade the performance of the takeovernode to an unacceptable level.
Related tasksUsing the Performance Capacity Used Breakdown chart for failover planning on page 581
The detailed Performance Capacity Used - Breakdown chart shows the performance capacity usedfor the Primary node and the Partner node. It also shows the amount of free performance capacityon the Estimated Takeover node. This information helps you determine whether you might have aperformance issue if the partner node fails.
Related referenceComponents of the Node Failover Planning page on page 579
The components of the Performance/Node Failover Planning page are displayed in a grid and inthe Comparing pane. These sections enable you to assess the impact of a node failover on theperformance of the takeover node.
Using the Node Failover Planning page to determine corrective actionsBased on the information that is displayed in the Performance/Node Failover Planning page, youcan take actions to ensure that a failover does not cause the performance of an HA pair to dropbelow an acceptable level.
For example, to reduce the estimated performance impact of a failover, you can move somevolumes or LUNs from a node in the HA pair to other nodes in the cluster. Doing so ensures thatthe primary node can continue to deliver acceptable performance after a failover.
Related tasksMoving workloads to another node in a different HA pair on page 203
You can use Unified Manager to help identify an aggregate on a node in a different HA pair that isless busy than the HA pair where your workloads are currently running. Then you can moveselected volumes to aggregates on the new HA pair. Moving high-performing workloads to anaggregate on a less busy node allows workloads on both nodes to perform more efficiently.
578Understanding and using the Node Failover Planning page

Components of the Node Failover Planning pageThe components of the Performance/Node Failover Planning page are displayed in a grid and inthe Comparing pane. These sections enable you to assess the impact of a node failover on theperformance of the takeover node.
Performance statistics grid
The Performance/Node Failover Planning page displays a grid containing statistics for latency,IOPS, utilization, and performance capacity used.
Note: Latency and IOPS values displayed in this page and in the Performance/NodePerformance Explorer page might not match because different performance counters are used tocalculate the values to predict node failover.
In the grid, each node is assigned one of the following roles:
• Primary
The node that takes over for the HA partner when the partner fails. The root object is alwaysthe Primary node.
• Partner
The node that fails in the failover scenario.
• Estimated Takeover
The same as the Primary node. Performance statistics displayed for this node show thetakeover node's performance after it takes over the failed partner.
Note: Although the workload of the takeover node is equivalent to the combined workloads ofboth nodes after a failover, the statistics for the Estimated Takeover node are not the sum of thestatistics of the Primary node and the Partner node. For example, if the latency of the Primarynode is 2 ms/op and the latency of the Partner node is 3 ms/op, the Estimated Takeover nodemight have a latency of 4 ms/op. This value is a calculation that Unified Manager performs.
You can click the name of the Partner node if you want it to become the root object. After thePerformance/Node Performance Explorer page is displayed, you can click the Failover Planningtab to see how performance changes in this node failure scenario. For example, if Node1 is thePrimary node and Node2 is the Partner node, you can click Node2 to make it the Primary node. Inthis way, you can see how the estimated performance changes depending on which node fails.
Comparing pane
The following list describes the components displayed in the Comparing pane by default:
Events charts
They are displayed in the same format as those in the Performance/Node PerformanceExplorer page. They pertain to the Primary node only.
Counter charts
They display historical statistics for the performance counter shown in the grid. In eachchart, the graph for the Estimated Takeover node shows the estimated performance if afailover had occurred at any given time.
For example, suppose the Utilization chart shows 73% for the Estimated Takeover node at11 a.m. on February 8. If a failover had occurred at that time, the utilization of the takeovernode would have been 73%.
The historical statistics help you find the optimal time for initiating a failover, minimizingthe possibility of overloading the takeover node. You can schedule a failover only at timeswhen the predicted performance of the takeover node is acceptable.
579Understanding and using the Node Failover Planning page

By default, statistics for both the root object and the partner node are displayed in the Comparingpane. Unlike in the Performance/Node Performance Explorer page, this page does not display theAdd button for you to add objects for statistics comparison.
You can customize the Comparing pane in the same way as you do in the Performance/NodePerformance Explorer page. The following list shows examples of customizing the charts:
• Click a node name to show or hide the node's statistics in the Counter charts.
• Click Zoom View to display a detailed chart for a particular counter in a new window.
Related conceptsUnderstanding the root object on page 520
The root object is the baseline against which other object comparisons are made. This enables youto view and compare the data from other objects to the root object, providing performance dataanalysis that helps you to troubleshoot and improve object performance.
Understanding counter charts on page 523Charts in the Counter Charts pane enable you to view and compare performance data for the rootobject and for objects you have added from the correlated objects grid. This can help youunderstand performance trends and isolate and resolve performance issues.
Related tasksSpecifying the time range in Zoom View on page 529
The Time Range control in the Counter Charts Zoom View window enables you to specify a dateand time range for the selected chart. This enables you to quickly locate specific data based oneither a preset time range or your own custom time range.
Viewing event details in the Events Timeline on page 527You can view all events and their related details in the Events Timeline pane of PerformanceExplorer. This is a quick and efficient method of viewing all the health and performance eventsthat occurred on the root object during a specified time range, which can be helpful whentroubleshooting performance issues.
Using a threshold policy with the Node Failover Planning pageYou can create a node threshold policy so that you can be notified in the Performance/NodeFailover Planning page when a potential failover would degrade the performance of the takeovernode to an unacceptable level.
The system-defined performance threshold policy named "Node HA pair over-utilized" generates awarning event if the threshold is breached for six consecutive collection periods (30 minutes). Thethreshold is considered breached if the combined performance capacity used of the nodes in anHA pair exceeds 200%.
The event from the system-defined threshold policy alerts you to the fact that a failover will causethe latency of the takeover node to increase to an unacceptable level. When you see an event that isgenerated by this policy for a particular node, you can navigate to the Performance/Node FailoverPlanning page for that node to view the predicted latency value due to a failover.
In addition to using this system-defined threshold policy, you can create threshold policies byusing the "Performance Capacity Used - Takeover" counter, and then apply the policy to selectednodes. Specifying a threshold lower than 200% enables you to receive an event before thethreshold for the system-defined policy is breached. You can also specify the minimum period oftime for which the threshold is exceeded to less than 30 minutes if you want to be notified beforethe system-defined policy event is generated.
For example, you can define a threshold policy to generate a warning event if the combinedperformance capacity used of the nodes in an HA pair exceeds 175% for more than 10 minutes.You can apply this policy to Node1 and Node2, which form an HA pair. After receiving a warning
580Understanding and using the Node Failover Planning page

event notification for either Node1 or Node2, you can view the Performance/Node FailoverPlanning page for that node to assess the estimated performance impact on the takeover node. Youcan take corrective actions to avoid overloading the takeover node if a failover does happen. If youtake action when the combined performance capacity used of the nodes is under 200%, thetakeover node's latency does not reach an unacceptable level even if a failover happens during thistime.
Related conceptsHow user-defined performance threshold policies work on page 152
You set performance threshold policies on storage objects (for example, on aggregates andvolumes) so that an event can be sent to the storage administrator to inform the administrator thatthe cluster is experiencing a performance issue.
What happens when a performance threshold policy is breached on page 154When a counter value exceeds its defined performance threshold value for the amount of timespecified in the duration, the threshold is breached and an event is reported.
Related tasksCreating user-defined performance threshold policies on page 157
You create performance threshold policies for storage objects so that notifications are sent when aperformance counter exceeds a specific value. The event notification identifies that the cluster isexperiencing a performance issue.
Using the Performance Capacity Used Breakdown chart for failover planningThe detailed Performance Capacity Used - Breakdown chart shows the performance capacity usedfor the Primary node and the Partner node. It also shows the amount of free performance capacityon the Estimated Takeover node. This information helps you determine whether you might have aperformance issue if the partner node fails.
About this task
In addition to showing the total performance capacity used for the nodes, the Breakdown chartbreaks the values for each node into user protocols and background processes.
• User protocols are the I/O operations from user applications to and from the cluster.
• Background processes are the internal system processes involved with storage efficiency, datareplication, and system health.
This additional level of detail enables you to determine whether a performance issue is caused byuser application activity or background system processes, such as deduplication, RAIDreconstruct, disk scrubbing, and SnapMirror copies.
Steps
1. Go to the Performance/Node Failover Planning page for the node that will serve as theEstimated Takeover node.
2. From the Time Range selector, choose the period of time for which the historical statistics aredisplayed in the counter grid and counter charts.The counter charts with statistics for the Primary node, Partner node, and Estimated Takeovernode are displayed.
3. From the Choose charts list, select Perf. Capacity Used.
4. In the Perf. Capacity Used chart, select Breakdown and click Zoom View.The detailed chart for Perf. Capacity Used is displayed.
581Understanding and using the Node Failover Planning page
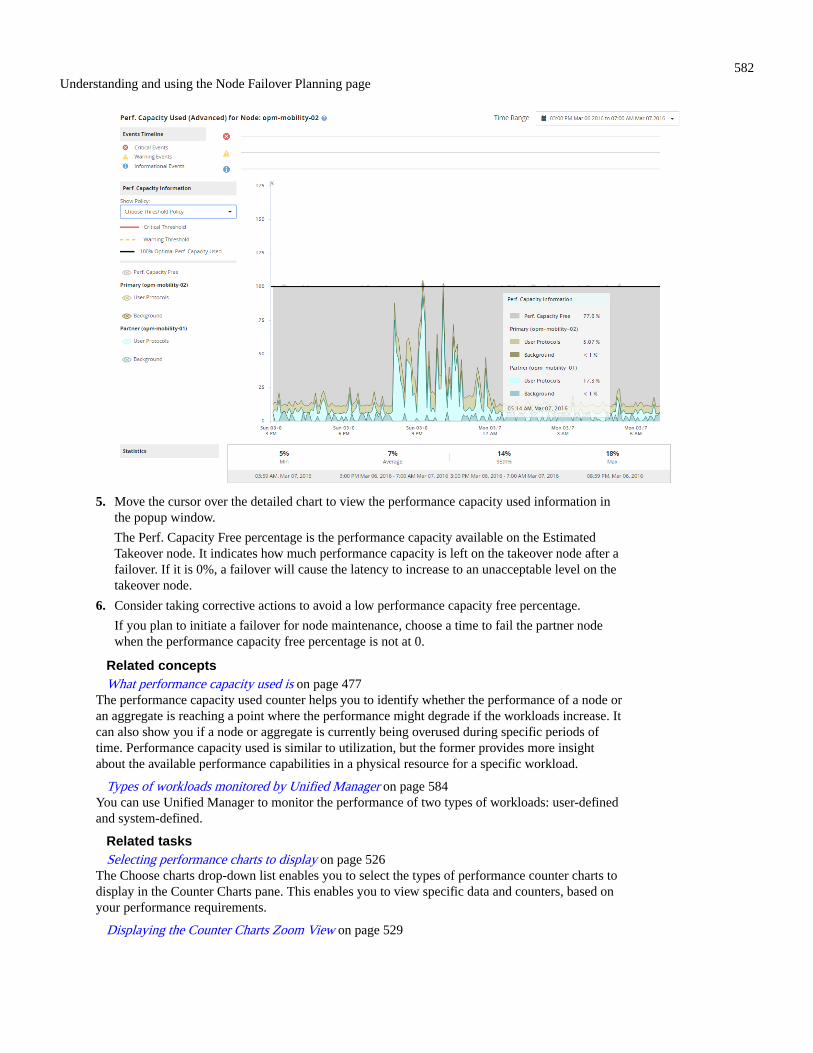
5. Move the cursor over the detailed chart to view the performance capacity used information inthe popup window.
The Perf. Capacity Free percentage is the performance capacity available on the EstimatedTakeover node. It indicates how much performance capacity is left on the takeover node after afailover. If it is 0%, a failover will cause the latency to increase to an unacceptable level on thetakeover node.
6. Consider taking corrective actions to avoid a low performance capacity free percentage.
If you plan to initiate a failover for node maintenance, choose a time to fail the partner nodewhen the performance capacity free percentage is not at 0.
Related conceptsWhat performance capacity used is on page 477
The performance capacity used counter helps you to identify whether the performance of a node oran aggregate is reaching a point where the performance might degrade if the workloads increase. Itcan also show you if a node or aggregate is currently being overused during specific periods oftime. Performance capacity used is similar to utilization, but the former provides more insightabout the available performance capabilities in a physical resource for a specific workload.
Types of workloads monitored by Unified Manager on page 584You can use Unified Manager to monitor the performance of two types of workloads: user-definedand system-defined.
Related tasksSelecting performance charts to display on page 526
The Choose charts drop-down list enables you to select the types of performance counter charts todisplay in the Counter Charts pane. This enables you to view specific data and counters, based onyour performance requirements.
Displaying the Counter Charts Zoom View on page 529
582Understanding and using the Node Failover Planning page

The Counter Charts Zoom View provides a finer level of detail for the selected counter chart andits associated timeline. This magnifies the counter chart data, enabling you to have a sharper viewinto performance events and their underlying causes.
583Understanding and using the Node Failover Planning page

Collecting data and monitoring workload performance
Unified Manager collects and analyzes workload activity every 5 minutes to identify performanceevents, and it detects configuration changes every 15 minutes. It retains a maximum of 30 days of5-minute historical performance and event data, and it uses this data to forecast the expectedlatency range for all monitored workloads.
Unified Manager must collect a minimum of 3 days of workload activity before it can begin itsanalysis and before the latency forecast for I/O response time can be displayed on the WorkloadAnalysis page and in the Event details page. While this activity is being collected, the latencyforecast does not display all changes occurring from workload activity. After collecting 3 days ofactivity, Unified Manager adjusts the latency forecast every 24 hours at 12:00 a.m., to reflectworkload activity changes and establish a more accurate dynamic performance threshold.
During the first 4 days that Unified Manager is monitoring a workload, if more than 24 hours havepassed since the last data collection, the latency charts will not display the latency forecast for thatworkload. Events detected prior to the last collection are still available.
Note: Daylight savings time (DST) changes the system time, which alters the latency forecast ofperformance statistics for monitored workloads. Unified Manager immediately begins to correctthe latency forecast, which takes approximately 15 days to complete. During this time you cancontinue to use Unified Manager, but, since Unified Manager uses the latency forecast to detectdynamic events, some events might not be accurate. Events detected prior to the time change arenot affected.
Related conceptsHow the cluster discovery process works on page 616
After you have added a cluster to Unified Manager, the server discovers the cluster objects andadds them to its database. Understanding how the discovery process works helps you to manageyour organization's clusters and their objects.
What the expected range of performance is on page 587The latency forecast is a prediction of what the upper and lower performance values are expectedto be at a specific time. For the workload latency, the upper values form the performancethreshold. When the actual value crosses the performance threshold, Unified Manager triggers adynamic performance event.
Related referenceWorkload performance measurement values on page 585
Unified Manager measures the performance of workloads on a cluster based on historical andexpected statistical values, which form the latency forecast of values for the workloads. Itcompares the actual workload statistical values to the latency forecast to determine when workloadperformance is too high or too low. A workload that is not performing as expected triggers adynamic performance event to notify you.
Types of workloads monitored by Unified ManagerYou can use Unified Manager to monitor the performance of two types of workloads: user-definedand system-defined.
User-defined workloads
The I/O throughput from applications to the cluster. These are processes involved in readand write requests. A volume, LUN, NFS share, SMB/CIFS share, and a workload is a user-defined workload.
Note: Unified Manager only monitors the workload activity on the cluster. It does notmonitor the applications, the clients, or the paths between the applications and the cluster.
584Collecting data and monitoring workload performance

If one or more of the following is true for a workload, it cannot be monitored by UnifiedManager:
• It is a data protection (DP) copy in read-only mode. (DP volumes are monitored foruser-generated traffic.)
• It is an offline data clone.
• It is a mirrored volume in a MetroCluster configuration.
System-defined workloads
The internal processes involved with storage efficiency, data replication, and system health,including:
• Storage efficiency, such as deduplication
• Disk health, which includes RAID reconstruct, disk scrubbing, and so on
• Data replication, such as SnapMirror copies
• Management activities
• File system health, which includes various WAFL activities
• File system scanners, such as WAFL scan
• Copy offload, such as offloaded storage efficiency operations from VMware hosts
• System health, such as volume moves, data compression, and so on
• Unmonitored volumes
Performance data for system-defined workloads is displayed in the GUI only when the clustercomponent used by these workloads is in contention. For example, you cannot search for the nameof a system-defined workload to view its performance data in the GUI.
Related conceptsRoles of workloads involved in a performance event on page 603
Unified Manager uses roles to identify the involvement of a workload in a performance event. Theroles include victims, bullies, and sharks. A user-defined workload can be a victim, bully, andshark at the same time.
Cluster components and why they can be in contention on page 600You can identify cluster performance issues when a cluster component goes into contention. Theperformance of workloads that use the component slow down and their response time (latency) forclient requests increases, which triggers an event in Unified Manager.
Related referencePerformance event analysis and notification on page 597
Performance events notify you about I/O performance issues on a workload caused by contentionon a cluster component. Unified Manager analyzes the event to identify all workloads involved,the component in contention, and whether the event is still an issue that you might need to resolve.
Event details page on page 108From the Event details page, you can view the details of a selected event, such as the eventseverity, impact level, impact area, and event source. You can also view additional informationabout possible remediations to resolve the issue.
Workload performance measurement valuesUnified Manager measures the performance of workloads on a cluster based on historical andexpected statistical values, which form the latency forecast of values for the workloads. Itcompares the actual workload statistical values to the latency forecast to determine when workloadperformance is too high or too low. A workload that is not performing as expected triggers adynamic performance event to notify you.
585Collecting data and monitoring workload performance

In the following illustration, the actual value, in red, represents the actual performance statistics inthe time frame. The actual value has crossed the performance threshold, which is the upper boundsof the latency forecast. The peak is the highest actual value in the time frame. The deviationmeasures the change between the expected values (the forecast) and the actual values, while thepeak deviation indicates the largest change between the expected values and the actual values.
The following table lists the workload performance measurement values.
Measurement Description
Activity The percentage of the QoS limit used by the workloads in the policy group.
Note: If Unified Manager detects a change to a policy group, such as adding orremoving a volume or changing the QoS limit, the actual and expected values mightexceed 100% of the set limit. If a value exceeds 100% of the set limit it is displayed as>100%. If a value is less than 1% of the set limit it is displayed as <1%.
Actual The measured performance value at a specific time for a given workload.
Deviation The change between the expected values and the actual values. It is the ratio of the actualvalue minus the expected value to the upper value of the expected range minus theexpected value.
Note: A negative deviation value indicates that workload performance is lower thanexpected, while a positive deviation value indicates that workload performance ishigher than expected.
Expected The expected values are based on the analysis of historical performance data for a givenworkload. Unified Manager analyzes these statistical values to determine the expectedrange (latency forecast) of values.
Latency Forecast(Expected Range)
The latency forecast is a prediction of what the upper and lower performance values areexpected to be at a specific time. For the workload latency, the upper values form theperformance threshold. When the actual value crosses the performance threshold, UnifiedManager triggers a dynamic performance event.
Peak The maximum value measured over a period of time.
Peak Deviation The maximum deviation value measured over a period of time.
Queue Depth The number of pending I/O requests that are waiting at the interconnect component.
Utilization For the network processing, data processing, and aggregate components, the percentage ofbusy time to complete workload operations over a period of time. For example, thepercentage of time for the network processing or data processing components to processan I/O request or for an aggregate to fulfill a read or write request.
586Collecting data and monitoring workload performance

Measurement Description
Write Throughput The amount of write throughput, in Megabytes per second (MB/s), from workloads on alocal cluster to the partner cluster in a MetroCluster configuration.
Related conceptsWhat the expected range of performance is on page 587
The latency forecast is a prediction of what the upper and lower performance values are expectedto be at a specific time. For the workload latency, the upper values form the performancethreshold. When the actual value crosses the performance threshold, Unified Manager triggers adynamic performance event.
Roles of workloads involved in a performance event on page 603Unified Manager uses roles to identify the involvement of a workload in a performance event. Theroles include victims, bullies, and sharks. A user-defined workload can be a victim, bully, andshark at the same time.
What the expected range of performance isThe latency forecast is a prediction of what the upper and lower performance values are expectedto be at a specific time. For the workload latency, the upper values form the performancethreshold. When the actual value crosses the performance threshold, Unified Manager triggers adynamic performance event.
For example, during regular business hours between 9:00 a.m. and 5:00 p.m., most employeesmight check their email between 9:00 a.m. and 10:30 a.m. The increased demand on the emailservers means an increase in workload activity on the back-end storage during this time.Employees might notice slow response time from their email clients.
During the lunch hour between 12:00 p.m. and 1:00 p.m. and at the end of the work day after 5:00p.m., most employees are likely away from their computers. The demand on the email serverstypically decreases, also decreasing the demand on back-end storage. Alternatively, there could bescheduled workload operations, such as storage backups or virus scanning, that start after 5:00p.m. and increase activity on the back-end storage.
Over several days, the increase and decrease in workload activity determines the expected range(latency forecast) of activity, with upper and lower boundaries for a workload. When the actualworkload activity for an object is outside the upper or lower boundaries, and remains outside theboundaries for a period of time, this might indicate that the object is being overused or underused.
How the latency forecast is formed
Unified Manager must collect a minimum of 3 days of workload activity before it can begin itsanalysis and before the latency forecast for I/O response time can be displayed in the GUI. Theminimum required data collection does not account for all changes occurring from workloadactivity. After collecting the first 3 days of activity, Unified Manager adjusts the latency forecastevery 24 hours at 12:00 a.m. to reflect workload activity changes and establish a more accuratedynamic performance threshold.
Note: Daylight savings time (DST) changes the system time, which alters the latency forecast ofperformance statistics for monitored workloads. Unified Manager immediately begins to correctthe latency forecast, which takes approximately 15 days to complete. During this time you cancontinue to use Unified Manager, but, since Unified Manager uses the latency forecast to detectdynamic events, some events might not be accurate. Events detected prior to the time change arenot affected.
Related conceptsCollecting data and monitoring workload performance on page 584
587Collecting data and monitoring workload performance

Unified Manager collects and analyzes workload activity every 5 minutes to identify performanceevents, and it detects configuration changes every 15 minutes. It retains a maximum of 30 days of5-minute historical performance and event data, and it uses this data to forecast the expectedlatency range for all monitored workloads.
Related tasksUsing the workload analyzer on page 41
There are many ways to start the workload analyzer from the user interface. Here we describelaunching the tool from the left-navigation pane.
Related referenceHow the latency forecast is used in performance analysis on page 588
Unified Manager uses the latency forecast to represent the typical I/O latency (response time)activity for your monitored workloads. It alerts you when the actual latency for a workload isabove the upper bounds of the latency forecast, which triggers a dynamic performance event, sothat you can analyze the performance issue and take corrective action for resolving it.
Performance event analysis and notification on page 597Performance events notify you about I/O performance issues on a workload caused by contentionon a cluster component. Unified Manager analyzes the event to identify all workloads involved,the component in contention, and whether the event is still an issue that you might need to resolve.
Workload performance measurement values on page 585Unified Manager measures the performance of workloads on a cluster based on historical andexpected statistical values, which form the latency forecast of values for the workloads. Itcompares the actual workload statistical values to the latency forecast to determine when workloadperformance is too high or too low. A workload that is not performing as expected triggers adynamic performance event to notify you.
How the latency forecast is used in performance analysisUnified Manager uses the latency forecast to represent the typical I/O latency (response time)activity for your monitored workloads. It alerts you when the actual latency for a workload isabove the upper bounds of the latency forecast, which triggers a dynamic performance event, sothat you can analyze the performance issue and take corrective action for resolving it.
The latency forecast sets the performance baseline for the workload. Over time, Unified Managerlearns from past performance measurements to forecast the expected performance and activitylevels for the workload. The upper boundary of the expected range establishes the dynamicperformance threshold. Unified Manager uses the baseline to determine when the actual latency isabove or below a threshold, or outside the bounds of their expected range. The comparisonbetween the actual values and the expected values creates a performance profile for the workload.
When the actual latency for a workload exceeds the dynamic performance threshold, due tocontention on a cluster component, the latency is high and the workload performs more slowlythan expected. The performance of other workloads that share the same cluster components mightalso be slower than expected.
Unified Manager analyzes the threshold crossing event and determines whether the activity is aperformance event. If the high workload activity remains consistent for a long period of time, suchas several hours, Unified Manager considers the activity to be normal and dynamically adjusts thelatency forecast to form the new dynamic performance threshold.
Some workloads might have consistently low activity, where the latency forecast for latency doesnot have a high rate of change over time. To minimize the number of events during analysis ofperformance events, Unified Manager triggers an event only for low-activity volumes whoseoperations and latencies are much higher than expected.
588Collecting data and monitoring workload performance

In this example, the latency for a volume has a latency forecast, in gray, of 3.5 milliseconds peroperation (ms/op) at its lowest and 5.5 ms/op at its highest. If the actual latency, in blue, suddenlyincreases to 10 ms/op, due to an intermittent spike in network traffic or contention on a clustercomponent, it is then above the latency forecast and has exceeded the dynamic performancethreshold.
When network traffic has decreased, or the cluster component is no longer in contention, thelatency returns within the latency forecast. If the latency remains at or above 10 ms/op for a longperiod of time, you might need to take corrective action to resolve the event.
Related conceptsWhat the expected range of performance is on page 587
The latency forecast is a prediction of what the upper and lower performance values are expectedto be at a specific time. For the workload latency, the upper values form the performancethreshold. When the actual value crosses the performance threshold, Unified Manager triggers adynamic performance event.
Collecting data and monitoring workload performance on page 584Unified Manager collects and analyzes workload activity every 5 minutes to identify performanceevents, and it detects configuration changes every 15 minutes. It retains a maximum of 30 days of5-minute historical performance and event data, and it uses this data to forecast the expectedlatency range for all monitored workloads.
Related tasksUsing the workload analyzer on page 41
There are many ways to start the workload analyzer from the user interface. Here we describelaunching the tool from the left-navigation pane.
Related referencePerformance event analysis and notification on page 597
Performance events notify you about I/O performance issues on a workload caused by contentionon a cluster component. Unified Manager analyzes the event to identify all workloads involved,the component in contention, and whether the event is still an issue that you might need to resolve.
Workload performance measurement values on page 585Unified Manager measures the performance of workloads on a cluster based on historical andexpected statistical values, which form the latency forecast of values for the workloads. Itcompares the actual workload statistical values to the latency forecast to determine when workloadperformance is too high or too low. A workload that is not performing as expected triggers adynamic performance event to notify you.
589Collecting data and monitoring workload performance

How Unified Manager uses workload latency to identify performance issuesThe workload latency (response time) is the time it takes for a volume on a cluster to respond toI/O requests from client applications. Unified Manager uses the latency to detect and alert you toperformance events.
A high latency means that requests from applications to a volume on a cluster are taking longerthan usual. The cause of the high latency could be on the cluster itself, due to contention on one ormore cluster components. High latency could also be caused by issues outside of the cluster, suchas network bottlenecks, issues with the client hosting the applications, or issues with theapplications themselves.
Note: Unified Manager only monitors the workload activity on the cluster. It does not monitorthe applications, the clients, or the paths between the applications and the cluster.
Operations on the cluster, such as making backups or running deduplication, that increase theirdemand of cluster components shared by other workloads can also contribute to high latency. Ifthe actual latency exceeds the dynamic performance threshold of the expected range (latencyforecast), Unified Manager analyzes the event to determine whether it is a performance event thatyou might need to resolve. The latency is measured in milliseconds per operation (ms/op).
On the Latency Total chart in the Workload Analysis page, you can view an analysis of the latencystatistics to see how the activity of individual processes, such as read and write requests, comparesto the overall latency statistics. The comparison helps you determine which operations have thehighest activity or whether specific operations have abnormal activity that is impacting the latencyfor a volume. When analyzing performance events, you can use the latency statistics to determinewhether an event was caused by an issue on the cluster. You can also identify the specificworkload activities or cluster components that are involved in the event.
This example shows the Latency chart . The actual response time (latency) activity is a blue lineand the latency forecast (expected range) is green.
Note: There can be gaps in the blue line if Unified Manager was unable to gather data. This canoccur because the cluster or volume was unreachable, Unified Manager was turned off duringthat time, or the collection was taking longer than the 5 minute collection period.
Related conceptsWhat the expected range of performance is on page 587
The latency forecast is a prediction of what the upper and lower performance values are expectedto be at a specific time. For the workload latency, the upper values form the performance
590Collecting data and monitoring workload performance

threshold. When the actual value crosses the performance threshold, Unified Manager triggers adynamic performance event.
How cluster operations can affect workload latency on page 591Operations (IOPS) represent the activity of all user-defined and system-defined workloads on acluster. The IOPS statistics help you determine whether cluster processes, such as making backupsor running deduplication, are impacting workload latency (response time) or might have caused, orcontributed to, a performance event.
Related tasksUsing the workload analyzer on page 41
There are many ways to start the workload analyzer from the user interface. Here we describelaunching the tool from the left-navigation pane.
Related referencePerformance event analysis and notification on page 597
Performance events notify you about I/O performance issues on a workload caused by contentionon a cluster component. Unified Manager analyzes the event to identify all workloads involved,the component in contention, and whether the event is still an issue that you might need to resolve.
How cluster operations can affect workload latencyOperations (IOPS) represent the activity of all user-defined and system-defined workloads on acluster. The IOPS statistics help you determine whether cluster processes, such as making backupsor running deduplication, are impacting workload latency (response time) or might have caused, orcontributed to, a performance event.
When analyzing performance events, you can use the IOPS statistics to determine whether aperformance event was caused by an issue on the cluster. You can identify the specific workloadactivities that might have been the main contributors to the performance event. IOPS are measuredin operations per second (ops/sec).
This example shows the IOPS chart. The actual operations statistics is a blue line and the IOPSforecast of operations statistics is green.
Note: In some cases where a cluster is overloaded, Unified Manager might display the messageData collection is taking too long on Cluster cluster_name. This means thatnot enough statistics have been collected for Unified Manager to analyze. You need to reducethe resources the cluster is using so that statistics can be collected.
591Collecting data and monitoring workload performance

Related conceptsWhat the expected range of performance is on page 587
The latency forecast is a prediction of what the upper and lower performance values are expectedto be at a specific time. For the workload latency, the upper values form the performancethreshold. When the actual value crosses the performance threshold, Unified Manager triggers adynamic performance event.
How Unified Manager uses workload latency to identify performance issues on page 590The workload latency (response time) is the time it takes for a volume on a cluster to respond toI/O requests from client applications. Unified Manager uses the latency to detect and alert you toperformance events.
Performance monitoring of MetroCluster configurationsUnified Manager enables you to monitor the write throughput between clusters in a MetroClusterconfiguration to identify workloads with a high amount of write throughput. If these high-performing workloads are causing other volumes on the local cluster to have high I/O responsetimes, Unified Manager triggers performance events to notify you.
When a local cluster in a MetroCluster configuration mirrors its data to its partner cluster, the datais written to NVRAM and then transferred over the interswitch links (ISLs) to the remoteaggregates. Unified Manager analyzes the NVRAM to identify the workloads whose high writethroughput is overutilizing the NVRAM, placing the NVRAM in contention.
Workloads whose deviation in response time has exceeded the performance threshold are calledvictims and workloads whose deviation in write throughput to the NVRAM is higher than usual,causing the contention, are called bullies. Because only the write requests are mirrored to thepartner cluster, Unified Manager does not analyze read throughput.
Unified Manager treats the clusters in a MetroCluster configuration as individual clusters. It doesnot distinguish between clusters that are partners or correlate the write throughput from eachcluster.
Related conceptsPerformance event analysis for a MetroCluster configuration on page 180
You can use Unified Manager to analyze a performance event for a MetroCluster configuration.You can identify the workloads involved in the event and review the suggested actions forresolving it.
Roles of workloads involved in a performance event on page 603Unified Manager uses roles to identify the involvement of a workload in a performance event. Theroles include victims, bullies, and sharks. A user-defined workload can be a victim, bully, andshark at the same time.
Related tasksIdentifying victim workloads involved in a dynamic performance event on page 177
In Unified Manager, you can identify which volume workloads have the highest deviation inresponse time (latency) caused by a storage component in contention. Identifying these workloadshelps you understand why the client applications accessing them have been performing slowerthan usual.
Identifying bully workloads involved in a dynamic performance event on page 178In Unified Manager, you can identify which workloads have the highest deviation in usage for acluster component in contention. Identifying these workloads helps you understand why certainvolumes on the cluster have slow response times (latency).
Identifying shark workloads involved in a dynamic performance event on page 179
592Collecting data and monitoring workload performance
In Unified Manager, you can identify which workloads have the highest deviation in usage for astorage component in contention. Identifying these workloads helps you determine if theseworkloads should be moved to a less-utilized cluster.
Related referencePerformance event analysis and notification on page 597
Performance events notify you about I/O performance issues on a workload caused by contentionon a cluster component. Unified Manager analyzes the event to identify all workloads involved,the component in contention, and whether the event is still an issue that you might need to resolve.
Volume behavior during switchover and switchbackEvents that trigger a switchover or switchback cause active volumes to be moved from one clusterto the other cluster in the disaster recovery group. The volumes on the cluster that were active andserving data to clients are stopped, and the volumes on the other cluster are activated and startserving data. Unified Manager monitors only those volumes that are active and running.
Because volumes are moved from one cluster to another, it is recommended that you monitor bothclusters. A single instance of Unified Manager can monitor both clusters in a MetroClusterconfiguration, but sometimes the distance between the two locations necessitates using twoUnified Manager instances to monitor both clusters. The following figure shows a single instanceof Unified Manager:
593Collecting data and monitoring workload performance
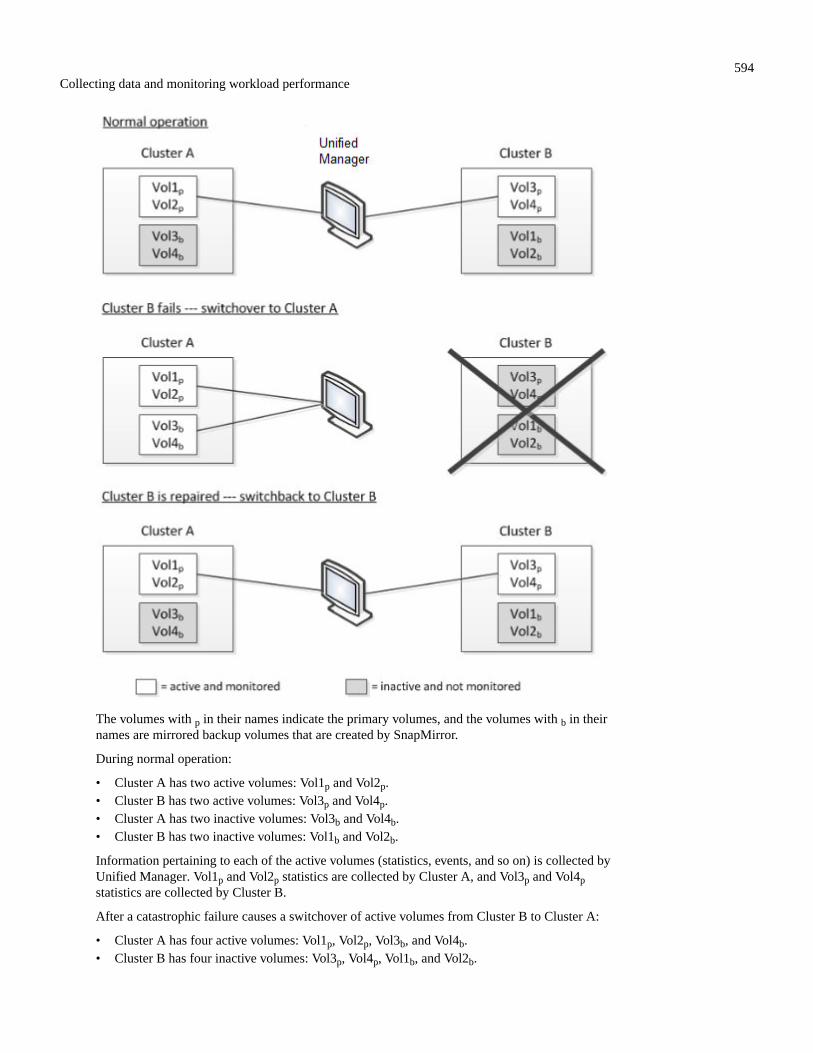
The volumes with p in their names indicate the primary volumes, and the volumes with b in theirnames are mirrored backup volumes that are created by SnapMirror.
During normal operation:
• Cluster A has two active volumes: Vol1p and Vol2p.
• Cluster B has two active volumes: Vol3p and Vol4p.
• Cluster A has two inactive volumes: Vol3b and Vol4b.
• Cluster B has two inactive volumes: Vol1b and Vol2b.
Information pertaining to each of the active volumes (statistics, events, and so on) is collected byUnified Manager. Vol1p and Vol2p statistics are collected by Cluster A, and Vol3p and Vol4p
statistics are collected by Cluster B.
After a catastrophic failure causes a switchover of active volumes from Cluster B to Cluster A:
• Cluster A has four active volumes: Vol1p, Vol2p, Vol3b, and Vol4b.
• Cluster B has four inactive volumes: Vol3p, Vol4p, Vol1b, and Vol2b.
594Collecting data and monitoring workload performance

As during normal operation, information pertaining to each of the active volumes is collected byUnified Manager. But in this case, Vol1p and Vol2p statistics are collected by Cluster A, and Vol3b
and Vol4b statistics are also collected by Cluster A.
Note that Vol3p and Vol3b are not the same volumes, because they are on different clusters. Theinformation in Unified Manager for Vol3p is not the same as Vol3b:
• During switchover to Cluster A, Vol3p statistics and events are not visible.
• On the very first switchover, Vol3b looks like a new volume with no historical information.
When Cluster B is repaired and a switchback is performed, Vol3p is active again on Cluster B,with the historical statistics and a gap of statistics for the period during the switchover. Vol3b is notviewable from Cluster A until another switchover occurs:
Note:
• MetroCluster volumes that are inactive, for example, Vol3b on Cluster A after switchback,are identified with the message "This volume was deleted". The volume is not actuallydeleted, but it is not currently being monitored by Unified Manager because it is not theactive volume.
• If a single Unified Manager is monitoring both clusters in a MetroCluster configuration,volume search returns information for whichever volume is active at that time. For example,a search for "Vol3" would return statistics and events for Vol3b on Cluster A if a switchoverhas occurred and Vol3 has become active on Cluster A.
What performance events arePerformance events are incidents related to workload performance on a cluster. They help youidentify workloads with slow response times. Together with health events that occurred at the sametime, you can determine the issues that might have caused, or contributed to, the slow responsetimes.
When Unified Manager detects multiple occurrences of the same event condition for the samecluster component, it treats all occurrences as a single event, not as separate events.
Related conceptsWhat alerts are on page 118
While events occur continuously, the Unified Manager generates an alert only when an eventmeets specified filter criteria. You can choose the events for which alerts should be generated—forexample, when a space threshold is exceeded or an object goes offline. You can also associate analert with a script that is executed when an alert is triggered.
What health events are on page 43
595Collecting data and monitoring workload performance

Health events are notifications that are generated automatically when a predefined conditionoccurs or when an object crosses a health threshold. These events enable you to take action toprevent issues that can lead to poor performance and system unavailability. Events include animpact area, severity, and impact level.
Event state definitions on page 65The state of an event helps you identify whether an appropriate corrective action is required. Anevent can be New, Acknowledged, Resolved, or Obsolete. Note that both New and Acknowledgedevents are considered to be active events.
What the expected range of performance is on page 587The latency forecast is a prediction of what the upper and lower performance values are expectedto be at a specific time. For the workload latency, the upper values form the performancethreshold. When the actual value crosses the performance threshold, Unified Manager triggers adynamic performance event.
Configuration changes detected by Unified Manager on page 70Unified Manager monitors your clusters for configuration changes to help you determine whethera change might have caused or contributed to a performance event. The Performance Explorer
pages display a change event icon ( ) to indicate the date and time when the change wasdetected.
Roles of workloads involved in a performance event on page 603Unified Manager uses roles to identify the involvement of a workload in a performance event. Theroles include victims, bullies, and sharks. A user-defined workload can be a victim, bully, andshark at the same time.
Types of workloads monitored by Unified Manager on page 584You can use Unified Manager to monitor the performance of two types of workloads: user-definedand system-defined.
Related tasksDisplaying information about performance events on page 168
You can use the Event Management inventory page to view a list of all the performance events onthe clusters being monitored by Unified Manager. By viewing this information you can determinethe most critical events and then drill down to detailed information to determine the cause of theevent.
Related referenceDescription of event severity types on page 66
Each event is associated with a severity type to help you prioritize the events that requireimmediate corrective action.
Description of event impact levels on page 67Each event is associated with an impact level (Incident, Risk, Event, or Upgrade) to help youprioritize the events that require immediate corrective action.
Description of event impact areas on page 67Events are categorized into six impact areas (availability, capacity, configuration, performance,protection, and security) to enable you to concentrate on the types of events for which you areresponsible.
Performance event analysis and notification on page 597
596Collecting data and monitoring workload performance

Performance events notify you about I/O performance issues on a workload caused by contentionon a cluster component. Unified Manager analyzes the event to identify all workloads involved,the component in contention, and whether the event is still an issue that you might need to resolve.
Performance event analysis and notificationPerformance events notify you about I/O performance issues on a workload caused by contentionon a cluster component. Unified Manager analyzes the event to identify all workloads involved,the component in contention, and whether the event is still an issue that you might need to resolve.
Unified Manager monitors the I/O latency (response time) and IOPS (operations) for volumes on acluster. When other workloads overuse a cluster component, for example, the component is incontention and cannot perform at an optimal level to meet workload demands. The performance ofother workloads that are using the same component might be impacted, causing their latencies toincrease. If the latency crosses the dynamic performance threshold, Unified Manager triggers aperformance event to notify you.
Event analysis
Unified Manager performs the following analyses, using the previous 15 days of performancestatistics, to identify the victim workloads, bully workloads, and the cluster component involved inan event:
• Identifies victim workloads whose latency has crossed the dynamic performance threshold,which is the upper boundary of the latency forecast:
◦ For volumes on HDD or Flash Pool hybrid aggregates (local tier), events are triggered onlywhen the latency is greater than 5 milliseconds (ms) and the IOPS are more than 10operations per second (ops/sec).
◦ For volumes on all-SSD aggregates or FabricPool aggregates (cloud tier), events aretriggered only when the latency is greater than 1 ms and the IOPS are more than 100 ops/sec.
• Identifies the cluster component in contention.
Note: If the latency of victim workloads at the cluster interconnect is greater than 1 ms,Unified Manager treats this as significant and triggers an event for the cluster interconnect.
• Identifies the bully workloads that are overusing the cluster component and causing it to be incontention.
• Ranks the workloads involved, based on their deviation in utilization or activity of a clustercomponent, to determine which bullies have the highest change in usage of the clustercomponent and which victims are the most impacted.
An event might occur for only a brief moment and then correct itself after the component it isusing is no longer in contention. A continuous event is one that reoccurs for the same clustercomponent within a five-minute interval and remains in the active state. For continuous events,Unified Manager triggers an alert after detecting the same event during two consecutive analysisintervals.
When an event is resolved, it remains available in Unified Manager as part of the record of pastperformance issues for a volume. Each event has a unique ID that identifies the event type and thevolumes, cluster, and cluster components involved.
Note: A single volume can be involved in more than one event at the same time.
Event state
Events can be in one of the following states:
597Collecting data and monitoring workload performance

Active
Indicates that the performance event is currently active (new or acknowledged). The issuecausing the event has not corrected itself or has not been resolved. The performance counterfor the storage object remains above the performance threshold.
Obsolete
Indicates that the event is no longer active. The issue causing the event has corrected itselfor has been resolved. The performance counter for the storage object is no longer above theperformance threshold.
Event notification
The events are displayed on the Dashboard page and on many other pages in the user interface,and alerts for those events are sent to specified email addresses. You can view detailed analysisinformation about an event and get suggestions for resolving it on the Event details page and onthe Workload Analysis page.
Event interaction
On the Event details page and on the Workload Analysis page, you can interact with events in thefollowing ways:
• Moving the mouse over an event displays a message that shows the date and time when theevent was detected.
If there are multiple events for the same time period, the message shows the number of events.
• Clicking a single event displays a dialog box that shows more detailed information about theevent, including the cluster components that are involved.
The component in contention is circled and highlighted red. You can click View full analysisto view the full analysis on the Event details page. If there are multiple events for the sametime period, the dialog box shows details about the three most recent events. You can click anevent to view the event analysis on the Event details page.
Related conceptsCollecting data and monitoring workload performance on page 584
Unified Manager collects and analyzes workload activity every 5 minutes to identify performanceevents, and it detects configuration changes every 15 minutes. It retains a maximum of 30 days of5-minute historical performance and event data, and it uses this data to forecast the expectedlatency range for all monitored workloads.
How Unified Manager determines the performance impact for an event on page 599Unified Manager uses the deviation in activity, utilization, write throughput, cluster componentusage, or I/O latency (response time) for a workload to determine the level of impact to workloadperformance. This information determines the role of each workload in the event and how they areranked on the Event details page.
Roles of workloads involved in a performance event on page 603Unified Manager uses roles to identify the involvement of a workload in a performance event. Theroles include victims, bullies, and sharks. A user-defined workload can be a victim, bully, andshark at the same time.
Cluster components and why they can be in contention on page 600You can identify cluster performance issues when a cluster component goes into contention. Theperformance of workloads that use the component slow down and their response time (latency) forclient requests increases, which triggers an event in Unified Manager.
Types of workloads monitored by Unified Manager on page 584
598Collecting data and monitoring workload performance

You can use Unified Manager to monitor the performance of two types of workloads: user-definedand system-defined.
Related tasksDisplaying information about performance events on page 168
You can use the Event Management inventory page to view a list of all the performance events onthe clusters being monitored by Unified Manager. By viewing this information you can determinethe most critical events and then drill down to detailed information to determine the cause of theevent.
Identifying victim workloads involved in a dynamic performance event on page 177In Unified Manager, you can identify which volume workloads have the highest deviation inresponse time (latency) caused by a storage component in contention. Identifying these workloadshelps you understand why the client applications accessing them have been performing slowerthan usual.
Identifying bully workloads involved in a dynamic performance event on page 178In Unified Manager, you can identify which workloads have the highest deviation in usage for acluster component in contention. Identifying these workloads helps you understand why certainvolumes on the cluster have slow response times (latency).
Related referenceEvent details page on page 108
From the Event details page, you can view the details of a selected event, such as the eventseverity, impact level, impact area, and event source. You can also view additional informationabout possible remediations to resolve the issue.
How Unified Manager determines the performance impact for an eventUnified Manager uses the deviation in activity, utilization, write throughput, cluster componentusage, or I/O latency (response time) for a workload to determine the level of impact to workloadperformance. This information determines the role of each workload in the event and how they areranked on the Event details page.
Unified Manager compares the last analyzed values for a workload to the expected range (latencyforecast) of values. The difference between the values last analyzed and the expected range ofvalues identifies the workloads whose performance was most impacted by the event.
For example, suppose a cluster contains two workloads: Workload A and Workload B. The latencyforecast for Workload A is 5-10 milliseconds per operation (ms/op) and its actual latency isusually around 7 ms/op. The latency forecast for Workload B is 10-20 ms/op and its actual latencyis usually around 15 ms/op. Both workloads are well within their latency forecast. Due tocontention on the cluster, the latency of both workloads increases to 40 ms/op, crossing thedynamic performance threshold, which is the upper bounds of the latency forecast, and triggeringevents. The deviation in latency, from the expected values to the values above the performancethreshold, for Workload A is around 33 ms/op, and the deviation for Workload B is around 25ms/op. The latency of both workloads spike to 40 ms/op, but Workload A had the biggerperformance impact because it had the higher latency deviation at 33 ms/op.
On the Event details page, in the System Diagnosis section, you can sort workloads by theirdeviation in activity, utilization, or throughput for a cluster component. You can also sortworkloads by latency. When you select a sort option, Unified Manager analyzes the deviation inactivity, utilization, throughput, or latency since the event was detected from the expected values
to determine the workload sort order. For the latency, the red dots ( ) indicate a performancethreshold crossing by a victim workload, and the subsequent impact to the latency. Each red dotindicates a higher level of deviation in latency, which helps you identify the victim workloadswhose latency was impacted the most by an event.
599Collecting data and monitoring workload performance

Related conceptsCollecting data and monitoring workload performance on page 584
Unified Manager collects and analyzes workload activity every 5 minutes to identify performanceevents, and it detects configuration changes every 15 minutes. It retains a maximum of 30 days of5-minute historical performance and event data, and it uses this data to forecast the expectedlatency range for all monitored workloads.
Roles of workloads involved in a performance event on page 603Unified Manager uses roles to identify the involvement of a workload in a performance event. Theroles include victims, bullies, and sharks. A user-defined workload can be a victim, bully, andshark at the same time.
Cluster components and why they can be in contention on page 600You can identify cluster performance issues when a cluster component goes into contention. Theperformance of workloads that use the component slow down and their response time (latency) forclient requests increases, which triggers an event in Unified Manager.
Types of workloads monitored by Unified Manager on page 584You can use Unified Manager to monitor the performance of two types of workloads: user-definedand system-defined.
Related tasksDisplaying information about performance events on page 168
You can use the Event Management inventory page to view a list of all the performance events onthe clusters being monitored by Unified Manager. By viewing this information you can determinethe most critical events and then drill down to detailed information to determine the cause of theevent.
Identifying victim workloads involved in a dynamic performance event on page 177In Unified Manager, you can identify which volume workloads have the highest deviation inresponse time (latency) caused by a storage component in contention. Identifying these workloadshelps you understand why the client applications accessing them have been performing slowerthan usual.
Identifying bully workloads involved in a dynamic performance event on page 178In Unified Manager, you can identify which workloads have the highest deviation in usage for acluster component in contention. Identifying these workloads helps you understand why certainvolumes on the cluster have slow response times (latency).
Related referencePerformance event analysis and notification on page 597
Performance events notify you about I/O performance issues on a workload caused by contentionon a cluster component. Unified Manager analyzes the event to identify all workloads involved,the component in contention, and whether the event is still an issue that you might need to resolve.
Event details page on page 108From the Event details page, you can view the details of a selected event, such as the eventseverity, impact level, impact area, and event source. You can also view additional informationabout possible remediations to resolve the issue.
Cluster components and why they can be in contentionYou can identify cluster performance issues when a cluster component goes into contention. Theperformance of workloads that use the component slow down and their response time (latency) forclient requests increases, which triggers an event in Unified Manager.
A component that is in contention cannot perform at an optimal level. Its performance hasdeclined, and the performance of other cluster components and workloads, called victims, mighthave increased latency. To bring a component out of contention, you must reduce its workload orincrease its ability to handle more work, so that the performance can return to normal levels.
600Collecting data and monitoring workload performance

Because Unified Manager collects and analyzes workload performance in five-minute intervals, itdetects only when a cluster component is consistently overused. Transient spikes of overusage thatlast for only a short duration within the five-minute interval are not detected.
For example, a storage aggregate might be under contention because one or more workloads on itare competing for their I/O requests to be fulfilled. Other workloads on the aggregate can beimpacted, causing their performance to decrease. To reduce the amount of activity on theaggregate, there are different steps you can take, such as moving one or more workloads to a lessbusy aggregate or node, to lessen the overall workload demand on the current aggregate. For aQoS policy group, you can adjust the throughput limit, or move workloads to a different policygroup, so that the workloads are no longer being throttled.
Unified Manager monitors the following cluster components to alert you when they are incontention:
Network
Represents the wait time of I/O requests by the external networking protocols on the cluster.The wait time is time spent waiting for "transfer ready" transactions to finish before thecluster can respond to an I/O request. If the network component is in contention, it meanshigh wait time at the protocol layer is impacting the latency of one or more workloads.
Network Processing
Represents the software component in the cluster involved with I/O processing between theprotocol layer and the cluster. The node handling network processing might have changedsince the event was detected. If the network processing component is in contention, itmeans high utilization at the network processing node is impacting the latency of one ormore workloads.
When using an All SAN Array cluster in an active-active configuration, the networkprocessing latency value is displayed for both nodes so you can verify the nodes are sharingthe load equally.
QoS Limit Max
Represents the throughput maximum (peak) setting of the storage Quality of Service (QoS)policy group assigned to the workload. If the policy group component is in contention, itmeans all workloads in the policy group are being throttled by the set throughput limit,which is impacting the latency of one or more of those workloads.
QoS Limit Min
Represents the latency to a workload that is being caused by QoS throughput minimum(expected) setting assigned to other workloads. If the QoS minimum set on certainworkloads use the majority of the bandwidth to guarantee the promised throughput, otherworkloads will be throttled and see more latency.
Cluster Interconnect
Represents the cables and adapters with which clustered nodes are physically connected. Ifthe cluster interconnect component is in contention, it means high wait time for I/O requestsat the cluster interconnect is impacting the latency of one or more workloads.
Data Processing
Represents the software component in the cluster involved with I/O processing between thecluster and the storage aggregate that contains the workload. The node handling dataprocessing might have changed since the event was detected. If the data processingcomponent is in contention, it means high utilization at the data processing node isimpacting the latency of one or more workloads.
601Collecting data and monitoring workload performance

Volume Activation
Represents the process that tracks the usage of all active volumes. In large environmentswhere more than 1000 volumes are active, this process tracks how many critical volumesneed to access resources through the node at the same time. When the number of concurrentactive volumes exceeds the recommended maximum threshold, some of the non-criticalvolumes will experience latency as identified here.
MetroCluster Resources
Represents the MetroCluster resources, including NVRAM and interswitch links (ISLs),used to mirror data between clusters in a MetroCluster configuration. If the MetroClustercomponent is in contention, it means high write throughput from workloads on the localcluster or a link health issue is impacting the latency of one or more workloads on the localcluster. If the cluster is not in a MetroCluster configuration, this icon is not displayed.
Aggregate or SSD Aggregate Ops
Represents the storage aggregate on which the workloads are running. If the aggregatecomponent is in contention, it means high utilization on the aggregate is impacting thelatency of one or more workloads. An aggregate consists of all HDDs, or a mix of HDDsand SSDs (a Flash Pool aggregate), or a mix of HDDs and a cloud tier (a FabricPoolaggregate). An "SSD Aggregate" consists of all SSDs (an all-flash aggregate), or a mix ofSSDs and a cloud tier (a FabricPool aggregate).
Cloud Latency
Represents the software component in the cluster involved with I/O processing between thecluster and the cloud tier on which user data is stored. If the cloud latency component is incontention, it means that a large amount of reads from volumes that are hosted on the cloudtier are impacting the latency of one or more workloads.
Sync SnapMirror
Represents the software component in the cluster involved with replicating user data fromthe primary volume to the secondary volume in a SnapMirror Synchronous relationship. Ifthe sync SnapMirror component is in contention, it means that the activity from SnapMirrorSynchronous operations are impacting the latency of one or more workloads.
Related conceptsCollecting data and monitoring workload performance on page 584
Unified Manager collects and analyzes workload activity every 5 minutes to identify performanceevents, and it detects configuration changes every 15 minutes. It retains a maximum of 30 days of5-minute historical performance and event data, and it uses this data to forecast the expectedlatency range for all monitored workloads.
Roles of workloads involved in a performance event on page 603Unified Manager uses roles to identify the involvement of a workload in a performance event. Theroles include victims, bullies, and sharks. A user-defined workload can be a victim, bully, andshark at the same time.
Types of workloads monitored by Unified Manager on page 584You can use Unified Manager to monitor the performance of two types of workloads: user-definedand system-defined.
Related tasksDisplaying information about performance events on page 168
You can use the Event Management inventory page to view a list of all the performance events onthe clusters being monitored by Unified Manager. By viewing this information you can determinethe most critical events and then drill down to detailed information to determine the cause of theevent.
Identifying victim workloads involved in a dynamic performance event on page 177
602Collecting data and monitoring workload performance

In Unified Manager, you can identify which volume workloads have the highest deviation inresponse time (latency) caused by a storage component in contention. Identifying these workloadshelps you understand why the client applications accessing them have been performing slowerthan usual.
Identifying bully workloads involved in a dynamic performance event on page 178In Unified Manager, you can identify which workloads have the highest deviation in usage for acluster component in contention. Identifying these workloads helps you understand why certainvolumes on the cluster have slow response times (latency).
Related referencePerformance event analysis and notification on page 597
Performance events notify you about I/O performance issues on a workload caused by contentionon a cluster component. Unified Manager analyzes the event to identify all workloads involved,the component in contention, and whether the event is still an issue that you might need to resolve.
Event details page on page 108From the Event details page, you can view the details of a selected event, such as the eventseverity, impact level, impact area, and event source. You can also view additional informationabout possible remediations to resolve the issue.
Roles of workloads involved in a performance eventUnified Manager uses roles to identify the involvement of a workload in a performance event. Theroles include victims, bullies, and sharks. A user-defined workload can be a victim, bully, andshark at the same time.The following table defines the workload roles:
Role Description
Victim A user-defined workload whose performance has decreased due to other workloads, calledbullies, that are over-using a cluster component. Only user-defined workloads are identified asvictims. Unified Manager identifies victim workloads based on their deviation in latency, wherethe actual latency, during an event, has greatly increased from its latency forecast (expectedrange).
Bully A user-defined or system-defined workload whose over-use of a cluster component has causedthe performance of other workloads, called victims, to decrease. Unified Manager identifies bullyworkloads based on their deviation in usage of a cluster component, where the actual usage,during an event, has greatly increased from its expected range of usage.
Shark A user-defined workload with the highest usage of a cluster component compared to allworkloads involved in an event. Unified Manager identifies shark workloads based on their usageof a cluster component during an event.
Workloads on a cluster can share many of the cluster components, such as aggregates and the CPUfor network and data processing. When a workload, such as a volume, increases its usage of acluster component to the point that the component cannot efficiently meet workload demands, thecomponent is in contention. The workload that is over-using a cluster component is a bully. Theother workloads that share those components, and whose performance is impacted by the bully, arethe victims. Activity from system-defined workloads, such as deduplication or Snapshot copies,can also escalate into "bullying".
When Unified Manager detects an event, it identifies all workloads and cluster componentsinvolved, including the bully workloads that caused the event, the cluster component that is incontention, and the victim workloads whose performance has decreased due to the increasedactivity of bully workloads.
603Collecting data and monitoring workload performance

Note: If Unified Manager cannot identify the bully workloads, it only alerts on the victimworkloads and the cluster component involved.
Unified Manager can identify workloads that are victims of bully workloads, and also identifywhen those same workloads become bully workloads. A workload can be a bully to itself. Forexample, a high-performing workload that is being throttled by a policy group limit causes allworkloads in the policy group to be throttled, including itself. A workload that is a bully or avictim in an ongoing performance event might change its role or no longer be a participant in theevent.
Related conceptsCluster components and why they can be in contention on page 600
You can identify cluster performance issues when a cluster component goes into contention. Theperformance of workloads that use the component slow down and their response time (latency) forclient requests increases, which triggers an event in Unified Manager.
Types of workloads monitored by Unified Manager on page 584You can use Unified Manager to monitor the performance of two types of workloads: user-definedand system-defined.
Related tasksDisplaying information about performance events on page 168
You can use the Event Management inventory page to view a list of all the performance events onthe clusters being monitored by Unified Manager. By viewing this information you can determinethe most critical events and then drill down to detailed information to determine the cause of theevent.
Identifying victim workloads involved in a dynamic performance event on page 177In Unified Manager, you can identify which volume workloads have the highest deviation inresponse time (latency) caused by a storage component in contention. Identifying these workloadshelps you understand why the client applications accessing them have been performing slowerthan usual.
Identifying bully workloads involved in a dynamic performance event on page 178In Unified Manager, you can identify which workloads have the highest deviation in usage for acluster component in contention. Identifying these workloads helps you understand why certainvolumes on the cluster have slow response times (latency).
Related referencePerformance event analysis and notification on page 597
Performance events notify you about I/O performance issues on a workload caused by contentionon a cluster component. Unified Manager analyzes the event to identify all workloads involved,the component in contention, and whether the event is still an issue that you might need to resolve.
Event details page on page 108From the Event details page, you can view the details of a selected event, such as the eventseverity, impact level, impact area, and event source. You can also view additional informationabout possible remediations to resolve the issue.
604Collecting data and monitoring workload performance

Managing backup and restore operations
You can create backups of Unified Manager and use the restore feature to restore the backup to thesame (local) system or a new (remote) system in case of a system failure or data loss.
There are three backup and restore methods depending on the operating system on which you haveinstalled Unified Manager, and based on the number of clusters and nodes being managed:
Operating System Size of Deployment Recommended Backup Method
VMware vSphere Any VMware snapshot of the Unified Manager virtualappliance
Red Hat Enterprise Linux orCentOS Linux
Small Unified Manager MySQL database dump
Large NetApp Snapshot of Unified Manager database
Microsoft Windows Any Unified Manager MySQL database dump
These different methods are described in the sections that follow.
Virtual appliance backup and restore processThe backup and restore model for Unified Manager when installed on a virtual appliance is tocapture and restore an image of the full virtual application.
The following tasks enable you to complete a backup of the virtual appliance:
1. Power off the VM and take a VMware snapshot of the Unified Manager virtual appliance.
2. Make a NetApp Snapshot copy on the datastore to capture the VMware snapshot.
If the datastore is not hosted on a system running ONTAP software, follow the storage vendorguidelines to create a backup of the VMware snapshot.
3. Replicate the NetApp Snapshot copy, or snapshot equivalent, to alternate storage.
4. Delete the VMware snapshot.
You should implement a backup schedule using these tasks to ensure that the Unified Managervirtual appliance is protected if issues arise.
To restore the VM, you can use the VMware snapshot you created to restore the VM to the backuppoint-in-time state.
Backup and restore using a MySQL database dumpA MySQL database dump backup is a copy of the Unified Manager database and configurationfiles that you can use in case of a system failure or data loss. You can schedule a backup to bewritten to a local destination or to a remote destination. It is highly recommended that you define aremote location that is external to the Unified Manager host system.
Note: MySQL database dump is the default backup mechanism when Unified Manager isinstalled on a Linux and Windows server. For Red Hat Enterprise Linux or CentOS Linuxsystems, you can use the NetApp Snapshot backup method if Unified Manager is managing alarge number of cluster and nodes, or if your MySQL backups are taking many hours tocomplete.
A database dump backup consists of a single file in the backup directory and one or more files inthe database repository directory. The file in the backup directory is very small because it contains
605Managing backup and restore operations

only a pointer to the files located in the database repository directory that are required to recreatethe backup.
The first time you generate a database backup a single file is created in the backup directory and afull backup file is created in the database repository directory. The next time you generate abackup a single file is created in the backup directory and an incremental backup file is created inthe database repository directory that contains the differences from the full backup file. Thisprocess continues as you create additional backups, up to the maximum retention setting, as shownin the following figure.
Important: Do not rename or remove any of the backup files in these two directories or anysubsequent restore operation will fail.
If you write your backup files to the local system, you should initiate a process to copy the backupfiles to a remote location so they will be available in case you have a system issue that requires acomplete restore.
Before beginning a backup operation, Unified Manager performs an integrity check to verify thatall the required backup files and backup directories exist and are writable. It also checks that thereis enough space on the system to create the backup file.
Note that you can restore a backup only on the same version of Unified Manager. For example, ifyou created a backup on Unified Manager 9.7, the backup can be restored only on UnifiedManager 9.7 systems.
Related referenceDatabase Backup page on page 614
The Database Backup page displays a list of backups created by Unified Manager and providesinformation about the backup name, size, and creation time.
Configuring the destination and schedule for database dump backupsYou can configure the Unified Manager database dump backup settings to set the database backuppath, retention count, and backup schedule. You can enable daily or weekly scheduled backups.By default, scheduled backups are disabled, but you should set a backup schedule.
Before you begin
• You must have the Operator, Application Administrator, or Storage Administrator role.
• You must have a minimum of 150 GB of space available in the location you define as thebackup path.
It is recommended that you use a remote location that is external to the Unified Manager hostsystem.
• When Unified Manager is installed on a Linux system, verify that the "jboss" user has writepermissions to the backup directory.
• You should not schedule backup operations to occur immediately after a new cluster has beenadded while Unified Manager is collecting 15 days of historical performance data.
606Managing backup and restore operations

About this task
More time is required the first time a backup is performed than for subsequent backups becausethe first backup is a full backup. A full backup can be over 1 GB and can take three to four hours.Subsequent backups are incremental and require less time.
Note: If you find that the number of incremental backup files is getting too large for the spaceyou have allocated for backups, you can create a new full backup periodically to replace the oldfull backup and all of its' child incremental files. As another option, you may want to start usingthe NetApp Snapshot backup method if Unified Manager is installed on a Linux system.
Steps
1. In the left navigation pane, click General > Database Backup.
2. In the Database Backup page, click Backup Settings.
3. Configure the appropriate values for a backup path, retention count, and schedule.
The default value for retention count is 10; you can use 0 for creating unlimited backups.
4. Select the Scheduled Daily or Scheduled Weekly button, and then specify the scheduledetails.
5. Click Apply.
Result
Database dump backup files are created based on the schedule. You can see the available backupfiles in the Database Backup page.
Related referenceDatabase Backup page on page 614
The Database Backup page displays a list of backups created by Unified Manager and providesinformation about the backup name, size, and creation time.
Related informationHow to start a new Incremental Backup chain within Active IQ Unified Manager
What a database restore isA MySQL database restore is the process of restoring an existing Unified Manager backup file tothe same or a different Unified Manager server. You perform the restore operation from theUnified Manager maintenance console.
If you are performing a restore operation on the same (local) system, and the backup files are allstored locally, you can run the restore option using the default location. If you are performing arestore operation on a different Unified Manager system (a remote system), you must copy thebackup file, or files, from secondary storage to the local disk before running the restore option.
During the restore process, you are logged out of Unified Manager. You can log in to the systemafter the restore process is complete.
The restore feature is version-specific and platform-specific. You can restore a Unified ManagerMySQL backup only on the same version of Unified Manager. Unified Manager supports backupand restore in the following platform scenarios:
• Virtual appliance backup to Red Hat Enterprise Linux or CentOS
• Red Hat or CentOS Linux backup to Red Hat Enterprise Linux or CentOS
• Windows backup to Windows
If you are restoring the backup image to a new server, after the restore operation completes youneed to generate a new HTTPS security certificate and restart the Unified Manager server. Youwill also need to reconfigure SAML authentication settings, if they are required, when restoringthe backup image to a new server.
607Managing backup and restore operations
Note: Old backup files cannot be used to restore an image after Unified Manager has beenupgraded to a newer version of software. To save space, all old backup files, except the newestfile, are removed automatically when you upgrade Unified Manager.
Related tasksRestoring a MySQL database backup on a Linux system on page 608
If data loss or data corruption occurs, you can restore Unified Manager to the previous stable statewith minimum loss of data. You can restore the Unified Manager database to a local or remote RedHat Enterprise Linux or CentOS system by using the Unified Manager maintenance console.
Restoring a MySQL database backup on Windows on page 609In case of data loss or data corruption, you can use the restore feature to restore Unified Managerto the previous stable state with minimal loss. You can restore the Unified Manager MySQLdatabase to a local Windows system or a remote Windows system by using the Unified Managermaintenance console.
Generating an HTTPS security certificate on page 650You might generate a new HTTPS security certificate for multiple reasons, including if you wantto sign with a different Certificate Authority or if the current security certificate has expired. Thenew certificate replaces the existing certificate.
Enabling SAML authentication on page 641You can enable Security Assertion Markup Language (SAML) authentication so that remote usersare authenticated by a secure identity provider (IdP) before they can access the Unified Managerweb UI.
Restoring a MySQL database backup on a Linux systemIf data loss or data corruption occurs, you can restore Unified Manager to the previous stable statewith minimum loss of data. You can restore the Unified Manager database to a local or remote RedHat Enterprise Linux or CentOS system by using the Unified Manager maintenance console.
Before you begin
• You must have the root user credentials for the Linux host on which Unified Manager isinstalled.
• You must have a user ID and password authorized to log in to the maintenance console of theUnified Manager server.
• You must have copied the Unified Manager backup file and the contents of the databaserepository directory to the system on which you will perform the restore operation.
It is recommended that you copy the backup file to the default directory /data/ocum-backup. The database repository files must be copied to the /database-dumps-reposubdirectory under the /ocum-backup directory.
• The backup files must be of .7z type.
About this task
The restore feature is platform-specific and version-specific. You can restore a Unified Managerbackup only on the same version of Unified Manager. You can restore a Linux backup file or avirtual appliance backup file to a Red Hat Enterprise Linux or CentOS system.
Tip: If the backup folder name contains a space, you must include the absolute path or relativepath in double quotation marks.
Steps
1. If you are performing a restore onto a new server, after installing Unified Manager do notlaunch the UI or configure any clusters, users, or authentication settings when the installation iscomplete. The backup file populates this information during the restore process.
608Managing backup and restore operations

2. Using Secure Shell, connect to the IP address or fully qualified domain name of the UnifiedManager system.
3. Log in to the system with the maintenance user (umadmin) name and password.
4. Enter the command maintenance_console and press Enter.
5. In the maintenance console Main Menu, enter the number for the Backup Restore option.
6. Enter the number for the Restore MySQL Backup.
7. When prompted, enter the absolute path of the backup file.
Bundle to restore from: /data/ocum-backup/UM_9.8.N151113.1348_backup_rhel_02-20-2020-04-45.7z
After the restore operation is complete, you can log in to Unified Manager.
After you finish
After you restore the backup, if the OnCommand Workflow Automation server does not work,perform the following steps:
1. On the Workflow Automation server, change the IP address of the Unified Manager server topoint to the latest machine.
2. On the Unified Manager server, reset the database password if the acquisition fails in step 1.
Related conceptsWhat a database restore is on page 607
A MySQL database restore is the process of restoring an existing Unified Manager backup file tothe same or a different Unified Manager server. You perform the restore operation from theUnified Manager maintenance console.
Restoring a MySQL database backup on WindowsIn case of data loss or data corruption, you can use the restore feature to restore Unified Managerto the previous stable state with minimal loss. You can restore the Unified Manager MySQLdatabase to a local Windows system or a remote Windows system by using the Unified Managermaintenance console.
Before you begin
• You must have Windows administrator privileges.
• You must have copied the Unified Manager backup file and the contents of the databaserepository directory to the system on which you will perform the restore operation.
It is recommended that you copy the backup file to the default directory \ProgramData\NetApp\OnCommandAppData\ocum\backup. The database repository files must be copiedto the \database_dumps_repo subdirectory under the \backup directory.
• The backup files must be of .7z type.
About this task
The restore feature is platform-specific and version-specific. You can restore a Unified ManagerMySQL backup only on the same version of Unified Manager, and a Windows backup can berestored only on a Windows platform.
Tip: If the folder names contain a space, you must include the absolute path or relative path ofthe backup file in double quotation marks.
Steps
1. If you are performing a restore onto a new server, after installing Unified Manager do notlaunch the UI or configure any clusters, users, or authentication settings when the installation iscomplete. The backup file populates this information during the restore process.
609Managing backup and restore operations

2. Log in to the Unified Manager system with administrator credentials.
3. Launch PowerShell as a Windows administrator.
4. Enter the command maintenance_console and press Enter.
5. In the maintenance console Main Menu, enter the number for the Backup Restore option.
6. Enter the number for the Restore MySQL Backup.
7. When prompted, enter the absolute path of the backup file.
Bundle to restore from: \ProgramData\NetApp\OnCommandAppData\ocum\backup\UM_9.8.N151118.2300_backup_windows_02-20-2020-02-51.7z
After the restore operation is complete, you can log in to Unified Manager.
After you finish
After you restore the backup, if the OnCommand Workflow Automation server does not work,perform the following steps:
1. On the Workflow Automation server, change the IP address of the Unified Manager server topoint to the latest machine.
2. On the Unified Manager server, reset the database password if the acquisition fails in step 1.
Related conceptsWhat a database restore is on page 607
A MySQL database restore is the process of restoring an existing Unified Manager backup file tothe same or a different Unified Manager server. You perform the restore operation from theUnified Manager maintenance console.
Backup and restore using NetApp SnapshotsA NetApp Snapshot backup creates a point-in-time image of the Unified Manager database andconfiguration files that you can use to restore in case of a system failure or data loss. You schedulea Snapshot backup to be written to a volume on one of your ONTAP clusters periodically so thatyou always have a current copy.
Note: This functionality is available only when Unified Manager is installed on a Red HatEnterprise Linux or CentOS Linux server.
Snapshot backups take very little time, usually just a few minutes, and the Unified Managerdatabase is locked for a very short timeframe, so there is very little disruption to your installation.The image consumes minimal storage space and incurs negligible performance overhead becauseit records only changes to files since the last Snapshot copy was made. Because the Snapshot iscreated on an ONTAP cluster, you can take advantage of other NetApp features such asSnapMirror to create secondary protection, if needed.
Before beginning a backup operation, Unified Manager performs an integrity check to verify thatthe destination system is available.
Note that you can restore a Snapshot backup only on the same version of Unified Manager. Forexample, if you created a backup on Unified Manager 9.8, the backup can be restored only onUnified Manager 9.8 systems.
Creating the volume where backups are storedYou can create the volume where Snapshot backups will be stored on one of your ONTAP clustersfrom ONTAP System Manager or from the ONTAP CLI.
Before you begin
The cluster, storage VM, and volume must meet the following requirements:
610Managing backup and restore operations

• Cluster requirements:
◦ ONTAP 9.3 or greater must be installed
◦ It should be geographically close to the Unified Manager server
◦ It can be monitored by Unified Manager, but it is not required
• Storage VM requirements:
◦ CIFS/SMB or NFS services must be enabled
◦ The name switch and name mapping must be set to use "files"
◦ NFSv4 must be enabled on the NFS server and NFSv4 iddomain specified on the client andstorage VM
◦ Local users created to correspond with client-side users
◦ Make sure All Read/Write access is selected
◦ Make sure that Superuser Access is set to "any" in the export policy
• Volume requirements:
◦ The volume should be at least double the size of the Unified Manager /opt/netapp/datadirectory
Use the command du -sh /opt/netapp/data/ to check the current size.
◦ The security style must be set to UNIX
◦ The local snapshot policy must be disabled
◦ Volume autosize should be enabled
◦ The performance service level should be set to a policy with high IOPS and low latency,such as "Extreme"
About this task
For detailed steps to create the NFS volume, see How to configure NFSv4 in ONTAP 9 and theONTAP 9 NFS Configuration Express Guide.
Specifying the destination location for Snapshot backupsYou configure the destination location for Unified Manager Snapshot backups on a volume youhave already configured in one of your ONTAP clusters. You define the location from the UnifiedManager maintenance console.
Before you begin
• You must have the root user credentials for the Linux host on which Unified Manager isinstalled.
• You must have a user ID and password authorized to log in to the maintenance console of theUnified Manager server.
• You must have the Cluster Management IP address, the name of the storage VM, the name ofthe volume, and the storage system user name and password.
• You must have mounted the volume to the Unified Manager host, and you must have the mountpath.
Steps
1. Using Secure Shell, connect to the IP address or fully qualified domain name of the UnifiedManager system.
2. Log in to the system with the maintenance user (umadmin) name and password.
3. Enter the command maintenance_console and press Enter.
4. In the maintenance console Main Menu, enter the number for the Backup Restore option.
5. Enter the number for Configure NetApp Snapshot Backup.
6. Enter the number for Configuration for NFS.
611Managing backup and restore operations

7. Review the information that you will need to provide and then enter the number for EnterBackup Configuration Details.
8. To identify the volume where the Snapshot will be written, enter the IP address of the ClusterManagement interface, the name of the storage VM, the name of the volume, the storagesystem user name and password, and the mount path.
9. Verify this information and enter y.The system performs the following tasks:
• Establishes the connection to the cluster
• Stops all the services
• Creates a new directory in the volume and copies the Unified Manager databaseconfiguration files
• Deletes the files from Unified Manager and creates a symlink to the new databasedirectory
• Restarts all the services
10. Exit the maintenance console and launch the Unified Manager interface to create theSnapshot backup schedule if you have not already done this.
Defining a schedule for Snapshot backupsYou can configure the schedule at which Unified ManagerSnapshot backups are created by usingthe Unified Manager UI.
Before you begin
• You must have the Operator, Application Administrator, or Storage Administrator role.
• You must have configured the NetApp Snapshot backup settings from the maintenance consoleto identify the destination where the snapshots will be created.
• You should not schedule backup operations to occur immediately after a new cluster has beenadded while Unified Manager is collecting 15 days of historical performance data.
About this task
Snapshot backups are created in just a few minutes and the Unified Manager database is lockedonly for few seconds.
Steps
1. In the left navigation pane, click General > Database Backup.
2. In the Database Backup page, click Backup Settings.
3. Enter the maximum number of Snapshot copies that you want to retain in the Retention Countfield.
The default value for retention count is 10. The maximum number of Snapshot copies isdetermined by the version of ONTAP software on the cluster: 1020 for ONTAP 9.4 and greater,and 250 for ONTAP 9.3 and earlier. You can leave this field blank to implement the maximumvalue regardless of ONTAP version.
4. Select the Scheduled Daily or Scheduled Weekly button, and then specify the scheduledetails.
5. Click Apply.
Result
Snapshot backup files are created based on the schedule. You can see the available backup files inthe Database Backup page.
612Managing backup and restore operations
After you finish
Because of the importance of this volume and the snapshots, you may want to create one or twoalerts for this volume so you are notified when either:
• The volume space is 90% full. Use the event Volume Space Full to set up the alert.
You can add capacity to the volume using ONTAP System Manager or the ONTAP CLI so thatthe Unified Manager database does not run out of space.
• The number of snapshots is close to reaching the maximum number. Use the event Too ManySnapshot Copies to set up the alert.
You can delete older snapshots using ONTAP System Manager or the ONTAP CLI so thatthere is always room for new snapshot backups.
You configure alerts in the Alert Setup page.
Restoring a Snapshot backupIf data loss or data corruption occurs, you can restore Unified Manager to the previous stable statewith minimum loss of data. You can restore the Unified Manager Snapshot database to a local orremote Red Hat Enterprise Linux or CentOS system by using the Unified Manager maintenanceconsole.
Before you begin
• You must have the root user credentials for the Linux host on which Unified Manager isinstalled.
• You must have a user ID and password authorized to log in to the maintenance console of theUnified Manager server.
About this task
The restore feature is platform-specific and version-specific. You can restore a Unified Managerbackup only on the same version of Unified Manager.
Steps
1. Using Secure Shell, connect to the IP address or fully qualified domain name of the UnifiedManager system.
2. Log in to the system with the maintenance user (umadmin) name and password.
3. Enter the command maintenance_console and press Enter.
4. In the maintenance console Main Menu, enter the number for the Backup Restore option.
5. Enter the number for Backup and Restore using NetApp Snapshot.
If you are performing a restore onto a new server, after installing Unified Manager do notlaunch the UI or configure any clusters, users, or authentication settings when the installation iscomplete. Enter the number for Configure NetApp Snapshot Backup and configure theSnapshot backup settings as they were configured on the original system.
6. Enter the number for Restore using NetApp Snapshot.
7. Select the Snapshot backup file that you want to restore and press Enter.
8. After the restore process is complete, log in to the Unified Manager user interface.
After you finish
After you restore the backup, if the OnCommand Workflow Automation server does not work,perform the following steps:
1. On the Workflow Automation server, change the IP address of the Unified Manager server topoint to the latest machine.
2. On the Unified Manager server, reset the database password if the acquisition fails in step 1.
613Managing backup and restore operations

Description of backup windows and dialog boxesYou can view the list of backups from the backup page in Unified Manager. You can view thebackup name, size, and creation time for the backups listed in this page. You can modify thedatabase backup settings from the Database Backup Settings page.
Database Backup pageThe Database Backup page displays a list of backups created by Unified Manager and providesinformation about the backup name, size, and creation time.
You must have the Application Administrator or Storage Administrator role.
List View
The list view displays information about the available backup files.
Name
Name of the backup.
Size
Size of the backup.
Creation Time
Creation date and time of the backup.
Command buttons
Backup Settings
Displays the Backup Settings dialog box, which enables you to specify a backup path,retention count, and backup schedule.
Related conceptsBackup and restore using a MySQL database dump on page 605
A MySQL database dump backup is a copy of the Unified Manager database and configurationfiles that you can use in case of a system failure or data loss. You can schedule a backup to bewritten to a local destination or to a remote destination. It is highly recommended that you define aremote location that is external to the Unified Manager host system.
Related tasksConfiguring the destination and schedule for database dump backups on page 606
You can configure the Unified Manager database dump backup settings to set the database backuppath, retention count, and backup schedule. You can enable daily or weekly scheduled backups.By default, scheduled backups are disabled, but you should set a backup schedule.
Backup Settings dialog boxDefine the backup schedule, the retention count, and when using MySQL database dump backupmethod, the backup path for a selected Unified Manager instance.
You can change the following database backup settings:
Path
When you are using the MySQL database dump backup method, this field specifies the pathto the location where you store the backup files. When using the Snapshot backup method,this location shows the cluster, storage VM, and volume on which the backup will bestored.
The following table specifies the backup path format, and default locations, for differentoperating systems:
614Managing backup and restore operations

Host operating system Backup path format
Virtual appliance /opt/netapp/data/ocum-backup
Red Hat Enterprise Linux orCentOS Linux
/data/ocum-backup
Microsoft Windows C:\ProgramData\NetApp\OnCommandAppData\ocum\backup\
Retention Count
Specifies the maximum number of backups to be retained by Unified Manager. The defaultvalue is 10.
Scheduled Daily
Specifies the daily backup schedule with the time.
Scheduled Weekly
Specifies the weekly backup schedule with the day and time.
None
Specifies that no backups will be created.
615Managing backup and restore operations

Managing clusters
You can manage the ONTAP clusters by using Unified Manager to monitor, add, edit, and removeclusters.
How the cluster discovery process worksAfter you have added a cluster to Unified Manager, the server discovers the cluster objects andadds them to its database. Understanding how the discovery process works helps you to manageyour organization's clusters and their objects.
The monitoring interval for collecting cluster configuration information is 15 minutes. Forexample, after you have added a cluster, it takes 15 minutes to display the cluster objects in theUnified Manager UI. This time frame is also true when making changes to a cluster. For example,if you add two new volumes to an SVM in a cluster, you see those new objects in the UI after thenext polling interval, which could be up to 15 minutes.
The following image illustrates the discovery process:
After all the objects for a new cluster are discovered, Unified Manager starts to gather historicalperformance data for the previous 15 days. These statistics are collected using the data continuitycollection functionality. This feature provides you with over two weeks of performanceinformation for a cluster immediately after it is added. After the data continuity collection cycle iscompleted, real-time cluster performance data is collected, by default, every five minutes.
Note: Because the collection of 15 days of performance data is CPU intensive, it is suggestedthat you stagger the addition of new clusters so that data continuity collection polls are notrunning on too many clusters at the same time.
616Managing clusters

Related tasksAdding clusters on page 617
You can add a cluster to Active IQ Unified Manager so that you can monitor the cluster. Thisincludes the ability to obtain cluster information such as the health, capacity, performance, andconfiguration of the cluster so that you can find and resolve any issues that might occur.
Viewing the list of monitored clustersYou can use the Cluster Setup page to view your inventory of clusters. You can view details aboutthe clusters, such as their name or IP address and communication status.
Before you begin
You must have the Operator, Application Administrator, or Storage Administrator role.
About this task
The list of clusters is sorted by the collection state severity level column. You can click a columnheader to sort the clusters by different columns.
Step
In the left navigation pane, click Storage Management > Cluster Setup.
Related referenceCluster Setup page on page 620
The Cluster Setup page displays information about the clusters that Unified Manager is currentlymonitoring. This page enables you to add additional clusters, edit cluster settings, and removeclusters.
Adding clustersYou can add a cluster to Active IQ Unified Manager so that you can monitor the cluster. Thisincludes the ability to obtain cluster information such as the health, capacity, performance, andconfiguration of the cluster so that you can find and resolve any issues that might occur.
Before you begin
• You must have the Application Administrator role or the Storage Administrator role.
• You must have the host name or cluster management IP address (IPv4 or IPv6) for the cluster.
When using the host name, it must resolve to the cluster management IP address for the clustermanagement LIF. If you use a node management LIF, the operation fails.
• You must have the user name and password to access the cluster.
This account must have the admin role with Application access set to ontapi, ssh, and http.
• You must know the port number to connect to the cluster using the HTTPS protocol (typicallyport 443).
• The cluster must be running ONTAP version 9.1 software or greater.
• You must have adequate space on the Unified Manager server. You are prevented from addinga cluster to the server when greater than 90% of space is already consumed.
Note: You can add clusters which are behind a NAT/firewall by using the Unified Manager NATIP address. Any connected Workflow Automation or SnapProtect systems must also be behindthe NAT/firewall, and SnapProtect API calls must use the NAT IP address to identify the cluster.
About this task
• Each cluster in a MetroCluster configuration must be added separately.
617Managing clusters

• A single instance of Unified Manager can support a specific number of nodes. If you need tomonitor an environment that exceeds the supported node count, you must install an additionalinstance of Unified Manager to monitor some of the clusters.
• You can monitor a single cluster by two instances of Unified Manager provided that you haveconfigured a second cluster-management LIF on the cluster so that each instance of UnifiedManager connects through a different LIF.
Steps
1. In the left navigation pane, click Storage Management > Cluster Setup.
2. On the Cluster Setup page, click Add.
3. In the Add Cluster dialog box, specify the values as required, and then click Submit.
4. In the Authorize Host dialog box, click View Certificate to view the certificate informationabout the cluster.
5. Click Yes.
Unified Manager checks the certificate only when the cluster is added initially. UnifiedManager does not check the certificate for each API call to ONTAP.
If the certificate has expired, you cannot add a new cluster. You must first renew the SSLcertificate and then add the cluster.
Result
After all the objects for a new cluster are discovered (about 15 minutes), Unified Manager starts togather historical performance data for the previous 15 days. These statistics are collected using thedata continuity collection functionality. This feature provides you with over two weeks ofperformance information for a cluster immediately after it is added. After the data continuitycollection cycle is completed, real-time cluster performance data is collected, by default, every fiveminutes.
Note: Because the collection of 15 days of performance data is CPU intensive, it is suggestedthat you stagger the addition of new clusters so that data continuity collection polls are notrunning on too many clusters at the same time. Additionally, if you restart Unified Managerduring the data continuity collection period, the collection will be halted and you will see gapsin the performance charts for the missing timeframe.
Tip: If you receive an error message that you cannot add the cluster, check to see if thefollowing issues exist:
• If the clocks on the two systems are not synchronized and the Unified Manager HTTPScertificate start date is later than the date on the cluster. You must ensure that the clocks aresynchronized using NTP or a similar service.
• If the cluster has reached the maximum number of EMS notification destinations the UnifiedManager address cannot be added. By default only 20 EMS notification destinations can bedefined on the cluster.
Related tasksAdding users on page 625
You can add local users or database users by using the Users page. You can also add remote usersor groups that belong to an authentication server. You can assign roles to these users and, based onthe privileges of the roles, users can manage the storage objects and data with Unified Manager, orview the data in a database.
Related referenceCluster Setup page on page 620
618Managing clusters

The Cluster Setup page displays information about the clusters that Unified Manager is currentlymonitoring. This page enables you to add additional clusters, edit cluster settings, and removeclusters.
Editing clustersYou can modify the settings of an existing cluster, such as the host name or IP address, user name,password, and port, by using the Edit Cluster dialog box.
Before you begin
You must have the Application Administrator role or the Storage Administrator role.
About this task
Note: Starting with Unified Manager 9.7, clusters can be added using HTTPS only.
Steps
1. In the left navigation pane, click Storage Management > Cluster Setup.
2. On the Cluster Setup page, select the cluster you want to edit, and then click Edit.
3. In the Edit Cluster dialog box, modify the values as required.
4. Click Submit.
Related tasksAdding users on page 625
You can add local users or database users by using the Users page. You can also add remote usersor groups that belong to an authentication server. You can assign roles to these users and, based onthe privileges of the roles, users can manage the storage objects and data with Unified Manager, orview the data in a database.
Related referenceCluster Setup page on page 620
The Cluster Setup page displays information about the clusters that Unified Manager is currentlymonitoring. This page enables you to add additional clusters, edit cluster settings, and removeclusters.
Removing clustersYou can remove a cluster from Unified Manager by using the Cluster Setup page. For example,you can remove a cluster if cluster discovery fails, or when you want to decommission a storagesystem.
Before you begin
You must have the Application Administrator role or the Storage Administrator role.
About this task
This task removes the selected cluster from Unified Manager. After a cluster is removed, it is nolonger monitored. The instance of Unified Manager registered with the removed cluster is alsounregistered from the cluster.
Removing a cluster also deletes all its storage objects, historical data, storage services, and allassociated events from Unified Manager. These changes are reflected on the inventory pages andthe details pages after the next data collection cycle.
Steps
1. In the left navigation pane, click Storage Management > Cluster Setup.
2. On the Cluster Setup page, select the cluster that you want to remove and click Remove.
619Managing clusters

3. In the Remove Data Source message dialog, click Remove to confirm the remove request.
Related tasksAdding clusters on page 617
You can add a cluster to Active IQ Unified Manager so that you can monitor the cluster. Thisincludes the ability to obtain cluster information such as the health, capacity, performance, andconfiguration of the cluster so that you can find and resolve any issues that might occur.
Adding users on page 625You can add local users or database users by using the Users page. You can also add remote usersor groups that belong to an authentication server. You can assign roles to these users and, based onthe privileges of the roles, users can manage the storage objects and data with Unified Manager, orview the data in a database.
Related referenceCluster Setup page on page 620
The Cluster Setup page displays information about the clusters that Unified Manager is currentlymonitoring. This page enables you to add additional clusters, edit cluster settings, and removeclusters.
Rediscovering clustersYou can manually rediscover a cluster from the Cluster Setup page in order to obtain the latestinformation about the health, monitoring status, and performance status of the cluster.
About this task
You can manually rediscover a cluster when you want to update the cluster—such as by increasingthe size of an aggregate when there is insufficient space—and you want Unified Manager todiscover the changes that you make.
When Unified Manager is paired with OnCommand Workflow Automation (WFA), the pairingtriggers the reacquisition of the data cached by WFA.
Steps
1. In the left navigation pane, click Storage Management > Cluster Setup.
2. On the Cluster Setup page, click Rediscover.Unified Manager rediscovers the selected cluster and displays the latest health andperformance status.
Related referenceCluster Setup page on page 620
The Cluster Setup page displays information about the clusters that Unified Manager is currentlymonitoring. This page enables you to add additional clusters, edit cluster settings, and removeclusters.
Page descriptions for data source managementYou can view and manage your clusters, including adding, editing, rediscovering, and removingclusters, from a single page.
Cluster Setup pageThe Cluster Setup page displays information about the clusters that Unified Manager is currentlymonitoring. This page enables you to add additional clusters, edit cluster settings, and removeclusters.
A message at the bottom of the page indicates how frequently Unified Manager collectsperformance data from clusters. The default collection interval is five minutes, but you can modify
620Managing clusters

this interval through the maintenance console if you find that collections from large clusters arenot completing on time.
Command buttons
Add
Opens the Add Cluster dialog box, which enables you to add clusters.
Edit
Opens the Edit Cluster dialog box, which enables you to edit the settings of the selectedcluster.
Remove
Removes the selected cluster and all the associated events and storage objects. After thecluster is removed, it is no longer monitored.
Attention: The cluster, its storage objects, and allassociated events are removed, and the cluster isno longer monitored by Unified Manager. Theinstance of Unified Manager registered with theremoved clustered is also unregistered from thecluster.
Rediscover
Forces a rediscover operation of the cluster so you can update the collection of health andperformance data.
Clusters list
The Clusters list displays the properties of all the discovered clusters. You can click a columnheader to sort the clusters by that column.
Status
Displays the current discovery status of the data source. The status can be Failed ( ),
Completed ( ), or In Progress ( ).
Name
Displays the cluster name.
Note that the name might take fifteen minutes or more to appear after the cluster is firstadded.
Maintenance Mode
Enables you to specify the timeframe, or "maintenance window", when a cluster will bedown for maintenance so that you do not receive a storm of alerts from the cluster while itis being maintained.
When maintenance mode is scheduled for the future this field displays "Scheduled", andyou can hover your cursor over the field to display the scheduled time. When the cluster isin the maintenance window this field shows "Active".
Host Name or IP Address
Displays the host name, fully qualified domain name (FQDN), short name, or the IP addressof the cluster-management LIF that is used to connect to the cluster.
Protocol
Displays the type of protocol that can be configured on the cluster: HTTP or HTTPS (for asecure connection).
621Managing clusters

If a connection is established with the cluster by using both protocols, HTTPS is chosenover HTTP. The default is HTTPS.
Port
Displays the port number of the cluster.
If the port is not specified, the default port for the selected protocol is used (80 for HTTP or443 for HTTPS).
User Name
Displays the user name that can be used to log in to the cluster.
Operation
Displays the current operation that is supported by the cluster data source.
The following operations are supported by the data source:
• Discovery
Specifies the operation when the data source is being discovered.
• Health Poll
Specifies the operation when the data source is successfully discovered and has startedsampling data.
• Deletion
Specifies the operation when the data source (cluster) is deleted from the respectivestorage objects list.
Operation State
Displays the state of the current operation. The state can be Failed, Completed, or InProgress.
Operation Start Time
The date and time the operation started.
Operation End Time
The date and time the operation ended.
Description
Any message related to the operation.
Related tasksRediscovering clusters on page 620
You can manually rediscover a cluster from the Cluster Setup page in order to obtain the latestinformation about the health, monitoring status, and performance status of the cluster.
Removing clusters on page 619You can remove a cluster from Unified Manager by using the Cluster Setup page. For example,you can remove a cluster if cluster discovery fails, or when you want to decommission a storagesystem.
Scheduling a maintenance window to disable cluster event notifications on page 63If you have a planned downtime for a cluster, for example, to upgrade the cluster or to move one ofthe nodes, you can suppress the events and alerts that would normally be generated during thattimeframe by scheduling a Unified Manager maintenance window.
Adding clusters on page 617You can add a cluster to Active IQ Unified Manager so that you can monitor the cluster. Thisincludes the ability to obtain cluster information such as the health, capacity, performance, andconfiguration of the cluster so that you can find and resolve any issues that might occur.
Editing clusters on page 619
622Managing clusters

You can modify the settings of an existing cluster, such as the host name or IP address, user name,password, and port, by using the Edit Cluster dialog box.
Add Cluster dialog boxYou can add an existing cluster so that you can monitor the cluster and obtain information aboutits health, capacity, configuration, and performance.
You can add a cluster by specifying the following values:
Host Name or IP Address
Enables you to specify the host name (preferred) or the IP address (IPv4 or IPv6) of thecluster-management LIF that is used to connect to the cluster. By specifying the host name,you will be able to match the name of the cluster across the web UI, rather than trying tocorrelate an IP address on one page to a host name on another page.
User Name
Enables you to specify a user name that can be used to log in to the cluster.
Password
Enables you to specify a password for the specified user name.
Port
Enables you to specify the port number used to connect to the cluster. The default port is443 for HTTPS.
Related tasksAdding clusters on page 617
You can add a cluster to Active IQ Unified Manager so that you can monitor the cluster. Thisincludes the ability to obtain cluster information such as the health, capacity, performance, andconfiguration of the cluster so that you can find and resolve any issues that might occur.
Related referenceCluster Setup page on page 620
The Cluster Setup page displays information about the clusters that Unified Manager is currentlymonitoring. This page enables you to add additional clusters, edit cluster settings, and removeclusters.
Edit Cluster dialog boxThe Edit Cluster dialog box enables you to modify the connection settings of an existing cluster,including the IP address, port, and protocol.
You can edit the following fields:
Host Name or IP Address
Enables you to specify the FQDN, short name, or the IP address (IPv4 or IPv6) of thecluster-management LIF that is used to connect to the cluster.
User Name
Enables you to specify a user name that can be used to log in to the cluster.
Password
Enables you to specify a password for the specified user name.
Port
Enables you to specify the port number used to connect to the cluster. The default port is443 for HTTPS.
623Managing clusters

Related tasksEditing clusters on page 619
You can modify the settings of an existing cluster, such as the host name or IP address, user name,password, and port, by using the Edit Cluster dialog box.
Adding clusters on page 617You can add a cluster to Active IQ Unified Manager so that you can monitor the cluster. Thisincludes the ability to obtain cluster information such as the health, capacity, performance, andconfiguration of the cluster so that you can find and resolve any issues that might occur.
624Managing clusters

Managing user access
You can create roles and assign capabilities to control user access to selected cluster objects. Youcan identify users who have the required capabilities to access selected objects within a cluster.Only these users are provided access to manage the cluster objects.
Adding usersYou can add local users or database users by using the Users page. You can also add remote usersor groups that belong to an authentication server. You can assign roles to these users and, based onthe privileges of the roles, users can manage the storage objects and data with Unified Manager, orview the data in a database.
Before you begin
• You must have the Application Administrator role.
• To add a remote user or group, you must have enabled remote authentication and configuredyour authentication server.
• If you plan to configure SAML authentication so that an identity provider (IdP) authenticatesusers accessing the graphical interface, make sure these users are defined as "remote" users.
Access to the UI is not allowed for users of type "local" or "maintenance" when SAMLauthentication is enabled.
About this task
If you add a group from Windows Active Directory, then all direct members and nested subgroupscan authenticate to Unified Manager, unless nested subgroups are disabled. If you add a groupfrom OpenLDAP or other authentication services, then only the direct members of that group canauthenticate to Unified Manager.
Steps
1. In the left navigation pane, click General > Users.
2. On the Users page, click Add.
3. In the Add User dialog box, select the type of user that you want to add, and enter the requiredinformation.
When entering the required user information, you must specify an email address that is uniqueto that user. You must avoid specifying email addresses that are shared by multiple users.
4. Click Add.
Related tasksEnabling remote authentication on page 635
You can enable remote authentication so that the Unified Manager server can communicate withyour authentication servers. The users of the authentication server can access the Unified Managergraphical interface to manage storage objects and data.
Setting up authentication services on page 636Authentication services enable the authentication of remote users or remote groups in anauthentication server before providing them access to Unified Manager. You can authenticate usersby using predefined authentication services (such as Active Directory or OpenLDAP), or byconfiguring your own authentication mechanism.
Adding authentication servers on page 637You can add authentication servers and enable remote authentication on the management server sothat remote users within the authentication server can access Unified Manager.
Enabling SAML authentication on page 641
625Managing user access

You can enable Security Assertion Markup Language (SAML) authentication so that remote usersare authenticated by a secure identity provider (IdP) before they can access the Unified Managerweb UI.
Related referenceUnified Manager user roles and capabilities on page 630
Based on your assigned user role, you can determine which operations you can perform in UnifiedManager.
Definitions of user types on page 629A user type specifies the kind of account the user holds and includes remote users, remote groups,local users, database users, and maintenance users. Each of these types has its own role, which isassigned by a user with the role of Administrator.
Definitions of user roles on page 629The maintenance user or Application Administrator assigns a role to every user. Each role containscertain privileges. The scope of activities that you can perform in Unified Manager depends on therole you are assigned and which privileges the role contains.
Editing the user settingsYou can edit user settings—such as the email address and role—that are specified each user. Forexample, you might want to change the role of a user who is a storage operator, and assign storageadministrator privileges to the user.
Before you begin
You must have the Application Administrator role.
About this task
When you modify the role that is assigned to a user, the changes are applied when either of thefollowing actions occur:
• The user logs out and logs back in to Unified Manager.
• Session timeout of 24 hours is reached.
Steps
1. In the left navigation pane, click General > Users.
2. In the Users page, select the user for which you want to edit settings, and click Edit.
3. In the Edit User dialog box, edit the appropriate settings that are specified for the user.
4. Click Save.
Related tasksAdding users on page 625
You can add local users or database users by using the Users page. You can also add remote usersor groups that belong to an authentication server. You can assign roles to these users and, based onthe privileges of the roles, users can manage the storage objects and data with Unified Manager, orview the data in a database.
Viewing usersYou can use the Users page to view the list of users who manage storage objects and data usingUnified Manager. You can view details about the users, such as the user name, type of user, emailaddress, and the role that is assigned to the users.
Before you begin
You must have the Application Administrator role.
626Managing user access

Step
In the left navigation pane, click General > Users.
Related tasksAdding users on page 625
You can add local users or database users by using the Users page. You can also add remote usersor groups that belong to an authentication server. You can assign roles to these users and, based onthe privileges of the roles, users can manage the storage objects and data with Unified Manager, orview the data in a database.
Deleting users or groupsYou can delete one or more users from the management server database to prevent specific usersfrom accessing Unified Manager. You can also delete groups so that all the users in the group canno longer access the management server.
Before you begin
• When you are deleting remote groups, you must have reassigned the events that are assigned tothe users of the remote groups.
If you are deleting local users or remote users, the events that are assigned to these users areautomatically unassigned.
• You must have the Application Administrator role.
Steps
1. In the left navigation pane, click General > Users.
2. In the Users page, select the users or groups that you want to delete, and then click Delete.
3. Click Yes to confirm the deletion.
Related tasksAdding users on page 625
You can add local users or database users by using the Users page. You can also add remote usersor groups that belong to an authentication server. You can assign roles to these users and, based onthe privileges of the roles, users can manage the storage objects and data with Unified Manager, orview the data in a database.
Assigning events to specific users on page 56You can assign unassigned events to yourself or to other users, including remote users. You canreassign assigned events to another user, if required. For example, when frequent issues occur on astorage object, you can assign the events for these issues to the user who manages that object.
Changing the local user passwordYou can change your local user login password to prevent potential security risks.
Before you begin
You must be logged in as a local user.
About this task
The passwords for the maintenance user and for remote users cannot be changed using these steps.To change a remote user password, contact your password administrator. To change themaintenance user password, see the chapter on "Using the maintenance console" in the Active IQUnified Manager System Configuration Guide.
Steps
1. Log in to Unified Manager.
627Managing user access

2. From the top menu bar, click the user icon and then click Change Password.
The Change Password option is not displayed if you are a remote user.
3. In the Change Password dialog box, enter the current password and the new password.
4. Click Save.
After you finish
If Unified Manager is configured in a high-availability configuration, you must change thepassword on the second node of the setup. Both instances must have same password.
Related tasksAdding users on page 625
You can add local users or database users by using the Users page. You can also add remote usersor groups that belong to an authentication server. You can assign roles to these users and, based onthe privileges of the roles, users can manage the storage objects and data with Unified Manager, orview the data in a database.
What the maintenance user doesThe maintenance user is created during the installation of Unified Manager on a Red HatEnterprise Linux or CentOS system. The maintenance user name is the "umadmin" user. Themaintenance user has the Application Administrator role in the web UI, and that user can createsubsequent users and assign them roles.
The maintenance user, or umadmin user, can also access the Unified Manager maintenanceconsole.
Related referenceDefinitions of user types on page 629
A user type specifies the kind of account the user holds and includes remote users, remote groups,local users, database users, and maintenance users. Each of these types has its own role, which isassigned by a user with the role of Administrator.
Definitions of user roles on page 629The maintenance user or Application Administrator assigns a role to every user. Each role containscertain privileges. The scope of activities that you can perform in Unified Manager depends on therole you are assigned and which privileges the role contains.
Unified Manager user roles and capabilities on page 630Based on your assigned user role, you can determine which operations you can perform in UnifiedManager.
What RBAC isRBAC (role-based access control) provides the ability to control who has access to variousfeatures and resources in the Active IQ Unified Manager server.
What role-based access control doesRole-based access control (RBAC) enables administrators to manage groups of users by definingroles. If you need to restrict access for specific functionality to selected administrators, you mustset up administrator accounts for them. If you want to restrict the information that administratorscan view and the operations they can perform, you must apply roles to the administrator accountsyou create.
The management server uses RBAC for user login and role permissions. If you have not changedthe management server’s default settings for administrative user access, you do not need to log into view them.
628Managing user access

When you initiate an operation that requires specific privileges, the management server promptsyou to log in. For example, to create administrator accounts, you must log in with ApplicationAdministrator account access.
Definitions of user typesA user type specifies the kind of account the user holds and includes remote users, remote groups,local users, database users, and maintenance users. Each of these types has its own role, which isassigned by a user with the role of Administrator.
Unified Manager user types are as follows:
Maintenance user
Created during the initial configuration of Unified Manager. The maintenance user thencreates additional users and assigns roles. The maintenance user is also the only user withaccess to the maintenance console. When Unified Manager is installed on a Red HatEnterprise Linux or CentOS system, the maintenance user is given the user name"umadmin."
Local user
Accesses the Unified Manager UI and performs functions based on the role given by themaintenance user or a user with the Application Administrator role.
Remote group
A group of users that access the Unified Manager UI using the credentials stored on theauthentication server. The name of this account should match the name of a group stored onthe authentication server. All users within the remote group are given access to the UnifiedManager UI using their individual user credentials. Remote groups can perform functionsaccording to their assigned roles.
Remote user
Accesses the Unified Manager UI using the credentials stored on the authentication server.A remote user performs functions based on the role given by the maintenance user or a userwith the Application Administrator role.
Database user
Has read-only access to data in the Unified Manager database, has no access to the UnifiedManager web interface or the maintenance console, and cannot execute API calls.
Related conceptsWhat the maintenance user does on page 628
The maintenance user is created during the installation of Unified Manager on a Red HatEnterprise Linux or CentOS system. The maintenance user name is the "umadmin" user. Themaintenance user has the Application Administrator role in the web UI, and that user can createsubsequent users and assign them roles.
Definitions of user rolesThe maintenance user or Application Administrator assigns a role to every user. Each role containscertain privileges. The scope of activities that you can perform in Unified Manager depends on therole you are assigned and which privileges the role contains.
Unified Manager includes the following predefined user roles:
Operator
Views storage system information and other data collected by Unified Manager, includinghistories and capacity trends. This role enables the storage operator to view, assign,acknowledge, resolve, and add notes for the events.
629Managing user access

Storage Administrator
Configures storage management operations within Unified Manager. This role enables thestorage administrator to configure thresholds and to create alerts and other storagemanagement-specific options and policies.
Application Administrator
Configures settings unrelated to storage management. This role enables the management ofusers, security certificates, database access, and administrative options, includingauthentication, SMTP, networking, and AutoSupport.
Note: When Unified Manager is installed on Linux systems, the initial user with theApplication Administrator role is automatically named "umadmin".
Integration Schema
This role enables read-only access to Unified Manager database views for integratingUnified Manager with OnCommand Workflow Automation (WFA).
Report Schema
This role enables read-only access to reporting and other database views directly from theUnified Manager database. The databases that can be viewed include:
• netapp_model_view
• netapp_performance
• ocum
• ocum_report
• ocum_report_birt
• opm
• scalemonitor
Related conceptsWhat the maintenance user does on page 628
The maintenance user is created during the installation of Unified Manager on a Red HatEnterprise Linux or CentOS system. The maintenance user name is the "umadmin" user. Themaintenance user has the Application Administrator role in the web UI, and that user can createsubsequent users and assign them roles.
Unified Manager user roles and capabilitiesBased on your assigned user role, you can determine which operations you can perform in UnifiedManager.
The following table displays the functions that each user role can perform:
Function Operator StorageAdministrato
r
ApplicationAdministrator
IntegrationSchema
Report Schema
View storage systeminformation
• • • • •
View other data, suchas histories andcapacity trends
• • • • •
View, assign, andresolve events
• • •
630Managing user access

Function Operator StorageAdministrato
r
ApplicationAdministrator
IntegrationSchema
Report Schema
View storage serviceobjects, such as SVMassociations andresource pools
• • •
View threshold policies • • •
Manage storage serviceobjects, such as SVMassociations andresource pools
• •
Define alerts • •
Manage storagemanagement options
• •
Manage storagemanagement policies
• •
Manage users •
Manage administrativeoptions
•
Define thresholdpolicies
•
Manage databaseaccess
•
Manage integrationwith WFA and provideaccess to the databaseviews
•
Schedule and savereports
• •
Execute "Fix It"operations fromManagement Actions
• •
Provide read-onlyaccess to databaseviews
•
Related conceptsWhat the maintenance user does on page 628
The maintenance user is created during the installation of Unified Manager on a Red HatEnterprise Linux or CentOS system. The maintenance user name is the "umadmin" user. The
631Managing user access

maintenance user has the Application Administrator role in the web UI, and that user can createsubsequent users and assign them roles.
Description of user access windows and dialog boxesBased on the RBAC settings, you can add users from the Users page and assign appropriate rolesto those users to access and monitor your clusters.
Users pageThe Users page displays a list of your users and groups, and provides information such as thename, type of user, and email address. You can also use this page to perform tasks such as adding,editing, deleting, and testing users.
• Command buttons• List view
Command buttons
The command buttons enable you to perform the following tasks for selected users:
Add
Displays the Add User dialog box, which enables you to add a local user, a remote user, aremote group, or a database user.
You can add remote users or groups only if your authentication server is enabled andconfigured.
Edit
Displays the Edit User dialog box, which enables you to edit the settings for the selecteduser.
Delete
Deletes the selected users from the management server database.
Test
Enables you to validate whether a remote user or group is present in the authenticationserver.
You can perform this task only if your authentication server is enabled and configured.
List view
The List view displays, in tabular format, information about the users that are created. You can usethe column filters to customize the data that is displayed.
Name
Displays the name of the user or group.
Type
Displays the type of user: Local User, Remote User, Remote Group, Database User, orMaintenance User.
Displays the email address of the user.
Role
Displays the type of role that is assigned to the user: Operator, Storage Administrator,Application Administrator, Integration Schema, or Report Schema.
632Managing user access
Related tasksViewing users on page 626
You can use the Users page to view the list of users who manage storage objects and data usingUnified Manager. You can view details about the users, such as the user name, type of user, emailaddress, and the role that is assigned to the users.
Adding users on page 625You can add local users or database users by using the Users page. You can also add remote usersor groups that belong to an authentication server. You can assign roles to these users and, based onthe privileges of the roles, users can manage the storage objects and data with Unified Manager, orview the data in a database.
Editing the user settings on page 626You can edit user settings—such as the email address and role—that are specified each user. Forexample, you might want to change the role of a user who is a storage operator, and assign storageadministrator privileges to the user.
Deleting users or groups on page 627You can delete one or more users from the management server database to prevent specific usersfrom accessing Unified Manager. You can also delete groups so that all the users in the group canno longer access the management server.
Add User dialog boxYou can create local users or database users, or add remote users or remote groups, and assignroles so that these users can manage storage objects and data using Unified Manager.
You can add a user by completing the following fields:
Type
Enables you to specify the type of user you want to create.
Name
Enables you to specify a user name that a user can use to log in to Unified Manager.
Password
Enables you to specify a password for the specified user name. This field is displayed onlywhen you are adding a local user or a database user.
Confirm Password
Enables you to reenter your password to ensure the accuracy of what you entered in thePassword field. This field is displayed only when you are adding a local user or a databaseuser.
Enables you to specify an email address for the user; the email address specified must beunique to the user name. This field is displayed only when you are adding a remote user ora local user.
Role
Enables you to assign a role to the user and defines the scope of activities that the user canperform. The role can be Application Administrator, Storage Administrator, Operator,Integration Schema, or Report Schema.
Command buttons
The command buttons enable you to perform the following tasks:
Add
Adds the user and closes the Add User dialog box.
633Managing user access

Cancel
Cancels the changes and closes the Add User dialog box.
Related tasksAdding users on page 625
You can add local users or database users by using the Users page. You can also add remote usersor groups that belong to an authentication server. You can assign roles to these users and, based onthe privileges of the roles, users can manage the storage objects and data with Unified Manager, orview the data in a database.
Edit User dialog boxThe Edit User dialog box enables you to edit only certain settings, depending on the selected user.
Details
The Details area enables you to edit the following information about a selected user:
Type
This field cannot be edited.
Name
This field cannot be edited.
Password
Enables you to edit the password when the selected user is a database user.
Confirm Password
Enables you to edit the confirmed password when the selected user is a database user.
Enables you to edit the email address of the selected user. This field can be edited when theselected user is a local user, LDAP user, or maintenance user.
Role
Enables you to edit the role that is assigned to the user. This field can be edited when theselected user is a local user, remote user, or remote group.
Command buttons
The command buttons enable you to perform the following tasks:
Save
Saves the changes and closes the Edit User dialog box.
Cancel
Cancels the changes and closes the Edit User dialog box.
Related tasksEditing the user settings on page 626
You can edit user settings—such as the email address and role—that are specified each user. Forexample, you might want to change the role of a user who is a storage operator, and assign storageadministrator privileges to the user.
634Managing user access

Managing authentication
You can enable authentication using either LDAP or Active Directory on the Unified Managerserver and configure it to work with your servers to authenticate remote users.
Additionally, you can enable SAML authentication so that remote users are authenticated througha secure identity provider (IdP) before they can log into the Unified Manager web UI.
Enabling remote authenticationYou can enable remote authentication so that the Unified Manager server can communicate withyour authentication servers. The users of the authentication server can access the Unified Managergraphical interface to manage storage objects and data.
Before you begin
You must have the Application Administrator role.
Important: The Unified Manager server must be connected directly with the authenticationserver. You must disable any local LDAP clients such as SSSD (System Security ServicesDaemon) or NSLCD (Name Service LDAP Caching Daemon).
About this task
You can enable remote authentication using either Open LDAP or Active Directory. If remoteauthentication is disabled, remote users cannot access Unified Manager.
Remote authentication is supported over LDAP and LDAPS (Secure LDAP). Unified Manageruses 389 as the default port for non-secure communication, and 636 as the default port for securecommunication.
Note: The certificate that is used to authenticate users must conform to the X.509 format.
Steps
1. In the left navigation pane, click General > Remote Authentication.
2. Check the box for Enable remote authentication....
3. In the Authentication Service field, select the type of service and configure the authenticationservice.
For Authentication type... Enter the following information...
Active Directory • Authentication server administrator name in one of following formats:
◦ domainname\username
◦ username@domainname
◦ Bind Distinguished Name (using the appropriate LDAP notation)
• Administrator password
• Base distinguished name (using the appropriate LDAP notation)
Open LDAP • Bind distinguished name (in the appropriate LDAP notation)
• Bind password
• Base distinguished name
If the authentication of an Active Directory user takes a long time or times out, theauthentication server is probably taking a long time to respond. Disabling support for nestedgroups in Unified Manager might reduce the authentication time.
635Managing authentication

If you select the Use Secure Connection option for the authentication server, then UnifiedManager communicates with the authentication server using the Secure Sockets Layer (SSL)protocol.
4. Optional: Add authentication servers, and test the authentication.
5. Click Save.
Related tasksAdding users on page 625
You can add local users or database users by using the Users page. You can also add remote usersor groups that belong to an authentication server. You can assign roles to these users and, based onthe privileges of the roles, users can manage the storage objects and data with Unified Manager, orview the data in a database.
Enabling SAML authentication on page 641You can enable Security Assertion Markup Language (SAML) authentication so that remote usersare authenticated by a secure identity provider (IdP) before they can access the Unified Managerweb UI.
Disabling nested groups from remote authenticationIf you have remote authentication enabled, you can disable nested group authentication so thatonly individual users, and not group members, can remotely authenticate to Unified Manager. Youcan disable nested groups when you want to improve Active Directory authentication responsetime.
Before you begin
• You must have the Application Administrator role.
• Disabling nested groups is only applicable when using Active Directory.
About this task
Disabling support for nested groups in Unified Manager might reduce the authentication time. Ifnested group support is disabled, and if a remote group is added to Unified Manager, individualusers must be members of the remote group to authenticate to Unified Manager.
Steps
1. In the left navigation pane, click General > Remote Authentication.
2. Check the box for Disable Nested Group Lookup.
3. Click Save.
Setting up authentication servicesAuthentication services enable the authentication of remote users or remote groups in anauthentication server before providing them access to Unified Manager. You can authenticate usersby using predefined authentication services (such as Active Directory or OpenLDAP), or byconfiguring your own authentication mechanism.
Before you begin
• You must have enabled remote authentication.
• You must have the Application Administrator role.
Steps
1. In the left navigation pane, click General > Remote Authentication.
2. Select one of the following authentication services:
636Managing authentication

If you select... Then do this...
Active Directory a. Enter the administrator name and password.
b. Specify the base distinguished name of the authentication server.
For example, if the domain name of the authentication server [email protected], then the base distinguished name iscn=ou,dc=domain,dc=com.
OpenLDAP a. Enter the bind distinguished name and bind password.
b. Specify the base distinguished name of the authentication server.
For example, if the domain name of the authentication server [email protected], then the base distinguished name iscn=ou,dc=domain,dc=com.
Others a. Enter the bind distinguished name and bind password.
b. Specify the base distinguished name of the authentication server.
For example, if the domain name of the authentication server [email protected], then the base distinguished name iscn=ou,dc=domain,dc=com.
c. Specify the LDAP protocol version that is supported by the authenticationserver.
d. Enter the user name, group membership, user group, and member attributes.
Note: If you want to modify the authentication service, you must delete any existingauthentication servers, and then add new authentication servers.
3. Click Save.
Related tasksAdding users on page 625
You can add local users or database users by using the Users page. You can also add remote usersor groups that belong to an authentication server. You can assign roles to these users and, based onthe privileges of the roles, users can manage the storage objects and data with Unified Manager, orview the data in a database.
Enabling remote authentication on page 635You can enable remote authentication so that the Unified Manager server can communicate withyour authentication servers. The users of the authentication server can access the Unified Managergraphical interface to manage storage objects and data.
Adding authentication serversYou can add authentication servers and enable remote authentication on the management server sothat remote users within the authentication server can access Unified Manager.
Before you begin
• The following information must be available:
◦ Host name or IP address of the authentication server
◦ Port number of the authentication server
• You must have enabled remote authentication and configured your authentication service sothat the management server can authenticate remote users or groups in the authenticationserver.
• You must have the Application Administrator role.
637Managing authentication

About this task
If the authentication server that you are adding is part of a high-availability (HA) pair (using thesame database), you can also add the partner authentication server. This enables the managementserver to communicate with the partner when one of the authentication servers is unreachable.
Steps
1. In the left navigation pane, click General > Remote Authentication.
2. Required: Enable or disable the Use secure connection option:
If you want to... Then do this...
Enable it a. Select the Use Secure Connection option.
b. In the Authentication Servers area, click Add.
c. In the Add Authentication Server dialog box, enter the authentication nameor IP address (IPv4 or IPv6) of the server.
d. In the Authorize Host dialog box, click View Certificate.
e. In the View Certificate dialog box, verify the certificate information, andthen click Close.
f. In the Authorize Host dialog box, click Yes.
Note: When you enable the Use Secure Connection authentication option,Unified Manager communicates with the authentication server and displaysthe certificate. Unified Manager uses 636 as default port for securecommunication and port number 389 for non-secure communication.
Disable it a. Clear the Use Secure Connection option.
b. In the Authentication Servers area, click Add.
c. In the Add Authentication Server dialog box, specify either the host name orIP address (IPv4 or IPv6) of the server, and the port details.
d. Click Add.
The authentication server that you added is displayed in the Servers area.
3. Perform a test authentication to confirm that you can authenticate users in the authenticationserver that you added.
Related conceptsAuthentication with Active Directory or OpenLDAP on page 641
You can enable remote authentication on the management server and configure the managementserver to communicate with your authentication servers so that users within the authenticationservers can access Unified Manager.
Related tasksAdding users on page 625
You can add local users or database users by using the Users page. You can also add remote usersor groups that belong to an authentication server. You can assign roles to these users and, based onthe privileges of the roles, users can manage the storage objects and data with Unified Manager, orview the data in a database.
Enabling remote authentication on page 635You can enable remote authentication so that the Unified Manager server can communicate withyour authentication servers. The users of the authentication server can access the Unified Managergraphical interface to manage storage objects and data.
Setting up authentication services on page 636
638Managing authentication

Authentication services enable the authentication of remote users or remote groups in anauthentication server before providing them access to Unified Manager. You can authenticate usersby using predefined authentication services (such as Active Directory or OpenLDAP), or byconfiguring your own authentication mechanism.
Testing the configuration of authentication servers on page 639You can validate the configuration of your authentication servers to ensure that the managementserver is able to communicate with them. You can validate the configuration by searching for aremote user or remote group from your authentication servers, and authenticating them using theconfigured settings.
Testing the configuration of authentication serversYou can validate the configuration of your authentication servers to ensure that the managementserver is able to communicate with them. You can validate the configuration by searching for aremote user or remote group from your authentication servers, and authenticating them using theconfigured settings.
Before you begin
• You must have enabled remote authentication, and configured your authentication service sothat the Unified Manager server can authenticate the remote user or remote group.
• You must have added your authentication servers so that the management server can search forthe remote user or remote group from these servers and authenticate them.
• You must have the Application Administrator role.
About this task
If the authentication service is set to Active Directory, and if you are validating the authenticationof remote users who belong to the primary group of the authentication server, information aboutthe primary group is not displayed in the authentication results.
Steps
1. In the left navigation pane, click General > Remote Authentication.
2. Click Test Authentication.
3. In the Test User dialog box, specify the user name and password of the remote user or the username of the remote group, and then click Test.
If you are authenticating a remote group, you must not enter the password.
Related tasksAdding users on page 625
You can add local users or database users by using the Users page. You can also add remote usersor groups that belong to an authentication server. You can assign roles to these users and, based onthe privileges of the roles, users can manage the storage objects and data with Unified Manager, orview the data in a database.
Enabling remote authentication on page 635You can enable remote authentication so that the Unified Manager server can communicate withyour authentication servers. The users of the authentication server can access the Unified Managergraphical interface to manage storage objects and data.
Setting up authentication services on page 636Authentication services enable the authentication of remote users or remote groups in anauthentication server before providing them access to Unified Manager. You can authenticate usersby using predefined authentication services (such as Active Directory or OpenLDAP), or byconfiguring your own authentication mechanism.
Adding authentication servers on page 637
639Managing authentication

You can add authentication servers and enable remote authentication on the management server sothat remote users within the authentication server can access Unified Manager.
Editing authentication serversYou can change the port that the Unified Manager server uses to communicate with yourauthentication server.
Before you begin
You must have the Application Administrator role.
Steps
1. In the left navigation pane, click General > Remote Authentication.
2. Check the Disable Nested Group Lookup box.
3. In the Authentication Servers area, select the authentication server that you want to edit, andthen click Edit.
4. In the Edit Authentication Server dialog box, edit the port details.
5. Click Save.
Related tasksAdding users on page 625
You can add local users or database users by using the Users page. You can also add remote usersor groups that belong to an authentication server. You can assign roles to these users and, based onthe privileges of the roles, users can manage the storage objects and data with Unified Manager, orview the data in a database.
Deleting authentication serversYou can delete an authentication server if you want to prevent the Unified Manager server fromcommunicating with the authentication server. For example, if you want to change anauthentication server that the management server is communicating with, you can delete theauthentication server and add a new authentication server.
Before you begin
You must have the Application Administrator role.
About this task
When you delete an authentication server, remote users or groups of the authentication server willno longer be able to access Unified Manager.
Steps
1. In the left navigation pane, click General > Remote Authentication.
2. Select one or more authentication servers that you want to delete, and then click Delete.
3. Click Yes to confirm the delete request.If the Use Secure Connection option is enabled, then the certificates associated with theauthentication server are deleted along with the authentication server.
Related tasksAdding users on page 625
You can add local users or database users by using the Users page. You can also add remote usersor groups that belong to an authentication server. You can assign roles to these users and, based on
640Managing authentication

the privileges of the roles, users can manage the storage objects and data with Unified Manager, orview the data in a database.
Authentication with Active Directory or OpenLDAPYou can enable remote authentication on the management server and configure the managementserver to communicate with your authentication servers so that users within the authenticationservers can access Unified Manager.
You can use one of the following predefined authentication services or specify your ownauthentication service:
• Microsoft Active Directory
Note: You cannot use Microsoft Lightweight Directory Services.
• OpenLDAP
You can select the required authentication service and add the appropriate authentication servers toenable the remote users in the authentication server to access Unified Manager. The credentials forremote users or groups are maintained by the authentication server. The management server usesthe Lightweight Directory Access Protocol (LDAP) to authenticate remote users within theconfigured authentication server.
For local users who are created in Unified Manager, the management server maintains its owndatabase of user names and passwords. The management server performs the authentication anddoes not use Active Directory or OpenLDAP for authentication.
Enabling SAML authenticationYou can enable Security Assertion Markup Language (SAML) authentication so that remote usersare authenticated by a secure identity provider (IdP) before they can access the Unified Managerweb UI.
Before you begin
• You must have configured remote authentication and verified that it is successful.
• You must have created at least one Remote User, or a Remote Group, with the ApplicationAdministrator role.
• The Identity provider (IdP) must be supported by Unified Manager and it must be configured.
• You must have the IdP URL and metadata.
• You must have access to the IdP server.
About this task
After you have enabled SAML authentication from Unified Manager, users cannot access thegraphical user interface until the IdP has been configured with the Unified Manager server hostinformation. So you must be prepared to complete both parts of the connection before starting theconfiguration process. The IdP can be configured before or after configuring Unified Manager.
Only remote users will have access to the Unified Manager graphical user interface after SAMLauthentication has been enabled. Local users and Maintenance users will not be able to access theUI. This configuration does not impact users who access the maintenance console, the UnifiedManager commands, or ZAPIs.
Note: Unified Manager is restarted automatically after you complete the SAML configurationon this page.
Steps
1. In the left navigation pane, click General > SAML Authentication.
641Managing authentication

2. Select the Enable SAML authentication checkbox.
The fields required to configure the IdP connection are displayed.
3. Enter the IdP URI and the IdP metadata required to connect the Unified Manager server to theIdP server.
If the IdP server is accessible directly from the Unified Manager server, you can click theFetch IdP Metadata button after entering the IdP URI to populate the IdP Metadata fieldautomatically.
4. Copy the Unified Manager host metadata URI, or save the host metadata to an XML text file.
You can configure the IdP server with this information at this time.
5. Click Save.A message box displays to confirm that you want to complete the configuration and restartUnified Manager.
6. Click Confirm and Logout and Unified Manager is restarted.
Result
The next time authorized remote users attempt to access the Unified Manager graphical interfacethey will enter their credentials in the IdP login page instead of the Unified Manager login page.
After you finish
If not already completed, access your IdP and enter the Unified Manager server URI and metadatato complete the configuration.
Important: When using ADFS as your identity provider, the Unified Manager GUI does nothonor the ADFS timeout and will continue to work until the Unified Manager session timeout isreached. You can change the GUI session timeout by clicking General > Feature Settings >Inactivity Timeout.
Related conceptsWhat a database restore is on page 607
A MySQL database restore is the process of restoring an existing Unified Manager backup file tothe same or a different Unified Manager server. You perform the restore operation from theUnified Manager maintenance console.
Related tasksEnabling remote authentication on page 635
You can enable remote authentication so that the Unified Manager server can communicate withyour authentication servers. The users of the authentication server can access the Unified Managergraphical interface to manage storage objects and data.
Adding users on page 625You can add local users or database users by using the Users page. You can also add remote usersor groups that belong to an authentication server. You can assign roles to these users and, based onthe privileges of the roles, users can manage the storage objects and data with Unified Manager, orview the data in a database.
Related referenceIdentity provider requirements on page 643
642Managing authentication

When configuring Unified Manager to use an identity provider (IdP) to perform SAMLauthentication for all remote users, you need to be aware of some required configuration settingsso that the connection to Unified Manager is successful.
Identity provider requirementsWhen configuring Unified Manager to use an identity provider (IdP) to perform SAMLauthentication for all remote users, you need to be aware of some required configuration settingsso that the connection to Unified Manager is successful.
You must enter the Unified Manager URI and metadata into the IdP server. You can copy thisinformation from the Unified Manager SAML Authentication page. Unified Manager isconsidered the service provider (SP) in the Security Assertion Markup Language (SAML)standard.
Supported encryption standards
• Advanced Encryption Standard (AES): AES-128 and AES-256
• Secure Hash Algorithm (SHA): SHA-1 and SHA-256
Validated identity providers
• Shibboleth
• Active Directory Federation Services (ADFS)
ADFS configuration requirements
• You must define three claim rules in the following order that are required for Unified Managerto parse ADFS SAML responses for this relying party trust entry.
Claim rule Value
SAM-account-name Name ID
SAM-account-name urn:oid:0.9.2342.19200300.100.1.1
Token groups – Unqualified Name urn:oid:1.3.6.1.4.1.5923.1.5.1.1
• You must set the authentication method to "Forms Authentication" or users may receive anerror when logging out of Unified Manager . Follow these steps:
1. Open the ADFS Management Console.
2. Click on the Authentication Policies folder on the left tree view.
3. Under Actions on the right, click Edit Global Primary Authentication Policy.
4. Set the Intranet Authentication Method to "Forms Authentication" instead of the default"Windows Authentication".
• In some cases login through the IdP is rejected when the Unified Manager security certificateis CA-signed. There are two workarounds to resolve this issue:
◦ Follow the instructions identified in the link to disable the revocation check on the ADFSserver for chained CA cert associated relying party:
Disable Revocation Check per Relying Party Trust◦ Have the CA server reside within the ADFS server to sign the Unified Manager server cert
request.
Other configuration requirements
• The Unified Manager clock skew is set to 5 minutes, so the time difference between the IdPserver and the Unified Manager server cannot be more than 5 minutes or authentication willfail.
643Managing authentication
Changing the identity provider used for SAML authenticationYou can change the identity provider (IdP) that Unified Manager uses to authenticate remote users.
Before you begin
• You must have the IdP URL and metadata.
• You must have access to the IdP.
About this task
The new IdP can be configured before or after configuring Unified Manager.
Steps
1. In the left navigation pane, click General > SAML Authentication.
2. Enter the new IdP URI and the IdP metadata required to connect the Unified Manager server tothe IdP.
If the IdP is accessible directly from the Unified Manager server, you can click the Fetch IdPMetadata button after entering the IdP URL to populate the IdP Metadata field automatically.
3. Copy the Unified Manager metadata URI, or save the metadata to an XML text file.
4. Click Save Configuration.A message box displays to confirm that you want to change the configuration.
5. Click OK.
After you finish
Access the new IdP and enter the Unified Manager server URI and metadata to complete theconfiguration.
The next time authorized remote users attempt to access the Unified Manager graphical interfacethey will enter their credentials in the new IdP login page instead of the old IdP login page.
Related referenceIdentity provider requirements on page 643
When configuring Unified Manager to use an identity provider (IdP) to perform SAMLauthentication for all remote users, you need to be aware of some required configuration settingsso that the connection to Unified Manager is successful.
Disabling SAML authenticationYou can disable SAML authentication when you want to stop authenticating remote users througha secure identity provider (IdP) before they can log into the Unified Manager web UI. WhenSAML authentication is disabled, the configured directory service providers, such as ActiveDirectory or LDAP, perform sign-on authentication.
About this task
After you disable SAML authentication, Local users and Maintenance users will be able to accessthe graphical user interface in addition to configured Remote users.
You can also disable SAML authentication using the Unified Manager maintenance console if youdo not have access to the graphical user interface.
Note: Unified Manager is restarted automatically after SAML authentication is disabled.
Steps
1. In the left navigation pane, click General > SAML Authentication.
2. Uncheck the Enable SAML authentication checkbox.
644Managing authentication

3. Click Save.A message box displays to confirm that you want to complete the configuration and restartUnified Manager.
4. Click Confirm and Logout and Unified Manager is restarted.
Result
The next time remote users attempt to access the Unified Manager graphical interface they willenter their credentials in the Unified Manager login page instead of the IdP login page.
After you finish
Access your IdP and delete the Unified Manager server URI and metadata.
Description of authentication windows and dialog boxesYou can enable LDAP authentication from the Setup/Authentication page.
Remote Authentication pageYou can use the Remote Authentication page to configure Unified Manager to communicate withyour authentication server to authenticate remote users who attempt to log into the UnifiedManager web UI.
You must have the Application Administrator or Storage Administrator role.
After you select the Enable remote authentication checkbox, you can enable remote authenticationusing an authentication server.
Authentication Service
Enables you to configure the management server to authenticate users in directory serviceproviders, such as Active Directory, OpenLDAP, or specify your own authenticationmechanism. You can specify an authentication service only if you have enabled remoteauthentication.
Active Directory
• Administrator Name
Specifies the administrator name of the authentication server.
• Password
Specifies the password to access the authentication server.
• Base Distinguished Name
Specifies the location of the remote users in the authentication server. Forexample, if the domain name of the authentication server is [email protected],then the base distinguished name is cn=ou,dc=domain,dc=com.
• Disable Nested Group Lookup
Specifies whether to enable or disable the nested group lookup option. By defaultthis option is disabled. If you use Active Directory, you can speed upauthentication by disabling support for nested groups.
• Use Secure Connection
Specifies the authentication service used for communicating with authenticationservers.
OpenLDAP
• Bind Distinguished Name
Specifies the bind distinguished name that is used along with the basedistinguished name to find remote users in the authentication server.
• Bind Password
645Managing authentication

Specifies the password to access the authentication server.
• Base Distinguished Name
Specifies the location of the remote users in the authentication server. Forexample, if the domain name of the authentication server is [email protected],then the base distinguished name is cn=ou,dc=domain,dc=com.
• Use Secure Connection
Specifies that Secure LDAP is used for communicating with LDAPSauthentication servers.
Others
• Bind Distinguished Name
Specifies the bind distinguished name that is used along with the basedistinguished name to find remote users in the authentication server that you haveconfigured.
• Bind Password
Specifies the password to access the authentication server.
• Base Distinguished Name
Specifies the location of the remote users in the authentication server. Forexample, if the domain name of the authentication server is [email protected],then the base distinguished name is cn=ou,dc=domain,dc=com.
• Protocol Version
Specifies the Lightweight Directory Access Protocol (LDAP) version that issupported by your authentication server. You can specify whether the protocolversion must be automatically detected or set the version to 2 or 3.
• User Name Attribute
Specifies the name of the attribute in the authentication server that contains userlogin names to be authenticated by the management server.
• Group Membership Attribute
Specifies a value that assigns the management server group membership toremote users based on an attribute and value specified in the user's authenticationserver.
• UGID
If the remote users are included as members of a GroupOfUniqueNames object inthe authentication server, this option enables you to assign the managementserver group membership to the remote users based on a specified attribute in thatGroupOfUniqueNames object.
• Disable Nested Group Lookup
Specifies whether to enable or disable the nested group lookup option. By defaultthis option is disabled. If you use Active Directory, you can speed upauthentication by disabling support for nested groups.
• Member
Specifies the attribute name that your authentication server uses to storeinformation about the individual members of a group.
• User Object Class
Specifies the object class of a user in the remote authentication server.
• Group Object Class
Specifies the object class of all groups in the remote authentication server.
• Use Secure Connection
Specifies the authentication service used for communicating with authenticationservers.
646Managing authentication

Note: If you want to modify the authentication service, ensure that you delete anyexisting authentication servers and add new authentication servers.
Authentication Servers area
The Authentication Servers area displays the authentication servers that the management servercommunicates with to find and authenticate remote users. The credentials for remote users orgroups are maintained by the authentication server.
Command buttons
Enables you to add, edit, or delete authentication servers.
• Add
Enables you to add an authentication server.
If the authentication server that you are adding is part of a high-availability pair (usingthe same database), you can also add the partner authentication server. This enables themanagement server to communicate with the partner when one of the authenticationservers is unreachable.
• Edit
Enables you to edit the settings for a selected authentication server.
• Delete
Deletes the selected authentication servers.
Name or IP Address
Displays the host name or IP address of the authentication server that is used to authenticatethe user on the management server.
Port
Displays the port number of the authentication server.
Test Authentication
This button validates the configuration of your authentication server by authenticating aremote user or group.
While testing, if you specify only the user name, the management server searches for theremote user in the authentication server, but does not authenticate the user. If you specifyboth the user name and password, the management server searches and authenticates theremote user.
You cannot test the authentication if remote authentication is disabled.
Related tasksEnabling remote authentication on page 635
You can enable remote authentication so that the Unified Manager server can communicate withyour authentication servers. The users of the authentication server can access the Unified Managergraphical interface to manage storage objects and data.
Setting up authentication services on page 636Authentication services enable the authentication of remote users or remote groups in anauthentication server before providing them access to Unified Manager. You can authenticate usersby using predefined authentication services (such as Active Directory or OpenLDAP), or byconfiguring your own authentication mechanism.
Adding authentication servers on page 637You can add authentication servers and enable remote authentication on the management server sothat remote users within the authentication server can access Unified Manager.
Editing authentication servers on page 640
647Managing authentication

You can change the port that the Unified Manager server uses to communicate with yourauthentication server.
Testing the configuration of authentication servers on page 639You can validate the configuration of your authentication servers to ensure that the managementserver is able to communicate with them. You can validate the configuration by searching for aremote user or remote group from your authentication servers, and authenticating them using theconfigured settings.
Deleting authentication servers on page 640You can delete an authentication server if you want to prevent the Unified Manager server fromcommunicating with the authentication server. For example, if you want to change anauthentication server that the management server is communicating with, you can delete theauthentication server and add a new authentication server.
SAML Authentication pageYou can use the SAML Authentication page to configure Unified Manager to authenticate remoteusers using SAML though a secure identity provider (IdP) before they can to log in to the UnifiedManager web UI.
• You must have the Application Administrator role to create or modify the SAMLconfiguration.
• You must have configured remote authentication.
• You must have configured at least one remote user or remote group.
After remote authentication and remote users have been configured, you can select the EnableSAML authentication checkbox to enable authentication using a secure identity provider.
IdP URI
The URI to access the IdP from the Unified Manager server. Example URIs are listedbelow.
ADFS example URI:
https://win2016-dc.ntap2016.local/federationmetadata/2007-06/
federationmetadata.xml
Shibboleth example URI:
https://centos7.ntap2016.local/idp/shibboleth
IdP Metadata
The IdP metadata in XML format.
If the IdP URL is accessible from the Unified Manager server, you can click the Fetch IdPMetadata button to populate this field.
Host System (FQDN)
The FQDN of the Unified Manager host system as defined during installation. You canchange this value if necessary.
Host URI
The URI to access the Unified Manager host system from the IdP.
Host Metadata
The host system metadata in XML format.
Related tasksEnabling SAML authentication on page 641
648Managing authentication

You can enable Security Assertion Markup Language (SAML) authentication so that remote usersare authenticated by a secure identity provider (IdP) before they can access the Unified Managerweb UI.
Enabling remote authentication on page 635You can enable remote authentication so that the Unified Manager server can communicate withyour authentication servers. The users of the authentication server can access the Unified Managergraphical interface to manage storage objects and data.
649Managing authentication

Managing security certificates
You can configure HTTPS in the Unified Manager server to monitor and manage your clustersover a secure connection.
Viewing the HTTPS security certificateYou can compare the HTTPS certificate details to the retrieved certificate in your browser toensure that your browser's encrypted connection to Unified Manager is not being intercepted.
Before you begin
You must have the Operator, Application Administrator, or Storage Administrator role.
About this task
Viewing the certificate enables you to verify the content of a regenerated certificate, or to viewalternate URL names from which you can access Unified Manager.
Step
In the left navigation pane, click General > HTTPS Certificate.The HTTPS certificate is displayed at the top of the page
After you finish
If you need to view more detailed information about the security certificate than what is displayedon the HTTPS Certificate page, you can view the connection certificate in your browser.
Related tasksGenerating an HTTPS security certificate on page 650
You might generate a new HTTPS security certificate for multiple reasons, including if you wantto sign with a different Certificate Authority or if the current security certificate has expired. Thenew certificate replaces the existing certificate.
Downloading an HTTPS certificate signing request on page 652You can download a certification request for the current HTTPS security certificate so that you canprovide the file to a Certificate Authority to sign. A CA-signed certificate helps prevent man-in-the-middle attacks and provides better security protection than a self-signed certificate.
Installing an HTTPS security certificate on page 653You can upload and install a security certificate after a Certificate Authority has signed andreturned it. The file that you upload and install must be a signed version of the existing self-signedcertificate. A CA-signed certificate helps prevent man-in-the middle attacks and provides bettersecurity protection than a self-signed certificate.
Generating an HTTPS security certificateYou might generate a new HTTPS security certificate for multiple reasons, including if you wantto sign with a different Certificate Authority or if the current security certificate has expired. Thenew certificate replaces the existing certificate.
Before you begin
You must have the Application Administrator role.
About this task
If you do not have access to the Unified Manager web UI, you can regenerate the HTTPScertificate with the same values using the maintenance console.
650Managing security certificates

Steps
1. In the left navigation pane, click General > HTTPS Certificate.
2. Click Regenerate HTTPS Certificate.The Regenerate HTTPS Certificate dialog box is displayed.
3. Select one of the following options depending on how you want to generate the certificate:
If you want to... Do this...
Regenerate the certificate withthe current values
Click the Regenerate Using Current Certificate Attributes option.
Generate the certificate usingdifferent values
Click the Update the Current Certificate Attributes option.
The Common Name and Alternative Names fields will use the values from theexisting certificate if you do not enter new values. The other fields do not requirevalues, but you can enter values, for example, for the City, State, and Country ifyou want those values to be populated in the certificate.
Note: You can select the "Exclude local identifying information (e.g.localhost)" checkbox if you want to remove the local identifying informationfrom the Alternative Names field in the certificate. When this checkbox isselected only what you enter in the field is used in the Alternative Namesfield. When left blank the resulting certificate will not have an AlternativeNames field at all.
4. Click Yes to regenerate the certificate.
5. Restart the Unified Manager server so that the new certificate takes effect.
After you finish
Verify the new certificate information by viewing the HTTPS certificate.
Related conceptsWhat a database restore is on page 607
A MySQL database restore is the process of restoring an existing Unified Manager backup file tothe same or a different Unified Manager server. You perform the restore operation from theUnified Manager maintenance console.
Related tasksViewing the HTTPS security certificate on page 650
You can compare the HTTPS certificate details to the retrieved certificate in your browser toensure that your browser's encrypted connection to Unified Manager is not being intercepted.
Downloading an HTTPS certificate signing request on page 652You can download a certification request for the current HTTPS security certificate so that you canprovide the file to a Certificate Authority to sign. A CA-signed certificate helps prevent man-in-the-middle attacks and provides better security protection than a self-signed certificate.
Restarting the Unified Manager virtual machine on page 652
651Managing security certificates

You can restart the virtual machine from the maintenance console of Unified Manager. You mustrestart after generating a new security certificate or if there is a problem with the virtual machine.
Restarting the Unified Manager virtual machineYou can restart the virtual machine from the maintenance console of Unified Manager. You mustrestart after generating a new security certificate or if there is a problem with the virtual machine.
Before you begin
The virtual appliance is powered on.
You are logged in to the maintenance console as the maintenance user.
About this task
You can also restart the virtual machine from vSphere by using the Restart Guest option. See theVMware documentation for more information.
Steps
1. Access the maintenance console.
2. Select System Configuration > Reboot Virtual Machine.
Related tasksViewing the HTTPS security certificate on page 650
You can compare the HTTPS certificate details to the retrieved certificate in your browser toensure that your browser's encrypted connection to Unified Manager is not being intercepted.
Generating an HTTPS security certificate on page 650You might generate a new HTTPS security certificate for multiple reasons, including if you wantto sign with a different Certificate Authority or if the current security certificate has expired. Thenew certificate replaces the existing certificate.
Downloading an HTTPS certificate signing request on page 652You can download a certification request for the current HTTPS security certificate so that you canprovide the file to a Certificate Authority to sign. A CA-signed certificate helps prevent man-in-the-middle attacks and provides better security protection than a self-signed certificate.
Downloading an HTTPS certificate signing requestYou can download a certification request for the current HTTPS security certificate so that you canprovide the file to a Certificate Authority to sign. A CA-signed certificate helps prevent man-in-the-middle attacks and provides better security protection than a self-signed certificate.
Before you begin
You must have the Application Administrator role.
Steps
1. In the left navigation pane, click General > HTTPS Certificate.
2. Click Download HTTPS Certificate Signing Request.
3. Save the <hostname>.csr file.
After you finish
You can provide the file to a Certificate Authority to sign, and then install the signed certificate.
Related tasksViewing the HTTPS security certificate on page 650
652Managing security certificates

You can compare the HTTPS certificate details to the retrieved certificate in your browser toensure that your browser's encrypted connection to Unified Manager is not being intercepted.
Generating an HTTPS security certificate on page 650You might generate a new HTTPS security certificate for multiple reasons, including if you wantto sign with a different Certificate Authority or if the current security certificate has expired. Thenew certificate replaces the existing certificate.
Installing an HTTPS security certificate on page 653You can upload and install a security certificate after a Certificate Authority has signed andreturned it. The file that you upload and install must be a signed version of the existing self-signedcertificate. A CA-signed certificate helps prevent man-in-the middle attacks and provides bettersecurity protection than a self-signed certificate.
Installing an HTTPS security certificateYou can upload and install a security certificate after a Certificate Authority has signed andreturned it. The file that you upload and install must be a signed version of the existing self-signedcertificate. A CA-signed certificate helps prevent man-in-the middle attacks and provides bettersecurity protection than a self-signed certificate.
Before you begin
You must have completed the following actions:
• Downloaded the Certificate Signing Request file and had it signed by a Certificate Authority
• Saved the certificate chain in PEM format
• Included all certificates in the chain, from the Unified Manager server certificate to the rootsigning certificate, including any intermediate certificates present
You must have the Application Administrator role.
Steps
1. In the left navigation pane, click General > HTTPS Certificate.
2. Click Install HTTPS Certificate.
3. In the dialog box that is displayed, click Choose file... to locate the file to upload.
4. Select the file, and then click Install to install the file.
Example certificate chain
The following example shows how the certificate chain file might appear:
-----BEGIN CERTIFICATE-----<Server certificate>-----END CERTIFICATE----------BEGIN CERTIFICATE-----<Intermediate certificate #1 (if present)>-----END CERTIFICATE----------BEGIN CERTIFICATE-----<Intermediate certificate #2 (if present)>-----END CERTIFICATE----------BEGIN CERTIFICATE-----<Root signing certificate>-----END CERTIFICATE-----
Page descriptions for certificate managementYou can use the HTTPS Certificate page to view the current security certificates and to generatenew HTTPS certificates.
653Managing security certificates

HTTPS Certificate pageThe HTTPS Certificate page enables you to view the current security certificate, download acertificate signing request, generate a new HTTPS certificate, or install a new HTTPS certificate.
If you have not generated a new HTTPS certificate, the certificate that appears on this page is thecertificate that was generated during installation.
Command buttons
The command buttons enable you to perform the following operations:
Download HTTPS Certificate Signing Request
Downloads a certification request for the currently installed HTTPS certificate. Yourbrowser prompts you to save the <hostname>.csr file so that you can provide the file to aCertificate Authority to sign.
Install HTTPS Certificate
Enables you to upload and install a security certificate after a Certificate Authority hassigned and returned it. The new certificate is in effect after you restart the managementserver.
Regenerate HTTPS Certificate
Enables you to generate an HTTPS certificate, which replaces the current securitycertificate. The new certificate is in effect after you restart Unified Manager.
Related tasksGenerating an HTTPS security certificate on page 650
You might generate a new HTTPS security certificate for multiple reasons, including if you wantto sign with a different Certificate Authority or if the current security certificate has expired. Thenew certificate replaces the existing certificate.
Downloading an HTTPS certificate signing request on page 652You can download a certification request for the current HTTPS security certificate so that you canprovide the file to a Certificate Authority to sign. A CA-signed certificate helps prevent man-in-the-middle attacks and provides better security protection than a self-signed certificate.
Installing an HTTPS security certificate on page 653You can upload and install a security certificate after a Certificate Authority has signed andreturned it. The file that you upload and install must be a signed version of the existing self-signedcertificate. A CA-signed certificate helps prevent man-in-the middle attacks and provides bettersecurity protection than a self-signed certificate.
Regenerate HTTPS Certificate dialog boxThe Regenerate HTTPS Certificate dialog box enables you to customize the security informationand then generate a new HTTPS certificate with that information.
The current certificate information appears on this page.
The "Regenerate Using Current Certificate Attributes" and "Update the Current CertificateAttributes" selection enables you to regenerate the certificate with the current information orgenerate a certificate with new information.
Common Name
Required. The fully qualified domain name (FQDN) that you wish to secure.
In Unified Manager high availability configurations, use the virtual IP address.
Optional. An email address to contact your organization; typically the email address of thecertificate administrator or IT department.
654Managing security certificates

Company
Optional. Typically the incorporated name of your company.
Department
Optional. The name of the department in your company.
City
Optional. The city location of your company.
State
Optional. The state or province location, not abbreviated, of your company.
Country
Optional. The country location of your company. This is typically a two-letter ISO code ofthe country.
Alternative Names
Required. Additional, non-primary domain names that can be used to access this server inaddition to the existing localhost or other network addresses. Separate each alternate namewith a comma.
Select the "Exclude local identifying information (e.g. localhost)" checkbox if you want toremove the local identifying information from the Alternative Names field in the certificate.When this checkbox is selected only what you enter in the field is used in the AlternativeNames field. When left blank the resulting certificate will not have an Alternative Namesfield at all.
Related tasksGenerating an HTTPS security certificate on page 650
You might generate a new HTTPS security certificate for multiple reasons, including if you wantto sign with a different Certificate Authority or if the current security certificate has expired. Thenew certificate replaces the existing certificate.
655Managing security certificates

Managing feature settings
The Feature Settings page allows you to enable and disable specific features in Active IQ UnifiedManager. This includes creating and managing storage objects based on policies, enabling the APIGateway, uploading scripts for managing alerts, timing out a web UI session based on inactivitytime, and disabling receipt of Active IQ platform events.
Note: The Feature Settings page is only available for users with Application Administrator role.
For information about Scripts Upload, see Enabling and disabling the ability to upload scripts.
Policy-based storage managementThe Policy-based storage management option allows storage management based on service levelobjectives (SLOs). This option is enabled by default.
On activating this feature, you can provision storage workloads on the ONTAP clusters added toyour Active IQ Unified Manager instance, and manage these workloads based on the assignedPerformance Service Levels and Storage Efficiency Policies.
You can choose to activate or deactivate this feature from General > Feature Settings > Policy-based storage management. On activating this feature, the following pages are available foroperation and monitoring:
• Provisioning (storage workload provisioning)
• Policies > Performance Service Levels
• Policies > Storage Efficiency
• Workloads Managed by Performance Service Level column on the Clusters Setup page
• Workload Performance panel on the Dashboard
You can use the screens to create Performance Service Levels and Storage Efficiency Policies, andprovision storage workloads. You can also monitor the storage workloads that conform to theassigned Performance Service Levels, as well as the nonconforming ones. The WorkloadPerformance and Workload IOPS panel also enables you to assess the total, available, and usedcapacity and performance (IOPS) of the clusters across your data center based on the storageworkloads provisioned on them.
After activating this feature, you can run the Unified Manager REST APIs to perform some ofthese functions from Menu Bar > Help button > API Documentation > storage-providercategory. Alternatively, you can enter the host name or IP address and the URL to access theREST API page in the format https://<hostname>/docs/api/
For more information about the APIs, see the Active IQ Unified Manager API Developer's Guide.
Active IQ Unified Manager API Developer's Guide
Related conceptsProvisioning and managing workloads on page 312
656Managing feature settings

The active management feature of Active IQ Unified Manager provides Performance ServiceLevels, Storage Efficiency Policies, and storage provider APIs for provisioning, monitoring, andmanaging storage workloads in a data center.
API GatewayThe API Gateway feature allows Active IQ Unified Manager to be a single control plane fromwhich you can manage multiple ONTAP clusters, without logging in to them individually.
You can enable this feature from the configuration pages that appear when you first log in toUnified Manager. Alternatively, you can enable or disable this feature from General > FeatureSettings > API Gateway.
Unified Manager REST APIs are different from the ONTAP REST APIs, and not all thefunctionalities of ONTAP REST APIs can be availed by using the Unified Manager REST APIs.However, if you have a specific business requirement of accessing the ONTAP APIs for managingspecific features that are not exposed to Unified Manager, you can enable the API Gateway featureand execute the ONTAP APIs. The gateway acts as a proxy to tunnel the API requests bymaintaining the header and body requests in the same format as in the ONTAP APIs. You can useyour Unified Manager credentials and execute the specific APIs to access and manage the ONTAPclusters without passing individual cluster credentials. Unified Manager performs as a single pointof management for running the APIs across the ONTAP clusters managed by your UnifiedManager instance. The response returned by the APIs is the same as the response returned by therespective ONTAP REST APIs executed directly from ONTAP.
After enabling this feature, you can execute the Unified Manager REST APIs from Menu Bar >Help button > API Documentation > gateway category. Alternatively, you can enter the hostname or IP address and the URL to access the REST API page in the format https://<hostname>/docs/api/
For more information about the APIs, see the Active IQ Unified Manager API Developer's Guide.
Inactivity timeoutYou can specify the inactivity timeout value for Active IQ Unified Manager. After an inactivity ofthe specified time, the application is automatically logged out. This option is enabled by default.
You can deactivate this feature or modify the time from General > Feature Settings > InactivityTimeout. Once you activate this feature, you should specify the time limit of inactivity (inminutes) in the LOGOUT AFTER field, after which the system automatically logs out. Thedefault value is 4320 minutes (72 hours).
Note: This option is not available if you have enabled Security Assertion Markup Language(SAML) authentication.
Active IQ portal eventsYou can specify whether you want to enable or disable Active IQ portal events. This setting allowsthe Active IQ portal to discover and display additional events about system configuration, cabling,and so forth. This option is enabled by default.
On enabling this feature, Active IQ Unified Manager displays events discovered by the Active IQportal. These events are created by running a set of rules against AutoSupport messages generatedfrom all monitored storage systems. These events are different from the other Unified Managerevents, and they identify incidents or risks related to system configuration, cabling, best practice,and availability issues.
657Managing feature settings

You can choose to activate or deactivate this feature from General > Feature Settings > ActiveIQ Portal Events. In sites with no external network access, you must upload the rules manuallyfrom Storage Management > Event Setup > Upload Rules.
This feature is enabled by default. Disabling this feature stops the Active IQ events from beingdiscovered or displayed on Unified Manager. When disabled, enabling this feature allows UnifiedManager to receive the Active IQ events on a cluster at a predefined time of 00:15 for that clustertimezone.
658Managing feature settings

Troubleshooting
Troubleshooting information helps you to identify and resolve issues you encounter when usingUnified Manager.
Changing the Unified Manager host nameAt some point, you might want to change the host name of the system on which you have installedUnified Manager. For example, you might want to rename the host to more easily identify yourUnified Manager servers by type, workgroup, or monitored cluster group.
The steps required to change the host name are different depending on whether Unified Manager isrunning on a VMware ESXi server, on a Red Hat or CentOS Linux server, or on a MicrosoftWindows server.
Changing the Unified Manager virtual appliance host nameThe network host is assigned a name when the Unified Manager virtual appliance is first deployed.You can change the host name after deployment. If you change the host name, you must alsoregenerate the HTTPS certificate.
Before you begin
You must be logged in to Unified Manager as the maintenance user, or have the ApplicationAdministrator role assigned to you to perform these tasks.
About this task
You can use the host name (or the host IP address) to access the Unified Manager web UI. If youconfigured a static IP address for your network during deployment, then you would havedesignated a name for the network host. If you configured the network using DHCP, the host nameshould be taken from the DNS. If DHCP or DNS is not properly configured, the host name"Unified Manager" is automatically assigned and associated with the security certificate.
Regardless of how the host name was assigned, if you change the host name, and intend to use thenew host name to access the Unified Manager web UI, you must generate a new securitycertificate.
If you access the web UI by using the server's IP address instead of the host name, you do not haveto generate a new certificate if you change the host name. However, it is the best practice to updatethe certificate so that the host name in the certificate matches the actual host name.
If you change the host name in Unified Manager, you must manually update the host name inOnCommand Workflow Automation (WFA). The host name is not updated automatically in WFA.
The new certificate does not take effect until the Unified Manager virtual machine is restarted.
Steps
1. Generate an HTTPS security certificate
If you want to use the new host name to access the Unified Manager web UI, you mustregenerate the HTTPS certificate to associate it with the new host name.
2. Restart the Unified Manager virtual machine
After you regenerate the HTTPS certificate, you must restart the Unified Manager virtualmachine.
659Troubleshooting

Changing the Unified Manager host name on Linux systemsAt some point, you might want to change the host name of the Red Hat Enterprise Linux orCentOS machine on which you have installed Unified Manager. For example, you might want torename the host to more easily identify your Unified Manager servers by type, workgroup, ormonitored cluster group when you list your Linux machines.
Before you begin
You must have root user access to the Linux system on which Unified Manager is installed.
About this task
You can use the host name (or the host IP address) to access the Unified Manager web UI. If youconfigured a static IP address for your network during deployment, then you would havedesignated a name for the network host. If you configured the network using DHCP, the host nameshould be taken from the DNS server.
Regardless of how the host name was assigned, if you change the host name and intend to use thenew host name to access the Unified Manager web UI, you must generate a new securitycertificate.
If you access the web UI by using the server's IP address instead of the host name, you do not haveto generate a new certificate if you change the host name. However, it is the best practice to updatethe certificate, so that the host name in the certificate matches the actual host name. The newcertificate does not take effect until the Linux machine is restarted.
If you change the host name in Unified Manager, you must manually update the host name inOnCommand Workflow Automation (WFA). The host name is not updated automatically in WFA.
Steps
1. Log in as the root user to the Unified Manager system that you want to modify.
2. Stop the Unified Manager software and the associated MySQL software by entering thefollowing command:
systemctl stop ocieau ocie mysqld
3. Change the host name using the Linux hostnamectl command:
hostnamectl set-hostname new_FQDN
hostnamectl set-hostname nuhost.corp.widget.com
4. Regenerate the HTTPS certificate for the server:
/opt/netapp/essentials/bin/cert.sh create
5. Restart the network service:
service network restart
6. After the service is restarted, verify whether the new host name is able to ping itself:
ping new_hostname
ping nuhost
This command should return the same IP address that was set earlier for the original hostname.
7. After you complete and verify your host name change, restart Unified Manager by entering thefollowing command:
systemctl start mysqld ocie ocieau
660Troubleshooting

Adding disk space to the Unified Manager database directoryThe Unified Manager database directory contains all of the health and performance data collectedfrom ONTAP systems. Some circumstances may require that you increase the size of the databasedirectory.
For example, the database directory may get full if Unified Manager is collecting data from a largenumber of clusters where each cluster has many nodes. You will receive a warning event when thedatabase directory is 90% full, and a critical event when the directory is 95% full.
Important: No additional data is collected from clusters after the directory reaches 95% full.
The steps required to add capacity to the data directory are different depending on whether UnifiedManager is running on a VMware ESXi server, on a Red Hat or CentOS Linux server, or on aMicrosoft Windows server.
Adding space to the data disk of the VMware virtual machineIf you need to increase the amount of space on the data disk for the Unified Manager database,you can add capacity after installation by increasing disk space using the Unified Managermaintenance console.
Before you begin
• You must have access to the vSphere Client.
• The virtual machine must have no snapshots stored locally.
• You must have the maintenance user credentials.
About this task
We recommend that you back up your virtual machine before increasing the size of virtual disks.
Steps
1. In the vSphere client, select the Unified Manager virtual machine, and then add more diskcapacity to data disk 3. See the VMware documentation for details.
In some rare cases the Unified Manager deployment uses "Hard Disk 2" for the data diskinstead of "Hard Disk 3". If this has occurred in your deployment, increase the space ofwhichever disk is larger. The data disk will always have more space than the other disk.
2. In the vSphere client, select the Unified Manager virtual machine, and then select the Consoletab.
3. Click in the console window, and then log in to the maintenance console using your user nameand password.
4. In the Main Menu, enter the number for the System Configuration option.
5. In the System Configuration Menu, enter the number for the Increase Data Disk Size option.
Adding space to the data directory of the Linux hostIf you allotted insufficient disk space to the /opt/netapp/data directory to support UnifiedManager when you originally set up the Linux host and then installed Unified Manager, you canadd disk space after installation by increasing disk space on the /opt/netapp/data directory.
Before you begin
You must have root user access to the Red Hat Enterprise Linux or CentOS Linux machine onwhich Unified Manager is installed.
661Troubleshooting

About this task
We recommend that you back up the Unified Manager database before increasing the size of thedata directory.
Steps
1. Log in as root user to the Linux machine on which you want to add disk space.
2. Stop the Unified Manager service and the associated MySQL software in the order shown:
systemctl stop ocieau ocie mysqld
3. Create a temporary backup folder (for example, /backup-data) with sufficient disk spaceto contain the data in the current /opt/netapp/data directory.
4. Copy the content and privilege configuration of the existing /opt/netapp/data directoryto the backup data directory:
cp -arp /opt/netapp/data/* /backup-data
5. If SE Linux is enabled:
a. Get the SE Linux type for folders on existing /opt/netapp/data folder:
se_type=`ls -Z /opt/netapp/data | awk '{print $4}' | awk -F: '{print $3}' | head-1`
The system returns a confirmation similar to the following:
echo $se_typemysqld_db_t
b. Run the chcon command to set the SE Linux type for the backup directory:
chcon -R --type=mysqld_db_t /backup-data
6. Remove the contents of the /opt/netapp/data directory:
a. cd /opt/netapp/data
b. rm -rf *
7. Expand the size of the /opt/netapp/data directory to a minimum of 750 GB throughLVM commands or by adding extra disks.
Important: Mounting the /opt/netapp/data directory on an NFS or CIFS share is notsupported.
8. Confirm that the /opt/netapp/data directory owner (mysql) and group (root) areunchanged:
ls -ltr /opt/netapp/ | grep data
The system returns a confirmation similar to the following:
drwxr-xr-x. 17 mysql root 4096 Aug 28 13:08 data
9. If SE Linux is enabled, confirm that the context for the /opt/netapp/data directory is stillset to mysqld_db_t:
a. touch /opt/netapp/data/abc
b. ls -Z /opt/netapp/data/abc
The system returns a confirmation similar to the following:
-rw-r--r--. root root unconfined_u:object_r:mysqld_db_t:s0 /opt/netapp/data/abc
10. Delete the file abc so that this extraneous file does not cause a database error in the future.
11. Copy the contents from backup-data back to the expanded /opt/netapp/data directory:
cp -arp /backup-data/* /opt/netapp/data/
662Troubleshooting

12. If SE Linux is enabled, run the following command:
chcon -R --type=mysqld_db_t /opt/netapp/data
13. Start the MySQL service:
systemctl start mysqld
14. After the MySQL service is started, start the ocie and ocieau services in the order shown:
systemctl start ocie ocieau
15. After all of the services are started, delete the backup folder /backup-data:
rm -rf /backup-data
Adding space to the logical drive of the Microsoft Windows serverIf you need to increase the amount of disk space for the Unified Manager database, you can addcapacity to the logical drive on which Unified Manager is installed.
Before you begin
You must have Windows administrator privileges.
About this task
We recommend that you back up the Unified Manager database before adding disk space.
Steps
1. Log in as administrator to the Windows server on which you want to add disk space.
2. Follow the step that corresponds to method you want to use to add more space:
Option Description
On a physical server, addcapacity to the logical drive onwhich the Unified Managerserver is installed.
Follow the steps in the Microsoft topic:
Extend a Basic Volume
On a physical server, add a harddisk drive.
Follow the steps in the Microsoft topic:
Adding Hard Disk Drives
On a virtual machine, increasethe size of a disk partition.
Follow the steps in the VMware topic:
Increasing the size of a disk partition
Changing the performance statistics collection intervalThe default collection interval for performance statistics is 5 minutes. You can change this intervalto 10 or 15 minutes if you find that collections from large clusters are not finishing within thedefault time. This setting affects the collection of statistics from all clusters that this instance ofUnified Manager is monitoring.
Before you begin
You must have a user ID and password authorized to log in to the maintenance console of theUnified Manager server.
663Troubleshooting

About this task
The issue of performance statistics collections not finishing on time is indicated by the bannermessages Unable to consistently collect from cluster <cluster_name> or Datacollection is taking too long on cluster <cluster_name>.
You should change the collection interval only when required because of a statistics collectionsissue. Do not change this setting for any other reason.
Important: Changing this value from the default setting of 5 minutes can affect the number andfrequency of performance events that Unified Manager reports. For example, system-definedperformance thresholds trigger events when the policy is exceeded for 30 minutes. When using5-minute collections, the policy must be exceeded for six consecutive collections. For 15-minutecollections the policy must be exceeded for only two collection periods.
A message at the bottom of the Cluster Setup page indicates the current statistical data collectioninterval.
Steps
1. Log in using SSH as the maintenance user to the Unified Manager host.The Unified Manager maintenance console prompts are displayed.
2. Type the number of the menu option labeled Performance Polling Interval Configuration,and then press Enter.
3. If prompted, enter the maintenance user password again.
4. Type the number for the new polling interval that you want to set, and then press Enter.
After you finish
If you changed the Unified Manager collection interval to 10 or 15 minutes, and you have acurrent connection to an external data provider (such as Graphite), you must change the dataprovider transmit interval so that it is equal to, or greater, than the Unified Manager collectioninterval.
Changing the length of time Unified Manager retains event and performancedata
By default, Unified Manager stores event data and performance data for 6 months for allmonitored clusters. After this time, older data is automatically deleted to make room for new data.This default timeframe works well for most configurations, but very large configurations withmany clusters and nodes may need to reduce the retention period so that Unified Manager operatesoptimally.
Before you begin
You must have the Application Administrator role.
About this task
You can change the retention periods for these two types of data in the Data Retention page. Thesesettings affect the retention of data from all clusters that this instance of Unified Manager ismonitoring.
Note: Unified Manager collects performance statistics every 5 minutes. Each day the 5-minutestatistics are summarized into hourly performance statistics. It retains 30 days of 5-minutehistorical performance data and 6 months of hourly summarized performance data (by default).
You should reduce the retention period only if you are running out of space or if backup and otheroperations are taking a very long time to complete. Reducing the retention period has thefollowing effects:
664Troubleshooting

• Old performance data is deleted from the Unified Manager database after midnight.
• Old event data is deleted from the Unified Manager database immediately.
• Events prior to the retention period will no longer be available to view in the user interface.
• Locations in the UI where hourly performance statistics are displayed will be blank prior to theretention period.
• If the event retention period exceeds the performance data retention period, a message will bedisplayed under the performance slider warning that older performance events may not havebacking data in their associated charts.
Steps
1. In the left navigation pane, click Policies > Data Retention.
2. In the Data Retention page, select the slider tool in the Event Retention or Performance DataRetention area and move it to the number of months that data should be retained, and clickSave.
Enabling periodic AutoSupportYou can choose to have specific, predefined AutoSupport messages sent automatically fromUnified Manager to technical support to ensure correct operation of your environment, and toassist you in maintaining the integrity of your environment. AutoSupport is enabled by default,and it must not be disabled in order for you to receive the benefits of NetApp Active IQ.
Before you begin
You must be logged in as the maintenance user.
About this task
Active IQ is a web-based application hosted on the NetApp Support Site that you can access usinga browser. Your system must have AutoSupport enabled and configured so that it sends data backto NetApp.
NetApp Active IQ
Steps
1. In the left navigation pane, click General > AutoSupport.
2. Select the Enable Sending AutoSupport Data Periodically to Active IQ check box.
3. If required, define the name, port, and authentication information for the HTTP proxy server.
4. Click Save.
Related tasksAdding users on page 625
You can add local users or database users by using the Users page. You can also add remote usersor groups that belong to an authentication server. You can assign roles to these users and, based onthe privileges of the roles, users can manage the storage objects and data with Unified Manager, orview the data in a database.
Sending on-demand AutoSupport messages on page 666
665Troubleshooting

You can send Unified Manager system information to technical support for assistance withtroubleshooting issues. The AutoSupport message contains diagnostic system information anddetailed data about the Unified Manager server.
Sending on-demand AutoSupport messagesYou can send Unified Manager system information to technical support for assistance withtroubleshooting issues. The AutoSupport message contains diagnostic system information anddetailed data about the Unified Manager server.
Before you begin
You must be logged in as the maintenance user.
Steps
1. In the left navigation pane, click General > AutoSupport.
2. Perform one or both of the following actions:
If you want to send theAutoSupport message to...
Do this...
Technical support Select the Send to Technical Support check box.
A specific email recipient Select the Send to Email Recipient check box, and enter the email address ofthe recipient.
3. If required, define the name, port, and authentication information for the HTTP proxy server,and click Save.
4. Click Generate and Send AutoSupport.
Related tasksAdding users on page 625
You can add local users or database users by using the Users page. You can also add remote usersor groups that belong to an authentication server. You can assign roles to these users and, based onthe privileges of the roles, users can manage the storage objects and data with Unified Manager, orview the data in a database.
Enabling periodic AutoSupport on page 665You can choose to have specific, predefined AutoSupport messages sent automatically fromUnified Manager to technical support to ensure correct operation of your environment, and toassist you in maintaining the integrity of your environment. AutoSupport is enabled by default,and it must not be disabled in order for you to receive the benefits of NetApp Active IQ.
AutoSupport pageThe AutoSupport page enables you to enable periodic AutoSupport, or to send an on-demandAutoSupport message to NetApp Active IQ. AutoSupport is enabled by default.
Information area
System ID
Displays the system ID for this Unified Manager server.
On-Demand AutoSupport area
You can generate and send an on-demand message to technical support, a specified emailrecipient, or both:
666Troubleshooting
Send to Technical Support
Indicates that you want to send an on-demand message to technical support for any issuesthat have occurred.
Send to Email Recipient
Indicates that you want to send an on-demand message to a specified recipient for anyissues that have occurred.
Generate and Send AutoSupport
Generates and sends an on-demand message to technical support, a specified emailrecipient, or both for any issues that have occurred.
Periodic AutoSupport area
Enables you to have specific, predefined messages to technical support for issue diagnosis andresolution periodically generated.
Enable Sending AutoSupport Data Periodically to Active IQ
Indicates that you want to enable the periodic AutoSupport functionality. This functionalityis enabled by default.
HTTP Proxy area
You can designate a proxy to provide Internet access in order to send AutoSupport content tosupport if your environment does not provide direct access from the Unified Manager server.
Use HTTP proxy
Check this box to identify the server being used as the HTTP proxy.
Enter the host name or IP address of the proxy server, and the port number used to connectto the server.
Use authentication
Check this box if you need to provide authentication information to access the server beingused as the HTTP proxy.
Enter the user name and the password required to authenticate with the HTTP proxy.
Note: HTTP proxies that provide only Basic Authentication are not supported.
Related tasksEnabling periodic AutoSupport on page 665
You can choose to have specific, predefined AutoSupport messages sent automatically fromUnified Manager to technical support to ensure correct operation of your environment, and toassist you in maintaining the integrity of your environment. AutoSupport is enabled by default,and it must not be disabled in order for you to receive the benefits of NetApp Active IQ.
Sending on-demand AutoSupport messages on page 666You can send Unified Manager system information to technical support for assistance withtroubleshooting issues. The AutoSupport message contains diagnostic system information anddetailed data about the Unified Manager server.
Unknown authentication errorIssue
When you are performing an authentication-related operation such as adding, editing,deleting, or testing remote users or groups, the following error message might be displayed:Unknown authentication error.
667Troubleshooting

Cause
This problem can occur if you have set an incorrect value for the following options:
• Administrator Name of the Active Directory authentication service
• Bind Distinguished Name of the OpenLDAP authentication service
Corrective action
1. In the left navigation pane, click General > Remote Authentication.
2. Based on the authentication service that you have selected, enter the appropriateinformation for Administrator Name or Bind Distinguished Name.
3. Click Test Authentication to test the authentication with the details that you specified.
4. Click Save.
User not foundIssue
When you are performing an authentication-related operation such as adding, editing,deleting, or testing remote users or groups, the following error message is displayed: Usernot found.
Cause
This problem can occur if the user exists in the AD server or LDAP server, and if you haveset the base distinguished name to an incorrect value.
Corrective action
1. In the left navigation pane, click General > Remote Authentication.
2. Enter the appropriate information for base distinguished name.
3. Click Save.
Issue with adding LDAP using Other authentication servicesIssue
When you select Others as the Authentication service, the user and groupObjectClass retainthe values from the previously selected template. If the LDAP server does not use the samevalues, the operation might fail.
Cause
The users are not configured correctly in OpenLDAP.
Corrective action
You can manually fix this issue by using one of the following workarounds.
If your LDAP user object class and group object class are user and group, respectively,perform the following steps:
1. In the left navigation pane, click General > Remote Authentication.
2. In the Authentication Service drop-down menu, select Active Directory, and thenselect Others.
3. Complete the text fields.
If your LDAP user object class and group object class are posixAccount and posixGroup,respectively, perform the following steps:
1. In the left navigation pane, click General > Remote Authentication.
2. In the Authentication Service drop-down menu, select OpenLDAP, and then selectOthers.
668Troubleshooting

3. Complete the text fields.
If the first two workarounds do not apply, call the option-set API, and set theauth.ldap.userObjectClass and auth.ldap.groupObjectClass options to thecorrect values.
669Troubleshooting

Copyright and trademark
CopyrightCopyright © 2020 NetApp, Inc. All rights reserved. Printed in the U.S.
No part of this document covered by copyright may be reproduced in any form or by any means—graphic, electronic, or mechanical, including photocopying, recording, taping, or storage in anelectronic retrieval system—without prior written permission of the copyright owner.
Software derived from copyrighted NetApp material is subject to the following license anddisclaimer:
THIS SOFTWARE IS PROVIDED BY NETAPP "AS IS" AND WITHOUT ANY EXPRESS ORIMPLIED WARRANTIES, INCLUDING, BUT NOT LIMITED TO, THE IMPLIEDWARRANTIES OF MERCHANTABILITY AND FITNESS FOR A PARTICULAR PURPOSE,WHICH ARE HEREBY DISCLAIMED. IN NO EVENT SHALL NETAPP BE LIABLE FORANY DIRECT, INDIRECT, INCIDENTAL, SPECIAL, EXEMPLARY, OR CONSEQUENTIALDAMAGES (INCLUDING, BUT NOT LIMITED TO, PROCUREMENT OF SUBSTITUTEGOODS OR SERVICES; LOSS OF USE, DATA, OR PROFITS; OR BUSINESSINTERRUPTION) HOWEVER CAUSED AND ON ANY THEORY OF LIABILITY,WHETHER IN CONTRACT, STRICT LIABILITY, OR TORT (INCLUDING NEGLIGENCEOR OTHERWISE) ARISING IN ANY WAY OUT OF THE USE OF THIS SOFTWARE, EVENIF ADVISED OF THE POSSIBILITY OF SUCH DAMAGE.
NetApp reserves the right to change any products described herein at any time, and without notice.NetApp assumes no responsibility or liability arising from the use of products described herein,except as expressly agreed to in writing by NetApp. The use or purchase of this product does notconvey a license under any patent rights, trademark rights, or any other intellectual property rightsof NetApp.
The product described in this manual may be protected by one or more U.S. patents, foreignpatents, or pending applications.
Data contained herein pertains to a commercial item (as defined in FAR 2.101) and is proprietaryto NetApp, Inc. The U.S. Government has a non-exclusive, non-transferrable, non-sublicensable,worldwide, limited irrevocable license to use the Data only in connection with and in support ofthe U.S. Government contract under which the Data was delivered. Except as provided herein, theData may not be used, disclosed, reproduced, modified, performed, or displayed without the priorwritten approval of NetApp, Inc. United States Government license rights for the Department ofDefense are limited to those rights identified in DFARS clause 252.227-7015(b).
TrademarkNETAPP, the NETAPP logo, and the marks listed on the NetApp Trademarks page are trademarksof NetApp, Inc. Other company and product names may be trademarks of their respective owners.
http://www.netapp.com/us/legal/netapptmlist.aspx
670Copyright and trademark