On the Radio: Effectiveness of the Viva Seguro Financial Education Program
35
1 19 JUNIO DE 2014 Documentos CEDE CEDE Centro de Estudios sobre Desarrollo Económico ISSN 1657-7191 Edición electrónica. On the Radio: Effectiveness of the Viva Seguro Financial Education Program Catherine Rodríguez Fabio Sanchez Sandra Zamora
Transcript of On the Radio: Effectiveness of the Viva Seguro Financial Education Program

1
19JUNIO DE 2014
Documentos CEDE
CEDECentro de Estudios
sobre Desarrollo Económico
ISSN 1657-7191 Edición electrónica.
On the Radio: Effectiveness of the Viva Seguro Financial Education Program
Catherine RodríguezFabio SanchezSandra Zamora

Serie Documentos Cede, 2014-19
ISSN 1657-7191 Edición electrónica.
Junio de 2014
© 2012, Universidad de los Andes–Facultad de Economía–CEDECalle 19A No. 1 – 37 Este, Bloque W.Bogotá, D. C., Colombia Teléfonos: 3394949- 3394999, extensiones 2400, 2049, [email protected] http://economia.uniandes.edu.co
Ediciones Uniandes Carrera 1ª Este No. 19 – 27, edificio Aulas 6, A. A. 4976 Bogotá, D. C., Colombia Teléfonos: 3394949- 3394999, extensión 2133, Fax: extensión 2158 [email protected]
Edición y prensa digital:Cadena S.A. • BogotáCalle 17 A Nº 68 - 92Tel: 57(4) 405 02 00 Ext. 307Bogotá, D. C., Colombia www.cadena.com.co
Impreso en Colombia – Printed in Colombia
El contenido de la presente publicación se encuentra protegido por las normas internacionales y nacionales vigentes sobre propiedad intelectual, por tanto su utilización, reproducción, comunicación pública, transfor-mación, distribución, alquiler, préstamo público e importación, total o parcial, en todo o en parte, en formato impreso, digital o en cualquier formato conocido o por conocer, se encuentran prohibidos, y sólo serán lícitos en la medida en que se cuente con la autorización previa y expresa por escrito del autor o titular. Las limitaciones y excepciones al Derecho de Autor, sólo serán aplicables en la medida en que se den dentro de los denominados Usos Honrados (Fair use), estén previa y expresamente establecidas, no causen un grave e injustificado perjuicio a los intereses legítimos del autor o titular, y no atenten contra la normal explotación de la obra.

1
CEDECentro de Estudios
sobre Desarrollo Económico
On the Radio: Effectiveness of the Viva Seguro Financial Education Program♣
Catherine Rodríguez♦, Fabio Sanchez‡ and Sandra Zamora+
Abstract
Through a novel randomized control trial this paper estimates the impact of Viva
Seguro, a financial education program that covers topics on risks and insurance management,
on knowledge, attitudes and actual behavior. The program was broadcasted in two Colombian
radio stations that have low and medium income households as target audience. Listeners
from these radio stations comprise our treatment group. The control group is comprised
by listeners from other two radio stations of similar characteristics and from the same
broadcasting company. Using panel data information on both the treatment and the control
group we find that giving financial education through such mass media channel has a positive
impact on the knowledge of risks individuals face, the number of insurance they know exist
and their perceived capability of understanding and handling insurance. No effect however
is found on the knowledge of specific concepts of insurance, or their attitudes towards
it, in savings behavior or the number of insurance bought. In general results show that
delivering financial education through radio is a cost effective alternative in order to improve
knowledge on insurance related concepts.
Key words: financial education, radio, insurance, randomized control tral (RCT)
JEL Code: I20, I25
♣ We thank FASECOLDA and the Microinsurance Innovation Facility from the ILO for financing this project as well as the four radio stations from RCN Group, Loteria de Bogota, Processa S.A.S. and Datexco. We specially thank Alejandra Diaz for her outstanding dedication and patience administrating the implementation of this project and the valuable comments given by her and all her team in Fasecolda. All errors are ours.
♦ Department of Economics, Universidad de los Andes: [email protected]‡ Department of Economics, Universidad de los Andes: [email protected]+ Department of Economics, Universidad de los Andes: [email protected]

2
En la radio: Efectividad del Programa de Educación Financiera Viva Seguro
Catherine Rodríguez, Fabio Sánchez y Sandra Zamora
Resumen
A través de un novedoso experimento aleatorio controlado este trabajo estima
el impacto de Viva Seguro, un programa de educación financiera que cubre los temas de
gestión de riesgos y seguros, en variables relacionadas con el conocimiento, las actitudes
y el comportamiento real de los individuos que lo recibieron. El programa Viva Seguro
fue transmitido en dos estaciones de radio en Colombia que tienen como público objetivo
oyentes de familias de bajos y medianos ingresos. Los oyentes de estas estaciones de radio
comprenden nuestro grupo de tratamiento. El grupo de control está compuesto por los
oyentes de otras dos estaciones de radio de características similares y de la misma empresa de
radiodifusión escogidos y encuestados en los mismos momentos que el grupo de tratamiento.
A través del uso de información de datos panel sobre los grupos de tratamiento y de grupo
control encontramos que dar educación financiera a través de la radio puede ser una estrategia
efectiva para mejorar el conocimiento de individuos en estos temas. Específicamente, aquellos
individuos que escucharon el programa de educación financiera a través de este medio de
comunicación presentaron un impacto positivo en el conocimiento de los riesgos a los que
se enfrentan, el número y tipos de seguro que conocen y en su capacidad de percepción de
la comprensión y el manejo seguros. No hay efecto sin embargo en el conocimiento de los
conceptos específicos de seguros, o sus actitudes hacia ellos, en el comportamiento del ahorro
o el número del seguro comprado. Estos resultados son consistentes con la estructura del
programa radial. Los resultados generales muestran que la entrega de la educación financiera
a través de la radio es una alternativa rentable a fin de mejorar los conocimientos sobre los
conceptos relacionados con los seguros.
Palabras clave: educación financiera, radio, seguros, experimento aleatorio controlado
(RCT)
Codigo JEL : I20, I25

3
1. Introduction
Financial education is a subject whose interest in the academia and policy arenas has
increased dramatically in the past decade. Several factors associated to this topic explain
such an increase in interest. First, education is and always will be a fundamental factor of
development and as a consequence research on how to successfully provide it to the population
is necessary. In the special case of financial education this is particularly important given that
it is now clear that the knowledge of these topics is very scarce in adult and young population
across the world. Second, the availability, types, complexity and number of financial products
such as credit cards, home loans, credit given by firms or small enterprise loans, insurance
and micro-insurance have significantly increased. Moreover, many times these products are
offered to low income and low educated clients who lack basic financial literacy concepts.
This illiteracy impairs the increase in uptake and adequate usages of such products by low
income clients. Finally, financial education programs that accompany some of these products
have also increased around the world. In many cases they are even mandatory for financial
firms and important amount of resources and time are devoted to them.
However, little is known about the cost effectiveness of financial education programs
and whether they are indeed helping people acquire the financial capabilities needed in this
modern world. Unfortunately there is little rigorous causal evidence that can help us discern
such important questions. This is especially true for the specific case of financial education
in insurance. Most of the studies available suffer from problems of selection bias and hence
the results obtained from them are not necessarily causal. This has slowly changed. One
example is the study by Gaurav et al. (2010) who through an experimental design evaluates
the impact of a financial education program given to rural households in India. The
financial education component was designed thorough two sessions of three hours each in
which general personal lessons of financial management were given (savings, credit, debt
management). Furthermore, given that the program was associated to the introduction of a
rainfall insurance product in the region, it also included a specific session on the relevance
on such product. Moreover simulations games were played with the attendants in order
to explain how insurance mechanisms work and how valuable they can be. According to
the authors the education component was very important and increased the demand for
insurance in 5.3 percentage points.

4
This paper seeks to fill this gap in the literature by presenting the results of a novel
randomized control trial conducted in Colombia in 2011 and 2012. We estimate the impact
of a financial education radio program called “Viva Seguro” designed and implemented
by the Insurance Association in Colombia (Federacion de Aseguradores Colombianos –
FASECOLDA) and the foundation attached to it (Fundacion de Aseguradores Colombianos
– FUNDASEG). The content and design of the program is based on the Global Financial
Education Program from Microfinance Opportunities and Freedom from Hunger. However,
it was modified to be suitable for airing in a radio station whose main audience is low and
medium income households in Colombia. The radio program, which comprised 36 one hour
daily episodes, seek to promote an increased awareness of the risks individuals are subject
to, improve their knowledge on appropriate strategies to deal with them and increase their
knowledge and attitudes towards insurance products.
Viva Seguro was aired in two famous radio stations in the country, in the cities of Bogota
and Pereira respectively in late 2011. Before the program started to be broadcasted on air, we
designed and carried out a contest in four different radio stations (the two treatment radio
stations were the program aired and two additional control stations) in which people were
motivated to participate and become eligible to win different awards by doing so. All those
interested in the contest had to register themselves and answer a 30 minute questionnaire
designed especially for the evaluation before the financial education programed aired in
the treatment radio stations. The final prize of the contest was delivered approximately six
months after the last chapter of the education program was aired and in order to participate
in it the contestants needed to answer a follow up survey. In total we were able to collect
baseline and follow-up information on 430 individuals of which 225 listened to the program.
Results suggest that using mass media as a deliverable channel for financial education is
effective in several aspects. In particular we find that listeners of the insurance radio program
increased their knowledge on the type of risks they could be subject to; their perceived
capacity in order to identify and deal with such risks; the number and type of insurance
products they know. No impact however was found on specific knowledge of insurance
concepts such as the premium, deductible or how and where to make a specific complaint.
Similarly no effect on attitude towards insurance take-up or whether they save or not for
emergency was found.

5
The use of mass media can be identified within the current trends in education in
microinsurance. For example, in South Africa SAIA has a radio education program. Similarly
in the CNSeg Brazil[8] also makes use of a novel radial and videos to disseminate its educational
material (Dror, Dalal, & Matul, 2010). In India the Microsegusos Academy (MIA)[9] produces
a Bollywood-style film which tells the story of a town where youths try to improve the
quality of living of their fellow citizens through health insurance products. (MIA, 2010).
However, to our knowledge, this is the first impact evaluation of such strategies that uses
an RCT design and hence provides valuable information both for practitioners as well as for
the academia.1
The reminder of the paper is organized in seven additional sections. Section two
describes the background and content of the radio program while section three describes
the design of the experiment. Section four describes the estimation strategy and section five
the data used in the paper. Section six presents the main results and finally section seven
concludes.
2. Viva Seguro
Since the year 2008 FASECOLDA and FUNDASEG have been the leading promoters
of the financial education on insurance in Colombia. The contents of the main text for
financial education, “Risk management and insurance: protect your family’s future” was
adapted from the Global Financial Education Program led by Microfinance Opportunities
and Freedom from Hunger. To do so, several focus groups, quantitative surveys and pilot
training where carried out. The final content seeks to provide specific knowledge and tools
that should contribute low income individuals in five aspects: i) increase their awareness
of risks; ii) improve their behavior against them; iii) increase their knowledge on insurance
and improve their perceptions towards them with the intention that they can; iv) make
better decisions and be more informed about risk management, and finally; v) improve
their behavior against the risks and decrease their vulnerability to the occurrence of events
unexpected to generate them severe financial shocks (FASECOLDA, 2011a).
1 Tower and McGuinness (2011) study is very closely related to the one we present in this paper. In particular they evaluate how a financial education program broadcasted through a local radio in Kenya influence knowledge and attitudes towards risks and insurance. The results suggest that the radio program was effective in changing the level of knowledge but did not find any behavioral change. However, it is not based on an RCT design as the one implemented here.

6
Initially the content was delivered through workshops carried out by the National
Instruction Service (SENA for its acronym in Spanish) to low income unemployed
individuals who were beneficiaries of unemployment insurance. Having gained experience in
such strategy and with the hope of increasing the reach of the financial education program
FASECOLDA and FUNDASEG decided to design a special program to be delivered though
radio stations. In order to do so, all available material was adapted with the support of
FASECOLDA communications area, the directors of each specific area in FASECOLDA
and the insurance companies themselves an appropriate content to be delivered through such
a mass media channel was available. In particular, this new content included radio dramas,
interviews with experts, interest notes, recommendations and interviews with the public.
Such a varied content assured that FASECOLDA could offer a dynamic and entertaining
program that offers useful information for consumers on risk management decision-making.
In total, Viva Seguro has 36 programs with an estimated duration of 41 minutes each.
They are designed to be broadcasted daily for 7 weeks. The curriculum of the program,
which is presented in the table 1, is divided into five key themes: (i) risks recognized and
which one has happened to you?, how did they affect your Pocket? What were your responses
and how effective were they?, (ii) financial instruments to deal with emergencies, (iii) types
of insurance, (iv) know your policy and (v) protection to the consumer (FASECOLDA(,
2011b). Table 2 explains in detail the general structure of each daily program. In addition,
each episode of the program was designed to have a specific structure. In particular each
episode was divided into 18 different segments that combined a review of previous episodes,
brief talk of an expert, a soap opera of the subject of the day, interviews with listeners, daily
contest and songs related to the topics talked about. The general structure of the programs
is presented in detail in Table 2.

7
17
Tab
les
Tab
le 1
. C
urri
culu
m o
f the
pro
gram
"V
iva
Segu
ro"
No
wee
k C
entr
al th
eme
Mon
day
Tue
sday
W
edne
sday
T
hurs
day
Frid
ay
1 R
isks
re
cogn
ized
an
d w
hich
one
has
hap
pene
d to
you
?, h
ow c
an t
hey
affe
cted
yo
ur
pock
et?,
ho
w
did
you
resp
ond
and
how
ef
fect
ive
was
th
e an
swer
?
1. In
trodu
ctio
n 2.
Dea
th
3. S
ickne
ss a
nd
inva
lidity
4.
Une
mpl
oym
ent
5. P
erso
nal a
ccid
ent
and
trans
it
2 6.
Fire
, ear
thqu
ake,
flood
7.
The
ft 8.
Occ
upat
iona
l ac
ciden
ts a
nd
dise
ases
Pro
f.
9. C
redi
t aga
inst
em
erge
ncies
10
. Sav
ing
for
emer
genc
ies
3 Fi
nanc
ial i
nstru
men
ts t
o de
al w
ith e
mer
genc
ies.
11
. The
insu
ranc
e. In
trodu
ctio
n
12. S
avin
gs a
nd
insu
ranc
e fo
r em
erge
ncies
13. O
pera
tion
and
basic
con
cept
s 14
. Ope
ratio
n an
d ba
sic c
once
pts
15. L
ife
4
Typ
es o
f ins
uran
ce
16. F
uner
al 17
. Per
sona
l ac
ciden
t 18
. Une
mpl
oym
ent
19. M
anda
tory
Car
in
sura
nce
(SO
AT)
20
. Fire
and
ea
rthqu
ake
(hom
e)
5 21
. The
ft 22
. Occ
upat
iona
l ha
zard
s 23
. SM
Es
24. H
ealth
insu
ranc
e an
d its
diff
eren
ce
with
the
POS
25. R
ead
your
pol
icy
care
fully
. Add
ition
al be
nefit
s of
insu
ranc
e
6 K
now
you
r pol
icy
26. E
xclu
sions
, pe
riods
of l
ack
and
othe
r fre
quen
t fe
atur
es
27. Q
uest
ions
to a
sk
your
adv
isor
28. W
hat d
efin
es th
e pr
ice o
f you
r in
sura
nce?
29. H
ow to
mak
e a
claim
? 30
. Rig
hts o
f the
in
sure
d
7 Pr
otec
tion
to
the
cons
umer
31
. Dut
ies o
f the
in
sure
d 32
. How
to su
bmit
a co
mpl
aint?
33
. The
fina
ncial
co
nsum
er a
dvoc
ate
34. W
hat w
e lea
rned
? 35
. Wha
t we
learn
ed?
Sour
ce: F
ASE
COLD
A, 2
011

818
Table 2. Structure of the radio program
No. Section Minutes Seconds Observations
1 Pre-recorded presentation 0 15 Song that identifies the program
2 Welcome 3 0 Reviewing general, previous episode and structure of the day
3 It can happen to you too 3 0 Three brief interviews
4 Commercial information 0 15 Commercial
5 We talk with the expert 1 6 0 Expert topic macro
6 Song 1 3 30 Related to the theme of the day
7 Secure notes 0 30 Notes curious did you know...?
8 SOAP Opera 3 0 On the topic of the day
9 Learn, participate and win 2 0 Contest of the week
10 Cases and things 3 0 Three brief interviews
11 Song 2 3 30 Related to the theme of the day
12 Commercial information 0 15 Commercial
13 We talk with the expert 2 6 0 Micro expert psychologist, anthropologist, academic
14 Live safe, quiet living, 1 30 Recommendations on the topic of the day
15 Are you safe? Write to us 0 30 Contacts
16 Song 3 3 30 Related to the theme of the day
17 Conclusion and parting 1 30 Conclusions. The following program presentation
18 Pre-recorded farewell 0 15 Song that identifies the program
TOTAL TIME 41 30 Source: FASECOLDA, 2011
3. Experimental Design
The basic idea of the experimental design for the evaluation of the impact of the radio
program was simple.2 We would have two radio stations in Bogota: one would broadcast
the Viva Seguro Financial Education Program (treatment radio station) while the other one
would not (control radio station) and hence would continue with its normal programming.
2 The original idea of evaluating the impact of broadcasting the Financial Education Program came from
FASECOLDA itself and the insurance companies associated to them. To do so, they obtained financial support from Microinsurance Innovation Facility and the Bill and Melinda Gates Foundation. The research team at Los Andes University and FASECOLDA then designed the evaluation strategy which we describe in this section.

9
The radio stations chose were Amor Estereo and La Cariñosa respectively. They are both
radio stations of one of the biggest media groups in the country (RCN) which kindly agreed
to participate in the experiment. The program was to be aired in the time slot of 10:00am to
11:00am every working day of the week in Amor Estereo.
In both radio stations a special contest would be promoted were different prizes were
offered.3 The contest was simple: listeners that listen to the station (Amor Estero or Cariñosa
respectively) in a pre-established times (times at which program “Viva Seguro” would be
aired in Amor Estereo) could compete in daily raffles of COP$ 30.000 pesos (aprox US$16)
and a final jackpot of $ 3.000.000 pesos (aprox US$1621). In order to participate in such
contests listeners were asked three things: i) register by calling a toll free number; ii) answering
a 25 minute questionnaire (baseline questionnaire) and; iii) listen to a specific radio station
in the specific hours were the Viva Seguro Financial Education Program was aired. Regarding
the last requirement, after completing the questionnaire listeners who registered would be
randomly assigned either to the treatment or the control radio station ad asked to listen to
that specific radio station during the time in which Viva Seguro was going to be aired. Based
on the estimated number of listeners in each radio station and the specific power calculation
we estimated that a total of 3,200 listeners were needed.
The promotion of the contest and registration of the participants was conducted
through Amor Stereo, La Cariñosa and Antena 2 (a third radio station of the group) between
May 23rd and August 3rd 2011. Moreover, despite the incentives given we found out listeners
were loyal to their own radio station, something which actually will serve important in the
identification strategy. When the daily contest was made, tracking reports were made and
interesting information emerged. In particular during the first days of the contest we found
out that participants who had been changed from radio station had a higher percentage
of incorrect responses (84.7%) compared with those who were not changed (56.3%). This
difference was because of the people who were changed of radio stations only 22.4% were
listening to the station assigned while those who were not changed the same percentage
increase to 62.5%.
3 The contest in Bogota was also aired in a third radio station of the group: Antena 2.

10
The low number of enrollees, the low rate of collection of baseline information
by telephone and effectiveness of randomization not to be described in detail below, led
to make three decisions. First, was the extension of the radio experiment to the cities of
Pereira and Barranquilla. Second, we eliminated the randomization of listeners across radio
stations. Finally, daily prices were increase to COP$100.000 pesos (aprox US$54) in these
cities in order to increase the numbers of listeners finally registered. Registry of contestants
in Pereira went from September 12ve to October 19th. For this city a total of 409 people
registered. In Barranquilla registry of contestants was held from September 12 to October
12 and 119 people finally enrolled. The control and treatment stations in each city, as well as
the registry and airing of the program are detailed in Table 3. Figure 1 shows the sequence
for the experiment and evaluation. In the cities of Pereira and Barranquilla this survey will
be conducted from June 2012.
19
Table 3. Registry and Airing of Viva Seguro
City Registry Airing of Viva Seguro
Time Frame of Viva Seguro
Treatment Radio Station
Control Radio Station
Bogotá May 23, 2011 – August 3, 2011
August 8, 2011 - September 27, 2011 10:00 am - 11:00 am
Amor Stereo 1.340 AM -
96.3 FM
La Cariñosa 610 AM
Barranquilla September 12,
2011 – October 19, 2011
October 24, 2011 – December 15, 2011 9:15 am - 10:00 am El Sol 1.550
AM Radio Uno 95.6 FM
Pereira September 24,
2011 – October 12, 2011
October 24, 2011 – December 15, 2011 10:30am - 11:15am La Cariñosa
1.210 AM Radio Uno 94.7 FM
Figure 1. Sequence for the experiment
Table 4. Number of Individuals
City Number of individuals Attrition
(%) Base line Follow-up
Bogota 428 276 64.5 Pereira 409 154 37.7 Barranquilla 119 23 19.3
Source: baseline and follow up survey
Promontion and
registration
Base line survey
Airing of "Viva Seguro"
Follow-up survey
The Big Prize is delivered amog the audience

11
Table 4 presents the total number of individuals from which we have baseline and
follow up information respectively after all the process above described was completed. As
can be observed, unfortunately the level of attrition is big reaching to 35% in Bogota, 62% in
Pereira and 80% in Barranquilla. Due to the huge attrition in this last city we decided to drop
all information from it and hence the results presented in this paper only take into account
the information gathered in Bogota and Pereira.
19
Table 3. Registry and Airing of Viva Seguro
City Registry Airing of Viva Seguro
Time Frame of Viva Seguro
Treatment Radio Station
Control Radio Station
Bogotá May 23, 2011 – August 3, 2011
August 8, 2011 - September 27, 2011 10:00 am - 11:00 am
Amor Stereo 1.340 AM -
96.3 FM
La Cariñosa 610 AM
Barranquilla September 12,
2011 – October 19, 2011
October 24, 2011 – December 15, 2011 9:15 am - 10:00 am El Sol 1.550
AM Radio Uno 95.6 FM
Pereira September 24,
2011 – October 12, 2011
October 24, 2011 – December 15, 2011 10:30am - 11:15am La Cariñosa
1.210 AM Radio Uno 94.7 FM
Figure 1. Sequence for the experiment
Table 4. Number of Individuals
City Number of individuals Attrition
(%) Base line Follow-up
Bogota 428 276 64.5 Pereira 409 154 37.7 Barranquilla 119 23 19.3
Source: baseline and follow up survey
Promontion and
registration
Base line survey
Airing of "Viva Seguro"
Follow-up survey
The Big Prize is delivered amog the audience
4. Estimation Strategy
In principle, two facts make the evaluation of the impact of Viva Seguro Radio Program
relatively straight forward. First, the decision of which radio station in each city of to air the
program was random. All stations in both cities belong to the same communication group
and are targeted to relatively similar audiences. In fact while in Bogota the control station was
La Cariñosa, in Pereira this same radio station which presumably have very similar listeners
as the ones in Bogota) was the treatment radio station. Second, the verification calls made
for the raffles of the daily prices gave us important evidence that listeners are relatively loyal
to their radio stations they listen to. We found that even with important incentives, listeners
did not change the radio station they normally hear. Let alone they will change it to listen to
a specific program. These two points suggest that the empirical strategy in order to evaluate
the impact of Viva Seguro is simple and straight forward.
However, things are not as straight forward as one can imagine. Several facts are
behind this. First, even though the decision of in which radio station to air the program was
random average characteristics of listeners between control and treatment radio stations

12
are not necessarily identical. Second, listening to the program is not random either. Perhaps
some people who are usual listeners of the treatment radio stations are more interested in
insurance were the ones who effectively listened to the complete program and perhaps these
are the ones who learned the most. Perhaps also, those who think they know all concepts and
will learn nothing new do not listen to it. These two alternative hypothesis could imply that
the average characteristics of those who listened and those who did not are not necessarily
comparable and hence any effect may be importantly biased.
In order to deal with these possibilities we undertake two different estimation strategies.
First, to control for possible differences in socioeconomic characteristics of listeners and
non-listeners of Viva Seguro we estimate a DID regression in which this is controlled for. In
particular two estimations are carried out one in which we analyze the impact of listening to
the program without any control, one in which we control for socioeconomic characteristics
which we have in the survey and finally an individual fixed effect strategy. Hence, the main
specification is described by the equation below:
8
However, things are not as straight forward as one can imagine. Several facts are behind
this. First, even though the decision of in which radio station to air the program was random
average characteristics of listeners between control and treatment radio stations are not
necessarily identical. Second, listening to the program is not random either. Perhaps some
people who are usual listeners of the treatment radio stations are more interested in insurance
were the ones who effectively listened to the complete program and perhaps these are the ones
who learned the most. Perhaps also, those who think they know all concepts and will learn
nothing new do not listen to it. These two alternative hypothesis could imply that the average
characteristics of those who listened and those who did not are not necessarily comparable and
hence any effect may be importantly biased.
In order to deal with these possibilities we undertake two different estimation strategies.
First, to control for possible differences in socioeconomic characteristics of listeners and non-
listeners of Viva Seguro we estimate a DID regression in which this is controlled for. In
particular two estimations are carried out one in which we analyze the impact of listening to
the program without any control, one in which we control for socioeconomic characteristics
which we have in the survey and finally an individual fixed effect strategy. Hence, the main
specification is described by the equation below:
(1)
Where is the outcome of interest for individual i in city c and period t,
represents a dummy variable equal to one if individual i reports listening to the Viva Seguro
Radio program and zero otherwise. Similarly, T is a dummy variable equal to one in follow-up
and zero in baseline. The matrix contains individual’s socieconomic characteristics such as
age, education, working status, average income and city of residence. Finally, represent
individual errors that are assumed to be iid. Under this strategy our coefficient of interest will
of course be which represents the usual DID coefficient that gives the impact that listening
to the Viva Seguro Financial Program on the radio has on each distinct outcome.
As can be observed, specification (1) controls for personal characteristics which can
influence the effectiveness of the radio program and f not controlled for may bias the
coefficient of interest. However, given that we have a panel data set, the specification can be
Where is the outcome of interest for individual i in city c and period t, represents
a dummy variable equal to one if individual i reports listening to the Viva Seguro Radio
program and zero otherwise. Similarly, T is a dummy variable equal to one in follow-up and
zero in baseline. The matrix contains individual’s socieconomic characteristics such as age,
education, working status, average income and city of residence. Finally, represent individual
errors that are assumed to be iid. Under this strategy our coefficient of interest will of course
be which represents the usual DID coefficient that gives the impact that listening to the Viva
Seguro Financial Program on the radio has on each distinct outcome.
As can be observed, specification (1) controls for personal characteristics which can
influence the effectiveness of the radio program and f not controlled for may bias the
coefficient of interest. However, given that we have a panel data set, the specification can
be improved by including in the regression fixed effects at the individual level. Under such
strategy then the main specification will be:

13
9
improved by including in the regression fixed effects at the individual level. Under such
strategy then the main specification will be:
(2)
Where represents individual fixed effects. Under this strategy our coefficient of
interest is then and as above it estimates the impact of listening to the financial education
program listened on the radio on the outcome of interest.
The estimations resented on specifications (1) and (2) could in principle be unbiased if
the experiment was absolutely clean and listening to the radio program was completely random
or if any difference between treatment and control individuals are either observable or
constant in time. However this might not be the case and hence an appropriate strategy needs
to control for this. In particular in this paper we use an instrumental variable approach. The
natural instrument in this case is of course whether in base line the listener informed that he
usually listened to either the treatment or the control radio station. Hence, what the regression
of such strategy will present is the Intention to treat impact. Specifically we estimate a first
stage in which listening to the Viva Seguro Financial Education Program depends on the usual
radio station the individuals normally listen to as is detailed in specification (3).
(3)
In this specification is a dummy variable equal to one if
individual i in baseline reported that he usually listens to the radio station in city c which
broadcasted the Viva Seguro Financial Education Program and zero otherwise. It should be
remembered that for the special case of Bogota, we randomized all individuals and instructed
them to listen to a specific radio station when the baseline questionnaire was conducted.
However, given that follow up calls made it clear that individuals did not change radio stations
using that rule as an instrument will not be valid. The second stage will follow either
specification (1) or (2) but using of course the estimated from specification (3).
5. Data
Column 1 in Table 5 presents the basic socioeconomic characteristics of all the
individuals’ from which we have information on base line from the cities of Bogota and
Pereira. As can be observed from the Table, most of the listeners who registered in the contest
Where represents individual fixed effects. Under this strategy our coefficient of interest
is then and as above it estimates the impact of listening to the financial education program
listened on the radio on the outcome of interest.
The estimations resented on specifications (1) and (2) could in principle be unbiased
if the experiment was absolutely clean and listening to the radio program was completely
random or if any difference between treatment and control individuals are either observable
or constant in time. However this might not be the case and hence an appropriate strategy
needs to control for this. In particular in this paper we use an instrumental variable approach.
The natural instrument in this case is of course whether in base line the listener informed
that he usually listened to either the treatment or the control radio station. Hence, what the
regression of such strategy will present is the Intention to treat impact. Specifically we estimate
a first stage in which listening to the Viva Seguro Financial Education Program depends on
the usual radio station the individuals normally listen to as is detailed in specification (3).
9
improved by including in the regression fixed effects at the individual level. Under such
strategy then the main specification will be:
(2)
Where represents individual fixed effects. Under this strategy our coefficient of
interest is then and as above it estimates the impact of listening to the financial education
program listened on the radio on the outcome of interest.
The estimations resented on specifications (1) and (2) could in principle be unbiased if
the experiment was absolutely clean and listening to the radio program was completely random
or if any difference between treatment and control individuals are either observable or
constant in time. However this might not be the case and hence an appropriate strategy needs
to control for this. In particular in this paper we use an instrumental variable approach. The
natural instrument in this case is of course whether in base line the listener informed that he
usually listened to either the treatment or the control radio station. Hence, what the regression
of such strategy will present is the Intention to treat impact. Specifically we estimate a first
stage in which listening to the Viva Seguro Financial Education Program depends on the usual
radio station the individuals normally listen to as is detailed in specification (3).
(3)
In this specification is a dummy variable equal to one if
individual i in baseline reported that he usually listens to the radio station in city c which
broadcasted the Viva Seguro Financial Education Program and zero otherwise. It should be
remembered that for the special case of Bogota, we randomized all individuals and instructed
them to listen to a specific radio station when the baseline questionnaire was conducted.
However, given that follow up calls made it clear that individuals did not change radio stations
using that rule as an instrument will not be valid. The second stage will follow either
specification (1) or (2) but using of course the estimated from specification (3).
5. Data
Column 1 in Table 5 presents the basic socioeconomic characteristics of all the
individuals’ from which we have information on base line from the cities of Bogota and
Pereira. As can be observed from the Table, most of the listeners who registered in the contest
In this specification is a dummy variable equal to one if individual i in baseline reported
that he usually listens to the radio station in city c which broadcasted the Viva Seguro Financial
Education Program and zero otherwise. It should be remembered that for the special case of
Bogota, we randomized all individuals and instructed them to listen to a specific radio station
when the baseline questionnaire was conducted. However, given that follow up calls made it
clear that individuals did not change radio stations using that rule as an instrument will not
be valid. The second stage will follow either specification (1) or (2) but using of course the
estimated
9
improved by including in the regression fixed effects at the individual level. Under such
strategy then the main specification will be:
(2)
Where represents individual fixed effects. Under this strategy our coefficient of
interest is then and as above it estimates the impact of listening to the financial education
program listened on the radio on the outcome of interest.
The estimations resented on specifications (1) and (2) could in principle be unbiased if
the experiment was absolutely clean and listening to the radio program was completely random
or if any difference between treatment and control individuals are either observable or
constant in time. However this might not be the case and hence an appropriate strategy needs
to control for this. In particular in this paper we use an instrumental variable approach. The
natural instrument in this case is of course whether in base line the listener informed that he
usually listened to either the treatment or the control radio station. Hence, what the regression
of such strategy will present is the Intention to treat impact. Specifically we estimate a first
stage in which listening to the Viva Seguro Financial Education Program depends on the usual
radio station the individuals normally listen to as is detailed in specification (3).
(3)
In this specification is a dummy variable equal to one if
individual i in baseline reported that he usually listens to the radio station in city c which
broadcasted the Viva Seguro Financial Education Program and zero otherwise. It should be
remembered that for the special case of Bogota, we randomized all individuals and instructed
them to listen to a specific radio station when the baseline questionnaire was conducted.
However, given that follow up calls made it clear that individuals did not change radio stations
using that rule as an instrument will not be valid. The second stage will follow either
specification (1) or (2) but using of course the estimated from specification (3).
5. Data
Column 1 in Table 5 presents the basic socioeconomic characteristics of all the
individuals’ from which we have information on base line from the cities of Bogota and
Pereira. As can be observed from the Table, most of the listeners who registered in the contest
from specification (3).
5. Data
Column 1 in Table 5 presents the basic socioeconomic characteristics of all the individuals’
from which we have information on base line from the cities of Bogota and Pereira. As can
be observed from the Table, most of the listeners who registered in the contest are women

14
20
Tab
le 5
. Des
crip
tive
Stat
istic
s
Ba
selin
e Fo
llow
-up
(Non
Attr
itter
s)
Diff
eren
ces
Attr
iters
non
at
trite
rs
A
ll Tr
eatm
ent
Cont
rol
Diff
eren
ces
All
Trea
tmen
t Co
ntro
l D
iffer
ence
s
Gen
der
0.72
0.
82
0.71
0.
12**
* 0.
69
0.82
0.
65
0.20
***
-0.0
68**
(0.4
45)
(0.3
79)
(0.0
45)
(0
.461
) (0
.379
) (0
.485
)
Ag
e 48
.35
48.7
4 48
.01
1.72
49
.22
49.7
4 48
.94
0.79
1.
98**
(13.
47)
(14.
04)
(13.
33)
(1
3.53
) (1
4.04
) (1
3.28
)
E
duac
tion
8.56
8.
23
8.64
-0
.41
8.7
8.23
8.
95
-0.7
2*
0.27
(4.1
05)
(4.5
35)
(4.0
05)
(4
.246
) (4
.538
) (4
.068
)
In
com
e le
vel
$0
-$13
9 0.
36
0.36
0.
36
0.00
0.
034
0.36
0.
33
0.02
-0
.029
(0.4
81)
(0.4
82)
(0.4
81)
(0
.476
) (0
.482
) (0
.474
)
$1
39-$
277
0.28
0.
29
0.27
0.
02
0.3
0.29
0.
3 -0
.1
0.04
(0.4
49)
(0.4
57)
(0.4
48)
(0
.459
) (0
.457
) (0
.460
)
$2
77-$
416
0.21
0.
22
0.21
0.
01
0.19
0.
22
0.18
0.
03
-0.0
26
(0
.408
) (0
.415
) (0
.406
)
(0.3
99)
(0.4
16)
(0.3
89)
$416
-$55
4 0.
08
0.06
0.
08
-0.0
2 0.
09
0.06
0.
1 -0
.4
0.02
4
(0.2
73)
(0.2
50)
(0.2
78)
(0
.290
) (0
.250
) (0
.310
)
A
bove
$55
4 0.
07
0.06
0.
07
0 0.
06
0.6
0.06
0
-0.0
11
(0
.252
) (0
.238
) (0
.255
)
(0.2
43)
(0.2
38)
(0.2
46)
Occ
upat
ion
W
orks
0.
39
0.33
0.
4 -0
.07*
0.
038
0.33
0.
41
-0.0
8 -0
.017
(0.4
89)
(0.4
73)
(0.4
92)
(0
.487
) (0
.473
) (0
.493
)
H
ouse
hold
0.
37
0.44
0.
36
0.08
* 0.
36
0.44
0.
32
0.12
**
-0.0
28
(0
.485
) (0
.498
) (0
.481
)
(0.4
81)
(0.4
98)
(0.4
68)
Oth
er
0.23
0.
23
0.23
0
0.25
0.
22
0.26
-0
.03
0.04
5
(0.4
21)
(0.4
20)
(0.4
21)
(0
.434
) (0
.420
) (0
.441
)
So
urce:
Bas
eline
and
follo
w up
surve
y. (*
** p
<0.
01, *
* p<
0.05
, * p
<0.
1 sig
nifica
nce)

15
(72%) with an average age of 48 years. As expected from the type of radio stations chosen in
this experiment, most of the radio listeners have low levels of education. The average number
of years of education reported is 8.5 which is equivalent to completing basic education but not
high school. Moreover 85% of the individuals report as having a month average income of
less than US$416 dollars. In regards to occupations, 39% report that work, 37% report they
are dedicated to household chores while the other 23% report they are either studying, are
unemployed or have retried among others. Columns two and three of the same table present
the same statistics but separating whether the individual belongs to the treatment or control
group respectively (treatment here is based on the radio station they listened to when registering
to the contest). Column 4 presents differences between treatment and control individuals in
baseline. As can be observed there are no substantial differences between both groups. The
treatment group is composed by a slightest larger percentage of women who of course is
reflected in a larger percentage that declares are dedicated to household chores. Columns 5
through 8 presents the same four columns above described but only for individual which we
have information form in the follow-up survey. As can be observed the differences between
age and occupation we had from individuals in the baseline is maintained. However with this
restricted sample there appears to be a marginal difference in the number of years of education
individuals report. In this new group, individuals from the control group report a slightly higher
number of years of education completed.
As detailed by Angirst and Lavy (2002) a high attrition rate does not necessarily impair
the internal validity of a given experiment. The important fact is that there is no clear bias
between those who attrite and those who do not. Table 5 presents the average differences
between attriters and non attriters and reports whether such differences are or not significant.
As can be observed, attrition does appear to be random. The only significant differences
between attriters and not attriters are related to gender and age. Specifically attriters are in a
larger proportion women and two years younger than non attriter individuals.
Regarding the data collected the survey had in total 49 questions divided in 5 sections
related with knowledge in risk and insurance; attitude towards insurance; perceived capabilities
of knowledge about insurance; change in behavior towards risk and insurance, and finally;
socioeconomic characteristics. The first section seeks to find information of knowledge

16
and attitude towards risks they knew and could be subject to as well as concepts related to
insurance products. Table 6 present the average number of risks each individual reported
in treatment and control groups in baseline and follow up. As can be observed, on average
individuals were able to correctly identify 1.5 risks with a standard deviation of 0.8. Almost
5% of all individuals were not able to identify any risk and the maximum number of risks
mentioned by a listener was 7.
Tables 6 also presents the number of insurance products they knew existed and were
able to correctly enumerate each one of them. On average, individuals correctly mentioned
1.6 different insurance products with a standard deviation of 1.29. In this case almost 10%
of individuals did not know any insurance while the maximum number of correct type of
insurance given was 17. Finally based on a total of 7 specific questions regarding knowledge
of different concepts and characteristics of insurance products we constructed a total score
for each individual as the sum of correct answers given. The summary statistics of these
scores are also presented in Table 6. As can be observed the general knowledge of specific
insurance products in this population is particularly low. On average, people correctly
answered 2 questions. Moreover more than 10 of these individuals did not have any correct
answer. In fact only one person had all seven questions correctly answered.
Regarding to attitude towards insurance and insurance products individuals were asked
if they felt they were able to understand the concepts of insurance products, whether they
had enough money to save for emergencies, if insurance was not needed if no one was sick
and finally if they thought were well prepared against resin. We constructed a composite
index of these four questions with a mean of 0.51. Section three of the survey inquired
about capabilities or how able the individual thought he was in identifying the risks he was
subject to, choose the correct insurance product, understand all concepts related to insurance
and adopt a correct strategy against risks. Based on the answers individuals gave we also
constructed a total score whose summary statistics are presented in the same table. Finally,
section four was dedicated to questions regarding change in behavior. Specifically, we asked
individuals whether they saved for emergencies, the number and type of insurance products
they have (only asked in baseline survey) and those they bought in the previous six months
(only asked in follow-up questions), and if they were interested in buying and insurance.
These are also presented in Table 6.

1721
Table 6. Descriptive Statistics
Follow-up (Non Attritters) All Treatment Control Difference Number of risks 1.57 1.72 1.49 0.23*** (0.789) (0.778) (0.785)
Number of Insurance they Know 1.73 1.72 1.73 -0.005 (1.153) (1.122) (1.171)
Average level of Knowledge of insurance concepts 2.15 1.98 2.25 -0.27* (1.452) (1.539) (1.397)
Attitude towards insurance 0.55 0.55 0.55 0.00 (0.340) (0.147) (0.136)
Perceived Capabilities and knowledge of insurance 0.63 0.66 0.61 0.05** (0.221) (0.224) (0.218)
Save 0.29 0.23 0.32 -0.091** (0.452) (0.420) (0.466)
Save for emergencies 0.05 0.04 0.06 -0.017 (0.220) (0.197) (0.232)
Number of New insurance bought in the last 6 months 0.23 0.22 0.23 0.00 (0.471) (0.447) (0.484)
Interest in buying insurance 0.27 0.31 0.25 0.053 (0.455) (0.462) (0.436)
*** p<0.01, ** p<0.05, * p<0.1 significance Source: Baseline and follow up survey. Information for individuals in both baseline and follow-up is reported
7. Results
a. DID
Table 7 presents the results obtained after estimating specifications (1) and (2)
above described having as dependent variable the number of risk individuals
answered they could be subject to. The first column includes only the treatment
and time variables as well as its interaction term to obtain the usual DID estimator.
The second model includes personal socioeconomic characteristics to control
for possible differences between radio listeners. Model 3 incorporates into the
estimation the individual fixed effects which of course imply that all individual
characteristics (including the treatment dummy) are dropped from the regression.
As can be observed, throughout all models our coefficient of interest is positive
and significant. Moreover, it is very stable across the three models. From this

1822
Table 7. DID - Number of risk they know
Dependent variable: number of risk they know
Models (1) (2) (3)
Listened to Viva Seguro -0.0251 -0.0017
(0.0759) (0.0796)
Follow up -0.112 -0.110 -0.112
(0.0776) (0.0774) (0.0777)
Listened to Viva Seguro * Follow up 0.410*** 0.416*** 0.410***
(0.107) (0.107) (0.107)
Bogotá 0.0796
(0.0637)
Age 0.0008
(0.0021)
Education 0.0012
(0.0073)
Gender 0.120*
(0.0663)
Works -0.0588
(0.0712)
Household -0.0412
(0.0757)
Income level $0-$139 0.0033
(0.0898) $139-$277 -0.178**
(0.0907) $277-$416 -0.0169
(0.0922) Constant 1.483*** 1.381*** 1.470***
(0.0549) (0.197) (0.0379)
Observations 860 858 860 R-squared 0.033 0.050 0.041 Number of individuals 430 Standard errors in parentheses. (*** p<0.01, ** p<0.05, * p<0.1 significance)
table our preferred estimation is the fixed effect estimation and it implies that by
listening to the financial education program individuals increase their knowledge
of the number of risks they could be subject to in 0.4. This is an important effect
and amounts to 0.5 standard deviations.

19
The three alternative models were estimated for all our variables of interested
presented in Table 6. The coefficients associated with the difference in difference
estimation in each of these regressions are presented in Table 8. As can be
observed, the effects of listening to Viva Seguro are evident in two other distinct
aspects. Listening to the radio program increased the number and type of insurance
they are able to correctly identify and their perceived capabilities and knowledge
about risks and insurance. These effects are important and amount to 0.6 and 0.34
standard deviations. As can be observed however, no effect was found for the other
variables of interest. In particular there appears to be no effect on knowledge of
specific concepts related with insurance such as the premium, deductible or how
and where to make a specific complaint. The same is true with respect to attitudes
towards risks or insurance. Finally, no effect of actual behavior is found either.
Listeners of Viva Seguro do not increase savings, savings for emergencies, bought
additional insurance not are willing to buy one.
b. Heterogeneous impacts
It is interesting to know whether the effects found in the previous section differ
according to some particular characteristics of individuals. In order to answer
this question, models with heterogeneous effects are estimated. Specifically, we
investigate if there is any differential impact according to income level, gender
and number of chapters of the program which were listened by the individual.
However, significant results were obtained only when we differentiated according
to the level of education of the individual and the number of chapters listened by
them. Therefore, we can say that the program impacts of Viva Seguro do not differ
depending on the gender or the age of the individual.
To differentiate the impact of Viva Seguro according to the level of education three
dummy variables were created. The first, called Primary, takes the value of one if the
individual has attained only a primary level of education (or lower) and zero otherwise.
The second, called secondary, takes the value of one if the individual reports a level
of secondary education and zero otherwise . The third, college, takes the value of

20
one if the individual reports a level of technical or higher college education and zero
otherwise . To avoid perfect multicollinearity problems we included the interaction
between listening to Viva Segura and only two of these dummies: primary and
secondary. Thus, the interpretation of the coefficient of difference in difference in
this case is the impact of hearing Viva Seguro for individuals with technical or higher
education; while the impact on individuals with other educational levels is obtained
by adding the respective coefficient with the interaction of interest.
Indeed, the results presented in Table 9 indicate that for people who only reached
primary or lower levels of education ( which in turn account for 33 % of the sample)
the number of risks that they can identify after listening to the program amounts to
23
Table 8. DID
Dependent variable Models (1) (2) (3)
Number of risks 0.410*** 0.416*** 0.410***
(0.107) (0.107) (0.107)
Number of Insurance they Know 0.783*** 0.782*** 0.783***
(0.184) (0.179) (0.169)
Average level of Knowledge of insurance concepts 0.140 0.127 0.140
(0.197) (0.183) (0.159)
Attitude towards insurance 0.0142 0.0143 0.0142
(0.0196) (0.0193) (0.0181)
Perceived Capabilities and knowledge of insurance 0.0776*** 0.0749*** 0.0776***
(0.0300) (0.0287) (0.0247)
Save -0.0214 -0.0220 -0.0214
(0.0625) (0.0577) (0.0491)
Save for emergencies -0.00846 -0.00474 -0.00846
(0.0314) (0.0310) (0.0302)
Number of New insurance bought in the last 6 months -0.0191 -0.0235 -0.0191
(0.0390) (0.0386) (0.0390)
Interest in buying insurance 0.0250 0.0247 0.0250 (0.0568) (0.0563) (0.0490) Standard errors in parentheses. (*** p<0.01, ** p<0.05, * p<0.1 significance)

2124
Tab
le 9
. Het
erog
eneo
us I
mpa
cts
– L
evel
of E
duca
tion
Varia
ble
depe
ndie
nte
No.
de
riesg
os a
lo
s qu
e es
tá
expu
esto
No.
de
segu
ros
que
cono
ce
Con
ocim
ient
o pr
omed
io
Actit
ud
Cap
acid
ad A
horr
a Ah
orra
par
a em
erge
ncia
s
No.
de
segu
ros
com
prad
os
Inte
rés
en
com
prar
se
guro
s
(1)
(2)
(3)
(4)
(5)
(6)
(7)
(8)
(9)
List
ened
to V
iva
Segu
ro *
Fol
low
up
0.02
13
0.25
5 0.
255
-0.0
0426
0.
0170
-0
.128
* 0.
0213
0.
255*
**
0.08
51
(0
.162
) (0
.259
) (0
.240
) (0
.027
4)
(0.0
376)
(0
.074
) (0
.045
7)
(0.0
628)
(0
.074
2)
List
ened
to V
iva
Segu
ro *
Fol
low
up
*prim
ary
0.44
1**
0.29
5 -0
.293
0.
0389
0.
0299
0.
0902
-0
.033
8 -0
.092
8 0.
0649
(0.2
04)
(0.3
26)
(0.3
02)
(0.0
345)
(0
.047
3)
(0.0
93)
(0.0
576)
(0
.079
1)
(0.0
935)
Li
sten
ed to
Viv
a Se
guro
* F
ollo
w u
p *s
econ
dary
0.
275
-0.0
921
-0.1
94
0.02
49
0.02
79
0.14
8 -0
.051
9 -0
.061
4 -0
.034
1
(0
.197
) (0
.315
) (0
.292
) (0
.033
3)
(0.0
457)
(0
.090
) (0
.055
6)
(0.0
764)
(0
.090
3)
Cons
tant
e 1.
44**
* 1.
67**
* 2.
138*
**
0.54
***
0.62
1***
0.
30**
* 0.
0593
***
0.05
12**
* 0.
21**
*
(0
.033
0)
(0.0
53)
(0.0
490)
(0
.005
6)
(0.0
0767
) (0
.015
) (0
.009
32)
(0.0
128)
(0
.015
1)
Obs
erva
cione
s 86
0 86
0 86
0 86
0 86
0 86
0 86
0 86
0 86
0 R-
cuad
rado
0.
047
0.02
2 0.
003
0.00
9 0.
013
0.00
8 0.
003
0.10
1 0.
021
Núm
ero
de i
ndiv
iduo
s 43
0 43
0 43
0 43
0 43
0 43
0 43
0 43
0 43
0 E
rrores
está
ndar
en pa
réntes
is. (*
** p<
0.01
, **
p<0.
05, *
p<
0.1
signi
fican
cia)

22
0.55 standard deviations higher than those who did not listened to it. At the same time,
the impact of listening to Viva Seguro disappears for those with secondary and higher
education. It is worth noting that the effect on the number of insurance mentioned
disappears , which can be explained by the smaller number of individuals in each
category. Finally, people with a level of technical or higher education are buying more
insurance products after having heard the Viva Seguro program. This same coefficient
associated with people with primary or secondary levels of education is negative but
not significant. This indicates that in principle the effect is smaller for this population,
however the coefficients is not statistically different form zero. We also find, as can be
observed on the Table 9, positive impact of Listening to Viva Seguro on the radio on
the individual’s attitude. However, since it is the only specification in which this effect
occurs, the results should be interpreted with caution.
Similarly, three dummies which indicate the number of chapters each individual
reported to listen to were created, all of which can be interpreted as a level of
treatment intensity. The first dummy identified individuals who had listened to
a number of chapters equal to or greater than the average in the sample; the
second identified those who had heard a number of chapters above the median
and the third finally identified those individuals who had heard the most number
of chapters (the 25th percentile or higher 30 or more chapters). The results for
the first two measures did not yield significant results, however for the third case
statistically significant differences were found and are shown in Table 10. In
particular, among those who heard thirty or more sections of the program the
number of risks individuals could identify is higher. In this case, the effect of
the program is equivalent to 0.6 standard deviations. The results regarding the
number of insurance known also indicate that the effect on the population with
greater exposure to treatment was 0.34 standard deviations lower than the effect
reported in previous specifications (0.57 standard deviations) . As in the previous
case, positive impacts on the purchase of additional insurance and the desire to
purchase additional insurance for those who heard the program the most were
found. Again, these results should be analyzed with caution as they do not occur
regularly in all other specifications.

23
25
Tab
le 1
0 H
eter
ogen
eous
Im
pact
s –
num
ber o
f lis
tene
d ch
apte
rs
Varia
ble
depe
ndie
nte
No.
de
riesg
os a
lo
s qu
e es
tá
expu
esto
No.
de
segu
ros
que
cono
ce
Con
ocim
ient
o pr
omed
io
Actit
ud
Cap
acid
ad
Ahor
ra
Ahor
ra
para
em
erge
nci
as
No.
de
segu
ros
com
prad
os
Inte
rés
en
com
pra
r se
guro
s (1
) (2
) (3
) (4
) (5
) (6
) (7
) (8
) (9
)
List
ened
to V
iva
Segu
ro *
Fol
low
up
0.21
4**
0.17
5 0.
0325
0.
0148
0.
0300
-
0.07
8*
-0.0
260
0.18
8***
0.
0844
**
(0.0
896)
(0
.143
) (0
.133
) (0
.015
) (0
.020
7)
(0.0
41 ) (0
.025
2)
(0.0
347)
(0
.041
0)
List
ened
to V
iva
Segu
ro *
Fol
low
up
* Li
sten
ed to
m
ore
than
30
chap
ters
0.26
5*
0.45
8*
0.10
8 0.
0180
0.
0309
0.
14**
0.
0401
0.
0230
0.
0283
(0.1
59)
(0.2
54)
(0.2
36)
(0.0
27)
(0.0
369)
(0
.075 )
(0.0
449)
(0
.061
8)
(0.0
731)
Cons
tant
e 1.
443*
**
1.67
3**
* 2.
138*
**
0.54
***
0.62
1***
0.
3***
0.
0593
***
0.05
12**
* 0.
207*
**
(0
.033
1)
(0.0
527)
(0
.049
0)
(0.0
06)
(0.0
0765
) (0
.015 )
(0.0
0931
) (0
.012
8)
(0.0
152)
Obs
erva
cione
s 86
0 86
0 86
0 86
0 86
0 86
0 86
0 86
0 86
0 R-
cuad
rado
0.
042
0.02
4 0.
001
0.00
7 0.
014
0.01
2 0.
003
0.09
8 0.
018
Núm
ero
de
indi
vidu
os
430
430
430
430
430
430
430
430
430
Erro
res es
tánd
ar en
parén
tesis.
(***
p<0.
01, *
* p<
0.05
, * p
<0.
1 sig
nific
ancia
)

24
c. Robustness check – IV
As noted in section four it may be the case that our coefficient of interest is
biased because of people who did not attrite or due to simple differences between
listeners in the control and treatment radio stations respectively. In order to
control for such possibility we implement and instrumental variables approach
where the instrument used is the radio station each individual was listening when
they subscribed to the contest. That is what we estimate in this particular case it’s
then the impact on the intended to treat.
Table 11 presents the first stage results for all regressions under two distinct
methodologies: standard OLS regressions and fixed effects estimations. Moreover,
the table also presents the Weak Identification Test (Kleibergen-paap rk Wald F
statistic) and an endogeneity test to see whether this methodology was indeed
necessary. As expected, the predictive power of this variable is important.
Listeners who were normal listeners of those radio stations in which the Viva
Seguro Financial Education Program aired had a higher probability of listening to
the aforementioned program. Moreover, in no case the F statistic is lower than 84
suggesting that in the second stage we will not suffer from weak identification bias
problems.
26
Table 11 First Stage
Dependent variable: Listened to Viva Seguro Models Ivreg XT- Ivreg
Original Radio Station that listened at baseline 0.367*** 0.425***
(0.036) (0.046)
F – statistic 105.13 84.25 Individual controls Yes No Fixed effects No Yes Observations 858 860 R-squared 0.4743 0.6017 Number of individuals 430 Standard errors in parentheses. (*** p<0.01, ** p<0.05, * p<0.1 significance)
Table 12. Second Stage
Dependent variable Models Ivreg XT- Ivreg
Number of risks 0.674*** 0.907***
(0.238) (0.271)
Number of Insurance they Know 0.804** 1.157***
(0.397) (0.417)
Average level of Knowledge of insurance concepts 0.0748 0.120
(0.404) (0.391)
Attitude towards insurance 0.0360 0.0241
(0.0426) (0.0446)
Perceived Capabilities and knowledge of insurance 0.171*** 0.112*
(0.0639) (0.0610)
Number of New insurance bought in the last 6 months -0.0146 0.00728
(0.0853) (0.0961)
Interest in buying insurance 0.0197 0.0913 (0.125) (0.121) Standard errors in parentheses. (*** p<0.01, ** p<0.05, * p<0.1 significance)
25
26
Table 11 First Stage
Dependent variable: Listened to Viva Seguro Models Ivreg XT- Ivreg
Original Radio Station that listened at baseline 0.367*** 0.425***
(0.036) (0.046)
F – statistic 105.13 84.25 Individual controls Yes No Fixed effects No Yes Observations 858 860 R-squared 0.4743 0.6017 Number of individuals 430 Standard errors in parentheses. (*** p<0.01, ** p<0.05, * p<0.1 significance)
Table 12. Second Stage
Dependent variable Models Ivreg XT- Ivreg
Number of risks 0.674*** 0.907***
(0.238) (0.271)
Number of Insurance they Know 0.804** 1.157***
(0.397) (0.417)
Average level of Knowledge of insurance concepts 0.0748 0.120
(0.404) (0.391)
Attitude towards insurance 0.0360 0.0241
(0.0426) (0.0446)
Perceived Capabilities and knowledge of insurance 0.171*** 0.112*
(0.0639) (0.0610)
Number of New insurance bought in the last 6 months -0.0146 0.00728
(0.0853) (0.0961)
Interest in buying insurance 0.0197 0.0913 (0.125) (0.121) Standard errors in parentheses. (*** p<0.01, ** p<0.05, * p<0.1 significance)
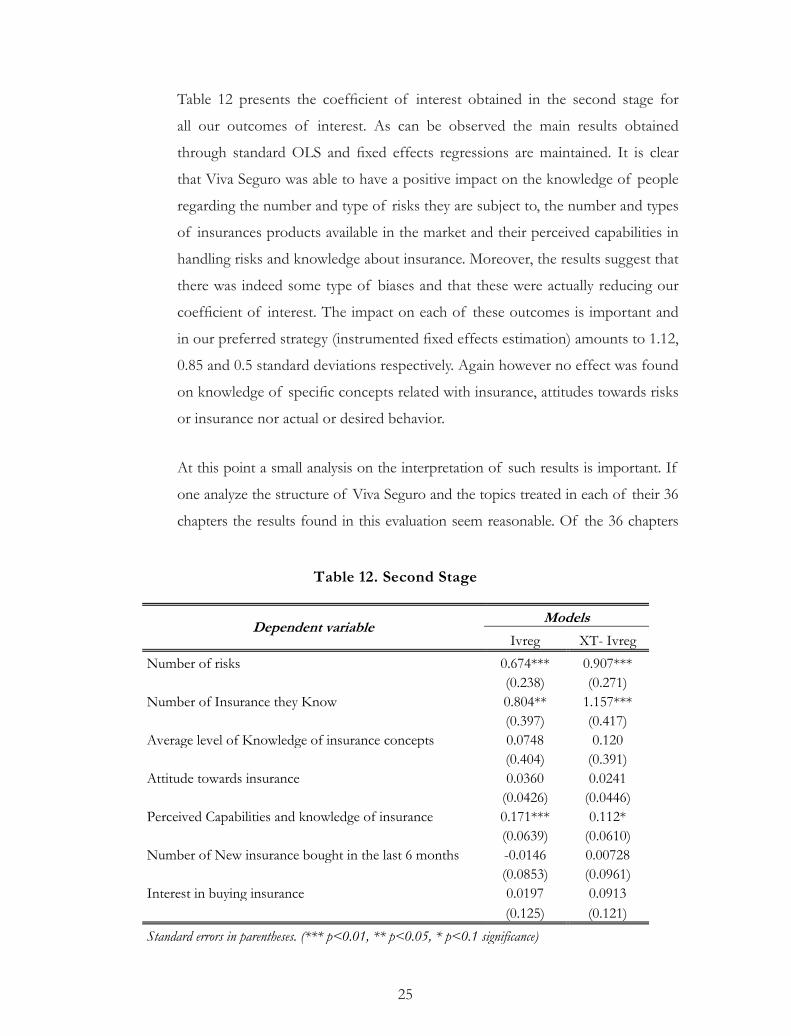
Table 12 presents the coefficient of interest obtained in the second stage for
all our outcomes of interest. As can be observed the main results obtained
through standard OLS and fixed effects regressions are maintained. It is clear
that Viva Seguro was able to have a positive impact on the knowledge of people
regarding the number and type of risks they are subject to, the number and types
of insurances products available in the market and their perceived capabilities in
handling risks and knowledge about insurance. Moreover, the results suggest that
there was indeed some type of biases and that these were actually reducing our
coefficient of interest. The impact on each of these outcomes is important and
in our preferred strategy (instrumented fixed effects estimation) amounts to 1.12,
0.85 and 0.5 standard deviations respectively. Again however no effect was found
on knowledge of specific concepts related with insurance, attitudes towards risks
or insurance nor actual or desired behavior.
At this point a small analysis on the interpretation of such results is important. If
one analyze the structure of Viva Seguro and the topics treated in each of their 36
chapters the results found in this evaluation seem reasonable. Of the 36 chapters

26
that the program had almost 47% of them are dedicated to explaining to the listener
the types of risks they are subject to and the type and number of insurance that
exists. Hence it’s not strange that these are precisely the areas in which an impact was
found (the questions regarding capabilities are most of them related to these specific
topics too). On the contrary only 20% of the chapters were dedicated to specific
concepts related with insurance o the duties, rights and complaints possibilities the
insured agent has. Results suggest that if the other outcome variables are to be
impacted additional chapters on such topics should be included.
7. Conclusions
This paper presents the results of a novel experiment that estimates the effectiveness
of broadcasted financial education programs. Specifically, we estimate how listening on the
radio to the Viva Seguro Financial Education Program could impact several outcomes of
interest. Results suggest that Viva Seguro was able to have a positive impact on the knowledge
of people regarding the number and type of risks they are subject to, the number and types
of insurances products available in the market and their perceived capabilities in handling
risks and knowledge about insurance. This effect is stronger for less educated people and
for those who listened to a higher number of chapters. However, no effect was found on
knowledge of specific concepts related with insurance, attitudes towards risks or insurance
nor actual or desired behavior. Given the structure of the Viva Seguro program and that
almost 50% of the chapters were dedicated to the first two topics the results here found are
the expected ones. Moreover, the results are robust to an alternative instrumental variable
methodology that could take into account and control for any non-observable that could be
biasing the results.
It is important to mention the cost-effectiveness of this program. Comparing these
results with those from other financial education programs delivered through different
channels gives a clear policy recommendation. Broadcasting financial education programs
on the radio is effective in changing the knowledge of people if sufficient time is dedicated
to the topic one wants to educate on. Changing behavior, as is the case with most financial
education programs however is much more difficult. In this particular case the evidence
suggest that listening to specialized programs on the radio will not change it.

27
References
Joshua Angrist & Victor Lavy, 2002. “New Evidence on Classroom Computers and Pupil
Learning,” Economic Journal, Royal Economic Society, vol. 112(482), pages 735-
765, October.
Innovatios for Poverty Action. (2010). Retrieved Abril 12, 2011, from Project evaluation:
Financial Education Delivered through Radio and Videos among Low-Income
Households in Cuzco, Peru: http://www.poverty-action.org/project/0112
Acción Social. (2010). Acción Social. Retrieved Abril 25, 2011, from Así es el programa
de mujeres ahorradoras en acción: http://www.accionsocial.gov.co/contenido/
contenido.aspx?conID=2456&catID=489
Banca de las Oportunidades. (2009). Términos de referencia: Contratación de un estudio de
línea base para la evaluación de impacto de la implementación de la metodología de
grupos de autoayuda en Colombia en el marco del programa de inversión “Banca de
las Oportunidades”.
Banca de las Oportunidades. (2010a). Los grupos de ahorro: ¿Qué son? Retrieved Abril
25, 2011, from http://www.bancadelasoportunidades.com.co/documentos/
Grupos%20de%20Ahorro%20y%20Credito/Presentaciones/vsl.pdf
Banca de las Oportunidades. (2010b). Experiencia y Aprendizaje de la Implementación de
Grupos de Ahorro y Crédito Local en Colombia.
Banca de las Oportunidades. (2011). Grupos de Ahorro y Crédito Local. Retrieved Mayo 4,
2011, from Metodología: http://www.bancadelasoportunidades.gov.co/contenido/
contenido.aspx?conID=823&catID=331&pagID=537
Banco Central de la República Argentina. (2010). Programa de Alfabetización Económica
y Financiera. Retrieved Abirl 2008, 2011, from http://www.bcra.gov.ar/index.asp

28
Banco Central do Brasil. (2009, Septiembre). ENEF - Estrategía Nacional de Educación
Finaciera - Brasil. Primera Conferencia de Educación Económica y Financiera de
América Latina y el Caribe.
Banco de la República. (2011). Encuesta electrónica: progrmas de educación financiera en
Colombia.
Banerjee, A. V., & Duflo, E. (2008). The Experimental Approach to Development Economics.
Massachusetts Institute of technology, Department of Economics and Abdul Latif
Jameel. Poverty Action Lab.
Bernal, R., & Peña, X. (2011). Guía Práctica para la Evaluación de Impacto. Ediciones
Uniandes.
Bernheim, B., Garrett, D., & Maki, D. (2000). Education and saving: The long-term effects
of high school financial curriculum mandates. Journal of Public Economics, 80,
435–465.
Bernheim, B. D., & Garrett, D. M. (2003). The effects of financial education in the workplace:
evidence from a survey of households. Journal of Public Economics, 87, 1487–1519.
Bohorquez Garcia, N. (2011, Abril 15). Educación Finaciera - Banco de la República. Bogotá,
D.C.
Burns, C., & Dalal, A. (2010). Explaining Insurance: Implementing Consumer Education in
CARE-India’s Insure Lives & Livelihoods Program. Financial Access Initiative.
Cenfri. (2010). The South African Insurance Association (SAIA) insurance education
programme: 2005 -2009.
CIC. (2008). “Bima ya Jamii” Project 2008 - 2010.
Cohen, M., Hopkins, D., & Lee, J. (2008). Financial Education: Bridge between Branchless
Banking Bridge between Branchless Banking. Microfinance Opportunities.
29
Compensar. (2011). Subsidio al desempleo. Retrieved Mayo 3, 2011, from http://www.
compensar.com/finanzas/desempleo.aspx
Condusef. (2010, Septiembre 29). Semana Nacional de Educación Financiera 2010. Retrieved
Abril 18, 2011, from http://www.condusef.gob.mx/index.php/2010/1168-semana-
nacional-de-educacion-financiera-2010
Dercon , S., & Kirchberger, M. (2008). Literature Review on Microinsurance. Micro Insurance
Innovation Facility.
Dividendo por Colombia . (2011). Historia. Retrieved Mayo 4, 2011, from http://www.
dividendoporcolombia.org/contenido/contenido.aspx?catID=42&conID=96
Dror, I., Dalal, A., & Matul, M. (2010). Emerging practices in consumer education on risk
management and insurance. Microinsurance Innovation Facility.
Duflo, E., Glennerster, R., & Kremer, M. (2007). Using Randomization in Development
Economics Research: A Toolkit. Centre for Economic Policy Research.
EDA & APMAS. (2006). Self Help Groups in India: A study of the lights and shades.
FASECOLDA. (2008). Programa de Formación en en Manejo de Riesgos y Seguros.
FASECOLDA. (2010). Informe Educación Financiera: Resultados Programa Riesgos y
Seguros - Talleres.
FASECOLDA. (2010). Logros FASECOLDA 2005-2010. Retrieved Abril 26, 2011, from
http://www.fasecolda.com/fasecolda/BancoConocimiento/F/fasecolda_en_
accion_2011_marzo17_-_copia/fasecolda_en_accion_2011_marzo17_-_copia.asp
FASECOLDA. (2011a). Desarrollo de los hitos.
FASECOLDA. (2011b). Estructura y Briefs.

30
FASECOLDA, SENA & FUNDASEG. (n.d.). Guia del capacitador: ¿Está usted seguro?
¡Protéjase!
FEF. (2010). Financial Education Fund. Retrieved Abril 14, 2011, from Projects: http://
www.financialeducationfund.org/index.php?nav=projects&view=11
Financial Literacy and Education Commission. (2010). National Strategy for Financial
Literacy 2011.
Flores, B., Landerretche, Ó., & Sánchez, G. (2011). Alfabetismo Financiero y Bancarización:
Comportameinto financiero, deuda y ahorro en Chile.
Fogafin. (2010). Educación financiera. Retrieved Abril 15, 2011, from Estrategia Nacional
de Educación Económica y Financiera: https://www.fogafin.gov.co/Web/
Formularios/Public/Content/frmContent.aspx?id=319&padre=576
FSA. (2006). FSA. Retrieved Abril 18, 2011, from Financial Capability in the UK: Establishing
a baseline: http://www.fsa.gov.uk/pubs/other/fincap_baseline.pdf
Gaurav, S., Cole, S., & Tobacman, J. (2010). A Randomized Evaluation of the Impact of
Financial Literacy on Rainfall Insurance Take-up in Gujarat. ILO Microinsurance
Innovation Facility, 1(1).
Gray, B., Sebstad, J., Cohen, M., & Stack, K. (2009, Diciembre). Can Financial Education
Change Behavior? Lessons from Bolivia and Sri Lanka. Microfinance Opportunities,
Freedom from Hunger y The Citigroup Foundation.
Innovations for Poverty Action . (2005). IPA - Project Evaluation. Retrieved Abril 12, 2011,
from Business Education for Microcredit Clients in Peru: http://www.poverty-
action.org/project/0020
Lusardi, A. (2002). Preparing for retirement: The importance of planning cost. National Tax
Association Proceedings, 148-154.

31
Lusardi, A., & Mitchell, O. S. (2007). Baby Boomer retirement security: The roles of planning,
financial literacy, and housing wealth. Journal of Monetary Economics, 54, 205–224.
Lusardi, A., & Tufano, P. (2008). Debt Literacy, Financial Experience and Overindebtedness.
Meyer, B. D. (1995, April). Natural and Quasi-Experiments in Economics. Journal 01 Business
& Economic Statistics, 13(2), 151-161.
MIA. (2010). Current projects. Retrieved Abril 14, 2011, from Bollywood style movie
as an insurance education tool: http://www.microinsuranceacademy.org/
content/%E2%80%9Csab-tujhse-hai%E2%80%9D-bollywood-style-movie-
insurance-education-tool
Micro Insurance Network. (2009). Working group. Retrieved Abril 14, 2010, from Impact
Evaluation of Composite Microinsurance and Consumer Education: http://www.
microinsurancenetwork.org/workinggroup/impact/project.php?id=9
Microinsurance Innovation Facility. (2010). Insurance Consumer Education – Kenya (ICE-
Kenya). Retrieved Mayo 3, 2011, from http://www.microinsurancefacility.org/sites/
default/files/content/learning_journey/see_also/MFO.pdf
Microinsurance Innovation Facility. (2011). Annual Report 2010. International Labour
Organisation 2011.
Microinsurance Network. (2010, Verano). Un estudio general sobre la educación en seguros.
Boletín - Trilogía Microseguros, 21.
Ministerio de Agricultura y Desarrollo Rural. (2010). Progrma de desarrollo de las
oportunidades de inversión y capitalización de las microempresas rurales -
Oportunidades Rurales - .
Morduch, J. (2004). Micro-insurance: the next revolution?

32
NEFE. (2004). Evaluation of the NEFE High School Financial Planning Program 2003 -
2004. University of Minnesota.
O’Connell, A. (2007). Measuring the effectiveness of financial education.
OECD. (2009). Financial-education.org. Retrieved Mayo 4, 2011, from OECD Project on
Financial Education and its International Network on Financial Education: http://
www.financial-education.org/dataoecd/8/28/44409678.pdf
OECD. (2011). OECD Financial Education Project: Background and Implementation.
Retrieved Abril 18, 2011, from http://www.oecd.org/document/23/0,3746,
fr_2649_15251491_25696983_1_1_1_1,00.html
Orton, L. (2007). Financial Literacy: Lessons from International Experience. Canadian Policy
Research Networks Inc.
Portafolio. (2011, Febrero 3). Reforma tributaria busca bancarizar a la mayoría de los
colombianos. Retrieved Mayo 3, 2011, from http://www.portafolio.co/economia/
reforma-tributaria-busca-bancarizar-la-mayoria-los-colo
Rodrik, D. (2008). The new development economics: we shall experiment, but how shall we
learn? John F. Kennedy School of Government.
Roth, J., & McCord, M. J. (2007). The Landscape of Microinsurance in the World’s 100
Poorest Countries. The MicroInsurance Centre, LLC.
Save the Children. (2010). Información basada en investigación realizada por Save the
Children.
Sebstad , J., & Cohen, M. (2003). Finacial Education for the Poor. Microfinance Opportunities.
Secretaria Distrital del Hábitat. (2010). Secretaría Distrital del Hábitat y la Asobancaria unidas
para que la población más vulnerable se capacite en temas financieros. Retrieved Abril

33
26, 2011, from http://www.habitatbogota.gov.co/sdht/index.php?option=com_co
ntent&view=article&id=240:secretaria-distrital-del-habitat-y-la-asobancaria-unidas-
para-educar-en-temas-financieros&catid=76:noticias-secundarias&Itemid=126
Tower, Craig and Elizabeth McGuinness (2011) ‘A Friend Indeed’: Evaluation of an Insurance
Education Radio Campaign in Kenya. Microfinance Opportunities