On the Asian expression of the PDO
11
INTERNATIONAL JOURNAL OF CLIMATOLOGY Int. J. Climatol. (in press) Published online in Wiley InterScience (www.interscience.wiley.com). DOI: 10.1002/joc.1326 ON THE ASIAN EXPRESSION OF THE PDO ROSANNE D’ARRIGO a * and ROB WILSON b a Tree-Ring Laboratory, Lamont-Doherty Earth Observatory, 61 Route 9W, Palisades, NY, USA b University of Edinburgh, Edinburgh, UK Received 23 September 2005 Revised 8 February 2006 Accepted 8 February 2006 ABSTRACT The causes and mechanisms of Pacific Decadal Variability (PDV) are still being investigated. One reason that such variability is not better understood is the scarcity of high-resolution paleoclimatic records from the Asian side of the North Pacific. Here we present a reconstruction of the boreal spring (March–May) Pacific Decadal Oscillation (PDO) index, spanning A.D. 1565–1988, that is the first to represent the large-scale Asian expression of this phenomenon using tree-ring data. Intervention analysis reveals significant (95% level) regime shifts corresponding to those in the instrumental PDO during the mid-1920s, mid-1940s and mid-1970s, the latter period associated with the famed 1976 shift in Pacific climate. Shifts in the preinstrumental period show varying correspondence with those of a North American-based tree- ring reconstruction of the North Pacific index (NPI), another indicator of Pacific decadal climate variability. Differences between these two time series hint at modulation of local climate from Asian monsoon, El Ni˜ no-Southern Oscillation (ENSO) and volcanic forcing, which could be partly masked by combining data from these sensitive regions in future PDO reconstructions. Overall, however, comparison of the reconstructions from both Asia and North America (NA) is useful for evaluating the distinct expressions of the PDO on both sides of the North Pacific and their interactions with the tropics. Copyright 2006 Royal Meteorological Society. KEY WORDS: PDO; Asia; tree rings; reconstruction; dendrochronology; monsoon; North Pacific; ENSO 1. INTRODUCTION The search continues for the causes and mechanisms of Pacific Decadal Variability (PDV) and its linkages to tropical climate (Minobe, 1997; Trenberth and Hurrell, 1994; Deser et al., 2004). Instrumental records of PDV are of insufficient length to adequately assess the long-term behavior and complexity of this phenomenon. To fulfill the need for longer records, a suite of reconstructions of the Pacific Decadal Oscillation (PDO; the dominant mode of North Pacific sea-surface temperature (SST); Mantua et al., 1997) has been produced using tree-ring records from western North America (NA; Biondi et al., 2001; D’Arrigo et al., 2001; Gedalof and Smith, 2001; Cook, 2003; MacDonald and Case, 2005). Although these records generally agree well with each other during the twentieth century, there is relatively little agreement before this time. This may partly result from the varying spatial coverage of NA tree-ring data used for these PDO reconstructions, as well as the fact that the models are all calibrated during the recent period using teleconnected relationships that may not be time-stable. However, the early lack of agreement may also reflect a real pattern of less coherency in the Pacific atmosphere–ocean system prior to the twentieth century. One missing piece of the puzzle is that none of the above-mentioned tree-ring reconstructions of the PDO include data from the Asian (upstream) side of the North Pacific. Yet, there is increasing evidence that Asian climate plays a critical role in PDV and its tropical teleconnections. North Pacific SST anomalies have been correlated with climate extremes across eastern Asia, and can interact with the Asian monsoon (Nakamura * Correspondence to: Rosanne D’Arrigo, Tree-Ring Laboratory, Lamont-Doherty Earth Observatory, 61 Route 9W, Palisades, NY, USA; e-mail: [email protected] Copyright 2006 Royal Meteorological Society
-
Upload
independent -
Category
Documents
-
view
0 -
download
0
Transcript of On the Asian expression of the PDO
INTERNATIONAL JOURNAL OF CLIMATOLOGY
Int. J. Climatol. (in press)
Published online in Wiley InterScience (www.interscience.wiley.com). DOI: 10.1002/joc.1326
ON THE ASIAN EXPRESSION OF THE PDO
ROSANNE D’ARRIGOa* and ROB WILSONb
a Tree-Ring Laboratory, Lamont-Doherty Earth Observatory, 61 Route 9W, Palisades, NY, USAb University of Edinburgh, Edinburgh, UK
Received 23 September 2005Revised 8 February 2006
Accepted 8 February 2006
ABSTRACT
The causes and mechanisms of Pacific Decadal Variability (PDV) are still being investigated. One reason that suchvariability is not better understood is the scarcity of high-resolution paleoclimatic records from the Asian side of theNorth Pacific. Here we present a reconstruction of the boreal spring (March–May) Pacific Decadal Oscillation (PDO)index, spanning A.D. 1565–1988, that is the first to represent the large-scale Asian expression of this phenomenon usingtree-ring data. Intervention analysis reveals significant (95% level) regime shifts corresponding to those in the instrumentalPDO during the mid-1920s, mid-1940s and mid-1970s, the latter period associated with the famed 1976 shift in Pacificclimate. Shifts in the preinstrumental period show varying correspondence with those of a North American-based tree-ring reconstruction of the North Pacific index (NPI), another indicator of Pacific decadal climate variability. Differencesbetween these two time series hint at modulation of local climate from Asian monsoon, El Nino-Southern Oscillation(ENSO) and volcanic forcing, which could be partly masked by combining data from these sensitive regions in futurePDO reconstructions. Overall, however, comparison of the reconstructions from both Asia and North America (NA) isuseful for evaluating the distinct expressions of the PDO on both sides of the North Pacific and their interactions withthe tropics. Copyright 2006 Royal Meteorological Society.
KEY WORDS: PDO; Asia; tree rings; reconstruction; dendrochronology; monsoon; North Pacific; ENSO
1. INTRODUCTION
The search continues for the causes and mechanisms of Pacific Decadal Variability (PDV) and its linkages totropical climate (Minobe, 1997; Trenberth and Hurrell, 1994; Deser et al., 2004). Instrumental records of PDVare of insufficient length to adequately assess the long-term behavior and complexity of this phenomenon.To fulfill the need for longer records, a suite of reconstructions of the Pacific Decadal Oscillation (PDO; thedominant mode of North Pacific sea-surface temperature (SST); Mantua et al., 1997) has been produced usingtree-ring records from western North America (NA; Biondi et al., 2001; D’Arrigo et al., 2001; Gedalof andSmith, 2001; Cook, 2003; MacDonald and Case, 2005). Although these records generally agree well witheach other during the twentieth century, there is relatively little agreement before this time. This may partlyresult from the varying spatial coverage of NA tree-ring data used for these PDO reconstructions, as well asthe fact that the models are all calibrated during the recent period using teleconnected relationships that maynot be time-stable. However, the early lack of agreement may also reflect a real pattern of less coherency inthe Pacific atmosphere–ocean system prior to the twentieth century.
One missing piece of the puzzle is that none of the above-mentioned tree-ring reconstructions of the PDOinclude data from the Asian (upstream) side of the North Pacific. Yet, there is increasing evidence that Asianclimate plays a critical role in PDV and its tropical teleconnections. North Pacific SST anomalies have beencorrelated with climate extremes across eastern Asia, and can interact with the Asian monsoon (Nakamura
* Correspondence to: Rosanne D’Arrigo, Tree-Ring Laboratory, Lamont-Doherty Earth Observatory, 61 Route 9W, Palisades, NY, USA;e-mail: [email protected]
Copyright 2006 Royal Meteorological Society
R. D’ARRIGO AND R. WILSON
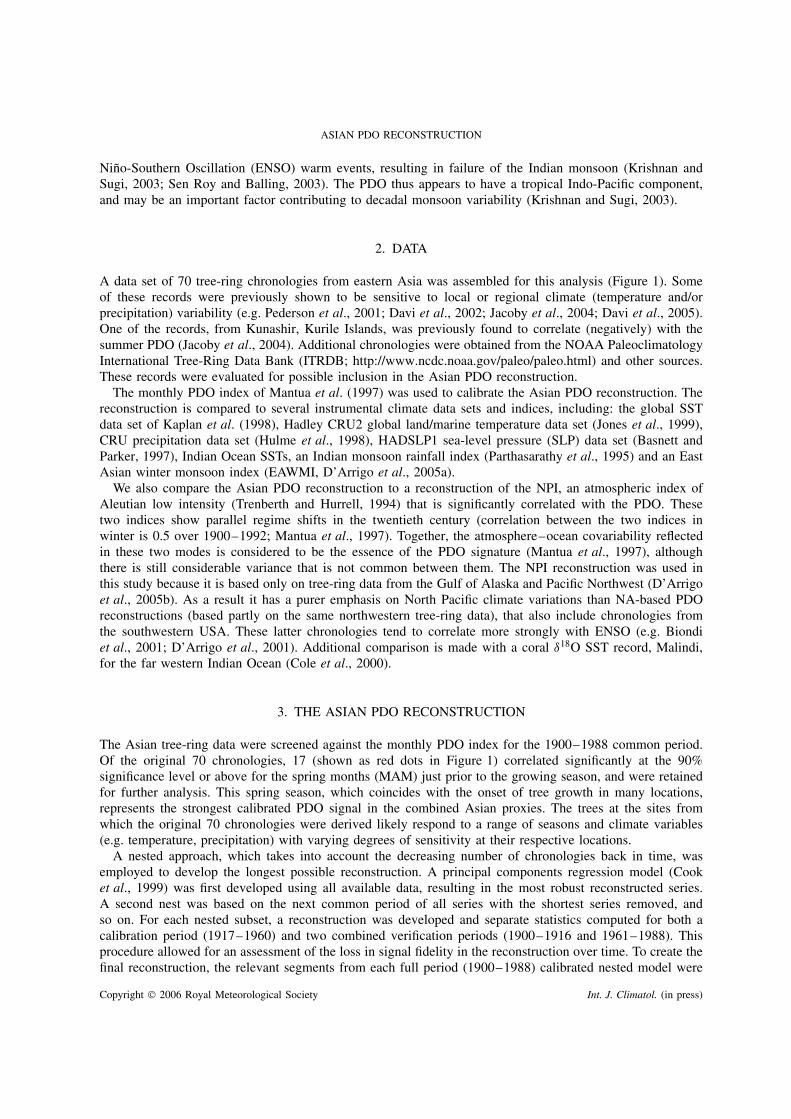
et al., 2002; Chongyin et al., 2004; Lau et al., 2004; Chan and Zhou, 2005). Japanese coastal air temperaturesdemonstrate PDO-related regime shifts (Minobe, 1997), and Asia’s atmospheric circulation has been shownto interact with Pacific anomalies on decadal time scales (Frauenfeld and Davis, 2002). Compared to westernNA, the climate of eastern Asia will respond differently to fluctuations in the Kuroshio–Oyashio Extension,east of Japan (Figure 1), an important factor influencing PDO variability (Schneider and Cornuelle, 2005), orto Atlantic forcing (Schwing et al., 2003). It has also been suggested that a key to the famed 1976 regimeshift and related PDV may lie in the upstream circulation and recent warming of the Asian landmass, and thatdecadal Pacific SST variability could be forced by the atmosphere over Eurasia (Frauenfeld and Davis, 2002).These observations suggest that the climate of Asia plays an active role in determining PDO variability, andthat an extended record of the Asian expression of the PDO could contribute to our understanding of thelong-term variability of Pacific climate and its teleconnections.
A reconstruction of the spring PDO index, developed solely from Asian tree-ring data, is presented herein.We demonstrate that this reconstruction is distinct from a reconstructed index of North Pacific climate vari-ability, the North Pacific index (NPI), partly developed from NA tree-ring data previously used to reconstructthe PDO. We also compare the Asian PDO reconstruction to climate records for the tropical Indo-Pacificregion, as previous studies have found evidence for a North Pacific-tropical climate connection (Trenberthand Hurrell, 1994; Deser et al., 2004). The 1976 regime shift, for example, is evident in both North Pacific andtropical climate indices (e.g. Deser et al., 2004), and common decadal fluctuations exist between North Pacificand tropical Indian Ocean SSTs (Minobe, 1997; Chelliah and Bell, 2004). Indices of PDV and Indian monsoonrainfall correlate significantly on decadal time scales, and positive PDO phases can amplify the impact of El
60°
40°
80°20°
60°
40°
20°100° 120° 140° 160°
80° 100° 120° 140° 160°
RUSSIA
MONGOLIA
CHINA
Kurosh
io current
Oya
shio current
BHUTAN
NORTHPACIFIC OCEAN
Kunashir
0 500
km
1000
Figure 1. Map of east Asia showing locations of tree-ring sites (white dots) used as candidate predictors of the Asian PDO (some dotsrepresent more than one site). Sites in red are those included in the regression model used to reconstruct the PDO for the most replicated
(1720–1988) nest
Copyright 2006 Royal Meteorological Society Int. J. Climatol. (in press)
ASIAN PDO RECONSTRUCTION
Nino-Southern Oscillation (ENSO) warm events, resulting in failure of the Indian monsoon (Krishnan andSugi, 2003; Sen Roy and Balling, 2003). The PDO thus appears to have a tropical Indo-Pacific component,and may be an important factor contributing to decadal monsoon variability (Krishnan and Sugi, 2003).
2. DATA
A data set of 70 tree-ring chronologies from eastern Asia was assembled for this analysis (Figure 1). Someof these records were previously shown to be sensitive to local or regional climate (temperature and/orprecipitation) variability (e.g. Pederson et al., 2001; Davi et al., 2002; Jacoby et al., 2004; Davi et al., 2005).One of the records, from Kunashir, Kurile Islands, was previously found to correlate (negatively) with thesummer PDO (Jacoby et al., 2004). Additional chronologies were obtained from the NOAA PaleoclimatologyInternational Tree-Ring Data Bank (ITRDB; http://www.ncdc.noaa.gov/paleo/paleo.html) and other sources.These records were evaluated for possible inclusion in the Asian PDO reconstruction.
The monthly PDO index of Mantua et al. (1997) was used to calibrate the Asian PDO reconstruction. Thereconstruction is compared to several instrumental climate data sets and indices, including: the global SSTdata set of Kaplan et al. (1998), Hadley CRU2 global land/marine temperature data set (Jones et al., 1999),CRU precipitation data set (Hulme et al., 1998), HADSLP1 sea-level pressure (SLP) data set (Basnett andParker, 1997), Indian Ocean SSTs, an Indian monsoon rainfall index (Parthasarathy et al., 1995) and an EastAsian winter monsoon index (EAWMI, D’Arrigo et al., 2005a).
We also compare the Asian PDO reconstruction to a reconstruction of the NPI, an atmospheric index ofAleutian low intensity (Trenberth and Hurrell, 1994) that is significantly correlated with the PDO. Thesetwo indices show parallel regime shifts in the twentieth century (correlation between the two indices inwinter is 0.5 over 1900–1992; Mantua et al., 1997). Together, the atmosphere–ocean covariability reflectedin these two modes is considered to be the essence of the PDO signature (Mantua et al., 1997), althoughthere is still considerable variance that is not common between them. The NPI reconstruction was used inthis study because it is based only on tree-ring data from the Gulf of Alaska and Pacific Northwest (D’Arrigoet al., 2005b). As a result it has a purer emphasis on North Pacific climate variations than NA-based PDOreconstructions (based partly on the same northwestern tree-ring data), that also include chronologies fromthe southwestern USA. These latter chronologies tend to correlate more strongly with ENSO (e.g. Biondiet al., 2001; D’Arrigo et al., 2001). Additional comparison is made with a coral δ18O SST record, Malindi,for the far western Indian Ocean (Cole et al., 2000).
3. THE ASIAN PDO RECONSTRUCTION
The Asian tree-ring data were screened against the monthly PDO index for the 1900–1988 common period.Of the original 70 chronologies, 17 (shown as red dots in Figure 1) correlated significantly at the 90%significance level or above for the spring months (MAM) just prior to the growing season, and were retainedfor further analysis. This spring season, which coincides with the onset of tree growth in many locations,represents the strongest calibrated PDO signal in the combined Asian proxies. The trees at the sites fromwhich the original 70 chronologies were derived likely respond to a range of seasons and climate variables(e.g. temperature, precipitation) with varying degrees of sensitivity at their respective locations.
A nested approach, which takes into account the decreasing number of chronologies back in time, wasemployed to develop the longest possible reconstruction. A principal components regression model (Cooket al., 1999) was first developed using all available data, resulting in the most robust reconstructed series.A second nest was based on the next common period of all series with the shortest series removed, andso on. For each nested subset, a reconstruction was developed and separate statistics computed for both acalibration period (1917–1960) and two combined verification periods (1900–1916 and 1961–1988). Thisprocedure allowed for an assessment of the loss in signal fidelity in the reconstruction over time. To create thefinal reconstruction, the relevant segments from each full period (1900–1988) calibrated nested model were
Copyright 2006 Royal Meteorological Society Int. J. Climatol. (in press)
R. D’ARRIGO AND R. WILSON
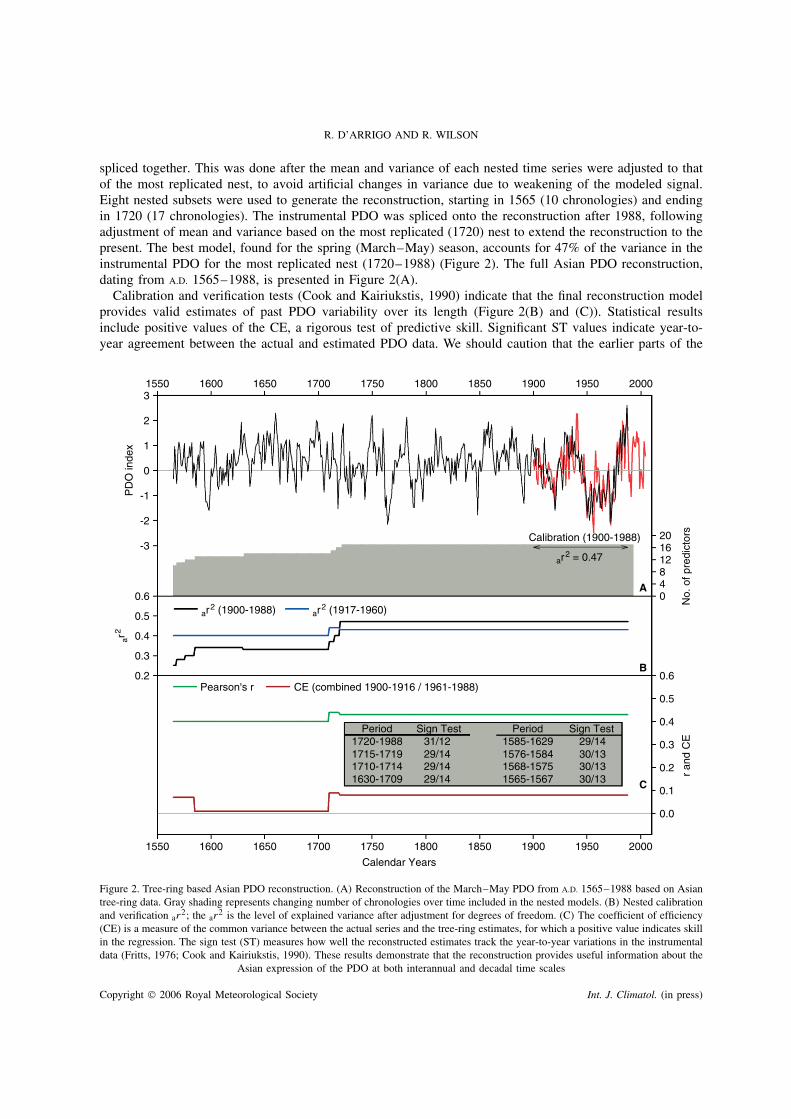
spliced together. This was done after the mean and variance of each nested time series were adjusted to thatof the most replicated nest, to avoid artificial changes in variance due to weakening of the modeled signal.Eight nested subsets were used to generate the reconstruction, starting in 1565 (10 chronologies) and endingin 1720 (17 chronologies). The instrumental PDO was spliced onto the reconstruction after 1988, followingadjustment of mean and variance based on the most replicated (1720) nest to extend the reconstruction to thepresent. The best model, found for the spring (March–May) season, accounts for 47% of the variance in theinstrumental PDO for the most replicated nest (1720–1988) (Figure 2). The full Asian PDO reconstruction,dating from A.D. 1565–1988, is presented in Figure 2(A).
Calibration and verification tests (Cook and Kairiukstis, 1990) indicate that the final reconstruction modelprovides valid estimates of past PDO variability over its length (Figure 2(B) and (C)). Statistical resultsinclude positive values of the CE, a rigorous test of predictive skill. Significant ST values indicate year-to-year agreement between the actual and estimated PDO data. We should caution that the earlier parts of the
3
2
1
0
-1
-2
-3
0.6
0.5
0.4
0.3
0.2
1550 1600 1650 1700 1750 1800 1850 1900 1950 2000
1550 1600 1650 1700 1750 1800 1850 1900 1950 2000
201612840
0.6
0.5
0.4
0.3
0.2
0.1
0.0
Calendar Years
ar2 (1900-1988) ar2 (1917-1960)
Pearson's r CE (combined 1900-1916 / 1961-1988)
Calibration (1900-1988)
ar2 = 0.47
Period Sign Test1720-19881715-17191710-17141630-1709
31/1229/1429/1429/14
Period Sign Test1585-16291576-15841568-15751565-1567
29/1430/1330/1330/13
PD
O in
dex
ar2
r an
d C
EN
o. o
f pre
dict
ors
A
B
C
Figure 2. Tree-ring based Asian PDO reconstruction. (A) Reconstruction of the March–May PDO from A.D. 1565–1988 based on Asiantree-ring data. Gray shading represents changing number of chronologies over time included in the nested models. (B) Nested calibrationand verification ar
2; the ar2 is the level of explained variance after adjustment for degrees of freedom. (C) The coefficient of efficiency
(CE) is a measure of the common variance between the actual series and the tree-ring estimates, for which a positive value indicates skillin the regression. The sign test (ST) measures how well the reconstructed estimates track the year-to-year variations in the instrumentaldata (Fritts, 1976; Cook and Kairiukstis, 1990). These results demonstrate that the reconstruction provides useful information about the
Asian expression of the PDO at both interannual and decadal time scales
Copyright 2006 Royal Meteorological Society Int. J. Climatol. (in press)
ASIAN PDO RECONSTRUCTION
reconstruction, due to less data prior to ∼1720 and lower levels of explained variance, should be viewed withless certainty. There is, however, reasonable verification for all eight nested models over the length of thereconstruction. These tests indicate that the tree-ring estimates reasonably capture the interannual to DecadalVariability in the PDO.
Multitaper method (MTM, Mann and Lees, 1996) spectral analysis reveals significant (above 99% level)peaks at ∼2–3 and 26 years, and a broad range of lower (multidecadal-centennial) frequencies over the1565–1988 period. Singular spectrum analysis (SSA; Vautard, 1995) similarly revealed dominant modesat ∼2–3, 26, and 63 years. The 63-year mode falls within the range of the 50–70 year oscillatory modeidentified by Minobe (1997) for the North Pacific. These results are difficult to compare to the North Americanreconstructions, which are primarily for the colder season months and for different time intervals (correlationbetween the spring (MAM) and winter (DJF) PDO is 0.75 over 1901–2002). However, some common modesof variation are found on decadal to multidecadal time scales (e.g. 25–50 years for D’Arrigo et al. (2001)and 17–28 years for Biondi et al. (2001).
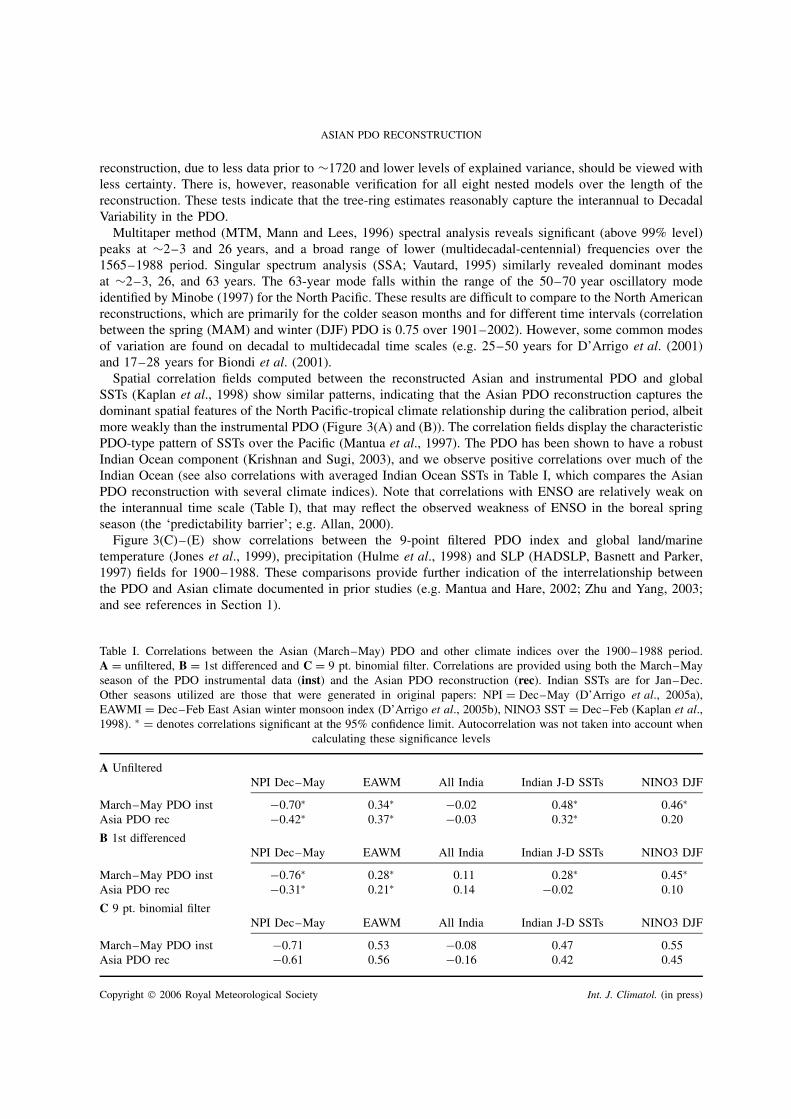
Spatial correlation fields computed between the reconstructed Asian and instrumental PDO and globalSSTs (Kaplan et al., 1998) show similar patterns, indicating that the Asian PDO reconstruction captures thedominant spatial features of the North Pacific-tropical climate relationship during the calibration period, albeitmore weakly than the instrumental PDO (Figure 3(A) and (B)). The correlation fields display the characteristicPDO-type pattern of SSTs over the Pacific (Mantua et al., 1997). The PDO has been shown to have a robustIndian Ocean component (Krishnan and Sugi, 2003), and we observe positive correlations over much of theIndian Ocean (see also correlations with averaged Indian Ocean SSTs in Table I, which compares the AsianPDO reconstruction with several climate indices). Note that correlations with ENSO are relatively weak onthe interannual time scale (Table I), that may reflect the observed weakness of ENSO in the boreal springseason (the ‘predictability barrier’; e.g. Allan, 2000).
Figure 3(C)–(E) show correlations between the 9-point filtered PDO index and global land/marinetemperature (Jones et al., 1999), precipitation (Hulme et al., 1998) and SLP (HADSLP, Basnett and Parker,1997) fields for 1900–1988. These comparisons provide further indication of the interrelationship betweenthe PDO and Asian climate documented in prior studies (e.g. Mantua and Hare, 2002; Zhu and Yang, 2003;and see references in Section 1).
Table I. Correlations between the Asian (March–May) PDO and other climate indices over the 1900–1988 period.A = unfiltered, B = 1st differenced and C = 9 pt. binomial filter. Correlations are provided using both the March–Mayseason of the PDO instrumental data (inst) and the Asian PDO reconstruction (rec). Indian SSTs are for Jan–Dec.Other seasons utilized are those that were generated in original papers: NPI = Dec–May (D’Arrigo et al., 2005a),EAWMI = Dec–Feb East Asian winter monsoon index (D’Arrigo et al., 2005b), NINO3 SST = Dec–Feb (Kaplan et al.,1998). ∗ = denotes correlations significant at the 95% confidence limit. Autocorrelation was not taken into account when
calculating these significance levels
A UnfilteredNPI Dec–May EAWM All India Indian J-D SSTs NINO3 DJF
March–May PDO inst −0.70∗ 0.34∗ −0.02 0.48∗ 0.46∗Asia PDO rec −0.42∗ 0.37∗ −0.03 0.32∗ 0.20
B 1st differencedNPI Dec–May EAWM All India Indian J-D SSTs NINO3 DJF
March–May PDO inst −0.76∗ 0.28∗ 0.11 0.28∗ 0.45∗Asia PDO rec −0.31∗ 0.21∗ 0.14 −0.02 0.10
C 9 pt. binomial filterNPI Dec–May EAWM All India Indian J-D SSTs NINO3 DJF
March–May PDO inst −0.71 0.53 −0.08 0.47 0.55Asia PDO rec −0.61 0.56 −0.16 0.42 0.45
Copyright 2006 Royal Meteorological Society Int. J. Climatol. (in press)
R. D’ARRIGO AND R. WILSON
–0.6
–0.5
–0.4
–0.3
–0.2
0.2
0.3
0.4
0.5
0.6
80
N7
0N
60
N5
0N
40
N3
0N
20
N1
0N
EQ
10
S
0
20
S
30E
60E
90E
120E
150E
150W
120W
90W
60W
180
030
E60
E90
E12
0E15
0E15
0W12
0W90
W60
W18
0
30
S4
0S
80
N7
0N
60
N5
0N
40
N3
0N
20
N1
0N
EQ
10
S2
0S
30
S4
0S
AB
030
E60
E90
E12
0E15
0E15
0W12
0W90
W18
0
80
N7
0N
60
N5
0N
40
N3
0N
20
N1
0N
EQ
10
S2
0S
30
S4
0S
C
030
E60
E90
E12
0E15
0E15
0W12
0W90
W60
W18
0
80
N7
0N
60
N5
0N
40
N3
0N
20
N1
0N
EQ
10
S2
0S
30
S4
0S
D
80
N7
0N
60
N5
0N
40
N3
0N
20
N1
0N
EQ
10
S
0E2
0S
30E
60E
90E
120E
150E
150W
120W
90W
60W
180
30
S4
0S
Figu
re3.
Com
pari
son
ofac
tual
(A)
and
reco
nstr
ucte
d(B
)A
sian
Mar
ch–
May
PDO
inde
xw
ithgl
obal
Mar
ch–
May
SSTs
for
1900
–19
88(K
apla
net
al.,
1998
).A
lso
show
nar
eco
mpa
riso
nsbe
twee
nth
esm
ooth
ed(9
-poi
ntfil
ter)
PDO
inde
xan
d(C
)C
RU
land
/mar
ine
tem
pera
ture
s,v2
,va
rian
cest
abili
zed,
Jone
set
al.,
1999
;(D
)C
RU
grid
ded
land
prec
ipita
tion
(Hul
me
etal
.,19
98;
and
(E)
Had
ley
Cen
tre
SLP
data
(Had
SLP1
,B
asne
ttan
dPa
rker
,199
7).
As
mig
htbe
expe
cted
,th
eA
sian
land
sign
alis
stro
nger
atde
cada
ltim
esc
ales
,as
show
nhe
re,
rath
erth
anin
tera
nnua
ltim
esc
ales
Copyright 2006 Royal Meteorological Society Int. J. Climatol. (in press)
ASIAN PDO RECONSTRUCTION
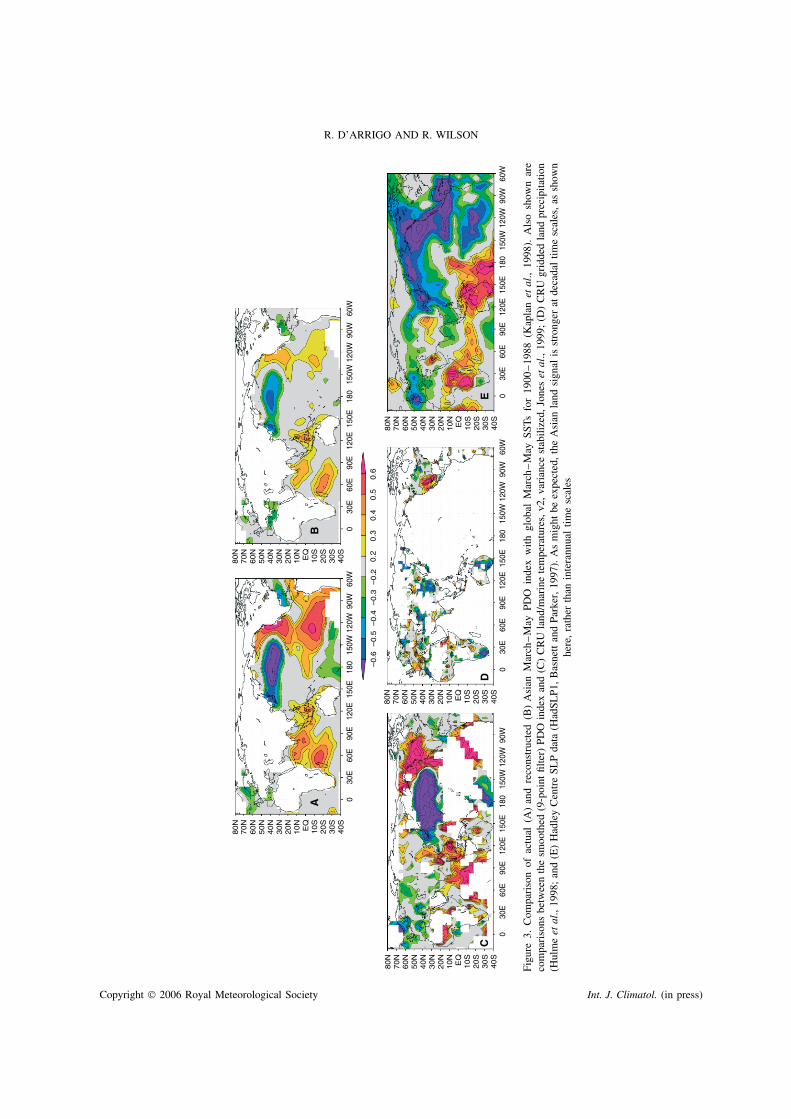
The teleconnected link with Indian Ocean SSTs is further highlighted by comparing the Asian PDOreconstruction with the Malindi δ18O coral record for the far western Indian Ocean (Figure 4). Correlationswith this SST proxy are significant over the 1870–1988 period (r = −0.47), although there is no coherencebetween the records prior to this time. The earlier, low correlation period may reflect decoupling in decadal-scale coherence between the tropics and extratropics (D’Arrigo et al., 2005b), or between the Asian proxiesand the PDO.
The Asian PDO reconstruction shows linkages to several aspects of the broader Asian monsoon system.For example, significant correlations are observed with the EAWMI, particularly at decadal time scales(Table I(C); D’Arrigo et al., 2005a). This finding implies an important interaction between North PDV andthe monsoon, at least during the twentieth century. This is supported by the significant relationships observedbetween the PDO, EAWM and NPI (Jhun and Lee, 2004), and between the PDO and climate anomaliesover Asia (e.g. Krishnan and Sugi, 2003). However, no apparent coherence exists with the all India monsoonrainfall index (Parthasarathy et al., 1995). This latter observation does not agree with analysis by Krishnanand Sugi (2003), who showed a significant relationship between the PDO and Indian summer monsoonrainfall. This inconsistency may be due to the differently defined spatial grids and methods used by Krishnanand Sugi (2003) to generate their PDO index compared to that used herein (Mantua et al., 1997). We do,however, observe some connection between the PDO and episodes of monsoon failure over India (see Table IIbelow).
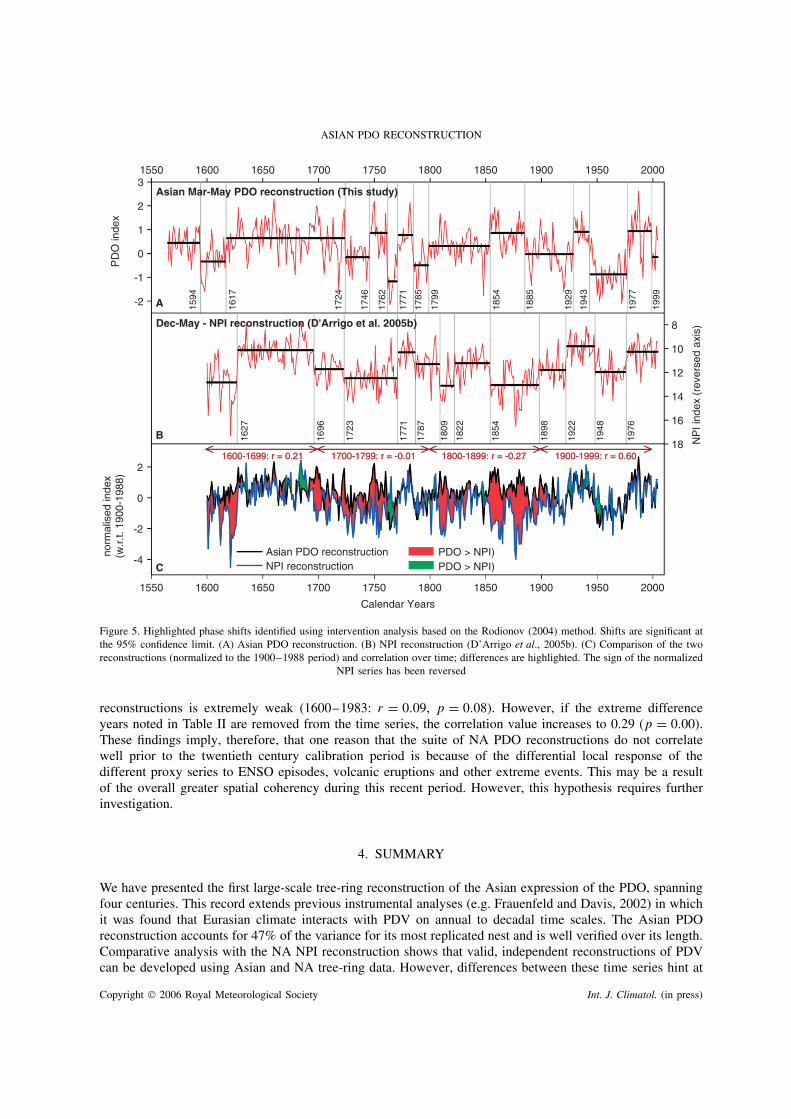
Intervention analysis (Rodionov, 2004) was applied to the Asian PDO reconstruction to identify significantshifts (at the 95% confidence limit) in this series (Figure 5(A)). For this analysis, mean values of 15-year periods were compared on either side of each year throughout the reconstruction. The Asian PDOreconstruction reasonably tracks regime shifts seen in the instrumental PDO in the mid-1920s, mid-1940sand mid-1970s (Mantua et al., 1997) (Figure 5(A)). Although, as noted above, the quality of the PDOreconstruction decreases somewhat back in time, there are decadal-scale variations prior to the instrumentalperiod that may also represent regime shifts: in 1594, 1617, 1724, 1746, 1762, 1771, 1785, 1799, 1854 and1885. The mean period between shifts is broadly consistent with that observed by Minobe (1997).
A similar intervention analysis undertaken on the NPI reconstruction also identifies the three main twentiethcentury shifts (Figure 5(B)). When compared to the results for the Asian PDO reconstruction prior to thetwentieth century, quite different phase shifts are identified. However, there are some pre-twentieth centuryshifts that appear to be common between the Asian and NA data sets, although their ‘local’ postshift responsescan differ. For example, similar shifts are identified around 1723/1724, 1771, 1785/1787 and 1854. Some ofthe differences between the PDO and NPI reconstructions might be related to inherent differences in behaviorbetween these two indices, as well as the different seasons used for reconstruction.
4
3
2
1
0
-1
-2
-3
-4
norm
alis
ed in
dex
(w.r
.t. 1
900-
1988
)
1800 1825 1850 1875 1900 1925 1950 1975
Calendar Years
Asian PDO reconstructionMalindi coral record
1801-1869: r = -0.05 1870-1988: r = -0.47
1801-1988: r = -0.18
Figure 4. Comparison of the Asian PDO reconstruction with the coral O18 record of Indian Ocean SST for Malindi (Cole et al., 2000).Both records were normalized to the 1900–1988 period and the sign of the Malindi record inverted for visual comparison
Copyright 2006 Royal Meteorological Society Int. J. Climatol. (in press)
R. D’ARRIGO AND R. WILSON
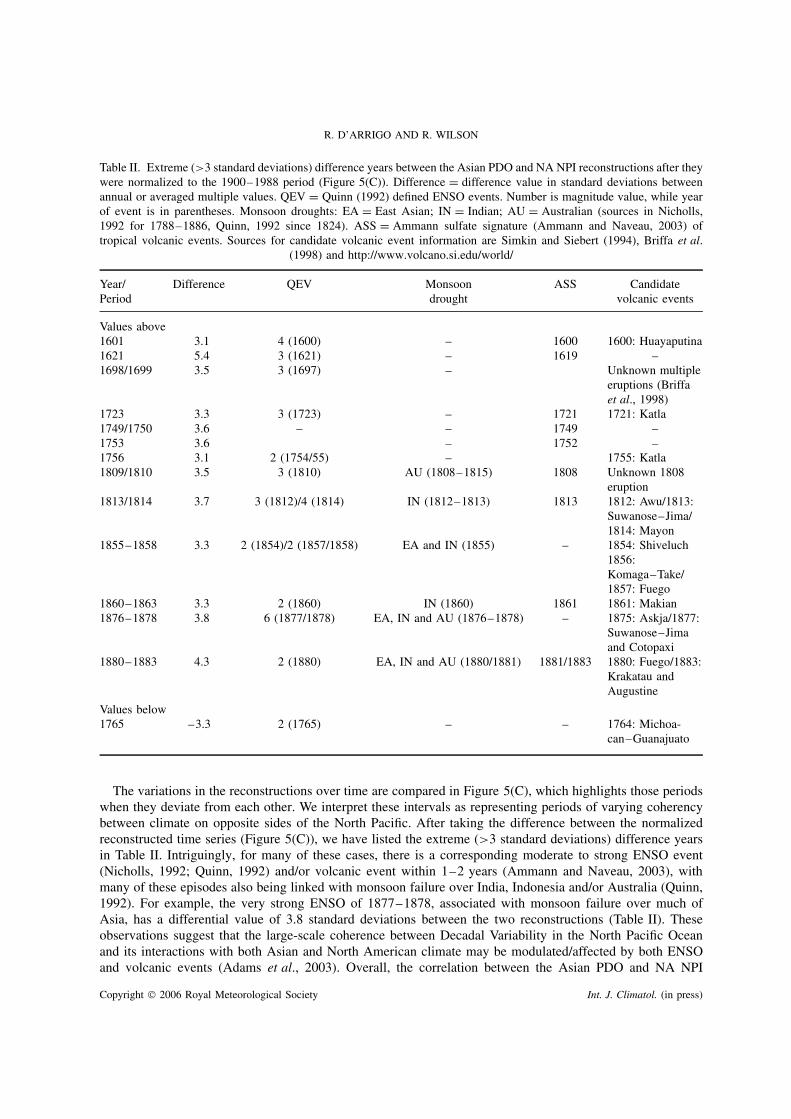
Table II. Extreme (>3 standard deviations) difference years between the Asian PDO and NA NPI reconstructions after theywere normalized to the 1900–1988 period (Figure 5(C)). Difference = difference value in standard deviations betweenannual or averaged multiple values. QEV = Quinn (1992) defined ENSO events. Number is magnitude value, while yearof event is in parentheses. Monsoon droughts: EA = East Asian; IN = Indian; AU = Australian (sources in Nicholls,1992 for 1788–1886, Quinn, 1992 since 1824). ASS = Ammann sulfate signature (Ammann and Naveau, 2003) oftropical volcanic events. Sources for candidate volcanic event information are Simkin and Siebert (1994), Briffa et al.
(1998) and http://www.volcano.si.edu/world/
Year/Period
Difference QEV Monsoondrought
ASS Candidatevolcanic events
Values above1601 3.1 4 (1600) – 1600 1600: Huayaputina1621 5.4 3 (1621) – 1619 –1698/1699 3.5 3 (1697) – Unknown multiple
eruptions (Briffaet al., 1998)
1723 3.3 3 (1723) – 1721 1721: Katla1749/1750 3.6 – – 1749 –1753 3.6 – 1752 –1756 3.1 2 (1754/55) – 1755: Katla1809/1810 3.5 3 (1810) AU (1808–1815) 1808 Unknown 1808
eruption1813/1814 3.7 3 (1812)/4 (1814) IN (1812–1813) 1813 1812: Awu/1813:
Suwanose–Jima/1814: Mayon
1855–1858 3.3 2 (1854)/2 (1857/1858) EA and IN (1855) – 1854: Shiveluch1856:Komaga–Take/1857: Fuego
1860–1863 3.3 2 (1860) IN (1860) 1861 1861: Makian1876–1878 3.8 6 (1877/1878) EA, IN and AU (1876–1878) – 1875: Askja/1877:
Suwanose–Jimaand Cotopaxi
1880–1883 4.3 2 (1880) EA, IN and AU (1880/1881) 1881/1883 1880: Fuego/1883:Krakatau andAugustine
Values below1765 –3.3 2 (1765) – – 1764: Michoa-
can–Guanajuato
The variations in the reconstructions over time are compared in Figure 5(C), which highlights those periodswhen they deviate from each other. We interpret these intervals as representing periods of varying coherencybetween climate on opposite sides of the North Pacific. After taking the difference between the normalizedreconstructed time series (Figure 5(C)), we have listed the extreme (>3 standard deviations) difference yearsin Table II. Intriguingly, for many of these cases, there is a corresponding moderate to strong ENSO event(Nicholls, 1992; Quinn, 1992) and/or volcanic event within 1–2 years (Ammann and Naveau, 2003), withmany of these episodes also being linked with monsoon failure over India, Indonesia and/or Australia (Quinn,1992). For example, the very strong ENSO of 1877–1878, associated with monsoon failure over much ofAsia, has a differential value of 3.8 standard deviations between the two reconstructions (Table II). Theseobservations suggest that the large-scale coherence between Decadal Variability in the North Pacific Oceanand its interactions with both Asian and North American climate may be modulated/affected by both ENSOand volcanic events (Adams et al., 2003). Overall, the correlation between the Asian PDO and NA NPI
Copyright 2006 Royal Meteorological Society Int. J. Climatol. (in press)
ASIAN PDO RECONSTRUCTION
15503
2
1
0
PD
O in
dex
1627
1594
1617
1724
1746
1762
1771
1785
1799
1854
1885
1929
1943
1977
1999
1696
1723
1771
1787
1809
1822
1854
1898
1922
1948
1976
-1
-2 A
B
1600-1699: r = 0.211600-1699: r = 0.21 1700-1799: r = -0.011700-1799: r = -0.01 1800-1899: r = -0.271800-1899: r = -0.27 1900-1999: r = 0.601900-1999: r = 0.602
0
-2
norm
alis
ed in
dex
(w.r
.t. 1
900-
1988
)
-4C
Asian Mar-May PDO reconstruction (This study)
Dec-May - NPI reconstruction (D'Arrigo et al. 2005b)
1600 1650 1700 1750 1800 1850 1900 1950 2000
1550 1600 1650
Asian PDO reconstructionNPI reconstruction
PDO > NPI)PDO > NPI)
1700 1750
Calendar Years
1800 1850 1900 1950 2000
8
10
12
14
NP
I ind
ex (
reve
rsed
axi
s)
16
18
Figure 5. Highlighted phase shifts identified using intervention analysis based on the Rodionov (2004) method. Shifts are significant atthe 95% confidence limit. (A) Asian PDO reconstruction. (B) NPI reconstruction (D’Arrigo et al., 2005b). (C) Comparison of the tworeconstructions (normalized to the 1900–1988 period) and correlation over time; differences are highlighted. The sign of the normalized
NPI series has been reversed
reconstructions is extremely weak (1600–1983: r = 0.09, p = 0.08). However, if the extreme differenceyears noted in Table II are removed from the time series, the correlation value increases to 0.29 (p = 0.00).These findings imply, therefore, that one reason that the suite of NA PDO reconstructions do not correlatewell prior to the twentieth century calibration period is because of the differential local response of thedifferent proxy series to ENSO episodes, volcanic eruptions and other extreme events. This may be a resultof the overall greater spatial coherency during this recent period. However, this hypothesis requires furtherinvestigation.
4. SUMMARY
We have presented the first large-scale tree-ring reconstruction of the Asian expression of the PDO, spanningfour centuries. This record extends previous instrumental analyses (e.g. Frauenfeld and Davis, 2002) in whichit was found that Eurasian climate interacts with PDV on annual to decadal time scales. The Asian PDOreconstruction accounts for 47% of the variance for its most replicated nest and is well verified over its length.Comparative analysis with the NA NPI reconstruction shows that valid, independent reconstructions of PDVcan be developed using Asian and NA tree-ring data. However, differences between these time series hint at
Copyright 2006 Royal Meteorological Society Int. J. Climatol. (in press)
R. D’ARRIGO AND R. WILSON
modulation of local climate from ENSO, monsoon failure or volcanic events. To minimize these effects, whichcan ‘muddy’ the PDV signal, future attempts at reconstructing the PDO may be optimized by including bothAsian and NA data. Overall, however, comparison of the reconstructions from both Asia and NA is usefulfor evaluating the distinct expressions of the PDO on both sides of the North Pacific and their interactionswith tropical climate, and could be of value in future predictive efforts.
ACKNOWLEDGEMENTS
This project was funded by the National Science Foundation’s Paleoclimate Program (Grants ATM02-02898,OCE 04-02474). Support was also provided by the Inter American Institute (IAI). We thank contributors to theNOAA Paleoclimatology Data Bank, and J. Cole, E. Cook, G. Jacoby, O. Solomina and G. J. Van Oldenborghfor data and assistance. Three anonymous reviewers made comments that improved the manuscript. Somefigures and analyses were generated using KNMI Climate Explorer. LDEO Contribution No. 6878.
REFERENCES
Adams JB, Mann ME, Ammann CM. 2003. Proxy evidence for an El Nino-like response to volcanic forcing. Nature 426: 274–278.Allan R. 2000. ENSO and climatic variability in the past 150 years. In ENSO: Multiscale Variability and Global and Regional Impacts,
Diaz HF, Markgraf V (eds). Cambridge University Press: Cambridge, 3–55.Ammann C, Naveau P. 2003. Statistical analysis of tropical explosive volcanism occurrences over the last 6 centuries. Geophysical
Research Letters 30: 1210, DOI: 10.1029/2002GL016388.Basnett T, Parker D. 1997. Development of the Global Mean Sea Level Pressure Data Set GMSLP2. Climate Research Technical
Note.79: Hadley Centre, Meteorological Office: Devon.Biondi F, Gershunov A, Cayan D. 2001. North Pacific decadal climate variability since AD 1661. Journal of Climate 14: 5–10.Briffa KR, Jones PD, Schweingruber FH, Osborn TJ. 1998. Influence of volcanic eruptions on Northern Hemisphere summer temperature
over the past 600 years. Nature 393: 450–455.Chan J, Zhou W. 2005. PDO, ENSO and the early summer monsoon rainfall over south China. Geophysical Research Letters 32:
L08810, DOI:10.1029/2004GL022015.Chelliah M, Bell G. 2004. Tropical multidecadal and interannual climate variability in the NCEP-NCAR reanalysis. Journal of Climate
17: 1777–1803.Chongyin L, Jinhai H, Jinhong Z. 2004. A review of decadal/interdecadal climate variation studies in China. Advances in Atmospheric
Sciences 21: 425–436.Cole J, Dunbar R, McClanahan T, Muthiga N. 2000. Tropical Pacific forcing of decadal SST variability in the western Indian ocean
over the past two centuries. Science 287: 617–619.Cook E. 2002. Reconstructions of Pacific Decadal Variability from long tree-ring records. EOS Trans. AGU 83(19): Spring Meet. Suppl.
Abstract GC42A-04.Cook E, Kairiukstis L. 1990. Methods of Dendrochronology. Kluwer Press: Dordrecht.Cook E, Stahle D, Meko D, Cleaveland M. 1999. Drought reconstructions for the continental United States. Journal of Climate 12:
1145–1162.D’Arrigo R, Villalba R, Wiles G. 2001. Tree-ring estimates of Pacific decadal climate variability. Climate Dynamics 18: 219–224.D’Arrigo R, Wilson R, Panagiotopoulos F, Wu B. 2005a. On the long-term variability of the East Asian winter monsoon. Geophysical
Research Letters 32: L21706, 10.1029/2005GL023235.D’Arrigo R, Wilson R, Deser C, Wiles G, Cook E, Villalba R, Tudhope A, Cole J, Linsley B. 2005b. Tropical-North Pacific climate
linkages over the past four centuries. Journal of Climate 18: 5253–5265.Davi N, Jacoby G, Curtis A, Baatarbileg N. 2006. Extension of drought records for central Asia using tree-rings: west central Mongolia.
Journal of Climate 19: 288–299.Davi N, D’Arrigo R, Jacoby G, Buckley B, Kobayashi O. 2002. Warm-season annual temperature variability for Hokkaido, Japan
reconstructed from tree-ring density data: AD 1557–1990. Climatic Change 52: 201–217.Deser C, Phillips A, Hurrell J. 2004. Pacific interdecadal climate variability: linkages between the tropics and North Pacific during
boreal winter since 1900. Journal of Climate 17: 3109–3124.Frauenfeld O, Davis R. 2002. Midlatitude circulation patterns associated with decadal and interannual Pacific Ocean variability.
Geophysical Research Letters 29: 2221, DOI:10.1029/2002GL015743.Fritts H. 1976. Tree Rings and Climate. Academic Press: London.Gedalof Z, Smith D. 2001. Interdecadal climate variability and regime-scale shifts in Pacific North America. Geophysical Research
Letters 28: 1515–1518.Hulme M, Osborn T, Johns T. 1998. Precipitation sensitivity to global warming: comparison of observations with HadCM2 simulations.
Geophysical Research Letters 25: 3379–3382.Jacoby G, Solomina O, Frank D, Eremenko N, D’Arrigo R. 2004. Kunashir (Kurile Islands) oak response to temperature and relation
to the Pacific Decadal Oscillation (PDO). Palaeogeography, Palaeoclimatology, Palaeoecology 209: 303–311.Jhun JG, Lee EJ. 2004. A new East Asian winter monsoon index and associated characteristics of the winter monsoon. Journal of
Climate 17: 711–726.Jones P, New M, Parker D, Martin S, Rigor I. 1999. Surface air temperature and its variations over the last 150 years. Reviews of
Geophysics 37: 173–199.
Copyright 2006 Royal Meteorological Society Int. J. Climatol. (in press)

ASIAN PDO RECONSTRUCTION
Kaplan A, Cane M, Kushnir Y, Clement A, Blumenthal B, Rajagopalan B. 1998. Analyses of global sea surface temperature 1856–1991.Journal of Geophysical Research 103: 18567–18589.
Krishnan R, Sugi M. 2003. Pacific Decadal Oscillation and variability of the Indian summer monsoon rainfall. Climate Dynamics 21:233–242.
Lau K, Lee J, Kim K, Kang I. 2004. The North Pacific as a regulator of summer climate over Eurasia and North America. Journal ofClimate 17: 819–833.
MacDonald G, Case R. 2005. Variations in the Pacific Decadal Oscillation over the past millennium. Geophysical Research Letters 32:L08703, DOI:10.1029/2005GL022478.
Mann ME, Lees J. 1996. Robust estimation of background noise and signal detection in climatic time series. Climatic Change 33:409–445.
Mantua N, Hare S. 2002. The Pacific Decadal Oscillation. Journal of Oceanography 58: 35–44.Mantua N, Hare S, Zhang Y, Wallace J, Francis R. 1997. A Pacific interdecadal oscillation with impacts on salmon production. Bulletin
of the American Meteorological Society 78: 1069–1079.Minobe S. 1997. A 50–70 year climatic oscillation over the North Pacific and North America. Geophysical Research Letters 24:
683–686.Nakamura H, Izumi T, Sampe T. 2002. Interannual and decadal modulations recently observed in the Pacific storm track activity and
East Asian winter monsoon. Journal of Climate 15: 1855–1874.Nicholls N. 1992. Historical El Nino/Southern oscillation variability in the Australasian region. In El Nino–Historical and Paleoclimatic
Aspects of the Southern Oscillation, Diaz HF, Markgraf V (eds). Cambridge University Press: Cambridge, 151–173.Parthasarathy A, Munot A, Kothawale D. 1995. Monthly and seasonal rainfall series for All-India homogeneous regions and
meteorological subdivisions: 1871 to 1994. Research Report 1995. RR-065. Contributions from Indian Institute of TropicalMeteorology: Pune.
Pederson N, Jacoby G, D’Arrigo R, Buckley B. 2001. Hydrometeorological reconstructions for northeastern Mongolia derived fromtree rings: 1651–1995. Journal of Climate 14: 872–881.
Quinn WH. 1992. A study of Southern Oscillation-related climatic activity for A.D. 622–1900 incorporating Nile River flood data. InEl Nino–Historical and Paleoclimatic Aspects of the Southern Oscillation, Diaz HF, Markgraf V (eds). Cambridge University Press:Cambridge, 119–149.
Rodionov SN. 2004. A sequential algorithm for testing climate regime shifts. Geophysical Research Letters 31(09204):DOI:10.1029/2004GL019448.
Schneider N, Cornuelle B. 2005. The forcing of the Pacific Decadal Oscillation. Journal of Climate 18: 4355–4373,DOI:10.1175/JCLI3527.1.
Schwing F, Jiang J, Mendelssohn R. 2003. Coherency of multi-scale abrupt changes between the NAO, NPI and PDO. GeophysicalResearch Letters 30(7): 1496, DOI:10.1029/2002GL016535.
Sen Roy S, Balling R. 2003. Influence of El Nino/southern oscillation, Pacific Decadal Oscillation, and local sea-surface temperatureanomalies on peak season monsoon precipitation in India. Climate Research 25: 171–178.
Simkin T, Siebert L. 1994. Volcanoes of the World. Geoscience Press: Tucson, 349.Trenberth K, Hurrell J. 1994. Decadal atmospheric-ocean variations in the Pacific. Climate Dynamics 9: 303–319.Vautard R. 1995. Patterns in time: SSA and MSSA. In Analysis of Climate Variability, von Storch H, Navarra A (eds). Springer Press:
Berlin, 259–279.Zhu Y, Yang X. 2003. Relationships between Pacific Decadal Oscillation (PDO) and climate variability in China. Acta Meteorologica
Sinica 61: 641–653.
Copyright 2006 Royal Meteorological Society Int. J. Climatol. (in press)