On the acoustics of emotion in audio: what speech, music, and sound have in common
12
ORIGINAL RESEARCH ARTICLE published: 27 May 2013 doi: 10.3389/fpsyg.2013.00292 On the acoustics of emotion in audio: what speech, music, and sound have in common Felix Weninger 1 *, Florian Eyben 1 , Björn W. Schuller 1,2 , Marcello Mortillaro 2 and Klaus R. Scherer 2 1 Machine Intelligence and Signal Processing Group, Mensch-Maschine-Kommunikation,Technische Universität München, Munich, Germany 2 Centre Interfacultaire en Sciences Affectives, Université de Genève, Geneva, Switzerland Edited by: Anjali Bhatara, Université Paris Descartes, France Reviewed by: Jarek Krajewski, University of Cologne, Germany Gabriela Ilie, St. Michael Hospital, Canada *Correspondence: Felix Weninger, Technische Universität München,Theresienstraße 90, 80333 Munich, Germany. e-mail: [email protected] Without doubt, there is emotional information in almost any kind of sound received by humans every day: be it the affective state of a person transmitted by means of speech; the emotion intended by a composer while writing a musical piece, or conveyed by a musi- cian while performing it; or the affective state connected to an acoustic event occurring in the environment, in the soundtrack of a movie, or in a radio play. In the field of affective computing, there is currently some loosely connected research concerning either of these phenomena, but a holistic computational model of affect in sound is still lacking. In turn, for tomorrow’s pervasive technical systems, including affective companions and robots, it is expected to be highly beneficial to understand the affective dimensions of “the sound that something makes,” in order to evaluate the system’s auditory environment and its own audio output. This article aims at a first step toward a holistic computational model: starting from standard acoustic feature extraction schemes in the domains of speech, music, and sound analysis, we interpret the worth of individual features across these three domains, considering four audio databases with observer annotations in the arousal and valence dimensions. In the results, we find that by selection of appropriate descriptors, cross-domain arousal, and valence regression is feasible achieving significant correlations with the observer annotations of up to 0.78 for arousal (training on sound and testing on enacted speech) and 0.60 for valence (training on enacted speech and testing on music). The high degree of cross-domain consistency in encoding the two main dimensions of affect may be attributable to the co-evolution of speech and music from multimodal affect bursts, including the integration of nature sounds for expressive effects. Keywords: audio signal processing, emotion recognition, feature selection, transfer learning, music perception, sound perception, speech perception 1. INTRODUCTION Without doubt, emotional expressivity in sound is one of the most important methods of human communication. Not only human speech, but also music and ambient sound events carry emotional information. This information is transmitted by modulation of the acoustics and decoded by the receiver – a human conversa- tion partner, the audience of a concert, or a robot or automated dialog system. By that, the concept of emotion that we consider in this article is the one of consciously conveyed emotion (in contrast, for example, to the “true” emotion of a human related to biosignals such as heart rate). In speech, for example, a cer- tain affective state can be transmitted through a change in vocal parameters, e.g., by adjusting fundamental frequency and loud- ness (Scherer et al., 2003). In music, we consider the emotion intended by the composer of a piece – and by that, the per- forming artist(s) as actor(s) realizing an emotional concept such as “happiness” or “sadness.” This can manifest through acoustic parameters such as tempo, dynamics (forte/piano), and instru- mentation (Schuller et al., 2010). In contrast to earlier research on affect recognition from singing (e.g., Daido et al., 2011), we focus on polyphonic music – by that adding the instrumentation as a major contribution to expressivity. As a connection between music and speech emotion, for example, the effect of musical training on human emotion recognition has been highlighted in related work (Nilsonne and Sundberg, 1985; Thompson et al., 2004). Lastly, also the concept of affect in sound adopted in this article is motivated by the usage of (ambient) sounds as a method of communica- tion – to elicit an intended emotional response in the audience of a movie, radio play, or in the users of a technical system with auditory output. In the field of affective computing, there is currently some loosely connected research concerning either of these phenom- ena (Schuller et al., 2011a; Drossos et al., 2012; Yang and Chen, 2012). Despite a number of perception studies suggesting over- lap in the relevant acoustic parameters (e.g., Ilie and Thompson, 2006), a holistic computational model of affect in general sound is still lacking. In turn, for tomorrow’s technical systems, includ- ing affective companions and robots, it is expected to be highly beneficial to understand the affective dimensions of “the sound that something makes,”in order to evaluate the system’s auditory environment and its own audio output. In order to move toward such a unified framework for affect analysis, we consider feature relevance analysis and automatic regression with respect to continuous observer ratings of the main www.frontiersin.org May 2013 |Volume 4 | Article 292 | 1
-
Upload
independent -
Category
Documents
-
view
0 -
download
0
Transcript of On the acoustics of emotion in audio: what speech, music, and sound have in common
ORIGINAL RESEARCH ARTICLEpublished: 27 May 2013
doi: 10.3389/fpsyg.2013.00292
On the acoustics of emotion in audio: what speech, music,and sound have in commonFelix Weninger 1*, Florian Eyben1, Björn W. Schuller 1,2, Marcello Mortillaro2 and Klaus R. Scherer 2
1 Machine Intelligence and Signal Processing Group, Mensch-Maschine-Kommunikation, Technische Universität München, Munich, Germany2 Centre Interfacultaire en Sciences Affectives, Université de Genève, Geneva, Switzerland
Edited by:Anjali Bhatara, Université ParisDescartes, France
Reviewed by:Jarek Krajewski, University ofCologne, GermanyGabriela Ilie, St. Michael Hospital,Canada
*Correspondence:Felix Weninger , TechnischeUniversität München,Theresienstraße90, 80333 Munich, Germany.e-mail: [email protected]
Without doubt, there is emotional information in almost any kind of sound received byhumans every day: be it the affective state of a person transmitted by means of speech;the emotion intended by a composer while writing a musical piece, or conveyed by a musi-cian while performing it; or the affective state connected to an acoustic event occurring inthe environment, in the soundtrack of a movie, or in a radio play. In the field of affectivecomputing, there is currently some loosely connected research concerning either of thesephenomena, but a holistic computational model of affect in sound is still lacking. In turn,for tomorrow’s pervasive technical systems, including affective companions and robots, itis expected to be highly beneficial to understand the affective dimensions of “the soundthat something makes,” in order to evaluate the system’s auditory environment and itsown audio output. This article aims at a first step toward a holistic computational model:starting from standard acoustic feature extraction schemes in the domains of speech,music, and sound analysis, we interpret the worth of individual features across these threedomains, considering four audio databases with observer annotations in the arousal andvalence dimensions. In the results, we find that by selection of appropriate descriptors,cross-domain arousal, and valence regression is feasible achieving significant correlationswith the observer annotations of up to 0.78 for arousal (training on sound and testing onenacted speech) and 0.60 for valence (training on enacted speech and testing on music).The high degree of cross-domain consistency in encoding the two main dimensions ofaffect may be attributable to the co-evolution of speech and music from multimodal affectbursts, including the integration of nature sounds for expressive effects.
Keywords: audio signal processing, emotion recognition, feature selection, transfer learning, music perception,sound perception, speech perception
1. INTRODUCTIONWithout doubt, emotional expressivity in sound is one of the mostimportant methods of human communication. Not only humanspeech, but also music and ambient sound events carry emotionalinformation. This information is transmitted by modulation ofthe acoustics and decoded by the receiver – a human conversa-tion partner, the audience of a concert, or a robot or automateddialog system. By that, the concept of emotion that we considerin this article is the one of consciously conveyed emotion (incontrast, for example, to the “true” emotion of a human relatedto biosignals such as heart rate). In speech, for example, a cer-tain affective state can be transmitted through a change in vocalparameters, e.g., by adjusting fundamental frequency and loud-ness (Scherer et al., 2003). In music, we consider the emotionintended by the composer of a piece – and by that, the per-forming artist(s) as actor(s) realizing an emotional concept suchas “happiness” or “sadness.” This can manifest through acousticparameters such as tempo, dynamics (forte/piano), and instru-mentation (Schuller et al., 2010). In contrast to earlier research onaffect recognition from singing (e.g., Daido et al., 2011), we focuson polyphonic music – by that adding the instrumentation as amajor contribution to expressivity. As a connection between music
and speech emotion, for example, the effect of musical training onhuman emotion recognition has been highlighted in related work(Nilsonne and Sundberg, 1985; Thompson et al., 2004). Lastly, alsothe concept of affect in sound adopted in this article is motivatedby the usage of (ambient) sounds as a method of communica-tion – to elicit an intended emotional response in the audienceof a movie, radio play, or in the users of a technical system withauditory output.
In the field of affective computing, there is currently someloosely connected research concerning either of these phenom-ena (Schuller et al., 2011a; Drossos et al., 2012; Yang and Chen,2012). Despite a number of perception studies suggesting over-lap in the relevant acoustic parameters (e.g., Ilie and Thompson,2006), a holistic computational model of affect in general soundis still lacking. In turn, for tomorrow’s technical systems, includ-ing affective companions and robots, it is expected to be highlybeneficial to understand the affective dimensions of “the soundthat something makes,” in order to evaluate the system’s auditoryenvironment and its own audio output.
In order to move toward such a unified framework for affectanalysis, we consider feature relevance analysis and automaticregression with respect to continuous observer ratings of the main
www.frontiersin.org May 2013 | Volume 4 | Article 292 | 1
Weninger et al. Acoustics of emotion in audio
dimensions of affect, arousal, and valence, across speech, music,and ambient sound events. Thereby, on the feature side, we restrictourselves to non-symbolic acoustic descriptors, thus eliminatingmore domain-specific higher-level concepts such as linguistics,chords, or key. In particular, we use a well proven set of “low-level” acoustic descriptors for paralinguistic analysis of speech (cf.Section 2.3). Then, we address the importance of acoustic descrip-tors for the automatic recognition of continuous arousal andvalence in a “cross-domain” setting. We show that there exist largecommonalities but also strong differences in the worth of indi-vidual descriptors for emotion prediction in the various domains.Finally, we carry out experiments with automatic regression on aselected set of “generic acoustic emotion descriptors.”
2. MATERIALS AND METHODS2.1. EMOTION MODELLet us first clarify the model of emotion employed in this article.There is a debate in the field on which type of model to adoptfor emotion differentiation: discrete (categorical) or dimensional(e.g., Mortillaro et al., 2012). We believe that these approaches arehighly complementary. It has been copiously shown that discreteemotions in higher dimensional space can be mapped parsimo-niously into lower dimensional space. Most frequently, the twodimensions valence and arousal are chosen, although it can beshown that affective space is best structured by four dimensions –adding power and novelty to valence and arousal (Fontaine et al.,2007). Whether to choose a categorical or dimensional approach isthus dependent on the respective research context and the specificgoals. Here, we chose a valence× arousal dimensional approachbecause of the range of affective phenomena underlying our stim-uli. In addition for some of our stimulus sets only dimensionalannotations were available.
2.2. DATABASESLet us now start the technical discussion in this article by a briefintroduction of the data sets used in the present study on arousaland valence in speech, music, and sound. The collection of emo-tional audio data for the purpose of automatic analysis has oftenbeen driven by computer engineering. This is particularly true forspeech data – considering applications, for example, in human-computer interaction. This has led to large databases of sponta-neous emotion expression, for example, emotion in child-robotinteraction (Steidl, 2009) or communication with virtual humans(McKeown et al., 2012), which are however limited to specificdomains. In contrast, there are data sets from controlled experi-ments, featuring, for example, emotions expressed (“enacted”) byprofessional actors, with restricted linguistic content (e.g., pho-netically balanced pseudo sentences) with the goal to allow fordomain-independent analysis of the variation of vocal parame-ters (Burkhardt et al., 2005; Bänziger et al., 2012). In the case ofpolyphonic music, data sets are mostly collected with (commer-cial) software applications in mind – for example, categorizationof music databases on end-user devices (“music mood recogni-tion”; Yang and Chen, 2012). Finally, emotion analysis of generalsounds has been attempted only recently (Sundaram and Schle-icher, 2010; Drossos et al., 2012; Schuller et al., 2012). In this light,we selected the following databases for our analysis: the Geneva
Multimodal Emotion Portrayals (GEMEP) set as an example forenacted emotional speech; the Vera am Mittag (VAM) database asan example for spontaneous emotional speech “sampled” from a“real-life”context; the“Now That’s What I Call Music”(NTWICM)database for mood recognition in popular music; and the recentlyintroduced emotional sounds database.
2.2.1. Enacted emotion in speech: the Geneva multimodal emotionportrayals (GEMEP)
The GEMEP corpus is a collection of 1260 multimodal expres-sions of emotion enacted by 10 French-speaking actors (Bänzigeret al., 2012). GEMEP comprises 18 emotions that cover all fourquadrants of the arousal-valence space. The list includes the emo-tions most frequently used in the literature (e. g., fear, sadness, joy)as well as more subtle differentiations within emotion families (e.g., anger and irritation, fear, and anxiety). Actors expressed eachemotion by using three verbal contents (two pseudo sentences andone sustained vowel) and different expression regulation strategieswhile they were recorded by three synchronized cameras and a sep-arate microphone. To increase the realism and the spontaneity ofthe expressions, a professional director worked with the respectiveactor during the recording session in order to choose one scenariotypical for the emotion – either by recall or mental imagery – thatwas personally relevant for the actor. Actors did not receive anyinstruction on how to express the emotion and were free to useany movement and prosody they wanted.
In the present research we consider a sub selection of 154instances of emotional speech based on the high recognition ratesreported by Bänziger et al. (2012). For this set of portrayals per-ceptual ratings of arousal and valence were obtained in the contextof a study on the perception of multimodal emotion expressions(Mortillaro et al., unpublished). Twenty participants (10 male)listened to each of these expressions (presented in random order)and rated the content in terms of arousal and valence by usinga continuous slider. Participants were given written instructionsbefore the study. These instructions included a clear definition foreach dimension that was judged. Furthermore, right before theystarted to rate the stimuli, they were asked whether they under-stood the dimensions and the two anchors and were invited to askquestions in case something was unclear. During the ratings thename of the dimension (e.g., “activation”), a brief definition (e.g.,“degree of physical/physiological activation of the actor”), and theanchors (“very weak”and“very strong”) were visible on the screen.
2.2.2. Spontaneous emotion in speech: the VAM corpusThe VAM corpus (Grimm et al., 2008) was collected by the instituteINT of the University Karlsruhe, Germany, and consists of audio-visual recordings taken from the German TV talk show “Vera amMittag”(English:“Vera at noon”– Vera is the name of the talk showhost). In this show, the host mainly moderates discussions betweenguests, e.g.,by occasional questions. The corpus contains 947 spon-taneous, emotionally rich utterances from 47 guests of the talkshow which were recorded from unscripted and authentic discus-sions. There were several reasons to build the database on materialfrom a TV talk show: there is a reasonable amount of speech fromthe same speakers available in each session, the spontaneous dis-cussions between talk show guests are often rather affective, and
Frontiers in Psychology | Emotion Science May 2013 | Volume 4 | Article 292 | 2
Weninger et al. Acoustics of emotion in audio
the interpersonal communication leads to a wide variety of emo-tional states, depending on the topics discussed. These topics weremainly personal issues, such as friendship crises, fatherhood ques-tions, or romantic affairs. At the time of recording, all subjects didnot know that the recordings were going to be analyzed in a studyof affective expression. Furthermore, the selection of the speak-ers was based on additional factors, such as how emotional theutterances were or which spectrum of emotions was covered bythe speakers, to assure a large spectrum of different and realisticaffective states. Within the VAM corpus, emotion is described interms of three basic primitives – valence, arousal, and dominance.Valence describes the intrinsic pleasantness or unpleasantness ofa situation. Arousal describes whether a stimulus puts a personinto a state of increased or reduced activity. Dominance is notused for the experiments reported in this article. For annotationof the speech data, the audio recordings were manually segmentedto utterance level. A large number of human annotators were usedfor annotation (17 for one half of the data, six for the other).
For evaluation an icon-based method that consists of an arrayof five images for each emotion dimension was used. Each humanlistener had to listen to each utterance in the database to choosean icon per emotion dimension in order to best describe the emo-tion heard. Afterward, the choice of the icons was mapped onto adiscrete five-point scale for each dimension in the range of +1 to−1, leading to an emotion estimation (Grimm et al., 2007a).
2.2.3. Emotion in music: now that’s what i call music (NTWICM)database
For building the NTWICM music database the compilation “NowThat’s What I Call Music!” (UK series, volumes 1–69) is selected.It contains 2648 titles – roughly a week of total play time – andcovers the time span from 1983 to 2010. Likewise it represents verywell most music styles which are popular today; that ranges fromPop and Rock music over Rap, R&B to electronic dance music asTechno or House. While lyrics are available for 73% of the songs,in this study we only use acoustic information.
Songs were annotated as a whole, i.e., without selection of char-acteristic song parts. Respecting that mood perception is generallyjudged as highly subjective (Hu et al., 2008), four labellers weredecided for. While mood may well change within a song, as changeof more and less lively passages or change from sad to a positiveresolution, annotation in such detail is particularly time-intensive.Yet, it is assumed that the addressed music type – mainstreampopular and by that usually commercially oriented – music to beless affected by such variation as, for example, found in longerarrangements of classical music. Details on the chosen raters areprovided in Schuller et al. (2011b). They were picked to forma well-balanced set spanning from rather “naïve” assessors with-out instrument knowledge and professional relation to “expert”assessors including a club disc jockey (DJ). The latter can thusbe expected to have a good relationship to music mood, and itsperception by the audiences. Further, young raters prove a goodchoice, as they were very well familiar with all the songs of the cho-sen database. They were asked to make a forced decision accordingto the two dimensions in the mood plane assigning values in −2,−1, 0, 1, 2 for arousal, and valence, respectively. They were furtherinstructed to annotate according to the perceived mood, that is, the
“represented” mood, not to the induced, that is, “felt” one, whichcould have resulted in too high labeling ambiguity. The annota-tion procedure is described in detail in Schuller et al. (2010), andthe annotation along with the employed annotation tool are madepublicly available1.
2.2.4. Emotion in sound events: emotional sound databaseThe emotional sound database (Schuller et al., 2012)2 is basedon the on-line freely available engine FindSounds.com3 (Rice andBailey, 2005). It consists of 390 manually chosen sound files out ofmore than 10,000. To provide a set with a balanced distribution ofemotional connotations, it was decided to use the following eightcategories taken from FindSounds.com: Animals, Musical instru-ments, Nature, Noisemaker, People, Sports, Tools, and Vehicles. Withthis choice the database represents a broad variety of frequentlyoccurring sounds in everyday environment. The emotional sounddatabase was annotated by four labelers (one female, 25–28 years).They were all post graduate students working in the field of audioprocessing. All labelers are of Southeast-Asian origin (Chineseand Japanese), and two reported to have musical training. Forthe annotation these four listeners were asked to make a decisionaccording to the two dimensions in the emotion plane assigningvalues on a five-point scale in −2, −1, 0, 1, 2 for arousal andvalence. They were instructed to annotate the perceived emotionand could repeatedly listen to the sounds that were presented inrandom order across categories. Annotation was carried out indi-vidually and independently by each of the labelers. For annotation,the procedure as described in detail in Schuller et al. (2010) wasused – thus, the annotation exactly corresponds to the one used formusic mood (cf. above). The annotation tool can be downloadedfreely4.
2.2.5. Reliability and “gold standard”For all four of the databases, the individual listener annotationswere averaged using the evaluator weighted estimator (EWE) asdescribed by Grimm and Kroschel (2005). The EWE providesquasi-continuous dimensional annotations taking into accountthe agreement of observers. For instance n and dimension d(arousal or valence), the EWE yd
EWE ,n is defined by
ydEWE ,n =
1K∑
k=1rk
K∑k=1
rk ydn,k , (1)
where K is the number of labellers, and ydn,k is the rating of instance
n by labeller k in dimension d. Thus, the EWE is a weighted meanrating with weights corresponding to the confidence in the label-ing of rater k – in this study, we use the correlation coefficient rk ofrater k’s rating and the mean rating. By the first term in the aboveequation, the weights are normalized to sum up to one, in orderto have the EWE in the same scale as the original ratings.
1http://openaudio.eu/NTWICM-Mood-Annotation.arff – accessed 27 Mar 20132http://www.openaudio.eu/Emotional-Sound-Database.csv – accessed 27 Mar 20133http://www.findsounds.com – accessed 27 Mar 20134http://www.openaudio.eu/wsh_mood_annotation.zip – accessed 27 Mar 2013
www.frontiersin.org May 2013 | Volume 4 | Article 292 | 3

Weninger et al. Acoustics of emotion in audio
The average rk (across the K raters) is depicted for arousal andvalence annotation in the four databases in Table 1. For VAM, weobserve that valence was more difficult to evaluate than arousal,while conversely, on ESD, raters agree more strongly on valencethan arousal. In NTWICM, both arousal and valence have similaragreement (r = 0.70 and 0.69). Results for GEMEP are in the sameorder of magnitude, indicating some ambiguity despite the factthat the emotion is enacted.
Furthermore, Table 1 summarizes the number of raters, num-ber of rated instances, and length of the databases’ audio. It can beseen that NTWICM is by far the largest regarding the number ofinstances and audio length, followed by VAM, ESD, and GEMEP.The huge differences in audio length are further due to the timeunit of annotation, which is similar for VAM, ESD, and GEMEP(roughly 2–4 s of audio material), yet in NTWICM entire tracksof several minutes length of popular music were rated.
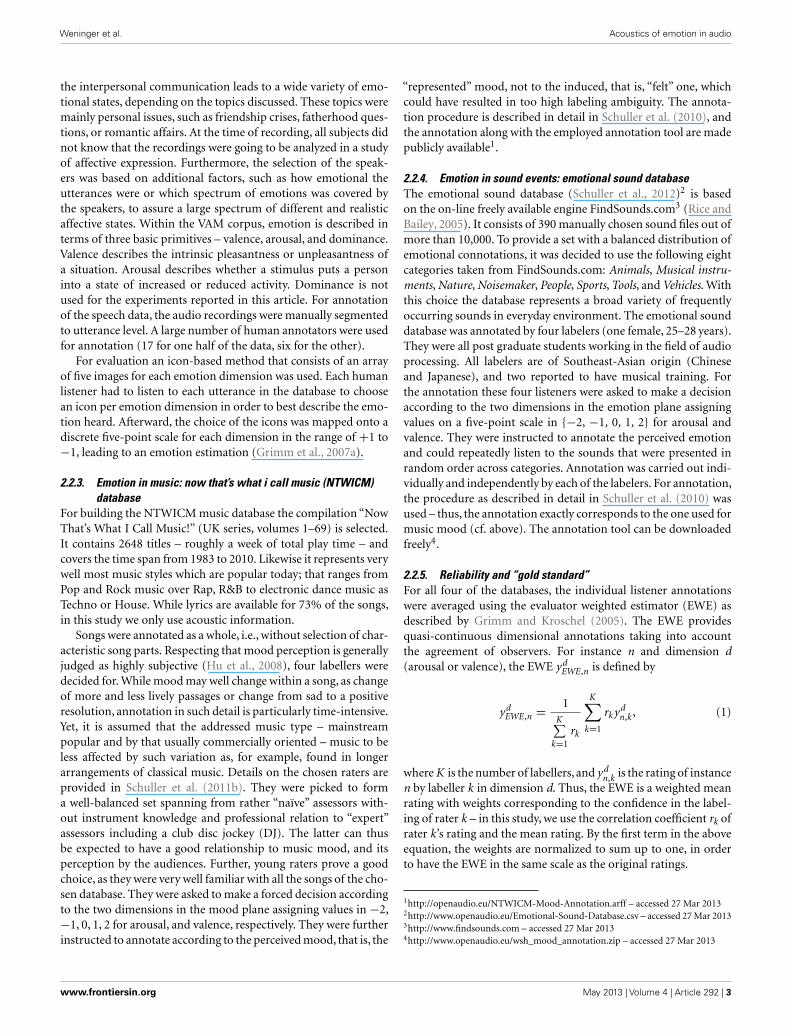
Figure 1 shows the distribution of the arousal and valenceEWE ratings on the three databases considered. For the purposeof this visualization, the quasi-continuous arousal/valence ratingsare discretized into five equally spaced bins spanning the interval[−1, 1] on each axis, resulting in a discretization of the arousal-valence space into 25 bins. The number of instances per bin iscounted. It is evident that in VAM, instances with low valence pre-vail – this indicates the difficulty of creating emotionally balanceddata sets by sampling audio archives. Furthermore, we observe astrong concentration of ratings in the “neutral” (center) bin ofthe arousal-valence space. The enacted GEMEP database is over-all better balanced in terms of valence and arousal ratings – yetstill, there seems to be a lack of instances with low arousal andnon-neutral valence rating, although some of the chosen emotion
categories (e.g., pleasure) would be expected to fit in this part.For NTWICM, we observe a concentration in the first quadrantof the valence-arousal plane, and a significant correlation betweenthe arousal and valence ratings (Spearman’s ρ= 0.61, p 0.001).This indicates a lack of, e.g., “dramatic” music with high arousaland low valence in the chosen set of “chart” music. Finally, in ESD,ratings are distributed all over the arousal and valence scales – asshown in more detail by Schuller et al. (2012), this is due to thedifferent sound classes in the databases having different emotionalconnotation (e.g., nature sounds on average being associated withhigher valence than noisemakers).
2.3. EXTRACTION OF ACOUSTIC DESCRIPTORSIn this article, the ultimate goal is automatic emotion recogni-tion (AER) from general sound. In contrast to neighboring fieldsof audio signal processing such as speech or speaker recognition,which rely exclusively on rather simple spectral cues (Young et al.,2006) as acoustic features, AER typically uses a large variety ofdescriptors. So far no attempt has been made at defining a “stan-dard” feature set for generic AER from sound, which may be dueto the facts that AER still a rather young field with about 15 yearsof active research, and that emotion recognition is a multi-facetedtask owing to the manifold ways of expressing emotional cuesthrough speech, music, and sounds, and the subjective nature ofthe task. Some of the currently best performing approaches forautomatic speech emotion recognition (Schuller et al., 2011a) usea large set of potentially relevant acoustic features and apply a large,“brute-force” set of functionals to these in order to summarize theevolution of the contours of the acoustic features over segmentsof typically a few seconds in length (Ververidis and Kotropoulos,
Table 1 | Database statistics.
Database Domain Agreement [r ] # Annot. # Inst. Length [h:m]
Arousal Valence
VAM Speech (spontaneous) 0.81 0.56 6–17 947 0:50
GEMEP Speech (enacted) 0.64 0.68 20 154 0:06
NTWICM Music 0.70 0.69 4 2648 168:03
ESD Sound 0.58 0.80 4 390 0:25
A B C D
FIGURE 1 | Distribution of valence/arousal EWE on the VAM (A), GEMEP (B), emotional sound (C), and NTWICM (D) databases: number of instancesper valence/arousal bin.
Frontiers in Psychology | Emotion Science May 2013 | Volume 4 | Article 292 | 4

Weninger et al. Acoustics of emotion in audio
2006). This is done to capture temporal dynamics in a feature vec-tor of fixed length and has been shown to outperform modelingof temporal dynamics on the classifier level (Schuller et al., 2009).In the process of addressing various tasks in speech and speakercharacterization in a series of research challenges (Schuller et al.,2009, 2013), various large sets for the speech domain have beenproposed. Little work, however, has been done on cross-domaingeneralization of these features, which will be the focus of thepresent study.
For the analysis reported on in this article, we use a well-evolvedset for automatic recognition of paralinguistic phenomena – theone of the INTERSPEECH 2013 Computational ParalinguisticsEvaluation baseline (Schuller et al., 2013). In this set, supraseg-mental features are obtained by applying a large set of statisticalfunctionals to acoustic low-level descriptors (cf. Tables 2 and 3).The low-level descriptors cover a broad set of descriptors fromthe fields of speech processing, Music Information Retrieval, andgeneral sound analysis. For example,Mel Frequency Cepstral Coef-ficients (Davis and Mermelstein, 1980; Young et al., 2006) arevery frequently used in ASR and speaker identification. Further,they are used in Music Information Retrieval. Spectral statisticaldescriptors, such as spectral variance and spectral flux, are oftenused in multi-media analysis, and are part of the descriptor setproposed in the MPEG-7 multi-media content description stan-dard (Peeters, 2004). They are thus very relevant for music andsound analysis. Loudness and energy related features are obviouslyimportant for all tasks. The same holds true for the sound qualitydescriptors (which are used to discriminate harmonic and noise-like sounds) and the fundamental frequency and psychoacousticsharpness. The latter is a well-known feature in sound analysis(Zwicker and Fastl, 1999). Jitter and Shimmer are micro-prosodicvariations of the length and amplitudes (respectively) of the fun-damental frequency for harmonic sounds. They are mainly used invoice pathology analysis, but are also good descriptors of generalsound quality.
3. RESULTS3.1. FEATURE RELEVANCELet us now discuss the most effective acoustic features out of theabove mentioned large set for single- and cross-domain emotionrecognition. To this end, besides correlation coefficients (r) offeatures with the arousal or valence ratings, we introduce the cross-domain correlation coefficient (CDCC) as criterion. As we striveto identify features which carry similar meaning with respect toemotion in different domains, and at the same time provide highcorrelation with emotion in the domains by themselves, the pur-pose of the CDCC measure is to weigh high correlation in singledomains against correlation deviations across different domains.Let us first consider a definition for two domains i and j, namely
CDCC2f ,i,j =
∣∣∣r (i)f + r(j)f
∣∣∣− ∣∣∣r (i)f − r(j)f
∣∣∣2
(2)
where r (i)f is the correlation of feature f with the domain i, and
“domain” refers to the arousal or valence annotation of a certaindata set. We only consider the CDCC across the data sets (speech,music, and sound), not CDCC across arousal and valence.
Table 2 | ComParE acoustic feature set: 64 provided low-level
descriptors (LLD).
Group
4 ENERGY RELATED LLD
Sum of auditory spectrum (loudness) Prosodic
Sum of RASTA-style filtered auditory spectrum Prosodic
RMS energy, zero-crossing rate Prosodic
55 SPECTRAL LLD
RASTA-style auditory spectrum, bands 1–26 (0–8 kHz) Spectral
MFCC 1–14 Cepstral
Spectral energy 250–650 Hz, 1 k–4 kHz Spectral
Spectral roll off point 0.25, 0.50, 0.75, 0.90 Spectral
Spectral flux, centroid, entropy, slope Spectral
Psychoacoustic sharpness, harmonicity Spectral
Spectral variance, skewness, kurtosis Spectral
6 VOICING RELATED LLD
F 0 (SHS and viterbi smoothing) Prosodic
Prob. of voice Sound quality
Log. HNR, Jitter (local, delta), Shimmer (local) Sound quality
Table 3 | ComParE acoustic feature set: functionals applied to LLD
contours (Table 2).
Group
FUNCTIONALS APPLIEDTO LLD/1 LLD
Quartiles 1–3, 3 inter-quartile ranges Percentiles
1% Percentile (≈min), 99% percentile (≈max) Percentiles
Percentile range 1–99% Percentiles
Position of min/max, range (max−min) Temporal
Arithmetic mean1, root quadratic mean Moments
Contour centroid, flatness Temporal
Standard deviation, skewness, kurtosis Moments
Rel. duration LLD is above 25/50/75/90% range Temporal
Rel. duration LLD is rising Temporal
Rel. duration LLD has positive curvature Temporal
Gain of linear prediction (LP), LP coefficients 1–5 Modulation
Mean, max, min, SD of segment length2 Temporal
FUNCTIONALS APPLIEDTO LLD ONLY
Mean value of peaks Peaks
Mean value of peaks – arithmetic mean Peaks
Mean/SD of inter peak distances Peaks
Amplitude mean of peaks, of minima Peaks
Amplitude range of peaks Peaks
Mean/SD of rising/falling slopes Peaks
Linear regression slope, offset, quadratic error Regression
Quadratic regression a, b, offset, quadratic error Regression
Percentage of non-zero frames3 Temporal
1Arithmetic mean of LLD/positive1 LLD. 2Not applied to voice related LLD except
F0. 3Only applied to F0.
It is obvious that the CDCC measure is symmetric in the sensethat CDCC2
f ,i,j = CDCC2f ,j ,i , and that it ranges from −1 to 1.
If a feature f exhibits either strong positive or strong negative
www.frontiersin.org May 2013 | Volume 4 | Article 292 | 5

Weninger et al. Acoustics of emotion in audio
correlation with both domains, the CDCC will be near one, whereas it will be near −1 if a feature is strongly positively correlatedwith one domain yet strongly negatively correlated with the other.A CDCC near zero indicates that the feature is not significantlycorrelated with both domains (although it might still be corre-lated with either one). Thus, we can expect a regressor to showsimilar performance on both domains if it uses features with highCDCC.
Next, we generalize the CDCC2 to J domains by summing upthe CDCCs for domain pairs and normalizing to the range from−1 to+1,
CDCCJf =
∑Ji=1
∑Jj=i+1
(∣∣∣r (i)f + r(j)f
∣∣∣− ∣∣∣r (i)f − r (i)f
∣∣∣)J (J − 1)
. (3)
Intuitively, a regression function determined on features withhigh CDCC J
f is expected to generalize well to all J domains.
In Tables 4 and 5, we now exemplify the CDCC3 across thethree domains on selected features, along with presenting theircorrelation on the individual domains. Note that for the purposeof feature selection, we treat the union of VAM and GEMEP asa single domain (“speech”). Further, in our analysis we restrictourselves to those features that exhibit high (absolute) correla-tion in a single domain (termed sound, speech, or music featuresin the table), and those with high CDCC3 (termed cross-domainfeatures). Thereby we do not present an exhaustive list of the topfeatures but rather a selection aiming at broad coverage of featuretypes. To test the significance of the correlations, we use t-testswith the null hypothesis that feature and rating are sampled fromindependent normal distributions. Two-sided tests are used sincewe are interested in discovering both negative and positive corre-lations. Significance levels are adjusted by Bonferroni correction,which is conservative, yet straightforward and does not requireindependence of the individual error probabilities.
Looking at the top sound arousal features (Table 4), we findloudness to be most relevant – in particular, the (root qua-dratic) mean, the linear regression offset (corresponding to a“floor value”) and the 99-percentile. This is similar to the rank-ing for speech. Interestingly, loudness is stronger correlated thanRMS energy, indicating the importance of perceptual auditory fre-quency weighting as performed in our loudness calculation. Formusic, these three loudness features are not as relevant, thoughstill significantly correlated.
The overall best speech arousal feature is the root quadraticmean of spectral flux – indicating large differences of consecutiveshort-time spectra – which is interesting since it is independentof loudness and energy, which have slightly lower correlation (cf.above). The “second derivative” of the short-time spectra (arith-metic mean of 1 spectral flux) behaves in a similar fashion asspectral flux itself. However, the correlation of these features witharousal in sound and music is lower. Further, we find changes inthe higher order MFCCs, such as the root quadratic mean of deltaMFCC 14 to be relevant for speech and music arousal, relating toquick changes in phonetic content and timbre. Finally, mean F0,a “typical” speech feature characteristic for high arousal, is foundto be relevant as expected, but does not generalize to the otherdomains.
The best music arousal features are related to mean peak dis-tances – for example, in the loudness contour and the spectralentropy contour resembling occurrence of percussive instruments,indicating positive correlation between tempo and arousal. In con-trast, the peak distance standard deviation is negatively correlatedwith arousal – thus, it seems that “periodic” pieces of music aremore aroused, which can be explained by examples such as dancemusic. However, it seems that all these three features have a mostlymusical meaning, since they only show weak correlations in soundand speech. Yet, a notable feature uniting speech and music isthe (root quadratic) mean of the first MFCC, which is relatedto spectral skewness: arguably, a bias toward lower frequencies(high skewness) is indicative of absence of broadband (mostlypercussive) instruments, and “calm” voices, and thus low arousal.
Summarizing cross-domain features for arousal, we find thatthe“greatest common divisor”of speech, sound, and music is loud-ness (and – relatedly – energy), but the behavior of functional typesis interesting: the quadratic regression offset is much more rele-vant in the case of music than the mean loudness, which is mostlycharacteristic in speech and sound. In the NTWICM database ofpopular music, in fact we often find parabola shaped loudnesscontours, such that this offset indicates the intensity of the musi-cal climax. A suitable cross-domain feature not directly related toloudness or energy is the spectral flux quadratic regression offset(the ordinate of the “high point” of spectral change).
Judging from the results in Table 5, we see that loudness is alsoindicative of valence in sound, music, and speech, but the cor-relations have different signs: on the one hand, loud sounds asidentified by high root quadratic mean of loudness are apparentlyperceived as unpleasant, as are loud voices. For music, on the otherhand, loudness can be indicative of high valence (“happy” music).
Among relevant speech valence features, we find mean energy(change) in the speech frequency range (1–4 kHz) and F0 (quar-tiles 1 and 2) – F0,however, is a“speech only”feature which exhibitslow correlation in the other domains (similarly to the observationsfor arousal above).
Music valence features overlap with music arousal features, dueto the correlation in the ratings. Among the music valence fea-tures, the median first MFCC (related to spectral skewness – cf.above) is particularly noticeable as it has “inverse” correlation onspeech and music – “percussive” music with a flat spectrum is con-notated with positive emotion (high valence) while “noisy” voicesare characteristic of negative emotion (low valence).
Cross-domain features for valence are generally rarely signifi-cant on the individual domains and hard to interpret – here, incontrast to arousal, it seems difficult to obtain descriptors thatgeneralize across multiple domains.
We now move from discussion of single features to a broaderperspective on automatic feature selection for cross-domain emo-tion recognition. To this end, we consider automatically selectedsubsets of the ComParE feature set by the CDCC criteria. In par-ticular, for each of arousal and valence, we choose the 200 featuresthat show the highest CDCC2 for the (sound, music), (sound,speech), and (music, speech) pairs of domains. Furthermore, foreach of arousal and valence, we select a set of 200 features byhighest CDCC3 across all three of the sound, music, and speechdomains.
Frontiers in Psychology | Emotion Science May 2013 | Volume 4 | Article 292 | 6

Weninger et al. Acoustics of emotion in audio
Table 4 | Cross-domain feature relevance for arousal: top features ranked by absolute correlation (r ) for single domain, and CDCC across all
three domains (CDCC3).
Rank LLD Functional r CDCC3
Sound Music Speech
SOUND FEATURES
1 Loudness R.q. mean 0.59** 0.16** 0.75** 0.31
4 Loudness Lin. regr. offset 0.54** 0.27** 0.56** 0.36
6 Loudness 99-Percentile 0.53** 0.09 ° 0.67** 0.23
8 Energy R.q. mean 0.50** 0.07− 0.64** 0.21
SPEECH FEATURES
1 Spectral flux R.q. mean 0.38** 0.13** 0.76** 0.21
9 1 Spectral flux Arith. mean 0.25* 0.28** 0.68** 0.26
63 1 MFCC 14 R.q. mean 0.14− 0.32** 0.58** 0.20
97 F0 R.q. mean 0.17− 0.09o 0.55** 0.12
MUSIC FEATURES
1 Loudness Mean peak dist. 0.02− –0.58** –0.08− 0.01
2 Spectral ent. Mean peak dist. 0.04− –0.54** –0.16** 0.03
3 Loudness Peak dist. SD 0.02− –0.53** –0.10− 0.02
5 MFCC 1 R.q. mean –0.11− –0.53** –0.47** 0.23
CROSS-DOMAIN FEATURES
1 Loudness Quad.reg. offset 0.41** 0.37** 0.37** 0.37
4 Loudness Arith. mean 0.57** 0.18** 0.73** 0.31
5 Spectral flux Quad. reg. offset 0.32** 0.30** 0.45** 0.31
6 1 Energy 1–4 kHz Quartile 1 –0.32** –0.30** –0.59** 0.31
Significance denoted by **p<0.00, *p<0.01, °p<0.05, −p≥0.05; Bonferroni corrected p-values from two-sided paired sample t-tests.
Table 5 | Cross-domain feature relevance for valence: top features ranked by absolute correlation (r ) for single domain, and CDCC across all
three domains (CDCC3).
Rank LLD Functional r CDCC3
Sound Music Speech
SOUND FEATURES
1 Loudness Quartile 3 –0.31** 0.27** –0.21** –0.09
2 Loudness Rise time –0.30** –0.21** –0.04− 0.10
3 Loudness R.q. mean –0.29** 0.29** –0.23** –0.10
10 Spectral flux Skewness 0.27** –0.13** 0.11− –0.04
SPEECH FEATURES
1 F0 Quartile 2 0.05− –0.07− –0.31** –0.01
2 Energy 1–4 kHz Arith. mean –0.17− 0.23** –0.31** –0.07
4 1 Energy 1–4 kHz Arith. mean –0.08− 0.26** –0.30** –0.09
10 F0 Quartile 1 0.07− –0.14** –0.29** 0.00
MUSIC FEATURES
1 1 Loudness Mean peak dist. –0.02− –0.65** –0.03− 0.02
2 Loudness Mean peak dist. –0.12− –0.65** –0.04− 0.06
3 MFCC 1 Quartile 2 –0.04− –0.61** 0.24** –0.08
9 Spectral ent. Mean peak dist. 0.05− –0.57** 0.04− –0.02
CROSS-DOMAIN FEATURES
1 Spect. centroid Rise time –0.13− –0.16** –0.12− 0.12
2 Psy. sharpness Rise time –0.13− –0.16** –0.12− 0.12
5 Energy 250–650 Hz IQR 1–3 –0.14− –0.11** –0.15* 0.12
6 MFCC 13 IQR 1–3 –0.08− –0.20** –0.18** 0.12
Significance denoted by **p<0.001, *p<0.01, op<0.05), −p≥0.05; Bonferroni corrected p-values from two-sided paired sample t-tests.
www.frontiersin.org May 2013 | Volume 4 | Article 292 | 7
Weninger et al. Acoustics of emotion in audio
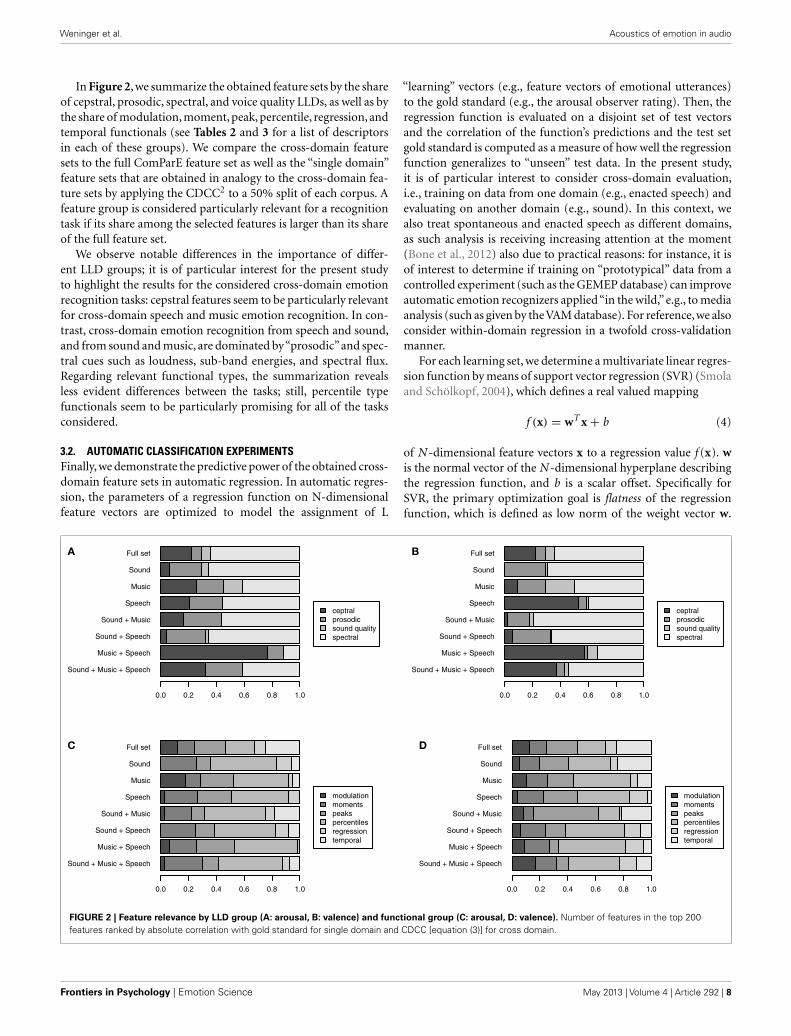
In Figure 2, we summarize the obtained feature sets by the shareof cepstral, prosodic, spectral, and voice quality LLDs, as well as bythe share of modulation, moment, peak, percentile, regression, andtemporal functionals (see Tables 2 and 3 for a list of descriptorsin each of these groups). We compare the cross-domain featuresets to the full ComParE feature set as well as the “single domain”feature sets that are obtained in analogy to the cross-domain fea-ture sets by applying the CDCC2 to a 50% split of each corpus. Afeature group is considered particularly relevant for a recognitiontask if its share among the selected features is larger than its shareof the full feature set.
We observe notable differences in the importance of differ-ent LLD groups; it is of particular interest for the present studyto highlight the results for the considered cross-domain emotionrecognition tasks: cepstral features seem to be particularly relevantfor cross-domain speech and music emotion recognition. In con-trast, cross-domain emotion recognition from speech and sound,and from sound and music, are dominated by“prosodic”and spec-tral cues such as loudness, sub-band energies, and spectral flux.Regarding relevant functional types, the summarization revealsless evident differences between the tasks; still, percentile typefunctionals seem to be particularly promising for all of the tasksconsidered.
3.2. AUTOMATIC CLASSIFICATION EXPERIMENTSFinally, we demonstrate the predictive power of the obtained cross-domain feature sets in automatic regression. In automatic regres-sion, the parameters of a regression function on N-dimensionalfeature vectors are optimized to model the assignment of L
“learning” vectors (e.g., feature vectors of emotional utterances)to the gold standard (e.g., the arousal observer rating). Then, theregression function is evaluated on a disjoint set of test vectorsand the correlation of the function’s predictions and the test setgold standard is computed as a measure of how well the regressionfunction generalizes to “unseen” test data. In the present study,it is of particular interest to consider cross-domain evaluation,i.e., training on data from one domain (e.g., enacted speech) andevaluating on another domain (e.g., sound). In this context, wealso treat spontaneous and enacted speech as different domains,as such analysis is receiving increasing attention at the moment(Bone et al., 2012) also due to practical reasons: for instance, it isof interest to determine if training on “prototypical” data from acontrolled experiment (such as the GEMEP database) can improveautomatic emotion recognizers applied“in the wild,” e.g., to mediaanalysis (such as given by the VAM database). For reference, we alsoconsider within-domain regression in a twofold cross-validationmanner.
For each learning set, we determine a multivariate linear regres-sion function by means of support vector regression (SVR) (Smolaand Schölkopf, 2004), which defines a real valued mapping
f (x) = wT x+ b (4)
of N -dimensional feature vectors x to a regression value f (x). wis the normal vector of the N -dimensional hyperplane describingthe regression function, and b is a scalar offset. Specifically forSVR, the primary optimization goal is flatness of the regressionfunction, which is defined as low norm of the weight vector w.
Sound + Music + Speech
Music + Speech
Sound + Speech
Sound + Music
Speech
Music
Sound
Full set
0.0 0.2 0.4 0.6 0.8 1.0
ceptral
prosodic
sound quality
spectral
Sound + Music + Speech
Music + Speech
Sound + Speech
Sound + Music
Speech
Music
Sound
Full set
0.0 0.2 0.4 0.6 0.8 1.0
ceptral
prosodic
sound quality
spectral
Sound + Music + Speech
Music + Speech
Sound + Speech
Sound + Music
Speech
Music
Sound
Full set
0.0 0.2 0.4 0.6 0.8 1.0
modulation
moments
peaks
percentiles
regression
temporal
Sound + Music + Speech
Music + Speech
Sound + Speech
Sound + Music
Speech
Music
Sound
Full set
0.0 0.2 0.4 0.6 0.8 1.0
modulation
moments
peaks
percentiles
regression
temporal
A B
C D
FIGURE 2 | Feature relevance by LLD group (A: arousal, B: valence) and functional group (C: arousal, D: valence). Number of features in the top 200features ranked by absolute correlation with gold standard for single domain and CDCC [equation (3)] for cross domain.
Frontiers in Psychology | Emotion Science May 2013 | Volume 4 | Article 292 | 8

Weninger et al. Acoustics of emotion in audio
This is related to the notion of sparsity and crucial to avoidover-fitting of the model parameters in the present case of highdimensional feature spaces. The trade-off between flatness of theweight vector and deviation of the regression values from the goldstandard on the learning set is modeled as a free parameter C inthe optimization (cf. Smola and Schölkopf, 2004 for details). Inour experiments, C is set to 10−3 for within-domain regressionand 10−5 for cross-domain regression. The optimization problemis solved by the frequently used Sequential Minimal Optimizationalgorithm (Platt, 1999). To foster reproducibility of our research,we use the open-source machine learning toolkit Weka (Hall et al.,2009). Unsupervised mean and variance normalization of eachfeature per database is applied since SVR is sensitive to featurescaling.
In Table 6, the correlation coefficients (r) of automatic within-domain and cross-domain regression with the arousal observerratings are displayed. First, we consider regression using the full6373-dimensional ComParE feature set. In within-domain regres-sion, results ranging from r = 0.54 (sound) up to r = 0.85 (enactedspeech) are obtained, which are comparable to previously obtainedresults on sound, music, and spontaneous speech (Grimm et al.,2007b; Schuller et al., 2011b, 2012). Especially the result for musicis notable, since we do not use any “hand-crafted” music featuressuch as chords or tempo. In cross-domain regression, significantcorrelations are obtained except for the case of training on musicand evaluating on sound. However, the mean r across all trainingand testing conditions (0.50) is rather low.
Considering automatic feature selection by CDCC2 for eachcombination of two domains, results in Table 6B indicate a drasticgain in performance especially for cross-domain regression. How-ever, also the results in within-domain regression are improved.All correlations are significant at the 0.1% level. Particularly,using CDCC based feature selection robust regression (achiev-ing r > 0.76) is possible across enacted and spontaneous speech.Further, it is notable that the average result across the four testingdatabases does not vary much depending on the training data-base used, indicating good generalization capability of the selectedfeatures. The overall mean r in this scenario is 0.65.
Finally, if we select the top features by CDCC3 on all databases(treating speech as a single domain for the purpose of feature selec-tion), it is notable that we still obtain reasonable results (mean rof 0.58) despite the fact that the top features by CDCC3 exhibitcomparably low correlation with the target labels on the singledomains (cf. Table 4).
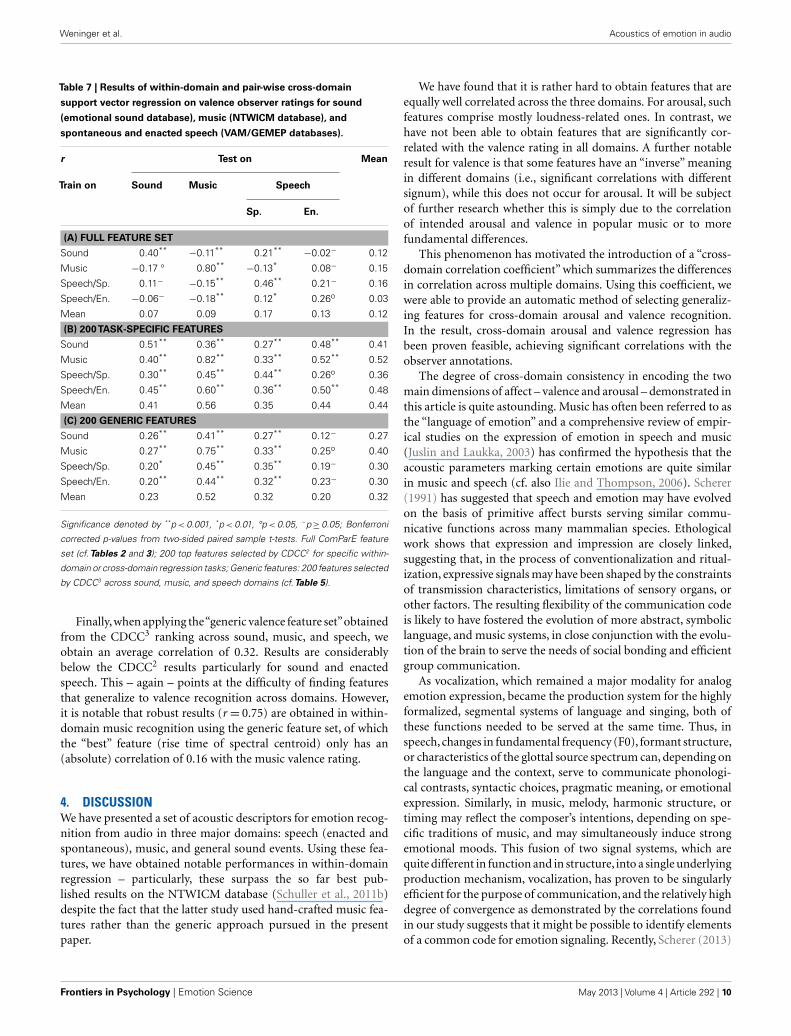
Summarizing the results for valence regression (Table 7), weobserve that using the full feature set, we cannot obtain reason-able results in cross-domain regression. Among the cross-domainresults, the only significant positive correlations are obtained inevaluation on spontaneous speech, however, these are lower thanthe correlation of the single best speech features. Interestingly, weobserve significant negative correlations when evaluating on musicand training on another domain, which is consistent with the factthat some of the music valence features are “inversely” correlatedwith the target label in the other domains (cf., e.g., the discussionof median MFCC 1 above). In the within-domain setting, it can beobserved that regression on valence in music is possible with highrobustness (r = 0.80). This is all the more noticeable since this
Table 6 | Results of within-domain and pair-wise cross-domain
support vector regression on arousal observer ratings for sound
(emotional sound database), music (NTWICM database), and
spontaneous and enacted speech (VAM/GEMEP databases).
r Test on Mean
Train on Sound Music Speech
Sp. En.
(A) FULL FEATURE SET
Sound 0.54** 0.14** 0.70** 0.64** 0.51
Music 0.11− 0.65** 0.46** 0.39** 0.40
Speech/Sp. 0.38** 0.37** 0.81** 0.80** 0.59
Speech/En. 0.20* 0.32** 0.60** 0.85** 0.49
Mean 0.30 0.37 0.64 0.67 0.50
(B) 200TASK-SPECIFIC FEATURES
Sound 0.59** 0.46** 0.76** 0.79** 0.65
Music 0.46** 0.67** 0.73** 0.75** 0.65
Speech/Sp. 0.54** 0.47** 0.83** 0.78** 0.66
Speech/En. 0.56** 0.46** 0.77** 0.85** 0.66
Mean 0.54 0.52 0.77 0.79 0.65
(C) 200 GENERIC FEATURES
Sound 0.56** 0.35** 0.78** 0.56** 0.56
Music 0.38** 0.66** 0.74** 0.63** 0.60
Speech/Sp. 0.44** 0.43** 0.82** 0.69** 0.59
Speech/En. 0.31** 0.45** 0.77** 0.78** 0.58
Mean 0.42 0.47 0.78 0.67 0.58
Significance denoted by **p<0.001, *p<0.01, −p≥0.05; Bonferroni corrected
p-values from two-sided paired sample t-tests. Full ComParE feature set (cf.
Tables 2 and 3); 200 top features selected by CDCC2 for specific within-domain
or cross-domain regression tasks; Generic features: 200 features selected by
CDCC3 across sound, music, and speech domains (cf.Table 4).
correlation is higher than the one obtained in arousal regression,while for the other domains, valence seems to be harder to rec-ognize than arousal. This can partly be attributed to the fact thatin the analyzed music data, the valence rating is correlated to thearousal rating.
Concerning feature selection by CDCC2 (Table 7B), we observea boost in the obtained correlations (mean= 0.44, compared to0.12 without feature selection). For instance, when training onenacted speech and evaluating on music, we obtain a signifi-cant r of 0.60. This result is interesting in so far as the bestselected feature for this particular cross-domain setting, namelythe flatness of the loudness contour, only exhibits a correlation of0.28, respectively 0.27, with the valence rating on the NTWICM(music) and GEMEP (enacted speech) databases. Thus, the 200CDCC2-selected features for this regression task seem to be ofcomplementary nature. Furthermore, by applying feature selec-tion in the within-domain setting, best results are obtained forsound (r = 0.51), music (r = 0.82), and enacted speech (r = 0.50)valence recognition. However, regarding the issue of enacted vs.spontaneous speech, we find that regressors trained on one type donot generalize well to the other, which is in contrast to the findingfor arousal.
www.frontiersin.org May 2013 | Volume 4 | Article 292 | 9
Weninger et al. Acoustics of emotion in audio
Table 7 | Results of within-domain and pair-wise cross-domain
support vector regression on valence observer ratings for sound
(emotional sound database), music (NTWICM database), and
spontaneous and enacted speech (VAM/GEMEP databases).
r Test on Mean
Train on Sound Music Speech
Sp. En.
(A) FULL FEATURE SET
Sound 0.40**−0.11** 0.21**
−0.02− 0.12
Music −0.17 ° 0.80**−0.13* 0.08− 0.15
Speech/Sp. 0.11− −0.15** 0.46** 0.21− 0.16
Speech/En. −0.06− −0.18** 0.12* 0.26o 0.03
Mean 0.07 0.09 0.17 0.13 0.12
(B) 200TASK-SPECIFIC FEATURES
Sound 0.51** 0.36** 0.27** 0.48** 0.41
Music 0.40** 0.82** 0.33** 0.52** 0.52
Speech/Sp. 0.30** 0.45** 0.44** 0.26o 0.36
Speech/En. 0.45** 0.60** 0.36** 0.50** 0.48
Mean 0.41 0.56 0.35 0.44 0.44
(C) 200 GENERIC FEATURES
Sound 0.26** 0.41** 0.27** 0.12− 0.27
Music 0.27** 0.75** 0.33** 0.25o 0.40
Speech/Sp. 0.20* 0.45** 0.35** 0.19− 0.30
Speech/En. 0.20** 0.44** 0.32** 0.23− 0.30
Mean 0.23 0.52 0.32 0.20 0.32
Significance denoted by **p< 0.001, *p<0.01, °p<0.05, −p≥0.05; Bonferroni
corrected p-values from two-sided paired sample t-tests. Full ComParE feature
set (cf. Tables 2 and 3); 200 top features selected by CDCC2 for specific within-
domain or cross-domain regression tasks; Generic features: 200 features selected
by CDCC3 across sound, music, and speech domains (cf.Table 5).
Finally,when applying the“generic valence feature set”obtainedfrom the CDCC3 ranking across sound, music, and speech, weobtain an average correlation of 0.32. Results are considerablybelow the CDCC2 results particularly for sound and enactedspeech. This – again – points at the difficulty of finding featuresthat generalize to valence recognition across domains. However,it is notable that robust results (r = 0.75) are obtained in within-domain music recognition using the generic feature set, of whichthe “best” feature (rise time of spectral centroid) only has an(absolute) correlation of 0.16 with the music valence rating.
4. DISCUSSIONWe have presented a set of acoustic descriptors for emotion recog-nition from audio in three major domains: speech (enacted andspontaneous), music, and general sound events. Using these fea-tures, we have obtained notable performances in within-domainregression – particularly, these surpass the so far best pub-lished results on the NTWICM database (Schuller et al., 2011b)despite the fact that the latter study used hand-crafted music fea-tures rather than the generic approach pursued in the presentpaper.
We have found that it is rather hard to obtain features that areequally well correlated across the three domains. For arousal, suchfeatures comprise mostly loudness-related ones. In contrast, wehave not been able to obtain features that are significantly cor-related with the valence rating in all domains. A further notableresult for valence is that some features have an “inverse” meaningin different domains (i.e., significant correlations with differentsignum), while this does not occur for arousal. It will be subjectof further research whether this is simply due to the correlationof intended arousal and valence in popular music or to morefundamental differences.
This phenomenon has motivated the introduction of a “cross-domain correlation coefficient” which summarizes the differencesin correlation across multiple domains. Using this coefficient, wewere able to provide an automatic method of selecting generaliz-ing features for cross-domain arousal and valence recognition.In the result, cross-domain arousal and valence regression hasbeen proven feasible, achieving significant correlations with theobserver annotations.
The degree of cross-domain consistency in encoding the twomain dimensions of affect – valence and arousal – demonstrated inthis article is quite astounding. Music has often been referred to asthe “language of emotion” and a comprehensive review of empir-ical studies on the expression of emotion in speech and music(Juslin and Laukka, 2003) has confirmed the hypothesis that theacoustic parameters marking certain emotions are quite similarin music and speech (cf. also Ilie and Thompson, 2006). Scherer(1991) has suggested that speech and emotion may have evolvedon the basis of primitive affect bursts serving similar commu-nicative functions across many mammalian species. Ethologicalwork shows that expression and impression are closely linked,suggesting that, in the process of conventionalization and ritual-ization, expressive signals may have been shaped by the constraintsof transmission characteristics, limitations of sensory organs, orother factors. The resulting flexibility of the communication codeis likely to have fostered the evolution of more abstract, symboliclanguage, and music systems, in close conjunction with the evolu-tion of the brain to serve the needs of social bonding and efficientgroup communication.
As vocalization, which remained a major modality for analogemotion expression, became the production system for the highlyformalized, segmental systems of language and singing, both ofthese functions needed to be served at the same time. Thus, inspeech, changes in fundamental frequency (F0), formant structure,or characteristics of the glottal source spectrum can, depending onthe language and the context, serve to communicate phonologi-cal contrasts, syntactic choices, pragmatic meaning, or emotionalexpression. Similarly, in music, melody, harmonic structure, ortiming may reflect the composer’s intentions, depending on spe-cific traditions of music, and may simultaneously induce strongemotional moods. This fusion of two signal systems, which arequite different in function and in structure, into a single underlyingproduction mechanism, vocalization, has proven to be singularlyefficient for the purpose of communication, and the relatively highdegree of convergence as demonstrated by the correlations foundin our study suggests that it might be possible to identify elementsof a common code for emotion signaling. Recently, Scherer (2013)
Frontiers in Psychology | Emotion Science May 2013 | Volume 4 | Article 292 | 10

Weninger et al. Acoustics of emotion in audio
has reviewed theoretical proposals and empirical evidence in theliterature that help to establish the plausibility of this claim, in par-ticular, the evolutionary continuity of affect vocalizations, showingthat anatomical structures for complex vocalizations existed beforethe evidence for the presence of representational systems such aslanguage.
As to the cross-domain consistency with different kinds of envi-ronmental sounds, it seems quite plausible to assume that oncespeech and music were decoupled from actually occurring affectbursts and took on representational functions, different kinds ofnature sounds were used in speech and music both for referenceto external events and expressive functions. It seems reasonable toassume that the type of representational coding was informed by
the prior, psychobiological affect code, particularly with respect tothe fundamental affect dimensions of valence and arousal.
Empirical studies like the one reported here, using machinelearning approaches, may complement other approaches to exam-ine the evolutionary history of affect expression in speech andmusic by empirically examining, using large corpora of differ-ent kinds of sound events, the extent to which auditory domainsexhibit cross-domain consistency and which common patterns areparticularly frequent.
ACKNOWLEDGMENTSThis study has received funding from the European Commission(grant no. 289021, ASC-Inclusion).
REFERENCESBänziger, T., Mortillaro, M., and Scherer,
K. R. (2012). Introducing theGeneva multimodal expression cor-pus for experimental research onemotion perception. Emotion 12,1161–1179. doi:10.1037/a0025827
Bone, D., Lee, C.-C., and Narayanan,S. (2012). “A robust unsupervisedarousal rating framework usingprosody with cross-corpora evalua-tion,” in Proceeding of the Interspeech(Portland, OR: ISCA).
Burkhardt, F., Paeschke, A., Rolfes,M., Sendlmeier, W., and Weiss, B.(2005). “A database of Germanemotional speech,” in Proceedingof the Interspeech (Lisbon: ISCA),1517–1520.
Daido, R., Hahm, S., Ito, M., Makino,S., and Ito, A. (2011). “A system forevaluating singing enthusiasm forkaraoke,” in Proceeding of the ISMIR(Miami, FL: International Societyfor Music Information Retrieval),31–36.
Davis, S. B., and Mermelstein, P.(1980). Comparison of parametricrepresentations for monosyllabicword recognition in continu-ously spoken sentences. IEEETrans. Acoust. 28, 357–366.doi:10.1109/TASSP.1980.1163420
Drossos, K., Floros, A., and Kanel-lopoulos, N.-G. (2012). “Affectiveacoustic ecology: towards emotion-ally enhanced sound events,” in Pro-ceedings of the 7th Audio Mostly Con-ference: A Conference on Interactionwith Sound (New York, NY: ACM),109–116.
Fontaine, J., Scherer, K. R., Roesch,E., and Ellsworth, P. (2007). Theworld of emotion is not two-dimensional. Psychol. Sci. 18,1050–1057. doi:10.1111/j.1467-9280.2007.02024.x
Grimm, M., and Kroschel, K. (2005).“Evaluation of natural emotionsusing self assessment manikins,” in
Proceeding of the ASRU (Cancún:IEEE), 381–385.
Grimm, M., Kroschel, K., Mower,E., and Narayanan, S. (2007a).Primitives-based evaluation andestimation of emotions in speech.Speech Commun. 49, 787–800.doi:10.1016/j.specom.2007.01.010
Grimm, M., Kroschel, K., andNarayanan, S. (2007b). “Sup-port vector regression for automaticrecognition of spontaneous emo-tions in speech,” in Proceeding ofthe International Conference onAcoustics, Speech and Signal Process-ing (ICASSP), Vol. IV (Honolulu,HI: IEEE), 1085–1088.
Grimm, M., Kroschel, K., andNarayanan, S. (2008). “The Veraam Mittag German audio-visualemotional speech database,” inProceeding of the IEEE InternationalConference on Multimedia andExpo (ICME) (Hannover: IEEE),865–868.
Hall, M., Frank, E., Holmes, G.,Pfahringer, B., Reutemann, P.,and Witten, I. H. (2009). TheWEKA data mining software: anupdate. SIGKDD Explor. 11, 10–18.doi:10.1145/1656274.1656278
Hu, X., Downie, J. S., Laurier, C., Bay, M.,and Ehmann,A. F. (2008).“The 2007MIREX audio mood classificationtask: lessons learned,” in Proceedingof the ISMIR (Philadelphia: Interna-tional Society for Music InformationRetrieval), 462–467.
Ilie, G., and Thompson, W. F.(2006). A comparison of acousticcues in music and speech forthree dimensions of affect.Music Percept. 23, 319–329.doi:10.1525/mp.2006.23.4.319
Juslin, P. N., and Laukka, P. (2003).Communication of emotions invocal expression and music per-formance: different channels, samecode? Psychol. Bull. 129, 770–814.doi:10.1037/0033-2909.129.5.770
McKeown, G., Valstar, M., Cowie, R.,Pantic, M., and Schröder, M. (2012).The SEMAINE database: annotatedmultimodal records of emotion-ally colored conversations betweena person and a limited agent.IEEE Trans. Affect. Comput. 3, 5–17.doi:10.1109/T-AFFC.2011.20
Mortillaro, M., Meuleman, B., andScherer, K. R. (2012). Advocatinga componential appraisal modelto guide emotion recognition.Int. J. Synth. Emot. 3, 18–32.doi:10.4018/jse.2012010102
Nilsonne, A., and Sundberg, J. (1985).Differences in ability of musi-cians and nonmusicians to judgeemotional state from the funda-mental frequency of voice sam-ples. Music Percept. 2, 507–516.doi:10.2307/40285316
Peeters, G. (2004). A Large Set of AudioFeatures for Sound Description. Tech-nical Report. Paris: IRCAM.
Platt, J. C. (1999). “Fast trainingof support vector machines usingsequential minimal optimization,”in Advances in Kernel Methods: Sup-port Vector Learning (Cambridge,MA: MIT Press), 185–208.
Rice, S. V., and Bailey, S. M. (2005). “Aweb search engine for sound effects,”in Proceeding of the 119th Confer-ence of the Audio Engineering Society(AES) (New York: Audio Engineer-ing Society).
Scherer, K. R. (1991). “Emotion expres-sion in speech and music,” inMusic, Language, Speech, and Brain,eds J. Sundberg, L. Nord, andR. Carlson (London: Macmillan),146–156.
Scherer, K. R. (2013). “Emotion inaction, interaction, music, andspeech,” in Language, Music, and theBrain: A Mysterious Relationship, ed.M. Arbib (Cambridge, MA: MITPress), 107–139.
Scherer, K. R., Johnstone, T., and Klas-meyer, G. (2003). “Vocal expression
of emotion,” in Handbook of AffectiveSciences, eds R. J. Davidson, K.R. Scherer, and H. H. Goldsmith(Oxford, NY: Oxford UniversityPress), 433–456.
Schuller, B., Batliner, A., Steidl, S.,and Seppi, D. (2011a). Recognis-ing realistic emotions and affect inspeech: state of the art and lessonslearnt from the first challenge.Speech Commun. 53, 1062–1087.doi:10.1016/j.specom.2011.01.011
Schuller, B., Weninger, F., and Dorfner,J. (2011b). “Multi-modal non-prototypical music mood analy-sis in continuous space: reliabilityand performances,” in Proceedings12th International Society for MusicInformation Retrieval Conference,ISMIR 2011 (Miami, FL: ISMIR),759–764.
Schuller, B., Dorfner, J., and Rigoll,G. (2010). Determination of non-prototypical valence and arousalin popular music: features andperformances. EURASIP J. AudioSpeech Music Process. 2010:735854.doi:10.1186/1687-4722-2010-735854
Schuller, B., Hantke, S., Weninger, F.,Han, W., Zhang, Z., and Narayanan,S. (2012). “Automatic recognitionof emotion evoked by generalsound events,” in Proceedings 37thIEEE International Conference onAcoustics, Speech, and Signal Pro-cessing, ICASSP 2012 (Kyoto: IEEE),341–344.
Schuller, B., Steidl, S., and Batliner, A.(2009). “The INTERSPEECH 2009emotion challenge,” in Proceedingof the Interspeech (Brighton: ISCA),312–315.
Schuller, B., Steidl, S., Batliner, A., Vin-ciarelli, A., Scherer, K., Ringeval,F., et al. (2013). “The INTER-SPEECH 2013 computational par-alinguistics challenge: social signals,conflict, emotion, autism,” in Pro-ceedings INTERSPEECH 2013, 14th
www.frontiersin.org May 2013 | Volume 4 | Article 292 | 11

Weninger et al. Acoustics of emotion in audio
Annual Conference of the Interna-tional Speech Communication Asso-ciation (Lyon: ISCA).
Smola, A., and Schölkopf, B. (2004). Atutorial on support vector regres-sion. Stat. Comput. 14, 199–222.doi:10.1023/B:STCO.0000035301.49549.88
Steidl, S. (2009). Automatic Classifica-tion of Emotion-Related User Statesin Spontaneous Children’s Speech.Berlin: Logos Verlag.
Sundaram, S., and Schleicher,R. (2010). “Towards evalua-tion of example-based audioretrieval system using affectivedimensions,” in Proceeding ofthe ICME (Singapore: IEEE),573–577.
Thompson, W. F., Schellenberg,E. G., and Husain, G. (2004).Decoding speech prosody: do musiclessons help? Emotion 4, 46–64.doi:10.1037/1528-3542.4.1.46
Ververidis, D., and Kotropoulos,C. (2006). Emotional speechrecognition: resources, fea-tures, and methods. SpeechCommun. 48, 1162–1181.doi:10.1016/j.specom.2006.04.003
Yang, Y.-H., and Chen, H.-H. (2012).Machine recognition of musicemotion: a review. ACM Trans.Intell. Syst. Technol. 3, 1–30.doi:10.1145/2168752.2168754
Young, S. J., Evermann, G., Gales,M. J. F., Hain, T., Kershaw, D.,Liu, X., et al. (2006). The HTK
Book, Version 3.4.1. Cambridge:Cambridge University EngineeringDepartment.
Zwicker, E., and Fastl, H. (1999). Psy-choacoustics – Facts and Models. Hei-delberg: Springer.
Conflict of Interest Statement: Theauthors declare that the research wasconducted in the absence of any com-mercial or financial relationships thatcould be construed as a potential con-flict of interest.
Received: 28 March 2013; paper pend-ing published: 15 April 2013; accepted:06 May 2013; published online: 27 May2013.
Citation: Weninger F, Eyben F, SchullerBW, Mortillaro M and Scherer KR(2013) On the acoustics of emotion inaudio: what speech, music, and soundhave in common. Front. Psychol. 4:292.doi: 10.3389/fpsyg.2013.00292This article was submitted to Frontiers inEmotion Science, a specialty of Frontiersin Psychology.Copyright © 2013 Weninger, Eyben,Schuller , Mortillaro and Scherer . This isan open-access article distributed underthe terms of the Creative Commons Attri-bution License, which permits use, distri-bution and reproduction in other forums,provided the original authors and sourceare credited and subject to any copy-right notices concerning any third-partygraphics etc.
Frontiers in Psychology | Emotion Science May 2013 | Volume 4 | Article 292 | 12