On detecting service violations and bandwidth theft in QoS network domains
23
On Detecting Service Violations and Bandwidth Theft in QoS Network Domains Ahsan Habib, Sonia Fahmy, Srinivas R. Avasarala, Venkatesh Prabhakar, Bharat Bhargava CERIAS and Department of Computer Sciences Purdue University, West Lafayette, IN 47907–1398, USA email: habib,fahmy,bb @cs.purdue.edu, [email protected], [email protected] Abstract We design and evaluate a simple and scalable system to verify Quality of Service (QoS) in a differentiated ser- vices domain. The system uses a distributed edge-to-edge monitoring approach with measurement agents collecting information about delays, losses and throughput, and reporting to a Service Level Agreement Monitor (SLAM). The SLAM detects potential service violations, bandwidth theft, denial of service attacks, and flags the need to re- dimension the network domain or limit its users. Measurements may be performed entirely edge-to-edge, or the core routers may participate in logging packet drop information. We compare the core-assisted and edge-to-edge schemes, and we extend network tomography-based loss inference mechanisms to cope with different drop precedences in a QoS network. We also develop a load-based service monitoring scheme which probes the appropriate edge routers for loss and throughput on demand. Simulation results indicate that the system detects attacks with reasonable accuracy, and is useful for damage control in both QoS-enabled and best effort network domains. Keywords: Service Level Agreements, Network Tomography, Network Monitoring, Network Security, Quality of Service. 1 Introduction Internet security lapses have cost U.S. corporations 5.7 percent of their annual revenue, as reported by University of California at Davis economist Frank Bernhard [13]. Specifically, the increase in the number of denial of service attacks (12,805 reported by the San Diego Supercomputer Center in February 2001 [24]), implies that bandwidth theft attacks can become widespread in networks with Quality of Service (QoS) support. Hence, monitoring network activity is required to maintain confidence in the security and QoS of networks, from both the user (ensuring the service level paid for is indeed obtained) and provider (ensuring no unusual activity or attacks take place) perspectives. Developing a low cost distributed monitoring system is the primary focus of this paper. We use the differentiated services (DS) QoS framework as an underlying network, though our system is not specific to DS. Packets entering a DS domain are classified and the DS field in the IP header is marked at the edge router [25]. The packets then experience specific per-hop behaviors (PHBs) as they are forwarded by the interior (core) routers of the domain depending on their DS field. Currently, the Expedited Forwarding (EF) PHB [19] and the Assured Forwarding (AF) PHBs [18] have been defined. The EF PHB can be used to build a low loss, low latency, end-to-end service. The AF PHB offers different levels of forwarding assurances, each with three drop precedences (e.g., green, yellow and red). Typically, a user has a service level agreement (SLA) with a provider that describes the expected service, user traffic profile, and charging models. The provider uses SLAs, along with other mechanisms, to provision the network appropriately. Differences in charging models of the service classes can attract attacks that inject marked packets to steal band- width and other network resources. Such attacks make use of known vulnerabilities in firewall filter rules to inject This research is sponsored in part by the National Science Foundation grants CCR-001712 and CCR-001788, CERIAS, an IBM SUR grant, the Purdue Research Foundation, and the Schlumberger Foundation technical merit award. Now with Andiamo Systems, San Jose, CA 95134 Now with Senera Systems, Sunnyvale, CA 94086 1
Transcript of On detecting service violations and bandwidth theft in QoS network domains
On Detecting Service Violations and Bandwidth Theft in QoSNetwork Domains�
Ahsan Habib, Sonia Fahmy, Srinivas R. Avasaralay, Venkatesh Prabhakarz, Bharat BhargavaCERIAS and Department of Computer Sciences
Purdue University, West Lafayette, IN 47907–1398, USAemail:fhabib,fahmy,[email protected], [email protected], [email protected]
Abstract
We design and evaluate a simple and scalable system to verifyQuality of Service (QoS) in a differentiated ser-vices domain. The system uses a distributed edge-to-edge monitoring approach with measurement agents collectinginformation about delays, losses and throughput, and reporting to a Service Level Agreement Monitor (SLAM).The SLAM detects potential service violations, bandwidth theft, denial of service attacks, and flags the need to re-dimension the network domain or limit its users. Measurements may be performed entirely edge-to-edge, or the corerouters may participate in logging packet drop information. We compare the core-assisted and edge-to-edge schemes,and we extend network tomography-based loss inference mechanisms to cope with different drop precedences in aQoS network. We also develop a load-based service monitoring scheme which probes the appropriate edge routers forloss and throughput on demand. Simulation results indicatethat the system detects attacks with reasonable accuracy,and is useful for damage control in both QoS-enabled and besteffort network domains.
Keywords: Service Level Agreements, Network Tomography, Network Monitoring, Network Security, Quality ofService.
1 Introduction
Internet security lapses have cost U.S. corporations 5.7 percent of their annual revenue, as reported by University ofCalifornia at Davis economist Frank Bernhard [13]. Specifically, the increase in the number of denial of service attacks(12,805 reported by the San Diego Supercomputer Center in February 2001 [24]), implies that bandwidth theft attackscan become widespread in networks with Quality of Service (QoS) support. Hence, monitoring network activity isrequired to maintain confidence in the security and QoS of networks, from both the user (ensuring the service levelpaid for is indeed obtained) and provider (ensuring no unusual activity or attacks take place) perspectives. Developinga low cost distributed monitoring system is the primary focus of this paper.
We use the differentiated services (DS) QoS framework as an underlying network, though our system is not specificto DS. Packets entering a DS domain are classified and the DS field in the IP header is marked at the edge router [25].The packets then experience specific per-hop behaviors (PHBs) as they are forwarded by the interior (core) routersof the domain depending on their DS field. Currently, the Expedited Forwarding (EF) PHB [19] and the AssuredForwarding (AF) PHBs [18] have been defined. The EF PHB can be used to build a low loss, low latency, end-to-endservice. The AF PHB offers different levels of forwarding assurances, each with three drop precedences (e.g., green,yellow and red). Typically, a user has a service level agreement (SLA) with a provider that describes the expectedservice, user traffic profile, and charging models. The provider uses SLAs, along with other mechanisms, to provisionthe network appropriately.
Differences in charging models of the service classes can attract attacks that inject marked packets to steal band-width and other network resources. Such attacks make use of known vulnerabilities in firewall filter rules to inject�This research is sponsored in part by the National Science Foundation grants CCR-001712 and CCR-001788, CERIAS, an IBM SUR grant,the Purdue Research Foundation, and the Schlumberger Foundation technical merit award.yNow with Andiamo Systems, San Jose, CA 95134zNow with Senera Systems, Sunnyvale, CA 94086
1
traffic or spoof the identity of valid users with high QoS levels. Since the DS framework is based on aggregation offlows into service classes, valid user traffic may experiencedegraded QoS as a result of the injected traffic. Taken to anextreme, the attacks may result in denial of service. This creates a need for developing an effective defense mechanismthat can automate the detection and reaction to attacks on the QoS-provisioned DS network domain.
Although measurement of path characteristics [26, 27] and network monitoring [5, 14, 20] have been extensivelyinvestigated, few studies of user SLA validation have been performed [10]. Inspired by recent results on networktomography [1, 6, 7], we infer internal characteristics of anetwork domain using edge-to-edge probes, and design adistributed monitoring system to detect service violations and bandwidth theft in a network domain. We employ agentson selected routers of the DS domain to efficiently measure packet delays, loss, and throughputs. Measurements arecommunicated to an SLA Monitor (SLAM). The SLAM analyzes measurements and automatically detects potentialattacks and violations of negotiated SLAs, as well as flag theneed to re-provision the network by increasing capacityor limiting users.
We also compare core-assisted and pure edge-to-edge approaches for packet loss ratio computation. The compari-son can help network providers decide which technique best serves their needs. We inject probes only when necessaryto reduce communication overhead. Moreover, we extend stripe-based loss inference [15] to cope with different dropprecedences in a QoS network. Throughput measurements are only performed when a delay or loss violation is re-ported. As with any detection mechanism, the attackers can attach the mechanism itself, but we assume the cost toattack this distributed monitoring mechanism is higher than the cost to inject or spoof traffic, or bypass a single edgerouter.
The remainder of this paper is organized as follows. Section2 discusses related work. Section 3 describes the high-level architecture used in our service violation detectionsystem. Section 4 gives the methodology of measurements andSLA violation detection. Section 5 discusses when to probe the network based on network load. Section 6 presents oursimulation experiments and results. Finally, section 7 summarizes our conclusions and recommendations for enhancedsecurity.
2 Related Work
A number of related studies have investigated differentiated services security, measurements of QoS parameters, net-work tomography and monitoring, and SLA verification.
2.1 Network Security
A security analysis for the differentiated services framework is provided in [32]. QoS attacks are classified as eitherattacking thenetwork provisioning process, or attacking thedata forwarding process. Network provisioning involvesconfiguration of DS nodes by policy distribution points in the network (Bandwidth Brokers (BBs)), through RSVP[4] or SNMP [9]. This process can be attacked by injecting bogus configuration messages, modifying the content ofreal configuration messages, delaying or dropping such messages. Networks can be secured against such attacks byemploying encryption of the configuration messages. Attacks on the data forwarding process are of a more seriousnature and can involve injecting traffic into the network with an intent to steal bandwidth or to cause QoS degradationby causing other user flows to experience longer delays, higher loss rates, and lower throughput. Our goal is to detectattacks on the data forwarding process by monitoring the characteristics of a network domain.
2.2 Performance Measurements
A large body of research has focused on measuring delay, loss, and throughput in the Internet [26, 27]. Shared PassiveNetwork Performance Discovery (SPAND) [29] is a tool that communicates with distant Internet hosts and reports toa performance server in the same domain. Sharing history to improve future measurement was proven useful. Savageet al proposeDetourrouters as edge devices in Internet clouds that will tunnel traffic to improve Internet performance[28]. These edge routers exchange bandwidth, latency, droprate among themselves. We also employ intelligent routersat key access points that monitor a network domain. Resilient Overlay Networks (RON) is an architecture to detectand recover from path outages and periods of degraded performance [2]. RON nodes monitor the quality of Internetpaths among themselves and use this information to route packets, optimizing application-specific routing metrics.RON uses three different routing metrics: latency, loss andthroughput. Measurement techniques in SPAND, Detour,and RON are useful but not directly applicable to violation detection in a QoS network domain.
2
2.3 Network Tomography
Network tomography is an approach to infer the internal behavior of a network based on purely end-to-end measure-ments [31]. A number of studies [1, 6, 7] have shown how to infer loss and delay, and discover the topology of amulticast network. Coates and Nowark [11, 12] discuss delayand loss inference using unicast probing in order tomonitor TCP flows [31]. Duffield et al [15] use packet “stripes” (back-to-back probe packets) to infer link loss bycomputing the correlations among packet losses within a stripe at the destinations. Using end-to-end unicast probing,the authors demonstrate how to infer loss characteristics of the links in the network interior. We extend this techniqueto infer loss in a QoS domain and show how to detect service violations and attacks in that domain based on inferredvalues.
2.4 Network Monitoring
Many proposals for network monitoring [5, 14] ensure that a network is operating within desirable parameters. Inefficient reactive monitoring [14], the authors discuss ways to monitor communication overhead in IP networks. Theirmain idea is to combine global polling with local event driven reporting. Our core-assisted scheme also uses local eventdriven reporting and performs global polling only when it isabsolutely necessary. Breitbart et al [5] identify effectivetechniques to monitor bandwidth and latency in IP networks.The authors presentprobing-basedtechniques wherepath latencies are measured by transmitting probes from a single point of control. The paper describes algorithms tocompute an optimal set of probes to measure latency of paths in a network. We focus on monitoring a network domainto detect attacks. For scalability, our approach involves only edge routers in any QoS parameter measurement.
2.5 SLA Verification
In [10], a histogram-based aggregation algorithm is used todetect SLA violations. The algorithm measures networkcharacteristics on a hop-by-hop basis and uses them to compute end-to-end measurements and validate end-to-endSLA requirements. In large networks, efficient collection of management data is a challenge. While exhaustive datacollection yields a complete picture, there is an added overhead. Furthermore, the authors assume that the routes usedby SLA flows are known, citing VPN and MPLS [8] provisioning. We use average values to reduce constraints on thenetwork setup, and eliminate the need for knowledge of the set of flows traversing each router.
3 Architecture for SLA Violation Detection
Differentiated Services (DS) [3] pushes complexity to boundary devices which process lower volumes of traffic. Theboundary routers where traffic enters a domain, called ingress routers, perform traffic conditioning that consists oftraffic classification based on multiple fields in the packet header, traffic metering to ensure conformance to a profile,marking, dropping, shaping or remarking of out-of-profile traffic. Core routers perform simple forwarding based onthe DS field. SLAs between the user and provider networks are used to derive filter rules for traffic classificationat the ingress routers. Therefore, ingress routers with appropriate configuration of filter rules should prevent non-conforming traffic from entering a DS domain. Though ingressrouters serve as a good first line of defense, attackerscan still succeed in injecting non-conforming traffic into aDS domain in a variety of ways, e.g.:
1. Attackers can impersonate a legitimate user by spoofing flow identity (IP addresses, protocol and port numbers).Network filtering [16] at routers in the user network can detect such spoofing if the attacker and the impersonateduser are on different subnets, but the attacks proceed unnoticed otherwise.
2. Attackers can devise mechanisms to bypass the ingress routers by exploiting some well known vulnerabilities inthe firewall filters. Thus, they can inject traffic with their own identity and a desired destination. Alternatively,the traffic can be aggregated from multiple ingress routers.
3. Legitimate users can send traffic in excess of their profiles. Ingress routers will re-mark excess traffic with acode point of a lower service class, e.g., AF red packets or best effort, which affects other user flows of thatlower class, as in a denial of service attack.
3
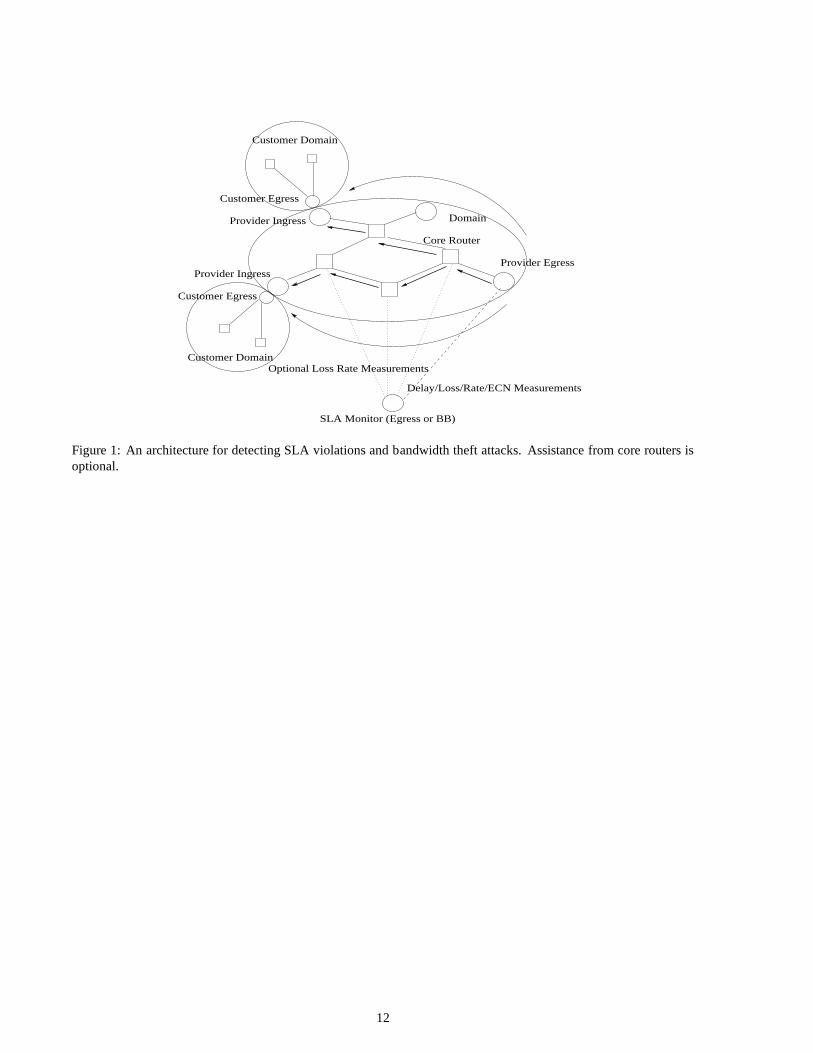
Such attacks and others escape detection at ingress routers. Co-ordination among boundary routers or support fromcore routers is required for detection. Changes that can be observed due to the attack traffic in the network includelonger per-packet delays, higher average buffer occupancy, and higher packet drop rates. We use these characteris-tics, specifically delays, loss ratios, and bandwidth achieved by flowsafter aggregation within the domain to detectbandwidth theft attacks and service violations.
Figure 1 depicts our proposed architecture. An SLA Monitor (SLAM) coordinates the monitoring activities insidethe DS domain. In the figure, the SLAM is shown as a separate entity in a network domain. However, any edgerouter can take this responsibility as long as it has sufficient resources and computing capabilities. Loss ratios maybe inferred on a pure edge-to-edge basis or using core routerassistance. In the core-assisted scheme, egress and corerouters send delay and loss measurements respectively to the SLAM for the flows in the domain. Upon request, theingress sends the number of packets entering a domain per flowto calculate loss ratio. The packet loss is computed asthe ratio of the packet drop inside a domain to the total packets entering the domain. Loss ratio of a flow is a bettermetric than loss rate (i.e., number of drops per second). Another alternative is to measure delay, loss or throughputusing only edge routers using network tomography techniques. The SLAM maintains delay and loss information ofmisbehaving flows only. In addition, the SLAM maintains the SLA parameters for each user for a certain domain. Bycomparing the delay and loss measurements against the specific user SLA, we can identify potential SLA violations.
4 QoS Parameter Measurement
The SLA parameters used for detecting violations include delay, loss, and throughput. This section describes methodsto measure and use these parameters to detect service violations.
4.1 Delay Measurements
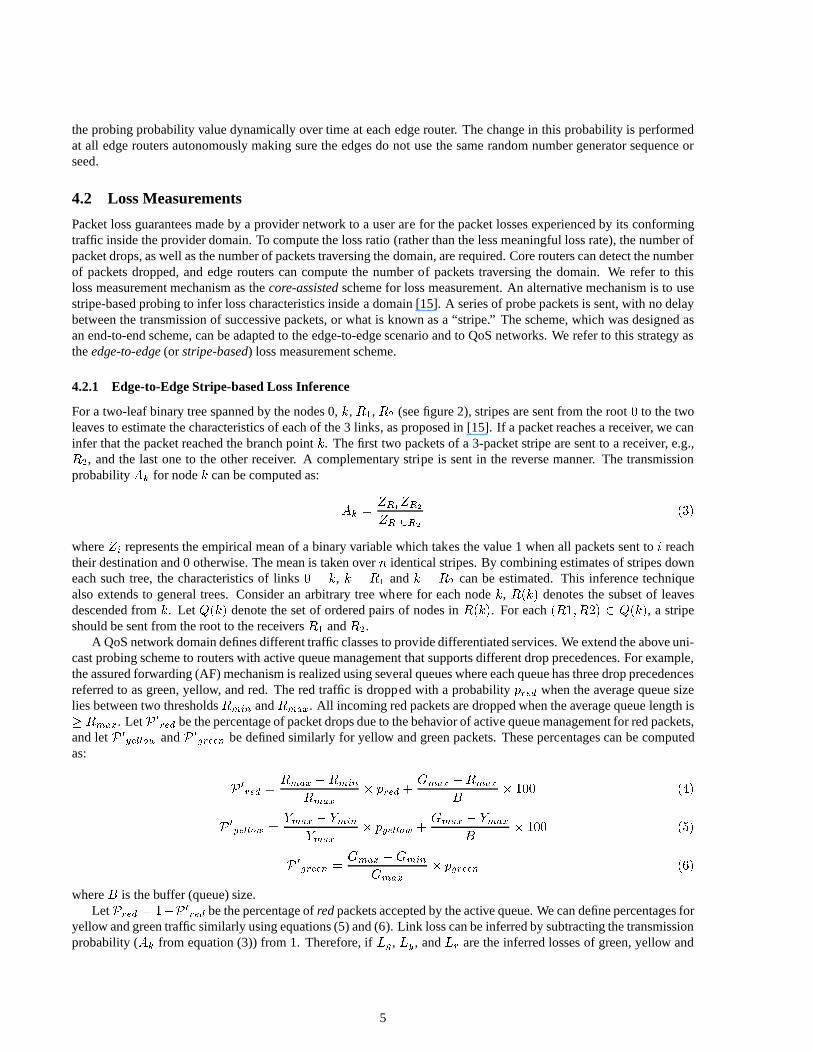
Delay bound guarantees made by a provider network to user traffic flows are for the delays experienced by the flowsbetween the ingress and egress routers of the provider domain. Delay measurements either use delay of real user trafficor injected traffic. The first approach is intrusive because encoding timestamps into the data packets would requirechanging the packets at the ingress and rewriting the original content at the egress after appropriate measurements.The second approach is non-intrusive in that we can inject probe packets with desired control information to enablean egress router to recognize such probes, perform measurements and delete the probes from the traffic stream. Weadopt the second approach in our design. For each packet traversing an ingress router, with a certain pre-configuredprobabilitypprobe, the ingress copies the packet IP header into a new probe packet. A timestamptiingress is encodedinto the payload of flowi, and an identifier field is marked with a new value in the probe packet. The egress routerremoves probes from the traffic stream, and computesdelayij for a packet from flowi of userj traffic as:delayij = tiegress � tiingress (1)wheretiegress is the time the packet of flowi traverses the egress router. The egress forwards the packetdetailsand the measured delay information to the SLAM. The encoded timestamp should follow a well-known format, e.g.,Coordinated Universal Time (UTC), and a standard protocol like Network Time Protocol (NTP) should be used tomaintain clock synchronization. Alternatively, the two-way delay from ingress to egress and back to ingress can bedivided by two if links are approximately symmetric. At the SLAM, we classify the packet as belonging to flowiof userj and update the average packet delay of userj traffic, avg delayj , using an exponential weighted movingaverage (EWMA): avg delayj = �� avg delayj + (1� �)� delayij (2)where� is a small fraction to emphasize recent history rather than the current sample alone. If this average packetdelay exceeds the delay guarantee in the SLA, we conclude that a service violation may have occurred. If the networkis properly provisioned and all flows do not misbehave, delayfor userj should not exceed its delay guarantee.
Determining the probability with which we should inject probe packets is not an easy task. If there areM edgerouters in a network domain,N i flows (on the average) passing through an edge routeri, andpijprobe is the probability
that an edge routeri and flowj will be selected to probe for latency, thenMN ipijprobe is the average number of probepackets injected into the network domain. To keep the volumeof these control messages low, we must select a lowprobability. However, if the probability is too low, the chance of undetected violations is higher. Therefore, we vary
4
the probing probability value dynamically over time at eachedge router. The change in this probability is performedat all edge routers autonomously making sure the edges do notuse the same random number generator sequence orseed.
4.2 Loss Measurements
Packet loss guarantees made by a provider network to a user are for the packet losses experienced by its conformingtraffic inside the provider domain. To compute the loss ratio(rather than the less meaningful loss rate), the number ofpacket drops, as well as the number of packets traversing thedomain, are required. Core routers can detect the numberof packets dropped, and edge routers can compute the number of packets traversing the domain. We refer to thisloss measurement mechanism as thecore-assistedscheme for loss measurement. An alternative mechanism is tousestripe-based probing to infer loss characteristics insidea domain [15]. A series of probe packets is sent, with no delaybetween the transmission of successive packets, or what is known as a “stripe.” The scheme, which was designed asan end-to-end scheme, can be adapted to the edge-to-edge scenario and to QoS networks. We refer to this strategy astheedge-to-edge(or stripe-based) loss measurement scheme.
4.2.1 Edge-to-Edge Stripe-based Loss Inference
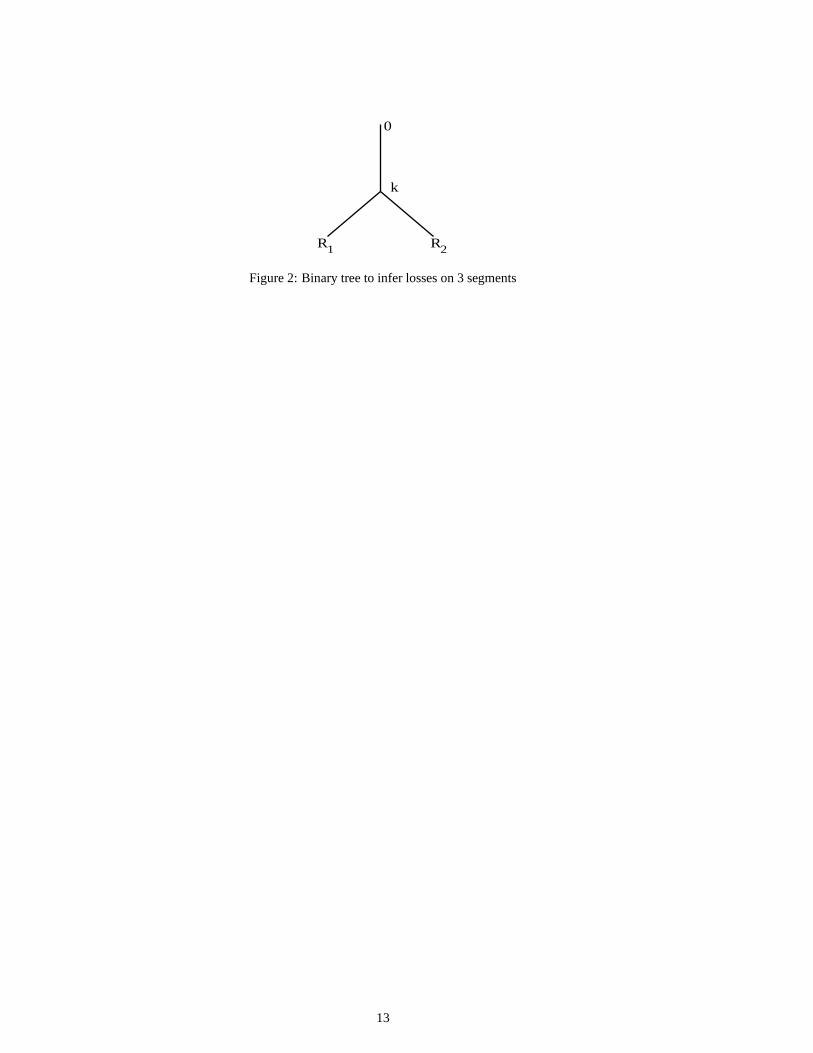
For a two-leaf binary tree spanned by the nodes 0,k, R1, R2 (see figure 2), stripes are sent from the root0 to the twoleaves to estimate the characteristics of each of the 3 links, as proposed in [15]. If a packet reaches a receiver, we caninfer that the packet reached the branch pointk. The first two packets of a 3-packet stripe are sent to a receiver, e.g.,R2, and the last one to the other receiver. A complementary stripe is sent in the reverse manner. The transmissionprobabilityAk for nodek can be computed as: Ak = ZR1ZR2ZR1[R2 (3)whereZi represents the empirical mean of a binary variable which takes the value 1 when all packets sent toi reachtheir destination and 0 otherwise. The mean is taken overn identical stripes. By combining estimates of stripes downeach such tree, the characteristics of links0 � k, k � R1 andk � R2 can be estimated. This inference techniquealso extends to general trees. Consider an arbitrary tree where for each nodek, R(k) denotes the subset of leavesdescended fromk. LetQ(k) denote the set of ordered pairs of nodes inR(k). For each(R1; R2) 2 Q(k), a stripeshould be sent from the root to the receiversR1 andR2.
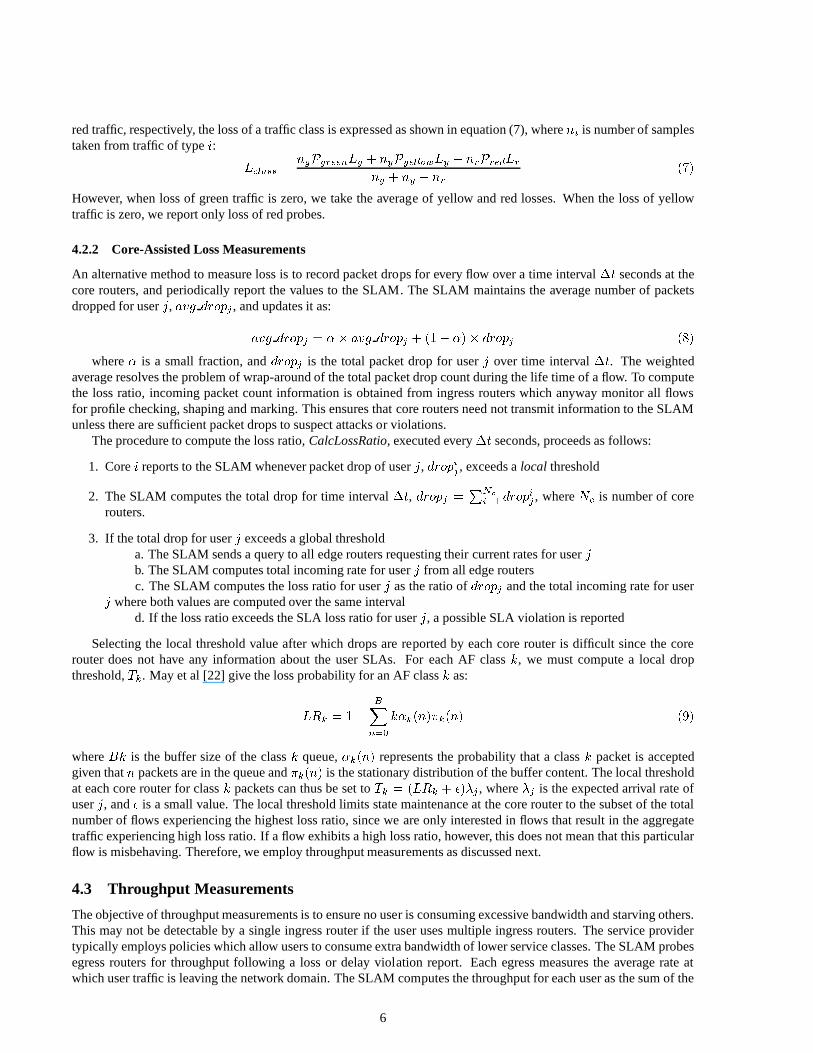
A QoS network domain defines different traffic classes to provide differentiated services. We extend the above uni-cast probing scheme to routers with active queue managementthat supports different drop precedences. For example,the assured forwarding (AF) mechanism is realized using several queues where each queue has three drop precedencesreferred to as green, yellow, and red. The red traffic is dropped with a probabilitypred when the average queue sizelies between two thresholdsRmin andRmax. All incoming red packets are dropped when the average queuelength is� Rmax. LetP 0red be the percentage of packet drops due to the behavior of active queue management for red packets,and letP 0yellow andP 0green be defined similarly for yellow and green packets. These percentages can be computedas: P 0red = Rmax �RminRmax � pred + Gmax �RmaxB � 100 (4)P 0yellow = Ymax � YminYmax � pyellow + Gmax � YmaxB � 100 (5)P 0green = Gmax �GminGmax � pgreen (6)whereB is the buffer (queue) size.
LetPred = 1�P 0red be the percentage ofredpackets accepted by the active queue. We can define percentages foryellow and green traffic similarly using equations (5) and (6). Link loss can be inferred by subtracting the transmissionprobability (Ak from equation (3)) from 1. Therefore, ifLg, Ly, andLr are the inferred losses of green, yellow and
5
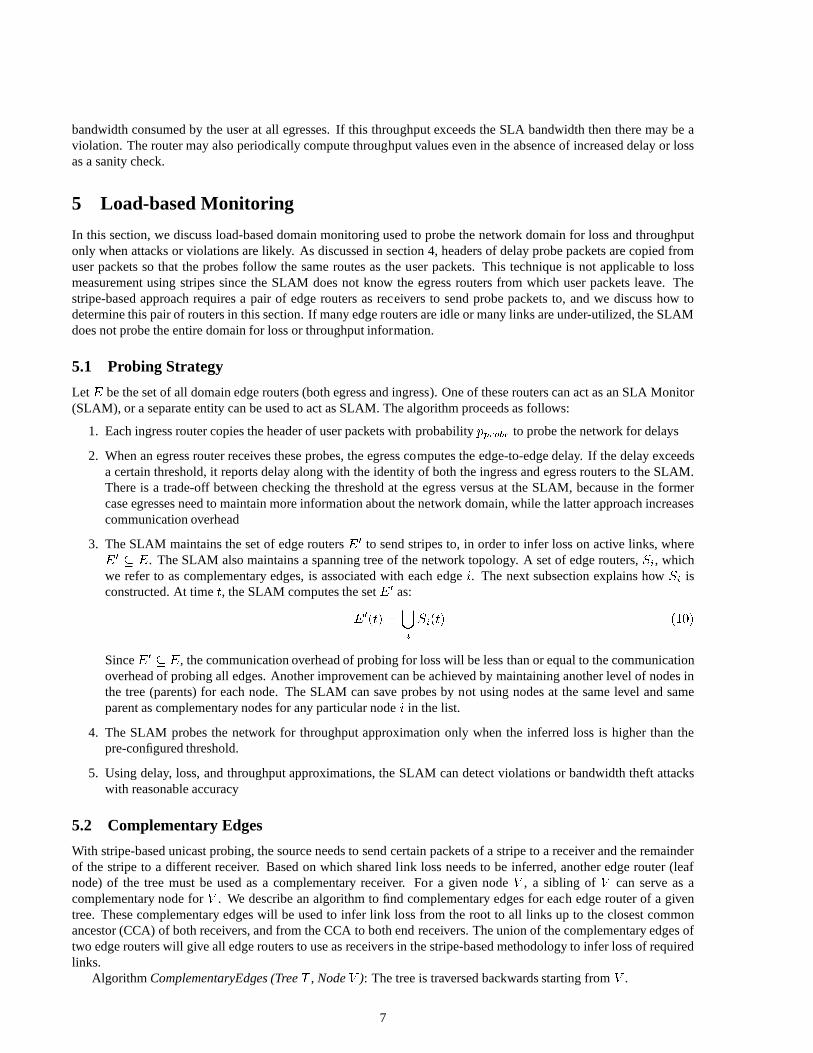
red traffic, respectively, the loss of a traffic class is expressed as shown in equation (7), whereni is number of samplestaken from traffic of typei: L lass = ngPgreenLg + nyPyellowLy + nrPredLrng + ny + nr (7)However, when loss of green traffic is zero, we take the average of yellow and red losses. When the loss of yellowtraffic is zero, we report only loss of red probes.
4.2.2 Core-Assisted Loss Measurements
An alternative method to measure loss is to record packet drops for every flow over a time interval�t seconds at thecore routers, and periodically report the values to the SLAM. The SLAM maintains the average number of packetsdropped for userj, avg dropj , and updates it as:avg dropj = �� avg dropj + (1� �)� dropj (8)
where� is a small fraction, anddropj is the total packet drop for userj over time interval�t. The weightedaverage resolves the problem of wrap-around of the total packet drop count during the life time of a flow. To computethe loss ratio, incoming packet count information is obtained from ingress routers which anyway monitor all flowsfor profile checking, shaping and marking. This ensures thatcore routers need not transmit information to the SLAMunless there are sufficient packet drops to suspect attacks or violations.
The procedure to compute the loss ratio,CalcLossRatio, executed every�t seconds, proceeds as follows:
1. Corei reports to the SLAM whenever packet drop of userj, dropij , exceeds alocal threshold
2. The SLAM computes the total drop for time interval�t, dropj = PN i=1 dropij , whereN is number of corerouters.
3. If the total drop for userj exceeds a global thresholda. The SLAM sends a query to all edge routers requesting theircurrent rates for userjb. The SLAM computes total incoming rate for userj from all edge routersc. The SLAM computes the loss ratio for userj as the ratio ofdropj and the total incoming rate for userj where both values are computed over the same intervald. If the loss ratio exceeds the SLA loss ratio for userj, a possible SLA violation is reported
Selecting the local threshold value after which drops are reported by each core router is difficult since the corerouter does not have any information about the user SLAs. Foreach AF classk, we must compute a local dropthreshold,Tk. May et al [22] give the loss probability for an AF classk as:LRk = 1� BXn=0 k�k(n)�k(n) (9)whereBk is the buffer size of the classk queue,�k(n) represents the probability that a classk packet is acceptedgiven thatn packets are in the queue and�k(n) is the stationary distribution of the buffer content. The local thresholdat each core router for classk packets can thus be set toTk = (LRk + �)�j , where�j is the expected arrival rate ofuserj, and� is a small value. The local threshold limits state maintenance at the core router to the subset of the totalnumber of flows experiencing the highest loss ratio, since weare only interested in flows that result in the aggregatetraffic experiencing high loss ratio. If a flow exhibits a highloss ratio, however, this does not mean that this particularflow is misbehaving. Therefore, we employ throughput measurements as discussed next.
4.3 Throughput Measurements
The objective of throughput measurements is to ensure no user is consuming excessive bandwidth and starving others.This may not be detectable by a single ingress router if the user uses multiple ingress routers. The service providertypically employs policies which allow users to consume extra bandwidth of lower service classes. The SLAM probesegress routers for throughput following a loss or delay violation report. Each egress measures the average rate atwhich user traffic is leaving the network domain. The SLAM computes the throughput for each user as the sum of the
6
bandwidth consumed by the user at all egresses. If this throughput exceeds the SLA bandwidth then there may be aviolation. The router may also periodically compute throughput values even in the absence of increased delay or lossas a sanity check.
5 Load-based Monitoring
In this section, we discuss load-based domain monitoring used to probe the network domain for loss and throughputonly when attacks or violations are likely. As discussed in section 4, headers of delay probe packets are copied fromuser packets so that the probes follow the same routes as the user packets. This technique is not applicable to lossmeasurement using stripes since the SLAM does not know the egress routers from which user packets leave. Thestripe-based approach requires a pair of edge routers as receivers to send probe packets to, and we discuss how todetermine this pair of routers in this section. If many edge routers are idle or many links are under-utilized, the SLAMdoes not probe the entire domain for loss or throughput information.
5.1 Probing Strategy
LetE be the set of all domain edge routers (both egress and ingress). One of these routers can act as an SLA Monitor(SLAM), or a separate entity can be used to act as SLAM. The algorithm proceeds as follows:
1. Each ingress router copies the header of user packets withprobabilitypprobe to probe the network for delays
2. When an egress router receives these probes, the egress computes the edge-to-edge delay. If the delay exceedsa certain threshold, it reports delay along with the identity of both the ingress and egress routers to the SLAM.There is a trade-off between checking the threshold at the egress versus at the SLAM, because in the formercase egresses need to maintain more information about the network domain, while the latter approach increasescommunication overhead
3. The SLAM maintains the set of edge routersE0 to send stripes to, in order to infer loss on active links, whereE0 � E. The SLAM also maintains a spanning tree of the network topology. A set of edge routers,Si, whichwe refer to as complementary edges, is associated with each edgei. The next subsection explains howSi isconstructed. At timet, the SLAM computes the setE0 as:E0(t) =[i Si(t) (10)SinceE0 � E, the communication overhead of probing for loss will be lessthan or equal to the communicationoverhead of probing all edges. Another improvement can be achieved by maintaining another level of nodes inthe tree (parents) for each node. The SLAM can save probes by not using nodes at the same level and sameparent as complementary nodes for any particular nodei in the list.
4. The SLAM probes the network for throughput approximationonly when the inferred loss is higher than thepre-configured threshold.
5. Using delay, loss, and throughput approximations, the SLAM can detect violations or bandwidth theft attackswith reasonable accuracy
5.2 Complementary Edges
With stripe-based unicast probing, the source needs to sendcertain packets of a stripe to a receiver and the remainderof the stripe to a different receiver. Based on which shared link loss needs to be inferred, another edge router (leafnode) of the tree must be used as a complementary receiver. For a given nodeV , a sibling ofV can serve as acomplementary node forV . We describe an algorithm to find complementary edges for each edge router of a giventree. These complementary edges will be used to infer link loss from the root to all links up to the closest commonancestor (CCA) of both receivers, and from the CCA to both endreceivers. The union of the complementary edges oftwo edge routers will give all edge routers to use as receivers in the stripe-based methodology to infer loss of requiredlinks.
Algorithm ComplementaryEdges (TreeT , NodeV ): The tree is traversed backwards starting fromV .
7
1. C 0 ;, P = parent(V )2. whileP <> root of the tree
Add leafX toC 0 whereCCA(V;X) = PP parent(P )3. returnC 0
This algorithm only needs to be executed initially when the network is setup and when it is reconfigured with additionalrouters/links. The result is stored at the SLAM.
5.3 SLAM Functionality
For each incomingdelaycontrol packet, the SLAM updates the average delay of the user using equation (2). Thenit compares the delay to the SLA delay to detect violations for that user. If the delay has been violated, the SLAMupdates the list of edges to send stripes to for loss inference. If there is any loss at the core for the EF traffic class, anSLA violation is flagged. If the inferred AF loss ratio exceeds a certain threshold, the SLAM queries the edges for userthroughputs and checks whether there is a throughput violation. The SLAM also compares some report packet DSfields with the flow SLA to ensure that an attack does not occur in the form of injecting packets with a higher servicethan allowed for that user. For each violation, the SLAM informs the administrator who may choose to throttle thatparticular user traffic.
6 Simulation Results
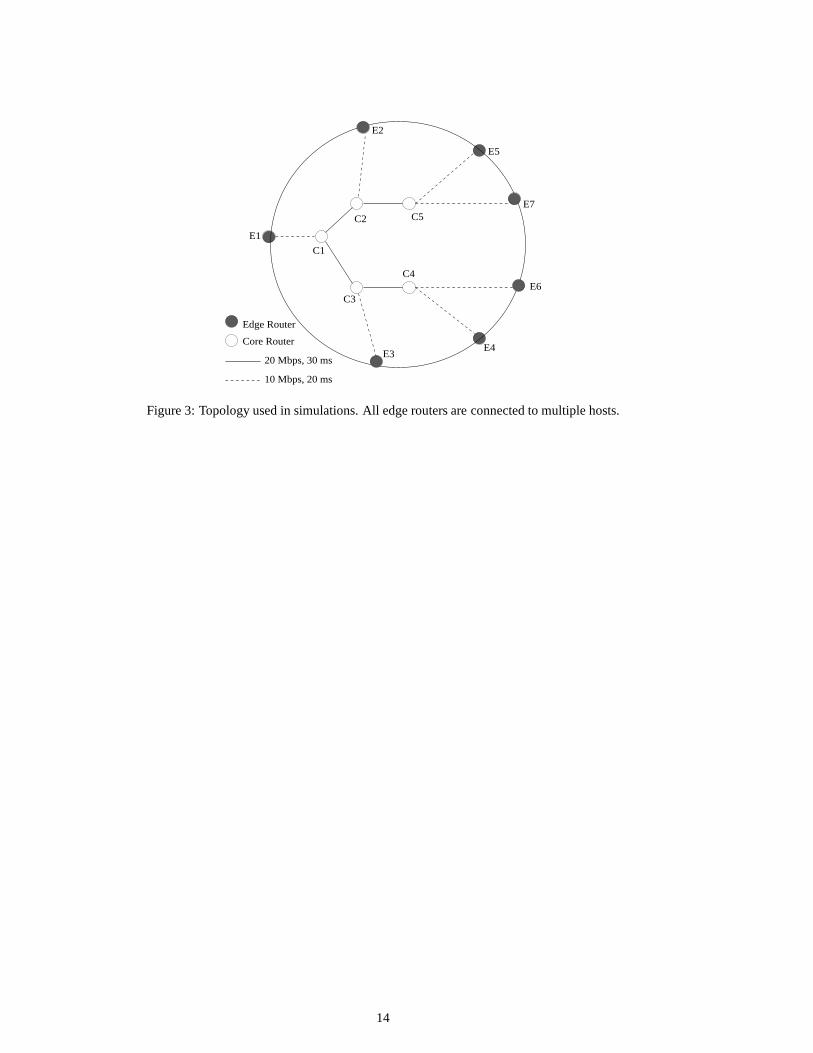
We conduct a series of experiments to investigate the delay,loss, and throughput approximation methods described insection 4. We use thens-2simulator [23], with the standard differentiated servicesimplementation by a group fromNortel Networks [30]. TCP New Reno is used, with a packet sizeof 1024 bytes and a maximum window of 64 packets.We employ a similar network topology to the one in [15] to evaluate both the core-assisted and stripe-based loss ratioapproximations. The topology is shown in figure 3. Multiple hosts are connected to all edges to create flows along alllinks in the topology. A number of flows fromE1, E2 andE3 are destined to hosts connected to edge routerE6 tosimulate attacks on the linkC4�E6.
6.1 Delay, Loss, and Throughput Approximations
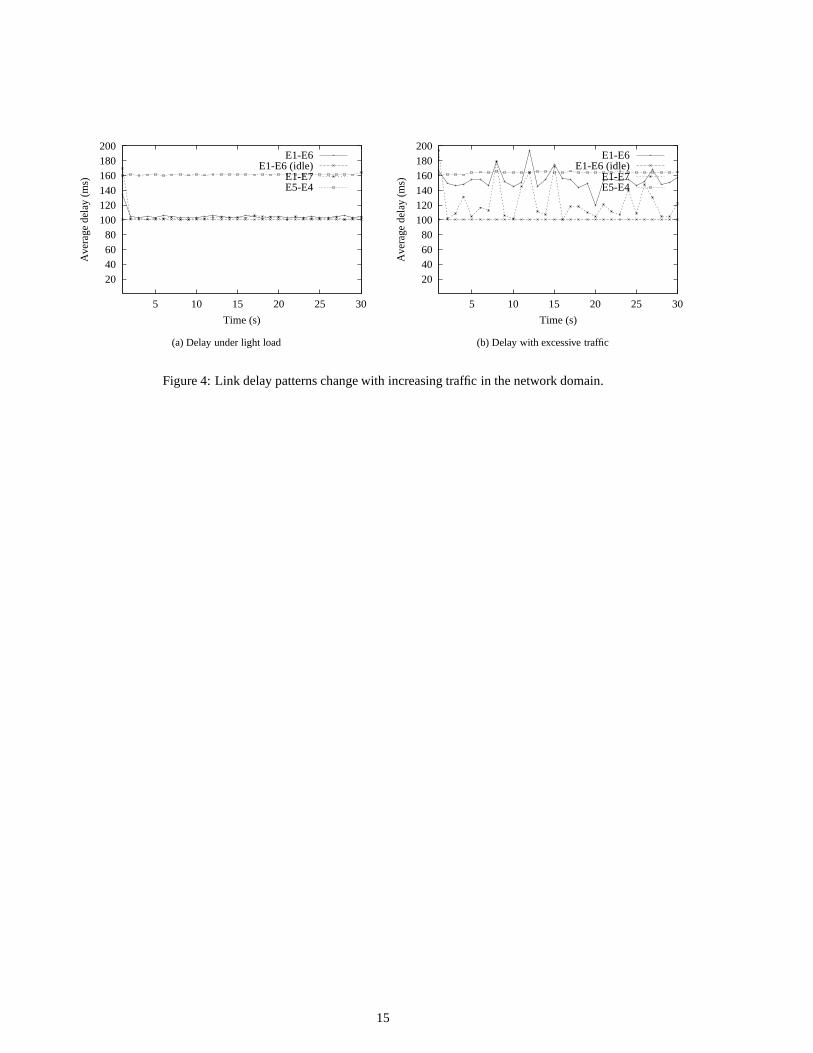
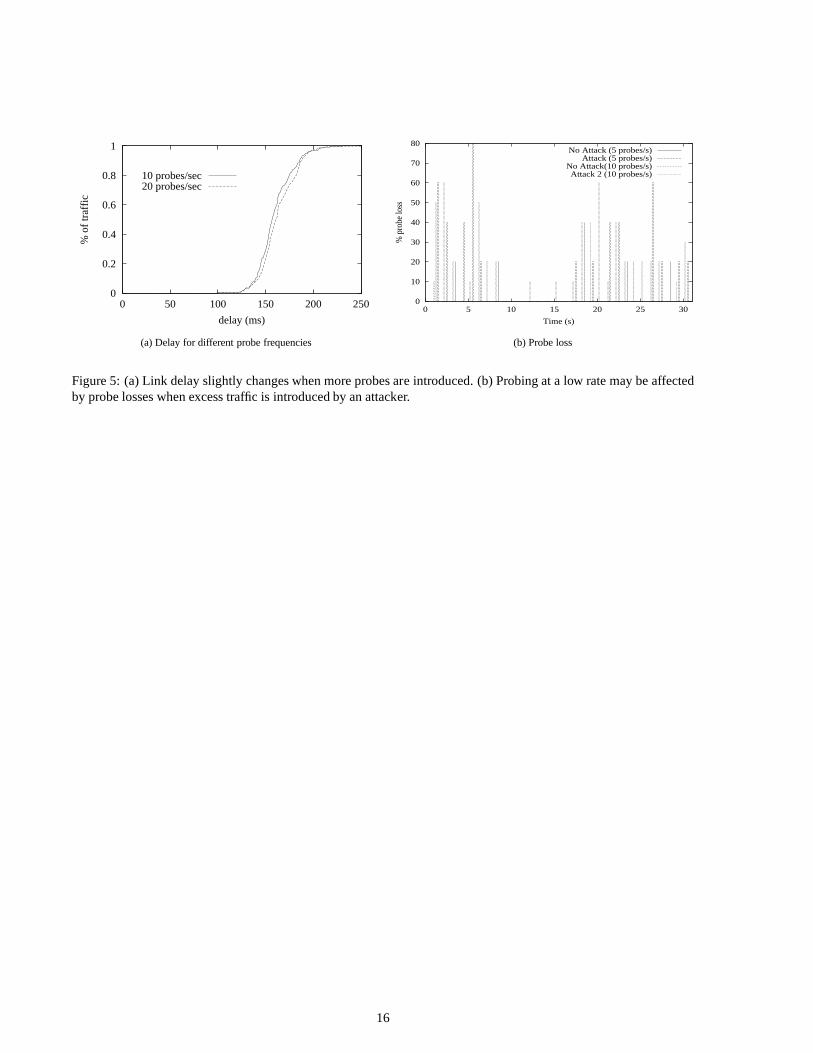
We measure delay when the network is adequately provisionedor over-provisioned (and thus experiences little loss)and then we simulate an attack on routerE6. This scenario is illustrated in figure 4. Under light load, the end-to-enddelay ofE1�E6 link is 100 ms;E1�E7 delay is 100 ms; andE5�E4 delay is 160 ms. With the attack traffic, theaverage delay of theE1� E6 link increases up to 180 ms (figure 4(b)). Since all the core router to core router linkshave a higher capacity than other links,C4�E6 becomes the most congested link, increasing the delay for all traffictraversingE6. The delay of theE5 � E4 link does not increase because this path is not congested. Therefore, delaypatterns are a good indication of the presence of excess traffic inside a network domain. As previously discussed, thefrequency of delay probing is a critical parameter. Sendingfewer probes reduces overhead but using only a few probescan produce inaccurate estimation, especially that some ofthe probes are lost in the presence of excess traffic. Figure5 shows that introducing more delay probes may increase the delay of actual traffic. Figure 5 (b) shows that sendingonly 5 probes per second is inadequate because as much as 80% of the probes may be lost. Sending probes at a rate of10 to 15 per second is a good choice in this experiment.
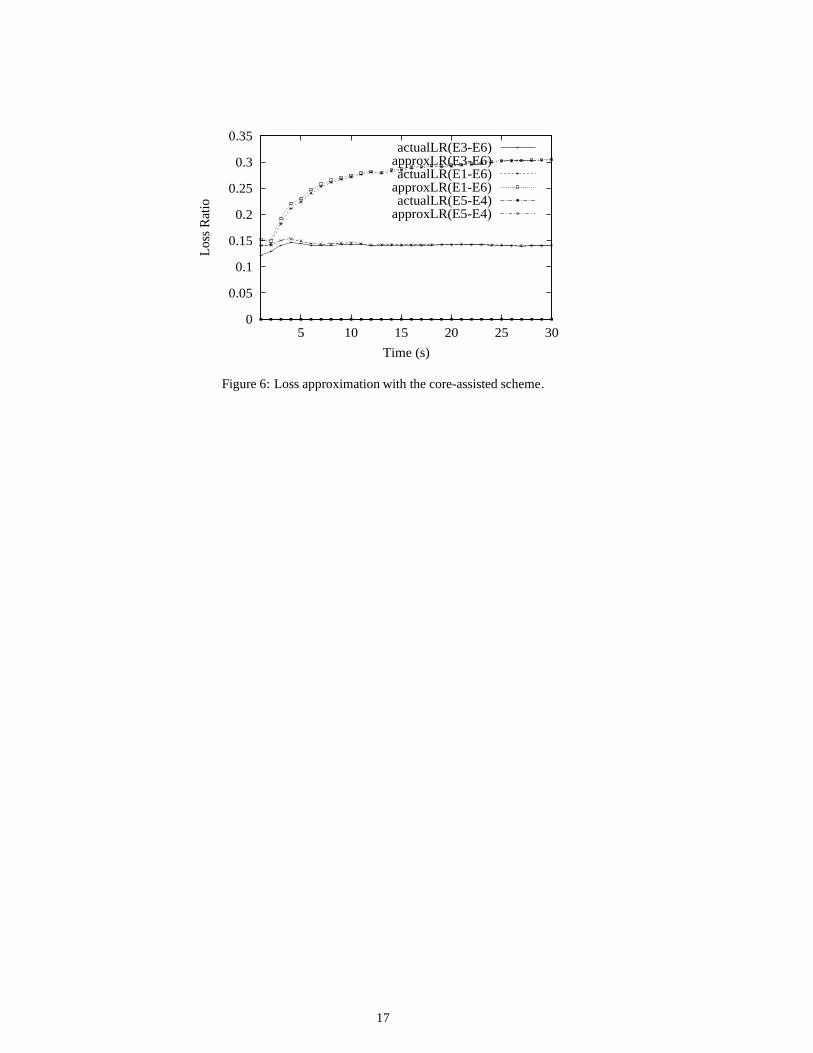
Figure 6 shows loss approximation using the core-assisted scheme. As the scheme uses an exponential weightedmoving average of the drop values and the number of incoming packets traversing edge routers, the initial approx-imated values deviate from the actual values. Thus initial data (the first two seconds) should be discarded. Theapproximated value is very close to the actual one after that. According to the simulation setup, linkC4�E6 exhibitsan increased loss ratio for theE1�E6 as depicted in figure 6.
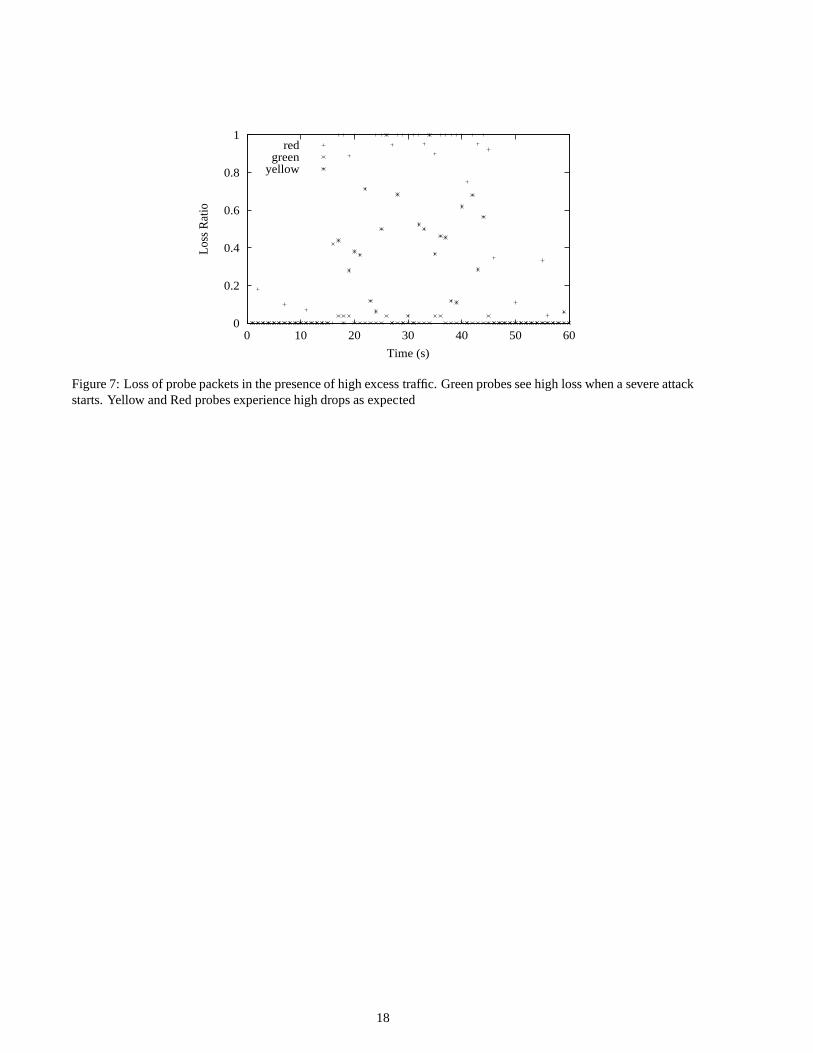
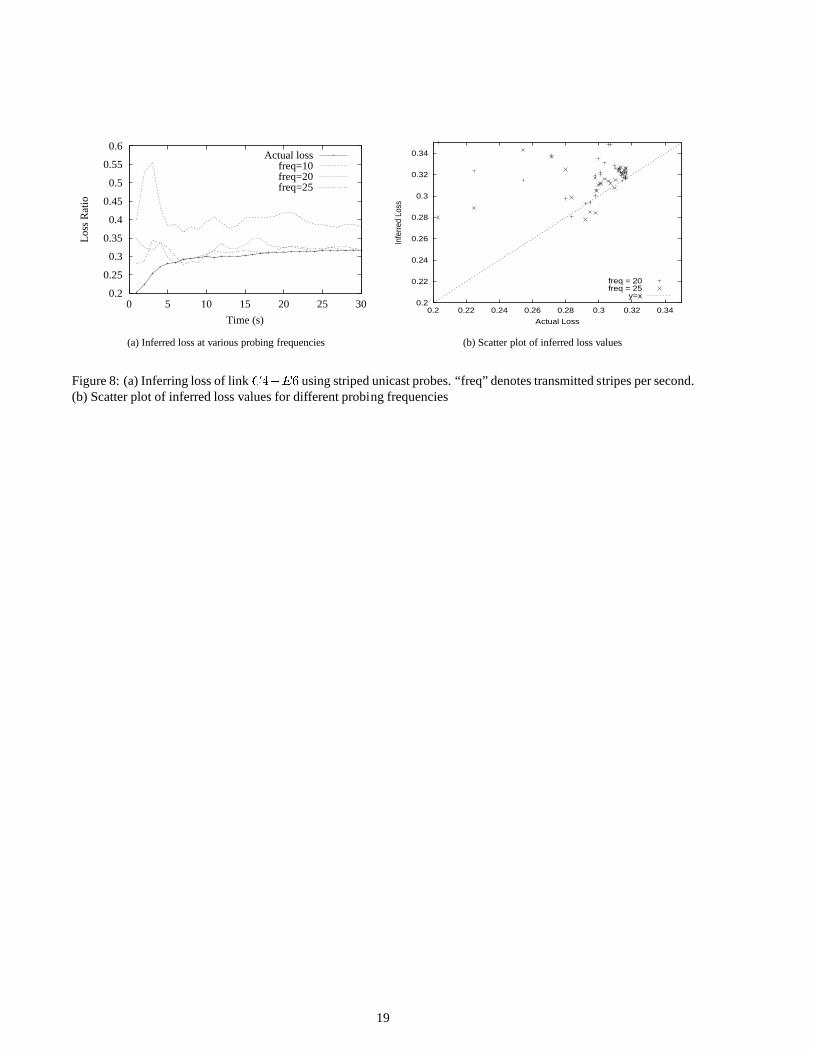
Using striped probes for loss inference (as proposed in [15]) produces reasonably accurate approximations if corerouters do not employ active queue management or service differentiation. In assured forwarding, packets markedas “red” have a high drop probability while “green” packets have low drop probability. We send stripes of differentcolors to infer loss in this case. Figure 7 shows the loss of probes with different drop precedences. Figure 8 depicts
8
the inferred loss of linkC4 � E6 using these striped unicast probes at different frequencies. The objective of thisexperiment is to determine how often a stripe should be sent to infer loss accurately. The figure shows that at least 20stripes per second are required to infer a loss ratio close tothe actual value. The figure also demonstrates that a longertime is required for convergence in the striped-based scheme than in the core-assisted scheme.
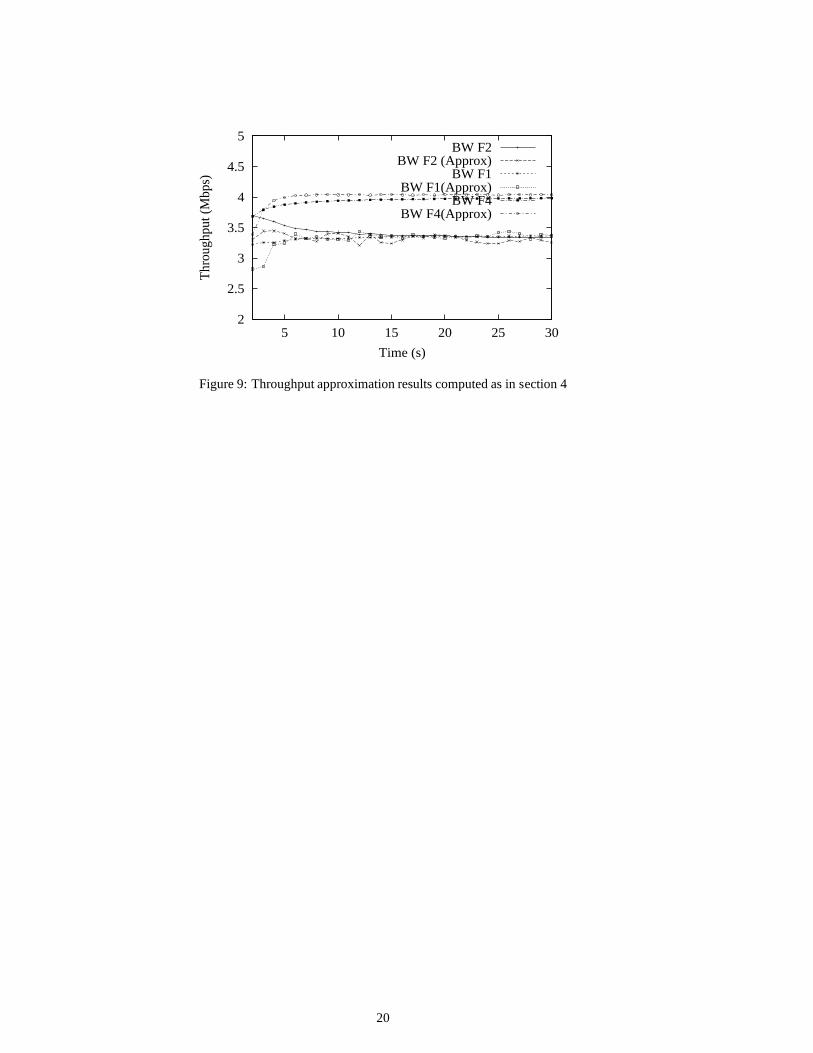
Figure 9 shows the throughput approximation of different flows traversing a network domain. There are severalaggregate flows going through the domain. We measure throughput for flowF1 that follows the pathE3 toE6, flowF2 that follows pathE1 toE6, flow F3 that follows pathE2� E6, and flowF4 that follows pathE5 � E4. Otheraggregate flows follow pathsE1�E7 andE3�E7. The throughput approximation procedure (discussed in section4) is used to compute the average rate at the egress routers. Figure 9 shows an initial fluctuation between actual andapproximated throughput measurements due to the average calculation. After a few seconds, the values are close toeach other. Measurement at the egress routers detects distributed attacks entering through different ingress routersofa domain.
6.2 Detecting Attacks and Service Violations
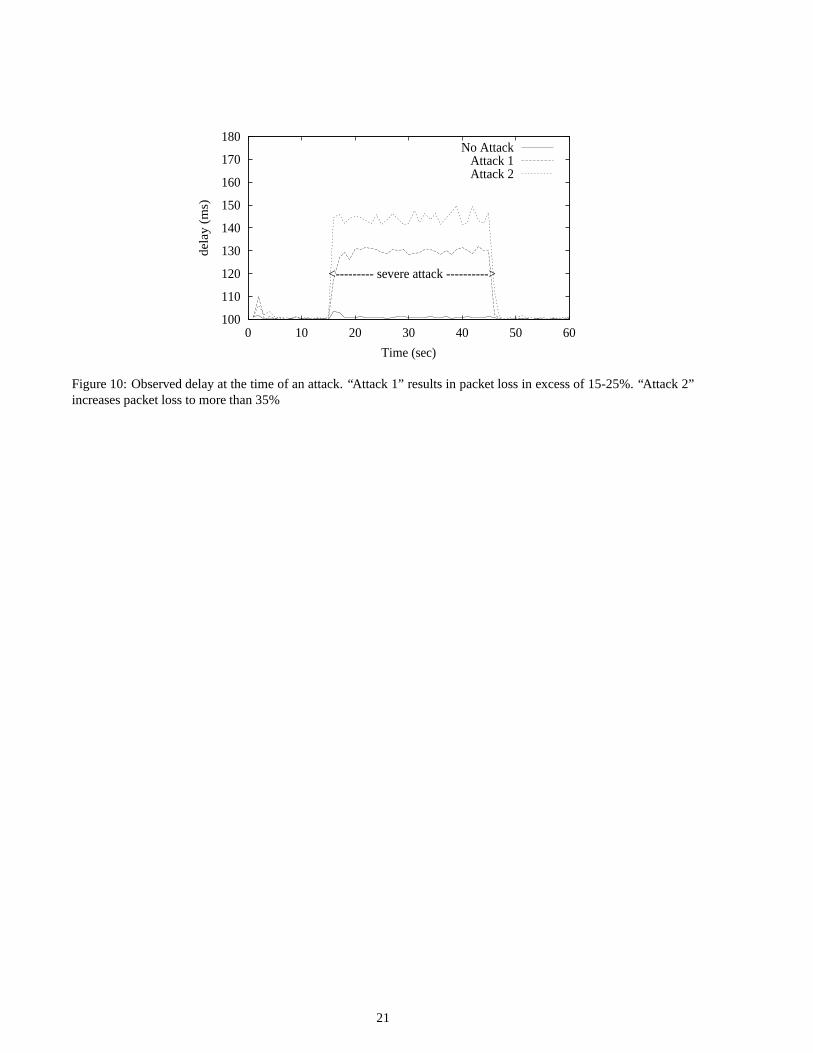
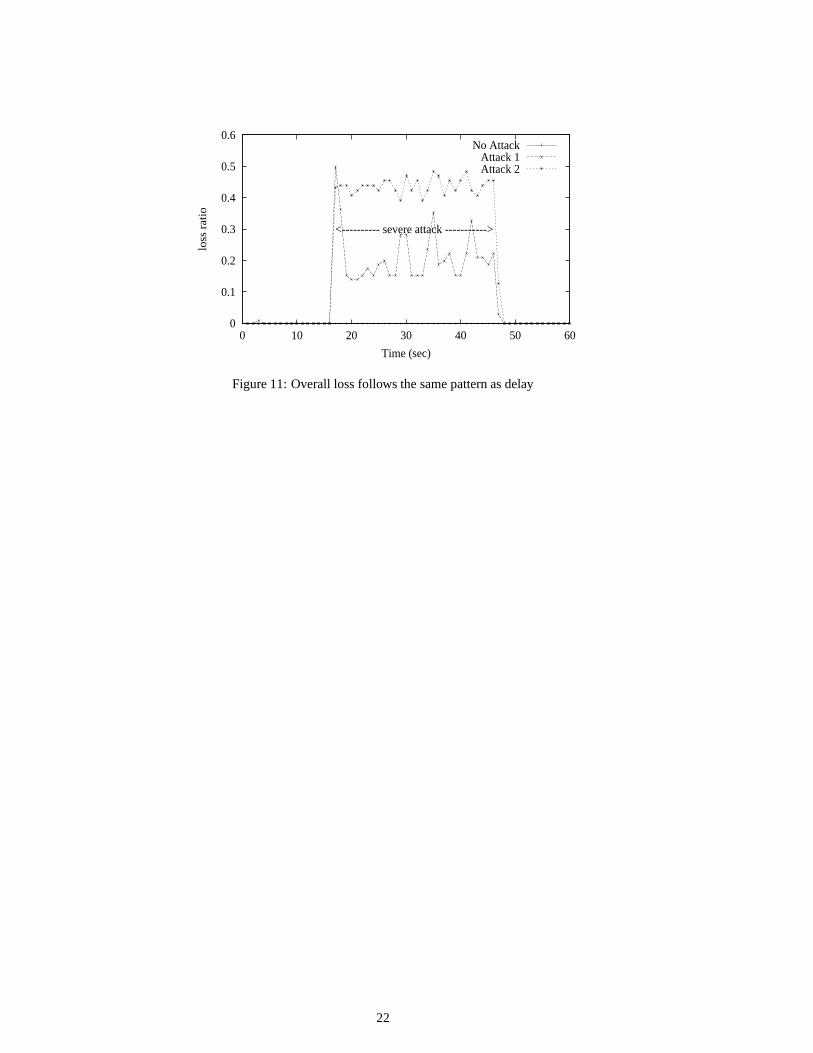
In this section, we demonstrate the detection of mild and severe distributed denial of service attacks. In figures 10 and11, label “No attack” means the network does not have significant traffic in excess of its capacity. This scenario haslittle loss inside the network domain. This is the normal case with proper network provisioning and traffic conditioningat the edge routers. Labels “Attack 1” and “Attack 2” denote situations when traffic is injected into the network domainfrom different ingress points. At each ingress point the flows do not violate any profiles, but the aggregate traffic isexcessive. The intensity of the attacks is increased duringtime t=15 secondsto t=45 seconds. The delay increasesby 30% during Attack 1 and by 50% during Attack 2 (figure 10). Packet drops of 15 to 25% result in case of Attack1, and drops of more than 35% result with Attack 2, as depictedin figure 11. We use equation (7) to compute overalltraffic loss in the QoS network.
The SLA Monitor (SLAM) can thus aid in the detection of denialof service (DoS) and distributed DoS (DDoS)attacks in a network domain. When the SLAM detects an anomaly(high delay and high loss), it polls the edge devicesfor throughputs of existing flows, in order to detect high bandwidth aggregates. This is similar to the method usedin [21], where aggregate-based congestion control (ACC) agents match the prefix of the IP destination addresses todeclare high bandwidth flows going to the same destination address. In our core-assisted scheme, the core routersimilarly sends the packet drop information, together withthe source and destination IP addresses to the SLAM. TheSLAM performs IP prefix matching to detect any possible DDoS attack through this domain. If there is an attack, theSLAM sends control information to all ingress routers to throttle (filter out) packets of this flow or at least control theirrates. The differentiated services architecture can help to propagate such messages to the upstream domain all the wayto the source if possible.
6.3 Comparative Evaluation
Based on our experiments, we present a quantitative measureof performance to compare the core-assisted, load-based and edge-to-edge approaches. We used the topology shown in figure 3 to experiment with the approaches.We compare communication overhead, accuracy, convergencetime, implementation overhead, and flexibility. Weconsider a domainD with M edge routers andN core routers. The total injected probes and size of each probe packetare used to compute the communication overhead in bytes. In the edge-to-edge approach, a stripe ofs packets istransmitted from the monitor to every egress routers pair. For the network domain, the total number of probe packetsis s � (M � 1) � (M � 2) � f , wheref is the frequency of stripes per unit time. The communicationoverhead istherefores� (M � 1)� (M � 2)� f � pa ket size.
The core-assisted loss measurement scheme overhead depends on the number of packets core routers send to theSLAM to report excessive drop for certain flows. We assume there areF flows traversing each edge router, and eachflow hasP packets on average. We define� as the percentage of misbehaving flows. Ifd bytes are required to recorddrop information of each flow, then each core needs to sendC = max(1; F���dpa ket size ) control packets to the SLAM.To compute theloss ratio, the monitor queries all edges for packet count informationof the misbehaving flows. Everyedge will reply to this query. The total number of packets exchanged is(2M +N) � C packets (recall thatN is thenumber of core routers). Therefore, the communication overhead is(2M + N) � C � pa ket size. We computethe communication overhead for the core-assisted approachbased on attack information provided in [24]. In [24], theauthors observed an average of 4268 backscatter attacks perweek over a three week period of time by monitoring a
9
sole ingress link into a lightly utilized /8 network. They show that 50% of the attacks last for 10 minutes, 30% last for30 minutes, 17% last for 60 minutes, 2% last for 5 hours and 1% last for 10 hours or more.
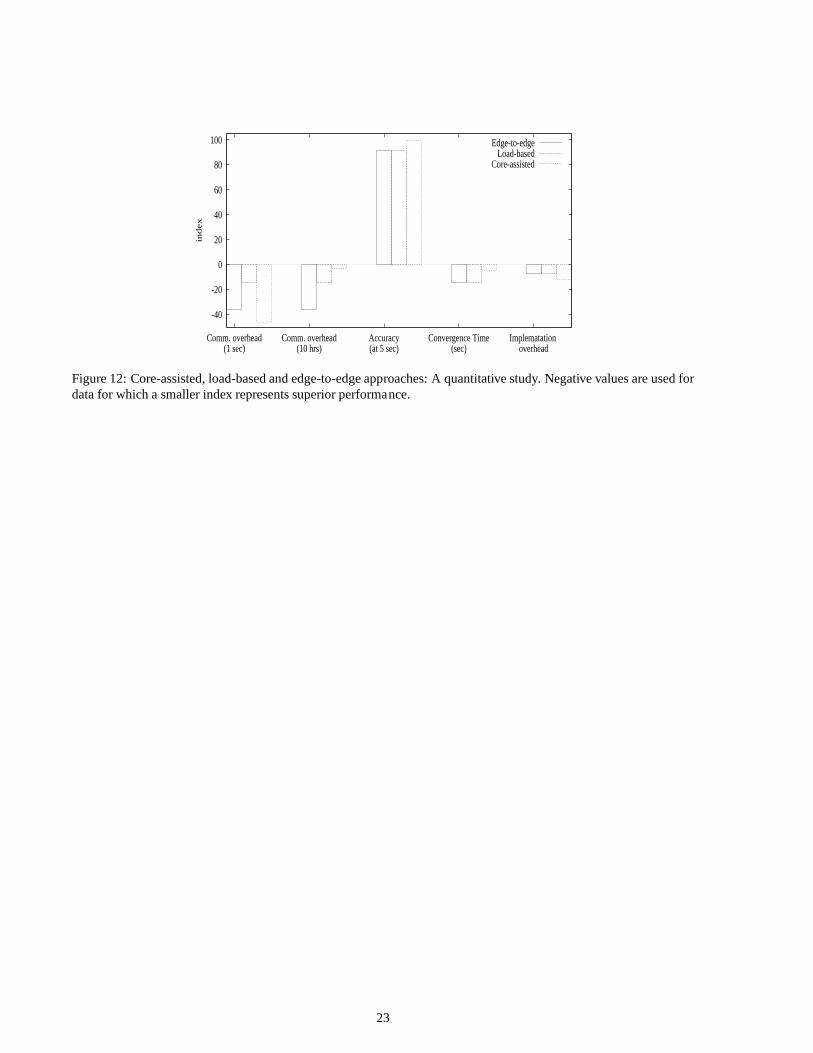
Accuracy is computed using the deviations of approximatingthe loss ratio from the actual loss ratio value. Wecalculate accuracy based on our experimental results, withf = 20 as the probing frequency for the edge-to-edgeapproach. Implementation overhead considers which components of the network must be modified. The edge-to-edge approach needs to modify only edge routers, while the core-assisted approach requires change to both edge andcore routers. The edge-to-edge scheme is thus considered more flexible since it is easier to deploy. However, thecore-assisted approach gives more insight into the performance characteristics of the network domain and has higheraccuracy and shorter convergence time. Figure 12 depicts a quantitative comparison of the three approaches. Notethat we use a high percentage of misbehaving flows as in [24]. For a large domain with millions of flows per second,the core-assisted approach exhibits a higher communication overhead over a short period with many attacks, but it hasa lower overhead over a longer time scale. The load-based approach is the same as the edge-to-edge approach in allrespects, except that it reduces communication overhead byprobing only the necessary regions.
7 Conclusions
We have investigated methods to detect service level agreement violations in QoS networks. These methods areuseful for network re-dimensioning, as well as for detection of denial of service and bandwidth theft attacks. Thecore-assisted loss measurement method is powerful but difficult to deploy. An alternative edge-to-edge stripe-basedloss inference scheme for different drop precedences was thus proposed. In the edge-to-edge probing approach, alow network probing rate has been shown to give incorrect results due to the loss of probes in case of excess trafficcaused by an attack. A large number of probes, however, increases actual traffic delay and loss. We have shown thatusing probes with different drop precedences is necessary to infer loss in a QoS network. Our proposed load-basedmonitoring technique can aid in detecting attacks such as malicious traffic remarking or injection, without excessiveoverhead. Our approach can be integrated with an adaptive admission control or flow control scheme to regulate trafficdynamically and control an attack as soon as it is detected. The scheme can be used in any general network architecture(not only a QoS network).
References[1] A. Adams and et al. The use of end-to-end multicast measurements for characterizing internal network behavior.IEEE
Communications, 38(5), May 2000.
[2] D. Anderson, H. Balakrishnan, F. Kaashoek, and R. Morris. Resilient overlay network.In proc of 18th ACM Symp onOperating Systems Principles (SOSP), Banff Canada, Oct 2001.
[3] S. Blake, D. Black, M. Carlson, E. Davies, Z. Wang, and W. Weiss. An architecture for differentiated services. RFC 2475,December 1998.
[4] R. Braden, L. Zhang, S. Berson, S. Herzog, and S. Jamin. Resource ReSerVation Protocol (RSVP). RFC 2205, Sept 1997.
[5] Y. Breitbart and et al. Efficiently monitoring bandwidthand latency in IP networks.In proceedings of IEEE INFOCOM,Alaska, April 2001.
[6] T. Bu, N.G. Duffield, F. Lo Presti, and D. Towsley. Networktomography on general topologies.ACM SIGMETRICS, June2002.
[7] R. Caceres, N. G. Duffield, J. Horowitz, and D. Towsley. Multicast-based inference of network-internal loss characteristics.IEEE Transactions on Information Theory, Nov 1999.
[8] R. Callon, P. Doolan, N. Feldman, A. Fredette, G. Swallow, and A. Viswanathan. A framework for multiprotocol labelswitching. Internet Draft, 2000.
[9] J. Case, M. Fedor, M. Schoffstall, and J. Davin. A Simple Network Management Protocol (SNMP). IETF RFC 1157, May1990.
[10] M. C. Chan, Y.-J. Lin, and X. Wang. A scalable monitoringapproach for service level agreements validation. InProceedingsof the International Conference on Network Protocols (ICNP), pages 37–48, Nov 2000.
[11] M. J. Coates and R. Nowak. Network delay distribution inference from end-to-end unicast measurement.in Proc. of the IEEEInternational Conference on Acoustics, Speech,and SignalProcessing, May 2001.
10
[12] M. J. Coates and R. Nowak. Network loss inference using unicast end-to-end measurement.in Proc. ITC Conf. IP Traffic,Modeling and Management, Monterey, CA, Sept. 2000.
[13] D. F. DeLong. Hackers said to cost U.S. billions.E-Commerce Times Online, Feb 8, 2001.
[14] M. Dilman and D. Raz. Efficient reactive monitoring.In proceedings of IEEE INFOCOM, Alaska, April 2001.
[15] N. G. Duffield, F. Lo Presti, V. Paxson, and D. Towsley. Inferring link loss using striped unicast probes.In proceedings ofIEEE INFOCOM, April Alaska, April 2001.
[16] P. Ferguson and D. Senie. Network ingress filtering: Defeating denial of service attacks which employ ip source addressspoofing agreements performance monitoring. RFC 2827, May 2000.
[17] S. Floyd and V. Jacobson. Random early detection gateways for congestion avoidance.IEEE/ACM Transactions on Network-ing, 1(4):397–413, August 1993. ftp://ftp.ee.lbl.gov/papers/early.ps.gz.
[18] J. Heinanen, F. Baker, W. Weiss, and J. Wroclawski. Assured Forwarding PHB Group. RFC 2597, June 1999.
[19] V. Jacobson, K. Nichols, and K. Poduri. An Expedited Forwarding PHB. RFC 2598, June 1999.
[20] J. Jiao, S. Naqvi, D. Raz, and B. Sugla. Toward efficient monitoring. IEEE Journal on Selected Areas in Communications,18(5), April 2000.
[21] M Mahajan and et al. Controlling high bandwidth aggregates in the network. Technical Report, ACIRI, Feb 2001.
[22] M. May, J. Bolot, A. Jean-Marie, and C. Diot. Simple performance models of differentaited services schemes for the Internet.In proceedings of IEEE INFOCOM, New York, March 1999.
[23] S. McCanne and S. Floyd. Network simulator ns-2. http://www.isi.edu/nsnam/ns/, 1997.
[24] D. Moore, G. M. Voelker, and S. Savage. Inferring internet denial-of-service activity.In proceedings of USENIX, 2001.
[25] K. Nichols, S. Blake, F. Baker, and D. Black. Definition of the differentiated service field (DS field) in the IPv4 and IPv6headers. RFC 2474, December 1998.
[26] V. Paxson. Measurement and Analysis of End-to-End Internet Dynamics. PhD thesis, University of California, Berkeley,Computer Science Division, 1997.
[27] V. Paxson, G. Almes, J. Mahdavi, and M. Mathis. Framework for IP performance metrics. IETF RFC 2330, May 1998.
[28] S. Savage and et al. Detour: a case for informed internetrouting and transport.IEEE Micro, v 19, no 1, Jan 1999.
[29] S. Seshan, M. Stemm, and Katz R. H. Spand: Shared passivenetwork performance discovery.In proc of USENIX Symposiumon Internet Technologies and Systems (USITS ’97), Dec 1997.
[30] F. Shallwani, J. Ethridge, P. Pieda, and M. Baines. Diff-Serv implementation for ns.http://www7.nortel.com:8080/CTL/#software, 2000.
[31] Y. Tsang, M. J. Coates, and R. Nowak. Passive unicast network tomography based on TCP monitoring. Technical report,Nov. 2000.
[32] F. Zhi, S. W. Felix, T. S. Wu, H. Huang, and F. Gong. Security issues for differentiated service framework. Internet EngineeringTask Force Draft, October 1999.
11
Customer Egress
Core Router
Provider Egress
Provider Ingress
Customer Egress
Customer Domain
Customer Domain
Provider Ingress
Domain
SLA Monitor (Egress or BB)
Delay/Loss/Rate/ECN Measurements
Optional Loss Rate Measurements
Figure 1: An architecture for detecting SLA violations and bandwidth theft attacks. Assistance from core routers isoptional.
12
0
k
R R21
Figure 2: Binary tree to infer losses on 3 segments
13
C2
C1
C4
E1
E5
C3
E3E4
E6
E7C5
E2
Core Router
Edge Router
20 Mbps, 30 ms
10 Mbps, 20 ms
Figure 3: Topology used in simulations. All edge routers areconnected to multiple hosts.
14
20406080
100120140160180200
5 10 15 20 25 30
Ave
rage
del
ay (
ms)
Time (s)
E1-E6E1-E6 (idle)
E1-E7E5-E4
(a) Delay under light load
20406080
100120140160180200
5 10 15 20 25 30
Ave
rage
del
ay (
ms)
Time (s)
E1-E6E1-E6 (idle)
E1-E7E5-E4
(b) Delay with excessive traffic
Figure 4: Link delay patterns change with increasing trafficin the network domain.
15
0
0.2
0.4
0.6
0.8
1
0 50 100 150 200 250
% o
f tra
ffic
delay (ms)
10 probes/sec20 probes/sec
(a) Delay for different probe frequencies
0
10
20
30
40
50
60
70
80
0 5 10 15 20 25 30
% p
robe
loss
Time (s)
No Attack (5 probes/s)Attack (5 probes/s)
No Attack(10 probes/s)Attack 2 (10 probes/s)
(b) Probe loss
Figure 5: (a) Link delay slightly changes when more probes are introduced. (b) Probing at a low rate may be affectedby probe losses when excess traffic is introduced by an attacker.
16
0
0.05
0.1
0.15
0.2
0.25
0.3
0.35
5 10 15 20 25 30
Loss
Rat
io
Time (s)
actualLR(E3-E6)approxLR(E3-E6)actualLR(E1-E6)
approxLR(E1-E6)actualLR(E5-E4)
approxLR(E5-E4)
Figure 6: Loss approximation with the core-assisted scheme.
17
0
0.2
0.4
0.6
0.8
1
0 10 20 30 40 50 60
Loss
Rat
io
Time (s)
redgreen
yellow
Figure 7: Loss of probe packets in the presence of high excesstraffic. Green probes see high loss when a severe attackstarts. Yellow and Red probes experience high drops as expected
18
0.2
0.25
0.3
0.35
0.4
0.45
0.5
0.55
0.6
0 5 10 15 20 25 30
Loss
Rat
io
Time (s)
Actual lossfreq=10freq=20freq=25
(a) Inferred loss at various probing frequencies
0.2
0.22
0.24
0.26
0.28
0.3
0.32
0.34
0.2 0.22 0.24 0.26 0.28 0.3 0.32 0.34
Infe
rred
Los
s
Actual Loss
freq = 20freq = 25
y=x
(b) Scatter plot of inferred loss values
Figure 8: (a) Inferring loss of linkC4�E6 using striped unicast probes. “freq” denotes transmitted stripes per second.(b) Scatter plot of inferred loss values for different probing frequencies
19
2
2.5
3
3.5
4
4.5
5
5 10 15 20 25 30
Thr
ough
put (
Mbp
s)
Time (s)
BW F2BW F2 (Approx)
BW F1BW F1(Approx)
BW F4BW F4(Approx)
Figure 9: Throughput approximation results computed as in section 4
20
100
110
120
130
140
150
160
170
180
0 10 20 30 40 50 60
de
lay
(ms)
Time (sec)
<--------- severe attack ---------->
No AttackAttack 1Attack 2
Figure 10: Observed delay at the time of an attack. “Attack 1”results in packet loss in excess of 15-25%. “Attack 2”increases packet loss to more than 35%
21
0
0.1
0.2
0.3
0.4
0.5
0.6
0 10 20 30 40 50 60
loss
ra
tio
Time (sec)
<---------- severe attack ----------->
No AttackAttack 1Attack 2
Figure 11: Overall loss follows the same pattern as delay
22
-40
-20
0
20
40
60
80
100
Comm. overhead(1 sec)
Comm. overhead(10 hrs)
Accuracy(at 5 sec)
Convergence Time(sec)
Implematation overhead
ind
ex
Edge-to-edgeLoad-based
Core-assisted
Figure 12: Core-assisted, load-based and edge-to-edge approaches: A quantitative study. Negative values are used fordata for which a smaller index represents superior performance.
23