OK TEDI - Mining Data Online
120
OK TEDI MINING LIMITED ANNUAL REVIEW 2017
-
Upload
khangminh22 -
Category
Documents
-
view
2 -
download
0
Transcript of OK TEDI - Mining Data Online

OK TEDI MINING LIMITED ANNUAL REVIEW
2017


Morehead
Nomad
Boboa
Nukumba
Manda
Bosset
Aiambak
Nakaku
Obo
Sturt Island
LewadaTapila
KiungaAtkamba
Bige
Ningerum
Haidauwogam
IeranKonkonda
Balimo
Daru
Rumginae
Tabubil
Olsobip
Telefomin
Oksapmin
IND
ON
ES
IA
PA
PU
A N
EW
GU
INE
A
BAMU
GOGODALA
ORIOMO-BITURI
KIWAI
DARU URBAN
MOREHEAD
NOMAD
OLSOBIP
STAR MOUNTAINS
NINGERUMKIUNGARURAL
W E S T E R N P R O V I N C E
M I D D L E F L Y D I S T R I C T
S O U T H F L Y D I S T R I C T
N O R T H F L Y D I S T R I C T
S A N D A U N P R O V I N C E
S O U T H E R NH I G H L A N D SP R O V I N C E
G U L F P R O V I N C E
A R A F U R A S E A
Lake Murray
Fly River
Burei River
Everill Junction
Massey Bakers Junction
HerbertRiver
AguRiver
IokeRiver
Ok Tedi River
Binge River
Bituri River
Strickland River
REGION MAP KEY CONTENTS
Highlights 2017 2
Company Profile 4
Mission, Vision & the Ok Tedi Way 6
Chairman’s Report 8
Managing Director/Chief Executive Officer’s Report 10
Governance 12
Materiality 18
Safety and Occupational Health 20
Business Review and Outlook 28
Geology 36
People 44
Environment 50
Social Responsibility 62
Finance 76
Financial Statements 81
Audited Financial Statements 83
General Standard Disclosures 111
Global Reporting Initiative Verification Statement 114
Abbreviations 115
Contacts and Acknowledgements 116
Mine Area
Nupmo
Tutuwe
Wai-Tri & Alice River
Middle Fly
Suki Fly Gogo
Dudi - South Bank
Manawete - North Bank
Kiwaba
LEGEND
CMCA TRUST AREAS
Mine Area
Nupmo
Tutwe
Wai-Tri & Alice River
Middle Fly
Suki Fly Gogo
Manawete - North Bank
Kiwaba
Dudi - South Bank
International Border
Provincial Border
District Boundary
Local Level Government Boundary
Main Highway (Tabubil – Mill)
Provicial Road
Proposed Road
Major OTML Environmental Monitoring Stations
Sub District
Community Relations/OTDF Field Base
Mine Project Site
TABUBIL
KIUNGA PORTMORESBY
0 100
Kilometres
5025 75
International Border
LEGEND
CMCA TRUST AREAS
Mine Area
Nupmo
Tutwe
Wai-Tri & Alice River
Middle Fly
Suki Fly Gogo
Manawete - North Bank
Kiwaba
Dudi - South Bank
International Border
Provincial Border
District Boundary
Local Level Government Boundary
Main Highway (Tabubil – Mill)
Provicial Road
Proposed Road
Major OTML Environmental Monitoring Stations
Sub District
Community Relations/OTDF Field Base
Mine Project Site
TABUBIL
KIUNGA PORTMORESBY
0 100
Kilometres
5025 75
Provincial Border
LEGEND
CMCA TRUST AREAS
Mine Area
Nupmo
Tutwe
Wai-Tri & Alice River
Middle Fly
Suki Fly Gogo
Manawete - North Bank
Kiwaba
Dudi - South Bank
International Border
Provincial Border
District Boundary
Local Level Government Boundary
Main Highway (Tabubil – Mill)
Provicial Road
Proposed Road
Major OTML Environmental Monitoring Stations
Sub District
Community Relations/OTDF Field Base
Mine Project Site
TABUBIL
KIUNGA PORTMORESBY
0 100
Kilometres
5025 75
District Boundary
LEGEND
CMCA TRUST AREAS
Mine Area
Nupmo
Tutwe
Wai-Tri & Alice River
Middle Fly
Suki Fly Gogo
Manawete - North Bank
Kiwaba
Dudi - South Bank
International Border
Provincial Border
District Boundary
Local Level Government Boundary
Main Highway (Tabubil – Mill)
Provicial Road
Proposed Road
Major OTML Environmental Monitoring Stations
Sub District
Community Relations/OTDF Field Base
Mine Project Site
TABUBIL
KIUNGA PORTMORESBY
0 100
Kilometres
5025 75
Local Level Government Boundary
LEGEND
CMCA TRUST AREAS
Mine Area
Nupmo
Tutwe
Wai-Tri & Alice River
Middle Fly
Suki Fly Gogo
Manawete - North Bank
Kiwaba
Dudi - South Bank
International Border
Provincial Border
District Boundary
Local Level Government Boundary
Main Highway (Tabubil – Mill)
Provicial Road
Proposed Road
Major OTML Environmental Monitoring Stations
Sub District
Community Relations/OTDF Field Base
Mine Project Site
TABUBIL
KIUNGA PORTMORESBY
0 100
Kilometres
5025 75
Main Highway (Tabubil – Mill)
LEGEND
CMCA TRUST AREAS
Mine Area
Nupmo
Tutwe
Wai-Tri & Alice River
Middle Fly
Suki Fly Gogo
Manawete - North Bank
Kiwaba
Dudi - South Bank
International Border
Provincial Border
District Boundary
Local Level Government Boundary
Main Highway (Tabubil – Mill)
Provicial Road
Proposed Road
Major OTML Environmental Monitoring Stations
Sub District
Community Relations/OTDF Field Base
Mine Project Site
TABUBIL
KIUNGA PORTMORESBY
0 100
Kilometres
5025 75
Provincial Road
LEGEND
CMCA TRUST AREAS
Mine Area
Nupmo
Tutwe
Wai-Tri & Alice River
Middle Fly
Suki Fly Gogo
Manawete - North Bank
Kiwaba
Dudi - South Bank
International Border
Provincial Border
District Boundary
Local Level Government Boundary
Main Highway (Tabubil – Mill)
Provicial Road
Proposed Road
Major OTML Environmental Monitoring Stations
Sub District
Community Relations/OTDF Field Base
Mine Project Site
TABUBIL
KIUNGA PORTMORESBY
0 100
Kilometres
5025 75
Proposed Road
LEGEND
CMCA TRUST AREAS
Mine Area
Nupmo
Tutwe
Wai-Tri & Alice River
Middle Fly
Suki Fly Gogo
Manawete - North Bank
Kiwaba
Dudi - South Bank
International Border
Provincial Border
District Boundary
Local Level Government Boundary
Main Highway (Tabubil – Mill)
Provicial Road
Proposed Road
Major OTML Environmental Monitoring Stations
Sub District
Community Relations/OTDF Field Base
Mine Project Site
TABUBIL
KIUNGA PORTMORESBY
0 100
Kilometres
5025 75
Major OTML Environmental Monitoring Stations
LEGEND
CMCA TRUST AREAS
Mine Area
Nupmo
Tutwe
Wai-Tri & Alice River
Middle Fly
Suki Fly Gogo
Manawete - North Bank
Kiwaba
Dudi - South Bank
International Border
Provincial Border
District Boundary
Local Level Government Boundary
Main Highway (Tabubil – Mill)
Provicial Road
Proposed Road
Major OTML Environmental Monitoring Stations
Sub District
Community Relations/OTDF Field Base
Mine Project Site
TABUBIL
KIUNGA PORTMORESBY
0 100
Kilometres
5025 75
Sub District
LEGEND
CMCA TRUST AREAS
Mine Area
Nupmo
Tutwe
Wai-Tri & Alice River
Middle Fly
Suki Fly Gogo
Manawete - North Bank
Kiwaba
Dudi - South Bank
International Border
Provincial Border
District Boundary
Local Level Government Boundary
Main Highway (Tabubil – Mill)
Provicial Road
Proposed Road
Major OTML Environmental Monitoring Stations
Sub District
Community Relations/OTDF Field Base
Mine Project Site
TABUBIL
KIUNGA PORTMORESBY
0 100
Kilometres
5025 75
Community Relations/OTDF Field Base
LEGEND
CMCA TRUST AREAS
Mine Area
Nupmo
Tutwe
Wai-Tri & Alice River
Middle Fly
Suki Fly Gogo
Manawete - North Bank
Kiwaba
Dudi - South Bank
International Border
Provincial Border
District Boundary
Local Level Government Boundary
Main Highway (Tabubil – Mill)
Provicial Road
Proposed Road
Major OTML Environmental Monitoring Stations
Sub District
Community Relations/OTDF Field Base
Mine Project Site
TABUBIL
KIUNGA PORTMORESBY
0 100
Kilometres
5025 75
Mine Project Site
LEGEND
CMCA TRUST AREAS
Mine Area
Nupmo
Tutwe
Wai-Tri & Alice River
Middle Fly
Suki Fly Gogo
Manawete - North Bank
Kiwaba
Dudi - South Bank
International Border
Provincial Border
District Boundary
Local Level Government Boundary
Main Highway (Tabubil – Mill)
Provicial Road
Proposed Road
Major OTML Environmental Monitoring Stations
Sub District
Community Relations/OTDF Field Base
Mine Project Site
TABUBIL
KIUNGA PORTMORESBY
0 100
Kilometres
5025 75
Existing Representative Monitoring Sites
OK TEDI MINING LIMITED
ANNUAL REVIEW 2017
This 2017 Annual Review presents the integrated financial and non-financial results of the OTML operations at Mt Fubilan and supporting operations.
ANNUAL REVIEW 2017 1
2 OK TEDI MINING LIMITED
ENVIRONMENTAL
PEOPLE
HIGHLIGHTS 2017
Continued COMMITMENT TO ENVIRONMENTAL OUTCOMES with PGK 180 M (USD 56.3 M) spent on environmental programs
MINE WAS COMPLIANT with environmental criteria
96% OF THE WORKFORCE is of Papua New Guinean origin
1,651 WORKFORCE at 31 December 2017, including 148 TRAINEES
INVESTED PGK 16.4 M (USD 5.2 M) on EDUCATION and training of graduates, apprentices, trade trainees and school and university scholarships
Contributed 3.8% OF PNG’S GDP
GROSS OPERATING REVENUE OF PGK 3,253 M (USD 1,019 M)
PGK 848 M (USD 266 M) profit after tax
PGK 784 M (USD 246 M) free cash flow
PGK 380 M (USD 119 M) dividend paid
STRENGTHENED FINANCIAL POSITION – debt free with PGK 581 M (USD 180 M) in cash reserves
CASH COSTS IN FIRST QUARTILE of global copper producers
Provided VALUABLE SOURCE OF FOREIGN CURRENCY into PNG market
Committed to our vision of “NOBODY GETS HURT”
IMPROVED SAFETY PERFORMANCE with a Lost Time Injury Frequency Rate of 0.09 (one lost time injury), lower than in 2016 (0.58) and the lowest rate in eighteen years
CONSOLIDATED ITS POSITION as a globally competitive, low cost, copper producer
PROUD PNG-OWNED COMPANY with the transfer of additional OK Tedi equity to Landowner companies in progress (from 12.2% to 33%)
Achieved the HIGHEST MINE PRODUCTION, ore processed and metal production in the last five years
OK TEDI MINING HIGHLIGHTS 2017
ECONOMIC

ANNUAL REVIEW 2017 3
SINCE THE START OF MINING OPERATIONS IN 1984 OTML HAS PRODUCED
COPPER
GOLDSILVER
PROVIDED PGK 17.3 M (USD 5.4 M) for Ok Tedi Development Foundation (OTDF) programs
Total contribution of PGK 1,374 M (USD 428 M) to the Province and PNG economy
CONTRIBUTED PGK 5.5 M (USD 1.7 M) to Tax Credit Scheme infrastructure projects
PROCURED 48% of the total value of goods and 73% OF SERVICE CONTRACTS from PNG businesses
Responded to 100% of community complaints and grievances
THE LONGEST running open-pit copper, gold and silver mine in PNG
THE LARGEST electric power generator and user in the Western Province
THE ONLY large copper mine to separate sulphides from the tailings prior to tailings discharge
THE SINGLE largest employer in the Western Province
The Total Recordable Injury Frequency Rate was 1.53, an IMPROVEMENT on 2016 (2.43)
SAFETY AND OCCUPATIONAL HEALTH
SOCIAL
100% PNG OWNED BY THE STATE AND LANDOWNERS
4.75
14.6
31.4
MILLIONTONNES
MILLIONOUNCES
MILLION OUNCES
TO LEARN MORE ABOUT OTML AND THIS ANNUAL REVIEW, VISIT: WWW.OKTEDI.COM OR CONTACT: [email protected]

4 OK TEDI MINING LIMITED
Success is measured by safety performance, financial performance, social development programs and the management and mitigation of environmental impacts.
The Global Reporting Initiative’s (GRI) G4 reporting guidelines have been used in this Annual Review to guide the disclosure of non-financial material information. This report is the fifth report prepared according to the GRI Core General Standard Disclosures of reporting and the Mining and Metals Sector Supplement, based on the material aspects for the Company. The non-financial GRI reporting has been selectively verified externally by Materiality Counts Pty Ltd and the verification statement is included in this report.
OTML’s registered office and senior management team are located in Tabubil. Support operations are based in Tabubil, Kiunga Port and Bige (the site for pyrite concentrate storage and the sediment recovery facility). OTML also has a representative office in Port Moresby, PNG and a marketing and logistics office in Brisbane, Australia. In addition to the Special Mining Lease (SML), the Company holds a tenement portfolio of several Exploration Leases (ELs), Leases for Mining Purposes (LMPs) and leases under the PNG Land Act.
OTML has made a significant contribution to development in the Western Province through direct and indirect employment, royalties, compensation payments, business opportunities and training. Benefits from the mine are directed to Western Province communities, specifically the Mine Villages, Community Mine Continuation Agreement (CMCA) communities, the Fly River Provincial Government (FRPG) and the Independent State of PNG.
The Company has continued to be responsible for environmental and social impacts including sediment aggradation in the Ok Tedi and Fly River systems, through various mitigation programs, monitoring and reporting to the communities and the State. OTML’s future is dependent upon consent from the CMCA communities as well as the Provincial and National Governments. Success is measured by safety performance, financial performance, social development programs and the management and mitigation of environmental impacts.
This 2017 Annual Review presents the integrated financial and non-financial results of the OTML operations at Mt Fubilan and supporting operations. The financial statements have been prepared in accordance with the Papua New Guinea Companies Act of 1997 and these comply with the International Financial Reporting Standards (IFRS) and other generally accepted PNG accounting practices. External Auditor PriceWaterhouseCoopers (PWC) has audited the financial statements and the audit opinion is included in this report.
Ok Tedi Mining Limited (OTML, or the Company)
is owned by the Independent State of
Papua New Guinea (PNG) and has been operating
an open-pit copper, gold and silver mine located
in the Star Mountains of the Western Province, PNG for over 30 years.
COMPANY PROFILE

ANNUAL REVIEW 2017 5
ABOVE: New mine maintenance workshop, mine offices and crushed ore stockpile.
REPORT BOUNDARYThis Annual Review relates to the material activities of the Ok Tedi mining operations comprising the mining and processing of ore from the Mt Fubilan deposit, the transportation of slurry concentrates to Kiunga and the shipping thereof to the silo and/or transfer vessel in Port Moresby. Included in this report are the transportation of waste sulphide concentrate slurry from the tailing pyrite processing plant to Bige for placement in engineered containment cells and the dredging of sands and sediment at Bige from the Ok Tedi River. This report does not cover the copper concentrate product after transfer from the Company’s silo vessel onto export vessels.
This Annual Review covers the 2017 calendar year with 2016 comparatives where available.
Historical data can be found on the Ok Tedi website in previous Annual Reviews. This Annual Review also includes where applicable, forward looking information for 2018.
OTML remits an annual Environmental Report to the PNG Conservation and Environment Protection Authority (CEPA) and the Mineral Resources Authority (MRA) presenting the results of compliance monitoring and research. The 2017 environmental information in this report is for the full 2017 calendar year.
OTML’s performance data is presented in the metric system. Unless otherwise stated, all monetary amounts are quoted in PGK (Papua New Guinea Kina) and USD (United States Dollars).
CHANGES AND/OR RESTATEMENTS FOR THE 2016 ANNUAL REVIEWIf erroneous data or information was published in the 2016 Annual Review, then acknowledgement of the error/s is announced and rectified in the current Annual Review.
In 2016, the total riverine disposal was stated (p 64) as 48,589,000 tonnes. The correct number was 48,549,000 tonnes.
In 2016, the tonnes of scrap metal shipped for recycling was stated (p 64) as 2,627 tonnes. The correct number was 2,461 tonnes.

6 OK TEDI MINING LIMITED
OUR VISION is that Nobody Gets Hurt, operating as one integrated team, with a high-performance culture, reflected in everything that we do.
THE ”OK TEDI WAY” DESCRIBES;
WHO OK TEDI IS: OTML is a Papua New Guinean company focused on the safe, reliable
and profitable development of the Mt Fubilan resource.
Our core business is the mining and processing of copper and gold into a concentrate.
We aim to be a high-performance organisation, maximising economic extraction of the resource, providing a superior return to our shareholders and continuously improving against the competition.
We provide interesting and challenging work for our employees and recognise and reward performance.
We respect the environment and communities within which we operate.
OTML HAS BEEN OPERATING SUCCESSFULLY IN PNG FOR MORE THAN 30 YEARS EXTRACTING COPPER, GOLD AND SILVER FROM THE MT FUBILAN OPEN PIT.
MISSION, VISION

ANNUAL REVIEW 2017 7
HOW OK TEDI OPERATES:
We develop and pursue business strategies and plans that maximise value.
We have clear job accountabilities and the authority to act. We expect and encourage performance improvement and stretch.
Support functions are lean and closely integrated into the operation, providing either functional support or the protection of our social licence to operate.
We reward excellence, differentiating on the basis of performance.
We provide our people with the training and tools to develop, consistent with the business needs.
Non-core work is considered for outsourcing to specialist providers.
We operate as one team, recognising inter-dependencies – a One Team, Wan Pasin culture.
THE OK TEDI VALUES THAT GUIDE EXPECTED BEHAVIOURS OF ALL PEOPLE IN OUR COMPANY:
SAFETY, ENVIRONMENT - we care about our employees, business partners and our communities’ well-being.
INTEGRITY – we expect honesty, trust, fairness and respect.
ACCOUNTABILITY – we own our jobs, we meet our commitments.
TEAMWORK – our goals are common, our successes shared.
PERFORMANCE – we give our best every day and seek to continuously improve.
SUSTAINABILITY – we use what we need and conserve what we can.
& THE OK TEDI WAY

8 OK TEDI MINING LIMITED
Through the combined efforts of our employees and contractor partners we have been able to meet internal production targets in 2017. Our operations delivered the highest mine production, ore processed and metal production for the last five years. Pleasingly, these results were achieved while sustaining the cost reductions reported last year.
This performance delivered an after-tax profit of PGK 848 million (USD 266 million) and generated PGK 784 million (USD 246 million) of free cash-flow. This in turn allowed the Company to distribute PGK 380 million (USD 119 million) of dividends in 2017, whilst retaining sufficient liquidity to fund high value growth opportunities identified in the Company’s strategic business plan. The Company also played an important role in generating foreign currency with USD 1 billion of sales revenue generated during the year.
I wish to thank management and the workforce of Ok Tedi for their continued commitment and valued contribution.
In November 2017, the tenure of the Board appointments expired. In recognition of progress made by the Company, the Trustee Shareholder renewed director’s appointments for a further three years in accordance with applicable Board governance requirements. This included retention of long standing director Dr Weiss as Special Economic Advisor. I would also like to take this opportunity to acknowledge our Trustee Shareholder, the Prime Minister of PNG, the Honourable Peter O’Neill CMG, for his continued and valued support.
The Board remains both optimistic and confident about the outlook for OTML and looks forward to a successful 2018.
SIR MOI AVEI, KBEChairman
CHAIRMAN’S REPORT
ABOVE: Ok Tedi Chairman, Sir Moi Avei.
Our safety vision is “Nobody Gets Hurt” and the OTML Board remains strongly committed to achieving this outcome. Nothing we do in our business is more important than the safety and health of our employees, contractors, and communities. I am pleased to report that in 2017, there was a substantial reduction in injuries sustained. This reflected in the lowest lost time injury frequency rate recorded in the last eighteen years.
At Ok Tedi, our licence to operate remains closely linked to our environmental performance and relationships with communities. During the year, the operation maintained its efforts to minimise the impacts of the mining and processing operations and continued to comply with the Ok Tedi environmental regime. We expect that the current environmental regime will be replaced by new legislation (the Ok Tedi Environment Management Act (OTEMA)) in early 2018. The Company is prepared and committed to meet the new requirements.
The Company also continues to make significant contributions to services and infrastructure development in areas affected by the mine through its community development programs. The OTDF, a subsidiary of OTML, serves as the vehicle for delivering projects and services funded by contributions made by OTML directly and through the CMCA Trusts and the Tax Credit Scheme (TCS). OTDF serves this purpose with the eventual goal of broadening its shareholder base and expanding its role to be a significant contributor to long-term development in the Western Province.
As reported last year, the State, the Fly River Provincial Government (FRPG) and the CMCAs, reached agreement whereby the FRPG and special purpose community entities, will collectively hold a 33% equity interest in Ok Tedi, with the State retaining the balance. This change, expected to be completed in 2018, will serve to further strengthen the relationship between Ok Tedi and our host communities. OTML will remain a proud PNG-owned company.
I am pleased to present our annual report for
2017, detailing progress made over the past year to strengthen
safety and operational performance and the Company’s financial
position. In 2017, Ok Tedi consolidated its position as a globally competitive copper mining company.
OPPOSITE: Loading waste from West Wall of Mt Fubilan open pit.

ANNUAL REVIEW 2017 9

10 OK TEDI MINING LIMITED
Pleasingly, improved operational performance has been achieved in conjunction with ongoing cost containment. This has allowed the full benefit of improving commodity prices to be realised. The Company was able to sustain its position as a globally competitive copper producer with a C1 cost of $0.93/lb, being within the lowest quartile of global copper producers. As a result, the Company has generated a profit of PGK 848 million and free cash flow of PGK 784 million after funding PGK 174 million of capital expenditure and before distribution of PGK 380 million in dividends.
At 31 December 2017, the Company had no borrowings and PGK 581 million in cash. We are well positioned to fund a major project approved by the Board in August 2017, the replacement and relocation of the in-pit crusher at a cost of around PGK 650 million. This high value opportunity was identified in our 2016 strategic planning cycle and is expected to generate a return that significantly exceeds our investment by allowing access to additional ore.
In 2018, our attention will be directed towards taking the next step in operational performance. Through a structured business improvement program, “Pasin Ok Tedi”, we are focused on fully utilising the resources we have. The next increment of performance improvement will come through strengthening the capability of our people, refining our management systems and processes, improving equipment reliability and leveraging technology. We will also continue to invest in exploration and resource development and are optimistic about the potential outcomes.
Finally, I wish to thank Ok Tedi employees and contractors, as one team working to further strengthen the Company. I look forward to the ongoing support of our workforce, communities and shareholders as we strive to continuously improve our performance in 2018.
PETER GRAHAM, CBEManaging Director and Chief Executive Officer
MANAGING DIRECTOR/CHIEF EXECUTIVE OFFICER’S REPORT
OPPOSITE: Blast hole drilling in the open pit.
ABOVE: Ok Tedi Managing Director/CEO Mr Peter Graham
Through the combined efforts of our employees and contractor partners we have made substantial improvement in our safety performance. The LTIFR of 0.09 (one lost time injury) was lower than that for 2016 (0.58) and was the best result in eighteen years. The TRIFR was 1.53, a strong improvement on 2016 (2.43), but with considerable room for improvement.
We remain committed to our vision of ‘Nobody Gets Hurt”. Key themes include visible safety leadership, building capability to sustain the desired safety cultural change, applying sound risk management to the planning and execution of all operational activities, and improving systems and standards.
We maintained our strong focus on management of environmental impacts and on strengthening relationships with mine impacted communities through regular communications, contracting with local and regional suppliers, and investments in education and health and various programs aimed at improving self-sustainability.
From an operational perspective, 2017 represented an important step in our efforts to continuously improve performance. In 2016, our primary focus was managing the complex re-start and ramp-up after the dry weather outage. This allowed us to restore profitability and repay debt accumulated during the outage period. Considerable progress was also made in reworking business strategy and identifying key value opportunities for the business. In 2017, we have built on those foundations and consolidated the gains made.
With improved discipline in execution of plans, we achieved an increase in average monthly production rates in both the mine and the mill. Total material mined (ore and waste) in 2017, was 84.6 million tonnes (Mt) or 7.1 Mt per month (Mtpm). This compared favourably with the 2016 rate (5.8 Mtpm). Ore processed in 2017 was 20.1 Mt (or 1.7 Mtpm), which was higher than in 2016 (1.6 Mtpm).
As a result, 2017 copper production increased from 80 thousand tonnes (Kt) (or 8 thousand tonnes per month (Ktpm)) in 2016 to 105 Kt (8.8 Ktpm). Gold production increased from 218 thousand ounces (Koz) (22 thousand ounces per month (Kozpm) in 2016 to 271 Koz (23 Kozpm).
In 2017, Ok Tedi delivered strong results in all
aspects of the business, consolidating our
position as a globally competitive copper mining company. Ok
Tedi is now firmly established as one of
the lower cost producers of copper in the world,
something that all of our stakeholders can
take pride in. Our best months of performance
in 2017 also exposed valuable opportunities
for continuous improvement in 2018.

ANNUAL REVIEW 2017 11

12 OK TEDI MINING LIMITED
OTML is an unlisted PNG majority State Owned Enterprise (SOE) operating in accordance with the Papua New Guinea Companies Act (1997). The Company is committed to maintaining robust corporate governance practices. This includes monitoring and adopting as appropriate, contemporary international practices such as the guidance principles of the Australian Stock Exchange Corporate Governance Council as follows:
• Majority of the Directors are independent;
• The Chairman is independent;
• The Board of Directors (or the Board) has three standing committees; and
• Non-executive Directors do not receive any short or long-term incentives, equity-based remuneration or retirement/termination benefits.
OK TEDI BOARD OF DIRECTORSThe Board holds primary responsibility for the governance of OTML and operates in accordance with the Company’s constitution and applicable legislation. The profile of each board member can be found on the OTML website, www.oktedi.com/about-us/board-of-directors.
Supporting the Board are three standing committees - Appointment and Remuneration, Audit and Risk and Safety, Health, Environment and Community (SHEC).
The composition of the Ok Tedi Board of Directors as at 31 December 2017, is shown in the table below:
YEAR 2017
BOARD MEMBER POSITION STATUS DATE APPOINTED COMMITTEE FUNCTION
Sir Moi Avei, KBE
Chairman Independent 01-Nov-17 Chairman – Appointment and Remuneration
Mr Peter Graham, CBE
CEO and MD Ex-Officio 01-Nov-17 Member – Appointment and Remuneration, Safety, Health Environment and Community
Dr Roger Higgins Non-executive Director
Independent 01-Nov-17 Chairman – Safety, Health and Environment and Community
Mr Glen Kuri Non- executive Director
Independent 01-Nov-17 Member – Safety, Health and Environment and Community
Dr Jacob Weiss1, CMG
Special Economic Advisor
01-Nov-17 Chairman – Audit and Risk, Member – Appointment and Remuneration
1 Dr Weiss, a long-term OTML director, was appointed instead in November 2017 as Special Economic Advisor.
THE APPOINTMENT AND REMUNERATION COMMITTEEThe Appointment and Remuneration Committee provides advice and recommendations to the Board regarding remuneration policies and practices for directors, executives and other employees, to ensure fair reward having regard to Company performance, individual performance and current industry practice. The Committee also provides advice and recommendations to the Board on senior executive succession and processes to identify and develop key talent. In addition, the Committee oversees and monitors strategies to promote diversity. The Appointment and Remuneration Committee members are Sir Moi Avei (chairman), Dr Jacob Weiss (member) and Mr Peter Graham (member).
GOVERNANCE
OPPOSITE: Don Tepi conducting vibration monitoring in the processing plant.

ANNUAL REVIEW 2017 13

OK TEDI MINING LIMITEDTotal Shares = 192,700,000
STATE OF PNG 87.80%
MROT NO.2 LIMITED 12.20%
23,500,000 Shares 169,200,000 Shares
14 OK TEDI MINING LIMITED
GOVERNANCE CONTINUED
THE AUDIT AND RISK COMMITTEEThe role of the Audit and Risk Committee is to assist the Board to fulfil its corporate governance and oversight responsibilities in relation to financial reporting, accounting policies, internal control systems, internal and external audit and compliance functions. This Committee also reviews policies, processes, practices and reporting systems relevant to the Company’s exposure to business and financial risk, to ensure that all identified material risks have clearly defined ownership/oversight within the Board and Committee structure. The committee reports to the Board following each committee meeting. The Audit and Risk Committee members are Dr Jacob Weiss (chairman) and one vacant Non-Executive Director position. Mr Peter Graham (MD and CEO) and Mr Cameron Clark (Company Secretary and GM Commercial) attend as invitees.
THE SAFETY, HEALTH, ENVIRONMENT AND COMMUNITY COMMITTEEIn August 2017, the charter of the former Safety, Health and Environmental (SHE) committee was changed to include Community (SHEC). A new SHEC Charter was approved by the Board.
The SHEC Committee comprises two Non-Executive Directors, Managing Director and an OTML management representative. The Committee is responsible for reviewing SHEC policies, operational risk register and the effectiveness of SHEC systems, SHEC indicator performance and significant incidents. The committee reports to the Board following each Committee meeting. The SHEC Committee members are Dr Roger Higgins (chairman), Mr Glen Kuri (member), Mr Peter Graham (member) and Mr Mark Thompson (GM Operations Support, member).
BOARD MAIN ISSUES During 2017, the Board and Standing Committees met on eight occasions. Issues considered included:
• Approval of key economic assumptions used for planning and evaluation purposes;
• Approval of plans including; 2017 Strategic Business Plan; Three Year Plan (2018 to 2020), and the 2018 Annual Budget;
• Approval of Delegation of Authorities, Policies, Code of Conduct and Business Ethics;
• Consideration and approval of operational matters exceeding the delegated authority of Management; and
• Approval of the 2017 bonus and 2018 salary program for OTML employees.
SHAREHOLDER STRUCTUREThe shareholder structure for OTML as at 31 December 2017 is shown below:
Decision 183/2016 of the National Executive Council “Allocation of Direct Equity in OTML to Fly River Provincial Government, CMCA and Mt Fubilan Landowners (33% Direct Equity in OTML)” confirmed the intent of the State to increase equity held to 33% in OTML. This decision is expected to be formalised by way of execution of relevant share transfers in 2018.
The Board holds primary responsibility for the governance of OTML and operates in accordance with the Company’s constitution and applicable legislation.

ANNUAL REVIEW 2017 15
CODE OF CONDUCT AND BUSINESS ETHICSThe Code of Conduct and Business Ethics (The Code) provides guidance to Directors, employees and stakeholders on adhering to the highest standards of business conduct and compliance with the law and best practise. It recognises that as a leading PNG company, OTML must apply the highest ethical standards to its operations, its contract partners and employees. The Code covers the use of Company’s resources and information, fraud, confidential and proprietary information, conflict of interest, gifts and entertainment, outside directorships, financial inducements and political contributions.
LEGAL REGISTER AND OBLIGATIONS COMPLIANCE SYSTEMIn 2017, OTML completed a comprehensive review and upgrade of the Legal Compliance Register. The Legal Compliance Register is used to ensure accountability and proper management and compliance of legal obligations and to identify, document and periodically review changes. The system includes permits, licenses and reports and has been used to capture other obligations which are relevant to OTML operations.
EXTERNAL STANDARDS, INITIATIVES AND GUIDELINESOTML measures its performance against Papua New Guinean and international standards, initiatives and guidelines. OTML uses the following standards and guidelines in continuous improvement of its operating systems:
• ISO14001:2004, the International Standard for Environmental Management Systems;
• OHSAS 18001:2007, the International Safety Management Standard;
• AS/NZS ISO31000:2009, Risk Management, Principles and Guidelines;
• The International Finance Corporation Performance Standards on Social and Environmental Sustainability for operating projects;
• The GRI G4 sustainability reporting framework and guidelines;
• Mining (Safety) Act & Regulations;
• Mining Act;
• PNG Companies’ Act; and
• International Financial Reporting Standards (IFRS).
The Company complied with its various licences and permits during 2017 and no fines or sanctions were issued to OTML by the regulatory authorities.
ABOVE: Ben John at the central engineering workshop repairing a shovel bucket.

16 OK TEDI MINING LIMITED
THE EXTRACTIVE INDUSTRIES TRANSPARENCY INITIATIVE The Extractive Industries Transparency Initiative (EITI) is a global standard that promotes transparency and accountability in the oil, gas and mining sectors. EITI implementation has two core components being transparency (disclosure of company information about their operations, including payments to the government and the government disclose of its receipts and other relevant information on the industry) and accountability, whereby a multi-stakeholder group comprising representatives from the government, companies and civil society oversee the process and communicate the findings of the EITI reporting and promote the integration of EITI into broader transparency and accountability effort.
In 2017, the State published its first EITI report disclosing expenditure in 2013 from the extractive industries sector. OTML information was included as a SOE and was mainly sourced from the 2013 Annual Review. In December 2016, OTML participated in a survey from the EITI working group requesting 2014 data. In August 2017, OTML provided the 2015 and 2016 requested data to the EITI office. OTML will continue to publish its payments to all stakeholders in line with the EITI and GRI reporting requirements, through the Annual Review process.
RISK MANAGEMENT AND THE PRECAUTIONARY APPROACHOTML uses a risk-based approach to guide the Company through the identification of major hazards and risks in the workplace and from external sources that could impact on the business. OTML’s risk management system is based on AS/NZS ISO31000:2009. Enterprise Risk Management is used when evaluating economic, environmental or social aspects of mining projects and major changes to the business.
During 2017, OTML commenced a review of major operational hazards (risks) and convened risk review workshops with knowledgeable persons to review the risks and identify critical controls to reduce the risks. The assessment of current controls for the following top four risk areas was completed:
• Ground Control (Mt Fubilan Pit West Wall);
• Confined Space;
• Working at Heights; and
• Vehicle Interactions (mobile plant).
The Board reviews significant business risks with the assistance of established standing committees. The precautionary principle is applied where there may be a lack of evidence to assist in the development of appropriate management plans.
GOVERNANCE CONTINUED

ANNUAL REVIEW 2017 17
REPORTINGThis Annual Review provides a comprehensive overview of the Company’s activities and financial outcomes. The financial statutory accounts of the report are audited by PWC PNG against the IFRS and other generally accepted accounting practices in PNG.
The non-financial reporting aspects of the Annual Review have been developed using the GRI Standards Core reporting guidance. The specific Disclosure on Management Approach and indicator summary is located in the back of this Annual Review. The Annual Review has been partially verified against the GRI requirements by Materiality Counts Pty Ltd, an Australian assurance consulting firm.
AUDITING
INSURANCE AUDITIn January 2018, the International Mining Industry Underwriters (IMIU) completed OTML’s operational annual risk external audit and presented a final risk assessment underwriters report to OTML.
OTML continues to be well regarded in terms of commitment to risk mitigation. In 2018, the IMIU determined a Risk Exposure Number of 38.2 for OTML, an improvement on the IMIU global average of 43.6, that compares other mining operations around the world. Ok Tedi has better than average commercial attractiveness to insurers.
FINANCIAL AUDITThe financial statements of the Company for the year ending 31 December 2017 have been audited by PWC PNG and their Independent Auditor’s Report is included in this Annual Review.
ABOVE: Processing plant tailings thickener.

18 OK TEDI MINING LIMITED
MATERIALITY
OTML has a comprehensive community engagement program with a wide range of stakeholders who can directly and/or indirectly impact or be impacted by the Company and its operational activities. The Company holds formal engagement meetings with key stakeholders including the CMCA communities, National and Provincial Governments, Suppliers, Customers, Contractors and Employees.
OTML has applied a broad approach to the identification and assessment of material topics through the collation of information from internal and external sources. Topics of significance are identified through internal risk registers, major hazard reviews, corporate policies and strategic reviews.
The collation and assessment of material topics includes the determination of the extent of the opportunity or impact on various stakeholders within OTML’s sphere of influence, which has a broad reach across Western Province.
This Annual Review incorporates information on the material topics and the potential impact on OTML by its stakeholders. The following table highlights the most significant material topics, potential impacts and OTML management controls. Further information can be found in each of the Annual Review sections.
ISSUEKEY STAKEHOLDERS CONCERNED ISSUE DESCRIPTION AND CHALLENGES OTML ACTIONS
ANNUAL REVIEW SECTION
Delivery of the Strategic Plan
OTML, Government, Communities and Suppliers
Meet planned mining and processing production rates, balanced with management of the safety, technical, environmental, social and operational challenges.
Further pit wall instability is a major risk to the delivery of OTML’s Strategic Plan.
Completion of comprehensive external geotechnical reviews of pit designs. Updated operational management plans and operator training. Creation of a dedicated team to manage pit wall stability issues.
Business Review and Outlook
Waste rock, tailings and pyrite management
OTML, Communities and Government
Waste rock and tailings impacting the riverine system causing downstream river bed aggradation, elevated sediment loads, decreased water quality, overbank flooding in the Middle Fly River region and reduced aquatic biomass.
Remain compliant with Environmental Regime (Licence) conditions.
OTML’s waste management plans aim to minimise incremental impacts on the river system. OTML extracts pyrite from its tailings producing a Pyrite Concentrate (PCon) and barren tailings. The PCon is piped to engineered subaqueous storage facilities at Bige. Dredging at Bige removes approximately 10 million cubic metres (Mm3) of fine sediment from the river annually.
Environment
“Nobody Gets Hurt” - employee and contractors health and safety
OTML, Employees and Government
Achieving zero incidents to employees and contractors is a core value and a priority for OTML.
Implementation of a revised major mine hazard initiative, a safety management system and the iLead behavioural program. This resulted in significant safety performance improvement in 2017.
Safety
Community development projects and consultation
OTML, Government and Communities
Communities have benefited from OTML, OTDF and TCS social development and infrastructure project delivery. Consultation is important to share information.
Timely project planning, funding and delivery are a key objective for OTML and OTDF.
Social Responsibility
Peoples’ ability to execute operations strategy and plans
OTML, Employees, Government and Communities
Skilled competent people are required to deliver OTML’s strategy and plans.
OTML is focused on improving the skills and culture of the workforce through training and engagement.
People
OTML have prepared the 2017 Annual Review in
accordance with the GRI Sustainability Reporting
Standards and the Mining and Metals Supplement. The Standards are used by companies to report
how their operations impact the economy,
environment and society.
OPPOSITE: New mine maintenance workshop and offices.

ANNUAL REVIEW 2017 19

20 OK TEDI MINING LIMITED
OTML’s Safety and Occupational Health
vision is “Nobody Gets Hurt”, with safety as
a core value for the business. OTML’s
Safety Policy is based on the belief that
all accidents are preventable and that an incident and injury-free
workplace is achievable.
SAFETY AND OCCUPATIONAL HEALTH
All levels of management are expected to display visible safety leadership through daily workplace engagements and demonstration of leadership behaviours on safety and health issues. Ultimately the expectation is that every employee is a safety leader, empowered to stop work if unsafe acts or conditions are observed.
During 2017, the Safety and Occupational Health team was strengthened with the addition of senior personnel with expertise in business improvement and functionally in integrated management systems, risk management, competency training and assessments, and vector control.
Safety and Occupational Health strategies and plans are developed by a management Safety and Occupational Health, Environment and Community Steering Committee comprising all members of the Executive Leadership team and Safety, Occupational Health, Community Relations, Environment and Asset Protection functional heads. The SHEC Committee meets monthly to review significant incident investigations and progress against plans. In addition, the OTML Board has a SHEC Governance Committee which meets at least twice per year to review strategy, progress with plans and any emerging trends.
OTML applies an Integrated Management System which is aligned with OHSAS 18001 and which includes a suite of systems, standards, processes and procedures covering all areas of the business. A systematic risk-based approach is applied across the business to identify potentially fatal or life changing hazards and risks. A matrix of Areas of Significant Risk by geographic work location has been developed and appropriate actions applied in each area to mitigate high-risk incidents.
System audits are conducted periodically to determine system integrity and system effectiveness. In 2017, audits were conducted on the mine geotechnical program, confined space, working at heights and vehicle interactions.
OTML applies a behaviour based safety program (iLead) which supports communication of management’s safety expectations, monitoring of behaviour and use of safety tools/activities including inspections, hazard identification and job safety observations. Indicators are tracked and reported against monthly targets for compliance with expectations.
To support the quality of inputs to iLead, a safety training program “Fundamentals of Safety” was conducted for supervisors and superintendents to refresh their understanding of safety basics – Hazard Identification, Inspections, JSO’s, JSA’s, Toolbox Talks, Near Miss and Hazard Reporting.
In 2017, the focus remained on strengthening the foundations for safety and occupational health, refreshing standards, simplifying systems, consolidating understanding of higher risks and controls, and encouraging greater participation and engagement of the workforce.
SAFETY PERFORMANCE
LAGGING INDICATORSOTML continues to report against the industry standard lagging indicators for LTIFR, TRIFR and Significant Incident Frequency Rate (SIFR). The results in 2017 showed improvement versus 2016 with an LTIFR of 0.09 (0.58 in 2016) and TRIFR of 1.53 (2.43 in 2016). The LTIFR was the best result in eighteen years but the TRIFR was below OTML’s previous best of 1.07.
The only LTI for 2017 was reported in October. A contractor was struck on his hand by a falling metal plate resulting in finger injuries.
An analysis of the Total Recordable Injuries in 2017 identified 60% were:
• Classified as Restricted Work Cases with work restrictions mandated by medical certificate for a total of 74 days;
• Were reported in relation to OTML employees and 40% related to service contractors; and
• Related to hand and finger injuries.

ANNUAL REVIEW 2017 21
The main casual factors included ‘Inadequate risk assessments’, ‘Inappropriate or lack of Personal Protective Equipment’, ‘Defective and/or Incorrect tools & equipment used’ and ‘Training/awareness and familiarisation with the task’.
The following table shows the trend in lagging indicators for each rate category over the past two years for combined OTML employees and contractors.
2016 2017
Hours Worked (million per annum) 8.6 11.7
Lost Time Incidents 5 1
LTIFR 0.58 0.09
Total Recordable Incidents 21 18
TRIFR 2.43 1.53
Significant Incidents 10 10
SIFR 1.16 0.85
Note: Significant Incidents include High Potential Incidents
LEADING INDICATORSThe iLead system sets and monitors compliance by all levels of management against a defined expectation of safety activities including Inspections, Hazard Identifications and Job Safety Observations each month.
Participation by all levels of management exceeded minimum standards for the year.
LEADING INDICATORS2016
ACTUAL2017
ACTUAL
Inspections 1,765 11,023
Hazard ID 1,233 5,709
Job Safety Observations 3,072 13,687
Note: Combines activities for both OTML and Contractor employees, site – wide.
During 2017, the installation of the TrakPro vehicle monitoring equipment was completed in company and contractor light vehicles and highway buses and trucks. The system monitors speed in geo-fenced sections of road, alerting the driver and the system controller of speed exceedances. Exceedances above defined limits result in the issue of warnings or disciplinary action depending on the magnitude of the exceedance. In 2017, there were no light vehicle, highway or truck incidents related to speed compared with, on average, one light vehicle rollover per month in 2015/16 before TrakPro was installed.
In 2017, the total distance travelled by all highway vehicles was about sixteen million kilometres, with one threshold infringement per twenty-seven thousand kilometres travelled.
PLANS AND PRIORITIESIn 2017, Ok Tedi was in the second year of a five-year Safety Plan aimed at moving from a compliance safety culture to a commitment safety culture. There were two primary focus areas – upgrading/updating Safety Systems and Standards and the strengthening of safe behaviours.
By year-end, revision of the OTML Integrated Management System was complete with 21 standards reviewed and endorsed by the Executive Leadership Team ready for roll-out in 2018.
Central to OTML’s Integrated Management System, is a focus on risk and hazard identification, including the implementation of Bow Tie analysis of prioritised Major Hazards, including appropriate controls and an assessment of the effectiveness of controls.
OTML’s Occupational Health and Wellness program focuses on Fitness for Work. High-risk cases which typically include lifestyle disease are screened and a personal health improvement plan is established and monitored by medical staff.

22 OK TEDI MINING LIMITED
OTML FIVE-YEAR SAFETY PLANA comprehensive review of Safety, Training and Occupational Health was undertaken to align the OTML workforce capability and development model to the extractive industries framework. This approach underscores the business objective of focusing on safety fundamentals. Many existing training packages have been reviewed and upgraded to ensure controls on key hazards are appropriately addressed in training materials. Workforce training and development will continue as a key theme for the business in 2018.
SAFETY AND OCCUPATIONAL HEALTH CONTINUED
MATURE SAFETY CULTURE
(COMMITMENT)
CA
PA
BIL
ITY
FR
AM
EW
OR
K
Review, amend the program as necessary and apply continuous improvement principles.
Continuous Improvement (Commitment)
Safety champions mentoring the workforce, bringing workers from a position of Environmental Safety Awareness (ESA) to Personal Safety Awareness (PSA).
Involving Staff (Participation)
Continue coaching and review the systems. Enhance safety culture based on PSA.
Choose safety champions and start coaching desired behaviour, make sure workforce is aware of ESA/PSA requirements.
Managing Systems (Compliance)
Strengthen foundations, developing systems to ensure we are starting from a position of compliance. Developing
Systems
FOUNDATION
YEAR
YEAR
YEAR
YEAR
YEAR
1
3
5
2
4DEVELOPING
SAFETY CULTURE (TAKING
RESPONSIBILITY)
EMERGING SAFETY CULTURE
(COMPLIANCE)
SYST
EMS
BEHA
VIOU
RS

ANNUAL REVIEW 2017 23
INCIDENT MANAGEMENTDuring 2017, Incident Management protocols and procedures manuals were updated. Training was provided to management at all operational locations to ensure designated roles in Incident Management were understood.
Communication equipment (satellite phones, cell phones and two-way radios) was updated, emergency response rooms established and resourced and several relevant scenarios were tested in desktop and field exercises.
OCCUPATIONAL HEALTH & WELLNESSOTML’s Occupational Health and Wellness program focuses on Fitness for Work. High-risk cases which typically include lifestyle disease are screened and a personal health improvement plan is established and monitored by medical staff.
In 2017, a total of 946 employees were medically assessed with 548 employees identified to be at greater risk for atherosclerotic cardiovascular diseases. Of these employees, 88 were identified as high-risk and placed on supervised improvement plans.
Employees classified as high-risk are regularly monitored. By following a structured health management plan, 58% showed improvement in their health risk rating. For the high-risk group, compliance with their individual plans was mandatory.
An illicit drug and alcohol testing program is in place with employees and contractors subject to random testing and “for cause” testing. A total of 181,913 Blood Alcohol Concentrations (BAC) tests were completed during 2017. Applying a zero tolerance standard, a total of 52 employees and contractors returned a positive BAC (9 OTML and 43 Contractors).
2016 FEBRUARY – DECEMBER
2017 JANUARY - DECEMBER
SAFETY TRAINING COURSENUMBER OF EMPLOYEES
HOURS
NUMBER OF EMPLOYEES
HOURS
General Site Induction 2,743 11,581 2,133 6,806
Electrical Lock-out-Tag-out 1,543 4,482 1,826 4,576
Confined Space 533 2,092 882 5,265
Working at Heights 710 5,706 807 5,234
Cranes & Lifting 485 3,537 383 10,053
Mobile Equipment 151 1,253 168 3,913
Heavy Vehicle 168 442 539 5,524
Light Vehicle Equipment 473 379 150 572
TOTAL 6,806 29,472 6,888 41,943
Notes: General Safety Inductions include induction of visitors. The numbers presented are exclusive of Verification of Competencies
Ultimately the expectation is that every employee is a safety leader, empowered to stop work if unsafe acts or conditions are observed.

24 OK TEDI MINING LIMITED
All OTML employees work 12 hour shifts and production workers work continuous shift rosters, creating a need for both the Company and employees to manage fatigue. Flight schedules have been adjusted where possible to reduce the impacts of travel time on effective respite days. The quality and options available for meals were also reviewed and adjusted and workers have been encouraged to plan some exercise as part of their daily routine. In 2017, there were no incidents recorded with fatigue as a primary cause.
An Employee Assistance program is in place to provide confidential counselling and support to employees and their families, either face to face or by telephone. The most common matters raised with the counsellor were stress (mainly financial), substance dependence and domestic abuse or violence.
In early 2017, the Tabubil Hospital responded to a concerning public health trend in the incidence of Tuberculosis (TB). Hospital facilities were expanded to incorporate a TB isolation ward for treatment of TB patients. This facility was completed in the 3rd quarter of 2017, in conjunction with a community education and testing campaign focused initially on Wangbin village, on the outskirts of Tabubil which attracted over 100 attendees.
In 2017, 26 TB positive cases were identified from 873 individuals who presented at Tabubil Hospital, compared to the 140 cases in 2016. There were no TB cases confirmed among OTML employees.
In 2017, a total of 796 positive cases of malaria were identified at Tabubil Hospital from a total of 4,637 individuals screened. An increased incidence in Bige and Kiunga was also observed. Contractor employees residing in villages were found to be the worst affected at these locations.
A specialist company was contracted to review and upgrade the existing vector control program being run by Tabubil Hospital. A qualified entomologist was engaged in April and a dedicated team of vector control personnel was mobilised. The vector control program was upgraded with mosquito trapping equipment, new fogging equipment, more effective chemicals, and a more rigorous schedule of fogging and residual spraying. By the end of December, 465 houses in Tabubil were treated by residual spraying. Active vector surveillance, vegetation control, fogging, residual spraying and larvicide treatment of water bodies at all OTML sites is ongoing.
Mosquito trapping has detected dengue carrying mosquitoes in Tabubil. Screening for dengue identified three positive cases from 391 persons presenting at Tabubil Hospital.
CASES REPORTED AT TABUBIL HOSPITAL
2016 2017
TB 140 26
Dengue 98 3
Malaria 82 796
In May 2017, an independent Public Health specialist completed an Environmental Health Risk Review in Tabubil, Kiunga and Bige. The scope of the review included potable water supply systems, accommodation and workplace safety (waste management, laundry and infectious disease outbreak management) and food safety. Improvement recommendations were provided to camp management and camp service contractors at each location for prioritisation. Recommendations included changes to chemicals used, procedural changes and upgrades to facilities. By year-end, additional camp accommodation and a new camp kitchen were nearing completion at Bige and upgrades to kitchen and food storage facilities in Tabubil were underway. An ongoing program of inspections of camp kitchens, food storage areas and tests of potable water by a Public Health Officer attached to the Tabubil Hospital continued throughout 2017.
A new Fubilan Catering Services contract was executed in April for Tabubil, which includes a healthy menu focus in support of the employee health and well-being program. This includes a sandwich crib option which commenced in June.
SAFETY AND OCCUPATIONAL HEALTH CONTINUED
OPPOSITE: Gwen Hapot conducting grinding works at the fabrication workshop.

ANNUAL REVIEW 2017 25

26 OK TEDI MINING LIMITED
INDUSTRIAL HYGIENEAn Industrial Hygiene Program periodically monitors common hazards including noise, dust, lighting, radiation and vibration. Where unacceptable levels are measured, effective controls are implemented to safeguard workers.
Material Safety Data Sheets are available for all chemicals at point of issue.
In 2017, the focus was on developing an in-house capability to measure exposures rather than relying on external consultants. Monitoring equipment owned by the Company was recalibrated or replaced and training is planned in 2018 to establish an in-house monitoring capability. Independent review and the establishment of a Similar Exposure Group has been scheduled for 2018.
SECURITYSecurity is managed by OTML’s Asset Protection Department (APD), supported by contracted (unarmed) security guards and the Royal PNG Constabulary (RPNGC), a mix of Provincial Police and Mobile Squad personnel shared between Tabubil and Kiunga. Interactions with the RPNGC are guided through the APD under a draft Memorandum of Understanding capturing OTML’s requirement for compliance with the United Nations Voluntary Principles of Human Rights (UNVPHR). In return, OTML provides support to Mobile Squad personnel with accommodation and messing, vehicles, fuel, air transportation and remunerates Mobile Squad officers a daily per diem. OTML also maintains a small cadre of Reservists.
All occurrences and incidents of note (including any investigations into criminal or administrative matters) are captured with the OTML ‘eSolve’ case management system, a comprehensive and confidential security and intelligence database, maintained to aid investigations and track closure of incidents.
In October 2017, a five day course of instruction was provided in Human Rights Training to 28 participants including Police, APD officers and Contractors. The training was facilitated by the RPNGC based on the UNVPHR requirements (course content endorsed by United Nations and AusAid) and provided content on human rights, skills, knowledge and attitudes to uphold human rights.
A Family Sexual Violence course was also conducted in Tabubil in October 2017 with 17 participants (RPNGC and APD staff) and facilitated by RPNGC. In the same month, the RPNGC, with ‘content experts’ from the Australian Federal Police, presented a course of instruction to 32 participants on ‘Investigative Interviewing’ for both Police and suitable qualified APD personnel.
Additionally, the APD’s in house training officer conducted a range of ‘Basic Security Training’ programs over the course of the year to security contractor partners. Nineteen contractor employees were given instruction in basic security training and related responsibilities.
Aviation Security training was provided on three occasions between May and July to a total of 21 participants. The training content included ethics, static guard duties, foot patrols, radio communication, fitness and self-defense. Assessment activities included human rights and the ‘Use of Force’.
SAFETY AND OCCUPATIONAL HEALTH CONTINUED

ANNUAL REVIEW 2017 27
FIRE RESCUE AND FIRE PROTECTION SYSTEMSOTML has developed capable Emergency Response Teams (ERT) in each of its key business areas including the Mine, Tabubil, Kiunga and Bige. APD is responsible for first-response to any emergency incident (including fire-fighting, rescue and paramedic services). Training of ERT members is an ongoing commitment to maintain skills so that teams can rapidly deploy in the event of an emergency.
Regular reviews of personnel competency were conducted. A paramedic capability has been maintained in support of all worksites and during 2017 First-aid/cardiopulmonary resuscitation training was provided to 487 employees and contractor staff by accredited paramedic trainers.
APD deliver regular training to ‘Fire Auxiliaries’ across three locations at the mine/mill, Kiunga and Bige. The team also provides statutory testing and inspections of fire safety and protection system installations across all sites.
The APD participated in major Emergency Response Exercises during 2017 at the Mine/Mill, Airport and Kiunga Port.
OTML participated in ‘The Extractive Industries Emergency Response Challenge’ held at the PNG Maritime College in Madang between the 2nd and 4th October 2017. Other participating teams included the Porgera Joint Venture, Harmony Gold, Simberi, Oil Search, Ramu Nickel and Newcrest Lihir Mining. Competitions included response scenarios involving, Rope and Vertical Rescue, Hazmat, Fire Fighting, Endurance, Confined Space, Search and Rescue and Multi-Casualty response.
The Ok Tedi ERT won awards in Rope and Vertical Rescue and Hazmat and finished a creditable second place in each of the theory, multi-casualty and confined space, search and rescue events.
ABOVE: Emergency Response Team undertaking a fire fighting drill.

28 OK TEDI MINING LIMITED
OTML operates the longest running open-pit copper,
gold and silver mine in PNG and is 100% PNG
owned. Since the start of operations, Ok Tedi mine has produced 4.75 Mt of copper, 14.6 Moz of gold
and 31.4 Moz of silver. Total sales of copper, gold and silver concentrate in 2017 were PGK 3.2 billion.
In 2017, OTML contributed 3.8% of PNG’s gross
domestic product. As at 31 December 2017, the
Mineral Resource estimate was 782 Mt at 0.45%
copper and 0.53 grams per tonne (g/t) gold.
BUSINESS REVIEW & OUTLOOK
OTML’s business operations are centred on the Mt Fubilan deposit located in the Star Mountains. The deposit is mined as a large open pit with a flotation processing plant capable of treating up to 24 million tonnes per annum (Mtpa), and recovering copper and gold into a saleable concentrate using conventional technology. The concentrate product contains approximately 24% copper with gold content in the range of 15 to 25 g/t. Copper concentrate is piped 156 kilometres (km) south to the Kiunga port facilities located on the Fly River. The concentrate is dried, stored, blended and then shipped down the Fly River to Port Moresby where it is transferred to a storage vessel before being exported overseas. The mine is serviced by the township of Tabubil, located 20 km to the southeast and it is here that the Company maintains its registered office. OTML also maintains a corporate office in Port Moresby and a logistics facility in Brisbane, Australia.
FINANCIALOTML generated PGK 3.2 billion (USD 1.0 billion) in gross sales revenue in 2017 which was an increase of 55% compared to 2016. This was due to a combination of higher metal production and higher metal prices.
Production in 2017 was 105 Kt of copper and 271 Koz of gold. This represented an increase of 31% and 24% respectively compared to 2016 and partly a result of an operating period that was 20% longer (twelve months operation in 2017 compared to ten months in 2016). The price of copper increased by 18% in 2017, while gold price remained relatively unchanged. Copper represents about 60% of the Company’s revenue.
The Earnings Before Interest and Taxes (EBIT) margin increased from 26% in 2016 to 37% in 2017 and was reflected in the 2017 profit after tax of PGK 848 million (USD 266 million), which was 121% higher than in 2016 (PGK 384 million).
Cash generated during 2017 was PGK 784 million (USD 246 million) after funding capital expenditure of PGK 174 million (USD 54 million) and mine development expenditure of PGK 165 million (USD 52 million), necessary to enable access to ore in the later years of the mine life. PGK 52 million was received as proceeds from asset sales.
The Company distributed PGK 380 million (USD 119 million) in dividends to shareholders during 2017, including a USD 50 million dividend declared in August 2017 and a further USD 50 million declared in December 2017. USD 19 million was paid in respect of prior year dividends declared. The cash balance held by OTML at the end of 2017 was PGK 581 million (USD 180 million), with no borrowings.
In August the Board approved the first phase of expenditure (USD 47 million) on a project to replace and relocate the in-pit crusher facility at an estimated total project cost of PGK 670 million (USD 207 million). This high value opportunity was identified in the Company’s 2016 strategic planning cycle and is expected to generate a return that significantly exceeds the investment by allowing access to additional ore. Most of this expenditure is expected to occur in 2018 and 2019 and the Company is well placed to self-fund this initiative.
MININGMining of the Mt Fubilan Ore Reserves continues to be carried out as a large open pit operation. Ore is mined and transported to a primary crusher as first stage processing or to a Run of Mine stockpile, where blending of various ore types can take place. Waste rock is characterised according to its Acid Rock Drainage (ARD) potential and disposed of in the Taranaki, Harvey Creek, Paris, Moscow or Vancouver waste dumps. Limestone waste rock is selectively dumped together with potential ARD waste rock to neutralise acid generation. Mining is conducted using conventional drill and blast techniques, with shovel and excavator loading equipment.

ANNUAL REVIEW 2017 29
The total material mined in 2017 was 84.6 Mt (7.1 Mtpm). This mining rate compared favourably to the 2016 production of 58.1 Mt (5.8 Mtpm for the 10 months of production) and benefitted from the commissioning of an additional loading unit in early 2017.
The 2017 copper feed grade to the mill of 0.63% compared favourably to 2016 (0.58%). This improvement reflects the work completed during the 2015 and 2016 strategic planning cycles to revise mining strategies (pit optimisation, stage designs and sequencing) and maximize business value. Gold grade in 2017 was 0.71 g/t Au, marginally lower than 2016 (0.73 g/t Au).
Mine production was achieved at a unit cost of USD 1.97 per tonne of material moved or USD 2.20 per tonne ex-pit.
PROCESSINGThe ore is crushed in a primary crusher at a nominal 8,000 tonnes per hour and conveyed to a primary ore stockpile. The primary ore is then ground (two trains each comprising a Semi Autogenous Grinding (SAG) mill and two ball mills) to a final grain size of approximately 180 microns. This material is treated in a twin parallel standard mineral flotation circuit to produce a copper, gold and silver concentrate of 24% to 25% Cu and between 15 and 25 g/t Au. A portion of gold is also separately captured utilising a gravity gold circuit. The concentrate is thickened and piped as slurry to handling facilities at Kiunga where it is filtered, dried and prepared for shipping.
In 2017, ore milled was 20.1 Mt or 1.7 Mtpm. This compared favourably to 2016 where a total of 16.1 Mt of ore was processed at an average rate of 1.6 Mtpm. This improvement was primarily a result of achieving the best plant operating time since 2012, due principally to the ongoing focus on restoring asset reliability.
ABOVE: Loading waste rock from West Wall of Mt Fubilan.

30 OK TEDI MINING LIMITED
The copper recovery in 2017 (83.5%) was lower than in 2016 (85.8%) This did however reflect ore lithology mix rather than underperformance of the processing circuit. Performance based on the actual ore blend processed exceeded metallurgical model predictions by 1.3%. The 2017 gold recovery of 59.1% was higher than that achieved in 2016 of 58.2%, but with an opportunity to improve this performance remaining.
The 2017 copper production was 105 Kt (8.8 Ktpm). This represented an underlying improvement of 10% compared to the 2016 copper production of 80 Kt (8 Ktpm), benefitting from a higher (8%) copper grade and monthly milling rate (6%) and offset by lower copper recoveries (-3%).
Gold production in 2017 was 271 Koz (23 Kozpm). This was an improvement of 3% compared to 2016 gold production of 218 Koz (22 Kozpm) with the higher monthly milling rate (6%) and improved gold recoveries (1%), offset by a lower gold grade (-4%).
ASSET MANAGEMENTIn 2017, an Asset Management Department was established to improve the focus on capital efficiency, equipment reliability and equipment total life-cycle costs. This Department was also tasked to manage the major maintenance shutdown projects in the processing plant and the major mobile equipment fleet component change-out programs.
Maintenance planners and reliability engineers have initially been centralised to ensure consistency in application of policies, standards and procedures and to facilitate professional development.
The early focus has been on equipment condition audits, generation of user guides for each work management process, compilation of master data throughout the operations, improving usage of System, Applications and Products (SAP) functionality, and establishment of Key Performance Indicators (KPI) to monitor performance.
In 2017, the processing plant achieved the highest level of operating time for five years. In the mine the Programmed Component change-outs were completed on almost 50% of the 793F haul truck fleet.
PRODUCTION RATES YEAR-ON-YEAR COMPARISONComparisons between 2017 and 2016 should consider the operational suspension that affected the 2016 calendar year. The production comparisons are shown in the table below.
OPERATIONS PARAMETER 2016 2017
Ore milled (Mt) 16.1 20.1
Copper grade (%) 0.58 0.63
Gold grade (g/t) 0.73 0.71
Concentrate produced (Kt)
320 437
Copper produced (Kt)
80 105
Gold produced (Koz) 218 271
Period of operation 10 months (March –
December)
12 months
2018 PRODUCTION AND COMMERCIAL OUTLOOKThe production outlook for 2018 remains positive with an expectation that copper and gold production will meet or exceed 2017 performance.
Mine production in 2018 is expected to remain largely unchanged from 2017 but should increase in the last quarter of the year. Strategic planning indicates that there is significant value in accelerating the mining rate from 2019 and beyond (from the current 85 Mtpa to more than 100 Mt). As a result, approved plans make allowance for the purchase of an additional load unit (and ancillary equipment) which, along with planned productivity improvements, is expected to deliver the required 20% increase.
BUSINESS REVIEW & OUTLOOK CONTINUED
OTML generated PGK 3.2 billion (USD 1.0 billion) in sales revenue in 2017 which was an increase of 55% compared to 2016. This was due to a combination of higher metal production and higher metal prices.
OPPOSITE: Glen Miller, trainee at a flotation processing plant monitoing station.

ANNUAL REVIEW 2017 31

32 OK TEDI MINING LIMITED
BUSINESS REVIEW & OUTLOOK CONTINUED
Copper grade in 2018 is expected to be marginally lower than in 2017 and be offset by an increase in copper recovery, based on the planned ore feed. Gold grade and recoveries in 2018 are also expected to marginally improve. A planned increase in metal production is anticipated to come from an increase in ore milled, driven by the combined benefit of a further increase in plant operating time and a slightly more favourable ore feed in terms of mill throughput rates.
Costs in 2018 are expected to be higher in gross terms than in 2017, largely reflecting the additional production volumes, but with a strong intent to remain competitive on a unit cost basis and therefore preserve margin.
As a result and subject to metal prices and other key sensitivities such as oil price and exchange rates, profitability and cash generated from operations are expected to approximate or exceed that generated in 2017. Free cashflow will however be lower, primarily as a result of the planned growth capital expenditure.
POWEROTML is the largest electricity user in the Western Province and generates its own power from a combination of hydroelectric and diesel thermal generation power stations, to meet the average and peak demand of approximately 63 Megawatts (MW) and 70 MW respectively.
Hydroelectric generation comprises the main 56 MW power station at Ok Menga and the 2.4 MW station at Yuk Creek. The Tabubil diesel thermal power station includes a combination of diesel powered reciprocating engines and turbines, with a total combined installed capacity of 63 MW, to supplement the hydroelectric generation and meet the balance of the power demand. Smaller thermal generation units are also located at Bige, Kiunga and outstations.
Total power generated in 2017 was 493,188 Megawatt hours (MWh), of which hydroelectric generation provided 81%. The total power generated in 2015 and 2016 was lower than in previous years, due to the temporary suspension of operations during the dry weather event.
2008 2009 2010 2011 2012 2013 2014 2015 2016 20170
100
200
300
400
500
600
102
370
139
382
151
332
127
343
159
374
135
385
8035
3
8124
5
9531
9
9739
6
OTML ANNUAL POWER GENERATION 2008 TO 2017*Annual Electricity Generated (GWhrs)
* Includes Tabubil, Klunga and Bige. 2015/16 impacted by dry weather event.
Diesel-generated (GWhr)
Hydroelectricity (GWhr)

ANNUAL REVIEW 2017 33
Due to the relatively low cost of power generated from the hydroelectric stations compared to the diesel thermal units and the environmental benefits, the operating philosophy is to maximise the use of hydrogeneration subject to the available run of river flows. Major capital upgrades of the Ok Menga hydro power station were completed in 2015 to ensure the reliability and efficiency of the existing station and a three year improvement program was established in 2016 to increase hydro power generation by five percent.
Low cost reliable power supply is essential to achieve a stable, profitable operation. Presently, the Tabubil thermal power station includes a combination of 11 diesel-powered reciprocating engines (3 Wartsila, 6 Mirrlees and 2 Caterpillar) and four turbines (including 3 Turbo Mach and 1 MARS), with a total combined installed capacity of 63 MW.
The 30-year-old Mirrlees, 3.5 MW generation units are at the end of their service life. In 2017, the OTML Board approved capital expenditure to replace these aging units with 3 x 8 MW Wartsila generation units, which are scheduled to be progressively commissioned during 2018. Once in service, these modern higher efficiency generation units are expected to reduce overall diesel fuel consumption by approximately 10%.
Once completed, the combination of increasing the hydro generation and the installation of higher efficiency diesel generation units, will result in a significant reduction in diesel consumption and associated transportation requirements, carbon dioxide (CO2) emissions and cost.
Further opportunities have been identified to reduce the overall power demand (with an associated reduction in diesel thermal generation) and to further the increase hydro generation. These opportunities will be progressed as part of the overall life of mine strategic plan.
SUPPLY AND LOGISTICSOTML operations are located in a geographically remote area of Western Province surrounded by challenging terrain. Freight and concentrate material is transported between Port Moresby and Kiunga by three vessels (Fly Prosperity, Fly Challenger, Fly Resilience) each with a capacity of 4,200 t. A fourth vessel (Fly Alliance) can carry approximately 3,000 t of concentrate and over 200 containers up the Fly River to Kiunga (850 river km). The Fly Alliance is supported by a fifth vessel, the Kiunga Chief, which is chartered from Consort Shipping. Goods are then trucked on the OTML constructed and maintained public gravel road between Kiunga and Tabubil (136 km) and then on to the mine (20 km), utilising a fleet of prime movers, tankers and trailers. Supply and logistics mobilise approximately 4,000 twenty-foot equivalent containers and 100 Megalitres (ML) of diesel annually. Break bulk volumes (such as mobile equipment and project materials) are transported in addition to standard freight movements. OTML also charters several aircraft to support operations.
In 2017, OTML purchased goods and services worth PGK 1.9 billion (USD 0.6 billion). Of the expenditure 65% (PGK 1.2 billion) was sourced from within the Western Province or from PNG companies. Due to the long lead time for many supplies, establishing and maintaining a reliable supply and logistics chain is critical to maintain effective operations. OTML has a supplier pre-qualification process that includes checks on safety performance and systems, company registration, financial solvency, insurances and reliability of supply.
The Company produced 437 Kt (dry) of copper concentrate in 2017, which was piped 156 km from the processing facility to the Kiunga drying/filtration plant before 425 Kt was shipped to silo vessel (MV Kumul Arrow) located in Port Moresby, before export to customers in Japan, South Korea, The Philippines, Germany and India, as well as spot shipments to other customers. The balance of concentrate was held in stock at the end of 2017.

34 OK TEDI MINING LIMITED
During 2017 the Company sold the first of four vessels to P&O Maritime, with a view to progressively transferring the remaining three to P&O over the course of 2018. These vessels will be owned, maintained and operated by P&O for the benefit of OTML under a Time Charter Party agreement.
There will be a major increase in logistics activity in 2018, associated with additional mining activity, the execution of major capital projects and the plan to increase the volume of concentrate produced and sold. This increase in activity will be managed by a combination of logistics improvement initiatives and additional shipping/transport fleet capacity.
PROCESSING WASTE TREATMENTOTML is the only large copper mine to separate sulphides from the tailings prior to tailings discharge. Due to elevated amounts of pyrite ore, the thickened tailings from the flotation circuit scavenger cells are pumped to the Tailings Pyrite Plant (TPP) where they pass through another set of flotation cells. The TPP flotation cells extract the remaining sulphides and primarily pyrite from the tailings stream to reduce the amount of sulphides released into the river (target is less than 1% sulphur) thereby reducing ARD risk.
The PCon produced by the TPP is transported through a 125 km long pipeline to designated PCon storage pits on the West Bank of the Ok Tedi River at Bige, where it is permanently stored sub-aqueously to prevent the oxidation of the sulphides and formation of acid. Once full, the pits are capped with Non-Acid Forming (NAF) sands dredged from the river as part of the normal sand deposition process.
After PCon recovery from the tailings, the remaining barren sands are disposed of by pumping the material from the processing plant through a pipeline located within the Moscow Tunnel (about 1.5 km long) for discharge into tributaries of the Ok Tedi River and eventually into the Fly River. The tailings are mobilised by the fast-flowing streams and held in suspension until the river profile starts to flatten out at Bige, upstream of the junction with the Fly River. As the stream velocity slows over a dredged slot in the riverbed, most of the tailings, particularly the coarser particles settle out into the slot. A dredge then pumps the sediments ashore for hydraulic placement into long-term engineered storage stockpiles located on the East and West Banks of the Ok Tedi River at Bige.
Since 1997, approximately 10 million cubic metres (Mm3) per annum of sand has been dredged from the riverbed. Geochemical sampling has identified that NAF material tends to deposit at the southern end of the dredge slot, whilst heavier pyrite material deposits at the northern end, enabling selective dredging and placement of the sand on the stockpiles.
The stockpile embankments range from about 12m to 22m high with outer overall slopes including swales to reduce surface water runoff velocity. Revegetation trials on the slopes and crown have demonstrated that a good primary and secondary vegetation cover can be established.
BUSINESS REVIEW & OUTLOOK CONTINUED
The production outlook for 2018 remains positive with an expectation that copper and gold production will meet or exceed 2017 performance.
OPPOSITE: Maino Dupmat and Emmanuel Sikwapi servicing plant at Workshop 1.

ANNUAL REVIEW 2017 35

36 OK TEDI MINING LIMITED
The sustainability of the Ok Tedi mining
operation continues to be assured through
careful management of the existing
Mineral Resources within the mine area
and more critically, the development
and subsequent re-estimation of Mineral
Resources beyond the existing mine pit areas,
commonly called the “near mine programs”.
GEOLOGY
The priority of the exploration team for 2017 was to progress the identification and the testing of targets at various stages of development within the existing Special Mining Lease (SML) and identify additional Mineral Resources within the SML and near mine programs. This includes the immediate mine-pit environment, for example the Crusher Relocation Project where Mineral Resources will be converted to Ore Reserves as part of the 2017 Resource to Reserve process and in particular, the adjacent and most advanced Sulphide Creek Prospect area northeast of the current pit. In 2017, in-pit resource development drilling and exploratory drilling work occurred within the SML, with focus on the Wellington Skarn area on the northern side of Sulphide Creek and along the New York Ridge adjacent to the mine area.
Resource development drilling continued in 2017 at the Townsville Prospect. A Mineral Resource estimate for the Upper Gold Zone is expected to be completed in early 2018.
The overall intention of the geology and exploration team is to offset the ore depletion rate caused by mining in the SML. This is accomplished through a process of target identification and the evaluation of existing exploration targets to a point where sufficient geological confidence is reached to estimate new Mineral Resources. Further increase in confidence presents an opportunity to upgrade existing Mineral Resources for the eventual conversion to Ore Reserves.
Exploration activities to collect geological information and analyse the data also continued in the more remote licences, with the aim of following up on previously identified targets, whilst maintaining statutory work and monitoring expenditure commitments.
The focus for 2018 is to carry out additional drilling to better define the resources in the northern and eastern areas of the Fubilan pit and down the New York Ridge to Sulphide Creek. Outside the SML, work will focus on drilling at Townsville to estimate and present a maiden Mineral Resource Statement on discrete zones of copper mineralisation that occur in the Lower Copper Zones beneath the Upper Gold Zone. The maintenance to fulfil the statutory commitments in other areas will also continue in 2018.
OTML has a current tenement holding of 682.4 (square kilometres) km2 (Figure 2). In 2017, EL 2276 - Mianmin was totally relinquished and the size of EL 2289 – Dorongo prospect was reduced by 50%. The result is that the 2017 exploration portfolio footprint is approximately 77% the size of that in 2016.
PAPUA NEW GUINEA
International boundary
Intrusive Rocks
OTML Exploration Licence
Special Mining Lease
0 1 0 205 1 5
Kilometres
Sulphide Creek
Ok T
edi I
ntru
sive
Com
plex
OTML EXPLORATIONNEAR MINE TENEMENTS
N
DarienMt BinnieOk Gilor
Mt Ian
Townsville
Kauwol T6
MT FUBILAN(Mine Site)
MarrakeshMt Anju
OK TediTransfer
Zone
IND
ON
ES
IA
P.N
.G.
Mt Kwirok
Mt Frew
Mt Kwang
1 41 °E5°30'S
1 41 °E
1 41 °30'E
1 41 °30'E
5°30'S
Location
EL2289 DO R O NG O
EL2256 ANJU
EL21 56 TO W NSVILLE
EL1 677 KAUW O L
EL2472B UB U
(application)
Figure 2. OTML Exploration Near Mine Tenements.

ANNUAL REVIEW 2017 37
MINERAL RESOURCE AND ORE RESERVE STATEMENTIn February 2018, a revised Mineral Resource and Ore Reserve Statement as at 31 December 2017 was presented to the OTML Board. Recent drilling at Mount Fubilan contributed to this upgraded estimate. Comparing the previous December 2016 estimate to the latest December 2017 estimate, the changes report a 3% increase in the total Mineral Resource tonnes from 761 Mt to 782 Mt and a slight decrease in both the copper and gold grades by 2% and 4% respectively. The total Proven and Probable Ore Reserves over the same period increased by 9% from 215 Mt to 235 Mt, with a decrease in both copper and gold grades of 13% and 16% respectively.
The changes reflected in the Mineral Resource Statements of 2016 and 2017 are shown in the tables below.
MINERAL RESOURCE AND ORE RESERVE STATEMENT AS AT 31 DECEMBER 2017
MINERAL RESOURCE ORE RESERVE CONVERSION
CATEGORYTONNAGE
(MT)CU
(%)AU
(G/T) CATEGORYTONNAGE
(MT)CU
(%)AU
(G/T)
RESERVE / RESOURCE
RATIO
Measured 365 0.47 0.53 Proven 156 0.60 0.69 43%
Indicated 372 0.43 0.50 Probable 80 0.58 0.70 22%
Inferred 44 0.51 0.71
Total 782 0.45 0.53 Total 235 0.59 0.69 30%
MINERAL RESOURCE AND ORE RESERVE STATEMENT AS AT 31 DECEMBER 2016
MINERAL RESOURCE ORE RESERVE CONVERSION
CATEGORYTONNAGE
(MT)CU
(%)AU
(G/T) CATEGORYTONNAGE
(MT)CU
(%)AU
(G/T)
RESERVE / RESOURCE
RATIO
Measured 276 0.55 0.61 Proven 142 0.69 0.79 52%
Indicated 392 0.41 0.51 Probable 72 0.67 0.86 18%
Inferred 92 0.41 0.55
Total 761 0.46 0.55 Total 215 0.68 0.82 28%
The information in the tables above relates to Mineral Resources and Ore Reserves based on information compiled by Chris De-Vitry (Mineral Resource) and Daniel Hastings (Ore Reserve) who are members of the Australasian Institute of Mining and Metallurgy.
Mr De-Vitry and Mr Hastings are Geological and Mine Engineering Consultants and have sufficient experience that is relevant to the style of mineralisation and type of deposit under consideration and to the activity being undertaken to qualify as a Competent Person as defined in the 2012 edition of the Australasian Code for Reporting of Exploration Results, Mineral Resources and Ore Reserves.
Mr De-Vitry and Mr Hastings consent to the inclusion of the above tables, which have been based on their information, in the OTML Mineral Resource and Ore Reserve Statement, in the form and context in which it appears. Signed on this the 27th day of February 2018.
DANIEL HASTINGS CHRIS DE-VITRYMAusIMM 301925 MAusIMM 210853Principal Consultant - Hastings Bell Pty Ltd Principal Consultant – Manna Hill Geoconsulting

38 OK TEDI MINING LIMITED
LEGENDSTRATIGRAPHY
BrecciaEndoskarnMagnetite skarnUndifferentiated SkarnFubilan Quartz CoreFubilan Monzonite PorphyryPorphyritic MonzodioriteSydney MonzodioriteOk Tedi Complex, undifferentiatedBirim FormationPnyang Formation - limestonePnyang Formation - mudstonePnyang Formation - siltstonePnyang Formation - sandstoneBrecciated Darai LimestoneDarai Limestone - siltstoneDarai LimestoneIeru Formation
Major Faults
31 4400 31 5200 31 6000
31 4400 31 5200 31 6000
424
800
424
400
423
200
424
800
424
400
423
200
Meters
0 300 6001 50
CENTRE PIT
SILTSTONERIDGE
TARANAKISKARN
GOLD COASTSKARN
PARISSKARN
EDINBURGHSKARN
OK TEDI GEOLOGY
WEST WALL
MOSCOW
N
OK TEDI ORE RESERVES, RESOURCES AND EXPLORATION TARGETS
NEAR MINE – MT FUBILAN (SML 1).Mt Fubilan is a significant high-grade copper-gold-silver deposit with several phases of mineralisation centred on two main intrusions known as the Fubilan Monzonite Porphyry, located in the northern half or Centre Pit area and the Sydney Monzodiorite in the south. The Ok Tedi geology map (Figure 3) shows the near mine stratigraphic units and deposit areas. The majority of the ore is found as disseminated mineralisation in intrusive and sedimentary host rocks and as massive magnetite/sulphide skarns located adjacent to the intrusions along the contacts with limestone and siltstone units.
GEOLOGY CONTINUED
RIGHT: Figure 3. Ok Tedi Geology.
IMAGE OPPOSITE: Mining operations on East Wall of Mt Fubilan.

ANNUAL REVIEW 2017 39

40 OK TEDI MINING LIMITED
The main source of new information obtained for the in-pit resource development during 2017 was from the 6,635 metres (m) of drilling that occurred, mainly in the Eastern, Northern and North-Western parts of the mine. Most of this drilling was aimed at delineating extensions of mineralisation along the margins of the current pit wall. The aim for 2018 is to continue this work and identify additional Mineral Resources as an extension to current operations and thereby expand the overall resource base to replace mining depletion and to increase the potential conversion rate from Mineral Resources to Ore Reserves.
Additional exploration work in SML 1 during 2017 focused on the Wellington Skarn area on the northern side of Sulphide Creek and along the New York Ridge adjacent to the mine area. Ten holes totalling 4,840 m were drilled in these two areas.
Copper and gold mineralisation in the Wellington Skarn area was discovered relatively early in the history of Mt Fubilan. In 2015, a drill hole (SCK001) intersected 39 m at 1.05% Cu, 0.64 g/t Au which generated renewed interest. Since then the area has been mapped in detail indicating that the skarn has a 500 m extension along strike. Five holes totalling approximately 2,400 m were drilled to test the Wellington Skarn during 2017.
Significant intersections from the 2017 drilling program include:
DRILL HOLE NO.
DOWNHOLE MINERALISED INTERVAL (m)
COPPER GRADE (%)
GOLD GRADE (g/t)
DOWNHOLE MINERALISATION START DEPTH (m)
SCK01430.9 0.73 0.56 285.2
73.8 0.33 0.73 363.2
SCK016 6.7 1.07 0.62 93
SCK018 39.9 0.78 1.32 282.4
Preliminary metallurgical test work indicates that the mineralisation at the Wellington Skarn is similar to the skarn ores at Mt Fubilan.
Drilling is planned to continue in 2018 to further define the limits of the mineralisation and test the continuity of the higher-grade zones. During 2017, four of the ten drill holes mentioned above were completed at the New York Ridge, adjacent to the Fubilan pit. The aim of three of these holes was to test the extensions of the Taranaki Skarn under the New York Monzodiorite Sill and the remaining drill hole was to test the Darian Porphyry Stock. The results presented no significant intersections in the first two holes (SCK 017 and 019) and assay results for SCK 020 and 021 are still pending.
Re-modelled magnetic data, together with the integration of a new geological model for the area has identified several potentially significant targets which will be tested in early 2018.
The first half of 2018 will involve an intensive drilling campaign which aims at improving the geological understanding and identifying mineralisation hidden by the intrusive New York Sill. The aim is to estimate additional Mineral Resources for incorporation into the Life-of-Mine plan by the end of the year.
Other targets which will be evaluated in 2018 including the Gilor Skarn which appears to be an extension of the Wellington Skarn system to the north east. Scout mapping in this area has located areas of mineralised skarn and breccia units. Rock chips from this area have returned values up to 1.34 g/t Au and 0.87% Cu.
OTHER SIGNIFICANT PROSPECTSBeyond the boundary of the SML, OTML holds five Exploration Leases (EL) in the Western and Sandaun Provinces. These are the Townsville Kauwol, Bubu, Anju and Dorongo leases. Ongoing exploration efforts have included geophysical and geochemical assessments, mapping and sampling programs and the drilling of prospective targets. The Townsville Prospect, located within the Townsville EL and approximately four kilometres north of the processing plant, is the most advanced regional exploration project.
GEOLOGY CONTINUED

TOWNSVILLE CU-AU PROJECT COMPOSITE SECTION
ANNUAL REVIEW 2017 41
TOWNSVILLE PROSPECTThe known mineralisation of the Townsville Prospect occurs in the Upper Gold Zones and the Lower Copper Zones. The working three dimensional geological model and associated drill holes are shown in Figure 4. Drilling recommenced on this prospect early in 2017, targeting the Upper Gold Zones to confirm the continuity of the gold mineralisation and to extract fresh material for metallurgical test work. Three holes were completed during 2017, totalling 1,153 m.
Drill samples have been submitted for metallurgical test work and Mineral Resource modelling of the gold and copper zones has commenced.
Historical drilling beneath Zone 1 Gold has demonstrated that copper mineralisation could occur at depth. Drill hole TVL105 was extended to test this proposition and intersected a 66 m intercept of 1.14% Cu and 1.09 g/t Au from a downhole depth of 321 m, confirming a second copper zone at Townsville.
The table below shows the significant drill hole copper and gold results from Townsville drill holes completed during 2017.
HOLE ID FROM (M) TO (M) INTERVAL (M) CU (%) AU (G/T)
TVL105 5.5 53.1 47.6 0.04 1.00
TVL105 113.8 307 193.2 0.20 2.12
TVL105 321 425 104 0.87 0.79
TVL105 321 387 66 1.14 1.09
TVL106 5.1 332.4 327.3 0.4 2.28
TVL107 1.5 134 132.5 0.08 2.21
In 2017, development of a Mineral Resource model for the Upper Gold Zones of the Townsville Prospect commenced and is planned to be completed in early 2018. The goal for 2018 is to commence development and complete a Mineral Resource model for the Lower Copper Zones.
Figure 4. Drill section illustrating the Upper Gold Zones (yellow) and Lower Copper Zones (green) at the Townsville Prospect.

42 OK TEDI MINING LIMITED
MARRAKESHThe Marrakesh prospect lies at the south-eastern end of the Gold Coast Skarn fault system and a feature of the area is a copper and gold mineralised porphyry/skarn breccia, first intersected in an historic drill hole. The upper part of the Fubilan porphyry was gold rich and the geological interpretation is that Marrakesh represents the un-eroded upper parts of a concealed porphyry system.
Drilling at the Marrakesh prospect commenced in the last Quarter of 2017 with a total of six holes planned. This drilling program will continue into the first quarter of 2018.
REGIONAL EXPLORATIONOTML has continued to explore outside of the SML as part of a wider regional exploration program on granted leases. The program includes the assessment of geophysical and geochemical data from various anomalies. The most prominent target areas include Townsville, Kauwol, Anju and Dorongo licences.
ANJU (EL2256)During 2017, work at Anju included a program of geological mapping, petrographic studies and the drilling of three holes totalling 450 m. The geology of the prospect area consists of a monzonite porphyry stock which has been intruded by two breccia units.
Drill hole ANJ001 intersected two types of porphyritic monzonite, an upper unit with phyllic (sericite – pyrite) alteration and a more extensive lower unit displaying minor (propylitic) (epidote –pyrite) alteration. Thin, sheeted silica/pyrite veins occur in the upper intrusive unit. An intercept associated with potassic (biotite-magnetite) alteration of 36.7 m at 0.24 g/t Au from 34 m depth (including 3 m at 0.42 g/t Au from 45.9 m) was obtained from ANJ001.
The breccias are interpreted to be of phreatic-magmatic origin representing the upper parts of a Mt Fubilan-type porphyry system. The geochemistry and alteration indicate a fertile system and good potential exists for a Cu-Au deposit at depth.
In 2018, an Induced Polarisation survey is planned to map out the extent of the sulphide “lithocap” near surface and the resulting interpretive model will be followed-up with diamond drilling.
DORONGO (EL2289)In 2017, the Dorongo tenement was reduced in size by 50% to a current holding of 242.6 km2. A soil sampling program and a ground magnetic survey were completed during 2017. A low-level copper anomaly coincident with minor disseminated pyrite and calc-silicate veining was identified. Scout drilling is planned to test this area in 2018 and the magnetic anomalies identified from the survey will be followed-up by ground inspection.
KAUWOL (EL1667)A field program conducted in 2017 focused on the ‘T6’ magnetic anomaly located approximately 10 km north-east of the Ok Tedi mine. Following soil grid sampling and mapping, four scout holes were drilled for a total of 575 m. Mapping and sampling of several rock outcrops returned anomalous gold up to 0.4 g/t Au and 0.1% Cu.
Holes KWL006 to DHKWL008 only produced weak copper mineralisation in diorite to monzodiorite porphyry stocks. Petrographic studies of some of the drill samples have improved the geological understanding of the deposit.
In 2018, follow-up ground inspections will be undertaken over the existing magnetic anomaly targets. A few scout holes are planned at relatively widely spaced intervals and detailed surface mapping and geochemical sampling will occur concurrently.
BUBU (EL2472)The Bubu EL is located immediately to the west of the Fubilan pit. The Kwirok porphyry is in the south and a deep magnetic anomaly, possibly intrusive related, occurs in the north. Altered float samples discovered in 2009 were traced over approximately one kilometre in a creek draining the south side of the Mt Binnie ridge and these samples returned assays up to 0.85 g/t Au.
The 2018 exploration program includes follow-up ground inspections and geophysical modelling.
MIANMIN (EL2276)The Mianmin tenement originally covered an area of 2,073 km2 and was located between Mt Fubilan and Frieda River. Due to the considered low-level prospectivity of the area, the tenement’s licence was completely relinquished in 2017.
GEOLOGY CONTINUED

ANNUAL REVIEW 2017 43
OPERATION
FEASIBILITY
PRE-FEASIBILITY
CONCEPT STUDY
ADVANCED TARGET
TARGET TESTING
TARGET DEFINITION
RECONNAISSANCE
MT FREW
BETEP
MARRAKESH NEW YORK BRECCIA
SULPHIDE CREEK– NEW YORK
MT ANJU
SULPHIDE CREEK– WELLINGTON
MT KWANG
TOWNSVILLE
GILOR
DARIEN
FUBILAN
SKARN PORPHYRY BRECCIA
INC
RE
AS
ING
CO
NF
IDE
NC
E
P R O S P E C T I V I T Y
DORONGO BUBUKAUWOL
REGIONAL EXPLORATION PROJECT PIPELINE

44 OK TEDI MINING LIMITED
OTML employed 1,651 people at year-end 2017,
(1,633 employees in 2016) and is the single
largest employer in the Western Province. PNG
citizens represent 96% of the workforce and of
these, 40% are from the Western Province.
PEOPLE
Employee numbers have stabilised since the restructure and roster changes in March 2016. Most employees work one of two repeatable Fly-in Fly-out rosters, although in excess of 400 employees from Western and Sandaun Provinces reside in company housing in Tabubil. The rosters provide for efficient allocation of resources and allow for adequate respite.
The breakdown of employees by category and origin as at the end of December 2017 is shown below. The staffing proportions by origin have remained relatively constant through the organisational restructures in 2015/2016 and there are no seasonal variations in employment numbers. Classification of senior staff was revised in 2017.
CATEGORIES
ORIGIN
GENDER
DEMOGRAPHICS
148 Trainees-PNG National in OTML training programs
1,651 TOTAL
235 Over 50
1,651 TOTAL
64 Expatriates
927 Non-Western Province
1,651 TOTAL
532 40-49
418 Senior National Staff
660 Western Province
164 Female
1,651 TOTAL
569 30-39
1,021 National Staff
64 Expatriates
1,487 Male
315 Under 30
2017
2017
2017
2017
187 Trainees-PNG National in OTML training programs
1,633 TOTAL
201 Over 50
1,633 TOTAL
54 Expatriates
1,056 Non-Western Province
1,633 TOTAL
509 40-49
73 Senior National Staff
523 Western Province
159 Female
1,633 TOTAL
616 30-39
2016
2016
2016
2016
1,319 National Staff
54 Expatriates
1,474 Male
307 Under 30
OPPOSITE: Wilfred Amos, Heavy Equipment Fitter at Workshop 1.

ANNUAL REVIEW 2017 45

46 OK TEDI MINING LIMITED
The workforce is assigned into 12 Position Grades (PG) from entry level to senior management. PG1-4 are those below frontline supervisors and have the option of union representation. About 45% of the eligible workforce of 1,021 employees are members of the union. All employees are engaged under individual contracts.
In 2017, the Ok Tedi Women’s Network was formed to address the under-representation of females in the Ok Tedi workforce and issues including identification of structural barriers to career progression, professional development needs, personal safety and health matters. Seventy-three female staff attended a kick-off function and an agenda has been established for 2018. During 2017, three female employees were promoted on merit to positions as Managers.
OTML employees in all areas of the operation are remunerated competitively in the context of the PNG resource industries. Female employees are remunerated equally with their male colleagues in the same position grade. Senior staff participate in an annual performance review with their supervisor, with the outcome linked to salary and career progression. All employees participate in a bonus/short–term incentive scheme with actual performance against KPIs published monthly. At year-end 2017, all employees received a general bonus of 12% of their normal wage.
OTML supports the following International Labour Organisation Conventions as ratified in PNG:
• Discrimination (Employment and Occupation, No. 11);
• Freedom of Association (No. 87);
• Abolition of Forced Labour (No. 105);
• Worst Forms of Child Labour (No. 182);
• Maternity Protection (No. 103); and
• Equality of Treatment Accident Compensation (No. 19).
The workforce is well informed on company performance and has an understanding that its competitive position is important to ensure a sustainable future. Formal town hall meetings (Haus Bungs) involving all employees are conducted twice per year to share business results and plans. Daily safety and production performance and trends are communicated via the first screen to appear when employee’s logon to the company computer system.
Regular communications with the workforce and the union executive facilitates alignment and timely resolution of grievances. In 2017, labour issues raised included requests for alternate work rosters and a return from individual agreements to an Industrial Agreement. No strikes or lock-outs occurred during the year. Election of the union executive was delayed for some months by the unavailability of the Electoral Commission to supervise the ballot due to the national election.
PEOPLE CONTINUED

ANNUAL REVIEW 2017 47
BUILDING A HIGH-PERFORMANCE ORGANISATIONThere are three elements to OTML’s transformation strategy to build a high-performance organisation – establishing the preferred workforce culture, developing workforce capability, and business improvement.
WORKFORCE CULTUREOTML aims to attract, develop and retain the highest quality employees. This is achieved through effective communications, an emphasis on a “one integrated team” approach, creation of opportunities for personal and professional development, and provision of quality feedback and recognition to reinforce excellence in performance.
In 2017, a program entitled “Culture by Design” was initiated to support the establishment of a high-performance culture at Ok Tedi. The program commenced with a culture survey in June 2017 to solicit feedback from the workforce on how they viewed the work culture and suggestions for change. The survey results informed a transformation plan to improve Ok Tedi’s business performance through changes including improved collaboration and teamwork, greater role clarity and alignment, a shift to positive discipline and supportiveness and greater delegation of authority to enable improvement and change.
A catalyst team of opinion leaders from across the business was established to help develop and implement initiatives focused on driving a “One Team, Wan Pasin” culture. In 2017, this team commenced identification of desired changes in workforce behaviour and the desired safety and personal behaviours and planned a program of work for implementation in 2018. Task teams were established, each with a sponsor from senior management, covering activities including translation of values to behaviours, celebration of team and individual success, building pride in achievements and selection and training of change champions.
ABOVE: Emmanuel Sikwapi (HEF Apprentice Year 2) servicing plant.

48 OK TEDI MINING LIMITED
DEVELOPING WORKFORCE CAPABILITYOTML recognises the need for workforce flexibility with the capacity to change and apply new technology and skills to maintain competitiveness. Employees are the Company’s most valuable asset and require investment in personal and professional development to meet business challenges.
OTML’s aim is to ensure that all employees are appropriately skilled and competent in the safe execution of their work responsibilities and are offered the opportunity for personal growth consistent with business needs.
OPERATOR TRAININGIn 2017, Competency Models were updated for all areas of the operations (Mine, Processing, and Operations Support) identifying the specific competencies required to progress from PG1 to PG4. Training materials were prepared or acquired to enable employees to add to their skills and advance their careers. Employees’ competencies were assessed to confirm skills attainment and by year-end 166 employees had been reclassified to higher levels.
In 2018, some adjustments are planned to the Competency Models to more closely align with Australian standards enabling the acquisition of packaged training materials to support progression. Expanded use of equipment simulators is also planned in 2018 to provide feedback to operators and management on common operational errors and corrective actions.
LEADERSHIP TRAININGA Leadership Development Program for supervisors and superintendents from the Mining and Processing areas was developed and piloted in late 2017. The program aims to develop greater self- awareness of leadership capabilities and styles, build leadership capability and capacity to align to cultural outcomes and improve the quality of communications. During 2018, this program will be extended to all OTML supervisors and superintendents.
In 2017 team building workshops were held for the general managers and managers to clarify the business mission and vision, improve alignment and agree on priority actions for change. An Extended Leadership Team (consisting of general managers and managers) has been established and meets monthly to review business results and issues, strengthen alignment and foster a one-team approach.
PROFESSIONAL DEVELOPMENTEmployees in PG5+ level positions participate annually in a Performance Appraisal and Personal Development Process. The key outputs are performance feedback and identification of training need. In 2017, training included a personal development program for female administrative staff, specialist technical training for engineers and tradesmen, training in various technical and business software applications and various safety oriented programs.
EDUCATIONEducation is seen as the key pathway for people to improve their self-worth and provide long term benefits for themselves and families.
Education assistance is offered to the eligible children of employees to reimburse mandatory school fees for primary and secondary schooling and tertiary education. In 2017, PGK 8.5 million was paid to education institutions as reimbursement for school and tertiary fees.
OTML supports the following three structured develop programs for in-house trainees:
• Graduate Development Scheme (GDS) (a 2-year program) to meet OTML’s needs for young professionals and to contribute to the pool of work-experienced graduates in PNG. Priority is given to graduates who have been sponsored through the Western Province education sponsorship program and from the Preferred Area. In 2017, there were 37 GDS trainees in this program.
• Apprentice Trade Program (a 4-year sandwich program) to meet OTML’s needs and contribute to the national pool of trades people. In 2017, there were 134 apprentices in this program. Since 1982, when the program commenced, 1,133 apprentices have received their trade certificates.
• Preferred Area Training Program (a four-year program) to provide entry level training to Local/Preferred Area trainees in such disciplines as Mobile Equipment Operators and Plant Operators, Heavy Equipment Fitting and General Administration. In 2017, there were 49 trainees in this program.
PEOPLE CONTINUED

ANNUAL REVIEW 2017 49
An investment of PGK 4.4 million was made in 2017 on education and training of apprentices, trade trainees and school/university scholarships.
BUSINESS IMPROVEMENT – ORGANISATION DEVELOPMENTThe focus for 2017 (and moving into 2018) was to set the foundations for continuous business improvement. Efforts initially focused on simplifying OTML’s management systems to allow leaders to devote more time to value adding activities and the establishment of an improvement culture using a simple business improvement framework and the application of technology. Dedicated teams were established in the mining and processing areas, coordinated through a central Business Improvement team.
Departments conducted workshops to better understand the cultural transformation program, their contribution to it, and the management processes and systems they own. Quick wins were identified for immediate action along with other high value projects to be commenced in 2018. These workshops introduced the methodology to be used (“Business Improvement: The Ok Tedi Way”) and built the momentum for change.
Aligning with the Workforce Culture program’s “One Team, Wan Pasin” approach, several process improvement activities commenced in 2017, coordinated by the central Business Improvement team. These activities focused on reducing business silos and complexity and included a project to improve contractor selection, engagement and employee on-boarding and induction processes, which will be delivered in early 2018. During 2017, the high value productivity improvement activities were also scoped and will commence in 2018.
Employees are the Company’s most valuable asset and require investment in personal and professional development to meet business challenges.
ABOVE: Brendon Moweya analysing samples in the environment laboratory.

50 OK TEDI MINING LIMITED
OTML undertakes a comprehensive
environmental monitoring program
governed by the Ok Tedi Agreement.
In 2017, environmental monitoring was
compliant with the Environmental Regime
conditions and there were no fines or
imposed penalties. The expenditure on
environmental programs was PGK 180 million
(USD 56 million).
ENVIRONMENT
Ok Tedi’s mining operations are centred on the Mt Fubilan deposit in the upper Fly River catchment in the remote Star Mountains, Western Province (Figure 1). The mine is located at an altitude of approximately 2,000m in a densely vegetated, mountainous area where the annual average rainfall is approximately 9,000 millimetres per annum. The easily erodible siltstone and limestone outcrops, coupled with the high rainfall and steep terrain, contribute to a highly unstable geotechnical setting. Localised landslips are common and transport eroded sediment into the surrounding riverine system.
In response to the structural instability of the region, OTML was granted permission from the State to discharge treated tailings and waste rock into the local environment. These materials are hydraulically mobilised down the river systems into the middle and lower reaches of the Fly River. At Bige, located 100 km downstream of the mine, approximately 10 Mm3 of sediment has been dredged annually from the river since 1997/1998 to reduce riverbed sedimentation. The sediment is placed in engineered stockpiles on the east and west banks of the river which are progressively rehabilitated.
The OTML Environment Department is responsible for monitoring impacts along the 1,000 km downstream riverine system from the mine to the Gulf of Papua and at the port transfer facility in Port Moresby Fairfax Harbour. The monitoring includes regular field sampling of water, sediments, aquatic biota and food edibility. A hydrological network of monitoring stations is maintained along the river system which contribute to providing bathymetry surveys, data analysis and reporting. The Environment team works with the OTML Community Relations Department (CRD) to provide environmental information for stakeholder consultation.
The environmental management programs include the treatment of the tailings prior to discharge by removing the sulphide minerals (e.g. pyrite) component, the addition of limestone to the mill feed and waste dumps, the mine waste dredging project at Bige, and an industrial waste management program.
COMPLIANCE MONITORINGThe Ok Tedi Mine, through the Ok Tedi Agreement, is governed by the Ok Tedi Mining Act, 1976, (as amended and supplemented). The schedule to this Act is the Principle Agreement between OTML and the State. The Ninth Supplemental Agreement, which was passed through the PNG Parliament in 2001, has adopted the Environmental Regime which contains OTML’s environmental management and reporting obligations set against six environmental values that relate to:
• the assessment of water quality downstream of the operation in terms of potability;
• the availability of normal aquatic resources such as fish and edible aquatic flora to meet normal community requirements;
• the safe edibility of these aquatic resources;
• the availability of normal terrestrial resources such as dry land on which to establish gardens, hunt and gather firewood, to meet normal community requirements;
• the safe edibility of these terrestrial resources such as crops and natural forest resources included in the normal dietary intake of the local community; and
• water levels in the main Ok Tedi and Fly River channels for navigation by commercial and village craft.
The 2017 Ok Tedi Annual Environmental Report (covering the twelve-month period commencing 1 January 2017) has been prepared and will be submitted to the PNG Conservation and Environment Protection Authority (CEPA) in March 2018. The findings in the report as shown in the following table were that the mine was compliant with all the Environmental Regime conditions.
OPPOSITE: Waisruke Gru at the Bige plant rehabilitation nursery.

ANNUAL REVIEW 2017 51

52 OK TEDI MINING LIMITED
OK TEDI ENVIRONMENTAL MANAGEMENT ACTFollowing the approval of the Mine Continuation Project in 2013, the Company was advised by the CEPA that a new OTEMA would replace the current Environmental Regime in 2018. The finalisation and implementation of the OTEMA is currently pending as it requires enactment by the National Parliament. Under the OTEMA, the following changes to the environmental conditions are proposed:
• annual reports are to be supplemented with quarterly reports;
• an expanded compliance monitoring program that combines the existing compliance program with several other long-standing monitors of the effectiveness of OTML’s mitigation measures;
• the adoption of existing mitigation measures into compliance requirements to be reported regularly, where the key compliance requirements include:
- maintaining the quarterly average tailings sulphur discharge content below 1.0% sulphur;
- maintaining the quarterly average Net Acid Production Potential (NAPP) in tailings below 30 kilograms (kg) sulphuric acid per tonne (H2SO4/t);
- maintaining the annual average NAPP in the waste dumps below 150 kg H2SO4/t;
- matching dredging rates to sand delivery at Bige to control bed aggradation downstream of Bige; and
- placing non-acid forming covers over the Bige stockpiles and reporting cover quality to the State annually; and
• continued development by OTML of its Environmental Management System to be aligned with the ISO 14001 Standard.
OTML Environment Department and Bige Operations have reviewed their operating plans and updated the management systems to align with the new requirements.
ENVIRONMENTAL CRITERIA 2012-2017 COMMENTS REGARDING 2017 MONITORING
Water in the main channel satisfies drinking water standards.
Compliant The water in the main channel and the floodplain satisfies drinking water standards if the contained suspended sediment can settle.
Fish flesh metal concentrations and terrestrial food sources are within the levels of regional and national market basket studies’ and below the World Health Organisation (WHO) established provisional weekly intake values.
Compliant
Levels of the contaminant metals (Cd, Cu, Pb and Zn) in a range of naturally sourced foods that are commonly consumed by Ok Tedi and Fly River communities were comparable to international and regional (Porgera, Strickland and Fly) market baskets and dietary studies. Metal content in these foods is comparable to those of other studies and the intake of these metals by both adults and young children is low compared to the WHO thresholds.
Fly River navigability. CompliantRiver levels in 2017 were higher than average due to sustained rainfall in parts of the Fly River catchment. The number of open shipping days at Kiunga was 344 in 2017 compared to only 308 in 2016. The river is open for copper concentrate ships when the river height is greater than 6.8 m at Kiunga and closed if the level drops below 5.8 m.
Dissolved and bioavailable copper concentrations in the river water.
CompliantThere is an observed decrease in dissolved copper (dCu) and bioavailable copper concentrations in the last decade. These improvement trends are caused by a combination of factors including; implementation of the mine waste tailings project which removes copper bearing sulphide minerals and changes in copper cut-off grade.
Undertaking eco-toxicological monitoring programs.
Compliant
Algal growth inhibition (%AGI) at all compliance sites, except Ningerum and Obo (slightly), is below the 5% threshold for significance, as has been the case over the last six years. Bacterial Growth Inhibition (%BGI) at all sites except Nukumba and Ogwa exceeds the 25% threshold value for significance. Between 2016 and 2017, %BGI at all sites except Ningerum and Nukumba has increased. The improvement in %AGI and to a lesser extent %BGI observed over the last decade is associated with the observed decrease in the concentrations of dissolved copper and bioavailable copper.
Fish biomass remains sufficient to provide food for households along the river.
Compliant
Analysis of the long term (1983-2017) catch data shows a biomass decreasing at all sites monitored with the highest decreases observed closest to the mine. The total biomass reported during 2017 (249.6kg) was slightly higher than in 2016 (247.6 kg), implying sufficient fish stocks to meet the community’s food needs. Fish availability is determined using biomass generated by gill nets mesh sizes ranging from 3 to 5 inches. In 2017, the daily requirement of 2.6 kg was exceeded on 15 out of 24 netting occasions representing a success rate of 63%.
Extent of vegetation dieback in off-river areas affected by flooding.
CompliantVegetation dieback mapping in 2017 revealed that the total area affected by dieback was 2,013 km2, a 3.1% increase compared to 2016. The impacted area of the lower Ok Tedi increased to 222 km2, a rise of 0.4% compared to 2016. The total area is less than the long term predicted maximum area of 2,395 km2.
Monitoring of potential for ARD formation within mine and river.
CompliantResults of sediment surveys in the river system during 2017 indicate an improvement in the acid-base geochemistry of the riverine sediments since 2008 at the lower Ok Tedi levee. Acid Neutralising Capacity/Maximum Potential Acidity (ANC/MPA) ratio in dredged sediments at Bige slightly decreased below the 1.5 target in November and December. However, the 2017 annual average was 2.5 compared to 1.98 in 2016.
ENVIRONMENT CONTINUED
ABOVE: Sunset over the Ok Tedi River.

ANNUAL REVIEW 2017 53
ENVIRONMENTAL CRITERIA 2012-2017 COMMENTS REGARDING 2017 MONITORING
Water in the main channel satisfies drinking water standards.
Compliant The water in the main channel and the floodplain satisfies drinking water standards if the contained suspended sediment can settle.
Fish flesh metal concentrations and terrestrial food sources are within the levels of regional and national market basket studies’ and below the World Health Organisation (WHO) established provisional weekly intake values.
Compliant
Levels of the contaminant metals (Cd, Cu, Pb and Zn) in a range of naturally sourced foods that are commonly consumed by Ok Tedi and Fly River communities were comparable to international and regional (Porgera, Strickland and Fly) market baskets and dietary studies. Metal content in these foods is comparable to those of other studies and the intake of these metals by both adults and young children is low compared to the WHO thresholds.
Fly River navigability. CompliantRiver levels in 2017 were higher than average due to sustained rainfall in parts of the Fly River catchment. The number of open shipping days at Kiunga was 344 in 2017 compared to only 308 in 2016. The river is open for copper concentrate ships when the river height is greater than 6.8 m at Kiunga and closed if the level drops below 5.8 m.
Dissolved and bioavailable copper concentrations in the river water.
CompliantThere is an observed decrease in dissolved copper (dCu) and bioavailable copper concentrations in the last decade. These improvement trends are caused by a combination of factors including; implementation of the mine waste tailings project which removes copper bearing sulphide minerals and changes in copper cut-off grade.
Undertaking eco-toxicological monitoring programs.
Compliant
Algal growth inhibition (%AGI) at all compliance sites, except Ningerum and Obo (slightly), is below the 5% threshold for significance, as has been the case over the last six years. Bacterial Growth Inhibition (%BGI) at all sites except Nukumba and Ogwa exceeds the 25% threshold value for significance. Between 2016 and 2017, %BGI at all sites except Ningerum and Nukumba has increased. The improvement in %AGI and to a lesser extent %BGI observed over the last decade is associated with the observed decrease in the concentrations of dissolved copper and bioavailable copper.
Fish biomass remains sufficient to provide food for households along the river.
Compliant
Analysis of the long term (1983-2017) catch data shows a biomass decreasing at all sites monitored with the highest decreases observed closest to the mine. The total biomass reported during 2017 (249.6kg) was slightly higher than in 2016 (247.6 kg), implying sufficient fish stocks to meet the community’s food needs. Fish availability is determined using biomass generated by gill nets mesh sizes ranging from 3 to 5 inches. In 2017, the daily requirement of 2.6 kg was exceeded on 15 out of 24 netting occasions representing a success rate of 63%.
Extent of vegetation dieback in off-river areas affected by flooding.
CompliantVegetation dieback mapping in 2017 revealed that the total area affected by dieback was 2,013 km2, a 3.1% increase compared to 2016. The impacted area of the lower Ok Tedi increased to 222 km2, a rise of 0.4% compared to 2016. The total area is less than the long term predicted maximum area of 2,395 km2.
Monitoring of potential for ARD formation within mine and river.
CompliantResults of sediment surveys in the river system during 2017 indicate an improvement in the acid-base geochemistry of the riverine sediments since 2008 at the lower Ok Tedi levee. Acid Neutralising Capacity/Maximum Potential Acidity (ANC/MPA) ratio in dredged sediments at Bige slightly decreased below the 1.5 target in November and December. However, the 2017 annual average was 2.5 compared to 1.98 in 2016.

54 OK TEDI MINING LIMITED
ENVIRONMENT CONTINUED
TAILINGS AND WASTE ROCK MANAGEMENTThe riverine discharge of tailings and waste rock management continues to be the most significant long-term environmental risk for OTML. In the past this has caused sediment aggradation in the river, causing overbank flooding in the middle and lower Fly River as well as decreased aquatic biomass. OTML has implemented a comprehensive series of mitigation projects to reduce the long-term impact on the river system including; removal of pyrite from the tailings, addition of limestone to waste rock and tailings to maintain alkalinity in the river system and the dredging of sands from the river bed approximately 100 km downstream of the mine at Bige. In 2017, approximately 17 Mt of treated tailings was discharged to the upper reaches of the Ok Tedi River and 51.4 Mt of waste rock was discharged to failing dumps to the north and south of the mine.
To further assist in neutralising potential acid production from the mining and processing operations, up to 4,000 tonnes per day of limestone is added to the mill feed at the primary crusher. The finely ground limestone reacts more readily to neutralise acidity and is transported with the tailings down the river system. A large proportion of the milled limestone is deposited in the dredge slot at Bige.
OTML is the only large copper mine to separate sulphides from the tailings prior to tailings discharge as part of the Mine Waste Tailings Project (MWTP). The target is less than 1% Sulphur in the final tailings which is predominately sand-sized particles. The PCon produced is transported through a 273 (millimetre) mm outside diameter, 125 km long pipeline to designated PCon storage pits on the West Bank at Bige where it is permanently stored sub-aqueously and then covered with barren sands dredged from the river and rehabilitated.
The residual tailings comprising barren sands are discharged into tributaries that flow into the Ok Tedi River and eventually into the Fly River. Tailings are mobilised by the fast-flowing streams and held in suspension until the river profile starts to flatten out a short distance upstream from the junction with the Fly River. The sediments (comprising natural, tailings and waste rock fines) that accumulate at this short section of river are being dredged at a nominal 10 Mm3 per annum at Bige. The sediments are pumped ashore and hydraulically placed into long-term engineered storage stockpiles located on the banks of the Ok Tedi River at Bige covering approximately 980 hectares (ha). The stockpiles are stabilised and progressive revegetation during operations using native trees and plants will continue as final landforms are constructed.
BIODIVERSITY IMPACTSThe discharge of mine waste to the local river system results in increased sediment deposition on the bed of the river. The resultant heightening of the riverbed over many years has caused an increase in the duration of overbank floodplain inundation. This flooding resulted in the conversion of parts of the forested floodplain to grassed floodplain in the lower Ok Tedi and the upper reaches of middle Fly River system. The extent of forest dieback and changes to grassland is monitored annually and reported to the State in the annual environmental report.
OPPOSITE: Diro Niai inspecting young seedlings for rehabilitation works at Bige.

ANNUAL REVIEW 2017 55

56 OK TEDI MINING LIMITED
Based on the 2017 vegetation dieback mapping, 2,013 km2 of forest vegetation has been impacted through the lower Ok Tedi and Fly River floodplains since the commencement of OTML’s operations. This represents a 3.1% increase since the 2016 assessment. The impacted area of the lower Ok Tedi increased to 222 km2, a rise of 0.4% compared to 2016. Vegetation recovery for the Ok Tedi and Fly River floodplains was affected by above average river levels associated with the La Niña climatic conditions that have been evident since early 2016 and has decreased by 22.1% to 244 km2. The vegetation recovery extent in the lower Ok Tedi fell to 84 km2, a reduction of 3.1%. The currently impacted area is 16% lower than the predicted maximum extent of 2,395 km2.
In 2017, 18 new vegetation monitoring sites targeting areas of vegetation stress were established between Manda and Everill Junction. Plant specimens collected were submitted for identification by specialists at Lae National Herbarium. This monitoring will complement the existing satellite-based monitoring of vegetation dieback and recovery. OTML also purchased high resolution (5 m horizontal) Pleiades satellite imagery to replace the lower resolution (SPOT) data. This will improve dieback and other floodplain resources mapping.
Since 1983, OTML has monitored fish biomass, abundance and species richness, using standardised gillnet methods at three riverine sites, to assess the change in fish catch over time. Between 1983 and 2017, fish biomass decreased significantly. However, the extent of decline in fish abundance and species richness has reduced since 2009, coinciding with the observed improvement in water quality and bed level stabilisation due to the mitigation programs (MWTP and dredging).
In 2017, 11 representative lagoons, lakes and swamps that formed, were studied to determine if these new aquatic habitats supported similar ecology, fish assemblages and biomass, as in established floodplain habitats. The results showed that the newly formed grassed lagoons were highly productive and the biomass in these sites, although dominated by exotic/introduced species, exceeded the per capita daily intake requirement on nearly all occasions. OTML will continue to monitor the riverine biodiversity as part of the annual monitoring program and maintain the environmental mitigation projects to reduce the overall impacts.
ENVIRONMENTAL PERFORMANCEOTML is committed to improving environmental performance across all aspects of the Company’s operations and has prepared the 2017 data tables and previous year data for comparison. The average %Sulphur in final tailings discharge was 0.95%. This was 5% lower than the target value of 1% and lower than the 2016 value. During 2017, the NAPP target of <30 Kg H2SO4/t for the final tails was met by milling limestone and maintaining sulphur levels below 1%. Keeping the NAPP target at <30 Kg H2SO4/t is critical to ongoing generation of cover quality materials in the dredge slot at Bige, as well as reducing the risk of ARD on the levee and the adjacent floodplain.
In 2017, OTML replaced the aged hydrometric network, which included the establishment of a telemetry base station at Tabubil and a field station at Ningerum. The second phase of this project will be completed in 2018, resulting in improved data capture, transmission and reporting to OTML and external authorities. As part of the project, three hydrographers were trained (TAFE Diploma level qualification) to operate the upgraded system.
ENVIRONMENT CONTINUED

ANNUAL REVIEW 2017 57
WATER USAGEIn 2017, total water use was 17% higher than in 2016 due to a full operating year (12 months versus 10 months in 2016). Recycled water comprised 73% of the water utilised by the processing plant.
ENERGY CONSUMPTIONOpen cut mining and the processing of copper ore is an energy intensive industry. OTML’s energy intensity index (MWh/t contained copper) decreased from 5.2 in 2016 to 4.7 in 2017.
Fuel is a major component of the overall costs of OTML operations and also contributes significantly to the Company’s greenhouse gas (GHG) emissions. Total GHG emissions in 2017 were 277 Kt carbon dioxide equivalents (CO2-e), representing a 3% increase from that in 2016. High cost thermal energy generation is minimised where possible and hydroelectric base load power is utilised.
The total amount of electricity used during 2017 was 493 Gigawatt hours (GWh) compared to 414 GWh in 2016, with 396 GWh being produced from hydroelectricity. Hydroelectric power therefore provided 81% of OTML’s power requirement through the two hydroelectric generation stations (Ok Menga and Yuk Creek), representing an increase from 77% in 2016.
Less than one GWh (0.47 GWh) was sold to Ok Tedi Power Limited, the company created to manage power distribution through Western Province and this was slightly higher than in 2016.
In 2017, total diesel consumption was 103.2 ML and 28% of this consumption was used for power generation compared to 29% in 2016.
Diesel is used for the following purposes:
• powering of vessels used to transport supplies to site and concentrate to the Kumul Arrow;
• dredging activities conducted at Bige;
• road transportation of materials and goods from the Kiunga wharf facility to Tabubil town;
• the mining fleet consisting of trucks, shovels and ancillary equipment; and
• supplementary power generation at Tabubil, Bige, Kiunga and outstations.
ABOVE: Hydrographer, Regina Komboi and Scott Walker from Australian Laboratory Services collecting downstream water samples.

58 OK TEDI MINING LIMITED
ENERGY TYPE (CONSUMPTION) 2016 2017
Total energy used (fossil + renewables) (Petajoule (PJ)) 4.78 5.17
Total energy (fossil) (PJ) 3.63 3.75
Total renewable energy (PJ) 1.15 1.42
Energy used for transportation (ships, planes, vehicles) (PJ) 2.35 2.68
ENVIRONMENTAL MANAGEMENT PERFORMANCE 2016 2017
Environmental induction (number of OTML and contract employees) 0 1,380
Environmental action plan (% completed) na 58
Incidents Level 3+ (Medium, major or catastrophic) 1 3
WATER MANAGEMENT 2016 2017
Total water used (‘000 m3) 52,083 60,844
Freshwater (‘000 m3/% of total) 14,725/28 16,425/27
Recycled water (‘000 m3/% of total) 37,358/72 44,419/73
Freshwater intensity index (m3/t contained copper) 184 156
WASTE MANAGEMENT 2016 2017
Total riverine disposal (‘000 t) 48,549 68,398
Waste rock (‘000 t/% of total) 34,927/72 51,415/75
Tailings (‘000 t/% of total) 13,622/28 16,983/25
PCon slurry piped to Bige (‘000 t) 2,147 2,648
Riverine disposal intensity index (t/t contained copper) 634 649
Annual dredge slot production rates (Mt) 14.1 16.3
Average annual % sulphur in waste rock 1.29 1.40
Average annual % sulphur in tailings 1.12 0.95
Average annual ANC/MPA in dredged sediments 1.98 2.56
Average dissolved copper (µg/L) at Nukumba 6 7
Scrap metal (t shipped for recycling) 2,461 2,481
ENERGY AND GREENHOUSE GAS PRODUCTION 2016 2017
Total diesel consumption (ML) 92.3 103.2
Diesel consumption for power generation (ML/% of total) 27.1/29 28.9/28
Diesel used for machinery / other (ML/% of total) 65.2/71 74.3/72
Electricity use (MWh) 414,355 493,188
Diesel generated electricity (MWh/% of total) 95,061/23 96,891/19
Hydroelectricity (MWh/% of total) 319,153/77 396,296/81
Power sold (MWh) 412 471
Energy intensity index (MWh/t contained copper) 5.2 4.7
GHG emissions (‘000 t CO2 e) 268 277
GHG emissions index (t CO2 e/t contained copper) 3.3 2.6
New land disturbed this year (ha) 6 14.3
Total land disturbed to date (ha) 2,721 2,735
Land rehabilitated this year (ha) 14 15.32
na = not applicable
ENVIRONMENT CONTINUED
OPPOSITE: Cap Martin dredging sediments from river bed at Bige.

ANNUAL REVIEW 2017 59

60 OK TEDI MINING LIMITED
LAND DISTURBANCEIn 2017, 14 ha of new land was disturbed as part of the geology exploration activities and stockpile development at Bige. This brings the total cumulative disturbance at all operational sites to 2,735 ha. During 2017, 15.3 ha of Bige stockpiles were rehabilitated using a mixture of grasses and tree species. No land rehabilitated currently meets the end land use criteria.
MINE CLOSURE PLANNINGOTML is required to prepare an updated Mine Closure Plan, Mine Area Rehabilitation Plan and Social Impact Assessment every three years. During 2016, a suite of updated Mine Closure Plan documents were prepared using the latest information based on disturbances, proposed mine plan and learnings from the Bige rehabilitation trials. The closure plans were formally approved by the State in July 2017.
In preparation for closure in 2024, OTML has PGK 758 million (USD 235 million) in an offshore trust fund for closure works. Financial modelling has demonstrated that this amount exceeds the estimated closure costs based on updated estimates for mine closure requirements.
Progressive rehabilitation at Bige includes the outer slopes and crown areas of the Eastern stockpile. A combination of mechanical and hand planting techniques using local community labour has demonstrated a viable revegetation strategy exists. It is expected that the approach will continuously evolve, and the long-term sustainability assessed through a monitoring program.
During 2017, Landform Functional Analysis (LFA) and Ecosystem Functional Analysis (EFA) monitoring transects were established at the East and West banks at Bige. Training was conducted for Bige rehabilitation staff to monitor the transects. A Geographical Information System (GIS) database was specifically developed to manage monitoring data.
During 2017, a total of 24 transects were established on the East and West Bank Bige stockpiles for LFA/EFA monitoring and three transects established at Kwiape village as a control. A GIS database framework was developed to manage the data generated from this monitoring. The EFA/LFA monitoring is aligned to Mine Area Rehabilitation Plan success criteria.
ENVIRONMENTAL INCIDENTS AND COMPENSATIONOTML reports on the amount of environmental compensation paid to communities and landowners as direct payment for damage to crops, gardens, waterways in the event of a process or chemical spill or other mine related incident. In 2017, there were three moderate environmental production related (Level 3) incidents.
ENVIRONMENT CONTINUED
The Environment team works with the OTML CRD to provide environmental information for stakeholder consultation.

ANNUAL REVIEW 2017 61
NO DATE LOCATIONRATING
(ACTUAL) DESCRIPTION
1 21-Mar-17 Mill 3Process tailings was discharged to the discharge point, instead of going through the TM01 tailings thickener. This resulted in a short duration increase of the Sulphur to the tailings.
2 8-Jun-17Tabubil-Kiunga
Highway3
Copper concentrate pipeline was vandalised at KM48 and KM55, releasing around 800 wet metric tons of copper concentrate. The pipeline was shut down and repairs completed. Most of concentrate was recovered.
3 1-Aug-17 Mill 3
A power failure in the mill caused pumps to trip causing an estimated 60 t of copper flotation slurry to overflow from the bunded area into the drainage line, through the workshop and eventually into the natural environment within the lease boundary.
No community compensation was paid for these incidents. Annual compensation payments were made to the nine CMCA regions as direct reparation due to legislated continued use of riverine tailings discharge. In 2017, payments totalled PGK 70.96 million.
COMMUNITY/ENVIRONMENTAL COMPENSATION2016 (PGK)
(M)2017 (PGK)
(M)
Lease and CMCA related 71.67 70.96
Non-lease and non CMCA related 0.0 0.0
Total 71.67 70.96
NON-MINE WASTE MANAGEMENTOTML has an Industrial Sites Management Program which coordinates the identification, quantification and management of contaminants and waste streams from all operational areas to reduce the potential for contaminated sites to develop. The Company has developed an integrated waste management program that is actively collecting and sorting materials that can be recycled to reduce landfill. In 2017, there were similar volumes of waste scrap steel shipped off-site, compared to 2016.
2017 TOTAL SCRAP METAL SHIPPED
Ferrous (t) Non – Ferrous (t) Liner Plates (t) TOTAL (t)
1,503 218 759 2,481
2016 TOTAL SCRAP METAL SHIPPED
Ferrous (t) Non – Ferrous (t) Liner Plates (t) TOTAL (t)
1,597 103 761 2,461
In 2017, there was 1.13 ML of waste oil used as a fuel in the lime kiln and 0.52 ML shipped to Port Moresby for recycling. Waste tyres have been stockpiled pending disposal.

62 OK TEDI MINING LIMITED
OPPOSITE: Children at Migalsim village.
OTML conducts its operations in a manner
that balances economic and social impacts,
respecting the rights and cultural heritage of impacted communities. OTML has demonstrated
it can provide long term social benefits when communities,
other stakeholders and governments collaborate
to balance the environmental impacts
of mining with the social and economic benefits
of development.
SOCIAL RESPONSIBILITY
The Company maintains regular and open dialogue with the CMCA communities and National and Provincial governments. This dialogue is based on Free and Prior Informed Consent principles to which OTML subscribes. OTML has developed and applies a comprehensive Community Relations system that provides processes and tools to address impacts and grievances, respecting human rights and local cultures. The system is described in the OTML Community Relations Manual, which is available on the OTML website: www.oktedi.com.
Ok Tedi’s Community Relations programs focus on developing partnerships with local communities, government and businesses in order to improve long term social and economic development in Western Province and the Telefomin District. The program has been developed through consultation with the CMCA communities and complements initiatives of government, aid agencies and Non-Government Organisations (NGO) working in the region.
The delivery and management of major programs is primarily through the OTDF, a not for profit entity, funded directly from OTML. OTDF aims to build capacity and self-sufficiency within the local communities in order to develop long term sustainable outcomes. OTML supports the OTDF by providing resources and staff to participate on various Boards and Trusts, providing strategic planning support, technical services, networking assistance, financial and in-kind resources.
Ok Tedi’s commitment to social responsibility covers all phases of the mining project life cycle from exploration, construction, operations and mine closure activities.
PNG, Western Province and communities obtain enduring benefits from OTML through employment, local business, dividends, taxes and royalties, goods and services, TCS projects, training, capacity building and economic and social development programs.
COMMUNITY MINE CONTINUATION AGREEMENTThis agreement defines the cash compensation, investment and development payments that OTML will make to the 158 CMCA communities affected by the operations. The communities are grouped into nine CMCA regions (Figure 1) and represent over 147,0002 people. The nine CMCA regions extend from the mine in the north to the Fly River delta in the south. Each region has four representatives, including at least one woman.
CMCA AND MINE VILLAGES UPDATESThe CRD conducts annual population and family listing updates for the nine CMCA Trust regions including the six Mine Villages. The cash payments to the beneficiaries are calculated based on the population of respective regions and directly disbursed to family accounts via online banking system.
The CRD manages payments into more than 20,000 family accounts for the annual CMCA payments and over 1,500 accounts for the annual lease payments to the six Mine Villages.
COMMUNITY CONSULTATIONOTML seeks to build transparent and collaborative relationships with its stakeholders based on trust and respect. By listening and discussing issues, community and stakeholder concerns and aspirations can be considered in the Company’s planning for future program implementation through the CRD or the OTDF.
The CRD is responsible for formal and informal community consultation and managing the dissemination of information to communities. The CRD continues to conduct village patrols to all 158 CMCA communities. In 2017, a single annual patrol was completed for the land villages in February and the river villages in April.
OTML uses these meetings to provide feedback on issues previously raised, provide information updates on mining operations, environmental impacts and social responsibility programs managed through the OTDF. The community is able to raise concerns and these are recorded as requests or grievances for follow-up and resolution.
2 The initial CMCA village and household census was conducted in 2007. The population count has increased by 82% over the last ten years indicating that more people are benefiting from the annual CMCA cash payments.
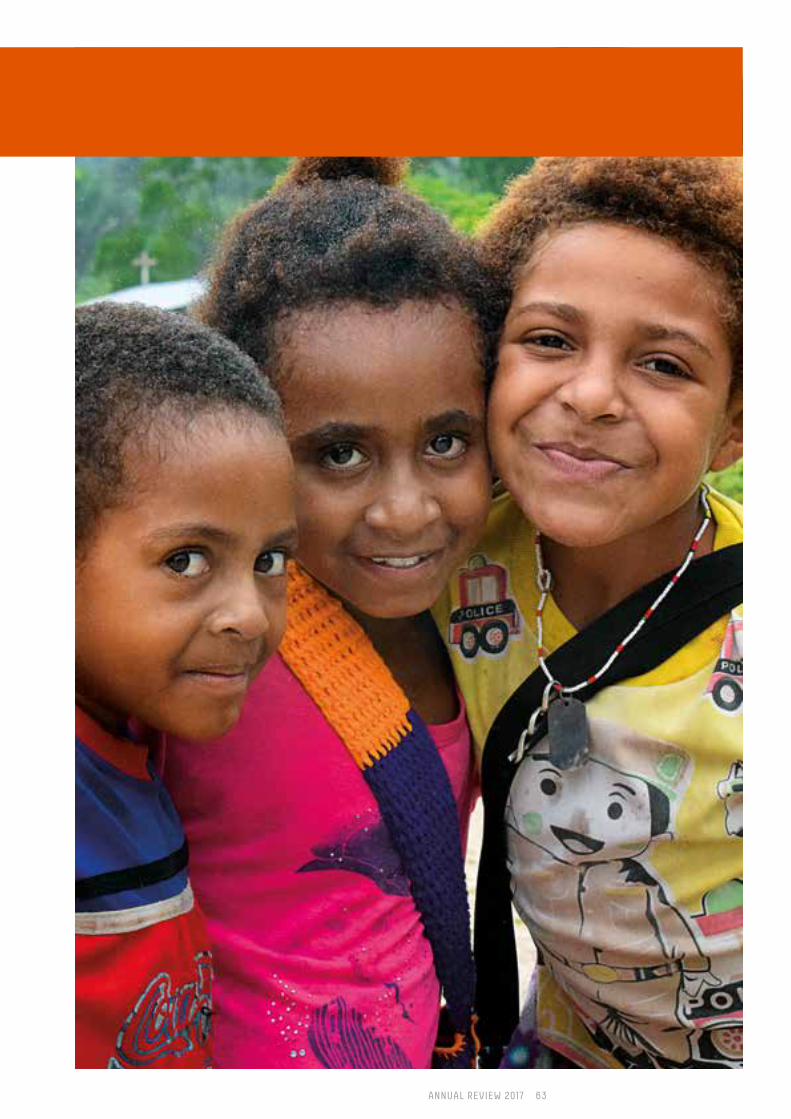
ANNUAL REVIEW 2017 63

64 OK TEDI MINING LIMITED
Key information disseminated included updates on:
• the status of the transfer of equity in OTML from the State to Western Province entities;
• the dividend payments and allocations; and
• the change in management of the CMCA and general compensation cash payments from Deloitte to OTML.
In February 2017, four patrol teams comprising of OTML Community Relations Officers and Data Clerks visited 68 villages out of a total of 71 villages and others located in North Ok Tedi, Highway and Lower Ok Tedi. Three villages in the Lower Ok Tedi were not visited due to security concerns for the team, preventing updates to their villages, and one other village because people were absent. The teams conducted the biennial CMCA population updates and also disseminated 680 copies of OTML Komuniti Nius to the communities. Over 7,000 community members in total attended the meetings. Attendance was 20% higher than in previous annual patrols.
In March/April 2017, four patrol teams scheduled visits to 82 Middle and South Fly villages. All 82 villages were visited, but only 81 meetings were conducted. One village in the South Fly region did not allow the team to conduct a meeting and complete the population updates. In total, over 15,000 community members attended the meetings.
The communities raised several issues that were addressed at the meetings or taken on notice for follow-up by management and further discussion. These included:
• some villages were not happy with the 33% shareholding and the split between the three Western Province entities;
• dissatisfaction with six mine villages receiving 9% shares compared to 12% for the other 152 CMCA communities;
• cash payments to be included in the dividends from 12% CMCA shareholding; and
• general compensation payments to be paid to family accounts instead of clan accounts.
These issues were addressed at the leaders meetings and feedback will be provided to the communities during the 2018 CR patrols.
In the last 12 months, there has been no major community disruption to OTML operations and the Company generally enjoys a positive working relationship with the communities.
OTML COMPLAINTS AND GRIEVANCESOTML developed a CGMS which was introduced in 2014. This on-line system enables the rapid capture of complaints or grievances from the community. Information on the CGMS can be found on the OTML website: www.oktedi.com.
The CGMS meets the grievance mechanism tool guidelines of the United Nations and International Finance Corporation for Resource Sector development and addresses human rights and grievances.
Complaints are usually raised by the community with Community Relations officers during patrols or are lodged at the Tabubil or Kiunga offices. The CGMS supports considered responses and enables management to analyse trends by complaint type, region or complainant. Complaints can be resolved and closed out at any time if a complainant is satisfied with the outcome.
In 2017, a total of 583 complaints or queries were lodged in the system and 575 were successfully closed out. Of the complaints, 47% were related to compensation and payments. This comprised family CMCA cash, general compensation and lease payments totalling PGK 10.2 million and specific claims totalling PGK 2.7 million. Following investigations, most of the claims were found to be not genuine and complainants were notified accordingly. The Highway, Middle Fly, Lower Ok Tedi and Mine Villages had the most complaints registered.
SOCIAL RESPONSIBILITY CONTINUED

ANNUAL REVIEW 2017 65
COMPLAINT CATEGORYNUMBER OF
COMPLAINTS IN 2017
Compensation and payments 275
Safety and security incidents 12
Employment, training and business 26
Land and local culture 29
Infrastructure, health, education and technology 27
Local leadership and organisation 16
Information, procedures and protocol breaches 155
Environment and emergencies 11
Key stakeholder relations 7
Other 25
SIGNIFICANT DISPUTES RELATING TO LAND USE OR CUSTOMARY RIGHTSIn 2017, a total of seven land related disputes were ongoing. Five of these were in relation to land ownership claims over the SML and Tabubil Township lease. One was in relation to pursuit of benefits from the State for the occupation of the Kiunga Wharf operational areas and a legal case against OTML where landowners are claiming payment for the usage of Dablan Creek.
OTML is closely monitoring these legal cases since they could potentially impact the operation.
COMMUNITY RELATIONS PROJECTS AND OTHER SIGNIFICANT ISSUESOther projects and significant issues attended to by the CRD in 2017 include:
TYPE DESCRIPTION
Km 59 Pump Station Memorandum of Agreement (MOA)
A benefit sharing proposal was negotiated, and MOA signed between OTML and the landowning clans in October 2017.
Sepe-Auti Profile Social baseline study completed for the Sepe-Auti Village in South Fly. Sepe-Auti signed the Mine Life Extension agreement in January 2017 and field data collection was conducted during the village patrols in February.
OTML Obligations RegisterReview and update the registration and status of all OTML obligations for the last 35 years relating to Community Relations.
CMCA/Mine Village Database
Development of a database application to improve the management of population and family account data for the CMCA and Mine Villages. This is an in-house initiative requiring training of data clerks and Community Relations Officers in the use of data collection tools and data entry.
Leaders Meeting
An open forum with the invited leaders was conducted in Kiunga in October 2017 to provide an opportunity for leaders to raise suggestions and discuss issues. The meeting was attended by representatives from OTML, the OTDF, Provincial Government and community leaders.
Ok Tedi’s commitment to social responsibility covers all phases of the mining project life cycle from exploration, construction, operations and mine closure activities.

66 OK TEDI MINING LIMITED
OK TEDI DEVELOPMENT FOUNDATIONThe OTDF was established in 2001 under the Ok Tedi Mine Continuation (Ninth Supplemental) Agreement Act as a tax-free entity. OTDF’s vision is to improve self-sustainability and quality of life for Western Province communities with consideration for the peoples of the Telefomin District, Sandaun Province. The four key themes underpinning OTDF day to day operations are:
• effective management and implementation of development programs;
• strengthening partnerships;
• appropriate and accountable financial and operational systems support; and
• open and transparent communications.
OTDF is managed by a Board and in 2016, rolled out a five year strategic direction in anticipation of becoming less reliant on direct funding from OTML and assuming greater responsibility as the development vehicle for Western Province. The strategy focus is on the five key sectors of Local and Regional Development, Education, Health, Infrastructure, Community and Social Development. Project and program funding for the OTDF is primarily from OTML, CMCA Trusts and Western Province Peoples Dividend Trust Fund (WPPDTF).
OK TEDI DEVELOPMENT FOUNDATION - SOURCE INCOME, 2017
SOURCE OF INCOMEAMOUNT (PGK M) PERCENTAGE
OTML 16.6 42%
OTML – Tax Credit Scheme 0.7 2%
WPPDTF 9.7 24%
CMCA Trust 11.4 28%
Other Donors 1.7 4%
TOTAL 40.1 100%
PROGRAM EXPENDITURE BY SECTOR 2017
PROGRAMAMOUNT (PGK M) PERCENTAGE
Community and Social Development 1.2 3%
Education 8.0 20%
Health 13.0 32%
Infrastructure 7.8 20%
Local and Regional Economic Development 10.1 25%
TOTAL 40.1 100%
Detailed information on program delivery for 2017 can be found in the OTDF Annual Report and on the OTDF website: www.otdfpng.org. A short summary of key community achievements is described in the following pages.
SOCIAL RESPONSIBILITY CONTINUED
OPPOSITE: Dancer, Nekepi Ginia from Kawiapo, during the South Fly CMCA Cultural Show.

ANNUAL REVIEW 2017 67

68 OK TEDI MINING LIMITED
SOCIAL RESPONSIBILITY CONTINUED
COMMUNITY DEVELOPMENT
COMMUNITY HEALTHOTML has provided significant resources so that the community can access quality primary health care in Western Province.
The Tabubil hospital is an accredited five-star facility under the PNG Department of Health system and is managed by Diwai Pharmaceutical Limited, a commercial subsidiary of Divine World University. The hospital provides services to the North Fly District and Telefomin communities. Tabubil hospital is funded predominantly by OTML with a contribution from FRPG.
The Tabubil Urban Clinic provides primary health care services and reduces the demand on tertiary health care services at Tabubil hospital. The clinic undertakes regular health patrols, radio health consultations and completed 17,176 consultations and administered 3,555 vaccinations in 2017. A community health education program delivered resources on diarrhoeal control, tuberculosis, non-communicable diseases, sexual health and personal hygiene.
The Company, through the OTDF, works in partnership with the Western Province Provincial Health Department, various church groups, NGOs and private health providers. Funding for primary rural health has been consolidated and includes the OTML TCS, Western Province People’s Dividend Trust Fund and CMCA Trusts. OTDF expended PGK 13.0 million on health sector projects in 2017.
In 2016, the North Fly Health Services Development Program (NFHSDP) and Middle and South Fly Health Program (CMSFHP) were integrated into a single program. Program delivery is co-ordinated through Abt Associates in collaboration with local providers. Program expenditure in 2017 was PGK 12.1 million with a further PGK 0.9 million paid to CMCA Trust health projects.
Abt Associates worked with the health partners to develop a two-year transition plan to hand over the program to the Government and Health Service Providers. The plan focuses on the transition from direct clinical inputs towards working with partners to identify impediments to achieving sustainable health services and maintaining the significant health improvements in the Western Province.
The NFHSDP program supports the Kiunga four star hospital through management and administrative inputs.
Since the integration of rural health services, there have been significant improvements in all 16 health indicators across the Western Province. The PNG National Department of Health completes an annual Sector Performance Annual Review and the current report (2016) shows that Western Province has maintained its ranking (4th) out of the 22 PNG Provinces and is well above the national average. Selected health indicators are shown below.

ANNUAL REVIEW 2017 69
WESTERN PROVINCE HEALTH SECTOR PERFORMANCE 2007 AND 2016
SELECTED HEALTH INDICATORS NFHSDP CMSFHP
2007 2016 2007 2016
Antenatal 1st Visit Coverage (%) 57 81 29 31
Malaria Incidence per 1,000 Population 479 367 126 71
Outreach Clinics per 1,000 Children < 5 years 17 33 4 16
Pentavalent Vaccination Coverage (%) 55 63 7 30
Measles Vaccination Coverage (%) 45 57 - -
Facility Births with Low Birth Weight (%) 10 7 - -
Outpatient Visits per Person per Year - - 1.3 1.6
Couple Years Protection for Contraception - - 726 2,235
ABOVE: Emmy Jummy and Monica John recording village population data on annual patrol.

70 OK TEDI MINING LIMITED
EDUCATIONIn 2015, the Community Education Service was transferred from OTML to OTDF management as part of consolidating community development initiatives for all mine affected communities. The OTDF has improved co-ordination of educational services with various partners including the Fly River Education Department and other development partners.
The investment in education is recognised by the community as a way of improving the long term economic and social conditions in Western Province.
The goal is for the CMCA to have access to quality education through improved curriculum, teacher education and training and management, in line with national and Western Province education plans. OTDF funding is sourced from the OTML TCS and CMCA Trusts. The aim is to also source additional funding from the WPPDTF for education programs. In 2017, education program expenditure was PGK 8.0 million. The primary expenditure was in CMCA and mine Preferred Area Village scholarships and funding paid for 546 full time students studying secondary and tertiary courses in PNG and overseas.
The OTML TCS funded building improvements for the Montfort Primary School and Oksapmin High School for students in the North Fly region.
In 2017, Flexible Open Distance Education expanded by six centres, bringing the total to nine in the Western Province. The Women’s and Children Trust contributed PGK 555,000 to assist with courses. In 2017, there were 707 adult matriculation enrolments to upgrade year 12 results to meet tertiary institution enrolment levels and all students completed their subjects. In addition, 499 year-12 students enrolled, and 17 full time year-12 students graduated.
In 2017, the Tabubil International School was reopened with support from OTML, the community and an innovative community business initiative, to provide alternative higher quality schooling for children from the local communities. The Tabubil supermarket, which was restructured after a non- landowner shareholder encountered financial difficulties, is now owned by landowners. It has elected to support education and especially the Tabubil International School by contributing approximately PGK 3 million per year out of its profits. This subsidy resulted in a significant reduction in annual school fees and in January 2018, 447 students were enrolled.
WOMEN AND YOUTH PROGRAMSCommunity and Social Development is a priority for the CMCA communities. Increased participation by CMCA members (including women and youth) in planning, decision-making and the implementation of community priorities and projects, which can lead to greater independence. In 2017, the OTDF has focused on women’s and youth’s projects, funded from the Women and Children’s Trust Funds to the value of PGK 1.1 million. There has been strong support for development of Women and Youth Associations across the Province with formal training for office bearers, especially in areas of leadership, director’s skills and governance.
Through these Associations, a number of village-based initiatives have commenced, including Livelihood Development Programs for rice and milling, eaglewood, rubber and other agronomy based projects that can provide sustainable food security and allow excess products to be sold.
SOCIAL RESPONSIBILITY CONTINUED

ANNUAL REVIEW 2017 7 1
INFRASTRUCTUREThe objective is to provide increased access to markets, basic services and village services that improve local and regional economic development opportunities. Funding is from the OTML TCS, WPPDTP and CMCA Trusts and in 2017, PGK 7.84 million was spent on projects. This included final payments for the Aiambak to Lake Murray road and the Obo/Kaviananga bridge. Eighteen houses were built for health providers and teachers and 26 water catchments and tanks installed. The Trusts have invested over PGK 100 million in major assets, including ships, planes, offices and buildings, with long term projected annual returns of 8%, based on current lease arrangements. The CMCA Trust has recently provided funding for the building of a 40-room hotel in Kiunga (Cassowary Hotel), to be managed by Coral Sea Hotels, with a guaranteed return of PGK 2.5 million per annum over 10 years.
REGIONAL AND ECONOMIC DEVELOPMENTEconomic development focuses on projects that can provide sustainable food supply for communities and provide medium-term economic access to markets, for example, the selling of agricultural products to local and regional customers. The OTDF provides financial support through Trust investments and transfers knowledge to community farmers working small to medium enterprise rubber, rice and eaglewood plantations. One project funded by the Six Mine Villages and the Star Mountains Women’s Association was the PGK 7 million, Mt Fubilan poultry project. The aim of this project is to produce over 4,000 eggs per day and 33,000 broiler chickens per year. The major customer is Fubilan Catering Services, who have the OTML catering contract. The project provides local employment, a project payback of five years and potential for development of integrated upstream, locally grown, chicken food projects.
ECONOMIC CONTRIBUTIONOTML provides significant funds towards socio-economic development, both directly through services provided, infrastructure, and indirectly through the facilitation of community access to services and infrastructure. OTML’s service delivery is through the OTDF. OTML’s economic contribution to PNG and the Western Province is through the following payments:
• royalties from metal sales;
• employee salaries;
• capital and operating expenditure to suppliers of goods and services in PNG;
• payments under the various land and community agreements;
• various business taxes, including company payroll and the TCS;
• donations and investments in community development programs; and
• investment in local and regional infrastructure, including roads, bridges, jetties, hospitals, schools.
Contributions to the PNG economy in 2017 were approximately PGK 1,374 million, which was significantly higher than 2016 of PGK 952 million. Taxes and levies paid to the PNG Government were PGK 161 million, 60% higher than in 2016 due to resumption of company tax payments in 2017 following tax losses during the dry weather event. A dividend of PGK 380 million was paid to shareholders, including a PGK 49.5 million payment for 2014 dividends. Royalty payments of PGK 47.9 million were made to the FRPG and landowners, up by PGK 19.2 million from 2016.
TCS expenditure was 56% lower in 2017 (PGK 5.5 million) when compared to 2016 expenditure. Goods purchased in PNG increased to PGK 295 million compared to PGK 285 million in 2016.

72 OK TEDI MINING LIMITED
CONTRIBUTION TO LOCAL COMMUNITIES AND THE PNG ECONOMY
PGK (M) USD (M)
2016 2017 2016 2017
Taxes and levies paid to PNG Government 101.2 161.1 32.0 50.5
Dividend paid - - - -
– Government 100.5 380.0 31.7 116.0
Total Dividend paid 100.5 380.0 31.7 116.0
ROYALTY PAYMENT
– Fly River Provincial Government 15.8 21.3 5.0 6.7
– Landowners 15.7 28.0 5.0 8.7
– Less: Royalty tax – Land owners (0.8) (1.4) (0.3) (0.4)
Subtotal 30.7 47.9 9.7 15.0
TAX CREDIT SCHEME
– Health 2.0 0.1 0.6 0.0
– Education 2.6 3.2 0.8 1.0
– Roads, bridges, airport 3.2 0.6 1.0 0.2
– Utilities 4.6 1.6 1.4 0.5
Subtotal 12.4 5.5 3.9 1.7
Goods purchased in PNG 285.4 295.2 90.2 92.5
PNG contractors 258.9 243.5 81.8 76.3
Local training costs 3.0 4.4 0.9 1.4
Salaries and wages 159.5 236.6 50.4 74.1
TOTAL 951.5 1,374.2 300.5 427.5
ROYALTY PAYMENTS In 2017, OTML paid PGK 49.3 million in royalties (inclusive of taxes) from copper and gold production. The royalties were significantly higher than in 2016 and distributed to the following recipients:
ROYALTY RECIPIENTS 2016 (PGK M) 2017 (PGK M)
Fly River Provincial Government 15.8 21.3
Landowners 14.9 26.6
National Government (IRC) 0.8 1.4
SOCIAL RESPONSIBILITY CONTINUED

ANNUAL REVIEW 2017 73
COMPENSATION PAYMENTSOTML makes annual compensation payments and these payments typically cover costs for the various leases involving the mine and its infrastructure. General compensation payments to CMCA communities include, mine landowner projects, environmental and other general compensation.
In 2017, compensation payments totalled PGK 88.8 million.
PAYMENT RECIPIENTS 2016 (PGK M) 2017 (PGK M)
Land Leased to Villages 4.9 5.6
General Compensation under Restated Eighteen Supplemental Agreements 30.13 14.7
CMCA 41.5 56.2
Mine Village Benefits 3.1 12.2
Other compensation 0.1 0.1
TOTAL 79.7 88.8
3 payment covered both 2015 and 2016.
DONATIONSOTML received 93 requests for donations or assistance from communities and the general public in 2017. Of these, 59 requests were approved by the donations committee and over PGK 100,000 in assistance was provided. The type of assistance comprised; medivacs (15), medical referrals either to Port Moresby or Tabubil Hospital (9), OTML assistance to various recipients (21) and assistance with helicopter hire or travel on OTML charter flights (14).
CMCA PAYMENTSThe CMCA provides specific funding on an annual basis to affected villages in the eight Trust Regions and the six mine villages. The funding includes reparation for the mining induced impacts on the receiving environment. Certain agreements require that OTML seek consent prior to making material changes to its operations and hence make investment and development payments to the eight Trust Regions and six mine villages. To mobilise the Trusts, Village Planning Committees (VPCs) are empowered to identify and prioritise sustainable development projects. The Board of each Trust meets every quarter to approve new projects submitted by the VPCs and reviews progress of the projects under construction.
In 2016 and 2017, the following funds were distributed to the various groups and trusts, with an increase due for release of non-CMCA4 development funds, the Women’s and Children fund and an Investment Fund released in 2017, following completion of legal actions.
4 2017 CMCA payments to South Fly communities includes the K12.3 Investment Fund that was on hold until a court case was settled in 2017.
ABOVE: OTML Community Relations data analyst, Daniel Tau conducting census updates at Migalsim Village, North Fly District.

74 OK TEDI MINING LIMITED
GROUPS AND TRUSTS 2016 (PGK M) 2017 (PGK M)
Mine Landowners 3.1 12.1
Development Fund 2.5 6.6
Women & Children Fund 3.5 10.9
Investment Fund 1.7 5.1
Special Compensation 33.8 33.7
Logi, Kawok, Komokpin Villages 1.8 -
Total 46.4 68.4
TAX CREDIT SCHEME The TCS was established by the PNG National Government in 1996 to deliver infrastructure and development projects to the Provinces in which resource companies operate. This funding stream is the National Government’s direct funding for projects from the taxes collected in the Province where they were generated. The TCS guidelines issued by the Internal Revenue Commission and the Department of National Planning and Monitoring define the types of projects that qualify for TCS funding. The funding is based on the lesser of the income tax payable for the year or 0.75% of assessable income.
OTML’s TCS was established in 1997 and has provided significant project funding to the Western Province and Sandaun Province. In 2017, the OTML TCS contribution was PGK 5.5 million. The projects delivered under the TCS are shown below.
YEAR 2017 CONTRIBUTION (PGK M)
HEALTH
Tabubil Hospital Staff Housing projects 0.1
EDUCATION
Montfort Primary School Infrastructure 0.7
Oksapmin High School Development project 2.4
Telefomin High School project 0.1
ROADS, BRIDGES, AIRPORTS AND BUILDINGS
Balimo Hospital Staff Housing project 0.4
Fly River Jetty Projects – 5 locations 0.1
Lower Ok Tedi bridge 0.1
UTILITIES
Kiunga Town Water and Sewerage Supply project 1.6
TOTAL 5.5
SOCIAL RESPONSIBILITY CONTINUED
OTML provides significant funds towards socio-economic development, both directly through services provided, infrastructure, and indirectly through the facilitation of community access to services and infrastructure.

ANNUAL REVIEW 2017 75
LOCAL BUSINESS SUPPLY CHAINOTML is the largest business in Western Province and relies on PNG and International supply chains for goods and services. The PNG supply chain includes large multinational companies that have offices in PNG and medium to small enterprises. The company policy is to source locally manufactured or supplied goods and services where they are competitively priced and meet the required quality. Many of the suppliers are headquartered in Western Province.
The OTML Supply and Logistics department engages over 200 suppliers and 150 service providers. Local businesses that are proven suppliers usually have well developed management and governance frameworks which qualify them to be awarded larger and more complex contracts with OTML.
In 2017, there were 230 contracts raised with various suppliers of which 78 contracts or service orders were awarded to PNG or PNG/Joint Venture companies. The total value of services contracts sourced from PNG suppliers was PGK 929 million or 73% of all contracts.
The breakdown of goods purchased by source is shown in the table below and of this, PGK 47.4 million was generated from within the Western Province.
BREAKDOWN OF PURCHASES OF GOODS BY LOCATION
2016 2017
ORIGIN PGK (M) USD (M) PGK (M) USD (M)
Western Province 51.5 16.3 47.4 14.7
National Papua New Guinea 233.9 73.9 247.8 76.8
Overseas 260.6 82.3 313.7 97.2
TOTAL 546.0 172.5 608.9 188.7
BREAKDOWN OF PURCHASES OF GOODS IN WESTERN PROVINCE
2016 2017
LOCAL PURCHASES IN WESTERN PROVINCE PGK (M) USD (M) PGK (M) USD (M)
Kiunga 1.1 0.4 0.3 0.1
Tabubil 50.4 15.9 47.1 14.6
TOTAL 51.5 16.3 47.4 14.7

76 OK TEDI MINING LIMITED
FINANCE
ECONOMIC CONTRIBUTIONOTML’s economic performance for 2017 is summarised and presented below and includes the 2016 economic data for comparative purposes. The financial statements have been externally audited by PricewaterhouseCoopers PNG. During 2017, there was no direct financial assistance in the form of tax subsidies, royalty relief, grants or financial incentives received by the Company from the PNG Government.
BREAKDOWN OF CONTRIBUTIONS TO THE PNG ECONOMY2016
(%)2017(%)
National Government, TCS, Product levy 11 12
Dividend (National Government and Landowners) 10 26
PNG goods and services 28 20
OTML contractors 25 17
Employment 16 16
Royalty 3 3
Community compensation 7 6
SALES AND MARKETINGOTML produces a copper-gold-silver concentrate product which is sold to smelters or refineries in Asia and Europe. Formal trade and off-take agreements are in place with customers in Japan, Philippines, Germany, South Korea and India, with these arrangements representing at least 85% of expected annual production. The balance of product is sold as spot shipment as circumstances dictate.
OTML’s commitment to meeting customer requirements occurs across the value chain, with resource development, mining, processing and logistics teams working together to reliably deliver a marketable concentrate parcel. A final concentrate product is blended to meet specific customer specifications at OTML’s Kiunga facility, before being transported on purpose built vessels (suitable for navigating the Fly River) to a silo vessel capable of holding more than one month’s normal production. The silo vessel, the Kumul Arrow, is generally located in Port Moresby harbour. Product is then exported to customers by our commercial export shipping partners.
OTML’s commitment to meeting customer requirements occurs across the value chain, with resource development, mining, processing and logistics teams working together to reliably deliver a marketable concentrate parcel.

ANNUAL REVIEW 2017 77
SALES REVENUE BY COMMODITY
2016 (PGK M) 2017 (PGK M) 2016 (USD M) 2017 (USD M)
Copper 1,164 1,952 368 612
Gold 794 1,016 251 318
Silver 44 58 14 18
Finalisation/revaluation 53 153 17 48
Total sales revenue 2,055 3,179 649 996
EXPORTS 2016 2017
Concentrate (t) 307,074 425,359
Contained copper (t) 76,398 102,883
Contained gold (oz) 205,896 260,661
Contained silver (oz) 871,377 1,231,360
EXPORTS BY RECIPIENT COUNTRIES 2016 (%) 2017 (%)
Japan 62.0 47.2
South Korea 12.8 9.4
Philippines 18.4 13.0
Germany 0.0 4.7
India 3.5 9.4
Spot Sales 3.3 16.3
METAL PRICESA comparison of the average 2016 to 2017 metal prices realised by OTML is shown below. The 2017 copper price was 18% higher than in 2016 and gold price was comparable.
YEARCOPPER (USD/lb)
GOLD(USD/oz)
2016 2.36 1,278
2017 2.79 1,260
FINANCIAL PERFORMANCE SUMMARYOTML strengthened its financial position by generating PGK 784 million of cash (net of investing activities). This enabled a cash balance of PGK 581 million (USD 180 million) to be held as at 31 December 2017.
In 2017, the Company generated a profit (after tax) in 2017 of PGK 848 million (USD 266 million). This compares favourably to the net profit of PGK 384 million (USD 121 million) recorded in 2016.

78 OK TEDI MINING LIMITED
COMPANY INCOME STATEMENT AND BALANCE SHEET
RESULTS: INCOME STATEMENT2016
(PGK M)2017
(PGK M)2016
(USD M)2017
(USD M)
Sales revenue 2,055 3,179 649 996
Other operating income -1 74 0 23
Marketing costs -247 -358 -78 -112
Cash operating costs -1,127 -1,488 -356 -466
Change in product inventories 60 41 19 13
Depreciation and amortisation -201 -243 -64 -76
Profit from operations 539 1,205 170 378
Net finance costs -12 -1 -4 -
Profit from ordinary activities before tax 527 1,204 166 378
Income tax expense -143 -356 -45 -112
Net profit for the year 384 848 121 266
RESULTS: BALANCE SHEET2016
(PGK M)2017
(PGK M)2016
(USD M)2017
(USD M)
ASSETS
Cash and cash equivalents 179 581 56 180
Trade and other receivables 327 280 103 86
Inventories 372 558 117 173
Total current assets 878 1,419 276 439
Financial assurance fund 734 758 231 235
Property, plant and equipment 2,337 2,468 736 764
Restoration and rehabilitation 45 0 14 0
Deferred Income Tax Asset 18 0 6 0
Other 37 18 12 6
Total non-current assets 3,171 3,244 999 1,005
LIABILITIES
Trade and other payables 325 224 102 69
Borrowings 0 0 0 0
Provisions 66 125 21 39
Total current liabilities 391 349 123 108
Restoration and rehabilitation 733 651 231 202
Provisions 0 211 0 66
Total non-current liabilities 733 862 231 268
Net assets 2,925 3,452 921 1,068
Share capital 195 195 234 234
Reserves 0 0 -583 -601
Retained earning 2,730 3,257 1,270 1,435
Total equity 2,925 3,452 921 1,068
FINANCE CONTINUED

ANNUAL REVIEW 2017 79
DISCUSSION OF INCOME STATEMENT
REVENUETotal operating revenue in 2017 was PGK 3,253 million, 58% above that for 2016. This reflects the 18% increase in copper price to USD 2.79/lb combined with the 35% and 26% increase in copper and gold metal sold respectively.
With sales revenues denominated in USD, the marginal strengthening of the USD relative to the PGK (averaged 0.3133 in 2017 compared to 0.3158 in 2016) had a small favourable impact on PGK revenues.
YEAR PGK (M)
2017 3,179
2016 2,055
EXPORT SALES 2016 2017
Concentrate (dmt) 307,074 425,359
Contained copper (t) 76,398 102,883
Contained gold (oz) 205,896 260,661
Contained silver (oz) 871,377 1,231,360
Marketing costs, which include treatment charges, refining cost, freight and royalties represented 11% of revenue in 2017, which was slightly lower than 2016 (12%).
OPERATING COSTSThe gross operating cost in 2017 was PGK 1,488 million (USD 466 million), representing an average of PGK 124 million (USD 39 million) per month of operation. This was 6% higher than 2016 in PGK terms and primarily due to an increase in production activity. Total material mined (ore and waste) in 2017 was 7.1 Mt per month which was 18% higher than 2016 (5.8 Mt/month). Ore processed in 2017 was 1.7 Mt/month, which was 6% higher than 2016 (1.6 Mt per month). In USD terms (the currency in which revenues are denominated) the gross operating cost in 2017 was 5% higher than 2016.
COST BASE – AVERAGE GROSS OPERATING COST
YEARPGK/MONTH
(M)USD/MONTH
(M)
2016 (10 months operation) 117 37
2017 124 39
OPERATING MARGINS
The Company was able to sustain its position as a globally competitive copper producer with C1 cost of $0.93/lb being within the lowest quartile of global copper producers.
In 2017 there was increased copper production (+31%), gold production (+24%), and copper price (+18%) to be translated to higher operating margins. As a result, the operating margin, calculated as the earnings before interest and tax of PGK 1.2 billion, as a percentage of gross sales revenue (PGK 3.2 billion), was 37% in 2017, up from 26% in 2016.
ABOVE: Loading copper concentrate from feeder vessel to storage silo in Port Moresby Harbour.

80 OK TEDI MINING LIMITED
PROFITABILITYAs a result of revenue growth and sustained containment of production unit costs, the Company was able to generate a pre-tax profit of PGK 1.2 billion, which translated into an after-tax profit of PGK 848 million. This was an increase of 121% compared to 2016 (PGK 384 million).
PROFITABILITY (COMPANY)
PGK (MILLIONS) 2016 2017
Profit Before Tax 527 1,204
Tax Expense -143 -356
Profit After Tax 384 848
DISCUSSION OF BALANCE SHEET
CASH AND BORROWINGSCash on hand at the end of 2017 was PGK 581 million (USD 180 million), with no borrowings. This was an increase of PGK 401 million over 2016, where the closing cash balance was PGK 179 million. This increase in net cash was after the payment of PGK 380 million in dividends in 2017 (USD 119 million).
RECEIVABLESTrade and other receivables were PGK 280 million (USD 86 million) as at 31 December 2017. This was 14% lower than in 2016 PGK 327 million (USD 103 million) and reflects lower concentrate production and export shipping in the final quarter of 2017, relative to the final quarter in 2016.
INVENTORYInventories on hand as at 31 December 2017 were PGK 558 million (USD 173 million), 50% higher than in 2016 PGK 372 million (USD 117 million), reflecting both an increase in concentrate inventories (25,480 dmt held at the end of 2017, compared to 13,800 dmt held at the end of 2016) and the restoration of warehouse stores and spares in 2017 that were run down during the dry weather event.
NON-CURRENT ASSETSThe Financial Assurance Fund is retained to fund estimated mine closure obligations. The value of the fund increased from PGK 734 million at the end of 2016 to PGK 758 million as at 31 December 2017, primarily due to the strengthening of the USD against the PGK.
Capital expenditure in 2017 was PGK 339 million. This included PGK 174 million of primarily sustaining capital and a further PGK 165 million of mine development expenditure necessary for accelerated removal of mine waste necessary to secure future ore sources. This was PGK 66 million higher than 2016, primarily due to the longer operating period (twelve months operation in 2017 compared to ten months in 2016). During 2017, the first of four purpose-built feeder vessels was sold to a specialist maritime services provider. The balance of vessels will be progressively transferred during 2018.
TRADE AND OTHER PAYABLESTrade and other payables at the end of 2017 were PGK 224 million. This was lower than 2016 PGK 325 million, mainly due to the payment PGK 59 million of prior year dividends in 2017.
NON-CURRENT LIABILITIESThe PGK 129 million increase in non-current liabilities to PGK 862 million at 31 December 2017 includes; a PGK 63 million for the lease liability and deferred profit on the sale and lease back of the Fly Alliance feeder vessel in 2017, an increase in deferred tax of PGK 147 million mainly due to timing differences associated with inventory build and capital purchases, offset by the PGK 82 million reduction in the provision for Restoration and Rehabilitation (mine closure cost obligation) following an approved update of the mine closure estimate in accordance with the requirements of the Mine Closure Code.
EQUITYShareholder equity benefited from a net profit after tax of PGK 848 million during 2017. Dividend distributions from profits of PGK 321 million (USD 100 million) were declared in 2017. As a result, total equity increased by PGK 527 million in 2017 to PGK 3.5 billion.
FINANCE CONTINUED

ANNUAL REVIEW 2017 81
Annual Report of the Directors to the Shareholders 82
Independent Auditor’s Report to the Shareholders 83
FINANCIAL STATEMENTS:
Statements of Comprehensive Income 86
Statements of Changes in Equity 87
Statements of Financial Position 88
Statements of Cash flows 89
Notes to and forming part of the Financial Statements 90
OK TEDI MINING LIMITED
FINANCIAL STATEMENTS FOR THE YEAR ENDED 31 DECEMBER 2017PRESENTED IN PNG KINA
In 2017, the Company generated a profit (after tax) of PGK 848 million (USD 266 million). This compares favourably to the net profit of PGK 384 million (USD 121 million) recorded in 2016.
CONTENTS

82 OK TEDI MINING LIMITED
OK TEDI MINING LIMITED
The Directors are pleased to present their report on the affairs of the Company and the Group, including the financial statements, for the year ended 31 December 2017.
ACTIVITIESThe Group’s principal activity is mining and processing copper ore. Shipments for the year totalled 425,359 (2016: 307,074) dry metric tonnes of copper concentrate.
FINANCIAL RESULTSThe Group made a profit after tax of K848,724,000 for the year (2016 profit of K385,157,000).
DIRECTORSThe Directors as at balance date were:
Sir M. Avei (Chairman)Mr P. Graham (Managing Director/CEO)Dr J. Weiss (ceased 7 November 2017) Mr D. Vele (ceased 12 July 2017)Dr R. HigginsMr G Kuri
The Company Secretary as at balance date was:
Mr C. Clark
DIVIDENDSK320,514,000 dividends were declared during the year (2016: K150,000,000).
AUDITORSDetails of amounts paid to the auditors PricewaterhouseCoopers for audit and other services are shown in note 5 to the financial statements.
DONATIONSThe total amount of donations made by the Company is stated in note 5 to the financial statements.
ACCOUNTING POLICIESAny changes in accounting policies are stated in note 1 to the financial statements.
INTEREST REGISTERNo entries were made in the interest register in 2017.
Signed for, and on behalf of, the Board on 1 March 2018.
SIR MOI AVEI, KBE PETER GRAHAM, CBEChairman Managing Director and Chief Executive Officer
ANNUAL REPORT OF THE DIRECTORS TO THE SHAREHOLDERS FOR THE YEAR ENDED 31 DECEMBER 2017

ANNUAL REVIEW 2017 83
INDEPENDENT AUDITOR’S REPORT TO THE SHAREHOLDERS OF OK TEDI MINING LIMITED
REPORT ON THE AUDIT OF THE FINANCIAL STATEMENTS OF THE COMPANY AND THE GROUP
OUR OPINIONWe have audited the financial statements of Ok Tedi Mining Limited (the Company), which comprise the statements of financial position as at 31 December 2017, and the statements of comprehensive income, statements of changes in equity and statements of cash flows for the year then ended, and the notes to the financial statements which include a summary of significant accounting policies and other explanatory information for both the Company and the Group. The Group comprises the Company and the entities it controlled at 31 December 2017 or from time to time during the financial year.
In our opinion, the accompanying financial statements:
• comply with International Financial Reporting Standards and other generally accepted accounting practice in Papua New Guinea; and
• give a true and fair view of the financial position of the Company and the Group as at 31 December 2017, and their financial performance and cash flows for the year then ended.
BASIS FOR OPINIONWe conducted our audit in accordance with International Standards on Auditing (ISAs). Our responsibilities under those standards are further described in the Auditor’s responsibilities for the audit of the financial statements section of our report.
We believe that the audit evidence we have obtained is sufficient and appropriate to provide a basis for our opinion.
INDEPENDENCE
We are independent of the Group in accordance with the International Ethics Standards Board for Accountants’ Code of Ethics for Professional Accountants (IESBA Code), and we have fulfilled our other ethical responsibilities in accordance with these requirements.
Our firm carries out other services for the Group in the area of taxation services. The provision of these other services has not impaired our independence as auditor of the Company and the Group.
INFORMATION OTHER THAN THE FINANCIAL STATEMENTS AND AUDITOR’S REPORTThe directors are responsible for the annual report which includes other information. Our opinion on the financial statements does not cover the other information included in the annual report and we do not and will not express any form of assurance conclusion on the other information.
In connection with our audit of the financial statements, our responsibility is to read the other information and, in doing so, consider whether the other information is materially inconsistent with the financial statements or our knowledge obtained in the audit, or otherwise appears to be materially misstated. If, based on the work we have performed on the other information that we obtained prior to the date of this auditor’s report, we conclude that there is a material misstatement of this other information, we are required to report that fact. We have nothing to report in this regard.
PricewaterhouseCoopers
PwC Haus, Level 6, Harbour City, Konedobu. PO Box 484, PORT MORESBY, PAPUA NEW GUINEA T: (675) 321 1500 / (675) 305 3100, F: (675) 321 1428, www.pwc.com.pg

84 OK TEDI MINING LIMITED
RESPONSIBILITIES OF THE DIRECTORS FOR THE FINANCIAL STATEMENTSThe directors are responsible, on behalf of the Company, for the preparation of financial statements that give a true and fair view in accordance with International Financial Reporting Standards and other generally accepted accounting practice in Papua New Guinea and the Companies Act 1997, and for such internal control as the directors determine is necessary to enable the preparation of financial statements that are free from material misstatement, whether due to fraud or error.
In preparing the financial statements, the directors are responsible for assessing the Group’s ability to continue as a going concern, disclosing, as applicable, matters related to going concern and using the going concern basis of accounting unless the directors either intend to liquidate the Group, or to cease operations, or have no realistic alternative but to do so.
AUDITOR’S RESPONSIBILITIES FOR THE AUDIT OF THE FINANCIAL STATEMENTSOur objectives are to obtain reasonable assurance about whether the financial statements, as a whole, are free from material misstatement, whether due to fraud or error, and to issue an auditor’s report that includes our opinion. Reasonable assurance is a high level of assurance, but is not a guarantee that an audit conducted in accordance with ISAs will always detect a material misstatement when it exists. Misstatements can arise from fraud or error and are considered material if, individually or in the aggregate, they could reasonably be expected to influence the economic decisions of users taken on the basis of these financial statements.
As part of an audit in accordance with the ISAs, we exercise professional judgement and maintain professional scepticism throughout the audit. We also:
• Identify and assess the risks of material misstatement of the financial statements, whether due to fraud or error, design and perform audit procedures responsive to those risks, and obtain audit evidence that is sufficient and appropriate to provide a basis for our opinion. The risk of not detecting a material misstatement resulting from fraud is higher than for one resulting from error, as fraud may involve collusion, forgery, intentional omissions, misrepresentations, or the override of internal control.
• Obtain an understanding of internal control relevant to the audit in order to design audit procedures that are appropriate in the circumstances, but not for the purpose of expressing an opinion on the effectiveness of the Group’s internal control.
• Evaluate the appropriateness of accounting policies used and the reasonableness of accounting estimates and related disclosures made by the directors.
• Conclude on the appropriateness of the directors’ use of the going concern basis of accounting and, based on the audit evidence obtained, whether a material uncertainty exists related to events or conditions that may cast significant doubt on the Group’s ability to continue as a going concern. If we conclude that a material uncertainty exists, we are required to draw attention in our auditor’s report to the related disclosures in the financial statements or, if such disclosures are inadequate, to modify our opinion. Our conclusions are based on the audit evidence obtained up to the date of our auditor’s report. However, future events or conditions may cause the Group to cease to continue as a going concern.
• Evaluate the overall presentation, structure and content of the financial statements, including the disclosures, and whether the financial statements represent the underlying transactions and events in a manner that achieves fair presentation.
• Obtain sufficient appropriate audit evidence regarding the financial information of the entities or business activities within the Group to express an opinion on the consolidated financial statements of the Group. We are responsible for the direction, supervision and performance of the group audit. We remain solely responsible for our audit opinion.
We communicate with those charged with governance regarding, among other matters, the planned scope and timing of the audit and significant findings, including any significant deficiencies in internal control that we identify during our audit.
INDEPENDENT AUDITOR’S REPORT TO THE SHAREHOLDERS OF OK TEDI MINING LIMITED CONTINUED

ANNUAL REVIEW 2017 85
INDEPENDENT AUDITOR’S REPORT TO THE SHAREHOLDERS OF OK TEDI MINING LIMITED CONTINUED
REPORT ON OTHER LEGAL AND REGULATORY REQUIREMENTSThe Companies Act 1997 requires that in carrying out our audit we consider and report on the following matters. We confirm in relation to our audit of the financial statements for the year ended 31 December 2017:
• We have obtained all the information and explanations that we have required;
• In our opinion, proper accounting records have been kept by the Company as far as appears from an examination of those records.
WHO WE REPORT TOThis report is made solely to the Company’s shareholders, as a body, in accordance with the Companies Act 1997. Our audit work has been undertaken so that we might state to the Company’s shareholders those matters which we are required to state to them in an auditor’s report and for no other purpose. We do not accept or assume responsibility to anyone other than the Company and the Company’s shareholders, as a body, for our audit work, for this report or for the opinions we have formed.
PRICEWATERHOUSECOOPERS
CHRISTOPHER HANSOR
Partner Registered under the Accountants Act 1996
Port Moresby 2 March 2018

86 OK TEDI MINING LIMITED
OK TEDI MINING LIMITED
STATEMENTS OF COMPREHENSIVE INCOMEFOR THE YEAR ENDED 31 DECEMBER 2017
CONSOLIDATED COMPANY
NOTE2017
K’0002016
K’0002017
K’0002016
K’000
CONTINUING OPERATIONSOPERATING REVENUE:
Sales revenue 4(a) 3,179,111 2,055,062 3,179,111 2,055,062
Other operating income/(expense), net 4(b) 114,826 31,504 73,941 (615)
Total operating revenue 3,293,937 2,086,566 3,253,052 2,054,447
Mining costs (366,809) (261,396) (366,809) (261,396)
Processing costs (422,834) (308,207) (422,834) (308,207)
Increase in inventories of product on hand and in process 40,949 60,337 40,949 60,337
General and administrative costs 5 (708,627) (577,983) (669,816) (547,499)
Depreciation and amortisation (243,554) (202,028) (243,131) (201,465)
Exploration costs (28,047) (10,216) (28,047) (10,216)
Marketing costs (358,124) (246,947) (358,124) (246,947)
Total operating costs (2,087,046) (1,546,440) (2,047,812) (1,515,393)
Profit from operating activities 1,206,891 540,126 1,205,240 539,054
Finance income 6(a) 16,926 16,109 16,918 16,096
Finance cost 6(b) (17,856) (28,156) (17,856) (28,156)
Profit before income tax 1,205,961 528,079 1,204,302 526,994
Income tax expense 7 (357,237) (142,922) (356,740) (142,625)
Net profit for the year 848,724 385,157 847,562 384,369
Total other comprehensive income for the year - - - -
Total comprehensive income for the year 848,724 385,157 847,562 384,369
This statement is to be read in conjunction with the accompanying notes.

ANNUAL REVIEW 2017 87
STATEMENTS OF CHANGES IN EQUITYFOR THE YEAR ENDED 31 DECEMBER 2017
CONSOLIDATED COMPANY
ORDINARY SHARES
K’000
RETAINED EARNINGS
K’000TOTALK’000
RETAINED EARNINGS
K’000TOTALK’000
Balance at 1 January 2016 195,102 2,495,853 2,690,955 2,495,097 2,690,199
COMPREHENSIVE INCOME
Net profit for the year - 385,157 385,157 384,369 384,369
Other comprehensive income - - - - -
Dividends declared (note 24) - (150,000) (150,000) (150,000) (150,000)
Balance at 31 December 2016 195,102 2,731,010 2,926,112 2,729,466 2,924,568
COMPREHENSIVE INCOME
Net profit for the year - 848,724 848,724 847,562 847,562
Other comprehensive income - - - - -
Dividends declared (note 24) - (320,515) (320,515) (320,515) (320,515)
Balance at 31 December 2017 195,102 3,259,219 3,454,321 3,256,513 3,451,615
This statement is to be read in conjunction with the accompanying notes.

88 OK TEDI MINING LIMITED
OK TEDI MINING LIMITED
STATEMENTS OF FINANCIAL POSITIONAS AT 31 DECEMBER 2017
CONSOLIDATED COMPANY
NOTE2017
K’0002016
K’0002017
K’0002016
K’000
NON-CURRENT ASSETS:Property, plant and equipment 8 1,145,741 1,130,628 1,144,390 1,129,261
Mine development costs 9 1,271,504 1,150,745 1,271,504 1,150,745
Intangible assets 10 50,940 56,827 50,940 56,827
Restoration and rehabilitation asset 11 - 45,126 - 45,126
Deferred income tax asset 106 17,873 - 17,687
Investment in subsidiaries 28(b) - - 21 20
Financial assurance fund 29 757,808 734,070 757,808 734,070
Other receivables 12 18,127 37,238 18,126 37,238
Total non-current assets 3,244,225 3,172,507 3,242,789 3,170,974
CURRENT ASSETS:Cash and cash equivalents 13 612,522 214,443 580,781 179,472
Trade and other receivables 14 282,884 333,345 279,950 326,647
Inventories 15 558,647 371,623 558,647 371,623
Total current assets 1,454,053 919,411 1,419,378 877,742
TOTAL ASSETS 4,698,278 4,091,918 4,662,167 4,048,716
CURRENT LIABILITIES:Trade and other payables 16 255,679 356,636 224,094 324,701
Provisions and other liabilities 20 72,056 75,517 70,823 65,863
Income tax payable 18 54,297 - 53,920 -
Total current liabilities 382,032 432,153 348,837 390,564
NON-CURRENT LIABILITIES:Provision for restoration and rehabilitation 22 651,118 733,584 651,118 733,584
Provisions and other liabilities 21 63,461 69 63,251 -
Deferred income tax liability, net 19 147,346 - 147,346 -
Total non-current liabilities 861,925 733,653 861,715 733,584
TOTAL LIABILITIES 1,243,957 1,165,806 1,210,552 1,124,148
NET ASSETS 3,454,321 2,926,112 3,451,615 2,924,568
SHAREHOLDERS’ EQUITY:Ordinary shares 23 195,102 195,102 195,102 195,102
Retained earnings 3,259,219 2,731,010 3,256,513 2,729,466
TOTAL SHAREHOLDERS’ EQUITY 3,454,321 2,926,112 3,451,615 2,924,568
These financial statements were authorised for issue by the Board on 1 March 2018.
For, and on behalf of, the Board.
SIR MOI AVEI, KBE PETER GRAHAM, CBEChairman Managing Director and Chief Executive Officer
This statement is to be read in conjunction with the accompanying notes.

ANNUAL REVIEW 2017 89
STATEMENTS OF CASH FLOWSFOR THE YEAR ENDED 31 DECEMBER 2017
CONSOLIDATED COMPANY
2017K’000
2016K’000
2017K’000
2016K’000
CASH FLOWS FROM OPERATING ACTIVITIES:Receipts from customers 3,257,541 1,849,407 3,183,959 1,851,242
Payments to suppliers and others (2,146,348) (1,271,884) (2,070,104) (1,255,784)
Cash Generated From Operations 1,111,193 577,523 1,113,855 595,458
Interest received (note 6a) 11,547 5,679 11,537 5,666
Interest paid (note 6b) (204) (11,862) (204) (11,862)
Income tax (paid)/received (note 18) (54,285) 21,302 (53,915) 21,747
Net cash generated from Operating Activities 1,068,251 592,642 1,071,273 611,009
CASH FLOWS FROM INVESTING ACTIVITIES:Purchase of property, plant and equipment (note 8) (173,924) (122,422) (173,518) (122,047)
Mine development expenditures (note 9) (165,185) (140,689) (165,185) (140,689)
Purchase of intangible assets (note 10) (1,216) (10,959) (1,216) (10,959)
Proceeds from sale of property, plant and equipment 52,530 749 52,471 497
Net cash used in Investing Activities (287,795) (273,321) (287,448) (273,198)
CASH FLOWS FROM FINANCING ACTIVITIES:Repayment of overdraft facility - (195,000) - (195,000)
Dividends paid (note 16 (a)) (379,694) (100,500) (379,694) (100,500)
Finance lease payments (6,757) - (6,757) -
Net cash used in Financing Activities (386,451) (295,500) (386,451) (295,500)
Net increase in cash and cash equivalents 394,005 23,821 397,374 42,311
Cash and cash equivalents at beginning of the year 214,443 165,199 179,472 116,048
Foreign exchange effect on foreign currency balances 4,074 25,423 3,935 21,113
CASH AND CASH EQUIVALENTS AT END OF THE YEAR (note 13) 612,522 214,443 580,781 179,472
This statement is to be read in conjunction with the accompanying notes.
90 OK TEDI MINING LIMITED
OK TEDI MINING LIMITED
NOTES TO AND FORMING PART OF THE FINANCIAL STATEMENTSFOR THE YEAR ENDED 31 DECEMBER 2017
1. PRINCIPAL ACCOUNTING POLICIES
The principal accounting policies applied in the preparation of these consolidated financial statements are set out below. These policies have been consistently applied to all the years presented, unless otherwise stated.
(A) BASIS OF PREPARATION
These consolidated financial statements of Ok Tedi Mining Limited have been prepared in accordance with the Papua New Guinea Companies Act 1997 and comply with International Financial Reporting Standards (IFRS) and other generally accepted accounting practice in Papua New Guinea. All amounts are stated in Papua New Guinea Kina, the functional currency of the Company, rounded to the nearest thousand Kina.
The accounts have been prepared on the basis of historical costs and do not take into account changing money values or current valuations of non-current assets, other than for certain financial instruments which are measured at fair value. Cost is based on the fair values of the consideration given in exchange for the assets.
The preparation of the financial statements in conformity with IFRS requires the use of certain accounting estimates. It also requires management to exercise its judgement in the process of applying the Group’s accounting policies. The areas involving a higher degree of judgement or complexity, or areas where assumptions and estimates are significant to the consolidated financial statements are disclosed in note 3.
The Directors have the power to amend these financial statements after their issue.
Changes in Accounting Policies and Disclosures
I. Standards, amendment and interpretations effective in the year ended 31 December 2017
The Group has applied the following standards and amendments for the first time during for their reporting period beginning 1 January 2017.
- Amendments to IAS 12 – Recognition of Deferred Tax Assets for Unrealised Losses - Amendments to IAS 7 – Disclosure Initiative - Annual Improvements to IFRSs 2014-2016 Cycle
The adoption of these amendments did not have any impact on the amounts recognised in prior periods and will also not affect the current or future periods.
II. Standards, amendments and interpretations issued but not effective for the year ended 31 December 2017 or adopted early
The following standards, amendments and interpretations to existing standards have been published and are mandatory for the entity’s accounting periods beginning on or after 1 January 2018 or later periods, but the entity has not early adopted them:
• IFRS 9, ‘Financial Instruments’ (effective 1 January 2018) replaces the guidance in IAS 39 with a standard that is less complex and principles based. The new standard simplifies the model for classifying and recognising financial instruments and aligns hedge accounting more closely with common risk management practices. IFRS 9’s new impairment model is a move away from IAS 39’s incurred credit loss approach to an expected credit loss model.
• IFRS 15 ‘Revenue from contracts with customers’ (effective 1 January 2018) replaces IAS 11 and IAS 18. The new standard is based on the principle that revenue is recognised when control of a good or service transfers to a customer – so the notion of control replaces the existing notion of risks and rewards. The company will have to adopt a new 5-step process for the recognition of revenue:
• identify contracts with customers
• identify the separate performance obligations
• determine the transaction price of the contract
• allocate the transaction price to each of the separate performance obligations, and
• recognise the revenue as each performance obligation is satisfied.
Amendments to IFRS 15 (effective 1 January 2018). These amendments comprise clarifications of the guidance on identifying performance obligations, accounting for licences of intellectual property and the principal versus agent assessment (gross versus net revenue presentation).
The company has conducted investigations for the changes to IFRS 9 and IFRS 15 and does not consider that there are any measurement or recognition issues arising from the release of these new pronouncements that will have a significant impact on the reported financial position or financial performance of the Group.
• IFRS 16, ‘Leases’ (effective 1 January 2019) replaces the guidance in IAS 17 and will have a significant impact on accounting by lessees. The previous distinction under IAS 17 between finance leases and operating leases for lessees has been removed. IFRS 16 now requires a lessee to recognise a lease liability representing future lease payments and a ‘right-of-use asset’ for virtually all lease contracts. There is an optional exemption for certain short-term leases and leases of low-value assets. Under IFRS 16, a contract is, or contains, a lease if the contract conveys the right to control the use of an identified asset for a period of time in exchange for consideration.
The company is currently assessing the impact on the measurement and recognition of leases arising from the release of these new pronouncements.
(B) CONSOLIDATION
The subsidiary undertakings and special-purpose entities in which the Company has an interest of more than one half of the voting rights or otherwise has power to exercise control over the operation are consolidated. They are consolidated from the date on which control is transferred to the Company and are no longer consolidated from the date that control ceases. All inter-entity transactions, balances and unrealised gains and losses on transactions between group companies are eliminated. In the Company’s financial statements, investments in subsidiaries are stated at the lower of cost or recoverable amount.

ANNUAL REVIEW 2017 91
(C) REVENUE RECOGNITION
Revenue from the sale of copper concentrate, which also contains quantities of gold and silver, is brought to account at the time of shipment to the buyer; when the significant risks and rewards of ownership have been transferred to the buyer; the Group no longer has control over the goods; and the amount of revenue can be reliably estimated. The revenue is based on one hundred percent of provisional weights, assays and prices and is adjusted when actual values are determined and invoiced in accordance with the terms and conditions of the relevant sales contract. The final settlement adjustments on the copper portion of the sales contracts is generally based on the average London Metal Exchange (LME) price for a specified future period generally three to five months after arrival at the customers’ facility. The copper concentrate sales invoicing is done net of treatment and refining charges. However, for revenue disclosure purposes, the sales are grossed up and the treatment and refining charges from the smelters and refineries are included in marketing costs in the face of the statement of comprehensive income.
Unfinalised shipments at balance date are valued using metal prices, weights and assays known at that date. Where, in accordance with the terms of the sales contract, prices have not been finalised, sales values have been determined using three months forward price for copper and spot prices at year end for gold and silver.
The average forward prices used at 31 December 2017 were US$3.26 per pound for copper (31 December 2016: US$2.50), US$1,311 per ounce for gold (31 December 2016: US$1,153) and US$17 per ounce for silver (31 December 2016: US$16).
Interest income is recognised on a time-proportion basis using the effective interest method.
(D) PROPERTY, PLANT AND EQUIPMENT
All property, plant and equipment are stated at historical cost less depreciation. Historical cost includes expenditure that is directly attributable to the acquisition of the asset. Subsequent costs are included in the asset’s carrying amount, or recognised as a separate asset as appropriate, only when it is probable that future economic benefits associated with the item will flow to the Group and the cost of the item can be reliably measured.
Certain properties owned by the Group and rented externally to third parties would be classified as Investment property under IAS 40. These properties are classified under Property and accounted for under IAS 16 at depreciated costs as the carrying amount is considered immaterial for re-classification.
Property, plant and equipment are depreciated either on a units of production basis or a straight-line basis over their estimated economic lives or the expected life of the mine, whichever is shorter. A change in method from straight line to units of production is accounted for prospectively as a change in estimate. Capital spare parts are depreciated over the life of the equipment for which they are purchased.
The depreciation basis and range of estimated economic lives of the major asset categories are:
Mine production facilities Units of production
Buildings and improvements 5 years to life of mine
Automotive and other equipment 4 - 10 years to life of mine
Mobile mining equipment 4 years to life of mine
Support facilities 5 years to life of mine
Processing equipment Units of production
Gains and losses on disposal of property, plant and equipment are brought to account in the determination of operating profit. An asset’s carrying amount is written down immediately to its recoverable amount if the asset’s carrying amount is greater than its estimated recoverable amount.
Repairs and maintenance are charged to the profit and loss account during the financial period in which they are incurred.
(E) PRE-PRODUCTION EXPENDITURE AND EXPLORATION EXPENDITURE
Pre-production expenditure represents the net mine development cost incurred by the Company prior to the commencement of commercial production on 31 January 1985. Such expenditure is classified as a mine development asset and is amortised on a units of production basis over the mine life.
(F) DEFERRED STRIPPING COST
Deferred stripping costs represent the costs incurred in removing overburden and other mine waste materials during the operating phase where those stripping costs are incurred as part of a stripping campaign to access additional ore. This activity is referred to as development stripping. The directly attributable costs (inclusive of an allocation of relevant overhead expenditure) are initially capitalised as a mine development asset, based on the ratio obtained by dividing the amount of waste tonnes mined by the quantity of ore tonnes contained for the specific ore body accessed through the stripping campaign (“the stripping ratio”). Stripping costs incurred in the period are deferred to the extent that the actual current period stripping ratio exceeds the estimated average stripping ratio for the additional ore body accessed.
The stripping asset is then amortised over the life of the additional ore body accessed on a unit of production basis.
(G) RESTORATION AND REHABILITATION
A provision is raised for anticipated expenditure to be made on restoration and rehabilitation to be undertaken after the open pit mine closure based on the present value of the future cash flows.
These costs may include the costs of dismantling and demolishing of infrastructure or decommissioning, the removal of residual material, the remediation of disturbed areas and the relocation and retrenchment of employees under an agreed mine closure plan. Where future economic benefits are probable a corresponding asset is raised and subsequently amortised using the straight line method.
The Group’s restoration, rehabilitation and environmental expenditure policy identifies the environmental, social and engineering issues to be considered and the procedures to be followed when providing for costs associated with the site closure. Site rehabilitation and closure involves the dismantling and demolition of infrastructure not intended for subsequent community use, the removal of residual materials and the remediation of disturbed areas. Community requirements and long term land use objectives are also taken into account.
The increase in the provision due to passage of time is recognised as interest expense.
Changes in the provision related to changes in the discount rate or changes in the estimated amount and timing of future cash flows are adjusted against the carrying amount of the related asset.
(H) COMPENSATION
The Group has signed various compensation agreements with landowners and other surrounding communities affected by the mine. Compensation packages are denominated in the local currency and, in the majority of instances, are payable over the life of the open pit mine.
Where payments are contingent upon mine continuation, the anticipated amounts payable annually are accrued on a pro-rata basis. Where payments have to be made regardless of mine continuation, a full provision is created against future expected payments using the same principles as in note 1(g).

92 OK TEDI MINING LIMITED
NOTES TO AND FORMING PART OF THE FINANCIAL STATEMENTS CONTINUEDFOR THE YEAR ENDED 31 DECEMBER 2017
OK TEDI MINING LIMITED
1. PRINCIPAL ACCOUNTING POLICIES CONTINUED
(I) INVENTORIES
Copper concentrate and product in process are physically measured or estimated and valued at the lower of cost or net realisable value. Cost is derived on an absorption costing basis which includes fixed and variable overheads and depreciation. Net realisable value is the amount estimated to be obtained from the sale of inventories in the normal course of business, less any costs anticipated to be incurred prior to sale.
Spare parts and consumables are valued at weighted average cost into store. An appropriate provision for stock obsolescence is raised in respect of slow moving inventory.
(J) FOREIGN CURRENCY TRANSLATION
Items included in the financial statements of each of the Group’s entities are measured using the currency of the primary economic environment in which the entity operates (the functional currency). The consolidated financial statements are presented in Kina, which is the Company’s functional and presentation currency.
Transactions denominated in foreign currency are translated at a rate of exchange which approximates the rate of exchange at the date of the transaction. Amounts owing to and by the Company denominated in foreign currencies at balance date are translated at exchange rates current at that date.
Realised and unrealised foreign exchange variations on revenue accounts are recognised in the income statement.
(K) INCOME TAX
The Group provides for all taxes estimated to be payable on net profit for the year. It prepares and lodges its tax return using PNG Kina as the functional and presentation currency.
Deferred income tax is provided in full, using the liability method, on temporary differences arising between the tax bases of assets and liabilities and their carrying amounts in the consolidated financial statements. Deferred income tax is determined using tax rates (and laws) that have been enacted or substantially enacted by the balance sheet date, and are expected to apply when the related deferred income tax asset is realised or the deferred income tax liability settled.
Deferred income tax assets are recognised to the extent that it is probable that future taxable income will be available against which the temporary differences can be utilised.
Deferred income tax liabilities are provided on taxable temporary differences except where the timing of the reversal of the temporary difference is controlled by the Group and it is probable that the temporary difference will not reverse in the near future.
Income tax expense in the income statement comprises the estimated tax payable and the movement in deferred tax balances. Current and deferred tax balances attributable to amounts recognised directly in equity are also recognised directly in equity.
(L) EMPLOYEE BENEFITS
(i) Wages and Salaries, Annual Leave and Sick Leave
Liabilities for wages and salaries, annual leave and sick leave are recognised and measured as the amount unpaid at the reporting date at current pay rates in respect of employees’ services up to that date, including on-costs.
(ii) Long Service Leave
Liability for long service leave is recognised and measured as the present value of expected future payments to be made in respect of services provided by employees up to the reporting date. Consideration is given to expected future wage and salary levels, experience of employee departures and periods of service.
(iii) Termination Benefits
Termination benefits are payable when employment is terminated before the normal retirement date or when an employee accepts voluntary redundancy in exchange for those benefits. The Group recognises termination benefits when it is demonstrably committed to either terminate the employment of current employees according to a detailed formal plan without possibility of withdrawal, or providing termination benefits as a result of an offer made to encourage voluntary redundancy. Benefits falling due after more than twelve months from the balance sheet date are discounted to present value.
(iv) Retirement Benefits
The Group contributes to NASFUND, an independent defined contribution fund, on behalf of its citizen employees and contributions are charged direct to the income statement when payable. Once the contributions have been paid, the Group has no further payment obligations.
(M) CASH AND CASH EQUIVALENTS
For the purpose of the statements of cash flows, cash and cash equivalents include cash at bank and on hand, net of overdraft, and deposits held at call with banks, with maturity of three months or less.
(N) FINANCIAL INSTRUMENTS
a) Financial assets
(i) Classification
The Group classifies its financial assets in the following categories: (a) loans and receivables; (b) available-for-sale securities; (c) held-to-maturity securities; and (d) at fair value through profit or loss. The classification depends on the purpose for which the financial assets were acquired. Management determines the classification of its financial assets at initial recognition.
The Group does not hold any financial assets under category (c) at the end of each reporting period.
Where possible, financial assets are supported by collateral or other security. These arrangements are described in the individual accounting policies associated with each item.
Loans and receivables are non-derivative financial assets with fixed or determinable payments: (i) that are not quoted in an active market, (ii) with no intention of being traded, and (iii) that are not designated as available-for -sale. They are included in current assets, except for those with maturities greater than twelve (12) months after the reporting period, which are then classified as non-current assets.
The Group’s loans and receivables consist of cash and cash equivalents and trade and other receivables.
The Company’s investment in the Financial Assurance Fund is classified as fair value through profit or loss.

ANNUAL REVIEW 2017 93
b) Financial liabilities
(i) Classification
The Group classifies its financial liabilities in the following categories: (a) financial liabilities at amortised cost; and (b) financial liabilities at fair value through profit or loss. Financial liabilities at fair value through profit or loss comprises of two sub-categories: financial liabilities classified as held for trading and financial liabilities designated by the Group as at fair value through profit or loss upon initial recognition. The classification depends on the purpose for which the financial liabilities were acquired or incurred. Management determines the classification of its financial liabilities at initial recognition.
The Group does not hold any financial liabilities at fair value through profit or loss during and at the end of each reporting period.
Financial liabilities at amortised cost are contractual obligations which are either to deliver cash or another financial asset to another entity or to exchange financial assets or financial liabilities with another entity under conditions that are potentially unfavourable to the Group. They are included in current liabilities, except for those with maturities greater than twelve (12) months after the reporting period, which are then classified as non-current liabilities.
The Group’s financial liabilities at amortised cost only consist of trade, other payables and borrowings.
(ii) Recognition and measurement
Financial liabilities at amortised cost are recognised when the Group becomes a party to the contractual provision of the instrument. Financial liabilities at amortised cost are initially measured at fair value plus transaction costs and subsequently measured at amortised cost using the effective interest method.
(ii) Recognition and measurement
Initial measurement
Regular-way purchases and sales of financial assets are recognised on trade date (the date on which the Group commits to purchase or sell the asset). Loans and receivables are initially recognised at fair value plus transaction costs.
Subsequent measurement
Loans and receivables are carried at amortised cost using the effective interest method.
The Financial Assurance Fund investments are measured at fair value.
(iii) Derecognition
Financial assets are derecognised when the contractual rights to receive cash flows have expired or the Group has transferred substantially all risks and rewards of ownership of the financial assets.
(iv) Impairment of financial assets
The Group assesses at the end of each reporting period whether there is objective evidence that a financial asset or a group of financial assets is impaired. A financial asset or a group of financial assets is impaired and impairment losses are incurred only if there is objective evidence of impairment as a result of one or more events that occurred after the initial recognition of the asset (a ‘loss event’) and that loss event (or events) has an impact on the estimated future cash flows of the financial asset or group of financial assets that can be reliably estimated.
The Group first assesses whether there is objective evidence of impairment that exists individually for receivables which are individually significant, and collectively for receivables which are not individually significant. If the Group determines that no objective evidence of impairment exists for an individually assessed receivable, whether significant or not, it includes the asset in a group of financial assets with similar credit risk characteristics and collectively assesses them for impairment. Loans and receivables that are individually assessed for impairment and for which an impairment loss is or continues to be recognised are not included in a collective assessment of impairment.
The criteria that the Group uses to determine that there is objective evidence of an impairment loss include:
• Significant financial difficulty of the issuer or obligor;
• A breach of contract, such as a default or delinquency in interest or principal payments;
• The Group, for economic or legal reasons relating to the borrower’s financial difficulty, granting to the borrower a concession that the lender would not otherwise consider;
• It becomes probable that the borrower will enter bankruptcy or other financial reorganisation;
• The disappearance of an active market for that financial asset because of financial difficulties; or
• Observable data indicating that there is a measurable decrease in the estimated future cash flows from a portfolio of financial assets since the initial recognition of those assets, although the decrease cannot yet be identified with the individual financial assets in the portfolio, including:
i) Adverse changes in the payments status of borrowers in the portfolio; and
ii) National or local economic conditions that correlate with defaults on the assets in the portfolio.
The amount of impairment loss is measured as the difference between the asset’s carrying amount and the present value of estimated future cash flows (excluding future credit losses that have not been incurred) discounted at the original effective interest rate of receivables. The carrying amount of receivables is reduced through the use of an allowance account and the amount of loss is charged to profit or loss.
When receivables are determined to be uncollectible, they are written off against the related provision for impairment. Such receivables are written off after all the necessary procedures have been completed and the amount of the loss has been determined.
If, in a subsequent period, the amount of impairment loss decreases and the decrease can be related objectively to an event occurring after the impairment was recognised (such as an improvement in the debtor’s credit rating), the reversal of previously recognised impairment loss is recognised in Provision for impairment in the statement of income under expenses. Reversals of previously recorded impairment provision are based on the result of management’s updated assessment, considering the available facts and changes in circumstances, including but not limited to results of recent discussions and arrangements entered into with a client or other third party as to the recoverability of receivables at the end of the reporting period. Subsequent recoveries of amounts previously written-off are credited to Other income in the statement of comprehensive income.

94 OK TEDI MINING LIMITED
NOTES TO AND FORMING PART OF THE FINANCIAL STATEMENTS CONTINUEDFOR THE YEAR ENDED 31 DECEMBER 2017
OK TEDI MINING LIMITED
1. PRINCIPAL ACCOUNTING POLICIES CONTINUED
(N) FINANCIAL INSTRUMENTS CONTINUED
b) Financial liabilities continued
(iii) Derecognition
Financial liabilities are derecognised when and only when the obligation is extinguished, i.e., when the obligation is discharged or cancelled or has expired.
(O) IMPAIRMENT OF ASSETS
Non-current assets are tested for impairment whenever events or changes in circumstances indicate that the carrying amount may not be recoverable.
Impairment of assets is recognised whenever the carrying amount of an asset exceeds its recoverable amount. The recoverable amount is measured as the higher of net selling price and value in use. Value in use for individual assets is calculated by discounting future cash flows using a risk adjusted pre-tax discount rate. For purposes of assessing impairment, assets are grouped at the lowest levels for which there are separately identifiable cash flows (cash generating units).
(P) BORROWING COSTS
Prior to the commencement of commercial production in 1985, the amount of interest costs eligible for capitalisation was based on the actual interest costs incurred because the borrowings were incurred to fund development of the mine property. Capitalisation of borrowing costs ceased following the commissioning of the assets upon commercial production. These pre-production borrowing costs are amortised using the straight line basis over the life of the mine. Borrowing costs incurred subsequent to the commencement of commercial production are expensed when incurred over the period of the borrowing unless the borrowing relates to the construction of a qualifying asset, in which case the borrowing costs are capitalised. Interest is expensed using the effective interest method. Facility fees are amortised over the period of the facility.
(Q) LEASES
Leases of property, plant and equipment, where substantially all the risks and benefits incidental to the ownership are assumed by the Group, are classified as finance leases. Finance leases are capitalised, recording an asset and liability equal to the present value of the minimum lease payments, including any guaranteed residual values. Leased assets are amortised over their useful lives. Lease payments are allocated between the reduction of the lease liability and the interest expense for the period.
Operating lease payments, where substantially all the risks and benefits remain with the lessor, are expensed as incurred over the period of the lease. Commitments for such leases are disclosed in note 26(d).
(R) TRADE RECEIVABLES
Trade receivables are recognised initially at fair value and subsequently, where required, reduced by provision for impairment. A provision for impairment of trade receivables is established when there is objective evidence that the Group will not be able to collect all amounts due according to the original terms of receivables. The amount of the provision is the difference between the asset’s carrying amount and the recoverable amount. The amount of the provision is recognised in the income statement. Subsequent recoveries of amounts previously written off are credited against expenses in the income statement.
(S) INTANGIBLE ASSETS
Costs associated with maintaining software programmes are recognised as an expense as incurred. Development costs that are directly attributable to the acquisition, design and testing of identifiable and unique software products controlled by the Company are recognised as intangible assets when the following criteria are met:
• it is technically feasible to complete the software so that it will be available for use:
• management intends to complete the software and use it
• there is an ability to use the software
• it can be demonstrated how the software will generate probable future economic benefits
• adequate technical, financial and other resources to complete the development and to use the software are available, and
• the expenditure attributable to the software during its development can be reliably measured.
Directly attributable costs that are capitalised as part of the software include employee costs and an appropriate portion of relevant overheads.
Capitalised development costs are recorded as intangible assets and amortised from the point at which the asset is ready for use.
The Company amortises intangible assets with a limited useful life using the straight-line method over the shorter of the life of the asset or the life of the mine.
(T) DIVIDEND DISTRIBUTION
Dividend distribution to the Company’s shareholders is recognised as a liability in the Group’s financial statements in the year in which the dividends are approved by the Company’s Directors.
(U) TRADE AND OTHER PAYABLES
These amounts represent liabilities for goods and services provided to the Group prior to the end of financial year which are unpaid. The amounts are unsecured and are usually paid within 30 days of recognition.
(V) RELATED PARTY RELATIONSHIPS AND TRANSACTIONS
Related party relationship exists when one party has the ability to control, directly, or indirectly through one or more intermediaries, the other party or exercises significant influence over the other party in making financial and operating decisions. Such relationship also exists between and/or among entities which are under common control with the reporting enterprise, or between, and/or among the reporting enterprise and its key management personnel, directors, or its shareholder. In considering each possible related party relationship, attention is directed to the substance of the relationship, and not merely the legal form. Related party balances are shown net where there is a right of set-off.
(W) COMPARATIVE FIGURES
Comparative figures have been amended where appropriate to comply with changes in presentation adopted in the current year.

ANNUAL REVIEW 2017 95
2. FINANCIAL RISK MANAGEMENT(A) FINANCIAL RISK FACTORS
The Group’s activities expose it to a variety of financial risks including market risk (consists of currency, price and interest rate risk), credit risk, liquidity risk and fair value risk. The Group’s overall risk management program focuses on the unpredictability of financial markets and seeks to minimise potential adverse effects on the Group’s financial performance. Risk management is carried out by the Group’s treasury section under policies approved by the Board of Directors.
The Company and the Group hold the following financial instruments:
CONSOLIDATED COMPANY
2017K’000
2016K’000
2017K’000
2016K’000
FINANCIAL ASSETS:
Cash and cash equivalents 612,522 214,443 580,781 179,472
Trade and other receivables 282,884 333,345 279,950 326,647
Financial assurance fund 757,808 734,070 757,808 734,070
Other receivables 18,127 37,328 18,126 37,238
1,671,341 1,319,186 1,636,665 1,277,427
FINANCIAL LIABILITIES:
Trade and other payables 255,679 356,636 224,094 324,701
Other liabilities 65,748 75,517 64,515 65,863
Finance lease liability 42,824 - 42,824 -
364,251 432,153 331,433 390,564
(B) MARKET RISKS FACTORS
(i) Foreign Exchange Risks
The Company operates internationally and is exposed to foreign exchange risks arising from various currency exposures, primarily with respect to the US Dollar and the Australian Dollar. Foreign exchange risk arises from future commercial transactions and recognised assets and liabilities.
The Company’s revenues are in US dollars and a significant proportion of costs are in US dollars and Australian dollars. Therefore the Company’s operations are exposed to substantial foreign exchange risk. It is not the Company’s policy to hedge foreign exchange risk.
The rates used at 31 December 2017 for United States dollars and Australian dollars were 0.3095 and 0.3967 equal to one Kina respectively (31 December 2016 - 0.3150 and 0.4354 respectively).
At 31 December 2017, if the Kina had moved by 5% against the US dollar with all other variables held constant, the net profit after tax (NPAT) for the year would have an effect of K14.4 million (31 December 2016: K10.8 million) higher/lower, mainly as a result of foreign exchange gains/losses on translation of US dollar denominated provision for restoration & rehabilitation, trade receivables, financial assurance fund and cash at bank.
Monetary assets, provisions and liabilities denominated in foreign currencies, at balance date, are as follows:
CONSOLIDATED COMPANY
2017K’000
2016K’000
2017K’000
2016K’000
ASSETS:
Cash – US Dollars 222,520 125,385 222,520 125,385
– Australian Dollars 4,765 2,492 2,941 1,668
Receivables – US Dollars 218,807 223,655 218,807 223,655
Financial Assurance Fund receivable – US Dollars 757,808 734,070 757,808 734,070
LIABILITIES:
Payables – US Dollars 10,682 30,103 10,682 30,103
– Australian Dollars 34,597 29,309 33,983 28,872
Provision-Restoration & rehabilitation – US Dollars 651,118 733,584 651,118 733,584
(ii) Price Risks
The final settlement price received by the Company for the sale of its copper/gold concentrate is usually specified in sales contracts as being based on the average London Metal Exchange (LME) price for a defined future period generally three to five months after arrival of shipments at the customers’ facilities (refer note 1(c)).
At 31 December 2017, a fluctuation of US$110 per tonne (US$0.05/pound) in the price of copper would have an effect of K25.6 million (US$7.94 million) on the NPAT. A fluctuation of US$10/ounce in the price of gold would have an effect of K5.90 million (US$1.82 million) on NPAT. These sensitivities assume all other variables remain constant.
The Company does not hedge its copper and gold production.
The Company is exposed to debt securities price risk. These arises from the investments held by the Company through offshore fund managers and are classified as financial assurance fund at fair value in the statement of financial position. The investment manager does not use derivative financial instruments to reduce risk in the currency market and to increase or decrease the Company’s exposure to particular markets.
(iii) Interest Rate Risks Exposures
For the year ended 31 December 2017, the Company had on average cash of K405 million (2016: K95 million) at any given time. The cash balances were on demand and earned minimal interest.

96 OK TEDI MINING LIMITED
NOTES TO AND FORMING PART OF THE FINANCIAL STATEMENTS CONTINUEDFOR THE YEAR ENDED 31 DECEMBER 2017
OK TEDI MINING LIMITED
(C) CREDIT RISKS EXPOSURES
The credit risk on financial assets of the Company which have been recognised on the balance sheet is generally the carrying amount, net of any provisions for doubtful debts.
For derivatives, credit risk arises from the potential failure of counter parties to meet their obligations under the respective contracts. With respect to commodity contracts outlined above, the Company has an exposure to loss in the event counter parties fail to settle on contracts which are favourable to the Company.
For trade receivables and financial commitments, the Company only deals with counter parties with a credit rating of BBB - or better. Since trade sales are spread over a number of customers the Company believes that no significant concentration of credit risk exists and it is not the Company’s policy to hedge credit risk.
The Company has policies in place to ensure that sales are made to customers with an appropriate credit history and require letters of credit from the majority of its buyers. Management does not expect any losses from non-performance by counterparties.
(D) LIQUIDITY RISKS EXPOSURES
Prudent liquidity risk management implies maintaining sufficient cash, the availability of funding through an adequate amount of committed credit facilities and the ability to close out market positions. The Company manages liquidity risk by maintaining sufficient bank balances to fund its operations and the availability of funding through a committed credit facility.
Management monitors rolling forecasts of the liquidity reserve on the basis of expected cash flows.
The table below analyses the Group’s financial liabilities which will be settled on a net basis into relevant maturity groupings based on the remaining period at the balance sheet date to the contractual maturity date. The amounts disclosed in the table are the contractual undiscounted cash flows.
1 YEAR
MORE THAN 2 YEARS
TO 5 YEARSMORE THAN
5 YEARS
GROUP K’000 K’000 K’000
AT 31 DECEMBER 2017
Trade and other payables 255,679 - -
Other liabilities 92,692 - -
Finance lease liability 6,758 27,030 27,030
AT 31 DECEMBER 2016
Trade and other payables 356,636 - -
Other liabilities 75,586 - -
1 YEAR
MORE THAN 2 YEARS TO
5 YEARSMORE THAN
5 YEARS
COMPANY K’000 K’000 K’000
AT 31 DECEMBER 2017
Trade and other payables 224,094 - -
Other liabilities 91,250 - -
Finance lease liability 6,758 27,030 27,030
AT 31 DECEMBER 2016
Trade and other payables 324,701 - -
Other liabilities 65,863 - -
(E) FAIR VALUE ESTIMATION
Fair value is the price that would be received to sell an asset or paid to transfer a liability in an orderly transaction between market participants at the measurement date.
The Company classifies its fair value measurements using a fair value hierarchy that reflects the significance of the inputs used in making the measurements. The fair value hierarchy has the following levels:
• quoted prices (unadjusted) in active markets for identical assets or liabilities (Level 1);
• inputs other than quoted prices included within Level 1 that are observable for the asset or liability, either directly (that is, as prices) or indirectly (that is, derived from prices) (Level 2); and
• inputs for the asset or liability that are not based on observable market data (that is, unobservable inputs) (Level 3). The Company has no assets or liabilities classified under Level 3 as at December 31, 2017 and 2016.
The appropriate level is determined on the basis of the lowest level input that is significant to the fair value measurement.
The Company’s Financial Assurance Fund is carried at fair value as at December 31, 2017. The Company holds no other financial instruments that are carried at fair value in 2017 and 2016.
The fair values were determined in reference to observable market inputs reflecting orderly transactions, i.e., market listings, published broker quotes and transacted deals from similar and comparable assets, adjusted to determine the point within the range that is most representative of the fair value under current market conditions. The Company has no non-financial assets or liabilities carried at fair value as at December 31, 2017 and 2016.
The fair value of financial and non-financial liabilities takes into account non-performance risk, which is the risk that the entity will not fulfil an obligation.

ANNUAL REVIEW 2017 97
(F) CAPITAL RISK MANAGEMENT
The Group’s objectives when managing capital are to safeguard its ability to continue as a going concern, so that it can continue to provide returns for shareholders and benefits for other stakeholders and to maintain an optimal capital structure to reduce the cost of capital.
In order to maintain or adjust the capital structure, the Group may adjust the amounts of dividends paid to shareholders, return capital to shareholders, issue new shares or sell assets to reduce debt.
Consistent with others in the industry, the Group and the Company monitor capital on the basis of the gearing ratio. This ratio is calculated as net debt divided by total capital. Net debt is calculated as total financial liabilities (including trade and other payables and derivative financial instruments as shown in the balance sheet) less cash and cash equivalents. Total capital is calculated as equity as shown in the balance sheet plus debt.
The gearing ratios at 31 December 2017 and 31 December 2016 were as follows:
CONSOLIDATED COMPANY
2017K’000
2016K’000
2017K’000
2016K’000
Trade and other payables (note 16) 255,679 356,636 224,094 324,701
Finance lease liability 42,824 - 42,824 -
Other liabilities 66,276 75,586 66,832 65,863
Less: Cash and cash equivalents (note 13) (612,522) (214,443) (580,781) (179,472)
Net debt - 217,779 - 211,092
Equity 3,454,321 2,926,112 3,451,615 2,924,568
Total capital 3,454,321 3,143,891 3,451,615 3,135,660
Gearing Ratio - 0.069 - 0.067
3. CRITICAL ACCOUNTING ESTIMATES AND JUDGEMENTSThe most significant estimates and judgements relate to the long term copper and gold price, mineral reserves and remaining open pit mine life, provision for restoration and rehabilitation obligations, recoverability of long-lived assets (including mine development costs) and depreciation. Actual results could differ from those estimates and may affect amounts reported in future years. Management believes that the estimates and assumptions are reasonable.
(A) CRITICAL ACCOUNTING ESTIMATES
The estimates and assumptions that have a risk of causing a material adjustment to the carrying amounts of assets and liabilities within the next financial year are outlined below:
(i) Uncertainty of mineral reserve and mineral resource estimates
Mineral reserve and mineral resource estimates are imprecise and depend partly on statistical inferences drawn from drilling and other data, which may prove to be unreliable. Future production could differ dramatically from mineral reserve estimates for the following reasons:
• Mineralisation or formations could be different from that predicted by drilling, sampling and similar examinations;
• Declines in the market price of copper, gold and silver may render the mining of some or all of OTML’s mineral reserves uneconomic;
• Increases in mining costs and processing costs could adversely affect the economics of mineral reserves; and
• The grade of mineral reserves may vary significantly from time to time and there can be no assurance that any particular level of copper, gold and silver may be recovered from the mineral reserves.
Any of these factors may require the Company to reduce mineral reserve and mineral resource estimates or increase its costs.
(ii) Life of Mine
In 2013, Management changed the estimated life of mine through which the mining and processing of copper ore are forecast to continue from 2015 to 2025. The new mine life of 2025 is based on the mine life extension (MLE) feasibility study that was approved by the Board in February 2013.
Agreements for the extension of the mine life were completed and agreed with the nine (9) CMCA impacted regions in December 2012. All other regulatory and legislative approvals necessary to give legal attest to the mine continuation beyond 2015 were completed during 2014.
The current mine plan and resource and reserve statement supports mining of the ore reserve up to 2024. Although Special Mine Lease 1 (SML 1) expires in 2022, management are confident that renewal of the lease beyond 2022 is highly probable.

98 OK TEDI MINING LIMITED
NOTES TO AND FORMING PART OF THE FINANCIAL STATEMENTS CONTINUEDFOR THE YEAR ENDED 31 DECEMBER 2017
OK TEDI MINING LIMITED
(iii) Provision for Restoration and Rehabilitation
The Provision for Restoration and Rehabilitation is based largely on an obligation to contribute to the Ok Tedi Financial Assurance Fund (refer note 1(g) and note 22). Pursuant to the Mine Closure Code, contained in the Mining (Ok Tedi Mine Continuation (Ninth Supplemental) Agreement) Act 2001, the Company is required to update its Mine Closure Plan and submit it to the Office of the Environment and the Department of Mining every three years. The updated Mine Closure Plan must notify, amongst other things, what the Company’s latest estimate is of the open pit mine closure costs. A Mine Closure Plan in 2013 estimated a cost of mine closure of US$227 million which has been further updated in 2016 to reflect the continuation of the mine to 2025 and approved by the regulators in 2017 and estimated a cost of mine closure of US$196 million. The Company will be preparing another Detailed Mine Closure Plan 4 years before the end of mine life. The amount of provision recognised at balance sheet date is the latest estimated cost of US$196 million escalated to 2025 at an inflation rate of 2.36 percent (2016: 2.18 percent) and is discounted using a discount rate of 2.35 percent (2016: 2.38 percent).
(iv) Provision for Obsolescence
Materials and supplies are valued at the lower of cost and net realisable value. An allowance for obsolescence is determined by reference to the age of the store items identified.
Allowance for obsolescence are based on the percentage and age of the store items identified: 10% for 2-3 years; 20% for 3-4 years; 30% for 4-5years; 40% for 5-6 years; 50% for 6-7 years; 60% for 7-8years and 100% above 8 years.
(v) Depreciation and Amortisation of Long Term Assets
In estimating the remaining life of the open pit mine, for the purpose of depreciation and amortisation calculations, due regard is given to the volume of remaining economically recoverable reserves but not to limitations that could arise from the potential for changes in technology, demand and other issues, such as early mine closure. These are inherently difficult to estimate and this uncertainty can lead to a financial limitation on the basis of depreciation and amortisation adopted and is reviewed annually under prevailing circumstances.
Major costs being depreciated or amortised over the extended mine life to 2025 that would have a significant financial impact should early mine closure eventuate are:
CONSOLIDATED COMPANY
2017K’000
2016K’000
2017K’000
2016K’000
Property, plant and equipment 1,145,741 1,130,628 1,144,390 1,129,261
Mine development cost 1,271,504 1,150,745 1,271,504 1,150,745
Intangible assets 50,940 56,827 50,940 56,827
Restoration and rehabilitation - 45,126 - 45,126
Total Costs At Risk 2,468,185 2,383,326 2,466,834 2,381,959
(B) CRITICAL ACCOUNTING JUDGEMENTS
(i) Income taxes
Significant judgment is required in determining the provision for income taxes. There are many transactions and calculations for which the ultimate tax determination is uncertain during the ordinary course of business. Where the final tax outcome of these matters is different from the amounts that were initially recorded, such differences will impact the current tax and deferred tax provisions in the period in which such determination is made.
(ii) Impairment Assessment of Long Term Assets
In accordance with the Group policy (note 1(o)), the Company has undertaken an assessment of impairment indicators and determined that there are no indicators of potential impairment of long term assets. However, an assessment of the recoverable amount of the long term assets was performed on a value-in-use basis as part of the Company’s standard process. These calculations used post-tax cash flow projections based on the most recently approved life of mine plan, discounted at a post-tax discount rate. The use of after-tax cash flows and discount rate was considered appropriate as the cash generating unit was the company as a whole and use of post-tax cash flows and discount rates should provide a consistent result to using pre-tax cash flows and discount rate.
The calculation of recoverable amount requires the use of estimates. In performing the assessment the key assumptions included:
• Long term metal prices of US$3.00/lb for copper and US$1,200 for gold. These are consistent with external sources of information.
• Remaining mine life of 8 years and recoverable ore of 235MT
• Discount rate of 12%, with sensitivities ranging from 7.5% to 15%
Should the discount rate increase (decrease) by +/-1%, total net present value of property plant and equipment and other non-current assets would increase (decrease) by approximately K20 million. The assessment indicated that the recoverable amount was greater than carrying amount and no impairment was required to be recognised as at 31 December 2017.

ANNUAL REVIEW 2017 99
CONSOLIDATED COMPANY
2017K’000
2016K’000
2017K’000
2016K’000
4(a). SALES REVENUECopper 1,952,066 1,164,295 1,952,066 1,164,295
Gold 1,015,804 793,544 1,015,804 793,544
Silver 58,365 44,070 58,365 44,070
Finalisation/revaluation adjustments (note 1(c)) 152,876 53,153 152,876 53,153
Total Sales Revenue 3,179,111 2,055,062 3,179,111 2,055,062
4(b). OTHER OPERATING INCOME/(EXPENSE), NETGain (loss) on disposal of equipment 189 (615) 189 (615)
Other income 40,885 32,119 - -
Adjustment to provision for restoration and rehabilitation 73,752 - 73,752 -
Total Other Operating Income 114,826 31,504 73,941 (615)
5. GENERAL AND ADMINISTRATIVE COSTSCommercial, Business Improvements and Managing Director costs 510,711 404,781 510,711 404,781
External Relations 120,068 123,660 120,068 121,962
Business strategy 29,638 16,642 29,638 16,642
Other expenses 48,210 32,900 9,399 4,114
Total Operating Costs 708,627 577,983 669,816 547,499
Included in the operating profit before tax are the following items:
Auditor’s remuneration:
- Auditing services 854 884 680 710
- Other services 245 212 187 188
Donations 235 273 116 27
6(a). FINANCE INCOMEForeign exchange gain, net 5,379 10,430 5,379 10,430
Interest income 11,547 5,679 11,539 5,666
Total Finance Income 16,926 16,109 16,918 16,096
6(b). FINANCE COSTUnwinding of discount on long term provisions:
- Restoration and rehabilitation (note 22) (17,652) (16,294) (17,652) (16,294)
Interest expense (204) (11,862) (204) (11,862)
Total Finance Cost (17,856) (28,156) (17,856) (28,156)

100 OK TEDI MINING LIMITED
NOTES TO AND FORMING PART OF THE FINANCIAL STATEMENTS CONTINUEDFOR THE YEAR ENDED 31 DECEMBER 2017
OK TEDI MINING LIMITED
CONSOLIDATED COMPANY
2017K’000
2016K’000
2017K’000
2016K’000
7. INCOME TAX EXPENSE
The prima facie tax charge on the profit for the year is reconciled to the income tax expense as follows:
Profit for the year before tax 1,205,961 528,079 1,204,302 526,994
Prima facie tax on the profit for the year at 30% (361,788) (158,424) (361,291) (158,098)
Tax effect of permanent differences:
Non-deductible items (6) (4) (6) (4)
Non-taxable income 3,149 1,726 3,149 1,697
Double deduction – staff training 982 815 982 815
Unrealised exchange (gain)/loss 426 869 426 869
Over provision in prior years - 12,096 - 12,096
Income Tax Expense (357,237) (142,922) (356,740) (142,625)
TAX EXPENSE COMPRISES:
Income tax - current year (note 18) (192,124) (337) (191,707) -
Deferred tax - current year (note 19 (a)) (165,113) (142,585) (165,033) (142,625)
Income Tax Expense (357,237) (142,922) (356,740) (142,625)
BUILDINGS AND IMPROVEMENTS
K’000
PLANT, MACHINERY
EQUIPMENT & OTHER ASSETS
K’000
CAPITALWORKS IN
PROGRESSK’000
TOTALK’000
8. PROPERTY, PLANT AND EQUIPMENTCOMPANY
Opening cost 1 January 2017 428,738 3,622,237 135,553 4,186,528
Opening accumulated depreciation (329,082) (2,728,185) - (3,057,267)
Opening net book value 99,656 894,052 135,553 1,129,261
Additions - property, plant and equipment - - 173,518 173,518
Transfer from capital works in progress 5,165 114,150 (119,315) -
Additions - capital lease - 50,689 - 50,689
Disposals (net book value) - (22,641) - (22,641)
Depreciation charge (note 3(a)(v)) (12,779) (173,658) - (186,437)
Closing Net Book Value 31 December 2017 92,042 862,592 189,756 1,144,390
Closing Cost 31 December 2017 433,903 3,741,695 189,756 4,365,354
Accumulated depreciation (341,861) (2,879,103) - (3,220,964)
Closing Net Book Value 31 December 2017 92,042 862,592 189,756 1,144,390

ANNUAL REVIEW 2017 101
BUILDINGS AND IMPROVEMENTS
K’000
PLANT, MACHINERY,EQUIPMENT
K’000
CAPITALWORKS IN
PROGRESSK’000
TOTALK’000
COMPANY
Opening cost 1 January 2016 399,827 3,563,360 104,695 4,067,882
Opening accumulated depreciation (320,876) (2,585,292) - (2,906,168)
Opening net book value 78,951 978,068 104,695 1,161,714
Additions - property, plant and equipment - - 122,047 122,047
Transfer from capital works in progress 28,911 62,278 (91,189) -
Disposals and adjustments - (118) - (118)
Depreciation charge (8,206) (146,176) - (154,382)
Closing Net Book Value 31 December 2016 99,656 894,052 135,553 1,129,261
Closing Cost 31 December 2016 428,738 3,622,237 135,553 4,186,528
Accumulated depreciation (329,082) (2,728,185) - (3,057,267)
Closing Net Book Value 31 December 2016 99,656 894,052 135,553 1,129,261
(A) LEASED ASSETS
Plant, machinery equipment and other assets include the following amounts where the Company is a lessee under a finance lease (refer to note 21(b) for further details):
CONSOLIDATED COMPANY
2017K’000
2016K’000
2017K’000
2016K’000
Vessel
Cost 49,581 - 49,581 -
Accumulated depreciation - - - -
Net book amount 49,581 - 49,581 -
In accordance with the Mining (Ok Tedi Agreement) Act, the Independent State of Papua New Guinea (the State) has the right, after the closure of the mine, to acquire certain infrastructure fixed assets. The accounting net book value of these fixed assets is K92,042,000 (2016: K99,656,000). At the time that these accounts were prepared the Company has not received, and does not expect to receive, notice that the State intends to acquire any of the assets concerned. The current life of the open pit mine estimate is that mining and processing of ore will continue until the end of 2025 (note 3 (a)(ii)).
The schedule above does not include the OTDF property, plant and equipment which has a closing net book value of K1,351,000 (2016: K1,367,000).
PRE-PRODUCTION
EXPENDITUREK’000
DEFERRED STRIPPING
COSTK’000
TOTALK’000
9. MINE DEVELOPMENT COSTS (CONSOLIDATED AND COMPANY)Opening cost 1 January 2017 399,367 1,226,404 1,625,771
Accumulated amortisation (385,483) (89,543) (475,026)
Opening net book value 13,884 1,136,861 1,150,745
Additions - 165,185 165,185
Amortisation (575) (43,851) (44,426)
Closing Net Book Value 31 December 2017 13,309 1,258,195 1,271,504
Closing cost 31 December 2017 399,367 1,391,579 1,790,946
Accumulated amortisation (386,058) (133,384) (519,442)
Closing Net Book Value 31 December 2017 13,309 1,258,195 1,271,504

102 OK TEDI MINING LIMITED
NOTES TO AND FORMING PART OF THE FINANCIAL STATEMENTS CONTINUEDFOR THE YEAR ENDED 31 DECEMBER 2017
OK TEDI MINING LIMITED
PRE-PRODUCTION
EXPENDITUREK’000
DEFERREDSTRIPPING
COSTK’000
TOTALK’000
9. MINE DEVELOPMENT COSTS (CONSOLIDATED AND COMPANY) CONTINUEDOpening cost 1 January 2016 392,710 1,092,372 1,485,082
Accumulated amortisation (384,908) (54,798) (439,706)
Opening net book value 7,802 1,037,574 1,045,376
Additions 6,657 134,032 140,689
Amortisation (575) (34,745) (35,320)
Closing Net Book Value 31 December 2016 13,884 1,136,861 1,150,745
Closing cost 31 December 2016 399,367 1,226,404 1,625,771
Accumulated amortisation (385,483) (89,543) (475,026)
Closing Net Book Value 31 December 2016 13,884 1,136,861 1,150,745
CONSOLIDATED COMPANY
2017K’000
2016K’000
2017K’000
2016K’000
10. INTANGIBLE ASSETSOpening net book value 56,827 51,851 56,827 51,851
Transfer from capital works in progress (note 8) 1,216 10,959 1,216 10,959
Amortisation (7,103) (5,983) (7,103) (5,983)
Closing Net Book Value 50,940 56,827 50,940 56,827
Cost 67,050 65,834 67,050 65,834
Accumulated amortisation (16,110) (9,007) (16,110) (9,007)
Net Book Value 50,940 56,827 50,940 56,827
The intangible asset relates to the capitalised development cost of the operations and accounting software of the Company.
11. RESTORATION & REHABILITATION ASSETOpening net book value 45,126 55,327 45,126 55,327
Adjustment to provision (note 22) (40,563) (7,434) (40,563) (7,434)
Impact of change in exchange rate on provision 469 2,988 469 2,988
Amortisation (5,032) (5,755) (5,032) (5,755)
Closing Net Book Value (note 1(g)) - 45,126 - 45,126
Cost 471,868 503,740 471,868 503,740
Accumulated amortisation (471,868) (458,614) (471,868) (458,614)
Net Book Value - 45,126 - 45,126
12. OTHER RECEIVABLES (NON-CURRENT)Advances to suppliers 18,127 37,238 18,126 37,238
Total Non-Current Other Assets 18,127 37,238 18,126 37,238

ANNUAL REVIEW 2017 103
CONSOLIDATED COMPANY
2017K’000
2016K’000
2017K’000
2016K’000
13. CASH AND CASH EQUIVALENTSCash on hand 77 39 75 35
Cash at bank 602,445 194,404 580,706 179,437
Short term deposits 10,000 20,000 - -
Total Cash and Cash Equivalents 612,522 214,443 580,781 179,472
14. TRADE AND OTHER RECEIVABLES Accounts receivable – trade 220,278 226,442 218,807 223,655
Accounts receivable – sundry (a), (b) 17,858 13,083 16,343 9,741
Prepayments and other receivables 44,998 93,972 45,050 93,389
283,134 333,497 280,200 326,785
Less: Provision for doubtful debts (c) (250) (152) (250) (138)
Total Current Receivables 282,884 333,345 279,950 326,647
The Company’s and the Group’s exposure to credit risk is discussed in note 2(c).
(A) IMPAIRED RECEIVABLES
As at 31 December 2017, other receivables of the Group with a nominal value of K0.8 million which are over six months overdue (2016: K0.7 million) are considered to be impaired. There was K250,000 provision for the year (2016: K138,000). The individually impaired receivables mainly relate to employee, local, overseas and PNG sundry receivables. It was assessed that a portion of the receivables was expected to be recovered. There were no impaired trade receivables in 2017.
(B) PAST DUE BUT NOT IMPAIRED
As at 31 December 2017, sundry receivables of K 4,100,000 (2016: K 4,238,000) were past due but not impaired. These relate to employee, local, overseas and PNG sundry receivables for which there is no recent history of default and/or regular partial payments are being received. The ageing analysis of these sundry receivables are as follows (2016: all >120 days due to the stand down of operation):
CURRENT 30 DAYS 60 DAYS 90 DAYS 120 DAYS TOTAL
2017 K’000 2,460 384 256 154 846 4,100
2016 K’000 3,190 129 138 78 703 4,238
CONSOLIDATED COMPANY
2017K’000
2016K’000
2017K’000
2016K’000
(C) PROVISION FOR DOUBTFUL DEBTS
Opening balance 152 726 138 642
Increase in provision 112 14 112 -
Write-offs applied against provision (14) (588) - (504)
Closing Balance 250 152 250 138
(D) FOREIGN EXCHANGE RISK
Information about the Group’s and the Company’s exposure to foreign currency risk in relation to Trade and Other Receivables is provided in note 2(b)(i).
(E) FAIR VALUE
Due to the short-term nature of the receivables, their carrying amount is assumed to approximate their fair value.

104 OK TEDI MINING LIMITED
NOTES TO AND FORMING PART OF THE FINANCIAL STATEMENTS CONTINUEDFOR THE YEAR ENDED 31 DECEMBER 2017
OK TEDI MINING LIMITED
CONSOLIDATED COMPANY
2017K’000
2016K’000
2017K’000
2016K’000
15. INVENTORIES MATERIALS AND SUPPLIES:
Spare parts and consumables 481,249 344,373 481,249 344,373
Less: Provision for obsolete stock (a) (23,887) (33,087) (23,887) (33,087)
Total Consumables 457,362 311,286 457,362 311,286
CONCENTRATE:
Product in process 42,332 23,429 42,332 23,429
Product on hand 58,953 36,908 58,953 36,908
Total Concentrate 101,285 60,337 101,285 60,337
Total Inventories 558,647 371,623 558,647 371,623
(A) PROVISION FOR OBSOLETE STOCK
Opening balance 33,087 42,500 33,087 42,500
Write-off - - - -
Reversal of Provision (9,200) (9,413) (9,200) (9,413)
Closing Balance 23,887 33,087 23,887 33,087
16. TRADE AND OTHER PAYABLES Accounts payable – trade 228,743 260,937 223,113 263,516
Dividends payable (a) - 59,179 - 59,179
Other payables 26,936 36,520 981 2,006
Total Trade and Other Payables 255,679 356,636 224,094 324,701
(A) PROVISION FOR DIVIDEND PAYABLE
Opening Balance 59,179 9,679 59,179 9,679
Declared 320,515 150,000 320,515 150,000
Paid (379,694) (100,500) (379,694) (100,500)
Closing Balance - 59,179 - 59,179
17. BORROWINGSOpening balance - 195,000 - 195,000
Loan repayment - (195,000) - (195,000)
Total Borrowings - - - -
18. INCOME TAX PAYABLEOpening balance payable/(refundable) - (21,639) - (21,747)
Tax expense (note 7) 192,124 337 191,707 -
TCS, royalty and interest withholding tax (83,542) - (83,872) -
Payments/refunds (54,285) 21,302 (53,915) 21,747
Closing Balance Payable 54,297 - 53,920 -

ANNUAL REVIEW 2017 105
CONSOLIDATED COMPANY
2017K’000
2016K’000
2017K’000
2016K’000
19. DEFERRED INCOME TAX, NETDeferred Income Tax comprises:
DEFERRED TAX ASSET:
Employee benefits 10,171 7,031 10,065 6,844
Tax loss carry over - 61,747 - 61,747
Rehabilitation and restoration liability 195,335 206,537 195,335 206,537
Provision for stock obsolescence 7,166 9,926 7,166 9,926
Property, plant and equipment - 31,682 - 31,682
Others 42,267 4,636 42,267 4,637
Total Deferred Tax Assets 254,939 321,559 254,833 321,373
DEFERRED TAX LIABILITY:
Prepayments / consumables inventory (113,102) (76,951) (113,102) (76,951)
Financial Assurance Fund (190,116) (186,143) (190,116) (186,143)
Property, plant and equipment (53,888) - (53,888) -
Others (45,073) (40,592) (45,073) (40,592)
Total Deferred Tax Liabilities (402,179) (303,686) (402,179) (303,686)
Deferred Tax (Liabilities) / Assets, Net (147,240) 17,873 (147,346) 17,687
(A) MOVEMENT IN DEFERRED INCOME TAX ASSET/(LIABILITY)
Opening balance 17,873 160,458 17,687 160,312
Charged to income statement (note 7) (165,113) (142,585) (165,033) (142,625)
Closing Balance (147,240) 17,873 (147,346) 17,687
20. PROVISIONS AND OTHER LIABILITIES Employee entitlements 34,461 30,436 33,546 22,813
Community Mine Continuation Agreements 3,301 24,438 3,301 22,407
Compensation liability 17,156 16,170 17,156 16,170
Lease liability 6,308 - 6,308 -
Deferred Income and other current liabilities 3,289 - 2,971 -
Production levy 7,541 4,473 7,541 4,473
Total Current Provisions and Other Liabilities 72,056 75,517 70,823 65,863

106 OK TEDI MINING LIMITED
NOTES TO AND FORMING PART OF THE FINANCIAL STATEMENTS CONTINUEDFOR THE YEAR ENDED 31 DECEMBER 2017
OK TEDI MINING LIMITED
CONSOLIDATED COMPANY
2017 K’000
2016K’000
2017K’000
2016K’000
21. PROVISIONS AND OTHER LIABILITIES Deferred income 26,735 - 26,735 -
Lease liability 36,516 - 36,516 -
Employee entitlements 210 69 - -
Total Non-Current Provisions and Other Liabilities 63,461 69 63,251 -
(A) EMPLOYEE ENTITLEMENTS (CURRENT AND NON-CURRENT)
Opening balance 30,505 8,658 22,813 7,923
Provision created 30,676 43,008 30,236 35,598
Less: payments made against the provision (26,507) (21,161) (19,504) (20,708)
Closing Balance 34,674 30,505 33,545 22,813
Current (note 20) 34,461 30,436 33,545 22,813
Non-current 213 69 - -
Closing Balance 34,674 30,505 33,545 22,813
(B) LEASE LIABILITY
Commitments in relation to finance leases are payable as follows:
Within one year 6,758 - 6,758 -
Later than one year but not later than five years 27,030 - 27,030 -
Later than five years 27,030 - 27,030 -
Minimum lease payments 60,818 - 60,818 -
Future finance charges (17,994) - (17,994) -
Recognised as a liability 42,824 - 42,824 -
The present value of finance lease liabilities is as follows:
Within one year 6,308 - 6,308 -
Later than one year but not later than five years 20,833 - 20,833 -
Later than five years 15,683 - 15,683 -
Minimum lease payments 42,824 - 42,824 -

ANNUAL REVIEW 2017 107
2017 K’000
2016K’000
2017K’000
2016K’000
22. PROVISION FOR RESTORATION AND REHABILITATION Opening balance 733,584 686,349 733,584 686,349
Adjustment to provision (notes 11 & 14(b)) (112,675) (7,434) (112,675) (7,434)
Impact of change in exchange rate on provision 12,557 38,375 12,557 38,375
Interest charged (note 6b) 17,652 16,294 17,652 16,294
Closing Balance (note 1(g)) 651,118 733,584 651,118 733,584
The adjustment to the provision relates to change in the estimated cost of mine closure which received approval from the Government during the year.
23. ORDINARY SHARESIssued and paid up capital
192,700,000 shares (2016: 192,700,000 shares) 195,102 195,102 195,102 195,102
24. DIVIDENDSThe Constitution provides that the Board may vote to:
- pay dividends as in the judgment of the Directors that the position of the Company justifies; and
- reduce or increase the amount or delay the payment of an ordinary dividend.
Furthermore, as defined in the Fifth Restated Shareholders Agreement, the declaration and amount of any dividend will be in accordance with the Constitution and otherwise at the sole discretion of the Board.
Final dividend 320,515 150,000 320,515 150,000
Total Dividends Declared 320,515 150,000 320,515 150,000
Dividend distributions to the Company’s shareholders are recognised as a liability in the Company’s financial statements in the year in which the dividends are approved by the Company’s Directors.
25. CONTINGENCIES(A) GUARANTEES
Collector of Customs 120 120 120 120
Total Guarantees 120 120 120 120
(B) LITIGATION
The Company is subject to various claims and litigation. The Directors however consider that the probability of significant loss from these claims is remote.
(C) MINE CONTINUATION
The agreement that led to the dismissal of proceedings in relation to environmental damage included an undertaking by the Company to use best endeavours to include the villages that supported the actions in the Community Mine Continuation Agreement (CMCA) process. There is no obligation for the inclusion of these villages to add to the total amount paid under the existing CMCAs.
26. COMMITMENTS(A) COMPENSATION PAYMENTS
The Mining (Ok Tedi Restated Eighth Supplemental Agreement) Act 1995 (No. 48) of Papua New Guinea was enacted in August 1995 and required the Company to make annual payments to compensation trusts over the remaining life of the mine. Required payments have been made by the Company and current liabilities are recognised in the accounts.
The Mining (Ok Tedi Mine Continuation (Ninth Supplemental) Agreement) Act 2001 (No. 7) was enacted in 2001 and required the Company to make annual payments initially aggregating to K161.5 million over the life of mine.
A requirement of the agreement was to have a mid-term review which addressed many factors including an assessment of whether predicted environmental impacts are being exceeded. This occurred during 2006 and agreements were successfully concluded during the second quarter of 2007 with the formal signing of the CMCA Review Memorandum of Agreement between the delegates of the CMCA regions and shareholders of the Company. The communities downstream of the mine benefited from the agreed increased compensation deal over the period 2007 to 2013.
With the agreement signed in December 2012 by the nine CMCA impacted regions for mine life extension, the total benefits agreed was PGK 515.0 million (USD 162.2 million) over ten years from 2016 to 2025.

108 OK TEDI MINING LIMITED
NOTES TO AND FORMING PART OF THE FINANCIAL STATEMENTS CONTINUEDFOR THE YEAR ENDED 31 DECEMBER 2017
OK TEDI MINING LIMITED
(B) ENVIRONMENTAL MONITORING COSTS
In OTML’s 2009 Detailed Mine Closure Plan (MCP), which was submitted to the PNG Office of Environment and Conservation and the Mineral Resources Authority the Company has undertaken to monitor key environmental aspects for a 30 year period following closure of the open pit mine. The Detailed MCP included a detailed estimate of the cost of this PCEMP (Post Closure Environmental Monitoring Program) which totalled USD 38 million. This comprises: Monitoring Activities which are aimed at the performance of the cover on the Bige stockpiles and, throughout the riverine system, ARD, water quality, fish biology and hydrography; Support Programs which cater for labour, equipment, travel and access logistics, and operating, management and reporting costs; and Contingency and Escalation Costs which allow for both pre closure and post closure cost movements.
(C) CAPITAL EXPENDITURE
As at 31 December 2017, the Company had budgeted for capital commitments totalling K96,574,000 which are not provided for in the accounts (31 December 2016: K41,128,000).
(D) OPERATING LEASES
Payments due under operating leases for property and equipment not provided for in the accounts are:
CONSOLIDATED COMPANY
2017K’000
2016K’000
2017K’000
2016K’000
Due within 1 year 132,841 100,925 132,841 100,925
Due within 1-2 years 103,914 100,925 103,914 100,925
Due within 2-5 years 190,543 265,058 190,543 265,058
Due > 5 years - 54,512 - 54,512
Total Operating Leases 427,298 521,420 427,298 521,420
27. INSURANCEThe Company places insurance cover with insurers of high credit rating. The insurance policies cover the usual risks that are able to be transferred to insurers under property, liability and transit insurance policies.
The basis of indemnification for Business Interruption (BI) insurance is reimbursement of fixed costs with a cover of US$600,000,000 (2016: US$600,000,000) inclusive of self-insured retentions.
Self-insured retentions (ISR) include: Property Damage – US$12,500,000; Business Interruption – first 30 days after insurable event plus US$2,500,000 for property damage.
28. INVESTMENT IN SUBSIDIARIESThe holding company’s investment in subsidiaries comprises shares at cost.
ORDINARY SHARES
% SHAREHOLDING
Ok Tedi Development Foundation Limited (a) 3 75%
Ok Tedi Australia Pty Limited (b) 10,000 100%
Ok Tedi Power Limited (c) 1 100%
(A) OK TEDI DEVELOPMENT FOUNDATION LIMITED (OTDF)
OTDF was established pursuant to the Mining (Ok Tedi Mine Continuation (Ninth Supplemental) Agreement) Act 2001. Before mine closure, the Company is under an obligation to transfer its shares in OTDF to four reputable organisations engaged in development activities in Papua New Guinea consistent with the objects of OTDF. If the Company does not transfer its shares prior to mine closure, OTDF must be wound up. During 2011, one share was transferred to PNG Sustainable Development Program Limited.
The objects of OTDF are to pursue the promotion of sustainable social improvement and economic activity in the Western Province and Telefomin district of the Sandaun Province for the well-being of persons resident in these provinces. OTDF must act solely in pursuit of these objects.
OTDF have a break-even operating result for the year (31 December 2016: break-even). OTDF is exempt from PNG income tax and supplies to OTDF do not attract GST. Further, moneys paid or the cost of assets contributed to OTDF is an allowable deduction to the person making the payment or contribution in the year of payment or contribution.
(B) OK TEDI AUSTRALIA PTY LIMITED (OTAPL)
OTAPL was incorporated on 19 June 2008 as a wholly owned subsidiary of OTML. The objectives of OTAPL are to provide marketing and logistics services to OTML. The Company’s investment in OTAPL at cost is K 21 million.
(C) OK TEDI POWER LIMITED (OTPL)
OTPL was incorporated on 12 June 2014 as a wholly owned subsidiary of OTML. The sole purpose of OTPL is to manage the provision of electricity in the Western Province, Papua New Guinea. The Company’s investment in OTPL at cost is K nil.

ANNUAL REVIEW 2017 109
29. OK TEDI FINANCIAL ASSURANCE FUND The Mine Closure Code contained in the Mining (Ok Tedi Mine Continuation (Ninth Supplemental) Agreement) Act 2001 requires the Company to contribute to a Mine Closure Fund (referred to as the Ok Tedi Financial Assurance Fund). The Ok Tedi Financial Assurance Fund has been established with Standard Bank Offshore Trust Company (Jersey) Ltd acting as independent Trustee. The Fund covers costs of (a) deconstruction and clean up, (b) revegetation, (c) environmental monitoring and maintenance, (d) employee retrenchment, (e) dredging after closure and (f) post closure monitoring which are valued in USD based on current cost with contingency and escalation considered up to mine closure.
The Ok Tedi Financial Assurance Fund is established to provide sufficient cash at the open pit mine closure for settlement of mine rehabilitation and restoration liabilities (refer note 1(g)). A Detailed Mine Closure Plan which was approved by the Minister for Mining on 7 May 2012 indicated that the Fund should contain US$227 million by 2013. As at 31 December 2013, the Company had already met the funds required and ceased the semi-annual payments. The Funds are held by the Trustee to be applied in assisting both the Company and the State to comply with their respective Mine Closure Plan obligations under the Mine Closure Code. A detailed review of the mine closure plan and cost estimate to reflect the continuation of the mine to 2025 was updated in 2016 and approved by the regulators in 2017. Management expect that the existing Fund with accrued income through to 2025 will be sufficient to meet any increase in the mine closure liability.
The assets of the Ok Tedi Financial Assurance Fund are legally separate from the Company and are not available to meet the claims of creditors in any winding up of the Company. They are irrevocably dedicated to funding open pit mine closure costs and cannot be used for any other purpose. Contributions to the Fund are initially recorded at cost and the Company recognises its receivable from the Fund at fair value.
In accordance with accounting practice, the Ok Tedi Financial Assurance Fund is considered to be a special purpose entity controlled by the Company and it is consolidated in the Group financial statements. The assets of the Fund at 31 December 2017 comprised a portfolio of investments, valued at balance date at K758 million or US$235 million (2016: K734 million or US$231 million). These investments are accounted for as a financial asset at fair value through profit or loss.
Total contributions by the Company to the Fund and the consolidated Fund equity are summarised as follows:
CONSOLIDATED(CASH, CASH EQUIVALENTS AND AVAILABLE FOR SALE
INVESTMENTS AT FAIR VALUE)
COMPANY
(RECEIVABLE FROM THE FAF)
2017K’000
2016K’000
2017K’000
2016K’000
Opening balance 734,070 689,750 734,070 689,750
Payment - (55) - (55)
Portfolio return - current year 10,497 1,945 10,497 1,945
Exchange variance 13,241 42,430 13,241 42,430
Closing balance 757,808 734,070 757,808 734,070
Without considering the Ok Tedi Financial Assurance Fund and the Restoration and rehabilitation liability, the Company Financial Position would be:
CONSOLIDATED COMPANY
2017K’000
2016K’000
2017K’000
2016K’000
Total Assets 3,940,468 3,357,848 3,904,359 3,314,646
Total Liabilities 592,837 432,222 559,434 390,564

110 OK TEDI MINING LIMITED
NOTES TO AND FORMING PART OF THE FINANCIAL STATEMENTS CONTINUEDFOR THE YEAR ENDED 31 DECEMBER 2017
OK TEDI MINING LIMITED
30. RELATED PARTY TRANSACTIONS(A) OWNERSHIP
Shareholders and their respective shareholdings are as follows:
ORDINARY SHARES % HOLDING
Independent State of Papua New Guinea 169,200,000 87.8
Minerals Resources Ok Tedi No. 2 Limited 23,500,000 12.2
192,700,000 100
(B) TRANSACTIONS DURING THE YEAR
Transactions with the Independent State of Papua New Guinea predominantly comprise the payment of taxes and other statutory payments.
(C) KEY MANAGEMENT COMPENSATION
2017K’000
2016K’000
Salaries and short-term employment benefits 19,503 21,265
Post-employment benefits 2,718 4,109
Total Compensation 22,221 25,374
Key management comprise the Managing Director and General Managers.
31. EMPLOYEE BENEFITSThe number of people employed by the Company at the end of the year was 1,653 (2016: 1,633).
Staff costs comprise of the following:
CONSOLIDATED COMPANY
2017K’000
2016K’000
2017K’000
2016K’000
Salaries and wages 231,315 166,386 222,490 159,270
Contribution to retirement benefit funds 14,809 12,071 14,117 11,359
Other employee on-costs 47,242 35,518 44,384 34,712
Total Staff Costs 293,366 213,975 280,991 205,341
32. INCORPORATION AND REGISTERED OFFICEThe Company is incorporated in Papua New Guinea. The Registered Office and Address for Service of Notices is 1 Dakon Road, Tabubil, Western Province, Papua New Guinea.
33. POST BALANCE DATE EVENTSNo significant events occurred post balance date.

ANNUAL REVIEW 2017 111
GENERAL STANDARD DISCLOSURES GRI DESCRIPTION SECTION/PAGE NUMBER
EXTERNAL ASSURANCE
STRATEGY AND ANALYSIS
G4-1 Statement from the CEO. MD/CEO report - pp 10, Chairmans reports, pp 8
G4-2 Key Impacts, risks and opportunities. Governance - pp 12-17, Materiality - pp 18
ORGANISATIONAL PROFILE
G4-3 Name of Organisation. Company profile - pp 4-5
G4-4 Primary brands, products, and services. Company profile - pp 4-5
G4-5 Location of organisation’s headquarters. Company profile - pp 4-5
G4-6 Number of countries where the organisation operates. Company profile - pp 4-5
G4-7 Nature of ownership and legal form. Governance - pp 12-17
G4-8 Markets served. Business Review - pp 33, Finance - pp 76-80
G4-9 Scale of the organisation. Highlights - pp 2-3, Company Profile - pp 4-5, Business Review - pp 28-35
G4-10 Total number of employees. People - pp 44-49
G4-11Percentage of total employees covered by collective bargaining agreements.
People - pp 46
G4-12Organisation’s supply chain. Describe the organisation’s supply chain.
Business Review - pp 33, Social Responsibility - pp 75
G4-13 Significant changes during the reporting period. MD/CEO - pp 10, Business Review - pp 28-35
G4-14How the precautionary approach or principle is addressed by the organisation.
Governance - pp 16
G4-15Externally developed principles or initiatives to which the organisation subscribes.
Governance - pp 12-17
G4-16Memberships of associations & national or international advocacy organisations.
Governance - pp 12-17
IDENTIFIED MATERIAL ASPECTS AND BOUNDARIES
G4-17Entities included in the organisations consolidated financial statements.
Audited Financial Statements - pp 81-110
G4-18Process for defining the report content and the aspect boundaries.
Company profile - pp 4-5, Materiality - pp 18 YES
G4-19List all material aspects identified in the process for defining report content.
Materiality - pp 18 YES
G4-20For each material aspect, report the aspect boundary within the organisation.
Materiality - pp 18 YES
G4-21For each material aspect, report the aspect boundary outside the organisation.
Materiality - pp 18 YES
G4-22Report the effect of any restatements of information provided in previous reports.
Company profile - pp 5
G4-23Report significant changes from previous reporting periods in the Scope & Aspect Boundaries.
Company profile - pp 4-5
STAKEHOLDER ENGAGEMENT
G4-24 List of stakeholder groups. Materiality - pp 18
G4-25 Basis for identification and selection of stakeholders. Materiality - pp 18
G4-26 Approaches to stakeholder engagement. Materiality - pp 18, Social Responsibility - pp 62-75
G4-27 Key stakeholder topics and concerns. Social Responsibility - pp 62-75
REPORT PROFILE
G4-28 Reporting period. Company profile - pp 5
G4-29 Date of most recent previous report. Company profile - pp 5
G4-30 Reporting cycle. Company profile - pp 5
G4-31 Contact point for the report. Inside cover - pp 116
G4-32 Report the ‘In accordance’ option Company profile - pp 4, 18
G4-33Organisations policy and current practice with regard to seeking external assurance.
Company profile - pp 4, 12
GENERAL STANDARD DISCLOSURES

112 OK TEDI MINING LIMITED
GENERAL STANDARD DISCLOSURES GRI DESCRIPTION SECTION/PAGE NUMBER
EXTERNAL ASSURANCE
GOVERNANCE
G4-34 Governance structure. Governance - pp 12-17
G4-37Processes for consultation between stakeholders and the highest governance body.
Governance - pp 12-17
G4-45 Highest governance body’s role. Governance - pp 12-14
G4-46Report the highest governance body’s role in reviewing the effectiveness of the organisation’s risk.
Governance - pp 14-16
G4-47Report the frequency of the highest governance body’s review of economic environmental and social impacts risks and opportunities.
Governance - pp 14-17
G4-48Highest committee or position that formally reviews and approves the organisation’s sustainability report.
Governance - pp 12-14
G4-49Process for communicating critical concerns to the highest governance body.
Governance - pp 12-17
G4-50Nature and total number of critical concerns that were communicated to the highest government body.
Governance - pp 12, 14
ETHICS AND INTEGRITY
G4-56Mission and values statement, codes of conduct and principles.
Governance - pp 6-7, Mission and Vision pp 12-17
SPECIFIC STANDARD DISCLOSURES INCLUDING MINING AND METALS SUPPLEMENTCATEGORY: ECONOMIC
MATERIAL ASPECT: ECONOMIC PERFORMANCE
G4-DMA Generic Disclosures on Management Approach.Materiality - pp 18, Business Review - pp 28-35, Finance - pp 76-80
YES
G4-EC1 Direct economic value generated and distributed.Business Review - pp 28-35, Social Responsibility - pp 62-75, Finance - pp 76-80
YES
G4-EC4 Financial assistance received from government. Finance - pp 76-80
MATERIAL ASPECT: INDIRECT ECONOMIC IMPACTS
G4-DMA Generic Disclosures on Management Approach. Social Responsibility - pp 62-75 YES
G4-EC7Development and impact of infrastructure investments and services supported.
Social Responsibility - pp 62-75 YES
G4-EC8Significant indirect economic impacts, including the extent of impacts.
Social Responsibility - pp 62-75 YES
CATEGORY: ENVIRONMENTAL
MATERIAL ASPECT: WATER
G4-DMA Generic Disclosures on Management Approach. Environment - pp 50-61
G4-EN8 Total water withdrawal by source. Environment - pp 58-61
G4-EN10 Percentage and total volume of water recycled and reused. Environment - pp 57-58
MATERIAL ASPECT: EFFLUENTS AND WASTE
G4-DMA Generic Disclosures on Management Approach. Environment - pp 50-61 YES
G4-EN23 Total weight of waste by type and disposal method. Environment - pp 58-61
G4-EN24 Total number and volume of significant spills. Environment - pp 60-61
G4-MM3Total amounts of overburden, rock, tailing, and sludges and their associated risks.
Environment - pp 54, 58 YES
MATERIAL ASPECT: COMPLIANCE
G4-DMA Generic Disclosures on Management Approach. Environment - pp 50-61
G4-EN29Monetary value of significant fines and total number of non-monetary sanctions for non-compliance with environmental laws and regulations.
Environment - pp 61
GENERAL STANDARD DISCLOSURES CONTINUED
OK TEDI MINING LIMITED

ANNUAL REVIEW 2017 113
GENERAL STANDARD DISCLOSURES GRI DESCRIPTION SECTION/PAGE NUMBER
EXTERNAL ASSURANCE
MATERIAL ASPECT: OVERALL
G4-DMA Generic Disclosures on Management Approach. Environment - pp 50-61
G4-EN31Total environmental protection expenditures and investments by type.
Environment - pp 50
MATERIAL ASPECT: ENVIRONMENTAL GRIEVANCE MECHANISMS
G4-DMA Generic Disclosures on Management Approach. Environment - pp 50-61
G4-EN34Number of grievances about environmental impacts filed, addressed, and resolved through formal grievance mechanisms.
Environment - pp 60-61
CATEGORY: SOCIAL
SUB-CATEGORY: LABOR PRACTICES AND DECENT WORK
MATERIAL ASPECT: EMPLOYMENT
G4-DMA Generic Disclosures on Management Approach. People - pp 44-49
G4-LA1Total number and rates of new employee hires and employee turnover by age group, gender and region.
People - pp 44-46
MATERIAL ASPECT: OCCUPATIONAL HEALTH AND SAFETY
G4-DMA Generic Disclosures on Management Approach. S&OH - pp 20-27 YES
G4-LA6Type of injury and rates of injury, occupational diseases, lost days, and absenteeism, and total number of work-related fatalities, by region and by gender.
S&OH - pp 20-24 YES
MATERIAL ASPECT: TRAINING AND EDUCATION
G4-DMA Generic Disclosures on Management Approach. People - pp 44-49
G4-LA9Average hours of training per year per employee by gender, and by employee category.
People - pp 23, 44-49
MATERIAL ASPECT: DIVERSITY AND EQUAL OPPORTUNITY
G4-DMA Generic Disclosures on Management Approach. People - pp 44-49
G4-LA12
Composition of governance bodies and breakdown of employees per employee category according to gender, age group, minority group membership, and other indicators of diversity.
People - pp 12, 44
SUB-CATEGORY: SOCIETY
MATERIAL ASPECT: LOCAL COMMUNITIES
G4-DMA Generic Disclosures on Management Approach. Social Responsibility - pp 62-75 YES
G4-SO1Percentage of operations with implemented local community engagement, impact assessments, and development programs.
Social Responsibility - pp 62-75
G4-SO11Number of grievances about impacts on society filed, addressed and resolved through formal grievance mechanisms.
Social Responsibility - pp 64-65 YES
G4-MM6Number & description of significant disputes relating to land use, customary rights.
Social Responsibility - pp 64-65 YES
G4-MM7Extent to which grievance mechanisms were used to resolve disputes relating to land use.
Social Responsibility - pp 65 YES
MATERIAL ASPECT: COMPLIANCE
G4-DMA Generic Disclosures on Management Approach. Governance - pp 12-17
G4-SO8Monetary value of significant fines and total number of non-monetary sanctions for non-compliance with laws and regulations.
Environment - pp 50

114 OK TEDI MINING LIMITED
SCOPE OF WORKMateriality Counts was engaged by Ok Tedi Mining Limited (OTML) to provide independent limited assurance of its 2017 Annual Review (the Report) to the scope of work outlined below. The Report covers OTML’s operations for the 12 months to 31 December 2017, unless stated otherwise in the text. The work was performed using Materiality Counts’ assurance methodology to ISAE 3000, the International Standard on Assurance Engagements Other than Audits or Review of Historical Financial Information. Material issues formed the basis of the scope. Materiality Counts interviewed OTML personnel/contractors, reviewed data collation processes, sighted original records, interrogated spreadsheets and re-performed calculations.
The subject matter for the assurance consisted of the following material issues and related datasets:
• ENVIRONMENT:
- Waste rock and tailings management: amount of riverine disposal, waste rock and tailings, % sulphur in waste rock, % sulphur in tailings, riverine disposal intensity index, average dissolved copper at Nukumba and ANC/MPA in dredged sediments, amount of sand and silt removed from the river.
- Removal of pyrite from tailings to reduce Acid Rock Drainage risk: amount of PCon slurry piped to Bige.
• SAFETY AND OCCUPATIONAL HEALTH: “Nobody Gets Hurt” – employees and contractors: fatalities, hours worked, safety inspections, hazard identifications, job safety observations, training, LTI, LTIFR, TRI, TRIFR, SI and SIFR.
• SOCIAL RESPONSIBILITY: Community development project delivery and funding: OTDF expenditure and capacity building programs.
• GOVERNANCE: Delivery of the strategic plan base case: information on geotechnical stability of the open pit.
The criteria for the assurance consisted of the following three elements:
• Provision of a balanced representation of material issues in the Report.
• Accuracy of the performance data and statements in the Report.
• Validity of the self-declared Global Reporting Initiative (GRI) G4 Core reporting.
MATERIALITY COUNTS’ INDEPENDENCEOTML was responsible for preparing the Report. Materiality Counts was responsible for expressing assurance conclusions regarding the material issues detailed above in line with the scope of work agreed with OTML. During the reporting period, Materiality Counts did not work with OTML on any other consulting work. Materiality Counts is an independent consultancy specialising in Integrated and Sustainability Report development and assurance, materiality determination, strategy development and stakeholder partnerships.
OUR CONCLUSIONMateriality Counts concludes that, based on the scope of work and related limitations, for the specified subject matter, OTML’s 2017 Annual Review provides a balanced representation of the material issues concerning OTML, reports accurate performance information and satisfies the requirements of GRI G4 Core reporting for the 12 months to 31 December 2017. In addition, Materiality Counts provided a management report on the assurance findings to OTML.
KEY OBSERVATIONSBased on the scope of work, and not affecting our assurance conclusion, the following good practice was identified:
• Data owner understanding: of data collation processes, readily providing evidence to support data reported.
• Performance improvement: in 2017, in particular with respect to safety.
• Commitment to the community: comprehensive content on programs with the local community.
Materiality Counts identified the following areas for improvement:
• DATA CONSISTENCY: Improve data consistency relating to the Ok Tedi Development Fund (OTDF).
• DATA COLLATION: Collate environment, social, economic, human resources and governance performance data in one database (such as INX) including calculations, reconciliation and other methodologies used by data owners.
• REPORT COMPLETENESS AND TRANSPARENCY: Report on the collapse and remediation of the West Wall, including changes to the Life of Mine Plan, for complete and transparent reporting on delivery of the strategic plan.
Materiality Counts congratulates OTML on its ongoing commitment to reporting.
Materiality Counts, 2 April 2018, Melbourne, Australia
Materiality Counts has prepared this statement for OTML in accordance with the standard practiced by members of the consulting profession performing this type of service at the same time. No other warranty, express or implied, is given by Materiality Counts as a result of the provision of this statement. To the extent permitted by law, this statement is provided for informational purposes only, without the right to rely, and Materiality Counts will not be liable for any reliance which may be placed on this statement by a third party. This statement may not be used by any third party without Materiality Counts’ express written permission.
MATERIALITY COUNTS INDEPENDENT ASSURANCE REPORT TO OK TEDI MINING LIMITED

ANNUAL REVIEW 2017 115
ABBREVIATIONS
< Less than
% Percent
ADP Asset Protection Department
AGI Algal Growth Inhibition
ANC Acid Neutralising Capacity
APD Asset Protection Department
ARD Acid Rock Drainage
Au Gold
BAC Blood Alcohol Concentrations
BGI Bacterial Growth Inhibition
CEO Chief Executive Officer
CEPA PNG Conservation and Environmental Protection Authority
Cd Cadmium
CGMS Complaints and Grievance Management System
CMCA Community Mine Continuation Agreement
CO2-e Carbon dioxide equivalent
CRD Community Relations Department
Cu Copper
dCu Dissolved copper
Dmt Dry metric tonnes
EBIT Earnings Before Interest and Taxes
EFA Ecosystem Function Analysis
EITI Extractive Industries Transparency Initiative
EL Exploration Lease
ERT Energy Response Teams
FRPG Fly River Provincial Government
g/t Grams per tonne
GDP Gross Domestic Product
GDS Graduate Development Scheme
GHG Greenhouse Gas
GIS Geographical Information System
GRI Global Reporting Initiative
GWh Gigawatt hour
ha Hectare
H2SO4 Hydrogen sulphate
IFRS International Financial Reporting Standards
IMIU International Mining Industry Underwriters
Kg Kilogram
km Kilometre
Km2 Square kilometre
Koz Thousand ounces
Kozpm Thousand ounces per month
KPI Key Performance Indicator
Kt Thousand tonnes
Ktpm Thousand tonnes per month
lb Pound
LFA Landform Function Analysis
LMP Lease for Mining Purpose
LTI Loss Time Injury
LTIFR Lost Time Injury Frequency Rate
m Metre
M Million
Mm3 Million cubic metres
mm Millimetre
m3 Cubic metres
m3/t Cubic metres per tonne
MD Managing Director
ML Megalitres
MOA Memorandum of Agreement
Moz Million ounces
MPA Maximum Potential Acidity
MRA Mineral Resources Authority
MSFHP Middle and South Fly Health Program
Mt Million tonnes
Mtpa Million tonnes per annum
Mtpm Million tonnes per month
MW Megawatt
MWh Megawatt hour
MWTP Mine Waste Tailings Project
na Not applicable
NAF Non-Acid Forming
NAPP Net Acid Production Potential
NFHSDP North Fly Health Services Development Programme
NGO Non-Government Organisation
OHS Occupational Health and Safety
OHS&W Occupational, Health, Safety and Wellness
OTDF Ok Tedi Development Foundation Limited
OTEMA Ok Tedi Environmental Management Act
OTML Ok Tedi Mining Limited
oz Ounces
Pb Lead
PCon Pyrite concentrate
PG Position Grade
PGK Papua New Guinea Kina
PJ Petajoule
PNG Papua New Guinea
PWC PriceWaterhouseCoopers
Q2 2nd Quarter
RPNGC Royal PNG Constabulary
SAG Semi Autogenous Grinding
SAP Systems Applications and Products
SHE Safety, Health and Environment
SHEC Safety, Health, Environment and Community
SIFR Significant Injury Frequency Rate
SOE State Owned Enterprise
SML Special Mining Lease
t Tonnes
TB Tuberculosis
TCS Tax Credit Scheme
TPP Tailings Pilot Plant
TRIFR Total Recordable Injury Frequency Rate
ug/L Microgram per litre
UNVPHR United Nations Voluntary Principles of Human Rights
USD United States Dollar
VPC Village Planning Committee
WHO World Health Organisation
WPPDTF Western Province Peoples Dividend Trust Fund
Zn Zinc

116 OK TEDI MINING LIMITED
CONTACTS AND ACKNOWLEDGEMENTS
OK TEDI MINING LIMITED
BANK OF SOUTH PACIFIC LIMITEDDakon RoadTabubil, Western ProvincePapua New Guinea
ANZ BANKING GROUP LIMITEDANZ Building, Harbour CityPoreporena FreewayPort Moresby, NCDPapua New Guinea
EXTERNAL AUDITOR/ TAX CONSULTANTPricewaterhouseCoopersPwC HausHarbour CityPO Box 484Port Moresby, NCDPapua New Guinea
LAWYERSAllens LinklatersLevel 6Mogoru Moto BuildingChampion ParadePort Moresby, NCDPapua New Guinea
OK TEDI MINING LIMITEDPO Box 1Dakon Road, TabubilWestern ProvincePapua New GuineaPhone: +675 649 3000 or +675 649 3311Fax: +675 649 9199
OK TEDI MINING LIMITEDPO Box 93Hoawaginai Drive, KiungaWestern ProvincePapua New GuineaPhone: +675 649 3724Fax: +675 649 1046
OK TEDI MINING LIMITEDPO Box 506Musgrave StreetPort Moresby, NCDPapua New GuineaPhone: +675 321 3522Fax: +675 320 1308
OK TEDI AUSTRALIA LIMITEDPO Box 535Hamilton Central QLD 4007936 Nudgee RoadNorthgate, QueenslandAustraliaPhone: +61 7 3363 9900Fax: +61 7 3363 9999
OK TEDI DEVELOPMENT FOUNDATION LIMITEDPO Box 21Hoawaginai Drive, KiungaWestern ProvincePapua New GuineaPhone: +675 649 5446Fax: +675 649 1320
OK TEDI POWER LIMITEDPO Box 93Hoawaginai Drive, KiungaWestern ProvincePapua New GuineaPhone: +675 649 3786Fax: +675 649 1320
WWW.OKTEDI.COM
CAUTIONARY STATEMENT REGARDING FORWARD LOOKING INFORMATION Certain information contained in this Annual Review 2017, including any information as to the Company’s strategy, projects, plans, future financial or operating performance and other statements that express management’s expectations or estimates of future performance, constitute “forward-looking statements”. All statements, other than statements of historical fact, are forward-looking statements. The words “aim”, “believe”, “expect”, “will”, “should”, “anticipate”, “contemplate”, “target”, “plan”, “project”, “continue”, “budget”, “may”, “intend”, “estimate” and similar expressions identify forward-looking statements. Forward-looking statements are necessarily based upon a number of estimates and assumptions that, while considered reasonable by management, are inherently subject to significant business, economic and competitive uncertainties and contingencies. The Company cautions the reader that such forward-looking statements involve known and unknown risks, uncertainties and other factors, many of which are beyond the control of the Company, that may cause the actual financial results, performance or achievements of the Company to be materially different from the Company’s estimated future results, performance or achievements expressed or implied by those forward-looking statements and the forward-looking statements are not guarantees of future performance. These risks, uncertainties and other factors include, but are not limited to the impact of global liquidity and credit availability on the timing of cash flows and the values of assets and liabilities based on projected future cash flows, changes in the worldwide price of gold, copper or certain other commodities (such as silver, fuel and electricity), possible variations of ore grade or recovery rates, failure of plant equipment or processes to operate as anticipated, ability to profitably produce and transport the Company’s product, demand for the Company’s product, fluctuations in foreign currency markets, risks arising from holding derivative instruments ability to successfully complete announced transactions and integrate acquired assets, legislative, political or economic developments in the jurisdictions in which the Company carries on business including increases in taxes, operating or technical difficulties in connection with mining or development activities, employee relations, availability and costs associated with mining inputs and labour, the speculative nature of exploration and development, including the risks of obtaining necessary licenses and permits and diminishing quantities or grades of reserves, changes in costs and estimates associated with the Company’s projects and the risks involved in the exploration, development and mining business. There can be no assurance that forward-looking statements and information will prove to be accurate, as actual results and future events could differ materially from those anticipated in such statements. Accordingly, readers are cautioned not to place undue reliance on forward-looking statements and information due to inherent uncertainty. All forward looking statements and information made herein are qualified by this cautionary statement and speak only as at the date of issue of this Annual Review 2017. The Company disclaims any intention or obligation to publicly update, revise or review any forward-looking statements whether as a result of new information, future events or otherwise, except as required by applicable laws or regulations. OPPOSITE: Haul trucks in the open pit.
This 2017 Annual Review has been printed on environmentally friendly paper stocks.
The cover and text have been printed on HannoArt, which is FSC certified. Containing fibre sourced only from responsible forestry practices, this sheet is ISO 14001 EMS accredited and is totally chlorine free.
ACKNOWLEDGEMENTSProduction and Publishing: nous.com.au Report Management: Sustainable Mining Strategies Pty Ltd
Images on pages: Cover, 6, 9, 15, 25, 27, 31, 35, 45, 47, 51, 53, 63, 67, 69, 73, 79, 117 – OTML Media
Images on pages: 2, 5, 11, 17, 19, 29, 49, 55, 57, 59 – Frank Roe
Images on pages: 13, 39, 43 – Sustainable Mining Strategies


WWW.OKTEDI.COM
OK TEDI MINING LIM
ITED ANNUAL REVIEW 2017