Oil and Gas Industry : A Nontechnical Guide
331
-
Upload
khangminh22 -
Category
Documents
-
view
3 -
download
0
Transcript of Oil and Gas Industry : A Nontechnical Guide

JOSEPH F. HILYARD
THE
OIL & GAS INDUSTRY A NONTECHNICAL
GUIDE

DisclaimerThe recommendations, advice, descriptions, and methods in this book are presented solely for educational purposes. The author and publisher assume no liability whatsoever for any loss or damage that results from the use of any of the material in this book. Use of the material in this book is solely at the risk of the user.
Copyright© 2012 by PennWell Corporation 1421 South Sheridan Road Tulsa, Oklahoma 74112-6600 USA
800.752.9764 +1.918.831.9421 [email protected] www.pennwellbooks.com www.pennwell.com
Director: Mary McGee Managing Editor: Stephen Hill Production Manager: Sheila Brock Production Editor: Tony Quinn Book Designer: Susan E. Ormston Cover Designer: Charles Thomas
Library of Congress Cataloging-in-Publication Data
Hilyard, Joseph. The oil and gas industry : a nontechnical guide / Joseph F. Hilyard. p. cm. Includes bibliographical references and index. ISBN 978-1-59370-254-0 1. Petroleum industry and trade. 2. Petroleum engineering. I. Title. HD9560.5.H5125 2012 338.2’7282--dc23
2012007391
All rights reserved. No part of this book may be reproduced, stored in a retrieval system, or transcribed in any form or by any means, electronic or mechanical, including and recording, without the prior
written permission of the publisher.
Printed in the United States of America 1 2 3 4 5 16 15 14 13 12

To my two sons, Jonathan and Aaron, whom I hereby direct to use wisely their share
of the petroleum products and natural gas brought to market in the 21st century.

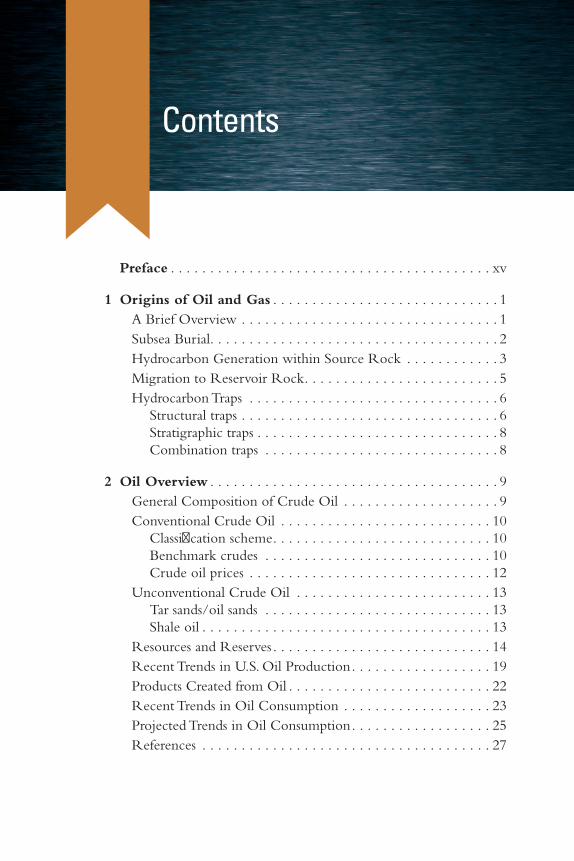
Contents
Preface . . . . . . . . . . . . . . . . . . . . . . . . . . . . . . . . . . . . . . . . . xv
1 Origins of Oil and Gas . . . . . . . . . . . . . . . . . . . . . . . . . . . . . 1A Brief Overview . . . . . . . . . . . . . . . . . . . . . . . . . . . . . . . . . 1Subsea Burial. . . . . . . . . . . . . . . . . . . . . . . . . . . . . . . . . . . . . 2Hydrocarbon Generation within Source Rock . . . . . . . . . . . . 3Migration to Reservoir Rock. . . . . . . . . . . . . . . . . . . . . . . . . 5Hydrocarbon Traps . . . . . . . . . . . . . . . . . . . . . . . . . . . . . . . . 6
Structural traps . . . . . . . . . . . . . . . . . . . . . . . . . . . . . . . . . 6Stratigraphic traps . . . . . . . . . . . . . . . . . . . . . . . . . . . . . . . 8Combination traps . . . . . . . . . . . . . . . . . . . . . . . . . . . . . . 8
2 Oil Overview . . . . . . . . . . . . . . . . . . . . . . . . . . . . . . . . . . . . . 9General Composition of Crude Oil . . . . . . . . . . . . . . . . . . . . 9Conventional Crude Oil . . . . . . . . . . . . . . . . . . . . . . . . . . . 10
Classification scheme. . . . . . . . . . . . . . . . . . . . . . . . . . . . 10Benchmark crudes . . . . . . . . . . . . . . . . . . . . . . . . . . . . . 10Crude oil prices . . . . . . . . . . . . . . . . . . . . . . . . . . . . . . . 12
Unconventional Crude Oil . . . . . . . . . . . . . . . . . . . . . . . . . 13Tar sands/oil sands . . . . . . . . . . . . . . . . . . . . . . . . . . . . . 13Shale oil . . . . . . . . . . . . . . . . . . . . . . . . . . . . . . . . . . . . . 13
Resources and Reserves . . . . . . . . . . . . . . . . . . . . . . . . . . . . 14Recent Trends in U.S. Oil Production. . . . . . . . . . . . . . . . . . 19Products Created from Oil . . . . . . . . . . . . . . . . . . . . . . . . . . 22Recent Trends in Oil Consumption . . . . . . . . . . . . . . . . . . . 23Projected Trends in Oil Consumption. . . . . . . . . . . . . . . . . . 25References . . . . . . . . . . . . . . . . . . . . . . . . . . . . . . . . . . . . . 27

The Oil & Gas Industry: A Nontechnical Guideviii
3 Natural Gas Overview. . . . . . . . . . . . . . . . . . . . . . . . . . . . . 29Formation and Composition of Natural Gas . . . . . . . . . . . . . 29Conventional Natural Gas . . . . . . . . . . . . . . . . . . . . . . . . . . 31Unconventional Natural Gas . . . . . . . . . . . . . . . . . . . . . . . . 32
Deep gas. . . . . . . . . . . . . . . . . . . . . . . . . . . . . . . . . . . . . 33Tight gas . . . . . . . . . . . . . . . . . . . . . . . . . . . . . . . . . . . . 33Shale gas. . . . . . . . . . . . . . . . . . . . . . . . . . . . . . . . . . . . . 33Coal-bed methane . . . . . . . . . . . . . . . . . . . . . . . . . . . . . 34Geopressurized gas . . . . . . . . . . . . . . . . . . . . . . . . . . . . . 34Methane hydrate . . . . . . . . . . . . . . . . . . . . . . . . . . . . . . . 35
Resources and Reserves . . . . . . . . . . . . . . . . . . . . . . . . . . . . 36Recent Trends in Gas Production . . . . . . . . . . . . . . . . . . . . . 41Projected Trends in Gas Production . . . . . . . . . . . . . . . . . . . 42Recent and Projected Trends in Gas Consumption . . . . . . . . 44References . . . . . . . . . . . . . . . . . . . . . . . . . . . . . . . . . . . . . 46
4 Searching for and Evaluating Oil and Gas . . . . . . . . . . . . 49Obtaining Rights to Explore for and Produce Oil and Gas. . . 49
Production-sharing agreement . . . . . . . . . . . . . . . . . . . . . 50Service contract . . . . . . . . . . . . . . . . . . . . . . . . . . . . . . . 50Production contract . . . . . . . . . . . . . . . . . . . . . . . . . . . . 51
Exploration Activities. . . . . . . . . . . . . . . . . . . . . . . . . . . . . . 51Geologic methods. . . . . . . . . . . . . . . . . . . . . . . . . . . . . . 52Geochemical methods . . . . . . . . . . . . . . . . . . . . . . . . . . . 52Geophysical methods. . . . . . . . . . . . . . . . . . . . . . . . . . . . 52
Survey Methods . . . . . . . . . . . . . . . . . . . . . . . . . . . . . . . . . 52Gravimetric survey . . . . . . . . . . . . . . . . . . . . . . . . . . . . . 52Magnetic survey . . . . . . . . . . . . . . . . . . . . . . . . . . . . . . . 52Seismic survey . . . . . . . . . . . . . . . . . . . . . . . . . . . . . . . . 53
Exploratory Drilling . . . . . . . . . . . . . . . . . . . . . . . . . . . . . . 57Evaluation Methods and Tools . . . . . . . . . . . . . . . . . . . . . . . 59
Well logging . . . . . . . . . . . . . . . . . . . . . . . . . . . . . . . . . . 59Real-time methods . . . . . . . . . . . . . . . . . . . . . . . . . . . . . 63Other evaluation methods . . . . . . . . . . . . . . . . . . . . . . . . 63
Making the Decision to Begin Production. . . . . . . . . . . . . . . . . . . . . . . . . . . . . . 64
Development economics . . . . . . . . . . . . . . . . . . . . . . . . . 64Technical and operational factors . . . . . . . . . . . . . . . . . . . 65
References . . . . . . . . . . . . . . . . . . . . . . . . . . . . . . . . . . . . . 66
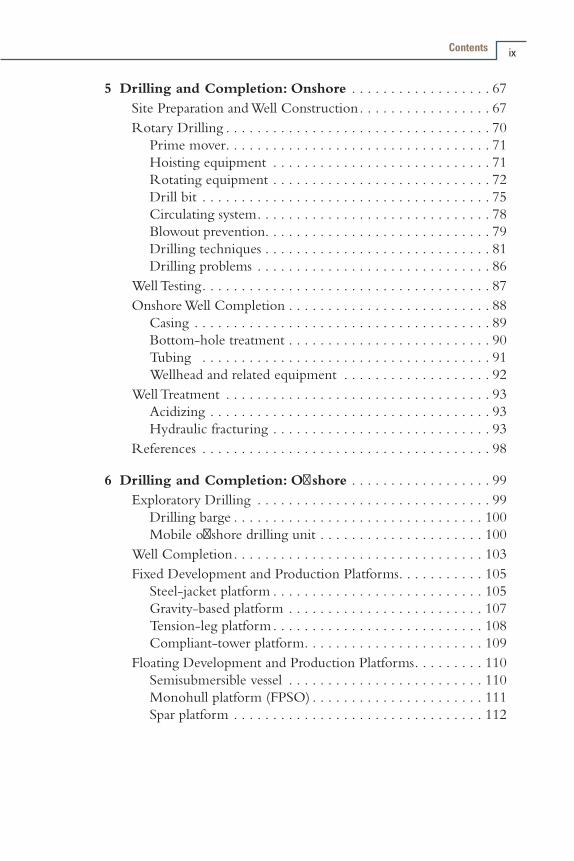
Contents ix
5 Drilling and Completion: Onshore . . . . . . . . . . . . . . . . . . 67Site Preparation and Well Construction. . . . . . . . . . . . . . . . . 67Rotary Drilling . . . . . . . . . . . . . . . . . . . . . . . . . . . . . . . . . . 70
Prime mover. . . . . . . . . . . . . . . . . . . . . . . . . . . . . . . . . . 71Hoisting equipment . . . . . . . . . . . . . . . . . . . . . . . . . . . . 71Rotating equipment . . . . . . . . . . . . . . . . . . . . . . . . . . . . 72Drill bit . . . . . . . . . . . . . . . . . . . . . . . . . . . . . . . . . . . . . 75Circulating system. . . . . . . . . . . . . . . . . . . . . . . . . . . . . . 78Blowout prevention. . . . . . . . . . . . . . . . . . . . . . . . . . . . . 79Drilling techniques . . . . . . . . . . . . . . . . . . . . . . . . . . . . . 81Drilling problems . . . . . . . . . . . . . . . . . . . . . . . . . . . . . . 86
Well Testing. . . . . . . . . . . . . . . . . . . . . . . . . . . . . . . . . . . . . 87Onshore Well Completion . . . . . . . . . . . . . . . . . . . . . . . . . . 88
Casing . . . . . . . . . . . . . . . . . . . . . . . . . . . . . . . . . . . . . . 89Bottom-hole treatment . . . . . . . . . . . . . . . . . . . . . . . . . . 90Tubing . . . . . . . . . . . . . . . . . . . . . . . . . . . . . . . . . . . . . 91Wellhead and related equipment . . . . . . . . . . . . . . . . . . . 92
Well Treatment . . . . . . . . . . . . . . . . . . . . . . . . . . . . . . . . . . 93Acidizing . . . . . . . . . . . . . . . . . . . . . . . . . . . . . . . . . . . . 93Hydraulic fracturing . . . . . . . . . . . . . . . . . . . . . . . . . . . . 93
References . . . . . . . . . . . . . . . . . . . . . . . . . . . . . . . . . . . . . 98
6 Drilling and Completion: Offshore . . . . . . . . . . . . . . . . . . 99Exploratory Drilling . . . . . . . . . . . . . . . . . . . . . . . . . . . . . . 99
Drilling barge . . . . . . . . . . . . . . . . . . . . . . . . . . . . . . . . 100Mobile offshore drilling unit . . . . . . . . . . . . . . . . . . . . . 100
Well Completion. . . . . . . . . . . . . . . . . . . . . . . . . . . . . . . . 103Fixed Development and Production Platforms. . . . . . . . . . . 105
Steel-jacket platform . . . . . . . . . . . . . . . . . . . . . . . . . . . 105Gravity-based platform . . . . . . . . . . . . . . . . . . . . . . . . . 107Tension-leg platform . . . . . . . . . . . . . . . . . . . . . . . . . . . 108Compliant-tower platform. . . . . . . . . . . . . . . . . . . . . . . 109
Floating Development and Production Platforms. . . . . . . . . 110Semisubmersible vessel . . . . . . . . . . . . . . . . . . . . . . . . . 110Monohull platform (FPSO) . . . . . . . . . . . . . . . . . . . . . . 111Spar platform . . . . . . . . . . . . . . . . . . . . . . . . . . . . . . . . 112

The Oil & Gas Industry: A Nontechnical Guidex
7 Managing Oil and Gas Production . . . . . . . . . . . . . . . . . 115Start of Production . . . . . . . . . . . . . . . . . . . . . . . . . . . . . . 115Artificial Lift . . . . . . . . . . . . . . . . . . . . . . . . . . . . . . . . . . . 116Workover of a Well . . . . . . . . . . . . . . . . . . . . . . . . . . . . . . 117
Workover actions . . . . . . . . . . . . . . . . . . . . . . . . . . . . . 118Sidetrack well . . . . . . . . . . . . . . . . . . . . . . . . . . . . . . . . 118Recompletion . . . . . . . . . . . . . . . . . . . . . . . . . . . . . . . 118Workover of offshore wells . . . . . . . . . . . . . . . . . . . . . . 119
Improved Oil Recovery . . . . . . . . . . . . . . . . . . . . . . . . . . . 119Waterflood . . . . . . . . . . . . . . . . . . . . . . . . . . . . . . . . . . 120Gas injection. . . . . . . . . . . . . . . . . . . . . . . . . . . . . . . . . 121Chemical flood . . . . . . . . . . . . . . . . . . . . . . . . . . . . . . . 121Thermal recovery . . . . . . . . . . . . . . . . . . . . . . . . . . . . . 121
Gas Production Management—an Overview . . . . . . . . . . . 123Initial Gas Treatment . . . . . . . . . . . . . . . . . . . . . . . . . . . . . 124Gas Processing Operations . . . . . . . . . . . . . . . . . . . . . . . . . 125
Removal of carbon dioxide and hydrogen sulfide . . . . . . 126Removal of water vapor . . . . . . . . . . . . . . . . . . . . . . . . 126Removal of heavier hydrocarbon gases . . . . . . . . . . . . . . 126Nitrogen removal . . . . . . . . . . . . . . . . . . . . . . . . . . . . . 127Helium removal . . . . . . . . . . . . . . . . . . . . . . . . . . . . . . 127
Other Environmental Issues in Gas Production . . . . . . . . . . 127When Production Ends . . . . . . . . . . . . . . . . . . . . . . . . . . . 128
8 Transporting Oil . . . . . . . . . . . . . . . . . . . . . . . . . . . . . . . . 131Preliminary Crude Processing . . . . . . . . . . . . . . . . . . . . . . 132Pipeline Networks . . . . . . . . . . . . . . . . . . . . . . . . . . . . . . . 133
Overview . . . . . . . . . . . . . . . . . . . . . . . . . . . . . . . . . . . 133Pipe . . . . . . . . . . . . . . . . . . . . . . . . . . . . . . . . . . . . . . . 135Other components . . . . . . . . . . . . . . . . . . . . . . . . . . . . 139Inspection and maintenance. . . . . . . . . . . . . . . . . . . . . . 140
Offshore Pipelines . . . . . . . . . . . . . . . . . . . . . . . . . . . . . . . 144From wellhead to platform . . . . . . . . . . . . . . . . . . . . . . 144From platform to shore . . . . . . . . . . . . . . . . . . . . . . . . . 146
Oil Tanker Ships . . . . . . . . . . . . . . . . . . . . . . . . . . . . . . . . 149Railcars and Tank Trucks . . . . . . . . . . . . . . . . . . . . . . . . . . 151Oil Storage . . . . . . . . . . . . . . . . . . . . . . . . . . . . . . . . . . . . 152SPRs . . . . . . . . . . . . . . . . . . . . . . . . . . . . . . . . . . . . . . . . 154References . . . . . . . . . . . . . . . . . . . . . . . . . . . . . . . . . . . . 155
Contents xi
9 Transporting Natural Gas by Pipeline . . . . . . . . . . . . . . . 157Overview of Gas Transportation . . . . . . . . . . . . . . . . . . . . . 157Transmission Systems . . . . . . . . . . . . . . . . . . . . . . . . . . . . . 160
U.S. gas transmission . . . . . . . . . . . . . . . . . . . . . . . . . . . 160Basic pipeline equipment. . . . . . . . . . . . . . . . . . . . . . . . 163Gas storage . . . . . . . . . . . . . . . . . . . . . . . . . . . . . . . . . . 168Inspection and maintenance. . . . . . . . . . . . . . . . . . . . . . 170Global gas transmission . . . . . . . . . . . . . . . . . . . . . . . . . 171
Distribution Systems . . . . . . . . . . . . . . . . . . . . . . . . . . . . . 173City gate station . . . . . . . . . . . . . . . . . . . . . . . . . . . . . . 173Piping network . . . . . . . . . . . . . . . . . . . . . . . . . . . . . . 173Piping materials . . . . . . . . . . . . . . . . . . . . . . . . . . . . . . 175Minimizing gas leakage . . . . . . . . . . . . . . . . . . . . . . . . . 176Controlling corrosion . . . . . . . . . . . . . . . . . . . . . . . . . . 177Peak-shaving. . . . . . . . . . . . . . . . . . . . . . . . . . . . . . . . . 177
10 Transporting Natural Gas as LNG . . . . . . . . . . . . . . . . . . 179Background. . . . . . . . . . . . . . . . . . . . . . . . . . . . . . . . . . . . 179The Liquefaction Process . . . . . . . . . . . . . . . . . . . . . . . . . . 182LNG Storage Tanks . . . . . . . . . . . . . . . . . . . . . . . . . . . . . . 183Offshore Liquefaction Concepts . . . . . . . . . . . . . . . . . . . . . 185LNG Tanker Ships . . . . . . . . . . . . . . . . . . . . . . . . . . . . . . . 187Onshore Regasification Process . . . . . . . . . . . . . . . . . . . . . 190Offshore Regasification Process . . . . . . . . . . . . . . . . . . . . . 192LNG Safety. . . . . . . . . . . . . . . . . . . . . . . . . . . . . . . . . . . . 192
11 Converting Oil into Products. . . . . . . . . . . . . . . . . . . . . . 195Overview of Refining . . . . . . . . . . . . . . . . . . . . . . . . . . . . 195Separation/Distillation . . . . . . . . . . . . . . . . . . . . . . . . . . . . 197Conversion . . . . . . . . . . . . . . . . . . . . . . . . . . . . . . . . . . . . 202
Cracking . . . . . . . . . . . . . . . . . . . . . . . . . . . . . . . . . . . 202Combination . . . . . . . . . . . . . . . . . . . . . . . . . . . . . . . . 206Modification. . . . . . . . . . . . . . . . . . . . . . . . . . . . . . . . . 207
Enhancement . . . . . . . . . . . . . . . . . . . . . . . . . . . . . . . . . . 208Hydroprocessing . . . . . . . . . . . . . . . . . . . . . . . . . . . . . . 209Amine treating . . . . . . . . . . . . . . . . . . . . . . . . . . . . . . . 209Solvent extraction . . . . . . . . . . . . . . . . . . . . . . . . . . . . . 209Sweetening. . . . . . . . . . . . . . . . . . . . . . . . . . . . . . . . . . 209

The Oil & Gas Industry: A Nontechnical Guidexii
Blending/Finishing . . . . . . . . . . . . . . . . . . . . . . . . . . . . . . 210Gasoline blendstocks . . . . . . . . . . . . . . . . . . . . . . . . . . . 210Gasoline additives . . . . . . . . . . . . . . . . . . . . . . . . . . . . . 210
Types of Refineries . . . . . . . . . . . . . . . . . . . . . . . . . . . . . . 211Classification by complexity. . . . . . . . . . . . . . . . . . . . . . 211Classification by capacity . . . . . . . . . . . . . . . . . . . . . . . . 212
Refinery Maintenance Schedules . . . . . . . . . . . . . . . . . . . . 212Product Pipelines. . . . . . . . . . . . . . . . . . . . . . . . . . . . . . . . 213
Finished petroleum products . . . . . . . . . . . . . . . . . . . . . 213Petrochemicals and LPGs. . . . . . . . . . . . . . . . . . . . . . . . 214
Standards for Refined Products. . . . . . . . . . . . . . . . . . . . . . 217Petrochemicals Production . . . . . . . . . . . . . . . . . . . . . . . . . 218
12 Converting Natural Gas into Products . . . . . . . . . . . . . . 221Direct Gas Use as a Fuel . . . . . . . . . . . . . . . . . . . . . . . . . . 221Gas as a Petrochemical Feedstock . . . . . . . . . . . . . . . . . . . . 222
Ethane . . . . . . . . . . . . . . . . . . . . . . . . . . . . . . . . . . . . . 222Propane and butane. . . . . . . . . . . . . . . . . . . . . . . . . . . . 222
Gas-to-Liquids Technology. . . . . . . . . . . . . . . . . . . . . . . . . 223Other Products Derived from Natural Gas . . . . . . . . . . . . . 224
13 Petroleum Industry Structure . . . . . . . . . . . . . . . . . . . . . 225Major Oil and Gas Producers . . . . . . . . . . . . . . . . . . . . . . . 225
The Seven Sisters, supermajors, and international oil companies. . . . . . . . . . . . . . . . . . . . . . . . . . . . . . . 226
National oil companies . . . . . . . . . . . . . . . . . . . . . . . . . 228Hybrid companies. . . . . . . . . . . . . . . . . . . . . . . . . . . . . 229
Independent Producers . . . . . . . . . . . . . . . . . . . . . . . . . . . 230Service Companies . . . . . . . . . . . . . . . . . . . . . . . . . . . . . . 232IOC-NOC Interactions . . . . . . . . . . . . . . . . . . . . . . . . . . . 233OPEC . . . . . . . . . . . . . . . . . . . . . . . . . . . . . . . . . . . . . . . 235
OPEC history. . . . . . . . . . . . . . . . . . . . . . . . . . . . . . . . 236OPEC membership. . . . . . . . . . . . . . . . . . . . . . . . . . . . 236OPEC outlook . . . . . . . . . . . . . . . . . . . . . . . . . . . . . . . 237
Refiners . . . . . . . . . . . . . . . . . . . . . . . . . . . . . . . . . . . . . . 240Independent refiners . . . . . . . . . . . . . . . . . . . . . . . . . . . 242World refining capacity . . . . . . . . . . . . . . . . . . . . . . . . . 243Largest refiners and refineries. . . . . . . . . . . . . . . . . . . . . 245Refinery projects planned for 2010 and beyond . . . . . . . 250
References . . . . . . . . . . . . . . . . . . . . . . . . . . . . . . . . . . . . 251

Contents xiii
14 Petroleum Trading. . . . . . . . . . . . . . . . . . . . . . . . . . . . . . . 253Oil Trading . . . . . . . . . . . . . . . . . . . . . . . . . . . . . . . . . . . . 254
Physical versus paper trading . . . . . . . . . . . . . . . . . . . . . 254Pricing—a historical perspective . . . . . . . . . . . . . . . . . . 255Oil pricing today . . . . . . . . . . . . . . . . . . . . . . . . . . . . . 256Pricing along the delivery chain. . . . . . . . . . . . . . . . . . . 258Posted prices. . . . . . . . . . . . . . . . . . . . . . . . . . . . . . . . . 259Hubs . . . . . . . . . . . . . . . . . . . . . . . . . . . . . . . . . . . . . . 259Transportation services . . . . . . . . . . . . . . . . . . . . . . . . . 260Sale and movement of refined products . . . . . . . . . . . . . 262Petroleum product marketers . . . . . . . . . . . . . . . . . . . . . 263Gasoline distribution and marketing . . . . . . . . . . . . . . . . 264
Natural Gas Trading . . . . . . . . . . . . . . . . . . . . . . . . . . . . . . 264U.S. historical perspective . . . . . . . . . . . . . . . . . . . . . . . 264Physical delivery of natural gas . . . . . . . . . . . . . . . . . . . . 265Hubs . . . . . . . . . . . . . . . . . . . . . . . . . . . . . . . . . . . . . . 266Financial gas market . . . . . . . . . . . . . . . . . . . . . . . . . . . 267LDC role in gas marketing. . . . . . . . . . . . . . . . . . . . . . . 267LNG trading. . . . . . . . . . . . . . . . . . . . . . . . . . . . . . . . . 268
15 Emerging Challenges for the Petroleum Industry . . . . . 271Continued Technology Development . . . . . . . . . . . . . . . . . 273Competition from Nonfossil Energy Sources. . . . . . . . . . . . 273Climate-Change Policy . . . . . . . . . . . . . . . . . . . . . . . . . . . 274Industry Structure . . . . . . . . . . . . . . . . . . . . . . . . . . . . . . . 275Industry Operations. . . . . . . . . . . . . . . . . . . . . . . . . . . . . . 275
Workforce demographics . . . . . . . . . . . . . . . . . . . . . . . . 275Role of natural gas . . . . . . . . . . . . . . . . . . . . . . . . . . . . 276Crude oil quality. . . . . . . . . . . . . . . . . . . . . . . . . . . . . . 276Environmental and safety compliance . . . . . . . . . . . . . . . 276Security . . . . . . . . . . . . . . . . . . . . . . . . . . . . . . . . . . . . 277
The Chinese Challenge . . . . . . . . . . . . . . . . . . . . . . . . . . . 278Other International Interactions . . . . . . . . . . . . . . . . . . . . . 278Peak Oil Production . . . . . . . . . . . . . . . . . . . . . . . . . . . . . 279Final Thoughts . . . . . . . . . . . . . . . . . . . . . . . . . . . . . . . . . 280References . . . . . . . . . . . . . . . . . . . . . . . . . . . . . . . . . . . . 280
The Oil & Gas Industry: A Nontechnical Guidexiv
Appendix A: Terms, Abbreviations, and Acronyms . . . . . 281
Appendix B: Further Reading . . . . . . . . . . . . . . . . . . . . . 287Technical Books and Professional Articles . . . . . . . . . . . . . . 287General Interest . . . . . . . . . . . . . . . . . . . . . . . . . . . . . . . . . 289Other Information Sources . . . . . . . . . . . . . . . . . . . . . . . . 290
Appendix C: Organizations, Agencies, and Professional Societies . . . . . . . . . . . . . . . . . . . . . . . . . 291
Trade Associations and Professional Societies . . . . . . . . . . . . 291U.S. Government Agencies . . . . . . . . . . . . . . . . . . . . . . . . . 292International Energy Organizations . . . . . . . . . . . . . . . . . . 293
Index . . . . . . . . . . . . . . . . . . . . . . . . . . . . . . . . . . . . . . . . . 295
Preface
This book provides a nontechnical overview of what is commonly referred to as the petroleum industry, focusing on oil and natural gas, as well as their derivative products. My goal has been to create an engaging and accessible introduction to this critically important global industry to help those without a technical background who are either new to the industry or simply interested in how it operates.
This book guides the reader through the series of typical decisions made, actions taken, and equipment and processes used to bring petroleum products and natural gas to world markets. I have tried to present information about these various activities in broad but also clear and accurate terms. However, I have not attempted to describe every operational facet or technical aspect; this level of detail is available from a variety of other sources, a number of which are listed in appendix B.
The word “petroleum” is based the Latin petrus (rock) and oleum (oil). Petroleum can range in color from nearly colorless to jet-black. It can be thinner than water or thicker than molasses, and its density can vary from that of a light gas to that of a heavy asphalt. For the purposes of this book, the term petroleum is used to collectively describe oil and natural gas, whereas the petroleum industry includes the various entities that perform the range of activities noted in the bulleted list below, as well as those that support those activities.
Chapter 1 describes the geologic processes and structures related to the formation of both crude oil and natural gas within the earth, as well as its movement (migration) that results in the creation of commercially exploitable accumulations. Chapters 2 and 3 then focus individually on oil and gas, respectively, providing basic information about their composition, the location of major oil and gas resources around the world, the range of products created from oil and gas, and current patterns of, as well as future projections for, production and use.
The Oil & Gas Industry: A Nontechnical Guidexvi
Chapters 4 through 12 address petroleum industry operations:• Searching for and evaluating petroleum resources
•Drilling and completing wells to tap promising formations (onshore and offshore)
•Managing oil and gas production
•Transporting oil
•Transporting natural gas in both gaseous form (by pipeline) and in liquefied form
•Converting oil and gas into various products
Chapters 13 through 15 address several business-related issues: the structure of the industry, the dynamics of petroleum trading, and the challenges facing the industry. Finally, three appendices provide a listing of terms, abbreviations, and acronyms used in the book; suggested further reading; and organizations that can provide further information on many of the topics covered in this book.
I hope this book helps the reader understand the petroleum industry and makes clear the ingenuity and skill of its millions of professionals worldwide.

Origins of Oil and Gas
A discussion of the operations of the petroleum industry—including production and the extensive slate of useful products—must begin with a review of the origins of the raw material comprising the foundation of the industry’s value chain. In the case of petroleum, the origins of crude oil and natural gas can be traced back millions—in fact, tens of millions—of years ago, to the seabed of ancient oceans.
A Brief OverviewFor hydrocarbons to accumulate, three conditions must be met. First,
a sedimentary basin must be created—the result of movement of the earth’s crust, which creates large depressions into which sediments from surrounding elevated areas are transported over time.
Second, the sediments laid down in such basins must contain a high level of organic material. This organic-rich matter becomes part of the sedimentary material to create what is called source rock.
Third, over millions of years, the effects of elevated temperature and pressure must be sufficient to convert the material in the source rock into oil and gas. Maturity describes the degree to which petroleum generation has occurred. Heavy, thick oil is considered immature, having been generated at relatively low temperature. Mature oil—lighter or less viscous—forms at higher temperature.
In an important subsequent process called migration, the hydrocarbons must move out of the source rock through cracks, faults, and fissures and into porous and permeable reservoir rock. Finally, that reservoir rock must be configured (as a result of prior geologic activity) in a
1

The Oil & Gas Industry: A Nontechnical Guide2
way that immobilizes the hydrocarbons within structures called traps, allowing oil and gas to accumulate in sufficient volumes to warrant commercial exploitation.
Subsea BurialTo begin a more detailed look at the pathway to petroleum, it can
be said that petroleum geochemists and geologists widely agree that crude oil is derived from ancient organic matter—ranging from single-celled plankton to more-complex aquatic plants (e.g., algae) and even invertebrates and fish—laid down and then buried and preserved in sediments eons ago at the bottom of ancient oceans. Organic material carried into the oceans by rivers also is deposited and buried in the same manner.
The buried organic matter undergoes a transformation over millions of years. Initial microbial action (in the presence of oxygen dissolved in seawater) returns part of the sediment’s carbon to the atmosphere as carbon dioxide. However, as the sediment layer gets thicker, subsequent bacterial processes at work in deep seabed mud (with little or no oxygen present in the mud itself or the water immediately above it) convert the remaining organic matter into a waxy material called kerogen.
Kerogen is a complex mixture of large organic molecules whose appearance and characteristics depend on the kind and concentration of materials—such as algae, plankton, bacteria, pollen, resin, and cellulose—of which it is composed. It is from kerogen that oil and gas are generated.
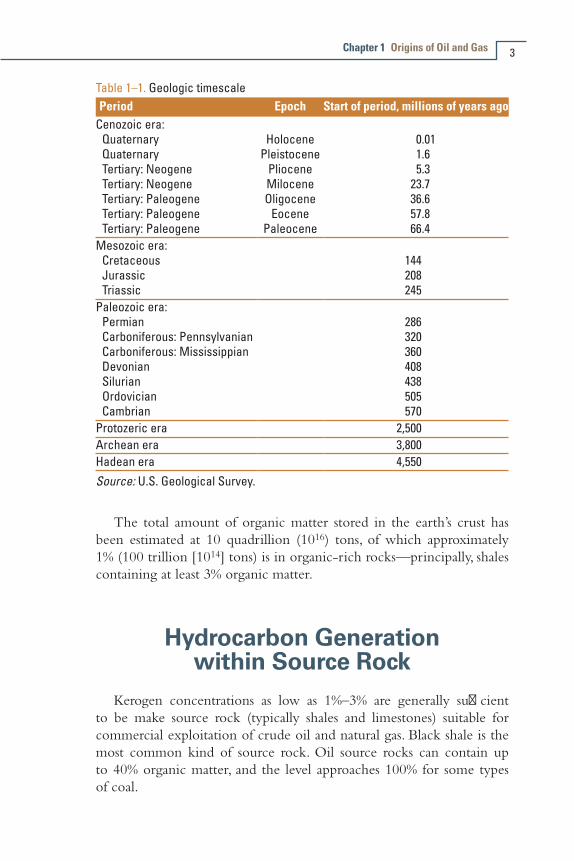
Organic matter was not laid down evenly through the various geologic eras (table 1–1). Accumulations were clearly concentrated in a limited number of intervals whose duration was determined by movements in the earth’s crust and by climatic changes. Different periods contributed the following approximate shares of the world’s kerogens:
•Middle Cretaceous (about 100 million years ago): nearly 30%
•Late Jurassic (150 million years ago): 25%
•Late Devonian (350 million years ago): less than 10%
• Silurian (420 million years ago):less than 10%
•Early Cambrian (550 million years ago): less than 10%
Chapter 1 Origins of Oil and Gas 3
Table 1–1. Geologic timescalePeriod Epoch Start of period, millions of years ago
Cenozoic era: Quaternary Holocene 0.01 Quaternary Pleistocene 1.6 Tertiary: Neogene Pliocene 5.3 Tertiary: Neogene Milocene 23.7 Tertiary: Paleogene Oligocene 36.6 Tertiary: Paleogene Eocene 57.8 Tertiary: Paleogene Paleocene 66.4Mesozoic era: Cretaceous 144 Jurassic 208 Triassic 245Paleozoic era: Permian 286 Carboniferous: Pennsylvanian 320 Carboniferous: Mississippian 360 Devonian 408 Silurian 438 Ordovician 505 Cambrian 570Protozeric era 2,500Archean era 3,800Hadean era 4,550Source: U.S. Geological Survey.
The total amount of organic matter stored in the earth’s crust has been estimated at 10 quadrillion (1016) tons, of which approximately 1% (100 trillion [1014] tons) is in organic-rich rocks—principally, shales containing at least 3% organic matter.
Hydrocarbon Generation within Source Rock
Kerogen concentrations as low as 1%–3% are generally sufficient to be make source rock (typically shales and limestones) suitable for commercial exploitation of crude oil and natural gas. Black shale is the most common kind of source rock. Oil source rocks can contain up to 40% organic matter, and the level approaches 100% for some types of coal.

The Oil & Gas Industry: A Nontechnical Guide4
Temperature plays a key role in the generation of oil and gas from kerogen. As the organic-rich source rock undergoes progressive burial (i.e., as additional sediments are laid down above it), the rock becomes hotter. This phenomenon reflects what is called the geothermal gradient of the earth. From the surface to a depth of about 60 meters (200 feet), ground temperature a relatively constant 11°C (55°F). From that point down to about 122 meters (400 feet), the gradient is variable, owing to atmospheric influences and circulating groundwater.
Below 400 feet, temperature rises steadily with depth, though the rate of increase varies with location. For tectonically stable shield areas and sedimentary basins, a typical figure is 1.5–2°C per 30.5 meters (1.5–2°F per 100 feet).
The term oil window is used to describe the range of temperature or depth within which most of oil’s complex constituents are produced (fig. 1–1). This window is typically 80–220°C (176–428°F) or 2,200–5,500 meters (7,200–18,000 feet).
Oil and gas migration in waterReservoir rock
Source rock
Source rock
Fig. 1–1. Generation and movement of oil and gas (Source: Hyne, N. J.)
Chapter 1 Origins of Oil and Gas 5
Other factors that can affect the rate of oil generation are pressure (imposed by overlying rock and sediment), the presence of heat-tolerant bacteria that act on the oil, and the presence of hydrogen and oxygen (from water and surrounding minerals). As these various drivers exert their influence, the kerogen in source rock undergoes conversion to petroleum in a process called maturation. Below a temperature of about 50°C (122°F), small amounts of kerogen begin to be transformed into oil. Peak conversion occurs at about 100°C (212°F).
If the temperature rises above 130°C (266°F) for even a brief time, then crude oil itself begins to break into smaller molecules, and gas starts to be produced. At first, this will be wet gas and condensate, with high levels of relatively heavy hydrocarbons. With further increases in temperature, the gas will become more dry, containing more of the lighter hydrocarbon gases.
Abiogenic hydrocarbons
About 60 years ago, Russian and Ukrainian scientists postulated an alternative mechanism for the formation of hydrocarbons. The abiogenic (inorganic) process they envisioned does not involve biological material, but rather the transformation of hydrogen and carbon into oil and gas deep within the outer mantle of the earth. This is postulated to take place at temperatures greater than 1,500°C (2,730°F) and pressures 50,000 times that at the earth’s surface—conditions found at a depth of about 65 miles.
Austrian-born Thomas Gold (1920–2004), a leading U.S. astronomer and geoscientist, was perhaps the best-known Western advocate for the theory.
Despite tantalizing results from limited laboratory and field experiments, it remains highly speculative.
Migration to Reservoir RockOil and gas typically move around within (and are eventually expelled
from) source rock after generation, typically driven by the pressure of overlying rock layers and aided by the presence of faults and cracks in

The Oil & Gas Industry: A Nontechnical Guide6
the source rock and nearby rock layers. In fact, virtually all commercially viable oil reservoirs result from migration that takes the hydrocarbons away from the source rock and into reservoir rock.
Oil very rarely collects in large underground pools of liquid, accumulating instead in the pores of highly permeable reservoir rock. Permeable rock has extensive and well-connected pores that enable (eventual) substantial hydrocarbon flow to a drilled wellbore.
Reservoir rock with good porosity and permeability is generally classified as either a clastic or a carbonate system. Clastic sediments are formed from fragments of various rocks that were transported and redeposited to create new formations. Sandstones, siltstones, and shales are the most common types. Notable clastic depositions are found in river delta regions, such as along the U.S. Gulf Coast, several Venezuelan coastal fields, the Niger River delta in Africa, and the south Caspian Sea.
Carbonate rock, in contrast, is typically formed by a chemical reaction between calcium and carbonate ions in shallow seas, or by a process called biomineralization. The most notable example of the latter is the creation of large reefs by marine coral. Carbonate rock also can build up from the constant rain of tiny shell fragments that falls to the sea floor from microorganisms living in the water above. Limestone and dolostone are typical carbonates.
Hydrocarbon TrapsIn a promising hydrocarbon-bearing formation, oil and gas have
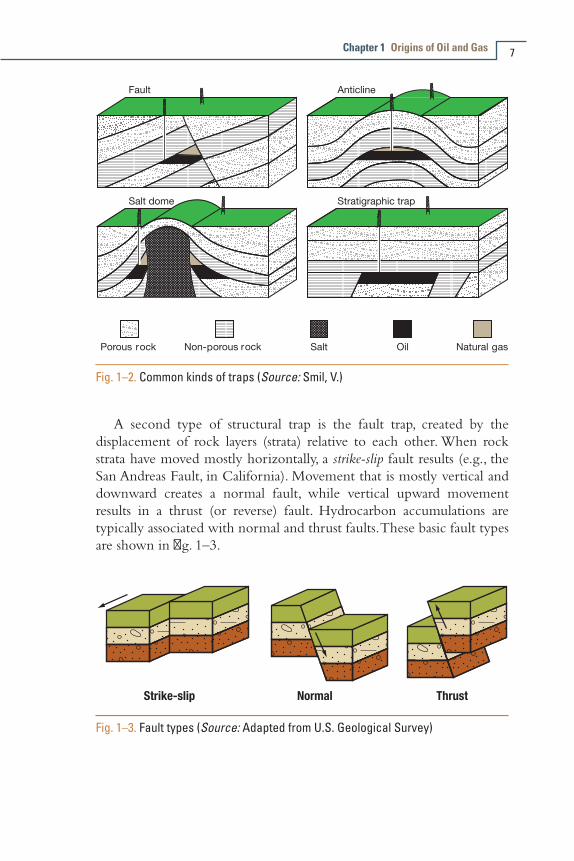
migrated into what is called a trap. There are several types, all created by prior deformation of the earth’s crust. Highly impermeable rocks above and around the trap seal it in a way that prevents any further significant movement of hydrocarbons upward or laterally. There are three basic types of hydrocarbon traps: structural, stratigraphic, and combination (fig. 1–2).
Structural trapsStructural traps are formed by tectonic processes—movement of
the rock plates that comprise the top of the earth’s crust—that deform underlying rock layers. One common type is the anticline, a smooth, archlike fold. By some estimates, nearly 80% of the world’s largest oil reservoirs are found in anticlinal traps.
Chapter 1 Origins of Oil and Gas 7
Fig. 1–2. Common kinds of traps (Source: Smil, V.)
A second type of structural trap is the fault trap, created by the displacement of rock layers (strata) relative to each other. When rock strata have moved mostly horizontally, a strike-slip fault results (e.g., the San Andreas Fault, in California). Movement that is mostly vertical and downward creates a normal fault, while vertical upward movement results in a thrust (or reverse) fault. Hydrocarbon accumulations are typically associated with normal and thrust faults. These basic fault types are shown in fig. 1–3.
Fig. 1–3. Fault types (Source: Adapted from U.S. Geological Survey)

The Oil & Gas Industry: A Nontechnical Guide8
Stratigraphic trapsStratigraphic traps are created when a seal or barrier is formed above
and around an oil- or gas-bearing formation by sedimentary deposition of impermeable rock. Primary stratigraphic traps include channels and barriers of sandstone in a river delta area, carbonate slopes, coral reefs, and clay-filled channels of dolomite or calcite.
Major oil fields with stratigraphic traps include Prudhoe Bay (Alaska), East Texas, and a supergiant field along the east coast of Lake Maracaibo, in Venezuela.
Combination trapsCombination traps are formed by a combination of processes that
occurred in the sediments during the time of deposition of the reservoir bed. They are also formed by tectonic activity that occurred in the reservoir beds after their deposition.
One example of a combination trap is associated with a salt dome—a mass of lighter salt that has pushed upward through heavier surrounding rock and sediments. Salt beds were formed by the natural evaporation of seawater from an ancient enclosed basin, and the resultant salt layer was then buried by successive layers of sediments over geologic time.
The upward push creates an anticlinal type of folding, with reservoir rock frequently found draping the flanks of the salt dome to create conditions for hydrocarbon trapping. Salt itself is impermeable to oil and gas and can contribute to trap creation. As described in later chapters, a cavity can be created in the salt formation itself, comprising an effective storage cavern for hydrocarbon products.
Three conclusions can be drawn from this discussion of hydrocarbon generation, migration, and trapping. First, by some estimates, an average of only about 10% of all the gas and oil that forms in a sedimentary basin ever reaches a trap. The remainder never moved from the source rock, is lost during migration, or seeps from the earth’s surface.
Second, oil may in some cases be found above gas. Even though figures 1–2 and 1–3 show gas accumulating above oil in various traps, the situation can be more complicated.
Third, as will be discussed in more detail later (see chap. 7, on hydrocarbon production), water is virtually always found in the pore spaces of reservoir rock, intermingled with oil and gas. For this reason, most wells pump not only oil and gas but also mineral-laden water called brine.

Oil Overview
Petroleum in its most common liquid form is referred to as crude oil. It is extracted from the earth by drilling into geologic structures (described in chap. 1) whose properties are conducive to the aggregation of oil.
General Composition of Crude OilPetroleum consists mostly of hydrocarbon molecules, themselves
made up of various combinations of hydrogen and carbon atoms. The simplest hydrocarbon molecule—one carbon atom bonded to four hydrogen atoms (CH4 )—is called methane and is the primary component of natural gas. More details about this form of hydrocarbon are given in chapter 3.
Crude oil is a mixture of a very large number of hydrocarbons with arcane names such as alkanes (or paraffins), cycloalkanes (or naphthenes), aromatic hydrocarbons, and asphaltenes. A major distinguishing characteristic is the number of carbon atoms they contain. For example, asphalt contains 35 or more carbon atoms per molecule, while pentane (used to make gasoline) has just 5. (Both are classified as alkanes.) The type, variety, and structure of the hydrocarbon molecules in crude oil determine its physical and chemical properties, such as color, thickness (viscosity), and boiling point. Crude oil also may contain nitrogen, oxygen and sulfur, plus trace amounts of metals such as iron, nickel, copper, and vanadium. In general terms, crude oil contains about 83%–87% carbon, 10%–14% hydrogen, 0.1%–2% nitrogen, 0.1%–1.5% oxygen, and less than 0.1% metals.
2

The Oil & Gas Industry: A Nontechnical Guide10
Conventional Crude OilCrude oil is often found along with natural gas and saline (salty)
water. The lighter natural gas forms a gas cap over the petroleum, while the saline water is heavier than most forms of crude and generally sinks beneath it. Conventional oil resources are those whose location and extent have been quite well established, that can be produced through wellbores using relatively standard equipment and procedures, and that typically require minimal processing prior to sale.
Classification schemeThe petroleum industry uses three major parameters to classify crude oil:
•Geographic location in which it is produced (which affects the cost of transporting the crude to a refinery).
•API gravity (an oil industry measure of density; API is the American Petroleum Institute). Light crude oil has relatively low density; heavy crude has high density. Oil with an API gravity (expressed as ºAPI) below 10.0 is classified as extraheavy.
• Sulfur content. Crude is generally called sweet if it contains relatively little sulfur or sour if it contains substantial amounts.
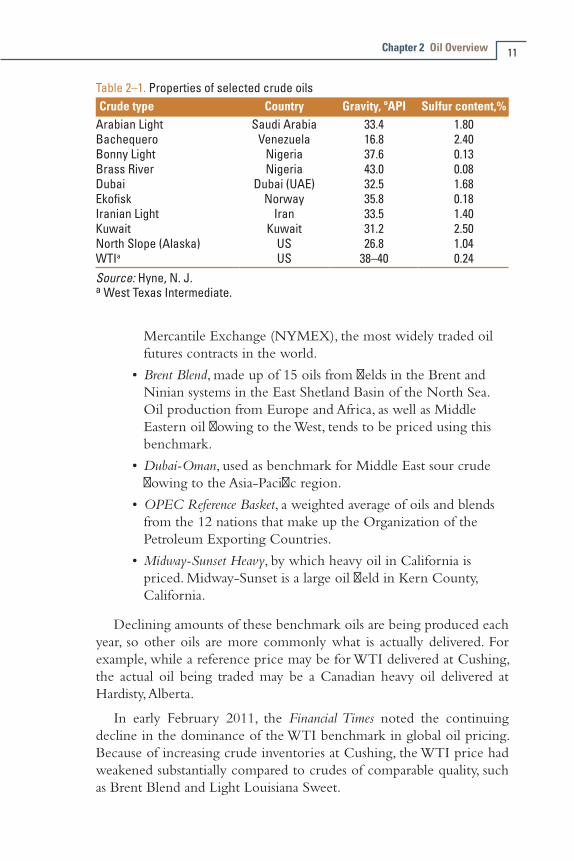
Light crude oil is more desirable than heavy oil because it produces a higher yield of gasoline, a highly valued petroleum product for transportation use. Sweet oil commands a higher price than sour oil because it has fewer environmental problems and requires less refining to meet sulfur-content standards imposed by buyers. Table 2–1 shows the API gravity and sulfur content of some benchmark crude oil (described in the next section).
Each crude oil has unique molecular characteristics that are evaluated by a process called assay analysis, carried out in a laboratory.
Benchmark crudesOil from an area in which its molecular characteristics have been
determined is used as a pricing reference, or benchmark, in global oil markets. Some common reference crudes are:
•West Texas Intermediate (WTI), a very high quality sweet, light oil delivered at Cushing, Oklahoma, for North American oil. Cushing is the delivery point for WTI traded on the New York
Chapter 2 Oil Overview 11
Mercantile Exchange (NYMEX), the most widely traded oil futures contracts in the world.
•Brent Blend, made up of 15 oils from fields in the Brent and Ninian systems in the East Shetland Basin of the North Sea. Oil production from Europe and Africa, as well as Middle Eastern oil flowing to the West, tends to be priced using this benchmark.
•Dubai-Oman, used as benchmark for Middle East sour crude flowing to the Asia-Pacific region.
•OPEC Reference Basket, a weighted average of oils and blends from the 12 nations that make up the Organization of the Petroleum Exporting Countries.
•Midway-Sunset Heavy, by which heavy oil in California is priced. Midway-Sunset is a large oil field in Kern County, California.
Declining amounts of these benchmark oils are being produced each year, so other oils are more commonly what is actually delivered. For example, while a reference price may be for WTI delivered at Cushing, the actual oil being traded may be a Canadian heavy oil delivered at Hardisty, Alberta.
In early February 2011, the Financial Times noted the continuing decline in the dominance of the WTI benchmark in global oil pricing. Because of increasing crude inventories at Cushing, the WTI price had weakened substantially compared to crudes of comparable quality, such as Brent Blend and Light Louisiana Sweet.
Table 2–1. Properties of selected crude oilsCrude type Country Gravity, ºAPI Sulfur content,%
Arabian Light Saudi Arabia 33.4 1.80Bachequero Venezuela 16.8 2.40Bonny Light Nigeria 37.6 0.13Brass River Nigeria 43.0 0.08Dubai Dubai (UAE) 32.5 1.68Ekofisk Norway 35.8 0.18Iranian Light Iran 33.5 1.40Kuwait Kuwait 31.2 2.50North Slope (Alaska) US 26.8 1.04WTIa US 38–40 0.24Source: Hyne, N. J. a West Texas Intermediate.

The Oil & Gas Industry: A Nontechnical Guide12
At one point in early February 2011, Brent’s premium over WTI reached a record level of more than $16 per barrel. Such discrepancies upset the plans of energy investors and traders. In fact, in 2009, Saudi Arabia dropped WTI as its benchmark for pricing oil for sale to customers in the United States.
Crude oil pricesA brief word is warranted about crude prices, which jumped about
30% between January and early April 2011. (On April 11, 2011, the Brent price reached a 2.5-year high of $127.02 per barrel, with WTI at $112.79.) Driving fears of further increases were concerns about chaotic geopolitics in several oil-producing countries, including:
•Actions aimed at ousting long-standing regimes in North Africa—from Tunisia and Egypt to Libya, Syria, and Algeria—as well as unrest in Yemen and Saudi Arabia.
•Continuing civil disorder in Nigeria, a major global source of highly prized light, sweet crude oil.
• Increased domestic spending in some of these nations (e.g., $125 billion in Saudi Arabia) in an attempt to quell discontent, which might then be made up by charging more for exported oil.
•Continued use of domestic fuel subsidies in many oil-producing countries, which tend to drive up internal demand and reduce oil volumes available for export.
Also contributing to concerns about future price and supply was rising oil demand in China, already the world’s second-largest oil consumer in 2010. Some analysts were projecting that oil consumption in China would top 10 million barrels per day (b/d) in 2011.
A counterbalance to upward price pressure was a slowing global economy. By mid-August 2011, the crude oil futures contract price on the NYMEX had fallen back to $80–$85 per barrel.
However, Middle Eastern geopolitics again pushed up oil prices in early 2012. On January 23, the price of NYMEX crude for March delivery rose to $99.58 per barrel, driven in part by a decision that day by European Union governments to ban imports of oil from Iran (effective July 1, 2012) and to freeze Europe-based assets of Iran’s central bank. (Approximately 20% of Iranian oil exports go to EU nations.)
The EU action was part of an international campaign to pressure Iran to resume talks on the country’s nuclear development program.
Chapter 2 Oil Overview 13
In response, some Iranian lawmakers threatened to close the Strait of Hormuz, a narrow passage between Iran and Oman and a critical route for tankers that carry oil from the Persian Gulf to world markets.
Unconventional Crude OilSeveral types of oil resources are called unconventional, to distinguish
them from oil that can be extracted using traditional oil field methods. These include tar sands (also called oil sands) and shale oil.
Tar sands/oil sandsCrude oil is sometimes found in semisolid form, mixed with sand
and water. Major deposits of oil of this type are found in the Athabasca region of northeastern Alberta. Tar sands contain bitumen—a kind of heavy crude oil. The sticky, black, tarlike material is so thick that it must be heated or chemically diluted before it will flow. Oil-eating bacteria have destroyed some of the lighter fractions of crude oil in such oil sands, leaving behind the heavier bitumen fractions.
Venezuela also has large amounts of crude trapped in sands in that nation’s Orinoco region. These hydrocarbons have a somewhat lower viscosity (i.e., are less thick) than those in Canada and are usually called heavy or extraheavy oil.
Combined, Canada and Venezuela contain an estimated 3.6 trillion barrels (570 billion cubic meters) of bitumen and extraheavy oil. This represents about twice the volume of the world’s reserves of conventional oil.1
Shale oilAnother unconventional resource, shale oil is found in shale source
rock that has not been exposed to heat or pressure long enough to convert trapped hydrocarbons into crude oil. According to the U.S. Department of Energy (DOE), oil shales are not technically shales and do not really contain oil. Rather, they are usually relatively hard rocks called marls—composed primarily of clay and calcium carbonate—containing the waxy substance called kerogen (described in chap. 1). The trapped kerogen can be converted into crude oil using heat and pressure to simulate natural processes.
The Oil & Gas Industry: A Nontechnical Guide14
Oil shales are found in many countries, but the United States has the world’s largest deposits. These are located chiefly in the Green River formation, which covers portions of Colorado, Utah, and Wyoming.2 DOE has estimated that as much as 800 billion barrels of oil are recoverable from that formation.
In addition, from 2008 to 2011, small and midsize companies stepped up exploration and production in several other regions, including the Bakken oil-bearing shale along the North Dakota/Montana border, the Permian Basin in West Texas, and the Eagle Ford formation in South Texas. The companies used two main techniques previously developed to extract natural gas from shale formations: the drilling of long horizontal wells to reach additional oil deposits; and hydraulic fracturing (fracing), in which water mixed with chemicals and other materials is pumped at high pressure into the ground to crack the rock and make it easier for oil to flow. Analysts have estimated that the United States could be producing an additional 2.5 million b/d of oil by 2016, with the increase coming equally from deepwater fields in the Gulf of Mexico and from new onshore sources.
As the world’s reserves of conventional light and medium oil are depleted, oil refineries are investing in the more-complex and expensive systems needed to process increased volumes of heavy oil and bitumen. Heavier crude oils have too much carbon and not enough hydrogen, so these systems generally involve removing carbon or adding hydrogen, to convert the longer, more-complex molecules in the oil to the shorter, simpler ones that characterize end-product fuels. (More details of these processes are presented in chap. 11.)
Resources and ReservesA brief discussion of oil resources and reserves is warranted here.
Resources are hydrocarbons that may or may not be produced in the future. An initial estimate of the magnitude of the resource in a yet-to-be-drilled prospect may be made. However, appraisal (by drilling delineation wells or acquiring more seismic data, as described in chap. 4) is needed to confirm the size of a field and pave the way for development and production. Once the relevant government body gives an oil company a production license for field development, the reserves in the field can be formally booked.

Chapter 2 Oil Overview 15
According to the Society of Petroleum Engineers (SPE), reserves are the quantities of crude oil estimated to be commercially recoverable by application of development efforts to known (discovered) accumulations, from a given date forward, under defined conditions. The total estimated amount of oil in a reservoir, including both producible and nonproducible oil, is called oil in place (OIP). However, because of reservoir characteristics and the limits of extraction technologies, only a fraction of this oil can be brought to the surface. Only this producible fraction comprises the reserves. The ratio of producible oil reserves to total OIP for a given field is often referred to as the recovery factor.
Reserves are further categorized by the level of certainty associated with the estimates of their magnitude. The following are the three categories in widest use:
•Proved reserves. These are considered reasonably certain to be producible using current technology at current prices, with current commercial terms and government consent. This category is also sometimes called 1P, but others in the industry refer to it as P90—that is, having a 90% certainty of being produced.
•Probable reserves. These are considered to have a reasonably probable chance of being produced using current or likely technology at current prices, with current commercial terms and government consent. This category is sometimes called P50—that is, having a 50% certainty of being produced—and is also known in the industry as 2P, meaning “proved plus probable.”
•Possible reserves. These have a chance of being developed under favorable circumstances. Some industry specialists refer to this as P10—that is, having a 10% certainty of being produced—while others use the term 3P, for “proved plus probable plus possible.”
Experience has shown that initial estimates of the size of newly discovered oil fields are usually too low. The term reserve growth refers to the increases in estimated ultimate recovery that occur as oil fields are developed and produced.
Known global oil reserves are estimated at about 1.2 trillion barrels (without oil sands) by the Energy Information Administration (EIA) of the DOE. The agency raises that figure to 3.74 trillion barrels if oil sands are included.
The Oil & Gas Industry: A Nontechnical Guide16
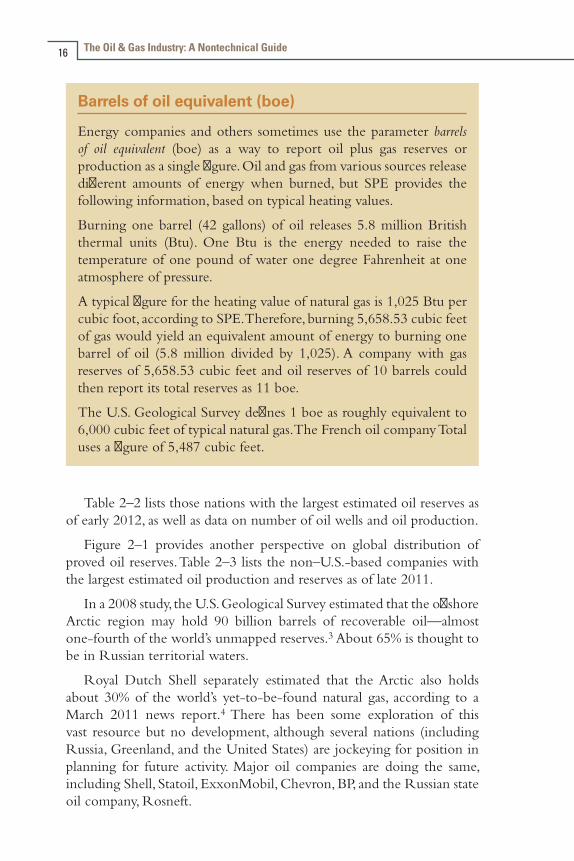
Barrels of oil equivalent (boe)
Energy companies and others sometimes use the parameter barrels of oil equivalent (boe) as a way to report oil plus gas reserves or production as a single figure. Oil and gas from various sources release different amounts of energy when burned, but SPE provides the following information, based on typical heating values.
Burning one barrel (42 gallons) of oil releases 5.8 million British thermal units (Btu). One Btu is the energy needed to raise the temperature of one pound of water one degree Fahrenheit at one atmosphere of pressure.
A typical figure for the heating value of natural gas is 1,025 Btu per cubic foot, according to SPE. Therefore, burning 5,658.53 cubic feet of gas would yield an equivalent amount of energy to burning one barrel of oil (5.8 million divided by 1,025). A company with gas reserves of 5,658.53 cubic feet and oil reserves of 10 barrels could then report its total reserves as 11 boe.
The U.S. Geological Survey defines 1 boe as roughly equivalent to 6,000 cubic feet of typical natural gas. The French oil company Total uses a figure of 5,487 cubic feet.
Table 2–2 lists those nations with the largest estimated oil reserves as of early 2012, as well as data on number of oil wells and oil production.
Figure 2–1 provides another perspective on global distribution of proved oil reserves. Table 2–3 lists the non–U.S.-based companies with the largest estimated oil production and reserves as of late 2011.
In a 2008 study, the U.S. Geological Survey estimated that the offshore Arctic region may hold 90 billion barrels of recoverable oil—almost one-fourth of the world’s unmapped reserves.3 About 65% is thought to be in Russian territorial waters.
Royal Dutch Shell separately estimated that the Arctic also holds about 30% of the world’s yet-to-be-found natural gas, according to a March 2011 news report.4 There has been some exploration of this vast resource but no development, although several nations (including Russia, Greenland, and the United States) are jockeying for position in planning for future activity. Major oil companies are doing the same, including Shell, Statoil, ExxonMobil, Chevron, BP, and the Russian state oil company, Rosneft.
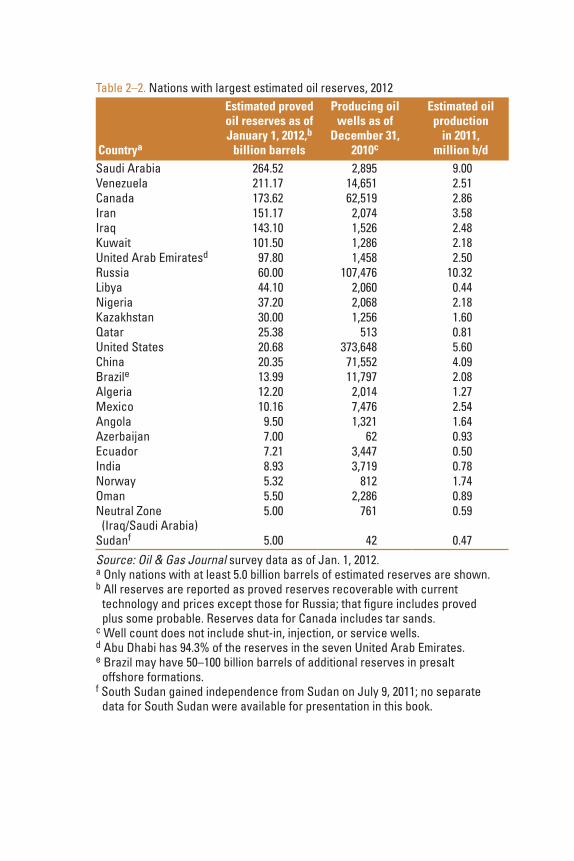
Table 2–2. Nations with largest estimated oil reserves, 2012 Countrya
Estimated proved oil reserves as of January 1, 2012,b
billion barrels
Producing oil wells as of
December 31, 2010c
Estimated oil production
in 2011, million b/d
Saudi Arabia 264.52 2,895 9.00Venezuela 211.17 14,651 2.51Canada 173.62 62,519 2.86Iran 151.17 2,074 3.58Iraq 143.10 1,526 2.48Kuwait 101.50 1,286 2.18United Arab Emiratesd 97.80 1,458 2.50Russia 60.00 107,476 10.32Libya 44.10 2,060 0.44Nigeria 37.20 2,068 2.18Kazakhstan 30.00 1,256 1.60Qatar 25.38 513 0.81United States 20.68 373,648 5.60China 20.35 71,552 4.09Brazile 13.99 11,797 2.08Algeria 12.20 2,014 1.27Mexico 10.16 7,476 2.54Angola 9.50 1,321 1.64Azerbaijan 7.00 62 0.93Ecuador 7.21 3,447 0.50India 8.93 3,719 0.78Norway 5.32 812 1.74Oman 5.50 2,286 0.89Neutral Zone
(Iraq/Saudi Arabia)5.00 761 0.59
Sudanf 5.00 42 0.47Source: Oil & Gas Journal survey data as of Jan. 1, 2012. a Only nations with at least 5.0 billion barrels of estimated reserves are shown. b All reserves are reported as proved reserves recoverable with current technology and prices except those for Russia; that figure includes proved plus some probable. Reserves data for Canada includes tar sands. c Well count does not include shut-in, injection, or service wells. d Abu Dhabi has 94.3% of the reserves in the seven United Arab Emirates. e Brazil may have 50–100 billion barrels of additional reserves in presalt offshore formations. f South Sudan gained independence from Sudan on July 9, 2011; no separate data for South Sudan were available for presentation in this book.

Fig. 2–1. Distribution of proved worldwide oil reserves: 1989, 1999, and 2009 (billion barrels) (Source: BP Statistical Review of World Energy 2010, June 2010)
Table 2–3. Top non–U.S.-based energy companies in oil production and reserves, 2011Company Production, million barrels Reserves, million barrels
Saudi Arabian Oil 2,920.0 260,100.0National Iranian Oil 1,350.5 137,010.0Pemex 957.0 10,359.1BP 866.0 10,530.0Iraq National Oil 861.4 115,000.0PetroChina 858.0 11,278.0OAO Rosneft 847.4 18,110.0PdVSA 814.0 211,170.0Abu Dhabi National Oil 789.1 92,200.0Petrobras 783.3 10,757.2Kuwait Petroleum 741.0 101,500.0OAO Lukoil 708.1 13,025.0Nigerian National Petroleum 666.1 37,200.0Sonangol 653.4 9,500.0Source: Oil & Gas Journal, October 3, 2011, OGJ100 survey data.

Chapter 2 Oil Overview 19
For example, Statoil expressed optimism in April 2011 about a new oil find about 125 miles offshore Norway that it said could hold as much as 500 million boe.5 The new field is about 60 miles north of the company’s Snøhvit gas field, which was the first Norwegian energy project in the Arctic. The Norwegian Petroleum Directorate estimates that the country’s portion of the Barents Sea could hold as much as 6 billion boe.
In August 2011, ExxonMobil entered into a joint venture with Rosneft that included (among other terms) opportunities to explore in a Russian sector of the Arctic Ocean.6 An initial ExxonMobil investment of $2.2 billion is envisioned for activities in the Kara Sea, between the northern coast of European Russia and the Novaya Zemlya island chain. (A similar deal, proposed earlier in the year by BP, fell through.)
The Arctic wilderness poses special risks, ranging from drifting icebergs to hostile weather. Industry experts, however, have contended that exploration, while environmentally sensitive, is not technically difficult in comparison with areas such as the deep waters of the Gulf of Mexico. They expect that drilling will be in relatively shallow waters and that there would be fewer storms in the region. Changing global climate conditions may lead to expansion of open water in the Arctic in the years ahead.
Recent Trends in U.S. Oil ProductionIn the United States, domestic oil production declined steadily
from 1985 to 2008. However, that trend was reversed by the successful exploitation of unconventional reserves such as shale oil, using two technologies: directional drilling and hydraulic fracturing (described in chapter 5).
As of early February 2011, onshore drilling for oil had risen to almost twice the level seen one year earlier, with 818 oil-directed rigs in operation. This was the highest number since 1987, according to the oil service company Baker Hughes.
Figure 2–2 presents data from EIA on U.S. domestic oil production in recent years. Tables 2–4 and 2–5 present information on liquids reserves and liquids production, respectively, for the U.S.-based companies that comprise the top 15 in domestic reserves and domestic production.
The Oil & Gas Industry: A Nontechnical Guide20
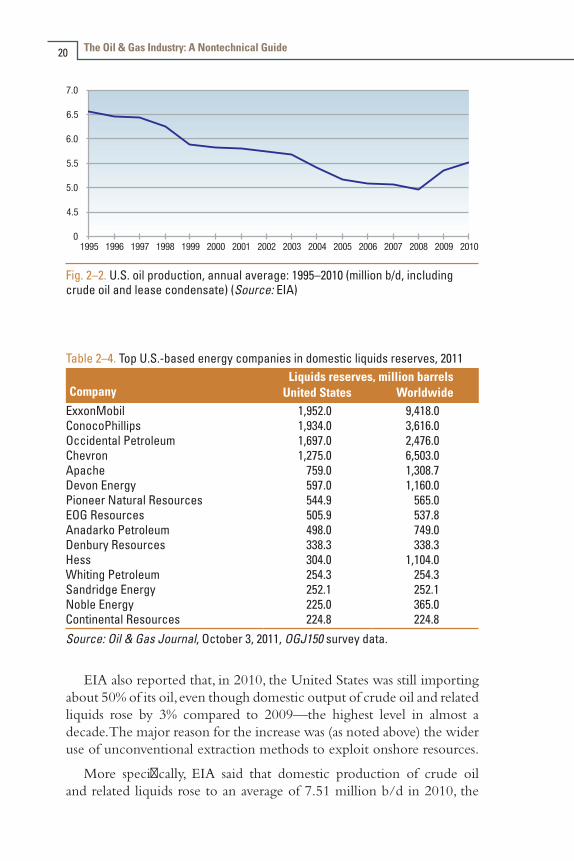
Fig. 2–2. U.S. oil production, annual average: 1995–2010 (million b/d, including crude oil and lease condensate) (Source: EIA)
Table 2–4. Top U.S.-based energy companies in domestic liquids reserves, 2011
CompanyLiquids reserves, million barrels
United States WorldwideExxonMobil 1,952.0 9,418.0ConocoPhillips 1,934.0 3,616.0Occidental Petroleum 1,697.0 2,476.0Chevron 1,275.0 6,503.0Apache 759.0 1,308.7Devon Energy 597.0 1,160.0Pioneer Natural Resources 544.9 565.0EOG Resources 505.9 537.8Anadarko Petroleum 498.0 749.0Denbury Resources 338.3 338.3Hess 304.0 1,104.0Whiting Petroleum 254.3 254.3Sandridge Energy 252.1 252.1Noble Energy 225.0 365.0Continental Resources 224.8 224.8Source: Oil & Gas Journal, October 3, 2011, OGJ150 survey data.
EIA also reported that, in 2010, the United States was still importing about 50% of its oil, even though domestic output of crude oil and related liquids rose by 3% compared to 2009—the highest level in almost a decade. The major reason for the increase was (as noted above) the wider use of unconventional extraction methods to exploit onshore resources.
More specifically, EIA said that domestic production of crude oil and related liquids rose to an average of 7.51 million b/d in 2010, the

Chapter 2 Oil Overview 21
highest since 2002. The increase made possible a 2% drop in U.S. crude oil imports, to 9.45 million b/d, despite rising demand as the economy recovered. Table 2–6 shows the nations from which the United States imported most (approximately 82%) of its crude oil in 2010, as well as preliminary crude import data for 2011. Table 2–7 provides similar information on 2010 total petroleum imports (crude plus products) for five other nations and Europe.
Table 2–6. U.S. crude oil import sources: Top 10 countries (million b/d)
CountryCrude imports to U.S., million b/d
2010 2011 (prelim)Canada 1.970 2.213Mexico 1.152 1.117Saudi Arabia 1.082 1.259Nigeria 0.983 0.757Venezuela 0.912 0.865Iraq 0.415 0.458Angola 0.383 0.315Colombia 0.338 0.403Algeria 0.328 0.189Ecuador 0.210 0.228Source: U.S. DOE/EIA. Published in Oil & Gas Journal, Jan. 9, 2012, p. 31. Note: Includes imports for the Strategic Petroleum Reserve.
Table 2–5. Top U.S.-based energy companies in domestic liquids production, 2011
CompanyAnnual liquids production, million barrels
United States WorldwideChevron 178.0 702.0ConocoPhillips 139.0 318.0ExxonMobil 123.0 709.0Occidental Petroleum 99.0 201.0Anadarko Petroleum 47.0 73.0Devon Energy 44.0 73.0Apache 40.3 125.1EOG Resources 33.9 38.4Hess 32.0 112.0Marathon Oil 25.0 89.0Denbury Resources 21.9 21.9Whiting Petroleum 19.0 19.0Noble Energy 19.0 31.0Pioneer Natural Resources 17.5 31.8Plains Exploration & Production 16.8 16.8Source: Oil & Gas Journal, October 3, 2011, OGJ150 survey data.
The Oil & Gas Industry: A Nontechnical Guide22
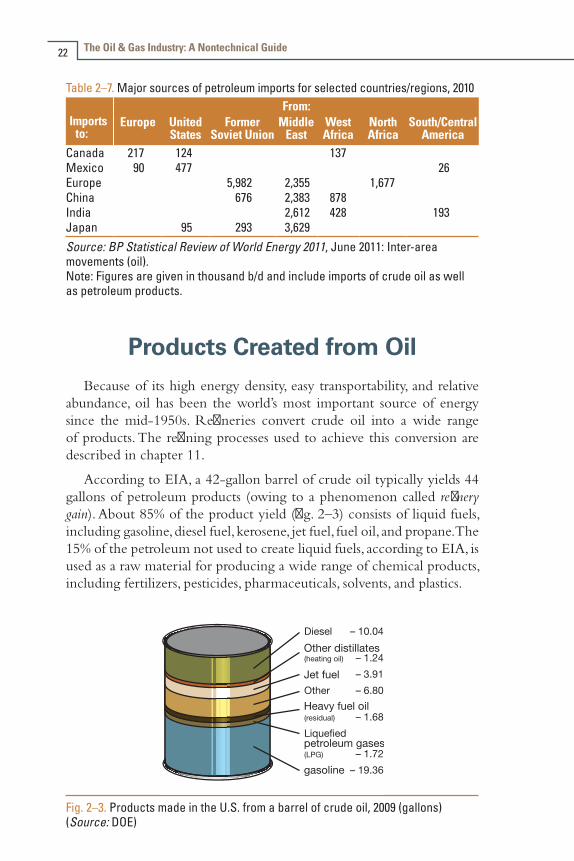
Table 2–7. Major sources of petroleum imports for selected countries/regions, 2010
Imports to:
From:Europe United
StatesFormer
Soviet UnionMiddle
EastWest Africa
North Africa
South/Central America
Canada 217 124 137Mexico 90 477 26Europe 5,982 2,355 1,677China 676 2,383 878India 2,612 428 193Japan 95 293 3,629Source: BP Statistical Review of World Energy 2011, June 2011: Inter-area movements (oil). Note: Figures are given in thousand b/d and include imports of crude oil as well as petroleum products.
Products Created from OilBecause of its high energy density, easy transportability, and relative
abundance, oil has been the world’s most important source of energy since the mid-1950s. Refineries convert crude oil into a wide range of products. The refining processes used to achieve this conversion are described in chapter 11.
According to EIA, a 42-gallon barrel of crude oil typically yields 44 gallons of petroleum products (owing to a phenomenon called refinery gain). About 85% of the product yield (fig. 2–3) consists of liquid fuels, including gasoline, diesel fuel, kerosene, jet fuel, fuel oil, and propane. The 15% of the petroleum not used to create liquid fuels, according to EIA, is used as a raw material for producing a wide range of chemical products, including fertilizers, pesticides, pharmaceuticals, solvents, and plastics.
Fig. 2–3. Products made in the U.S. from a barrel of crude oil, 2009 (gallons) (Source: DOE)

Chapter 2 Oil Overview 23
Certain types of hydrocarbons produced during refining can be mixed with nonhydrocarbons to create other products, such as greases, asphalt, petroleum coke, sulfur, sulfuric acid, and wax. More details on this subject are presented in chapter 11.
Recent Trends in Oil ConsumptionGlobal use of oil has been on a steady upward trajectory for decades,
as nations around the world have used oil-based fuels to expand their industries and economies (fig. 2–4). Global demand in 2007 reached about 86 million b/d but fell in both 2008 and 2009 as a global financial crisis (triggered mainly by mortgage lending and related activities) depressed investment and dampened economic activity. The figure for 2009 was 84.1 million b/d. For 2010, DOE reported that total world oil consumption resumed its upward trend, reaching about 87.9 million b/d and setting a new record.
At the 2009 global consumption rate of about 84.1 million b/d (30.7 billion barrels per year) and using the Oil & Gas Journal estimate of proved oil reserves (1.35 trillion barrels), the remaining oil supply would last about 44 years. Using the DOE reserves estimate of 3.74 trillion barrels (which includes oil sands), the remaining oil supply would last about 122 years.
Europe and Eurasia
Asia-Paci�c
Africa
Middle East
North America
South and Central America
Fig. 2–4. Global oil consumption: 1995–2009 (million b/d) (Source: Adapted from BP Statistical Review of World Energy 2010, June 2010)

The Oil & Gas Industry: A Nontechnical Guide24
Looking just at the United States, about two-thirds of all oil use is for transportation, according to DOE (fig. 2–5). In other nations, oil is more commonly used for space heating and power generation than for transportation.
Totals include such products as asphalt, road oil, kerosene, LP gases, lubricants, and petroleum coke, as well as gasoline, diesel, aviation fuels, heating oil, and residual fuel oil. Other petroleum products commonly used for transportation include diesel fuel (used for trucks, buses, railroads, some vessels, and a few passenger autos), jet fuel, and residual fuel oil (used for tankers and other large vessels).
In nontransportation uses—such as space heating, industrial operations, and power generation—substitution of other energy sources for oil has been much easier than in the transportation sector. As a result, U.S. nontransportation use of oil fell from a peak of 8.7 million b/d in 1978 (about 47% of total oil use) to a low of less than 6 million b/d in the late 1980s and early 1990s. Consumption in these sectors has risen to 6.5–7.0 million b/d more recently. Oil accounts for less than 20% of the energy consumed for stationary uses, down from 30% in 1973.
3500
4000
4500
5000
5500
6000
6500
7000
7500
8000
Fig. 2–5. U.S. petroleum consumption by sector: 1995–2009 (million barrels) (Source: U.S. Department of Energy; Annual Energy Review 2009)
Chapter 2 Oil Overview 25
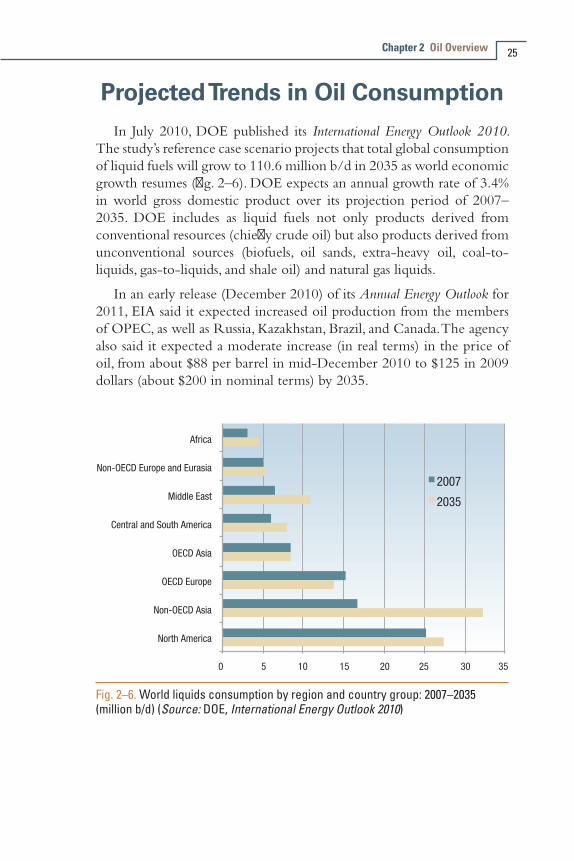
Projected Trends in Oil ConsumptionIn July 2010, DOE published its International Energy Outlook 2010.
The study’s reference case scenario projects that total global consumption of liquid fuels will grow to 110.6 million b/d in 2035 as world economic growth resumes (fig. 2–6). DOE expects an annual growth rate of 3.4% in world gross domestic product over its projection period of 2007–2035. DOE includes as liquid fuels not only products derived from conventional resources (chiefly crude oil) but also products derived from unconventional sources (biofuels, oil sands, extra-heavy oil, coal-to-liquids, gas-to-liquids, and shale oil) and natural gas liquids.
In an early release (December 2010) of its Annual Energy Outlook for 2011, EIA said it expected increased oil production from the members of OPEC, as well as Russia, Kazakhstan, Brazil, and Canada. The agency also said it expected a moderate increase (in real terms) in the price of oil, from about $88 per barrel in mid-December 2010 to $125 in 2009 dollars (about $200 in nominal terms) by 2035.
Fig. 2–6. World liquids consumption by region and country group: 2007–2035 (million b/d) (Source: DOE, International Energy Outlook 2010)

The Oil & Gas Industry: A Nontechnical Guide26
Another agency that produces well regarded forward-looking views of world oil consumption is the International Energy Agency (IEA), based in Paris. IEA released its World Energy Outlook in November 2010. Its central analysis—the New Policies Scenario (NPS)—assumes that nations around the world take some steps to address concerns about global climate change, but not the aggressive actions urged by IEA itself. The NPS makes the following projections concerning oil use through the year 2035:
•Oil demand (excluding biofuels) reaches 99 million b/d by 2035. All of the net growth comes from non-OECD countries (almost half from China alone). OECD is the Organization for Economic Cooperation and Development.
•Crude oil production reaches about 68 million b/d by 2020 but never regains its all-time peak level of 70 million b/d reached in 2006.
•Oil from unconventional sources (e.g., shale, tar sands, and extraheavy oil) meets about 10% of total world oil demand by 2035 (compared to 3% in 2009). Canadian oil-sands production reaches 4.2 million b/d in 2035 (compared to 1.3 million b/d in 2009).
•Oil production from the Caspian Sea region grows from 2.9 million b/d in 2009 to about 5.2 million b/d in 2035. Financing and multination pipeline construction challenges could constrain this development.
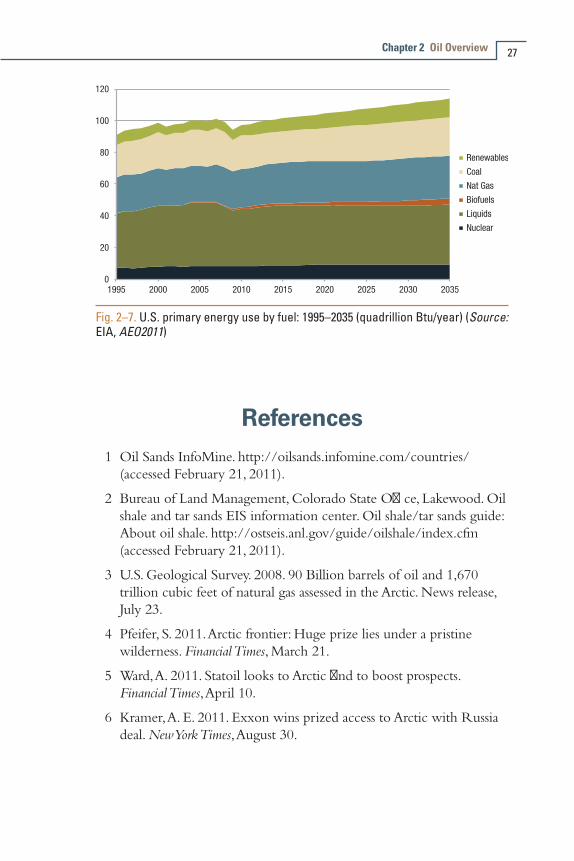
With regard to the United States, EIA issued its Annual Energy Outlook 2011 (AEO2011) in April 2011, examining U.S. energy trends through 2035. In the study’s reference case, total U.S. consumption of liquid fuels, including both fossil liquids and biofuels, grows from 18.6 million b/d (36.2 quadrillion Btu [quads] per year) in 2009 to 21.4 million b/d (41.7 quads per year) in 2035 (fig. 2–7).
The transportation sector dominates demand for liquid fuels in AEO2011, but its share (as measured by energy content) grows only slightly—from 72% of total liquids consumption in 2009 to 74% in 2035. Biofuel consumption accounts for most of the growth. The biofuel portion of liquid fuels consumption is about 1.89 million b/d equivalent (3.9 quads per year) in 2035. Oil consumption is expected to remain roughly unchanged by 2035, at about 20 million b/d.
Chapter 2 Oil Overview 27
Fig. 2–7. U.S. primary energy use by fuel: 1995–2035 (quadrillion Btu/year) (Source: EIA, AEO2011)
References 1 Oil Sands InfoMine. http://oilsands.infomine.com/countries/
(accessed February 21, 2011).
2 Bureau of Land Management, Colorado State Office, Lakewood. Oil shale and tar sands EIS information center. Oil shale/tar sands guide: About oil shale. http://ostseis.anl.gov/guide/oilshale/index.cfm (accessed February 21, 2011).
3 U.S. Geological Survey. 2008. 90 Billion barrels of oil and 1,670 trillion cubic feet of natural gas assessed in the Arctic. News release, July 23.
4 Pfeifer, S. 2011. Arctic frontier: Huge prize lies under a pristine wilderness. Financial Times, March 21.
5 Ward, A. 2011. Statoil looks to Arctic find to boost prospects. Financial Times, April 10.
6 Kramer, A. E. 2011. Exxon wins prized access to Arctic with Russia deal. New York Times, August 30.

Natural Gas Overview
This chapter provides information about the composition of natural gas, the location of major gas resources around the world, and current patterns of, as well as future projections for, gas production and use.
Formation and Composition of Natural Gas
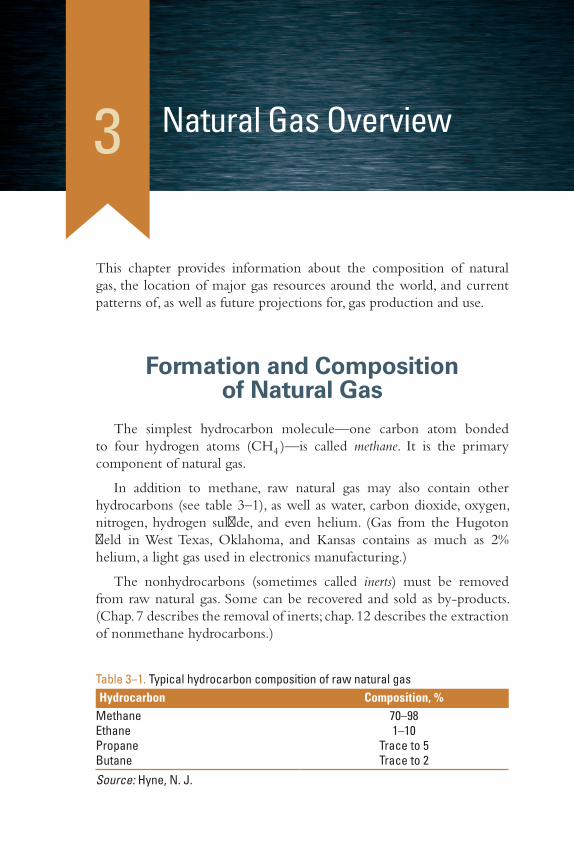
The simplest hydrocarbon molecule—one carbon atom bonded to four hydrogen atoms (CH4 )—is called methane. It is the primary component of natural gas.
In addition to methane, raw natural gas may also contain other hydrocarbons (see table 3–1), as well as water, carbon dioxide, oxygen, nitrogen, hydrogen sulfide, and even helium. (Gas from the Hugoton field in West Texas, Oklahoma, and Kansas contains as much as 2% helium, a light gas used in electronics manufacturing.)
The nonhydrocarbons (sometimes called inerts) must be removed from raw natural gas. Some can be recovered and sold as by-products. (Chap. 7 describes the removal of inerts; chap. 12 describes the extraction of nonmethane hydrocarbons.)
Table 3–1. Typical hydrocarbon composition of raw natural gasHydrocarbon Composition, %
Methane 70–98Ethane 1–10Propane Trace to 5Butane Trace to 2Source: Hyne, N. J.
3
The Oil & Gas Industry: A Nontechnical Guide30
Natural gas has no odor or color and is lighter than air. An organic sulfur compound called mercaptan is added to natural gas to give the gas its identifiable smell (see chap. 9).
Because natural gas has a specific gravity just over half that of air, when released into the atmosphere, it rises and quickly mixes with air. Gases that are heavier than air—such as propane, the vapors of gasoline, and fuel oils—will tend to pool or settle at ground level.
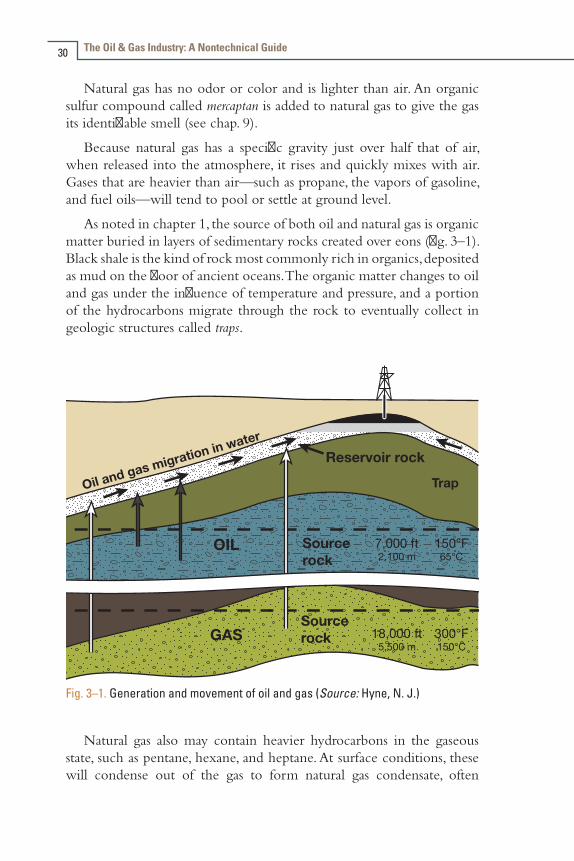
As noted in chapter 1, the source of both oil and natural gas is organic matter buried in layers of sedimentary rocks created over eons (fig. 3–1). Black shale is the kind of rock most commonly rich in organics, deposited as mud on the floor of ancient oceans. The organic matter changes to oil and gas under the influence of temperature and pressure, and a portion of the hydrocarbons migrate through the rock to eventually collect in geologic structures called traps.
Oil and gas migration in waterReservoir rock
Source rock
Source rock
Fig. 3–1. Generation and movement of oil and gas (Source: Hyne, N. J.)
Natural gas also may contain heavier hydrocarbons in the gaseous state, such as pentane, hexane, and heptane. At surface conditions, these will condense out of the gas to form natural gas condensate, often
Chapter 3 Natural Gas Overview 31
shortened to condensate. Condensate resembles gasoline in appearance and is similar in composition to some volatile light crude oils.
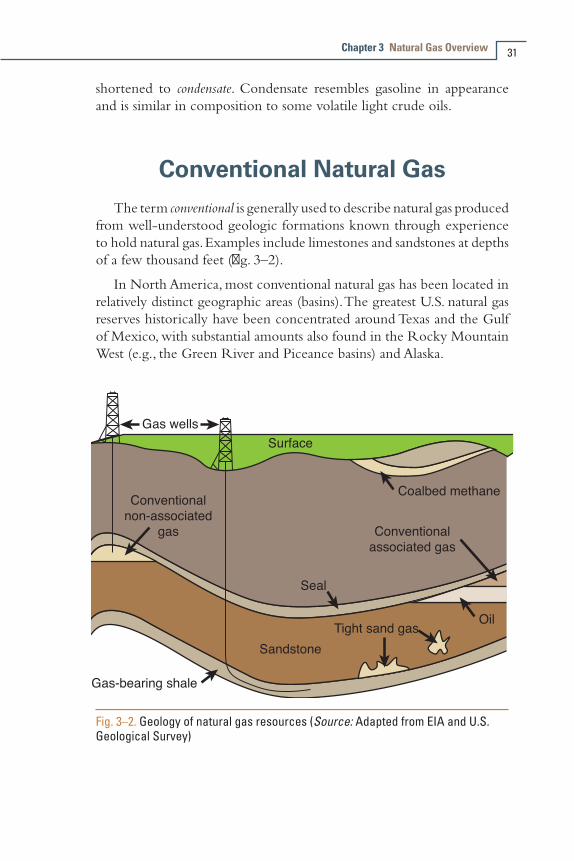
Conventional Natural GasThe term conventional is generally used to describe natural gas produced
from well-understood geologic formations known through experience to hold natural gas. Examples include limestones and sandstones at depths of a few thousand feet (fig. 3–2).
In North America, most conventional natural gas has been located in relatively distinct geographic areas (basins). The greatest U.S. natural gas reserves historically have been concentrated around Texas and the Gulf of Mexico, with substantial amounts also found in the Rocky Mountain West (e.g., the Green River and Piceance basins) and Alaska.
Fig. 3–2. Geology of natural gas resources (Source: Adapted from EIA and U.S. Geological Survey)
The Oil & Gas Industry: A Nontechnical Guide32
Conventional gas that is produced during the extraction of crude oil is commonly referred to as associated gas. By contrast, a formation targeted specifically for extraction of natural gas is said to yield nonassociated gas.
Unconventional Natural GasIn the broadest sense, unconventional natural gas is gas that cannot
be economically produced unless one or more technologies are used to stimulate the gas-bearing formation and to expose more of the formation to the wellbore. An unconventional gas reservoir can be deep or shallow, of high or low pressure and temperature, and can contain single or multiple layers.
What was unconventional yesterday can nevertheless become conventional tomorrow, as technology and geologic knowledge advance and as public policy changes (e.g., tax incentives to promote investment). For example, before 1978, unconventional natural gas deep in the Anadarko basin (centered in western Oklahoma and the Texas Panhandle) was virtually untouched, because it was neither economical nor technically possible to extract it. However, regulatory changes and passage of the Natural Gas Policy Act of 1978 provided incentives for searching for and extracting unconventional natural gas and spurred investment into deep exploration and development drilling. These changes made much of the deep gas in the basin conventionally extractable.
Today, there are six main categories of unconventional natural gas:•Deep gas
•Tight gas
• Shale gas
•Coal-bed methane
•Gas in geopressurized zones
•Methane hydrate

Chapter 3 Natural Gas Overview 33
Deep gasDeep gas is typically found 15,000 feet or deeper underground,
considerably deeper than conventional gas. Therefore, deep gas is relatively expensive to find and produce.
Tight gasTight gas is trapped in unusually impermeable hard rock or in
sandstone or limestone that is highly nonporous (tight sand). Extraction of gas from tight formations typically requires expensive techniques such as fracturing and acidizing.
Shale gasNatural gas can also exist in deposits of shale, a fine-grained and
soft sedimentary rock that breaks easily into thin, parallel layers. Gas is typically found in sections where two thick, black shale deposits “sandwich” a thinner area of shale. This gas can be held in naturally occurring fractures or in pore spaces, or it can be adsorbed onto the surface of the organic components of the shale.
Ordinarily, shales are not permeable enough to let significant amounts of gas or other fluids flow to a wellbore; for this reason, most shales are not commercially viable sources of natural gas. However, over the past 20 or so years, considerable improvements in technology—notably, directional and horizontal drilling and multistage hydraulic fracturing—have contributed toward bringing shale gas into the U.S. energy portfolio. Horizontally drilled wellbores—some as long as 10,000 feet—maximize the amount of borehole surface area in contact with the shale, while fracturing (as explained in chap. 5) creates artificial fissures in the shale that facilitate fluid flow from the formation into the wellbore.
Major gas shale plays in the United States are the Marcellus (Appalachia), Haynesville (Louisiana/Texas), Barnett (Texas), Fayetteville (Arkansas), Woodford (Oklahoma), Eagle Ford (Texas), and Antrim (Michigan). Major plays in Canada are the Horn River/Muskwa (northeast British Columbia), Colorado Group (west-central Saskatchewan/south-central Alberta), and Montney (Alberta).
As of 2008, the Barnett shale was already the source of about 6% of all natural gas produced in the Lower 48 states. More details on the extent of gas-bearing shales in the United States and in other countries are presented later in this chapter (in the “Resources and Reserves” section).

The Oil & Gas Industry: A Nontechnical Guide34
Productivity of shale gas wells
There is an emerging debate about how rapidly production from a typical shale gas well is likely to decline and whether that decline rate flattens out over time.
If the curve flattens out slowly, then shale gas wells will produce gas at a reasonably high rate and low cost over a long period of time. By contrast, if the curve declines more sharply and rapidly, then the ultimately recovered gas reserves from a shale formation could be significantly lower and the production costs could be higher.
For this reason, some experts argue that better models are needed to guide the commitment of financial resources to the continued development of gas-bearing shales.
Coal-bed methaneHistorically, methane was a nuisance and a safety hazard in the
coal-mining industry. As a coal mine is being built and coal extracted, methane held within the coal leaks out into the mine. This poses a safety threat because too high a concentration of methane creates dangerous conditions for coal miners. Thus, in the past, accumulating methane was intentionally vented to the atmosphere.
Today, however, coal-bed methane has become a popular form of unconventional natural gas, with many projects put in place around the world to extract and market it. In April 2011, the Potential Gas Committee (PGC) estimated that about 158.6 trillion cubic feet (tcf) of technically recoverable (probable, possible, and speculative) coal-bed methane existed in the United States at the end of 2010.1 (Based at the Colorado School of Mines for more than 40 years, the nonprofit PGC assesses U.S. natural gas resources annually.) In eastern Australia, coal-bed gas reserves (proved plus probable) grew from about 6 tcf in 2006 to about 27 tcf in 2010, according to Resource and Land Management Services, a consultancy based in Brisbane.
Geopressurized gasNatural geologic formations in which the pressure is higher than
would be expected for a given depth are said to be geopressurized. In these zones, layers of clay have been deposited and compacted quickly on top of sand or silt. The water and natural gas present in the clay have been
Chapter 3 Natural Gas Overview 35
squeezed out by the compression of the clay and have entered the more porous sand or silt deposits. Owing to this compression, the natural gas in the sand or silt is under very high pressure.
Geopressurized zones are typically quite deep, usually 10,000–25,000 feet below the surface of the earth. In the United States, they are located chiefly in the Gulf Coast region. It has been estimated that U.S. geopressurized zones could hold anywhere from 5,000 to 49,000 tcf of natural gas.
Methane hydrateAnother unconventional gas resource under evaluation for potential
production in the longer term is methane hydrate. Hydrate is typically a cold, slushlike, crystalline structure consisting of methane molecules trapped in a lattice of water molecules. Such hydrates are abundant in the Arctic (where they were first discovered) and in marine sediments, below the seabed.
Estimates of the worldwide methane hydrate resource vary from 7,000 to more than 73,000 tcf; however, these numbers are far from certain. Substantial additional research is needed to assess how hydrates form, interact with surrounding materials, behave during extraction operations, and potentially affect the environment.
In summary, unconventional natural gas constitutes a large proportion of the natural gas that is left to be extracted in North America and is playing an ever-increasing role in supplementing the U.S. natural gas supply. A study conducted by ICF International concluded that, in 2007, abut 42% of total U.S. natural gas production was from unconventional sources, and this figure is expected to rise to 64% in 2020.2
Unconventional natural gas also will play a major role in global energy markets. According to EIA, the full extent of the world’s tight gas, shale gas, and coal-bed methane resource base remains to be assessed fully. However, EIA projects a substantial increase in those supplies—especially in the United States, as well as in Canada and China.
EIA’s International Energy Outlook 2010 projects that shale gas alone could account for 26% of U.S. natural gas production in 2035. According to DOE, in Canada and China, tight gas, shale gas, and coal-bed methane are expected to account for 63% and 56% of total domestic production, respectively, in 2035.3
The Oil & Gas Industry: A Nontechnical Guide36
Liquefied natural gas (LNG)
In most discussions about natural gas, reference is made to liquefied natural gas (LNG). Importantly, LNG is not a naturally occurring gas resource. Rather, it is created by deeply cooling natural gas (typically to 260°F below zero).
The process transforms natural gas from gaseous to liquid form—increasing its energy density (Btu per cubic foot) by a factor of about 600—and makes possible the cost-effective shipment of the LNG in insulated tanker ships from gas production regions to major market regions.
The LNG is then unloaded from the tankers and regasified (i.e., warmed to convert it back into the gaseous state), treated to bring its composition into compliance with market specifications, and then distributed to users through conventional pipeline networks.
More details about LNG are presented in chapter 10.
Resources and ReservesA big story in 2011 concerning global natural gas resources was the
growing role of gas from unconventional resources—particularly the emergence of shale gas. In North America, the number of states with significant shale gas resources has increased. States with major shale gas potential include New York, Pennsylvania, Arkansas, and Oklahoma, as well as Texas and Louisiana. For example, in August 2011, the U.S. Geological Survey estimated that the Marcellus shale (underlying several Appalachian states) contains 84 tcf of gas and 3.4 billion barrels of natural gas liquids (undiscovered and technically recoverable). In Canada, shale gas developments are growing in the Horn River area of northeastern British Columbia, and prospective shale targets have been identified in Alberta, Saskatchewan, Ontario, Quebec, New Brunswick, and Nova Scotia.
Looking more widely, EIA has identified 48 shale basins with significant gas-bearing potential in more than 30 countries—from Australia, China, and India to eight European nations. At present, these resources are in various stages of assessment and development (table 3–2).4

Table 3–2. Estimated shale gas technically recoverable resources for selected basins in 32 countries Region/country Technically recoverable shale gas resources, tcf
Europe: France 180 Germany 8 Netherlands 17 Norway 83 United Kingdom 20 Denmark 23 Sweden 41 Poland 187 Turkey 15 Ukraine 42 Lithuania 4 Othera 19North America: United States 862 Canada 388 Mexico 681Asia: China 1,275 India 63 Pakistan 51Australia 396Africa: South Africa 485 Libya 290 Tunisia 18 Algeria 231 Morocco 11 Western Sahara 7South America: Venezuela 11 Colombia 19 Argentina 774 Brazil 226 Chile 64 Uruguay 21 Paraguay 62 Bolivia 48 Total 6,622Source: EIA a Includes Romania, Hungary, and Bulgaria.
The Oil & Gas Industry: A Nontechnical Guide38
In addition, a study released in May 2011 by the European Centre for Energy and Resource Security concluded that unconventional gas resources—notably shale gas—might “in theory . . . be able to cover European gas demand for at least another 60 years.” 5 Therefore, unconventional gas resources in Europe could reduce that region’s dependence on Russia and the Middle East.
With regard to the United States, EIA reported in April 2011 that U.S. proved (recoverable) reserves of natural gas (from all sources) are much higher than has previously been estimated—about 284 tcf in 2009 (the highest level since 1971).6 That figure (which includes natural-gas-plant liquids) reflects major improvements in shale gas exploration and production technologies.
In addition to proved reserves, there are large volumes of natural gas classified as undiscovered technically recoverable resources. Combining these two classifications of resources, EIA estimates that the United States possesses 2,552 tcf of potential natural gas resources. At the 2009 rate of consumption, that is enough gas to meet U.S. demand for about 110 years. EIA also reported that technically recoverable shale gas accounts for 827 tcf of this resource estimate, more than double the 353 tcf estimated in 2010.
Table 3–3 lists those nations with significant estimated natural gas reserves, as of January 1, 2012. Figure 3-3 provides another perspective on global distribution of proved natural gas reserves.
With regard to United States, tables 3–4 and 3–5 present information on gas reserves and gas production, respectively, for the U.S.-based companies that comprise the top 15 in domestic reserves and domestic production.

Table 3–3. Nations with largest estimated natural gas reserves, 2012Countrya Estimated proved gas reserves as of January 1, 2012,btcf
Russia 1,680.0Iran 1,168.0Qatar 890.0Saudi Arabia 283.0United States 272.5Turkmenistan 265.0Abu Dhabic 200.0Venezuela 195.1Nigeria 180.5Algeria 159.0Indonesia 141.1Iraq 111.5China 107.0Kazakhstan 85.0Malaysia 83.0Egypt 77.2Norway 70.9Uzbekistan 65.0Kuwait 63.0Canada 61.0Libya 52.8Source: Oil & Gas Journal, January 1, 2012, survey data. a Only nations with at least 50 tcf of estimated reserves are shown. b All reserves are reported as proved reserves recoverable with current technology and prices except for Russia and Canada, for which figures includes proved plus some probable. c Abu Dhabi has 93.0% of the gas reserves of the seven United Arab Emirates.
Fig. 3–3. Distribution of proved worldwide natural gas reserves (in %): 1989, 1999, and 2009 (Source: BP Statistical Review of World Energy 2011, June 2011)
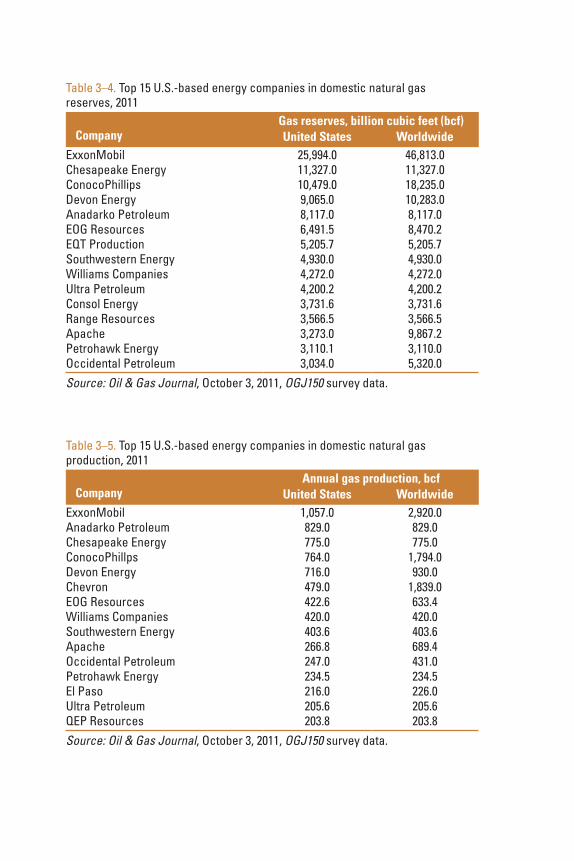
Table 3–4. Top 15 U.S.-based energy companies in domestic natural gas reserves, 2011
CompanyGas reserves, billion cubic feet (bcf)United States Worldwide
ExxonMobil 25,994.0 46,813.0Chesapeake Energy 11,327.0 11,327.0ConocoPhillips 10,479.0 18,235.0Devon Energy 9,065.0 10,283.0Anadarko Petroleum 8,117.0 8,117.0EOG Resources 6,491.5 8,470.2EQT Production 5,205.7 5,205.7Southwestern Energy 4,930.0 4,930.0Williams Companies 4,272.0 4,272.0Ultra Petroleum 4,200.2 4,200.2Consol Energy 3,731.6 3,731.6Range Resources 3,566.5 3,566.5Apache 3,273.0 9,867.2Petrohawk Energy 3,110.1 3,110.0Occidental Petroleum 3,034.0 5,320.0Source: Oil & Gas Journal, October 3, 2011, OGJ150 survey data.
Table 3–5. Top 15 U.S.-based energy companies in domestic natural gas production, 2011
CompanyAnnual gas production, bcf
United States WorldwideExxonMobil 1,057.0 2,920.0Anadarko Petroleum 829.0 829.0Chesapeake Energy 775.0 775.0ConocoPhillps 764.0 1,794.0Devon Energy 716.0 930.0Chevron 479.0 1,839.0EOG Resources 422.6 633.4Williams Companies 420.0 420.0Southwestern Energy 403.6 403.6Apache 266.8 689.4Occidental Petroleum 247.0 431.0Petrohawk Energy 234.5 234.5El Paso 216.0 226.0Ultra Petroleum 205.6 205.6QEP Resources 203.8 203.8Source: Oil & Gas Journal, October 3, 2011, OGJ150 survey data.

Chapter 3 Natural Gas Overview 41
Recent Trends in Gas ProductionFigure 3–4 shows the trend in global natural gas production from
1995 to 2009, based on data compiled by BP.7 Following more than a decade of steady increase, gas production fell by 2.1% in 2009, the first decline on record. Production fell sharply in Russia (by 2.62 tcf) and Turkmenistan (by 1.05 tcf)—in each case, the largest decline on record. The global decline reflected the impact of the worldwide recession that began in late 2008. (Gas production in the United States actually increased in every year from 2007 to 2009, as noted below.)
As shown in figure 3–5, natural gas production in the United States grew from 1995 to 2001, then fell back to about the 1995 level for 2004 to 2005. However, in 2006, growth resumed for three straight years, and production reached just under 21 tcf in 2009. Driving that growth of 2006–2009 was the increasing contribution from gas shales (coupled with continued strong production of gas from tight formations). The combination of horizontal drilling and hydraulic fracturing technologies has made it possible to produce shale gas economically, leading to an average annual growth rate in production from that resource of 48% from 2006 to 2010.8
Europe and Eurasia
Asia-Paci�c
Africa
Middle East
North America
South and Central America
Fig. 3–4. Annual global natural gas production (in tcf), 1995–2009 (Source: BP Statistical Review of World Energy 2010, June 2010)
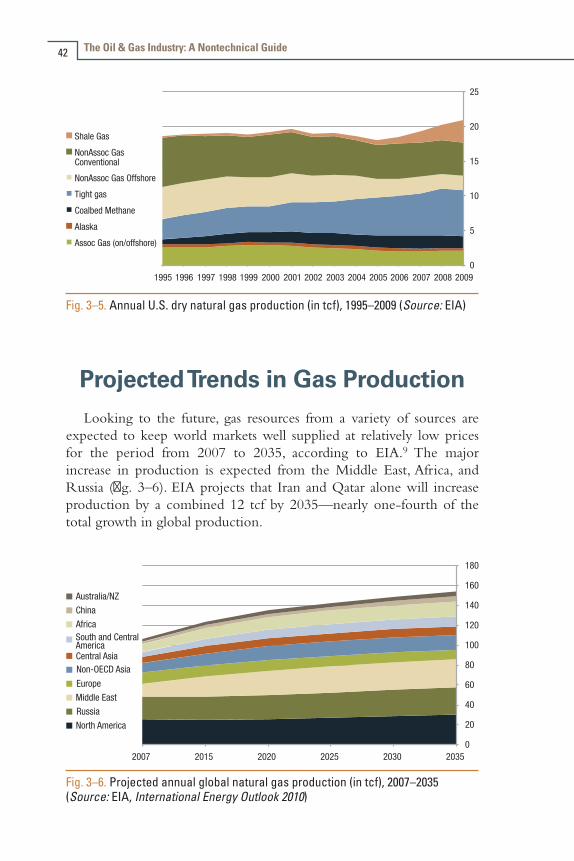
The Oil & Gas Industry: A Nontechnical Guide42
Fig. 3–5. Annual U.S. dry natural gas production (in tcf), 1995–2009 (Source: EIA)
Projected Trends in Gas ProductionLooking to the future, gas resources from a variety of sources are
expected to keep world markets well supplied at relatively low prices for the period from 2007 to 2035, according to EIA.9 The major increase in production is expected from the Middle East, Africa, and Russia (fig. 3–6). EIA projects that Iran and Qatar alone will increase production by a combined 12 tcf by 2035—nearly one-fourth of the total growth in global production.
South and Central America
North America
Australia/NZ
China
Non-OECD Asia
Russia
Middle East
Central Asia
Europe
Africa
Fig. 3–6. Projected annual global natural gas production (in tcf), 2007–2035 (Source: EIA, International Energy Outlook 2010)

Chapter 3 Natural Gas Overview 43
Tight sands, gas-bearing shales, and coal beds are expected to make major contributions to growth in gas production—and not just in the United States. For example, these three resources are expected to account for 63% of total domestic production in Canada and 56% in China in 2035.
In the United States, total domestic natural gas production is projected to grow from about 21 tcf in 2009 to 26.3 tcf in 2035 (fig. 3–7), with shale gas more than offsetting a decline in production of conventional natural gas. Shale gas production is expected to grow more than fivefold over the analysis period, reaching 12.2 tcf to account for 46% of all domestic U.S. gas production in 2035.
As noted earlier, EIA estimates U.S. technically recoverable unproved shale gas resources at 827 tcf. Although more information has become available as a result of increased drilling activity in developing shale gas plays, EIA has cautioned that estimates of technically recoverable resources and well productivity remain highly uncertain. Also note that gas from tight formations is expected to be a major contributor to U.S. production through 2035.
Shale
Tight
L-48 Onshore Conv
L-48 Offshore
Coal-bed
Alaska
Fig. 3–7. Projected annual U.S. dry natural gas production (in tcf), 2007–2035 (Source: EIA, AEO2011)
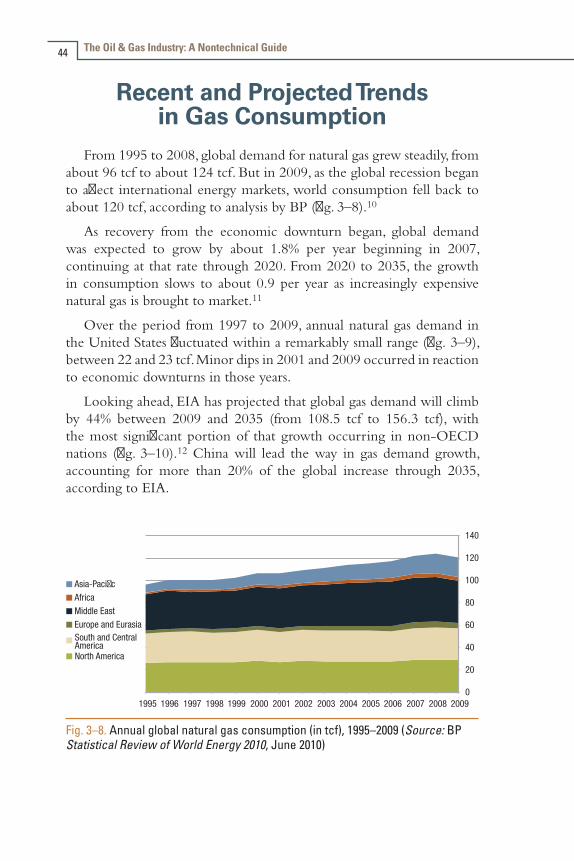
The Oil & Gas Industry: A Nontechnical Guide44
Recent and Projected Trends in Gas Consumption
From 1995 to 2008, global demand for natural gas grew steadily, from about 96 tcf to about 124 tcf. But in 2009, as the global recession began to affect international energy markets, world consumption fell back to about 120 tcf, according to analysis by BP (fig. 3–8).10
As recovery from the economic downturn began, global demand was expected to grow by about 1.8% per year beginning in 2007, continuing at that rate through 2020. From 2020 to 2035, the growth in consumption slows to about 0.9 per year as increasingly expensive natural gas is brought to market.11
Over the period from 1997 to 2009, annual natural gas demand in the United States fluctuated within a remarkably small range (fig. 3–9), between 22 and 23 tcf. Minor dips in 2001 and 2009 occurred in reaction to economic downturns in those years.
Looking ahead, EIA has projected that global gas demand will climb by 44% between 2009 and 2035 (from 108.5 tcf to 156.3 tcf), with the most significant portion of that growth occurring in non-OECD nations (fig. 3–10).12 China will lead the way in gas demand growth, accounting for more than 20% of the global increase through 2035, according to EIA.
North America
Asia-Paci�c
Middle East
Europe and Eurasia
Africa
South and Central America
Fig. 3–8. Annual global natural gas consumption (in tcf), 1995–2009 (Source: BP Statistical Review of World Energy 2010, June 2010)
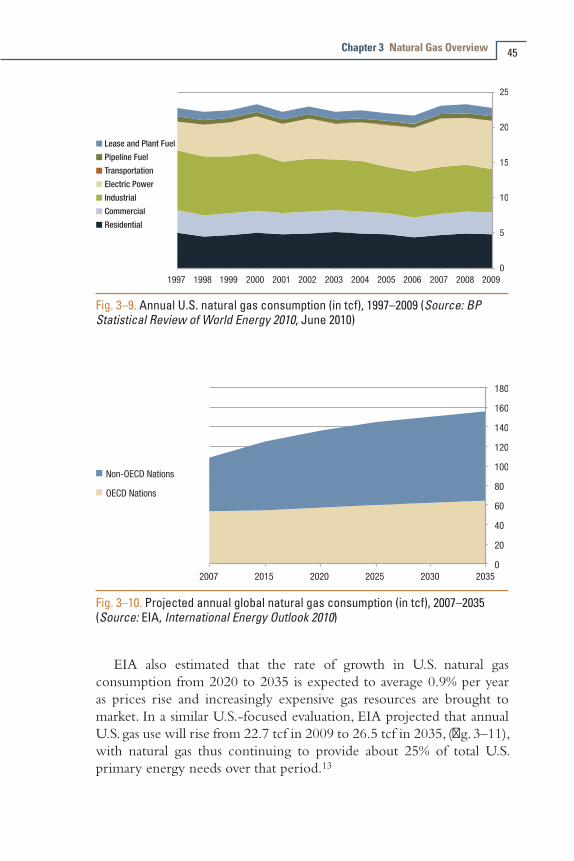
Chapter 3 Natural Gas Overview 45
Lease and Plant Fuel
Pipeline Fuel
Transportation
Electric Power
Industrial
Commercial
Residential
Fig. 3–9. Annual U.S. natural gas consumption (in tcf), 1997–2009 (Source: BP Statistical Review of World Energy 2010, June 2010)
Fig. 3–10. Projected annual global natural gas consumption (in tcf), 2007–2035 (Source: EIA, International Energy Outlook 2010)
EIA also estimated that the rate of growth in U.S. natural gas consumption from 2020 to 2035 is expected to average 0.9% per year as prices rise and increasingly expensive gas resources are brought to market. In a similar U.S.-focused evaluation, EIA projected that annual U.S. gas use will rise from 22.7 tcf in 2009 to 26.5 tcf in 2035, (fig. 3–11), with natural gas thus continuing to provide about 25% of total U.S. primary energy needs over that period.13
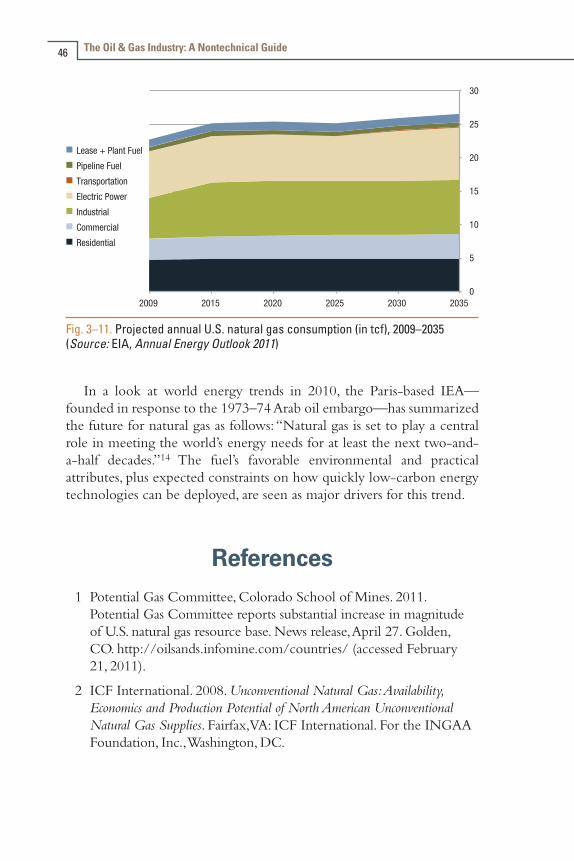
The Oil & Gas Industry: A Nontechnical Guide46
Fig. 3–11. Projected annual U.S. natural gas consumption (in tcf), 2009–2035 (Source: EIA, Annual Energy Outlook 2011)
In a look at world energy trends in 2010, the Paris-based IEA—founded in response to the 1973–74 Arab oil embargo—has summarized the future for natural gas as follows: “Natural gas is set to play a central role in meeting the world’s energy needs for at least the next two-and-a-half decades.”14 The fuel’s favorable environmental and practical attributes, plus expected constraints on how quickly low-carbon energy technologies can be deployed, are seen as major drivers for this trend.
References 1 Potential Gas Committee, Colorado School of Mines. 2011.
Potential Gas Committee reports substantial increase in magnitude of U.S. natural gas resource base. News release, April 27. Golden, CO. http://oilsands.infomine.com/countries/ (accessed February 21, 2011).
2 ICF International. 2008. Unconventional Natural Gas: Availability, Economics and Production Potential of North American Unconventional Natural Gas Supplies. Fairfax, VA: ICF International. For the INGAA Foundation, Inc., Washington, DC.
Chapter 3 Natural Gas Overview 47
3 U.S. Department of Energy, Energy Information Administration. 2010. International Energy Outlook 2010. Washington, DC: U.S. Department of Energy.
4 U.S. Department of Energy, Energy Information Administration. 2011. World Shale Gas Resources: An Initial Assessment of 14 Regions Outside the United States. Washington, DC: U.S. Department of Energy.
5 Kuhn, M., and F. Umbach. 2011. Strategic perspectives of unconventional gas: A game changer with implications for the EU’s energy security. London: European Centre for Energy and Resource Security (EUCERS) at King’s College.
6 U.S. Department of Energy, Energy Information Administration. 2011. Annual Energy Outlook 2011. Washington, DC: Department of Energy.
7 BP. Statistical Review of World Energy 2010. June 2010. London.
8 EIA. Annual Energy Outlook 2011.
9 EIA. International Energy Outlook 2010.
10 BP. Statistical Review of World Energy 2010.
11 EIA. International Energy Outlook 2010.
12 Ibid.
13 EIA. Annual Energy Outlook 2011.
14 International Energy Agency. 2010. World Energy Outlook: 2010 Edition. Paris.

Searching for and Evaluating Oil and Gas
Firms engaged in oil and gas exploration and development (E&D) face a daunting task. Drilling a single well on land can cost hundreds of thousands of dollars. Even more daunting, the capital investment needed to develop a medium-sized offshore field (e.g., with 100 million barrels of recoverable reserves) is on the order of $1 billion, depending on water depth, well depth, and geologic parameters.
Based on many decades of experience (their own and that of others), firms have identified in general terms those regions in which important oil-bearing formations may be found. In addition, they can use a variety of technical tools and procedures (described below) to pinpoint and analyze more accurately hydrocarbon deposits in a specific field or formation that shows promise. Beyond these geologic parameters and the related technical assessment, how does a company determine just where and when to undertake its next exploratory or developmental drilling program?
This chapter provides information on the technical assessment of potential hydrocarbon-bearing formations, the legal and contractual aspects of obtaining the right to explore for and develop such formations, and the economic and risk-assessment methods used by the petroleum industry to guide decision-making.
Obtaining Rights to Explore for and Produce Oil and Gas
The ownership or control of an area of interest (onshore or offshore) may rest with a government, a business entity, or an individual. For that reason, an E&D firm must enter into a business arrangement that will define the rights and obligations of all parties before exploratory drilling begins. In view of the risks involved, oil companies often establish joint
4

The Oil & Gas Industry: A Nontechnical Guide50
ventures or joint operating agreements, with one firm in the partnership designated as the operator who actually supervises the work.
In the United States, most onshore oil, gas, and mineral (OGM) rights are owned by private individuals. Sometimes this is not the same person who owns the surface rights. In this case, a company must negotiate terms for a lease with the individual who owns the OGM rights.
Exploration of offshore and remote areas is generally undertaken only by very large corporations or national governments. In most nations, the government issues licenses to explore, develop, and produce its oil and gas resources. The licenses are typically administered by an oil ministry. Discussion here will focus on cases in which a government owns or controls the region of interest (and, by implication, the hydrocarbon resources that may lie beneath it).
Exploration and production licenses are awarded in competitive bid rounds and are typically based on the size of the work program proposed (e.g., the number of wells to be drilled or the level of seismic survey activity undertaken). Two kinds of license arrangements are commonly used by the oil and gas industry around the world: production-sharing agreements and service or production contracts.
Production-sharing agreementThe production-sharing agreement (PSA; also called a production-
sharing contract [PSC]) is the most widely used business arrangement. Under a PSA, a government awards to a company the right to explore for and to produce hydrocarbons. The oil company bears the technical and financial risk of the initiative as it undertakes exploration, development, and ultimately production. If its efforts are successful, the company is allowed to use the money from sale of the produced oil to recover capital and operational expenses. The remainder is split between the government and the company according to a predetermined ratio. Under some PSAs, changes in international oil and gas prices or production rates can affect the share of production awarded to the company.
PSAs can be of benefit to governments that lack the expertise or capital to develop their resources and wish to attract foreign companies to do so. While they can be quite profitable for the companies involved, PSAs often involve considerable risk.
Service contractUnder a service contract, an E&D company acts as a contractor for
the host government and is paid to produce the hydrocarbons.

Chapter 4 Searching for and Evaluating Oil and Gas 51
Production contractUnder a production contract, a company takes over an existing or
underdeveloped field, works to improve production, and is paid an amount based on an agreed-to portion of the increased production. In some cases, a government will claim a royalty interest on any oil that a company produces. This gives the government the right to collect a stream of future payments, typically a percentage of the value of the oil produced. In addition, the government may impose taxes on profits realized by the company as a result of its oil production.
A government also may demand payment of various bonuses and fees. One example is a signature bonus, to be paid by the company at the start of the license.
Exploration ActivitiesOnce exploration rights have been established and related business
issues negotiated, the technical work of finding and evaluating promising oil- and gas-bearing formations can begin. In decades past, companies would look for evidence of seepage at the surface, indicating the presence of hydrocarbons below the surface (fig. 4–1). As noted by API, “their tools were simple, their wells were shallow, and luck was a big part of the game.”1 Today, exploration and production (E&P) firms use a variety of advanced tools and techniques to gain a detailed picture of the subsurface.
Oil or gas
Shale or other source rock
Non-porousrock
Fig. 4–1. Migration of oil and gas in a sedimentary basin (Source: Hyne, N. J.)
The Oil & Gas Industry: A Nontechnical Guide52
Geologic methodsGeologic techniques involve mapping and sampling of rock formations
that outcrop at the earth’s surface. Geologic information about an area is sometimes available from geologic agencies, based on earlier drilling activities for such resources as water, brine, coal, and minerals. These data can provide clues about the fluid content, porosity, permeability, age, and formation sequence (layering) of subsurface rocks.
Geochemical methodsVisible surface features—oil or natural gas seeps on the ground,
or specific geologic features on the seafloor—sometimes indicate the presence of deep or shallow hydrocarbon deposits. Geochemical methods can evaluate the chemical and bacterial properties of the soil above suspected oil and gas reservoirs, looking for changes induced by the slow escape and upward migration of hydrocarbons.
Geophysical methodsGeophysical analysis can help to determine subsurface strata depth,
thickness, and rock properties. These geophysical procedures include gravimetry, magnetometry, and seismography. (More details about each method are provided in the sections below.)
Seismographic techniques are widely used because they yield the most useful information about rock structures. In particular, the can identify traps capable of containing oil and gas. (Traps are described in detail in chap. 1.)
Survey Methods
Gravimetric surveyIn a gravimetric survey, geophysicists measure variations in
gravitational force. These variations give clues about the properties and extent of subsurface structures.
Magnetic surveyA magnetic survey measures minute variations in the strength and
direction of the earth’s magnetic field. This can also provide information about subsurface rock structures.
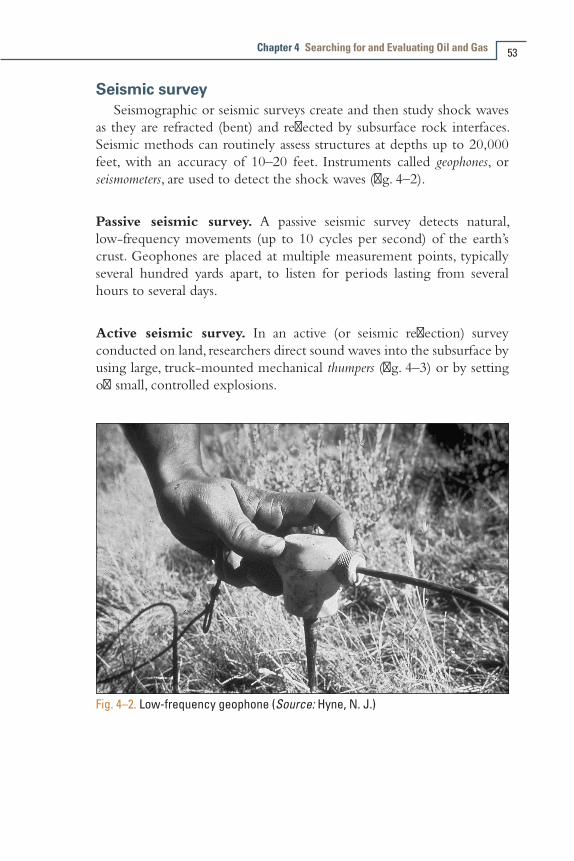
Chapter 4 Searching for and Evaluating Oil and Gas 53
Seismic surveySeismographic or seismic surveys create and then study shock waves
as they are refracted (bent) and reflected by subsurface rock interfaces. Seismic methods can routinely assess structures at depths up to 20,000 feet, with an accuracy of 10–20 feet. Instruments called geophones, or seismometers, are used to detect the shock waves (fig. 4–2).
Passive seismic survey. A passive seismic survey detects natural, low-frequency movements (up to 10 cycles per second) of the earth’s crust. Geophones are placed at multiple measurement points, typically several hundred yards apart, to listen for periods lasting from several hours to several days.
Active seismic survey. In an active (or seismic reflection) survey conducted on land, researchers direct sound waves into the subsurface by using large, truck-mounted mechanical thumpers (fig. 4–3) or by setting off small, controlled explosions.
Fig. 4–2. Low-frequency geophone (Source: Hyne, N. J.)
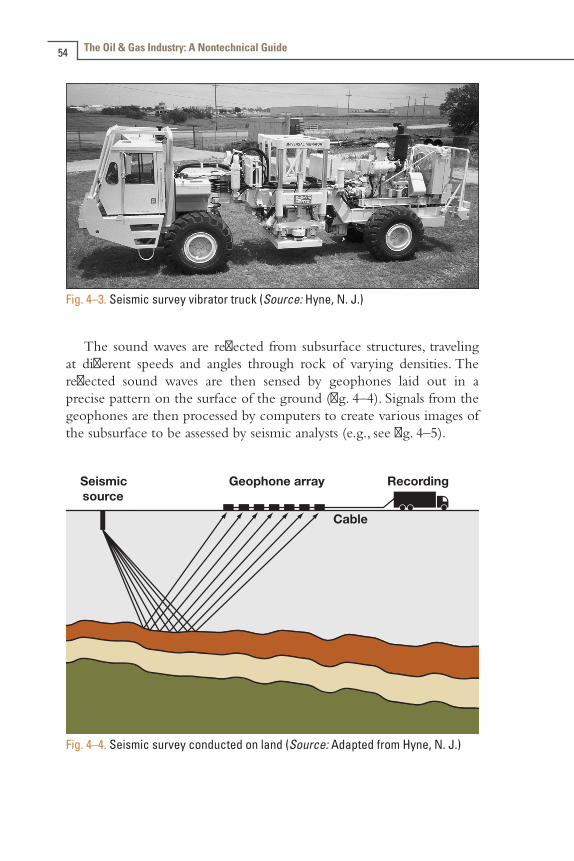
The Oil & Gas Industry: A Nontechnical Guide54
Fig. 4–3. Seismic survey vibrator truck (Source: Hyne, N. J.)
The sound waves are reflected from subsurface structures, traveling at different speeds and angles through rock of varying densities. The reflected sound waves are then sensed by geophones laid out in a precise pattern on the surface of the ground (fig. 4–4). Signals from the geophones are then processed by computers to create various images of the subsurface to be assessed by seismic analysts (e.g., see fig. 4–5).
Fig. 4–4. Seismic survey conducted on land (Source: Adapted from Hyne, N. J.)

Chapter 4 Searching for and Evaluating Oil and Gas 55
Fig. 4–5. Seismic record from Wind River basin, Wyoming (Source: Hyne, N. J.)
Offshore, an active seismic survey is conducted by a specially designed vessel that tows two kinds of equipment as it moves slowly across the water (fig. 4–6). The first type is a sound source (typically, an air gun), mounted close to the stern, that directs sound energy toward the ocean floor. The second type is a long plastic tube, called a streamer, that can stretch for up to five miles behind the vessel.
Fig. 4–6. Seismic survey conducted offshore (Source: Hyne, N. J.)
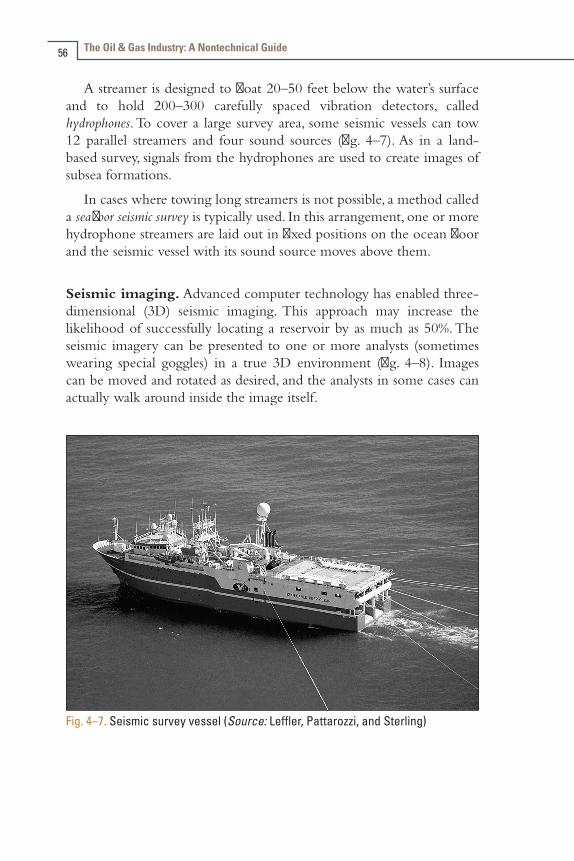
The Oil & Gas Industry: A Nontechnical Guide56
A streamer is designed to float 20–50 feet below the water’s surface and to hold 200–300 carefully spaced vibration detectors, called hydrophones. To cover a large survey area, some seismic vessels can tow 12 parallel streamers and four sound sources (fig. 4–7). As in a land-based survey, signals from the hydrophones are used to create images of subsea formations.
In cases where towing long streamers is not possible, a method called a seafloor seismic survey is typically used. In this arrangement, one or more hydrophone streamers are laid out in fixed positions on the ocean floor and the seismic vessel with its sound source moves above them.
Seismic imaging. Advanced computer technology has enabled three-dimensional (3D) seismic imaging. This approach may increase the likelihood of successfully locating a reservoir by as much as 50%. The seismic imagery can be presented to one or more analysts (sometimes wearing special goggles) in a true 3D environment (fig. 4–8). Images can be moved and rotated as desired, and the analysts in some cases can actually walk around inside the image itself.
Fig. 4–7. Seismic survey vessel (Source: Leffler, Pattarozzi, and Sterling)
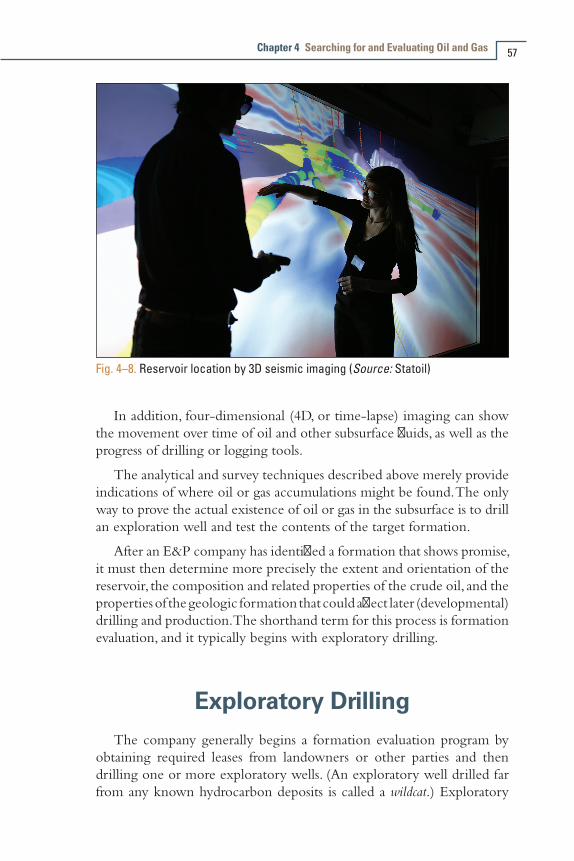
Chapter 4 Searching for and Evaluating Oil and Gas 57
Fig. 4–8. Reservoir location by 3D seismic imaging (Source: Statoil)
In addition, four-dimensional (4D, or time-lapse) imaging can show the movement over time of oil and other subsurface fluids, as well as the progress of drilling or logging tools.
The analytical and survey techniques described above merely provide indications of where oil or gas accumulations might be found. The only way to prove the actual existence of oil or gas in the subsurface is to drill an exploration well and test the contents of the target formation.
After an E&P company has identified a formation that shows promise, it must then determine more precisely the extent and orientation of the reservoir, the composition and related properties of the crude oil, and the properties of the geologic formation that could affect later (developmental) drilling and production. The shorthand term for this process is formation evaluation, and it typically begins with exploratory drilling.
Exploratory DrillingThe company generally begins a formation evaluation program by
obtaining required leases from landowners or other parties and then drilling one or more exploratory wells. (An exploratory well drilled far from any known hydrocarbon deposits is called a wildcat.) Exploratory

The Oil & Gas Industry: A Nontechnical Guide58
drilling is undertaken to locate probable mineral deposits or to establish the nature of geologic structures. Such wells may not be capable of production if minerals are discovered.
(Chapter 6 discusses development drilling. In contrast to exploratory drilling, development drilling is conducted to delineate the boundaries of a known mineral deposit to increase the productive capacity of the formation.)
Selecting the number and location of exploratory wells is critical, because drilling is very expensive. Onshore wells can cost as much as $15 million depending on well depth, while a 100-day offshore drilling program in deep water can cost $100 million.
The process can also be time-consuming. An API study found that it could take as few as 3 years or as many as 10 years to explore, develop, and begin production from an oil or gas lease on federal lands in the U.S. Intermountain West.2
DOE tracks the number of wells drilled each year in the United States. Data for recent years are shown in figure 4–9 and table 4–1.
It is difficult to generalize about the success rate of exploratory drilling because of wide variety in the type of formations and locations where such projects are undertaken. However, API has stated that the exploration drilling success rate nearly tripled from 1990 to 2007 (from about 26% to 71%) owing to advances in technology.3 DOE reported a success rate of 65.1% in 2008.4
Fig. 4–9. U.S. exploratory wells drilled (oil and gas): 1995–2000 (Source: EIA)
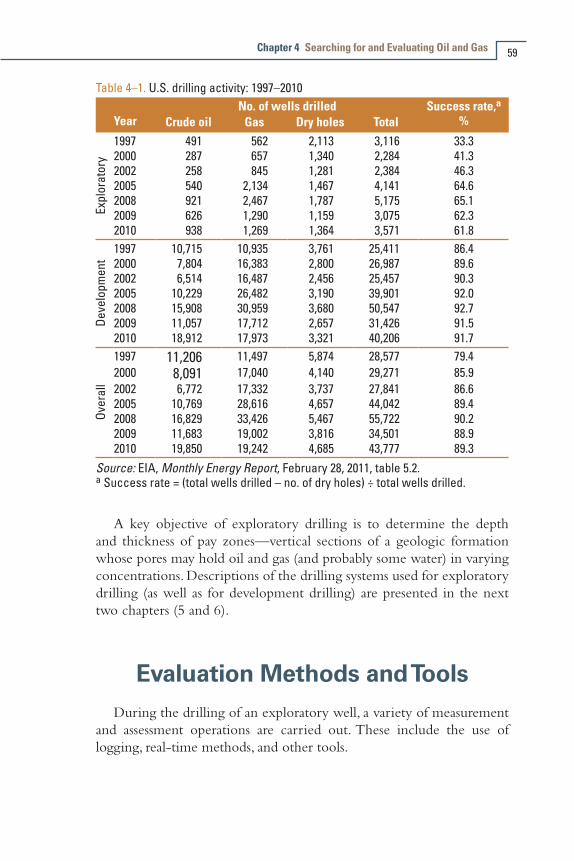
Chapter 4 Searching for and Evaluating Oil and Gas 59
Table 4–1. U.S. drilling activity: 1997–2010
YearNo. of wells drilled Success rate,a
%Crude oil Gas Dry holes Total
Expl
orat
ory
1997 491 562 2,113 3,116 33.32000 287 657 1,340 2,284 41.32002 258 845 1,281 2,384 46.32005 540 2,134 1,467 4,141 64.62008 921 2,467 1,787 5,175 65.12009 626 1,290 1,159 3,075 62.32010 938 1,269 1,364 3,571 61.8
Deve
lopm
ent
1997 10,715 10,935 3,761 25,411 86.42000 7,804 16,383 2,800 26,987 89.62002 6,514 16,487 2,456 25,457 90.32005 10,229 26,482 3,190 39,901 92.02008 15,908 30,959 3,680 50,547 92.72009 11,057 17,712 2,657 31,426 91.52010 18,912 17,973 3,321 40,206 91.7
Over
all
1997 11,206 11,497 5,874 28,577 79.42000 8,091 17,040 4,140 29,271 85.92002 6,772 17,332 3,737 27,841 86.62005 10,769 28,616 4,657 44,042 89.42008 16,829 33,426 5,467 55,722 90.22009 11,683 19,002 3,816 34,501 88.92010 19,850 19,242 4,685 43,777 89.3
Source: EIA, Monthly Energy Report, February 28, 2011, table 5.2. a Success rate = (total wells drilled – no. of dry holes) ÷ total wells drilled.
A key objective of exploratory drilling is to determine the depth and thickness of pay zones—vertical sections of a geologic formation whose pores may hold oil and gas (and probably some water) in varying concentrations. Descriptions of the drilling systems used for exploratory drilling (as well as for development drilling) are presented in the next two chapters (5 and 6).
Evaluation Methods and ToolsDuring the drilling of an exploratory well, a variety of measurement
and assessment operations are carried out. These include the use of logging, real-time methods, and other tools.
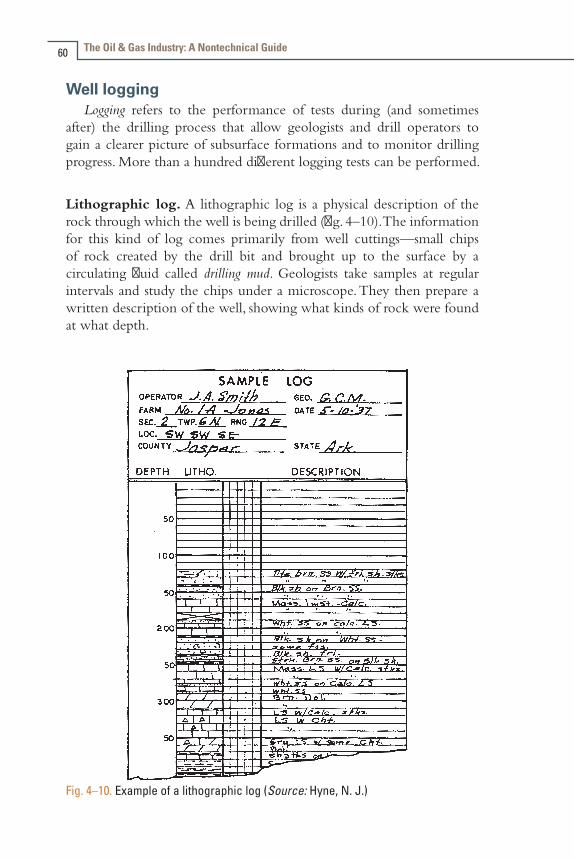
The Oil & Gas Industry: A Nontechnical Guide60
Well loggingLogging refers to the performance of tests during (and sometimes
after) the drilling process that allow geologists and drill operators to gain a clearer picture of subsurface formations and to monitor drilling progress. More than a hundred different logging tests can be performed.
Lithographic log. A lithographic log is a physical description of the rock through which the well is being drilled (fig. 4–10). The information for this kind of log comes primarily from well cuttings—small chips of rock created by the drill bit and brought up to the surface by a circulating fluid called drilling mud. Geologists take samples at regular intervals and study the chips under a microscope. They then prepare a written description of the well, showing what kinds of rock were found at what depth.
Fig. 4–10. Example of a lithographic log (Source: Hyne, N. J.)

Chapter 4 Searching for and Evaluating Oil and Gas 61
A more precise lithographic log may be desired for a subsurface interval of interest. To prepare such a log, workers can use a special drill to extract a core—a cylinder of rock typically two to five inches in diameter and 20–90 feet long—and bring it to the surface intact for study.
In rotary coring, the bottom end of the drill (fig. 4–11) has a bit comprising sharp teeth of tungsten steel or industrial diamonds arranged around its outer edge. It cuts in a circle around the outside of the wellbore. As the drill moves downward, the rock core passes up through the hollow bit and into a cylinder called a core barrel, mounted right above the bit.
Fig. 4–11. Rotary coring drill bit (Source: Hyne, N. J.)
Alternatives to rotary coring punch or drill holes outward into the rock formation, perpendicular to the wellbore. One such approach is percussion sidewall coring, in which multiple small core tubes, or bullets, are fired into the sidewall to take samples. The tubes are then pulled back into the coring tool by wires and brought back up to the surface for study.
Another alternative is rotary sidewall drilling. As the name implies, a small rotating bit drills into the sidewall to obtain a sample. The drill bit

The Oil & Gas Industry: A Nontechnical Guide62
can be moved to take multiple samples, each of which is captured and segregated within the tool prior to retrieval.
Normal drilling must be suspended to conduct a coring operation, so the process is expensive. In addition, the deeper the well, the more expensive it is to obtain a core sample.
Drill-time log. A drill-time log, as the name implies, records the rate of penetration (ROP) of the drill as it moves down through the rock layers. Drilling time is a function of both drilling parameters (e.g., drill rotation, weight on the drill bit, and type of bit) and rock properties. Assuming drilling parameters are held constant, changes in ROP can indicate a change in the type of rock encountered by the bit.
Mud log. A mud log records the chemical analysis of drilling mud and well cuttings as a well is being drilled, looking for traces of hydrocarbons. Correlating this analysis with drilling depth can help to pinpoint rock formations that bear gas or oil.
Wireline logs. Several kinds of analyses can be conducted with wireline logs. Instruments of various kinds are mounted inside a special cylinder called a sonde—typically 25–75 feet long and 3–10 inches in diameter—that is moved slowly up and down a well on a flexible electrical cable, or wireline. In preparation for wireline logging, the drill string is removed, and the wellbore is typically filled with drilling mud.
Electrical, radiation-based, acoustic, and ultrasonic instruments record such parameters as resistivity, rock type, porosity (and pore size), density, fluids content, and even the orientation of layers in the rock (table 4–2). Signals from the sonde are transmitted through the wireline to the surface, where they are recorded. From these data, logs are created that shows the continuously recorded measurements, at all points, throughout the depth of the well. The logs help to determine the extent and continuity of reservoirs and to assess the magnitude of oil and gas reserves.
Real-time methodsAs noted above, wireline logging is done after a well has been drilled.
However, companies can also now take real-time measurements and conduct logging while drilling.
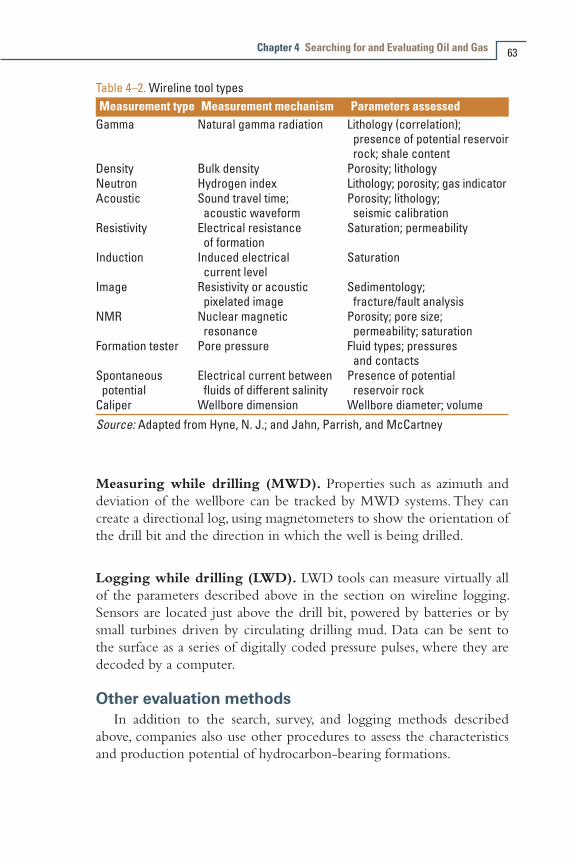
Chapter 4 Searching for and Evaluating Oil and Gas 63
Table 4–2. Wireline tool typesMeasurement type Measurement mechanism Parameters assessed
Gamma Natural gamma radiation Lithology (correlation); presence of potential reservoir rock; shale content
Density Bulk density Porosity; lithologyNeutron Hydrogen index Lithology; porosity; gas indicatorAcoustic Sound travel time;
acoustic waveformPorosity; lithology;
seismic calibrationResistivity Electrical resistance
of formationSaturation; permeability
Induction Induced electrical current level
Saturation
Image Resistivity or acoustic pixelated image
Sedimentology; fracture/fault analysis
NMR Nuclear magnetic resonance
Porosity; pore size; permeability; saturation
Formation tester Pore pressure Fluid types; pressures and contacts
Spontaneous potential
Electrical current between fluids of different salinity
Presence of potential reservoir rock
Caliper Wellbore dimension Wellbore diameter; volumeSource: Adapted from Hyne, N. J.; and Jahn, Parrish, and McCartney
Measuring while drilling (MWD). Properties such as azimuth and deviation of the wellbore can be tracked by MWD systems. They can create a directional log, using magnetometers to show the orientation of the drill bit and the direction in which the well is being drilled.
Logging while drilling (LWD). LWD tools can measure virtually all of the parameters described above in the section on wireline logging. Sensors are located just above the drill bit, powered by batteries or by small turbines driven by circulating drilling mud. Data can be sent to the surface as a series of digitally coded pressure pulses, where they are decoded by a computer.
Other evaluation methodsIn addition to the search, survey, and logging methods described
above, companies also use other procedures to assess the characteristics and production potential of hydrocarbon-bearing formations.

The Oil & Gas Industry: A Nontechnical Guide64
Cuttings evaluation. As noted above in the section on lithographic logs, the analysis of rock cuttings (also called well cuttings) are an important evaluation tool. During well drilling, rock cuttings are usually collected every one to five feet. These cuttings are small fragments of rock that provide clues as to the presence of hydrocarbons; they are examined closely for evidence (“shows”) of oil and gas.
Cuttings and cores also are useful in evaluating the conditions under which the rock layers were first formed and later transformed to provide favorable conditions for hydrocarbon generation, accumulation, and trapping.
Drill stem flow testing. Drill stem flow testing is the direct sampling of a portion of a well to check for the presence of oil or gas. A vertical section (pay zone) of the well is temporarily completed (sealed above and below the zone to be tested); drilling mud is removed; and water, gas, and oil are allowed to flow into the section. A valve on the drill stem tool allows these fluids to flow into the tool. Any gas present will generally flow up through the tool (and the drill string above it) to the surface for measurement. Oil may do the same if formation pressure is sufficient, or it may just fill the drill stem to a certain level that is measured later.
Pressure within the drill stem tool is continuously monitored. The tool’s valve is opened and closed several times, and a record of pressure change is made for a period of time that can range from a few minutes to a few days. The pressure record can help determine permeability, reservoir fluid pressure, and the presence of any damage to the formation.
After drill stem testing ends, drilling can resume.
In summary, data gathered in the exploratory drilling phase and the subsequent formation evaluation process are used to decide whether to go ahead with a development (production-oriented) drilling program. A company must determine whether the oil or gas resources it has found are sufficiently large and of sufficient quality that they can be profitably produced.

Chapter 4 Searching for and Evaluating Oil and Gas 65
Making the Decision to Begin Production
A variety of tools have been created for analysis of the economics of hydrocarbon development and the assessment of related risks. As noted above, development of an oil or gas project is, by definition, a high-cost venture with many significant uncertainties.
Although it is beyond the scope of this book to describe these tools in detail, the following sections provide a broad picture of the issues that they address. Note that no attention is given to the economics and risk of “start-from-scratch” exploratory activity—which, despite major financial investment, can result in zero return if no commercially producible oil or gas accumulations are found.
Development economicsAt the outset of a project, discussion with key stakeholders can
be vital to identify opportunities for collaboration, potential issues of concern, and procedures for obtaining needed approvals. Stakeholders may include government and regulatory bodies, development partners, neighboring property holders, nongovernmental organizations (e.g., environmental or human rights groups), financial institutions, and suppliers and contractors.
On the financial side of the ledger, estimates must be developed for:•Capital costs (production platforms; drilling gear; and
production facilities, e.g., compressors, pumps, separators, and instrumentation)
•Operating costs (including for maintenance and workovers)
•Personnel needs (workforce size and skills, labor costs, and overhead)
•Expected revenues (from oil and gas sales, tariffs, and payments from partners)
Special attention must be paid to agreements with a host government in regard to financial issues, such as taxes, royalty rates, royalty payment method, financial liabilities, and involvement in social development or training programs. Related issues include expectations for inflation, future oil and gas prices, and exchange rates.
The Oil & Gas Industry: A Nontechnical Guide66
Technical and operational factorsA company also must consider a range of issues related to the
extraction and subsequent processing of oil and gas. These include: •Expected rate of decline in well production over time
•Expected oil and gas quality (and required cleanup/treatment actions)
•Environmental regulations
•Proximity of storage facilities and pipelines (or other transportation methods) for getting oil and gas to market
•Planning for possible operational problems during drilling and production
•Decommissioning of equipment and sites at the conclusion of the project.
References 1 American Petroleum Institute. 2011. The Story of Oil and Natural Gas.
Interactive Web presentation. http://www.api.org/story/ (accessed April 2, 2011). Washington, DC: American Petroleum Institute.
2 American Petroleum Institute. 2011. Explaining Exploration and Production Timelines (Onshore). Washington, DC: American Petroleum Institute.
3 American Petroleum Institute. 2008. America’s energy savers. http://www.api.org/ehs/climate/new/upload/Energy_Efficiency.pdf (accessed April 2, 2011).
4 U.S. Department of Energy, Energy Information Administration. 2011. Monthly Energy Report. Washington, DC: U.S. Department of Energy.

Drilling and Completion: Onshore
Following the exploratory drilling and formation evaluation efforts described in the previous chapter—and assuming a positive result from assessment of risks and potential rewards—the E&P company then begins an expensive campaign of development drilling. The objective is to drill down to those formations that show promise and to put into place the equipment and systems needed to produce oil and gas safely and cost-effectively.
This chapter focuses on onshore (or land) drilling. Discussion of offshore drilling follows in chapter 6.
Site Preparation and Well Construction
Typically, each onshore well is sited within a drilling spacing unit (DSU). In recent historical practice, a DSU was a square encompassing 40 or 80 acres, within which only one well was drilled. This constraint was established in the 1930s in the United States to prevent exploitation of a field with excessive drilling and production rates.
More recently, based on advances in geologic evaluation and drilling technology, tighter spacing is being used, depending on such factors as formation permeability and heterogeneity, and drilling costs. A 10-acre DSU is not uncommon. In addition, operators can now drill as many as two dozen wells in a spoke pattern from a single surface location (pad).
Once the drilling site has been selected, several preparatory steps are taken. Workers establish the boundaries of the work area and carry out environmental impact studies if necessary. Lease agreements, titles, and right-of-way accesses also may be sought.
5

The Oil & Gas Industry: A Nontechnical Guide68
After all legal and environmental issues are settled, the crew goes about preparing the drill site. For an onshore site, this entails the following steps:
•The land is cleared and leveled, and access roads are built if needed.
•A water well is drilled if necessary to provide the significant volumes of water used in oil and gas drilling operations.
•A reserve pit is dug and lined with plastic, to hold rock cuttings and drilling mud generated during the drilling process. In environmentally sensitive areas, the cuttings and mud are trucked off-site instead of being placed in the pit.
As described in chapter 6, for an offshore site, the drill site is on the seabed. There is no site preparation in the conventional sense.
Once the land has been prepared, the crew digs several holes to make way for the rig and the main hole (fig. 5–1). A rectangular pit, called a cellar, is dug around the point where drilling will take place. The cellar provides a workspace around the hole and room for auxiliary equipment that will be located below the floor of the main drilling platform.
The crew then drills the main hole, often with a small drill truck rather than the main rig. The first part of the hole is larger in diameter than, and not as deep as, the main portion will be and is lined with a large-diameter conductor pipe. Other holes are dug off to the side to temporarily store equipment. After these holes are finished, the rig equipment can be trucked in and set up. If necessary, equipment may be brought to the site by helicopter or barge.
Fig. 5–1. Cellar and conductor casing (Source: Hyne, N. J.)
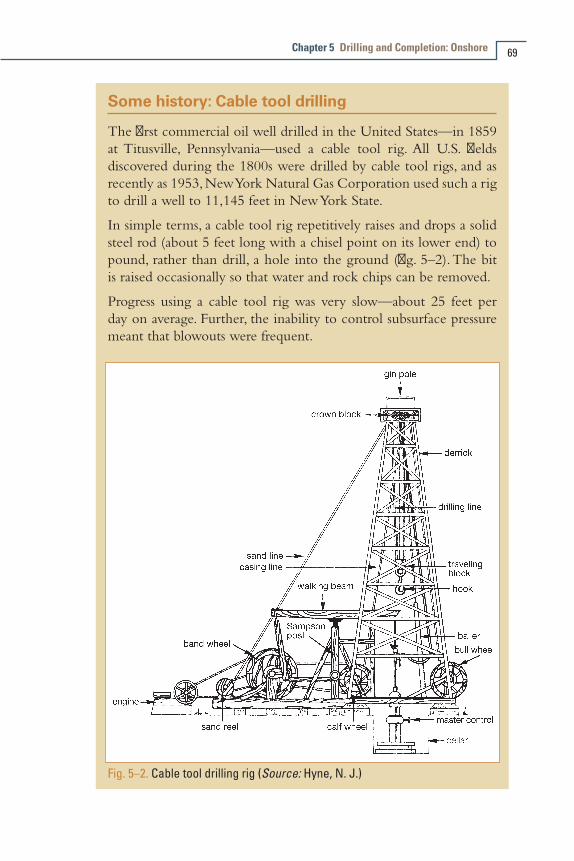
Chapter 5 Drilling and Completion: Onshore 69
Some history: Cable tool drilling
The first commercial oil well drilled in the United States—in 1859 at Titusville, Pennsylvania—used a cable tool rig. All U.S. fields discovered during the 1800s were drilled by cable tool rigs, and as recently as 1953, New York Natural Gas Corporation used such a rig to drill a well to 11,145 feet in New York State.
In simple terms, a cable tool rig repetitively raises and drops a solid steel rod (about 5 feet long with a chisel point on its lower end) to pound, rather than drill, a hole into the ground (fig. 5–2). The bit is raised occasionally so that water and rock chips can be removed.
Progress using a cable tool rig was very slow—about 25 feet per day on average. Further, the inability to control subsurface pressure meant that blowouts were frequent.
Fig. 5–2. Cable tool drilling rig (Source: Hyne, N. J.)

The Oil & Gas Industry: A Nontechnical Guide70
Rotary DrillingVirtually all oil and gas wells—onshore and offshore—are drilled
using a system called a rotary drilling rig, which can drill several hundred to several thousand feet per day. This system turns a long length of steel pipe with a sharp bit on its lower end to cut the wellbore (fig. 5–3). A basic rotary drilling system consists of four groups of components: prime mover (one or more engines), hoisting equipment, rotating equipment, and circulating equipment. Many innovations have been developed since rotary drilling first came into widespread use in the early 1900s.
and
Fig. 5–3. Rotary drilling rig (Source: Adapted from Jahn, Cook, and Graham)

Chapter 5 Drilling and Completion: Onshore 71
Prime moverMost rotary rigs use from one to four diesel engines, generating
as much as 3,000 horsepower. This prime mover powers the rotating equipment, the hoisting equipment, and the circulating equipment, as well as associated lighting, water-pumping, and compression equipment.
Hoisting equipment The hoisting equipment (fig. 5–4) raises and lowers what goes into or comes out of the wellbore. The most visible part of the hoisting equipment is the derrick, or mast, a towerlike structure up to 200 feet tall. The floor of the derrick is typically built on a framework that raises it 10–30 feet above the ground, to allow space for installation of wellhead equipment.
A strong hoisting line (braided steel wire wound on a fiber or steel core) is spooled around a frame, called the drawworks, on the derrick floor. The prime mover drives the drawworks to wind and unwind the hoisting line.
Crown block
Traveling block
HookHoisting line/cable
Drawworks
Fig. 5–4. Hoisting equipment (Source: Adapted from Hyne, N. J.)
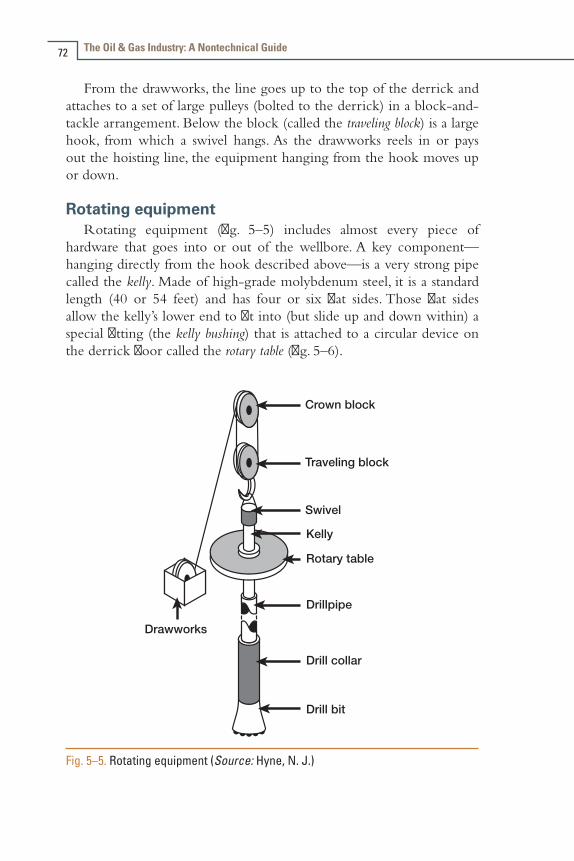
The Oil & Gas Industry: A Nontechnical Guide72
From the drawworks, the line goes up to the top of the derrick and attaches to a set of large pulleys (bolted to the derrick) in a block-and-tackle arrangement. Below the block (called the traveling block) is a large hook, from which a swivel hangs. As the drawworks reels in or pays out the hoisting line, the equipment hanging from the hook moves up or down.
Rotating equipmentRotating equipment (fig. 5–5) includes almost every piece of
hardware that goes into or out of the wellbore. A key component—hanging directly from the hook described above—is a very strong pipe called the kelly. Made of high-grade molybdenum steel, it is a standard length (40 or 54 feet) and has four or six flat sides. Those flat sides allow the kelly’s lower end to fit into (but slide up and down within) a special fitting (the kelly bushing) that is attached to a circular device on the derrick floor called the rotary table (fig. 5–6).
Crown block
Traveling block
Swivel
Kelly
Rotary table
Drillpipe
Drill collar
Drill bit
Drawworks
Fig. 5–5. Rotating equipment (Source: Hyne, N. J.)

Chapter 5 Drilling and Completion: Onshore 73
Fig. 5–6. Kelly, kelly bushing, and rotary table (Source: Hyne, N. J.)
At the very start of a drilling operation, one section of round drill pipe is screwed tightly to the bottom end of the kelly. That first section—with a sharp drill bit attached to its lower end—is then lowered through the bushing and rotary table until the flat sides at the lower end of the kelly are seated securely in the kelly bushing.
At that point, the kelly, bushing, and rotary table begin to rotate as a single unit, powered by the prime mover. The drill bit (turning clockwise when viewed from above) begins to bite into the ground below the derrick.
Each drill pipe section is called a joint. Made of heat-treated alloy steel, each section can be from 8 to 45 feet long (commonly 30 feet), with an outside diameter ranging from about 3 to 5.5 inches. Collectively, the downhole drill pipe, the bit, and related equipment comprise the drill string (fig. 5–7).
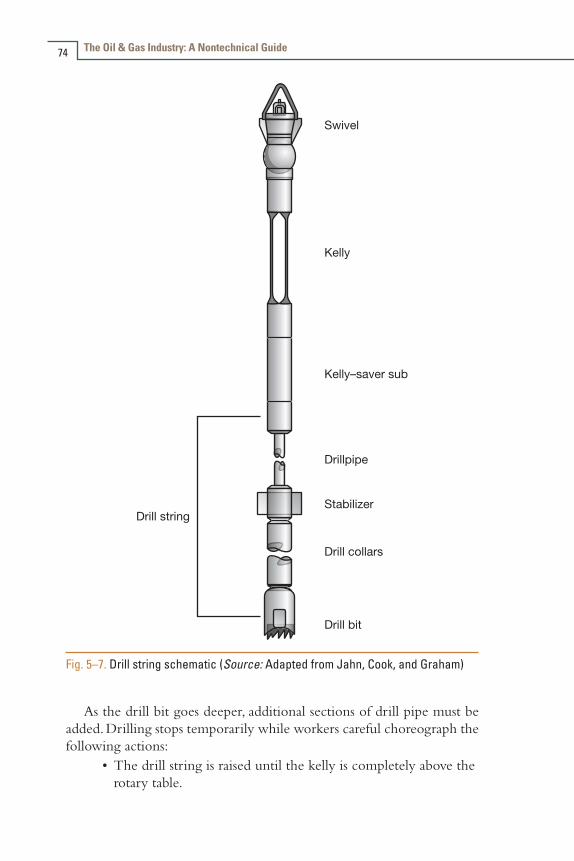
The Oil & Gas Industry: A Nontechnical Guide74
Fig. 5–7. Drill string schematic (Source: Adapted from Jahn, Cook, and Graham)
As the drill bit goes deeper, additional sections of drill pipe must be added. Drilling stops temporarily while workers careful choreograph the following actions:
•The drill string is raised until the kelly is completely above the rotary table.

Chapter 5 Drilling and Completion: Onshore 75
•The topmost drill pipe section (“A”) is grasped with special tools so it cannot fall back into the wellbore, and the kelly is unthreaded from section A.
•A new section (“B”) is swung into place and its top is screwed into the kelly.
•The bottom of section B is screwed into the top of section A.
•The kelly is lowered to reengage with the kelly bushing, at which point drilling resumes.
Note that special sections can be attached to the drill string, as needed, to perform desired functions, including the following:
•Connecting the drill bit to the first section of drill pipe
•Adding weight to the drill string (to increase drill bit pressure on the rock)
•Absorbing vibration or shocks transmitted from the drill bit up the drill string
• Stabilizing the drill string within the wellbore
•Connecting drill pipe sections that have different diameter or different threads
Automated systems for handling drill strings (as well as casing, described below) are commercially available to help improve safety as well as efficiency in drilling operations.
Drill bitThe business end of a drill string is the drill bit, and different rock
layers often require the use of different drill bits to achieve maximum drilling efficiency. Several designs have evolved as companies gained experience drilling in various kinds of geologic formations. Drill bits commonly range in diameter from about 4 to 26 inches.
The most common type is the rotary cone bit, and the general design that uses three rotating cones is called a tricone bit. As the drill string turns, the three cones also rotate, and teeth or buttons on the cones either flake or crush rock at the bottom of the well. Typical rotation speeds range from 50 to 100 rpm.
There are hundreds of different tricone bit designs, generally classified as either milled-teeth (fig. 5–8) or insert (fig. 5–9) bits. The former are most suitable for rock of soft or medium hardness; the latter are more effective on hard rock.

Fig. 5–8. Tricone milled-teeth drill bit (Source: Hyne, N. J.)
Fig. 5–9. Tricone insert drill bit (Source: Hyne, N. J.)

Chapter 5 Drilling and Completion: Onshore 77
A different drill bit design uses industrial diamonds to shear away the rock. Its metal cutters are studded with chips of diamond (rather than milled teeth or tungsten carbide insert buttons). The diamond drill bit has no moving parts (unlike the rotating cones in the tricone design). It simply turns at the same speed as the drill pipe to which it is attached.
A common configuration is the polycrystalline diamond compact (PDC) drill bit (fig. 5–10). Although a PDC bit is expensive, it can last for several hundred hours and drill more footage than other types.
The structures that connect a drill bit to the drill string above it contain channels. These enable the flow of drilling mud to lubricate and cool the drill bit and flush rock cuttings from the face of the bit.
The weight of the drill string pressing down on the drill bit is controlled from above by the drawworks and the hoisting line, as well as by the number of sections added to the drill string. Typically, 3,000–10,000 pounds per square inch (psi) of pressure per inch of bit diameter is applied.
Fig. 5–10. PDC drill bit (Source: Adapted from Hyne, N. J.)
The Oil & Gas Industry: A Nontechnical Guide78
After extended use, a drill bit must be changed because of wear or breakage. A tricone bit, for example, is commonly changed after 24–48 hours. In other cases, a different drill bit may be needed to penetrate a different type of rock.
In a time-consuming process called tripping, drilling is halted while the entire drill string is pulled from the wellbore. The drill pipe sections are unscrewed in sequence (sometimes three sections at a time) and are stored temporarily on a special rack on the drilling platform. A device called a bit breaker is attached to the rotary table to grip and unscrew the bit when it reaches the surface. A new drill bit is then screwed into place; the drill string is reassembled in order and is lowered back into the hole; and drilling resumes.
As a drill bit moves downward, it encounters increasing temperature and pressure. On average, temperature rises by about 1–2°F for every 100 feet of depth below the surface. For example, at 10,000 feet, oil in a reservoir below the Anadarko basin, in Oklahoma, would be at about 190°F. Pressure increases at a rate of about 45 psi per 100 feet of depth. Therefore, at 10,000 feet, a pressure of about 4,500 psi would be expected.
As noted below (in the “Drilling techniques” section), there are situations in which the drill bit can be made to rotate independently from the drill string, driven by a specially designed downhole motor.
Circulating systemThe circulating system consists of a range of equipment that works
together to move drilling fluid (called mud) into and out of the hole being drilled. This drilling mud serves several purposes: it cools and lubricates the drill bit; it flushes cuttings and debris away from the face of the drill bit; and it coats the walls of the well to stabilize them.
Another critical function of the circulating system is to help control pressure within the well. The weight of the drilling mud can be adjusted to exert greater pressure at the bottom of the well than the pressure exerted by fluids (oil, gas, and water) in the surrounding rock. This control is necessary to prevent uncontrolled fluid flow into the well and to prevent the well walls from caving in, trapping equipment downhole.
Drilling mud can consist of any of the following mixtures: •Water (fresh or saline) and clay (commonly bentonite)
•Oil (diesel, mineral, or synthetic) and clay
Chapter 5 Drilling and Completion: Onshore 79
•Water with 10% oil, plus clay (emulsion)
•A synthetic organic material and water
Chemicals and other additives to the drilling mud are used to adjust such parameters as weight (density), viscosity, and pH.
Drilling mud is mixed and stored in large steel tanks near the drilling rig. Rotating paddles or a high-pressure jet constantly agitate the mud to ensure uniform consistency. Large pumps (driven by the prime mover) move the mud through a long rubber hose to the swivel (above the top of the kelly) and then down into the hollow, rotating drill string. The mud sprays from nozzles or jets near the face of the drill bit.
Then, still under pressure from the mud pumps, the mud begins its trip back to the surface, flowing upward within the space between the rotating drill string and the walls of the well (called the annulus). At the top of the well, the mud moves into the mud return line and then through a series of devices that remove well cuttings, sand, silt, and even dissolved gases. This “clean” mud goes back into the mud tanks, ready for recirculation into the well, while removed solids are directed into a reserve pit.
After a well has been drilled, the mud cannot be reused. If made with freshwater, the mud can be spread on nearby land to fertilize crops. Other types must be moved by truck or barge to an approved disposal site.
Blowout preventionA blowout is the uncontrolled flow of oil or gas up the drill string
or wellbore annulus. This is triggered when the formation pressure (exerted by gas or oil in the formation around or at the bottom of the well) exceeds the pressure created by the drilling mud. A blowout can seriously injure workers and damage the drilling rig.
As noted above, the drill string is situated in the center of the wellbore, and there is a space (the annulus), typically several inches across, between the outer surface of the drill string and the wall of the well. For prevention of a blowout, it is important to at least cap the annulus. It may also be desirable to seal off the top of the drill string; however, in some cases, the operator may want to pump heavier mud down the drill string until mud pressure overcomes the pressure exerted by downhole formation fluids. For one or more of these goals to be achieved, a blowout preventer (BOP) is bolted securely to the top of the well, below the floor of the derrick (fig. 5–11).
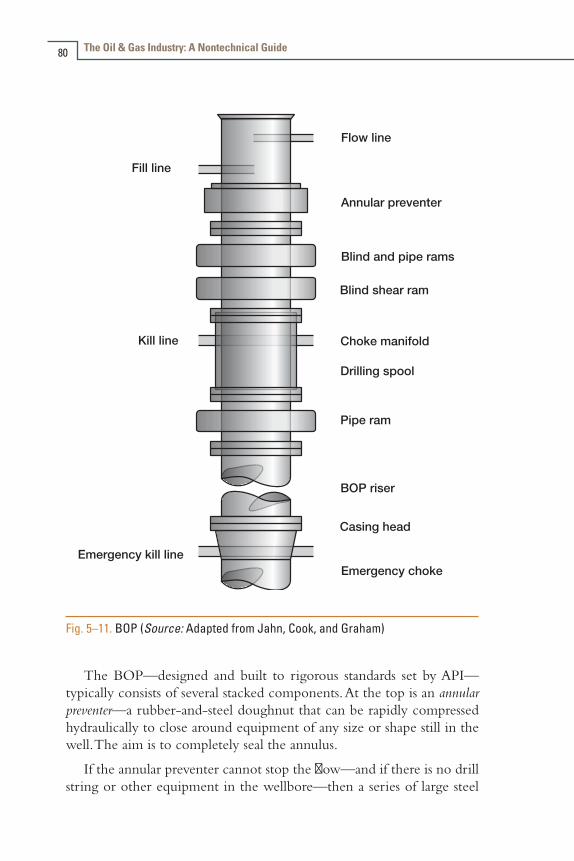
The Oil & Gas Industry: A Nontechnical Guide80
Flow line
Annular preventer
Blind and pipe rams
Blind shear ram
Choke manifold
Drilling spool
Pipe ram
BOP riser
Casing head
Emergency chokeEmergency kill line
Kill line
Fill line
Fig. 5–11. BOP (Source: Adapted from Jahn, Cook, and Graham)
The BOP—designed and built to rigorous standards set by API—typically consists of several stacked components. At the top is an annular preventer—a rubber-and-steel doughnut that can be rapidly compressed hydraulically to close around equipment of any size or shape still in the well. The aim is to completely seal the annulus.
If the annular preventer cannot stop the flow—and if there is no drill string or other equipment in the wellbore—then a series of large steel
Chapter 5 Drilling and Completion: Onshore 81
plates are rapidly pushed together to completely seal off the top of the well. The first of these is called a blind ram and is mounted immediately below the annular preventer.
If the blind ram is ineffective (or cannot be used), then a pipe ram (mounted below the blind ram) is activated. The pipe ram also is composed of two large blocks of steel, but each has a semicircular cutout in its mating surfaces. These cutouts allow the ram to close around, but not damage, the drill string (in the same manner as the annular preventer) while simultaneously sealing the annulus. Recall that the operator may want to pump mud down the drill string to help control downhole pressure.
A blind shear ram consists of two sliding steel plates with intersecting blades. As the plates come together, the angled blades cut the drill string; then, the plates in which they are mounted move into place to seal both the drill string and the annulus. Specialists who studied the April 2010 blowout of BP’s deepwater Macondo well in the Gulf of Mexico reported in March 2011 that one key part of the well’s 300-ton, 50-foot-tall BOP, about 4,000 feet below the water’s surface, failed to operate properly. In particular, Det Norske Veritas reported that a piece of drill pipe had buckled and became wedged in the blind shear ram as it tried to close. The pipe had been pushed out of its normal position by the flow of oil and gas up the well. Because the ram could not cut the pipe and fully close, the well was not sealed off.
All BOP components can be activated separately by hydraulic pressure, maintained in accumulator cylinders. Their operation does not depend on the rig’s prime mover. Workers can trigger the BOP from any of several control stations on or near the drilling rig.
A final BOP-related component is the choke manifold, a set of flow lines, valves, and chokes connected to the BOP stack. It is routinely used for nonemergency routing of drilling mud from the well to various onsite equipment. However, if the BOP has been activated, it can also be used to relieve well pressure and to circulate heavier drilling mud into the well.
Drilling techniquesEvery well operator would like to drill a straight well directly down
into the earth, expending the least amount of time and money to reach a subsurface target. In reality, because of the physics of rotary drilling, a straight hole in relatively uniform ground typically has a slight corkscrew configuration, with the drill bit moving downward within a cone whose

The Oil & Gas Industry: A Nontechnical Guide82
angle is as large as five degrees. In most cases, this digression from true vertical is acceptable.
Directional or deviated drilling. In many situations, however, it may be necessary or desirable to drill at a predetermined angle to avoid (or reach) specific rock formations or orientations or to hit a desired target. This is called directional or deviated drilling (fig. 5–12). This deviation from true vertical can be initiated at the start of drilling or after a vertical well (or well segment) has already been drilled. In the latter case, special tools are used—such as a long steel wedge (called a whipstock), or a device that blasts drilling mud at high pressure at the desired angle against the wall of the wellbore—to redirect the path of the drill bit.
A more advanced method for directional drilling sends a stream of high-pressure drilling mud down through a pipe to power a specially designed downhole mud motor that has a drill bit attached (fig. 5–13).
The pipe does not spin, only the drill bit, as a pilot hole is drilled at the desired orientation.
After the new angle is confirmed as correct, the original mud-motor system is replaced by a more elaborate unit called a downhole steerable assembly (fig. 5–14). This assembly can maintain or further change the deviation angle.
Fig. 5–12. Deviated wellbores (Source: Hyne, N. J.)

Drill pipe
Bent sub (angle exaggerated)
Downhole mud motor
Drill bit
Fig. 5–13. Downhole assembly to start drilling a deviated wellbore (Source: Adapted from Hyne, N. J.)
Fig. 5–14. Steerable downhole assembly for deviated drilling (Source: Hyne, N. J.)
The Oil & Gas Industry: A Nontechnical Guide84
Deviated drilling is particularly valuable in offshore operations because it is very expensive to build and operate multiple drilling platforms and wells to develop a large offshore field (particularly in deep water). Instead, a large production platform is typically constructed to drill several main wells, with many deviated or directional wells drilled out from each of those wells, at various depths and angles.
One notable example is the Cognac platform, sited in 1978 by Shell Oil in the Gulf of Mexico. Workers on the Cognac platform put in place 62 wells, all of which used deviated drilling. (The platform is still in operation as of early 2012.)
Advances in drilling technology
In the United States, Gas Research Institute (now Gas Technology Institute [GTI]) partnered with the DOE, oil and gas E&P companies and analysts as far back as the mid-1980s to develop geologic information as well as technology and procedures for both finding and evaluating the potential of natural gas chiefly from unconventional sources, such as coal seams, tight (low-permeability) sands, and shales.1–3
Collaborative GTI programs also were instrumental in spurring the development of new technologies for tapping and optimizing production from unconventional gas resources. These programs included:
•Documentation of successful drilling practices and compilation of environmental impact assessment tools for operators in a dozen U.S. basins/formations
•Advancement of technologies for slimhole, microhole, coiled-tube, horizontal, directional, jet-assisted, laser, and underbalanced drilling
•Evaluation of new drill bit designs, hydraulic fracturing methods, wellbore perforation technology, novel cement compositions, and downhole (cross-well) seismic imaging

Chapter 5 Drilling and Completion: Onshore 85
Precision drilling
Shell Oil (the U.S. subsidiary of Royal Dutch Shell) brought into operation its Perdido production platform in March 2010, located nearly 200 miles offshore in the Gulf of Mexico, in water almost two miles deep.4 The company reported that operators on the Noble Clyde Boudreaux floating drilling rig, using advanced control systems, were able to guide the drill bits as much as two miles farther below the seabed to hit targets the size of the lid on a garbage can.
Extended-reach (ER) drilling. A specific type of deviated drilling is ER drilling. An ER well has just a single deviation from vertical and typically bottoms out thousands of feet horizontally from its point of origin (fig. 5–15). This technique can be particularly useful in drilling from an onshore site to a target lying below the seabed offshore or in tapping resources that lie beneath environmentally sensitive areas.
(a)
(b)
Fig. 5–15. ER well (a) and horizontal-drain well (b) (Source: Adapted from Hyne, N. J.)
The Oil & Gas Industry: A Nontechnical Guide86
ExxonMobil and its international partners announced in February 2011 that they had drilled the world’s longest well, Odoptu OP-11, in Russia. This ER well set world records both for total measured depth (40,502 feet [7.67 miles]) and for horizontal reach (37,648 feet [7.13 miles]). Odoptu is one of three large fields five to eight miles offshore northeast Sakhalin Island, which lies off Russia’s Pacific Coast.
Horizontal-drain well. A horizontal-drain well is a deviated well with a long horizontal section that taps into a subsurface structure whose hydrocarbon-bearing zones are parallel to the surface of the ground (see fig. 5–15). This approach is particularly effective in reservoirs with vertical fractures and in tight (low-permeability) formations.
Laterals. Short horizontal branches drilled outward from a main vertical wellbore are called laterals. They allow operators to tap hydrocarbon-bearing zones at different depths.
Drilling problemsA variety of things can go wrong while drilling a well. Examples
include the following:•A piece of equipment breaks off or falls into the wellbore.
•The drill string gets stuck in the well.
•Circulation of drilling mud is lost as the mud flows outward into a very porous, highly fractured, or cavernous layer (zone) of rock.
•Drilling mud is forced into any permeable rock adjacent to the wellbore, degrading permeability and hindering flow of gas or oil into the wellbore.
•Corrosive gases (e.g., carbon dioxide or hydrogen sulfide) flow out of the formation and attack the integrity of the drill string or other downhole equipment.
•Unusually high pressure is encountered in a formation, overwhelming the pressure exerted by the drilling mud. This causes a kick—a rapid, unexpected flow of formation fluids into the wellbore—which could lead to a blowout.
The industry has developed a wide range of tools and techniques to resolve these and related problems. However, their description is beyond the scope of this book.

Chapter 5 Drilling and Completion: Onshore 87
Well TestingA variety of well tests were described in chapter 4 as part of the
exploration process, but other tests are also generally conducted during early production to help operators understand the nature of the well and its likely performance. In general terms, these tests help to determine the rate at which the greatest amount of oil or gas can be extracted without harming the formation.
Pressure is a particularly important parameter. It is measured in the tubing, within the casing, and at the bottom of the well. It is often measured while the well is flowing, but it is sometimes measured after a well has been shut in (i.e., flow has been deliberately stopped) for a day or so.
The operator will typically make an initial estimate of the well’s decline rate. This parameter is an indicator of the expected drop in production rate as more and more oil or gas is extracted from a formation. Understanding the decline rate will guide decisions about the possible use of artificial lift to improve production (as described in chap. 7).
Other tests are run to determine:•Potential (the maximum amount of oil and gas a well can
produce in a 24-hour period)•Productivity (various production rates and their likely effect on
well life)•Drawdown profile (change in bottom-hole pressure as a
shut-in well is brought on production)•Buildup profile (change in bottom-hole pressure as a flowing
well is shut in)•Absolute open flow (maximum flow rate of oil or gas into the
well when the bottom-hole pressure is zero)
If a decision is made to recomplete a well (i.e., to tap a new zone above or below the original), a cased-hole log is commonly run to confirm the presence of oil or gas in the new zone. An instrument using a gamma-ray and neutron detector is typically used to assess the relative fluid content of the formation rock.
Various kinds of production logs are run to evaluate problems in flowing wells. Sophisticated instruments can detect fluid movement, measure fluid flow at various depths, listen for noises that differentiate liquid from gas, measure fluid temperatures, measure pressure at specific depths, measure water concentration in well fluids, and identify the best places to perforate well casing.
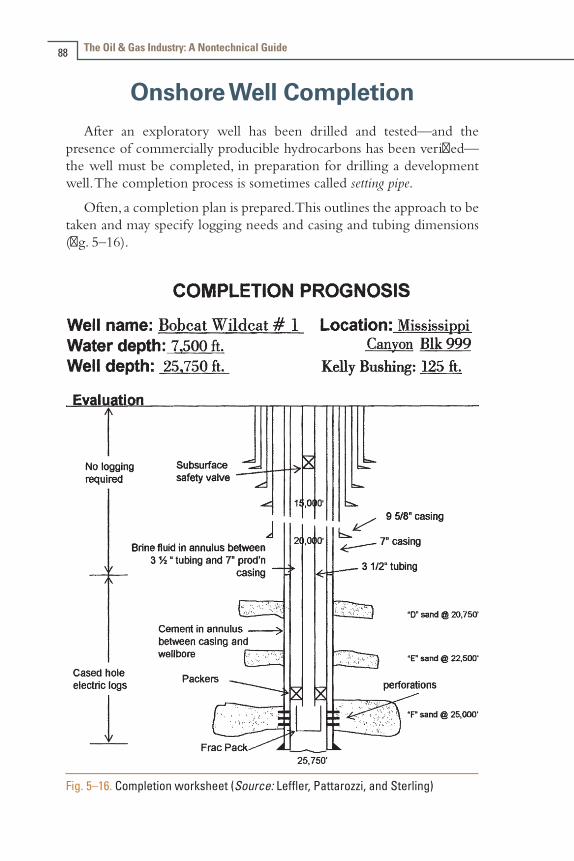
The Oil & Gas Industry: A Nontechnical Guide88
Onshore Well CompletionAfter an exploratory well has been drilled and tested—and the
presence of commercially producible hydrocarbons has been verified—the well must be completed, in preparation for drilling a development well. The completion process is sometimes called setting pipe.
Often, a completion plan is prepared. This outlines the approach to be taken and may specify logging needs and casing and tubing dimensions (fig. 5–16).
Fig. 5–16. Completion worksheet (Source: Leffler, Pattarozzi, and Sterling)
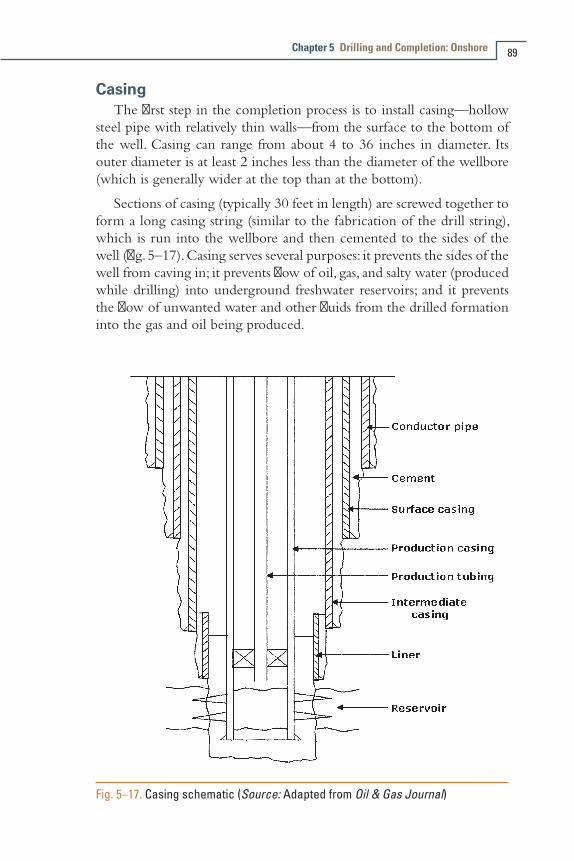
Chapter 5 Drilling and Completion: Onshore 89
CasingThe first step in the completion process is to install casing—hollow
steel pipe with relatively thin walls—from the surface to the bottom of the well. Casing can range from about 4 to 36 inches in diameter. Its outer diameter is at least 2 inches less than the diameter of the wellbore (which is generally wider at the top than at the bottom).
Sections of casing (typically 30 feet in length) are screwed together to form a long casing string (similar to the fabrication of the drill string), which is run into the wellbore and then cemented to the sides of the well (fig. 5–17). Casing serves several purposes: it prevents the sides of the well from caving in; it prevents flow of oil, gas, and salty water (produced while drilling) into underground freshwater reservoirs; and it prevents the flow of unwanted water and other fluids from the drilled formation into the gas and oil being produced.
Fig. 5–17. Casing schematic (Source: Adapted from Oil & Gas Journal)

The Oil & Gas Industry: A Nontechnical Guide90
Hangers suspend the casing string from the top of the well (so that it does not go all the way to the bottom of the well), and downhole devices called centralizers keep the string centered within the wellbore. Once the casing string is in position, a slurry of cement (Portland cement with various additives) is mixed and pumped into the casing.
A device called a cementing plug or wiper plug is put into place before the cement is pumped. As the cement is pushed down into the casing, the plug moves ahead of it, wiping any material from the inner casing wall that might contaminate the cement slurry.
Movement of the cement displaces drilling mud downward. Equipment positioned at the bottom of the casing string prevents drilling mud from moving back up into the casing but allows the cement to flow out of the casing and then upward to fill the space between the casing and the walls of the well. The cement job is complete once the cement has hardened, after which the special tools are removed.
A related remedial operation, called a squeeze job, is sometimes conducted to force additional cement into place around the casing. It is used to seal leakage paths detected after initial cementing, to isolate a segment of casing that has been perforated (see the “Bottom-hole treatment” section, below), or to repair damaged casing.
In practice, a well is drilled, cased, and cemented in stages as the drill bit moves down into the earth. A well commonly has at least three concentric casing strings, though deeper wells have more. Each string runs all the way back up to the surface, with the largest-diameter (and shortest-length) string on the outside, and the smallest-diameter (and longest-length) string on the inside.
The largest-diameter casing string (30–42 inches)—also called conductor pipe—is typically several hundred feet long. It helps route drilling mud coming from the well back to the mud tanks, prevents the top of the well from caving in, and isolates any freshwater or gas zones that are near the surface. Proceeding down the well, the operator installs surface casing, intermediate casing, and finally production casing (each smaller in diameter than the casing above it).
Bottom-hole treatmentThe very bottom of the well requires particular treatment to ensure
maximum production of hydrocarbons. In an open-hole completion, the well is first drilled to the top of the hydrocarbon-bearing formation and casing is set. Then, drilling continues down into the formation, which leaves the bottom of the well uncased, or open.
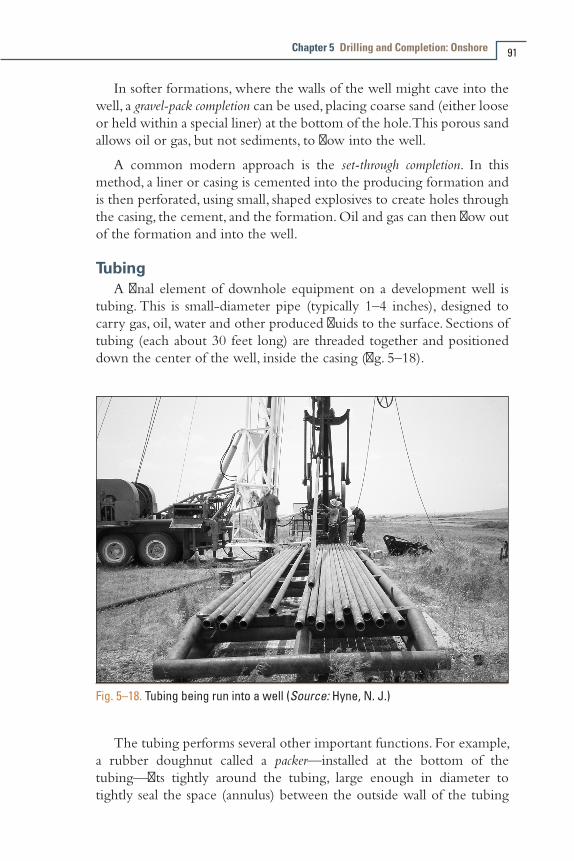
Chapter 5 Drilling and Completion: Onshore 91
In softer formations, where the walls of the well might cave into the well, a gravel-pack completion can be used, placing coarse sand (either loose or held within a special liner) at the bottom of the hole. This porous sand allows oil or gas, but not sediments, to flow into the well.
A common modern approach is the set-through completion. In this method, a liner or casing is cemented into the producing formation and is then perforated, using small, shaped explosives to create holes through the casing, the cement, and the formation. Oil and gas can then flow out of the formation and into the well.
Tubing A final element of downhole equipment on a development well is
tubing. This is small-diameter pipe (typically 1–4 inches), designed to carry gas, oil, water and other produced fluids to the surface. Sections of tubing (each about 30 feet long) are threaded together and positioned down the center of the well, inside the casing (fig. 5–18).
Fig. 5–18. Tubing being run into a well (Source: Hyne, N. J.)
The tubing performs several other important functions. For example, a rubber doughnut called a packer—installed at the bottom of the tubing—fits tightly around the tubing, large enough in diameter to tightly seal the space (annulus) between the outside wall of the tubing
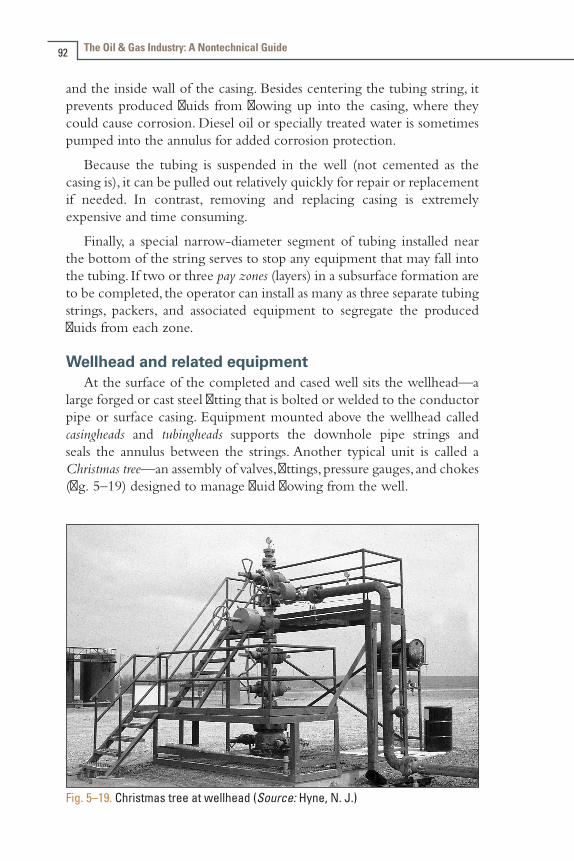
The Oil & Gas Industry: A Nontechnical Guide92
and the inside wall of the casing. Besides centering the tubing string, it prevents produced fluids from flowing up into the casing, where they could cause corrosion. Diesel oil or specially treated water is sometimes pumped into the annulus for added corrosion protection.
Because the tubing is suspended in the well (not cemented as the casing is), it can be pulled out relatively quickly for repair or replacement if needed. In contrast, removing and replacing casing is extremely expensive and time consuming.
Finally, a special narrow-diameter segment of tubing installed near the bottom of the string serves to stop any equipment that may fall into the tubing. If two or three pay zones (layers) in a subsurface formation are to be completed, the operator can install as many as three separate tubing strings, packers, and associated equipment to segregate the produced fluids from each zone.
Wellhead and related equipmentAt the surface of the completed and cased well sits the wellhead—a
large forged or cast steel fitting that is bolted or welded to the conductor pipe or surface casing. Equipment mounted above the wellhead called casingheads and tubingheads supports the downhole pipe strings and seals the annulus between the strings. Another typical unit is called a Christmas tree—an assembly of valves, fittings, pressure gauges, and chokes (fig. 5–19) designed to manage fluid flowing from the well.
Fig. 5–19. Christmas tree at wellhead (Source: Hyne, N. J.)

Chapter 5 Drilling and Completion: Onshore 93
Well TreatmentWell treatment collectively refers to several techniques used to ensure
the efficient flow of hydrocarbons out of a formation. These techniques are typically used to optimize production. However, they can also be used to repair formation damage—the blockage of pores in a formation by drilling mud, cement particles, corrosion products, or chemical buildup.
In broad terms, well treatment involves the injection of acid, gases, or water into the well to open up the rock formation and allow oil and gas to flow through it (and to the wellbore) more easily. Among the most common well treatments are acidizing and fracturing (also called fracing).
AcidizingAcidizing is a process used to dissolve dolomite, limestone, or
calcite cement between grains of sediment. Two types of acid are most commonly used—hydrochloric or hydrofluoric acid, sometimes mixed together—although acetic and formic acids are also used occasionally. Various additives are mixed with the acid to prevent both the corrosion of casing and tubing and the formation of iron compounds that could clog the pores of the reservoir.
Matrix acidizing is a well treatment used to enlarge the existing rock pores. In other cases, fracture acidizing is used, pumping the acid downhole under high pressure to both fracture and dissolve reservoir rock. Occasionally, an acid job is performed to clear away carbonate materials that can build up on the walls of a wellbore and inhibit oil and gas flow.
After an acid job, operators flush out spent acid and dissolved rock. The debris is pumped to the surface for treatment and disposal.
Hydraulic fracturingAs its name implies, hydraulic fracturing makes use of the force
exerted by fluids (gases or liquids) under great pressure to crack open an underground rock formation, creating new fissures or expanding existing ones.
Background. Until the late 1940s, oil and gas well operators commonly used explosives to increase production, lowering nitroglycerin into a well and detonating it. The explosion fractured the rock, creating a large cavity. The cavity was then cleaned out, and the well was completed as an open hole.
The Oil & Gas Industry: A Nontechnical Guide94
According to API, the first commercial use of hydraulic fracturing was in 1947, and it has been used on more than one million wells since then. Since about 2006, increased use of fracing has been instrumental in boosting production from gas-bearing shale formations in North America. The technique is also finding wider use in the exploitation of oil-bearing shales. Fracing is often used in combination with horizontal drilling to reach as much of the formation volume as possible.
Energy in Depth, a group of U.S. oil and gas producers, has asserted that approximately 90% of the oil and gas wells in operation in 2011 had been fractured. And the National Petroleum Council estimates that 60%–80% of all oil and gas wells drilled in the United States from 2011 to 2020 will require fracture treatment to remain viable.
The fracturing process. The frac job is carried out under the direction of contractors who have specialized skills and equipment, as well as experience in performing such operations (fig. 5–20). A key ingredient is the frac fluid prepared for each job, brought in tanker trucks to the work site, where it is mixed and stored in large tanks. This fluid is typically water (though it can also be a gel, a foam, or a gas [e.g., nitrogen or carbon dioxide]), mixed with organic polymers and proppant—grains of quartz sand (sometimes resin coated), aluminum oxide pellets, or tiny ceramic beads. The injected fluid mixture is about 99% water and proppant.
When pumped into the ground under high pressure, the frac fluid pushes out into the rock formation, creating or widening existing cracks and crevices. The proppant props open the cracks after the pressure is reduced, enabling oil or gas held in the pores of the shale to flow more easily to the wellbore.
Predicting the exact geometry of a hydraulic fracture is complicated, so operators use a variety of tools to monitor fracture progress. In simple terms, the injected fluid is pressurized to a level greater than that imposed by the overlying rock. The term fracture gradient is typically used to quantify the required minimum pressure. A gradient of 0.8 psi per foot of depth means that that at 10,000 feet, it would take 8,000 psi of hydraulic pressure to create or extend a fracture.
Pumper trucks are used to create the desired downhole pressure. A small frac job can use 45,000 gallons of frac fluid and 35 tons of sand; an especially large job can require several million gallons of fluid and 1,500 tons of sand. Pumping pressure can reach 15,000 pounds per square inch, with fluid flow rates of 100 barrels per minute.

Chapter 5 Drilling and Completion: Onshore 95
Fig. 5–20. Hydraulic fracturing an oil well (Source: Adapted from graphic by A. Granberg for Pro Publica Inc., Nov. 13, 2008)
After the injection phase is completed, the fluid and any loose proppant are back-flushed out of the well so as not to impede production. A portion of the frac fluid is generally recovered and stored in pits or containers; then, it may be processed to allow reuse in later fracing operations. Some of the fluids are treated (cleaned) and then released to the environment, while some other residual material is placed in permanent deep-well storage.
Results. Experts estimate that hydraulic fracturing can increase a well’s initial production rate by 1.5–30 times, with the greatest increases seen in low-permeability (tight) reservoirs. In fact, some tight formations may produce for no more than a few months (or not at all) if not stimulated in this way.
A well can be fraced several times during its life, and the technique may increase ultimate production by 5%–15%. This technique has been used with great success since about 2006 to increase gas production from shale formations across the United States, including the Barnett (Texas), Haynesville, and Fayetteville (southeast), and Marcellus (northeast).
In an April 2009 report, DOE reported shale gas production of only about 0.26 tcf in 1998.5 That figure jumped to 1.4 tcf in 2007, and DOE expected production of 4.8 tcf in 2020. DOE stated that shale gas
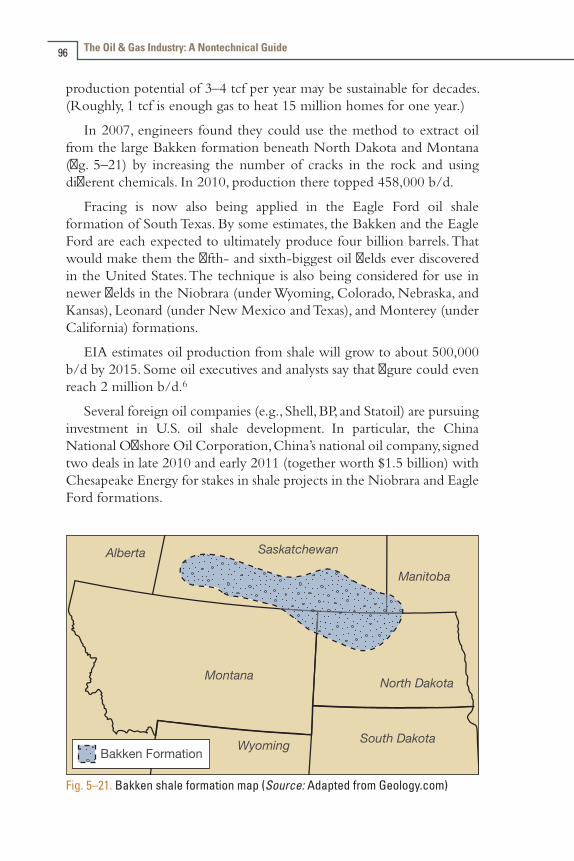
The Oil & Gas Industry: A Nontechnical Guide96
production potential of 3–4 tcf per year may be sustainable for decades. (Roughly, 1 tcf is enough gas to heat 15 million homes for one year.)
In 2007, engineers found they could use the method to extract oil from the large Bakken formation beneath North Dakota and Montana (fig. 5–21) by increasing the number of cracks in the rock and using different chemicals. In 2010, production there topped 458,000 b/d.
Fracing is now also being applied in the Eagle Ford oil shale formation of South Texas. By some estimates, the Bakken and the Eagle Ford are each expected to ultimately produce four billion barrels. That would make them the fifth- and sixth-biggest oil fields ever discovered in the United States. The technique is also being considered for use in newer fields in the Niobrara (under Wyoming, Colorado, Nebraska, and Kansas), Leonard (under New Mexico and Texas), and Monterey (under California) formations.
EIA estimates oil production from shale will grow to about 500,000 b/d by 2015. Some oil executives and analysts say that figure could even reach 2 million b/d.6
Several foreign oil companies (e.g., Shell, BP, and Statoil) are pursuing investment in U.S. oil shale development. In particular, the China National Offshore Oil Corporation, China’s national oil company, signed two deals in late 2010 and early 2011 (together worth $1.5 billion) with Chesapeake Energy for stakes in shale projects in the Niobrara and Eagle Ford formations.
Fig. 5–21. Bakken shale formation map (Source: Adapted from Geology.com)
Chapter 5 Drilling and Completion: Onshore 97
Environmental concerns. Despite this record of extensive use, environmental groups and others have expressed concerns about the environmental impact of hydraulic fracturing and the management of the volumes of water used to fracture shale. As of mid-2011, a number of states (notably in the Northeast, where development of the Marcellus gas shale resource is under way) were considering legislative action to oppose hydraulic fracturing. In addition, several class-action lawsuits were filed against gas developers.
One specific concern has been possible contamination of groundwater by either the materials used for fracturing or by the methane released as a result. Industry experts point out that wells are typically drilled to depths of 6,000–10,000 feet, well below the water table and separated from it by many tons of impermeable rock, but concerns persist.
Regarding fluid composition, the gas industry points to the 2009 DOE study that describes a typical mixture of frac fluid as 95% water and 4.5% sand, with just 0.5% made up of chemical additives.7
Well operators consider the composition of many frac fluids to be proprietary information, but they do make details available to regulators, first responders, and medical personnel for use in protecting human health and the environment. For example, since July 14, 2010, well completion reports by Range Resources (based in Fort Worth, Texas) have included detailed information about all additives the firm uses in its hydraulic fracturing operations in the Marcellus Shale. The data go to Pennsylvania state environmental officials and are posted on the company’s Web site.8
One provision of the federal Energy Policy Act of 2005 exempted hydraulic fracturing operations from compliance with the Safe Drinking Water Act. Nevertheless, well operators must comply with a range of federal chemical record-keeping and reporting requirements and with individual state laws and regulations concerning fracturing operations.
Federal legislation was proposed in 2008 and 2009 as the Fracturing Responsibility and Awareness of Chemicals Act (FRAC Act). Reintroduced in 2011, it would give the federal Environmental Protection Agency (EPA) the authority to regulate hydraulic fracturing in some states. However, as of February 2012, lawmakers had taken no action on the proposed law.
EPA released a study in 2004 that showed hydraulic fracturing did not pose a threat to drinking water supplies. However, in early 2011, the agency submitted a draft plan for further study to the agency’s independent Science Advisory Board for its review. EPA expects release
The Oil & Gas Industry: A Nontechnical Guide98
of initial study results by the end of 2012. An additional report based on further research is planned for release in 2014.
In April 2012, the EPA updated standards for oil and gas production that will reduce methane and other gaseous emissions released into the air from all new gas wells (effective Jan. 2015) that are hydraulically fractured.
Several European countries are also weighing the benefits and impacts of hydraulic fracturing. In May 2011, France imposed a moratorium on the practice, but a committee of the British parliament judged fracing to be acceptable. Poland, which may have Western Europe’s greatest shale gas reserves, had awarded dozens of concessions for development as of mid-2011, but was proceeding carefully.
References 1 McFall, K. S., D. E. Wicks, and V. A. Kuuskraa. 1986. A geologic
assessment of natural gas from coal seams in the Warrior Basin, Alabama. Topical report 86/0272. Des Plaines, IL: Gas Research Institute.
2 Ely, J. W., R. L. Tiner, M. Rothenburg, A. Krupa, F. McDougal, M. Conway, and S. Reeves. 2000. GRI’s restimulation program enhances recoverable reserves (parts 1 and 2). World Oil. November.
3 Reeves, S. R., and D. E. Wicks. 1994. Stimulation technology in the Antrim shale. Topical report 94/0101. Des Plaines, IL: Gas Research Institute.
4 Borchardt, J. K. 2010. 1300 Fathoms. Mechanical Engineering. December.
5 Ground Water Protection Council and ALL Consulting. 2009. Modern shale gas development in the United States: A primer. Prepared for the U.S. Department of Energy Office of Fossil Energy and the National Energy Technology Laboratory.
6 Fahey, J. 2011. New drilling method opens vast oil fields in US. Associated Press. Published February 9, 2011, in the Denver Post (and other channels).
7 Ground Water Protection Council and ALL Consulting. 2009.
8 Range Resources Corp. 2010. Voluntary Well Completion Reports. Posted on company Web site: www.rangeresources.com. Fort Worth, TX. (Accessed Feb. 13, 2012.)

Drilling and Completion: Offshore
Chapter 5 described onshore (land) drilling rigs. However, substantial amounts of oil and gas are also found off the coasts of many countries—often in deep water and deep below the seabed.
Although the general approaches for drilling into the seafloor and completing a well are much the same as those used when drilling on land, special vessels, equipment, platforms, and procedures are needed. This chapter will focus on offshore drilling and completion operations.
Exploratory DrillingMoveable rigs are most often used for exploratory offshore drilling
because they are much cheaper to use than permanent platforms. Moveable rigs include drilling barges, drill ships, jack-up rigs, and semisubmersible rigs.
Once large deposits of hydrocarbons have been found, permanent platforms of various designs are typically built for development drilling and production.
One important difference between offshore and onshore drilling rigs is the manner in which rotary power is transmitted to the drill string. Offshore rigs use a device called a top drive, instead of the drawworks and associated cables used on a land rig. The top drive is a large electric or hydraulic motor, typically 1,000 horsepower or more, that hangs near the top of the drilling derrick from the hook at the bottom of the traveling block. The top drive turns a shaft into which drill string sections can be screwed, commonly three sections at a time.
6
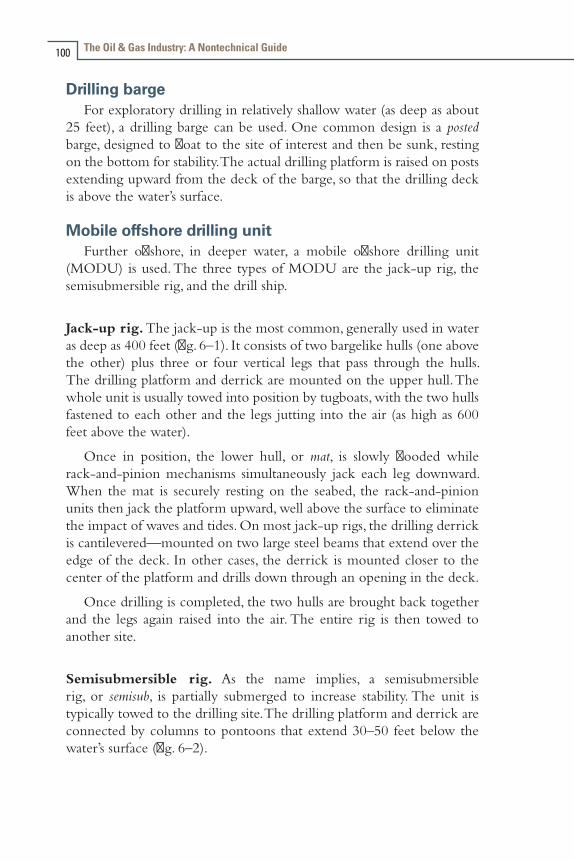
The Oil & Gas Industry: A Nontechnical Guide100
Drilling bargeFor exploratory drilling in relatively shallow water (as deep as about
25 feet), a drilling barge can be used. One common design is a posted barge, designed to float to the site of interest and then be sunk, resting on the bottom for stability. The actual drilling platform is raised on posts extending upward from the deck of the barge, so that the drilling deck is above the water’s surface.
Mobile offshore drilling unitFurther offshore, in deeper water, a mobile offshore drilling unit
(MODU) is used. The three types of MODU are the jack-up rig, the semisubmersible rig, and the drill ship.
Jack-up rig. The jack-up is the most common, generally used in water as deep as 400 feet (fig. 6–1). It consists of two bargelike hulls (one above the other) plus three or four vertical legs that pass through the hulls. The drilling platform and derrick are mounted on the upper hull. The whole unit is usually towed into position by tugboats, with the two hulls fastened to each other and the legs jutting into the air (as high as 600 feet above the water).
Once in position, the lower hull, or mat, is slowly flooded while rack-and-pinion mechanisms simultaneously jack each leg downward. When the mat is securely resting on the seabed, the rack-and-pinion units then jack the platform upward, well above the surface to eliminate the impact of waves and tides. On most jack-up rigs, the drilling derrick is cantilevered—mounted on two large steel beams that extend over the edge of the deck. In other cases, the derrick is mounted closer to the center of the platform and drills down through an opening in the deck.
Once drilling is completed, the two hulls are brought back together and the legs again raised into the air. The entire rig is then towed to another site.
Semisubmersible rig. As the name implies, a semisubmersible rig, or semisub, is partially submerged to increase stability. The unit is typically towed to the drilling site. The drilling platform and derrick are connected by columns to pontoons that extend 30–50 feet below the water’s surface (fig. 6–2).
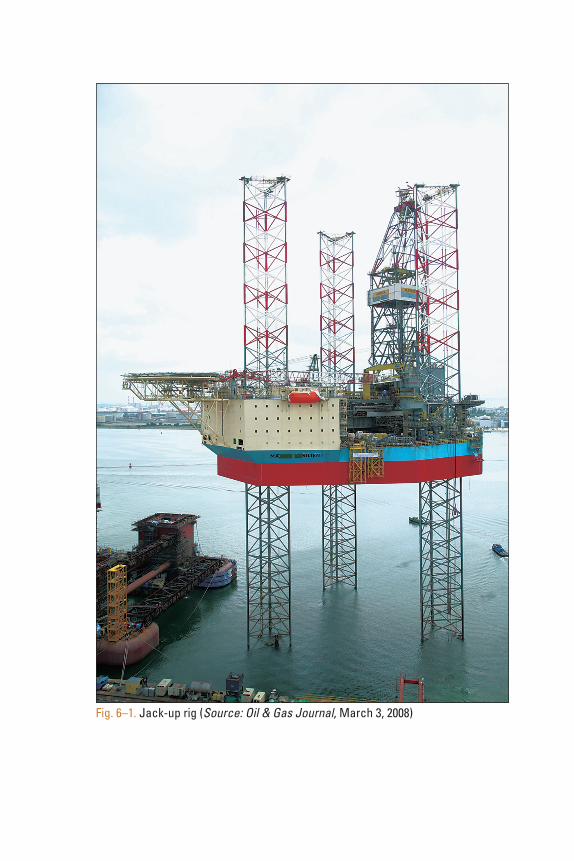
Fig. 6–1. Jack-up rig (Source: Oil & Gas Journal, March 3, 2008)

The Oil & Gas Industry: A Nontechnical Guide102
Fig. 6–2. Semisubmersible rig (Source: Oil & Gas Journal)
Ballast water is pumped into and out of the pontoons to achieve the desired stability. In relatively shallow water, a system of chains and anchors hold the floating rig in place. In deeper water, a dynamic positioning system (using Global Positioning System satellites, computers, and shipboard thrusters) keeps the vessel in the desired spot. Some semisubs can drill in water as deep as 10,000 feet.
Drill ship. The third type of MODU is the drill ship, a large vessel specially modified for drilling (fig. 6–3). The derrick is mounted in the center of the ship, and the operators drill down through a hole in the hull. As with the semisub, the drill ship uses a dynamic positioning system to keep it on station. Some drill ships have two drilling rigs.
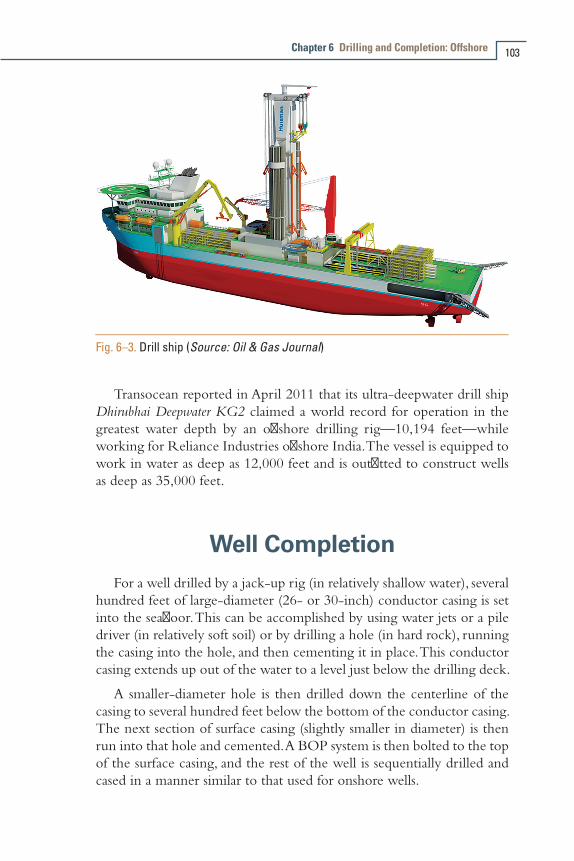
Chapter 6 Drilling and Completion: Offshore 103
Fig. 6–3. Drill ship (Source: Oil & Gas Journal)
Transocean reported in April 2011 that its ultra-deepwater drill ship Dhirubhai Deepwater KG2 claimed a world record for operation in the greatest water depth by an offshore drilling rig—10,194 feet—while working for Reliance Industries offshore India. The vessel is equipped to work in water as deep as 12,000 feet and is outfitted to construct wells as deep as 35,000 feet.
Well CompletionFor a well drilled by a jack-up rig (in relatively shallow water), several
hundred feet of large-diameter (26- or 30-inch) conductor casing is set into the seafloor. This can be accomplished by using water jets or a pile driver (in relatively soft soil) or by drilling a hole (in hard rock), running the casing into the hole, and then cementing it in place. This conductor casing extends up out of the water to a level just below the drilling deck.
A smaller-diameter hole is then drilled down the centerline of the casing to several hundred feet below the bottom of the conductor casing. The next section of surface casing (slightly smaller in diameter) is then run into that hole and cemented. A BOP system is then bolted to the top of the surface casing, and the rest of the well is sequentially drilled and cased in a manner similar to that used for onshore wells.
The Oil & Gas Industry: A Nontechnical Guide104
Completion of wells drilled by a semisubmersible rig or a drill ship (in deeper water) is somewhat more complex. The drill string itself is used first to lower a temporary guide base—a hexagonal steel framework—and then a guide frame to the seabed. Those two units are used to position the drill bit, and a hole 30 or 36 inches in diameter is drilled to about 100 feet.
The drill string and guide frame are then raised to the surface, and attention turns to the foundation pile—the first string of casing that will be placed in the hole. The guide frame is attached to the bottom of the foundation pile, and a permanent guide structure is attached to the top.
The whole assembly is lowered to the seafloor (using steel cables that run from the ship to the temporary guide base), and the foundation pile is run into the drilled hole and cemented. The permanent guide base (now flush with the seafloor) is mated with the temporary guide base.
The drill string is lowered again, the hole is drilled deeper, and a string of conductor casing is then cemented in place. A subsea BOP is lowered and locked onto the wellhead. Then, a flexible, hollow metal tube—a marine riser—is attached to the BOP stack and to the drilling rig. Once the drill string is inserted into the marine riser, drilling mud can be directed down through the drill string, returning upward through the annulus between the drill string and the wall of the marine riser.
A variety of special equipment is used to compensate for the motion of the semisubmersible or drill ship due to wind and waves. In the event of severe weather or other emergency, the BOP can be closed and the stack disconnected from the marine riser, allowing the ship to move to safety. Later, the connection can be reestablished.
The wellhead equipment on a completed subsea well is similar to that on onshore wells. In some cases, the subsea wellhead is dry (enclosed in chamber maintained at atmospheric pressure). In other cases, the equipment is wet (exposed to seawater).
Production from a subsea well can be carried by flowline to a manifold where it is combined with production from other wells (fig. 6–4). From the manifold, oil typically flows to a production platform (see next section) or to a floating production, storage, and off-loading vessel (FPSO). The FPSO is a converted or custom-designed ship with onboard facilities for oil separation and treating. Oil from the FPSO is often then transferred to a shuttle tanker that takes it to an onshore facility for further treatment or storage.
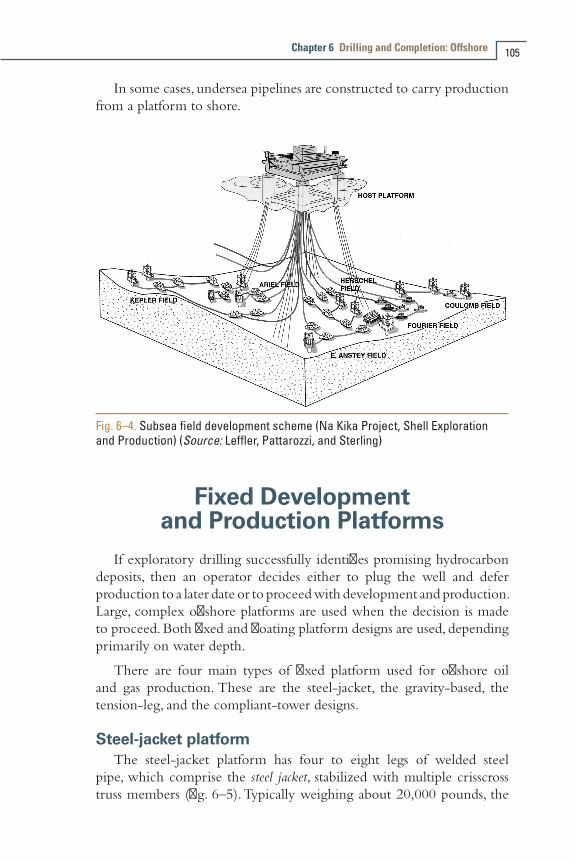
Chapter 6 Drilling and Completion: Offshore 105
In some cases, undersea pipelines are constructed to carry production from a platform to shore.
Fig. 6–4. Subsea field development scheme (Na Kika Project, Shell Exploration and Production) (Source: Leffler, Pattarozzi, and Sterling)
Fixed Development and Production Platforms
If exploratory drilling successfully identifies promising hydrocarbon deposits, then an operator decides either to plug the well and defer production to a later date or to proceed with development and production. Large, complex offshore platforms are used when the decision is made to proceed. Both fixed and floating platform designs are used, depending primarily on water depth.
There are four main types of fixed platform used for offshore oil and gas production. These are the steel-jacket, the gravity-based, the tension-leg, and the compliant-tower designs.
Steel-jacket platformThe steel-jacket platform has four to eight legs of welded steel
pipe, which comprise the steel jacket, stabilized with multiple crisscross truss members (fig. 6–5). Typically weighing about 20,000 pounds, the

The Oil & Gas Industry: A Nontechnical Guide106
platform is built on land, carried by barge or floated (in a horizontal position) to the site, and then rotated vertically and sunk into position. The bottom of each leg is welded, bolted, or cemented to piles driven into the seafloor.
Once the platform is securely in place, an onboard crane lifts the drilling deck, crew quarters, and various modules (e.g., for power generation or mud storage) onto the platform from barges. The steel jacket platform is generally used in water about 500 feet deep.
Fig. 6–5. Steel-jacket offshore platform (Source: Adapted from Leffler, Pattarozzi, and Sterling)
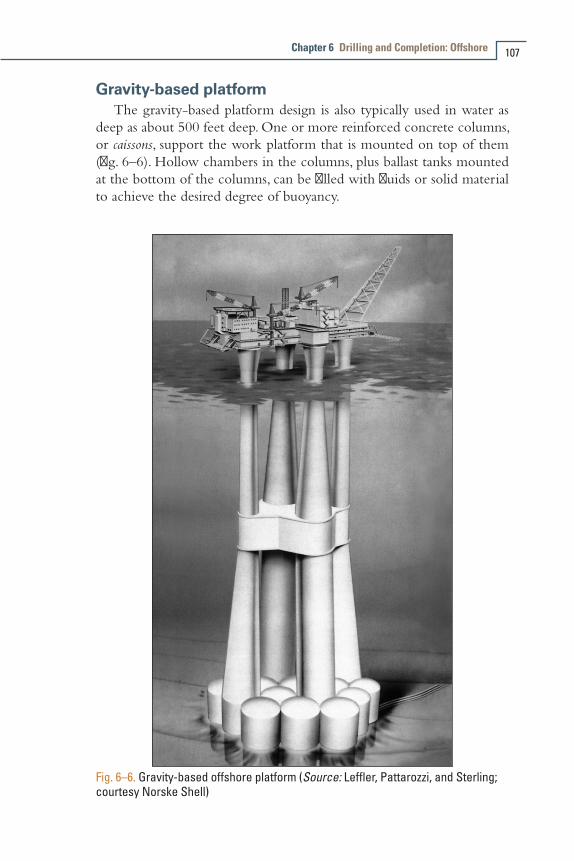
Chapter 6 Drilling and Completion: Offshore 107
Gravity-based platformThe gravity-based platform design is also typically used in water as
deep as about 500 feet deep. One or more reinforced concrete columns, or caissons, support the work platform that is mounted on top of them (fig. 6–6). Hollow chambers in the columns, plus ballast tanks mounted at the bottom of the columns, can be filled with fluids or solid material to achieve the desired degree of buoyancy.
Fig. 6–6. Gravity-based offshore platform (Source: Leffler, Pattarozzi, and Sterling; courtesy Norske Shell)
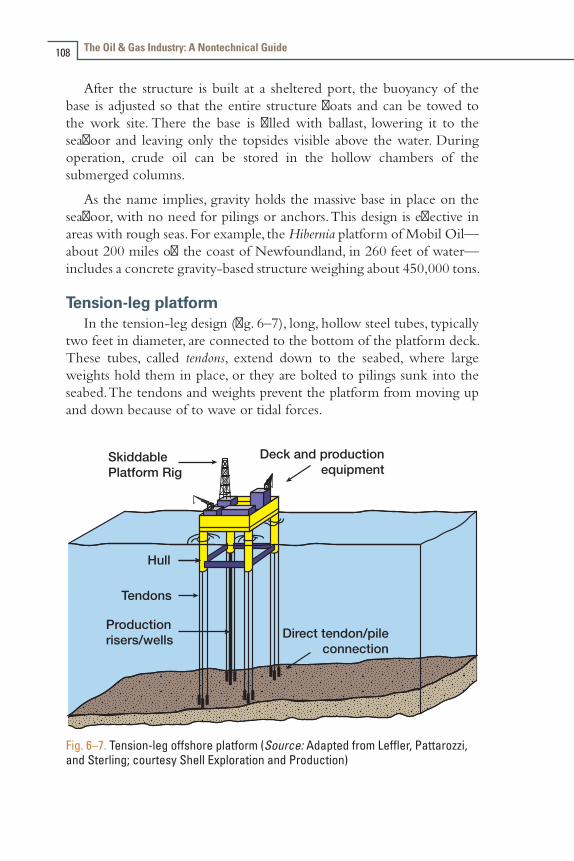
The Oil & Gas Industry: A Nontechnical Guide108
After the structure is built at a sheltered port, the buoyancy of the base is adjusted so that the entire structure floats and can be towed to the work site. There the base is filled with ballast, lowering it to the seafloor and leaving only the topsides visible above the water. During operation, crude oil can be stored in the hollow chambers of the submerged columns.
As the name implies, gravity holds the massive base in place on the seafloor, with no need for pilings or anchors. This design is effective in areas with rough seas. For example, the Hibernia platform of Mobil Oil—about 200 miles off the coast of Newfoundland, in 260 feet of water—includes a concrete gravity-based structure weighing about 450,000 tons.
Tension-leg platformIn the tension-leg design (fig. 6–7), long, hollow steel tubes, typically
two feet in diameter, are connected to the bottom of the platform deck. These tubes, called tendons, extend down to the seabed, where large weights hold them in place, or they are bolted to pilings sunk into the seabed. The tendons and weights prevent the platform from moving up and down because of to wave or tidal forces.
SkiddablePlatform Rig
Deck and productionequipment
Direct tendon/pileconnection
Hull
Tendons
Productionrisers/wells
Fig. 6–7. Tension-leg offshore platform (Source: Adapted from Leffler, Pattarozzi, and Sterling; courtesy Shell Exploration and Production)
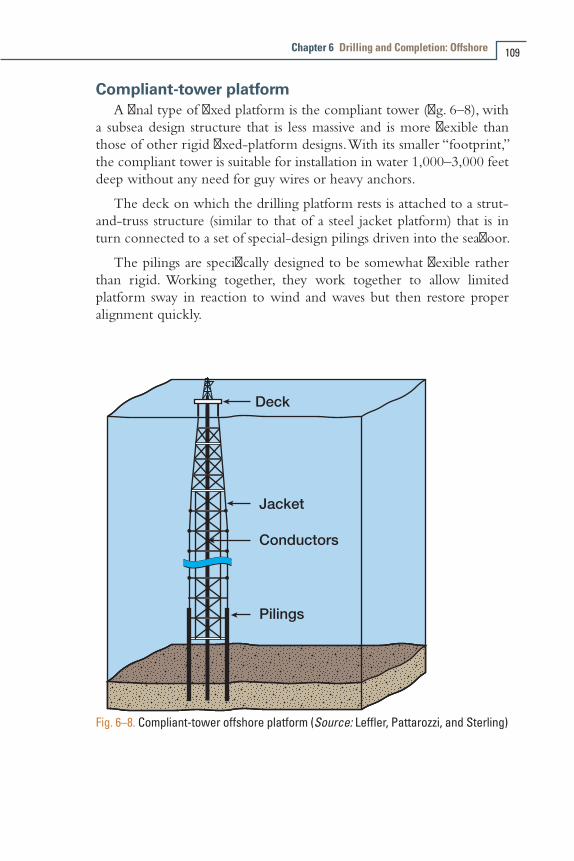
Chapter 6 Drilling and Completion: Offshore 109
Compliant-tower platformA final type of fixed platform is the compliant tower (fig. 6–8), with
a subsea design structure that is less massive and is more flexible than those of other rigid fixed-platform designs. With its smaller “footprint,” the compliant tower is suitable for installation in water 1,000–3,000 feet deep without any need for guy wires or heavy anchors.
The deck on which the drilling platform rests is attached to a strut-and-truss structure (similar to that of a steel jacket platform) that is in turn connected to a set of special-design pilings driven into the seafloor.
The pilings are specifically designed to be somewhat flexible rather than rigid. Working together, they work together to allow limited platform sway in reaction to wind and waves but then restore proper alignment quickly.
Deck
Jacket
Conductors
Pilings
Fig. 6–8. Compliant-tower offshore platform (Source: Leffler, Pattarozzi, and Sterling)
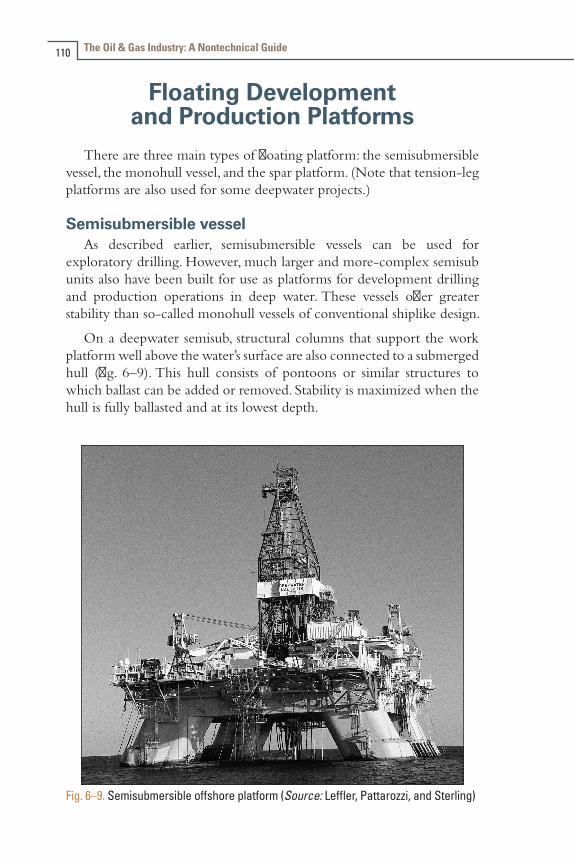
The Oil & Gas Industry: A Nontechnical Guide110
Floating Development and Production Platforms
There are three main types of floating platform: the semisubmersible vessel, the monohull vessel, and the spar platform. (Note that tension-leg platforms are also used for some deepwater projects.)
Semisubmersible vesselAs described earlier, semisubmersible vessels can be used for
exploratory drilling. However, much larger and more-complex semisub units also have been built for use as platforms for development drilling and production operations in deep water. These vessels offer greater stability than so-called monohull vessels of conventional shiplike design.
On a deepwater semisub, structural columns that support the work platform well above the water’s surface are also connected to a submerged hull (fig. 6–9). This hull consists of pontoons or similar structures to which ballast can be added or removed. Stability is maximized when the hull is fully ballasted and at its lowest depth.
Fig. 6–9. Semisubmersible offshore platform (Source: Leffler, Pattarozzi, and Sterling)
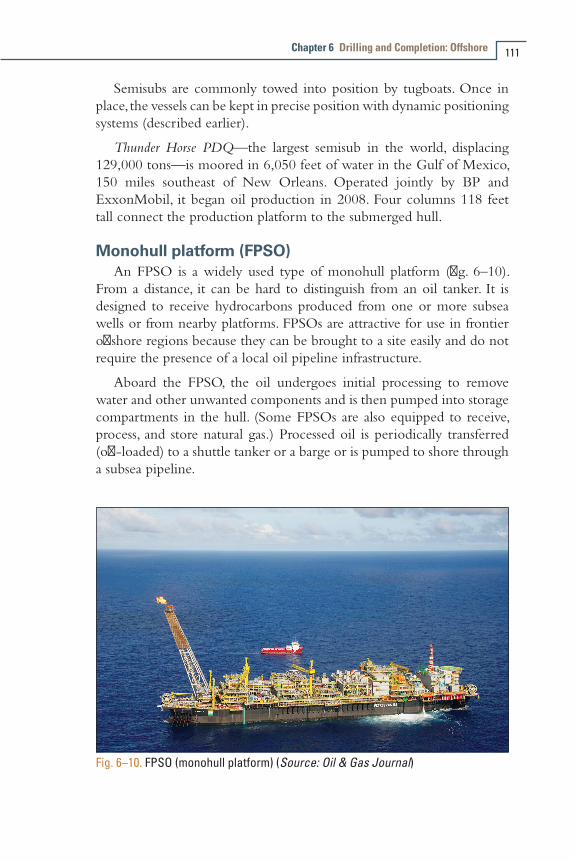
Chapter 6 Drilling and Completion: Offshore 111
Semisubs are commonly towed into position by tugboats. Once in place, the vessels can be kept in precise position with dynamic positioning systems (described earlier).
Thunder Horse PDQ—the largest semisub in the world, displacing 129,000 tons—is moored in 6,050 feet of water in the Gulf of Mexico, 150 miles southeast of New Orleans. Operated jointly by BP and ExxonMobil, it began oil production in 2008. Four columns 118 feet tall connect the production platform to the submerged hull.
Monohull platform (FPSO)An FPSO is a widely used type of monohull platform (fig. 6–10).
From a distance, it can be hard to distinguish from an oil tanker. It is designed to receive hydrocarbons produced from one or more subsea wells or from nearby platforms. FPSOs are attractive for use in frontier offshore regions because they can be brought to a site easily and do not require the presence of a local oil pipeline infrastructure.
Aboard the FPSO, the oil undergoes initial processing to remove water and other unwanted components and is then pumped into storage compartments in the hull. (Some FPSOs are also equipped to receive, process, and store natural gas.) Processed oil is periodically transferred (off-loaded) to a shuttle tanker or a barge or is pumped to shore through a subsea pipeline.
Fig. 6–10. FPSO (monohull platform) (Source: Oil & Gas Journal)

The Oil & Gas Industry: A Nontechnical Guide112
An FPSO can be a converted oil tanker or a custom-built vessel. Alternatively, depending on expected operating conditions, an FPSO may look more like a simple box than a ship, may be a semisubmersible with storage, or may even have a cylindrical shape. If oil is not processed onboard, then the vessel is considered an FSO—floating storage and off-loading vessel.
In most cases, the lines (risers) carrying oil from wells or nearby platforms are connected to a turret at the front of the FPSO. The turret lets the vessel rotate to head into the wind and reduce mechanical forces on the moorings. Some turrets and mooring systems are designed to be disconnected if necessary; others are permanently connected. In the often stormy North Sea, most ship-shaped FPSOs are purpose-built and permanently moored.
The world’s first FDPSO—floating drilling, production, storage, and off-loading vessel—was developed in 2009 for Murphy Oil, for operation off the coast of the Republic of Congo. The Azurite, owned by Prosafe Production, incorporates deepwater drilling equipment that can be removed for later use at other sites. The unit is a converted very large crude carrier (VLCC).
Spar platformThe last major type of offshore production platform is called a spar. In
this design, the work platform is built atop a tall cylinder that is designed to be submerged in the vertical position below the platform. Spars are built in three configurations (fig. 6–11):
• conventional spar, with a one-piece cylindrical hull
• truss spar, with a midsection composed of truss elements that connect an upper buoyant hull with a lower tank containing permanent ballast
• cell spar, built up from several vertical cylinders
Inherently more stable than a tension leg platform because of the heavy ballast in its bottom section, the spar also is attached to the seafloor with mooring lines. The lines can be adjusted to move the spar horizontally (within limits) to better position it above wells on the seabed. Strakes (resembling fins) installed on the outer surface of a cylindrical spar can help lessen the effects of wave action and water movement on the platform.
In March 2010, oil production began from the world’s deepest production platform, the Perdido spar, operated by Royal Dutch Shell.

Chapter 6 Drilling and Completion: Offshore 113
The $3 billion facility is sited 200 miles from Galveston, Texas, in 8,000 feet of water in the Gulf of Mexico. The spar measures 188 feet in diameter and 555 feet in height, incorporating both a cylindrical section (topmost) and a lower truss structure. Nine mooring lines, each two miles long, are attached to the base of the truss. Oil and gas will be produced from 35 wells below the platform, some extending 14,000 feet below the seabed.
Fig. 6–11. Spar platform options (Source: Leffler, Pattarozzi, and Sterling)


Managing Oil and Gas Production
Once drilling has been completed, a major business objective for the exploration and development firm is to effectively manage production to achieve cost-effective, safe, and environmentally sensitive extraction of crude oil and natural gas from subsurface reservoirs. This chapter focuses on actions that optimize production from oil and gas wells, including maintenance, repair, and improved-recovery programs that help achieve this goal while extending the productive life of wells. The initial sections present information pertinent to both oil and gas wells; those sections that come after focus first on oil production and then on gas production.
Start of ProductionAs production operations begin, the rig and other equipment used to
drill and complete the well have been moved away from the wellbore, and (as noted in chap. 5) the top is usually outfitted with a collection of valves and other components called a Christmas tree. These valves regulate pressures, control flows, and allow access to the wellbore in case further completion work is needed. From the outlet valve of the production tree, the flow can be connected to a distribution network of pipelines and tanks that eventually moves the product to refineries, natural gas compressor stations, or oil export terminals.
As long as the pressure in the reservoir remains high enough, the Christmas tree is all that is required to produce the well. If well pressure drops, artificial lift methods can be employed to maintain economic production.
7
The Oil & Gas Industry: A Nontechnical Guide116
Artificial LiftThe natural pressure within any liquid-producing reservoir will force
fluid (liquid or gas) to areas of lower energy or potential. When the pressure inside a production well is below the reservoir pressure, this differential will push fluids into (and upward within) the wellbore. This is typically the case for gas wells; it can also be true for some oil wells during early production.
For many oil wells, however, reservoir pressure may not be sufficient to push the fluid to the surface, creating the need for some type of artificial lift. The lift method chosen depends on the depth of the reservoir (greater depth results in a higher pressure requirement) and the density of the fluid (a heavier mixture results in a higher requirement). There at least a dozen artificial lift approaches in use by industry.
Following initial production, two things happen: water (which is heavier than oil and much heavier than gas) begins to encroach into the formation; and reservoir pressure drops as the reservoir depletes. If no action is taken, then flow from the well will eventually stop. However, most well operators will implement an artificial lift program to continue or increase production.
The most common approach is to remove the Christmas tree and install a surface pump. The motor-driven sucker-rod pump (also called a pumpjack) is by far the most common. From a distance, this arrangement resembles a large bird or a horse’s head slowly bobbing up and down (fig. 7–1).
Another approach, called gas lift, injects a compressed gas (often, natural gas) into the annulus between the casing and the tubing. Special valves allow the gas to enter the tubing, where it dissolves in the produced gas/water liquid and also forms bubbles. The dissolved gas and bubbles force the liquid up the tubing string, where the gas can be captured and recycled.
A third alternative is to install a powered pump—electric or hydraulic—at the bottom of the well tubing. In one case, power is delivered by an electrical cable running down the well; in the other, high-pressure hydraulic fluid is delivered to the pump to drive it.
A fourth method is to pump hydraulic fluid down into the tubing string itself, allowing the produced gas and water to flow upward through
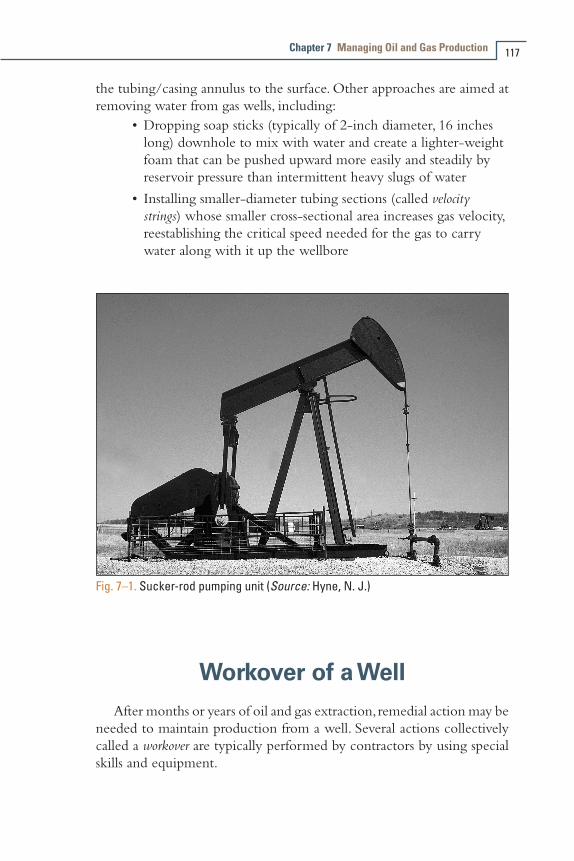
Chapter 7 Managing Oil and Gas Production 117
the tubing/casing annulus to the surface. Other approaches are aimed at removing water from gas wells, including:
•Dropping soap sticks (typically of 2-inch diameter, 16 inches long) downhole to mix with water and create a lighter-weight foam that can be pushed upward more easily and steadily by reservoir pressure than intermittent heavy slugs of water
• Installing smaller-diameter tubing sections (called velocity strings) whose smaller cross-sectional area increases gas velocity, reestablishing the critical speed needed for the gas to carry water along with it up the wellbore
Fig. 7–1. Sucker-rod pumping unit (Source: Hyne, N. J.)
Workover of a WellAfter months or years of oil and gas extraction, remedial action may be
needed to maintain production from a well. Several actions collectively called a workover are typically performed by contractors by using special skills and equipment.

The Oil & Gas Industry: A Nontechnical Guide118
Prior to workover, a well must be shut in to stop production. Flow is killed by pumping brine, drilling mud, oil, or some other fluid down into the annulus, between the casing and the tubing, and back up the tubing string. A BOP is usually installed as well, and the tubing string and other downhole equipment are removed.
Workover actionsWorkover can include the following steps:
•Removal of water or drilling mud (swabbing), done either right after a well is completed or later (to restore production in an operational well)
•Repair or replacement of downhole pumps, valves, and packers
• Installation of smaller-diameter tubing to boost flow rates
•Removal of scale (salts, e.g., calcium sulfate) or paraffin from tubing
•Cleanout of loose sand from the bottom of wells drilled in sandstones
•Repair of damaged tubing or casing or of the cement around the casing
Sidetrack wellIn some situations, the well casing may be significantly damaged or
may have otherwise lost integrity. Replacing the cemented casing is expensive, so one alternative is to drill and complete a sidetrack well. A hole is made in the casing above the obstruction or damage, and the well is plugged with cement below that hole. Special drill tools—such as a whipstock, bent housing, or bent sub (see chap. 5)—are used to drill outward at an angle from the original well. The new wellbore is completed in the conventional manner, and drilling continues after a liner is set.
RecompletionIf operators conclude that a particular pay zone is depleted, a technique
called recompletion may be undertaken. This is the completion of other pay zones below or above the original zone. Cement is used to seal off the original producing zone.
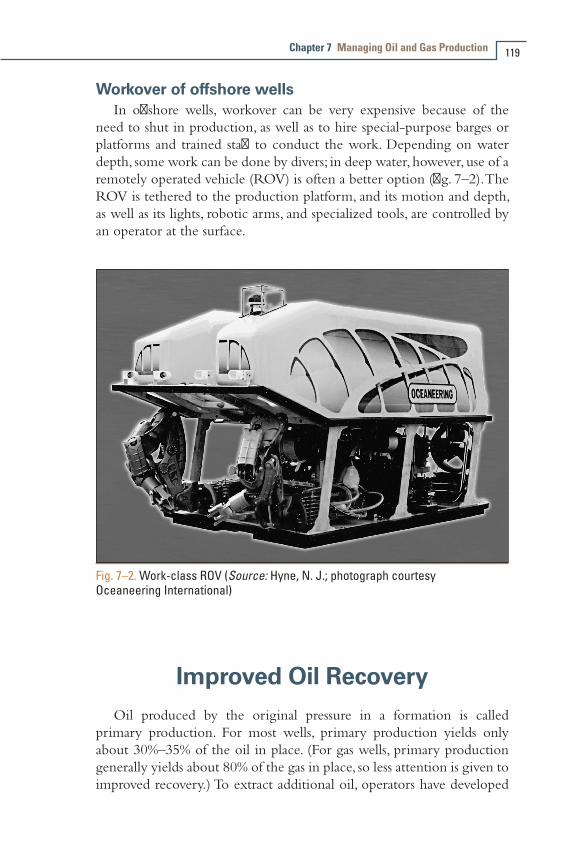
Chapter 7 Managing Oil and Gas Production 119
Workover of offshore wellsIn offshore wells, workover can be very expensive because of the
need to shut in production, as well as to hire special-purpose barges or platforms and trained staff to conduct the work. Depending on water depth, some work can be done by divers; in deep water, however, use of a remotely operated vehicle (ROV) is often a better option (fig. 7–2). The ROV is tethered to the production platform, and its motion and depth, as well as its lights, robotic arms, and specialized tools, are controlled by an operator at the surface.
Fig. 7–2. Work-class ROV (Source: Hyne, N. J.; photograph courtesy Oceaneering International)
Improved Oil RecoveryOil produced by the original pressure in a formation is called
primary production. For most wells, primary production yields only about 30%–35% of the oil in place. (For gas wells, primary production generally yields about 80% of the gas in place, so less attention is given to improved recovery.) To extract additional oil, operators have developed

The Oil & Gas Industry: A Nontechnical Guide120
a range of methods to inject various materials into a reservoir, aiming to push remaining oil toward wellbores.
WaterfloodA common technique often used first by operators to extract
additional oil is called waterflood (fig. 7–3), which can recover 5%–50% of the remaining oil. They introduce water (treated first to remove solids, bacteria, organic matter, and oxygen) through several injection wells placed in specific patterns around a producing well.
A waterflood program must be matched to the composition, permeability, and degree of homogeneity of the target rock to avoid damaging the formation and to maximize oil recovery. In some cases, polymers (to increase viscosity) or chemicals (to modify acidity) are added to the water.
Another set of methods to extract additional oil are collectively known as enhanced oil recovery. These methods involve the introduction of substances not naturally found in a reservoir and include the use of gases, chemicals, or thermal energy. The aim is to boost reservoir pressure and to sweep hydrocarbons from various parts of the reservoir toward wellbores.
As with waterflood, these methods require injection wells (often chosen from old production wells in a carefully determined pattern). They are also used when facing such problems as reservoir pressure depletion or high oil viscosity.
Injectionwell
Producingwell
Injectionwell
Fig. 7–3. Waterflood schematic (Source: Adapted from Hyne, N. J.)

Chapter 7 Managing Oil and Gas Production 121
Gas injectionThis technique typically sends carbon dioxide, nitrogen, or liquefied
petroleum gas (LPG) into the reservoir—gases that are miscible (dissolve in the oil). The gas then pushes the fluid oil through the pores and cracks in the rock toward producing wells. This approach can often recover 35% of remaining oil.
Chemical floodThis approach injects different chemicals—each serving a different
purpose—into a depleted sandstone reservoir in separate batches, or slugs. A common first step is to inject a slug of a detergent-like surfactant that reduces the surface tension of the oil, which washes out of the rock pores and forms a micro-emulsion. The next slug—water thickened with polymers—pushes the micro-emulsion toward the producing wells. A chemical flood can recover about 40% of remaining oil.
Thermal recoverySeveral types of thermal recovery are used to make heavy oil remaining
in a reservoir flow more easily.
Cyclic steam injection. One common approach is to use cyclic steam injection (fig. 7–4). Operators inject steam into a well and then shut in the well for as long as two weeks, to allow the heat from the steam to boost the temperature of the oil and make it flow more easily. After that, a surface pump pulls the heated heavy oil from the well over a period of days or weeks. This “puff and huff” cycle of injection and pumping is typically repeated until it becomes ineffective (perhaps 15 or 20 times).
Viscousoil
Fluid oil
Fig. 7–4. Cyclic steam injection (a) and production (b) (Source: Adapted from Hyne, N. J.)
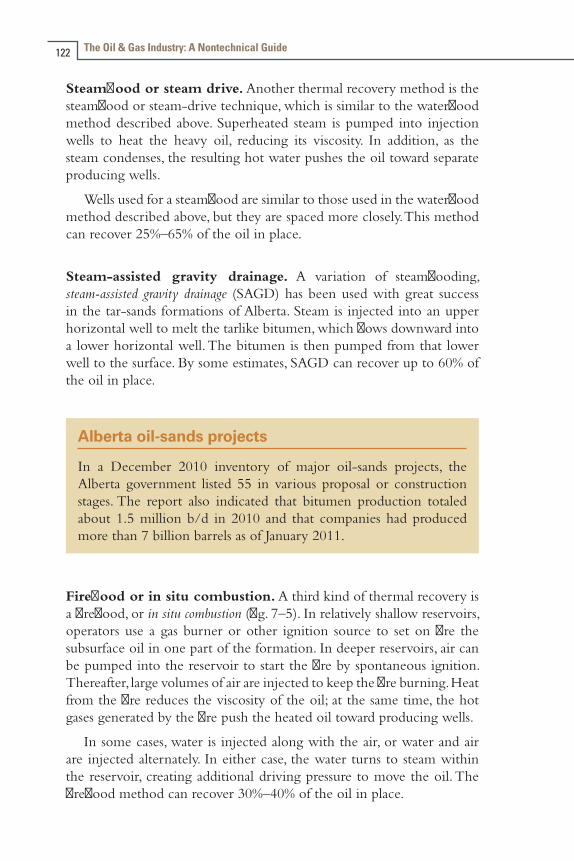
The Oil & Gas Industry: A Nontechnical Guide122
Steamflood or steam drive. Another thermal recovery method is the steamflood or steam-drive technique, which is similar to the waterflood method described above. Superheated steam is pumped into injection wells to heat the heavy oil, reducing its viscosity. In addition, as the steam condenses, the resulting hot water pushes the oil toward separate producing wells.
Wells used for a steamflood are similar to those used in the waterflood method described above, but they are spaced more closely. This method can recover 25%–65% of the oil in place.
Steam-assisted gravity drainage. A variation of steamflooding, steam-assisted gravity drainage (SAGD) has been used with great success in the tar-sands formations of Alberta. Steam is injected into an upper horizontal well to melt the tarlike bitumen, which flows downward into a lower horizontal well. The bitumen is then pumped from that lower well to the surface. By some estimates, SAGD can recover up to 60% of the oil in place.
Alberta oil-sands projects
In a December 2010 inventory of major oil-sands projects, the Alberta government listed 55 in various proposal or construction stages. The report also indicated that bitumen production totaled about 1.5 million b/d in 2010 and that companies had produced more than 7 billion barrels as of January 2011.
Fireflood or in situ combustion. A third kind of thermal recovery is a fireflood, or in situ combustion (fig. 7–5). In relatively shallow reservoirs, operators use a gas burner or other ignition source to set on fire the subsurface oil in one part of the formation. In deeper reservoirs, air can be pumped into the reservoir to start the fire by spontaneous ignition. Thereafter, large volumes of air are injected to keep the fire burning. Heat from the fire reduces the viscosity of the oil; at the same time, the hot gases generated by the fire push the heated oil toward producing wells.
In some cases, water is injected along with the air, or water and air are injected alternately. In either case, the water turns to steam within the reservoir, creating additional driving pressure to move the oil. The fireflood method can recover 30%–40% of the oil in place.
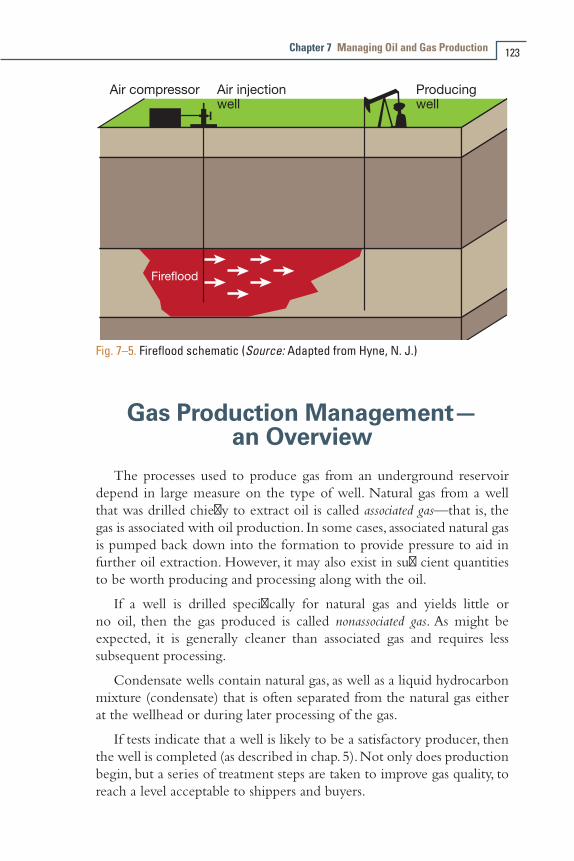
Chapter 7 Managing Oil and Gas Production 123
Air compressor Air injectionwell
Producingwell
Fig. 7–5. Fireflood schematic (Source: Adapted from Hyne, N. J.)
Gas Production Management— an Overview
The processes used to produce gas from an underground reservoir depend in large measure on the type of well. Natural gas from a well that was drilled chiefly to extract oil is called associated gas—that is, the gas is associated with oil production. In some cases, associated natural gas is pumped back down into the formation to provide pressure to aid in further oil extraction. However, it may also exist in sufficient quantities to be worth producing and processing along with the oil.
If a well is drilled specifically for natural gas and yields little or no oil, then the gas produced is called nonassociated gas. As might be expected, it is generally cleaner than associated gas and requires less subsequent processing.
Condensate wells contain natural gas, as well as a liquid hydrocarbon mixture (condensate) that is often separated from the natural gas either at the wellhead or during later processing of the gas.
If tests indicate that a well is likely to be a satisfactory producer, then the well is completed (as described in chap. 5). Not only does production begin, but a series of treatment steps are taken to improve gas quality, to reach a level acceptable to shippers and buyers.

The Oil & Gas Industry: A Nontechnical Guide124
Initial Gas TreatmentAbout 75% of the raw natural gas in the United States comes from
underground reservoirs that hold little or no oil. This nonassociated gas is cleaner (and therefore easier to process) than gas from wells that do contain oil. But regardless of the source, dirt, sand, and water vapor must be removed from the raw gas to prevent contamination and corrosion of equipment and pipelines.
A device called a wellhead separator performs initial cleanup, removing water, condensate and sediment. Dirt and sand are removed with filters or traps. Water vapor is typically removed by passing the gas through a desiccant material, such as silica gel or alumina (solid granules) or glycol (a liquid).
Nevertheless, the gas output from the wellhead separator can still contain hydrocarbons, hydrogen sulfide, and a range of noncombustible gases. Further treatment is needed, and this is most cost-effectively done at a large central facility called a natural gas processing plant or simply a gas plant (fig. 7–6). A network of small-diameter, low-pressure piping called a gathering system routes the gas from multiple (sometimes more than 100) wells to the gas plant.
Fig. 7–6. Williams Companies Rio Blanco gas plant (Colorado) (Source: Oil &Gas Journal)
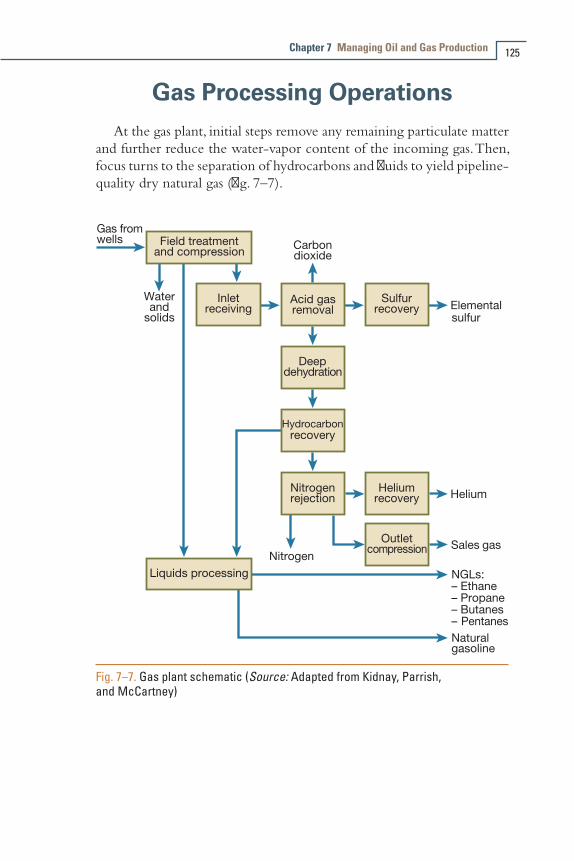
Chapter 7 Managing Oil and Gas Production 125
Gas Processing OperationsAt the gas plant, initial steps remove any remaining particulate matter
and further reduce the water-vapor content of the incoming gas. Then, focus turns to the separation of hydrocarbons and fluids to yield pipeline-quality dry natural gas (fig. 7–7).
Hydrocarbon
Fig. 7–7. Gas plant schematic (Source: Adapted from Kidnay, Parrish, and McCartney)
The Oil & Gas Industry: A Nontechnical Guide126
Removal of carbon dioxide and hydrogen sulfideNatural gas that contains significant amounts of carbon dioxide
or hydrogen sulfide is sometimes called acid gas because these two compounds can react with water vapor in the natural gas to form acids that cause corrosion. (When only hydrogen sulfide is present, natural gas is referred to as sour. Natural gas is described as sweet after the removal of hydrogen sulfide.)
A wide range of technologies have been developed to remove acid gases, including use of chemical, physical, and hybrid absorption solvents; molecular sieves and other solid adsorbents; membranes; direct chemical conversion processes; and cryogenic (ultralow-temperature) fractionation. One common approach flows raw natural gas up through a tower while a spray of water mixed with a solvent is injected at the top. The solvent reacts with the two gases (carbon dioxide and hydrogen sulfide), and the solution is drained from the bottom of the tower for further processing.
When present in sufficient amounts, carbon dioxide can be injected into an underground formation under pressure to improve oil recovery. Sulfur can be converted to elemental sulfur for commercial sale or can be injected into a suitable underground formation.
Removal of water vaporDehydrators reduce the moisture content of natural gas by the use of
either solid drying agents or, more commonly, water-absorbing liquids. Besides affecting the heating value of the natural gas and contributing to corrosion, water can (under certain pressure and temperature conditions) become part of a solid or slushlike compound, methane hydrate. A lattice structure of methane and water molecules, hydrate can plug pipelines, pressure regulators, and other equipment.
Removal of heavier hydrocarbon gasesRaw (but cleaned) natural gas can still contain significant amounts
of heavier hydrocarbon gases (such as propane and butane) that can be extracted and sold separately. The most common extraction method is to bubble the raw gas up through a tower containing a cold absorption oil, similar to kerosene.
As the gas comes in contact with the cold oil, the heavier hydrocarbon gases condense into liquids and are trapped in the oil. The lighter hydrocarbon gases, such as methane and ethane, do not condense into liquid and flow out the top of the tower. About 85% of the propane, 40% of the ethane, and almost all of the butane and heavier hydrocarbons can

Chapter 7 Managing Oil and Gas Production 127
be extracted using this absorption process. The absorption oil is then itself distilled to remove the trapped hydrocarbons, which are separated into individual components in a fractionation tower (see chap. 11).
After this treatment, the natural gas (now chiefly methane) may still contain some ethane, as well as small amounts of other constituents, such as nitrogen and helium. A portion of the ethane is sometimes extracted for use as a raw material in various chemical processes. This is done by first reducing the level of water vapor and then subjecting the gas to repeated compression and expansion to cool the ethane and capture it as a liquid.
Nitrogen removalNitrogen can reduce the heating value of natural gas (because nitrogen
does not burn). After the removal of carbon dioxide and hydrogen sulfide, the processed natural gas goes through a low-temperature distillation process to liquefy and separate the nitrogen. The collective removal of carbon dioxide, hydrogen sulfide, and nitrogen is called upgrading, because the natural gas is made cleaner and will consequently burn hotter.
Helium removalNatural gas is the main source of helium for industrial use in the
United States. Extraction of helium gas is done after the nitrogen has been removed, using a complex distillation and purification process to isolate the helium from other gases. Natural gas leaving the gas processing plant is ready for direct use by energy customers or for injection into a transmission pipeline system.
Other Environmental Issues in Gas Production
Two main environmental issues arise in the production of natural gas. The first relates to water quality and the other to air quality.
Both gas and oil extraction bring significant amounts of water to the surface and this produced water must be treated and/or disposed of in ways that minimize environmental impact. For example (as noted in chap. 5), hydraulic fracturing operations typically pump millions of gallons of water into the ground, a significant portion of which is then brought back up to the surface. Further, prior to extraction of methane from coal

The Oil & Gas Industry: A Nontechnical Guide128
seams, operators must remove water that collects naturally in the pores of the coal. Other gas-bearing formations also may contain considerable volumes of water.
Produced water typically contains dissolved salts, as well as varying levels of hydrocarbons (oil and grease), chemical additives and proppants, sediment, and even something called NORM—naturally occurring radioactive materials (e.g., radium-226 or -228). The petroleum industry has developed a range of technologies and procedures to ensure that produced waters can be treated and disposed of properly. For example, the Gas Research Institute (now Gas Technology Institute) developed a Produced Water Management Handbook in 2003. Based on interviews with some 250 oil and gas producers, the handbook discusses such practices as well injection, evaporation, surface disposal techniques, recycling and reuse strategies, reverse osmosis, and downhole gas/water separation.
With regard to air quality, methane is a potent greenhouse gas, trapping heat in the atmosphere approximately 20 times more effectively than carbon dioxide. This means that the gas industry pays particular attention to controlling leaks and emissions of methane from production, processing, and transportation operations.
In 1993, the natural gas industry joined with EPA to launch the Natural Gas STAR Program to reduce methane emissions. Program data from EPA indicate that emissions were reduced by more than 820 bcf from 1993 to 2008 (by 114 bcf in 2008 alone).
When Production EndsAfter a well has been depleted to the point at which further economic
recovery of oil or gas is not possible, it must be plugged and abandoned. This action is required by law, to prevent briny water from the well from polluting groundwater.
The first step is typically to cut and extract the well casing for salvage purposes. Then, a series of mechanical and cement plugs are installed. These seal off all high-pressure and permeable producing zones in the well. A separate cement plug is often installed in the uppermost section of the well to protect any freshwater reservoirs near the surface.
Offshore wells are plugged and abandoned in the same manner as onshore wells, and all subsea equipment is retrieved. When an offshore

Chapter 7 Managing Oil and Gas Production 129
platform is abandoned, usually only the deck equipment is salvaged. The legs that held up the deck can be cut off at seabed level, and the entire rig can then be towed to shore for salvage or disposal. Alternatively, the structure can be tipped over to lie horizontally on the seabed, often creating an excellent artificial reef for marine life.


Transporting Oil
Once crude oil has been produced from an onshore field, it generally undergoes initial processing close to the well site (as described in more detail below) and is then put into tanks for temporary storage (fig. 8–1). After a period of time in storage, crude oil enters the transportation system (fig. 8–2). It may be moved to a refinery (for conversion into a range of products), to a port (for export), or to the site of a customer (e.g., a power plant) who will use the crude directly.
This chapter focuses on the movement of crude by pipeline, although attention is also given to other transport modes, including tanker vessels, railcars, and tank trucks. Product pipelines—those that carry various finished products (gasoline, diesel, and heating oil) from a refinery to distributors or customers—are discussed later, in chapter 11. Offshore (subsea) pipelines are discussed toward the end of this chapter, after the sections dealing with onshore pipelines.
Fig. 8–1. Crude oil stock tanks at a well site (Source: Hyne, N. J.)
8

The Oil & Gas Industry: A Nontechnical Guide132
Fig. 8–2. Oil transportation system (Source: Adapted from Miesner and Leffler)
Preliminary Crude ProcessingA typical land-based oil field contains a number of wells. A network
of gathering lines carries this oil from the wells to a location in or near the oil field for preliminary processing.
Oil produced from almost any reservoir contains some gases (including natural gas, often in the form of associated gas) in addition to water vapor or liquid water. For this reason, a unit called a separator at a well site is used to remove both the natural gas and the water. Any solid materials (e.g., sand), as well as some dissolved salts, are removed from the raw crude.
Following this initial cleanup, the crude oil plus any condensate (light hydrocarbon liquids extracted during onsite natural gas separation) are pumped into holding (or lease) tanks near the well for temporary storage. (For further information about preliminary cleanup of natural gas at or near the wellhead, see chap. 7.)
When a pipeline company is ready to accept the stored oil, a technician or an automated system checks oil volume to be transferred as well as oil quality (to ensure that water and sediment content are below desired limits). In manual operations, after climbing to the top of the storage tank and opening a small hatch, a technician takes three actions:
•Measures the temperature of the oil
•Lowers a gauge tape into the tank to measure oil depth—similar to using a dipstick to check a car engine’s oil level
•Takes a sample of the stored oil by dipping a small bottle into the tank or by opening a small valve on the tank’s side
Chapter 8 Transporting Oil 133
Then, by calculation and analysis, the technician will: •Convert the measured oil depth to oil volume, using a gauge
table or computer algorithm
• Separate basic sediment and water (BS&W) from the oil sample, using a centrifuge
•Determine how much BS&W is contained in the measured oil volume.
After performing these actions and calculations (and assuming the BS&W percentage is acceptable to the oil buyer), the technician allows an agreed-on amount of oil to flow out of the tank into a pipeline or tank truck. After withdrawal, the technician measures the oil remaining in the tank, subtracts that figure from the initial measurement, and adjusts the calculated difference in volume for temperature and BS&W content. (Industry standards call for correcting the volume for a temperature of 60°F.)
At some facilities, the oil is measured and tested by skid-mounted automatic custody transfer (ACT) units. A technician periodically checks the ACT unit and confirms the BS&W measurement.
After the manual or automated analysis is completed, paperwork is prepared to document the sale. When the oil is delivered to a refinery, a tank farm, or another pipeline, similar analysis and calculation will be conducted to confirm oil quality and delivery volume.
Pipeline NetworksThe next sections describe an oil pipeline network, starting with
an overview and progressing to a more detailed discussion of the components of a pipeline. Tables 8–1 and 8–2 list major oil pipelines in the United States and in other countries, respectively.
OverviewLong-haul pipelines (also called mainlines or trunk lines) are larger-
diameter pipes with fewer delivery points than short-haul pipelines. The customer generally receives the same quality of oil that was put into the line for delivery but not necessarily the same oil molecules.
The speed of oil flowing through a pipeline depends on pipe diameter, interior-wall condition, pumping-system pressure, topography,

The Oil & Gas Industry: A Nontechnical Guide134
and pipeline orientation. In general terms, a given batch of oil moves at 3–8 miles per hour through a mainline, propelled by centrifugal pumps sited every 20–100 miles (depending on terrain).
Table 8–1. Selected major U.S. oil pipelinesRegion/name Route Comments
Seaway Pipeline U.S. Gulf Coast to Cushing, OKCapline Pipeline St. James, LA, to Patoka hub
in southern ILTAPS (Trans-Alaska
Pipeline System)Prudhoe Bay (North Slope)
to southern coast of AlaskaOil then moves by tanker ships
to California refineriesEnbridge Pipeline
SystemAlberta to Chicago
and Great Lakes regionMuch of the oil is from
Alberta tar-sands deposits; 1.5 million b/d
Spearhead Pipeline
U.S. portion of Enbridge system from Chicago to Cushing, OK
Keystone Pipeline Hardisty, Alberta, west to Manitoba, south to Nebraska, then east to Patoka hub; also, extension from Nebraska to Cushing, OK
Expansion proposed (Keystone XL) to carry oil from Nebraska to Cushing, OK, and on to Port Arthur, TX.
Sources: Various.
Table 8–2. Selected major oil pipelines outside the United States Region/name Route Comments
Sumed (Suez-Mediterranean) Pipeline
Ain Sikhna terminal on Gulf of Suez (Egypt) to Sidi Kerir on the Mediterranean coast
2.5 million b/d; moves Saudi and other Mideast oil to Europe across Egypt
BTC Pipeline Baku (Azerbaijan), to Tbilisi (Georgia), to Ceyhan (Turkey)
1.0 million b/d of Caspian Sea oil; by ship from Ceyhan to European markets
Druzhba (Friendship) Pipeline
West Siberia, Urals, and Caspian Sea to Europe
1.4 million b/d
East-West Pipeline
Oil fields in eastern Saudi Arabia to refineries and Yanbu terminal in western Saudi Arabia
ESPO (Eastern Siberia–Pacific Ocean) Pipeline
Taishet (Irkutsk Oblast, Russia) to Kozimo (near Nakhodka, Russia); also, spur from Skovorodino to Daqing, China, completed Dec. 2010.
1,713 miles, Taishet-Skovorodino (Amur Oblast), done; stage 2 (1,300 miles, to Kozimo) to be done by 2014; 1.6 million b/d to Asian Pacific markets
Sources: Various.

Chapter 8 Transporting Oil 135
Short-haul lines are also called spur, stub, or delivery lines. These lines usually operate in batch mode, in which the customer receives the same oil molecules that were put into the line. More details about this aspect of pipeline operation are presented in a later section.
Points at which pipelines come together are called hubs (or marine terminals if near a port). Significant storage volume is generally available at such facilities.
A major hub for U.S. crude oil pipelines is in Cushing, Oklahoma, approximately 500 miles north of the Gulf of Mexico. This is the hub at which any futures contract for West Texas Intermediate (WTI) crude oil executed on the New York Mercantile Exchange (NYMEX) is physically deliverable. Other primary U.S. hubs and marine terminals are at New York Harbor; the Gulf Coast (Texas-Louisiana coast); Tulsa, Oklahoma; Chicago; and Los Angeles.
At some production sites, no pipeline entry point is nearby. In such cases, trucks, barges, or railcars carry the pipe to another tank facility in an area served by a pipeline. However, pipeline transport is the most common way of delivering crude oil to refineries to be converted into a range of products. Alternatively, the crude oil could be loaded onto a tanker ship for transport to a domestic or foreign refinery or to some other customer. Each of these transport methods is discussed in more detail in later sections.
PipeMost sections of an oil pipeline operate at relatively low pressure
(up to about 150 psi). Pipe in these sections is made from various types of plastic, fiberglass, or steel. For high-pressure lines (operating pressure sometimes higher than 1,000 psi), steel is used. Some subsea lines are made from more-flexible polymer-and-steel composites.
Pipe for use in cross-country pipelines is manufactured to meet API standards for given applications. These standards specify the physical and chemical properties of both the starting-point metal and the finished pipe. Steel pipe is fabricated with various wall thicknesses and with outside diameters ranging from 4.5 to 48 inches.
A detailed description of the complex process of planning and building an oil or gas pipeline is beyond the scope of the present text. That process includes resolution of numerous financial, legal, environmental, and regulatory issues, as well as the technical challenges of excavation and pipe installation. For the purposes of this book, suffice it to say
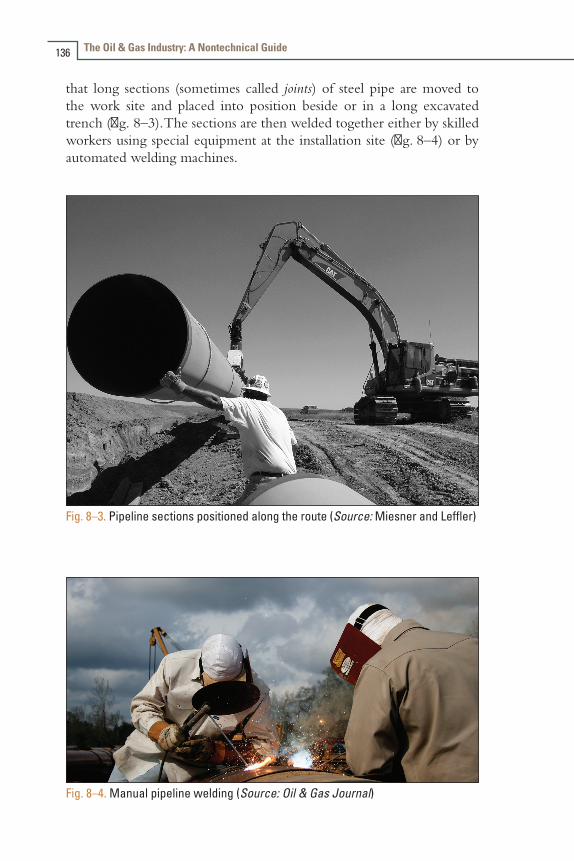
The Oil & Gas Industry: A Nontechnical Guide136
that long sections (sometimes called joints) of steel pipe are moved to the work site and placed into position beside or in a long excavated trench (fig. 8–3). The sections are then welded together either by skilled workers using special equipment at the installation site (fig. 8–4) or by automated welding machines.
Fig. 8–3. Pipeline sections positioned along the route (Source: Miesner and Leffler)
Fig. 8–4. Manual pipeline welding (Source: Oil & Gas Journal)
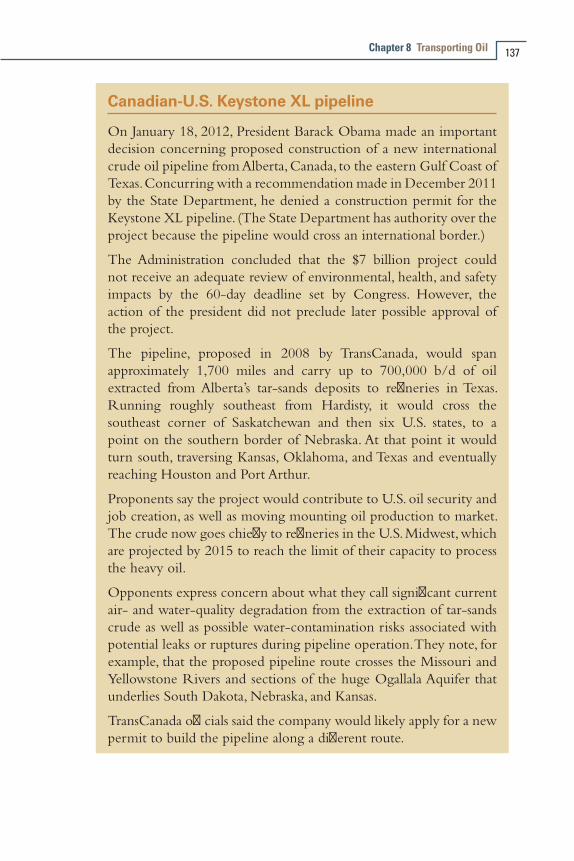
Chapter 8 Transporting Oil 137
Canadian-U.S. Keystone XL pipeline
On January 18, 2012, President Barack Obama made an important decision concerning proposed construction of a new international crude oil pipeline from Alberta, Canada, to the eastern Gulf Coast of Texas. Concurring with a recommendation made in December 2011 by the State Department, he denied a construction permit for the Keystone XL pipeline. (The State Department has authority over the project because the pipeline would cross an international border.)
The Administration concluded that the $7 billion project could not receive an adequate review of environmental, health, and safety impacts by the 60-day deadline set by Congress. However, the action of the president did not preclude later possible approval of the project.
The pipeline, proposed in 2008 by TransCanada, would span approximately 1,700 miles and carry up to 700,000 b/d of oil extracted from Alberta’s tar-sands deposits to refineries in Texas. Running roughly southeast from Hardisty, it would cross the southeast corner of Saskatchewan and then six U.S. states, to a point on the southern border of Nebraska. At that point it would turn south, traversing Kansas, Oklahoma, and Texas and eventually reaching Houston and Port Arthur.
Proponents say the project would contribute to U.S. oil security and job creation, as well as moving mounting oil production to market. The crude now goes chiefly to refineries in the U.S. Midwest, which are projected by 2015 to reach the limit of their capacity to process the heavy oil.
Opponents express concern about what they call significant current air- and water-quality degradation from the extraction of tar-sands crude as well as possible water-contamination risks associated with potential leaks or ruptures during pipeline operation. They note, for example, that the proposed pipeline route crosses the Missouri and Yellowstone Rivers and sections of the huge Ogallala Aquifer that underlies South Dakota, Nebraska, and Kansas.
TransCanada officials said the company would likely apply for a new permit to build the pipeline along a different route.
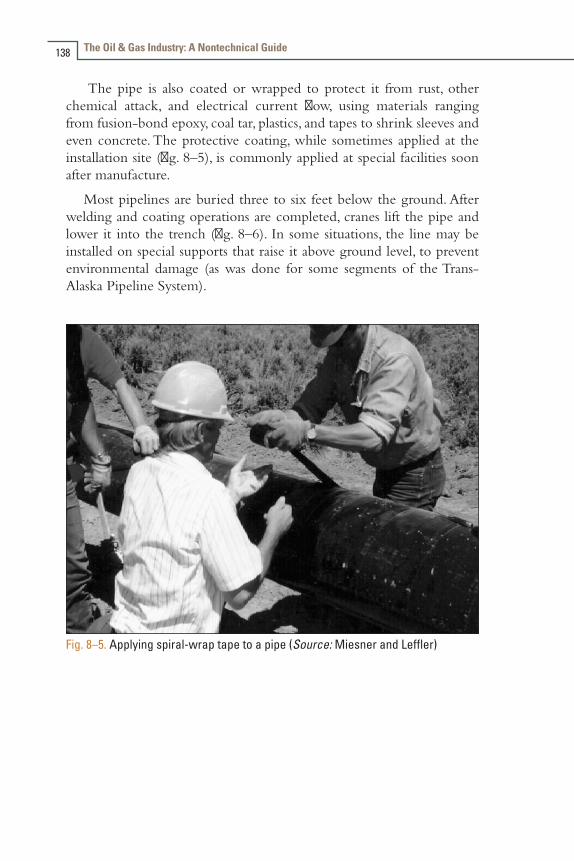
The Oil & Gas Industry: A Nontechnical Guide138
The pipe is also coated or wrapped to protect it from rust, other chemical attack, and electrical current flow, using materials ranging from fusion-bond epoxy, coal tar, plastics, and tapes to shrink sleeves and even concrete. The protective coating, while sometimes applied at the installation site (fig. 8–5), is commonly applied at special facilities soon after manufacture.
Most pipelines are buried three to six feet below the ground. After welding and coating operations are completed, cranes lift the pipe and lower it into the trench (fig. 8–6). In some situations, the line may be installed on special supports that raise it above ground level, to prevent environmental damage (as was done for some segments of the Trans-Alaska Pipeline System).
Fig. 8–5. Applying spiral-wrap tape to a pipe (Source: Miesner and Leffler)

Chapter 8 Transporting Oil 139
Fig. 8–6. Lowering the pipeline into position (Source: Miesner and Leffler)
Other componentsA variety of components work together to keep a pipeline operating
efficiently and safely. These include:•Valves (and their actuators) that control or cut off oil flow
in response to operational changes, maintenance needs, or emergencies
•Pumps of various designs and capacities that maintain pressure levels to keep the oil flowing (analogous to a compressor in a natural gas pipeline)
•Electric motors, engines, and turbines (running on liquid fuels or natural gas) that provide the power needed to run pumps (fig. 8–7)
•Meters that accurately measure the amount of oil being moved or delivered
•Other instruments, sensors, and computer-linked components that provide real-time information about the condition of all sections of a pipeline
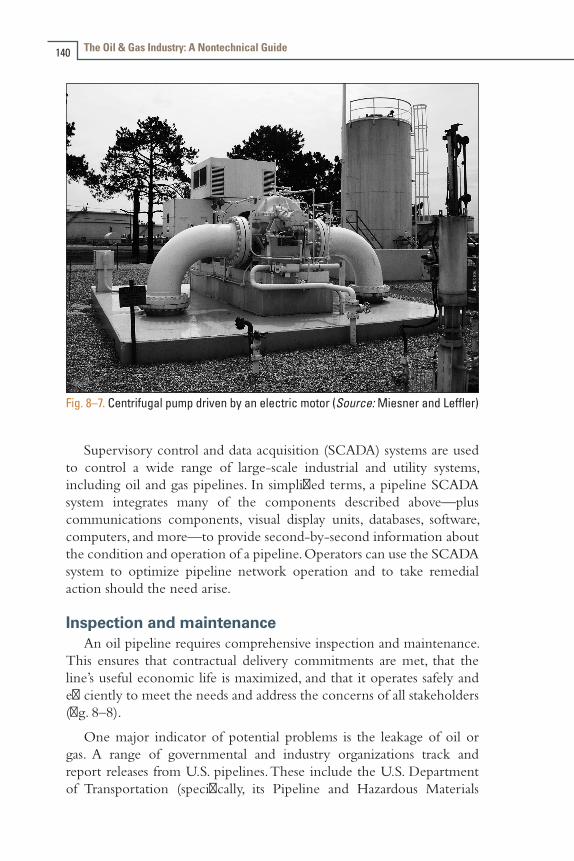
The Oil & Gas Industry: A Nontechnical Guide140
Fig. 8–7. Centrifugal pump driven by an electric motor (Source: Miesner and Leffler)
Supervisory control and data acquisition (SCADA) systems are used to control a wide range of large-scale industrial and utility systems, including oil and gas pipelines. In simplified terms, a pipeline SCADA system integrates many of the components described above—plus communications components, visual display units, databases, software, computers, and more—to provide second-by-second information about the condition and operation of a pipeline. Operators can use the SCADA system to optimize pipeline network operation and to take remedial action should the need arise.
Inspection and maintenanceAn oil pipeline requires comprehensive inspection and maintenance.
This ensures that contractual delivery commitments are met, that the line’s useful economic life is maximized, and that it operates safely and efficiently to meet the needs and address the concerns of all stakeholders (fig. 8–8).
One major indicator of potential problems is the leakage of oil or gas. A range of governmental and industry organizations track and report releases from U.S. pipelines. These include the U.S. Department of Transportation (specifically, its Pipeline and Hazardous Materials
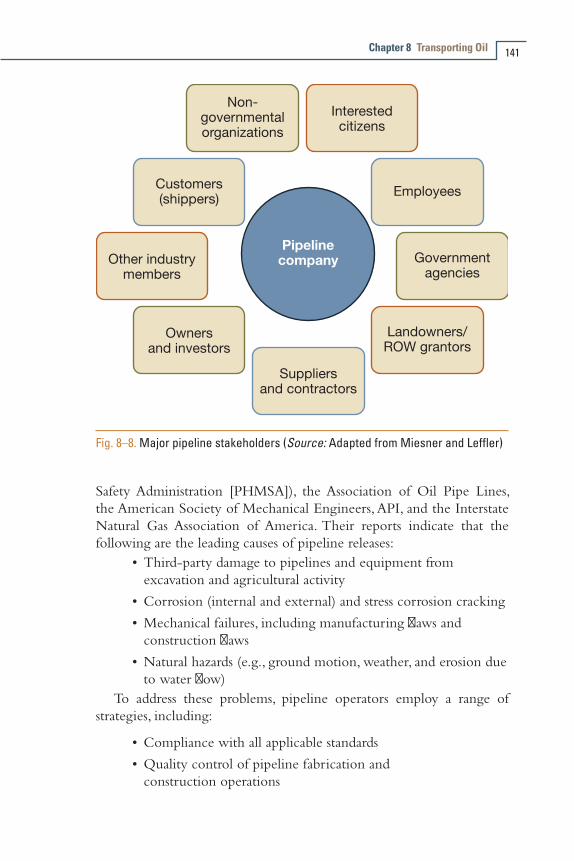
Chapter 8 Transporting Oil 141
Safety Administration [PHMSA]), the Association of Oil Pipe Lines, the American Society of Mechanical Engineers, API, and the Interstate Natural Gas Association of America. Their reports indicate that the following are the leading causes of pipeline releases:
•Third-party damage to pipelines and equipment from excavation and agricultural activity
•Corrosion (internal and external) and stress corrosion cracking
•Mechanical failures, including manufacturing flaws and construction flaws
•Natural hazards (e.g., ground motion, weather, and erosion due to water flow)
To address these problems, pipeline operators employ a range of strategies, including:
•Compliance with all applicable standards
•Quality control of pipeline fabrication and construction operations
Fig. 8–8. Major pipeline stakeholders (Source: Adapted from Miesner and Leffler)

The Oil & Gas Industry: A Nontechnical Guide142
•Careful mapping of pipeline location
•Public education about pipeline routes and operation
•Use of telephone call centers to aid excavators
•Monitoring or patrolling the pipeline route for signs of intrusion or leakage
• Installation of corrosion control systems (e.g., cathodic protection)
The methods and equipment used to find potential problems before they create failures warrant elaboration. Chief among these are sophisticated internal line inspection (ILI) devices, called smart pigs, that travel through a pipeline looking for metal loss, wall deformation, and cracks (fig. 8–9). Smart pigs employ advanced technologies, such as ultrasound and magnetic-field measurement, to accomplish their mission.
Another approach is the electrical survey, based on the principle that corrosion is associated with the movement of electrons (a flow of electrical current). Technicians measure the difference in voltage between the pipe and the adjacent soil or the magnitude of current flow between two points on the pipeline.
A third technique, called direct assessment (DA), is used in places where ILI tools cannot be employed. DA uses statistical analysis to identify the most likely problem locations along a pipeline. At those points, workers then excavate and examine the condition of the pipe and coating, including measurement of pipe wall thickness.
A final important element is the formal assessment of risk by pipeline operators. In simple terms, risk is calculated by multiplying the probability that an event will happen by the quantitative estimation of the negative consequences that would result from that event. For example, the probability of a major oil pipeline rupture might be very small, say 0.5%. However, if a pipeline were to rupture in a highly populated area, the consequences could include millions of dollars in property damage and business disruption, as well as loss of lives.
An increasing number of U.S. pipeline operators integrate their risk assessments with the kinds of programs described above to create a pipeline integrity management plan (IMP). The PHMSA and industry groups have defined what constitutes an acceptable IMP, and a range of vendors offer tools and software that can help pipeline companies create such a plan.

Chapter 8 Transporting Oil 143
Fig. 8–9. Smart pig for pipeline inspection, capable of detecting both metal loss and mechanical damage (Source: Miesner and Leffler)
Pipeline operators also plan and execute a range of programs for the repair and maintenance of pipelines. These include:
•Repair of a pipe’s outer surface or coating
•Pipe replacement or reinforcement
•Reduction of stress-concentration points on a pipe
•Burial of a pipeline more deeply for added protection
•Maintenance of cathodic protection systems
•Clearing of pipeline right-of-way (to keep signs and markers visible and to make it easier to see evidence of small leaks or third-party intrusions).
The Oil & Gas Industry: A Nontechnical Guide144
Pigs that are not as “smart” as those described above—but still quite capable—are also used for internal pipeline maintenance. They are run through the line periodically, to keep it free of paraffin, water, sediment, and other debris. This improves product flow and reduces the likelihood of internal corrosion.
Offshore PipelinesSpecial technology and techniques are needed to bring crude oil to
refineries and other onshore facilities from offshore fields. The challenge is particularly daunting when the production wells are in deep water, typically defined as more than 1,000 feet below the ocean surface.
The Deepwater Horizon platform (owned by Transocean and leased to BP), which suffered a catastrophic blowout in April 2010, was connected to wells about 5,000 feet below the surface of the Gulf of Mexico, about 250 miles southeast of Houston. Shell’s Perdido platform began producing oil and gas in March 2010 from a network of 35 wells at a water depth of about 8,000 feet.
No attempt is made here to describe in detail the complex equipment and advanced skills needed to install a subsea pipeline and its associated components. However, the following sections offer a brief summary.
From wellhead to platformSeveral types of pipe and related equipment work together to gather
oil or gas from subsea wellheads and bring it to the production platform above (fig. 8–10). These components must be strong enough to handle both the crushing pressure encountered at the seafloor—about 2,700 psi at a depth of 6,000 feet—as well as the internal pressure needed to lift oil to sea level. Piping is commonly made of steel, with wall thicknesses ranging from 0.75 to 2 inches.
Two types of piping are connected to the wellhead. A jumper—steel or flexible composite pipe typically 6–12 inches in diameter—carries hydrocarbons to a manifold (see below) if the distance is about 100 feet or less. For longer distances (up to tens of miles), the connecting pipe is called a flowline.
The manifold is a larger-diameter section of steel pipe to which jumpers from several wellheads can be connected. It has just a single outlet, to which a flowpipe is connected.
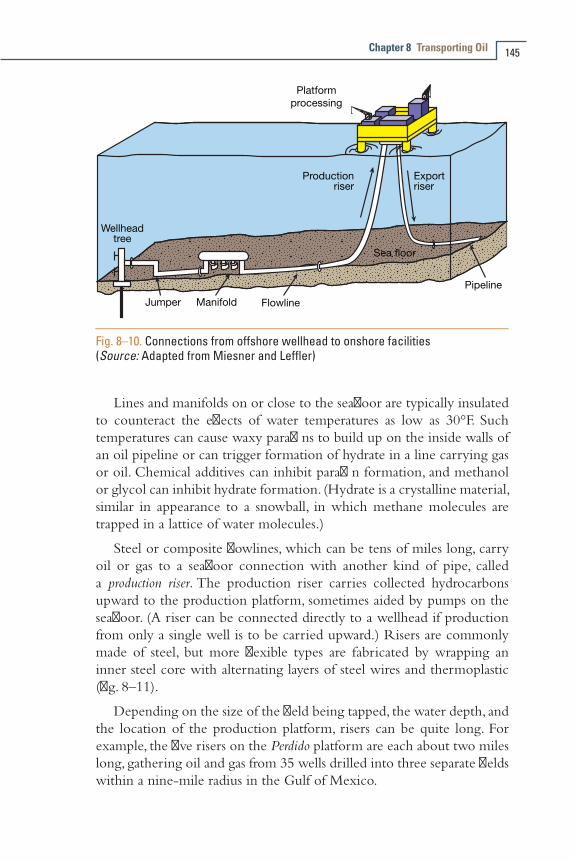
Chapter 8 Transporting Oil 145
Fig. 8–10. Connections from offshore wellhead to onshore facilities (Source: Adapted from Miesner and Leffler)
Lines and manifolds on or close to the seafloor are typically insulated to counteract the effects of water temperatures as low as 30°F. Such temperatures can cause waxy paraffins to build up on the inside walls of an oil pipeline or can trigger formation of hydrate in a line carrying gas or oil. Chemical additives can inhibit paraffin formation, and methanol or glycol can inhibit hydrate formation. (Hydrate is a crystalline material, similar in appearance to a snowball, in which methane molecules are trapped in a lattice of water molecules.)
Steel or composite flowlines, which can be tens of miles long, carry oil or gas to a seafloor connection with another kind of pipe, called a production riser. The production riser carries collected hydrocarbons upward to the production platform, sometimes aided by pumps on the seafloor. (A riser can be connected directly to a wellhead if production from only a single well is to be carried upward.) Risers are commonly made of steel, but more flexible types are fabricated by wrapping an inner steel core with alternating layers of steel wires and thermoplastic (fig. 8–11).
Depending on the size of the field being tapped, the water depth, and the location of the production platform, risers can be quite long. For example, the five risers on the Perdido platform are each about two miles long, gathering oil and gas from 35 wells drilled into three separate fields within a nine-mile radius in the Gulf of Mexico.

The Oil & Gas Industry: A Nontechnical Guide146
Steel carcass
Thermoplastic inner tube
Pressure steel reinforcement
Thermoplastic sheath
Thermoplastic sheath
Thermoplasticexternal uid barrier
Tensile steel layer
Tensile steel layer
Fig. 8-11. Construction of flexible pipe (Source: Miesner and Leffler)
From platform to shoreAfter crude oil undergoes initial cleanup aboard the production
platform, it is either off-loaded to a shuttle tanker for the trip to shore or pumped down through another riser (called an export riser) to enter a subsea pipeline. This section focuses on the transport of oil by subsea pipeline.
Laying miles of pipe in water hundreds or thousands of feet deep poses significant technical challenges. The first step is to carefully plan the line’s subsea path, evaluating the sea-bottom terrain. The goal is to identify the most cost-effective route that will permit efficient pipeline operation while also minimizing mechanical stress on the installed pipe, as well as any ecological damage.
Once the route is set, pipeline assembly begins. One common method is to weld together and coat pipe sections—typically 40–240 feet long and 16–42 inches in diameter, with walls at least 1 inch thick—at a shore-based facility. Long sections of pipe are then fitted with flotation devices, towed to the installation site, and lowered to the seafloor (fig. 8–12).
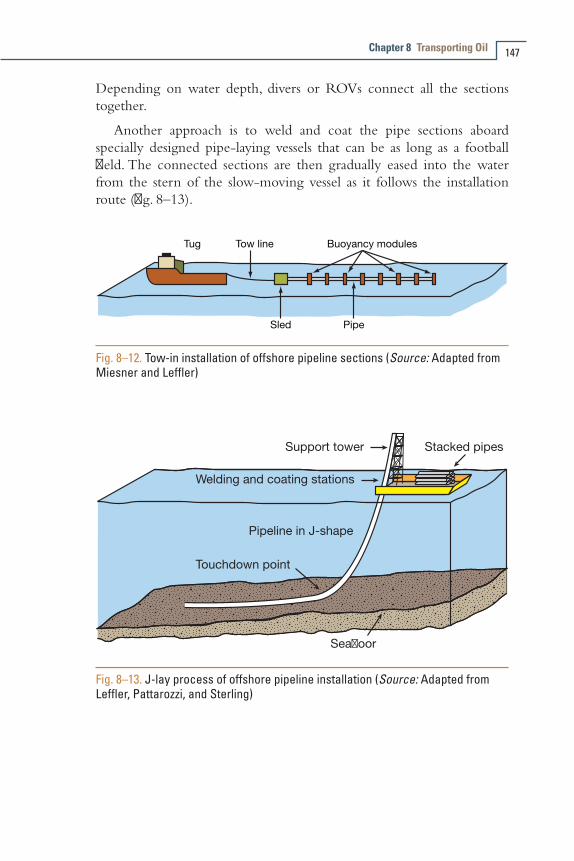
Chapter 8 Transporting Oil 147
Depending on water depth, divers or ROVs connect all the sections together.
Another approach is to weld and coat the pipe sections aboard specially designed pipe-laying vessels that can be as long as a football field. The connected sections are then gradually eased into the water from the stern of the slow-moving vessel as it follows the installation route (fig. 8–13).
Fig. 8–12. Tow-in installation of offshore pipeline sections (Source: Adapted from Miesner and Leffler)
Welding and coating stations
Support tower Stacked pipes
Sea�oor
Pipeline in J-shape
Touchdown point
Fig. 8–13. J-lay process of offshore pipeline installation (Source: Adapted from Leffler, Pattarozzi, and Sterling)
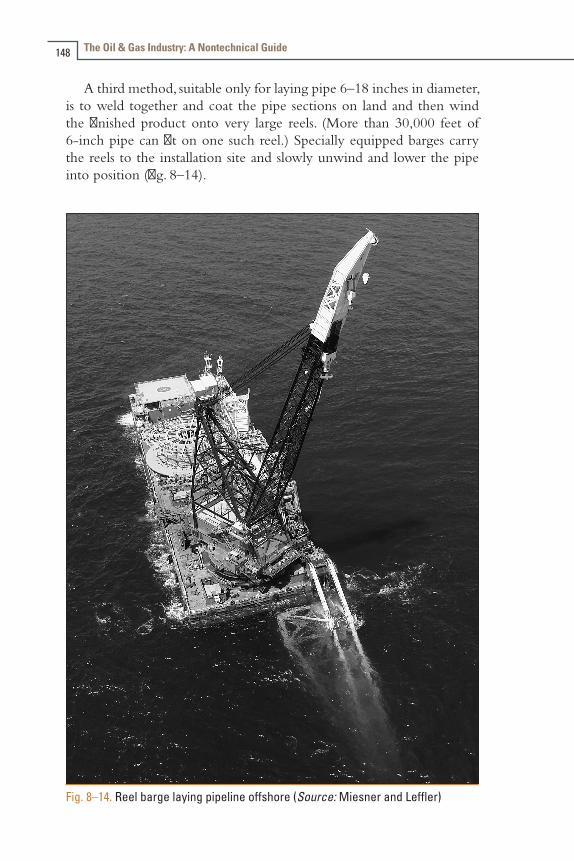
The Oil & Gas Industry: A Nontechnical Guide148
A third method, suitable only for laying pipe 6–18 inches in diameter, is to weld together and coat the pipe sections on land and then wind the finished product onto very large reels. (More than 30,000 feet of 6-inch pipe can fit on one such reel.) Specially equipped barges carry the reels to the installation site and slowly unwind and lower the pipe into position (fig. 8–14).
Fig. 8–14. Reel barge laying pipeline offshore (Source: Miesner and Leffler)

Chapter 8 Transporting Oil 149
Subsea pipelines can be quite extensive. For example, the Cameron Highway Oil Pipeline System is a 380-mile, 24- and 30-inch oil pipeline that extends along the Outer Continental Shelf of the Gulf of Mexico. It has the capacity to deliver more than 600,000 b/d of oil from several major deepwater fields to the Texas coast, connecting directly with three refineries and four terminals.
Oil Tanker ShipsCrude oil is also transported around the world on seagoing tanker
ships (fig. 8–15)—a mode of delivery that is second only to a pipeline in cost-effectiveness. The International Maritime Organization reported a total of 2,105 crude oil tankers in the global fleet in 2008.1
These vessels moved about 1.72 billion tons of oil (13.8 billion barrels) to global markets in 2009, according to the U.N. Conference on Trade and Development.2 This shipment volume was down about 3.4% from 2008 because of the global recession that began in 2008, reducing global oil demand.
Fig. 8–15. Supertanker AbQaiq. The vessel is en route to port, to take on an estimated two million barrels of crude oil produced in Iraq. (Source: U.S. Navy photograph [2003])

The Oil & Gas Industry: A Nontechnical Guide150
Some 4,954 oil product tankers are operated separately, carrying refined products from refineries to markets and terminals around the world in 2008. More information about transport of oil products is presented, along with a discussion of refining, in chapter 11.
The first commercially successful crude oil tankers were developed in the 1870s and 1880s, but World War I was the real impetus for development of the kinds of vessels now used around the world. Decades later, during World War II, the most popular tanker design was the T2. Just over 500 feet long, it carried about 16,500 tons of oil.
Crude oil tankers are typically classified by deadweight metric tonnage (DWT)—the displacement of a fully loaded vessel minus its weight when completely empty (with no cargo, fuel, ballast, crew, passengers, water, or provisions). A vessel’s cargo-carrying capacity is about 95% of its DWT. One DWT of capacity is equivalent to about 7.5 barrels of oil (though different grades of crude have different densities).
Until 1956, tankers had to be small enough to navigate the Suez Canal. However, when Egypt closed the canal in July of that year, shipowners realized that much larger vessels—able to travel around the Cape of Good Hope, instead of through the canal—could also offer significant transport efficiencies.
The first tanker with a capacity of more than 100,000 DWT was built in 1958. Since then, significant advances have been made in technology and design, as well as size.
The largest tanker ever built was the Seawise Giant, fabricated in 1979, with a capacity of 564,763 DWT. Just over 1,500 feet long, with 46 tanks and almost 340,000 square feet of deck area, the ship was said to be too large to pass through the English Channel. The ship had several owners and name changes before being scrapped in 2009.
Crude tankers in use today are required to have double steel hulls so that if the outside hull is damaged, oil will still be contained within the internal hull. Some vessels also have double bottoms for the same reason. Since 2010, no single-hull tanker vessel of 5,000 DWT or larger has been allowed to operate in U.S. waters unless it has a double bottom or double sides, under the terms of the federal Oil Pollution Act of 1990. The act was passed following the March 1989 oil spill from the Exxon Valdez tanker in Alaska. The International Maritime Organization, part of the United Nations, enacted a similar double-hull restriction, effective January 1, 2011.

Chapter 8 Transporting Oil 151
Today’s crude oil tankers are also identified by shorthand names related to their size (table 8–3). The term supertanker is used for very large crude carriers (VLCCs) and ultralarge crude carriers (ULCCs), which can carry a cargo of more than 2 million barrels.
Table 8–3: Common oceangoing crude oil tanker typesDesignation DWT Comments
Super Handymax 50,000Ultra Handymax 55,000Panamax 60,000–80,000 Largest tanker able to pass through
the locks of the Panama CanalAframax 80,000–120,000Suezmax 120,000–180,000 Largest tanker able to pass through
the Suez Canal (which has no locks)VLCC 200,000–320,000ULCC 320,000–560,000Source: Downey
As of 2010, the four largest supertankers in the world were designated as the TI class. Called the TI Asia, TI Africa, TI Europe, and TI Oceania, the four sister ships were built in 2002–2003 in South Korea, each of approximately 441,500 DWT. Their owners converted the first two to service as stationary FSOs for service in 2009 offshore Qatar.
Crude oil tankers of small or moderate size can dock at a pier designed to pump the oil into or out of the vessel. However, supertankers are typically so large that they cannot do so. Instead, they must take on and off-load their cargoes at offshore facilities or even transfer their cargoes at their port of destination to smaller tankers or barges.
Barges are also used to move oil between onshore storage terminals. In 2010, some 92 million barrels of crude were transported by barge in the United States, according to EIA.
Railcars and Tank TrucksTwo final oil transportation modes worth mention are the tank
truck and the railcar. EIA reported that crude shipments from domestic producers to U.S. refineries by tanker truck totaled approximately 145 million barrels in 2010. For railcars, the corresponding figure was roughly 9 million barrels.
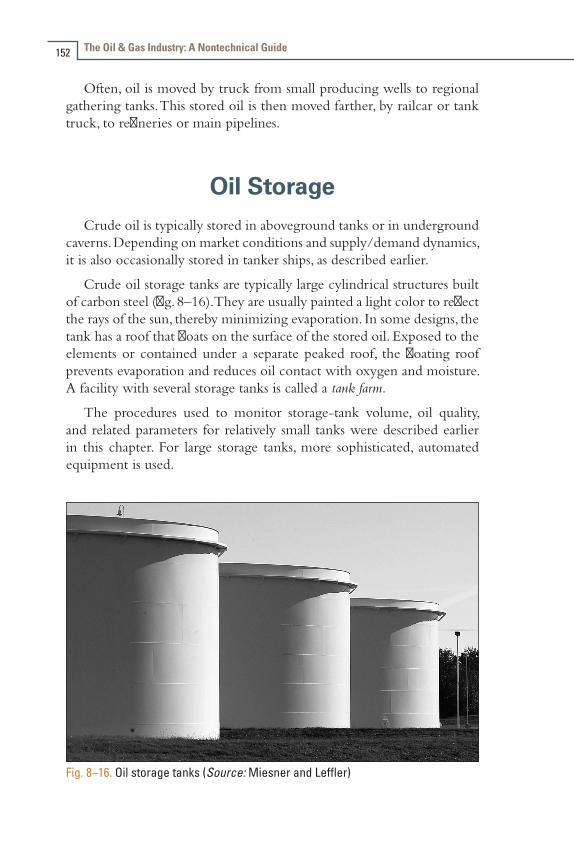
The Oil & Gas Industry: A Nontechnical Guide152
Often, oil is moved by truck from small producing wells to regional gathering tanks. This stored oil is then moved farther, by railcar or tank truck, to refineries or main pipelines.
Oil StorageCrude oil is typically stored in aboveground tanks or in underground
caverns. Depending on market conditions and supply/demand dynamics, it is also occasionally stored in tanker ships, as described earlier.
Crude oil storage tanks are typically large cylindrical structures built of carbon steel (fig. 8–16). They are usually painted a light color to reflect the rays of the sun, thereby minimizing evaporation. In some designs, the tank has a roof that floats on the surface of the stored oil. Exposed to the elements or contained under a separate peaked roof, the floating roof prevents evaporation and reduces oil contact with oxygen and moisture. A facility with several storage tanks is called a tank farm.
The procedures used to monitor storage-tank volume, oil quality, and related parameters for relatively small tanks were described earlier in this chapter. For large storage tanks, more sophisticated, automated equipment is used.
Fig. 8–16. Oil storage tanks (Source: Miesner and Leffler)
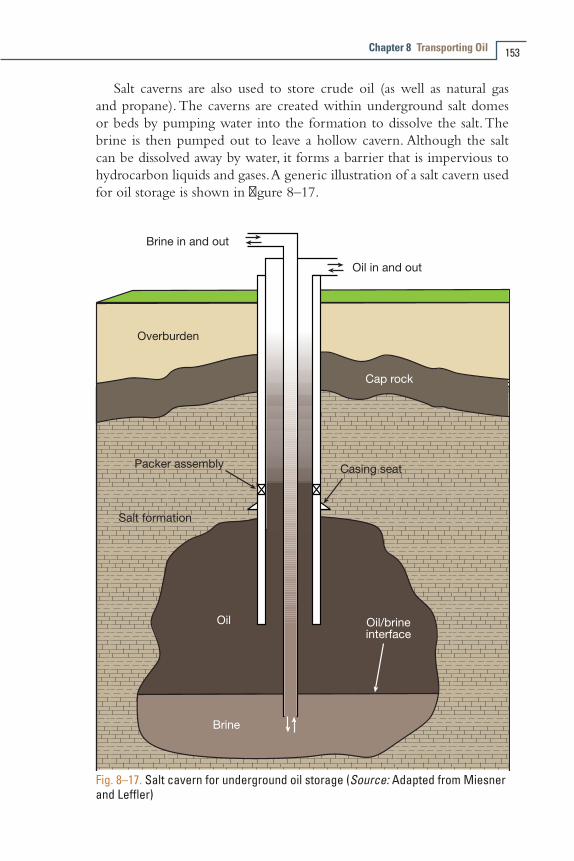
Chapter 8 Transporting Oil 153
Salt caverns are also used to store crude oil (as well as natural gas and propane). The caverns are created within underground salt domes or beds by pumping water into the formation to dissolve the salt. The brine is then pumped out to leave a hollow cavern. Although the salt can be dissolved away by water, it forms a barrier that is impervious to hydrocarbon liquids and gases. A generic illustration of a salt cavern used for oil storage is shown in figure 8–17.
Fig. 8–17. Salt cavern for underground oil storage (Source: Adapted from Miesner and Leffler)
The Oil & Gas Industry: A Nontechnical Guide154
A notable example of salt-cavern storage of oil is the U.S. Strategic Petroleum Reserve (SPR). The U.S. and other SPRs are described in detail in the next section.
SPRsIEA was formed in 1974, in reaction to the embargo imposed on
Western nations in 1973 by Arab oil producers. The aim of IEA is to coordinate the response of developed nations to restrictions in oil supply and to gather and disseminate information about global energy markets. One early recommendation of the IEA was that countries with significant levels of oil consumption create stockpiles of oil to mitigate the impact of supply disruptions. In response, the U.S. federal government began construction of its SPR in 1975 and completed it in 1984.
The U.S. SPR consists of four sites, on the Gulf Coast, whose exact locations are not disclosed for security reasons. A total of 60 salt caverns (each typically 2,000 feet high and 200 feet in diameter) have been created at those four sites, capable of holding a combined total of about 725 million barrels of crude oil (sufficient to meet U.S. demand for about two months).
The salt at the bottom of a cavern is about three degrees warmer than at the top, and this differential creates a natural convective flow that keeps the oil slowly circulating. Oil is removed by pumping water into the bottom of the cavern. Oil floats on water, rising to the top of the cavern to be drawn off. It is estimated that it would take 100 days to completely withdraw all of the oil from the U.S. SPR.
Crude has been withdrawn several times from the U.S. SPR:• In 1985, as part of a test sale
• In 1991, early in the first Persian Gulf War
• In the mid-1990s, to help reduce the budget deficit
• In 2000, during a heating-oil shortage
• In 2005, following Hurricane Katrina
• In mid-2011 (in concert with similar action by the other 27 member nations of the IEA), in response to reduced oil output created by unrest in the Middle East in general and Libya in particular

Chapter 8 Transporting Oil 155
A number of other nations also have (or are developing) significant strategic crude oil stockpiles. According to EIA, approximately 4.1 billion barrels of oil are held in strategic reserves around the world (including in the United States). Of this total, some 1.4 billion is government controlled, with the remainder held by private industry.
China completed the first phase of construction of a government-controlled SPR in 2008 and expects to have about 500 million barrels of oil in the system by 2016. Japan has about 324 million barrels in such reserves, and India is building a reserve of about 37 million barrels.
Outside the United States, oil is also stored in rock formations. Caverns in the rock must be mined using heavy equipment. Such caverns can be less expensive than aboveground tank storage but are more costly to build than salt-dome caverns.
References 1 International Maritime Organization Maritime Knowledge Centre.
October 2009. International Shipping and World Trade Facts and Figures. London. IMO is a specialty agency of the United Nations.
2 U.N. Conference on Trade and Development. 2010. Review of Maritime Transport 2010. Geneva, Switzerland. Published annually by the United Nations Conference on Trade and Development.


Transporting Natural Gas by Pipeline
This chapter and the next focus on the movement of natural gas from the wellhead to the marketplace. After a brief overview of gas transportation, subsequent sections of this chapter “follow the flow” to describe in more detail large-diameter gas transmission pipelines, the role of gas storage, small-diameter local distribution systems, and actions taken to ensure pipeline integrity. While this chapter focuses on pipeline transport, chapter 10 gives specific attention to the transformation of gas to liquid form (liquefied natural gas, LNG) for maritime shipment between countries.
Overview of Gas TransportationA first look at the transportation of natural gas can be confusing
because of the large number of stakeholders involved (fig. 9–1). To simplify the situation, look first at the path taken by natural gas as it moves from the point of production at a wellhead to its entry point into a pipeline (fig. 9–2).
Fig. 9–1. The natural gas value chain (Source: Adapted from Miesner and Leffler)
9

The Oil & Gas Industry: A Nontechnical Guide158
Fig. 9–2. Gas flow from wellhead to transmission pipeline
Natural gas produced from an underground formation first moves through flowlines to one or more separation units, to remove unwanted constituents including water, solids (e.g., sand), and crude oil. The raw gas typically will still contain some water vapor, as well as minor amounts of natural gas liquids (NGLs)—ethane, propane, butanes and pentane. Some nonhydrocarbon gases also may be present, including carbon dioxide, helium, hydrogen sulfide, and nitrogen. The raw gas then flows into a gathering system, which is a network of pipes that carry the gas from the separators to a gas plant, where production volumes can be consolidated for more economical subsequent processing.
At the gas plant, the raw gas is primarily upgraded to meet pipeline quality standards for specific gravity, heating value, and water content (fig. 9–3). At many gas plants, NGLs also are removed, for two reasons: first, they have economic value; second, if left in the gas stream, they can (a) affect the Btu content of the natural gas and (b) condense into liquid form within the pipe and impede gas flow. Even gas produced by heating LNG (the subject of more detailed discussion in chap. 10) is often processed to remove NGLs. More details about gas processing were presented earlier (see chap. 7).
After gas processing, the natural gas is introduced to a large-diameter transmission pipeline to start its journey to market. Compressors are used to push the gas into the pipeline at the entry point, as well as to maintain sufficient pressure along the pipeline route. In 2011, just over 300,000 miles of transmission lines were operating in the United States, according to EIA, carrying gas for hundreds or thousands of miles on intrastate and interstate routes.
The gas flows to local distribution companies (LDCs, also called gas utilities) that take control of the gas at critical facilities called city gate stations. Using equipment at or close to these stations, the LDCs add an odorant (to aid in leak detection), adjust gas pressure, and then introduce the gas into their distribution networks (fig. 9–4).

Fig. 9–3. Karsto natural gas processing plant, west coast of Norway (Source: Oil & Gas Journal)
Fig. 9–4. Gas flow from LDCs and other entities to customers

The Oil & Gas Industry: A Nontechnical Guide160
As described in detail starting on page 173, supply mains carry gas to areas where large groups of customers (or large single customers, e.g., factories) are located. At those points, the gas flows into pipes of somewhat smaller diameter, called feeder mains. Regulators at various points in the network control gas pressure to ensure reliable delivery at proper pressure levels.
On the last leg of the journey, the gas flows through lines of still smaller diameter, called service lines (or services). Meters measure the amount of gas used by individual customers.
Description of the processes of planning and building pipelines or distribution systems is beyond the scope of the present text. However, the following sections and chapters provide details on the operation of transmission and distribution pipeline systems.
Transmission SystemsMovement of natural gas by pipeline is a very efficient mode of energy
transportation that has been used around the world for many decades. Although this section focuses on the U.S. gas transmission system, it also includes some basic information about gas pipeline systems in other countries.
U.S. gas transmissionHigh-pressure transport of natural gas in the United States began in
1891, when Indiana Gas and Oil Company laid wrought iron pipe from an Indiana gas field to Chicago, about 120 miles away. Early in the 20th century, large amounts of natural gas were found in Texas, Oklahoma, and Louisiana, and several pipelines were built to carry it to local markets.
It was not until the 1920s, however, that long-distance pipeline transport of gas become economical, based on the development of several important technologies. These included a method for manufacturing seamless steel pipe, the introduction of oxyacetylene (and later, electric arc) welding to join steel pipe into long sections, and the development of instruments for measuring large volumes of gas.
Before 1925, the longest transmission pipelines were only about 300 miles long. However, by 1931, more than a dozen major lines were in service, carrying gas from fields in Texas and Louisiana to cities such as Denver; St. Louis; Kansas City, Missouri; and Chicago. After a pause in
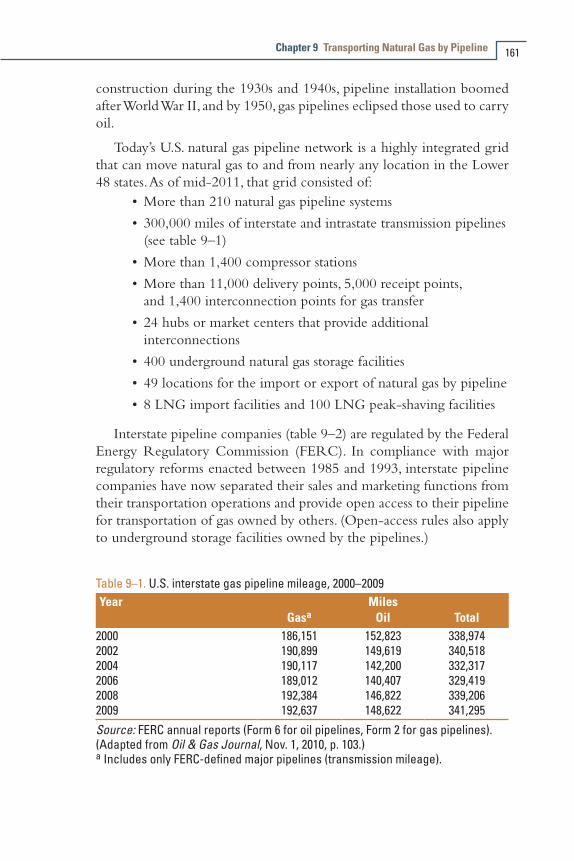
Chapter 9 Transporting Natural Gas by Pipeline 161
construction during the 1930s and 1940s, pipeline installation boomed after World War II, and by 1950, gas pipelines eclipsed those used to carry oil.
Today’s U.S. natural gas pipeline network is a highly integrated grid that can move natural gas to and from nearly any location in the Lower 48 states. As of mid-2011, that grid consisted of:
•More than 210 natural gas pipeline systems
• 300,000 miles of interstate and intrastate transmission pipelines (see table 9–1)
•More than 1,400 compressor stations
•More than 11,000 delivery points, 5,000 receipt points, and 1,400 interconnection points for gas transfer
• 24 hubs or market centers that provide additional interconnections
• 400 underground natural gas storage facilities
• 49 locations for the import or export of natural gas by pipeline
• 8 LNG import facilities and 100 LNG peak-shaving facilities
Interstate pipeline companies (table 9–2) are regulated by the Federal Energy Regulatory Commission (FERC). In compliance with major regulatory reforms enacted between 1985 and 1993, interstate pipeline companies have now separated their sales and marketing functions from their transportation operations and provide open access to their pipeline for transportation of gas owned by others. (Open-access rules also apply to underground storage facilities owned by the pipelines.)
Table 9–1. U.S. interstate gas pipeline mileage, 2000–2009Year Miles
Gasa Oil Total2000 186,151 152,823 338,9742002 190,899 149,619 340,5182004 190,117 142,200 332,3172006 189,012 140,407 329,4192008 192,384 146,822 339,2062009 192,637 148,622 341,295Source: FERC annual reports (Form 6 for oil pipelines, Form 2 for gas pipelines). (Adapted from Oil & Gas Journal, Nov. 1, 2010, p. 103.) a Includes only FERC-defined major pipelines (transmission mileage).
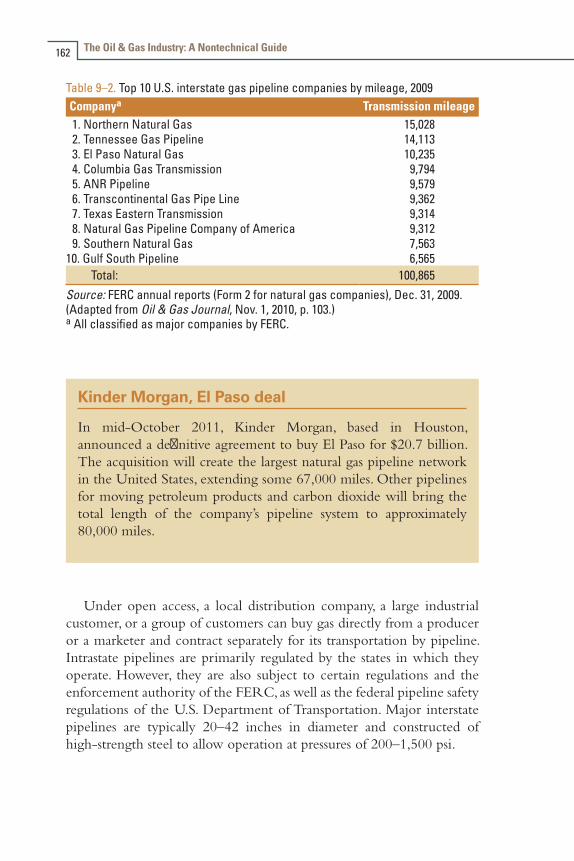
The Oil & Gas Industry: A Nontechnical Guide162
Table 9–2. Top 10 U.S. interstate gas pipeline companies by mileage, 2009 Companya Transmission mileage
1. Northern Natural Gas 15,028 2. Tennessee Gas Pipeline 14,113 3. El Paso Natural Gas 10,235 4. Columbia Gas Transmission 9,794 5. ANR Pipeline 9,579 6. Transcontinental Gas Pipe Line 9,362 7. Texas Eastern Transmission 9,314 8. Natural Gas Pipeline Company of America 9,312 9. Southern Natural Gas 7,56310. Gulf South Pipeline 6,565 Total: 100,865Source: FERC annual reports (Form 2 for natural gas companies), Dec. 31, 2009. (Adapted from Oil & Gas Journal, Nov. 1, 2010, p. 103.) a All classified as major companies by FERC.
Kinder Morgan, El Paso deal
In mid-October 2011, Kinder Morgan, based in Houston, announced a definitive agreement to buy El Paso for $20.7 billion. The acquisition will create the largest natural gas pipeline network in the United States, extending some 67,000 miles. Other pipelines for moving petroleum products and carbon dioxide will bring the total length of the company’s pipeline system to approximately 80,000 miles.
Under open access, a local distribution company, a large industrial customer, or a group of customers can buy gas directly from a producer or a marketer and contract separately for its transportation by pipeline. Intrastate pipelines are primarily regulated by the states in which they operate. However, they are also subject to certain regulations and the enforcement authority of the FERC, as well as the federal pipeline safety regulations of the U.S. Department of Transportation. Major interstate pipelines are typically 20–42 inches in diameter and constructed of high-strength steel to allow operation at pressures of 200–1,500 psi.

Chapter 9 Transporting Natural Gas by Pipeline 163
A transmission pipeline system is often referred to as a mainline or a trunk line if it covers a long distance, uses chiefly large-diameter pipe, and runs directly from a major gas supply source to a market area or an LDC, with few laterals or branches. In comparison, a grid-type transmission system is characterized by a large number of laterals from the main pipeline, creating a network of integrated points for gas delivery and receipt or pipeline interconnection.
When gas transmission piping is fabricated, an internal coating of fusion-bond epoxy may be applied to prevent internal corrosion during shipment and storage, to facilitate internal inspection prior to assembly for welding, and to improve flow efficiency because of the smooth surface created.
In general, by federal rule, a buried transmission line must have a minimum soil cover of 30 inches (in some cases, 36 inches). Also, the line must be installed with at least 12 inches of clearance from any other facilities.
In the United States, a comprehensive federal pipeline safety bill was approved by the Congress in mid-December 2011 and signed into law by President Obama on January 3, 2012. It not only reauthorizes the 2002 federal pipeline safety law but also raises integrity management requirements to new levels. The legislation was driven by several high-profile pipeline accidents in 2010, including a September 9 gas explosion in San Bruno, California (near San Francisco), that killed eight people and destroyed 37 homes.
Basic pipeline equipmentBuilding and operating a pipeline is a major financial investment,
so companies work hard to keep the gas flowing at maximum capacity as much as possible to recoup that investment. They use sophisticated, computer-based control systems to monitor pipeline operation and to schedule movement of gas into and out of storage as needed to minimize peaks and valleys in demand.
Gas enters the pipeline at a point known as an origination station. Here, multiple compressors are used to introduce gas from multiple gathering lines into a transmission line (fig. 9–5).
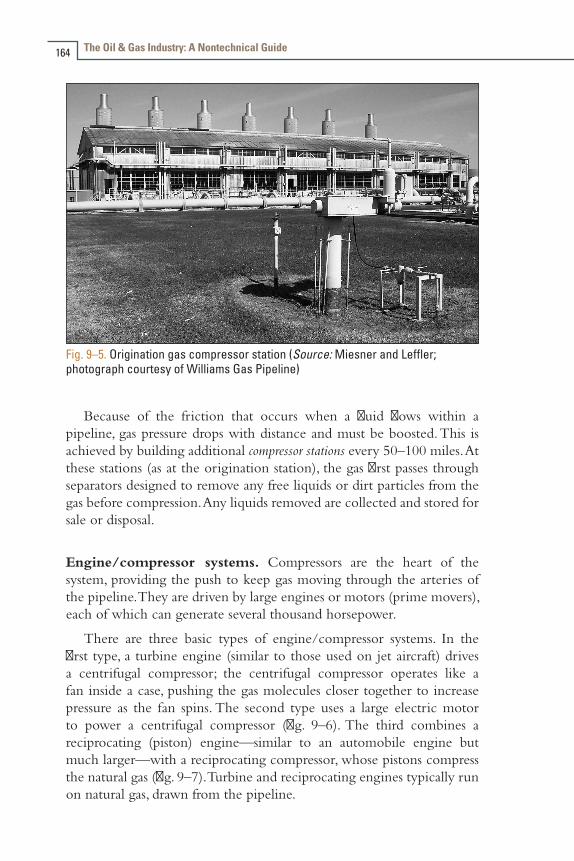
The Oil & Gas Industry: A Nontechnical Guide164
Fig. 9–5. Origination gas compressor station (Source: Miesner and Leffler; photograph courtesy of Williams Gas Pipeline)
Because of the friction that occurs when a fluid flows within a pipeline, gas pressure drops with distance and must be boosted. This is achieved by building additional compressor stations every 50–100 miles. At these stations (as at the origination station), the gas first passes through separators designed to remove any free liquids or dirt particles from the gas before compression. Any liquids removed are collected and stored for sale or disposal.
Engine/compressor systems. Compressors are the heart of the system, providing the push to keep gas moving through the arteries of the pipeline. They are driven by large engines or motors (prime movers), each of which can generate several thousand horsepower.
There are three basic types of engine/compressor systems. In the first type, a turbine engine (similar to those used on jet aircraft) drives a centrifugal compressor; the centrifugal compressor operates like a fan inside a case, pushing the gas molecules closer together to increase pressure as the fan spins. The second type uses a large electric motor to power a centrifugal compressor (fig. 9–6). The third combines a reciprocating (piston) engine—similar to an automobile engine but much larger—with a reciprocating compressor, whose pistons compress the natural gas (fig. 9–7). Turbine and reciprocating engines typically run on natural gas, drawn from the pipeline.
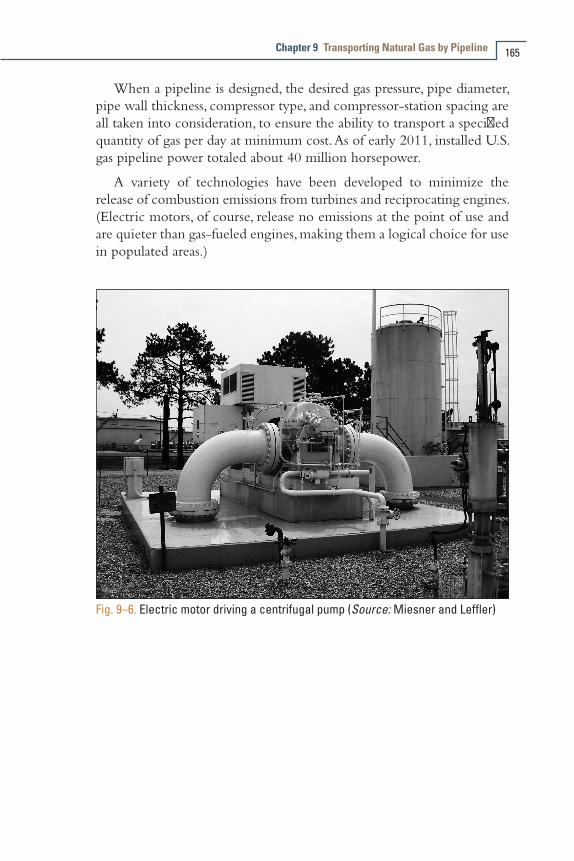
Chapter 9 Transporting Natural Gas by Pipeline 165
When a pipeline is designed, the desired gas pressure, pipe diameter, pipe wall thickness, compressor type, and compressor-station spacing are all taken into consideration, to ensure the ability to transport a specified quantity of gas per day at minimum cost. As of early 2011, installed U.S. gas pipeline power totaled about 40 million horsepower.
A variety of technologies have been developed to minimize the release of combustion emissions from turbines and reciprocating engines. (Electric motors, of course, release no emissions at the point of use and are quieter than gas-fueled engines, making them a logical choice for use in populated areas.)
Fig. 9–6. Electric motor driving a centrifugal pump (Source: Miesner and Leffler)
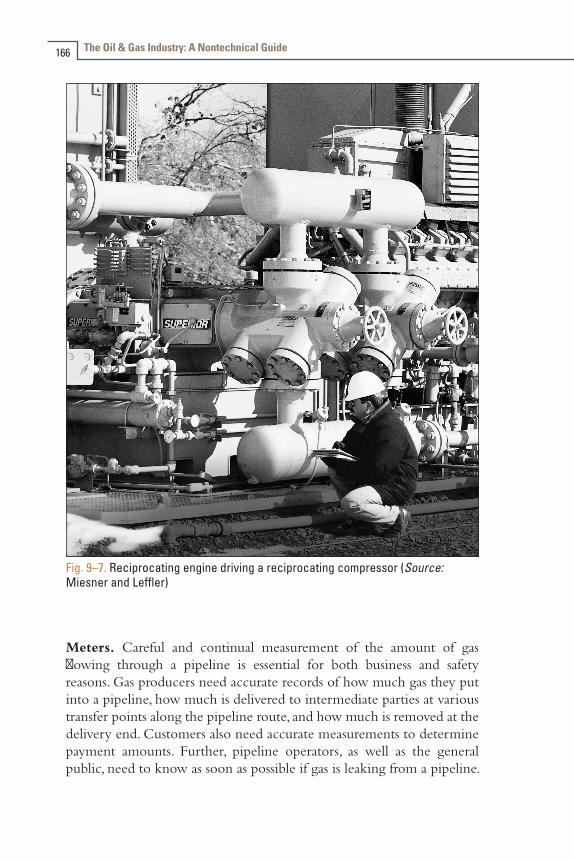
The Oil & Gas Industry: A Nontechnical Guide166
Fig. 9–7. Reciprocating engine driving a reciprocating compressor (Source: Miesner and Leffler)
Meters. Careful and continual measurement of the amount of gas flowing through a pipeline is essential for both business and safety reasons. Gas producers need accurate records of how much gas they put into a pipeline, how much is delivered to intermediate parties at various transfer points along the pipeline route, and how much is removed at the delivery end. Customers also need accurate measurements to determine payment amounts. Further, pipeline operators, as well as the general public, need to know as soon as possible if gas is leaking from a pipeline.

Chapter 9 Transporting Natural Gas by Pipeline 167
Measurement of gas volumes is achieved using a variety of sophisticated and carefully designed meter technologies. Meter types include:
•Positive displacement: Measuring flow in discrete segments, similar to people moving through a turnstile, and then adding up the segments
•Turbine: Measuring flow rate by monitoring the speed of rotation of a rotor suspended in the flow stream (fig. 9–8)
•Orifice: Forcing the gas to flow through a plate containing a carefully machined hole of known size and then using Bernoulli’s principle (relating mass flow, velocity, and pressure difference upstream and downstream from the orifice) to calculate flow rate
•Ultrasonic: Sending high-frequency pulses of sound energy across the pipe diameter, then using data on flow velocity, pipe cross-sectional area, and gas density to calculate flow rate
•Coriolis: Using the rather esoteric principle of the Coriolis force (based on angular momentum) to measure the deflection of a vibrating tube and, thereby, the mass of natural gas moving through the meter
Fig. 9–8. Turbine meter (Source: Miesner and Leffler)

The Oil & Gas Industry: A Nontechnical Guide168
Meters are subject to wear and deterioration with use. They must also be carefully calibrated on a regular basis to ensure accuracy and to enable the correction of raw measurements to standard pressure and temperature conditions.
Other components. Many other components are employed in pipeline systems. These include many kinds of specialized instrumentation, signal transmitters, sensors, valves, actuators, and computers as well as more mundane fittings, flanges, scrubbers, and strainers. All of these contribute to the efficient, safe, and reliable delivery of gas by pipeline. Detailed description of these components are beyond the scope of this book (See app. B for other reading suggestions.)
Gas storageStorage is an integral part of any system for delivery of large volumes
of natural gas. The primary reason is that demand for gas can vary—with the time of day, the season, and the operating schedules of large-volume customers, such as factories. In addition, natural gas production capacity can change over time, and storage can be used as a way to absorb increased volumes or as a gas source if production drops.
Pipeline companies use a system called operating storage to balance short-term swings in demand. This entails an operator’s moving gas into storage at night and extracting it early in the day, on a daily basis, year-round.
Gas can be stored in a variety of ways; the following are the most common:•Under pressure in depleted oil or natural gas reservoirs
• In aquifers (water-bearing sedimentary rock formations; see fig. 9–9)
• In underground salt caverns (as described in chap. 8)
In 2009, EIA reported that most (331 of 409) underground storage facilities in the United States were depleted reservoirs. Of the remainder, 43 were aquifers, and 35 were salt caverns.
During the past 20 years, the number of salt cavern storage sites has grown significantly for two reasons: first, the capability of such facilities to achieve rapid cycling (inventory turnover); second, their ability to respond to daily, even hourly, variations in customer demand.
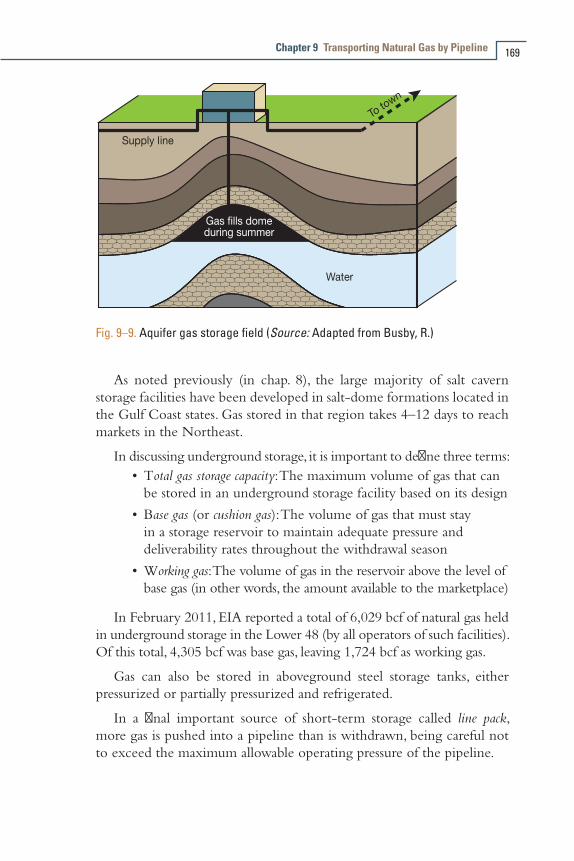
Chapter 9 Transporting Natural Gas by Pipeline 169
Fig. 9–9. Aquifer gas storage field (Source: Adapted from Busby, R.)
As noted previously (in chap. 8), the large majority of salt cavern storage facilities have been developed in salt-dome formations located in the Gulf Coast states. Gas stored in that region takes 4–12 days to reach markets in the Northeast.
In discussing underground storage, it is important to define three terms:•Total gas storage capacity: The maximum volume of gas that can
be stored in an underground storage facility based on its design
•Base gas (or cushion gas): The volume of gas that must stay in a storage reservoir to maintain adequate pressure and deliverability rates throughout the withdrawal season
•Working gas: The volume of gas in the reservoir above the level of base gas (in other words, the amount available to the marketplace)
In February 2011, EIA reported a total of 6,029 bcf of natural gas held in underground storage in the Lower 48 (by all operators of such facilities). Of this total, 4,305 bcf was base gas, leaving 1,724 bcf as working gas.
Gas can also be stored in aboveground steel storage tanks, either pressurized or partially pressurized and refrigerated.
In a final important source of short-term storage called line pack, more gas is pushed into a pipeline than is withdrawn, being careful not to exceed the maximum allowable operating pressure of the pipeline.

The Oil & Gas Industry: A Nontechnical Guide170
Storage can be owned by pipeline companies, LDCs, gas producers, dedicated gas storage companies, and even some gas trading companies.
Inspection and maintenanceMuch of the information presented in chapter 8 regarding
inspection and maintenance of oil pipelines applies as well to natural gas pipelines. The gas pipeline industry devotes considerable effort to a range of actions designed to maintain pipeline integrity and ensure safe operation, including:
•Adherence to rigorous quality and physical-property standards in the manufacture, handling, and assembly of piping
•Careful route selection and installation of pipeline sections to minimize possible damage from flooding, soil movement, or other natural hazards
•Application of coatings to protect external pipe walls from mechanical damage and corrosion
•Use of cathodic protection and related electrical-survey systems to control corrosion and thereby minimize metal loss from pipeline walls due to galvanic or microbial action
•Conduct of regular airborne and on-foot patrols of the pipeline right-of-way to detect any incursions, as well as signs of equipment damage or gas leakage
•Performance of hydrostatic tests on new pipeline sections (and, occasionally, on existing sections) to check for leaks by filling the line with water, raising the pressure to the expected operating level, and holding that pressure for a predetermined time while monitoring for leakage
•Education of the public and construction professionals (including use of maps, telephone call centers, and route markers) on the location and depth of pipelines
•Periodic cleaning of interior pipeline walls with pigs—pushed along by gas pressure—that remove water, sediment, paraffin, and other debris to help prevent corrosion and reduce resistance to gas flow
•Use of more-sophisticated smart pigs (ILI tools) that move through a pipeline to nondestructively examine the condition of the pipe wall and pinpoint any areas of concern (fig. 9–10)

Chapter 9 Transporting Natural Gas by Pipeline 171
•Occasional direct assessment (i.e., excavation and visual inspection) of pipe sections that ILI tools cannot traverse or that statistical analysis suggests may be prone to coating or pipe-wall deterioration
•Compliance with regulations established by government agencies regarding pipeline operation, maintenance, and repair
•Timely repair or replacement of any pipeline section or component as needed.
Fig. 9–10. Multi-diameter ILI tool prepared for launch (Source: Oil & Gas Journal)
Global gas transmission More than 50 natural gas transmission pipelines are operating in
countries outside North America (table 9–3). Another dozen are planned or under construction.
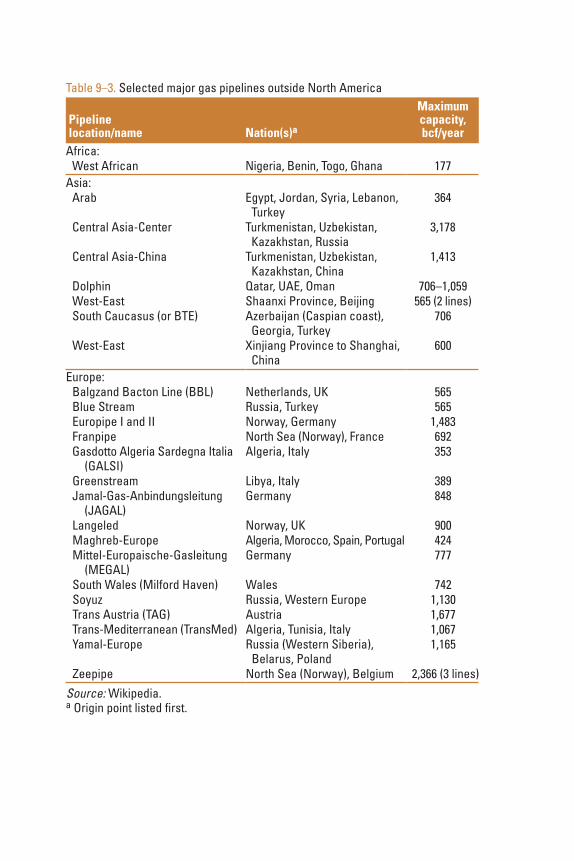
Table 9–3. Selected major gas pipelines outside North America Pipeline location/name
Nation(s)a
Maximum capacity, bcf/year
Africa: West African Nigeria, Benin, Togo, Ghana 177Asia: Arab Egypt, Jordan, Syria, Lebanon,
Turkey364
Central Asia-Center Turkmenistan, Uzbekistan, Kazakhstan, Russia
3,178
Central Asia-China Turkmenistan, Uzbekistan, Kazakhstan, China
1,413
Dolphin Qatar, UAE, Oman 706–1,059 West-East Shaanxi Province, Beijing 565 (2 lines) South Caucasus (or BTE) Azerbaijan (Caspian coast),
Georgia, Turkey706
West-East Xinjiang Province to Shanghai, China
600
Europe: Balgzand Bacton Line (BBL) Netherlands, UK 565 Blue Stream Russia, Turkey 565 Europipe I and II Norway, Germany 1,483 Franpipe North Sea (Norway), France 692 Gasdotto Algeria Sardegna Italia
(GALSI)Algeria, Italy 353
Greenstream Libya, Italy 389 Jamal-Gas-Anbindungsleitung
(JAGAL)Germany 848
Langeled Norway, UK 900 Maghreb-Europe Algeria, Morocco, Spain, Portugal 424 Mittel-Europaische-Gasleitung
(MEGAL)Germany 777
South Wales (Milford Haven) Wales 742 Soyuz Russia, Western Europe 1,130 Trans Austria (TAG) Austria 1,677 Trans-Mediterranean (TransMed) Algeria, Tunisia, Italy 1,067 Yamal-Europe Russia (Western Siberia),
Belarus, Poland1,165
Zeepipe North Sea (Norway), Belgium 2,366 (3 lines)Source: Wikipedia. a Origin point listed first.

Chapter 9 Transporting Natural Gas by Pipeline 173
Distribution SystemsAs of early 2011, about 71 million customers in the United States
relied on natural gas for a range of energy services, and about two-thirds of the gas they used was delivered by some 1,500 LDCs. There are two basic types of LDCs: private firms owned by investors, and public gas systems owned by local municipalities. According to EIA, LDCs deliver 99% of the gas used in the residential sector and 98% of the gas used in the commercial sector. In the industrial and electric power generation sectors, LDCs play a lesser role, delivering only about 45% and 2%, respectively, of the gas used; the remainder used in these latter two sectors comes directly from pipelines or other non-LDC entities (e.g., gas marketers).
City gate station As noted earlier in this chapter, the city gate station is the point at
which natural gas moves from the transmission pipeline system into the local distribution network. At or near the gate station, water and impurities are removed, the volume of the incoming gas is measured for billing and gas-control purposes, the gas pressure is reduced, and an odorant (typically mercaptan) is added to aid in leak detection.
Near the city gate station, the LDC also may add supplemental supplies, to meet spikes in demand caused by weather fluctuations or to adjust the heating value of the gas. Supplemental supply can include propane, butane, and LNG.
Piping network Gas typically flows into a city gate station at a pressure of 1,000–1,500
psi. This pressure is reduced in a series of steps as it flows through the distribution system to the facilities of various kinds of customers.
Five types of piping are used in the typical gas distribution system:• Supply mains carry gas at 100–200 psi from city gate stations
to regulator stations that reduce the pressure and move the gas into feeder mains. (Supply mains may deliver gas at high pressure to some customers, e.g., large industrial facilities.)
•Feeder mains typically deliver gas at 50–60 psi—downstream from a regulator station—to distribution mains. (As is the case for supply mains, feeder mains may connect directly to some customers).

The Oil & Gas Industry: A Nontechnical Guide174
•Other regulators at or near the origination point of distribution mains step down the pressure further, primarily for supply to residential, smaller commercial, and industrial services. Distribution mains are often buried under city streets.
• Service lines deliver gas from distribution mains to the meters of various customers.
•Fuel lines—pipes inside a building (“beyond the meter”)—bring gas to appliances. These lines are the property and the responsibility of the building owner.
Many distribution systems consist of overlapping networks of mains operated at different pressure levels. In figure 9–11, for example, note the service line to a large industrial customer directly from a supply main. Such customers require specially designed meter and regulator sets to handle the large gas volumes and higher delivery pressures they need.
Small commercial and residential customers served from a high-pressure supply main require an additional regulator to reduce the supply line pressure from the service line. That regulator will generally reduce the pressure to 60 psi or less.
Fig. 9–11. Local gas distribution network (Source: Adapted from Busby, R.)

Chapter 9 Transporting Natural Gas by Pipeline 175
Feeder mains deliver gas into low-, medium-, and high-pressure sections of the distribution system. Newer systems typically operate at a source pressure of 60 psi and require a regulator on each service line to further reduce the pressure to levels required for appliances.
If necessary, other district regulator stations drop feeder-main gas pressure further for use in older parts of the distribution system. The individual services connected to mains in these older distribution systems also require regulators, to reduce the pressure to levels necessary for proper appliance operation.
Sections of many older LDCs operate at very low pressure—in the range of 6–10 inches of water column (0.22–0.36 psi). Household appliances are generally designed to operate near this pressure level, so individual service regulators are not needed. In fact, many modern appliances have built-in regulators to ensure proper performance.
Piping materials Pipes used most commonly in a gas distribution system are made of
steel, cast iron, ductile iron, plastic, or copper, as detailed below: • Steel pipe has strength and flexibility but will corrode quickly
if it is not coated and cathodically protected. Pipe joints on steel lines are typically welded.
•Cast iron pipe does not corrode as quickly as other metals but is more brittle than steel or plastic. It may break when subjected to forces such as ground settlement, frost, or traffic vibration.
•Ductile iron pipe is more flexible than cast iron and therefore is more resistant to breaking. It does, however, corrode in a manner similar to cast iron.
•Plastic pipe does not corrode but is softer and much easier to scratch or cut than steel. A metal wire must be buried along with plastic pipe to permit workers to confirm its location at a later time if necessary by using a metal detector.
•Copper tubing is flexible (allowing use in confined spaces), resistant to corrosion, easy to connect, and available in long lengths. The American Society for Testing and Materials specifies the types of copper tubing suitable for use in gas distribution systems.
Supply, feeder, and distribution mains are made of cast iron or ductile iron. Service lines can be fabricated from plastic, steel, or copper. Copper

The Oil & Gas Industry: A Nontechnical Guide176
is the traditional material of choice for fuel lines inside a building, although flexible corrugated stainless steel tubing (coated in plastic) is finding increased use.
Mechanical compression is the only practical method for joining cast iron and ductile iron pipes. In this process, a rubber gasket is compressed against the pipe ends by metal flanges to create a gas-tight seal. Plastic and steel pipe also can be mechanically joined if welding or fusion (described below) are too difficult or present a safety hazard (e.g., if potentially explosive gases are present). Sections of plastic pipe (and fittings used with them) are typically joined with adhesives or by a process called heat fusion—melting the plastic and applying pressure to fuse the pieces together.
In general, distribution mains must be buried with at least 24 inches of cover. However, exceptions can be made if a state or municipality either allows installation in a common trench (along with other utility lines) or provides damage prevention by other means. At least 18 inches of cover are required for service lines buried under streets, and 12 inches is the minimum for lines on private property.
Minimizing gas leakageLocal distribution companies, like pipeline companies, work hard to
ensure worker and public safety and reliable operation—in particular, by minimizing gas leakage. Such efforts also improve LDC economics (by reducing gas loss) and reduce the impact of atmospheric release of methane, a potent greenhouse gas.
Because mechanical damage is one of the leading causes of pipeline failure, considerable effort is devoted to the prevention of contact with the piping system and related equipment. This includes public education programs, as well as one-call systems (telephone hotlines that provide pipeline-location data to anyone planning an excavation project).
Leak surveys are widely used to ensure that all gas piping is inspected regularly. Gas can be detected both above- and belowground by using sensitive instruments carried by hand or mounted on vehicles. Survey crews also watch for another indicator of leakage—namely, the change in color of vegetation, from green to brown or yellow, due to the drying effect of escaping gas.
A third element in leak detection is odorization. Because natural gas has virtually no smell, addition of an odorant (generally at the city gate station) is required by federal regulation. The odorant (commonly

Chapter 9 Transporting Natural Gas by Pipeline 177
mercaptan) gives natural gas what consumers recognize as a rotten-egg smell. Sufficient odorant is added to ensure that gas is detectable at a level of about 1% (or less) in air. When a leak is suspected, various tools are used to pinpoint it, excavate the suspect pipe section in the least disruptive way, repair the pipe, and restore the excavation site cost-effectively.
Controlling corrosionCorrosion is a chemical reaction that returns a refined metal to
its natural state as an ore. Contributing factors include heat, moisture, seawater, soil contaminants (e.g., salts and fertilizers), time, mechanical stress, and temperature.
Corrosion of buried pipe—the leading cause of leaks from buried gas mains—occurs when a small current of electricity flows from the pipe into the ground, causing deterioration of the pipe material. As a pipe corrodes, its wall thickness is reduced, creating the potential for gas loss or outright failure. Replacement of corroded pipe imposes additional maintenance costs as well.
Management of corrosion is required under Part 192 of the U.S. Code of Federal Regulations, and a range of methods and devices are used to do so. Although coatings and insulation can help, another common approach is cathodic protection. In simple terms, cathodic protection manages the flow of electrical currents in the walls of a pipeline in a way that minimizes or eliminates corrosion damage.
Corrosion on the outside wall of a pipeline is called external or atmospheric corrosion and is accelerated in areas of humidity, pollution, and hot or fluctuating temperatures. It can be caused by improper application or poor bonding of pipe coating, improper pipe maintenance, contact between incompatible metals, coating damage, or a localized corrosion cell created by abnormal conditions.
Corrosion of a pipe’s inner wall, or internal corrosion, results from the presence of water, bacteria, or chemicals. Just as with transmission pipelines, routine pigging to clean the pipe wall helps to reduce internal corrosion.
Peak-shavingAs noted previously, gas can be retrieved from storage facilities to
manage variations in gas demand. However, when withdrawals from storage are insufficient to meet peak customer requirements, LDCs may use a technique called peak-shaving.
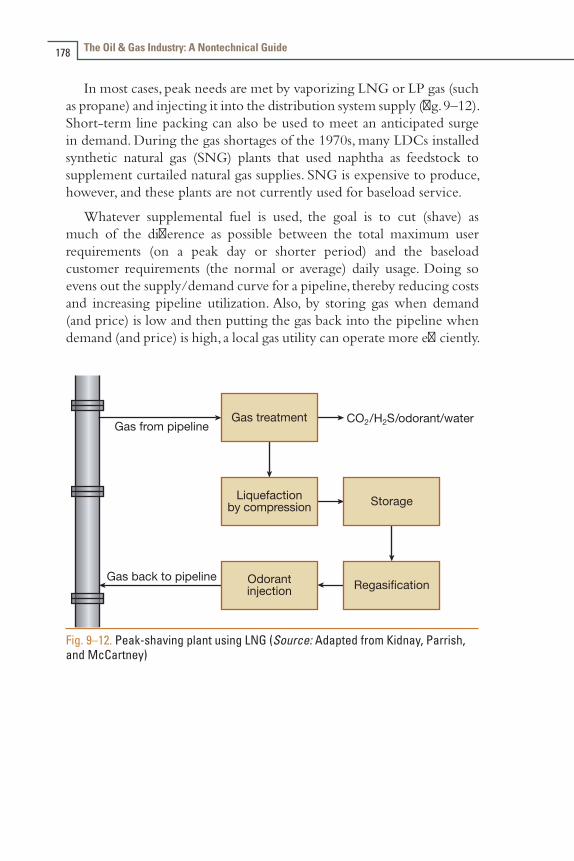
The Oil & Gas Industry: A Nontechnical Guide178
In most cases, peak needs are met by vaporizing LNG or LP gas (such as propane) and injecting it into the distribution system supply (fig. 9–12). Short-term line packing can also be used to meet an anticipated surge in demand. During the gas shortages of the 1970s, many LDCs installed synthetic natural gas (SNG) plants that used naphtha as feedstock to supplement curtailed natural gas supplies. SNG is expensive to produce, however, and these plants are not currently used for baseload service.
Whatever supplemental fuel is used, the goal is to cut (shave) as much of the difference as possible between the total maximum user requirements (on a peak day or shorter period) and the baseload customer requirements (the normal or average) daily usage. Doing so evens out the supply/demand curve for a pipeline, thereby reducing costs and increasing pipeline utilization. Also, by storing gas when demand (and price) is low and then putting the gas back into the pipeline when demand (and price) is high, a local gas utility can operate more efficiently.
Fig. 9–12. Peak-shaving plant using LNG (Source: Adapted from Kidnay, Parrish, and McCartney)
Transporting Natural Gas as LNG
An increasingly important development in the movement of natural gas—particularly between nations—has been the evolution, over the past several decades, of the LNG industry. Transforming natural gas into a cryogenic (ultracold) liquid increases its energy density dramatically, permitting movement by ship, barge, or tank truck instead of by pipeline. The same cryogenic technique is also used to expedite shipment of industrial gases such as nitrogen, oxygen, and hydrogen.
BackgroundThe three major steps in the LNG value chain (fig.10–1) are the
liquefaction process, the shipment of the LNG (most often by ships of special design) to an import terminal, and the transformation of the LNG back into gaseous form (regasification) for introduction into a pipeline that will carry it to market. Interim storage of the LNG is also part of industry operations at both liquefaction plants and regasification plants.
When natural gas (at atmospheric pressure and 60°F) is cooled below its boiling point (-263°F), its volume can be reduced by a factor of more than 600, and it can be stored and shipped without pressurization in liquid form. These are distinct economic benefits for gas shipment.
Liquefaction can be particularly valuable in bringing to market stranded gas—that is, gas that is not located close to users and that would require significant investment in infrastructure to transport it to market. Examples include gas resources found far offshore and in very deep water, as well as gas resources in far northern Arctic regions. LNG also allows countries to import natural gas cost-effectively from other nations around the world.
10
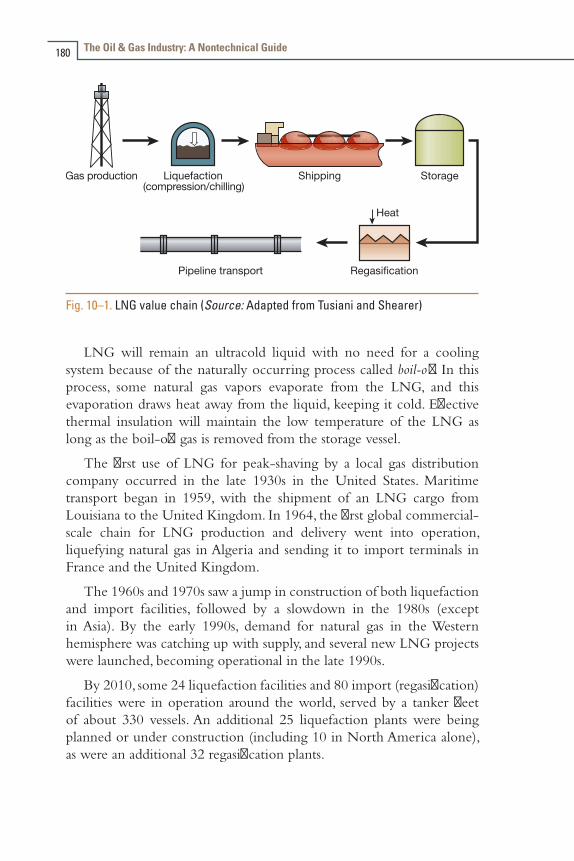
The Oil & Gas Industry: A Nontechnical Guide180
Fig. 10–1. LNG value chain (Source: Adapted from Tusiani and Shearer)
LNG will remain an ultracold liquid with no need for a cooling system because of the naturally occurring process called boil-off. In this process, some natural gas vapors evaporate from the LNG, and this evaporation draws heat away from the liquid, keeping it cold. Effective thermal insulation will maintain the low temperature of the LNG as long as the boil-off gas is removed from the storage vessel.
The first use of LNG for peak-shaving by a local gas distribution company occurred in the late 1930s in the United States. Maritime transport began in 1959, with the shipment of an LNG cargo from Louisiana to the United Kingdom. In 1964, the first global commercial-scale chain for LNG production and delivery went into operation, liquefying natural gas in Algeria and sending it to import terminals in France and the United Kingdom.
The 1960s and 1970s saw a jump in construction of both liquefaction and import facilities, followed by a slowdown in the 1980s (except in Asia). By the early 1990s, demand for natural gas in the Western hemisphere was catching up with supply, and several new LNG projects were launched, becoming operational in the late 1990s.
By 2010, some 24 liquefaction facilities and 80 import (regasification) facilities were in operation around the world, served by a tanker fleet of about 330 vessels. An additional 25 liquefaction plants were being planned or under construction (including 10 in North America alone), as were an additional 32 regasification plants.

Chapter 10 Transporting Natural Gas as LNG 181
As of mid-2011, there were 11 U.S. facilities (as well as another in Peñuelas, Puerto Rico) capable of importing and regasifying LNG. They are located in:
•Everett, Massachusetts
•Cove Point, Maryland
•Elba Island, Georgia
•Lake Charles, Louisiana
•Gulf of Mexico, offshore Louisiana
•Offshore Boston (2)
•Freeport, Texas
• Sabine, Louisiana
•Hackberry, Louisiana
• Sabine Pass, Texas
A facility in Kenai, Alaska—from which LNG had been exported to Japan and China since 1969—was mothballed in late 2011, though owner ConocoPhillips said in December that it expected to resume limited operation in mid-2012. On the basis of increasing U.S. gas supplies (chiefly from exploitation of gas-bearing shales), proposals were made in late 2010 to build or retrofit one facility in Texas and another in Louisiana for the export of LNG from the United States to world markets. In addition, more than 100 LDCs were operating smaller LNG regasification facilities to help meet peak gas demand.
A variety of hurdles must be overcome in the development and implementation of a large-scale LNG project, in addition to the obvious engineering challenges inherent in handling a high-energy-content cryogenic material. These include:
•Assurance of sufficient gas reserves over the project life (typically 20–30 years)
•Access to large amounts of capital
•Gaining long-term commitments from buyers of LNG
•Arrangements for use of tanker vessels
•Negotiation of multiple and complex commercial issues such as contracts, ownership rights, insurance, revenue sharing among partners, and financing
•Compliance with governmental regulations regarding safety, environmental impacts, security, and economic policies (e.g., tariffs) for both land-based facilities and vessels

The Oil & Gas Industry: A Nontechnical Guide182
The Liquefaction ProcessNatural gas from various formations and regions will differ in
composition. It is primarily methane, with small amounts of ethane, propane, butane, and pentane. It may also contain condensates (light oils) and other constituents.
Because LNG is bought and sold on the basis of its heating value, constituents that affect heating value must be removed. For example, ethane, propane, butane, or pentane will raise the heating value of methane, while nitrogen and carbon dioxide will reduce it. In addition, unless carbon dioxide, water, hydrogen sulfide, and mercury are extracted, they will freeze at low temperature, forming crystals that could plug filters, heat exchangers, and other equipment. Condensates are also removed.
The process of removing carbon dioxide or hydrogen sulfide is called sweetening. Removal of water or water vapor is called dehydration.
After it has been cleaned, the pressurized incoming gas undergoes a refrigeration process by which it is cooled to about -240°F (fig. 10–2). A final temperature reduction to -260°F is then carried out by flashing the gas (i.e., rapidly reducing its pressure by passing it through a valve) to just above atmospheric pressure.
The system of equipment used to liquefy LNG is called a train. The typical liquefaction facility has a half-dozen or more trains set up in parallel, and larger plants can produce up to eight million tons per year of LNG. A range of proprietary systems have been developed for liquefaction, but the following are the primary equipment in a train:
•Compressors, typically driven by natural gas–fueled turbine engines
•Heat exchangers, in which the heat from the incoming compressed gas is transferred to refrigerant gases (e.g., propane or ethylene) and then either to the atmosphere or to a stream of water
•Flash valve, to achieve final cooling
The resultant LNG is a clear, colorless, odorless liquid with half the density of water. It is pumped into special insulated tanks of various designs for storage before being loaded onto ships for transport to market.
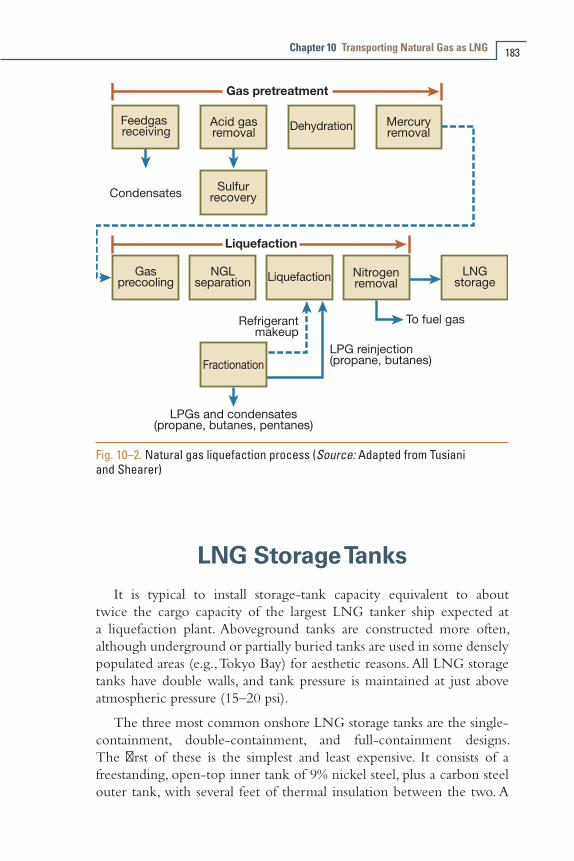
Chapter 10 Transporting Natural Gas as LNG 183
Fig. 10–2. Natural gas liquefaction process (Source: Adapted from Tusiani and Shearer)
LNG Storage TanksIt is typical to install storage-tank capacity equivalent to about
twice the cargo capacity of the largest LNG tanker ship expected at a liquefaction plant. Aboveground tanks are constructed more often, although underground or partially buried tanks are used in some densely populated areas (e.g., Tokyo Bay) for aesthetic reasons. All LNG storage tanks have double walls, and tank pressure is maintained at just above atmospheric pressure (15–20 psi).
The three most common onshore LNG storage tanks are the single-containment, double-containment, and full-containment designs. The first of these is the simplest and least expensive. It consists of a freestanding, open-top inner tank of 9% nickel steel, plus a carbon steel outer tank, with several feet of thermal insulation between the two. A

The Oil & Gas Industry: A Nontechnical Guide184
steel roof contains any boil-off vapor and supports a suspended ceiling that insulates the top of the inner tank. The term single containment means that the outer tank is not designed to contain any LNG that escapes from the inner tank; instead, the escaped LNG would flow into a secondary containment system, typically an area around the tank that is ringed by dikes.
Double containment is similar to single except that the outer tank (made of reinforced concrete and strengthened by a wall of earth or rock) can contain any LNG that leaks from the inner tank. A steel roof protects the inner tank but cannot hold any vapor released from it.
The third tank design is called full containment (fig. 10–3). It adds a concrete roof to the double-containment system’s concrete outer walls. This roof can hold any vapor produced by a breach in the inner 9% nickel steel tank. Although this design is the most expensive of the three—about 50% more costly than single containment—it allows the closest spacing between tanks and equipment.
Fig. 10–3. Full-containment LNG storage tank (Source: Adapted from Kidnay, Parrish, and McCartney)
A fourth design, called a membrane storage tank, is seldom used. In this design, a flexible stainless steel membrane is supported by a layer of insulation that is mounted on an outer prestressed concrete wall. The outer concrete wall and roof can contain any leak of liquid or vapor

Chapter 10 Transporting Natural Gas as LNG 185
from the primary membrane. Membrane tanks are generally seen as less durable than other designs.
At most LNG facilities, LNG is loaded from storage onto tanker ships moored at a jetty with loading arms incorporating specially designed couplings (fig. 10–4). A cryogenic piping system carries the LNG from the tanks to the jetty. It can take 24 hours to moor a tanker, connect the loading system, and slowly cool the LNG cargo tanks prior to loading. A typical jetty can handle about 215 loadings per year (about 13 million tons of LNG) servicing larger tankers.
Fig. 10–4. Darwin LNG plant, at Wickham Point, Australia (Source: Oil & Gas Journal )
Offshore Liquefaction ConceptsAs demand for LNG rose from 2000 to 2005, various parties
proposed innovative concepts for fixed or floating systems targeted at the exploitation of small or remote offshore reserves of stranded gas. One design, intended for use in shallow water, is the gravity-based structure (GBS), similar to technology used to build some offshore oil and gas production facilities. The GBS provides an artificial island for LNG

The Oil & Gas Industry: A Nontechnical Guide186
production and storage, using large prefabricated concrete structures that are flooded and sunk to rest on the seafloor.
Another approach involves the use of a specially designed FPSO moored in deeper water to take gas from a subsea gas field below it and convert it into LNG onboard. From such a floating LNG (FLNG) vessel, the LNG is later transferred to conventional LNG carriers that occasionally tie up to the FLNG vessel.
In May 2011, Royal Dutch Shell announced plans to build a FLNG vessel for use 125 miles off Australia’s northwest coast (fig. 10–5). The company described it as the biggest floating human-made object ever built—longer than four football fields and more massive than an aircraft carrier. It would convert 110,000 boe of gas from the Prelude field, where production is slated to start by 2017.
Fig. 10–5. Proposed Shell FPSO (FLNG vessel) for liquefaction offshore Australia (Source: Oil & Gas Journal )
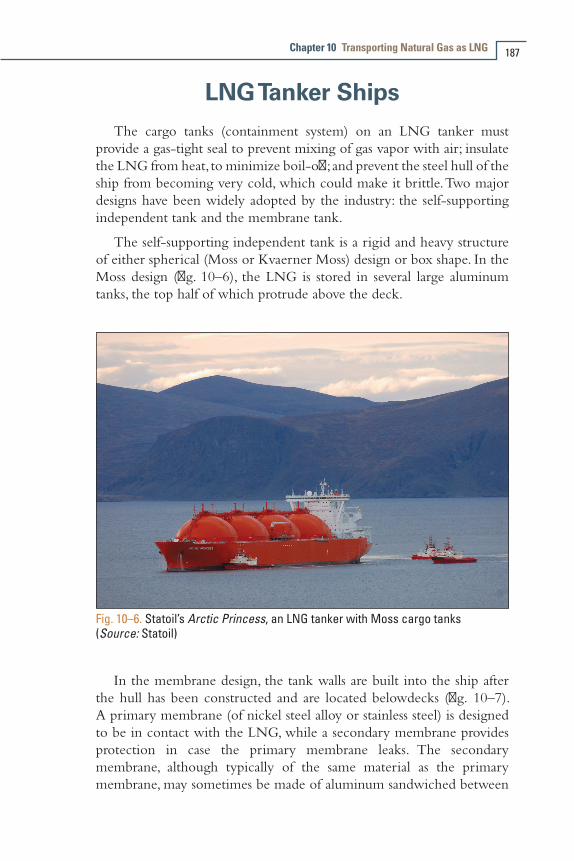
Chapter 10 Transporting Natural Gas as LNG 187
LNG Tanker ShipsThe cargo tanks (containment system) on an LNG tanker must
provide a gas-tight seal to prevent mixing of gas vapor with air; insulate the LNG from heat, to minimize boil-off; and prevent the steel hull of the ship from becoming very cold, which could make it brittle. Two major designs have been widely adopted by the industry: the self-supporting independent tank and the membrane tank.
The self-supporting independent tank is a rigid and heavy structure of either spherical (Moss or Kvaerner Moss) design or box shape. In the Moss design (fig. 10–6), the LNG is stored in several large aluminum tanks, the top half of which protrude above the deck.
Fig. 10–6. Statoil’s Arctic Princess, an LNG tanker with Moss cargo tanks (Source: Statoil)
In the membrane design, the tank walls are built into the ship after the hull has been constructed and are located belowdecks (fig. 10–7). A primary membrane (of nickel steel alloy or stainless steel) is designed to be in contact with the LNG, while a secondary membrane provides protection in case the primary membrane leaks. The secondary membrane, although typically of the same material as the primary membrane, may sometimes be made of aluminum sandwiched between
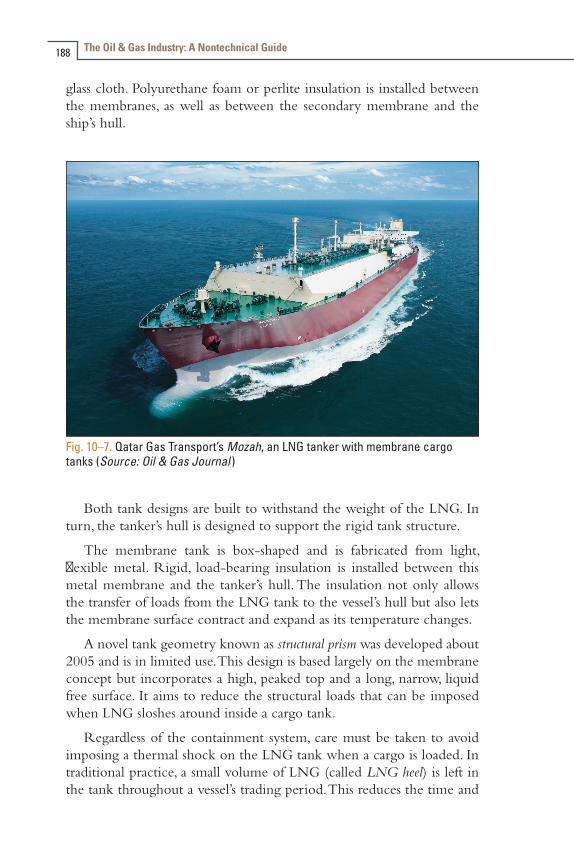
The Oil & Gas Industry: A Nontechnical Guide188
glass cloth. Polyurethane foam or perlite insulation is installed between the membranes, as well as between the secondary membrane and the ship’s hull.
Fig. 10–7. Qatar Gas Transport’s Mozah, an LNG tanker with membrane cargo tanks (Source: Oil & Gas Journal )
Both tank designs are built to withstand the weight of the LNG. In turn, the tanker’s hull is designed to support the rigid tank structure.
The membrane tank is box-shaped and is fabricated from light, flexible metal. Rigid, load-bearing insulation is installed between this metal membrane and the tanker’s hull. The insulation not only allows the transfer of loads from the LNG tank to the vessel’s hull but also lets the membrane surface contract and expand as its temperature changes.
A novel tank geometry known as structural prism was developed about 2005 and is in limited use. This design is based largely on the membrane concept but incorporates a high, peaked top and a long, narrow, liquid free surface. It aims to reduce the structural loads that can be imposed when LNG sloshes around inside a cargo tank.
Regardless of the containment system, care must be taken to avoid imposing a thermal shock on the LNG tank when a cargo is loaded. In traditional practice, a small volume of LNG (called LNG heel) is left in the tank throughout a vessel’s trading period. This reduces the time and
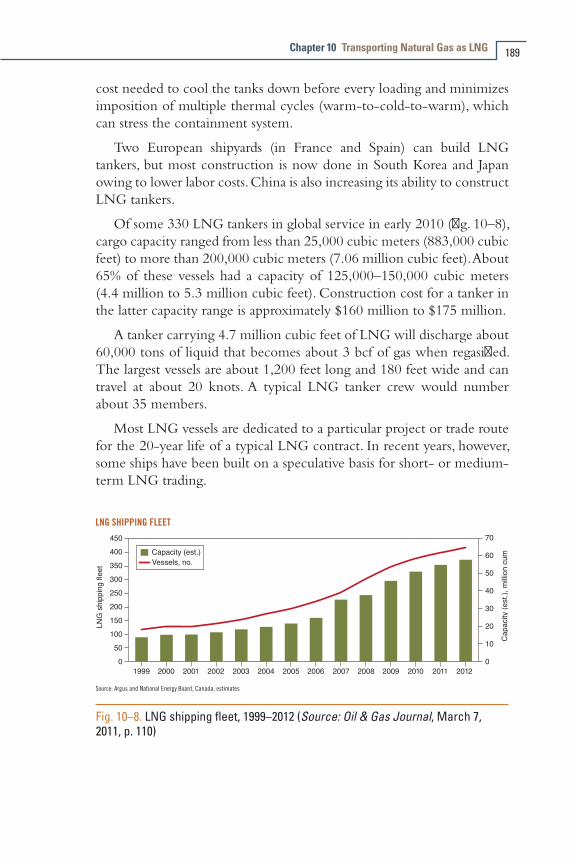
Chapter 10 Transporting Natural Gas as LNG 189
cost needed to cool the tanks down before every loading and minimizes imposition of multiple thermal cycles (warm-to-cold-to-warm), which can stress the containment system.
Two European shipyards (in France and Spain) can build LNG tankers, but most construction is now done in South Korea and Japan owing to lower labor costs. China is also increasing its ability to construct LNG tankers.
Of some 330 LNG tankers in global service in early 2010 (fig. 10–8), cargo capacity ranged from less than 25,000 cubic meters (883,000 cubic feet) to more than 200,000 cubic meters (7.06 million cubic feet). About 65% of these vessels had a capacity of 125,000–150,000 cubic meters (4.4 million to 5.3 million cubic feet). Construction cost for a tanker in the latter capacity range is approximately $160 million to $175 million.
A tanker carrying 4.7 million cubic feet of LNG will discharge about 60,000 tons of liquid that becomes about 3 bcf of gas when regasified. The largest vessels are about 1,200 feet long and 180 feet wide and can travel at about 20 knots. A typical LNG tanker crew would number about 35 members.
Most LNG vessels are dedicated to a particular project or trade route for the 20-year life of a typical LNG contract. In recent years, however, some ships have been built on a speculative basis for short- or medium-term LNG trading.
Fig. 10–8. LNG shipping fleet, 1999–2012 (Source: Oil & Gas Journal, March 7, 2011, p. 110)

The Oil & Gas Industry: A Nontechnical Guide190
Onshore Regasification ProcessOnce an LNG tanker completes its voyage, it typically moors at a
large marine LNG receiving terminal, often built on the coast or on the shore of a river with easy access to the ocean (fig. 10–9). These facilities receive LNG in large quantities and pump it back into large storage tanks of the kind described earlier to be held until needed. (One exception: The proprietary Bishop Process bypasses the cryogenic storage step. The LNG flows from the tanker through a pipe-in-pipe heat exchanger that uses the heat from circulating seawater to vaporize the LNG immediately. The gas is then pressurized and sent either directly into a pipeline or into an underground salt cavern.)
A marine LNG terminal typically has several storage tanks, each able to hold up to 160,000 cubic meters (3.8 bcf) of natural gas. Four tanks of that volume can hold an amount of LNG about equal to the cargoes of two to four LNG tankers—sufficient to maintain a suitable operating inventory. The sendout (of gaseous natural gas) from an LNG terminal is a function of pipeline capacity, storage and vaporization capacity, and frequency of LNG cargo delivery.
Fig. 10–9. Canaport marine LNG receiving terminal, St. John, New Brunswick (Source: Oil & Gas Journal )
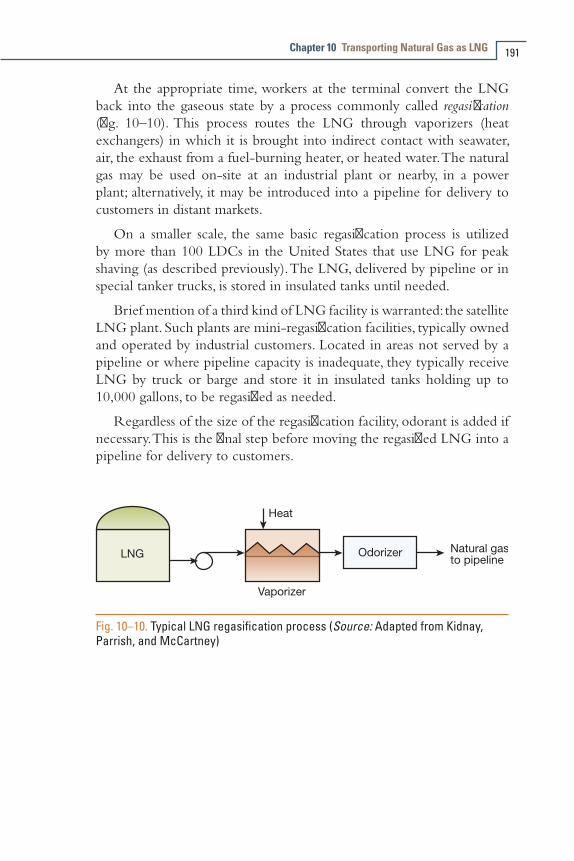
Chapter 10 Transporting Natural Gas as LNG 191
At the appropriate time, workers at the terminal convert the LNG back into the gaseous state by a process commonly called regasification (fig. 10–10). This process routes the LNG through vaporizers (heat exchangers) in which it is brought into indirect contact with seawater, air, the exhaust from a fuel-burning heater, or heated water. The natural gas may be used on-site at an industrial plant or nearby, in a power plant; alternatively, it may be introduced into a pipeline for delivery to customers in distant markets.
On a smaller scale, the same basic regasification process is utilized by more than 100 LDCs in the United States that use LNG for peak shaving (as described previously). The LNG, delivered by pipeline or in special tanker trucks, is stored in insulated tanks until needed.
Brief mention of a third kind of LNG facility is warranted: the satellite LNG plant. Such plants are mini-regasification facilities, typically owned and operated by industrial customers. Located in areas not served by a pipeline or where pipeline capacity is inadequate, they typically receive LNG by truck or barge and store it in insulated tanks holding up to 10,000 gallons, to be regasified as needed.
Regardless of the size of the regasification facility, odorant is added if necessary. This is the final step before moving the regasified LNG into a pipeline for delivery to customers.
Fig. 10–10. Typical LNG regasification process (Source: Adapted from Kidnay, Parrish, and McCartney)

The Oil & Gas Industry: A Nontechnical Guide192
Offshore Regasification ProcessIn the mid-2000s, other approaches to regasification were moving from
concept to commercial application: the conversion of LNG to gaseous form aboard converted or specially designed vessels moored offshore.
One approach involves use of a tanker that contains both LNG tanks and a regasification system. After arrival on station, the vessel connects to a special buoy that is in turn connected to a pipeline on the seabed. The tanker’s LNG is regasified onboard and sent down to the pipeline that carries it to shore.
Another is the floating storage and regasification unit (FSRU)—either a custom-built ship or a converted LNG tanker—typically moored permanently at an offshore site. Other loaded LNG tankers tie up to the FSRU and pump their LNG into the FSRU’s insulated tanks. Later, the LNG is regasified and sent to shore in the manner described above.
In a third concept, a specially built system is attached to a conventional LNG tanker offshore. This pulls LNG from the tanker and vaporizes it. Then the LNG is sent through a subsea line to an onshore pipeline.
Offshore regasification systems such as these will need to prove their safety, reliability, and economic feasibility in the coming years before being widely adopted.
LNG SafetyA wide range of codes, standards, industry guidelines and governmental
regulations spell out the actions necessary for proper construction, careful maintenance and safe operation of LNG facilities and equipment. In the United States, the following federal agencies regulate various aspects of the LNG industry:
•FERC
•DOE
•U.S. Coast Guard
•Department of Transportation
•Department of Homeland Security
•EPA

Chapter 10 Transporting Natural Gas as LNG 193
•Bureau of Ocean Energy Management, Regulation, and Enforcement
•Army Corps of Engineers
•National Oceanic and Atmospheric Administration
•Department of Labor/Occupational Safety and Health Administration
State and local agencies (e.g., fire, police, and environmental departments) also may have requirements regarding construction and operation of LNG terminals. For example, the National Fire Protection Association has developed standard NFPA 59A, which pertains to LNG production, storage, and handling. NFPA 59A incorporates a range of industry standards developed by such professional organizations as the American Society of Civil Engineers, the American Society of Mechanical Engineers, the American Concrete Institute, API, and the American Society for Testing and Materials. The worldwide LNG industry also follows closely the guidance of the International Maritime Organization (an agency of the United Nations) regarding safety, environmental issues, legal issues, and technical operation of LNG tanker vessels.


Converting Oil into Products
Crude oil is the starting point for creation of a wide range of products, ranging from gasoline and diesel fuel to roofing tar and heating oil. In turn, petrochemicals made from oil are used to create such products as plastics, cosmetics, insect repellents, and floor wax.
However, raw crude oil (as noted earlier) is a complex mix of hydrocarbon molecules of varying size and structure and is unsuitable for direct use in anything but some industrial boilers. Because of this variable molecular structure, different crude oils can vary widely in appearance and in physical properties. One may be dark brown and as thick as molasses; another may have a green tinge and flow like water; and a third may be black as coal and smell like rotten eggs.
Overview of RefiningThe range of processes used to transform raw crude oil into usable
products is conducted in a complex industrial facility called a refinery (fig. 11–1). Operators of a refinery commonly accept as feedstock a mix of crude oil types (the crude slate) from various sources and use a series of processing units to transform this slate into finished products.
In the marketplace, these finished products are often classified as follows:•Light distillates: liquefied petroleum gas (LPG), gasoline, naphtha
•Middle distillates: kerosene and related jet engine fuels, diesel fuel
•Heavy distillates and residuum: heavy fuel oil, lubricating oils, paraffin wax, asphalt/tar, petroleum coke
Importantly, initial processing takes place at or near the well site, soon after the flow of crude oil begins. Almost every oil reservoir has some
11

The Oil & Gas Industry: A Nontechnical Guide196
gas dissolved in the oil; conversely, almost every gas reservoir holds some oil. For economic reasons, it makes sense to do a bit of cleanup of both hydrocarbons (gas and oil) close to the wellhead (fig. 11–2).
Fig. 11–1. Tesoro’s Golden Eagle refinery, Martinez, CA (Source: Oil & Gas Journal )
Fig. 11–2. Initial processing of hydrocarbons in the oil patch (Source: Adapted from Leffler)
Chapter 11 Converting Oil into Products 197
As it comes to the surface and leaves the wellhead, the crude oil stream (containing dissolved gases) is directed into a separator vessel. As the stream enters the vessel, it undergoes a drop in pressure, and the light dissolved gases come out of the oil. (This effect is similar to what happens when a bottle of club soda is opened.) These gases can then be drawn from the top of the vessel for further processing (as described in chap. 7), while the oil remains in the lower part of the separator.
The crude is also very likely to contain some water or water vapor, and that water is drawn from the bottom of the separator. (Recall that oil floats on water.) The oil is then withdrawn, often mixed with condensate (a very light crude oil) from the gas separator, and sent on its way to be refined.
At the refinery, the transformation of crude oil into finished products is generally carried out in four phases: separation/distillation, conversion, enhancement, and blending. These are each covered in the following sections.
Separation/DistillationIn the separation state, the first issue of concern is the removal of
salts and any remaining water from the crude oil stream. Significant volumes of water are often produced along with crude oil, coming from the underground formation or resulting from either waterflooding or other efforts to boost production. Much of the produced water is removed close to the wellhead (by the separator, described above, and other processes), but crude entering a refinery typically still contains enough water to require treatment. This water often contains dissolved salts (calcium, sodium, and magnesium chloride compounds) that can damage refinery equipment.
The incoming crude is typically first routed to a vessel called a desalter, in which extra water is added and the crude/water solution is intensely mixed and heated to about 250°F. An electric field is then used to separate the crude from the water droplets, and chemicals remove the salts from the water. For removal of the final traces of water, the crude is typically routed to settling tanks or to a centrifugal separation system.
After the removal of water and salt, the crude undergoes a process called distillation. As a brief review, consider the use of distillation to purify water that contains some nonvolatile impurities (e.g., potassium
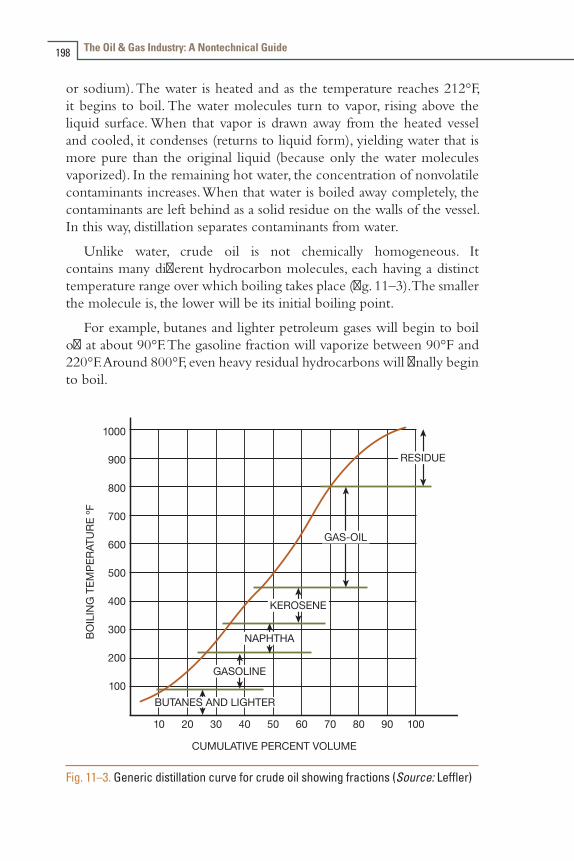
The Oil & Gas Industry: A Nontechnical Guide198
or sodium). The water is heated and as the temperature reaches 212°F, it begins to boil. The water molecules turn to vapor, rising above the liquid surface. When that vapor is drawn away from the heated vessel and cooled, it condenses (returns to liquid form), yielding water that is more pure than the original liquid (because only the water molecules vaporized). In the remaining hot water, the concentration of nonvolatile contaminants increases. When that water is boiled away completely, the contaminants are left behind as a solid residue on the walls of the vessel. In this way, distillation separates contaminants from water.
Unlike water, crude oil is not chemically homogeneous. It contains many different hydrocarbon molecules, each having a distinct temperature range over which boiling takes place (fig. 11–3). The smaller the molecule is, the lower will be its initial boiling point.
For example, butanes and lighter petroleum gases will begin to boil off at about 90°F. The gasoline fraction will vaporize between 90°F and 220°F. Around 800°F, even heavy residual hydrocarbons will finally begin to boil.
Fig. 11–3. Generic distillation curve for crude oil showing fractions (Source: Leffler)

Chapter 11 Converting Oil into Products 199
In an oil refinery, atmospheric distillation is the simplest form of this process, so named because it is carried out in a tall, cylindrical vessel (a distillation column or tower) operating at atmospheric pressure. This vessel is also called a fractionating tower because it separates the raw crude into fractions (or cuts) that consist of molecules of more nearly uniform size (compared to the raw crude). Later, these can be processed more easily into finished products.
As one might guess, different grades of crude (which sell at different prices based on their qualities) have different distillation curves (fig. 11–4). In preparation for entry into the distillation tower, crude oil is routed through a furnace in which superheated steam raises its temperature to about 750°F. The hot crude oil is then introduced at the bottom of the distillation tower, flowing onto the lowest tray in a stack of horizontal trays that fill the tower, each separated by one to two feet.
Fig. 11–4. Distillation curves for six different crude oils (Source: Leffler)

The Oil & Gas Industry: A Nontechnical Guide200
(Note that the design of the components inside a distillation column can vary widely. Components of various sizes, shapes, and materials can be used, tailored to the type of feed expected and the degree of uniformity required in the fractions produced. The structure and operation of a simple, generic column is described here to illustrate the major aspects of the distillation process.)
A high temperature is maintained at the bottom of the distillation column, and as the hot crude vaporizes, perforations in each tray allow the vapor to rise within the column. As it rises, the vapor cools as it bubbles through the several inches of liquid that eventually builds up in each tray. This heat transfer is enhanced by the use of devices such as bubble caps (fig. 11–5). Their geometry forces the vapor bubbles to spend more time in the liquid in each tray, which cools the vapor further. Some hydrocarbons in the vapor condense into liquid form and remain in the tray.
The temperature of the vapor drops, and the lower temperature of the liquid causes any heavier compounds that remain in the vapor to condense as they rise within the tower. The amount of liquid in each tray increases, and at several levels in the column, the liquid is drawn off. Lighter products are taken from the upper parts of the column; heavier liquids are taken from the trays closer to the bottom.
Fig. 11–5. Trays with bubble caps in distillation tower (Source: Adapted from Leffler)
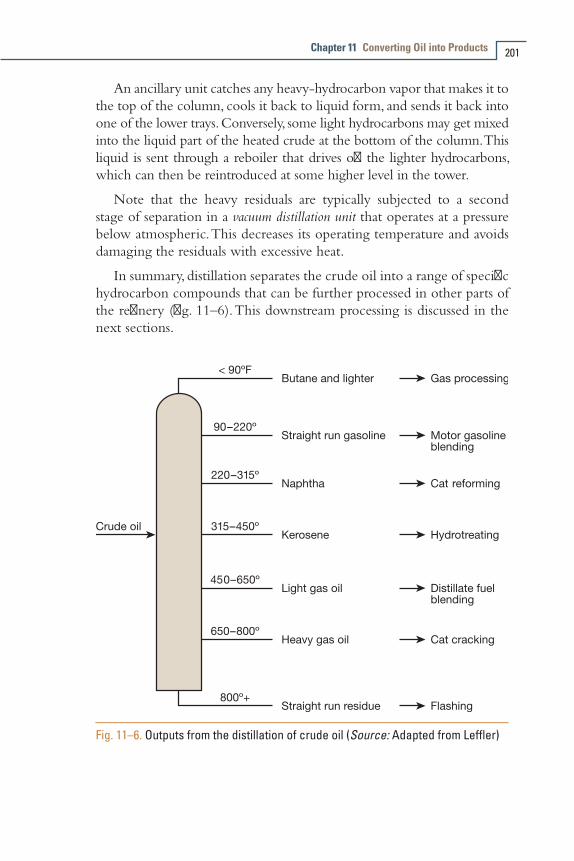
Chapter 11 Converting Oil into Products 201
An ancillary unit catches any heavy-hydrocarbon vapor that makes it to the top of the column, cools it back to liquid form, and sends it back into one of the lower trays. Conversely, some light hydrocarbons may get mixed into the liquid part of the heated crude at the bottom of the column. This liquid is sent through a reboiler that drives off the lighter hydrocarbons, which can then be reintroduced at some higher level in the tower.
Note that the heavy residuals are typically subjected to a second stage of separation in a vacuum distillation unit that operates at a pressure below atmospheric. This decreases its operating temperature and avoids damaging the residuals with excessive heat.
In summary, distillation separates the crude oil into a range of specific hydrocarbon compounds that can be further processed in other parts of the refinery (fig. 11–6). This downstream processing is discussed in the next sections.
Fig. 11–6. Outputs from the distillation of crude oil (Source: Adapted from Leffler)

The Oil & Gas Industry: A Nontechnical Guide202
ConversionIn the refining business, motor gasoline and compounds called middle
distillates are the finished products in highest demand and with the largest profit margins. There is a strong incentive to maximize production of these two product groups by converting as many of the molecules in crude oil as possible into these forms.
Conversion is the broad term applied to processes that crack (break apart), combine, or modify nongasoline and non–middle-distillate hydrocarbons into the two product groups noted above. (Conversion is also sometimes called upgrading, because it transforms lesser-value products in ways that increase their value.) Conversion also can be used to produce petrochemicals and to reduce the viscosity of residual fuel oil. Each of the major conversion processes is discussed individually below.
CrackingCracking is the breaking of large hydrocarbon molecules into smaller
ones. Thermal cracking uses heat to achieve this end, while catalytic cracking uses catalysts to do so. (Recall that catalysts are compounds that promote a chemical reaction but do not take part in it.) In some cases, both approaches also use pressure. Cracking is carried out in tall structures with thick walls, and the resulting stream of hydrocarbons generally must be sent through a distillation column to separate its product fractions.
Thermal cracking. There are several related types of thermal cracking. Those of most importance to oil production are described below.
Steam cracking. One type of thermal cracking, steam cracking makes use of high-temperature steam to do its work (as the name implies). Steam cracking can be used in several ways. In one configuration, it processes heavy residues from the distillation tower (fig. 11–7) to yield lighter products such as gasoline, naphtha, and gas oils.
Steam cracking can also be used to break apart lighter molecules—propane, ethane, naphtha, light fuel oil, and gas oil—to produce petrochemicals. The hydrogen in the high-temperature steam bonds with the cracked molecules to form new ones—primarily high-value ethylene and propylene. (Petrochemicals production is discussed later in this chapter.) When used in this second configuration, the processing unit is sometimes called an ethylene cracker. However, it also yields such valuable by-products as benzene, light fuel oil, hydrogen, and methane.
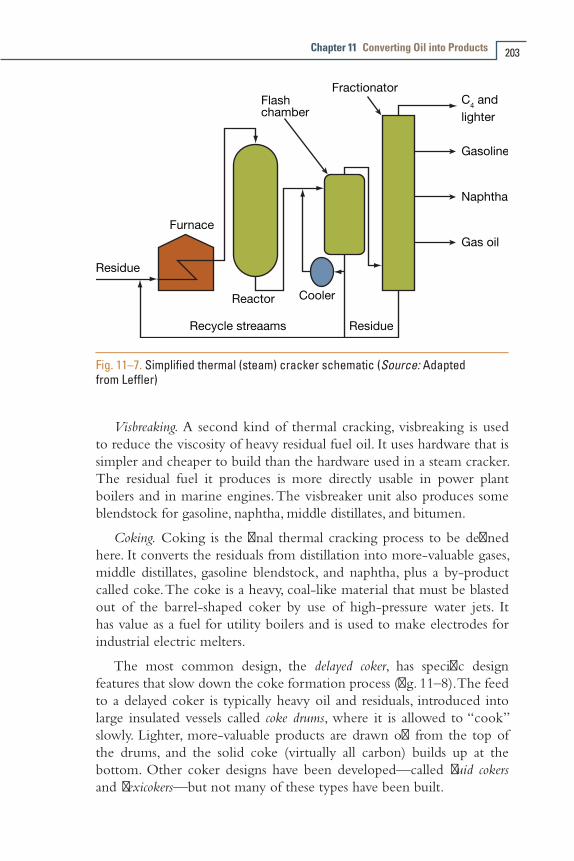
Chapter 11 Converting Oil into Products 203
Fig. 11–7. Simplified thermal (steam) cracker schematic (Source: Adapted from Leffler)
Visbreaking. A second kind of thermal cracking, visbreaking is used to reduce the viscosity of heavy residual fuel oil. It uses hardware that is simpler and cheaper to build than the hardware used in a steam cracker. The residual fuel it produces is more directly usable in power plant boilers and in marine engines. The visbreaker unit also produces some blendstock for gasoline, naphtha, middle distillates, and bitumen.
Coking. Coking is the final thermal cracking process to be defined here. It converts the residuals from distillation into more-valuable gases, middle distillates, gasoline blendstock, and naphtha, plus a by-product called coke. The coke is a heavy, coal-like material that must be blasted out of the barrel-shaped coker by use of high-pressure water jets. It has value as a fuel for utility boilers and is used to make electrodes for industrial electric melters.
The most common design, the delayed coker, has specific design features that slow down the coke formation process (fig. 11–8). The feed to a delayed coker is typically heavy oil and residuals, introduced into large insulated vessels called coke drums, where it is allowed to “cook” slowly. Lighter, more-valuable products are drawn off from the top of the drums, and the solid coke (virtually all carbon) builds up at the bottom. Other coker designs have been developed—called fluid cokers and flexicokers—but not many of these types have been built.

The Oil & Gas Industry: A Nontechnical Guide204
Coke drums
Fig. 11–8. Simplified delayed-coker schematic (Source: Adapted from Leffler)
Note that several refinery units are deliberately operated in ways designed to prevent the creation of coke during intermediate process steps. Heater tubes in a furnace, for example, can become coked up when carbon atoms crack off from a feedstock and adhere to the inside of the tubes, clogging them. Coking problems are prevented by adding steam, by maintaining high velocities in feed streams, and by reducing pressure to reduce process temperatures.
Catalytic cracking. As in thermal cracking, catalytic cracking (also called cat cracking) uses heat and pressure, but it also employs a catalyst to either speed up the process or allow it to occur at a lower temperature. A simplified schematic of a catalytic cracking unit is shown in figure 11–9.
In the form of small beads, pellets, or powder, the catalyst is added to the oil and processed along with it. The feed material (heavy residuals from the distillation column) and hot catalyst (about 700°F) are heated further with steam to about 1,000°F, driving the combination upward through a riser. Almost all of the cracking reactions take place in the riser in just a few seconds. Then, in the disengagement vessel, cyclones separate the catalyst and send it to be either disposed of or cleaned (to

Chapter 11 Converting Oil into Products 205
remove the carbon that builds up on its surface) for reuse. The desired cracked products are drawn from the top of the unit.
Catalytic cracking has almost completely replaced thermal cracking because the former produces more gasoline with a higher octane rating as well as more-valuable by-product gases. The two common types of cat crackers are described below.
Fluid catalytic cracker (FCC). There are several proprietary FCC design configurations, but in general terms, all employ a similar mode of feedstock/catalyst interaction: The particles of heated catalyst powder behave like a fluid because they are suspended within a stream of incoming hydrocarbon feedstock (typically heavy gas oil). In this fluidlike state, the catalyst can react more easily with the feedstock, improving the speed and efficiency of the cracking process.
Hydrocracking. Though similar to FCC, hydrocracking uses hydrogen, lower temperatures, higher pressures, and different catalysts (fig. 11–10). It is more expensive and requires a lot of energy to operate. Because it adds hydrogen as it cracks the feedstock (typically heavy vacuum gas oil), it converts virtually all of that feedstock to the desired products (typically high-value gasoline, jet fuel, or middle distillates).
Fig. 11–9. Simplified cat-cracker schematic (Source: Adapted from Leffler)
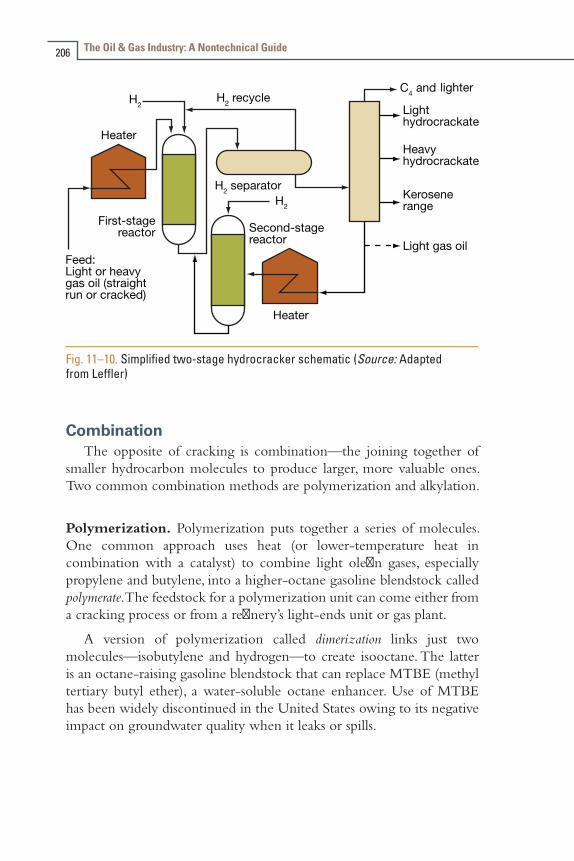
The Oil & Gas Industry: A Nontechnical Guide206
Fig. 11–10. Simplified two-stage hydrocracker schematic (Source: Adapted from Leffler)
CombinationThe opposite of cracking is combination—the joining together of
smaller hydrocarbon molecules to produce larger, more valuable ones. Two common combination methods are polymerization and alkylation.
Polymerization. Polymerization puts together a series of molecules. One common approach uses heat (or lower-temperature heat in combination with a catalyst) to combine light olefin gases, especially propylene and butylene, into a higher-octane gasoline blendstock called polymerate. The feedstock for a polymerization unit can come either from a cracking process or from a refinery’s light-ends unit or gas plant.
A version of polymerization called dimerization links just two molecules—isobutylene and hydrogen—to create isooctane. The latter is an octane-raising gasoline blendstock that can replace MTBE (methyl tertiary butyl ether), a water-soluble octane enhancer. Use of MTBE has been widely discontinued in the United States owing to its negative impact on groundwater quality when it leaks or spills.
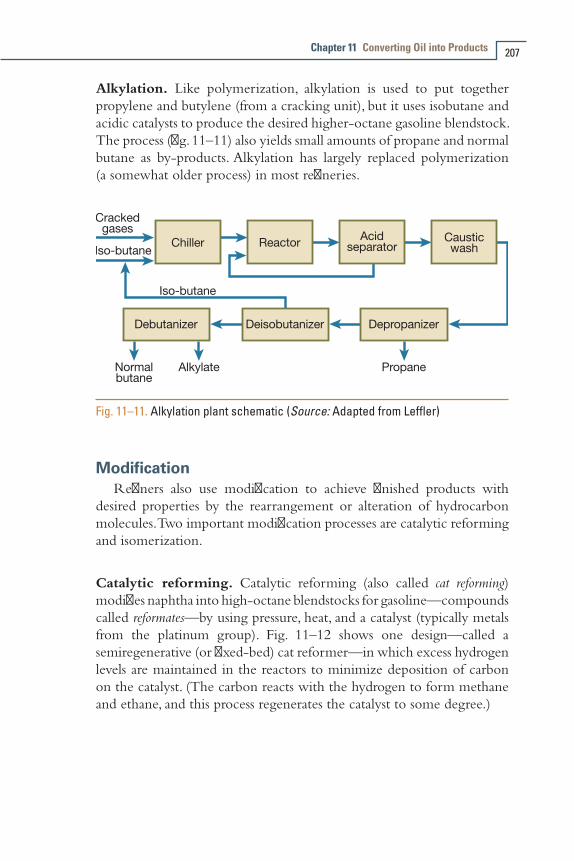
Chapter 11 Converting Oil into Products 207
Alkylation. Like polymerization, alkylation is used to put together propylene and butylene (from a cracking unit), but it uses isobutane and acidic catalysts to produce the desired higher-octane gasoline blendstock. The process (fig. 11–11) also yields small amounts of propane and normal butane as by-products. Alkylation has largely replaced polymerization (a somewhat older process) in most refineries.
Fig. 11–11. Alkylation plant schematic (Source: Adapted from Leffler)
ModificationRefiners also use modification to achieve finished products with
desired properties by the rearrangement or alteration of hydrocarbon molecules. Two important modification processes are catalytic reforming and isomerization.
Catalytic reforming. Catalytic reforming (also called cat reforming) modifies naphtha into high-octane blendstocks for gasoline—compounds called reformates—by using pressure, heat, and a catalyst (typically metals from the platinum group). Fig. 11–12 shows one design—called a semiregenerative (or fixed-bed) cat reformer—in which excess hydrogen levels are maintained in the reactors to minimize deposition of carbon on the catalyst. (The carbon reacts with the hydrogen to form methane and ethane, and this process regenerates the catalyst to some degree.)

The Oil & Gas Industry: A Nontechnical Guide208
Fig. 11–12. Semiregenerative cat reformer (Source: Adapted from Leffler)
Materials called aromatics (benzene, toluene, ethylbenzene, and isomers of xylene [BTEX]) can often be separated from reformate to use in petrochemicals or as additional gasoline blendstocks. Hydrogen is a major by-product of reforming, and the naphtha cat reformer is often the primary source of hydrogen for other uses in a refinery.
Isomerization. This is the process used to create isomers. An isomer is a molecule or compound that has the same number of atoms as another but has a different arrangement of those atoms, which produces different physical and chemical properties.
In a refinery, isomerization is used to rearrange the molecules in normal paraffins (butane, pentane, and hexane) to yield isoparaffins (isobutane, isopentane, and isohexane, respectively), which have a higher octane rating. Isobutane is used as a feedstock for alkylation (described earlier), while the other two isomers are used as gasoline blendstocks.
EnhancementIn general terms, enhancement is the use of selected processes to
remove unwanted elements or compounds from a hydrocarbon at some stage in the refinery. The most common enhancements are

Chapter 11 Converting Oil into Products 209
hydroprocessing, amine treating, solvent extraction, and sweetening, discussed in the following sections.
HydroprocessingHydroprocessing uses hydrogen to remove sulfur, nitrogen, nickel,
and vanadium from gasoline and middle distillates (kerosene, diesel, jet fuel, and heating oil). As noted earlier, the hydrogen often comes from the refinery’s naphtha cat reformer. If more is needed, then hydrogen can be generated by using steam to reform methane. Hydroprocessing is also sometimes called catalytic hydrotreating or catalytic hydrodesulfurization.
Amine treatingAlso sometimes called amine washing, this process uses amine solvents
to remove hydrogen sulfide, a highly toxic gas, from oil. (An amine is an organic compound derived from ammonia by replacing one or more hydrogen atoms with organic radicals.) The hydrogen sulfide can form during hydroprocessing. Common amine solvents are MEA (monoethanolamine) and DEA (diethanolamine).
Solvent extractionA third common enhancement process, solvent extraction is also
known as solvent recovery. At various stages in the refinery system, operators introduce a solvent into a product stream to selectively remove some component. The solvent must have two key characteristics: first, the component must dissolve completely into the solvent; second, it must be possible to easily remove the solvent/component solution from the product stream. Solvents are used in amine treating, BTEX recovery, and removal of waxes and asphalt-like molecules from the residue of a distillation tower.
SweeteningSweetening is the process used to neutralize the sulfur compound
mercaptan in gasoline and other intermediate and finished products. Mercaptan has a strong, characteristic rotten-egg smell, and sweetening oxidizes it into odorless disulfides that can remain in the fuel. This process is accomplished in a module sometimes called a merox unit.
Other enhancement processes are used to produce bitumen, lube oil, and grease. However, their description is beyond the scope of this book.

The Oil & Gas Industry: A Nontechnical Guide210
Blending/FinishingMost finished petroleum products that end up in the marketplace are
the result of blending a range of hydrocarbon molecules from a number of different processes at a refinery. Perhaps the most notable example is gasoline. As it comes from the distillation tower, straight-run gasoline has an octane rating too low to permit direct use in modern engines. Various components (blendstocks) are mixed into this gasoline to produce the gasoline sold to consumers.
Gasoline blendstocksRefiners face a challenge in choosing among blendstocks that have
different octane ratings, vapor pressures, and sulfur content. Complicating the picture, blendstocks can interact with each other in ways that further alter these parameters.
The following are the most widely used gasoline blendstocks:•FCC gasoline (i.e., the output from an FCC)
•Reformate (heavy naphtha, from the distillation tower, that has been catalytically reformed)
•Naphtha
•Alkylate (created by combining propylene and butylene from a cracking unit)
• Isomerate (isopentane and isohexane)
One important gasoline blendstock—ethanol—is added not at the refinery but downstream, typically at the storage depot of a wholesale gasoline distributor. This gives the refiner flexibility in selling its gasoline (i.e., some distributors may want to offer gasoline without ethanol in it). This practice also avoids an operational problem, because ethanol attracts water, which would contaminate gasoline moved by pipeline.
Gasoline additivesOther finishing compounds (distinct from blendstocks) are gasoline
additives, mixed into the fuel by refiners and oil companies to boost engine performance or maintain fuel quality. Common additives are detergents, dyes, antifoaming agents, emulsifiers, anti-icing agents, corrosion inhibitors, spark-plug-deposit preventers, and oxidation inhibitors.
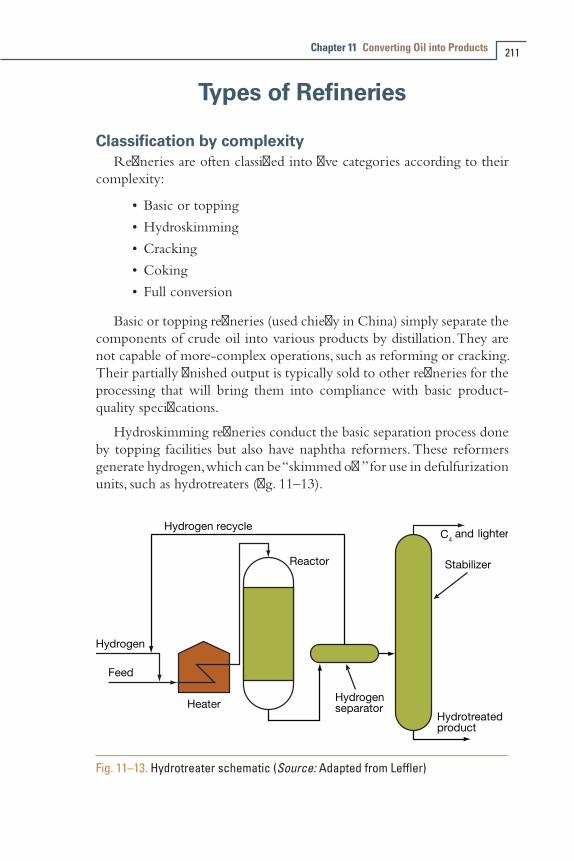
Chapter 11 Converting Oil into Products 211
Types of Refineries
Classification by complexityRefineries are often classified into five categories according to their
complexity:
•Basic or topping
•Hydroskimming
•Cracking
•Coking
•Full conversion
Basic or topping refineries (used chiefly in China) simply separate the components of crude oil into various products by distillation. They are not capable of more-complex operations, such as reforming or cracking. Their partially finished output is typically sold to other refineries for the processing that will bring them into compliance with basic product-quality specifications.
Hydroskimming refineries conduct the basic separation process done by topping facilities but also have naphtha reformers. These reformers generate hydrogen, which can be “skimmed off” for use in defulfurization units, such as hydrotreaters (fig. 11–13).
Fig. 11–13. Hydrotreater schematic (Source: Adapted from Leffler)

The Oil & Gas Industry: A Nontechnical Guide212
Cracking refineries have catalytic cracking units (e.g., an FCC or a hydrocracker) in addition to modules, such as an alkylation plant, that can increase the yield of high-value products (e.g., gasoline).
Coking refineries have the same capabilities as cracking refineries but also have cokers that can turn heavy vacuum residue into higher-value products.
A full-conversion (or complex) refinery is essentially a petrochemical plant coupled with an oil refinery. Such a facility not only has all the capabilities of a coking refinery but also has a steam cracker. This latter unit is used to produce ethylene and its major by-products (e.g., propylene). Ethylene and propylene are the building blocks for producing most plastics. Refineries have become steadily more complex as reflected in the increasing yield of gasoline and middle distillates since the 1980s.
Classification by capacityRefineries also are classified by the magnitude of their processing
capability. This capacity can be the charge capacity (the daily rate of feedstock input) or the production capacity (daily rate of final-product output). Nameplate capacity is the total amount of product that a refinery is designed to produce in a full calendar year.
Refinery Maintenance SchedulesBecause refineries are expensive to build, owners prefer to operate
them continuously. However, mechanical equipment wears out, catalysts become depleted, and new equipment must occasionally be installed; therefore, every refinery has a schedule for the performance of routine maintenance, called a turnaround. A turnaround can take as little as one day but more often lasts several weeks.
Turnarounds are typically conducted at the same time each year, in the spring and fall, when demand for all petroleum products is relatively low as compared to the winter heating season and the summer driving season. The spring turnaround is generally more extensive than the fall turnaround.
Exact turnaround dates are often published in advance, so that traders and market analysts can factor the maintenance schedules into their supply/demand projections. EIA tracks and reports capacity utilization, a measure of how close to full output U.S. refineries are operating.
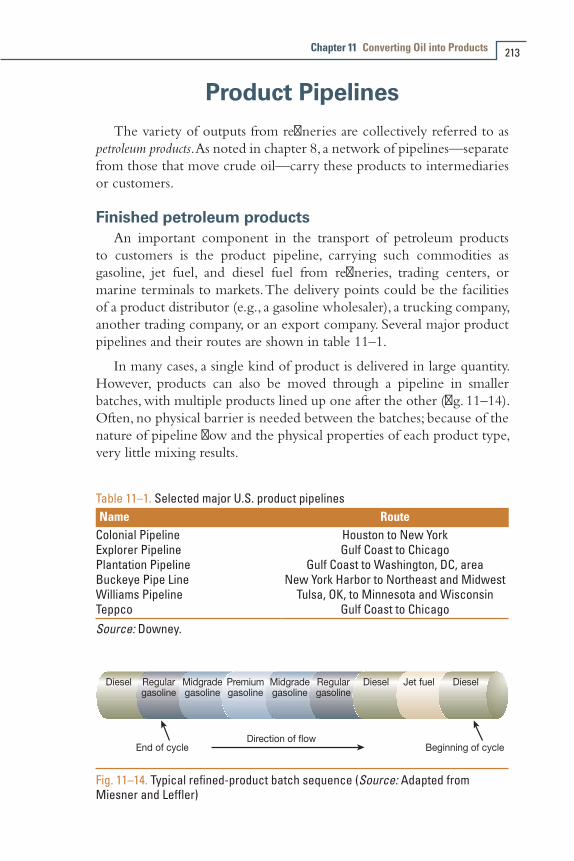
Chapter 11 Converting Oil into Products 213
Product PipelinesThe variety of outputs from refineries are collectively referred to as
petroleum products. As noted in chapter 8, a network of pipelines—separate from those that move crude oil—carry these products to intermediaries or customers.
Finished petroleum productsAn important component in the transport of petroleum products
to customers is the product pipeline, carrying such commodities as gasoline, jet fuel, and diesel fuel from refineries, trading centers, or marine terminals to markets. The delivery points could be the facilities of a product distributor (e.g., a gasoline wholesaler), a trucking company, another trading company, or an export company. Several major product pipelines and their routes are shown in table 11–1.
In many cases, a single kind of product is delivered in large quantity. However, products can also be moved through a pipeline in smaller batches, with multiple products lined up one after the other (fig. 11–14). Often, no physical barrier is needed between the batches; because of the nature of pipeline flow and the physical properties of each product type, very little mixing results.
Table 11–1. Selected major U.S. product pipelines Name Route
Colonial Pipeline Houston to New YorkExplorer Pipeline Gulf Coast to ChicagoPlantation Pipeline Gulf Coast to Washington, DC, areaBuckeye Pipe Line New York Harbor to Northeast and MidwestWilliams Pipeline Tulsa, OK, to Minnesota and WisconsinTeppco Gulf Coast to ChicagoSource: Downey.
Fig. 11–14. Typical refined-product batch sequence (Source: Adapted from Miesner and Leffler)
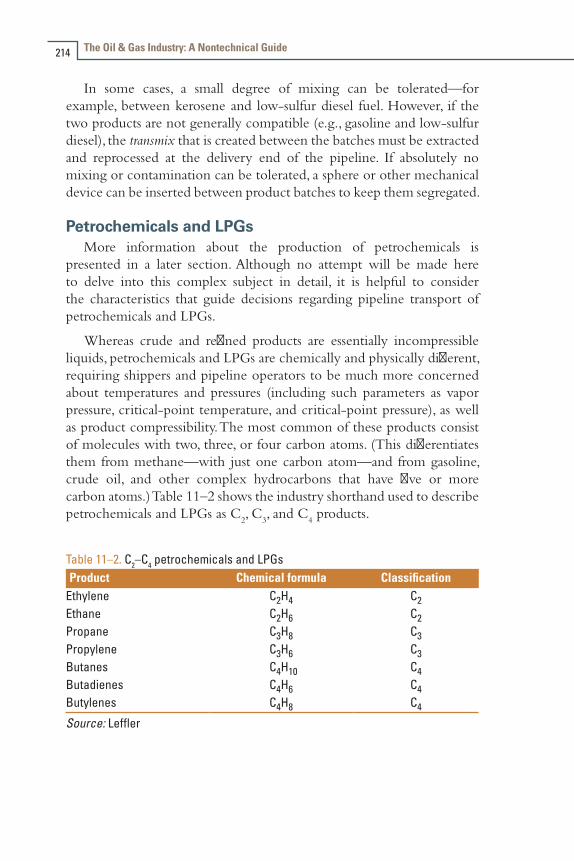
The Oil & Gas Industry: A Nontechnical Guide214
In some cases, a small degree of mixing can be tolerated—for example, between kerosene and low-sulfur diesel fuel. However, if the two products are not generally compatible (e.g., gasoline and low-sulfur diesel), the transmix that is created between the batches must be extracted and reprocessed at the delivery end of the pipeline. If absolutely no mixing or contamination can be tolerated, a sphere or other mechanical device can be inserted between product batches to keep them segregated.
Petrochemicals and LPGsMore information about the production of petrochemicals is
presented in a later section. Although no attempt will be made here to delve into this complex subject in detail, it is helpful to consider the characteristics that guide decisions regarding pipeline transport of petrochemicals and LPGs.
Whereas crude and refined products are essentially incompressible liquids, petrochemicals and LPGs are chemically and physically different, requiring shippers and pipeline operators to be much more concerned about temperatures and pressures (including such parameters as vapor pressure, critical-point temperature, and critical-point pressure), as well as product compressibility. The most common of these products consist of molecules with two, three, or four carbon atoms. (This differentiates them from methane—with just one carbon atom—and from gasoline, crude oil, and other complex hydrocarbons that have five or more carbon atoms.) Table 11–2 shows the industry shorthand used to describe petrochemicals and LPGs as C
2, C
3, and C
4 products.
Table 11–2. C2–C4 petrochemicals and LPGs Product Chemical formula Classification
Ethylene C2H4 C2Ethane C2H6 C2Propane C3H8 C3Propylene C3H6 C3Butanes C4H10 C4Butadienes C4H6 C4Butylenes C4H8 C4
Source: Leffler
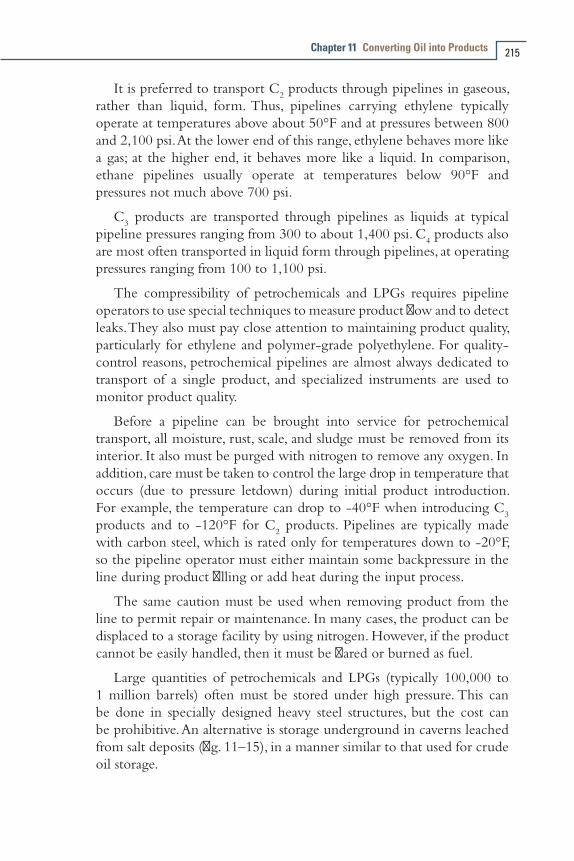
Chapter 11 Converting Oil into Products 215
It is preferred to transport C2 products through pipelines in gaseous,
rather than liquid, form. Thus, pipelines carrying ethylene typically operate at temperatures above about 50°F and at pressures between 800 and 2,100 psi. At the lower end of this range, ethylene behaves more like a gas; at the higher end, it behaves more like a liquid. In comparison, ethane pipelines usually operate at temperatures below 90°F and pressures not much above 700 psi.
C3 products are transported through pipelines as liquids at typical
pipeline pressures ranging from 300 to about 1,400 psi. C4 products also
are most often transported in liquid form through pipelines, at operating pressures ranging from 100 to 1,100 psi.
The compressibility of petrochemicals and LPGs requires pipeline operators to use special techniques to measure product flow and to detect leaks. They also must pay close attention to maintaining product quality, particularly for ethylene and polymer-grade polyethylene. For quality-control reasons, petrochemical pipelines are almost always dedicated to transport of a single product, and specialized instruments are used to monitor product quality.
Before a pipeline can be brought into service for petrochemical transport, all moisture, rust, scale, and sludge must be removed from its interior. It also must be purged with nitrogen to remove any oxygen. In addition, care must be taken to control the large drop in temperature that occurs (due to pressure letdown) during initial product introduction. For example, the temperature can drop to -40°F when introducing C
3
products and to -120°F for C2 products. Pipelines are typically made
with carbon steel, which is rated only for temperatures down to -20°F, so the pipeline operator must either maintain some backpressure in the line during product filling or add heat during the input process.
The same caution must be used when removing product from the line to permit repair or maintenance. In many cases, the product can be displaced to a storage facility by using nitrogen. However, if the product cannot be easily handled, then it must be flared or burned as fuel.
Large quantities of petrochemicals and LPGs (typically 100,000 to 1 million barrels) often must be stored under high pressure. This can be done in specially designed heavy steel structures, but the cost can be prohibitive. An alternative is storage underground in caverns leached from salt deposits (fig. 11–15), in a manner similar to that used for crude oil storage.
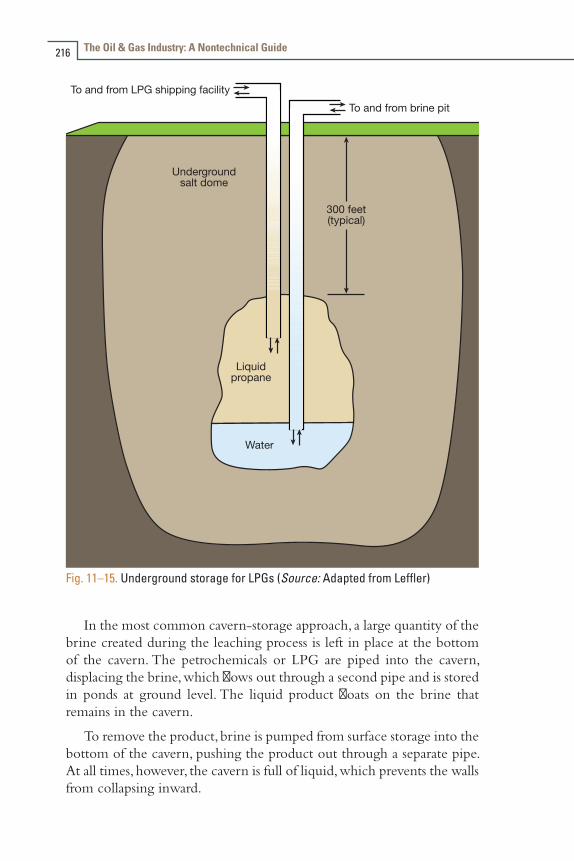
The Oil & Gas Industry: A Nontechnical Guide216
Fig. 11–15. Underground storage for LPGs (Source: Adapted from Leffler)
In the most common cavern-storage approach, a large quantity of the brine created during the leaching process is left in place at the bottom of the cavern. The petrochemicals or LPG are piped into the cavern, displacing the brine, which flows out through a second pipe and is stored in ponds at ground level. The liquid product floats on the brine that remains in the cavern.
To remove the product, brine is pumped from surface storage into the bottom of the cavern, pushing the product out through a separate pipe. At all times, however, the cavern is full of liquid, which prevents the walls from collapsing inward.
Chapter 11 Converting Oil into Products 217
Standards for Refined ProductsStandardization is essential in the creation of products from crude
oil. For example, specifications for gasoline enable the design of engines for use in vehicles and aircraft in different nations around the world. Standardization also facilitates the movement of supplies from one region to another to meet shortages, encourages competition between refineries and distributors, and lets regulator set common rules for environmental controls for various fuel types.
Key parameters for crude and refined products include the following:•Crude oil: API gravity, sulfur content, total acid number,
distillation temperature profile (DTP)
•Gasoline: octane rating, Reid vapor pressure (RVP), oxygenate/sulfur/benzene content, DTP
• Jet fuel: flash point, smoke point, freezing point, DTP
•Diesel: cetane index, cloud point, sulfur content, DTP
•Heating oil: cloud point, sulfur content, DTP
•Residual fuel oil: viscosity, sulfur content, flash point, DTP
Many industry and governmental organizations participate in the development and enforcement of standards for petroleum products. These include:
• International Organization for Standardization (ISO)
•API
•ASTM International (formerly the American Society for Testing and Materials)
• SAE International (formerly the Society of Automotive Engineers)
•Environmental Protection Agency
•European Committee for Standardization (Comité Européen de Normalisation)
• Japan Standards Association
•Canadian General Standards Board
Military organizations also participate, such as the North Atlantic Treaty Organization, the U.K. Ministry of Defense, the U.S. Navy, and the U.S. Air Force.

The Oil & Gas Industry: A Nontechnical Guide218
Petrochemicals ProductionPetrochemicals, derived from hydrocarbon molecules, account for
about 6% of total global crude oil use. They are not used directly as fuel, but instead are used to enhance certain properties of fuels or as components in the manufacture of plastics, synthetic fibers, fertilizers, and hundreds of other niche industrial and consumer products.
The primary feedstocks used to produce petrochemicals in the United States and the Middle East are two NGLs: ethane and propane. In Asia, use of heavy naphtha and light fuel oil and gas oils (diesel and heating oil) is more common.
Petrochemical feedstocks come from an oil refinery or a gas separation plant. Butanes and light naphtha can come from either kind of facility. In addition, an oil refinery can provide heavy naphtha, light fuel oils, and gas oils.
Petrochemical plants are typically built close to refineries to be near feedstock sources. In addition, by-product streams from petrochemical production often can be best utilized by returning them to a refinery for processing. These factors have led to the development of several very large integrated refining/petrochemical complexes around the world. The largest, the Reliance Refinery, is operated by Reliance Petroleum, in Jamnagar, Gujarat, India, and has the capacity to refine 1.24 million b/d of crude oil.
Steam cracking is the principal method used to produce a major class of petrochemicals called olefins. As described above, the gas or liquid feedstock is mixed with steam, is heated to a very high temperature for a brief period, and then is cooled quickly to halt any further chemical reactions. The process breaks the molecules of the feedstock, and the hydrogen in the steam bonds with the cracked molecules to form new hydrocarbon molecules.
The main output from steam cracking are the olefins ethylene and propylene, which (along with benzene) are the principal petrochemical building blocks used to make products such as consumer plastics. Ethylene can be combined (usually by using a catalyst) to create polymers such as polyethylene, polyvinyl chloride (PVC), polystyrene, and polyester. It is also used to produce ethylene glycol (for making antifreeze and fibers). Because of its versatility, global demand for ethylene is high—in the range of 100 million tons per year. Most new plants can produce 1 million tons per year.

Chapter 11 Converting Oil into Products 219
Propylene—the second most commonly produced petrochemical—is a by-product in the steam cracking of ethylene. It can also be produced in other ways: as a by-product of gas oil in FCC, through removal of hydrogen from propane, and through ethylene/butylene metathesis (a process in which molecules of the two substances switch places). Propylene is used to make polypropylene, acrylic acid, and acrylonitrile (for plastics manufacturing). The alkylation process also can convert propylene to a gasoline blendstock.
Important by-products of steam cracking for ethylene/propylene production are butadienes and butylenes. The former are used to make plastics resin and synthetic rubber; the latter are used as a gasoline blendstock and to produce the gasoline octane enhancer MTBE.
A final significant category of petrochemicals, the aromatics (collectively, BTEX), are all by-products of other processes, such as producing ethylene, reforming naphtha to produce gasoline blendstock, and producing raffinate (another gasoline blendstock) from the gas oil output from vacuum distillation. Benzene is used to make styrene and nylon; toluene is used to make solvents and urethane; and xylenes are used to make plasticizers, solvents, and gasoline octane enhancers.

Converting Natural Gas into Products
Natural gas is used in many ways in many countries around the world, as both a fuel and as a feedstock for making a range of other products.
Direct Gas Use as a FuelNatural gas is used primarily in combustion systems of various kinds
to provide a range of energy services. These include generating electric power (in boilers and gas turbines), heating and cooling buildings, and running commercial and industrial equipment (e.g., water heaters, dryers, ovens, and furnaces).
Gas is also used directly as a vehicle fuel, in the form of compressed natural gas (CNG). Every major U.S. manufacturer of heavy-duty engines offers natural gas options for use in long-haul trucks, buses, and large vehicles used for mining, waste collection, and construction. Medium-duty vehicles—such as delivery trucks and airport shuttles—can use CNG instead of gasoline or diesel, as can light-duty vehicles (cars, light trucks, and taxis), chiefly in fleet operations. LNG has also been proved feasible for use in locomotives, ships, and tugboats.
Figure 3–9, in chapter 3, shows how much natural gas has been used in recent years in various sectors of the U.S. economy. In 2009, natural gas provided about 24% of total U.S. energy needs, and slightly more than half of all U.S. homes that year used natural gas as their main heating fuel.
12

The Oil & Gas Industry: A Nontechnical Guide222
Gas as a Petrochemical FeedstockAs noted in chapter 7 (see the “Gas Processing Operations” section),
three commercially important chemicals are extracted from natural gas before the gas is sent to customers. These are ethane, propane, and butane.
EthaneEthane is used as a raw material in the petrochemical industry. It is
processed to make ethylene and polyethylene—two building blocks for manufacturing many other products.
Ethylene is used in the manufacture of vinyl acetate (for use in paints and adhesives), polystyrene (used to make resins for rubber), and ethanol; it is also used to make ethylene oxide, which is itself a raw material for the production of ethylene glycol (antifreeze), as well as polyester fibers, film, and latex paints. Ethylene also can be combined with chlorine to yield vinyl chloride, which is used to make PVC, now widely used as a piping material.
Polyethylene is a plastic used in a variety of products. These include housewares, insulation, packaging films, and toys.
Propane and butaneIf demand is low and the cost of recovery is high, propane and butane
are simply flared or burned as fuel within a refinery. However, they also can be recovered and sold separately or as LPG in pressurized containers for cooking, heating, and some vehicle applications (e.g., forklifts). Butane is a main fuel source for many developing countries and is also used as a fuel for cigarette lighters.
Propane and butane are also used to manufacture propylene and butylene, two important chemical building blocks. Propylene is used to make propylene oxide (used to sterilize medical equipment and food products and to manufacture detergents), as well as propylene glycol (used in skin care lotions, industrial antifreeze, and hydraulic and brake fluid). Butylene is used in manufacturing additives that improve the quality of gasoline.
Chapter 12 Converting Natural Gas into Products 223
Gas-to-Liquids TechnologyA process first developed in the 1920s by German scientists Franz
Fischer and Hans Tropsch laid the foundation for a modern technology that converts natural gas directly into liquid fuels. The new gas-to-liquids (GTL) technology is the proprietary Shell Middle Distillate Synthesis process, developed by Royal Dutch Shell. Proved earlier at commercial scale at a Shell facility in Malaysia, the process has been scaled up to build the Pearl GTL plant in Ras Laffan Industrial City, in Qatar, which began commercial operation in mid-2011. The huge complex, with two production trains, is a joint venture with Qatar Petroleum. It will convert 1.6 bcf of natural gas per day from the giant offshore North Field into a variety of fuels and lubricants. In mid-June 2011, the joint venture announced sale of the first commercial shipment of GTL gas oil from the plant.
After removal of water, condensates, and NGLs, the purified natural gas (methane) is routed to a high-temperature gasifier. In that unit, the methane and oxygen are converted into syngas, a mix of hydrogen and carbon monoxide. Flowing through a series of vessels, the syngas then reacts with catalysts to form long-chain hydrocarbons that are subsequently broken into a range of smaller molecules to yield five products:
•GTL naphtha, a high-paraffin petrochemical feedstock
•GTL kerosene, for blending into aviation fuel
•GTL normal paraffins, for use in detergent production
•GTL gas oil, a diesel-type automotive fuel
•GTL base oils, for use in lubricants
Shell has reported that the $19 billion plant, which took five years to build, incorporates 35 years of research into the conversion process. At full production (slated for mid-2012), the plant is expected to produce 120,000 b/d of condensate, LPG, and ethane, plus 140,000 b/d of the five GTL products listed above.
GTL is seen as a potential alternative to LNG technology as a way to monetize natural gas resources. At a global level, GTL is still an emerging industry with a limited number of commercial plants operating, but several others were in planning or engineering stages as of mid-2010 (table 12–1).
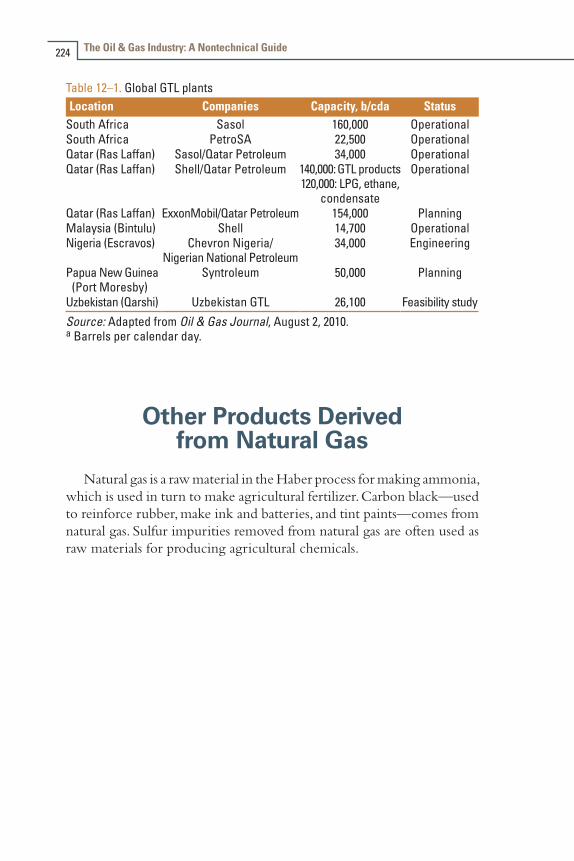
The Oil & Gas Industry: A Nontechnical Guide224
Table 12–1. Global GTL plantsLocation Companies Capacity, b/cda Status
South Africa Sasol 160,000 OperationalSouth Africa PetroSA 22,500 OperationalQatar (Ras Laffan) Sasol/Qatar Petroleum 34,000 OperationalQatar (Ras Laffan) Shell/Qatar Petroleum 140,000: GTL products
120,000: LPG, ethane, condensate
Operational
Qatar (Ras Laffan) ExxonMobil/Qatar Petroleum 154,000 PlanningMalaysia (Bintulu) Shell 14,700 OperationalNigeria (Escravos) Chevron Nigeria/
Nigerian National Petroleum34,000 Engineering
Papua New Guinea (Port Moresby)
Syntroleum 50,000 Planning
Uzbekistan (Qarshi) Uzbekistan GTL 26,100 Feasibility studySource: Adapted from Oil & Gas Journal, August 2, 2010. a Barrels per calendar day.
Other Products Derived from Natural Gas
Natural gas is a raw material in the Haber process for making ammonia, which is used in turn to make agricultural fertilizer. Carbon black—used to reinforce rubber, make ink and batteries, and tint paints—comes from natural gas. Sulfur impurities removed from natural gas are often used as raw materials for producing agricultural chemicals.

Petroleum Industry Structure
Chapters 3–12 focused on the technologies and methods used by the petroleum industry to find, develop, produce, and upgrade oil and natural gas; to refine or otherwise transform it into useful products; and to store and move these vital fuels and their derivatives through the value chain and to the energy consumer.
The final section of this book (chaps. 13–15) changes focus, to discuss in broad terms several topics related to the business aspects of industry operations.
This chapter examines the structure of the industry, focusing on the kinds of companies and organizations involved in producing and refining crude oil. (Chapter 8 presented similar information about natural gas pipeline companies.)
Chapter 14 outlines some of the basic market and trading mechanisms and practices used to bring oil and natural gas to consumers. Chapter 15 suggests some of the major challenges that the industry may face in coming decades.
Major Oil and Gas ProducersThe obvious place to start in examining the structure of the
petroleum industry is the upstream side of the business (fig. 13–1)—that is, the companies that search for, develop, and extract oil and gas. Understanding the historical context is helpful, in view of the significant changes that have occurred over the past four or five decades; the next sections present a brief review. (For a more complete history of the industry, see, e.g., Yergin, 1991.)
13
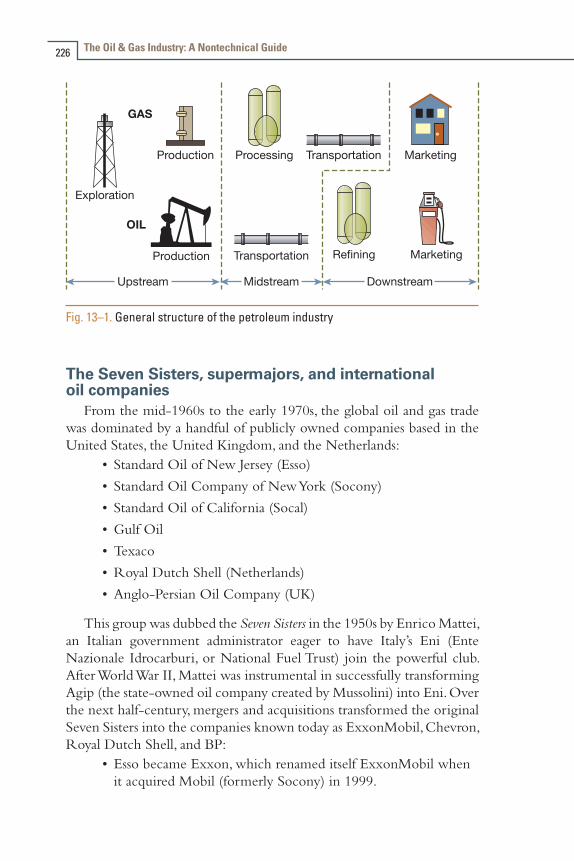
The Oil & Gas Industry: A Nontechnical Guide226
Fig. 13–1. General structure of the petroleum industry
The Seven Sisters, supermajors, and international oil companies
From the mid-1960s to the early 1970s, the global oil and gas trade was dominated by a handful of publicly owned companies based in the United States, the United Kingdom, and the Netherlands:
• Standard Oil of New Jersey (Esso)
• Standard Oil Company of New York (Socony)
• Standard Oil of California (Socal)
•Gulf Oil
•Texaco
•Royal Dutch Shell (Netherlands)
•Anglo-Persian Oil Company (UK)
This group was dubbed the Seven Sisters in the 1950s by Enrico Mattei, an Italian government administrator eager to have Italy’s Eni (Ente Nazionale Idrocarburi, or National Fuel Trust) join the powerful club. After World War II, Mattei was instrumental in successfully transforming Agip (the state-owned oil company created by Mussolini) into Eni. Over the next half-century, mergers and acquisitions transformed the original Seven Sisters into the companies known today as ExxonMobil, Chevron, Royal Dutch Shell, and BP:
•Esso became Exxon, which renamed itself ExxonMobil when it acquired Mobil (formerly Socony) in 1999.
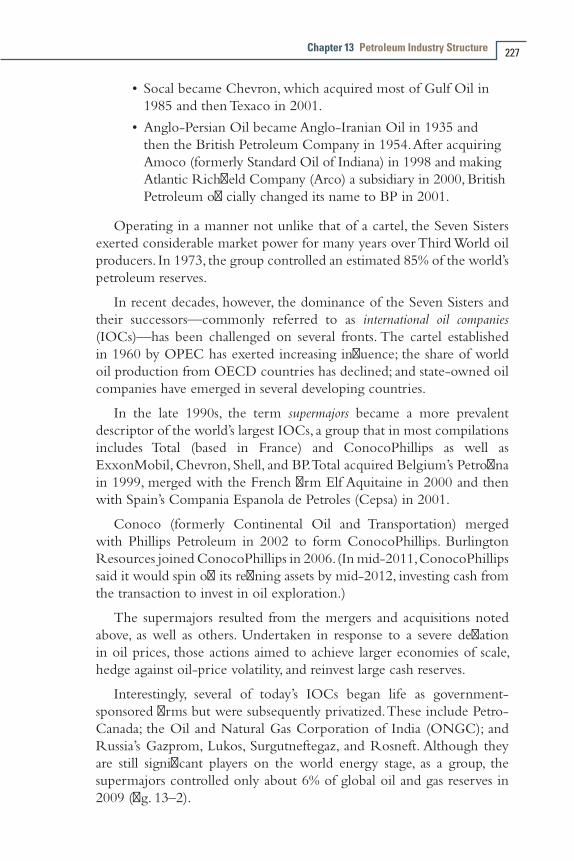
Chapter 13 Petroleum Industry Structure 227
• Socal became Chevron, which acquired most of Gulf Oil in 1985 and then Texaco in 2001.
•Anglo-Persian Oil became Anglo-Iranian Oil in 1935 and then the British Petroleum Company in 1954. After acquiring Amoco (formerly Standard Oil of Indiana) in 1998 and making Atlantic Richfield Company (Arco) a subsidiary in 2000, British Petroleum officially changed its name to BP in 2001.
Operating in a manner not unlike that of a cartel, the Seven Sisters exerted considerable market power for many years over Third World oil producers. In 1973, the group controlled an estimated 85% of the world’s petroleum reserves.
In recent decades, however, the dominance of the Seven Sisters and their successors—commonly referred to as international oil companies (IOCs)—has been challenged on several fronts. The cartel established in 1960 by OPEC has exerted increasing influence; the share of world oil production from OECD countries has declined; and state-owned oil companies have emerged in several developing countries.
In the late 1990s, the term supermajors became a more prevalent descriptor of the world’s largest IOCs, a group that in most compilations includes Total (based in France) and ConocoPhillips as well as ExxonMobil, Chevron, Shell, and BP. Total acquired Belgium’s Petrofina in 1999, merged with the French firm Elf Aquitaine in 2000 and then with Spain’s Compania Espanola de Petroles (Cepsa) in 2001.
Conoco (formerly Continental Oil and Transportation) merged with Phillips Petroleum in 2002 to form ConocoPhillips. Burlington Resources joined ConocoPhillips in 2006. (In mid-2011, ConocoPhillips said it would spin off its refining assets by mid-2012, investing cash from the transaction to invest in oil exploration.)
The supermajors resulted from the mergers and acquisitions noted above, as well as others. Undertaken in response to a severe deflation in oil prices, those actions aimed to achieve larger economies of scale, hedge against oil-price volatility, and reinvest large cash reserves.
Interestingly, several of today’s IOCs began life as government-sponsored firms but were subsequently privatized. These include Petro-Canada; the Oil and Natural Gas Corporation of India (ONGC); and Russia’s Gazprom, Lukos, Surgutneftegaz, and Rosneft. Although they are still significant players on the world energy stage, as a group, the supermajors controlled only about 6% of global oil and gas reserves in 2009 (fig. 13–2).
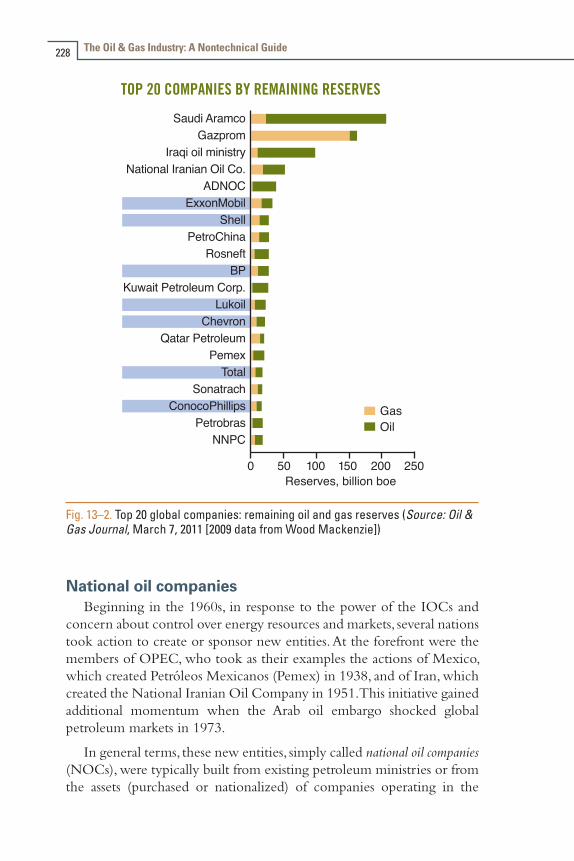
The Oil & Gas Industry: A Nontechnical Guide228
Fig. 13–2. Top 20 global companies: remaining oil and gas reserves (Source: Oil & Gas Journal, March 7, 2011 [2009 data from Wood Mackenzie])
National oil companiesBeginning in the 1960s, in response to the power of the IOCs and
concern about control over energy resources and markets, several nations took action to create or sponsor new entities. At the forefront were the members of OPEC, who took as their examples the actions of Mexico, which created Petróleos Mexicanos (Pemex) in 1938, and of Iran, which created the National Iranian Oil Company in 1951. This initiative gained additional momentum when the Arab oil embargo shocked global petroleum markets in 1973.
In general terms, these new entities, simply called national oil companies (NOCs), were typically built from existing petroleum ministries or from the assets (purchased or nationalized) of companies operating in the

Chapter 13 Petroleum Industry Structure 229
country. Solely owned and operated by their respective governments, NOCs conducted their business with much less transparency than did the IOCs.
The following are examples of NOCs founded in this way, along with the date(s) of creation:
• Sonatrach (Algeria), 1963–71
•Libyan National Oil, 1968–70
• Saudi Arabian Oil (Saudi Aramco), 1973–80
•Abu Dhabi National Oil, 1971
•Petroliam Nasional Berhad (Petronas), Malaysia, 1974
•Petróleos de Venezuela (PdVSA), 1975
•Kuwait National Petroleum, 1975
•Nigerian National Petroleum, 1977
In 2011, approximately 88% of global oil and gas reserves were controlled by state-owned oil companies, primarily located in the Middle East.
Hybrid companiesA third kind of major petroleum company became more prominent
starting about 2000. This hybrid entity, part public and part government owned, is sometimes referred to as a government-sponsored enterprise (GSE). Examples include the following:
•Petroleo Brasileiro SA (Petrobras) (Brazil)
•OMV Petrom (Romania)
• Statoil-Hydro (Norway), now Statoil
In the late 1990s, China began a major restructuring of its energy industries to transform the formerly state-owned China National Petroleum Corporation (CNPC)—which focused on domestic exploration and production—and the China Petroleum and Chemical Corporation (Sinopec)—which managed petroleum refining and distribution. The goal was to transfer some of the assets of the two corporations into vertically integrated firms that would be jointly owned by the government and investors. The entities that emerged from this reorganization are the China National Offshore Oil Corporation (CNOOC), Sinopec itself, and PetroChina, which is a spin-off of CNPC.
A report by IEA in early 2011 indicated that Chinese oil companies operate with a high degree of independence from the government. By

The Oil & Gas Industry: A Nontechnical Guide230
late 2010, Chinese oil companies had equity oil (i.e., control over the disposition of their share of production) in 20 of the 31 countries where they operated.
Even though GSEs are structured like private-sector corporations, the factors shaping their behavior are complex. Investors (and governments) expect them to be profitable, but they also must serve national interests (e.g., securing oil imports and/or developing domestic energy resources). For example, Norway’s Statoil had approval to leverage its expertise in deepwater development technology to pursue projects (alone or in partnerships) in other regions.
Independent ProducersIndependent producers, also called independents, are smaller and not
vertically integrated in the way that many IOCs, NOCs or GSEs are. Independents play a significant role in the upstream oil and gas business, operating chiefly in the United States but in several foreign countries as well.
Independents receive nearly all of their revenues from production at the wellhead. Chiefly in the exploration and production side of the petroleum business, they engage in little marketing or refining activity. For a U.S. firm to be considered an independent producer, Internal Revenue Service regulations stipulate that its refining capacity must average less than 75,000 b/d or its retail sales must be less than $5 million per year.
A variety of organizations represent the interests of independent producers. Operating at the national level is the Independent Petroleum Association of America (IPAA).
However, many state and regional groups provide similar support. One example is the Petroleum Technology Transfer Council (PTTC), which lists as members more than 40 state/regional producer organizations, including producers and royalty owners associations; oil and gas associations; landowners associations; petroleum councils; marginal well commissions; and alliances of energy producers. PTTC is a national not-for-profit organization founded in 1994 and managed by the American Association of Petroleum Geologists. PTTC seeks “to connect independents with the technology and knowledge to safely and responsibly develop the nation’s oil and gas resources.”1

Chapter 13 Petroleum Industry Structure 231
Through interactions with PTTC, their regional associations, and various research organizations (e.g., Gas Research Institute, now GTI), independent producers have also helped to develop and evaluate important new technologies (e.g., horizontal drilling and hydraulic fracturing) for improved exploitation of petroleum resources.
IPAA commissioned a study by IHS Global Insight (USA) evaluating the role of independents in the U.S. economy.2 The study looked only at the upstream sector, evaluating the activities of 18,000 independent producers operating in 32 states. It found that for the year 2010, these independents:
•Drilled 95.3% of onshore and 69.7% of offshore oil and gas wells
•Produced 86.3% of onshore U.S. natural gas and 69.4% of offshore production
•Operated most U.S. marginal wells (yielding less than 16 boe per day), which account for some 80% of the nation’s 800,000 producing wells
IPAA reported that independents hold 80% of the shallow-water leases in the Gulf of Mexico, and 75% of deepwater leases. They highlighted that independents play a larger role both in the Lower 48 states and in near-offshore areas, as IOCs and large integrated producers pursue development of larger fields in frontier areas, such as ultra-deepwater.
Prominent publicly held U.S.-based independent oil and gas producers include the firms Anadarko Petroleum, Barrett Resources, Cabot Oil and Gas, Chesapeake Energy, Devon Energy, EOG Resources, Forest Oil, Harvest Natural Resources, Noble Energy, Plains Exploration and Production, Quicksilver Resources, Swift Energy, Ultra Petroleum, and Ward Petroleum Group.
Independents based in other countries are also exerting an impact on global oil and gas production. Major foreign-based independents include Bankers Petroleum, Petrobank Energy and Resources, Talisman Energy, and Vermillion Resources (Canada); British Gas and Cairn Energy (UK); Carnarvon Petroleum and Nido Petroleum (Australia); Maersk Oil (Denmark); and Japex (Japan). To that list must now be added Melbourne, Australia–based BHP Billiton, the world’s largest mining company, which in July 2011 agreed to buy U.S. independent Petrohawk Energy for $12.1 billion; Petrohawk was a major player in U.S. shale gas development.

The Oil & Gas Industry: A Nontechnical Guide232
Service CompaniesOil and gas producers large and small typically turn to specialty firms,
called service companies, to conduct the hands-on work of building and operating drilling rigs. Service companies provide lubricants, other fluids/materials, and pumps and other equipment, as well as the expertise and tools needed to assess formation characteristics and well performance. As the price of oil goes up (as it did in 2010–11), demand for oil field services rises as well.
The Financial Times prepares an annual list of the world’s biggest companies, called the FT Global 500. In the oil equipment and services sector, eight companies made the list for 2011 (table 13–1). A major service company that did not make the list is Weatherford International, based in Switzerland.
National Oilwell Varco made the biggest jump in the listing for 2011 (table 13–1), based in part on its provision of equipment needed for hydraulic fracturing of shale to extract oil and gas. Such technology found extensive use in the United States and elsewhere in 2010 and 2011. In fact, oil field service companies were instrumental in pioneering the technique of horizontal drilling to extract gas and oil from shale.
Service companies apply specialized skills and technology to help halt declining output from producing fields, maintain aging wells and related equipment, or search for hydrocarbons in challenging environments.
Table 13–1. FT Global 500, oil equipment and services, 2010–11
CompanyGlobal rank 2011 market value,a
billion USD2011 2010Schlumberger (US) 41 71 126.8Halliburton (US) 176 279 45.5National Oilwell Varco (US) 262 478 33.4Baker Hughes (US) 274 — 31.9TransCanada (Canada) 321 312 28.3Transocean (US) 363 273 25.2Enbridge (Canada) 390 438 23.6Saipem (Italy) 391 474 23.5Source: Adapted from the Financial Times, 2011 FT Global 500 list. a Market values in U.S. dollars as of March 31, 2011, based on data from Thomson ONE Banker, Thomson Reuters Datastream, and individual companies.

Chapter 13 Petroleum Industry Structure 233
IOC-NOC InteractionsAs IOCs and NOCs (as well as hybrid GSEs) pursue their various
business and political interests, new kinds of relationships are developing. This is driven by the recognition that NOCs now are estimated to control more than 85% of global oil and gas reserves. Some NOCs rival the majors in size and scope and even compete directly with IOCs for access to reserves. Complicating the situation, other players—including major oil field services firms, private equity firms, sovereign wealth funds, and third-party energy marketers—have taken on roles previously dominated by IOCs.
A 2009 analysis by Ernst and Young postulated that this new reality has shifted the power structure of the global petroleum industry, so that IOCs must now convince NOCs and host governments that they can provide value beyond just finding and producing oil and gas.3 Particularly in the planning and execution of expensive, complex, high-risk megaprojects, IOCs offer vertically integrated skills, knowledge, and technology that can help resource-rich countries to capitalize on their hydrocarbon reserves. Industry experts have predicted that global capital spending on new projects could reach $400 billion during 2008–15, with much of it slated for megaprojects typically costing $5 billion each. The challenge, according to Ernst and Young, will be to customize their offerings to address the unique needs, beyond exploration and production, of NOCs. This may include training a local workforce, developing related processing and delivery infrastructure, and assisting with other economic development efforts.
Energy industry news from late 2009 to mid-2011 was replete with examples of the ways in which IOCs, NOCs, and other players are interacting. The following are a select few:
•Major Abu Dhabi sovereign wealth fund (Ipic) announced a plan to take full ownership of Cepsa, Spain’s second-largest oil company, buying the stake previously held by France’s Total.
•BP negotiated (unsuccessfully) with Russia during early 2011 on a $16 billion deal that would have given BP access to Russia’s Arctic oil fields and would have authorized BP and state-owned Rosneft to swap shares.
• Shell and Russia’s Gazprom formed an alliance to strengthen cooperation on projects in Russia and work together in other nations.
The Oil & Gas Industry: A Nontechnical Guide234
• Shell signed a $12.5 billion agreement with Iraq to capture flared gas from that country’s oil fields. Mitsubishi announced that they would also participate in the project.
•Korea National Oil signed a $1.5 billion deal with U.S. firm Anadarko for one-third of the latter’s interest in part of the Eagle Ford shale formation (Texas).
•Thailand’s biggest oil company, PTT Exploration and Production, paid $2.3 billion to Statoil for a 40% stake in a Canadian oil-sands project.
•Companies expecting to start drilling in 2011 off Cuba included Venezuela’s PdVSA (using a drilling rig built in China), Spain’s Repsol YPF, Malaysia’s Petronas, Russia’s Gazprom, and India’s ONGC.
•Occidental Petroleum won the lead contract to develop the Shah sour gas project in the United Arab Emirates, sharing a stake with Abu Dhabi National Oil.
•BP signed a 30-year production-sharing deal with Socar (Azerbaijan’s NOC) to develop the Shafaq-Asiman offshore gas field, southeast of Baku.
•TNK-BP, the Russian venture half-owned by BP, agreed to pay $1.8 billion to buy BP’s pipeline and production assets in Venezuela and Vietnam.
China’s global outreach has been particularly striking in recent years. An assessment for the Financial Times showed that from January through early November 2010, that country’s national oil companies spent more than $24 billion on overseas acquisitions—accounting for 20% of all global deals in the upstream oil and gas sector for the period.4 An analysis by Wood Mackenzie concluded that China’s three largest NOCs would realize a record one million boe/day in net overseas oil and gas production in 2010.5
China’s initiatives from late 2010 to mid-2011 included the following:•PetroChina agreed to pay $5.4 billion for a 50% stake in the
Cutback Ridge shale gas project of Encana in western Canada. (It is China’s largest investment in shale gas to date).
•PetroChina and Sinopec spent $1.9 billion and $4.65 billion, respectively, for stakes in Canadian oil sands projects.

Chapter 13 Petroleum Industry Structure 235
•PetroChina acquired a 50% stake in major private UK chemicals production firm Ineos to refine and trade oil at Scottish and French refineries.
•CNPC won a bid to expand an oil refinery in Cuba (a $6 billion deal) that is jointly owned by PdVSA (Venezuela) and Cubapetroleo.
•CNPC agreed to buy Occidental Petroleum’s operations in Argentina for $2.45 billion.
•CNOOC (China’s largest offshore oil and gas producer) signed two deals with Chesapeake Energy, each worth just over $1 billion, regarding U.S. acreage holding shale oil and gas resources.
•CNOOC and Bridas Energy Holdings (a private Argentine company) agreed to pay $7 billion for BP’s 60% stake in Argentina’s Pan American Energy. (CNOOC previously bought a 50% stake in Bridas for $3.1 billion.)
• Sinochem submitted the winning $3.1 billion bid for a share of the Peregrino oil field off the coast of Brazil.
• Statoil worked to finalize a deal to explore for shale gas in China as Sinopec and PetroChina also sought help from BP, Chevron, and Shell to develop domestic shale gas.
OPECOPEC is a major force in the global trade of crude oil. The
organization marked its 50th anniversary in 2011. Typically OPEC meets twice each year to assess current and projected world oil supply/demand and prices, as well as to coordinate the actions of its members in regard to production and pricing.
OPEC’s mission is to “coordinate and unify the petroleum policies of its Member Countries and ensure the stabilization of oil markets in order to secure an efficient, economic and regular supply of petroleum to consumers, a steady income to producers and a fair return on capital for those investing in the petroleum industry.”6
OPEC has historically used both pricing and production controls to achieve its goals. This entailed establishing an official posted price for
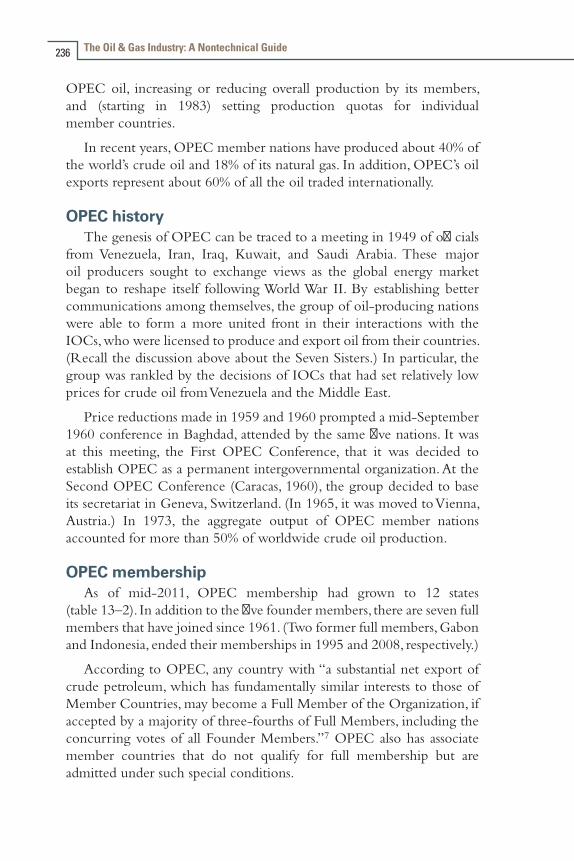
The Oil & Gas Industry: A Nontechnical Guide236
OPEC oil, increasing or reducing overall production by its members, and (starting in 1983) setting production quotas for individual member countries.
In recent years, OPEC member nations have produced about 40% of the world’s crude oil and 18% of its natural gas. In addition, OPEC’s oil exports represent about 60% of all the oil traded internationally.
OPEC historyThe genesis of OPEC can be traced to a meeting in 1949 of officials
from Venezuela, Iran, Iraq, Kuwait, and Saudi Arabia. These major oil producers sought to exchange views as the global energy market began to reshape itself following World War II. By establishing better communications among themselves, the group of oil-producing nations were able to form a more united front in their interactions with the IOCs, who were licensed to produce and export oil from their countries. (Recall the discussion above about the Seven Sisters.) In particular, the group was rankled by the decisions of IOCs that had set relatively low prices for crude oil from Venezuela and the Middle East.
Price reductions made in 1959 and 1960 prompted a mid-September 1960 conference in Baghdad, attended by the same five nations. It was at this meeting, the First OPEC Conference, that it was decided to establish OPEC as a permanent intergovernmental organization. At the Second OPEC Conference (Caracas, 1960), the group decided to base its secretariat in Geneva, Switzerland. (In 1965, it was moved to Vienna, Austria.) In 1973, the aggregate output of OPEC member nations accounted for more than 50% of worldwide crude oil production.
OPEC membershipAs of mid-2011, OPEC membership had grown to 12 states
(table 13–2). In addition to the five founder members, there are seven full members that have joined since 1961. (Two former full members, Gabon and Indonesia, ended their memberships in 1995 and 2008, respectively.)
According to OPEC, any country with “a substantial net export of crude petroleum, which has fundamentally similar interests to those of Member Countries, may become a Full Member of the Organization, if accepted by a majority of three-fourths of Full Members, including the concurring votes of all Founder Members.”7 OPEC also has associate member countries that do not qualify for full membership but are admitted under such special conditions.
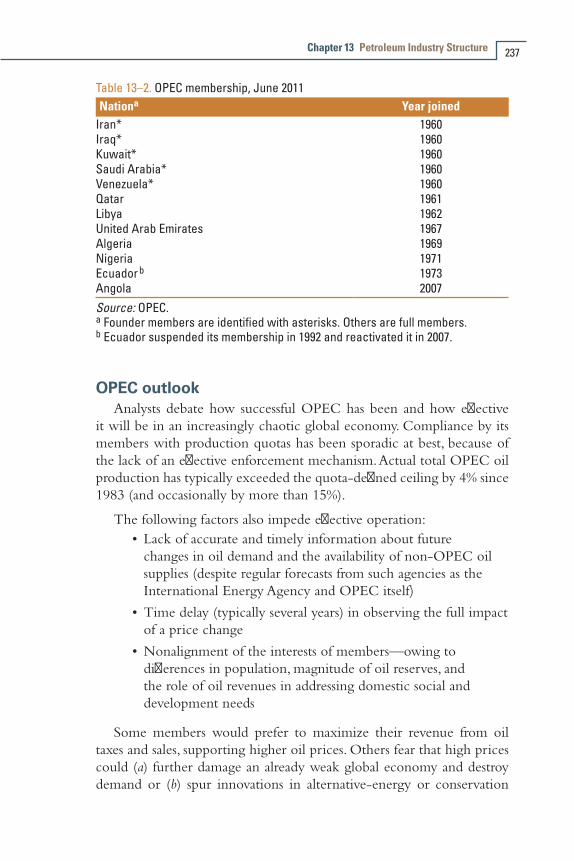
Chapter 13 Petroleum Industry Structure 237
Table 13–2. OPEC membership, June 2011Nationa Year joined
Iran* 1960Iraq* 1960Kuwait* 1960Saudi Arabia* 1960Venezuela* 1960Qatar 1961Libya 1962United Arab Emirates 1967Algeria 1969Nigeria 1971Ecuador b 1973Angola 2007Source: OPEC. a Founder members are identified with asterisks. Others are full members. b Ecuador suspended its membership in 1992 and reactivated it in 2007.
OPEC outlookAnalysts debate how successful OPEC has been and how effective
it will be in an increasingly chaotic global economy. Compliance by its members with production quotas has been sporadic at best, because of the lack of an effective enforcement mechanism. Actual total OPEC oil production has typically exceeded the quota-defined ceiling by 4% since 1983 (and occasionally by more than 15%).
The following factors also impede effective operation:•Lack of accurate and timely information about future
changes in oil demand and the availability of non-OPEC oil supplies (despite regular forecasts from such agencies as the International Energy Agency and OPEC itself)
•Time delay (typically several years) in observing the full impact of a price change
•Nonalignment of the interests of members—owing to differences in population, magnitude of oil reserves, and the role of oil revenues in addressing domestic social and development needs
Some members would prefer to maximize their revenue from oil taxes and sales, supporting higher oil prices. Others fear that high prices could (a) further damage an already weak global economy and destroy demand or (b) spur innovations in alternative-energy or conservation

The Oil & Gas Industry: A Nontechnical Guide238
technologies. Members with relatively modest reserves express concern that high production rates would deplete their petroleum legacy too rapidly.
Also affecting the success of OPEC are geopolitical disruptions and other unanticipated events. Examples include:
•Military conflict—in particular, the 1973 Arab-Israeli War (1973) and the Persian Gulf Wars (begun in 1990 and 2003)
• Surge in Asian oil demand, which tightened oil markets in 2005
•Political protests—from Tunisia and Egypt to Libya and Syria—in the “Arab Spring” uprisings of 2011 (see below)
In recent years, signs of internal OPEC discord have begun to emerge, reflecting the changing political priorities and economic fortunes of several prominent members. A key issue for OPEC is the timing and scope of Iraq’s planned return to significant oil production levels. By some estimates, with the help from foreign firms, Iraq could raise its output to 12–14 million b/d, compared to just 2.5 million in 2010.
Such a major increase could lead OPEC leaders to hold down overall production (aiming to prevent an oil price drop), reducing production quotas for other OPEC members, to “make room for” Iraqi output. (Iraq has not had an OPEC production quota since Saddam Hussein’s regime invaded Kuwait in 1990.)
At the June 2011 OPEC meeting in Vienna, a “lack of harmony” was on display, as reported in The Economist.8 Considering a proposal to increase production by 1.5 million b/d, members split evenly, so quotas remained at the levels set in December 2008. The price of Brent crude spiked on the news, hitting $118.43 per barrel.
Those arguing for higher production pointed to the loss of about 1.2 million b/d from Libya, where civil unrest continued after flaring in February. Others asserted that a continued high oil price was needed to generate revenues needed to help governments shelter citizens against sharply rising costs of food and other commodities.
On the one hand, the cartel noted that the devastating March 2011 earthquake and resultant tsunami in Japan drove down oil demand midyear, as did continuing economic uncertainty in the United States and elsewhere. On the other hand, the continued growth of China’s economy partially offset downturns in oil demand elsewhere.

Chapter 13 Petroleum Industry Structure 239
Further confounding the June 2011 discussions were the following:• Information suggesting possible softening of global oil demand
through 2012, which would negate the need for more supply
• Ill will due to Qatari support of rebel fighters in Libya and Saudi support of Bahrain’s suppression of a Shiite uprising (which angered Shiite Iran)
Energy markets and political dynamics will, of course, continue to evolve in coming years. Some observers of recent events suggest that OPEC’s power may be waning and that non-OPEC nations (e.g., Russia and Kazakhstan) could be poised to take a more prominent role on the world energy stage. At the same time, the following must be acknowledged:
•OPEC members produce a significant share of daily global oil output.
• Several OPEC members (particularly Saudi Arabia) have sufficient spare capacity to vary production and thereby shape the market.
In fact, just days before the June 2011 OPEC meeting, Saudi Aramco said it would speed development of the supergiant Manifa oil field, aiming to produce at its maximum rate (900,000 b/d) by 2014—a decade earlier than previously planned. Furthermore, a week after the meeting, the government said it would boost total national production to more than 10 million b/d by July—the highest level in 25 years and close to the kingdom’s total production capacity of 12.5 million b/d.
In a mid-2011 analysis, EIA projected that the OPEC share of total global crude and liquid fuels production would increase slightly in the near term, from 40.5% in 2010 to 40.9% in 2011 (table 13–3). Economic, technical, and political factors still to emerge will certainly shape OPEC’s role in the years beyond that time frame.
Table 13–3. Global crude oil and liquid fuels supply, 2010–2012
GroupProduction, million b/d % of total world2010 2011 2012 2010 2011 2012
Non-OPEC nations 51.70 52.29 52.78 59.5 59.6 59.1OPEC nations: Crude oil only 29.77 29.40 30.06 34.3 33.5 33.7 Other liquids 5.39 6.00 6.44 6.2 6.8 7.2OPEC total 35.16 35.40 36.50 40.5 40.4 40.9World total 86.86 87.69 89.28Source: EIA, Short Term Energy Outlook, June 7, 2011; adapted from table 3a.
The Oil & Gas Industry: A Nontechnical Guide240
RefinersEIA reported that there were 142 operable refineries in the United
States as of June 2011 (tables 13–4 and 13–5). Of those, 114 had a capacity of at least 25,000 barrels per calendar day (b/cd); all of the top 65 have capacities of at least 100,000 b/cd. Many of the largest are owned by well-known IOCs—the largest, in Baytown, Texas, by ExxonMobil.
Total U.S. refining capacity (counting only atmospheric crude oil distillation units) has been relatively stable in recent years, at about 16 million b/cd. Previously, capacity grew consistently for about 10 years starting in the early 1970s, rising to 19.4 million b/cd in 1981. At that point, however, dropping oil demand put pressure on refineries, and the first to shut down were those that had only simple distillation systems
Table 13–4. Largest U.S. oil refineries ranked by capacity, June 2011Companya Location Capacity,b b/cd
ExxonMobil Refining and Supply Baytown, TX 560,640ExxonMobil Refining and Supply Baton Rouge, LA 502,000Hovensa (Hess/PdVSA joint venture) Kingshill, Virgin Islands 500,000Marathon Petroleum Garyville, LA 464,000Citgo Petroleum Lake Charles, LA 427,800BP Products North America Texas City, TX 406,570BP Products North America Whiting, IN 405,000WRB Refining Wood River, IL 362,000ExxonMobil Refining and Supply Beaumont, TX 344,500Sunoco (R&M) Philadelphia, PA 335,000Chevron USA Pascagoula, MS 330,000Deer Park Refining Deer Park, TX 327,000Premcor Refining Group Port Arthur, TX 292,000Flint Hills Resources Corpus Christi, TX 290,078Motiva Enterprises Port Arthur, TX 285,000Houston Refining Houston, TX 280,390Chevron USA El Segundo, CA 273,000Flint Hills Resources St. Paul, MN 262,000BP West Coast Products Los Angeles, CA 253,000ConocoPhillips Belle Chasse, LA 247,000ConocoPhillips Sweeny, TX 247,000Chevron USA Richmond, CA 245,271ConocoPhillips Westlake, LA 239,400ExxonMobil Refining & Supply Joliet, IL 238,600ConocoPhillips Linden, NJ 238,000Source: EIA, Ranking of U.S. Refineries, June 2011. a Includes only refineries with atmospheric crude oil distillation capacity. b Based on capacity data from refineries as of January 1, 2011.

Chapter 13 Petroleum Industry Structure 241
and little capability for subsequent upgrading (i.e., improving their downstream processing capability).
Additional refineries closed in the late 1980s and during the 1990s. At the same time, however, refiners found ways to improve the efficiency of the crude oil distillation units that remained in service. This process, called debottlenecking, better matches flow capacity among different units and makes wider use of computer control. Motivated by environmental mandates (as well as economics), refiners also improved their upgrading capability. As a result, the capacity of downstream units was no longer the constraining factor on the amount of crude oil processed (or run) through the crude oil distillation system.
Crude oil runs climbed through the 1990s, and an associated parameter, capacity utilization, exceeded 90% from the mid-1990s through
Table 13–5. Smallest U.S. oil refineries ranked by capacity, June 2011Companya Location Capacity,b b/cd
Ergon West Virginia Newell, WV 20,000Petro Star North Pole, AK 19,700Western Refining Southwest Bloomfield, NM 16,800ConocoPhillips Alaska Prudhoe Bay, AK 15,000San Joaquin Refining Bakersfield, CA 15,000Age Refining San Antonio, TX 14,021Wyoming Refining New Castle, WY 14,000Calumet Lubricants Cotton Valley, LA 13,020BP Exploration Alaska Prudhoe Bay, AK 12,780Ventura Refining & Transmission Thomas, OK 12,000Hunt Southland Refining Sandersville, MS 11,000Silver Eagle Refining Woods Cross, UT 10,250American Refining Group Bradford, PA 10,000Montana Refining Great Falls, MT 10,000Greka Energy Santa Maria, CA 9,500Lunday Thagard South Gate, CA 8,500Calumet Lubricants Princeton, LA 8,300Martin Midstream Partners Smackover, AR 7,500Valero Refining Wilmington, CA 6,300Somerset Energy Refining Somerset, KY 5,500Goodway Refining Atmore, AL 4,100Garco Energy Douglas, WY 3,600Silver Eagle Refining Evanston, WY 3,000Tenby Oxnard, CA 2,800Foreland Refining Ely, NV 2,000Source: EIA, Ranking of U.S. Refineries, June 2011. a Includes only refineries with atmospheric crude oil distillation capacity. b Based on capacity data from refineries as of January 1, 2011.
The Oil & Gas Industry: A Nontechnical Guide242
2004. (Capacity utilization is the total amount of crude oil, unfinished oils, and NGLs run through a crude oil distillation unit divided by the capacity of the unit. A unit operating all-out has a capacity utilization of 100%.) EIA reported that utilization was more than 95% of capacity in 1997 and 1998 and averaged above 90% through 2005.
The U.S. recession caused lower petroleum demand and pushed utilization capacity down to 83% in 2009. That figure recovered slightly, to approximately 86% in 2010.
Some in the industry have talked about 1995–2005 as a golden age for refiners. Notable improvements in performance were achieved despite a drop in the number of U.S. refineries—from just over 300 in 1981, to 192 in 1985, and to 146 in 2003.
In June 2011, EIA reported that U.S. oil-refining capacity increased to 17.7 million b/cd during 2010—its highest level in nearly three decades, with 148 refineries operating in January 2011. The capacity increase over 2009 was 152,000 b/cd.
The Gulf Coast has more than twice the crude distillation capacity of any other region in the United States. The difference is even greater for downstream processing capacity. The Gulf Coast region is also the national leader in supply of refined products. For example, more than half of East Coast needs—and 20% of Midwest needs—for light products such as gasoline, heating oil, diesel, and jet fuel come from the Gulf Coast.
Independent refinersAs a general rule, independent refiners have little involvement in oil
production, choosing instead to purchase crude oil produced by others and process it into finished products. They may also own wholesale and retail marketing outlets or sell their products to marketing companies.
During the 1990s, the role of independent refiners grew substantially, largely as the result of refinery purchases from IOCs seeking to streamline and realign their positions. In more recent years, independent refiners themselves underwent a period of consolidation; mergers and acquisitions scrambled the refinery ownership roster but had little impact on overall refined product supply.
Many independent refiners are members of the National Petrochemical and Refiners Association. Valero Energy was the largest independent refiner in the United States in early 2011; second was Marathon Petroleum. Other prominent independents include Frontier Oil, Holly, and Sunoco (R&M).

Chapter 13 Petroleum Industry Structure 243
World refining capacityBroadly speaking, refining developed in consuming areas because it
was cheaper to move crude oil than to move petroleum products. In addition, proximity to consuming markets made it easier to respond to weather-induced spikes or seasonal shifts in demand. Thus, while the Middle East is the largest oil-producing region, the bulk of oil refining takes place in the United States, Europe, and Asia.
One historical exception was establishment of a significant refining center in the Caribbean to supply heavy fuel oil to U.S. East Coast power, heat, and electric generation markets. However, as the demand for this heavy (residual) fuel oil slipped, the economic rationale for those dedicated refineries could no longer be upheld. Most refineries meet local or regional demand first, using exports as a temporary method to balance supply and demand. Exceptions to this rule are the Caribbean refineries described above, as well as refineries in the Middle East and Singapore.
At the start of 2012, the largest concentration of refining capacity (including crude distillation as well as subsequent upgrading) was in North America, primarily in the United States (table 13–6). Note that Asia held the lead with regard to crude distillation only. Because North America (and the United States in particular) uses a large majority of its oil in the form of gasoline, the region has by far the largest downstream capacity (necessary to maximize gasoline output).
Table 13–6. Regional view of global refining capabilities, January 1, 2012
Region:
Africa
AsiaEastern Europe
Middle East
North America
South America
Western Europe Total
No. of refineries 45 164 89 44 148 66 99 655Crude distillation 3,218 24,918 10,369 7,277 21,246 6,595 14,431 88,055Vacuum distillation 510 4,833 3,903 1,982 9,309 2,847 5,678 29,062Catalytic cracking 210 3,208 877 358 6,513 1,311 2,216 14,693Catalytic reforming 458 2,209 1,474 660 4,126 402 2,138 11,468Catalytic
hydrocracking62 1,242 330 597 1,936 132 1,189 5,489
Catalytic hydrotreating
833 10,223 4,274 2,047 16,371 1,904 10,077 45,730
Coke production 1.84 20.45 12.57 3.30 133.71 24.64 12.61 209.12Source: Adapted from Oil & Gas Journal, December 5, 2011, p. 36. Note: All capacity figures are given in thousand b/cd, except coke, which is given in thousands of tonnes per day.
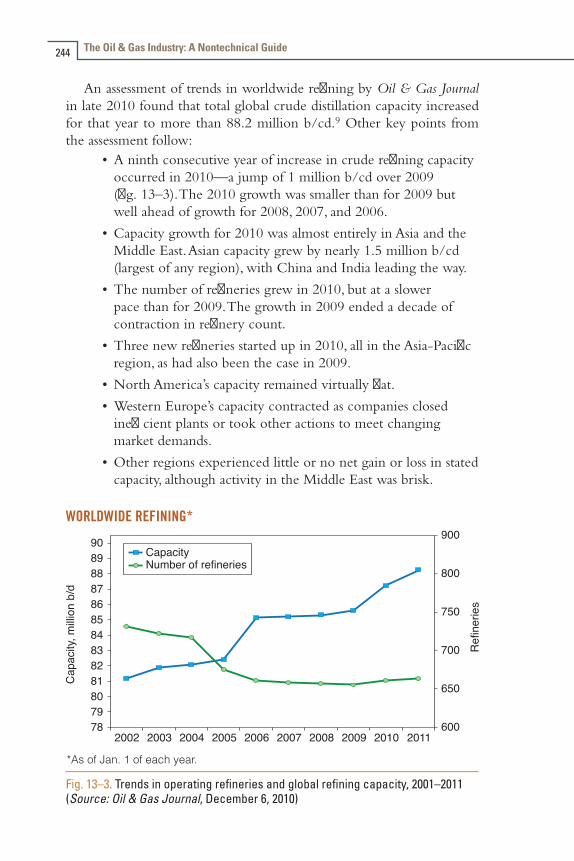
The Oil & Gas Industry: A Nontechnical Guide244
An assessment of trends in worldwide refining by Oil & Gas Journal in late 2010 found that total global crude distillation capacity increased for that year to more than 88.2 million b/cd.9 Other key points from the assessment follow:
•A ninth consecutive year of increase in crude refining capacity occurred in 2010—a jump of 1 million b/cd over 2009 (fig. 13–3). The 2010 growth was smaller than for 2009 but well ahead of growth for 2008, 2007, and 2006.
•Capacity growth for 2010 was almost entirely in Asia and the Middle East. Asian capacity grew by nearly 1.5 million b/cd (largest of any region), with China and India leading the way.
•The number of refineries grew in 2010, but at a slower pace than for 2009. The growth in 2009 ended a decade of contraction in refinery count.
•Three new refineries started up in 2010, all in the Asia-Pacific region, as had also been the case in 2009.
•North America’s capacity remained virtually flat.
•Western Europe’s capacity contracted as companies closed inefficient plants or took other actions to meet changing market demands.
•Other regions experienced little or no net gain or loss in stated capacity, although activity in the Middle East was brisk.
Fig. 13–3. Trends in operating refineries and global refining capacity, 2001–2011 (Source: Oil & Gas Journal, December 6, 2010)

Chapter 13 Petroleum Industry Structure 245
Largest refiners and refineriesTable 13–7 lists the 25 refining companies that own the most
worldwide capacity. Table 13–8, 13–9, and 13–10 list those refiners whose plants have more than 200,000 b/cd of capacity in Asia, the United States, and Western Europe, respectively. Table 13–11 presents information about the largest refineries in the world.
Table 13–7. Ranked list of the world’s largest refinersRank as of Jan. 1
CompanyCrude capacity,a
thousand b/cd2012 20111 1 ExxonMobil 5,7882 2 Royal Dutch Shell 4,1943 3 Sinopec 3,9714 4 BP 3,3225 8 Valero Energy 2,7766 7 PdVSA 2,6787 9 China National Petroleum 2,6758 5 ConocoPhillips 2,5689 6 Chevronb 2,560
10 11 Saudi Aramco 2,45111 10 Total 2,31412 12 Petrobras 1,99713 13 Pemex 1,70314 14 National Iranian Oil 1,45115 15 JX Nippon Oil & Energy 1,42316 16 Rosneft 1,29317 17 OAO Lukoil 1,21718 18 Marathon Petroleum 1,19319 24 SK Innovation 1,11520 19 Repsol YPF 1,10521 20 Kuwait National Petroleum 1,08522 21 Pertamina 99323 22 Agip Petroli 90424 25 Flint Hills Resources 81625 23 Sunoco (R&M) 675
Source: Oil & Gas Journal, Dec. 5, 2011, p.32. a Figures include partial interests in refineries not wholly owned by the company. b Includes holdings in Caltex Oil and GS Caltex.

Table 13–8. Companies in Asia with at least 200,000 b/cd refining capacity, January 1, 2012Company No. of refineries Crude capacity,a thousand b/cd1. Sinopec 27 3,9712. China National Petroleum 25 2,6753. ExxonMobil 10 1,9384. JX Nippon Oil & Energy 7 1,4235. Royal Dutch Shell 13 1,3416. Indian Oil 11 1,3157. Reliance Petroleum 2 1,2408. SK Innovation 1 1,1159. Pertamina 8 1,012
10. Chinese Petroleum 3 77011. GS Caltex 1 750b
12. Tonen/General Sekiyu Seisei KK 4 628c
13. Idemitsu Kosan 4 60814. Chevron 6 58315. Cosmo Oil 4 56516. S-Oil 1 565d
17. Formosa Petrochemical 1 54018. BP 4 35219. Saudi Aramco 6 32820. Hyundai Oil Refinery 3 31921. Hindustan Petroleum 2 298Source: Adapted from Oil & Gas Journal, December 5, 2011, p. 34. Note: Asia includes Australia, Bangladesh, Brunei, China (and Taiwan), India, Indonesia, Japan, Malaysia, Myanmar, New Zealand, North Korea, Pakistan, Papua New Guinea, the Philippines, Singapore, South Korea, Sri Lanka, and Thailand. a Figures include partial interests in refineries not wholly owned by the company. b Includes Caltex’s 50% stake. c Includes ExxonMobil’s 50% stake. d Includes Saudi Aramco’s 35% stake.

Table 13–9. Companies in the United States with at least 200,000 b/cd refining capacity, Jan. 1, 2012Company No. of refineries Crude capacity,a thousand b/cd
1. ConocoPhillips 13 2,276 2. Valero Energy 12 2,096 3. ExxonMobil 7 2,042 4. BP 6 1,486 5. Marathon Oil 6 1,193 6. Royal Dutch Shell 8 1,011b
7. Chevron 5 955 8. PdVSA 4 849c
9. Flint Hills Resources (Koch Industries)
3 816
10. Motiva Enterprisesd 3 77211. Sunoco (R&M) 3 67512. Tesoro 7 65813. Saudi Aramco 3 410e
14. Encana 2 27615. LyondellBasell 1 26816. Alon USA 3 24117. Husky Energy 2 238Source: Adapted from Oil & Gas Journal, December 5, 2011, p. 34. a Figures include partial interests in refineries not wholly owned by the company. b Includes Shell’s stakes in Motiva and its 50% stake in the Deer Park, TX, refinery. c Consists of PdVSA’s ownership of Citgo and its 50% stake in the ExxonMobil Chalmette, LA, refinery. d Joint (50/50) venture between Shell and Saudi Aramco. e Consists of 50% stake in Motiva.

Table 13–10. Companies in Western Europe with at least 200,000 b/cd refining capacity, January 1, 2012Company No. of refineries Crude capacity,a thousand b/cd
1. Total 14 1,984 2. ExxonMobil 9 1,680 3. Royal Dutch Shell 9 1,197 4. Agip Petroli 10 876 5. BP 8 854 6. Repsol YPF 5 709 7. Turkish Petroleum Refineries 4 613 8. Petroplus International 5 521 9. Cepsa 3 42710. Ineos Group Holdings 2 40311. OMV 3 39912. ERG Group 4 39613. ConocoPhillips 3 35014. Preem Raffinaderi 2 31615. Hellenic Petroleum 3 31316. Neste Oil 6 311b
17. Statoil 3 30418. Galp Energia 2 30419. Saras 1 30020. PdVSA 8 29521. Valero Energy 1 210Source: Adapted from Oil & Gas Journal, December 5, 2011, p. 34. Note: Western Europe includes Austria, Belgium, Denmark, Finland, France, Germany, Greece, Ireland, Italy, the Netherlands, Norway, Portugal, Spain, Sweden, Switzerland, Turkey, and the United Kingdom. a Figures include partial interests in refineries not wholly owned by the company. b Includes 50% stake in AB Nynas refineries.
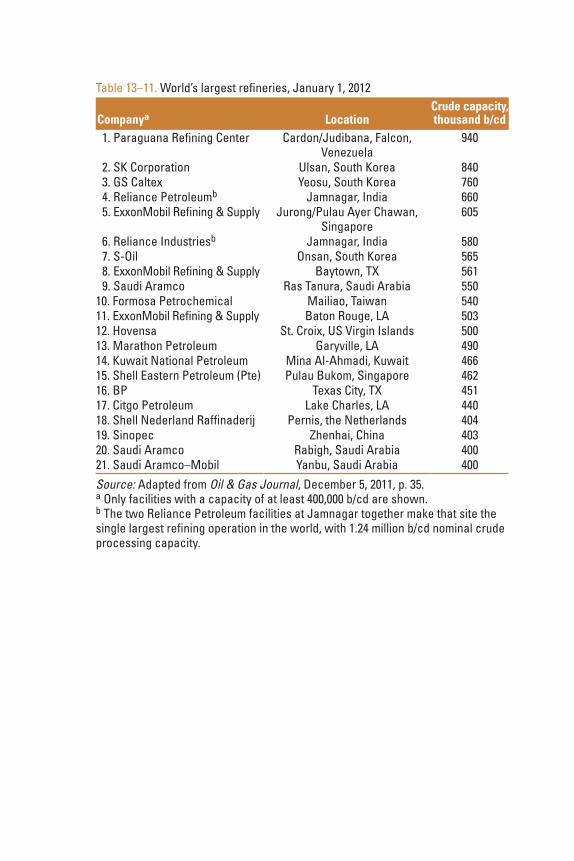
Table 13–11. World’s largest refineries, January 1, 2012 Companya
Location
Crude capacity, thousand b/cd
1. Paraguana Refining Center Cardon/Judibana, Falcon, Venezuela
940
2. SK Corporation Ulsan, South Korea 840 3. GS Caltex Yeosu, South Korea 760 4. Reliance Petroleumb Jamnagar, India 660 5. ExxonMobil Refining & Supply Jurong/Pulau Ayer Chawan,
Singapore605
6. Reliance Industriesb Jamnagar, India 580 7. S-Oil Onsan, South Korea 565 8. ExxonMobil Refining & Supply Baytown, TX 561 9. Saudi Aramco Ras Tanura, Saudi Arabia 55010. Formosa Petrochemical Mailiao, Taiwan 54011. ExxonMobil Refining & Supply Baton Rouge, LA 50312. Hovensa St. Croix, US Virgin Islands 50013. Marathon Petroleum Garyville, LA 49014. Kuwait National Petroleum Mina Al-Ahmadi, Kuwait 46615. Shell Eastern Petroleum (Pte) Pulau Bukom, Singapore 46216. BP Texas City, TX 45117. Citgo Petroleum Lake Charles, LA 44018. Shell Nederland Raffinaderij Pernis, the Netherlands 40419. Sinopec Zhenhai, China 40320. Saudi Aramco Rabigh, Saudi Arabia 40021. Saudi Aramco–Mobil Yanbu, Saudi Arabia 400Source: Adapted from Oil & Gas Journal, December 5, 2011, p. 35. a Only facilities with a capacity of at least 400,000 b/cd are shown. b The two Reliance Petroleum facilities at Jamnagar together make that site the single largest refining operation in the world, with 1.24 million b/cd nominal crude processing capacity.

The Oil & Gas Industry: A Nontechnical Guide250
Refinery projects planned for 2010 and beyondOil & Gas Journal pointed to several significant refinery-related
projects planned or under way in 2010.10 China’s plans are the most ambitious and include the following:
•A $3.4 billion, 200,000 b/cd refinery at Anning City, to process oil and gas to be imported from Myanmar beginning in 2013
•A $9 billion project (jointly owned by Kuwait National Petroleum and Sinopec) to build a 300,000 b/cd refinery on Donghai Island at Zhanjiang
•A $3.5 billion, 300,000 b/cd refinery and petrochemical complex planned for Tianjin, to be jointly owned by Rosneft and CNPC
•Doubling of capacity (to 200,000 b/cd) of PetroChina’s refinery in Hebei province
•A new 200,000 b/cd refinery to be built by CNOOC in Dongying, Shandong Province
•Four petroleum refining bases—each with capacity of 200,000 b/cd—at Dushanzi, Urumqi, Karamay, and Kuqa, all in Xinjiang Uygur Autonomous Region
Activity planned in other nations includes:•Commissioning of the 120,000 b/cd Cuddalore refinery in
Tamil Nadu, India, to process crude into LPG, bitumen, and European-standard automobile fuels
•Expansion of two other refineries in India (at Mangalore and Vadinar) to boost capacity to 300,000 and 415,000 b/cd, respectively
•Tripling of the capacity of Bangladesh’s only refinery (at Chittagong) to 100,000 b/cd, with assistance from a Saudi investment group
•Capacity expansion at Vietnam’s only refinery (at Dung Quat) to 200,000 b/cd from 148,000 b/cd
• Investment by Indonesia’s PT Pertamina and Kuwait National Petroleum of $9 billion in a joint venture, a 300,000 b/cd refinery in West Java
•Building of a complex south of Baku by Azerbaijan’s state oil company to process 300,000 b/cd of crude and 1.4 tcf of gas per year, as well as to produce petrochemicals and electric power

Chapter 13 Petroleum Industry Structure 251
• Investment by OPEC members in some 140 projects from 2012 to 2014, to expand refining capacity by 12 million b/d of crude and liquids, including a 400,000 b/d export refinery planned for Yanbu City, on Saudi Arabia’s Red Sea coast
•Construction of a $4.8 billion refinery in southwestern Iran, starting in 2012
•Construction of a $4.6 billion refinery in northwestern Uganda, in the district of Hoima
In summary, the structures of both the upstream and the refining sectors of the global petroleum industry are complex and multifaceted. Dynamic interactions among a range of companies, governments, and other entities address a range of technical, economic, and public policy challenges to produce petroleum products for world markets.
References 1 PTCC. Mission statement. PTCC Web site: http://www.pttc.org/
about.htm.
2 The Economic Contribution of the Onshore Independent Oil and Natural as Producers to the U.S. Economy: Final Report. April 2011. IHS Global Insight (USA), Lexington, MA.
3 Jessen, Rob. “Special Report: IOC challenge: Providing value beyond production.” Feb. 2, 2009. Oil & Gas Journal, Vol. 107, Issue 5, p. 24. Tulsa, OK.
4 Pfeifer, Sylvia and Hook, Leslie. “Chinese demand for energy pumps up M&A share.” Nov. 7, 2010. Financial Times. London.
5 Wood Mackenzie. “Chinese NOCs step up international expansion.” June 15, 2010. Edinburgh, Scotland.
6 OPEC. Mission statement, from OPEC Web site: www.opec.org
7 OPEC. Membership criteria, from OPEC Web site: www.opec.org
8 The Economist. “Drill will: Disharmony at OPEC breeds uncertainty over the oil price.” June 9, 2011.
9 True, W. R., and L. Kootungal. “Global capacity growth slows, but Asian refineries bustle.” December 6, 2010. Oil & Gas Journal, Vol. 108, Issue 46, p. 50. Tulsa, OK.
10 Ibid.

Petroleum Trading
The global trading of petroleum is complex and dynamic. A myriad of buyers, sellers, brokers, traders, shippers, and other parties seek to discover and act on information about the supply/demand and prices of a wide range of energy commodities—crude oil and raw natural gas, as well as products ranging from jet fuel and industrial lubricants to gasoline, LNG, butane, and petrochemicals.
In this commercial arena, the air is filled with talk of strips and benchmarks; futures, hubs, and market baskets; spreads and swaps; contango and backwardation. Though arcane and somewhat intimidating to the casual observer, this specialized vocabulary describes with precision and clarity a range of situations, options, and actions. Detailed description of every aspect of petroleum trading—and its terminology—is beyond the scope of this book. Instead, the aim of this chapter is to provide a broad yet high-level perspective on this vital aspect of the petroleum industry, at the risk of occasional oversimplification. Readers interested in comprehensive information about petroleum trading can explore a range of books by other writers on this subject (e.g., see app. B).
The first section of this chapter presents information about the mechanisms and agencies that have evolved over the past 30 years or so to support and facilitate the trading of oil. Later sections address the natural gas market.
14

The Oil & Gas Industry: A Nontechnical Guide254
Oil TradingCrude oil trading traditionally has involved oil from seven major regions:
•The North Sea
•The Russian-Caspian region
•The Mediterranean
•West Africa
•The Arab Gulf
•The Asia-Pacific region
•The AmericasEmerging sources include oil from Sakhalin Island off Russia’s Pacific Coast and Nile Blend crude from the Sudan.
As noted in chapter 2, crude oils from different geologic sources and geographic regions can vary widely in composition, and different grades of crude have different relative values in the market. In general, lighter and sweeter crude (containing relatively little sulfur) is more valuable than heavy crude because it can be refined more easily into valuable products such as gasoline. This should be kept in mind as this discussion about trading oil and moving it to market unfolds.
Importantly, petroleum trading takes place in two largely discrete but occasionally intersecting worlds. The first is the wholesale, or physical, trade of actual volumes of oil; the second involves more-speculative, future-oriented, or paper, trading by use of specialized financial instruments.
Physical versus paper tradingIn physical trading, one party agrees to purchase X barrels from a
seller and then pays for and takes actual physical delivery of those X barrels (either right away or at a future date). Paper trading spells out the right or opportunity to buy or sell agreed-to quantities of oil by a specified date. Three kinds of instruments are commonly used: futures contracts, options contracts, and swaps. These instruments allow buyers and sellers to hedge against possible future swings in oil prices.
Futures and options are traded on an exchange, which is a marketplace where parties can buy or sell a commodity for delivery at some point in the future. The two major exchanges for oil trading are the NYMEX and the London subsidiary of Atlanta-based Intercontinental Exchange (ICE). Other principal exchanges are in Singapore and Tokyo. In addition, the Dubai Mercantile Exchange (DME) in 2007 launched its

Chapter 14 Petroleum Trading 255
Oman Crude Oil Futures Contract (OQD). DME reported almost 745 million barrels of crude traded in 2010 through the OQD.
With regard to exchange-based trading:•A futures contract obligates the buyer to purchase (and the
seller to deliver) a specific quantity of oil at an agreed-to price at a specified future date.
•The purchaser of an options contract has the right (but not the obligation) to buy or sell a specific amount of oil at a specified price, at any time during a specified period. If the option is not used (exercised), then it expires; no sale occurs and the money spent to buy the option is lost. An option trade can be conducted through an exchange or over the counter (OTC), meaning privately negotiated.
• In a swap agreement, a floating price for a specific amount of a specific type of oil is exchanged for a fixed price over a specified period. There is no transfer of physical oil; both parties settle their contractual obligations by a transfer of cash. The swap is an OTC transaction.
Futures and swaps do not require the investor to take or deliver the actual oil. In fact, in approximately 99% of all such trades, no actual oil is delivered.
In addition to the services offered by exchanges, several trading service providers offer oil (and gas) trading to individuals through Internet futures accounts. It is also possible to invest in exchange-traded funds that specialize in oil or natural gas futures contracts.
Pricing—a historical perspectiveDecades ago, the industry established benchmark crudes to provide an
index for general price movements. For example, in the early 1960s, following the formation of OPEC, the cartel set Arabian Light crude as a pricing benchmark.
In 1983, the NYMEX began trading crude oil futures contracts and chose West Texas Intermediate (WTI) crude, for delivery at Cushing, Oklahoma, as its benchmark. (This specification was later broadened to light sweet crude, which allowed traders more flexibility in fulfilling a contract if physical delivery of oil was required.) In 1988, the International Petroleum Exchange (now the ICE) chose Brent crude as its benchmark for futures contracts. Brent crude is actually a blend of light, low-sulfur oil from 20 different fields. Chapter 2 comments on
The Oil & Gas Industry: A Nontechnical Guide256
the evolving battle between WTI and Brent crude for prominence in exchange-based trading
Traders selling oil using a futures contract must be willing to deliver it if necessary. Thus, the prices determined on futures exchanges, such as the NYMEX and the ICE, correspond directly to prices that govern the physical flow of oil.
Disruption of markets caused by the Iranian Revolution of 1979–80 sent oil prices skyrocketing, and new suppliers entered the market to compete with OPEC. By 1985, Saudi production had plunged. In response, traders switched to an approach called netback pricing, in which crude prices were set by adding a normal refinery profit margin to the price of a collection, or basket, of refined products. Crude oil prices stabilized briefly, but in March of 1986, they fell to $10.42 per barrel on the NYMEX.
In 1986, OPEC established a production allocation program, aiming to manage oil price swings by setting production quotas for its members. As discussed previously (in chap. 13), the quota system has been quite difficult to enforce, and oil-price volatility continues to this day. (For example, in 2008, crude prices ranged as high as $145 and as low as $36 per barrel.)
Oil pricing todayWholesale trade in actual oil is conducted through either term or spot
supply contracts. The majority of oil is traded today using the former, in which a seller agrees to supply a specific quantity of oil to the buyer for an agreed-to price at one or more future dates. In contrast, spot supply contracts are for delivery of a quantity of oil at a specific location as soon as possible (often, within a day or two).
On the spot market, a wide range of commodities are bought and sold for cash and delivered immediately, with payment literally on the spot. The prices of commodities (including oil and gas) are subject to extreme fluctuations—for example, caused by natural disasters, political developments, weather events, and changes in estimates of supply or demand. Nonetheless, the spot market does provide signals about expected near-term prices.
Spot contracts are arranged on the international market by traders operating around the world, at firms based in London, New York, and Singapore, as well as Geneva and Baar, in Switzerland; Amsterdam and Rotterdam, in the Netherlands; and even Westport, Connecticut. Spot supplies are sold to the highest bidder willing to take delivery quickly.
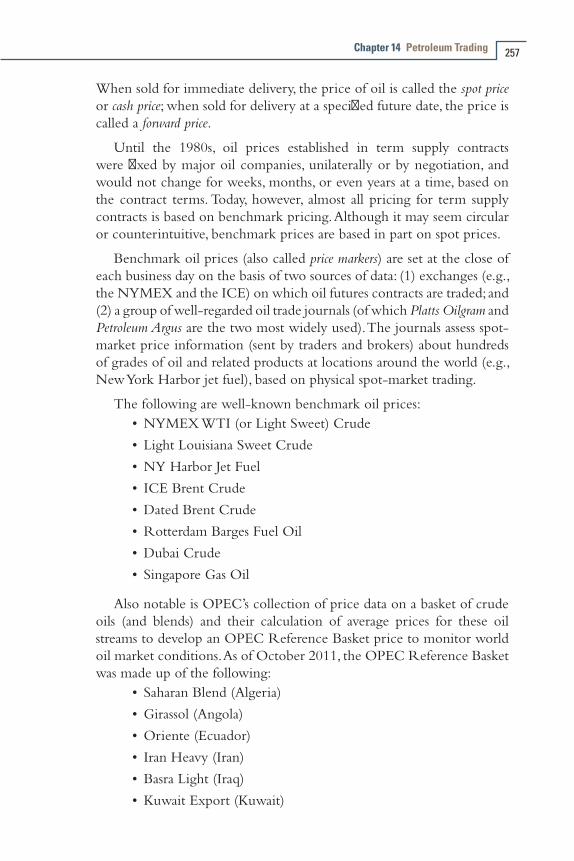
Chapter 14 Petroleum Trading 257
When sold for immediate delivery, the price of oil is called the spot price or cash price; when sold for delivery at a specified future date, the price is called a forward price.
Until the 1980s, oil prices established in term supply contracts were fixed by major oil companies, unilaterally or by negotiation, and would not change for weeks, months, or even years at a time, based on the contract terms. Today, however, almost all pricing for term supply contracts is based on benchmark pricing. Although it may seem circular or counterintuitive, benchmark prices are based in part on spot prices.
Benchmark oil prices (also called price markers) are set at the close of each business day on the basis of two sources of data: (1) exchanges (e.g., the NYMEX and the ICE) on which oil futures contracts are traded; and (2) a group of well-regarded oil trade journals (of which Platts Oilgram and Petroleum Argus are the two most widely used). The journals assess spot-market price information (sent by traders and brokers) about hundreds of grades of oil and related products at locations around the world (e.g., New York Harbor jet fuel), based on physical spot-market trading.
The following are well-known benchmark oil prices:•NYMEX WTI (or Light Sweet) Crude
•Light Louisiana Sweet Crude
•NY Harbor Jet Fuel
• ICE Brent Crude
•Dated Brent Crude
•Rotterdam Barges Fuel Oil
•Dubai Crude
• Singapore Gas Oil
Also notable is OPEC’s collection of price data on a basket of crude oils (and blends) and their calculation of average prices for these oil streams to develop an OPEC Reference Basket price to monitor world oil market conditions. As of October 2011, the OPEC Reference Basket was made up of the following:
• Saharan Blend (Algeria)
•Girassol (Angola)
•Oriente (Ecuador)
• Iran Heavy (Iran)
•Basra Light (Iraq)
•Kuwait Export (Kuwait)

The Oil & Gas Industry: A Nontechnical Guide258
•Es Sider (Libya)
•Bonny Light (Nigeria)
•Qatar Marine (Qatar)
•Arab Light (Saudi Arabia)
•Murban (United Arab Emirates)
•Merey (Venezuela)
The prices most commonly referenced in term oil contracts reflect recent activity in major trading locations such as Singapore, the Netherlands, New York Harbor, Dubai, the U.S. Gulf Coast, and Los Angeles. Prices established in contracts for nonbenchmark grades of oil are set at a premium or discount to one or more of the benchmark grades, based on quality differences, transportation costs, and taxes for the oils being compared. Complex formulas are sometimes used to determine the exact premium or discount each day or each month.
Pricing along the delivery chainPrices for physical oil are often quoted in relation to a certain
point in the delivery chain. The crude oil price, established early in the process, accounts for most of the price charged for the final product (e.g., gasoline), but each step in the refining and transportation chain adds to that final price.
Not all grades of oil follow the delivery sequence shown below, or they may move through the steps noted in a different order; nonetheless, the details are informative:
•Wellhead price: The price of crude at the point of production
•Cargo price: The price of crude or product on a large oceangoing tanker
•Refinery gate price: The price of crude entering a refinery or of finished products leaving a refinery
•Barge price: The price of oil on a barge vessel typically used on a river or close to shore, with a typical capacity of 8,000–50,000 barrels
•Pipeline price: The price of oil at a specified point in a pipeline
•Rack price: The price of oil at a wholesale terminal from which tank trucks take oil to be carried to filling stations, homes, and businesses
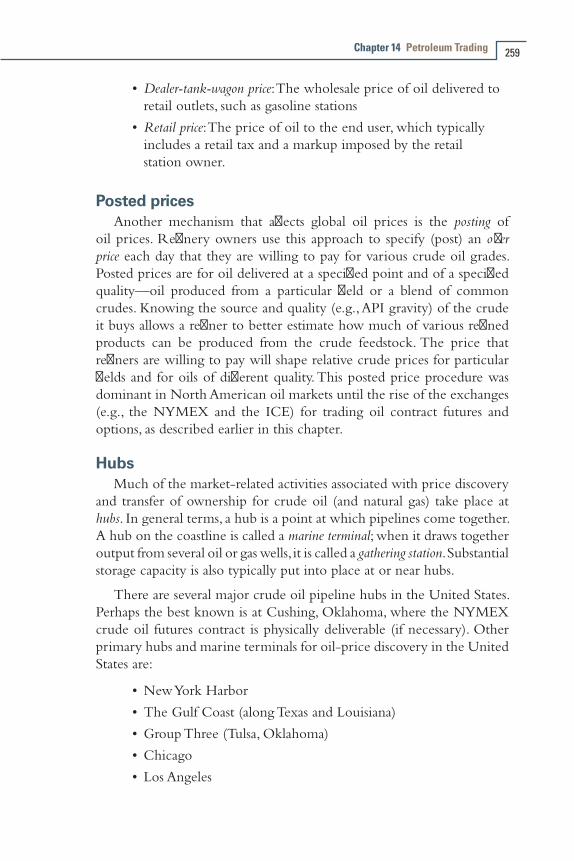
Chapter 14 Petroleum Trading 259
•Dealer-tank-wagon price: The wholesale price of oil delivered to retail outlets, such as gasoline stations
•Retail price: The price of oil to the end user, which typically includes a retail tax and a markup imposed by the retail station owner.
Posted pricesAnother mechanism that affects global oil prices is the posting of
oil prices. Refinery owners use this approach to specify (post) an offer price each day that they are willing to pay for various crude oil grades. Posted prices are for oil delivered at a specified point and of a specified quality—oil produced from a particular field or a blend of common crudes. Knowing the source and quality (e.g., API gravity) of the crude it buys allows a refiner to better estimate how much of various refined products can be produced from the crude feedstock. The price that refiners are willing to pay will shape relative crude prices for particular fields and for oils of different quality. This posted price procedure was dominant in North American oil markets until the rise of the exchanges (e.g., the NYMEX and the ICE) for trading oil contract futures and options, as described earlier in this chapter.
HubsMuch of the market-related activities associated with price discovery
and transfer of ownership for crude oil (and natural gas) take place at hubs. In general terms, a hub is a point at which pipelines come together. A hub on the coastline is called a marine terminal; when it draws together output from several oil or gas wells, it is called a gathering station. Substantial storage capacity is also typically put into place at or near hubs.
There are several major crude oil pipeline hubs in the United States. Perhaps the best known is at Cushing, Oklahoma, where the NYMEX crude oil futures contract is physically deliverable (if necessary). Other primary hubs and marine terminals for oil-price discovery in the United States are:
•New York Harbor
•The Gulf Coast (along Texas and Louisiana)
•Group Three (Tulsa, Oklahoma)
•Chicago
•Los Angeles

The Oil & Gas Industry: A Nontechnical Guide260
Important international locations for oil price discovery include the following pipeline hubs or marine terminals:
•ARA (Amsterdam, Rotterdam, and Antwerp), in the Netherlands/Belgium
•Genoa/Laverna, on the Italian/French Mediterranean coast
• Singapore
•The Arab Gulf—particularly Ras Tanura (Saudi Arabia) and Dubai (United Arab Emirates)
There are also market hubs for petroleum products at New York Harbor, the Houston Ship Channel, Los Angeles, and Group Three. NGL market centers are located at Mt. Belvieu, Texas; at Conway, Kansas; at Sarnia, Ontario; and in the Los Angeles Basin.
Transportation services An important component of the midstream petroleum sector is the
transport of crude oil and petroleum products by pipeline, tanker ship, railcar, and tank truck. Some large producers own and operate their own transportation equipment, but most use independent transportation operators for some or all oil movements.
Some of the larger firms offering oil tanker ship services are shown in table 14–1. (For information about major U.S. oil pipelines, see chap. 9.)
Table 14–1. Oil tanker ship companiesCompany Location
A/S Steamship Company Torm Copenhagen, DenmarkBlue Fin International Shipping Dubai, UAECrowley Marine Jacksonville, FLFrontline Hamilton, BermudaGeneral Maritime New York, NYKirby Houston, TXNippon Yusen Kabushiki Kaisha (NYK Line) Tokyo, JapanOMI Stamford, CTOverseas Shipholding Group New York, NYSeacor Holdings Ft. Lauderdale, FLShip Finance International Hamilton, BermudaTeekay Shipping Vancouver, BCUS Shipping Partners Edison, NJSource: Downey.

Chapter 14 Petroleum Trading 261
Although many large companies in the oil industry own their own vessels, a big part of the global tanker fleet is owned by individuals and corporations with no physical crude oil production or oil-refining capacity. Business people in Greece and Italy, for example, are prominent shipowners.
Individual owners usually use brokers to find cargoes, using a process called fixing a charter. First, the party initiating the charter (e.g., a refiner or oil trader desiring transport service) contacts a broker or a shipowner. The initiator is ready to specify the product or crude to be carried, the size of vessel needed, the route, the time period for delivery, and possibly the ports of loading and unloading at either end of the route. Tanker vessels are sometimes chartered as stationary floating storage tanks—for periods when storage costs onshore are very high or when onshore tanks are full.
The charterer and owner agree to a price for the transaction and provisionally book the vessel. In most cases, the parties refer to a document published annually by the not-for-profit Worldscale Association that lists nominal voyage costs (in U.S. dollars per metric ton of cargo). The book contains rates for travel between regions (e.g., U.S. Gulf Coast and the Baltic, Caribbean, and Black seas), as well as between individual ports. It is the responsibility of the charterer to ensure that the vessel meets all requirements (e.g., has a double hull) pertinent to ports at which the vessel may load and unload.
When all terms are agreed to and all issues are in good order, the charterer and vessel owner select one of three types of charter agreement:
•Spot charter (also called voyage charter)
•Contract of affreightment (COA)
•Period charter
The spot charter is for use of a specific vessel in the immediate future to move cargo between specified loading and discharge ports; it is a “one-shot” arrangement. The major difference between a spot charter and a COA charter is that the COA agreement does not stipulate the use of a specific vessel.
Whereas spot and COA charters refer to Worldscale Association data for pricing, period charters establish an agreed-on day rate (in U.S. dollars per day) for a particular vessel. There are several types of period charter; however, their description is beyond the scope of this book.

The Oil & Gas Industry: A Nontechnical Guide262
Standard trade terms used in global shipping have been developed by the International Chamber of Commerce. Among the most common terms used in defining tanker freight charges are five methods of delivery pricing:
•FOB (free on board): The seller is no longer responsible for the oil once it has been loaded onto the ship; the buyer assumes all risks and costs of ownership from that point.
•CFR (cost and freight; also called C+F): The seller pays all costs incurred to bring the oil to the delivery port, but the buyer is responsible for insuring the cargo while in transit. Once the cargo leaves the ship, all further costs accrue to the buyer.
•CIF (cost, insurance, and freight): The same as CFR, except that the seller also is responsible for insuring the cargo while in transit.
•Landed cost: The same as CIF, plus the seller pays the import duties at the delivery port.
•DDP (delivered duty paid): The seller is required to deliver the oil to the location specified by the buyer with all insurance, freight costs, and duties paid; in short, the DDP price includes all costs.
Sale and movement of refined productsAfter crude oil is converted into refined products, the products are
transported and sold to end users around the United States. The collection and dissemination of data regarding this aspect of the petroleum industry is conducted using five Petroleum Administration for Defense Districts (PADDs). They are named after a government agency, the Petroleum Administration for Defense, established in 1950 in conjunction with the Korean War effort; even though the agency was eliminated in 1954, the name is still used. These districts (see tables 14–2 and 14–3) were created during World War II to help organize the allocation of fuels derived from petroleum products.
In many cases, refined products move from a PADD that has excess supply to another that needs more products. For example, PADD III refineries supply a substantial volume of products to the Midwest (PADD II) and the East Coast (PADD I). As described in chapter 5, refined products are moved to market centers by using product pipelines, as well as tanker vessels and tank trucks.
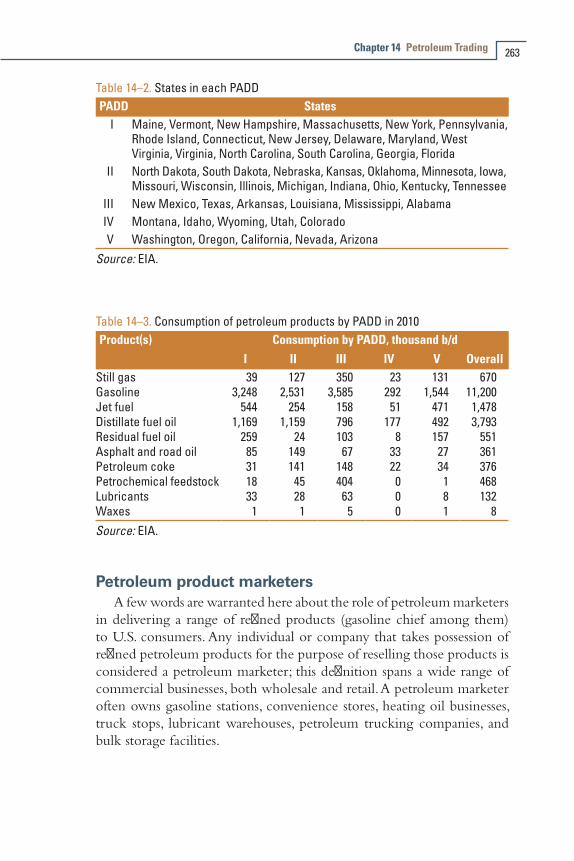
Chapter 14 Petroleum Trading 263
Table 14–2. States in each PADDPADD States
I Maine, Vermont, New Hampshire, Massachusetts, New York, Pennsylvania, Rhode Island, Connecticut, New Jersey, Delaware, Maryland, West Virginia, Virginia, North Carolina, South Carolina, Georgia, Florida
II North Dakota, South Dakota, Nebraska, Kansas, Oklahoma, Minnesota, Iowa, Missouri, Wisconsin, Illinois, Michigan, Indiana, Ohio, Kentucky, Tennessee
III New Mexico, Texas, Arkansas, Louisiana, Mississippi, AlabamaIV Montana, Idaho, Wyoming, Utah, ColoradoV Washington, Oregon, California, Nevada, Arizona
Source: EIA.
Table 14–3. Consumption of petroleum products by PADD in 2010Product(s) Consumption by PADD, thousand b/d
I II III IV V OverallStill gas 39 127 350 23 131 670Gasoline 3,248 2,531 3,585 292 1,544 11,200Jet fuel 544 254 158 51 471 1,478Distillate fuel oil 1,169 1,159 796 177 492 3,793Residual fuel oil 259 24 103 8 157 551Asphalt and road oil 85 149 67 33 27 361Petroleum coke 31 141 148 22 34 376Petrochemical feedstock 18 45 404 0 1 468Lubricants 33 28 63 0 8 132Waxes 1 1 5 0 1 8Source: EIA.
Petroleum product marketersA few words are warranted here about the role of petroleum marketers
in delivering a range of refined products (gasoline chief among them) to U.S. consumers. Any individual or company that takes possession of refined petroleum products for the purpose of reselling those products is considered a petroleum marketer; this definition spans a wide range of commercial businesses, both wholesale and retail. A petroleum marketer often owns gasoline stations, convenience stores, heating oil businesses, truck stops, lubricant warehouses, petroleum trucking companies, and bulk storage facilities.

The Oil & Gas Industry: A Nontechnical Guide264
Independent marketers are companies that purchase refined products (from major or independent refineries) and sell them at retail outlets. This classification includes firms whose primary business is gasoline sales (e.g., Speedway and QuikTrip), as well as large retailers (e.g., Costco and Walmart) who sell gasoline in addition to other merchandise. Two trade groups represent this group: the Petroleum Marketers Association of America and the Society of Independent Gasoline Marketers of America.
Gasoline distribution and marketingAfter typically brief storage at a supply terminal, refined gasoline is
distributed to service stations, airports, and other outlets by tank trucks. Companies mix proprietary additives into gasoline at these facilities.
Distributors are companies without refining operations that own and operate their own gas stations. Distributors may also supply gasoline to dealers who are independent gasoline stations with no distribution capabilities. More than 114,000 gasoline stations delivered transportation fuels to motorists in 2008 throughout the United States, according to census data.
Gasoline is sold at branded and unbranded stations. Branded stations include company-owned facilities, distributors, and dealers. Company-owned stations—which are owned and operated by a petroleum refining company (e.g., ExxonMobil and Chevron)—usually focus more on fuel sales than do operators of convenience stores. Branded operations allow distributors and dealers to market gasoline under a recognized brand. Unbranded stations can operate as either retail or commercial entities.
Natural Gas TradingA better understanding and appreciation of the dynamics at play in
today’s U.S. natural gas market can be achieved by reviewing, even briefly, the dramatic change that took place in the industry about 25 years ago.
U.S. historical perspectiveUntil about the mid-1980s, pipelines and LDCs operated under the
direction of federal and state agencies that controlled the price of natural gas at the wellhead and that regulated the rates that customers paid for gas. Pipelines bought gas from producers, moved it to market, and then resold the gas to LDCs.

Chapter 14 Petroleum Trading 265
Gas producers signed long-term contracts (typically for 20 years) with pipelines, promising to supply gas, and the pipelines agreed to pay for that gas regardless of whether they could sell it. As a result, in the late 1970s, more and more pipelines found themselves saddled with extra gas they could not sell but for which they still had to pay high prices.
In response, federal authorities deregulated gas sales through the Natural Gas Policy Act of 1978. The Federal Energy Regulatory Commission, which oversees interstate pipelines, issued a series of orders—FERC Order 436 (in 1985), 500 (in 1987), and 636 (in 1993)—that permitted LDCs and large gas customers to buy gas directly, not only from producers but also from marketers and brokers. Pipelines also were required to provide comparable transportation service for natural gas, regardless of where or from whom the customer had bought it.
In short, pipeline companies were transformed from merchants (who bought and then resold gas) into transporters. In response to this government action, hundreds of new players entered the arena as gas marketing companies or brokers. Some were created as subsidiaries of pipelines, producers, and LDCs; others were independent; but all aggregated gas from several sources into large volumes for sale to LDCs and large gas users (e.g., industrial firms and power plants).
Physical delivery of natural gasDeregulation and restructuring also sharply altered the terms of gas
purchase contracts. By the late 1980s, the familiar 20-year contract was replaced by shorter-term arrangements (typically, of 30 days’ duration). Since then, creative purchase agreements have evolved that offer a mix of short-, medium-, and long-term contract provisions tailored to meet the needs of the customer.
Pipeline companies have had to adapt to the increased number of players and the variety of transactions and contract arrangements that characterize the modern natural gas market. For example, a gas customer may have a two-year contract with a supplier to buy a certain volume of gas over that period. Even so, on each day, the customer also is contractually required to submit a nomination to the pipeline company, specifying how much of that gas to deliver in the next 24 hours and where to deliver it. Using this information, the pipeline company takes action to ensure that gas flow through the delivery system will be properly balanced.
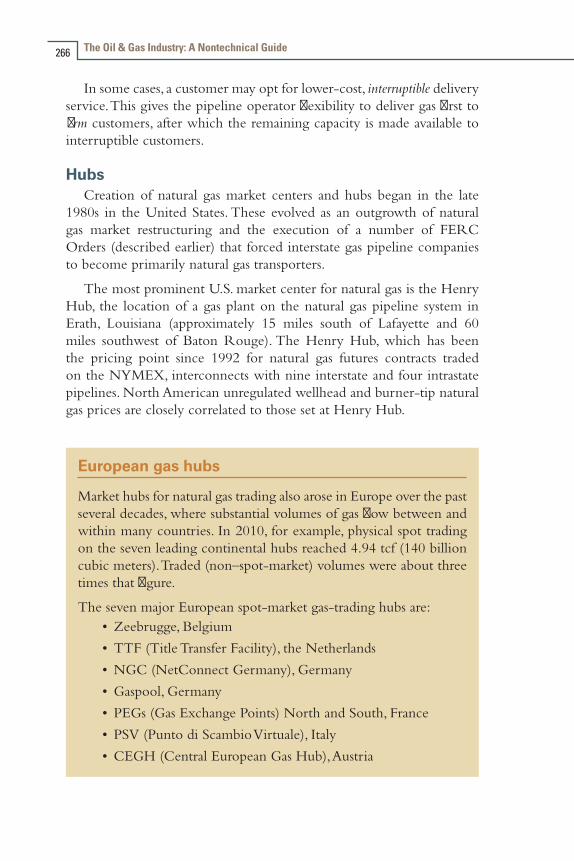
The Oil & Gas Industry: A Nontechnical Guide266
In some cases, a customer may opt for lower-cost, interruptible delivery service. This gives the pipeline operator flexibility to deliver gas first to firm customers, after which the remaining capacity is made available to interruptible customers.
HubsCreation of natural gas market centers and hubs began in the late
1980s in the United States. These evolved as an outgrowth of natural gas market restructuring and the execution of a number of FERC Orders (described earlier) that forced interstate gas pipeline companies to become primarily natural gas transporters.
The most prominent U.S. market center for natural gas is the Henry Hub, the location of a gas plant on the natural gas pipeline system in Erath, Louisiana (approximately 15 miles south of Lafayette and 60 miles southwest of Baton Rouge). The Henry Hub, which has been the pricing point since 1992 for natural gas futures contracts traded on the NYMEX, interconnects with nine interstate and four intrastate pipelines. North American unregulated wellhead and burner-tip natural gas prices are closely correlated to those set at Henry Hub.
European gas hubs
Market hubs for natural gas trading also arose in Europe over the past several decades, where substantial volumes of gas flow between and within many countries. In 2010, for example, physical spot trading on the seven leading continental hubs reached 4.94 tcf (140 billion cubic meters). Traded (non–spot-market) volumes were about three times that figure.
The seven major European spot-market gas-trading hubs are:•Zeebrugge, Belgium
•TTF (Title Transfer Facility), the Netherlands
•NGC (NetConnect Germany), Germany
•Gaspool, Germany
•PEGs (Gas Exchange Points) North and South, France
•PSV (Punto di Scambio Virtuale), Italy
•CEGH (Central European Gas Hub), Austria

Chapter 14 Petroleum Trading 267
Market centers or hubs offer two key services: transportation between (and interconnection with) other pipelines; and the physical coverage of the balancing needs associated with short-term gas receipt or delivery. Most will conduct transfer-of-title transactions between parties that buy, sell, or move their natural gas through the center, and many also provide other services that help expedite and improve the overall gas transportation process. These services include Internet-based access to natural gas trading platforms and capacity release programs. At the end of 2008, there were a total of 24 operational market centers in the United States and nine in Canada.
Financial gas marketDeregulation of wellhead prices opened the door to the trading
of natural gas as a commodity on financial exchanges, as well as the straightforward physical transportation and delivery of actual quantities of gas. The players in this part of the arena are traders and brokers, who, unlike marketers, never actually take ownership of the gas. They often make short-term deals—with terms ranging from a few months to as short as one day—seeking to capitalize on anticipated or actual changes in gas prices in different locations. These market participants use a variety of financial tools to spread risk, stabilize prices, and enable an owner of a quantity of gas to quickly convert that asset into cash if desired. The information provided earlier in this chapter about physical versus paper trading, the spot market, and the use of futures contracts, options contracts, and swaps in oil trading applies equally in the natural gas market.
LDC role in gas marketingReflecting developments in the industrial and large-volume gas sales
market, LDCs have offered customer-choice programs—also known as retail unbundling programs—since 1998 to residential and commercial customers. Under these programs, consumers can select their own gas provider. When a customer buys gas from a provider other than the LDC, the LDC still delivers it, even though the LDC is not involved in the sales transaction. In essence, the customers who switch to another provider become transportation-service customers for the LDC.
Despite this change in the traditional LDC/customer relationship, LDCs continue to promote efficient and safe use of the natural gas they deliver and to offer technical support to engineers, architects, builders,
The Oil & Gas Industry: A Nontechnical Guide268
and commercial and industrial customers seeking to buy or install equipment. Many also offer energy-conservation programs and energy audits to customers.
Few LDCs directly sell gas-fueled equipment. Nevertheless, some do participate in cooperative advertising campaigns with appliance manufacturers and local dealers.
LNG tradingChapter 10 described the equipment and processes used to convert
wellhead natural gas to supercold liquid form (LNG) for transport to customers. This section briefly describes some of the major financial and business aspects of LNG production and shipment.
The typical LNG project is both large and complex, involving not only the upstream operation of liquefaction plants and export facilities (for producing, temporarily storing, and then loading LNG onto specially designed tanker ships) but also the chartering and travel of those ships to import facilities (at which the LNG is regasified and introduced into pipelines for distribution). Each LNG project has its own unique characteristics and organizational structure, determined by legal and financial issues, ownership of the gas itself, political goals of the exporting country, and decisions about responsibility for various aspects of the value chain, described above.
Gas producers—sometimes including (or solely) an NOC (see chap. 13)—tend to be involved chiefly in the gas production and liquefaction stages. They also may want control of the LNG shipping process. However, LNG customers are said to be expressing more interest in participating in those upstream stages, to increase security of supply and to participate as investors in the more profitable parts of the LNG chain. They are increasingly acquiring control of LNG shipping and making purchases more often on an FOB basis. Examples include Osaka Gas, Tokyo Gas, Kogas, Union Fenosa, Gas Natural, and Gaz de France.
At the same time, some LNG producers are moving downstream, seeking to secure market outlets through ownership or purchase of access rights to LNG import terminals in competitive markets, thus gaining more control over ultimate sale of the gas. Examples include BP, Shell, Chevron, and ExxonMobil (all IOCs), as well as the NOCs Statoil, Petronas, and CNOOC.
Chapter 14 Petroleum Trading 269
LNG sales have traditionally been on a long-term basis (20 years or more), through purchase contracts with large LDCs or electric power generation companies that are state-owned or have a monopoly service territory. This long-term characteristic of LNG contracts has given shareholders and lenders the confidence to make substantial commitments of capital to LNG projects.
Pricing of LNG has until recently been dependent on the buyer’s market conditions. For a buyer such as a large utility with no pipeline-gas supply (e.g., in Korea and Japan), LNG prices have been set primarily by reference to crude oil—subject to approval by governmental authorities. However, in cases where security of supply has become as important as price, LNG pricing can become more competitive. In Europe, for example, LNG competes with gas delivered by pipeline from Russia and elsewhere; there, LNG pricing tends to follow pipeline pricing, with both generally linked to oil or oil products when they are supplied under long-term contracts. In the United States, LNG is generally priced against the Henry Hub index, often with adjustments for differences in delivery location.
At the same time, the rapid development of an LNG spot market—coupled with growing availability of shipping not committed to long-term contracts—have led to increasing globalization of spot LNG prices. Future expansion of LNG markets will depend on where new gas resources are discovered and developed, and on the relative cost of transporting that gas by pipeline compared to the LNG option. Still, there appears to be growing acceptance of the view that transportation as LNG can be cost competitive, based on evidence of impressive cost reductions over the past decade or so in LNG production and delivery infrastructure. For example, Qatar has put into place very large liquefaction facilities whose economies of scale make it possible to deliver large quantities of gas to the United States at costs competitive with many indigenous North American gas resources. It remains to be seen, however, where future domestic North American gas will come from—the Alaskan North Slope, for example, or the Canadian Arctic, or the burgeoning shale gas formations of the Lower 48—and how the eventual market price for that gas will compare to imported LNG.
The United States may even begin to export LNG as domestic production increases. Two proposals in late 2010 (one by Texas-based Cheniere Energy, the other by Australian bank Macquarie in partnership with Freeport LNG) would liquefy for export as much as 3.4 bcf per day of domestic U.S. natural gas.

Emerging Challenges for the Petroleum Industry
Over the next several decades, the petroleum industry faces a future likely to offer not only significant opportunity but also numerous tests of its ability to adapt and innovate. Disruptive yet potentially energizing trends and issues on the near and immediate horizons include the following:
• IOCs, finding it much harder to access new oil reserves, are having to turn to new areas, such as unconventional oil, deepwater basins, and unconventional gas.
• In 2009, the non-OECD economies were responsible for all of the growth in global energy demand. Since 2000, their share of demand growth has averaged more than 90%, according to BP.
•The influence of OPEC is rising once more, and one member, Iraq, is poised to again become a major global oil supplier in coming years.
• Successful development of natural gas from shale has triggered a reassessment of that fuel’s role, both in the United States and around the world. Several IOCs are studying possible large-scale shale gas production in China.
•The United Arab Emirates is building the first nuclear power plant in the Arab Gulf region—in a country that is one of the top 10 holders of oil reserves in the world. The 1,400-megawatt power station at Braka, in Abu Dhabi—the first of four planned units—is slated to start up in 2017.
•China is simultaneously pursuing oil and gas resources around the world, expanding its SPR, developing renewable energy resources, pushing hard to become more energy efficient, and growing its nuclear power generation capacity.
• Since about 2006, coal has been the fastest-growing primary energy source, used chiefly for power generation in industrializing economies, notably in China.
15
The Oil & Gas Industry: A Nontechnical Guide272
Projections by a range of government agencies and major industry players make it clear that oil and natural gas will continue to play an important role in the global energy marketplace in the next quarter-century. EIA, for example, judges that crude oil and associated liquids will provide approximately 32% of total global marketed energy use in 2035, with natural gas providing 22%.1 (If coal is added to the calculation, fossil fuels will provide just over 80% of total world marketed energy use that year, compared to 84.1% in 2010.)
Of immediate concern, however—to a wide range of companies, not just the petroleum industry—is the lingering burden of a global economic recession that began in 2008, continued into 2009, and was still affecting energy use in 2012 in a number of countries (chiefly the industrialized OECD nations). Recovery has been both uneven and painfully slow. Developing non-OECD Asian economies have led the way, and many are well on the road back to economic health. The recession in the United States may be formally over, but housing and employment data indicate that economic growth is still at anemic levels in early 2012. Recovery is also lagging in Japan, and several European nations (particularly Greece) continue to struggle with serious economic issues.
Looking further ahead, the EIA analysis noted above offers cautious optimism. It assumes that by 2015, most nations of the world will have resumed the expected rates of long-term growth they saw before the recession. For the period from 2007 to 2035, world gross domestic product is expected to rise by an average of 3.2% per year, with non-OECD economies averaging 4.4% and OECD economies 2.0% per year. Against that backdrop, EIA projects total world consumption of marketed energy increases to grow by 49% over the 2007–2035 time frame, with the largest increase occurring (as noted above) in non-OECD economies.2
More-detailed or longer-term prediction of events and trends affecting the petroleum industry is difficult at best. However, it is realistic to expect that the industry will be pushed hard to marshal its resources and skills in new ways as it works to develop oil and gas resources to meet the needs of future energy consumers. The remaining pages of this chapter describe some of the challenges expected to confront the petroleum industry in the decades ahead. The intent here is not to presume knowledge of the answers; rather, the objective is to set forth some of the major issues facing the petroleum industry and to suggest actions likely to be required in a dynamic global energy marketplace.

Chapter 15 Emerging Challenges for the Petroleum Industry 273
Continued Technology DevelopmentLeveraging its own resources with those of government and other
entities, the petroleum industry will need to continue to develop and apply (as it has in the recent past) new technologies to maintain competitive advantage. Anticipated areas of focus include new approaches to:
• Increasing the success rate for finding new hydrocarbon resources and identifying those most promising for development
•Optimizing production from both new and legacy wells
•Controlling operating costs and improving efficiency through expanded use of automation, computer-based technology, advanced imaging systems, and new materials
•Complying with evolving requirements for environmentally acceptable operations.
The first two items of the above list are expected to be of particular importance in the exploitation of such truly challenging frontier resources as methane hydrate or those likely to be found in the Arctic or far below the seafloor, in ultra-deepwater.
Competition from Nonfossil Energy Sources
The EIA projection cited above notes that renewable energy resources accounted for just over 10% of total global energy consumption in 2010. However, this figure is expected to jump to 13.5% by 2035.3 (For more insights into this trend, see the below section “The Chinese Challenge.”)
Of particular interest for the petroleum industry will likely be the growing use of plant and waste materials to produce liquid and gaseous fuels that could compete with oil and gas for market share. From cellulosic ethanol to blue-green algae to advanced digester design, there may be opportunities for the petroleum industry to participate in bringing fuel from renewable resources into the global energy mix.
On a different front, support for nuclear energy as a source for electric power generation is weakening in some countries in the wake of the March 2011 earthquake and tsunami that seriously damaged nuclear

The Oil & Gas Industry: A Nontechnical Guide274
power reactors in Fukushima Prefecture, Japan. Therefore, replacement of some nuclear generating capacity with increasing supplies of natural gas may become attractive.
Climate-Change PolicyWith a view to the big picture, decisions by governments on
whether, how, and when to deal with global climate change would likely have the most significant impact on use of fossil fuels (and renewable energy resources) around the world. The year 2012 marks the end of the first commitment period under the Kyoto Protocol, after which a new international framework will need to be negotiated and ratified. The Kyoto Protocol was signed in 1997 by 84 nations, launching international efforts to control greenhouse-gas emissions and combat global climate change.
Agreements reached at the U.N. climate conference in Cancun, Mexico, in December 2010 gave participating nations another year to decide whether to extend the 1997 Kyoto Protocol. Other provisions established a $100 billion fund to help poor countries adapt to climate change and created new methods to transfer clean energy technology.
Just before the Cancun meeting, Paris-based IEA issued its annual World Energy Outlook, which urged governments to implement their pledges (made in Copenhagen in late 2009) to fight climate change and cut fossil fuel subsidies. The agency warned that failure to do so would drive oil prices significantly higher. IEA noted that the big differences in price and demand outcomes under the different scenarios it evaluated would complicate investment planning by oil and gas companies, as well as policy decisions by OPEC.
At the next UN climate change conference—in Durban, South Africa, November 28–December 11, 2011—negotiators finally agreed at the eleventh hour to be part of a legally binding treaty whose terms are to be defined by 2015 and which would take effect in 2020.
Chapter 15 Emerging Challenges for the Petroleum Industry 275
Industry StructureThe continued viability of the business model of the vertically
integrated major oil company has come into question following (a) the explosion at BP’s Macondo well in the Gulf of Mexico, in April 2010, and (b) the rather lackluster 2005–10 financial performance of the half-dozen supermajor oil companies (described in chap. 13). Some analysts have suggested that spinning off refining assets (as both Marathon and ConocoPhillips did in mid-2011) might make it easier to partner with state-controlled companies or to participate in joint ventures. Others have asserted that separate entities focused on exploration and on production/refining might make more sense. The principal counterargument is that only very large companies can handle the rising costs and risks of exploration as stiffer regulations are developed in response to the Macondo accident.
On a related note, some observers suggest there may be a shift coming in the willingness of large and small companies to work together. Small companies may avoid major projects because of rising costs and potential liabilities; big firms may conclude that small companies don’t have the financial resources to adequately share the risk.
Industry Operations
Workforce demographicsOne of the biggest challenges facing the U.S. petroleum industry is
to build and develop its next-generation workforce to replace (a) the 500,000 industry professionals lost in staff reductions from 1982 to 2000 and (b) the large numbers of baby boomers expected to retire in the next few years. It will be critical that new workers and leaders have not only the required technical training but also the communication and policy-analysis skills to plan and manage large and complex energy development projects.4
An analysis published in September 2011 by Rigzone described several initiatives that can help address the situation. These include competency development for new hires in critical jobs (e.g., reservoir engineering), best-practices collaboration, tailored education initiatives, and increased use of mentoring.5
The Oil & Gas Industry: A Nontechnical Guide276
Role of natural gasCompanies worldwide will likely continue to reassess the relative
focus they give to oil and natural gas development. Firms will determine how the return of natural gas to a dominant position in the U.S. and global energy mix—driven by dramatic production from gas-bearing shales—factors into strategic corporate decisions.
A related issue is LNG’s role in the U.S. and world energy markets. Continuing advances in technology for gasification, storage, regasification, and even ocean shipping could bring down the cost of LNG. Further, as exploration companies pursue ever more remote resources, LNG might take on a more dominant role in bringing that gas to market. A related issue emerging in the United States is the potential for increased exporting of LNG, in view of burgeoning domestic production.
Crude oil qualityFor the projected global increase in demand for crude oil to be met,
some analysts speculate that a portion of tomorrow’s supplies will come from a range of new sources, chief among them Brazil, West Africa, Iraq, Canada, Kazakhstan, and Russia. An analysis in 2010 by Purvin & Gertz suggested that global crude oil is likely to become slightly heavier and more sour (i.e., contain more sulfur) over the next several years.6 The largest net change in crude oil quality during the next 10 years likely will be in North America as Canadian oil, primarily heavy and sour, displaces traditionally sweeter crude from the United States. These expected changes in quality will affect technical refinery operations and will have an impact on feedstock pricing in various markets around the world.
Environmental and safety complianceA major topic of debate in 2011 and 2012 has been the environmental
impact of the hydraulic fracturing process used to extract natural gas from shale formations. Concerns center on possible contamination of groundwater either by (a) the chemicals pumped at high pressure into the ground as part of the fracing fluid or (b) the improper handling of water and fluid brought back to the surface for treatment and disposal. There have also been reports that methane gas (possibly released during fracing) migrates upward through the ground and dissolves into drinking water drawn from aquifers not far below the surface.
Chapter 15 Emerging Challenges for the Petroleum Industry 277
Two other recent significant events were:•The loss of life and highly visible environmental damage
caused by the April 2010 blowout of BP’s deepwater Macondo well in the Gulf of Mexico
•The September 2010 gas pipeline explosion in San Bruno, California (near San Francisco), that killed eight people and destroyed 37 homes
All these incidents underscore how vital it is that the petroleum industry not only comply with regulations but also help all stakeholders understand industry actions taken to ensure public well being. This diligence applies as well to other operations, from the siting of LNG terminals to the construction and operation of refineries and other major energy-system components.
SecurityTerrorist attacks on the United States and other nations since 2000
have heightened the urgency of protecting of the facilities, assets, and staff of the global petroleum industry. Security measures now range from patrolling sea-lanes to prevent pirate attacks on tanker vessels, to strengthening computer and security systems from cyber attack, to carefully managing intellectual property and proprietary information.
Maritime piracy costs the global economy $12 billion per year, according to researchers. Particularly troublesome are the areas off the Gulf of Aden and along the eastern coast of Africa, extending southward from Somalia, through which large numbers of oil tankers move.
Average ransom payments (for hijacked ships of all kinds) jumped to $5.4 million in 2010, compared to just $150,000 in 2005, according to a December 2010 analysis by Colorado-based One Earth Future Foundation. The largest ransoms have been reported for release of oil supertankers; in November 2010, a record $9.5 million was paid for the release of the South Korean VLCC Samho Dream, captured while carrying a cargo of Iraqi oil headed for the United States.7
Also of concern are cyber attacks. The FBI has reported that hackers based in China had stolen information from at least five U.S. oil and gas companies during 2010, including data about the configuration of key equipment.
The Oil & Gas Industry: A Nontechnical Guide278
The Chinese ChallengeAs alluded to at the start of this chapter, all other players on the global
petroleum stage will need to stay abreast of the multifaceted energy strategy being pursued by China. News agencies pay close attention China’s aggressive global search—from Latin America to Africa—for oil and gas (and business deals to secure them) to meet growing domestic demand. China was second only to the United States as a net importer of oil in 2011. Moreover, China has been active on the international scene (see chap. 13), buying minority stakes in challenging deepwater blocks overseas. The country’s first deepwater drilling platform was under construction in 2011 in Shanghai.
China is also aggressively pursuing energy conservation and development of non–fossil fuel (nonfossil) resources, as ways to achieve energy security and to reduce combustion-related emissions. For example, China aims to cut carbon emissions by 40%–45% before 2020 and meet 15% of domestic energy needs using nonfossil resources. Two parts of that program will be the expanded use of nuclear energy for power generation and a $750 billion stimulus program for renewable energy development. The latter includes not just wind, solar, and hydropower but also unconventional gas (e.g., from coal seams or shale) and clean coal.
Other International InteractionsA reversal of roles is occurring between NOCs in resource-rich
countries and their traditional IOC rivals. In the past, the IOCs offered capital and technology to nations seeking to develop their hydrocarbon resources, under profitable contract arrangements. Now, however, many NOCs have access to funds from other sources (including their own treasuries) and can seek help instead from major global service companies.
The supermajors will have to adapt to survive. As described in chapter 13, it appears that IOCs will need to work harder to convince NOCs and host governments that they can provide value beyond just finding and producing oil and gas.
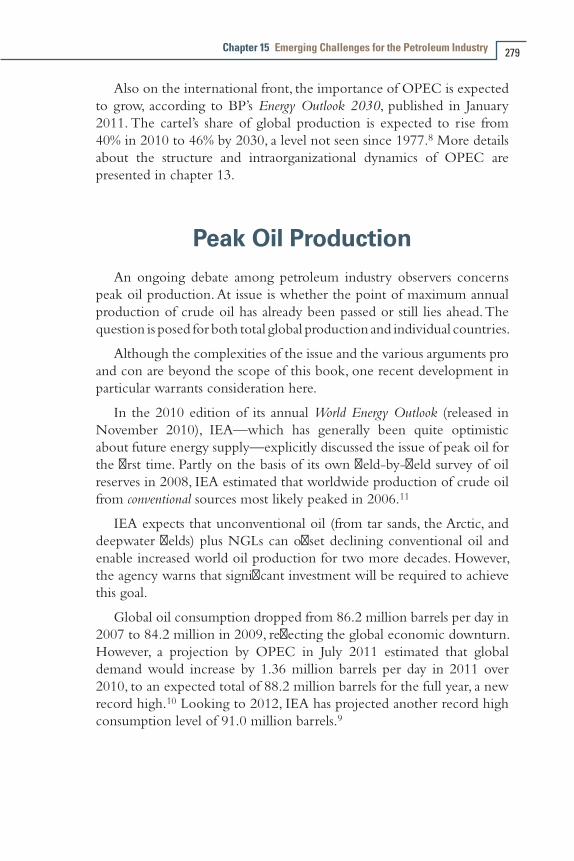
Chapter 15 Emerging Challenges for the Petroleum Industry 279
Also on the international front, the importance of OPEC is expected to grow, according to BP’s Energy Outlook 2030, published in January 2011. The cartel’s share of global production is expected to rise from 40% in 2010 to 46% by 2030, a level not seen since 1977.8 More details about the structure and intraorganizational dynamics of OPEC are presented in chapter 13.
Peak Oil ProductionAn ongoing debate among petroleum industry observers concerns
peak oil production. At issue is whether the point of maximum annual production of crude oil has already been passed or still lies ahead. The question is posed for both total global production and individual countries.
Although the complexities of the issue and the various arguments pro and con are beyond the scope of this book, one recent development in particular warrants consideration here.
In the 2010 edition of its annual World Energy Outlook (released in November 2010), IEA—which has generally been quite optimistic about future energy supply—explicitly discussed the issue of peak oil for the first time. Partly on the basis of its own field-by-field survey of oil reserves in 2008, IEA estimated that worldwide production of crude oil from conventional sources most likely peaked in 2006.11
IEA expects that unconventional oil (from tar sands, the Arctic, and deepwater fields) plus NGLs can offset declining conventional oil and enable increased world oil production for two more decades. However, the agency warns that significant investment will be required to achieve this goal.
Global oil consumption dropped from 86.2 million barrels per day in 2007 to 84.2 million in 2009, reflecting the global economic downturn. However, a projection by OPEC in July 2011 estimated that global demand would increase by 1.36 million barrels per day in 2011 over 2010, to an expected total of 88.2 million barrels for the full year, a new record high.10 Looking to 2012, IEA has projected another record high consumption level of 91.0 million barrels.9

The Oil & Gas Industry: A Nontechnical Guide280
Final ThoughtsSpecific details and a timetable for the evolution of the petroleum
industry are impossible to predict. Nevertheless, it can be said that the early 21st century is already creating the conditions—as well as the requirement—for innovation.
New thinking, new practices, and new technology will be needed to address the growing confluence of concern about climate change, energy security, resource nationalization, and rising energy prices. Success will come to those in the industry who put innovation at the core of their business strategies, upstream, midstream or downstream—from the wellhead to the point of use of oil, natural gas, and their many derivative products.
References 1 U.S. Energy Information Administration. International Energy
Outlook 2011. http://www.eia.gov/oiaf/ieo/world.html (accessed September 30, 2011).
2 Ibid.
3 Ibid.
4 Sloan, L. 2010. The challenges facing America’s 21st century oil and gas workforce. In 2010 International Petroleum Encyclopedia. Tulsa, OK: PennWell.
5 Saunders, B. The oil & gas industry’s great crew change (series): What’s expected to happen, and how companies are preparing. September 2011. Rigzone, Houston, TX.
6 Houlton, G. (Purvin & Gertz; Houston). 2010. Crude demand to increase, feed-quality changes in store. In Oil & Gas Journal. December 6: 119. Tulsa, OK: PennWell.
7 Bowden, A. The economic cost of maritime piracy: Working paper. December 2010. Broomfield, CO: One Earth Future Foundation.
8 BP. 2011. Energy Outlook 2030. http:www.bp.com. BP. London
9 IEA. 2010. World Energy Outlook 2010. Paris.
10 OPEC. Monthly oil market report. July 2011. Vienna.
11 IEA. 2010.
Terms, Abbreviations, and Acronyms
2D, 3D, 4D: two-, three-, four-dimensional seismic
AC: alternating current
AUV: autonomous underwater vehicle
AVA: amplitude variation with angle
AVO: amplitude variation with offset
b: billion
BHA: bottom-hole assembly
bbl: barrel
bcf: billion cubic feet
bcm: billion cubic meters
boe: barrels of oil equivalent
BOP: blowout preventer
bpd (b/d): barrels per day
bph: barrels per hour
BS&W: basic sediment and water
Btu: British thermal unit
capex: capital expenditure
cd: calendar day
cf: cubic feet
CFC: chlorofluorocarbon
CO2: carbon dioxide
CSEM: controlled-source electromagnetic
AAppendix
The Oil & Gas Industry: A Nontechnical Guide282
CT: compliant tower; or, computerized tomography
CTD: coiled-tubing drilling
CTE: coal tar enamel
DSU: drilling spacing unit
ERW: electric resistance welding
DA: direct assessment
DC: direct current
DP: dynamic positioning
DST: drill stem test
DSV: diver support vessel
EM: electromagnetic
EOR: enhanced oil recovery
ERD: extended-reach drilling
ESP: electrical submersible pump
FBE: fusion-bond epoxy
FDPSO: floating, drilling, production, storage, and off-loading vessel
FEED: front-end engineering and design
FEWD: formation evaluation while drilling
FMEA: failure modes and effects analysis
FPS: floating production system
FPSO: floating production, storage, and off-loading vessel
FSO: floating storage and off-loading vessel
ft: feet
F-T: Fischer-Tropsch
gal: gallon
GLR: gas : liquid ratio
GOC: gas-oil contact
GOM: Gulf of Mexico
GOR: gas : oil ratio
Appendix A Terms, Abbreviations, and Acronyms 283
gph: gallons per hour
GPS: Global Positioning System
GTL: gas to liquids
HCWC: hydrocarbon-water contact
HDD: horizontal directional drilling
HPHT: high-pressure/high-temperature
H2S: hydrogen sulfide
HSE: health, safety, and the environment
HSP: hydraulic submersible pump
Hz: hertz (cycles per second)
ILI: internal line inspection
IMP: integrity management plan
in.: inches
IOC: international oil company
km: kilometers
LDC: local distribution company
LNG: liquefied natural gas
LPG: liquefied petroleum gas
LWD: logging while drilling
m: meters
M: thousand
MAOP: maximum allowable operating pressure
Mcf: thousand cubic feet
Mcfd: thousand cubic feet per day
MDT: thousand decatherms
MFL: magnetic flux leakage
mi.: miles
MM: million
MODU: mobile offshore drilling unit
The Oil & Gas Industry: A Nontechnical Guide284
MSV: multipurpose service vessel
MT: metric ton
MWD: measurement while drilling
NGL: natural gas liquids
NGO: nongovernmental organization
NMR: nuclear magnetic resonance
NOC: national oil company
OBM: oil-based mud
OD: outside diameter
OWC: oil-water contact
PD: positive displacement
PDC: polycrystalline diamond compact
PLT: production logging tool
ppm: parts per million
PSA: production-sharing agreement
PSC: production-sharing contract
psi: pounds per square inch
psia: pounds per square inch absolute
psig: pounds per square inch gauge
PVT: pressure volume and temperature
RF: recovery factor
ROP: rate of penetration
ROV: remotely operated vehicle
ROW: right-of-way
rpm: revolutions per minute
RVP: Reid vapor pressure; or, pounds Reid vapor pressure
SBHP: static bottom-hole pressure
SBM: single-buoy mooring
SCADA: supervisory control and data acquisition

Appendix A Terms, Abbreviations, and Acronyms 285
SCC: stress corrosion cracking
scf: standard cubic foot
SI: International System of Units
SiO2: silicon dioxide (quartz)
SMYS: specified minimum yield strength
SNG: synthetic natural gas
SOBM: synthetic oil-based mud
SPR: strategic petroleum reserve
STP: standard conditions of temperature and pressure
t: tons
TAPS: Trans-Alaska Pipeline System
tcf: trillion cubic feet
TD: total depth
TEG: triethylene glycol
TLP: tension-leg platform
ULCC: ultralarge crude carrier
UR: ultimate recovery
USD: U.S. dollars
UT: ultrasonic testing
UV: ultraviolet
VLCC: very large crude carrier
VSP: vertical seismic profiling
WBM: water-based mud
WOB: weight on bit
WOC: wait on cement
WTI: West Texas Intermediate

Further Reading
Technical Books and Professional Articles
Ahlbrandt, T. S., R. R. Charpentier, T. R. Klett, J. W. Schmoker, C. J. Schenk, and G. F. Ulmishek. 2005. Global Resource Estimates from Total Petroleum Systems. Alexandria, VA: American Association of Petroleum Geologists.
Ahmed, T. 2006. Reservoir Engineering Handbook. 3rd ed. Oxford, UK: Gulf.
American Petroleum Institute. 2008. Specification for pipeline. API 5L. 44th ed. Washington, DC: American Petroleum Institute.
Archer, J. S., and C. G. Wall. 1999. Petroleum Engineering: Principles and Practice. Berlin: Kluwer Academic.
Azar, J. J., and G. R. Samuel. 2007. Drilling Engineering. Tulsa, OK: PennWell.
Brantly, J. E. 1971. History of Oil Well Drilling. Houston: Gulf Publishing Co.
Burdick, D. L., and W. L. Leffler. 2001. Petrochemicals in Nontechnical Language. 3rd ed. Tulsa, OK: PennWell.
Busby, R. L. 1999. Natural Gas in Nontechnical Language. Tulsa, OK: PennWell.
Center for Energy Economics at the Bureau of Economic Geology. 2007. Introduction to LNG. Austin, TX: University of Texas at Austin.
Consentino, L. 2001. Integrated Reservoir Studies. Paris: Institut Français du Pétrole.
Dake, L. P. 2004. The Practice of Reservoir Engineering. Revised ed. Oxford, UK: Elsevier.
BAppendix

The Oil & Gas Industry: A Nontechnical Guide288
Devereux, S. 1999. Drilling Technology in Nontechnical Language. Tulsa, OK: PennWell.
Economides, M., L. Watters, and S. Dunn-Norman. 1997. Petroleum Well Construction. Hoboken, NJ: Wiley.
Gluyas, J., and R. Swarbrick. 2003. Petroleum Geoscience. Oxford, UK: Blackwell Science.
Hyne, N. J. 2001. Nontechnical Guide to Petroleum Geology, Exploration, Drilling, and Production. 2nd ed. Tulsa, OK: PennWell.
Jahn, F., M. Cook, and M. Graham. 2008. Hydrocarbon Exploration and Production. 2nd ed. Oxford, UK: Elsevier.
Johnston, D. 1994. International Petroleum Fiscal Systems and Production Sharing Contracts. Tulsa, OK: PennWell.
Joshi, S. A. 1991. Horizontal Well Technology. Tulsa, OK: PennWell.
Kearey, P., M. Brooks, and L. Hill. 2002. An Introduction to Geophysical Exploration. 3rd ed. Oxford, UK: Blackwell Science.
Leffler, W. L. 2000. Petroleum Refining in Nontechnical Language. 3rd ed. Tulsa, OK: PennWell.
Leffler, W. L., R. A. Pattarozzi, and G. Sterling. 2003. Deepwater Petroleum Exploration and Production: A Nontechnical Guide. Tulsa, OK: PennWell.
Magoon, L. B., and W. G. Dow. 1994. The Petroleum System: From Source to Trap. Alexandria, VA: American Association of Petroleum Geologists.
McAleese, S. 2000. Operational Aspects of Oil and Gas Well Testing. Oxford, UK: Elsevier.
Miesner, T. O., and W. L. Leffler. 2006. Oil & Gas Pipelines in Nontechnical Language. Tulsa, OK: PennWell.
National Energy Board. 2006. Canada’s Oil Sands: Opportunities and Challenges to 2015. Ottawa, ON: National Energy Board.
North, F. K. 1985. Petroleum Geology. London: Allen & Unwin.
Odell, P. R. 2004. Why Carbon Fuels Will Dominate the 21st Century’s Global Energy Economy. Brentwood, UK: Multi-Science.
Parkash, S. 2003. Refining Processes Handbook. Oxford, UK: Gulf Professional Publishing (imprint of Elsevier, Inc.).
Perrin, D. 1999. Well Completion and Servicing. Paris: Institut Français du Pétrole.

Appendix B Further Reading 289
Raymond, M. S., and W. L. Leffler. 2005. Oil & Gas Production in Nontechnical Language. Tulsa, OK: PennWell.
Rider, M. L. 1996. The Geological Interpretation of Well Logs. Caithness, Scotland: Whittles.
Selley, R. C. 1997. Elements of Petroleum Geology. 2nd ed. Tulsa, OK: PennWell.
Tiab, D., and E. Donaldson. 2004. Petrophysics: Theory and Practice of Measuring Reservoir Rock and Fluid Transport Properties. 2nd ed. Houston: Gulf Professional Publishing (imprint of Elsevier, Inc.)
Tiratsoo, E. N. 1986. Oilfields of the World. 3rd ed. Houston: Gulf Publishing Co.
Tusiani, M. D. 1996. The Petroleum Shipping Industry: Operations and Practices. Tulsa, OK: PennWell.
Tusiani, M. D., and G. Shearer. 2007. LNG: A Nontechnical Guide. Tulsa, OK: PennWell.
General InterestBernstein, P. L. 1998. Against the Gods: The Remarkable Story of Risk.
Hoboken, NJ: Wiley.
Campbell, C. J. 2005. Oil Crisis. Brentwood, UK: Multi-Science Publishing.
Cordesman, A. H., and K. R. al-Rodhan. 2006. The Global Oil Market: Risks and Uncertainties. Washington, DC: Center for Strategic and International Studies Press.
Deffeyes, K. S. 2001. Hubbert’s Peak: The Impending World Oil Shortage. Princeton, NJ: Princeton University Press.
Downey, M. 2009. Oil 101. New York: Wooden Table.
Marcel, V. 2006. Oil Titans: National Oil Companies in the Middle East. London: Chatham House.
Margonelli, L. 2007. Oil on the Brain: Adventures from the Pump to the Pipeline. New York: Nan A. Talese/Doubleday.
Maugeri, L. 2006. The Age of Oil: The Mythology, History, and Future of the World’s Most Controversial Resource. Westport, CT: Praeger.

The Oil & Gas Industry: A Nontechnical Guide290
Simmons, M. R. 2005. Twilight in the Desert: The Coming Saudi Oil Shock and the World Economy. Hoboken, NJ: Wiley.
Smil, V. 2008. Oil. Oxford, UK: Oneworld.
Van Vactor, S. 2010. Introduction to the Global Oil & Gas Business. Tulsa, OK: PennWell.
Yergin, D. 1991. The Prize: The Epic Quest for Oil, Money and Power. New York: Simon & Schuster.
Yergin, D. 2011. The Quest: Energy, Security and the Remaking of the Modern World. New York: Simon & Schuster.
Other Information SourcesBaker Hughes. http://www.bakerhughes.com/
BP Statistical Review of World Energy. http://www.bp.com/
ODS-Petrodata. http://www.ods-petrodata.com/
Oil & Gas Journal. http://www.ogj.com/
Rigzone. http://www.rigzone.com/
World Oil. http://www.worldoil.com/

Organizations, Agencies, and Professional Societies
Trade Associations and Professional Societies
American Association of Petroleum Geologists (AAPG), http://www.aapg.org/
American Gas Association (AGA), http://www.aga.org/
American Petroleum Institute (API), http://www.api.org/
American Society of Mechanical Engineers (ASME)http://www.asme.org/
Association of Oil Pipe Lines (AOPL), http://www.aopl.org/
ASTM International (formerly American Society for Testing and Materials), http://www.astm.org/
Gas Processors Association (GPA), http://www.gasprocessors.com/
Gas Technology Institute (GTI) (formerly Gas Research Institute [GRI]), http://www.gastechnology.org/
Independent Petroleum Association of America (IPAA), http://www.ipaa.org/
Interstate Natural Gas Association of American (INGAA), http://www.ingaa.org/
Interstate Oil and Gas Compact Commission (IOGCC), http://www.iogcc.state.ok.us/
Natural Gas Supply Association (NGSA), http://www.ngsa.org/
SAE International (formerly Society of Automotive Engineers), http://www.sae.org/
CAppendix

The Oil & Gas Industry: A Nontechnical Guide292
Society of Economic Geologists, http://www.segweb.org/
Society of Exploration Geophysicists, http://www.seg.org/
Society of Petroleum Engineers (SPE), http://www.spe.org/
U.S. Government AgenciesBureau of Labor Statistics (BLS) (part of the Department of Labor),
http://www.bls.gov/
Bureau of Ocean Energy Management, Regulation and Enforcement (BOEMRE) (formerly Minerals Management Service; part of the Department of the Interior), http://www.boemre.gov/
Department of Energy (DOE), http://www.energy.gov/
Department of the Interior (DOI), http://www.doi.gov/
Department of Transportation (DOT), http://www.dot.gov/
Energy Information Administration (EIA) (part of the Department of Energy), http://www.eia.doe.gov/
Environmental Protection Agency (EPA), http://www.epa.gov/
National Oceanic and Atmospheric Administration (NOAA) (part of the Department of Commerce), http://www.nws.noaa.gov/
National Transportation Safety Board (NTSB), http://www.ntsb.gov/
Occupational Safety and Health Administration (OSHA) (part of the Department of Labor), http://www.osha.gov/
Pipeline and Hazardous Materials Safety Administration (PHMSA) (part of the Department of Transportation), http://www.phmsa.dot.gov/

Appendix A Terms, Abbreviations, and Acronyms 293
International Energy OrganizationsInternational Energy Agency (IEA) (part of the Organization for Economic
Cooperation and Development [OECD]), http://www.iea.org/
International Maritime Organization (IMO) (part of the United Nations), http://www.imo.org/
International Organization for Standardization (ISO), http://www.iso.org/
National Energy Board (NEB) (Canada), http://www.neb-one.gc.ca/
Organization of the Petroleum Exporting Countries (OPEC), http://www.opec.org/

Index
A Glossary of terms, abbreviations, and acronyms is provided starting on page 281.
Aabiogenic (inorganic) process, 5absolute open flow tests, 87absorption oil, 126–127Abu Dhabi, 233, 258, 271Abu Dhabi National Oil, 229, 234access to new oil reserves, 271acid gas, 126acidizing, 33, 93acid job, 93active, 53–56active seismic survey, 53additives, 210Africa. See also specific countries, 6, 11,
42, 254, 277Agip, 226Alaska, 181Alberta
oil-sands projects, 122shale gas, 36tar-sands, 122
Algeria, 12, 180, 229, 257alkanes (paraffins), 9alkylates, 210alkylation, 207, 208American Association of Petroleum
Geologists, 230American Petroleum Institute (API).
See API (American Petroleum Institute)
American Society for Testing and Materials, 175
American Society of Mechanical Engineers, 141
amine treating, 209amine washing, 209Amoco, 227Anadarko Petroleum, 231, 234Anglo-Iranian Oil, 227Anglo-Persian Oil Company, 226Annual Energy Outlook (Energy
Information Agency), 25, 26annular preventer, 80annulus, 79, 91–92anticlinal traps, 6API (American Petroleum Institute)
BOP design, 80construction standards, 193drilling success rate, 68early drilling exploration, 51exploration timeframe, 68hydraulic fracturing, 94oil and gas leakage, 141pipe standards, 135standards, 217
API gravity, 10, 217, 259appraisal, 14aquifers, 168Arabian Light crude benchmark, 255Arctic Ocean oil exploration, 19Arctic oil fields, 233, 279Arctic region, 16, 35, 179, 269, 273Argentina, 235Arkansas, 36aromatic hydrocarbons, 9Asia. See also specific countries, 180, 218,
238, 243, 244, 246, 254, 272asphaltenes, 9asphalt/tar, 195assay analysis, 10associated gas, 32, 123Association of Oil Pipe Lines, 141

The Oil & Gas Industry: A Nontechnical Guide296
Atlantic Richfield Company (Arco), 227
atmospheric corrosion, 177atmospheric distillation, 199Australia, 34, 36, 186, 231Austria, 236, 266automatic custody transfer (ACT)
units, 133Azerbaijan, 234, 250Azurite, 112
BBahrain, 239Baker Hughes, 19Bakken formation, 96Bangladesh, 250Bankers Petroleum, 231barge price, 258Barnett shale, 33, 95barrels of oil equivalent (boe), 16Barrett Resources, 231base gas, 169basic refineries, 211basic sediment and water (BS&W),
133basket, 256Belgium, 227, 260, 279benchmark crudes, 10–12, 255benchmark pricing, 257benchmarks, 10, 255benchmark uses, 258benzene, 202, 208, 219BHP Billiton, 231biofuel consumption, 26biomineralization, 6Bishop Process, 190bit breaker, 78bitumen, 12, 122, 203black shale, 30blending/finishing, 210blind ram, 81blind shear ram, 81blowout preventer (BOP), 79–80,
103–104, 118blowout prevention, 79–81blue-green algae, 273boil-off, 180bonuses, 51bottom-hole treatment, 90–91
BP, 16, 226, 227, 233, 234, 235, 268, 275, 278
branded stations, 264Brazil, 25, 229, 235, 279Brent Blend, 12Brent Blend benchmark, 11Brent crude benchmark, 255Brent crude pricing, 238Brent crude vs. West Texas
Intermediate (WTI), 255–256Bridas Energy Holdings, 235brine, 8British Columbia, 36British Gas, 231British Petroleum, 227bubble caps, 200building profile tests, 87bullets, 61Bureau of Ocean Energy
Management, 193Burlington Resources, 227butadienes, 219butanes, 158, 182, 198, 208, 218, 222butylenes, 206, 207, 219, 222
Ccable tool drilling, 69Cabot Oil and Gas, 231Cairn Energy, 231caissons, 107California, 96, 163, 277Canada
Encana shale gas, 234future position, 276gas production, 43independents, 231Keystone XL pipeline, 137major gas shale plays, 33market centers, 267oil production, 25shale gas, 36supermajors, 227tar sands/oil sands, 13unconventional natural gas, 35
Canadian-U.S. Keystone XL pipeline, 137
capacity classification, 212capacity utilization, 241carbonate system, 6carbon atoms, 214

Index 297
carbon black, 224carbon dioxide, 158, 182cargo price, 258cargo tanks, 187Carnavon Petroleum, 231cased-hole log, 87cash price, 257casing, 89–90casingheads, 92casing strings, 90cast iron pipe, 175catalytic cracking (cat cracking), 202,
204–206catalytic hydrodesulfurization, 209catalytic hydrotreating, 209catalytic reforming (cat reforming),
207–208cathodic protection, 170, 177cavern storage, 215–216cellar, 68cellulosic ethanol, 273cementing plug, 90centralizers, 90Cepsa, 227, 233CFR (cost and freight), 262charge capacity, 212charter agreements, 261chemical flood, 121chemical products, 22Chesapeake Energy, 96, 231, 235Chevron, 16, 226, 227, 235, 268CHF (cost, insurance, and freight),
262China
clean coal, 278cyber attacks from, 277drill rig construction, 234energy conservation, 278energy industry reorganization,
229global gas demand projections,
44global outreach, 234–235nuclear power, 278oil and gas resources, 271oil demand in, 12, 26, 238refinery expansion, 250renewable energy resources, 278shale gas production, 271SPRs (Strategic Petroleum
Reserves), 154
unconventional natural gas, 189, 278
China National Offshore Oil Corporation (CNOOC), 96, 229, 235, 250, 268
China National Petroleum Corporation (CNPC), 229, 235, 250
China Petroleum and Chemical Corporation (Sinopec), 229
Chinese challenge, 278choke manifold, 81Christmas tree, 92, 115circulating system, 78–79city gate station, 158, 173classification schemes, 10clean coal, 278cleaning pipelines, 170clean mud, 79climate-change policy, 274coal, 52, 271, 272, 278coal-bed methane, 34–35coal beds, 43coal seams, 84, 127–128, 278Cognac platform, 84coke, 203coke drums, 203coked up equipment, 204coking, 203coking refineries, 212Colorado, 96combination, 206–207Compania Espanola de Petroles
(Cepsa), 227, 233completed well, 64completion plan, 88complexity classification, 211–212compliant-tower platform, 109compressed natural gas, 221compressor station, 164condensate, 30–31, 131, 182condensate wells, 123conductor pipe, 90Conoco, 227ConocoPhillips, 181, 227, 275contamination of groundwater, 97contract of affreightment (COA), 261conventional crude oil
benchmark crudes, 10–12

The Oil & Gas Industry: A Nontechnical Guide298
classification schemes, 10crude oil prices, 12–13
conventional natural gas, 31–32conventional oil reserves, 13conversion. See also cracking, 202–
208copper tubing, 175core barrel, 61coriolis meters, 167corrosion, 142, 163, 170, 177corrosion control, 177costs of wells, 58cracking
alkylation, 207catalytic cracking, 204–206combination, 206–207modification, 207–208polymerization, 206thermal cracking, 202–204
cracking refineries, 212crude oil
composition of, 9conventional crude oil, 10–13prices, 12–13production, 26product standards, 217properties of, 195quality, 276storage tanks, 152supply, global, 240transportation of, 149–151
crude slate, 195cryogenic (ultracold) liquid, 179Cuba, 234, 235Cubapetroleo, 235Cushing, Oklahoma, 10–11, 135, 255,
259cushion gas, 169Cutback Ridge shale project, 234cuts, 199cuttings evaluation, 64cyber attacks, 277cyclic steam injection, 121cycloalkanes (napthenes), 9
DDDP (delivered duty paid), 262DEA (diethanolamine), 209deadweight metric tonnage (DWT), 150dealer-tank-wagon price, 259
debottlenecking, 241decline rate, 87deep gas, 33deepwater fields, 14, 279Deepwater Horizon platform, 144dehydration, 182delayed coker, 203delivery lines, 135Denmark, 231density of oil, 10depleted reservoirs, 168derrick, 71desalters, 197Det Norske Veritas, 81development drilling, 67development economics, 65deviated drilling. See directional
drillingDevon Energy, 231Dhirubhai Deepwater KG2, 103diesel fuels, 195, 209, 217dimerization, 206direct assessment (DA), 142directional (deviational) drilling,
82–85directional drilling, 19, 33, 82, 84dissolved salts, 197distillation, 197–198distillation column, 200distillation curve, 198–199distillation temperature profile
(DTP), 217distribution mains, 174distribution systems
city gate station, 173corrosion control, 177gas leakage minimization, 176–
177peak shaving, 177–178piping materials, 175–176piping network, 173–175
DOE (U.S. Department of Energy). See U.S. Department of Energy (DOE)
dolostone, 6double containment LNG tank, 184double-hull tankers, 150downhole drill pipe, 73downhole steerable assembly, 82–83drawdown profile tests, 87
Index 299
drawworks, 71–72drill bits, 75–78drilling and completion, offshore
drilling barge, 100exploratory drilling, 99–103fixed development and
production platforms, 105–109floating development and
production platforms, 110–113mobile offshore drilling unit
(MODU), 100–103well completion, 103–105
drilling and completion, onshorecable tool drilling, 69onshore well completion, 88–92rotary drilling, 70–86site preparation and well
construction, 67–69well testing, 87well treatment, 93–98
drilling barges, 100drilling fluid, 78–79drilling mud, 60, 103–104drilling space unit (DSU), 67drilling techniques
about, 81directional (deviational) drilling,
82–85extended reach drilling, 85–86horizontal drill wells, 86laterals, 86precision drilling, 85
drill pipe, 73drill pipe section, 75drill ship, 102–103drill stem flow testing, 64drill string, 73–74, 75, 77, 103–104drill-time logs, 62dry gas, 5dry subsea wellhead, 104Dubai, 258, 260Dubai Mercantile Exchange (DME),
254–255Dubai-Oman benchmark, 11ductile iron pipe, 175dynamic positioning, 102, 111
EEagle Ford oil shale, 96, 234Ecuador, 237Egypt, 12, 150, 238
(EIA) Energy Information Agency. See Energy Information Agency (EIA)
elastic systems, 6Elf Aquitane, 227Encana, 234end-product fuels, 14energy companies, 18energy conservation, 278Energy Information Agency (EIA)
Annual Energy Outlook 2010, 25Annual Energy Outlook 2011, 26capacity utilization, 212, 241global gas demand projections,
44global oil sources, 15International Energy Outlook 2010,
96local distribution companies
(LDCs), 173natural gas production, 45oil transportation, 151projected natural gas trends, 42refineries, 240refining capacities, 242shale basins, 36strategic petroleum reserves, 155unconventional natural gas,
35–36underground storage, 168, 169U.S. domestic oil imports, 20U.S. domestic oil production, 19U.S. natural gas consumption, 45U.S. natural gas demand, 45U.S. proved (recoverable) natural
gas, 38, 43Energy Outlook 2010 (BP), 278Energy Policy Act of 2005, 97engine/compressor systems, 164–165enhanced oil recovery, 120enhancement
about, 208–209amine treating, 209hydroprocessing, 209solvent extraction, 209sweetening, 209
Eni, 226environmental and safety issues,
276–277Environmental Protection Agency
(EPA), 97–98, 128, 192EOG Resources, 231

The Oil & Gas Industry: A Nontechnical Guide300
equity oil, 230Erath, Louisiana, 266Ernst and Young, 233Esso, 226ethane, 127, 158, 182, 202, 207, 215,
222ethanol, 210, 222ethylbenzene, 208ethylene, 212, 215, 218, 219, 222ethylene cracker, 202ethylene glycol, 222ethylene oxide, 222Europe. See also specific countries, 11,
12, 21, 38, 98, 189, 243, 244, 245, 266, 269, 272
European Center for Energy and Resource Security, 38
European gas hubs, 266European Union, 12evaluation methods and tools
about, 59cuttings evaluation, 64drill stem flow testing, 64other evaluation methods, 63–65real-time measurement methods,
62–63well logging, 60–62
exchange-based trading, 255exchanges, 254–255exchange-traded funds, 255exploration activities
about, 51geochemical methods, 52geologic methods, 52geophysical methods, 52
exploration and production licenses, 50
exploration drillingobjective of, 59success rate, 58
exploratory drilling, 57–59, 99–103export riser, 146extended reach drilling, 85–86external corrosion, 177extraheavy oil, 12ExxonMobil, 16, 19, 86, 226, 241,
268Exxon Valdez, 150
Ffault traps, 7Fayetteville shale, 95FCC gasoline, 210Federal Energy Regulatory
Commission (FERC), 161, 162, 192, 265
feeder mains, 160, 173, 175feedstocks, 218financial estimates, 65financial gas model, 267Financial Times, 11, 232, 234Financial Times Global 500, 232fireflood (in situ combustion), 122firm delivery, 265Fischer, Franz, 223fixed development and production
platformscompliant-tower platforms, 109gravity-based platforms, 107–108steel-jacket platforms, 105–106tension-leg platforms, 108
fixed platforms, 105fixing a charter, 261flexicokers, 203floating, drilling, production, storage
and off-loading vessel (FDPSO), 112
floating development and production platforms
monohull platforms, 111–112semisubmersible vessels, 110–111spar platforms, 112–113
floating production, storage and off-loading vessel (FPSO), 104, 112, 186
floating storage and off-loading vessels (FSOs), 112, 151
floating storage and regasification unit (FSRU), 192
flowline, 144fluid catalytic cracker (FCC), 205fluid cokers, 203FOB (free on board), 262Forest Oil, 231formation and composition of natural
gas, 29–31formation damage, 93formation pressure, 79
Index 301
forward price, 257foundation piles, 104four-dimensional (4D) seismic
imaging, 57frac fluids
composition of, 97environmental and safety issues,
276quantities, 94recovery of, 95
fractionating tower, 127, 199fractions, 199fracture acidizing, 93fracture gradient, 94fracturing. See hydraulic fracturing
(fracing)Fracturing Responsibility and
Awareness of Chemical Act (FRAC Act), 97
France, 98, 180, 189, 227, 233, 266Frontier Oil, 242fuel lines, 174full containment LNG tank, 184full-conversion refineries, 212futures contracts, 254, 255, 267
GGabon, 236gas-bearing shale, 43, 94gas cap, 10gas consumption trends, 44–46Gas de France, 268gas injection, 121gas leakage, 170gas leakage minimization, 176–177gas lift, 116Gas National, 268gas oil, 202gasoline
additives, 222catalytic cracking, 205conversion, 202distribution and marketing, 264hydroprocessing, 209refineries, 198standards, 217thermal cracking, 202–203
gasoline additives, 210gasoline blendstocks, 207, 208, 210,
219
gasoline stations, 264gas pipeline explosion, 277gas plants, 124–125, 158gas processing operations
about, 125carbon dioxide removal, 126heavier hydrocarbon gas removal,
126–127helium removal, 127hydrogen sulfide removal, 126nitrogen removal, 127water vapor removal, 126
gas productiontrends, projected, 42–43trends, recent, 41–42
Gas Research Institute (GRI). See also Gas Technology Institute (GTI), 128
gas storage, 168–170Gas Technology Institute (GTI), 84gas-to-liquids (GTL) technology,
223–224gas utilities, 158gathering stations, 259gathering system, 158Gazprom, 227, 233, 234geochemical exploration methods, 52geologic exploration methods, 52geophones, 53–54geophysical exploration methods, 52geopressurized gas, 34–35Georgia, 181geothermal gradient, 4Germany, 2, 266global energy demand, 271global gas transmission, 171–172global liquids consumption, 25global oil consumption, 279global oil reserves, 15global recession, 44, 272Gold, Thomas, 5gravel-pack completion, 91gravimetric surveys, 52gravity-based platform, 107–108gravity-based structure (GBS), 185Great Britain, 98Great Recession, 272Greece, 261, 272Greenland, 16groundwater, 128, 276

The Oil & Gas Industry: A Nontechnical Guide302
groundwater contamination, 97GSEs (government-sponsored
enterprises), 229–230GTL (gas-to-liquids) products,
223–224Gulf of Mexico, 14, 19, 31, 81, 84, 85,
111, 113, 144, 145, 149, 181, 231, 275
Gulf Oil, 226, 227
HHaber process, 224hangers, 90Haynesville shale, 95heat fusion, 176heating oil, 209, 217heavier hydrocarbon gas removal,
126–127heavy crude oil, 10heavy distillates, 195heavy fuel oil, 195heavy oil, 12heavy residual fuel oil, 203, 243heavy residual hydro carbons, 198helium, 29, 127, 158helium removal, 127Henry Hub, 266, 269hexane, 208Hibernia platform, 108hoisting equipment, 71–72hoisting line, 77Holly, 242horizontal drain wells, 85horizontal drilling, 33, 41, 232horizontal drill wells, 86hubs
Henry Hub, 266–267marine terminals, 135natural gas trading, 266–267oil trading, 259–260primary, 259
hullers, 61hybrid companies, 229–230hydrate, 35, 145hydraulic fracturing (fracing)
addition deposit recovery through, 14
background, 93–94environmental concerns, 97–98process of, 94–95
production improvement, 19results, 95–96service companies, 232shale gas, 33, 41tight gas, 33water usage, 127
hydrocarbon-bearing formations, 49hydrocarbon processing, 196hydrocarbon traps
combination traps, 8stratigraphic traps, 8structural traps, 6–7
hydrocracking, 205hydrogen, 205, 206, 208hydrogen sulfide, 158, 182, 202, 209hydrogen sulfide removal, 126hydrophones, 56hydroprocessing, 209hydroskimming refineries, 211hydrotreaters, 211
IIEA (International Energy
Association). See International Energy Association (IEA)
Independent Petroleum Association of America (IPAA), 230
independent producers, 230–231India, 36, 103, 155, 218, 227, 234,
244, 250Indiana Gas and Oil Company, 160Indonesia, 236, 250industry operations
crude oil quality, 276environmental and safety issues,
276–277natural gas role, 276security, 277workforce demographics, 275
industry structure, 275Ineros, 235inerts (nonhydrocarbons), 29injection wells, 120insert tricone bit, 75–76in situ combustion, 122inspection and maintenance
of natural gas transmission systems, 170–172
of pipelines, 140–144integrity management plan (IMP), 142

Index 303
Intercontinental Exchange (ICE), 254–255
intermediate casing, 90intermediate delivery, 257internal corrosion, 177internal line inspection, 142International Energy Association
(IEA)Chinese oil companies, 229natural gas future, 46New Policies Scenario (NPT),
26peak oil production, 279strategic petroleum reserves, 154World Energy Outlook, 274, 279
International Energy Outlook 2010 (Energy Information Agency), 35
international interactions, 278–279International Maritime Organization,
149, 150, 193international oil companies (IOCs)
access to new oil reserves, 271OPEC and, 236origins of, 226–227vs. national oil companies
(NOCs), 233–235, 278interruptible delivery, 265Interstate Natural Gas Association of
America, 141interstate pipeline companies, 161IOCs (international oil companies).
See international oil companies (IOCs)
Ipic, 233Iran, 12, 13, 42, 228, 236, 239, 251,
257Iranian Revolution, 256Iraq, 234, 236, 238, 257, 271, 276, 277isobutane, 207, 208isobutylene, 206isohexane, 208isomerates, 210isomerization, 208isooctane, 206isoparaffins, 208isopentane, 208Italy, 226, 261, 266
Jjack-up rigs, 100, 101Japan, 155, 181, 189, 231, 238, 269,
272, 274Japex, 231jet engine fuels, 195jet fuels, 205, 209, 217joint(s), 73, 135joint ventures, 19, 223, 250, 275jumper, 144
KKansas, 96Kazakhstan, 25, 239, 276kelly, 72, 73, 75kelly bushing, 72, 73kerogen, 2, 3, 5, 13kerosene, 195, 209kick, 86Kogas, 268Korea National Oil, 234Kuwait, 229, 236, 238, 250, 257Kuwait National Petroleum, 229, 250Kyoto Protocol, 274
Llanded cost, 262laterals, 86LDCs. See local distribution
companies (LDCs)leak detection, 176leak surveys, 176Leonard formation, 96Libya, 12, 154, 229, 238, 239, 258Libyan National Oil, 229licenses, 50light crude oil, 10light distillates, 195light fuel oil, 202light naphtha, 218light olefin gases, 206limestone, 6line pack, 169line packing, 178lines (risers), 112liquefaction facilities, 180liquefaction process, 179liquefied natural gas (LNG). See LNG
(liquefied natural gas)
The Oil & Gas Industry: A Nontechnical Guide304
liquid fuels supply, 240lithographic logs, 60–62LNG (FLNG) vessel, 186LNG (liquefied natural gas)
about, 36access rights to, 268loading, 185natural gas trading, 268–269pricing of, 269safety, 192–193shipping, 268spot market for, 269transportation costs vs.
indigenous gas, 269value chain, 179–180
LNG heel, 188LNG tankers capacity, 189LNG train, 182local distribution companies (LDCs)
distribution systems, 158–160, 173–175
functions of, 265pressure of, 175price controls, 264–265retail unbundling programs, 267role in marketing, 267–268
logging, 60logging while drilling (LWD), 63long-haul pipelines, 133Louisiana, 36, 160, 181lubricating oils, 195Lukos, 227
MMacondo well, 81, 275Maersk Oil, 231magnetic surveys, 52main hole, 68mainlines, 133, 163major oil and gas producers, 225–230major oil companies, 16, 275major plays, 33, 231Malaysia, 174, 223, 229, 234manifold, 144Marathon Petroleum, 242, 275Marcellus shale, 95, 97marine terminals, 135, 259–260maritime piracy, 277market hubs, 260marls, 12Maryland, 181
Massachusetts, 181mat, 100matrix acidizing, 93Mattei, Enrico, 226maturation, 5mature oil, 1maturity, 1MEA (monoethanolamine), 209measuring while drilling (MWD), 63membrane storage tank, 184–185membrane tank, 187–188mercaptan, 30, 209merox unit, 209metathesis process, 219meters, 165–168methane, 9, 29, 128, 202, 207methane emissions, 98methane gas, 276methane hydrate, 35–36, 126methyl tertiary butyl ether (MTBE),
206Mexico, 228middle distillates, 195, 202, 203, 205,
209Middle East. See also specific countries,
11, 12, 38, 42, 154, 218, 229, 236, 243, 244
Middle Eastern geo-politics, 12Midway Sunset Heavy benchmark,
11milled-teeth tricone bit, 75–76mobile offshore drilling unit
(MODU)drill ships, 102–103jack-up rig, 100, 101semisubmersible rig, 100, 102
Mobil Oil, 108modification
catalytic reforming, 207–208isomerization, 208
monohull platforms, 111–112Montana, 96Monterey formation, 96motor gasoline, 202moveable rigs, 99mud, 78mud logs, 62mud motor, 82Murphy Oil, 112mutistage hydraulic fracturing, 33
Index 305
Nnameplate capacity, 212naphtha, 195, 202, 203, 207, 210napthenes, 9National Fire Protection Association
(NFPA), 193National Iranian Oil Company, 228national oil companies (NOCs),
228–229National Oilwell Varco, 232National Petroleum and Refiners
Association, 242National Petroleum Council, 94natural gas. See also shale gas
cleanup of, 132conventional, 31–32conversion to products, 221–224deregulation, 267formation and composition of,
29–31as fuel, 221gas-to-liquids technology,
223–224other products, 224overview of, 29–44as petrochemical feedstock, 222projected trends, 42reservoir gas cap, 10resource geology, 31resources and reserves, 36–41trading, 267unconventional, 32–36
natural gas liquids (NGLs), 158Natural Gas Policy Act of 1978, 32,
265natural gas processing plant, 124natural gas production
annual global, 41U.S. dry natural gas production,
42natural gas reserves
by country, largest estimated, 39proved worldwide, 39U.S. proved (recoverable)
reserves, 38natural gas role, 276Natural Gas STAR Program, 128natural gas trading
European gas hubs, 266financial gas model, 267hubs, 266–267
LDC role in marketing, 267–268LNG trading, 268–269physical delivery, 265–266
Natural Resources, 231Nebraska, 96netback pricing, 256the Netherlands, 226, 256, 258, 260,
266New Brunswick, 36Newfoundland, 108New Mexico, 96New York, 36Nido Petroleum, 231Nigeria, 12, 229Nigerian National Petroleum, 229Niobra formation, 96nitrogen, 127, 158nitrogen removal, 127Noble Clyde Boudreaux, 85Noble Energy, 231nomination, 265nonassociated gas, 32, 123, 124nonfossil competition, 273–274nonhydrocarbons (inerts), 29nontransportation oil usage, 24NORM (naturally occurring
radioactive materials), 128normal faults, 7North Africa. See also specific countries,
12North America. See also specific
countries, 10, 31, 35, 36, 94, 180, 243, 244, 259, 266, 269, 276
North Dakota, 96Norway. See also Statoil, 229Norwegian Petroleum Directorate,
19Novaya Zemlya island chain, 19nuclear power, 271, 273, 278nylon, 219NYMEX, 254–255, 259, 266
OObama, Barak, 137, 163Occidental Petroleum, 234, 235Odopter OP-11, 86odorization. See also mercaptan, 176,
191offshore drilling depth, 102, 103
The Oil & Gas Industry: A Nontechnical Guide306
offshore pipelinesplatform to shore, 146–149wellhead to platform, 144–145
offshore seismic surveys, 55oil
conventional crude oil, 10–13crude oil composition, 9global demand, 23products created from, 22–23resources and reserves, 14–19trends, 23–24trends in oil consumption, 23–24trends in oil consumption,
projected, 25–27trends in U.S. oil demand, 21trends in U.S. oil production,
19–20unconventional crude oil, 13–14unconventional sources, 26
oil, gas and minerals (OGM), 50Oil & Gas Journal, 22, 244, 250oil and gas
about, 1–2evaluation methods and tools,
59–64evidence (”shows”) of, 64exploration activities, 51–52exploration and development
(E&D), 49exploratory drilling, 57–59generation and movement of, 30hydrocarbon generation, 3–5hydrocarbon traps, 6–8origins of, 1–8production decision, 65–66production management, 115–
129reservoir rock, 5–6rights to explore, 49–51searching and evaluating, 49–66subsea sources, 2–3survey methods, 52–57
Oil and Gas Company of India, 227oil and gas production management
environmental issues, 127–128gas processing operations, 125–
127gas production management
overview, 123initial gas treatment, 124production, end of, 128–129
oil-bearing shale, 94oil consumption
global, 279trends, 23–24trends, projected, 25–27
oil contract futures, 259oil demand, 26, 238–239oil futures contracts, 11, 12, 254oil imports, 20oil in place (OIP), 15oil leaks, 140–141oil pipelines, 134oil price, 237–238oil pricing
along delivery chain, 258–259currently, 256–258historically, 255–256
oil product tankers, 150oil recovery improvement
about, 119–120chemical flood, 121gas injection, 121thermal recovery, 121–122waterflood, 120
oil reservesglobal, 15nations with largest, 17worldwide proved, 18
oil sands. See tar sands/oil sandsoil shales, 12, 14, 26oil storage, 152–154oil tanker ship companies, 260oil tanker ships, 149–151oil trading
gasoline distribution and marketing, 264
hubs, 259–260petroleum product marketers,
263–264physical vs. paper, 254–255poster prices, 259pricing, along delivery chain,
258–259pricing, currently, 256–258pricing, historically, 255–256refined products sale and
movement, 262–263regions traded, 254transportation services, 260–262
oil window, 4Oklahoma, 10–11, 36, 78, 135, 160,
255, 259olefins, 218
Index 307
Oman, 11, 13, 235OMV Petrom, 229One Earth Future Foundation, 277ONGC, 234onshore drilling, 19onshore well completion
about, 88bottom-hole treatment, 90–91casing, 89–90tubing, 91–92wellhead and related equipment,
92Ontario, 36OPEC
about, 235–236EIA production forecast, 25geopolitical disruptions, 238–239growth of, 271, 279history of, 236membership, 236–237origins of, 228outlook, 237–239pricing benchmark, 255production allocation, 256
OPEC Reference Basket, 257–258OPEC Reference Basket benchmark,
11open access, 161–162open-hole completion, 90operating storage, 168options contracts, 254, 255, 267ore tubes, 61organic matter, 3Organization for Economic
Cooperation and Development (OECD), 26
orifice meters, 167origination station, 163Osaka Gas, 268over the counter (OTC), 255
Ppackers, 91paper trading, 254paraffins, 9paraffin wax, 195passive, 53pay zones (layers), 92, 118PdVSA, 234, 235peak oil production, 279peak-shaving, 177–178, 180, 191
Pearl GTL plant, 223Pennsylvania, 36pentane, 158, 182, 208percussion sidewall coring, 61Perdido platform, 85, 112, 144, 145Peregrino Oil Field, 235period charter, 261Petrobank Energy and Resources,
231PetroCanada, 227petrochemicals
feedstocks, 218, 222and LPGs, 214–216production, 218–219
PetroChina, 234, 235Petrofina, 227Petrohawk Energy, 231Petróleos Brasiliero (Petrobras), 229Petróleos de Venezuela (PdVSA), 229Petróleos Mexicanos, 228Petroleum Administration for Defense
Districts (PADD), 262–263Petroleum Argus, 257petroleum coke, 195petroleum generation, 1petroleum imports, 21petroleum industry challenges
about, 271–272Chinese challenge, 278climate-change policy, 274industry operations, 275–277industry structure, 275international interactions, 278–
279nonfossil competition, 273–274peak oil production, 279technology development, 273summary, 280
petroleum industry structureabout, 225hybrid companies, 229–230independent producers, 230–231international oil companies
(IOCs), 226–227IOC-NOC interactions, 233–
235major oil and gas producers,
225–230national oil companies (NOCs),
228–229OPEC, 235–239refiners, 240–251
The Oil & Gas Industry: A Nontechnical Guide308
service companies, 232Seven Sisters, 226–227supermajors, 227
Petroleum Marketers Association, 264Petroleum National Berhard
(Petronas), 229petroleum product marketers, 263–
264petroleum products
finished, 213–214market hubs for, 260standards for, 217
Petroleum Technology Transfer Council (PTTC), 230
petroleum tradingabout, 253natural gas trading, 264–269oil trading, 254–264
Petronas, 234, 268Phillips Petroleum, 227physical delivery, 256, 265–266physical trading, 254physical vs. paper oil trading, 254–
255pigs, 144, 170pipe
construction, 136materials used in, 135protection of, 138
Pipeline and Hazardous Materials Safety Administration (PHMSA), 140–141, 142
pipeline companies, 265pipeline equipment
about, 163–164engine/compressor systems,
164–165meters, 165–168other components, 168
pipeline networksabout, 133–135Canadian-U.S. Keystone XL
pipeline, 137inspection and maintenance,
140–144offshore, 144–149oil storage, 152–154oil tanker ships, 149–151other components, 139–140pipe, 135–138railcars and tank trucks, 151–152SPRs, 154–155
pipeline price, 258pipelines
crude oil, 131inspection and maintenance,
170–171outside of North America, 172repair and maintenance, 143temperature, 215
pipe ram, 81piping materials, 175–176piping network, 173–175Plains Exploration and Production,
231plastic pipe, 175Platts Oilgram, 257Poland, 98polycrystalline diamond compact
(PDC) bit, 77polyester, 218polyethylene (PE), 215, 218, 222polymerate, 206polymerization, 206polystyrene (PS), 218, 222polyvinyl chloride (PVC), 218, 222positive displacement meters, 167possible reserves, 15posted barges, 100poster prices, 259posting, 259Potential Gas Committee (PGC), 34potential tests, 87precision drilling, 85preliminary crude processing, 132–
133Prelude field, 186pressure
drilling, 78–79of local distribution companies
(LDCs), 175in reservoir, 115–116well testing, 87
pressure record, 64price controls, 264–265price markers, 257pricing reference, 10primary hubs, 259–260primary production, 119prime mover, 71probable reserves, 15processing of hydrocarbons, 196
Index 309
produced water, 127Produced Water Management Handbook
(GRI), 128production capacity, 212production casing, 90production contract, 51production decision
development economics, 65technical and operational factors,
66production logs, 87production management
artificial lift, 116–117oil recovery improvement,
119–123production start, 115workover of well, 117–119
production riser, 145production sharing agreement (PSA),
50production-sharing contract (PSC),
50productivity of shale gas wells, 34productivity tests, 87product pipelines
described, 131finished petroleum products,
213–214petrochemical production,
218–219petrochemicals and LPGs,
214–216refined product standards, 217
products from oilblending/finishing, 210conversion, 202–208enhancement, 208–209product pipelines, 213–216refinery maintenance schedules,
212refinery types, 211–212refining overview, 195–197separation/distillation, 197–202
propane, 158, 182, 202, 219, 222proppants, 94, 95propylene, 206, 207, 212, 218, 219,
222propylene glycol (PG), 222Prosafe Production, 112proved reserves, 15, 18PT Pertamina, 250
PTT Exploration and Production, 234
pump jack, 116Purvin & Gertz, 275
QQatar, 42, 151, 223, 239, 258, 269Quebec, 36Quicksilver Resources, 231
Rrack price, 258radioactive materials, 128raffinate, 219railcars and tank trucks, 151–152Range Resources, 97rate of penetration (ROP), 62raw gas, 158real-time measurement methods
about, 62logging while drilling (LWD), 63measuring while drilling
(MWD), 63recompletion, 118recoverable oil, 16recoverable shale gas reserves, 37refined products sale and movement,
262–263refined product standards, 217refiners/refineries
about, 195–197, 240–242Bangladesh, 250capacity, 250–251capacity, worldwide, 243–244independent, 242largest, 244–245projects planned for, 250–251stages of, 197
refinery gain, 22refinery gate price, 258refinery maintenance schedules, 212refinery types
capacity classification, 212complexity classification, 211–212
refining assets, 275refining capability
Asian ranked capacity, 246global, by size, 249U.S. ranked capacity, 247Western Europe ranked capacity,
248

The Oil & Gas Industry: A Nontechnical Guide310
worldwide, 243worldwide ranked capacity, 245worldwide trends, 243
refining overview, 195–197reformates, 207, 210reformers, 211reforming, 208regasification facilities, 180regasification process, 179, 191regulator stations, 175Reliance Industries, 103Reliance Refinery, 218remotely operated vehicles (ROVs),
119, 147renewable energy resources, 271, 273,
274, 278rental price, 259reserve growth, 15reserve pit, 68reserves
categories of, 15of conventional oil, 13DOE estimates, 23P10 (reserve category), 15P50 (reserve category), 15P90 (reserve category), 15
reservoir pressure, 115–116reservoir rock, 1–2, 6reservoirs. See also production
management depleted, 168drilling conditions, 78gas storage, 168–169geology of, 6, 8locating, 56–57recovery factor, 15unconventional natural gas, 32
residual fuel oil, 217residum, 195Resource and Land Management, 34resources, 14resources and reserves, 36–41Respol YPE, 234retail unbundling programs, 267reverse faults, 7rights to explore oil and gas
about, 49–50production contract, 51
production sharing agreement (PSA), 50
service contract, 50Rigzone, 275risers, 112, 145risk, 50, 142, 267risk assessments, 142Romania, 229Rosneft, 16, 19, 227, 233, 250rotary cone bit, 75rotary cutting, 61rotary drilling
about, 70blowout prevention, 79–81circulating system, 78–79components, 70drill bits, 75–78drilling techniques, 81–82hoisting equipment, 71–72prime mover, 71problems in, 86rotating equipment, 72–75
rotary sidewall drilling, 61rotary table, 72, 73rotating equipment, 72–75Royal Dutch Shell, 16, 112, 186, 223,
226royalty interest, 51Russia, 16, 19, 25, 38, 41, 42, 86, 227,
233, 234, 239, 269, 276
SSafe Drinking Water Act, 97salt caverns, 153, 155, 169salt domes, 8Samho Dream, 277sandstones, 6Saskatchewan, 36satellite LNG plant, 191Saudi Arabia, 12, 236, 239, 251, 256,
258, 260Saudi Arabian Oil (Saudi Aramco),
229, 239Science Advisory Board, 97seafloor seismic survey, 56Seawise Giant, 150security, 277sedimentary basin, 1seismic imaging, 56–57seismic surveys
Index 311
active, 53–56offshore, 55passive, 53
seismic vessels, 56seismographic techniques, 52seismometers, 53self-supporting independent tank,
187semisubmersible rigs (semisubs), 100,
102semisubmersible vessels, 110–111sendout, 190separation/distillation, 197–202separators, 132, 164, 197service companies, 232service contract, 50service lines, 160, 174, 175set-through completion, 91setting pipe, 88Seven Sisters, 226–227Shafaq-Asiman offshore gas field, 234shale. See also oil shales; shale gas
Barnett shale, 33, 95black shale, 30Canada, 33Cutback Ridge shale project,
234Eagle Ford oil shale, 96, 234Fayetteville shale, 95gas-bearing shale, 43, 94Haynesville shale, 95major gas shale plays, 33Marcellus shale, 95, 97oil-bearing shale, 94in reservoir rock, 6United States major gas shale
plays, 33United States shale formations,
95shale basins, 36shale formations
gas production from, 95oil production from, 96
shale gasCanada, 36major plays, 33, 231production, 95, 271recoverable reserves, by country, 37United States, 36well productivity, 34
shale oil. See oil shales
Shell, 16, 233, 234, 235, 268Shell Middle Distillate Synthesis
process, 223Shell Oil, 84, 85shipowners, 261shock waves, 53short-haul pipelines, 133, 135shut in (condition), 87sidetrack well, 118signature bonuses, 51siltstones, 6single containment LNG tank, 184single-hull tankers, 150Sinochem, 235Sinopec, 234, 235site preparation, 68slip-strike faults, 7slugs, 121smart pigs, 142, 170soap sticks, 117Socal, 226Socar, 234Society of Independent Gasoline
Marketers of America, 264Society of Petroleum Engineers
(SPE), 15Socony, 226solvent extraction, 209solvent recovery, 209Sonatrach, 229sonde, 62source rock, 1, 3–5sour crude oil, 10sour gas, 126South America. See specific countriesSouth Korea, 151, 189, 260, 269, 277Spain, 189, 227, 233, 234spar, 112spar platforms, 112–113spot charter, 261spot contract, 256spot market, 256spot price, 257SPRs (Strategic Petroleum Reserves),
154–155spur lines, 135squeeze job, 90stakeholders, 65Standard Oil of California, 226

The Oil & Gas Industry: A Nontechnical Guide312
Standard Oil of New Jersey, 226Standard Oil of New York, 226Statoil, 16, 19, 230, 234, 235, 268Statoil-Hydro (Statoil), 229steam-assisted gravity drainage
(SAGD), 122steam cracker, 212steam cracking, 202, 218steam flood (steam drive), 122steel jacket, 105steel-jacket platform, 105–106steel pipe, 175straight-run gasoline, 210strakes, 112stranded gas, 179Strategic Petroleum Reserves (SPRs),
154–155streamers, 55structural prism, 188stub lines, 135styrene, 219subsea pipelines, 131, 144, 149subsea wellheads, 104sucker-rod pump, 116–117Sudan, 254sulfur impurities, 224Sunoco, 242supermajors, 227, 278supertanker, 151supervisory control and data
acquisition (SCADA) systems, 140supply mains, 173surface casing, 90Surgutnefreaz, 227survey methods
gravimetric surveys, 52magnetic surveys, 52seismic surveys, 53–57
swap agreements, 255swaps, 254sweet crude oil, 10sweetening, 182, 209Swift Energy, 231Switzerland, 232, 236, 256syngas, 222, 223synthetic natural gas (SNG) plants,
178Syria, 12, 238
TTalisman Energy, 231tank farm, 151tar sands/oil sands, 12, 122, 279technology development, 273tectonic processes, 6temperature, 78temperature vs. depth, 3tendons, 108tension-leg platform, 108term contract, 256terms, abbreviations, and acronyms,
12tests, 87Texaco, 226, 227Texas, 36, 96, 160, 181Thailand, 234The Economist, 238thermal cracking, 202–204, 205thermal recovery
cyclic steam injection, 121fireflood (in situ combustion),
122steam-assisted gravity drainage,
122steam flood (steam drive), 122
three-dimensional (3D) seismic imaging, 56
thrust (reverse) faults, 6thumpers, 53Thunder Horse PDQ, 111TI Africa, 151TI Asia, 151TI class, 151TI Europe, 151tight gas, 33tight sands, 43time-lapse imaging, 57TI Oceana, 151TNK-BP, 234Tokyo Gas, 268toluene, 208, 219top drive, 99topping refineries, 211Total, 227, 233total gas storage capacity, 169trading exchanges, 254–255train, 182TransCanada, 137
Index 313
transmission pipeline, 158transmission systems
gas storage, 168–170global gas transmission, 171–172inspection and maintenance,
170–172pipeline equipment, 163–168U.S. gas transportation, 160–163
transmix, 214Transocean, 103transportation of natural gas
about, 157–160distribution systems, 173–178transmission systems, 160–172
transportation of natural gas as LNGabout, 179–181liquefaction process, 182–183LNG safety, 192–193LNG storage tanks, 183–185LNG tanker ships, 187–189offshore liquefaction concepts,
185–186offshore regasification, 192onshore regasification, 189–192
transportation of oilabout, 131pipeline networks, 133–144preliminary crude processing,
132–133transportation services, 260–262transport modes, 131traps
anticlinal traps, 6combination traps, 8described, 2, 30fault traps, 7hydrocarbon traps, 6–8stratigraphic traps, 8structural traps, 6–7
travelling block, 72trays, 200–201trends
gas consumption, recent and projected, 44–46
gas production, projected, 42–43gas production, recent, 41–42natural gas projections, by EIA,
42in oil consumption, 23–24in oil consumption, projected,
25–27in U.S. oil production, 19–20
tricone bits, 75–76
tripping, 78Tropsch, Hans, 223trunk lines, 133tubing, 91–92tubingheads, 92Tunisia, 12, 238turbine meters, 167Turkmenistan, 41turnaround, 212
UUganda, 251ultralarge crude carriers (ULCCs),
151Ultra Petroleum, 231ultrasonic meters, 167unbranded stations, 264U.N. Conference on Trade and
Development, 149unconventional crude oil
shale oil, 13–14tar sands/oil sands, 13
unconventional gas resources, 84unconventional natural gas
about, 32–36categories of, 32China, 278coal-bed methane, 34deep gas, 33geopressurized gas, 34–35methane hydrate, 35–36productivity of shale gas wells, 34shale gas, 33–34tight gas, 33
unconventional oil, 279Union Femosa, 268United Arab Emirates, 234, 258, 260,
271United Kingdom (UK), 180, 226,
231, 235United States
Arctic exploration, 16coal-bed methane, 34crude oil imports, 21energy outlook, 26federal agencies, 192federal pipeline safety law, 163gas transportation, 160–163Great Recession, 272hubs, 135LNG facilities, 181
The Oil & Gas Industry: A Nontechnical Guide314
major gas shale plays, 33major oil pipelines, 134natural gas, proved (recoverable)
reserves, 38natural gas pipeline network, 161natural gas reserves, 31oil imports, 20oil price discovery locations,
259–260oil production, 19–20oil refineries, growth of, 242oil refineries, largest by capacity,
240oil refineries, smallest by capacity,
241oil shales, 14oil usage, 24product pipelines, 212shale formations, 95total domestic natural gas
production, 43United States Gas Research Institute,
84upgrading, 127, 202upward flow, 90urethane, 219U.S. Army Corps of Engineers, 193U.S.-based companies, 19, 21U.S.-based energy companies
in domestic natural gas production, 40
domestic natural gas reserves, 40U.S. Coast Guard, 192U.S. Code of Federal Regulations, 177U.S. Department of Energy (DOE).
See also Energy Information Agency (EIA)
annual growth rate, 25industry collaboration, 84oil usage, 24reserves estimates, 23shale gas production, 95well drilling data, 58
U.S. Department of Health, Welfare and Health Administration, 193
U.S. Department of Homeland Security, 192
U.S. Department of Transportation, 140–141, 162, 192
U.S. Strategic Petroleum Reserves (SPRs), 153
Vvacuum distillation, 201, 219Valero Energy, 242velocity strings, 117Venezuela, 6, 8, 13, 229, 234, 235,
236, 258Vermillion Resources, 231vertical insertion (pay zone), 64very large crude carriers (VLCCs),
112, 151, 277Vietnam, 234, 250vinyl chloride (VC), 222visbreaking, 203voyage charter, 261
WWard Petroleum Group, 231water, 182, 197waterflood, 120water quality, 127water vapor, 197water vapor removal, 126water well, 68Weatherford International, 232well completion, 103–105well cuttings, 60well depth record, 86wellhead and related equipment, 92wellhead prices, 258wellhead separator, 124well logging
drill-time logs, 62lithographic logs, 60–62mud logs, 62wireline logs, 62
well pressure, 115–116well treatment
acidizing, 93hydraulic fracturing (fracing),
93–98West Africa. See also specific countries,
254, 276

Index 315
West Texas Intermediate (WTI) benchmark, 10–12, 135, 255–256
wet gas, 5wet subsea wellhead, 104whipstock, 82wholesale trading, 254wildcat, 56wiper plug, 90wireline, 62wireline logs, 62wireline tool types, 63Wood MacKenzie, 234workforce demographics, 275working gas, 169workover of wells
actions, 118described, 117–118of offshore wells, 119recompletion, 118sidetrack well, 118
World Energy Outlook (International Energy Association), 26, 274, 278
Worldscale Association, 261Wyoming, 96
Xxylenes (BTEX), 208, 219
YYemen, 12