OF THE PHILIP·PINES - Sea-Delt
535
I, ,. i ' NEDA STATISTICAL l1~ ' D I I OF THE PHILIP·PINES 0 . · Republic of. the Philippines ' . NATIONAL ECONOMIC. AND .D.EVELOP.MENT AUTHORITY ·· .. ·MANllA • 1975 , .. ,., ...
-
Upload
khangminh22 -
Category
Documents
-
view
0 -
download
0
Transcript of OF THE PHILIP·PINES - Sea-Delt

I,
,. i
'
NEDA
STATISTICAL l1~ ' D ~ I I OF THE PHILIP·PINES
0
. · Republic of. the Philippines ' . NATIONAL ECONOMIC. AND .D.EVELOP.MENT AUTHORITY
· · .. ·MANllA • 1975
, .. ,., ...

NEDA Statistical -1975 Yearbook of the Philippines
i 1· Rep u b I i c of the P h i I i p pin e s ' -~
NATIONAL ECONOMIC AND DEVELOPMENT IWTHORITY-..S.
Manila, 1975
• . '. l

' }
J
_ Republic of the Philippines NATIONAL ECONOMIC,AND DEVELOPMENT AUTHORITY
January 1, 1975
Foreword
This issue of the NEDA Statistical Yearbook of the Philippines for 1975 is a more voluminous consolidation of statistical work by agencies reporting to NEDA or are represented in the NEDA Board. These agencies include the major statistical bodies of the government 'such as the National Census and Statistics Office, the Central Bank, tax and customs collection bureaus, agricultural data gathering entities, · and other operating agencies. Acknowledgements of the role of these ·agencies are reported in the tables.
A new feature of the Yearbook is the integration of local data with international stafistics (mostly from agencies of the United . Nations) coinmonly asked about for comparison.
002:~4 /1~
GERARDO P. SJCAT · Director General
(
Republic of the Philippines......:
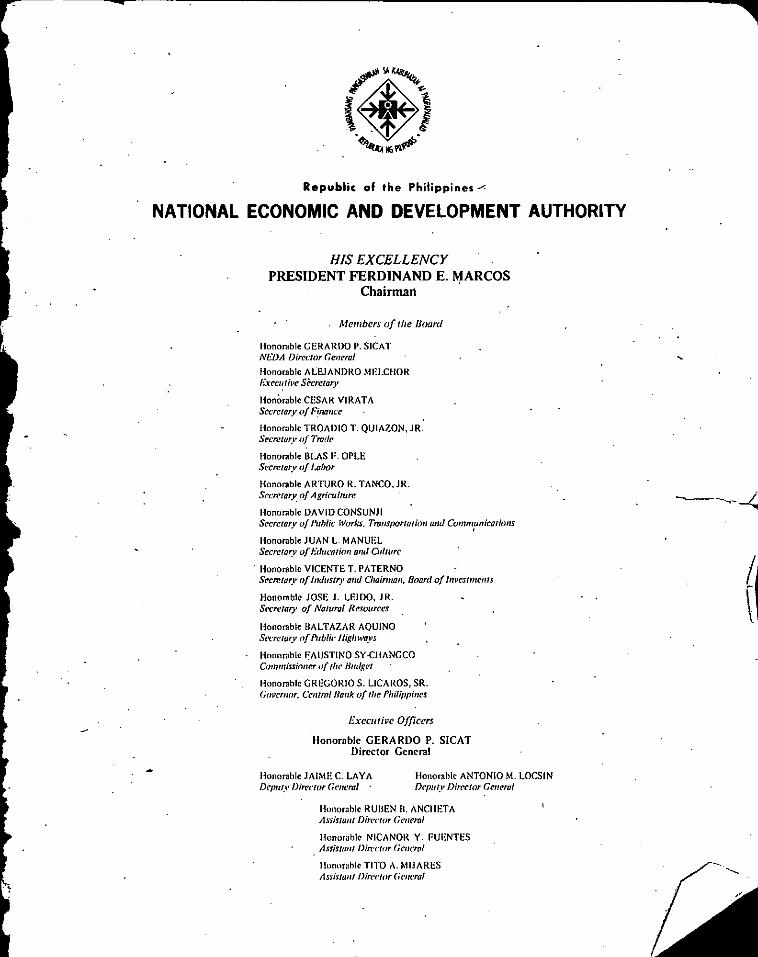
NATIONAL ECONOMIC AND DEVELOPMENT AUTHORITY
HIS EXCELLENCY PRESIDENT FERDINAND E. ~ARCOS
Chairman
Members of the /Joarc/
Honornble GERARDO P. SJCAT NEDA Diret·tor Ceneral
Honorable ALEJANDRO MELCHOR Hxec1'.1i11e SCcretary
Hon0rablc CESAR VIRATA Secretary of Ff11a11ce
Honornble TROADIO T. QUIAZON,JR. Secretary of Trade
Honorable BLAS F. OPLE SC'cre/ary of /.ohor
Honorable ARTURO R. TANCO, JR. Secretary_ of Agriculture
lfonornble DAVID CONSUNJI Secretary of l'uhlic Works. Tra11sr,orta1im1 and Comm
1unications
Honorablc JUAN L. MANUEL Secretary of l:.i.Jucation and Culture
. Honorable VICENTE T. PATERNO Secretary of J11Justry a11d Chairman, Board of llll'cstme111s
Honorable JOSE J. LEI DO, JR. St'Cretary of Nalllral Resources
1-!onorablc BALTAZAR AQUINO Secretary of Public J/igflwoys
Honorable f:AUSTJNO SY-CIIANGCO Commissioner 11f !flt• /Judge!
Honorahle GREGORIO S. LICAROS, SR. Gm,emor, Cell/ml /Ja11k of tl1e Philippines
Executive Officers
Honorable GERARDO P. SICAT Director General
Honorablc JAIME C. LAVA Dcpmy l)irr<·tor (;('J/t'ral ·
Honorab\e ANTONIO M. LOCSIN Deputy Direc/or General
Honorablc RUHEN B. ANCHETA Assista11t Director Gmeral
Honorablc NICANOR Y. FUENTES Assisumt /)ir<"ctor Gc11rrol
llonorable TITO A. MIJARES Ani.\"111111 l)in.·1·111r G,•m·rul

I
t
•
Contents
iii .Foreword
v The NEDA Board .
4 Summary of major statistical series
" 33 Chapter I ,L Population and housing; labor foree and
63
77
89 113
171
215 269
305
353
373.
405 433
451 475 493
Chapter II/ / Chapter . III
Chapter
Chapter
Chapter
IV L vL VI/ VII,:::
employment
Vital and health statistics
Population movements
National income
Agriculture
Fisheries and forestry
· Est11bl;~.'.,1eiit characteristics- -- - - -
Industrial sectors
Transport and communication
Chapter X Money and banking
Chapter · XI L · · Public finance
Chapter XII L 'Balance of payments; foreign trade
Chapter XIII / Family income and expenditures . ,
Chapter XIV _.:: Price and wage indices
Chapter XV L Education Chapter XVI L Interindustry relations ~d food balances
Chapter XVII ~ International statistics
vii

INTRODUCTION
A thorough review of the momentous events that occurred in the Philippines since the country was levelled almost to the ground as a result of the Second World War and its cruel aftermath and the painstaking experience that it had to undergo in the formidable task of development almost from scratch cannot be adequately described in any number of words. Such an exercise would be very panoramic in scope and unfathomable in depth, something that is almost impossible of human attainment. This would necessitate the presentation of
-voluminous sets of both quantitative and qualitative information spanning a period of more than a quarter of a century. Definitely such information is not available at the moment.
This being so, the most that can be done about it would be to present in a rather summary fashion the .major developments in the country during these last twenty-five years or so as gleaned from a sele_cted set of statistical data.
This publication is a compilation of a series of statistical data ·which deal on the various aspects of the Philippine economy and are issued by the National Economic and Development Authority (NEDA) annually. Seventeen major sets of statistics are presented in this issue; population and housing, labor force and employment; vital and health statistics; travel and tourism; national income; agriculture; .fisheries and forestry; establishments characteristics; industry; transport, communication and storage; money and banking; 1mblic finance; balance· of payments and external trade; family income and expenditures; price and wage indices_; education; interindustry relations and food balances; and international statistics.
Except for the data on ·national income where the National Accounts Staff of the Statistics Office, NEDA, assumes full responsibility in estimation and releasing to the public, all the other sets of statistical data contained in this volume were culled from published reports of the various source agencies of the government. The statistical data on population, housing, labor force, establishments characteristics, family income and expenditures, and, to some extent, external traile and prices come from the National Census and Statistics Office (NCSO), the main statistical collecting arm in the country.
Data on travel and tourism come from the former Board of Travel & Tourist Industry, now integrated in the newly created Department of Tourism, while data on fisheries and forestry are from the Bureau of Fisheries and Aquatic Resources and the Bureau of Forest Development, resp~ctively. Data on agriculture have been furnish eel by the
C

Department of Agriculture and the Bureau of Agricultural Economics (BAEcon) while data on the balance of payments and external trade, money and banking, and prices come from the Central Bank of the Philippines. Public finance data (government revenues, expenditures, and borrowings) come froin the Department of Finance, the Budget Commission and the Central Bank of the Philippines and data on transport, communications and storage coine from the Department of Public Works, Transportation, and Communications. Data on education are supplied by the Department of Education and Culture.
In preseriting this issue of the Statistical Series on the Philippine Economy for the scrutiny of the reader, the Statistics Office of the NEDA does not intend to duplicate the work currently being done by the various source agencies in the compilation of the data that pertain to their area of jurisdiction. Rather, ·the Statistics Office of the NEDA is just discharging its function of coordinating these different sets of statistical information for the public and for the policy-makers for easy reference so that they will be given access and kept. posted on the different developments in the country that will guide them in their work. Some of these statistics are also presented "in the NEDA Economic Indicators, a monthly publication of the Statistics Office, NEDA.
We take this opportunity to· thank all the source agencies of the statistical data presented in this volume for their splendid and whole-hearted cooperation in this endeavi>r. It is only through such a camaraderie that the function of the Statistics Office of the NEDA as a statistical coordinating arm of the government service can bear fruitful results. '
. \
2
j
l 1

Summary of Major Statistical Series

, SUMMARY OF MAJOR ~
Statistical Series Unit. j A. SOCIO-ECONOMIC CHARACTERISTICS OF ~ THE POPULATION
I. Mid-year population I ;000 persons
i 2. Sex distribution Both sexes 1,000 persons Male per cent Female per cent j
3. Age distribution per cent ◄ 0-4 5-9 '
10-19 20-39 40-64 65 and over
4. Regional distribution Philippines I ,000 persons Region I Region II
~ Region III Region IV Region V Region VI Region VII Region VIII
~ Region IX Region X
1 Region XI
5. Crude birth and death rates Rate per IJ}00 population Birth rate Death rate .
6. Literacy of population I 0 years old and over per cent
• Male Female
7. Per capita national income pes_o At curr.ent prices At 1967 prices -~
8. Mean household income peso Urban areas
Manila and suburbs Other urban
4

STATISTICAL SERIES
Latest Data
Reference Period
1975
July I; 1970
July I, 1970
May 6, 1970
1971
1970
1973'
1971
Value
41,457
36,684 49.7 50.3
16.6 14.8 21.8 28.5 14.9 3.5
36,684 2,991 1,690 3,713 8,325 2,966. 3,618 3,032 2,381 1,869 3,019 3,078
25.4 6.6
83.4 84.6 82.2
1,464 798
3,736 · 5,867 7,785 5,141
Compared to
· Reference Period
1974
July I, 1960
July I, 1960
Feb. IS, 1960
1970
1960
1972
1965
5
Value
41,232
27,088 50.4 49.6
16.9 16.1 23. I 27.3 13.9 2.7
27.088 2,427 · 1,202 2,566 5,502 2,363 3,077 2,523 2,041 1,350 2,111 1,923
27:4 6.7
72.0 73.6 70.6
1,206 755
2,541 4,405 6,590 3,463
Per Cent Change
· 0.54
35.42
35.42 23.23 . 40.58 44.69 51.30
· 25.S I 17.58 20.17 16.65 38.44 43.01 60.06
(7.30) (1.50) 15.83 14.94 16.43
21.39 5.69
47.02 ·--33.18 18.13 48.45

SUMMARY OF MAJOR ◄ l j
Statistical Series Unit -' ~
Rural areas
9. Distribution of families by income group 1,000 families 1 Unde_r f'I ,000 . per cent
1 PI ,000 to PI ,999 per cent P2,000 to P2,999 per cent· 1'3,000 to P4,999 per cent :1"5,000 and over
10. Distribution of total income by income
1 group Pmillion Under Pl ,000 per cent PI ,000 to PI ,999 per cent ~ :1"2,000 to :1"2,999 per cent 1'3,000 to P4,999 per cent ~
1'5,000 and over per cent 11. Average household expenditure peso
Urban areas
◄ Manila and suburbs Other urban
Rural areas 12. Per capita private consumption
expenditure peso At current prices
◄ At 1967 prices j I 3. Total labor force 1,000 persons
Employed
l Unemployed 14. Labor force participation rate per cent
Urban Rural
B. NATIONAL INCOME 1 ' l 15. Gross national product at market prices Pmillion
At current prices At 1967 prices •
I 6. Net domestic product at factor cost (at. ; 1967 prices) P million Agriculture
6 . , ~

STATISTICAL SERIES (continued)
Latest Data
Reference Period
1971
1971
CY 1971
CY 1973
Nov. 1973
Nov. 1973
CY 1973
CY 1973
Value
2,818 6,347
17.3 24.0 17.7 20.0 21.0
23,714 2.9. 9.6
11.8 20.4 55.3
4,479 6,809 7,766 6,447 3,474
1,244· 700
14,559 · 13,865 . 694-
50.4 47.6 51.9
71;314. "39,102
31,313 9,559
•
Compared to
Reference Period
1965
1965
CY 1965
CY 1972
Nov. 1972
Nov. 1972
CY 1972
CY 197i
7
Value
1,755 5,126
29.3. 30.2 1-7.5 13.5 9.4
13,024 6.7 7.3
16.9 20,I 39.0
2,877 4,621 6,680 3,734 2,142
1,072 679
13,294 12,582
712 . 48.4 45.5 49.8
56,869 35,613
29,022 8,948
Per Cent Change
60.56 23.81
82.07
55.68 47.34 16.25 72.65 62.18
19.50 6.22 ~ 10.19 (2.53) 4.13 4.61 4.21
25.40 9.79
8.10 6.82

Statistical Series
Mining and quarrying Manufacturing Construction Transport, _com_munication, .storage and
utilities Commerce Services
17. Expenditures on gross domestic products at I 96Tprices Personal consumption expenditures Gen.era! government .current expenditures Gross domestic capital formation
Construction Durable equipment Increase in stocks
Exports (Less) lniports
C. PRODUCTION
18. Production of agricultural crops Food crops
Palay Com Fruits and vegetables ' Other food crops
Commercial crops Coconut Sugarcane Abaca and other fiber crops Tobacco Rubber
· 19. Value of.production of agricultural crops Food crops
, . Palay Com Fruits and vegetables -Other food crops
Commercial crops Coconut
8
SUMMARY OF MAJOR
Unit
1' million
,J l,006MT
• '
~ ~
1' million 1 , ~
1 ~ ~
I

STATISTICAL SERIES (continued) •.-~"' '• · ~-
Latest Data Compared to Per Cent ~},-
Reference Value Reference Value Change Period Period
732 686 6.70 6,?27 5,828 11.99 1,245 1,014 22.78
1,306 1,217 7.31 4,903 4,594 6.72 7,101 6,735 5.43
CY 1973 · 39,063 CY 1972 36.774 6.22 27,337 25,735 ·6.22
; 3,360 3,208 4.73 7,429 6,820 8.92 2,612 2,371 10.16 3,975 3,664 8.48
842 785 7.26 6,360 5,8 I 5 9.37 5,423 4,804 12.88
Crop Year 1973 15,079.5 Crop Year 1972 15,192.9 (0.75) 9 877.7 I 0,625.0
~ 4,414.6 .5,100.1 (13.45) 1,83 I: I 2,012.6 (9.02) 2,225.7 2,133.2 4.33 1,406.3 1,379.1 1.97 5,201.8 4 567.9 13.87 1,797.1 1,813.4 (0.90) 3, I 9~.8 2,559.7 24.65
64.8 56.3 15.09 126.0 116.8 7.87 23.1 21. 7 645
Crop Year 1973 · 10,742.7 Crop Y car 1972 10,305.1 4.24 6,258.3 6,741.6 (7 .1 7) 2,650.0 3,190.1 (16.94)
828.2 1,043.5 (20.64)
~.
1,920.4. I, 725.3 11.30 859.7 782.7 9.83
4 484.4 3.563.5 25.84 1,646.5 1,386.7 18.73
9

· Statistical Series
Sugarcane. Abaca and_other fiber crops Tobacco Rubber
20. Fish production Commercial fishing Fish ponds Municipal fisheries and sustenance
fishing 21. Value of fish production
Commercial fishing Fish ponds Munidpal fisheries and sustenance
fishing 22. Production of logs, lumber, plywood
and veneer Logs Lumber Plywood Veneer
23. Value of mining production_ Precious metals
. Base metals N_on-metallics ·
24. Value of manufacturing output Food· Beverages Tobacco Textiles Footwear and Wearing Apparel Wood and cork Furniture and fixtures Paper Printing Leather Rubber Chemicals
- Products of petroleum and coal
10 ·
SUMMARY OF MAJOR
Unit
1,000 MT
P-million ,
1,000Cu M 1,000 Bd Ft 1,000 Sq Ft 1,000 Sq Ft
P- million
P- million
I
'·

~ STATISTICAL SERIES (continued)
/
Latest Data Compared to Per Cent
· Reference Value Reference Value Change Period Period
2,499'.0 1,897.3 31.71 131.2 114.4 14.68 175.1 135.7 29:03 . 32.6 29.4 10.88
CY 1972 1,122.4 CY 1971 1,023.1 9.70 424.8 382.3 11.1 I ,98.9 97.9 1.02
598.7 542.9 10.27 CY 1972 2,827.5 CY 1971 2,231.1. . 26.73
1,106.1 879.2 25.80 332.4 328.0 1.34
1,389.1 1,123.8 · 23.60
FY 1972-73 8,990.3 FY 1971-72 8,416.1 6.82 449.4 598.2· (24.88)
1,240.5 785.4 57.94 717.0 764.3 (6.19)
r CY 1973 3,085.8 CY 1972 1,934:5" 59.57 391.5 246.5 58.82
~ 2,503.5 1,531.7 63.44
190.9 156.2 22.21 · CY 1971 18,665 CY'l970 14,967 24.70
7,631 3,686 25.63"
r 1,002 830-. ' 20.72
964 • 859 12.22 1,386 1,042 33.01
324 263 23.19 719 533 34.89 67 54 24.07
592 504 17._46 352 305 I 5.40
~ 36 .. 33 9.09
364 373 (2.42) 2,645 2,044 29.40 1,714 , 1,346 · 27.34
~ 11 . . • ..
)

SUMMARY OF MAJOR
Statistical Series Unit
Non-metallic mineral products Basic metal Metal products Machinery except electrical Electrical machinery Transport equipment Miscellaneous,
25. Electric energy generated . million (Kwh) National Power Corporation -MERALCO
26. Permit valuation ?f private building construction P million
Manila and suburbs 32 Chartered cities _Residential buildings
Manila and suburbs 32 chartered cities
Non-residei;itial buildings Manila and suburbs 32 chartered cities
Alterations.and repair Manila and suburbs 32 chartered cities
27. Rail transport Passengers 1,000 persons Freight tons 1,000 MT
. Express tons 1,000 MT 28. Tonnage entered and cleared in domestic
and international trade 1,000 tons Domestic trade International trade
29. Domestic air transport 1,000 miles Revenue passenger miles ·Available_seat miles
30: Volume of mail handled 1,000 pieces Surface mail Air mail
I I 12

STATISTICAL SERIES (continued)
Latest Data · Compared to Per Cent
Reference Value Reference Value Change Period Period
690 456 51.31 768 888 ( 13.52) 663 490 35.30 127 106· 19.81
' ,
595 459 29.62 -. 797 495 61.0 I
229 201 13.93 CY 1973 8,718 CY 1972 7,831 I 1.32
2,305 2,660 (13.35) 6,413 5,271 21.66
CY 1973 589.4 CY 1972 529.2 11.37 395.3 364.I 8.56 194.1 165.1 17.56 296.7 263.5 12.59
186.6 164.4 13.50 1 I 0.1 99.1 11.09 228.7 224.2 2.00 157.5 165.9 (5.07) 71.2 58.2 22.33
· 64.0 41.3 54.96 51.2 · 33.7 51.92 12.8 7.8 64.10
CY 1973 6,137 CY 1972 3,955 55.17 260 218 19.26 83 70 18.57
CY 1973 CY 1972 15,731 · 15,759 · (0.18) 52,850 48,466 9.04
CY 1972 CY 1971 S 19,349 523,634 (0.82) 868,639 775,481 12.01
FY 1972-73 515,296 FY 1971-72 508,536 1.32 399,514 399,514 0.00 115,781 109,022 6.19
13
/

SUMMARY OF MAJOR 7 ◄ 1
·statistical Series Unit ◄ D. MONEY ANO BANKING -~
,. 3 I. Money supply '.I' million
r· 32. International reserve- I" million . 33. Domestic credits '.I' million
,.... 34; Non-money supply deposits '.I' million ,- 35. Miscellaneous account I" million
36. Loans and investment outstanding '.!'_million Commercial banks per cent .Development banks
1 Rural and savings banks Government non-bank financial
institutions Private non-bank-financial institutions l
37. Total credits granted by banks and financial
◄ . institutions by industry 'P million . Agriculture
Mining and quarrying Manufacturing Construction
1 Public utilities Trade Banking and financial institutions Real estate Services Consumption
◄ 38. Percentage distribution of total credits granted by commercial and savings banks per cent Demand Short term
11 Intermediate term Long term
39. Average interest rate on credits granted by commercial and savings banks '.!'million
40. Total assets and liabilities of the Central Bank '.I' million Total assets Total liabilities
14 ,-.1

STA TISTl<;:AL SERIES (continued)
• ' Latest Data Compared to
~ Reference Value Reference Value. . Per Cent
Period Period Change ,. i
1973 8,152.5 1972 6,796.6 19.94 1973 6,744.4 1972 1,890.3 256.78 1973 22,763.9 1972 17,922.2 • 27 .0 I 1973 12,385.0 1972 8,103.0 · 52.84 1973 9,000.8 1972 4,982.9 ·80.63 . 1973 . 32,383.1 1972 24,574.0 31.77
~ 67.2 61.0 15.0 17.9 5.9 6.1
1 I.I 13.4
~ 0.8 1.6
1973 46,221.6 1972 32,776.8 41.0 I
2,988.6 2,652.9 12.65
~·· 835.9 563.7 48.28
r 10,447.4 7,431.3 40.58
368.8 364.6 · I.I 5 . 871.3 821.8 6.02 ·
22,380.2 13,872.9 61.32 5,777.1 4;920.5 17.40
977.l 717.2 36.23 595.1 551.7 7.86 980.1 880.2 11.34
CY 1973 ·100.0 CY 1972 100.0. 19.4 20.9 75.8 · 75.4
1.8 2.4
I 3.0 · 1.3
r CY 1973 11. l CY 1972 11.17 (5. 13)
1973 1972 14,744.7 9,414.3 56.62 14,433.2 9,073.7 59.06
15

Statistical-Series
41, .Total assets and liabilities of commercial · banks
Total assets Total liabilities
42. Total a~ets and liabilities of development banks Total assets Total liabilities
E. PUBLIC FINANCE
43. National and local government tax revenue Direct taxes Indirect taxes
44. Total tax receipts as a percentage of gross national product
45. National government expenditures Current operating expenditures Economic development Social development National defense General government Debt service
Capital expenditures Economic development Social development National defense General government
46. Revenues and expenditures of local governments Total revenues Total expenditures
General administration Economic development Social improvement Debt service Capital outlays Other charges
16
SUMMARY OF MAJOR
Unit
P million
P million
P million
per cent l" million P million per cent per cent per cent per cent per cent P million per cent per cent per cent per cent
1' million P million per cent per cent per cent per cent per cent per cent
.I
(I

STATISTICAL SERIES (continued)
Latest Data Compared to
Reference Value . Reference Value Per Cent Period Period · Change
1973 29,940.3 19,997.8 49.71 27,047.1 18,013.0 50.15
1973 1972
::;:> 5,267.2 4,752.1 10.83 3,165.8 3,977.4 (20.41)
FY 1971-72 5,362 FYl970-71 4,619 16.08 1,586 1,312 20.88 3,'176 3,307 14.18
FY 1971-72 8.65 FY 1970-71 8.56 I.OS FY 1972-73 7,941 FY 1971-72 5,588 42.10
·' 5,784 4,377 32.14 , 25.1 17.7 32.6 38.8 19.4 19.6 14.5 16.4 8.5 7.5
2',157 .Ll..!.!. 78.11 91.4 91.9 -4.5 5.5 3.8 . 1.9 0.3 0.7
FY 1971-72 FY 1970-71
1,292 1,086 18.96 1,264 1,033 22.36
47.8 47.4 19.0 18.S 13.3 13.8
1.3 1.6 9.3 9.3 9.3 9.3
17
'

SUMMARY OF MAJOR
Statistical Series Unit
47. Holders of government"securities J> million Central Bank . per cent
B.anks per cent. Trust funds per cent
l
~ Semi-government entities· per cent Private sector per cent
◄ Foreign holders per cent
48. Internal debt outstanding J> million National government Local government Government corporation Monetary institutions
49. Internal debt outstanding by period of ·maturity per cent
Long term i Medium term ·short term
so. External debt outstanding $ million
51. Total external debt outstanding $ million
(Disbursement basis) by borrower Public sector per cent
◄ Central Bank Others
Private sector 52. Total external debt outstanding
(Disbursement Basis) by maturity per cent
Short tenn ' Medium term • Long term
J 53. Expenditure on _infrastructure 'I" million Percentage distribution
Highways
~ Irrigation Flood control Scho·ols Airport and air navigation Power Rl}ral electrification
18

STATISTICAL SERIES (continued) .
, Latest Data Compared to
Reference Value Reference Value Per Cent I Period Period Change
~ Dec. 31, 19.73 11,203 D:c. 3 I, 1972 7,646 46.52 31.9 39.5 37.4 23.1
8.1 I 1.3 9.3 4.3
13.0 21.3 0.3 0,.4
Dec. 31, 1973 12,533.4 Dec. 3 1, 1972 9,701.5 29.19 7,294.2 5,607.8 30.07
96.2 106.3 (9 .51) 2,004.8 2,265.4 (11.51) 3,138.2 1,722.0 82.24
Dec. 31, 1973 100.0 Dec.31, 1972 100.0 26.7 27.1 42.9. 41.7 30.4 31.2
Dec. 31, 1973 1,224.9 Dec. 31, 1972 1,171.4 4.56 Dec. 31; 1973 Dec.31, 1972
2,337.8 . 2,210.4 5.76 =
41.2 42.5 19.1 18.1 24.1 24.3 58.8 57.5
Dec. 31, 1973 100.0 Dec. 31, 1972 100.0
14.2 14.5 17.0 21.2 68.7 64.3
FY 1972-73 1,275.6 FY 1971-72 758.6 68.15 100.0 100.0 50.8 47.4
r 15.5 14.2 4.8 0.7 6.4 5.0 4.4 8.7 3.5 7.8 2.9 2.0
19
) .✓•

7
SUMMARY OF MAJ()R
1 Statistical Series Unit
Portworks Railroads Others
F. EXTERNAL TRADE ' l
54. Foreign exchange receipts $ million ~
Merchandise exports (fob) Non-monetary gold Freight and insurance Travel Others
55. Foreign exchange .disbursements $ million Merchandise jmports
' Freight and insurance Travel Others
56. Net foreign receipts $ million 57. Direction of external. trade $ million
Exports Imports Balance of trade
North America E:uropean countries Japan
' Rest of Asia Rest of the world
58. Indices of external trade (I 965 , I 00) per cent Quantum index
Exports Imports 1
Price index Imports ·, Exports
Value index Imports Exports
Net terms of trade
20
, •

STATISTICAL SERIES (continued)
Latest Data
Reference Period
CY 1973
CY 1973
CY 1973 · CY 1973
CY 1973
Value
3.3 2.2 6.2
.2,508 1,768
103 20 74
543 2; 186 1,597
167 15 .
407 . 322
1,886 1,597
289 218
69 156 60
(213)
163.5 132.8
149.0 · 149. I
230.0 211.6
99.4
Compared to
Reference Period
CY 1972
CY 1972
CY 1972 CY 1972
CY 1972 ,
;
21
Value
2.1 I. 7
10.4
1,485 1,109
29 14
122 211
1,662 1,260 · 109
24 269
(177)
1,106 1,230 (124) 115 (12) (17) (32)
(178)
143.7 118.7
100.0 128.1
143.7 151.8 78.2
. Pei Cent Change
68.88 59.42
255.17. 42.85 (39.35) 157.34 31.52 26.74 53.21
(37 .50) 5L30
181.92
70.52 29.83
233.06 89.56
575.00 917 .64 187.50 (41.02)
13.77 11.87
49.00 16.39
60.05 39.37 27.10

7 SUMMARY OF MAJOR 1
Statistical Series Unit
59. Imports by end use $ million . ◄ Consumer goo'ds
Producer goods Machinery and equipment Raw materials and intermediate
◄ goods 60. Total exports $ million ~ Copra
Sugar Bananas Logs and lumber Desiccated coconut Coconut oil Pineapple_s, canned Gold Plywood -
· Copper concentrates Ten principal exports Other exports
G. PRICES
6 I. Consumer price index (I 966 = I 00) per cent Philippines (All income families) Manila and suburbs (Middle income
families) Regions outside Manila (Middle income
families) 1 62. Wholesale price index for Manila
(1965. 100) per cent Domestic products , Export products Imported products
63. Stock price index for Manila ( 1965 = l 00) per cent \ Mining Commercial and industrial Banking Insurance Sugar
22
'

STATISTICAL SERIES (continued)
Latest Data Compared to
Reference Value Re(erence Value Per Cent Period Period Change
CY 1973 1,596.6. CY 1972 1,229.6 29.84 287.5 202.6 41.90
1;309.1 · I,027.0 27.46 490.9 433.8 I 3.16
818.2 593.2 37.92 CY 1973 1,886.3 CY 1972 I, 105.5 70.62
165.8 110.5 50.04 274.0 208.6 31.35
27.8 24.3 14.40 338.7 174.4 94.20 · 32.5 I?:6 84.65 152.6 84.3 81.02.
19.7 19.6 0.51 39.9 26.9 48.32 58.1 33.7 72.40
290.3 190.9 52.06 1,399.3 890.7 57.10
487.0 214.8 126.72
June 1974 304.56 June 1973 209.81 56.24
289.23 191.61 50.94
281.23 192.97 45.73
CY 1973 218.4 . CY 1972 175.4 24.51 219.4 177.0 13_.95
248.l 161.2 53.90 212.9 166.4 27.94
CY 1973 153.7 CY 1972 120.2 27.87
~ 180.4 138.9 29.87 107.5 85.9 25.14
I
99.2 99.0 0.20 83.7 93.7 (10.68) 48.9 47.4 3.16
23
>

SUMMARY OF MAJOR
Statistical Series Unit ~ 64 .. Wage indices of la borers in Manila
(1965;100) per cent ~ Skilled labor Nominal Real
Unskilled Nominat · Real
H. ESTABLISHMENT CHARACTERISTICS
65. Employment index by industry (1965; 100) per cent Agriculture Mining and quarrying ' Manufacturing
·Construction Electricity, gas and water Commerce ~ Transportation and communication Services -
66. Index of average monthly earnings _of salaried employees ( l 965 ; l 00) per cent ' Mining and quarrying Manufacturing ~
Electricity, gas and water .Commerce Transportation and communication
67. Number of newly registered. business '1
organiza ti\ms Corporations. Partnerships
68: Single proprietorships
Paid-in capital investments of newly registered business organizations l' thousand i Agriculture Mining Manufacturing Construction
~ 24
=

STATISTICAL SERIES (continued)
Latest Data Compared to
Reference Value Reference Value Per Cent· Period Period 1 Change
CY 1973 CY 1972
154.4 146,6 5.32 82,8 86.8 (4.61) ••
168.7 164.3 2.67 . 90.4 97.4 (7.19)
CY 1973 132.2 CY 1972 123, 1 7.39 147:6 122.3 · 20.68 138.6 125.2 10.70 135.5 131.4 3.12 56.8 79.2 (28,29)
120:5 1 I 9.4 0.92 11 1.3 112.5 (1.07) 149.0 130.4 14.26 143.2 131.8 8.64
CY 1973 CY 1972 136.0 119.6 13.71 173.6 156.3 11.06 181.2 163.6 10.75 164.4 14 7.6 11.38
. 149.2 138.1 8.03
CY 1973 36 007 CY 1972 14 901 141.64 3,624 2,672 35.62 2,292 1,415 61.97
30,091 10,814 178.25
CY 1973 983 559 CY 1972 604,273 62.76 72,218 31,034 132.72 24,082 9,550 152.16
161,082 92,250 74.61 43,031 36,392 18.24
25
~ Q

Statistical Series
Electricity, gas and water .Trade Rest of commerce Transport, storage and communication Services
69. Capital increases and withdrawals of corporations and partnerships Increases Withdrawals Net effect
I. EDUCATION AND.HEALTH SERVICES
70. Enrolment Elementary ·
Public schools Private schools State colleges and universities
Secondary Public schools Private schools State colleges and universities
Collegiate Public schools Private schools State colleges and universities
7 I. Number of students per teacher Elementary
Public schools Private schools
Secondary . Public schools
. Private s~hools Collegiate ·
Public schools1
Private schools 72 .. operating expenditures of the government (Depart
ment of Education) on education I
I Excludes teachers in goVemment vocational schools offering collegiate courses.
26
SUMMARY OF MAJOR
Unit
·P ihousand
!
thousand
I' million
t

STATISTICAL SERIES (continued)
Latest Data Compared to
Reference Value Reference Value Per Cent Period Period Change
3,451 923 273.88 330,738 185,499 78.29 134,815 127,591 5.66 47,461 26,526 78.92
166,681 94,508 76.36
CY 1973 CY 1972 654,900 553;100 18.40
86,914 54,698 58.89 567,986 498,402 13.96
SY 1972-73 7 977 SY 1971-72 7,630 4.54 7,606 7,271 4.60
370 358 3.35 2 2 0.00
1,878 I 793 4.74 843 773 9.05
1,029 1,013 1.57 7 7 0.00
SY 1971-72 648 SY 1970-71 630 2.85 3 4 (25.00)
602 584 3.08 43 42 2.38
o,
SY 1972-73 30.8 SY 1971-72 , .. 30.7 0.32 SY 1971-72 35.3 SY1970-71 29.9 18.06
SY 1972-73 32.6 ·sy 1911-12 35.5 (8.1 7) SY 1971-72 35.0 SY 1970-71 33.5 4.47
SY 1970-71 285.0 SY 1969-70 288.0 (1.05) SY1971-7'2 25.2 SY1970-71 23.0 9.56
FY 1972-73 1,321 FY 1971-72 1,256 . 5 .. 17 _.
27

7 SUMMARY OF MAJOR
Statistical Series Unit
Ratio to total operating expenditures of the government per cent
Ratio to gross national product ·1 73. Bed .capacity of government and private.
hospitals beds 74. Bed capacity per I 0,000 population beds 7_5. Number of hospitals hospitals
Government Private
76. Expenditure of the national government on public health ' 'I' million Current operating Capital outlay
77. Number of physicians physicians Number of persons per physician. persons -
78. Number of dentists den-tists 1
Number of persons per dentist persons 79 .. Number of nurses .nurses 80. Number of midwives midwives
\ J. OTHER SERVICES
81. Total number of motor vehicles vehicles Private passenger vehicles
' Public utility vehicles
~ Service vehicles Government owned cars. and tl;llcks
~ Others 82. Private passenger vehicl:s J)er I Q9,000
~ persons 83. Kilometers of road kilometers·
National government Local government
84. Num~er of bridges National government Local government
85. Length of bridges kilometers National government Local government
28
···..:.:..:.~

·sTA TISTICAL SERIES (continued)
Latest Data Compared to ✓
Reference Value Reference Value Per Cent
Period Period Change
16.53 22.4 7. (26.44) 2.13 2.33 (8.58)
FY 1971-72 43,124 ' FY 1970-71 41,153 14.78 FY 1971-72 11.0 10,9 · 0.91 FY 1971-72 693 FY 1970-71 640 8.28
244 209 16.74 449 431 4.17
FY 1972-73 354 FY 1971-72 288 22.91 328 260 23.30
~ 26 22 18. 18 1973 35,286 1972 33,471. 5.42
1,106 1,133 (2.39) 1973 q,596 1972 12,474 0.97
3,099 3,040. 1.94 1973 51,563 1972 43,703 . 17.98 1973 19,931 1972 18,312 8.84
/
' CY 1973 571,347 CY 1972 516,72-7 10.57 296,480 282,153 5.07 87,308 70,351 24.10
176,155 150,268 17.22 9,242 13,746 (32. 77) 2,162 209 . 34.44
CY 1973 759 CY 1972 744 20.16 FY 1972-73 78,354.9 FY 1971-72 74,768.5 · 4.79
21,643.3 21,315.4 TIT 56,711.6 53,453.2 6.09
FY 1971-72 13,151 FY 1970-71 12,897 1.96 6,541 6,472 1.06 6,610 6,425 2.87
FY 1971-72 276.6 FY 1970-71 270.7 2.17 169.5 165.0, 2.72
· I 07.1 IQ5.8 1.22
. -• 29

SUMMARY OF MAJOR
Statistical Series Unit
K. TOURISM • 86. Number of visitors
87. Estimated tourist receipts $ thousand
88. 'Flight~nd passengers carried by ,
inte ational air carriers -Passengers carried, total 1
Incoming Outgoing
Flights, total " Incoming
Outgoing
L. AVAILABLE FOOD SUPPLY
89. Daily per capita available food supply grams/day Cereals and cereal products Roots and tubers ... Sugar and syrup Pulses and nuts Vegetables
\. Fruits Meat and meat products Milk and milk products Eggs Fish and other marine products , Fats and oil Miscellaneous food 1
90. Calorie and nutrient values of available food supply (daily per capita) Calorie calories
~ Protein grams Fats · grams
91. PerTent sufficiency of daily per capita • available food supply to nutritional
. requirements per cent Food net, in grams per day Food net, in calories per day Protein, in grams per day Fats, in grams per day
30

STATISTICAL SERIES (continued)
Latest Data Compared to
Reference Value Reference Value Per Cent •
Period Period Change
· CY 1973 205,727 CY 1972 I 50,300 36.87 CY 1973 . 67,803 CY 1972 38,271 77.16
CY 1973 CY 1972 •
593,372 513,505 I 5.55 283. 137 239,528 18.20 310.235 273,977 13.23
10.805 11,732 Q.2.!l 5,302 5,866 (9.62) 5,503 5,866 (6.19)
CY 1972 950.9 CY 1971 965.7 ( 1.54) 363.2 391.9 (7.33)
65.9 58.2 13.23 51.4 . 49.3 4.25 ·f 5.0 14.8 1.35 76.8 78.1 ( 1.6 7) 98.9 99.6 (0. 71) 43.2 41.9 3.10 '-
/ 47.1 43.0 9.53
8.7 8.7 0.00 107.3 103.3 3.87
9.8 8.4 16.66 63.6 68.5 (7.16)
'
~ CY 1972 2,647 CY 1971 2,123 2.;_(18
52.9 54.9 (.1_(,5)
t 27.8 26.4 'dO
r •✓
CY 1972 CY ,1971 78.8 80.0 ! 1.50)
r 93.6 97.1 (3.61) 97.2 100.9 · (3.67)
95.9 91.0 5.38
I 31
f

t
f Figure LI
Figure 1.2
Figure 1.3
Table I.I
Table 1.2
Table 1.3
Table 1.4
Table 1.5
~ Table 1.6
Table 1.7
~ Table I.~
Table 1.9
fiablc 1.10
Table 1.11
Table 1.12
Table 1.13
Table 1.14
r r
CHAPTER I
POPULATION AND HOUSING;
LABOR FORCE AND EMPLOYMENT
Provinces Ranked According to Population: 1970 36
Population by Age and Sex: May 6, I 970 Census 38
Labor Force, Employment Status, Urban and Rural: 1965-73 40
Population, Land Area and Density of the Population by Region and Province: Census Years 1903-70 40
Population by Age and Sex: May 6,.19'70 Census 46
Total Population: 1877-2000 47
Population of the Philippines: 1799-1970 48
Population Projections by Age Distribution: 1960-2000 49
EstimateQ Vital Statistics According to Various Populati'on Projections, Philippines: 1970-2000 51
Employed Persons by Major Industry Group: October .1956 to November I 973 · 52
Employed Persons by Major Occupation.Group: October 1956 to November I 973 54
Labor Force, Participation Rate, Employment Status, Urban.and Rural: 1960-73 56
Literacy of Population I O Years Old and Over, by Sex for Urban and Rural Areas and Regions in the Philippines: 1960.and 1970 57
Inter-Regional Migration and Growth, Philippines: CY 1960-70 57
Registered Aliens by Nationality: CY 1962-72 58
Dwelling Units: I 960 59
Selected Characteristics of Dwelling Units, Philippines, Rural-Urban: May 1967 60
■

/
' '
CHAPTER I
POPULATION AND HOUSING; LABOR FORCE AND EMPLOYMENT
This chapter presents statistics on the characteristics of the population and labor force, their size, composition, distribution and growth over the years. Data pertaining to some labor characteristics of dwelling uryits are also 'included.
CENSUSES OF .POPULATION AND HOUSING. The Census of Population .and Housing is undertaken once in every decade. The last census, conducted on May 6, I 970; was the si~th census since 1903 and the third after World War II. The National Census and Statistics Office is authorized under Commonwealth Act 591 "to prepare for and undertake all censuses of population, agriculture, industry and commerce." Such national censuses are designed primarily to provide authoritative data for use in development planning on the national and local levels.
National summary results are presented by province and by municipality and are published in the Census of the Philippines. •
POPULATION ESTIMATES AND PROJECTIONS. Inter•censal and post-censal estimates and projections of the population and its characteristics are prepared by the National Census and Statistics Office and published from time to time in the Journal of Philippine Statistics and Handbook of Philippine Statistics. Such estimates and projections are based on the latest censuses of population and housing and trends established in past censuses.
Population ·projections utilize the component method, where each of . the c9mponents of population change-births, death and net migration is projected. Data on the age-sex distribution, death rate for each age-sex groups, fertility rate, sex ratio at births, estimatet of net
' . migration are used in population projection.
As defined by the National Census and Statistics Office, urban areas in their entirety comprise all cities and municipalities which have a population density of at least .1,000 persons per square kilometer; poblaciones or central districts of municipalities and cities which have a population density of at least 500 persons per square kilometer; and/or poblaciones or central districts which, regardless of population size, have a street pattern, at least six establishments, and a town hall or a
34
'j
•

. '
church, a public plaza, a public building like a school, a hospital, a puericulture center, or a library, etc. Rural areas comprise· all poblaciones or central districts and all barrios that do not meet the requirements for classification. as urban. Manila and suburbs, or the Greater Manila Area, comprise the city of Manila proper, Quezon City, Caloocan City, Pasay City, and the municipalities of Makati, Mandaluyong, San Juan and Parai'iaque. LABOR FORCE _AND EMPLOYMENT. Labor force is the part of the population ten .years old and over that is either employed or unemployed.✓Employed persons include all those who were reported at work or those with. a job but not at work, while unemployed include all tlfose who were reported as wanting and looking foi work on a full-time basis. Persons not in the tabor force_ are those who are not at work and without jobs and not wanting work. Labor force and employment statistics are published in the NCSO Survey of Households Bulletin, Journal of Philippine Statistics, and NCSO Special Releases.
Data on the size, composition, and distributiof) of the employed persons classified by industry, class of worker, hours worked, and other socio-economic characteristics, the number and distribution of the
· unemployed and their characteristics are included.
/
...
35
•

PROVINCES
0 .5 1.Q
Figure I.I RANKED ACCORDING TO
(Population in millions) POPUr!ATION: 1970
1.5 2.0 2.5
,· CEBU • NEGROS OCCIDENTAL
PANGASINAN CITY OF MANILA ILOILO COTABATO LEVTE ZAMBOANGA DEL SUR QUEZON CAMARINES SUR' BATANGAS PAMPAIIIGA NUEVA ECIJA BULACAN DAVAO DEL SUR NEGROS ORIENTAL LAGUNA BOHOL ALBAV IS,ABE LA CAGAVAN TARLAC CAVITE MASBATE MISAMIS ORIENTAL SOUTH COTABATO LAN AO DEL SUR
• -DAVAO DEL N/ORTE · WESTERN SAMAR
3.0 3.5 · RIZAL

-
0 .5 ,.o 1.5
SORSOGON. SULU BUKIDNON ZAMBOANGA DEL NORTE CA.PIZ !LOCOS SUR LA UNION LANAO DEL NORTE !LOCOS NORTE. ZAMBALES
• - • ORIENTAL MIN DORO MISAMIS OCCIDENTAL
·, · NORTHERN SAM AR ' ANTIQUE AGUSAN DEL.NORTE EASTERN SAMAR BENGUET AKLAN CAMARINE!> NORTE SURIGAO DEL SUR SOUT<HERN LEYTE DAVAO ORIENTAL .. SURIGAO DEL NORTE PALAWAN · NUEVA VIZCAYA BATAAN AGUSAN DEL SUR ROMBLON. CATANDUANES ABRA MARIN DUQUE OCCIDENTAi:. MINDORO KALINGA-APAYAO MOUNTAIN PROVINCE IFUGAO CAMI.GUIN BATANES
2.0 2.5 3.0 3.5

l
3
MALE
Figure 1.2 POPULATION ~y AGE AND SEX
MAY 6, 1970 CENSUS •
AGE GROUP (IN YEARS)
BEIDW 5
2 I 0
FEMALE
2
-1 N M I L LIONS IN MILLIONS
38
1
4
3

I 9 6 5
I 9 6 6
I 9 6 7
I 9 6 8
I 9 6 9
I 9 7 I.
I 9 7 2
I 9 7 3
LEGEND:
Figure 1.3 LABOR FORCE, EMPLOYMENT STATUS, URBAN AND RURAL
1965- 73
TOTAL LABOR FORCE -(IN THOUSANDS)
t 1,000 EMPLOYED (URBANI t 1,000 t·: 1,000
EMPLOYED " ·UNEMPLOYED (RURAL)
39
10,764 •
11,757
11,776
II ,3 7 I
12,046
13,241
13,294.
14,559

Table 1.1 POPULATION, LAND AREA AND DENSITY OF THE
--\ p 0 p ulation
and (in thousands)
Region Province 1970 1960 1948 1939 1918
(May 6) (Feb. 15) (Oct. I) (Jan. I) (Dec. 31)
• PHILIPPINES 36,684 27,088 19,234 16,000 10,314
I. Ilocos 2,991 2,427 1,943 1,729 I 477
◄ Abra 146 11 5 87 88 73 Benguet 264 184 110 122 Q
llocos Norte 343. 287 251 238 ..
219 Ilocos Sur 385 338 276 272 247 ~ La Union 374 29-3 237 208 178 Mt. Province 93 86 62 59 194 j Pangasinan 1,386 1,124 920 742 566
' II. Cagayan 1,690 1.202 775 714 348 Batanes 11 10 11 9 8 Cagayan 581 445 311 292 191 - -lfugao 92 77 50 68 Q ~ Isabela 648 442 264 220 113 ,. Kalinga-Apayao 136 90 56 47 Q
Nueva Vizcaya1 222 138 83 78 36 ,J
' -III. Central Luzon · 3,7 I 3 2,566 1,847· 1,582 1,048 Bataan · 216 145 93 86 58 Bulacan 836 55/i 411 333 · ,249 Nueva Ecija 851 608 468 417 227 Pampanga 907 ql7 417 375 258 .. Tarlac 560 427 327 264 172 Zambales 343 213 . I 39 107 84
IV. Southern Tagalog . 8,325 5,502 3,637 2,795 1,683 Manila and Suburbs2 1,33 I 1,139 984 623 285 Batangas 926 681 510 442 340 Cavite 520 378 263 239 157 Laguna 700 472 321- 280 196 Marinduque 144 115 86 82 57 Occidental Mindoro 144 84 43· 39 28 Oriental Mindoro 328 229 125 93 44 Pala wan 237 163 106 94 69' I Quezon3 983 653 417 359 212 Rizal 2,845 .1,456 673 445 230 Romblon 167 132 109 99 65
40
' L

POPULATION BY REGION AND PROVINCE: CENSUS YEARS 1903-70
Land Area Density (sq. km.) · (persons/sq. km.)
190"3 1970 1960 1948 1939 I 918 -1903 (Mar._2) (May 6) (Feb. 15) (Oct. I)' (Jan. I) (Dec. 31) (Mar. 2)
7,635 300,000.0 122.3 90.3 64.1 53.3 34.4 25.5 1,138 2 I ,568.4 138.7 112.5 . 90.1 80.2 68.5 52.8
52 3,975.5 36.6 29.0 21.8 22.1 18.4 13.1 a 2,655.4 99.3 . 69.2 41.4 45.9 a a
179 3,399.3, I 01.0 84.5 74.0 70.0 64.4 52.7 190 2,579.6 149.3 I 3 J. I 107.1 105.4 95.8 73.7 138 1,493.1 250.3 196.5 159.0 139.3 I I 9.2 92.4 136 2,097.3 44.4 40.9 29.6 28.1 92.5 64.8 443 5,368.2 258.2 209.4 171.5 138.2 105.4 82.5
252 36,403. l 46.4 33.0 21.3 19.6 9.6 6.9 -8 209.3 54.5 49.3 51.1 43.0 38.2 38.2 148 9,002.7 64.6 49.5 34.6 32.4 21.2 16.4
.r a 2,517.8 36.7 30.5 I 9.8 '}.7.0 a a
76 I 0,664.6 60.8 41.5 24.8 20.6 10.6 7.1 a 7,047.6 19.3 12.7 8.0 6.7 a a
20 6,96 I. I 31.9 19.8 11.9 11.2 5.2 2.9
t
824 18 277.9 203.1 140.4 101.1 86.6 57.3 ·_45.1 47 1,373.0 157 .5 105.8 67.7 62.6 42.2 34.2
224 2,672.0 313.0 • 208.0 153.9 124.6 93.2 83.8 134 5,284.3 161.1 I 15.1 88.5 78.9 43.0 25.4 224 2,180.7 416.0 283.1 191.0 172.0 118.3 102.7 135 3,053.5 183.3 139.7 107.1 86.5 56.3 44.2 60 3,714.4 92.4 57.5 35.2 23_3-- 22.6- 16.2
1,244 47,512.9 175.2 I I 5.8 76.5 58.8 35.4 26.2 220 38.3 34,746.4 29,728.7 25,689.4 16,266.3 · 7,441.3 5,744.1 258 3,-165.8 292.6 215.2 161.2 139.6 107.4 81.5 135 1,287.5 404.0 293.7 203.9 185.6 121.9 104.9 149 1,759.7 397.6 268.3 182.6 159. I 111.4 84.7 52 959.2 I 50.2 I I 9.5 89:5 85.5 · 59.4 54.2 13 5,879.8 24.5 14.3 • 7.3 6.6 4.8 2.2
r 24 4,364.7 75.2 52.5 28.5 21.3 I 0.1 5.5
f 36 14,896.3 15.9 10.9 7.1 6.3 4.6 2.4
r . ·153 11,946.l 82.3 54.7 34.9 30.I. 17.7 I 2.8 15 I 1,859.6 1,529.7 - 783.2 361.9 239.3 123.7 81.2
' 53 1.355.9 123.2 97.1 80.3 73.0 47.9 39. I
~ I
41

Table I.I - POPULATION, LAND AREA AN_D DENSITY OF THE POPULATION
• p opul.ation
Region and """(in thousands) ·
Province 1°970 1960 1948 1939 1918 (May 6) (Feb. 15) ., (Oct. I) · (Jan. I) (Dec. 31)
V. Bicol 2,966 2,363 1,667 1,347 841 . Albay 674 515 395 334 260
Camarines Norte 262 188 104 98 52 1 Camarines Sur 948 820 554 386 219
Catanduanes 162 156 112 99 64 Masbate 493 336 211 182 68 Sorsogon 427 348 291 248 178
VI. Western Visayas 3,618 3,077 2,53 I 2,174 1,347 j
Aklan 263 226 197 177 137 -, Antique 289 238 234 199 155
· Capiz 394 315 245 229 155 . Iloilo4 1,168 966 816 744 503
. Negros Occidental 1,504 1,332 1,039 825 397 VII. Central Visaya_s_ 3,032 2,523 2,119 1,955 1,486 " Bohol 683 592 553 492, 358 " Cebu
,, 1,634 1,333 1,123 1,068 855
Negros Orient"i.15 715 598 443 395 273 -,
VIII. Eastern Visayas - 2,381 2,041 1,764 J°,463 978 Leyte6 . 1,11 I 963 . 819 743 476 Southern Leyte 251 210 188 173 122 Eastern Samar 271 238 198 155 C
Northern Samar 306 261 228 155 C
Western Samar - 442 369 331 237 380 IX. Western Mindanao 1,869 1,350 763 603 320
Sulu7 426 327 241 247 173 Zamboanga de! Norte 409 281 168 139 57 Zamboanga de! Sur 1,034 742 354 217 90
'1 , ,
0
42
L

BY REGION AND PROVINCE: CENSUS YEARS I 903-70 (continued)
Land Area Density (sq'. km.) (persons/sq. km.) ·
1903 1970 1960 1948 1939 1918 1903 '(Mar. 2) (May 6) (Feb. I 5) (Oct. I) (Jan. I) (Dec. 31) (Mar. 2)
643 17,632.5 168.2 134.0 94.5 76.4 47.7 36.5 201 .2,552.6 264.0 201.7 I 54.6 130.8 I 01.9 78.7 45 2,112.5 124.1 89.0 49.1 46.4 24.6 21.3
194 5,266.8 180.0 155.6 105.1 73.3 41.6 )6.8 39 1,511.5 ,)07.4 103,4 74.2 65.5 42.3 25.8 44 4,047.7 · 121.8 83.0 52.2 45.0 16.8 10.9
120 2,141.4 199.4 162.4 135.9 115.8 83.1 56.0 1,085 20,223.2 178.9 · I 52:2 125.2 107.5 66.6 53.7
114 1,817.9 144.9 124.4 108.4 97.4 75.4 62.7 136 2,522.0 114.7 94.5 92.6 78.9 61.5 53.9
. I I 7 2,633.2 149.6 119.7 93.0 87.0 58.9 44.4 410 5,324.0 219.4 181.5 153.3 139.7 94.5 77.0 ,-308 7,926.1 189.7 168.I 131.0 104.1 SO.I 38.9
._ 1,124 14,951.5 202.8 168.7 141.7 130.8 99.4 75.2 269 4,117.3 166.0 143.8 134.4 119.5 87.0 65.3 654 5,088.4 . 321.2 ·261.9 220.7 .209.9 168.0 128.5 2Ql . . 5,745.8 124.5 104.0 77.2 68.7 47.S /35.0
655, 21,431.6 111.1· 95.2. 82.3 · 68.3 45.6 30.6 389 6,268.2 177.2 153.7 130.7 I 18.5 75.9 62.1
b 1,734.8 144.9 120.8 I 08.1 99.7 70.3 b
C 4,339.6 62.4 54.8 45.6 35.7 C C ' C 3,497.9 87.5 74.7 ' 65.2 44.3 C I C
. 266 5,591.0 79.2 66.0 59.2' 42.4 68.0 47.6
189 18,685.0 100.0 72.3 40.8 32.3 ill lQJ_
r 91 2,687.8 · 158.4 121.6 89.6 91.9 64.4 33.9 17 6,075.2 67.4 46.3 27.6 22.9 9.4 2.8 81 9,922.0 104.2 74.8 35.7 21.9· 9.1 8.2
I
~ 43

Table I. I - POPULATION, LAND AREA AND DENSITY OF THE POPULATION
Region and ' Province 1970
(May 6) 1960
(Feb. 15)
X. Northern Mindanao 3,019 bill Agusan del Norte Agusan del Sur Bukidnon Camiguin Lanao de! Norte Lanao del Sur Misamis Occidental Misamis Oriental Surigao de! Norte Surigao de! Sur
XI. Southern Mindanao Cotabato8
Davao de! Norte Davao Oriental Davao de! Sur South Cotabato
I Includes Quirino. 2Suburbs are include4 in RizaJ. 3Jncludes Aurora. 4Jncludes Guimaras. 5Jncl~dcs Sequijor. 6Jncludes Biliran. 7JJ1cludes Tawi-tawi. BJncludes Sultan Kudarat and Maguindanao.
278 175 415
54 350 456 320 473 239 259
3,078 I ,I ~6
443 248 785 466
0 Benguel, lfugao, Kalinga-Apayao included in Mt. Province.· bSouthem Leyh: included in Leyte. CEastern and Northern Sarnar included in Western Samar. dAgusan dcl Sur included in Agusan dd Norte. eCamiguin incl~ded .in Misamis Oriental. /Lanao del Sur included in Lnnao del Norte. ESurigao del Sur included in Surigao del NOrte.
177 94
194 45
271 378 248 344 195 165
1,923 734 263 133 498 295
hDavao del Sur and Davao Oriental included in Davao del Norte. iSouth Cotabato included in Cotabato.
Po·pulation (in thousands)
1948 (Oct. I)
1,377 89 38-63 70
132 212 208 300 155 110
804 337
91 68
205 103
1939 (Jan. I)
1,050 64 35 58 41 99
144 210 173 126 iOO 591 241
60 58
174 58
1918 (Dec. 31)
507 45
d
40 ,
21 70 81
127 67 56
279 172 107
h
h
Source: National Census and Statistics Of~ce, The Population of the Philippines: Its G,rowth and Development, 1973.
44
,
-......

~:
-,-
I t
~ t
r f
i ~ i
r
r r
BY REGION AND PROVINCE: CENSUS YEARS I 903-70 (cqntinued)
1903 (Mar. 2)
290 31 d.
21 e
22 I 45 87 84 g
191 . 126
65 h
h
Land Area (sq. km.)
39 844.9 2,590.3 8,965.5 8,293.8
229.8 3,092.0 3,872.9 1,939.3 3,570.1 2,739.0 4,552.2
43,469.0 16,328.3 8,129.8 5,164.5 6,377.6 7,468.8
Density (persons/sq. km.)
1970 1960 1948 1939 1918 1903 (May 6) (Feb. 15) (Oct. I) (Jan. I) (Dec. 31) (Mar. 2)
. 75.8 53.0 34.6 26.4 12!7 _ll_ I 07.3 68.5 34.3 24.7 17.4 12.0
19.5 10.4 4.2 3.9 d d
50.0 23.4 7.7 7.0 4.8 2.5 234.6 194.6 302.9 178.4 e e
113.2 8'.7.5 42.6 32.0 6.8 7.1 117 .6 97.7 · 54.& . 37.2 18.1 I
. 164.9 128. 1 I '19 .0 108.3 41.8 23.2 I 32.4 96.3 84.1 48.5 35.6 24.4
87.2 71.2 56.6 46.0 24.5 30.7 56.8 36.2 24.2 22.0 12.3 g
70.8 44.2 18.5 13.6 __M 4.4 69.6 45.0 20.6 l~.8 I 0.5 7.7 54.4 32.3 11.2 7.4 13.2 8.0 48.0 25.7 13.2 - 11.2 h h
123.1 78.0 32.2 27.3 h .h
62.4 39.5 13.8 7.8
-
45

1 Table 1.2 - POPULATION BY AGE AND SEX: MAY 6, 1970 CENSUS
(In Thousands)
Philippines
Age in Years Both Sexes Male Female
1
' ALL AGES 36,684 18,250 18,434
Below 5 i 6,088 3,126 2,962
◄ s to 9 5,418 2;799 2,619 10 to 14 4,310 2,196 2,114 15 to 19 3,685 1,739 1,945 20 to 24 3,373 1,580 1,794 , 25 to 29 2,881 1,426 1,455 1 30 to 34 2,287 1,159 1,128 - : 35'to 39 · 1,906 976 . 930 _._ ' 40 to 44 1,441 708 732 45 to 49 1,282 609 672 -50 to 54 · 1,074 503 571 55 to 59 928 442 486 " 60. to 64 736 359 377 65 to 69 487 238 250 -,
· 70 to 74 356 183 113
75 to 79 168 82 86 80 and over 264 124 139
Note: Details may- not add up to totals due to rounding.. -Sourr:e of data: National Census and StatistiCB Office, Census of Population and Housing (Narlonal Summary - Philippines).
◄ '
46
I

Year
1877 1887 1896
.1903 1918 1939 1948 1960 1970 1971 1972 1973 1974 1975 1976 1977 1978 1979 1980 1985 1990 1995 2000
Table 1.3 -TOTAL POPULATION: 1877-2000 (Population in thousands, growth rate in per cent)
Census Population1 Estimated Midyear. Population
High Medium . Low Projection2 Projection3 Projection 4
5,568 5,985 6,261 7,635 (Mar. 2)
10,314 (Dec. 18) 16,000 (Jan. 1) 19,234 (Oct. I) 27·,088 (Feb. 15) 36,684 (May 6) 36,852 36,852 36,852
37,969 37,919 37,867 39,144 39,040 38,934 40,380 40,219 40,055 41,680 41,457 41,232 43,048 42,759 42,469 44,411 44,010 43,600 45,840 45,315 44,875 47,340 46,686 46,026 48,915 48,123 47,327 50,569 49,630 48,691 59,533 57,187 54,840 09,955 65,343 60,740 82,135 74,205 66,355 96,551 83,901 71.,592
loata for 1877-1896 exclude non-Chri~tian population .
. 2High projections assume constant fertility and a slow decline in mortality. 3Mcdium p'rojcctions assume a gradual decline in fertility and a slow decline in n.,ortality. 4Low projections assume a rapid decline in fertility and a slow decline in mortality.
Intercensal Annual
Growth Rate
, 0.7 0.5 2.9 1.9 2.2 -1.9 3.1 3.0
So~rce of data: National Census and S1atis'tics Office (Population for J 970.~000 were based on Population Projections: 1970.2000, Special Report No. 4).
-
47
, I
,,
\

Table 1.4 - POPULATJON OF THE PHILIPPINES: 1799 TO 1970 (In thousands)
Average Annual Rate of Increase
Year Population Over Previous Date (In Per Cent)
17991 1,502,574 n.a. 18001 1,561,251 3.90000 18121 1,933,331 1.79727 18191 2, 106;230 1.23119
·18291 2,593,287 · 2.10204 18401 3,096,031 1.62391 18501 3~857,424 2.233 I 2 1858' 4,290,381 1.33859 18701 4,712,006 -0.78419 18771 5,567,685 2.41243 18871 5,984,727 0.72492
18961 . 6,261;339. 0.50329 19032 7,635,426 2.87489 19183 10,314,310 1.89735 19394 16,000,303 2.21955 19484 19,234,182 1.90601 19604 27,087,685 3.05710 19704 36,684,486 3.01190
n.a. -data not available for population previous to 1799. lNon-Christians were not included. 2Jncludes 647,740 non.Christians. 3Jncludes 932,953 non-Christians. 4(ncludes non-Christians.
Source of-Oata
Buzeta · Zuniga Cedulas Cedulas Church Local Officials Buzeta Bowring Guia Oficial C::ensus Census Prof. Plenn's estimate based on census records. Census Census· Census Census. Census Census
Source of data: National Census 8!1d Statistics Office. The Population of the Philippines: Its Growth and Development, 1973.
48
,

j
Table 1.5 - POPULATION PROJECTIONS BY AGE DISTRIBUTION: 1960-2000 (July l population in thousands)
Pro j e•c t e d
Age ·Actual in years
1960• 1965b I 970° 1975 1980 1985 1990 1995 2000 ,· ., Total . . '_J
population 27,343 31,674'36,852 43,048 50,569 59,535 611,955 82,135 96,551 0- 4 4,618 5,354 6,115 7,498 8,849 10,325 11,916 13,857 16,329 5- 9 4,413 4,474 5,443 5,900 7,286 8,655 10,148 11,717 13,642
10-14 3,470 4,057 4,330 5,397 5,861 , 7,248 8,615 10,107 11,673 15-19 2,842 3,430 3,701 4,294 5,359. 5,829 7,213 8,579 10,066 20-24 2,483 2;868 3,389 3,658 4,251 5,318 5,789 7,169 8,530 25:29 1,973 2,391 2,894 3,339 3,613 4,210 5,273 5,745 7,119 30-34 1,572 1,944 2,298 2,848 3,295 3,575 4,169 5,226 5,698 35-39 1,443 1;510 1,915 2,255 2,803 3,252 3,532 4,125 5,174-40-44 1,110 1,366 1,447 1,871 2,212 2,757 3,204 3,485 4,071 45-49 1,043 1,095 1,288 1,406 1,823 2,162 2,700 3,144 3,422 50-54 · 717 988 1,079 1,237 1,356 1,765 2,097 2,624 3,060 55-59 493 729 932 1,019 l,175 1,293 1,687 2,010 2,519 60-64 435 492 740 856 942 1,093 1,207 1,580 1,885 65-69 228 397 490 646 754 840 980 1,088 1,426 70-74 196 293 358 391 523 622 698 821 916 75 and over 307 286 434 433 467 589 627 858 1,021
BBased on the 1960 Census of Population. btnterpolatcd. C8a.,;ed on the 1970 CeQ5Us of Population. dHigh.projections assume constant fertility and a slow decline in mortality.
49
..
1975
42,759
7,209 5,900 5,397 4,294. 3,658 3,339 2,848 2,255 1,871 1,406 1,237 1,019
856 646 391 433
-

-
Table 1.5 - POPULATION PROJECTIONS BY AGE DISTRIBUTION I 960-2000 (continued)
(July I population in thousands)
-p r 0 j e C t e d
Age M e d i u m• L 0 wf
in years 1980 1985 1990 1995 2000 1975 1980 1985 1990 1995 2000
'Total . population 49,630 57,187 65,343 74,205 83,901 42,469 48,691 54,840 60,740 66,355 71,592
· 0- 4 8,191 8,902 · 9,622 10,49 I 11,538 6,919 7,534 7,477 5- 9 7,004 8,013. 8,749 9,461 10,329 S,900 6,724 7,37b
10-14 5,861 6,968 7,976 8,714 9,424 S,397 S,861 6,688 · I 5-19 S,360 5,829 6,93S 7,941 8,678 4,294 S,359 S,829 20-24 4,251 5,318 5,789 6,892 7,897 3,658 4,251 5,318, 25-29 3,613 4,210 5,273· S,74S , 6,844 3,339 3,613 4,211 30-34 3,29S 3,574 4,169 S,226 S,698 2,848 3,295 3,574 3S-39 • 2,803 3,252 3,532 4,125 5,174 2;25S 2,803 3,252 40-44 2,2 I 2 · 2,757 3,204 3,485 4,071 1,871 2,211 2,757 45-49 1,823 2,162 2,700 3,144 3,422 1,406 1,823 2,162 50-54 1,356 1,765 2,097 2,624 3,060 1,237 1,356 1,765 55-59 1,175 1,293 . 1,687 2,010 2,519 1,019 1,175 1,293 60-64 942 1,093 1,207 1,580 1,885 856 942 1,093 65-69 754 840 979 1,088 1,426 646 754 840 70-74 523 622 698 821 915 391 523 622 75 and over 467 589 726 858 1,021 433 467 589
CMedium projections assume a gradua1 decline in fertility and a slow decline in mortality . . fLow projections assume a rapid decline in fertility and a slow decline in mortality.
7,336 7,196 7,350 7,214 7,338 7,319 6,655 7,304 5,789 6,616 S,273 S,74S 4,169 S,226 3,532 4,12S 3,204 3,485 2,700 3,144 2,097 2,624 1,687 2,010 1,207 1,580
980 1,088 698 821 727 858
Source: Nationa1 Cc~s and Statistics Office, Tht Population ofrhe Phlllppfna: It& Growth and Development, 1973.
50
7,007 7,084 7,187 7,291, 7,263 6,569 S,698 5,174 4,071 3,422 3,060 2,519 J,885 1,426
915 1,021
'· ◄
1 ~
~
, , t
◄

Table 1.6 - ESTIMATED VITAL STATISTICS ACCORDING TO VARIOUS POPULATION PROJECTIONS, PHILIPPINES: 1970-2000
Series and Years Crude Crude Rate of Natu- Dependency Fertility Birth' Rate Death Rate ral Increase Ratio Rates·
r, Low Projection 1970-1975 39.5257 11.2000 28.3257 86.40 5,476.73 ,. 1976-1980 36.9082 9.6050 27.3032 81.48 5,038.65 1981-1985 31.7761 8.0193 23.7568 75.46 . 4,275.15 1-986-1990 27.7383 7.320.6 20.4177 67.26 3,637.57 1991-1995 24.5578 6.5854 17.9724 58.39' 3,102.85 I 996-2000 .-21.9574 6.0742 14.8832 52.48 2,652.65 .
Me.dium 1970-1975 41.0306 11.3527 29.6779 . 87.67 5,717.50 Projection I 976-1980 39.5944 9.8441 29.7503 84".98 5,498.50
1981-1985 36.6619 8.3642 28.2977 82.97 5,116.75 1986-1990 34.3141 7.6892 26.6249 78.57. 4,797.95 19,91-1995 32.6361 7.2330 25.4031 73.49 4,530.65 1996-2000 31.5679 7.0367 24.53.12 70.37 4,305.50
· High Projection 1970-i975 42.5246 11.5042 · 31.0204 . 88.94 5,958.33 1976-1980 42.21 OJ 10.0770 32.1331 88.48 5,958.33 1981cl 985 41.2561 8.6885. 32.5676 90.48 5,958.33 I 986-1990 40.2136 8.0203 32. I 933 89.72 5,958.33 1991-1995 39.5519. 7.5 I 88 32.0331 88.00 5,958.33 1996-:2000 39.5342 7.2614 32.2728 87.31 5,958.33
Rate: Per 1,000 population. Source: National Census and Statistics Office.·
I
51

Table 1.7 - EMPLOYED PERSONS OCTOBER 1956 -
(In
Major Industry Group I 956 1957 1958 1959 1960 1961
ALL INDUSTRIES 7,702 8,199 8,329 8,575 8,539. 9,095 = =
Agriculture, forestry, 5,514 - hunting & fishing 4,548 4,997 5,276 5,298 5,224
~lining & quarrying 31 27 21 35 29 31 Construction 198 228 I 61 210 231 230 ~!anufacturing 9.62 1,005 927 992 1,036 1,026 Electricity, gas, water
& sanitary services 26 15 24 21 20 19 Commerce 803 785 743 811 753 873 ~
Transport, storage & communication 228 223 228 250 271 278
Government, community, 1 business & recreational
services 392 396 453 445 424 538 Domestic services 332 319 271 311 321 368 Personal services other
than domestic f35 172 185 165 184 179 Industry not reported 47 31 39 38 46 39
(In
Major Industry Group I 956 1957 1958 1959 1960 1961
ALL INDUSTRIES 100.0 100.0 100.0 100.0 100.0 100.0 -- = -- -- = -- ~
Agriculture, forestry, . hunting & fishing 59.0 60.9 63.4 61.8 61.2 60.6
Mining & quarrying. 0.4. 0.3 0.3 0.4 0.3 0.3. ' Construction 2.6 2.8 1.9 2:4 2.7 2.5 Manufacturing 12.5 12.3 II.I 11.6 12.l 11.3 Electricity, gas, water
& sanitary services 0.3 0.2 0.3 0.2 0.2 0.2 Commerce 10.4 ·9.6 8.9 9.5 8.8 9.6 Transport, storage
& communication 3.0 2.7 2.7 2.9 3.2 3.1 Government, community, • business & recreational •
services 5.1 4.8 5.4 5.2 5.0 5.9 .Domestic services 4.3 3.9 3.3 3.6 3.8 4.0 Personal services other
than domestic 1.8 2.1 2.2 1.9 2.2 '2.0 Industry not reported 0.6 0.4 0.5 0.4 0.5 0.4
Note: Datn are the results of the nationwide sample surveys of.households conducted in the mOnth of October of each year, except in 1958, 1971, l 972 and 1973 when the surveys were taken in November. No &uveys were conducted in 1964, 1969 and 1970 October series.
Source of data: National Census and StatistiC8 Office. ~
52
l

BY MAJOR INDUSTRY GROUP: NOVEMBER 1973
thousands)
1962 1963 1965 1966 1967 i968 1971 1972 1973 ' 9,603 9,764 I 0, I 01 10,936 10,867 10,47-1- 12,543 12,582 13,865
5,898. 5,779 5,725 6,290 6,330 5,631 6,321 6,863 ·7,766 40 29 24 26 45 43 59 36 51
236 . 271 295 283 276 342 420 432 350 1,052 I ,I 39 I, I 01 1,229 _1,223 1,234 1,439 1,323 1,396
- 30 22 22 37 30 36 49 44 37 911 1,026 I, 114 I ,I 26 1,078 1,130 . 1,559 · 1,478 1,537
286 318 339 384 375 363 529 467 504
568 582 708 788 769 903 1,196 1,071 1,198 377 355 500 502 502 503 666 617 725
178 228 227 242 229 252 278 246 . 271 28 16 47 ·30 10 33 27 4 30
Per Cent)
1962 1963 1965 1966 1967 1968 1971 1972 1973
100.0 100.0 100.0 100.0 100.0 100:0 100.0 100.0 100.0 -- -- -- -- = -- -- -- --
61.4 59.2 56.7 57.5 58.3 53.8 50.4 54.5 56.0 0.4 0.3 0.2 0.2 0.4 0.4 0.5 0.3 0.4 2.5 2.8 2.9 2.6 2.5 3.3 3.4 3.4 2.5
IJ-.0 11.7 10.9 11.2 11.3 11.8 11.5 10.5 JO.I
0.3 0.2 0.2 0.3 0.3 0.3 0.4 0.4- 0.3 9.5 10.5 11.0 10.3 9.9 10.8 12.4 11.8 1 I.I ·, 3.0 3.3 3.4 3.5 3.4 3.5 4.2 3.7 3.6
5.9 6.0 7.0 7.2 7.1 8.6 7.5 8.5 8.6 3.9 J.6 5.0 4.6 4.6 4.8 5.3 4.9 5.2
1.9 2.3 2.2 2.2 2.1 2.4 2.2 2.0 2.0 0.3 0.2 0.5 0.3 0.1 0.3 0.2 0.0 0.2
53

Major Occupation Group 1956
.ALL OCCUPATION GROUPS 7,702
Professional & technical workers 216 Proprietors, managers & ad minis-
trators 352 Clerical workers 153 ~ales workers 456 Farmers, farm laborers, fishermen,
loggers, & related workers 4,525 Workers in mines &-quarries 30 Transport & communication workers 145
,,- Craftsmen & production process workers 1,071
Manual workers & laborers, n.e.c. 171 Service & related workers 541
. Occupation not reported 41
Major Occupation Group 1956
ALL OCCUPATION GROUPS 100.0 --
Professional & technical workers 2.8 Proprietors, managers & adminis-
trators 4.6 Clerical workers 2.0 Sales workers 5.9 Farmers, farm laborers, fishermen,
Joggers, & related workers -58.8 Workers in mines & quarries 0.4 Transport & communication workers 1.9 Craftsmen & production process
-workers 13.9 Manual workers & laborers, n.e.s. 2.2 Service & related workers 7.0 Occupation not reported 0.5
• Le.r:.s than 9,500. Source of data: National Census and Statistic.cc Office.
54
Table 1.8 - EMPLOYED PERSONS OCTOBER 1956 TO
(In
1957 1958 I 9:i9 1960
8,199 8,329 8,575 8,539
222 246 255 239
309 249 319 324 .170 175 196 21 I 483 504 505 446
4,957 5,257 5,272 5,211 26 21 25 22
152 161 168 189
I, 138 1,025 · I, 117 1,132 158 120 146 I 63 558 535 547 560
27 35 25 43
(In
1957 1958 I 959 1960
100.0 100.0 100.0 100.0 -- -- -- --
2.7 3.0 3.0 2.8
3.8 3.0 3.7 3.8 2.1 2.1 2.3 2.5 5.9 6. I 5.9 5.2
60.5 63.1 61.5 61.0 0.3 0.3 0.3 0.3 1.9 , ·1.9 2.0 2.2
13.9 12.3 13.0 I 3.3 1.9 - 1.4 1.7 . 1.9 6.8 6.4 6.4 6.6 o_.3 0.4 0.3 0.5
~
,,j
l
~ ., ,
..

I
BY MAJOR OCCUPATION GROUP: NOVEMBER 1973 thousands)
I 961 1962 1963
9,095 9,603 9.764 --
309 285 313
340 358 356 273 252 284 537 . 572 646
5,501 5,892 5,755 23 30 21
184 192 251
1,100 1,156 1,250 168 166 199 636 675 676
29 26 16
Per cent)
1961 1962 1963
100.0 100.0 100.0 -- -- --
3.4 ·3.0 3.2
3.7 '3.7 3.6 3.0 2.6 2.9 5.9 6.0 6.6
60.5 61.3 58.9· 0.2 0.3 0.2 2.0 2.0 2.6
12. I I 2.0 12.8 1.8 1.7 2.0 7.0 7.0 6.9 0.3 0.3 0.2
i965 1966
I 0, I 01 l 0,936
375 441
432 420 352 364 675 723
5,677 6,246 14. 18
272 280
1,270 1,384 l S 1 176
840 860 42 24
1965 1966
100.0 - 100.0 -- --3.7 4.0
4.3 3.8 3.5 3.3 6.7 6.6
56.2 57. I. 0 . .1 .Q.2 2.7 2.6
12.6 l 2.7. 1.5 1.6 8.3 7.9 0.4 0.2
55
1967 1968 I 971 1972 1973
10,867 !0,471 12,543· 12,582 13,865
441 511 I 699 595 701
393 457 l 74 136 131 357 386 449 457 518 695 666 1,419 1,3 l 4 1,357
6,299 5,598 6,286 6,829 7,707 34 28 , 33 20 28
281 290 517 507 504
1,35 l .l,420 J ,578 1,471 1,499 159 183 229 226 249 847 9QS 1,136 1,019 1,139 * 26 24 7 30
1967 1968 1971 1972 1973
100.0 100.0 100.0 100.0 100.0 -- ·-- -- -- --
4.1 4.9 5.6 4.7 5.0
3.6 4.4 1.4 I.I 0.9 3.3 3. 7. 3.6 3.6 3.7 6.4 6.4 11.3 10.4 9.8
58.0 53.S SO.I . 54.3 55.6 0.3. 0.3 0.3 0.2 0.2 2.6 2.8 4.1 4.0 3.6
12.4 13.6 12.6 11.7 10.8 1.5 1.8 1.8. 1.8 1.8 7.8 8.6 9.0 8.1 8.2 0.1 0.2 0.2 0.1 0.2
'

Table 1.9- LABOR FORCE, PARTICIPATION RATE, EMPLOYMENT STATUS, URBAN AND RURAL: 1960-73
(Number of persons in the labor force in thousands) ·
Labor force Total Labor Force by Employment .Status Participation Labor Employed Unemployed
Rate (Per Cent)
Force · Number Per cent · Number Per ce·nt
Philippines 1960 53.8 9,116 8,539 93.7 577 6.3 I 961 55.6 9,713 ·. 9,095 93.6 618 6.4 1962 57.1 10,266 9,603 93.5 662 6.5 1963 55.2 10,233 9,764 95.4. 469 4.6 1964 59.9 11,296 10,572 93.6 724 . 6.4 l
1965 53.1 10,764 10, I O 1 93.8 663 1.6.2 1966 55.1 11,757 10,936 93.0 821 7.0 1967 54.7 '' ,776 10,867 92.3 909 7.7
·◄ 1968 49.6 11,371 10,471 92.1 900 7.9 1969 52.0 12,046 11,235 93.3 812 6.7 1971 50.2 13,241 12,543 . 94.7 699 5.3 1972 48.4 13,294 12,582 94.6 712 5.4 1973 50.4 14,559 13,865 95.2 694 4.8
, Urban1
1965 51.0 3,313 2,958 89.3 355 10.7 1966 50.5 3,579 3,223 90.0 357 10.0 1967 48.4 3,483 3,124 89_7 359 10.3
~ 1968 46.5 3,679 3,347 91.0 333 9.0 1969 45.1 3,596 3,267 90.8 329 9.2 1971 47.9 4,157 3,797 91.3 360 8.7 1972 45.5 4,166 3,759 90.2 407 9.8 1973 47.6 4,635 4,265 92.0 370 8.0
Rural1 '
1965 54.1 7,451 7,143 95.9 308 4.1 1966 57.4 8,178 7,714 94.3 464 5.7 1967 57.9 8,293 7,742 93.4 551 6.6 1968 51.2 7,692 7,124 9'.4-6 568 7.4 1969 55.6 8,450 7,968 94.3 483 5.7 19,71 51.3 9,084 8,745 96.3 339 3.7 1972 49.8 9,127 8,823 96.7 305 3.3 1973' 51.9 9,925 9,600 96.7 325 3.3
, · Note: Annual figures obtained from the results of the October rounds of the BCS Survey of Hou!:cholds except for ] 964 ·and 1969 (May) and l 9_71-73 (November); no survey was conducted in 1970.
llJrhan and mral classification of households started in 1965. -~ · Source of data: National {:cnsus and Statistics Office, NCSO Survey of Households (NCSOSH) Bulletin for various years. ...
56

I
Table 1.10 - LITERACY OF POPULATION I O YEARS OLD AND OVER, BY SEX FOR URBAN AND RURAL AREAS AND REGIONS IN THE PHILIPPINES: 1960 AND 1970
(Figures in per cent)
1960 19.70 Geographic Area
Both Male Female Both Male Female Sexes Sexes
PHILIPPINES 72.0 73.6 70.6 83.4 84.6 87.2
Urban n.a. n.a. n.a. 92.8 94.0 91.8 Rural n.a. n.a. n.a. 78.7 80.2 77.2
Region 11 71.5 75.6 67.6 83.1 86.2 80.I Region H 71.6 74.2 69.0 78.7 80.7 76.7 Region III 80.9 83.5 78.5 90.3 92.0 88.8 Region IV · 84.0 85.6 82.6 92.2 93.4 91.1 Region V 75.7 77.2 74.0 86.4 87.4 85.4 Region VI 70.0 70.2 69.9 82.1 82.0 82.2 Region VII 62.8 64.7 61.0 _ 77.8 79.5 -76.1 Region Vlll 65.3 64.6 66.0 77.6 76.4 78.8 Region IX 47.9 50.1 45.5 65.4 68.0 62.9 Region X 73.4 73.8 73.0 79.9 80.6 79.2 Region XI . 59.3 61.7 56.6 75.5 77.5 73.4
1 Region I includes the provinte!I of lfugao and Kalinga Apayno (for 1960 only). n.n. - Data not available on urban-rural classification. Souree of data: Nationnl Census and Statistics Office, 1960 and 1970 Population Censuse., (Advanced Report for 1970).
Table 1.11 - INTER-REGIONAL MIGRATION ·AND GROWTH, PHILIPPINES: CY 1960-70
(Population in thousands)
Net Migration
Region Na_tural Net Change Growth Both Sexes Male Female
I' 787.4 (161.2) (74.3) (86.9) 626.2 II 394.6 32.3 24.8 7.5 426.9
III 956.7 190.4 93.4 97.0 1,147.1 IV 1,918.7 904.2 434.6 469.6 2,822.9 V 904.9 (300.8) (146.8) (154.0) 604.1
VI 965.7 (425.6) (219.5) (206.1) 540.1 vu 749.7 (239.8) (111.7) (128.1) . 509.9
VIII 698.4 (358.0) (165.2) ·(192.8) 340.4 IX 522.6 (4.3) (10.2)_. 5.9 518.3 X 817.7· 44.2 21.2 23.0 861.9
XI 837.3 318.6 159.2 159.4 1,155.9
lr'fhe figure includes the prm·inccs of lfugao and Kalinga~Aparao (both in Region 11). Source: National Census and Statifflcs Office, Net Jnumal Migration rn the Philippines: 1960-1970.
57
'I
/

Table 1.12 - REGISTERED ALIENS BY NATIONALITY: CY I 962~72
Calendar Nationality ,
, Year Total
Chinese American . Spanish Indian
. ' 1962 145,829 131,291 7,722 1,600 1,423 1963 135,939 120,027 8,170 1,752 1.404 1964 132,870 117,630 8,049 I ,~86 1,311 1965 141,586 126,05 I 8,976 1,404 1,427 , 1966 131,758 115,501 9,240 1,447 1,487 I
' 1967 144,194 126,641 10,067 1,495 1,640 1968 127,659 110,701 10,364 1,292 1<531 ~ 1969 I 34,37.7 · J 17,864 10,165 1,047 I ,51 2 1970 110,226 - 94,963 9,554 1,114 1,392. 1971 111,811 96,090 9,951 904 l;333 1972 I 13,243 98,306 9,377 779 I ,364
◄ • Table 1.12 (continued)
·◄
Calendar Nationality ·, Year Other '
British German Belgian national- Stateless , ities·
1962 724 540 331 2,143 55 ~ I 963 612 526 377 3,013 58 1964 571 511 344 2,917 51 • 19(55 647 536 226 2,261 58 ' 1966 653 526 331 2,502 71 l
1967 643 580 312 2,770 46 .~ ---- --~ ... 1968 · 678 512 328 2,213 40
1969 676 517 346 2,216 34 i 1970 499 462 274 1,939 29
1 1971 595 487 289 2,135 27 1972 528 462 307 2,094 26
Source of d3ta: Commi!Sion on Immigration and Deportation. ◄
58

I\
---
p .
· Table 1.13 -- D\\'.ELLJNG UNITS~ 1960
Total Number of Dwelling Units Number of Occupied Dwelling lJnits
4,790,954 4,648,245
•
All !1welling units by occupancy
Number Per cent
Owner occupied only 4,049,346 84.52 Owner occupied and
rented 38,564 0.80 Rented only - 296,630 6.)9 Occupied rent free 263,705 5.50 Vacant 142,709 °2.98
. Occupied dwelling units by type of cooking fuel
Number Per cent
Electricity 60,509 1.30. Kerosene . 151,348 3.26 Gas 53,067 1.14 Wood 4,312,110 92.77 Charcoal 25,48 I 0.55 Others . 45,730 0.98
Occupied dwelling units with and wiihout radio
I
With radio Without radio . .
Number
516,826 4,131,419
I
Per cent
11.12 88.88
Occupied dwe11ing units by source_ of water supply
Number Per cent
Piped water 930,800 20.03 Artesian well 271,609 5.84 Force pump 1,070,869 23.04 Open well 1,464,581 31.51 ; Spring 632,842 ·13.61 Rainwater 54,503 1.17 Others 223,041 4.80
Occupied dwelling units by type of toilet facilities
· Number Per·cent
Flush 353,721 7.61 Antipolo 429,498 9.24 Open pit 1,664,573 35.81 Public toilet I 08,432 2.33 None 2,092,021 45.01.
Occupied dwelling units by type of lighting
- Number Per cent
Electricity 765,935 I 6.48 Kerosene 3,806,907 81.90 Oil 20,495 0.44
· Others 54,908 1.18
Souret: of data: Summary Report, Population and Housing. 1960 Cen~s of the Phlllppiites.
59

l
Table 1.14 - SELECTED. CJ-IARACTERISTJCS OF DWELLING
(Numbn in ~
•
Characteristic Philippines Urban Rural
Number of dwelling units 5,234 1,570 ·3,663
Tenancy IOO.O 100.0 100.0
Owner-occupied 89.3 73.9 · 9S.9 , Rented 6.0 19.3 0.3 Rent free 4.6 6.7 3.6
' Not reported 0.1 0.1 0.2 ~
Type of dwelling unit 100.0 100.0 100.0
Single house 86.9 74.1 92.3 Duplex 4.5 8.5 . 2.8 Apartment or accessoria 4.1 I 3.1 0.2 1 Barong-barong (makeshift) · 4.2 3.S 4.5 Others 0.4 0.9· 0.2
Kinds of construction materials 100.0. 100.0 100.0 -◄ Strong materials 31.6 61.2 18.8 Mixe<;I materials 51.5 31.6 60.1 1 Light materials 16.5 6.9 20.5 I Not reported 0.5 0.3 0.7 ,
Condition of dwelling unit 100.0 100.0 100.0 ; In good condition 18.1 ,24.6 15.4 Nr.eds minor repair 57.1 54.9 58:1 Needs general repair 22.2 18.8 23.6\ Dilapidated 2 .3 1.5 2.6 Not reported 0.3 0.2 0.3
,, Source of data: National Census and Statistics Officr.. NCSOSH Sun'f'Y of Housing,_ May 1967.
~
'
60

UNITS, PHILIPPINES, URBAN-RURAL; May 1967
thousands)
\
Characteristic , Philippines Urban Rural
Kind of lighting used • 100.0 100.0 100.0 · Electricity 22.9 62.8 5.8
' Kerosene pressure lamp 14.2 10.7 15.8 Other kerosene lamp 57.7 24.1 · 72.1 Others 5.2 2.3 6.4 Not reported 0.1 0.1
Source of drinking water 100:0 100.0 100.0 Waterworks 22.9 56.2 8.6 Community drilled well 15.9 13.7 16.7 Private drilled well 11.4 1'3.5 10.5 Closed well with pump 11.5 6.7 13.5 Open well ·21.3 6.9 27.4 Spring 11.5 0.8 16.1 Stream, creek, river 4.4 0.6 · 6.0 Rainwater 1.3 1.5 1.2
Types of toilet facilities 100.0 100.0 100.0 ·--Water sealed 12.8 34.0 3.7 Cement bowl 7.2 • 14.1 4.2 Closed pit 26.9 21.4 29.3 Open pit 17 .6 9.4 21.2 Public toilet 1.7 3.8 0.8 Pail system 0.3 I.I None- 33.2 16.0 40.7 Not reported 0.2 0.1 0.2
61

CHAPTER II
VITAL AND HEALTH STATISTICS
Figure 2.1 Births and Deaths: Selected Years
Table 2.1 Live Births, Total Deaths, Deaths .Under I Year, Maternal Deaihs and Foetal Deaths: CY 1921-72 ·
Table 2.2 Number of Live Births by Region: CY 1950-72
Table 2.3 Mortality: Ten (I O) Leading Causes, Number and Crude Death Rates, Philippines: CY 1967-71 and 1972
Table 2.4 Infant Mortality: Ten (10) Leading Causes, Number and Rate per 1,000 Live Births -and Percentage Distribution, Philippines: CY, 1967-71 and 1972
Table 2.5 Infant Mortality Under Age One Year by Region: CY 1950-72
'Table 2.6 Morbidity: Ten (10) Leading Causes, Number and Crude Death Rates, Philippines: CY 1967-71 and tV72 ·
Table 2.7 Government and Private l:lospitals: Number and Bed Capacity, Philippines: 'FY 1959-60 to 1971-72
65 •• 6,6
68
70
70
7?,
75
.76

CHAPTER II
VITAL AND HEAL TH -STATISTICS
Chapter II is-concerned with vital and health statistics - data on births, deaths, foetal deaths and stillbirths, diseases, hospitals, etc. Most data on vital and _ health statistics are compiled by the Disease Intelligence Center through its annual report, the Philippine Health Statistics. Others are published in the NCSO Vital Statistics Report-and the quarterly Journal of Philippine Statistics'.
BIRTHS AND DEATHS; DISEASES. Statistics on births and deaths are compiled by the Disease Intelligence <:;enter and the National Census and Statistics Office. The former publishes such data as the number and rate of total births, deaths, infant, foetal and maternal mortality by region, province or city; mortality and morbidity by leadir.g causes, by region; mortality by age; morbidity and mortality from sdected notifiable diseases by region, province or city; infant morta1ity by cause of death, age and sex, by region; and maternal mortality by main causes. and by region. ·
. The National Census and Statistics Office presents data on births by month and by place. of'births, classified by sex, legitimacy, order of ·birth, age of mother, nationality of parents, and attendance· at birth. Data on deaths are presented by month and by place 0f death, classified by cause of death, age, sex, civil ·status, occupation and nationality of deceased. Statistics on foetal deaths are tabulated showing number of foetal deaths by month and by place of death, classified by order of birth, age_ of mother, period of gestation, and weight at birth.
MARRIAGES. The National Census and Statistics Office publishes data on marriages in its yearly Vital Statistics Report and quarterly Journal of Philippine Statistics.
Compilation of the data is based on the complete control of copies of marriage contracts received in the Office of the Civil Registrar-General. Data ·on marriages are tabulated showing number of marriages by month and by place of occurrence, classified by age and by previous marital status of bride an.d groom and by type of ceremony.
MEDICAL SERVICES AND HEALTH STATISTICS
Other government agencies which compile medical and health statistics under the Disease Intelligence Center are the Bureau of Medical Services, the Bureau of Dental Services, and the Bureau of Quarantine. Such important characteristics as the number of hospitals and hospital beds, by type of institution, etc. are classified by these agencies by province and health region. '
64
I ,
l

Figure 2.1 BIRTHS AND DEATHS: SELECTED YEARS
· SELECTED YEARS
0
f · .YEAR
' ~ i] f]l ~ i]] 1946 000 LEGEND
/
~~~a)~ ~ ~ E]] BIRT·HS 100,000
1950 DO~ 0 DEATHS 100,000
~ t!j i]] i]] ~ E]]E!]!] 1955 001
~ i!l ~ l!J l]j f!1 f]] t]l I 1960 OD~-
E!Jt]]~~~ ~ i!] ~ [!J · 1965 DOG
E]1 t!1 i]] i!1 ~ t!1-~~~rn 1970 OOQ
' 65
.,_

' Table 2.1 ..:. LIVE BIRTHS. TOTAL DEATHS, DEATHS UNDER I YEAR,
I3irths Total Deaths Calendar
Year Number Crude Rate 1 Number Crude Rate1
1921 - I 925 378,471 33.9 209,376 18.9 1926 - 1930 419,145 33.5 231,827 18.5 1931 -1935 451,186 32.1 235,423 16.8 I 936 - l 940 513,765 32.5 260,463 16.5 I 941 - I 945 n.a. n.a. • n.a. n.a.
' · 1946 533,283 28.9 278,546 15. I 1947 572,226 30.5 238,527 12.7 ◄
, 1948 602,415 31.5 234,467 12.2 · 1949 609,138 30.9 231,151 11.8 1950 642,472 31.6 226,505 I I.I
1951 637,264 30.4 237,937 11.4 1952 648,7,25 30.0 241,020 I I.I 1953 661,939 29.7 239,988 10.8 1954 702,662 30.5 217,650 9.5 1955 734,761 30.9 219,798 9.3
1956 757,794 30.9 219,719 9.0 1957 748·,33 I 29.6 241,469 9.5 1958 766,562 29.4 218,186 8.4 1959· 809,086 30.0 I 97,423 7.3 1960 810,904 29.6 212,688 7.8
1961 782,857 ' ' 27.6 213,587 7.5 1962 832,204 28.4 213,439 7.3 1963 851,459 28.2 215,743 7 .I· 1964 880,871 28.2 214,904 6.9 1965 871,715 27.0 241,305 7.5
1966 908,826 21.I . 240,865 7.2 1967 911,872 .26.3 241,548 7.0 1968 961,646 26.8 253,841 7.1 1969 1,015,784 27.3 255,785 6.9 1970 1,008,504 27.4 248,25 I 6.7 1971 963,749 25.4 250,139 6.6
1972 968,385 24.8 287,761 7.3
1 Pr.r 1,000 JlOpulaiion. • 2Pcr 1,000 live births. n.a. - Data not available. Sourc,: of data: 1972-Phili~pine Health° Statistics, Disease lntdliJi;<:nc,: Cc~t,~r, Drparlmcnl of 1-lcallh.
'
66

' MATERNAL DEATHS AND FOETAL DEATHS: CY 1921-72
Deaths Under I Year Maternal Deaths Foetal Deaths
Number Rate2 Number Rate2 Number Ratc2
./ n.a. n.a. n.a. n.a. n.a . n.a. 65,912 157 .2 n.a. n.a. n.a. n.a. 67,921 150.6 3,231 7.2 n.a. n.a. 71,155 138.5 3,358 , 6.6 n.a. n.a.
n.a. n.a. n.a. · n.a. n.a. n.a. 66,902 125.5 n.a. n.a. n.a. n.a. 63,809 I 11 .5 2,425 4.2 n.a. n.a. 68,897 114.4 2,468 4:1 n.a. n.a. 66,114 108.5 1,818 3.0 n.a. n.a. 65,273 101.6 2,406 3.7 n.a. n.a.
67,209 105.5 2,645 4.2 n.a. n.a. 65,883 101.6 . 2,5-11 3.9 n.a . n.a.
. 69,729 105.3 2,397 3.6 n.a .. n.a. 66,175 94.2 , 2,214 3.2 n.a. n.a. 61,958 84.3 2,339 3.2 n.a. n.a.
63,583 83.9 2,241 3.0 n.a. n.a. 69,592 93.0 1,963 2.6 8,967 12.0 61,335 80.0 2,235 - 2.9 9,012 11.8 58,610 72.4 2,114 2.6 10,167 12.6 59,301 73. I 1,981 2.4 10,262 12. 7
56,663 72.4 2,023 2.6 8,800 . 11.2 56,365 67.7 1,944 2.3 7,424 8.9 56,700 66.6 1,783 2.1 7,026 8.2 54,174 61.5 1,03 I 1.2 6,696 7 _/j
59,733 68.5 1,757 2.0 6,143 7.0
59,810 65.8 1,829 2.0 6,166 6.8 59,448 65.2 1,822 2.0 7,468 8.2 62,994 65.5 1,979 2.1 6,855 7.1 65,142 64.1 2,047 2.0 7,290 7.2 59,774 59.3 1,950 1.9 7,384 7.3 59,730 62.0 1,261 1.3 12,969 13.5
65,719 67.9 1,379 1.4 13,577 14.0
67
•

Table 2.2- NUMBER OF LIVE BIRTHS
Calendar Region Region Region Region· Region
Year I II III IV V
1950 81,079 31,149 67,078 146,266 62,124 1951 .. 77,812 32,355 65,019 146,163· 61,814 1952 77,418 33,762 67,416 153,729 _ 59,428 1953 78,608 34,586 70,157 157,117 59,267 1954 79,788 35,759 72,583 169,714 61,280
1955 81,974 37,543 80,699 182,805 63,303 1956 85,748 39,199 83,593 185,156 . 68,142 1957 82,666 37,205 81,859 187,821 64,814 1958 86,522 38,654 82,866 194,515 68,237 1959 88,117 40,113 84,704 . 220,021 71,171
1960 92,796 41,672 86,305 216,254 67,448 1961 88,219 41,583 82,996 214,005 64,374 1962 91,719 43,930 . 88,419 234,259 71,727 1963 93,556 45,044 92,193 236,914 72,978 1964 93,028 44,932 94,427 246,374 76,796
1965 89,019 40,674 92,910 250,876 72,758 1966 91,437 44,155 98,901 263,972 74,191 1967 89,219 40,017 , 104,733 262,625 76,475 1968 91,104 46,835 109,300 275,565 77,661 1969 95,320 S 1,156 114,392 303,007 80,384
1970 93,961 . 47,843 - 111,878 289,427 80,947 1971 97,234 51,093 113,008 290,958 71,918 1972 96,026 S 1, 1 OS 115,311 290,011 76,801
Source of data: Disease lntdligcnce Center, Department of llealth.
'
68
•

,~··
\ \ ) BY REGION: CY 1950-72
\
, Region Region Region Region Region Region Total
I
·' VI VII VIII IX X XI Philippines
/
· 58,973 75,896 55,139 10,987 32,896 20,885 642,472 56,435 76,776 50,660 12,468 35,147 22,615 637,264 57,633 · · 76,980 48,180 12,224 35,856 26,099 648,725 59',585 76,086 47,890 13,444 36,690 28,508 661,938 62,660 81,812 52;657 14,337 40,511 3 I ,56 I 702,662
65,920 77,172 54,808 16,070 40,170 34,297 734,761 64,432 80,323 55,787 15,172 42,574 37,668 757,794 63,902 75,366 52,162 16,683 45,069 40,784 748,3.3 I 63,216 76,551 54,702 16,600 45,749 38,950 766,562 66,022 79,737 56,689 16,408 45,372 40,732 809,086"
66,204 82,222 50,628 15,675 46,954 44,746 810,904 62,407 80,957 45,098 14,071 46,153' 42,994 782,857 64,440 8 I ;01 9 47,054 · . 17,096 50,457 42,084 832,204 60,641 80,667 50,047 20,340 54,215 44,864 851,459 60,417 82,313 53,198 24,221 . 58,088 47,077 880,871
57,709 84,127 51,068 23,802 57,345 51,427 . 871,715 59,365 84,636 51,835 24,831 60,507 54,996 908,826 56,907 86,284 48,660 27,789 6 I ,016 58,057 911,782. 61,166 93,294 51,287 28,975 64,091 62,368 961,646 p0,921 93,491 50,705· 30,469 68,571 67,368 1,015,784
58,716 95,887 55,673 · 32,122 72,790 69,260 1,008,504 55,337 · 92,216 37,028 23,984 62,764 68,209 963,749 56,257 88,584 34,542 21,355 65,037 73,267 968,385
69

Table 2.3 - MORTALITY: TEN (10) LEADING CAUSES, NUMBER · (Crude death rate per
5-Year Average 1967-71
Cause Per Cent of
' , Number Rate Total Deaths
Pneumonia 42,310 115.9 16.9 Tuberculosis (all forms) 28,526 78.2 11.4 Diseases of the vascular system 12,020 32.9 4.8 Castro-enteritis and colitis 14,042 38.5· 5.6 Diseases of the heart 12,863 35.2 5.1 Bronchitis I 0,881 29.8 4.4 Malignant neoplasms 9,032 24.7 3.6 Avitaminosis and other nutritional ·
deficiency states 11,744 32.2 ·4.7 Accidents 9,364 25.7 3.7 Ill-defined diseases peculiar to
early infancy and unqualified immaturity 13,324 36.5 5.3
Table 2.4 ,-- INFANT MORTALITY: TEN (10) LEADING CAUSES, NUMBER AND PERCENTAGE DISTRI
Cause
Pneumonia Ill-defined diseases peculiar to
early infancy and unqualified immaturity ·
Castro-enteritis and colitis Bronchitis Avitaminosis and other nutritional
deficiency states Postnatal asphyxia and atelectasis Tetanus All o'ther defined diseases of early
infancy Congenital malformation Other infections of newborn
Number
16,312
13,324 5,204 . 4,918
4,715 3,599 2,529
-1,570 1,261
871
5-Y ear Average 1967-71
Rate
16.8
13.7 5.4 5.1
4.8 3.7' 2.6
1.6 1.3 0.9
Source: J 972'Philippine Health Statistics, Disease Intelligence Center, Deparhnent of Health.
70
Per Cent of Infants Deaths
26.6
21.7 8.5 8.0
7.7 5.9 4.1
2.6 2.1 1.4

I AND CRUDE DEATH RATES. PHILIPPINES: CY 1967-71 AND 1972 100,000 population)
1972
Pc~ Cent of Number Rate Total Deaths
48,831 125.1 I 7. I 29,784 76.3 I 0.4 12,844 32.9 4.5 17,167 44.0 6.0 16,971 43.5 5.9 9,250 23.7 3.2
10,268 26.3 3.6
12,257 31.4 4.3 14,435 37.0 5.1
15,592 39.9 5.5
AND RATE PER 1,000 LIVE BIRTHS BUTION, PHILIPPINES: CY 1967-71 AND 1972
Number
I 8,564
15,592 5,919 3,818
3,198 -3,072 2,685
2,574 . 976
862
1972
Rate
19.2
16.1 6.1 3.9
. 3.3 3.2 2.8
~
2.7 1.0 0.9
Per Cent of Infants Deaths
28.2
23.7 9.0 5.8
4.9 4.7 4.1
3.9 1.5 1.3
' -71
Cause
Pneumonia Tuberculosis (all forms) Disease of the vascular system Gastro-enteritis and colitis Diseases of the heart Bronchitis Malignant neoplasms Avitaminosis and other nutritional
deficiency states Accidents 111-defil)ed diseases peculiar to
early infancy and unqualified irnmaturity '
Cause
Pneumonia Ill-defined diseases peculiar to
early infancy and unqualified immaturity
Gastro-enteritis and colitis Bronchitis Avitaminosis and other nutritional
deficiency states Postnatal asphyxia and atelectasis Tetanus All other defined diseases of early
infancy · -' Congenital malformation Other infections of newborn
I

' Table 2.5 - INFANT MORTALITY UNDER AGE
Region Regio~ Region Region Calendar I II Ill IV
Year Number Rate1 Number Rate1 Number Rate1 Number Rate1
1950 7,645 94.29 3,797 121.90 8,307 123.84 14,221 97.23 1951 7,649 98.30 4,117 127.24 8,255 126.96 14,705 100.61 1952 6,985 90.22 3,949 116.97 7,769 115 .24 14,577 94.82 1953 8,034 I 02.20 4,595 132.86 8,092 115 .34 15,866 100.98 1954 6,745 84.54 4,446 124.33 7,384 I 01. 73 14,316 84.35 1955 6,125 74.72 3,759 I 00.13 6,791 84.15 14,030 76.75 1956 6,634 77.34 4,205 107.27 6;729 80.50 13,923 75.20 1957 6,901 83.48 4,397 118.18 7,447 90.97 15,542 82.75 1958 6,245 72.l~ 3,745 96.89 6,771 81.75 14,339 73.72 1959 6,077 68.97 3,832 95.53 5,844 68.99 13,494 61.33 1960 6,242 67.27 4,234 I 01.60 5,715 66.22 I 3,743 63.55 1961 5,886 66.72 4,002 96.24 5,128 61.79 13,553 63.33 1962 5,716 62.32. 3,840 87.41 5,372 60.76 13,411 57.25 1963 5,404 57.76 3,584- 79.57 5,243 56.87 14,076 59.41 1964 5,058 54.37 3,203 71.29 4,849 51.35 14,382 58.37 1965 5,599 62.90 3,320 81.62 5,727 61.64 I 5,726 62.68 1966 5,702 62.36 3,720 84.25 4,683 47.35 15,578 59.01 1967 5,149 57.71 3,444 86.06 6,092 58.17 16,401 62.45
~
1968 5,835 64.05 3,294 70.33 6,294 57.58 17,585 63.81 1969 5,614 58.90 3,506 68.54 6,195 54.16 18,684 61.66 1970 5,338 · 56.81 3,427 71.63 5,693 50.89 17,3 I 9 59.84 1971 5,398 55.52 3,779 73.96 5,972 52.85 17,877 61.4-4 1972 5,998 62.50 4,029 78.80 6,807 59.00 19,479 67.10
lRate - Per 1,000 livebirths. Source of data: Disease Intelligence Center, Deparbncnt_of HcaJth.
;
. '
72
l

ONE YEAR BY REGION: CY 1950-72
Region Region Region Region V VI VII VIII
Number Rate1 Number Rate1 Number Rate1 Number Rate1
4,378 70.47 7,656 129.82 7,649 100.78 4,772 86.54 4,524 73.19 7,517 133.20 8,311 108.25 5,094 100.55 5,022 84.51 7,792 135.20 7,848 101.95 4,421 91.76 3,857 65.08 7,524 126.27 8,355 109.81 4,893 102.17 5,069 82.72 6,968 111.20 8,639 105.60 4,501 85.48 4,577 72.30 6,696 101.58 7,780 10g.81 4,768 86.99 4,916 72.14 6,689 I 03,81 7,989 9 .46 4,671 83.73 5,489 84.69 7,686 120.28 8,607 114.20 4,772 91'.48 4,616 67.65 5,775 91.35 7,188 93.90 4,198 76.74 4,933 69.31 5,725 86.71 6,606 82.85 4,337 76.51
. 4,436 65.77 5,946 89.81 6,729 81.84 4,322 85.37 4,128 64.13 5,457 87.44 6,591 81.41 3,860 85.59 4,320 60.23 5,371 83.35 6,708 82.80 . 3,660 77.78 4,894 67.06 ;
5,361 88.4) 6,055 75.06 3,772 75.37 4,652 60.58 4,835 80.03 5,905 71.77 3,586 67.41
4,571 62.82 5,586 96.80 6,481 77.04 3,831 75.02 5,080 68.47 5,994 100.97 6,594 77.91 3,562 68.72 4,352 56.91 5,087 89.39 6,247 72.40 3,689 75.81 4,801 61.82 5,433 88.82 6,407 68.68 3,337 65.07 4,854 60.39 5,703 93.61 6,683, 71.48 3,554 70.09
3,945 48:74 5,229 89.06 5,760 60.07 3,333 59,87 4,841 67.31 5,474 98.92 5,040 54.65 3,201 86.45 4,961 · 64.60 6,144 109.20 5,637 63.60 3,201 92.70
73
r

Table 2.5 - INFANT MORTALITY UNDER AGE ONE YEAR BY REGION: CY 1950-72 (continued)
Region Region Region Total IX X XI Philippines
Number Rate1 Number Rate1 Number Rate1 Number Rate1
1,247 113.50 4,206 127.86 1,395 66.79 65,273 101.60 1,252 100.42 4,248 120.86 1,537 67.96 67,209 105.46 1,311 107.25 4,450 124.11 1,759 67.40 65,883 101.56 1,582 117.67 4,701 128.13 2,230 78.22 69,729 105.34 1,460 I 01.83 4,532 111.87 2,115 67.01 66,175 94.18
1,378 85.75 4,107 102.24 1,947 56.77 61,958 84.32 1,512 99.66 4~05 96.42 2,210 58.67 63,583 83.91
. ,1,681 100.76 4,676 103.75 2,394. 58.70 69,592 93.00 1,582 95.30 4,371 95.54 2,502 64.24 61,335 80.01 1,517 92.45 4,079 89.24 2,196 53.91 58,610. 72.44
1,561 99.59 4,053 86.32 2,320 51.85 59,301 73.13 1,640 116.55 4,123 89.33 2,295 53.38 56,663 72.38 1,709 99.96 4,045 80.17 2,213 52.59 56,365 . 67.73 1,750 86.04 4,405 81.25 2,156 48.06 56,700 66.59 1,409 58.17 3,867 66.57 2,425 51.51 54,174 61.50
1,670 70.16 4,618 80.53 2,604 50.63 59,733 68.52 1,766 71.12 4,642 76.72 2,497 45.40 59,818 65.82 1,900 68.37 4,544 74.47 2,543 43.80 59,448 65.20 2,294 79.17 4,855 75.75 2,859 45.84 62,994 65.51 1,606 52.71 5,233 76.32 3,510 52.10 65,142 64.13
1,974 61.45 4,546 62.45 3,210 46.35 59,774 59.27 1,573 65.59 4,007 63.84 2,568 37.65 59,730 61.98 1,828 85.60 4,504 69.30 3,13 I ..;2.10 65,719. 67.90
r
74

I ' r
Table 2.6 - MORBIDITY: TEN (10) LEADING CAUSES, NUMBER AND CRUDE DEATH RATES, PHILIPPINES: CY 1967-71 AND 1972
5 - Year Average I 9 7 2 (1967-71)
Cause Number Rate1 Number Rate1
Influenza 259,924 712.1 395;185 1,012.3 Bronchitis 311,108 · 852.3 335,439 859.2 Gastro-enteritis and colitis 189,683 519.7 258,282 661.6
· Tuberculosis (all forms) 134,563 368.7 137,038 351.0 Pneumonia 81,752 224.0 95,717 245.2 Measles 2 I ,973 60.2· 15,451 39.6· Malaria 29,097 79.7 27,090 69.4· Whooping cough 21,956 60.2 26,3 I I 67.4
. Beriberi 20,057 54.9 17,182' 44.0 Dysentery (all.forms) 16,655 45.6 21,774 55.8
lper 100,000 population:
Source: 1972,Phll/pplne Health Statistics, Disease Intelligence Center, Deparbnent of Health .
•
75

_,;-, '.
'
Table 2. 7 - GOVERNMENT AND PRIVATE HOSPITALS - NUMBER AND
BED CAPACITY: FY 1959-60 TO 1971-72
Number of Hospitals Bed Ca paci \Y Bed Capacity
Fiscal Year ·Per 10,000 Total Government1 Private Total Governrnent1 Private Population
1959-60 109 109 n.a. 13,450 13,450 n.a. n.a. I 960-61 148 148 n.a. 14,625 14,625 n.a. n.a. 1961-62 174 174 n.a. 15,575 . 15,575 .n.a. :.-: .. · . .. n.a. I 962-63 129 129 n.a. 14,300 14,300 ·n.a. n.a. 1963-64 374 136 2383 26,600 15,400 11,2003 8.7
1964-65 376 138 238 28,800 17,600 11,200 9.1 1965-66 464 1802 284 41,680 30,220 11,463 12.8 1966-67 677 1972 480 47,811 30,717 17,094 14.3
. 1967-68 717 2042 513 49,622 30,972 18,650 14.3 1968-69 799 3182 481 53,793 34,342 t9,4si• ts.i
1969-70 650 220 430 40,289 19,725 20,564 10.9 .1970-71 640 209 431 41, I 53 20,400 20,753 10.9 1971-72 693 244 449 43,124 21,700 21,424 11.0
n.a. - data not available. lGovemmenl hospital data for fiscal years; excludes the Philippine General Hospi.W. Veterans' Memorial Hospital and V. Luna Medical Center for years 1%0-64. · •
2Jncludes h5l~itals and medical centr.rs under the administration of the Office of the Presidmt, Department of National Defense and Bureau of Disease Control.
3Data are for reporting hospitals only. Only 185 of 238 private hospitals reported in the 1964 Survey of Hospitals. Sources: National CeJl9Js and StatisticsOffice,Journal of PhDlpplne Statistic&. Vol. 24. Nos. 1 and 2; md Yearbook of Phllipplne
Statistics. J %6 Department of Health, Annual Reports.
7
76
• 1

• w • ••
)
CHAPTER III
PO!:>ULATION MOVEMENTS
Figure 3.1· Distribution of Visitor Arrivals by Nationality, Philippines: CY . ' 1953 to April 1974 .. .· . .
Table 3.1 Distribution of Visitor Arrivals by Nationality, Philippines: CY 1953 to June 1974
Table 3:2 Selected Characteristics of Visitor Arrivals: CY 1973
Table 3.3 Distribution of Visitor Arrivals by Country of Residence and Mode of Travel, Philippines: CY 1973
Table 3.4 Estimated Tourist Rea;ipts, Philippines: CY 1960-73
Table 3.5 Incoming and Outgoing Flights and Passengers Carried by
79
80
82
84
85
International Carriers, Manila: CY 1958 to 2nd Quarter 1974 86
.....
■
.,

l
CHAPTER III
POPULATION MOVEM.ENTS
This chapter presents statistics on the tourism industry. Basic data on passenger traffic are obtained from the--records of the Commission on · Immigration and. Deportation. Data on the distribution and characteristics of visitor arrivals classified by country of residence and ·mode . of travel are collected by the Department of Tourism. Information on other aspects of the tourist trade are collected and tabulated directly from information on E/D cards which are made by the Commission on Immigration and Deportation.
The Civil Aeronautics Board furnishes statistics on incoming and outgoing flights and passengers carried. Information on per capita expenditures of visitor arrivals were estimated on the basis of a survey conducted by the Department of Tourism. Miscellaneous information on cruise passengers are obtained from the records of shipping offices and -on air inclusive tours from travel agencies. Comprehensive travel statistics are published annually in the Department of Tourism publication Travel Statistics.
:'Visitor arrival" or "visitor" is used to denote a person who comes to the Philippines for pleasure, recreation, sports, business, health, family reason, study, or for religious purposes and who remains in the country for a period not exceeding 59 days. The country of residence is the country where one is entitled to live or reside on a permanent status. Tourist receipts refer to the payments of foreign tourists for goods and services in a country made out of foreign currency resources. Such figures represent the value of tourist trade in a country as an invisible export.
78

Figure 3.1 DISTRIBUTION OF VISITOR ARRIVALS BY NATIONALITY, PHILIPPINES:
CY 1953 TO APRiL 1974
TOTAL
a..••• ,...."-!AMERICAN
OTHf R f URI PEAN i7 8RITISHi7 _ ,
.. ' . . -
NUMBER Of VISITOR ARRIVALS
·- 300,000
A-+- 200,000
~_,I\ -...
j •
I '
100,000
80,000
eo,ooo
40,000
zo.ooo
10,000
8.000
THER ASIANS~! VJ' -.._ -~V-~31-Jl,,''-l-+--+--l--l--Jll-4-
f--t--ji--t-f--+--A--I/-IJF'-~l,--1,1,,;<:._,,+-~l-+,_.--+-+--+--+--l--!-+-'l~\I-
6,000
.. ,,
,, , ....
I
/ /J I jJ,(i /,,OTHER NATIONALITIES \
/ ,, lj/f ~ V \, \
_11,
J
'
-AUSTRALIAN
I
I I I
l9SJ '54 '55 '56 '57 '58 '59 '60 '61 '62 '63 '64 '65 '66 '67 '68 '69 '70 '71 '72 '73 '74 * * JANUARY-APRIL
4,000
2,000
1,000
800
600
400
200
100
80
eo

Table 3.1 - DISTRIBUTION OF VISITOR ARRIVALS
Calendar Total American Japanese Australian ---Year Number Per Cent Number Per Cent Number Per Cent Number Per Cent
1953 11,634 100.00 8,567 73.64 424 3.64 74 0.64 1954 14,964 100.00 . 10,255 68.53 603 4.03 114 0.76 1955 16,785 100.00 11,389 67.85 1,053 6.27 189 1.13 1956 21,643 100.00 15,091 69.73 1,298 6.00 188 0.87 1957 26,053 100.00 16,073 61.69 1,454 5.58 1,578 6.06 1958 · 30,859 100.00 19,497 63.18 1,370 4.44 1,630 5.28 1959 34,434 100.00 19,876 57.72 2,242 6.51 _471 1.37
1960 50,657 100.00 23,627 46.~4 2,319 4.58 4,139 8.17 1961 57,250 100.00 . 25,968 45.36 3,366 5.88 4,964 8.67 1962 62,364 100.00 31,339 50.25 3,557 5.70 4,577 7.34 1963 69,813 100.00 36,693 52.5'6 5,117 7.33 5,485 7.86 1964 75,243 100.00 39,146 52.03 7,478 9.94 5,523 7.34
1965 84,015 100.00 45,551 54.22 7,118 8.47 5,217 6.21 1966 101,695 . 100.00 52,225 51.35 10,221 10.05 "7,389 7.27 1967 108,805 100.00 54,290 49.90 12,170 11.19 8,128 7.47 1968 112,713 100.00 53,603 47.56 14,188 12.59 10,860 9.63 1969 123,268 100.00 60,394 48.99 15,202 12.33 10,929 8.87
1970 144,071 100.00 69,476 48.22 15,838 10.99 12,388 8.60 1971 144,321 100.00 64,740 44.86 23,589 16.35 12,415 8.60 1972 150,300 100.00 62,583 41.64 25,969 17.28 12,89 I 8.58 1973 205,727 100.00 63,146 30.69 57,677 . 28.04 14,328 6.96
January 10,804 100.00 3,815 35.3 I 3,015 27.91 1,048 9.70 February 11,978 100.00 4,161 . 34.73 3,308 27.62 725 6.05 March 13,136 100.00 4,442 33.81 3,327 25.33 792 6.03 April 16,613 roo.oo 6,777 40.79 3,988 24.01 1,295 7.80 May 14,633 100.00 5,809 39.70 3,643 24.90 . 1,041 7.11 June 16,374 100.00 7,189 43.90 3,238 19.77 1,383 8.45 July 17,723 100.00 7,566 42.69 3,877 21.88 883 4.98 August 18,916 100.00 5,033 26.61 5,299 28.01 1,145 6.05 September 17,651 100.00 3,951 22.38 5,872 33.27 1,354 7.67 j
October 21,623 100.00 5,952 27.53 · 6,045 27.96 1,957 9.05 November 21,979 100.00 4,857 22.10 7,823 35.59 1,161 5.28 December 24,297 100.00 3,594 14.79 8,242 33.92 1,544 6.36
1974 -January 27,523 100.00 4,291 15.59 12,290 44.65 2,036 7.40 February 25,845 100.00 3,879 15.01 12,463 48.22 1,360. 5.26 March 27,913 100.00 5,158 18.48 13,266 47.53 1,294 4.64 April 24,825 100.00 5,146 20.73 9,614 38.73 . 1,789 7.21 May 23,855 100.00 . 2,950 12.37 8,648 36.25 1,327 5.56 June 33,869 100.00 4,740 14.00 12,726 37.57 1,525 4.50
Source: Department of Tourism.
80
l

BY NATIONALITY, PHILIPPINES: CY 1953 TO JUNE 1974
' Other British Other Asians Other Europeans Nationalities Stateless
Number Per Cent Number Per Cent Number Per Cent Number Per Cent Number Per Cent
688 5.91 858 7.38 703 6.04 255 2.19 65 0.56 963 6.44 1,620 10.83 967 6.46 437 2.92 5 0.03
1,083 6.45 1,322 7.88 1,242 7.40 498 2.97 9 0.05 1,248 5.77 1,788 8.26 1,277 5.90 741 3.42 12 .0.05 1,905 7.3 I 2,488 9.55 1,678 6.44 836 . 3.21 41 0.16 2,062 6.68 3,209 10.40 2,179 7.06 892 2.89 20 0.07 2,901 8.42 _ 4,899 14.23 2,420 7.03 1,561 4.53 64 0.19
5,359 10.58 8,513 16.80 4,230 8.35 2,360 4.66 110 0.22 6,216 10.86 10,085 17.62 4",165 7.27 2,384 4.16 102 0.18 7,685 12.32 5,123 8.22 7,711 12.37 2,339 3.75 33 0.05 8,108 11.61 5,456 7)32 5,937 8.50. 2,995 4.29 22 ·0.03 7,701 10.24 5,532 7.35 6,150 8.17 3,675 4,88 38 0.05
7,721 9.1', 6,627 7.89 7,249 8.63 4,514 5.37 18 0.02 9,887 9.72 7,359 7.24 8,974 8.82 5,622 5.53 18 _ 0.02 9,794 9.00 8,087 7.43 I 0,411 9.57 5,888 5.41 37 0.03 8,800 7.81 8,022 7.12 10,020 8.89 7,201 6.39 19 0.01 8,46] 6.87 9,232 7.49 11,936 9.68 7,098 5.76 15 0.01
9,404 6.53 12,118 8.41 15,250 10.59 9,569 · 6.64 28 0.02 9,930 6.88 13,371 9.26 13,080 9.06 7.171 4.97 25 0.02
11,061 7.36 I 3,752 9.15 16,013 10.65 8,022 5.33 9 0.01 16,450 8_.00 28,588 13.90 · 17,952 8.73 7,559 3.67 27 0.01 .)
- -710 6.57 803 7.43 978 9.05. 435 4.03 0 0.00
1,031 8.61 903 7.54 1,425 11.90 424 3.54 I 0.01 917 6.98 1,097 8.35 1,902 14.48 657 5.00 2 0.02
1,221 ·7_35 1,270 7.64 1,460 8.79 602 3.62 0 0.00 904 6.18 1,422 9.72 1,216 8.3 I 596 4.07 2 0.01
I ,I 03 6.74 1,823 11.13 982 6.00 . 656 4.01 0 0.00 1,271 9.17 2,320 13.09 1,200 6.77 606 3.42 0 0.00 1,613 8.53 3,459 18.29 1,682 8.89 685- 3.62 0 0.00 1,3 I 5 7.45 3,244 18.38 1,397 7.92 516 2.92 2 . 0.01 1,670 7.72 3,406 I 5.75 1,819 8.41 765 3.54 9 . 0.04 1,592 7.24 3,671 16.70" 1,920 8.74 954 4.34 I 0.01 3,103 12.77 5,170 21.28 1,971 8.11 663 2.73 10 0.04
2,428 8.82 3,847 13.98 1,?57 7 :11 672 2.44 2 0.01 1,327 5.13 3,160 12.23 3,215 12.44 439 1.70 2 0.01 1,617 5.79 3,158 11.31 2,229 7.99 I, I 91 4.26 0 0.00 2,009 8.09 3,315 13.35 1,839 7.41 I, 111 4.47 2 o".01 1,273 5.34 7,532 31.57 1,408 5.90 716 3.00 · I 0.01 1,634 4.83 10,663 31 .48 1,559 4.60 1,020 3.01 2 0.01
. 81

Table 3.2 - SELECTED CHARACTERISTICS
Sex Age
Nationality Total Under Male Female 20 20:39 40-59 I .
American 63,146 37,958 25,188 I 0, I 07 I 9,308 23,609 Japanese 57,677 48,953 8,724 1,733 30,91-2 ,20,591 Australian 14,328 8,636 5,692 1,655 4,822 5,448 British I 6,450 I I ,463 4,987 2,657 7,587 5,324 German 4,41 I 3,373' 1,038 268 2,313 1,505
Canadian 3,032 1,874 1,158 409 1,142 1,161 -Chinese 15,560 8,243 7,317 1,478 6,160
,. 6,665
Italian· 2,218 1,379 839 , 146 827 949 , Indian 2,196 1,707 489 303 ·995 791
French 1,808 1,313 495 146 . 769 754 r
Swiss 1,642 I, 196 446 107 813 572 Dutch 1,517 1,132 385 125 521 648 Thai 1,351 I 964 387 114 800 414 Indonesian 1,899 1,483 .416 170 ' 882 - 783 Nt,_w Zealander 1,348 915 433 118 531 475
Malaysian 1,532 1,209 323 13() 954 398 Singaporean 1,758 1,317 441 115 1,004 583 Swedish 846 638 208 90 287 383 Korean 1,429 1,192 237 118 645 616 All others I 1,579 7,901 3,678 1,402 5,125 4,129
Sub total 205,727 142,846 62,881 21,391- 86,397 75,798
Filipino t~urists 37,084 16,569 20,515 4,190 16,416 10,835
Grand Total 242,811 159,415 83,396 25,581 102,813 86,633 ◄
Source of data: Department of Tourism.
' ' \
82
l

OF VISITOR ARRIVALS; CY 1973 I .
Group. Purpose of Visit
60 Median Pleasure Official \ .
Not And Over Age Holiday Business Mission Others Reported
10,122 41.33 .41,530 . 9,461 3,551 7,342 1,262 4,441 37.04 42,523 8,758 2,001 2,148 2,247 2,403 42.02 7,650 2,7.92 473 2,364 1,049
882. · 34.18 · 10,448 4,219 549 775 459 375 36.26 2,559 1,253 201 238 160
320 38.89 1,933 664 200 144 91 1,257 39.93 12,323 1,348 637 · 759 493
296 42.35 1,636 284 94 117 ,87 107 35.48 1,228 288 · 331 273 76 139 38.21 907 567 169 131 34
150 37.06 1,160 353 35 55 . 39 · 223 42.99 763 507 112 118/ 17 .23 33.55 614 184 424 107 22 64 . 37.19 711 364 540 226 ·58
224 40.55 728 356 126 76 62
50 32.83 756 269 327 147 33·
56 34.72 1,136 332 164 97 29
86 41.90 421 295 50 53 27
50 38.01 471 331 336 247 · 44
923 36.62 7,232 1,339 1,328 887 793 I
22,141 38.36 136,729 33,964 11,648 16,304 7,082
5,643 36.99
27,784 38.14
83
/.:.

I .
Table 3.3 - DISTRIBUTION OF VISITOR ARRIVALS BY COUNTRY OF RESIDENCE AND MODE OF TRAVEL, PHILIPPINES: CY 1973
Country of Residence Air Sea Total
North America 64,902 1,602 66,504 United States 61,337 1,527 62,864 Canada 3,092 75 3,167 Others -473 0 473
South America 577 578
Europe 23,729 1,704 25,433 United Kingdom 4,946 750 5,696 Germany 3,678 224 3,902 Italy 2,432 4 2,436 France 1,604 11 1,6 I 5
_Switzerland 1,730 21 . I, 751 Netherlands 1,304 . 17 1,321 Ot.hers, 8,035 677 8,712
Pacific Countries 22,019 4,238 26,257 Australia I 0, 190 3,848 14,038 Hawaii 5,424 0 5,424 Guam 5,231 0 5,231 Others 1,174 390 1,564
Middle East 1,790 1,791
Far East 79,026 5,741 84,767 Japan 44,175 5,635 49,810 Indonesia 1,916 3 1,919 Hong Kon.g '18,942 0 18,942 Singapore 3,212 5 3,217 Thailand · 2,255 2 2,257
. Republic of China 2,610 77 2,687· India I ;680 7 _ 1,687 Malaysia 1,307 8 1,315 Others 2,929 4 2,933
Others 367 30 397
Total 192,410 13,317 205,727
Note: Yearly Total excludes 37,084 Filipino Tourists. Source: Department of Tourism.
84
•
,
..

~ I
[
I
r
Table 3.4 - ESTIMATED TOURIST REC?IPTS, PHILIPPINES: CY 1960-73
Calendar· · Number of Year Visitors
(Actual)
1960 50,657 1961 57,250 1962 62,364 1963 69,813 1964 75,243
1965 84,015 1966 101,695 1967 108,805 1968 112,713 1969 123,268
1970 144,0_71 1971 144,321 1972 166,431 1973 242,811
I According to survey Of outgoing visiton..
2Excludes internatioual fare payments.
Average Length of Stay (Days)
6.4 6.4 6.7 7.0 · · 6.9
7.0 73 7,i 7.2 7.2
7.3 7.3 7.3 7.8
Average1 lndi- Total Tourist victual Daily Receipts2
Expenditures (Thousand (U.S. Dollars) U.S. Dollars)
30.00 9,726 29.16 10,685 24.50 10,237 30.00 14,661 30.00 15,575
30.00 17,643 28.30 21,009 29.50 23,110
- 30.50 24,752 30.50 27,070
30.50 32,077 30.50 32,l33 31.50 38,271 35.80 67,80~
· (Estimated visitor expenditure is based on the number of visitors in a given year fT1ultiplicd by .their average length of stay and multiplied again by the average expenditure per pcn;ons per day.)
Source: Deparbnent of Tourism.
85
•

Table 3.5 - INCOMING AND OUTGOING FLIGHTS AND MANILA: CY 1958-
Air Passengers Calendar Arrivals · In-Transit
Year/Quarter Number Growth Number Growth
(Per Cent) ·(Per Cent)
1958 57,737 8 32,450 • 1959 57,591 0.25 28,679 (11.65)
1960 62,037 7.72 37,207 29.78 1961 77,728 25.29 43,000 15.57 ·1962 80,195 · 3.17 53,441 24,28 1963 94,078 17.3 I 59,959 12.20 1964 109,851 · 16.77 67,198. 12.07
1965 123,049 I • J 2.0J 76,586 13.97 1966 155,952 26.74 75,610 ( 1.27) 1967 156,441 0.31 82,260 8.80. 1968 180,479 15.37 86,405 5.04 1969 205,094 13.64 . 76,358 (11.63)
1970 237.,632 15.86 107,092 40.25 1971 234,997 (I. 11) 1•23,345 · 15.18
1972 239,528 1.93 164,781 33.59 --1st Quarter
I · 52,856 (22.06) 39,340 5.06
2nd Quarter 75,663 43.15 41,809 6.28 3rd Quarter ,61,901 (18.19). 43,531 4.12 4th Quarter 49,108. (20.67) 40,101 (7.88)
1973 283,137 18.21 155,232 (5.80)
1st Quarter 47,468 (3.34) 43,119 7.53 2nd Quarter 64,846 36.61 38,096 (11.65) 3rd Quarter. 68,681 5.91 41,800 9.72 4th Quarter 102,142 48.72 32,217. (22.93)
1974
1 st Quarter 100,245 ( 1.86) 30,843 (4.26) 2nd Quarter 107,832 7.57 26,543 (13.94)
' '
8Oata not available prior to 1958.
, Source of basic data: Dcparbnent of Tourism . .
86
' .

PASSENGERS CARRIED BY INTERNATIONAL CARRIERS, 2nd Quarter I 974
Air Flights
Departures Arrivals Departures
Number Growth Number Growtl] Number Growth (Per Cent) (Per Cent) (Per Cent)
· 59,885 a 3,33 I a 3,330 a - 62,933 5.09 3,182 (4.47) 3,172 (4.74)
63,947 1.61 2,942 (7.54) 2,945 (7 .16) 86,375 35.07 2,760 (6. i 9) 2,760 (6.28) 91,300 5.70 2,700 (2.17) 2,698 (2.25)
102,619 12.40 2,824 4.59 2,861 6.04 117,659 14.66 3,108 10.06 3,1 JO 8.70
135,113 14.83 3,46',l 11.61 3,470 . 11.58 165,920 22.80 3,577 . 3.11 3,579 3.14 I 78,663 7.68 4,016 12.27 4,016 12.21 210,767 I 7.97 4,485. 11.68 4,491 11.83 237,328 12.60 5,038 12.33 '5,043 12.29
280,997 18.40 5,407 7.32 5,409 7.26 293,472 4.44 5,666 4.79 5,677 4.95
273,977 (6.64) 5,866 3.53 5,866 3.33
68,312 (5.25) !,SOS 1.69 1,510 1.82 91,068 33.31 1,51 S 0.66 1,516 0.40 65,965 (27.57) 1,466 (3.23) -1,466 (3.30) 48,632 (26.28) 1,380 (5.87) 1,374 (6.28)
310,235 13.23 5,302 (9.61) 5,303 (9.60)
I 60,389 24.18 1,31 S (4.71) 1,317 4.15 76,534 26.74 1,329 1.06 1,329 0.91 82,654 8.00 1,298 (2.33~ 1,297 (2.4 I)
-90,658 9.68 1,360 4.78 · 1,360 4.86
122,114 34.70 1,344 (I. 18) 1,346 (1.03) 116,764 (4.38) 1,399 4.09 1,398 3.86
87
•

CHAPTER IV
NATIONAL INCOME
Figure 4.1 Gross National Product, National Income and Net Domestic Product: CY 1968-73 (At constant 1967 prices)
Figure 4.2 Net Domestic. Product by Industrial Origin: CY 1968-73 (At constant 1967 prices) ·
Table 4.1 Gross National Product and Expenditures Account: CY 1960-73 (At current prices in million pesos)
Table 4.2 Personal Income and Outlay Account: CY 1960-7.3 (At current prices in million pesos)
Table 4.3 General Government Receipts and Expenditures Account:' CY 1960-73 (At current'prices in million pesos)
Table 4.4 Combined Capital Reconciliation Account: CY 1960-73 (At current prices in million pesos)
Table 4.5 Foreign Transactions Account: CY 1960-73 (At current prices in million pesos)
Table 4.6 Gross National Product, National Income and Net Domestic Product by Industrial Origin: CY 1960-73 (At current prices in million pesos) ·
Table 4.7 Per Cent Growth ·Rates of Gross National Product, National Income and Net Domestic Product by Industrial Origin: CY· 1960-73 (At current prices)
Table 4.8 Gross National Product, National Income and Product by Industrial Origin: CY 1960-73 (At million pesos)
Net Domestic I 967 prices in
92
93
94
96
96
98
98
100
100
102
Table 4.9 Per Cent Growth Rates of Gross National Product, National Income and Net Domestic Product by Industrial Origin: CY 1960-73 (At 1967 prices) · ' 102
Table 4.10 Gross National Product by Expenditure Shares: CY 1960-73 (At current prices in million pesos) 104·
Table 4.11 Per Cent Growth Rates of Gross National Product by Expenditure Shares: CY 1960-73 (At current prices) 104
Table 4.12 Gross National Product by Expenditure Shares: CY 1960-1973 (At 1967 prices in million pesos) 106
Table 4.13 Per Cent Growth Rates of Gross National Product by Expenditure Shares: CY 1960-73 (At 1967 prices) 106 ,
Table 4.14 Semestral Estimates: Gross National Product, National Income and Net Domestic Product by Industrial Origin, 1st Semester . 1967 to 2nd Semester 1973 (At current prices in million pesos) 108
Table 4.15 Semestral.Estimates: Gross National Product, National Income and Net Domestic Product by Industrial Origin, 1st Semester 1967 to 2nd Semester 1973 (At 1967 prices in million pesos) .. 108
Table 4.16 Semestral Estimates: Gross National· Product by Expenditure Shares, 1st Semester 1967 to 2nd Semester 1973 (At current prices in million pesos) 110
Table 4.17 Semestral Estimates: Gross .National Product by Expenditure Shares, 1st Semester 1967 to 2nd Semester 1973 (At 1967 prices in million pesos) 110
.. ■

------------------------------------------- ----
CHAPTER IV
NATIONAL INCOME
No other set of statistical data presents a more vivid description on how the economy fared during a given p~riod than national income statistics. First, national income statistics measure the growth of the economy for a given period, the rate of such growth, both in money and in real terms, and whether the pace of the country's development is accelerating, decelerating, or lagging behind population growth. Second, national income statistics portray the structure of the economy - whether the economy is predominantly agricultural or industrial, which sector of the economy contributes greatly to the GNP, and which sector of the economy shows the greatest.growth and potential. Third, national income statistics present to the economic planner, to the marketing executive, and to the populace as a whole, a ready-made set or data indicating the directions of the country's growth so essential in planning; and fourth, national income statistics indicate the various recipients of the nation's output by sectors or by industries or by households, the distribu lions of the social income by type of income and by source of income and the disposition or expenditure of such income by sectors. In short, national income statistics present penetrating insights into the aggregative as well as the sectoral performance of the economy· for a given period so necessary for policy, planning, and analytical purposes.
' The statistical data on national income presented in this chapter measure the performance of. the Philippine economy from 1960 to 1973. Seventeen (17) major sets of statistical tables and two charts sum up such performance. Aside from the five standard accounts, namely: the Gross National Product and Expenditure Account, the Personal Income and Outlay Account, the General Government Receipts and Expenditures Account, the Combined Capital Reconciliation Account and the Foreign Transactions Account, other. tables presented are the gross national product (GNP), industrial origin, 1960 to 1973, both at current and constant 1967 prices; gross national product (GNP) by expenditure shares, 1960 to !973, also at current and 1967 prices; semestral estimates of the GNP, NI, and NDP by industrial origin, first semester 1967 to second· 1973, at current and constant prices; and semestral estimates of the GNP by expenditure shares for the same period, also at current and 1967 prices. The two charts present the level and growth of the (iNP, NI a:nd NDP from 1968 to 1973 and the industrial distribution of NDP for the same period.
90

I
Major responsibility in the preparation of these NI estimates is lodged in the National. Accounts Staff, Statistics Office of the National Economic and Development Authority (NEDA). The NI series presented here are not strictly· comparable with earlier NI estimates published by the Office in the Statistical Reporter, a quarterly publication of the Office. The NI .series appearing in this chapter represents the second phase in the overall revision program currently being underta!cen by the Office in its national income accounts: The. third phase in this program is the linking of the NI series from 1946 to 1959 with the 1960-66 and the 1967-73 series preparatory to making an overall revision in the NI estimates covering the entire post-war period (1946-73f
_ 91
•
t

. Figure 4.1 GROSS NATIONAL PRODUCT, NATIONAL INCOME AND
NET DOMESTIC PRODUCT: CY 1968-73 (At constant 1967 prices)
IN BILLION PESOS
40
35
30
25
20
15
10
5
0 1968 .1969 . 1970 1971
I GROSS NATIONAL PRODUCT .
I NATIONAL INCOME
fill NET DOMESTIC PROOucr
•
1972 1973

r a
\ ~
J
~) ~~~~---------,-----~--~, .~ .. . ' I
8
6
4
2
0
Figure 4.2 NET DOMESTIC PRODUCT BY INDUSTRIAL ORIGIN: CY 1968-73
(At constant 1967 prices)
in Billion Pesos
Agriculture, Fishery &.Forestry Manufacturing
1968 '69 '70 '71 '72 '73
Mining & Quarrying
10 ~------------
91-------------~
61--~-------=~
4
2
0
•
Construction 16 ~-----------~ 16 ~-----------~
12 1---------------1
81---------------1
12 1------------
4
0 1968 '69 '70 '71 '72 '73
8
4
0 1968 '69 '70 '71 '72 '73
8
6
4
0 1968 '69
Commerce Serv-ices 8
6
4
2
0 '70 '71 '72 '73 1968 '69 '70 '71
Tran spor tat ion ,Corrmun ication Storage&. Utilities
18 ,-------------~
12 ··t---------------1
8
4
0 1988 '89 '70 '71 '72 '73
\
'72 '73

Table 4.l GROSS NATIONAL PR.ODUCT AND
(At current prices
Item
I. Compensation of Employees } 2. Entrepreneurial & property income of
persons 3. General government income from property
& entrepreneurship 4. Corporate Income
a. Corporate Tax • b. Corporate Savings
NATIONAL INCOME or NET NATIONAL PRODUCT at factor cost
5. Indirect taxes less subsidies 6. Capital consumption allowance
GROSS NATIONAL PRODUCT at market prices
7. Personal consumption expenditures 8. General government consumption
expenditures 9. Gross domestic capital formation
• a. Fixed capital formation b. Increase in stocks
I 0. Exports of goods and services l I. Less: Imports of goods and services
EXPENDITURES ON GROSS DOMESTIC PRODUCT
12. Net factor income from abroad 13. Statistical discrepancy
EXPENDITURES ON GROSS NATIONAL PRODUCT
1960 1961 1962 1963 1964
10,658 11,722 12,991 15,076 16,128
64 482 208 274
65 421 196 225
86 675 202 473
77 795 241 554
73 837 256 581
I 1,204 12,208 13,752 15,948 17,038 977 I, 120 I ,228 1,456 1,538 794 904 1,087 1,352 1,560
12,975 14,232 16,067 18,756 20,136 10,444 11,474 12,512 14,361 16,050
1,087 2,230 1,999
231 . 1,408 1,508
1,253 2,685 2,379
306 1,627 1,945
1,409 1,716 1,898 3,008 3,807 4,491 2,624 3,324 4,046
384 483 445 2,451 3,136. 3,306 2,860 2,972. 3,611
13,661 15,094 16,520 20,048 22,134 .(203) (Ill) (55) (66) (88) (483) (751) (398)(1,226)(1,910)
12,975 14,232 16,067 18.756 20,136
Source: Statistics Office, Nationa1 Economic and·Development Authority.
94
I
,.Q

r--
EXPENDITURES ACCOUNT: CY 1 960-73
in million pesos)
1965 1966 1967 1968 1969
17,966 19,578 21,863 24,068 27,298
88 105 123 93 102 685 979 1,082 1,390 1,300 · 274 258 ·302 . _384 414 4 I I 721 780 1,006 886
18,739 20,662 23,068 25,551 28,700 1,491 1,721 2,003 2,204 2,297 1,799 2027 2,277 2,635 3,093
22,029 24,410 27,348 30,390 34,090 17,514 I 9,252 21,276 22,626 24,369
2,104 2,274 2,542 2,833 3,287 4,828 5,080 6,260 6,647 6,924 4,342 4,533 5,743 6,092 6,333
486 547 517 555 591 3,858 4,500 4,676 4,465 4,315 3,897 4,143 5,239 5,615 5,598
24,407 26,963 29,515 30,956 33,297 (123) (144) (305) (406) (285)
(2,255) · (2,409) (1,862) · (160) 1,078
22,029 24,410 27,348 30,390 34,090
95
I
1970 1971 1972 1973 - ___ ,,.A
31,659 38,508 43,914 55,141 ~
55 82 164 234 1,813 1,580 1,652 1,798
403 401 472 858 1,410 I ,I 79 1,180 940
33,527. 40,170 45,730 57,173 3,467 4,484 4,790 6,558 4,162 5,435 6,349 7,583
41,156 50,089 56,869 71,314 28,729 36,343 40,642 48,548
3,521 4,344 5,333 5,873 8,605 10,280 11,358 14,211 7,600 9,258 I 0, 122 12,658 I 1,005 1,022 1,236 1,553 7,797 8,814 9,696 16,027 l-7,993 9,146 10,143 13,574
40,659 50,635 56,886 71,085 (779) (597) (857) (468)
1,276 SI (840) 697
41,156 50,089 56,869 71,3 I 4

--·-·-
-
I
I
1
~-
Item
I. Personal consumption expenditures 2. Personal direct taxes 3. Personal savings 4. Statistical discrepancy
DISPOSAL OF INCOME
5. Compensation of employees } 6. Entrepreneurial and property income_
of persons . 7. Current transfer of payments
a. From general government b. From abroaq
PERSONAL INCOME
\
Table 4.2 - PERSONA_L INCOME AND
(At current prices
1960 I 961 I 962 I 963 I 964
10,444 11,474 12,512 14,361 16,050 56 82 127 I 72 213
962 1,305 1,203 2,213 2,301 ( 483) (751) (398) {1,226) (1,9 I 0)
10,979 12,110 13,444 15,520 16,654
10,658 11,722 12,991 15,076 16,128
321 388 453 444 526 144 162 155 192 163 177 226 298 25 2 363
10,979 12,110 13,444 15,520 16,654
Source of data: Statistics Office, National Economic and Development Authority.
Table 4.3 - GENERAL GOVERNMENT RECEIPTS AND
(At current prices
Item 1960 1961 1962 1963 1964
I. General government consumption expenditures 1,087 1,253 1,409 1,716 1,898 2. Current transfer payments to persons 144 . 162 155 192 163 3. General government savings (dissaving) 207 100 131 91 78
CURRENT EXPENDITURES 1,438 1,515 1,695 1,999 2,139
4. General government inc.ome from property and entrepreneurship 64 65 86 77 73
5, Indirect taxes less subsidies 977 1,120 1,228 1,456 1,538 6. Direct taxes 264 278 329 413 469
a. On corporation 208 ·196 202 241 256 b. On persons 56· 82 127 172 213
7. Current ·transfer payments from abroad 133 52 52 53 59 CURRENT RECEIPTS 1,438 1,515 1,695 ·. 1,999 2,139
Source of data: Statistics Office, National Economic and Development Allthority.
96
j {
•

,----) I
OUTLAY ACCOUNT: CY 1960-73
· in million pesos)
1965 1966 1967 1968 1969 1970 1971 1972 1973
r 17,514 19,252 21,276 22,626 24,369 28,729 36,343 40,642 48,548.
239 238 301 362 422 594 890 989 1,979 t 2,959 2,909 2,839 1,936 2,343 2,119 2,579 3,270 6,432
r · (2,255) (2,409) (1,862) (160) 1,078 1,276 51 840 697 18,457 19,990 22,554 24,764 28,212 32,718 39,863 45,741 57,656
[ 17,966 19,578 21,863 24,068 27,298 31,659 38,508 43,914 55,141
491 412 691 696 914 1,059 1,355 1,827 2,515 205 207 246 342 · 502 511 695 818 1,361 286 205 445 354 412 548 660 1,009 1,154
18,457 19,990 22,554 24,764 28,212 32,718 39,863 45,741 57,656
EXPENDITURES ACCOUNT: CY 1960-73
in million pesos)
1965 1966 1967 1968 1969 1970 I 971 1972 1973
2,104 2,274 2,542 2,833 3,287 3,521 4,344 5,333 5,873 205 207 246 342 502 511 695 818 1,361
,---,
(116) 14 223 37 (364) 642 1,018 502 2,813 2,193 2,495 3,011 3,212 3,425 4,674 . 6,057 6,653 10,047 '
88 105 123 93 102 55 82 164 234 1,491 1,721 2,003 2,204 2,297 3,467 4,484 4,790 6,558
513 496 603 746 836 997 1,291 . 1,461 .2,837 274 258 302 384 414 ·403 401 472 858 239 238 301 362 422 594 890 989 1,979 IOI 173 282 169 190 155 200 238 418
2,193 2,495 3,01 I 3,212 3,425 4,674 6,057 6,653 10,047
' .
' 97
. "

---
----------
., __ j
\
Table 4.4 - COMBINED CAPITAL RECONCILIA
(At current prices
Item 1960 1961 1962 1963 1964
1. Gross domestic capital formation 2,230 2,685 3,008 3,807 4,491 a. Fixed capital formation 1,999 2,379 2,624 3,324 4,046 b. Increase in stocks 231 306 384 483 445
GROSS DOMESTIC CAPITAL FORMATION 2,230 2,685 3,008 3,807 4,491
2. Personal savings 962 1,305 1,203 2,213 2,301
3. Corporate savings 274 225 473 554 581
4. General government savings ( dissaving) 207 100 131 91 78
5. Capital consumption allowance 794 904 1,087 1,352 1,560
6. Net borrowing (lending) from abroad (7) 151 114 (403) (29)
GROSS SAVINGS 2,230 2,685 3,008 3,807 4,491
Source of data: Statistics Office, National Economic and Development Authority.
Table 4.5 - FOREIGN TRANSACTIONS (At current prices in
Item 1960 1961 1962 1963 1964
1. Exports of goods and services 1,408 1,627 2,451 3,136 3,306 a. Merchandise, FOB 1,244 1,354 1,902 2,552 2,605 b. Freight & insurance 8 20 32 47 45 c. Other exports 156 253 517 537 656
2. Net factor income from abroad (203) (111) (55) (66) (88)
3. Current transfer payments from abroad 310 278 350 305 422 a. To persons 177 226 298 252 363 b. To general-government 133 52 52 53 59
4. Net borrowing (lending) from abroad (7) 151 114 (403) (29) CURRENT RECEIPTS 1,508 1,945 2,860 · 2,972 3,611
5: Imports of goods and services 1,508 1,945 2,860 · 2,972 3,611 a Merchandise, FOB 1,226 1,595 2,238 2,415 3,049 b. Freight and insurnnce 156 162 212 208 269 c. Other imports 126 188 410 349 293
CURRENT PAYMENTS
Source of data: Statistics Office, National Economic and Development Authority. '
98
-~ I

TION ACCOUNT: CY 1960-73
in million pesos)
1965 1966 1967 1968 1969 1970 1.971 1972 1973
4,828 5,080 6,260 6,647 6,924 8,605 10,280 11,358 14,211 4,342 4,533 5,743 6,092" 6,333 7,600 ,9,258 I 0, 122 1 2;658
486 547 517 555 591 1,005 1,022 1,236 1,553 4,828 5,080 6,260 6,647 6,924 8,605 ,10,280 I I ,358 14,211 -- 2,959 2,909 2,839 1,936 2,343 2,119 2,579 3,270 6,432
411 721 780 1,006 886 1,410 1,179 1,180 940 (I 16) 14 223 37 (364) 642 ' 1,018 502 2,813
1,799 2,027 .2,277 2,635 3,093 4,162 5,435 6,349 7,583 .(225) (591) 141 1,033 966 272 69 57 (3,557) 4,828 5,080 6,260 6,647 6,924 .8,605 I 0,280 I I ,358 14,211
~-- ACCOUNT: CY 1960-73 million pesos)
'
· I 965 1966 1967 1968 1969 1970 1971 1972 1973
3,858 4,500 4,676 4,465 4,315 7,797 8,814 9,696 16,027 2,698 3,220 3,199 3,342 3,331 6,259 7,221 7,373 11,883
54 64 65 66 70 . 173 I 27 90 I 3 I 1,106 1,2 I 6 1,412 I ,057 914 1,365 1,466 2,233 4,013 (123) (144) (305) (406) (285) (779) (597) (857) (468) 387 378 727 523 602 703 860 1,247 .1,572 286 205 445 , 354 412 548 660 1,009 1,154 IOI 173 282 169 190 155 200 238 418
(225) (591) 141 1,033 966 272 69 57 (3,557) 3,897 4,143 5,239 5,615 5,598 , 7,993 9,146 I 0,143 13,574
3,897 4,143 5,239 5,615 5,598 7,993 9,146 10,143 13,574 3,155 3,330 4,171 4,523 4,450 6,490 7,686 8,480 10,865
258 279 372 407 376 640 661 736 1,137. 484 534 696 685 772 863 799 927 1,572
99
\

Table 4.6 -GROSS NATIONAL PRODUCT, NATIONAL BY INDUSTRIAL ORIGIN,
(At current prices
Industry /Item
I. Agriculture, Fishery and Forestry 2. Mining and Quarrying 3. Manufacturing· 4. Construction 5. Transportation, Communication, Storage
and Utilities 6. Commerce 7. Services
NET DOMESTIC PRODUCT at factor cost 8. Net factor income from abroad
NET NATIONAL PRODUCT or NATIONAL INCOME
9. Indirect taxes net of subsidies I 0: Capital consumption allowance
· GROSS NATIONAL PRODUCT
1960 1961 1962 1963 1964
3,669 3,969 4,463 5,337· 5,5 I 2 128 136 175 182 188 .
2,141 2,356 2,646 3,084 3,208 395 450 448 582 659
562 587 627 670 716 1,865 1,973 2,224 2,472 2,707 2,647 2,848 3,224 3,687 4,136
11,407 12,319 13,807 1°6,014 17,126 (203) (Ill) (55) (66) (88)
11,204 12,108 13,752 i5,948 11,il38 977 1,120 1,228 1,456 1,538 794 904 1,087 l·,352 1,560
12,975 14,232 16,067 18,756 20,136
Source of data: Statistics Office, National Economic and Devdopment Authority. \
Table 4.7 - PER CENT GROWTH RATES OF GROSS DOMESTIC PRODUCT BY !NOUS
(At current
Industry /Item 1960-ol 1961-62 1962-63 1963-64 1964-65
I. Agriculture, fishery and forestry 8.2 12.4 19.6 3.3 I 2.5 2. Mining~ quarrying 6.3 28.7 4.0 3.3 23.4 3. Manufacturing 10.0 12.3 16.6 4.0 6.0 4. Construction 13.9 (0.4) 29.9 13.2 15.0 5. Transportation, Communication,
Storage and Utilities 4.4 6.8 6.9 6.9 9.8 6. Commerce 5.8 12.7 11.2 9.5 7.6 7. Services 7.6 13.2 14.4 · 12.2 10.5
NET DOMESTIC PRODUCT at factor cost 8.0 12.1 16.0 ,6.9 10.1
8. Net factor income from abtoad 45.3 50.5 (20.0) (33.3) (39.8) NET NATIONAL PRODUCT or NATIONAL INCOME 9.0 12.6 16.0 6.8 10.0
9. Indirect taxes net of subsidies 14.6 9.6 18.6 5.6 (3.1) I 0. Capital consumption allowance I 3.9 20.2 24.4 15.4 15.3
GROSS NATIONAL PRODUCT 9.7 I 2.9 16.7 7.4 9A
Source or data: Statistics Office, National Economic and Development Autho_rity.
100
J

I ~
INCOME AND NET DOMESTIC PRODUCT CY 1960-73 in million pesos)
1965 1966 1967 1968 1969 1970 1971 1972 1973
t 6,201 6,801 7,775 9,041 10,605 12,460 15,185 17,017 20,985
232 315 348 418 530 845 924 1,052 1,692 3,400 3,738 4,274 4,692 5,073 6,476 7,808 8,779 12,263
758 760 880 838 979 876 1,021 1,386 1,742
786 871 928 1,020 . 1,07J3 1,263 · 1,451- 1,661 ) ,974 2,914 3,228 3,601 3,842 4,075 4,889 5,863 6,748 8,143 4,571 5,093 5,567 6,106 6,645 7,497 8,515 9,744 10,842
18,862 20,806 23,373 25,957 28,985 34,306 40,767 46,587 57,641 (123). (144) (305) (406) (285) · (779) (597) (857) (468)
18,739 20,662 23,068 25,551 28,700 33,527. 40,170 45,730 57,173 1,491 1,721 2,003 2,204 2,297 3,467 4,484 4,790 6,558 1,799 2,027 2,277 2,635 3,093 4,162 5,435 6,349 7,583
22,029 24,410 27,348 30,390 34,090 41,156 50,089 56,869 71,314
NATIONAL PRODUCT, NATIONAL INCOME AND NET TRIAL ORIGIN: CY 1960-73 prices)
1965-66 1966-67 1967-68 1968-69 1969-70 1970-71 1971-72 1972-73
9.7 14.3 16.3 17.3 17.5 21.9 12.1 23.3 35.8 10.5 20.1 26.8 59.4 9.3 13.9 60.8
9.9 14.3 9.8 8.1 27.7 20.6 15.0 36.6 0.3 15.8 (4.8) 16.8 - (10~5) 16.6 35.7 25.7
10.8 6.5 9.9 5.7 17.2 14.9 14.5 18.8 10.8 11.6 6.7 6.1 20.0 19.9 15.1 20.7 11.4 9.3 9.7 8.8 - 12.8 13.6 14.4 11.3
10.3 12.3 I I. I 11.7 18.4 18.8 14.3 23.7 (17.1) (111.8) (13.3) 29.8 (I 73.3) 23.4 43.6 45.4
I 0.3 11.6 10.8 12.3 16.8 19.8 13.8 25.0 15.4 16.4 10.0 4.2 50.9 29.3 6.8 36.9 12.7 12.3 15.7 17.4 34.6 30.6 16.8. I 9.4 10.8 12.0 1 I. I 12.'.l 20.7 21.7 . 13.5 25.4

,r /
Table 4.8 - GROSS NATIONAL PRODUCT, NATIONAL INCOME AND NET
Industry /I tern
I. Agriculture, Fishery and Forestry 2. Mining and Quarrying
-3. ManuJ'acturing 4: Construction 5. Transportation, Communication;
Storage and Utilities • 6. Commerce 7. Services
(At 1967 prices
1960 1961 1962 1963 1964
5,874 6,214 6,483 6,908 6,698 256 253 254 265 267
2,945 3,044 3,200 3,4 I 9 · 3,517 514 582 571 207 789
683 711 738 771 805
NET DOMESTIC PRODUCT at factor cost
2,496 2,591 2,817 2,972 3,065 4,135 4,299 4,485 4,686 4,968
16,903 17,694 18,548 19,728 20,109 8. Net factor income from abroad
NET NATIONAL PRODUCT or NATIONAL INCOME .
9. Indirect taxes net of subsidies 10. Capital consumption allowance
GROSS NATIONAL PRODUCT
(331) (166) (66) (73) (95)
16,572 17,528 18,482 19,655 20,014 1,448 1,609 1,650 I, 794 I ,806
994 1,092 I ,228 1,413 l ,61 5 19,014 20,229 21,360 22,862 23,435 _
Source: Statistics Office, National Economic and Development Authority.
Table 4.9 - PER CENT GROWTH RATES OF GROSS 'NATIONAL
PRODUCT BY INDUSTRIAL (At1967
Industry /Item 1960-61 1961-62 I 962-63 1963-64 1964-65
I. Agriculture, Fishery and Forestry 5.8 4.3 6.6 (3.0) 8.0 2. Mining and Quarrying • (1.2) 0.4 4.3 0.8 5.2
. 3. Manufacturing. 3.4 5.1 6.8 2.9 4.4 4. Construction I 3.2 (1.9) 23.8 11.6 9.6 -5. Transportation, Communication,
Storage and Utilities 4.1 3.8 4.5 4.4 5.8 6. Commerce 3.8 8.7 5.5 3.1 4.2 7. Services 4.0 4.3 · 4.5 6.0 3.8
NET DOMESTIC PRODUCT at factor cost 4.7 4.8 6.4 1.9 5.7
8. Net factor income from abroad 49.8 60.2 (I 0.6) (30.1) (33. 7) NET NATIONAL PRODUCT or
NATIONAL INCOME 5.8 5.4 6.3 1.8 5.6 9. Indirect taxes net of subsidies 1 I. I 2.5 8.7 0.7 (7.0)
I 0. Capital consumption allowance 9.9 12.5 15. I 14.3 14. l GROSS NATIONAL PRODUCT 6.4 5.6 7.0 2.5 5.2
Soufcc: Statistics Office, National Economic and Development Authority.
102
1
I l i

f I DOMESTIC PRODUCT BY INDUSTRIAL ORIGIN: CY 1960-73
in million pesos)
~ 1965 1966 1967 1968 1969 1970 1971 1972 · 1973
7,234 7,460 7,775 8,301 8,822 8,962 8,934 8,948 9,559 281 313 4,348. 407 468 5.58 650 686 732
3,672 3,911 4,274 4,570 4,811 5,108 5,497 5,828 6,527 865 818 880 750 820 689 771 1,014 1,245
852 890 928 968 999. 1,063 1,154 1,217 1,306 3,193 3,359 3,601 3,791 3,935 4,149 4,357 4,594 4,903 5,158 5,356 5,567 5,760' 5,955 6,196 6,424 6,735 7,101
21,255 22,107 23,373 24,547 25.810 26,725 27,787 29,022 31,373 (127) ( 149) (305) ( 411) (282) (480) (310) (382) (205)
' 21,128 21,958 23,068 24,136 25,528 26,245 27,477 28,640 3 I, 168 I
r 1,679 I ,829 2,003 2,084 . 2,045 2,697 3,057 2,974 3,589 r 1,843 2,053 2,277 2,561 2,895 3,249 3,656 3,999 4,345
f
24,650 25,840 27,348 28,781 30,468 3 2, 19 I 34,190 35,613 39,102
PRODUCT, NATIONAL INCOME AND NET DOMESTIC
ORIG!Ni CY 1960-73 prices)
1965-66 1966-67 1967-68 1968-69 1969-70 1970-71 1971-72 1972-73
3.1 4.2 6.8 6.3 1.6 0.3 0.2 6.8 · 11.4 11.2 17.0 15.0 19.2 16.5 5.5 6.7
t 6.5 9.3 6.9 5.3 6.2 7.6 6.0 12.0
(5.4) 7.6 (14.8) 9.3 ( 16.0) 11.9 31.5 22.8
4.5 4.3 4.3 3.2 6.4 8.6 5.5 7.3 ~ 5.2 7.2 5.3 3.8 5.4 5.0 5.4 6.7
'~
3.8 3.9 3.5 3.4 4.0 3.7 4.1\ 5.4
4.0 5.7 5.0 5.1 3.5 4.0 4.4 8.1
f (17.3) (104.7) (34.8) 31.4 (70.2) · 35.4 (23.2) 46.3
I 3.9 5.1 4.6 5.8 2.8 4.7 4.2 8.8 ·s.9 9.5 4.0 (1.9) 31.9 13.3 (2.7) 20.7
~ 11.4 10.9 12.5 13.0 12.2 12.5 9.4 8.7 4.8 5.8 5.2 5.9 5.7 6.2 4.2 9.8
•
103 ·
f

Table 4.10 - .GROSS NATIONAL PRODUCT BY (At current prices
Type of Expenditure
I. Personal consumption expenditures 2. General government consumption
expenditures A. Compensation of employees B. Other expenditures
3. Gross domestic capital formation A. Fixed capital fonnation
I. 'construction a. Government b. Private
2. Durable equipment B. Increase in stocks
4. Exports of goods and services 5. Less: Imports of goods and services
EXPENDITURES ON GROSS DOMESTIC PRODUCT .
6. Net factor income from abroad 7. Statistical discrepancy
EXPENDITURES ON GROSS NATIONAL PRODUCT
1960 ·1961 1962 1963 1964
10,444 11,474 12,512 14,361 16,050
1,087 1,253 1,409 1,716 1,898 761 866 1,020 1,218 1,371 326 387 389 498 527
2,230 2,685 3,008 3,807 4,491 1,999 2,379 2,624 3,324 4,046
957 1,154 1,148 1,494 1,690 286 31 I 332 414 334 671 843 816 1,080 1-,357
1,042 1,225 1,476 1,830 2,356 231 306 384 483 445
1,408 1,627 2,451 3,136 3,306 1,508 1,945 2,860 2,972 3,611
13,661 15,094 16,520 20,048 22,134 (203) (Ill) (55) (66) (88) (483) (751) (398) (1,226) (1,910)
12,975 14,232 16,067 18,756 20,136
Source: StatistiC!! Office.; NntionaJ F,eonomic and Development Anlhority.
Table 4.11 - PER CENT GROWTII RATES OF GROSS NATIONAL (Al current
Type of Expenditure 1960-61 1961-62 1962-63 1963-64 1964-65
l. Personal consumption expenditures 9.9 9.0 14.8 11.8 9.1 2. General government ·consumption
expenditures I 5.3 12.5 21.8' 10.6 10.9 A. Compensation of employees 13.8 17.8 19.4 12.6 10.2 B. Other expenditures 18.7 0.5 28.0 5.8 12.5
3. Gross domestic capital formation · 20.4 12.0 26.6 18.0 · 7.5 A. Fixed capital formation 19.0 10.3 26.7 21.7 7.3
I. Construction 20.6 (0.5) 30.1 13.1 15.0 a. Govemmen t 8.7 6.8 24.7 (19.3) 28.1 b. Private 25.6 (3.2) · 32.4 25.6 11.6
2. Durable equipment 17.6 20.5 24.0 28.7 1.8 B. Increase in stocks 32.5 25.5 25.8 (7.9) 9.2
4. Exports of goods and seryices 15.6 50.6 27.9 5.4 16.7 5. Less: Imports of goods and services 29.0 47.0' 3.9 21.5 '7.9
EXPENDITURES ON GROSS DOMESTIC PRODUCT 10.5 9.4 21.4 10.4 10.3
6. Net factor income from abroad 45.3 . 50.5 (20.0) (33.3) (39.8) 7. Statistical discrepancy
EXPENDITURES ON GROSS NATIONAL PRODUCT 9.7 12.9 16.7 ·7.4 9.4
.§ource: StafutiC!! Office. Nationd Economic and Development Authority.
104

...
EXPENDITURE SHARES. CY 1960-73 in million pesos)
1965 1966 1967 1968 1969 1970 1971 1972 1973
17,514 19,252 21,276 22,626 24,369 28,729 36,343 40,642 48,548
2,104 2,274 2,542 2,833 3,287 3,521 4,344 5,333 5,873 1,511 1,640 1,803 1,991 2,212 2,498 2,889 3,390 3,469
593 634 739 842 1,075 1,023 1,464 1,943 2,404 4,828 5,080 6,260 6,647 6,924 8,605 10,280 11,358 14,211 · 4,342 4,533 5,743 6,092 6,333 7,600 9,258 10,122 12,658 1,943 1,950 2,257 2,150 2,510 2,244 2,619 3,554 4,468
428 511 647 643 993 .· 540 . 819 1,314 1,674 1,515 1,439 1,610 1,507 1,517 1,704 1,800 2,240 2,794 2,399 2,583 3,486 3,942 3,823 5,356 6,639 . 6,568 8,190
486 547 5i7 555 . 591 1,005 1,022 1,236 1,553 3,858 4,500 4,676 4,465 · 4,315 7,797 8,814 9,696 16,027 3,897 4,143 5,239 5,615 5,598 7,993 9,146 10,143 13,574
24,407 26,963 29,515 30,956 33,297 40,659 50.635 56,886 71,085 (I 23) (144) (305) _ (406) (285) (779) (597) (857) (468)
(2,255) (2,409) (1,862) (160) 1,078 1,276 51 840 697
.22,029 24,410 27,348 30,390 34,090 41,156 50,089 56,869 71,314
PRODUCT BY EXPENDITURE SHARES, CY 1960-73 prices)
I 965-06 I 966-67 1967-08 1968-09 1969-70 1970-71 1971-72 1972-73
9.9 10.5 6.3 7.7 17.9 26.5 11.8 19.5
8.1 11.8 11.4 16.0 7.1 23.4 22.8 JO.I 8.5 9.9 10.4 11.1 12.9 15.3 I 7.7 i3 6.9 16.6 13.9 27.7 (4.8) 43.1 32.7 23.7 5.2 23.2 6.2 4.2 · 24.3 19.5 10.5 25.1 4.4 26.7 6.1 4.0 20.0 21.8 9.3 25.1 0.4 15. 7 . (4.7) 16.7 (10.6) 16.7 35.7 25.7
19.4 26.6 (0.6) 54.4 (45.6) 51.7 60.4 . 27.4 (5.0) 11.9 (6.4) 0.7 12.3 5.6 24.4 24.7 · 7.7 35.0 13.1 (3.0) 40.1 24.0 (I.I) 24.7
.12.6. (5.5) 7.4 6._5 70.1 1.7 20.9 25.6 16.6 3.9 (4.5) . (3.4) . 80.7 13.0 10.0 65.3 6.3
'26.5 7.2 0.3 42.8 · 14.4 10.9 33.8 10.5
{] 7.1) 9.5 4.9 7.6 22.1 24.5 12.3 25.0 (111.8) {] 3.3) 29.8 (173.3) 23.4. (43.6) 45A
10.8 12.0 1 I.I 12.2 20.7 21.7 13.5 25.4
105

Table 4.12 - GROSS NATIONAL PRODUCT BY · (At 1967 prices
Type of Expenditure .
. I. Personal consumption expenditures 2. General government consumption
expenditures A. Compensation of employees B. Other expenditures
3. Gross domestic capital formation A. Fjxed capital formation
I . Construction a. Government b. Private
2. Dllrablc equipment B. Increase in stocks·
4. Exports of go·ods and services 5. Less: Imports of goods and services
EXPENDITURES ON GROSS DOMESTIC PRODUCT
6. Net factor income from abroad 7. Statistical discrepancy
EXPENDITURES ON GROSS NATIONAL PRODUCT
1960 1961 1962 1963 1964
15;051 15,801 16,101 11,108 18,408
1,91 I 2,028-2,079 1,460 1,517 1,591
451 511 488 3,288 3,746 3,649 2,980 3,347 3,183 1,218 1,468 1;387
364 396 401 854 1,072 986
1,762 1,879 1,796 308 399 466
2,486 2,567 2,974 3,253 3,312 3,339
2,245 1,676
569 4,334 3,781 1,702
472 1,230 2,079
553 3,543 3,182
2,334 I ,75~
576 4,956 4,442 1,861
367 1,494 2,58 I
514 3,754 3,836
19,489 20,830 22,070 24,648 25,616 (331) (166) (66) (73) (95) (144) (435) .(644)(1,713)(2,086)
19,014 20,229 21,360 22,862 23,435
Table 4.13 - PER CENT GROWTH RATES OF GROSS NATIONAL ; (At I 967
Type of Expenditure I 960-6 I 1961-62 I 962-63 1963-64 1964-65
1. Personal consumption expenditures 4.9 5.7 6.0 4.0 4.9 2. General government consumption
expenditures 6.1 2.5 8.0 4.0 4.4 A. Compensation of employees 3.9 4.9 '5) 4.8 2.5 B. Other expenditures 13.3 (4.5) 16.6 1.2 10.1
3. Gross domestic capital fonnation 13.9 (2.6) 18.8 14.4 4.6 A. Fixed capital formation 1.2.3 (4.9) '18.8 I 7.5 4.6
I. Construction 20.5 (5.5) 22.7 9.3 I i.6 a: Government 8.8 1.3 17.7 (22.2) 24.5 b. Private 25.5 (8.0) 24:7 21.5 8.4
. 2. Durable equipment 6.6 (4A) 15.8 24.1 (0.4) B. Jncrcase in stocks 29.5 16.8 I 8.7 . , 7.1 4.5
4. Exports of goods and services 3.2 15.9 19.1 · 6.0 I 3.6 5. Less: Imports of goods and services 1.8 0.8 (4.7) 20.6 6.0
EXPENDITURES ON GROSS DOMESTIC PRoD·ucT 6.9 6.0 11.7 3'.9 5.9
6. Net factor income from abroad 49.8 60.2 (I 0.6) (30.1) (33. 7) 7. Statistical discrepancy
EXPENDITURES ON GROSS NATIONAL PRODUCT 6.4 5.6 . 7.0 2.5 5.2
Source: Statistics Office. National Economic" and Dr.vdopmcnt AuU10rity.
106
•

EXPENDITURE SHARES, CY 1960-73 in million pesos)
1965 1966 1967 1968 1969 · 1970 1971 1972 1973
19,319 20,313 21·,276 22,146 23,178 23,872 24,897 25,735 27,337
2,436 2,439 2.542 2,648 2,902 2,683 2,905 3,208 3,360 1,802 1,790 1,803 1,827 .1,871 1,888 1,923 2,025 2,173
634 649 739 821 1,031 795 982 1,183 1,187 5,184 5,274 6,259 6,482 6,506 6,390 6,667 . 6,820 7,429 4,647· 4,697 5,742 5,939 5,949 5,615 5,944 6,035 6,587 2,076 2,014 2,257 2,038 2,290 1,781 1,866 2,371 2,612
457 528 647 610 . 904 427 585 877 976 1,619 1,486 1,610 1,428 1,386 1,354 1,281 1,494 1,636
.2,571 2,683 3,485 3,901 3,659 3,834 4,078 3,664 3,975 537 577 517 543 557 . 775 723 785 842
4,264 '4,525 4,676 4,258 4,040 4,437 4,924 5,815 6,360 4,068 4,263 5,239 5,638 5,489 5,037 4,836 4,804 5,423
27,135 28,288 29,514 29,896 31,137 32,345 . 34,557 36,774 39,063 (127) (149) (305) (41 I) (282) (480) (310) (382) (205)
- · (2,358) (2,299) (1,861) (704) (387) 326 (57) (779) 244
24,650 25,840 27,348 28,78·1 .30,468 32;191 34,190 35,613 39,102
PRODUCT BY EXPENDITURE SHARES, CY 1960-73 prices)
1965-66 1966-67 1967-68 1968-69 1969-70 1970-71 1971-72 1972-73
5.1 4.7 4.1 4.7 3.0 43 3.4 6.2
0.0 4.2 4.2 9.6 (7.5) 8.3 10.4 4.7 (0.7) 0.7 1.3 2.4 0.9 1.9 5.3 7.3 2.4 13.9 I 1.1 25.6 (22.9) 23.5 20.5 0.3 1.7 . 18.7 3.5 0.4 (1.8) 4.3 2.3 8.9 I.I 22.2 3.4 , 0.2 (5.6) 5.9 1.5 9.1
(3.0) 12.1 (9. 7) 12.4 (22.2) 4.8 27.1 10.2 15.5 22.5 (5.7) 48.2 (52.8) 37.0 49.9 11.3 (8.2) 8.3 (1 1.3) (2.9) (2.3) (5.4) 16.6 9.5 4.4 29.9 11.9 (6.2) (4.8) 6.4 (I 0.2) 8.5 7.4 (10.4) 5.0 2.6 39.1 (6.7) 8.6 7.3 6.1 3.3 (8.9) (5. I) 9.8 11.0 18.1 ,9.4 4.8 22.9 . 7.6 (2.6) (8.2) (4.0) (0.7) 12.9
4.2 4.3 1.3 4.2 3.9 6.8 6.4 6.2 (17.3) (I 04. 7) (34.8) 31.4 (70.2) 35.4 (23.2) 46.3
48 5.8 5.2 5.9 5.7 6.2 4.2 9.8
0
107

0 -
l
Table 4.14 - SEMESTRAL ESTIMATES: GROSS NATIONAL PRODUCT BY INDUSTRIAL ORIGIN,
(At_ current prices
1967 1968 1969 Industry/Item 1st Sem. 2nd Sem. 1st Sem. 2nd Sem. -lst Sem.
I. Agriculture, fishery & forestry 3,374 . 4,401 ·4,189 4,852 · 4,690 2. Mining and Quarrying 177 · 171 206 212 230 3. Manufacturing 2,083 2,191 2,275 2,417 2,537 4. Construction 508 372 476 362 419 S. Transport, communication, storage
and uti1ities 467 461 505 515 537 6. Commerce 1,771 1,830 1,870 1,972 1,962 7. Services 2,703 2,864 2,995 3, l l l 3,237
NET DOMESTIC PRODUCT at factor cost 11,083 12,290 12,516 13,441 13,612
8. Net factor income from abroad (140) (165) (218) (l 88) (132) NET NATIONAL PRODUCT or
NATIONAL INCOME 10,943 12,125 12,298 13,253 13,480 9. Indirect taxes net of subsidies 1,020 983 1,095 1,109 1,182
l 0. Capital consumption allowance 1,131 1,146 1,301 1,334 1,503 GROSS NATIONAL PRODUCT· 13,094 14,254 · 14,694 15,696 16,165
Source: St1ti~tics Office. National Economic ■nd_ Dcvclpment Authority.
TABLE 4.15 - SEMESTRAL ESTIMATES: GROSS NATIONAL PRODUCT, BY INDUSTRIAL ORIGIN, 1ST SEMESTER
(At l 967 prices
Industry/Item 1967 1968 1969 1st Sem. 2nd ·sem. 1st Sem. 2nd Sem. 1st Setn.
l. Agriculture, fishery & forestry 3,525 4,250 3,888 4,413 4,101 2. Mining and quarrying 177 171 189 218 213 3. Manufacturing 2,083 . 2,191 2,225 2,345 2,415 . 4. Construction 508 372 -426 ·324 355 5. Transportation", communication,
storage and utilities 467 461 478 490 498 . 6. Commerce 1,778 1,823 I,853 1,938 1,929
7. Services 2,703 2,864 2,857 2,903 2,950 NET DOMESTIC PRODUCT
at factor cost 11,241 12,132 11,916 I 2,631 12,461 8. Net •factor income from abroad (140) (165) (221) (! 90) . (133)
NET NATIONAL PRODUCT or NATIONAL INCOME 11,101 l l ,967 l l ,695 12,441 12,328
9. Indirect taxes net of subsidies 1,020 983 1,042 1,042 1,079 I 0. Capital consumption allowance l, 13 l 1,146 1,268 1,293 1,407
GROSS NATIONAL PRODUCT 13,252 14,096 14,005 14,776 14,814
Source: Stati~tics Office. National Economic and DcvdopITlcnt Authority.·
108

~ • (, ~ r
PRODUCT. NATIONAL INCOME AND NET DOMESTIC I ST SEMESTER 1967 TO 2ND SEMESTER I 973
l in million pesos)
l, 1970 1971 1972 1973 · 2nd Sem. I st Sem. 2nd Sem. 1 st Sem. 2nd Sem. 1st Sem. 2nd Sem. I st Sem. 2nd Sem.
~ 5,915 5,873 6,587 7,095 8,090 7,939 9,078 9,438 11,547 300 408 437 438 486 516 536 750 942
• 2,536 3,108 3,368 3,736 4,072 4,540 4,439 5,599 6,664 560 · 438 438 502 519 637 749 804 9_38
541 629 634 716 735 833 828 958 1,016 2,113 2,336 2,553 2,786 3,077 3,339 3,409 3,619 4,524 3,408 3,627 3,870 4, 13_2 4,383 4,895 4,849 5,282 5,560
15,373 16,419 17,887 19,405 21,362 22,699 23,888 25,450 31,191 (153) (195) (584) (286) (311) (412) (445) (400) (68)
15,220 16,224 17,303 19,119 21,051 22,287 23,443 26,050 31,123 1,115 1,55_7 1,910 2,154 2,330 2,358 2,432 3,276 3,282 1,590 1,892 2,270 2,624 2,811 3,119 3,230 3,592 3,991
17,925 19,673 21,483 23,897 26,192 27,764 29,105 32,918 38,396
NATIONAL INCOME, AND NET DOMESTIC PRODUCT
1967 TO 2ND SEMESTER I 973 in million pesos)
1970 1971 1972 1973 2nd Sem. 1 st Sem. 2nd Sem. 1st Sem. 2nd Sem. 1 st Sem, 2nd Sem. 1st Sem. 2nd Sem.
4,721 4,309 4,653 4,363 4,571 4,380 4,568 4,591 4,968 255 269 289 311 339. 326 360 375 357
2,396 2,552 2,556 2,712 2,785 2,917 2,849 3,362 3,165 ~
· 465 355 334 380 391 467 547 575 670
501 530 533 570 584 611 606 637, 669 2,006 2,049 2,100 2,144 2,213 2,312 2,282 2,403 2,500 3,005 3,081 . 3,115 3,187 3,237 3,401 3,334 3,511 3,590
13,349 13,145 13,580 13,667 14,120 14,476 14,547 15,454 15,929 (149) (140) (340) · (162) (148) (192) (190) (163) (42)
13,200 13,005 13,240 13,505 13,972 14,284 14,356 15,291 15,877 966 1,247 1,450 1,517 1,540 1,504 1,470 1,914 1,675
1,488 1,580 1,669 1,801 1,855 1,977 2,022 2,143 2,202 15,654 15,832 16,359 16,823, 17,367 · 17,765 17,848 19,348 19,754
109

• --- f . , . . ,,. TABLE 4,16 - SEMESTRAL ESTIMATES: GROSS NATIONAL PRODUCT BY
(At current prices
Type of Expenditure 1967 1968 1969 1st Sem. 2nd Sem, 1st Sem, 2nd Sem. 1st Sem.
1. Personal consumption expenditures 10,563 10,713 11,207 I 1,419 I 1,878 2. General government consumption
expenditures 1,204 1,338 1,346 1,487 · 1,530 A. Compensation of employees 849 954 955 1,036 1,048 B. Other expenditures 355 384 391 451 482
3. Gross domestic capital formation 3,219 3,041 3,249 3,398 3,214 .A. Fixed capital formation 2,970 2,773 2,985 3,107 2,926
I. Construction 1,302 955 1,221 929 1,074 a. Government 375 272 341 302 369 b. Private 927 683 880 627 705
2. Durable Equipment 1,668 1,818 1,764 2,178 1,852 B. Increase in stocks 249 268 264 291 288
4. Exports of goods and services 2,280 2,396 2,223 2,242 2,120 5. Less: Imports of goods and
services 2,519 2,720/ 2,725 2,890 2,847 EXPENDITURES ON GROSS
DOMESTIC PRODUCT 14,747 14,768 15,300 I 5,656 15,895 6. Net factor income from abroad (140) (165) (218) (188) (132) 7. Statistical discrepancy (1,5 I 3) (349) (388) 228 402
EXPENDITURES ON GROSS NATIONAL PRODUCT 13,094 14,254 14,694 I 5,696 16,165
Source: S_latislics Offir.r., Niltiunal 1-:r.onomic and Dcvdopment Authority.
Table 4. I 1 - SEMESTRAL ESTIMATES: GROSS NATIONAL PRODUCT _BY (At I 967 prices in
Type of Expenditure· 1967 1968 1969 I st Sem. 2nd Sem. I st Sem. 2nd Sem. 1st Sem.
I. Personal consumption expenditures 10,563 10,113 10,995 I I .15 I I 1,508
' 2. General government consumption
/ expenditures 1,204 1,338 1,283 1,365 1,404 A. Compensation of employees 849 954 907 920 931 B. Other expenditures 355 384 376 445 473
3. Gross domestic capital formation 3,240 3,019 3,174 3,308 3,058 A. Fixed capital formation 2,991 2,751 2,915 3,024 2,984
I. Construction !,302 955 1,161 877 984 . a. Government 375 272 327 283 340
b. Private 927 683 834 594 644 2. Durable equipment 1,689 1.796 I ,754 2,147 1,800
B. Increase in stocks 249 268 259 284 274 4. Exports of goods and sCrv(ces 2,322 2,354. 2,050 2,208 2,012 S. LesS: Imports of goods and serviCes 2,535 2,704 2,735 2,903 2,833
EXPENDITURES ON GROSS DOMESTIC PRODUCT 14,794 14,720 14,767 15,129 I 5,149
6. Net factor"incomc from abroad (140) (165) (221) (190) (133) 7. Statistical discrepancy (1,402) (459) · (541) (I 63) (202)
·EXPENDITURES ON GROSS NATIONAL PRODUCT I 3,252 14,096 14,005 14,776 14,814
Sourec: Statistir.s office, National Economic and Dc\·elopmcnl Aulhorily.
I I 0

EXPENDITURE SHARES, !ST SEMESTER 1967 TO 2ND SEMESTER 1973 in million pesos)
1970 1971 1972 1973 2nd Sem. I st Sem. 2nd Scm. I st Sem. 2nd Scm. 1st Scm. 2nd Sem. 1st Sem. 2nd Sem.
12,491 13,534 I 5,195 17,166 19,177 , 20,168 20,474 . 2 J,576 29,972
' 1,757 1,673 1,848 2,023 2,321 2,504 2,829 2,859 3,014 1,164 I, I 7 I 1,327 I ,345 1,535 1,670 1,720 1,702 1,767
593 502 521 678 786 834 I, 109 1,157 1,247 3,710 4,229 4,376 5,086 5,194 5,527 5,831 6,457 7,754 3,407 3,742 3,858 4,593 4,665 4,906 5,216 5,714 6,944 1,436 · 1,12_2 1,122 I ,287 1,332 1,634 1,920 2,062 2,406
624 234 306 456 363 644 670 738 936 812 888 816 831 969 990 I .250 1,324 . 1,470
1,971 2,620 2,736 3,306 . 3,333 . 3,272 3,296 3,652 4,538 303 487 518 493 529 621 615 . 743 810 -
2,195 3,425 4,372 4.319 4,501 4,342 5,354 7,891 8,136
2,75 I . 3,723 4,270 '4,319 4,827 4,856 5,287 5,726 7,848
17,402 19,138 21,521 24,269 26,366 27,685 29,201 33,057 38,028 (I 53) (I 95) (584) (286) (3 I I) (412) (445) (400) (68) 676 730 546 (86) 137 491 349 261 436
17,925 19,673 21,483 23,897 26,192 27,764 29,105 32,918 ·38,396
EXPENDITURE SlJARES, !ST SEMESTER 1967 TO 2ND SEMESTER 1973
million pesos)
1970 1971 1972 \973 2nd Scm. 1st Sem. 2nd Sem. I st Sem. 2nd Sem. I st Scm. 2nd Sem. I st Sem .. 2nJ Sem.
11,670 I I ,841 12,031 12,284 12,613 12,848 12,887 13,423 13,914
1,498 1,354 l,32~ 1,432 1,473 I ,SI 3 1,695 1,698 1,662
940 945 943 961 962 998 1,927 1,063 1,110
558 409 386 471 SI I SIS 668 635 552 3,448 3,291 3,099 3,429 3,238 3,366 3,454 3,627 3,802 3,165 2,904 2,711 3,072 2,872 2,966 3,069 3,199 3,388 1,306 · 916 865 940 926 1,099 1,272 1,293 1,319
564 191 236 333 252 433 444 463 513 742 725 629 607 674 666 828 830 806
1,859 1,988 1,846 2,132 1,946 1,867 1,797 1,906 2,069 283 387 · 388 357 366 400 385 428 414
2:028 1,999 2,438 2,353 2,571 2,530 3,285 3,542 2,818 2,656 2,558 2,479 2,42~ 2,414 2,357 2,447 2,462 2,961
15,988 I 5,927 16,418 17,076 I 7,481 17,900 18,874 19,828 19,235 (149) (140) (340) (162) (148) (192) (190) (163) (42)
(1851 45 281 (91) 34 57 (836) (317) 561
15,654 15,832 '16,359 16,823 17,367 17,765 17,848 19,348 19,754
I I I

Table 5.1
Figure 5.1 Figure 5.2
Table 5.2
Figure 5·.3
Table 5.3 Table 5.4
Table 5.5
Table 5.6
Table 5.7
Table 5.8
Table 5.9
Table 5.10
Table 5.11
Table 5.12 Table 5.13
Table 5.14
Table 5.15
Table 5.16
CHAPTER V AGRICULTURE
Quantity and Value of Production by Kind of Crop, Philippines: Crop Year 1929-73 Over-all Crop Production: Crop Year 1946-73 Palay and Corn Production and Area Harvested: Crop Year 1960-73 Area Harvested and Average Yield by Kind of Crop, Philippines: Crop Year 1929-73 Coconut, Sugar Cane, Banana Production and Area Harvested: Crop Year 1960-73 Size of Farm by Major Crop Category: CY 1960 and 1970 Number and Area of Farms by Type of Tenancy: CY 1960 and 1970 Number and Area of Farms by Type of Land Tenure: CY 1960 and 1970
Area Transferred and Number of Tenants-Recipient by Land Size Category as of June 14, 1974 Agricultural Loans Granted and Outstanding by Financial In-stitutions: CY 1953-73 Population and Inventory Value of Poultry on Farm by Kind: CY 1950-73
Livestock on Farm: Animal Population and Inventory Value by Kind: CY 1950-73.
Livestock and Poultry: Number and Dressed Weights of Animals Slaughtered by Kind: CY 1955-71 Monthly Averages of Daily Minimum and Maximum Tempera-tures in the Philippines by Key Station: CY 1958-73 Normal Rainfall in the Philippines by Key Station: CY 1965-73 Monthly and Annual Frequencies of Tropical Cyclones in the Philippine Area of Responsibility: CY 1948-72 Monthly and Annual Frequencies of Typhoons in the Philippine Area of Responsibility: CY I 948-72 Monthly and Annual Frequencies of Tropical Storms in the Philippine Area of Responsibility: CY 1948-72
Monthly and Annual Frequencies of Tropical Depressions in the Philippine Area of Responsibility: CY 1948-72
116 128
129
132
138 ■ 141
141
142
142
143
145
146
148
150 162
166
167
168
169

CHAPTER V AGRICULTURE
The present chapter presents basic statistics on the agricultural sector. Included are time series 'data on the quantity and value of production for, each major crop; hectarage and average yield; farm characteristics; population a!]d inventory value of poultry and livestock herd, number and dressed weights of animals slaughtered, total area transferred to tenants under the land reform program and agricultural loans granted and outstanding by financial institutions.
The Bureau of Agricultural Economics (BAEcon) is the primary source of all statistics of various characteristics of the agricultural sector. Through· its Integrated Agricultural Surveys (!AS),· formerly the Annual, Crop and Livestock Survey (CLS) until I 966, it gathers information on area with emphasis on rice and corn hectarage, quantity and value of crop production, number and value of livestock and poultry population and meat production.
Data collection under the CLS was done annually using the interview method among a sample of about 6,000 farm households throughout the country. These data were published in the Crop and Livestock Statistics Bulletin until it stopped publication in 1965 and the more important series were published in the Philippine Agricultural Situation. Through the years, improvements in the sampling design and the phases of the CLS led to what is now known as the !AS starting in
, crop year 1966-67. In effect !AS integrated four different surveys, namely; (I) CLS, (2) Crop Forecasting Survey, (3) Survey on Prices Paid and Received by Farmers, and ( 4) Farm Wages Survey which were formerly treated as independent operations conducted at different periods or seasons of the year.
The !AS has been conducted quarterly: (I) the first round in October; (2) the second round in January; (3) the third in April; and (4) the fourth round in June. The first three rounds which cover a sub-sample equivalent to 1/4 of the total number of sample barrios in the final round in June, are aimed to collect indicators on crop production for purposes of forecasting and data on. farm prices and wages. The final round was designed to provide final estimates of crop production, numbers of livestock and poultry, as well as information on utilization of farm inputs and on palay and corn stock disposition.
Geographically, the !AS covers ·the eleven regions of the country. Each province is treated as an independent domain. However, the
114

provinces of Batanes, Palawan and Stilu are excluded from the Survey due to administrative and operational difficulties. Estimates for these provinces are obtained through special arrangements with other agencies of the Department. ,
' Statistics on crops 'including estimates of area planted, yield and value, and quantity of production of the major crops, are tabulated by region. Included also are statistics on the regional estimates of the population and value of livestock and poultry; production of milk, eggs, and other dairy and poultry products; and the number and dressed weights of livestock and poultry slaughtered on farms.
Data on the number of animals slaughtered and their corresponding dressed weights are compiled by the Bureau of Animal Industry.
Another important source of material on agriculture is The Raw Material Resources Survey Bulletin, Series No. I, published by · the National Economic Council in June 1959. The National Census and Statistics Office also collects data by means of agricultural censuses conducted at irregular intervals. Farm characteristics collected include: (I) area and number of agricultural holdings classified into different types; (2) aggregate area of field crops and number of holdings reporting them; (3) area and number of trees and vines of productive age and number of agricultural holdings reporting them; (4) number of livestock herd at a specific_ date; (5) area planted and production during the crop year of key food and commercial crops; (6) value and quantity of egg and milk production.
Information on climatic conditions are ·also included in this sector as they affect crop production. Some of these are data on frequency of depressions, tropical cyclones, typhoons and tropical storms. Normal rainfall and minimum and maximum temperatures for the 12 key stations in the country are also presented. Data on climatic conditions are compiled by the Philippine Atmospheric,· Geophysical and Astronomical Services Administration (PAGASA).
115

r
Table 5.1 - QUANTITY AND VALUE OF PRODUCTION (Quantity in thousand metric
. Commercial
Crop Total Crops2 ·)
Food Crops- Crops2 Palay Year
Quantity Value ('uantity Val tie Quantity Value Quantity Value
1929 4,728.0 509.0 3.1 '.!.0.2 255.3 1,607.8 253.7 2,190.6 I 93.4
1930 4,854.1 470.8 3,236.9 250.3 1,617.2 220.5 2,269.8 185.6 1931 4,645.0 349.5 3,134.2 186.0 1,510.8 I 63.5 2,184.2 129.8 1932 4,829.6 291.6 3,169.1 135.3 1,660.5 156.5 2,080.8 89.6 1933 5,044.6 275.7 3,166.5 I 29.0 1,878.1 146.7 2,105.1 86.8 1934 5,579.5 338.2 3,376.9 144.9 2,202.6 193.3 2,332.1 104.7
1935 4,404.8 254.9 2,932.0 127.8 l .472.8 I 27. l 2,016.3 92.8 191!, 4.648.1 341.2 2,837.3 156.7 1,810.8 184.5 1,857.7 118.8 1937 5,360.2 376.2 3,499.5 176.6 1,860.7 199.6 2,420.7 134.4 1938 5,386.4 395.9 3,452.6 181.3 1,933.8 214.6 2,303.2 136.4 19399 5,251.2 348.3 3,518.3 208.0 1,732.9 140.3 2,296.5 152.2
1940 2,934.9 175.5 2,934.9 175.5 n.a. n.a. 2,362.7 15 l.7 1941 2,915:5 151.6 2,915.5 15 l .6 n.a. n.a. 2,381.7 151.6 1942 3,024.7 151.6 3,024.7 15 l .6 n.a. n.a. 2,44 I. 7 15 l .6 1943 n.a. n.a. n.a. n.a. n.a. n.a. n.a. n.a. 1944 n.a. n.a. n.a. n.a. n.a. n.a. n.a. n.a.
1945 n.a. n.a. n.a. n.a. n.a. n.a. n.a. n.a. 1946 3,022.7 1,005.9 2,707.3 897.8 315.4 108.1 1,623.3 664.4 1947 4,679.3 1,270.7 3,444.1 937.9 1,235.2 332.8 2,088.2 679.5 1948 5,104.8 1,324.6 3,649.3 897.0 1,455.4 427 .. 6 2,240.9 656.4 1949 5,496.4 1,449.2 3,945.1 970.6 1,55 l.4 478.6 2,49 l.3 735.5
1950 5,888.8 1,497.9 4,275.8 1,014.9 1,613.0 483.0 2,606.1 768.6 1951 6,652.5 1,637.5 4,418.6 1,021.7 2,233.9 615.8 2,616.4 694.7 1952 6,962.0 1,553 .. 2 4,996.8 1,084.8 1,965.2 468.4 2,830.7 695.3 1953 7,909.4 1,541.2 5,781.2 979.4 2,128.2 561.8 3,144.2 678.1 1954 8,456.4 1,523.5 5,979.1 916.1 2,477.3 607.4 3,182.4 599.5
1955 8,632.8 1,559.5 ts,044.2 935.8 2,588.6 623.7 3,202.9 612.1 1956 8,858.2 1,565.1 6,348.0 975.3 2,510.2 589.8 3,273.3 609.4 1957 9,135.5 1,640.4 6,470.2 997.4 2,665.3 643.0 3,345.9 621.3 1958 9,504.3 1,797.2 6,377.6 1,007.4 3,126.7 789.8 3,203.5 635.2 1959 10,l 10.4 1,808.7 7,008.0 1,099.4 3,102.4 709.3. 3,684.5 705.4
116

BY KIND OF CROP, PHILIPPINES: CROP YEAR 1929-731 tons; value in million pesos)
Crop Corn Banana Mango
Year Quantity Value Quantity Value Quantity Value
1929 350.1 24.4 186.7 18.9 23.5 3.4
1930 361.3 24.9 219.0 20.6 25.4 3.6 1931 338.6 15. 7 214.7 20.0 27. I 3.7 1932 407.6 10.8 214.8 I 6.4 27.0 3.4 1933 412.5 12.6 187.6 14.7 26.8 3.1 1934 338.7 11.4 196.3 13.5 27.2 2.9
1935 295.5 11.7 144.1 8.7 21.0 '2.1 1936 363.1 15.7 . 139.2 8.0 20.0 1.9 1937 437.7 18.0 166.7 9.6 20.l 1.9 1938 500.6 19.4 167.5 10.3 20.7 2.2 19399 459.1 18. 7 147.2 8.3 36.3 2.9
1940 572.2 23.8 n.a.· n.a. n.a. n.a. 1941 533.8 n.a. n.a. n.a. n.a. n.a. 1942 583.0 n.a. n.a. n.a. n.a. n.a. 1943 n.a. n.a. n.a. n.a. n.a. n.a. 1944 n.a. n.a .. n.a. n.a. n.a. n.a.
1945 . n.a. n.a . n.a. n.a. n.a. n.a. 1946 331.3 93.1 139.3 30.0 28.1 16.5 1947 472.2 99.4 184.5 44.2 37.1 14.6 1948 519.0 99.0 138.7 31. 7 28.0 15.5 1949 534.1 106.9 153.9 3 l.2 27.4 9.4
1950 573.7 89.4 161.4 37.8 27.4 11. 7 1951 603.2 107.7 184.7 45.2 27.1 15.6 1952 761.9 127.9 204.6 49.1 30.1 17.1 1953 709.5 98.7 263.0 21.0 45.0 14.4 L954 780.9 107.6 273.6 20.2 48.5 15.6
1955 770.1 l06.0 294.8 21.3 50.4 17.7 1956 907.4 1 I 6.1 303.2 21.9 52.5 17.2 1957 895.4 114.5 3 I 9.1 23.1 53.0 17.5 1958 852.1 106.6 340.6 25.0 56.7 18.7 1959 1,015.9 132.5 335.9 27.9 54.6 I 7.3
11 7
Other Fruits Pineapple and Nuts3
Quantity Value Quantity Value
11.9 0.4 54.0 2.7
12.1 0.4 55.1 3.0 12.5 0.4 55.3 2.8 21.0 0.6 56.7 2.4 . 14.8 0.4 59.5 2.4 15.0 0.3 55.9 2.3
20.2 0.5 47.3 2.2 21.9 0.6 46.2 2.1 21.8 0.6 45.4 2.2 24.6 0.9 45.5 2.1 28.1 0.8 75.0 5.5
n.a. n.a. n.a. n.a. n.a. n.a. n.a. n.a. n.a. n.a. n.a. n.a. n.a. n.a. n.a, n.a.
· n.a. n.a. n.a. n.a.
n.a. n.a. n.a. n.a. 14.0 2.0 79.2 . 23.5 21.2 2.9 95./5 23.5 38.9 3.7 79.9 18.1 35.2 4.6 79.9 14.9
56.5 8.5 80.6 17.2 67.6 12.2 83.9 19.6 74.8 13.5 94.1 21.6 92.J 13.8 · I 28.7 21.4 99.3 14. 7 138.7 22.5
I 03.3 14.6 147.0 25.1 107.1 14.9 152. 1 28.2 108.4 15.1 157.8 29.4 115. 7 16.4 165.0 29.6 106.9 15.5 I 57 .8 27.4

Table 5.1 ~ QUANTITY AND VALUE OF PRODUCTION BY (Quantity in thousand metric.
Commercial Crop Total Crops2 Food Crops2 Crops2 Palay
Year Quantity Value . Quantity Value Quantity Value Quantity Value
1960 10,411.2 2,045.9 7,315.1 1,168.1 3,096.1 877.8 3,739.5 711.9 1961 10,414.8 2,142.3 7,390.6 1,362.5 3,024.2 779.8 3,704.8 838.3 1962 11,349.8 2,448.4 7,830.4 I ,438.2 3,519.4 1,010.2 3,910.1 902.3 1963 11,769.4 2,734.8 7,973.9 l ;539.9 3,795.5 1,194.9 3,967.0 948.8 1964 12,185.1 3,146.1 8,288.3 1,840.2 3,896.8 1,305.9 3,842.9 1,148.2
1965 12,242.8 3,278.4 8,478.9 . 1,965.3 3,763.9 l,3'13.1 3,992.5 1,227.7 1966 12,192.7 3,644.8 8,598.2 2,172.7 3,594.5 1,472.1 4,072.6 1,314.0 1967 12,627.2 4,216.8 8,751.7 2,450.0 3,875.5 1,766.8 4,094.0 1,381.4 1968 13,242.1 5,155.2 9,294.0 3,116.7 3,948.1 2,038.5 · 4,560.7 l·,858.1 1969 13,264.2 5,728.0 9,345.6 3,446.0 3,918.6 2,282.0 4,444.7. 1,717.9
1970 !'5,200.7 8,099.9 10,670.1 4,750.3 4,530.6 3,349.6 5,233.4 2,073.7 1971 15,621.4 9,143.9 I 0, 773.8 5,559.2 4,847.6 3,584.7 5,342.9 2,490.2 1972 15,192.9 10,305.1 I 0,625.0 6,741.6 4,567.9 3,563.5 5,100.1 3,190.1 1973P 15,079.5 10,742.7 9,877.7 6,258.3 5,201.8 4,484.4 4,414.6 2,650.0
118

KIND OF CROP, PHILIPPINES: CROP YEAR 1929-731 (continued) tons; value in million pesos)
Other Fruits · Corn Banana Mango Pineapple and Nuts3
Quantity Value Quantity Value Quantity- Value Quantity Value Quantity Value
1,165.3 149.7 307.3 24.l 57.6 13.9 133.9 19.5 176.6 31.4 1,209.6 187.9 349.0 34.1 59.3 10.5 115.8 17.0 176.6 30.9 1,266.3 171.3 524.9 38.3 66.1 13.2 139.6 19.5 203.0 35.8 1,272.8 188.4 556.9 48.5 92.3 23.0 151.4 21.7 205.0 36.2 1,292.7 262.8 754.9 42.1 95.1 21.0 155.7 22.3 213.4 38.6
1,312.7 272.8 684.8 44.1 129.4 27.6 176.1 25.3 223.2 41.3 1,379.8 310.5 682.7 73.8 131.5 32.9 188.2 27.7 · 235:5 48.3 1,489.9 328.3 765.4 114.3 134.1 44.8 208.1 42.8 245.2 70.1 1,619.2 347.4 780.6 150.3 126.5 54.3 226.0 65.2 238.3 88.7 1,732.8 403.8 _7.46.-9- -- 310.4 · 140.6 92.7 238.4 83.0 247.4 127.5
---_ ___,_ ........ -_,.- ~2',008.2 525.9 896.0 656.9 151.7 142.9 233.4 109.5 288.4 212.5
2,005.0 720.9 1,034.8" 811.8 !37.5 127.0 234.3 121.4 256.6 198.5 2,012.6 1,043.5 980.1 781.2 I 39.1 123.4 282.1 146.6 337.2 288.2 1,831.1 828.2 1,012.6 814.7 187.6 180.0 293.4 166.4 309.8 284.6
119

Table 5.1 - QUANTITY AND VALUE OF PRODUCTION BY KIND
(Quantity in thousand metric
Crop Citrus4 Rootcropss Vegetables incl. Beans and
Onions and Potato" Peas7
Year Quantity Value Quantity Value Quantity Value Quantity Value
1929 1 1:2 0.9 256.7 5.6 17.6 1.4 11.3 1.5
1930 11.5 0.9 246.9' 5.8 19.7 1.6 9.3 1.2 1931 11.4 0.9 248.9 6.8 24.4 1.7 I 0.1 1.6 1932 11.6 0.9 305.8 6.5 27.0 1.4 10.2 1.3 1933 11.6 0.8 308.0 4.2 24.8 1.2 9.7 l.2 1934 11.3 0.7 359.4 5.3 . 24.9 1.2 10.6 1.1
1935 9.9 0.6 336.7 5.5 28.6 1.4 7.6 1.0 1936 9.4 0.5 336.4 5.4 30.6 1.5 7.6 0.8 1937 11.1 0.7 333.5 5.5 30.6 1.5 6.4 0.7 1938 10.7 0.6 334.8 5.4 31. 7 - ·-1~6~.6 0.9 l939~ 18.3 1.0 414.4 14.1 24.3 1. 7 1 :r----l,3_ ~ , __________
1940 n.a. n.a. n.a. n.a. n.a. n.a. n.a. n.a. 1941 n.a. n.a. n.a. n.a. n.a. n.a. n.a. n.a. 1942 n.a. n.a. n.a. n.a. n.a. n.a. n.a. n.a. 1943 n.a. n.a. n.a. n.a. n.a. n.a. n.a. n.a. 1944 n.a. . n.a. n.a . n.a. n.a. n.a. n.a. n.a.
1945 n.a. n.a. n.a. n.a. n.a. n.a. n.a. n.a. 1946 18.9 6.7 434.1 47.2 24.7 7.7. 6.7 1947 24.3 8.1 469.2 41.5 33.0 9.5 8.5 5.5 1948 18.5 6.4 528.9 43.1 35.3 9.6 9.2 4.9 1949 I 9.1 . 5.1 528.2 38.1 45.6 9.2 14.2 6.8
1950 19.8 5.2. 664.3 47.0 52.5 11. 7 15.4 7.4 . ◄ 1951 21.1 7.1 698.6 63.4 71.3 21.1 22.0 14.7
1952 20.2 7.2 815.7 77.8 103.6 28.0 38.2 24.3 1953 27.5 8.0 1,135.4 46.2 171.9 40.1 35.8 17.6 1954 30.0 9.2 1,180.0 4,8.3 177.2 39.4 39.0 19.2
1955 31.5 9.7 1,200.0 50.7 173.4 38.3 40.0 19.4 1956 32.8 10.1 1,260.8 77.8 185.5 39.9 42.0 20.1 1957 34.3 11.1 1,292.0 80.4 187.2 42.5 44.1 20.6 1958 36.2 11.1 1,330.0 74.1 194.7 42.8 47.8 23.0 1959 37.0 11.4 1,339.5 69.1 190.3 42.6 49.1 23.4
@) 1
120

OF CROP, PHILIPPINES: CROP YEAR 1929-731 (continued)
_tons; value in million pesos)
Other Food Coffee Cacao Peanuts Crops Coconut8
Quantity Value Quantity Value Quantity Value Quantity Value Quantity Value
1.3 0.9 1.2 1.2 4.1 0.6 • n.a. n.a. 480.2 67.5
1.4 0.9 1.2 1.2 4.2 0.6 n.a. n.a. 460.J 57.5 1.4 0.9 1.2 I. I 4.4 0.6 n.a. n.a. 419.6 33.6 I. I 0.6 LO 0.9 4.5 0.5 n.a. n.a. 406.2 26.0 1.0 0.5 0.9 0.7 4.2 0.4 n.a. n.a. 472.5 23.1 1.0 0.5 0.9 0.7 3.6 0.3 n.a. n.a. 475.2 I 9.5
0.7 0.4 0.8 0.6 3.3 0.3 n.a. n.a. 539.7 37.9 0.7 0.4 0.8 0.6 3.7 0.4 n.a. n.a. 650.9 51.3 0.9 0.5 0.8 0.6 3..8 0.4 n.a. n.a. 521.9 62.4 1.0 0.5 0.9 0.6 3.8 0.4 n.a. . n.a. 697.8 76.3 2.0 0.7 0.5 0.3 6.5 0.5 n.a. n.a. 504.4 19.6
n.a. n.a. n.a. n.a. n.a. n.a. n.a. n.a. n.a. n . .a. n.a. n.a. n.a. n.a. n.a. n.a. n:a. n.a. n.a. n.a. n.a. n.a. n.a. n.a. n.a. n.a. n.a. n.a: n.a. n.a. n.a. n.a. n.a. n.a. n.a. n.a. n.a. n.a. n.a. n.a. n.a\ n.a. n.a. n.a. n.a. n:a. n.a. n.a. n.a. n.a.
n.a. n.a. n.a. n.a. n.a. n.a. n.a. n.a. n.a. n.a. 3, I 4.0 0.6 1.5 3.0 2.2 n.a. n.a. 203.8 22.7 4.4 5.8 0.8 1.5 5.1 1.9 n.a. n.a. 1,007.2 233.9 3.9 4.8 0.17 1.3 7.4 2.5 n.a. n.a. 928.0 282.6 3.8 4.4 0.7 1.4 9.6 3.1 2.1 n.a . 756.9 263.0 . 4.0 4.8 0.7 1.5 12.3 4.1 I.I n.a. 8116. I 260.8
,Ac~•.-· J J .7 0.8 3.0 I 6.1 5.7 1.2 n.a. I ,137.9 307.5 __.,,--- 5 .0 I 2. 7 1.3 4.9 15.4. 5.4 1.2 n.a. 800.6 153.3
5.7 9.5 1.3 3.9 17.0 6.4 4.1 0.3 901.7 246.9 6.1 9.4 1.4 4.2 17.5 5.9 4.5 0.4 984,5 211.2
7.0 10.6 1.5 4.5 17.6 5.4 4.7 0.4 1,142.9 241.4 7.1 9.5 1.5 4.1 17.9 5.7 4.8 0.4 1,182.0 255.5 8j 11.1 1~6 4.6 18.2 5.8 4.9 0.4 1,373.0 299.9 9.6 I 3.5 I. 7 4.9 • \.J 8,6 6.1 . 5.4 0.4 1,349.4 376.9
10.6 16.2 I. 7 \5.b -~16.4 · 5.1 7.8 0.6 1,122.0 255.4
121

Crop Year
1960 . 1961
1962 1963 1964
1965 1966 1967 1968 1969
1970 1971
. 1972 )973P
Table 5.1 - QUANTITY AND VALUE OF PRODUCTION BY KIND (Quantity in thousand metric
Vegetables incl. Beans and· Citrus4 _Rootcrops5 Onions and Potato6 Peas7
Quantity Value Quantity Value Quantity Value Quantity . Value
43.3 10.6 1,411.6 84.4 185.2 45.6 42.3 23.3 53.1 15.1 1,445.3 113.9 165.0 45.2 33.4 I 9.1 62.1 13.8 1,334.1 111.8 · 197.4 55.0 33.1 17.8 62.1 15.4 1,360.4 I 2 I. I 182.2 50.3 · 31.3 16.4 61.4 I 5.3 1,552.5 143.7 190.4 -54_2 27.4 14.8
70.8 . 17.5 1,536.7 149.5 216.0 60.9 25.7 14.0 75.3 I 8.5 1,472.0 179.7 224.1 67.9 24.0 14.0 78.5 27.0 1,367.6 193.6 232.3 94.7 20.5 20:3 77.6 36.4 1,305.2 205.7 228.5 113. 7 22.0 27.9 74.6 36.1 1,338.1 · 278.2 249.2 161.6 20.0 27.7
70.7 41.0 1,316.3 404.5 310.3 245.8 23.0 37.8 62.7 37.7 1,220.8 · 426.8 304.4 275.1 23.6 39.5 65.5 41.8 1,217.7 446.7 305.6 303.1 23.6 41.0 63.8 50.7 1,220.5 490.5 332.6 372.4 25.9 51.6
i
• 122

OF CROP, PHILIPPINES: JROP YEAR 1929-731 (continued) •
_ tons; value in million pesos)\- ,,. . - _
I Oth'er Food Coffee Cacao I Peanuts Crops Cqconut8
I Value Value Quantity Value Quantity ~alue Quantity Quantity Quantity Value
25.9 38.1 ,3.1 - 9.lo 15.3 5.2 8.2 1.4 1,117.3 399.6 32.3 28.7 3.6 I J.16 12.8 4.7 30.0 5.5 I, 130.3 322.3 43.1 38.5 3.2 9J5 10.9 4.2 36.5 7.2 1;>!18.9 448.2 32.9 47.5 3.4 9.r 11.1 4.5 45.1 8.2 1,555.6 587,2 39.3 54.6 3.5
9f 14.3 6.2 44.8 6.7 1,550.2 651.4
44.1 58.6 4.2 I l.B 13.2 5.6 49.5 9.1 1,533.5 672.2 ' 42.8 60.0 4.0 10.9 13.7 6.1 52.0 8.4 I ,557.0 771.2
44.3 96.4 3.5 9.5 14.3 8.4 54.0 18.3 1,664.3 884.5 43.9 126.6 4.2 10.v 15.0 10.7 46.3 21.0 1,598.1 920.0
' 44.2 I 55.3 4.4 I 5.0 14.9 11.2 49.4 25.6 1,564.9 869.9
I 49.0 222.8 4.3 20.5 - 17.4 16.0 68.0 40.5 .1,726.2 1,273.0 49.5 219.6 .3.6 18.9 18.9 I 9.1 79.2 · 52.7 1,679.1 1,261.7 51.6 236.8 3.5 18.~ 18.9 19.8 87.4 60.5 1,813.4 1,386.7 50.9 233.8 3.6 19.6 18.2 24.3 I I 3. I 91.5 1,797.1 1,646.5
I I
I
123

Crop Year
1929 '
1930 1931 1932 1933 1934
1935 1936 1937 1938 19399
1940 1941 1942 1943 1944
1945 1946 1947 1948 1949
1950 1951 1952
I __ .19,53 1954
1955 1956 1957 1958 1959
Table 5.1 - QUANTITY.AND VALUE OF PRODUCTION BY KIND
, (Quantity in thousand metric
Sugar Cane10 Abaca Native Tobacco Virginia
Quantity Value Quantity Value Quantity Value Quantity
840.4 · I 16.6 213.4 54.8 _5-1-,.$ 10.5
892.5 112.5 195.5 37.7 50.1 9.3 869.1 104.0 162.2 17.0 47.3 7.4
1,065.3 116.1 130.4 8.2 49.1 5.1 1,218.2 '111.4 134.5 7.8 45.4 3.6 1,499.2 158.8 180.3 10.9 35.5 . 2.9
684.7 72.5 200.6 12.9 31.1 2.5 945.9 107.1 150.0 19.6 35.0 3.7
1,076.1 105.0 200.6 25.1 '36.2 4.1 1,012.0 109.0 164.9 22.7 39.1 4.1 1,042.3 104.5 144.1 11.4 32.1 3.6
n.a. n.a. n.a. n.a. . n.a. n.a. n.a. n.a. n.a. n.a. n.a. n.a. n.a. n.a. n.a"': _ n.a. n.a. n.a. n.a. n.a. n.a. n.a. n.a .. n.a., n.a. n.a. n.a. n.a. n.a. n.a.
n.a. n.a. n.a. n.a. n.a. n.a. 62.6 62.3 30.4 8.3 14.3 12.9
· 119.7 60.1 · 82.0 25.9 I 7.7 9.9 395.7 81.7 99.4 47.7 22.3 11.8 692.9 154.6 74.6 48.1 21.9 10.8
654.0 146.8 82.2 52.6 26.4 20.7 930.2 203.0 130.4 79.8 29.9 21.7
1,018.9 223.8 114.6 68.7 26.7 19.6 1,086.2 239.9 112.i . 60.8 20.5 7.2 1.9 1,352.0 342.1 106.2 38.9
I 26.8 9.4 0.8
1,304.4 317.6 104.5 35.2 20.0 7.5 I 0.1 1,163.3 257.2 120.3 35.4 18.6 7.1 19.7 1,103.0 244.1 128.5 37.9 20.1 7.7 30.8 1,593.5 310.8 124.6 38.7 I 8.4 7.4 31.2 1,806.8 344.9 111.5 39.4 2L8 7.9 29.9
124
~
l :j

f I I
t I . .
OF CROP, PHILIPPINES: fROP YEAR 1929-731 (continued)
tons; value in million pesos) . . I
I Tobacco Ramie
\ Rubber Maguey Kapok
--.Value Quantity Value b . I uantity Value Quantity Value Quantity Value
n.a. n.a .. 0.4 0.5 2L3 3.5 0.6 0.3
n.a. n.a. 0.4 0.5 17.9 2.7 - 0.7 0.3 n.a. n.a. 0.4 0.4 11.4 0.8 0.8 0.3 n.a. n:a. • * 8.1 0.3 1.2 0.4 n.a. n.a. 0.3' 0.2 5.9 0.2 1.3 0.4 n.a. nm. 0.5 0.4 10.7 0.4 1.2 0.4
-n.a. n.a. 0.5 0.3 14.9 0,6 1.3 0.4 n.a. n.a. 0.7. 0.5 26.9 1.8 1.4 0.5 n.a. n.a. 0.7 0.5 23.8 2.0 1.4 0.5 n.a. n.a. 0.8 0.6 17.7 1.4 1.5 0.5 n.a. n.a. 0.9 0.6 6.5 0.3 2.6 0.3
n.a. n.a. n.a. n.a. n.a. n.a. n.a. n.a. n.a. n.a. n.a. n.a. n.a. ·n.a. n.a. n.a. n.a. n.a. n.a. n.a. n.a. n.a. n.a. n.a. n.a. n.a. n.a. n.a. n.a. n.a: n.a. n.a. n.a. ·n.a. n.a. n.a. n.a. n.a. n.a. n.a.
n.a. n.a. n.a. n.a. n.a. n.a. n.a. n.a. n.a. n.a. I.I 0.9 0.5 0.1 2.7 0.9 n.a. n.a. 1.7 1.2 4.8 I. I 2.1 0.7 0.1 n.a. 1.5 1.2 6.7 2.0 1.8 0.6 n.a. n.a. 1.2 1.0 1.8 0.5 2.0 0.6
n.a. n.a. 1.3 I.I 1.8 0.6 1..2 0.4 n.a. n.a. - 1.5 2.6 2.8 0.8 · 1.2 0.4 n.a. n.a .. 1.8 2.1 1.0 0.3 1.6 0.6.
' 3.4 0.1 0.1 1.9 2.4 1.4 0.5 1.8 0.6 ' 1.5 I.I 0.7 !l.O 2.4 1.2 ·0.3 2._7 0.9
·11 ,,
17.5 I. 7 I.I 2.0 2.4 0.2 0.1 2.8 0.9 30.1 1.2 1.2 il.o 2.1 0.2 2.9 1.2 47.2 2.2 2.2 2l2 2.2 2.5 0.6 3.0 1.2 49.8 2.0 1.7 216 2.9 1.7 0.4 . 3.3 1.2
55.6 2.5 2.1 2!0 2.2 2.6 0.6 3.3 ·l.2
125

Table 5.1 - QUANTITY AND VALUE OF PRODUCTION BY KIND (Quantity in thousand metric
Crop Sugar.Cane1 0 Abaca Native Tobacco Virginia
Year Quantity Value Quantity Value Quantity Value Quantity
1960 1,809.7 339.8 94.5 58.8 29.8 13.1 34.2 1961 · 1,709.1 321.7 114.8 65.3 31. 7 13.9 28.3 1962 1,902.4 428.7 I 16.3 61.4 41.0 16.3 28.7 1963 2,030.1 473.1 127.8- 61.4 42.3 19.0 25.4 1964 2,132.3 504.7 134.3 78.9 44.1 24.9 20.9
1965 2,034.8 506.3 134.0 78.6 28.6 15.8 17.2 1966 1,828.3 574.4 135.3 65.4 43.3 27.9 14.8 1967 2,027.4 751.3 117.6 62.0 36.4 29.8 14.7 1968 2,161.3 970.6 103.4 · 52.0 47.5 46.9 17.4 1969 2,166.5 1,199.4 105.9 66.3 36.9 64.1 19.9
1970 2,594.6 1,801.6 122.4 105.7 39.2 80.3 22.0 · ·1971 2,980.2 2,079.3 104.6 90.9 35.8 66.3 20.0
1972 ·2,559. 7 1,897.3 110.1 102.6 35.8 83.7 20.5 1973P 3,190.8 2,499.0 1 I 9.2 118.5 43.7 107.6 21.1
- not available.
1 AU unpublished materials for the different crops, fruits and nuts prepared by the Division of Statistics, Depaibnent of Agriculture and Commerce and by the Bureau of Census and Statistics during the early 40's for the crop years ending June 30, 1939, 1940, 1941 and 1942 were destroyed during the battle for the liberation of Manila in 1945. No official estimates of the area, production and value of crops in the Philippines were made during the Japanese occupation up to June 30, 1945.
2Excludes crops, for which data arc not available for some vcars. · 3From 1929 to 1939 includes only chico, lruizones, papa;a, guayabano, atis and pi1i while from 1946 to present, includes
in 'addition, avocado, eaimito, cashew, jack fruit and watermelon. 4From 1929 to 1939 includes mandarin, orange and pomclo while from 1946 to 1973, includes in addition, calamansi. 5From 1929 to 1939 includes only cassava, gabi, camote, tugue and ubi. From 1946 to present, pao (galiang) was included .
. 6From 1929 to J 939 vegetables include cabbage, eggplant, radish and tomatoes. From J 946 to 1973, pechay and garlic were included. · ·
7From 1929 to 1969 includes only beans and mongo. Soy beans was included from l ?70 to 1973. BCopra only from 1929 to 1946.
9census figures. / IOcentrifu/al and muscovado.
Ppreliminary estimates. *Less than 0.1 of the unit employed. Sources of basic data: National Census and Statistics Office;. Yearbook of Philippine St'atistfcs, 1946.
National Economic and Development Authority (formerly National Economic Council), The Raw Material Resources Survey Bulletin, Series No. 1, June 1959. Bureau of Agricultural_ Economics, Deparbnent of Agriculture.
126

f-- ' I I
OF CROP, PHILIPPINES: ~ROP YEAR 1929-731 (continued) ~ tons; value m rntlhon pesos,
! I Tobacco Ramie I Rubber Maguey Kapok
I Yalue Quantity Value \Quantity Value Quantity Value Quantity Value
~ 60.3 2.2 I.I 3. I . 3.5 2.1 0.5 3.2 I. I 50.2 2.0 1.0 3.7 4.2 2.2 0.5 2.1 0.7 47.7 3.7 1.9 4.5 4.9 2.4 0.6 1.5 0.5
~ 44.2 5.5 3.2 5.2 5.8 2.4 0.6 1.2 0.4 35.1 . 5.4 3.2 6.0 6:7 2.4 0.6 1.2 0.4
r 29.2 5.5 3.2 5.9 · 6.7 2.5 0.5 \ 1.9 0.6 21.8 4.5 2.9 6.4 7.2 2.7 0.6 2.2 0.7
f 24.7 3:9 5.2 6.5 6.5 2.7 I. 7 2.0 I.I 30.6 1.3 2.5 14.4 11.5 2.9 - 2.9 1.8 1.5 49.5 1.9 3.9 I 8.4 24.4 2.4. 2.6 I :8 1.9
48.7 3.1 7.1 19.0 27.9 2.4 3.2 ·I. 7 2.1 44.6 3: I 7.2 20.9 29.2 2.4 3.2 1.5 2.3 52.0 3.1 · 6.8 21. 7 29.4 2.5 . 3.3 I.I 1.7 67.5 3.2 7.5 23.1 32.6 2.5 3.5 I. I 1.7
. 127

•
N (X)
Figure 5.1 1 OVER-ALL CROP PRODUCTION: CROP YEAR 1946-73
MILLION METRIC TONS
18
16
14
12
10
8
6
4
2
0 1946
1947 148
~9 '50
151
TOTAL CROPS
-==-:-==-=-=-=---- - --
-----==~~~~~~-~~-~~~~~~~~~~~~- ~~~~-~i~i~i~~i~i~i~i~~~-~~ ·-----------------=-------------- - - - - - - - - - - -
---------====~=~=~ ~-i~~~~~-~-~-~_i_~- i~i~i~-~-i~i~i~i~ii ~; i ~ ~~ ~ ~: ~ ~~~~
'52 '54 '56 '53 '55 157
'58 '59
160 . 161
162 '63
'64 , '65
'66 '67
'68 '69
-------,

N '-0 -
• ♦ •w .,._..,+ 4,- •• •• •• w • •• • - + •• .++•'"W'-- ♦♦ fl ♦ W .. ◄♦ i
Figure 5.2 PALA. Y AND CORN PRODUCTION AND AREA HARVESTED: CROP YEAR 1960-73
QUANTITY (IN MILLION METRIC TONS)_
•·············•·····•
............
.-:•,•···················
.................
6 4 2 0
¼PRELIMINARY
AREA CROP YEAR (IN MILLION HECTARES)
196.0
1961
1962
1963
1964
1965
1966
1967
1968
1969
1970
I 971
•"❖"•'❖'•'••································•:•:•:•·❖
······•'··----·-·············
•,•,•.·-·••, .. -•::::::::::::::::::::::::::.-
· ••••.•• ,,,•,,•,•,•····················-----=·=·=·=·=·=···=·=·
1972 .-:::::::•::-:::::::::::::::::: ........ .
I 9 7 3 * ❖:•:•:•:•:•:•:•:•:•:•:•:•:•:•:•:•:::•:•:❖:;:::::::::::::::::::::::: 0
PALAY fE:E) CORN
2 3 4
•

'
Table 5.2 - AREA HARVESTED AND AVERAGE YIELD BY
(Area in thousand_ hectares and mean
Crop Palay (Rough rice) Corn (Shelled) Banana Mango Year Area Mean Yield Area Mean Yield Area Mean Yield Area Mean Yield
11929 1,775.2 1.234 515.0 0.679 10~.4 1.722 14.9 1.577
,
1930 1,812.8 · 1.252 517.0 0.699 112.6 1.945 15.4 1.649 1931 1,790.6 1.220 524.2 0.646 · 112.7 1.905 15.4 1.760 1932 1,781.6 1.168 577.1 0.706 112.8 1.904 15.4 1. 753 . 1933 1,853.7 1.136 629.3 0.656 103.4 1.814 15.5 1.729 1934 2,004.0 1.164 539.3 0.628 108.1 1.816 15.6 1.744
1935 1,964.1 1.027 567.4 0.521 95.1 1.515 15.0 l.400 1936 2,048.7 0.907 685.0 0.530 92.5 1.505 15.0 1.333 1937 2,061.0 1.175 659.4 0.663 92.2 1.808 15. l 1.331 1938 1,912.1 1.205 702.5 0.713 92.3 1.815 15.5 1.335 1-9398 1,965.5 1.168 , 816.7 0.562 96.5 1.525 30.4 1.194
I
1940 2,080.4 1.136 912.9 0.627 .,
n.a. n.a. n.a. n.a. 1941 2,289.2 1.040 966.9 0.552 n.a. n.a. n.a. n.a. 1942 2,318.6 1.053 998.5 0.584 n.a. n.a. n.a. n.a. · 1943- n.a. n.a. n.a. n.a. n.a. n.a. n.a. n.a. 1944 n.a. n.a. n.a. n.a. n.a. n.a. n.a. n.a.
1945 . n.a. n.a. n.a. n.a. · n.a. n.a. n.a. n.a. 1946 1,650.0 0.984 571.1 0.580 87.3 1.596 31.0 0.906 1947 1,879.6 I. I 11 812.3 0.581 94.2 1.963 31.5 1.178 1948 .2,026.4 I.I 06 826.5 0.628 90.0 1.541 3 i.9 0.878 1949 2,164.1 1.151 . 866.2 0.617 93.4 1.648 32.7 0.838
'
.1950 2,214.0 1.177 909.0 0.631 97.7 1.652 -32.9 0.833 1951 2,251.8 1.162 953.2 0.633 l 01.0 1.829 33.5 0.809 1952 2,466.0 1.148 1,044.0 0.730 I 13.8 1.798 37.7 0.798 ~ 1953 2,655.0 1.184 1,101.'3 0.644 144.6 1.819 48.7 0.924 1954 2,645.4 1.203 1,120.0 0.697 159.0 I. 721 53.6 0.905
, 1955 2,655.5 1.206 1,388.4 0.555 167.0 I. 7_65 56.2 0.897 1956 2,742.5 1. 194 1,674.8 0.542 167.0 1.816 56.3 0.932 1957 2,768.1 1.209 1,786.8 0.501 172.4 1.851 . 58.7 0.903 1958 3,154.1 1.016 1,380.6 0.617 185.5 1.836 60.6' 0.934 1959 3,329.4 t. 107 2,107.0 0.482 179.3 1.873 57.2 o._954
130

KIND OF CROP, PHILIPPINES: CROP YEAR 1929-73 1
yield in metric tons per hectare)
Other.Fruits and Vegetables including Pineapple Nuts2 Citrus3 Rootcrops4 Onions and Potato5
Area ·Mean Yield Area Mean Yield Area Mean Yield Area Mean Yield Area Mean Yielfl
)
3.3 3.606 12.0 4,500 5.1 2.196 127.9 2.007 16.7 1.054
3.8 3.184 11.8 4.669 5.3 2.170 123.3 2.002 17.3 1.139 4.1 3.049 11.7 4. 726 5.2 2.192 106.5 2.337 19.5 1.25-J 4.0 f 250 11.7 4.846 5.3 2.189 l 08.1 2.829 19.0 1.421 2.8 5.286 11.4 5.228 5.3 2.189 114.3 2.695 16.6 1.494 .
_ 2.9 5.172 11.6 4.819 5.4 2.093 118.4 3.035 17. l 1.456
4.0 5.050 11.3 4.186 5.4 1.833 116.3 2.895 18.6 1.538 4.2 5.214 11.6 3.983 5.1 1.843 116.2 2.895 19.6 1.561 4.2 5.190 11.6 3.914 5.5 2.018 114.2 2.920 19.7 1.553 4.7 5.234 11.9 3.824 5.5 1.945 117.6 2.847 19.9 1.593
10.6 2.651 20.9 3.589 13.9 1.317 178.1 2.327 13.1 1.855 '
i:i.a. n.a. n.a. n.a. n.a. n.a. n.a. n.a. n.a. n.a. n.a. n._a. n.a. n.a. n.a. n.a, n.a. n.a. n.a. n.a. n.a. n.a. n.a. n.a. n.a. n.a. n.a. n.a. n.a. n.a. n.a. n.a. n.a. n.a. n.a. n.a. . n.a. n.a. n.a. n.a. n.a. n.a. n.a. n.a. n.a. n.a. n.a. n.a. n.a. n.a.
n.a. n.a. n.a. n.a. n.a. n.a. n.a. n.a. n.a. n.a. 7.4 t892 47.6 1.9.16 15.1 1.252 148.3 2.927 7.9 3.152 9.0 2.356 50.4 ! .897 15.5 1.568 175.6 2.672 13.0 2.538
10.2 3.814 47.3 1.689 15.9 1.164 165.9 3.188 13.6 2.596 11. 7 3.008 48.9 1.634 16.4 1.165 172.4 3.064 I 7.1 2.667
15.2 3.717 48.8 1.652 -16.6 1.193 185.5 3.581 20.2 2.599 16.0 4.225 50.7 1.655 ,-- 17.3 1.220 1s'8.5 3.706 -22.3 3.197 18.0 4.156 57.1 1.648 17.5 1.154 198. l 4.118 34.0 3.047 22.5 4.093 72.4 1.778 17.0 1.618 258.7 4.389 89.8 1.914 24.7 4.020 79.5 l.745 18.8 1.596 267.9 4.406 95.2_ 1.861
27.9 3.702 81.2 1.810 19.7 1.599 · 272.7 4.408 97.9 I. 771 25.9 4.139 83.2 1.828 20.5 1.600 279.9 4.504 98.4 1.885 26.9 4.030 86.9 1.816 21.4 1.603 291.7 4.429 100.3 1.866 28.6 4:046 91.1 1.8 I 1 22.1 1.638 299.7 _ · 4.438 103.0 1.890 26.1 4.096 '86.4 1.826 22.0 1.682 300.3 4.460 99.3 1.916
1 31

Table 5. 2 - AREA HARVESTED AND A VERA GE YIELD BY
(Area in thousand hectares and mean yield in metric tons per hectare)
Crop Palay (Rough rice) Ccirn (Shelled) Banana Mango . . Year
Area Mean Viele! Area Mean Yield Area. Mean Yield Area Mean Yield
1960 3,306.5 1.131 1,845.5 0.631 161.5 1.903 52.5 l.097 1961 3,197.8 . 1.158 2,045.5 · .0.591 217.0 1.608 43.5 l.363 1962· 3,179.2 1.230 2,016.3 0.628 220.8 2.377 41.1 1.608 1963 3,161.3 1.255 1,950.0 0.653 213.3 2.61 I 49.1 ' l.880 1964 3,087.5 I. 245 _ 1,897.6 0.681 216.4 3.488 48.6 ' 1.961
, 1965 . 3,199.7 1.248 l .922.8 0.683 220:5 3.106 50.6 2.557 1966 3,109.2 1.310 2,106.1 0.655 210.4 3.245 48.4 2.717 1967 3,096.1 1.322 2,157.9 0.690 214.4 3.570 46.2 2.903
· 1968 3,303.7 1.380 2_,247.9 0.720 228.7 3.413 45.1 2,805 1969 3,332.2 1.334 2,256.1 0.768 223.3 3.345 46.9 2.998
1970 3,113.4 1.681 2,419.6 0.830 235.2 3.810 45.5 3.334 19?1 3,112.6 1.716 · 2,392.2 0.838 227.1 4.557 40.5 3.395 1972 3,246.4 1.57] 2,431.7 0.828 243.8 4.020 40.8 3.410 1973P 3,111.8 1.419 2,325.4 0.787 247.5 _;1.091 40.0 4.690
'

KIND OF CROP, PHILIPPINES: CROP YEAR 1929-731 (continued)
Other Fruits and Vegetables including Pineapple_ Nuts2 Citrus3 Rootcrops4
Onions and Potato5
Area Mean Yield Area Mean Yield Area Mean Yield Area Mean Yield Area Mean Yield
22.6 5.925 83.2 2.123 22.8 1.899 289.1 4.883 80.7 2.295 19.2 6.031 78.8 2.241 27.8 1.939 282.7 5.112 61.5 2.683 21.0 6.648 83.6 2.428 28.6 2.171 261.3 5.106 63.6 3.-104 22.7 6.670 80.9 2.534 29.1 2.134 264.4 5.145 55.1 3.307 -26.7 5.832 73.0 2.923 28.4 2.162 287.9 5.392 53.3 3.572
30.1 5.850 70.8 3.152 28.6 2.476 273.7 5.614 53.1 4.068 25.3 7.439 - 68.8 3.322 28:5 2.642 262.9 5.599 54.7 4.097 23.3 8.931 69.9 3.508 28.7 2.735 252.1 , 5.425 55.2 4.208 28.7 7.875 67.4 3.536 28.0 2.771 250.4 5.212 53.2 4.293 29.9 7.973 - 67.9 3.644 25.2 2.960 253.6 5.276 56.5 4.411
28.9 8.076 70.7 4.0,79 21.3 · 3.319 252.4 5.215 62.8 4.941 28.0 8.368 65.2 3.936 18.9 3.318 246.0 4.963 58.5 5.203 29.6 9.530 70.8 4.762 18.7 3.502 258.5 4.711 65.9 4.638
- 27.6 10.630 74.0 4.186 19.0 3.358 266.3 4.583 65.5 ..
5.078
133

Table 5.2 - AREA HARVESTED AND AVERAGE YIELD BY
(Area in thousand he~tares and mean
Beans and Peas6 Coffee Cacao Peanuts Crop Year Area Mean Yield Area Mean Yield Area Mean Yield Area Mean Yield
1929 22.1 0.511 1.2 1.083 1.6 0.750 7.4 0.554
1930 18.0 0.517 1.2 l.167 1.6 0.750 7.9 0.532 1931 18.7 0.540 1.2 1.167 1.6 0.750 '·7.7 0.571 1932 l 7.3 0.590 1.3 0.846 1.6 0.625 7.8 0.577 1933 17.1 0.567 1.4 0.714 1.5 0.600 6.5 0.646 1934 17.5 0.606 1.4 0.714 1.5 0.600 6.4 0.563
1935 14.l 0.539 _l.5 0.467 1.5 0.533 6.1 0.541 1936 14. l 0.539 1.5 0.467 1.5 0.533 6.2 0.597 1937 12.1 0.529 1.5 0.600 1.6 0.500 6.4 0.594 1938 15.0 0.507 1.6 0.625 1.6 0.563 6.4 0.594 19398 34.9 0.289 7.1 0.282 4.6 0.109 12.2 0.533
1940 n.a. n.a. n.a. n:a. n.a. n.a. n.a. n.a. 1941 n.a. n.a. n.a. n.a. n.a. n.a. n.a. n.a. 1942 n.a. n.a. n.a: n.~. n.a:. n.a. n.a. n.a. 1943 n.a. n.a. n.a. n.a. n.a. . n.a. n.a . n.a. 1944 n.a. n.a. ·n.a. n.a. n.a. n.a. n.a. n.a. , 1945 n.a. n.a. I).a. n.a. n.a. n.a. n.a. n.a. 1946 22.3 0.345 9.2 0.337 4.0 0.150 7.6 0.395 1947 25.5 0.333 9.5 0.463 4.1 0. 195 1 l. I · 0.460 1948 26.5 0.347 · 9.5 0.410 3.9 0.180 13. 7 0.540 1949 31.9 0.445 9.2 · 0.413 4.0 0.175 18.6 0.516
1950 3'4.0 0.453 9.8 0.408 4.0 0:175 21.0, 0.586 1951 41.4 0.531 10.2 0.451 4.2 0.190 22.3 0.722 1952 60.5 0.631 12.4 0.403 6.3 0.206 · 24.9 0.618 1953 60.8 0.589. 15.4 0.370 6.7 0.194 27.4 0.620 1954 66.1 · 0.590 17.4 0.351 6.8 0.206 28.2 0.621
1955 67.l 0.591 19.2 0.365 6.5 0.231 28.4 0.620 1956 70.0 0.600 19.8 0.359 6.4 0.234 28.8 0.622 1957 75.4 0.585 21.5 0.386 6.7 0.239 29.3 0.621 1958 81.I 0.589 23.4 0.410· 7.1 0.239 30.5 0.610 1959 81.6 0.602 25.6 0.414 6.9 0.246 26.6 0.616
134

,
KIND OF CROP, PHILIPPINES: CROP YEAR 1929-731 (continued)
yield in metric tons per hectare)
,
Other Food Crops Coconut7 Sugar Cane Abaca Native Tobacco
Area Mean Yield Area Mean Yield Area Mean Yield Area Mean Yiel~ Area Mean Yield
• n.a. n.a. 531.0 0.904 257.7 3.261 484.9 0.440 82.6 0.624
n.a. n.a. 550.8 0.835 259.0 3.446 496.l 0.394 80.0 0.627 n.a. n.a. 56 l.4 · 0.747 256.2 3.392 484.9 0.334 74.4 0.636 n.a. n.a. 566.l 0.718 253.1 4.209 467.0 0.279 -78.2 0.627 n.a. n.a. 600.7 0.787 268.5 4_537·. 477.2 0.301 74.6 0.608 h.a. n.a. 608.2 0.781 305.9 4.901 458.6 0.393 55.4 0.641
n.a.· n.a. 617.9 0.873 2 I I. I 3.243 488.1 0.41 I 61.5 0.506 n.<!_. n.a. 632.0 1.030 250.8 3.772 478.9 0.313 65.5 0.535 n.a. n.a. 637.9 0.818 257.1 4.186 502.7 0.399 74.0 0.490 n.a. n.a .. 643.1 l.085 227.9 4.441 508.3 0.324 74.8 0.522 n.a. n.a. ·1,051.2 0.480 229.7 4.538 291.5 · 0.494 57.9 0.5,54
n.a. n.a. n.a. n.a. n.a. n.a. n.a. n.a. n.a, n.a. n.a. n.a. n.a. n.a. n.a. n.a. n.a. -- n.a. n.a. n:a. n.a. _n,a. n.a. n.a. n.a. n.a. n.a. n.a. n.a. n.a. n.a. n.a. n.a. n.a. n.a. n.a. n.a. n.a. n.a. n.a. n.a. n.a. n.a. n.a. n.a. n.a. n.a. n.a. n.a. n.a.
n.a. n.a. n.a. n.a. n.a. n.a. n.a. n.a. n.a. n.a. n.a. n.a. 960.0 0.212 29.0 2.159 272.4 0.112 27.1 0.523 n.a. n.a. 960.0 l.049 4!.0 2.920 280.8 0.292 33.0 0.536 n.a. n.a. 960.0 0.967 82.3 4.808 283.2 0.351 33.7 0.662 l.0 2.100 965.5 0.784 129.0 5.371 282.7 0.264 38.7 .0.566
0.5 2.200 985.0 0.859 l 29.5 5.050 .29!.5 0.282 46.1 0.573 0.6 2.000 987.0 l .153 168.9 5.507 305.3 0.427 50.8 0.589 0.6 2.000 987.8 0.810 200.8 5.074 275.1 0.417 46.4 0.575 1.9 2.158 990.0 0.911 225.4 4.819 271.9 0.414 35.4 0.579 2.1 2.143 990.0 0.994 265.1 5.100 238.6 0.445 43.5 0.616
2.2 2.136 990.0 l.544 267.7 4:873 217.0 0.482 37.1 0.539 2.3 2.087 992.0 l.192 240.3 4.841 216.8 0.555 39.8 0.467 2.4 2.402 992.0 1.384 ·234.7 4.700 231.5 0.555 42.9 0.468 2.7 2.000 995.6 1.355 238.7 6.676 l 92.8 0.646 36. 1 0.510 3.5 2.229 1,006.1 l. 1 I 5 252.2 7.164 l 92.5 0.579 42.0 · 0.519
135

;
• Table 5.2 - AREA HARVESTED AND AVERAGE YIELD BY
(Area in thousand hectares and mean
- -Crop· Beans and Peas6 Coffee Cacao Peanuts
Year Area Mean Yield Area Mean Yield Area Mean Yield Area M_ean Yield
.. 1960 78.2 0.541 30.5 0.849 6.6 0.470 24.3 0.630 1961 63.1 0.529 39.0 '0.828 9.5 0.379 21.8 0.587 1962 67.1 0.493 50.4 0.852 9.1 0.352 19.6 0.556 1963 68.8 0.455 42.0 0.783 9.7 - 0.350 I 9.4 · 0.572 1964 61.1 0.448 42.0 0.936 9.-2 0.380 25.2 0.568
1965 56.0 0.459 44.3 0.996 9.6 0.438 24.1 0.548 1966 54.9 0.437 45 .. 7 0.936 9.4 0.426 25.9 0.529 • 1967 47.4 0.432 SO.I 0.884 8.8 0.398 28.5 0.502 1968 · 48.2 0.456 49.4 0.889 9.2 0.456 29.7 0.505. 1969 45.3 0.442 51.9 0.852 9.2 0.478 31.0 0.481
1970 · 50.0 0.460 54.0 0.907 8.4 0.512 32.5 · 0.535 1971 49.2 0.480 54.3 0.912 7.4 0.486 32.5 0.582 1972 44.6 0.530 54.8 0.942 6.9 0.503 32.8 0.578 1973P 46.7 0.555 60.8 0.837 7.1 0.507 33.2 0.548
•
136

KIND OF CROP, PHILIPPINES: CROP YEAR 1929-731 (continued)
yield in rnet~1
tons per hectare)
Other Food Crops Coconut7 Sugar Cane Abaca Native Tobacco
Area Mean Yield Area Mean Yield Area Mean Yield ,Area Mean Yield Area Mean Yield
4.0 2.050 1,059.4 1.055 242.2 7.472 175.2 0.539 44.1 0.676 11.2 2.727 1,199.9 0.942 232.2 7.360 174.6 0.658 45.9 0.691 11.1 3.288 1,283.7 I. I 05 254.7 7.469 182.6 0.637 53.2 0.694 11.6 3.888 1,392.3 1.11 7 258.8 7.844 181.9 0.703 56.1 0.694 11.6 3.797 1,482.9 1.045 '269.9 7.900 210.5 0.638 61.0 0.681
11.4· 4.342 1,604.7 0.956 350.5 'i.805 199.3 0.672 47.3 .0.600 11. 7 4.444 1,610.9 0.967' 315.3 5.799 198.0 0.683 60.3. 0.718 11.4 4.737 1,820.2 0.914 308.7 6.568, 186.1 · 0.632 57.7 0.631 11.3 4.097 1,800.4 0.888 318.3 6.790 170.7 0.606 64.9 0.732 11.2 4.41) 1,845.5 0.848 343.0 6.316 172.9 0.612 57.1 0.646
11. 7 5.812 1,883.9 0.916 366.1 7.087 173.0" 0.708 54.0 0.726 12.9 6.140 2,048.5 0.820 441.6 6.749 155.3 0.674 46.6 0.768 15.8 5.497 2,125.5 0.853 441.0 5.790 145.2 0.758 45.7 0.783 16.9 6.692 2,133.3 0.796 455.2 7.010 163.3 0.730 51.9 0.842
I 37 ·

\
w 00
Figure 5.3 COCONUT, SUGAR CANE, BANANA PRODUCTION AND AREA HARVESTED
QUANTITY IN MILLION METRIC TONS
6 4 2
lfPRELIMINARY
-- ..
CROP YEAR I 960-73 .
CROP YEAR
1960
1961
1962
1963
1964
1965
1966
1967
1968
i 969'
1970
1971
!972
1973*
0 0
AREA IN MILLION HECTARES
2 3 (====~ COCONUT
~ SUGAR CANE
4
llilll!li BANANA

Table 5.2 - AREA HARVESTED AND A VERA GE YIELD BY KIND OF CROP, PHILIPPINES: CROP YEAR 1929-731 (continued)
(Area in thousand hectares and mean yic!d in.metric tons per hectare)
Virginia Tobacco Ramie Rubber Magucy Kapok Total Crop .Area Year~ Area Mean Yield Arca Mean Yield Arca Mean Yield Area Mean Yield Area Mean Yield Planted9
1929 -n.a. n.a. 2.6 0.161 37.3 0.571 5.5 0.116 4,012.7
1930 n.a. n.a. 3.6 0.109 39.0 0.459 5.5 0.126 4,082.d 1931 n.a. n.a .. 3.8 . 0.097 37.8 0.302 6.4 0.123 4,044.0 1932 n.a. n.a. 3.5 0.007 35.1 0.231 .7.7 0.162 4,073.7 1933 n.a. n.a. 3.6 0.073 31.0 0.190 7.7 0. 163 4,242.1 1934 n.a. n.a. 3.7 0.143 30.2 0.354 7.4 0.157 4,318.6
1935 n.a. n.a. 3.7 o."136 31.8 0.469 7.5 0.179 4,242.0 1936 n.a. n.a. 3:8 0.184 37.3 0. 721 7.6 0.186 4,497.1 1937 n.a. n.a. '3.8 0.187 · 37.8 0.628 7.6 0.186 4,525.4 1938 n.a . n.a. 3.8 0.212 38.8 0.456 7.7 0.189 4,411.0
. 19398 n.a. n.a. 3.6 0.260 8.3 0.783 3.2 0.818 4,849.9
1940 n.a. n.a. n.a. n.a. n.a. n.a. n.a. n.a 2,993.3 1941 n.a. n.a. n.a. n.a. n.a. n.a. n.a. n.a. 3,256.1 1942 n.a. n.a. n.a. n.a. n.a. n.a. n.a. n.a. 3,317.1 1943 n.a. n.a. n.a. n.a. n.a. n.a. n.a. n.a. n.a.
1944 n.a .• n.a. n.a. n.a. n.a. n.a. n.a n.a. n.a.
1945 n.a. n.a. n.a. n.a. n.a. n.a. n.a. n.a. n.a.
1946 n.a. n.a. 3.3 0.333 6.4 0.072 3.3 0.818 3,910.3 1947 n.a. n.a. 3.3 0.515 6.7 0.716 3.5 0.600 4,45~.6 1948 0.3 0.333 3.3 0.454 8.1 0.827 3.3 0.546 4,655.5 1949 0.5 n.a. 5.0 0.240 7.9 0.228 3.4 0.588 4,920.3
1950 n.a. n.a. 3.4 0.382 7.0 0.257 3.4 0.353 5,075.1 1951 n.a. n.a. 5.4 0.278 7.2 0.389 3.5 0.343 5,241.1 1952 0.4 n.a. 5.4 0.333 3.8 . 0.263 3.0 0.533 5,613.6 1953 3.3 0.576 0.7 0.143 5.0 0.380 3.9 . 0.359 3.0 0.600 6,060.8 1954 4.7 0.170 1.3 0.846 5.0 0.400 3.8 0.316 3.0 0.900 6,139.7 . 1955 15.5 o:652 2.9 0.586 5.0 0.400 3.0 0.067 3.0 0.933 6,431.1 1956 35.3 0.558 2.9 0.414 5.0 0.400 3.0 0.067 3.0 0.967 6,813.9
. 1957 37.7 0.817 2.9 0.759 5.0. 0.440 2.5 1.000 3.0 1.000 7,000.7 1958 48.7 0.641 1.5 1.333 5.0 0.520 2.3 0.739 3.2 1.031 6.994.0 1959 49.0 0.610 1.7 1.471 4.9 0:408 3.7 0.703 3.2 1.031 7,906_.5
139

Table 5.2 - AREA HARVESTED AND AVERAGE YIELD BY KIND OF CROP, PHILIPPINES: CROP YEAR 1929-7.3 1 (continued)
(Area in thousand hectares and mean yield in metric tons per hectare)
Ramie Rubber Maguey Kapok Total Virginia Tobacco Crop-----Year Arca Mean Yield Arca Mean Yield Arca Mean Yield Area Mean Yield Arca
Aiea Mean Yield Pla!'tcd9
1960 51.7 0.662 1961 45.2 0.626 1962 47.3 0.6.07 1963 41.3 0.615 1964 34.5 0.606
1965 28.8 0.597 1966 25.4 0.583 1967 24.8 0.593 1968 28.7 0.602 1969 32.3 0.616
1970 33.4 0.659 1971 29.0 0.690 1972 31.9 0.644 I 973P 32.1 0.657
- not ~v~lable. llpll'liminary r.stimatcs
1.7 2.0 2.5 3.2 3.2
3.2 2.8 2.5 0.8 1.4
2.4 2.4 2.4 2.4
1.294 , 1.000 1.423 1.719 1.688
1.719 1.607 1.560 1.625 1.429
1.292 1.292 1.281 1.333
5.2 10.! 14.4 18.1 19.8
17.0 15.7 15.2 15.2 21.2
21.8 23.0 24.7 26.!
0.596 0.336 0.312 0.287 0.303
0.347 0.408 0.428 0.941 0.868
0.872 0.909
. 0.879 0.885
2.9 2.6 3.0 2.9 2.5
2.7 3.0 3.0 2.9 2.8
2.8 2.7 2.6 2.6
0.724 0.836 0.800 0.828 0.960
0.963 0.900 0.933 1.000 0.857
0.857 0.889 0.976 0.962
3.4 0.941 7,593.8 2.3 0.913 7,833.2 2.6 0.577 7,916.8 2.6 0.462 7,934.6 2.7 0.444 7,955.5
3.0 0.633 8,251.8 3. I 0.710 8,296.4 3. I 0.645 8,5 I 1.3 3.0 0.600 8,805.7 2.9 0.621 8,919.3
2.7 0.630 8,946.5 2.4 0.625 9,096.8 I. 7 0.708 9,381.8 1.3 0.846 9,210.0
IAIJ unpublished matr.ria.Js for lht. diffr.!'l".nl crops, fruih and nuts prepan:d by the Division of StatistiCS, Deparbnent f){ Awiculturc. nnd Commerce and by thr. National Census and Statistics Office (fonnerly Bureau of the Census and Statisti~) during the l',arl)' 40s, for the crop years ending June 30, 1939, 1940, 1941 and 1942 were destroyed during the battle for the liberation of Manila in 1945. No official r.stimalcs of thr. an:n, produclion and ,·alllf: of crops in the Philippinr.s were made during the Japanese occupation up lo Jum: 30, I 945, '
2from 1929 lo 1939 includes only chico, lamr.ones, papaya, guayabnno, atis and pili while from 1946 lo 1973, indudr.s in addition, avocado, caimito, cashew, jackfrnit and,. Watennclon. ~
3From 1929 lo 1939 includes mandarin, orange and pomclo while from 1946 to 1.973, includes in addition, calamansi.
4from 1929 lo 1939 includes only casa.uva, gahi, camotc, tuguc and ubi. From 1946 lo 1973, pao (galiang) wns included.
· fifrom 1929 lo 1939 vegetables include cabbage, eggplant,' radish, and lorn aloes. ~·rom 1946 lo 1973, pcchay amd l!nrlic were induded. 6From 1929 to 1969 includes only beans and mongi;,. Soybeans was included from 1970 to 1973. 7From 1929 to 1939, mean yield indicalr.s·only mean yield of copra per hectare. SCcnrus figures.
9Excludes crOps, data for which au: not available for som<: ycani. Sourct'.S of basic data: National Census and Stali!!lic.'I OffiCt":, Yearbook of Phlllpplnt! Statistic:s, 1946.
N~tional Economit: and Dcvdopmcnt Authority (fonncrly NEC), Thc Raw Material Rt!:souru:sSurvq Bulletin, Sr.ril's No. I, June 1959. Bureau of Awicultural Economics, Ocp.i.rtmcnt of Aitriculture.
140 .

. Table 5.3·- SIZE OF FARM BY MAJOR CROP CATEGORY: CY 1960 AND 1970
Per Cent of Total Area In Farms of 10 Farms of 200
.Crop Number of Area in Farms Average size hectares hectares farms {1,000) {1,000 has.) of farm {has.) and over am:! Qver 1960 )970P 1960 1970" 1960 )970P 1960 1970 1960 1970
ALL FARMS 2,166.2 915.7 7,772.5 3,114.9 3.6 3.4 33 n.a. 8 n.a. Sugarcane 17.8 14.0 249.4 87.2 14.0 6.2 80 h.a. 43 n.a. Abaca 36.0 6.8 209.0 33.4 5.8 4.9 49 n.a. 8 n.a. Coconut 440.3 148.8 1,938.6 734.1 4.4 4.9 38 n.a. 3 n.a. Palay 1,041.9 407.1 3,112.1 1,037.3 3.0 2.5 20 n.a. 2 n.a. Corn 378.8 180.3 949.3 576.3 2.5 3.2 20 n.a. I n.a. Tobacco 22.9 2.5 38.4 4.9 I. 7 2.0 8 n.a. 0 n.a. Others 228.5 156.2 1,275.7 641.7 5.6 4.1 n.a. . n.a. n.a . n.a.
n.a. - Data not available.
Ppreliminary. Data obtained from twenty.four (24) provinces out of 66. Source of data: National Census and Statistics Office, Census of the Philippines, 1960 and 1970.
Table 5.4- NUMJ3ER AND AREA OF FARMS BY TYPE OF TENANCY: CY 1960 AND 1970
Number of Farms Per Cent of Total Area-in Hectares Per Cent of Total Type of Tenancy 1960 1970p 1960 1970P
Cash 13,506 2,205 1.56 0.74 Fixed amount of
produce 34,145 34,874 3.95 11. 76 Share of produce 745,426 235,558 86.22 79.39 Cash and fixed
amount of produce 693
a · 0.08 •
Cash and share of produce 10,847 a 1.25 a
Rent free 29,816 14,800 3.46 4.99 Others 30,105 9,265 3.48 3.12
Total 864,538 296,702 100.00 100.00
PPreliminary. Data obtained from thirty-one (31) provinces out of 66. 81nchJdcd in othr.rs.
1960 1970P
47,008 16,587
· 88,911 89,304 1,677,857 618,114
3,676 a
34,083 a
55,9 I 8 49,800 92,748 32,537
2,000,201 806,342
Sourer. uf data: National Crnsus and Statistics Office, Census of the Philippines, 1960 a~d 1970.
141
1960 1970P
2.35 2.06
4.45 11.07 83.88 76.66
0.18 a
1.70 a
2.80 6.18 4.64 4.03
100.00 100.00

l
Table 5.5 - NUMBER AND AREA OF FARMS BY TYPE OF LAND TENURE:
CY 1960 AND 1970
Number of Farm<- Per Cent of Total Area in Hectares Per Cent of Total Tenure Status
1960 1960 1970P 1970 P 1960 1970? 1960 1970P
Full owner 967,725 545,833 44.67 55.35 4,133,276 2,053,155 53. I 7 59.49
Part owner 310,944 122,798 14.36 12.45 1,139,956 425,799' 14.67 12.34
Tenant 864,538 296,702 39.91 30.09 2,000,201 806,341 25.73 23.36
Manager 2;487 1',848 0.11 0.19 365,309 100,946 · 4.70 2.93
Other forms of tenure 20,522 18,984 0.95 1.92 133,742 65,037 1. 73 1.88
Total 2,166,216 986,165 )00.00 100.00 7,772,484 3,451,278 I 00.00 100.00
PPrcliminary. Data obtained from thirty one (31) provinces out of 66. Source of data: National Census and Stafutics Office, Census of the Philippines, J 960 and ] 970.
Table 5.6 - AREA TRANSFERRED AND NUMBER OF TENANTS-RECIPIENT BY
LAND SIZE CATEGORY AS OF JUNE 14, 19741
(Area in hectares)
Estimated Area Number of Average Area Land Size Category Total Transferred Tenant - Per Tenant-
(hectares) Area2 to Tenants Awardees Awardee
100.00 and above 410,386 135,214.167 71,082 1.902
50.00 - 99.99 139,030 58,003.866 33,838 1.714
24.00 - 49.99 134,248 43,813.665 26,145 1.676
12.0 I - 23.99 189,722 26,909.298 16,681 1.613
7.01 - 12.00 153,804 12,575.779 7,803 1.612
' 7.00 and belciw 316,027 29,367.524 23,446 1.252
Total 1,343,217 305,884.299 178,995 1.709
l Area transforrcd II) te.minLc: in relation lo ·1hc estimated Iota! tcnanh:d an:a has-::d or. Certificate of I.and Transfer (CLTs) issued. Tcn:mtcd areas are awicultural lands worked by lr.nanl-farmers either under share-cropping or fo.nM:hold. Under tht: Aginrian Reform Pros;ram. only i1rivalc a.,<>ricultural lands primarily dcrnlcd to rice Qr corn an: co,·ert:d.
2Revisr.d. · Source of tlala: Dc11artmcnt of Agrarian Reform.
142
,

r I Table 5.7 - AGRICULTURAL LOANS GRANTED AND OUTSTANDING
BY FINANCIAL INSTITUTIONS: CY 1953-73 (in million pesos)
End of G r a n t e d
· Period Total Rural Development Other Com-AGLF AGA Banks1 Banks2 PNB3
mercial Banks3
f. 1953 30.4 n.a. 2.8 1.9 25.7 n.a. n.a. 1954 37.4 n.a. 15.7 3.0 18.7 n.a. n.a. 1955 69.8 n.a. 40.5 4.6 24.7 n.a. n.a. 1956 81.3 n.a. 44.5 I 1.6 25.-2 n.a. n.a. 1957 98.8 n.a. 48.8 24.2 25.8 n.a. n.a.
1958 85. l n.a. 23.9 36.1 25.1 n.a. n.a. 1959 86.3 n.a. 7.1 44.2 35.0 n.a. n.a. 1960 590.4 n.a. 1.9 50.8 37.9 5 499.8. 1961 780.8 n.a. 2.b 74.0 45.5 5 659.3 1962 949.2 n.a. 6.5 101.4 55.24 5 786.1
1963 1,266.6 n.a. 8.2 143.0 63.44 5 1,052.0 1964 1,396.5 n.a. 4.4 201.3 84.94 5 1,105.9 1965 1,429.5 n.a. 10.2 215.5 62.2 619.2 522.4
► 1966 1,615.6 I 6.3 247.4 91.0 665.4 595.5 ~
n.a. 1967 2,065.1 16.6 31.6 318.3 147.6 815.7 735.3
! 1968 2;218.6 · 15.3 29.6 362.8 158.9 858.2 793.8' ,1969 2,327.4 8.3 23.6 408.5 115,0 903.1 868.9' 1970 2,783.5 7.6 41.4 489.0 64.9 990.4 1,190.2 1971 3,489.3 I 8.1 38.4 · 591.6 61.5 958.1 1,821.6 1972 3,388.9 3 I. I 29.6 677.5 100.0 851.1 1,699.6
1973 2,083.9 l0.86 . 25.27 558.06 160.2 890.6 439. I 6
143

Table 5.7 - AGRICULTURAL LOANS GRANTED AND OUTSTANDING BY FINANCIAL INSTITUTIONS: CY 1953-73 (Continued)
(In million pesos)
0 u t s t a n d i n g End of
Rural Development Other Com-Period Total AGLF ACA Banks1 Banks2 PNB 3 mercial Banks3
1953 83.8 n.a. 2.7 1.4 79.7 n.a. n.a. 1954 105.8 n.a. 16.5 2.6 86.2. n.a. n.a. 1955 143.7 n.a. 43.5 4.3 95.9 n.a. n.a. 1956 175.7 n.a. · 60.7 10.4 104.6 n.a. n.a. 1957 196.6 n.a. 71.3 20.5 104.8 n.a. n.a.
1958 235.9 n.a. 85.6. 30.2 120.1 n.a. n.a. 1959 248.8 n.a. 81.4 35. I 132.3 n.a. n.a. 1960 724.8 n.a. 78.5 42.5 153. 7 5 450.1 1961 824.5 n.a. 79.1 -60.2 160.3 5 524.9 1962 953.4 n.a. 77.8 82.6 199.8 5 ' 593.2
'1963 I, 198.6 · n.a. 79.1 I I 3. 7 235.3 5 770.5 1964 1,415.8 n.a. 78:8 158.9 265.0 5 913.1 1965 1,575.1 n.a. 86.6 167.4 293.3 569.4 458.4 1966 1,682.2 n.a. 88.2 198.5 317.4 630.1 448.0 1967 1,938.3 n.a. 96.7 259.4 380.2 751.8 450.2
1968 2,332.5 I 5.2 106.7 302.8 438.1 857.7 612.0' I 969. 2,54;5. l 16.7 106.6 325.6 485.9 · 923.1 687.2' 1970 2,732.7 16.9 118.8 390.9 499.6 973.3 733.2 1971 2,625.0 24.0 126.9 261.1 498.3 902.2 812.5 1972 3,214.1 65.3 126.9 507.6 740.0 855.2 919.1
1973 4,013.6 52.78 119.1 777.68 820.1 1,283.3 960.8
l Excluding loans granted and outstanding under AGLF starting I 967. 2Jncluding prirntc development banks from J 962 to 1973. ._
30ata from 1965 to 1967 include credits to semi-government institutions. Starting January I, 1968 data arc based on Department of Economic Research, Central Hank of the Philippines Fonn No. 1 (Revised January 1, 1968) and exclude credits to public sector.
4Adjustmcnts were made on data of private development banks. Soata for PNH arc included under other commercial banks. 6J anuary to June 1973. 7 As of Oclober, 1973. 8As of January, 1974.
rHevised. AGLF - Agricultural Guarantee Loan Fund. ACA - Agricultural Credit Administration. PNB - Philippine National Bank. .· Source of data: Central Hank of tl~e Philippines.
144

Table 5.8 - POPULATION AND INVENTORY VALUE OF POULTRY ON FARM BY KIND: CY 1950-731 .
(Number in thousand heads, value in thousand pesos)
Calendar Chicken Duck Goose Turkey Year
Number Value Number. Value Number Value Number Value
19~0 25,235 35,192 709 1,104 27 63 25 120 1951 28,055 3~,071 752 1,419 25 80 24 128 1952 32,090 49,471 1,047 2,091 25 72 25 123 1953 37,392 55,360 1,243 2,370 25 74 25 140 1954 39,805 50,022 1,379 2,184 85 264 30 165
1955 44,584 54,825 1,696 2,718 91 283 34 175 1956 49,776 62,077 2,143 3;587 96 342 37 205 1957 51,839 63,278 2,078 3,532 102 344 41 231 1958 52,409 65,347 ·2,109 3,521 98 328 41 230 1959 56,142 69,839 2,097 3,561 97 :330 41 226
1960 52,335 67,263 2,231 3,725 97 319 38 208 1961 49,984 74,424 1,784 3,112 · 78 217 40 175 1962 51,354 65,706 1,934 3,004 85 233 73 327 1963 48,624 75,573 1,594 3,205 127 366 100 611 1964 51,648 81,376 1,602 2,940 · 80 227 93 580
1965 56,929 96,693 1,478 4,142 88 250 94 545 1966 68,122 120,078 2,034 3,408 70 250 12-7 649 1967 66,489 146,354 2,328 6,049 150 577 119 851
.1968 68,403 156,899 2,402 5,327 128 501 130 931 1969 62,528 152,122 2,279 5,199 I 24 468 124 894
1970 56,999 149,380 2,132 5,382 133 492 141 1,011 1971 56,512 209,831 2,352 8,931 2 2 2 2
1972 50,103 179,357 2,600 9,189 2 2 2 2
1973 49,965 165,492 2,906 9,980 2 2 2 2·
1Thc reference date of poultry population on farm is March 7 f~m 1960 to 1966 and January 1 for the years 1967 to 1973.
2rhe series of data on goose and turkey was discontinued u:1 1971.
Sources of data: National Economic and Development Authority (fonnerly NEC), Tfte Raw Material Resources Survey Bulletin, Series No. ],June 1959.
Bureau of Agricultural Economics, Department of Agriculture.
/
• 145

Table 5.9 - _LIVESTOCK ON FARM: ANIMAL POPULATION (Number in thousand heads,
Calendar Carabao Cattle Horse Year
Number Value Number Value Number
1950 1,903 314,141 698 76,388 206 1951 2,343 414,119 715 106,079 207 . 1952 2,439 429,040 739 119,665 214 1953 2,5 JO 439,634 762 1-22,269 219 1954 2,981 379,752 763 105,793 197
1955 3,279 417,050 806 1 I 2,590 208 1956 3,595 461,510 861 120,181 218 1957 3,584 451,140 883. 121,966 219 1958 3,596 432,356 896 119,400 221 1959 3,773 454,757 933 ,123,923 227
1960 3,696 506,183 1 , 1 11 135,271 217 1961 3,452 613,726 1,055 170,323 197 1962 3,472 609,792 1,094 165,415 210 1963 3,323 645,222 1,197 207,528 220 1964 3,191 624,482 1,383 247,167 242 l 965 3,346 755,400 1,560 365,494 264 ----1 1966 3,633 922,553 1,583 372,220 257 1967 3,926 1,029,568 1,575 386,937 244 1968 4,173 1,117,730 1,644 417,342 282 1969 4,369 1,092,630 1,629 418,085 295
1970 4,432 1,338,527 1,679 460,167 295 I 971 4,556 1,358,228 . 1,795 473,012 2
1972 . 4, 7 I I 1,892,187 1,933· 748,114 2
1973 4,937 2,051,156 2,099 784,016 2
1The reference date of animal population on farm is March 1 from 1955 to 1966.and January 1 for the years 1950 to 1953 and 1967 to 1971.
2i·he series of data on sheep and horses was discontinued from 1968 and 1971, respectively.
Sources of data: N.alional Economic and Dc\·elopment Authority (fonnr.rly NEC), The Raw Material Resources Survey Bui-lerfn, Series No. J, June 1959.
Bureau of Agricultural ~conomics, Department of Agriculture.
146
'

-AND INVENTORY VALUE BY KIND: CY 1950-73 1
value in thousand pesos)
,
Hog Goat Sheep /
Value Number Value Number Value Number Value
... 20,401 3,899 152,726 355 4,384 26 353 20,719 4,159 174,716 377 4,509 .21 278 2 I ,953 4,443 200,054 384 4,368 22 247 22,608 _ 4,794 2 I 3,965 391 4,438 21 221 19,260 4,868 117,151 438 4,763 16 · 169
20,546 5,289 124,422 459 4,965 16 179 21,658 5,750 138,630 498 5,327 17 183 21,886 6,026 139,886 530 5,597 18 201
- 21,467 6,084 143,815 537 5;416 17 237 22,209 . 6,574 154,741 566 5,712 17 244
19,751 6,573 182,393 617 6,275 - 15 173 26,873 6,191 219,894 532 5,365 20 2 I I 32,803 6,726 246,515 628 6,659 23 247 27,687 · 6,234 229,381 484 5,605 14 176 30,744 6,616 246,306 . 558 6,337 4 64 44.323 6,939 273,536 606 9,424 3 -28 62;475 6,914 3 I 9,994 ' 2 '616 9,478 21 52,418 5,497 360.139 599 - 9,401 2 is 58,627 6,090 39.5:920 624 13,374 2 2 60,482 6,350 . 425,259 698 15,300 2 2
6 I ,036 6,456 485,480 772 17,674 2 2
2 7,050 812,843 924 25.599 2 2
2 7,742 705,001 1,083 29,489 2 2-
2 8,627 753,874 1,248 30,993 2 2
147

Table 5. 10 - LIVESTOCK AND POULTRY: NUMBER AND DRESSED
(Number in thousand heads,
Carabao Cattle Calendar
Year Number Weight Number Weight
1955' 37 5,677 340 48,978 19,56 62 10,344 345 44,405 1957 83 13,586 364 46,882 1958 99 16,274 346 44,226 1959 104 17,408. 380 51,742
1960 103 17,402 247 34,715 1961 123 20,324 248 30,661 I 962 126 20,815 259 32,418 1963 93 15,416 280 38,704 1964 64 10,970 245 33,783'
1965 117 20,549 319 45,050 1966 109 I 9,609 362 55,557 1967 82 14,743 358 54,091 1968 85 I 5,4g3 378 57,254. 1969 51 9,146 302 46,453
197_0 118 . 21,443 366 56,194 1971 154 . 27,824 _381 58,419
Sources of basic data: Bureau of Agricultural Economics., Ucpartmcnt of Agriculture.
~urcau of Animal Industry, Ocpartmr.nl of Agriculture.
148
Hog
Number
3,740 4,095 4,188 4,182 4,433
4,808 4,599 4,518 4,351
-4,353
6,700 8,147 ·6,252 5,649 6,688
5,489 4,818

WEIGHTS OF ANIMALS SLAUGHTERED BY KIND: CY 1955-7_1
weight in thousand kilos)
Goat· Chicken Ducks
Weight Number Weight Number Weight Number
165.787 134 2,670 24,263 · 26,689 391 175,762 158 2,044 . 25,968 30,443 437 182,192 157 1,935 27,997 21,263 445 183,813 146 1,765 27,038 31,939 40:3 195,080 144 2,135 28,068 32,114 486
199,250 155 2,423 26,779 30,211. 700 200,285 164 2,590 23,045 25,972 762 201,281 180 2,844 25,020 28,441 773 191,833 163 2,610 29,144 31,548 714 192,392 128 1,801 28,104 31,254 695
291,932 174 2,242. 28,882 32,438 662 363,976 186 2,024 26,556 31,764. 681 280,182 279 3,028" 23,956 28,641 439 257,255 192 2,121 25,367 29,420 635 322,139 276 3,352 30,611 28,037 . 735
261,545 293 3,555 30,329 27,959 670 240,817 325 3,983 31 ;318 29,460 680
· 149
Weight
305 · 547 597 541 517
805 890 916 830 794
759 647 417 (i03 808
737 748

Table 5.11 - MONTHLY AVERAGES OF DAILY MINIMUM BY KEY STATION: CY.
(In degrees
Station/ Janua_ry February March April May June
·calendar Mini- Maxi- Mini- Maxi- Mini- Maxi- Mini- Maxi- Mini- Maxi- Mini- Maxi-Year mum mum mum mum mum mum mum mum mum mum mum mum
CATBALOGAN 1958 21.9 30.5 21.9 31.0 22.3 32.4 22.7 31.9 24.2 33.2 25.0 33.9 1959 21.7 30.3 22.0 3 I. I 22.1 30.9 22.9 · 32.3 23.8 32.6 24.3 33.8 1960 22.0 31.0 22.1 31.0 22.5 31. 7 23.8 32.8 24.4 32.6 24.4 32.2 1961 21.2 29. I 22.8 30.3 22.6 31.5 23.5 32.8 24.3 32.6 24.7 32.6 1962 21.8 29.4 21.7 28.9 22.2 31.2 22.9 32.3 23.7 32.5 23.5 32.8 1963 21.3 28.2 21.0 28.9 21.9 30.4 21.8 31.5 23.7 32.6 · 25.0 32.7 1964 22.0 31.S 23.3 30.8 21.8 31.8 23.6 32.2 24.2 32.3 24.0 32.S 1965 22.2 28.9 21.4 29.7 21.9 30.0 23.2 31.8 23.8 32.7 23.8 32. I 1966 22.2 31.S 21.8 31.9 23.0 32.7 23.9 34.1 25.0 33.3 24.S 33.0 1967 22.4 30.6 22.3 29.8 22.3 31.0 23.2 32.4 24.S 33.6 25.S 33.I 1968 22.4 29.6 21.0 29.8 22.8 31.9 23.0 32.2 24.3 33.0 24.4 33.4 1969 21.9 3 I. I 21.7 31.8 22.9 33.1 24.0 33.1 25.4 33.7 24.9 33.0 1970 22.4 30.3 22.S 3 I. I 23.4 32.8 23.9 33.S 24.7 34.2 24.6 32.S I 971 22.3 29.7 23.2 29.4 22.7 29.3 23.S 3 I. I 25.1 31.6 24.6 30.9 1972 23.2 28.9 23.S 3L9 22.9 30.3 24.3 33.2 25.2 33.8, 25.S 33.2 1973 22.7 32.1 22.7 31.8 22.8 32:S 24.4 33.7 25.0 34.2 25.5 34.2
CEBU 1958 22.8 31.3 22.4 31.3 23.1 32.2 23.8 32.8 25. I 33.0' 24.9 32.9 1959 22.S 30.3 22.9 30.7 23.S 31.2 23.8 32.7 24.7 32.6 25.0 33.2 1960 22.6 30.S 22.6 30.6 23.1 32.0 24.0 32.8 24.6 32.9 24.0 31.9 1961 22.4 29.9 23.1 30.8 23.3 32.4 24.3 33.2 24.6 32.8 23.8 31.S _ 1962 22.S 29.7 22.3 29.S 22.8 31.6 23.6 33.4 24.3 33.3 23.8 32.6 1963 22.4 29.2 22.2 30.0 21.9 31.0 22.2 . 32.S 24.7, 33.S 23.7 32.1 1964 22.9 31.S 22.S 30.S 23.0 32.0 24.2 33.3 24.S 32.2 23.8 31.0 1965 22.4 29.6 22.2 29.9 22.8 30.6 23.7 31.8 24.2 33.0 23.6 31.4 1966 22.8 30.7 22.8 31.4 23.4 32.3 24.6 33.S. 24.4 32.8 24.3 32.8 1967 22.3 29.3 22.0 29.7 22.0 30.S 23.3 33.0 24.S 34.2 24.6 32.7 1968 22.7 30.l 21.9 30.1 22.8 31.9. 23.9 32.6 24.6 34.0 24.5 32.8 1969 22.9 30.6 23.3 3 I. I 22.7 31.S 24.2 33.] 25.3 33.7 24.2 32.2 1970 23.2 31.0 23.2 31.2 24. I 1 32.S 24.8 33.4 25.7 34.(J 25.0 32.3 1971 23.0 29.S 23.9 29.8 23.0 30.S 23.7 32.0 25.2 31.7 24·_7 30.9 1972 23.3 29.1 23.4 31.2 23.1 31.0 23.9 32.3 24.6 33.3 24.9 31.9 1973 22.9 31.S 22.8 30.3 23.0 32.4 24.3 33.8 24.9 34.0 25.S 33.7
ISO
l

AND MAXIMUM TEMPERATURES IN THE PHILIPPINES 1958-73 centigrade)
' July August September
I October November December
-Mini- Maxi- Mini- Maxi- r.lini- Maxi- Mini- Maxi- Mini- Maxi- Mini- Maxi-mum mum mum mum mum mum mum mum mum mum mum mum
24.5 32.6 24.U 32.5 25.Q 32.8 24.1 31.4 23.0 30.4 22.1 30.2 24.0 31.8 24.5 32.1 24.1 3 1.9 23.9 32.3 23.6 31.3 · 22.7 ,30.8 24.3 32.4 25.1 32.8 23.4 31.2 23.9 31.0 23.0 30.5 22.3 29.7 24.4 32.2 24.8 31. 7 24.8 31.6 23.1 31.2 22.6 3 I .S 22.8 30.4 24.S 31.6 23.7 31.6 23.6 30.9 23.8 32.2 23.0 31.0 21.8 30.3 24.1 32.4 23.9 31. 7 24.9 32.2 22.5 31.4 23.1 31.2 22.7 31.0 23.7 . 31.9 25.2 32.5 24.2 32.2- 23.4 3 1.5 23.5 31.3 22.5 29.8 24.4 31.0 23.8 32.3 24.5 - 32.1 23.3 3 1.6 23.4 3 I. 7 22.9 31.0 24.0 31.4 24.9 32.8 25.8 33.3 23.6 3.1.9 23.C, 32.0 23.5 3 I .3 25.1 32.1 25.3 31. 7 . 24.7 31.5 23.9 31.4 23.1 30.8 21.9 30.3 25.4 32.6 25.3 32.2 25.6 32.4 23.0 3.1.5 21.9 29.7 22.(J 30.3 25.0 31.5 24.6 32.1 25.1 32.2 23.6 32.3 23.2 30.9 23.0 30.2 24.3 32.2 25.1 32.3 24.2 32.5 23.8 31.6 23.6 30.8 23.7 3 I. 7 24.5 30.8 24.7 32.2 25.3 32.8 24.6 31.1 24.4 30.6 24.2 30.6 25.7 33.3 24.9 32.5 25.0 32.2 24.9 32:8 24.6 32.2 24.1 31.9 25.2 33.2 2S.4 32.8 24.9 32.6 25.3 32.1 24.7 3 1.9 24.2 30.4
\ 24.1 31. 7 24.0 31.7 24.1 32.2 24.1 31.4 23.7 3 1.0 23.3 30.4 23.6 31.2 23.5 30.9 23.5 3 I .4 23.8 31.0 23.3 30.8 · 22.8 30.5 24.1 32.2 24.2 31.6 23.5 31.2 23.4 31.1 .. 23.4 31.4 22.3 30.8 13.4 31.0 23.8 31.0 23.6 31.5 22.8 30.8 23.1 31.0 22.8 30.7 23.4 30.7 23.8 31.1 23.9 30.8 23.9 31.5 23.3 31.4 22.6 30.9 23.8 31.7 23.8 31.0 24.1 31. 7 22.1 · 31.6 23.7 3 I. 7 23.1 31.5 23.5 31.8 24.3 31.6 24.0 3 I. 7 23.4 31.4 23.2 30.9 23.1 -30.5 23.6 30.7 23.3 31.5 23.3 31.3 23.6 31. 7 23.6 · 31.6 22.9 30.3
I 23.8 31.3 23.9 32.2 . 24.2 31.8 23.7 32.0 23.7 3 I. 7 23.5 30.5 23.9 31.2 24.0 31. 7 23.7 32.2 22.8 . 31.3 22.8 30.7 22.2 30.3 24.2 31.6 24.2. 31.2 23.8 31.8 23.7 31.6 22.4 30.5 23.1 30.1 24.2 3 I. I 24.1 31.8 24.1 31.4 23.7 32.0 23.4 31.3 23.5 31.0 24.2 31.3 24.1 31.5 24.1 31. 7 23.9 31.4 23.8 30.8 23.7 30.9 24.3 30.5 24.7 32.1 25.0 '32.1 24.5 30.8 24.5 30.0 24.3 30.9 24.8 31.6. 24.7 32.0 24.7 31.1 25.0 32.9 24.6 31.2 24.3 31.4 25.2 31.5 •25.1 31:6 25.2 31.6 24.8 32.1 24:.8 3 1.2 · 24.5 30.8
. '
151

Table 5.11 - MONTHLY AVERAGES OF DAILY MINI BY KEY STATION: CY
(In degrees
Station/ January February March April May June
Calendar Mini- Maxi- Mini- Maxi- Mini- Maxi- Mini- Maxi- Mini- Maxi- Mini- Maxi-Year mum mum mum mum mum mum mum mum mum mum mum mum.
DAGUPAN 1958 22.0 31.4 22.5 31.3 23.6 -34.5 24.3 35.2 25.8 35.9 24.9 31.9 1959 21.2 29.7 22.1 32.9 23.7 33.2 24.7 34.7 24.8 34.6 25.1 34.8 1960 22.4 31,1 22.9 31.7 23.3 33.4 24.9 33.2 25.2 34.2 25.1 32.2 1961 20.0 29.8 22.0 31.6 24.1 33.4 24.9 35.3 25.4 33.6 24.8 32.3 1962 21.2 29.5 20.7 31.0 24.0 32.7 24.7 34.2 25.1 35.1 24.7 33.3 1963 20.5 29.2 20.6 30.7 _ 22.1 32.7. 24.0 34.6 25.2 35.6 24.6 30.5 1964 21.8 32.4 21.6 32.0 23.0 33.3 24.1 35.9 24.8 34.2 24.4 33.0 1965 20.4 29.7 21.0 32.2 22.6 32.4 23.3 34.6 24.0 33.1 24.3 32.0 1966 21.4 32.1 22.4 33.4 23.5 34.8 24.7 35.5 24.6 31.9 25.3 33.8 1967 20.8 31.8 20.6 31.6 22.2 32.6 24.1 34.1 24.7 35.0 24.2 31.6 1968 -20.1 31.4 19.8 30.-5 22.3 33.5 23.1 34.1 24.0 34.6 24.0 34.5 1969 20.5 33.0 20.0 31.5 22.3 34.I 2:3.9 35.8 24.4 35.7 24.2 34.1 1970 20.9 32.0 ·20.5 32.7 22.9 34.2, 24.1 35.6 24.1 35.5 23.8 32.9 1971 20.6 30.4 21~8 32.3 22.0 32.8 24.1 34.4 25.1 · 33.7 25.1 32.9 1972 22.4· 31.3 22.6 31.5 22.0 31.9 24.4 34.7 25.4 34.8 25.6 33.6 1973 22.8 31.5 22.7 33.8 22.8 34.5 24.4 36.7 26.0 36.0 25.8 33.8
DAVAO 1958 22.4 31.9 22.1 32.6 22.1 33.5 23.4 34.3 23.7 33.0 23.5 31.6 1959 21.9 30.6 21.5 32.5 23.1 32.9 23.3 . 32.6 23.3 32.1 23.3 31.5 1960 22.1 31.6 22.3 31.4 22.3 32.4 23.4 32.5 23.3 32.8 22.9 31.4 1961 21.2 30.1 22.1 31.1 22.1 32.7 22.8 32.6 22.9 31.9 22.1 31.4 1962 22.2 29.6 22.0 29.4 22.0 31.3 22.8 32.5 23.2 32.1 22.7 31.7 1963 22.4 29.6 21.8 29.2 22.4 31.2 22.8 33. 1 23.2 33.2 23.1 31.9 1964 22.2 31.8 22.1 3Q.2 21.9 32.1 22.8 32.1 23.3 32.2 22.9 31.4 1965 21.9 30.4 22.1 30.6 22.7 31.5 22.6 · 32.4 23.0 32.4 22.8 31.4 1966 21.0 30.6 21.3 31.8 22.6 33.5 23.2 33.3 23.5 31.9 22.9 31.9 1967 22.5 31.1 22.2 31.5· 2-2.6 32.2 22.9 33.7 23.3 32.8 23.5 32.3
.1968 22.2 30.5 22.1 31.1 22.2 33.0 23.0 34.0 22.9 32.8 23.0 32.4 1969 21.3 30.4 21.8 31.3 22.0 32.4 22.6 33.7 23.8 33.7 23.3 32.0 1970 21.7 31.4 21.8 31.6 21.9 31.9 22.4 33.1 22.9 33.0 22.7 32.2
.. 1971 23.7 31.0 24.0 30.9 24.4 32.7 24.9 33.7 25.0 33.0 24.6 31.6 1972 23.9 31.9 23.9 31.7 23.9 31.5 24.3 33.5 24.9 33.0 24.9 32.2 1973 24.1 33.2 24.5 33.4 24.8 33.3 25.4 32.5 . 25.2 33.0 25.3 32.7
152

~
► MUM AND MAXIMUM TEMPERATURES IN THE PHILIPPINES
t I 9 58-73 (continued) centigrade)
: I
' July August September October November December
t
Mini- Maxi- Mini- Maxi- Mini- Maxi- Mini- Maxi- Mini- Maxi- Mini- Maxi-mum mum mum mum mum mum mum mum mum mum mum .mum
24.6 31.7 24.5 31.9 24.4 ·31.2 24.7 32.3 · 22.6 30.9 21.2 31.1
I. 24.5 33.0 24.4 . 31.0 24.7 31.6 24.1 32.0 23.6 31.5 22.5 31.9 24.9 32.7 24.5 30.2 24.6 31.9 24.2 31.2 23.1 32.4 22.2 30.7 24;5 30.2 24.6 30.8 24.6 30.7 23.8 31.3 22.5 31.9 22.4 3 I .4· 24.3 31.0 24.8 31.7 24.4 31.5 24.4 32.6 23.2 32.2 21.7 32.1 24.7 31.1 25.1 31.8 24.7 31.2 24.3 33.0 22.9 33.4 22.2 31.5 24.5 32.0 24.1 31.0 24.4 31.5 24.2 31.7 23.3 30.1 2t.8 29.8 24.1 30.8 24.6 32.0 24.6 32.2 23.9 33.5 23.6 33.2 21.8 32.8 24.7 33.2 24.9 31.9 23.8 30.3 24.0 33.3 23.4 31.8 22.8 32.2 24.4 31.9 23.9 29.9 23.9 31. 7 23.4 31.2 22.0 32.0 20.4 30.5 24.0 32.7 23.6 30.4 24.2 31.6 22.9 33.4 20.9 32.8 20.2 32.8 23.6 32.3 23.7 32.4 23.5 31.9 22.9 33.6 21.9 32.4 21.6 32.4 23.7 32.4. 23.2 3 I. I · 23.1 31.8 23.1 32.4 22.6 33.2 21.5 · 32.2 25.0 31.9 24.7 32.6 25.3 32.4 24.9 32.4 23.9 31.9 23.2 31.2 25.1 29.1 24.7 30.3 25.5 33.6 25.1 34.0 24.2 34.1 22.4 3 1.9 25.5 32.9 25.2 31.9 25.5 33.1 25.1 32.2 24.6 32.4 22.6 3 1.5
23.0 31.6 23.0 31.5 23.0 31.5 23.5 32.0 23.1 31.8 22.8 31.8 22.9 31.5 22.8 30.7 22.6 31.3 22.7 31.8 22.9 31. 7 22.3 32.7 22.6 31.4 22.9 31.5 22.2 31.6 22.0 32.1 22.0 31.3 21.7 30.8 21.6 31.4 22.0 31.6 22.3 31.8 22.4 32.0 . 22.3 32.7 22.5 3 1.5 22.9 31.7 22.8 31.6 22.7 31.2 23.1. 32.6 22:1 31.7 22.7 3 I. I 22.7 31.9 22.9 31.2 23.2 32.0 22.8 32.2 22.8 32.3 22.2 32.3 22.3 31.4 22.6 31.7 · 22.7 31.6 22.7 32.0 22.6 31.8 22.4 3 I. 7 22.6 31.4 22.7 31.4 22.9 31.6 22.6 32.3 · 22.3 32.4 21.9 3 I. I 23.0 31.9 23.1 31.4 23.2 32.4 23.0 32.0 22.9 32.3 22.6 31. 7 23.2 32.3 23.2 32.5 23.3 32.6 22.8 32.2 22.8 32.3 22.2 32.3 22.9 32.4 23.2 31.9 22.8 32.6' 22.8 32.0 22.6 32.8 · 22.4 29.7 22.3 32.0 22.5 31.8 22.6 31.8 22.5 32.9 22.4 31.9 22.2 32.1 21.9 32.2 21.6 31.8 21.7 32.9 21.8 32.2 21.4 32.1 21. 7 30.9 24.7 31.6 24·_5 32.3 24.9 32.7 24.6 31.7 24.5 32.6 24.3 31.8 25.3 32.2 24.6 32.4 24.8 32.0 25.1 33.2 24.9 32.6 24.6 32.5 25.1 32.7 25.2 32.6 25.0 32.3 n.a. n.a. n.a. n.a. n.a. n.a.
153

Table 5.11 - MONTHLY AVERAGES OF DAILY MINI BY KEY STATION: CY
(In degrees
' Station/ January February March April May June
Calendar Mini- Maxi- Mini- Maxi- Mini- Maxi- Mini- Maxi- Mini- Maxi- Mini Maxi-Year mum mum mum mum mum mum mum mum mum mum mum mum
JLOILO 1958 23.3 28.9 23.3 29.5 23.7 30.2 14.5 30.6 25 .. 8 31.8 25.5 30.7 1959 22.9 28.3 23.4 29.4 24.0 29.6 24.6 31.2 25.0 31.6 25.2 31. 7 1960 23.2 29.3 23.2 29.4 23.8 30.6 24.9 31.2 25.0 31.8 24.7 30.3 1961 22.3 27.8 23.4 29.3 24.0 30.8 25.-1 31.9 25.1 31.5 24.6 30.4 1962 22.9 28.1 22.4 27.3 23.5 29.7 24.6 31.8 25.3 31.5 24.7 31.3 1963 22.0 27.0 21.7 27.3 22.7 28.6 23.5 30.6 25.0 31.8 24.8 29.6 1964 23.3 29:2 22.8 28.2 23.6 29.7 24.9 30.9 24.4 31.0 24.6 30.8 1965 22.6 27.6 22.6 28.1 23.2 28.9 24.7 30.6 25.1 31.6 24.6 29.7 1966 22.8 28.6 23.0 29.0 23.8 30.5 25.3 31.6 24.9 30.0 2:i.0 31.0 1967 22.8 27.6 22.7 27.7 23.0 29.0 24.3 31.0 25.7 31. 7 25.5 30.0 1968 22.2 27.9 21.6 28.5 23.1 30.3 24.3 31.7 25.6 33.5 25.4 32.5 196!) 22.9 29.3 22.6 29.5 23.6 31.0 25.4 32.7 25.9 33.2 25.4 31.5 1970 23.7 29.2 23.5 29.3 24.5 30.7 25.4 31.8 26.1 32.8 25.3 31.2 1971 23.0 28.1 23.8 28~7 23.1 28.9 23.8 30.5 25.5 31.2 24.9 30.1 1972 23.2 28.2 23.6 29.7 23.7 · 29.5 24.7 31.4 25.3 32. I 25.4 31.3 1973 23.2 30.2 23.3 31. 7 23.0 33.0 24.8 34.8 25.7 36.0 26.1 33.4
LAOAG 1958 19.9 29.9 19.7 29.2 20.9 31.6 23.3 33.2 25.0 33.8 24.3 30.6 1959 18.3 28.7 20.3 31.1 21.7 32.2 22.7 32.8 24.4 33.6 24.9 33.1 1960 20.3 30.1 21.1 31.6 21.1 32.1 24.0 33.0 24.8 33.6 24.7 32.0 1961 I 7.4 29.1 18. 7 29.9 21.2 31,.7 23.2 33.0 24.7 33.1 24.1 31. 7 1962 19.0 28.8 17. I 30.4 21.6 31.3 23.2 32.6 24.6 33.6 24.2 .32.5 1963 17.6 27.4 17.6 30.0 19.2 30.4 21.2 31.8 24.0 33.6 23.7 30.7 1964 19.1 30.8 19.6 30.8 20.9 31.4 22.9 .32.9 24.5 33.8 23.9 31.9 I 965 19.1 28.6 18. 7 30.5 20.2 31.1 22.7 32.7 24.1 32.9 23.0 30.9 1966 18.9 30.5 20.2 31.5 21.1 32.2 23.4 33.2 24.4 32.6 24.2 32.8 1967 18.5 30.3 18.2 30.5 .19.9 30.9 22.9 31.8 23.6 33.2 23.4 30.9 1968 22.4 30.0 · 21.9 29.5 22.7 31.1 22.5 32.9 23.5 33.6 23.6 33.3 1969 19.2 30.3 18.8 30.0 21.4 32.0 23.0 33.2 24.3 34.3 24.9 32.3 1970 I 9. I 30.1 18.2 31.2 21 .4 32.6 23.3 33.9 24.6 · 34.5 24.4 33.1 I 971 I 9.5 29.9 21.9 3 1.2 21.4 32.4 23.7 33.3 25.2 34.4 25.6 32.6 1972 20.9 29.9 21.4 31.7 20.9 31.8 23.9 34.8 25.6 35.0 25.9 33.7 1973 21.1 31.4 22.1 32.9 22.4 34.0 25.1 35.0 25.9 35.7 25.9 33.9
154

MUM AND MAXIMUM TEMPERATURES IN THE PHILIPPINES 1958-73 (continued) centigrade)
Jul:t. August September October November December
Mini- Maxi- Mini- Maxi- _Mini- Maxi- Mini- Maxi- Mini- Maxi- Mini- Maxi-mum mum mum mum mum mum mum mum mum mum mum mum
24.9 30.0 24.5 30.4 25.4 29.9. 24.6 30.3 23.9 29.2 . 23.2 28.5 24.3 30.3 24.3 29.5 24.4 30.2 24.4 29.8 24.0 29.8 23.5 29.2 24.7 30.9 24.7 30.0 24.1 30.2 · 24.1. 30.0 23.9 29.6 23.2 29.2 24.5 29.5 24.4 29.2 24.6 29.9 23.6 29.9 23.9 30.l 23.9 29.3 24.2 29.7 24.0 29.4 24.0 29.4 24.8 31.0 23.9 29.8 23.0 28.5 24.9 29.9 24.2 29.5 24.3 29.5 23.8 30.2 24.0 29.6 23.6 29.4 24.5 30.4 25.0 30.2 24.6 29.9 24.1 30.2 23.8 29.3 23.4 28.7 24.3 28.6 24.3 30.0 23.9 29.4 24.1 . 30.1 24.1 29.9 23.5 28.6 24.5 30.1 24.9 29.9 25.2 29.7 24.0 30.1 24.1 30.1 24.3 29.2 25.4 29.0 25.3 28.5 25.8 29.4 25.0 29.2 24.8 29.1 22.4 28.4 25.3 31.4 25.0 29.9 25.0 30.4 24.1 30.0 22.8 29.0 23.l 28.5 24.4 30.7 24.8 30.4 24.7 30.0 24.4 30.9 24.2 30.3 24.1 29.4 25.0 30.6 25.2 30.0 25.0 30.7 24.7 30.6 24.7 30.2 24.5 29.8 24.9 29.5 25.0 30.4 25.2 30.4 24.9 29.8 24.7 30.0 24.8 29.8 25.9 29.7 25.6 29.9 25.1 30.1 · 25.3 31.5 25.2 30.2 24.8 29.7 25.7 31.2 25.5 30.9 25.4 31.0 25.5 31.0 25.4 30.8 24.7 30.3
24.3 31.0 23.9 31.6 24.0 30.5 23.7 31.6 21.6 31.6 19.3 30.2 24.0 31.7 23.8 30.5 23.3 31.4 22.1 31.4 22.0 30.8 20.8 31.6 24.1 32.2 24.0 30.0 23.6 31.3 22.8 31.8 20.7 32.6 20.1 30.4 23.2 29.5 23.6 30.1 23.3 30.0 21.9 31.7 20.3 32.0 20.2 30.2 23.9 30.4 23.7 31.0 23.7 31.3 23.5. 31.3 21.9 31.5 19.0 30.5 23.7 30.7 24.4 32.0 24.1 31.0 21.9 32.2 20.9 32.5 21.2 30.2 23.3 32.0 23.9 30.3 23.9 30.0 23.5 31.6 ·23.3 29.2 19.6 28.8 23.8 30.9 23.9 31.3 23.3 31.3 21.8 32.4 21.8 32.2 19.1 31.6 24.2 32.0 24.2 31.1 23.0 30.2 22.l 32.4 23.1 30.6 21.7 30.3 24.2 31.5, 23.9 30.4 23.1 30.9 . 22.2 30.5 21.2 31.1 19.1 28.9 24.1 32.0 24.2 30.1 24.7 30.8 23.6 31.7 22.5 32.0 23.3 30.7 24.1 31.7 23.·5 31. 7 23.8 30.9 22.4 31.6 22.2 30.5 20.3 31.3 24.3 32.2 23.8 31.l 23.4 30.9 23.5 31.7 22.9 31.7 21.5 31.6 25.3 31.6 25.0 31.8 25.0 31.5 24.3 31.0 22.6 30.2 22,0 30.6 25.4 30.3 25.9 31.1 25.4 33.2 24.2 34.6 23.8 34.7 22.0 32.1 25.8 32.4 25.2 31.4 25.6 32.8 24.7 32.1 23.7 31.3 20,8 30.3
155

r Table 5.11 - MONTHLY AVERAGES OF DAILY
BY KEY STATION: CY (In degrees
Station/ . January February March April May · June
Calendar Mini- Maxi- Mini- Maxi- Mini- Maxi- Mini- Maxi- Mini- Maxi- Mini- Maxi-Year mum mum mum mum mum mum mum mum mum mum mum mum
PUERTO PRINCESA 1958 23.5 32.0 23.2 31. 7 23.6 32.2 24.1 33.0 24.7 32.6 24.1 31.9 1959 22.9 31.6 23.0 32.1 23.7 32.1 24.0 33.0 24.9 33.2 24.0 31.8 1960 23.2 30.8 23.3 31.2 23.6 32.1 24.3 33.2 24.6 32.0 23.6 30.1 1961 21.3 30.7 · 22.2 31.9 22.7 32.8 23.8 · 33.6 22.9 32.1 22.1 31.1 1962 23.2 31.1 22.5 31.3 23.6 32.4 24.4 33.5 24.9 32.8 23.9 31.8 1963 22.6 29.8 22.2 30.1 23.2 31.5 23.0 32.5 25.0 33.7 24.1 31.1 1964 23.0 31.1 23.5 3 I. I 23.6 32.4 24.9 33.3 24.7 32.0 23.9 31.0 1965 22.4 29.6 22.6 30.2 23.5 30.8 · 24.2 32.1 24.8 32.2 23.8 30.7 1966 23.5 31.3 23.1 32.0 24.1 32.9 25.0 33.7 24.2 31.5 24.3 31.5 1967 23.1 30.2 23.3 30.5 21.9 31.0 23.7 32.2 25.2 32.5 24.9 31.7 1968 22.6 30.9 21. 7 31.6 23.6 32.4 24.3 33.5 25.0 33.5 24.9 32.7 1969 22.2 30.8 21. 7 31.6 23.3 33.0 24.6 34.1 25.4 33.5 23.9 32.1 1970 23.1 30.9 22.7 3 I. 7 23.5 32.7 25.0 33.8 25.1 33.2 24.4 31.5 1971 23.2 30.9 24.1 30.5 23.9 31.4 24.3 32.3 25.2 32.4 24.8 31.3 1972 23.4 30.6 23.9 31.8 23.6 31.3 25.1 33.2 25.0 32.8 25.0 31.8 1973 23.4 31.6 23.2 31.5 24.0 32.2 24.9 33.1 25.5 33.3 25.5 32.1
SURIGAO 1958 2'2.9 29.3 22.1 29.4 22.1 30.4 22.7 30.8 23.9 32.1 23.8 33.0 1959 22.2 29.1 22.1 29.8 22.7 29.3 22.9 31.2 23.4 30.8 . 23.7 32.2 1960 22.5 29.6 22.3 28.9 22.5 30.9 23.4 30.9 23.2 32.3 23.6 33.0 1961 22.3 27.2 22.8 28.2 22.6 30.6 23.5 30.7 24.0 31.9 24.3 31.8 1962 22.7 27.5 22.6 27.2 22.5 29.6 22.9 31.4 23.5 31.4 23.2 32.6 1963 22.2 26.3 21.8 25.8 22.2 28.1 22.2 30.4 23.6 31.2 24.3 32.4 1964 22.7 29.2 22.9 28.9 22.7 29.9 23.4 30.2 24.4 31.6 23.2 31.8 1965 23.4 28.3 23.1 28.2 22.9 28.9 23.7 30.7 24.1 31.9 23.8 31.9 1966 22.5 29.8 22.8 30.2 23.3 30.6 24.0 32.1 24.1 33.0 23.4 32.4 1967 22.7 28.9 22.9 27.9 22.2 29.3 22.6 30.5 23.5 32.0 24.0 32.9 1968 22.4 28.0 21.9 28.4 22.7 29.8 22.5 30.9 23.5 32.2 23.6 32.7 1969 22.6 28.8 22.0 28.9 22.5 29.7 23.4 30.9 24.4 32.3 24.2 32.3 1970 22.3 28.9 22.6 28.6 23.3 30.8 23.3 31.8 23.6 32.2 23.7 31.7 1971 23.6 27.9 24.2 28.5 23.9 28.5 24.5 30.1 25.5 31.7 25.0 31.4 1972 23.2 28.2 24.3 30.0 24.0 29.3 25.0 31.1 25.8 33.4 25.8 33.1 1973 23.9 30.7 23.8 30.0 24.2 30.5 25.2 31.2 25.7 32.3 26.0 33.5
156

MINIMUM AND MAXIMUM TEMPERA TURES IN THE PHILIPPINES ' I 958-73 (continued) centigrade)
July August September October November December ·
Mini- Maxi- Mini- Maxi- Mini- Maxi- Mini- Maxi- Mini- Maxi- Mini- Maxi-mum mum mum mum mum mum mum mum mum mum mum mum
23.4 3 I. I 23.4 3 I. I 23.5 31.2 23.7 30.8 23.3 30.3 23.0 31.4 23.5 30.7 23.2 30.0 23.5 31.0 23.2 30.2 23.6 3 I. I 23.4 31.2 23.7 31.1 23.2 31.1 . 23.3 31.1 23.0 3 I. I 23.0 30.8 22.2 31.1 22.4 31.3 23.5 31.2 23.8 31.8 23.5 31.7 23.6 32.2 23.8 31.8 23.9 30.7 23.3 30.3 23.4 30.2 23.7 32.1 23.4 31.4 23.4 30.2 23.5 30.9 23.6 30.6 23.8 31.6 23.6 31.2 23.8 31.4 23.5 30.9 23.8 31.0 23.5 30.8 23.7 30.5 29.7 30:1 23.5 30.2 23.3 30.2 23.5 30.4 23.9 30.9 24.0 30.6 24.2 31.5 24.2 31.1 24.3 31.4 23.8 · 30.5 24.0 31.2 24.2 31.4 24.2 31.0 23.9 31.5 24.r 31.4 23.9 30.7 22.3 30.9 22.I 31.5 22.7 31.0 23.0 31.3 22.7 31.4 24.6 32.2 24.5 31.3 23.9 31.0 24.0 31.4 23.5 31.0 23.6 31.3 23.4 30.8 23.6 3 I .4 23.6 31.1 23.9 32.1 23.7 30.8 23.8 31.0 23.7 3 I. I 23.6 30.9 23.3 3 I .3 23.7 31.0 23.7 31.5 23.4 31.0 24.5 31.4 24.6 31.0 24.6 31.4 24.4 30.7 24.2 31.1 24.5 30.7 25.0 32.1 24.6 31.6 24.6 3 I. I 25.2 32.3 25.1 31.3 24.4 31.3 25.1 31.6 24.8 31.2. 24.7 30.8 24.9 · 31.0 24.9 30.5 24.8 31.0
23.9 31.9 23.6 31.8 24.0 32.6 23.7 31.0 23.4 30.3 22.4 29J 23.4 31.8 23.2 31.8 23.6 32.4 23.5 31.5 23.3 30.6 22.9 30.5 23.5 33.2 24.5 33.5 23.3 32.1 24.0 31.4 23.0 29.8 22.4 29.0 23.8 28.2 24.6 31.7 24.2 31.7 22.8 31.4 22.9 30.4 23.0 29.7 24.2 31.5 23.6 31.4 24.6 31.0 23.8 31.5 23.4 30.2 22.3 28.6 23.4 32.0 23.6 30.8 24.7 31.9 23.1 31.1 23.0 29.6 22.7 30.2 22.9 31.8 24.2 32.0 23.4 31. 7 23.2 31.I 22.0 22.0 23.6 30.6 24.2 31.1 23.6 32.0 24.0 31.8 23.3 31.3 23.0 30.6 23.0 29.6 23.3 30.8 23.9 32.6 24.5 32.4 23.3 31.1 23.0 30.8 23.1 29.7 24.5 31.7 24.9 32.1 24.4 31.9 23.5 30.9 23.2 29.9 22.4 28.3 24.1 32.7 24.2 32.1 24.7 32.0 23.6 30.5 22.5 29.0 23.3 28.3 24.0 30.9 23.9 32.0 24.5 31.5 23.2 31.4 22.9 27.9 23.1 28.9 t3.4 31.4 23.7 31.7 23.3 32.1 23.4 30.6 23.0 30.2 22.7 29.8 24.8 31.3 25.0 32. I 25.3 32.8 24.8 30.6 24.7 30.1 24.7 29.9 25.8 32.7 25.3 32.3 25.7 32.4 25.7 32.9 25.1 30.6 25.1 30.8 25.6 33.1 25.5 33.0 25.3 32.1 25.3 31.4 24.9 30.1 24.8 30.1
157

Table 5.11 - MONTHLY AVERAGES OF DAILY MINI BY KEY STATION: CY
(In degrees
Station/ January February March April May June
Calendar Mini- Maxi- Mini- Maxi- Mini- Maxi- Mini- Maxi- Mini- Maxi- Mini- Maxi-Year mum mum mum mum mum mum mum mum mum mum mum mum
LEGASPI 1958 22.8 29.0 22.3 28.9 22.9 29.3 23.8 30.6 24.6 31.9 24.5 33.0 1959 22:4 28.6 22.7 28.9 23.0 29.5 23.6 31.2 24.3 31.5 24.9 33.2 1960 23.3 29.4 22.9 29.2 23.5 30.5 24.1 31.4 24.7 31.6 24.3 32.4 1961 22.0 27.5 23.2 29.S 23.4 31.0 24.3 31.3 24.4 32.2 24.3 31.8 1962 22.3 27.9 22.1 28.0 23.4 29.8 23.6 31.3 24.2 31.5 23.8 32.8 1963 21.5 27.6 21.5 27.5 21.7 29.1 22.6 31.0 23.8 32.1 24.1 32.3 1964 22.5 29.4 22.6 28.9 22.6 30.1 23.6 30.4 24.2 32.2 24.1 32.4 1965 22.0 28.2 22.9 29.3 22.2 29.5 23.5 31.0 23.5 31.8 23.7 32.3 1966 22.4 29.1 22.7 30.0 22.7 30.4 23.7 31.7 23.8 32.4 24.1 32.7 1967 22.5 28.3 22.2 28.9 22.3 29.9 22.9 31.4 23.9 33.3 24.2 32.7 1968 21. 7 28.6 20.9 29.4 22.8 29.0 22.9 31.8 24.2 33.8 23.6 34.3 1969 21.9 29.6 21.0 30.0 22.3 31.3 23.5 . 31.8 24.4 33.8 23.7 34.2 1970 21.4 29.5 21.6 29.8 22.3 31.2 22.8 32.0 23.5 33.7 23.1 33.2 1971 22.5 28.3 23.4 28.5 22.9 29.0 25.0 31.3 25.3 31.9 25.2 31.0 1972 23.4 28.1 24.2 29.7 23.4 28.9 24.8 30.3 25.3 · 31.7 25.6 32.1 1973 23.0 29.2 23.0 29.9 23.1 30.3 24.6 31.0 25.5 32.6 25.9 33.0
MANILA 1958 22.9 30.4 22.8 30.9 23.4 32.6 24.4. 33.5 26.2 33.9 25.4 31.5 1959 22.3 29.8 22.3 31.3 23.4 32.1 24.8 34.0 25.5 34.2 26.5 33.0 "!960 22.6 29.5 23.0 29.9 23.6 32.1 25.2 32.6 25.4 32.3 25.3 31.2 1961 21.0 28.8 22.5 30.6 24.5 31.7 25.4 33.3 25.9 32.8 24.3 31.1 1962 21.8 28.7 21.6 29.2 23.9 31.8 24.8 32.3 25.8 33.0 25.2 31.9 1963 21.2 27.1 21.2 28.2 22.5 30.6 24.2 32.0 25.6 33.6 24.5 30.3 1964 23.1 30.8 23.0 30.1 24.2 31.6 25.0 33.0 25.4 33.3 24.7 32.4 1965 21. 7 -2.0 22.3 30.4 23.4 31.3 24.9 33.3 25.4 32.8 25.3 32.2 1966 22.8 31.0 23.4 31.1 24.6 32.5 25.9 33.8 25.6 31.5 26.1 32.8 1967 22.6 29.5 22.2 29.5 23.6 31.0 25.4 32.5 26.5 33.2 24.7 31.4 1968 22.1 29.2 21.8 29.6 23.9 31.6 24.8 32.5 26.1 33.5 26.0 33.0 1969 22.9 30.4 22.6 30.5 24.6 32.2 25.8 33.3 27.6 34.1 26.6 32.5 1970 22.4 30.1 22.6 30.0 24.1 32.4 25.0 33.5 25.6 34.4 24.6 32.0 1971 n.a. n.a. n.a. n.a. n.a. n.a. n.a. n.a. n:a. n.a. n.a. n.a. 1972 n.a. n.a. n.a. n.a. n.a. n.a. n.a. n.a. n.a. n.a. n.a. n.a. 1973 n.a. n.a. ii.a. n.a. n.a. n.a. 24.2 34.5 25.0 34.9 25.7 33.1
n.a. - Data not available.
158

MUM AND MAXIMUM TEMPERATURES IN THE PHILIPPINES 1958-73 (continued) centigrade)
July August September October November December
Mini- Maxi- Mini- Maxi- Mini- Maxi- Mini- Maxi0 Mini- Maxi- Mini- Maxi-mum mum mum mum mum mum mum mum mum mum mum mum
24.1 31.6 23.9 31.1 24.3 31.9 23.7 30.4 23.4 29.5 22.4 29.4 23.8 32.4 24.0 31 :5 23.6 32.1 23.8 31.4 23.5 30.2 23.5 29.3 24.4 32.1 . 24.8 32.5 23.5 31.4 23.3 30.7 23.3 29.7 22.7 29. l 24.0 31.7 24.2 31.3 23.9 31.8 22.8 31.2 23.5 30.0 23. l 29.3 24.1 31.0 23.5 31.6 23.4 30.7 23.8 31.9 23.2 30.2 22.9 29.0 23.9 32.3 23.1 32.3 23.6 31.7 22.8 31.5 23.8 30.2 22.9 29.7 23.7 32.5 24.4 32.0 23.5 31.8 23.4 31.4 23.2 31.0 22.6 29.2 23.4 30.8 23.7 32.1 23.8 31.7 23.2 31.0 23:5 30.9 23.2 29.6 23.4 31.9 23.8 ,32.7 23.7 31.8 23.0 31.4 23.3 31.4 23.4 30.1 23.9 32.0 23.8 31.0 23.3 31.7 22.9 31.5 22.2 30.0 21.9 28.9 23.8 32.9 23.9 32.4 23.4 32.5 22.1 31.4 21.4 29.7 22.1 29.2 23.2 32.4 22.7 31.8 22.7 31.4 21.7 31.6 21.8 30.6 21.9 29.5 23.1 33.0 23.0 31.8 23.0 32.2 23.2 31.2 23.0 30.9 23.3 30.2 24.8 30.7 25.2 31.5 25.2 31.9 24.9 30.4 24.4 29.9 24.6 28.9 25.4 31.7 24.8 31.4 24.9 31.3 24.8 31.8 24.8 30.0 24.3 30.0 25.2 32.1 25.0 31.6 25.0 3-1.2 24.8 30.6 24.9 30.7 23.9 28.4
24.8 31.2 24.7 31.8 24.7 30.6 24.4 31.1 23.4 30.5 21.9 30.0 24.7 30.8 24.2 29.6 24.6 30.5 24.4 30.7 23.9 30.0 22.8 29.8 25.1 31.2 24.0 29.6 22.8 30.6 23.8 30.0 23.8 30.9 22.8 29.3 24.4 29.4 24.5 29.3 24.6 29.8 24.0 30.2 23.3 30.4 23.3 30.3 -2.0 -2.0 24.3 30.5 24.0 29.2 24.6 31.3 23.5 30.3 22.4 29.4 24.4 30.3 24.5 30.9 24.0 29.6 24.5 31.4 23.9 31.4 23.8 30.3 25.0 31.5 24.3 30.4 24.7 31.2 24.7 31.6 23.6 29.8 22.8 29. l 24.5 30.4 24.5 30.8 24.5 30.8 24.2 31. 7 24.2 31.5 23.1 30.9 25.1 31.9 25.2 3 I. l 24.7 29.9 24.9 3 I. I 24.8 31.4 24.0 30.2 25.2 30.8 24.9 '29.4· 24.8 30.3 24.5 30.8 23.7 30.3 '22.3 29.5 25.0 31.4 25.0 30.4 25.l 30.5 24.2 31.2 23.0 30.2 22.6 29.7 25.2 31.1 24.5 30.9 24.8 30.4 24.0 31.3 23.4 30.8 23.8 29.8 . 23·.8 31.1 24.0 30.5 23.9 30.8 24.3 -30.8 24.6 30.7 n.a. n.a. n.a. n.a. n.a. n.a. n.a. n.a. n.a. n.a. n.a. n.a. n.a. n.a. n.a. n.a. n.a. n.a. n.a. n.a. n.a. n.a. n.a. n.a. n.a. n.a. 25.4 31.0 25.0 30.7 24.9 30.7 24.7 29.8 24.2 30. l 22.6 28.7
159
,\

Table 5.11 -MONTHLY AVERAGES OF DAILY MINI BY KEY STATION: CY
(In degrees
Station/ January February March April May June
Calendar Mjni- Maxi- Mini- Maxi- Mini- Maxi- Mini- Maxi- Mini- Maxi- Mini- Maxi-Year mum mum mum mum mum mum mum mum mum mum mum mum
TUGUEGARAO 1958 19.8 29.8 19.6 30.7 21.1 34.2 22.1 36.6 24.0 37.7 24.1 34.6 1959 19.0 29.9 20.3 32.8 21.1 31.5 22.8 36.2 23.6 36.1 24.5 37.8 1960 20.6 30.2 20.6 30.0 21.6 35.4 23.5 35.5 24.3 37.4 24.2 35.6 1961 18.4 30.5 19.6 34.0 22.1 25.0 22.7 36.8 24.1 37.8 23.9 37.1 1962 19.3 29.1 18.4 31.4 21.6 35.1 22.9 36.6 24.0 37.7 23.5 36.5 1963 17.3 26.6 18.1 28.8 20.0 33.3 21.8 36.9 24.0 39.8 24.0 35.2 1964 20.3 32.0 19.5 30.2 21.4 33.1 22.0 36.1 24.2 37.4 23.5 35.1 1965 18.8 27.5 19.0 31.8 20.3 33.6 23.0 37.5 24.1 36.4 24.3 35.5 1966 19.3 3 I. 1 20.2 32.4 21.1 34.8 23.2 36.5 23.6 33.6 23.6 35.5
· 1967 19.5 28.6 18.2 29.8 19.9 32.4 22.5 34.8 23.2 37.4 23.5 35.1 1968 18.7 28.7 17.9 30.3 21.0 34.7 21.0 35.1 23.3 37.0 22.9 35.6 1969 21.9 32.3 21. 7 33.7 22.9 35.7 24.0 36.8 25.4 39.5 24.9 36.1 1970 22.4 29.0 22.5 3 I. 7 23.4 34.8 23.9 35.7 24.7 36.8 24.6 35.8 1971 19.8 28.6 21.3 29.7 21.3 31.3 23.4 35.5 24.8 34.8 25.1 34.9 1972 21.3 28.8 21.6 32.2 20.8 30.8 23.5 34.1 24.4 35.3 25.4 35.6 1973 21.2 30.4 21.4 32.7 21.6 34.1. 23.7 37.1 25.0 38.7 25.2 36.4
ZAMBO ANG A 1958 21.8 32.6 21.5 32.5 22.4 32.6 23.1 32.7 23.8 32.2 23.4 32.0 1959 21.3 31.4 21.6 32.0 22.8 32.3 22.9 32.7 23.8 32.2 23.3 31.0 1960 21.8 31.8 22.1 3.0.9 21.8 31.7 22.9 32.1 23.3 31.9 23.3 30.9 1961 21.3 30.8 22.3 31.4 21.8 32.5 23.0 32.4 23.3 31.2 23.0 30.6 1962 22.3 30.8 22.2 31.0 22.7 31.0 22.6 32.0 23.5 31.7 22.7 31.3 1963 22.2 30.0 22.6 30.4 22.6 31.0 22.1 31.6 23.5 31.7 23.7 31.3 1964 22.4 31.3 22.4 31.4 22.7 31.3 23.4 31.7 23.9 30.8 23.0 30.4 1965 21.5 30.3 22.4 ~0.8 22.7 31.0 23.2 3 I. 7 23.6 31 .4 23.2 30.3 1966 21.7 32.7 20.0 31.8 22.1 32.1 23.3 32.8 23.6 32.4 23.2 31.0 1967 22.0 31.9 22.0 32.7 22.2 31.8 22.0 31.4 23.0 3 I. 7 23.2 31.9 1968 21.9 3 I. I 21.0 31.5 22.6 32.7 22.8 32.4 23.2 31.5 23.3 31.8 1969 21.2 31.5 21.2 31.8 22.2 32.3 22.8 32.7 23.8 32.9 23.6 31.0. 1970 22.1 31.7 21.7 32.3 22.9 32.5 23.6 32.2 23.6 31.8 23.3 30.9 1971 · 23.2 31 .3 23.8 30.9 23.6 32.0 23.7 32.4 24.6 31.7 24.2 30.8 1972 23.4 3i.4 23.8 31.9 23.6 31.0 24.3 32.1 24.5 31.8 24.5 3 I. I 1973 23.4 32.7 23.1 32.7 23.8 32.9 24.9 32.3 25.0 31.8 24.8 31.8
Source: Philippine Atmospheric, Geophysical and Astronomical Services Administration (PAGASA).
•
160

MUM AND MAXIMUM TEMPERATURES IN THE PHILIPPINES , 1958-73 (continued) centigrade)
July August September Octob'er November December
Mini- Maxi- Mini- Maxi- Mini- Maxi- Mini- Maxi- Mini- Maxi- Mini- Maxi-mum mum mum mum mum· mum mum mum mum mum mum mum
24 . .J 35.7 23.3 33.8 23.9 33.2 23.4 32.0 21.2 29.4 I 9.8 30.4 23.7 35.8 24.2 34.6 23.6 35.6 22.1 32.4 21.8 30.2 21.1 30.9 23.8 36.8 24.0 25.6 23.4 33.8 22.6 32.9 21.6 32.9 20.2 '30.0 23.3 33.2 23.7 34.8 23.3 33.9 22.2 33.2 21.0 31.1 20.8 31.0 23.2 32.9 23.2 34.7 23.1 34.0 22.8 33.0 21.5 31.6 20.1 29.8 23.7 33.9 24.1 35.2 23.7 34.1 22.2 33.3 21.7 34.1 20.8 , 29.5 23.5 34.8 24.0 33.4 23.6 33.2 23.0 32.2 22.2 26.8 20.4 27.6 23.7 33.9 23.8 34.6 23.2 33.7 21.6 32.6 21.6 31.3 19.9 30.3 23.4 34.0 23.7 35.0 22:5 33.4 21.4 33.0 22.5 30.l 21.5 · 29.2 24.0 35.8 23.7 32.2 23.3 33.9 22.0 30.7 20.9 30.2 I 9.4 27.5 23.6 35.3 23.6 33.4 23.7 34.0 21.2 32.4 19.1 30.5 I 8.3 31.1 25.0 34.9 24.6 35.0 25.1 34.2 23.6 34.1 23.2 29.5 23.0 27.5 24.3 36.7 25.1 34.5 24.2 33.5 23.8 32.2 23.6 30.2 23.7 30.0 24.8 33.2 24.8 35.2 24.8 34.2 24.2 31.1 22.7 28.5 22.2 27.8 25.2 33.2 24.6 33.3 24 .. 5 33.1 24.0 34.1 23.5 31.8 22.1 29.9 24.9 34.4 24.5 33.1 24.7 33.3 24.2 31.2 23.4 29.3 20.9 26.9
22.9 31.4 23.4 3 I. I 23.2 31.3 23.0 30.7 22.5 31.2 22.0 3 I. I 22.7 30.2 22.9 30.3 .22.8 30.8 23.0 30.8 22.9 31.5 21.9 3 1.2 22.9 30.9 23.4 3 1.5 23.1 30.5 22.7 3 I. I 22.6 31.4 21.6 31.5 22.9 31.1 23.0 31.0 22.3 31.4 22.2 30.8 22.2 31.8 22.3 · 31.7 23.3 30.8 23.0 30.6 22.8 30.5 23.0 31.5 22.9 31.1 22.9 30.5 22.9 31.3 23.3 27.7 23.4 3 I. I 22.5 30.4 22.8 31.2 21.2 30.9 22.8 29.8 22.8 30.5 23.1 30.4 22.7 30.4 23.1 30.1 22.2 30.2 23.0 30.6 22.7 30.9 23.2 31.3 22.7 32.1 22.7 32.1 · 22.2 32.7 23.1 30.4 23.4 31.2 23.1 32.2 22.8 3 I. 7 22.7 32.0 22.5 32.3 22.9 31.0 22.8 31.5 22.4 31.3 22.7 30.8 22.1 31.7 21.5 31.5 23.0 32.0 22.9 31.2 22.4 31. 7 21.3 31.8 19.2. 32.1 18.0 31.6 23.2 30.9 22.5 31.4 23.2 31.6 22.6 . 31.9 22.4 31.7 22.4 31.8 22.8 31.1 22.8 31.3 22.7 3 I. 7 23.1 31.4 22.7 31.6 22.6 31.6 24.3 30.7 24.1 31.2 24.2 31.9 24.S 31.1 24.1 3 I .4 24.2 3 I. 7 24.7 32.1 24.7 30.3 24.S 31.4 24.6 32.3 24.6 32.7 24.3 32.6 24.8 31.2 24.7 31.4 . 24.5 31.1 24.8 32.1 24.8 31.4 24.5 32.0
16 I

TABLE 5.12 NORMAL RAINFALL IN THE (In milli
Calendar CA TBA LOGAN
Year Jan. Feb. Mar. Apr. May June July Aug. Sept. Oct. Nov. Dec.
1965 270.9 . 128.5 342.9 168_.5 330.1 208.2 304.8 107.0 184. l 178.8 182.9 492.5 1966 93.4 86.4 ·69.3 33.0 281.8 139.0 414.4 116.0 104.9 381.2 328.) 528.3 1967 493.4 240.-2 68.9 48.4 56.7 102.2 172.7 206.8 498.9 198.8 467.8 207.8 1968 349.3 102.1 53.2 35.8 109.1 91.0 113. l 296.9 195.7 218.1 566.0 173 . .8 1969 52.4 10.1 2.8 79.9 65.6 298.6 213.9 214.8 233.7 166.3 200.3 340.8 197() 260.7 239.4 99.2 89.8 121.5 247.3 294.0 162.5 146.6 594.4 468.3 I 63. I 1971 183. I 180.7 389.8 198.5 369.1 345.6 352.5 110.3 160.3 420.5 222.6 139.7 1972 643.9 107.1 128.6 41.4 64.7 241.1 236.2 249.8 518.9 112.9 208.) 259.4 1973 8.7 41.0 62.6 43.8 64.2 83.2 183.8 156.3 225.4 218.3 353.5 320.I
CEBU
1965 82.8 99.7 134.7 77.9 32.8 . 287.6 86.5 182.1 67.0 221.1 109.7 146.5 1966 70.3 38.4 8.0 24.5 271.8 125.2 305.2 214.8 142.5 202.I 208.9 16 l.8 1967 463.7 73.5 77:8 12.4 57.7 I 87.9 180.4 98.5 I 13.0 107.l 139.3 59.6 1968 57. I 56.4 58.1 32.6 5.1 144.6 115 .7 134.9 177.3 147.6 265.8 41. I 1969 I 1.5 4.8 26.5 5.5 54.5 172.5 103.7• 181.9 141.3 89.0 47.5 66.2 1970 51.8 22.8 17.6 · 17.0 43.8 239.6 238.7 182.0 98.1 197.5 23 I.I 152.0 1971 84. I 53.5 21.4 86.0 184.0 301.5 137.0 96.I 253.4 295.1 138.4 77.7 1972 253.2 16.8 83.7 82.7 126.7 166.3 86.8 194.6 249.I 100.3 100.2 70.5 1973 12.3 70.0 20.4 10.8 28.4 154.1 234.4 172.1 315.5 109.7 480.3 112.8
DAGUPAN
1965 • • 66.1 137 .8 352.0 296.3 484.7 339.0 296.2 66.5 16.6 • 1966 I 0.2 1.8 2.3 105.0 687.8 209.3 429.3 344.1 945.9 62.I 118.2 15.0 1967 • 0.0 • 41.3 78.8 546.I 244.5 677.9 283.8 281.4 69.6 • 1968 0.0 0.0 1.0 149.5 131.4 175.2 561.41,499.8 373.2 29.0 64.0 0.0 1969 0.0 0.0 0.0 43.8 312.0 260.7 731.8 456.8 336.8 136.1 59.6 5.0 1970 10.2 4.0 9.7 91.9 174.1 534.3 292.5 611.4 292.9 223.3 31.4 16.9 1971 30.3 • • 85.7 1 19. 1 447.7 332.7 375.8 179.0 204.2 46.9 31.8 1972 13.5 2.1 29.5 26.4 79.8 295.8 2,659.4 'J ,273.8 201.4 59.8 2.8 15.7 1973 5.3 12.9 8.7. 26.2 250.8 270.9 201.3 494.9 165.6 184.7 36.4 •
162

PHILIPPINES BY KEY STATION: CY 1965-73 meters)
DAYAO
Jan. Feb. Mar. Apr. May June July Aug.
170.0 180.9 176.6 262.6 178.2 194.2 85.6 186.1 142.0 27.0 30.6 120.3 462.3 49.5 149.3 153.6 96.6 64.3 92. I 138.5 224.3 100.9 146.6 37.9
222.3 26.9 39.9 29.2 245.6 49.6 17 l.7 261.3 151.3 96.8 57.3 89.8 174.6 295.0 86.8 177.7 I Ol.3 200.3 119.9 49.4 141.6 122.2 249.9 239.3 145.2 70. 1 14.6 325.6 29°2.6 313.5 125.5 246.5 63.1 148.6 199.8 282.7 ·425.9 22 l.7 33.7 193.3
4_.3 19.9 · 41.3 108.5 122.6 133.3 266.8 347.6
ILOILO
57.8 12.7 81.8 33.3 70:6 249.3 360.7 267.5 81.1 2 l.l 10:5 11.0 . 514.4 255.5 364.7 115.4
\84.8 48.8 39.9 12.4 78.l 246.4 326.6 425.0 \1.5 7 .I 10.7 15. l 75.7 158.4 \73.6 409.7 6.4 • 8.9 10.0 39.3 ·152.6 426.1 125.0
25.9 7.2 35.1 5.3 151.0 414.4 195.8 256.1 9.2 4.1 5.6 84.0 94.2 168.8 353.3 182.4
143.4 23.4. 26.0 31.0 I 18.7 236.6 767.4 221.9 3.5 20.5 2.0 12.5 • 120.2 392.6 533.9
LAOAG
• 0.0 0.0 4.6 267.6 585.3 395.4 208. l 0.0 0.0 1.3 0.3 217.4 49.8 122.8 ·517.8 0.0 0.0 0.0 121.9 210.5 1,082.7 23 l.3 727.1 • 1.0 0.0 6.8 25.4 108.3 582.4 914.6
Sept.
278.7 157.6 6 I .4
126.9 291.2 168.7 329.I 302.8 320.1
219.0 234.5 102.0 14 l.2 183.6 234.9 42.6
377.0
6 480.9
-393.6 600.5 233.6 497.4
9.4 0.0 4.9 • 215.8 327.6 733.7 322.7 1,007.3 0.5 • 0.0. 7 .1 . 81.4 481.0 216.7 494.8 438.7 0.0 6.2 0.0 0.0 37.2 148.2 269.7 344.8 90.1 l.1 1.0 • 2.8 94.3 323.5 1,456.8 303.6 40.2 • 0.0 • 12.7 22.2 164.3 320.2 218.2 564.7
163
· Oct. Nov. Dec.
224.6 I 28.3 135.0 193.5 225.1 97.2 96.5 40. I 29.0
228.1 74.5 75.6 159.7 246.7 177.3 176.4 !38.6 84.1 125.4 184.0 79.6. 177.2 133.0 43.2
• • •
166.4 251.8 121.2 200.5 255.6 70.7 322.5 I 85.7 29.7
50.8 190.4 9.9 109.6 53.2 71.2 225.0 101.8 60.7 301.3 77.4 110:5 187.9 188.1 150.0 272.3 483.S 161.7
7.5 45.2 2.0 15.6 194.8 4.3
229'.3 36. l • 24.4 0.0 0.0
115.6 12.8 0.8 77.3 27.9 27.3
495.5 27.5 65.I 0.3 0.5 •
376.5 49.2 •

Calendar Year Jan. Feb. Mar.
1965 307.2 198. I 242.7 1966 592.1 1_04.8 I 55.9 1967 490.5 148".9 215.3 1968 403.3 78.5 118 .3 1969 48.2 24.1 73.I 1970 269.6 303.2 292.2 1971 391 .3 ·308.2 422.5 1972 659.2 132.9 267.1 1973 169.2 101.2 83.0
1965 I 0.7 9.3 2.3 1966 4.2 14.8 • 1967 23.7 8.7 1.0 1968 6.3 • 7 .l 1969 s".9 0.0 14.9 1970 5.9 0.3 2.6 1971 3.0 3.9 45.0 1972 38.7 * 42.2 1973 9.1 2.9 4.6
1965 84.6 1.3 56.9 1966 0.1 0.4 26.9 1967 58.6 6.4 83.8 1968 • SS.I • 1969 30.0 0.0 0.0 1970 78.9 4.3 30.2 i97! 14.7 IOI.I 101.7 1972 36.8 I 1.9 16.4 1973 9.0 0.0 37.0
"1'hc amount of rainfall is less than 0.J mm.
TABLE 5.12 NORMAL RAINFALL IN THE PHILIPPfNES ([n milli
LEGASPI
Apr. May ·June July Aug. Sept. Oct. Nov. Dec.
158.4 189.6 281.5 484.4 308.4 255.5 318.I 428.2 547.6 87.8 216.3 • 167.5 424.5 209.1 266.8 400.3 452.0 814.5
139.5 47.2 122.2 124.0 388.2 193.7 219.8 723.4 281.1 49.4 I 9.4 136.6 105.9 235.1 321.3 171.1 269.4 181.6
143.7 31.6 149.7 203.3 168. l 443.5 158.5 333.7 544.4 172.2 134.5 203.5 358.3 424.6 219.4 540.2 758.1 559.2 137.9 408.8 192.9 394.2 169.3 173.0 473.9 322.0 837.0 95.8 151.0 393.0 174.7 300.7 225.3 185.7 611.7 333.4
108.0 98.7 183.3 317.3 316.6 185.2 511.0 773.6 978.3
MANILA
o7.s 221.l 206.4 403.5 398.1 285.6 131.4 . 92.8 36.4 0.0 468.6 96.1 270.5 365.4 741.3 77.4 237.5 85.0 1.8 39.3 725.0 225.5 362.4 343.8 166.7 86.l 5.6 0.0 95.6 110.4 420.5 467 .5 312.5 99.5 12.9 • 5.6 14.9 169.0 334.7 384.7 389.6 2 I 9.1 47.0 86.0
11.8 44.5 163.7 425.4 358:6 885.l 258.5 97.0 • 52.1 116.6 303.1 333.3 211.0 94.8 309.6 270.0 145.4
1.8 162.6 417.8 1,743.8 535.1 21 I.'/ 93. I 74.7 15.3 • 24.0 189.3 302.6 320.1 145.3 276.3 170.5 75.2
PUERTO PRINCESA
29.9 194.8 394.4 160.0 212.1 127.7 708.8 206.9 91.9 60.7 248.1 105.7 275.5 211.6 171.4 280.8 219.4 81.5 85.6 59.8 87.5 221.5 191.7 126.3 ·230.2 213.3 17.5
1.6 50.3 47.0 128.I 300.0 160.5 94.4 422.2 2.8 24.9 102.6 81.4 249.2 169.5 297.3 167.0 198.3 I 32.2 5.9 132.4 160.9 162.2 I 88.1 298.4 219.3 358.5 190. I
135.6 89.6 294.3 148.2 127.0 148.7 485.5 353.5 93.6 12.7 79.4 61.9 72.3 126.6 239.6 101 .4 191.7 96.3 11.4 187.2 87.8 210.3 134.1 204.3 127.9 358.5 380.8
Source: Climatological Oi\·ision, Philippine A tmosphcric,_Gcophysical and Astronomical Services Administration (PAGASA ).
164

BY KEY STATION: CY 1965-73 (continued)_ meters)
SURIGAO
Jan. Feb. Mar. Apr. May June July Aug.
831.9 745.7 338.9 272.4 79.] 122.9 163.6 112.8 322.1 209.3 211.4 207.4 154.0 41.0 301.8 59.2 669:1 893.8 400.5 · 162.3 115.5 53.2 114.7 151.8 611.1 234.7 394.9 153.1 70.6 71.6 20.3 89.9 165.7 149.3 166.0 438.2. 135.7 129.3 311.5 80.9 456.4 606.8 314.2. 141.3 181.0 449.0 107.6 180.8 954.5 568.7 598.5 265.8 140.2 200.4 194.1 133.6
1,142.5 376.4 495.8 206.3 57.4. 168.2 78.0 235.1 81.1 15 I. I 217.9 250.9 86.5 80.0 208.3 102. l
TUGUEGARAO
35.6 9.3 9.0 10.0 126.4 123.2 429.0 119.4 5.1 21.1 52.0 36.2 407.9 152.8 · 207.1 309.l
12.3 3.9 3.9 238.8 74.1 363.5 47.3 442.2 8.2 I. I 9.4 75.3 69.2 203.8 232.3 512.7 0.8 • 1.5 52.9 83.4 160.9 224.5 71.3
47.3 1.8 134.7 34.8 185.7 91.2 185.9 154.7 6.8 46.9 10.3 10.0 102.5 145.8 312.5 178.3
80.1 10.2 36.3 25.2 150.6 171.6 213.4 217.6 15.4 7.4 25.7 • 108.6 171.4 86.1 276.8
Z<\.MBOANGA CITY
12.5 49.0 34.4 41.9 58.4 I 59.2 113.3 51.8 90.3 36.6 29.8 53.4 65.4 139.6 208.0 112.5 33.I 26.0 63.7 139.1 75.6 92.0 . 125.0 152.0 26.6 10.0 4i.7 29.0 54.1 48.0 74.5 227.8 -12.3 18.1 10.4 8.2 65.3 234.0 123.2 133.8 61.8 6.8 46.9 79.9 139.9 185.5 98.7 1·04.5 59.7 208.8 • • 61.4 94.1 149. 1 154.7 45.3 95.4 82.7 26.1 123.4 116.4 86.0 · 85.7 • 1.3 4.0 79.6 124.l 118.6 203.2 170.3
165
Sept. Oct. Nov. Dec.
171.2 371.5 357.7 603.4 135.1 208.7 493.1 785.l 118.3 435.7 336.7 329.3 248.0 201.9 250.2 532.6 157.3 92.4 ·387.9 617.4 129.3 335.3. 441.1 582.2 134.0 628.3 466.8 483.2 106.9 148.3 534.7 179.3 239.1 286.4 977.3 890.8
254.9 73.6 126.0 20.5 43.3 167.1 614.4 218.8
126.7 657.3 136.6 13.8 325.9 48.5 12.4 0.3 203.3 95.5 187.5 68.5 164.7 433.5 319. I 186.2 242.2 567.4 853.2 220.5 168.1 26.2 . 108.8 ·33.9 84.2 492.7 786.l 57.9
62.8 99.0 33.5 53.5 50.8 58.3 54. I 36.9
177.6 227.5 76.6' 10.2 161.0 I 51.8 14.3 164.9 118.6 57.2 144.2 31.8 164.3 244.6 40.4 131.0 44.7 394.4 64.1 91.8· 93.5 71.5 83.3 20.4
185.2 148.8 256.9 48.3

Table 5.13 - MONTHLY AND ANNUAL FREQUENCIES OF TROPICAL CYCLONES 1
IN THE PHILIPPINE AREA OF RESPONSIBILITY: CY I 948-72
Calendar Year
Jan. Feb. Mar. Apr. May June .
July Aug. Sept. Oct. Nov. Dec. Total
1948 I 0 0 0 2 0 3 I 3 2 6 3 21 1949 I 0 0 0 0 3 4 2 4 3 4 I 22 1950 0 0 0 0 0 2 3 1 3 2 I I 13 1951 0 0 0 0 I I 1 4 2 I 2 I 13 1952 0 0 0 0 I 5 2 4 4 5 3 5 29 1953 0 1 0 0 I 2 0 5 2 2 4 I 18 1954 0 0 1 0 I 0 I 6 2 3 3 1 18 195.5 I I 0 I 'O 0 2 3 1 4 1 1 15 1956 0 0 I 2 0 0 5 4 5 3 5 3 28 1957 2 0 0 I 0 r 2 1 2 3 3 I 0 15
. I 958 I 0 0 0 0 1 4 3 3 2 4 ·-o 18 1959 0 1 I 0 0 0 I 4 2 4 3 2 18 1960 I 0 0 I 1 2 2 6 I 3 0 2 19 1961 I I 1 0 I . 3 4 4 4 1 I 2 23 1962 0 I 0 0 2 0 5 6 4· 1 3 0 22 1963 0 0 0 0 0 4 4 2 3 I 0 2 I 6-1964 0 0 0 0 3 1 8 6 5 4 3 2 32 1965 2 I 1 0 1 3 4 4 3 I I 0 21 1966 0 0 0 I 3 I 7 1 3 I 3 2 22 1967 0 1 I . I . 1 2 4 5 0 2 3 I 21 1968 0 0 I 0 0 1 3 3 3 2 3 0 16 1969 0 0 0 1 I 0 4 2 3 2 2 0 15 1970 0 I 0 0 0 I 3 4 5 3 3 I 21 1971 I 0 I 2 4 2 5 2 4 4 2 0 27 1972 2 0 0 0 0 2 4 2 4 I I 1 17
Total 13 8 8 10 23 38 84 86 76 60 62 32 500
I Tropical Cy_cloncs arc classified according to the maximum winrl speed about their centcrs. They may fall ~m,lcr any of the following categories:
a) Tropical Depression up to 6 l km/hr · 15) Tropical Slorm - from 6:\ lo 87 km/hr c) SCvere Tropical Storm - from 88 to I 17 km/hr d) Typhoon - . above II 8 km/hr
Sourrc of data: Climatological Division, Philip1>ine Atmospheric, Geophysical and Astronomical Services Adminislralion (PAGASA), "Tropical Cyclones for 1972" published April 1973.
166

Table 5.14 - MONTHLY AND ANNUAL FREQUENCIES OF J'YPHOONS 1
IN THE PHILIPPINE AREA OF RESPONSIBILITY: CY 1948-72,
Calendar Jan. Feb. Mar. Apr. May June July Aug. Sept. Oct. Nov. Dec. Total Year
1948 l 0 0 0 2 0 2 I 3 .J 2 2 14 1949 · l 0 0 0 0 l l 0 2- 2 2 I 10 1950 0 0 0 0 0 I 1 0 1 I I 1 6 1951 0. ·O 0 0 I 0 1 1 1 0 2 2 8 1952 0 0 0 0 0 2 2 3 0 4 3 2 16 1953 0 I 0 0 I 1 0 3 2 I I 0 JO 1954 0 0 0 0 1 0 1 2 2 2 3 0 11 1955 0 0 0 I 0 0 1 2 1 .2 0 l ·8 1956 0 0 I 1 0 0 1 3 4 2 4 l 17 1957 1 0 0 I 0 1 l I 3 l I 0 10 1958 I 0 0 0 0 1 4 2 2 2 I 0 13 1959 0 0 0 0 0 0 l 3 1 3 2 2 12 1960 0 0 0 I 0 I 2 3 0 3 0 2 12 1961 ·O 0 I 0 I 0 2 2 3 0 0 I 10 1962. 0 0 0 0 2 0 3 4. 2 I 3 0 15 1963 0 0 0 0 0 3 2 1 2 I 0 0 9 1964 0 0 0 0 I I 4 2 4 2 I 1 16 1965 I 0 0 0 I 2 2 3 2 0 I 0 12 1966 .o 0 0 l 2 I 2 I 2 0 0 I 10 1967 0 0 I l 0 l 2 I 0 2 3 0 I I 1968 0 0 0 0 0 I I l 3 2 3 0 I l 1969 0 0 0 l 0 0 2 2 1 2 I 0 9 1970 0 I 0 0 0 0 1 2 I 2 I 0 8 1971 I 0 0 I I 2 4 I 3 l I 0 15 1972 I 0 0 0 0 I I I I 0 I I 7
Total 7 2 3 8 13 20 44 45 46 37 37 18 280
lTyphoons - maximum'wind speed within the disturbance exceeds 118 km/hr. (64 knots) or 74 mph. Source of data: Climatological Division, Philippine Atmospheric, Geophysical and Astronomical Services Administration
(PAGASA), "'Trop;ca/ Cyclones for 1972°: published April 1973.
167

Table 5.15 -·MONTHLY AND ANNUAL FREQUENCIES OF TROPICAL STORMS 1
IN THE PHILIPPINE AREA ·OF RESPONSIBILITY: CY I 948-72
Calendar Jan. Feb. .Mar. Apr. May June July Aug. Sept. Oct. Nov. Dec. Total
Year
1948 0 0 .o 0 0 0 0 0 0 0 0 0 0 1949 0 0 0 0 0 I 2 0 I I I 0 6 1950 0 0 0 0 0 0 0 0 1 0 0 0 I
· 1951 0 0 0 0 0 0 0 0 0 0 0 0 0 1952 0 0 O· 0 0 I 0 I 2. 0 0 2 6 .1953 0 0 0 0 0 I o_ 2 0 0 2 0 5 1954 0 0 1 0 0 0 0 2 0 0 0 I 4 1955 I I 0 o· 0 0 0 I - 0 I 0 0 4 1956 o· 0 0 I 0 0 I I 0 0 0 0 3 1957 I . 0 0 0 0 O· 0 0 0 2 0 0 3 1958 0 0 0 ·o 0 0 0 I 0 0 0 0 I 1959 · 0 I I 0 0 0 0 I . I I 0 0 5 1960 p 0 0 0 I I 0 2 I 0 0 0 5 1961 I I 0 0 0 I I 0 I I I 0 7 1962 0 I 0 0 0 0 I I 0 0 0 0 3 1963 0 0 0 0 0 I 1 0 I 0 0 2 5 1964 0 0 0 0 I 0 I 2 I 2 2 0 9 1965 0 I I 0 0 I I 0 I 0 0 0 5. 1966 0 0 0 0 0 0 2 0 I 0 2 0 5 1967 0 1 0 0 I 0 2 2 0 0 0 I 7 1968 0 0 I 0 0 0 2 2 0 0 0 0 5 1969 0 0 0 0 0 0 I 0 I 0 I 0 3 .1970 0 0 0 0 0 0 2 I 2 I I 0 7 1971 0 0 I I 2 0 0 I. I 3 0 0 9 1972 0 0 0 b 0 0 0 0 l 0 0 0 I
Total 3 6. 5 2 5 7 17 20 16 12 . I 0 6 · 109
•Tropical Storm - maximum wind speed within the disturharicc ranges frorn 63-87 kifomcicrs per hour. ·source of data: Climatological Dfris'ion, Philippine Atmospheric, Geophysical and Astronomical Services Administration
· · (PAGASA), "TropiCal Cyclones for 197,2" publis~cd April 1973.·
168

Table 5.i6 - MONTHLY AND ANNUAL FREQUENCIES OF TROPICAL DEPRESS1ONS 1
IN THE PHILIPPINE AREA OF RESPONSIBILITY: CY 1948-72
Calendar Jan. Feb. Mar. Apr. May June July Aug. Sept. Oct. Nov. Dec. Total - Year
1948 0 0 0 0 c· 0 I 0 0 I 4 1 7 1949 0 0 0 0 0 I I 2 1 0 I 0 6 1950 0 0 0 0 0 I 2 I 1 I 0 0 6 1951 0 0 0 0 0 l 0 2 l 1 0 0 5 1952 0 0 0 0 l 2 0 0 2 l 0 l 7 1953 0 0 0 0 0 0 0 0 0 I l '1 3 1954 0 0 0 0 0 0 0 2 0 l 0 0 3 1955 0 0 0 0 0 0 I 0 0 l I 0 3 1956 0 0 0 0 0 0 3 0 l l 1. _2 8 1957 0 0 0 0 0 l 0 l 0 0 0 0 2 1958 0 0 0 0 0 0 0 0 I 0 3 0 4 1959 0 0 0 0 0 0 0 0 0 - 0 l 0 I 1960 l 0 0 0 0 0 0 I 0 .. 0 0 0 2 1961 0 0 0- 0 0 2 1 .2 0 0 0 l 6 1962 0 0 0 0 0 0 I l 2 0 0 0 4 1963 0 0 0 0 0 0 .l I 0 0 0 0 2 1964 0 0 0 0 l 0 3 2 0 0 0 I 7 1965 1 0 0 0 0 0 I. 1 0 l 0 0 4 1966 0 0 0 0 I 0 3 0 0 I I I 7 1967 0 0 0 0 0 1 o- 2 0 0 0 0 3 1968 0. 0 0 0 0 0 ·(i 0 0 0 0 0 0 1969 0 0 0 0 1 0 1 0 I 0 0 0 3 1970 0 0 0 0 0 l 0 I 2 0 l 1 6 1971 0 0 0 0 1 0 1 0 0 0 I 0 3 1972 1 0 0 0 0 I 3 I 2 1 0 0 9
Total 3 0 0 0 5 lI 23 20 14 1 I 15 9 11 l
lTropical Uepressions - maximum wind speed within the disturban('.e up to 61 kilomeiers per hour. Source of data: Climatological l.livi.sion, Vhilippine Atmospheric, Geophysical and Astronomical Services Administratior·
(PAG,\SA ), "Tropical Cyclones for 1972" 1mhlishcd April 1973.
169

CHAPTER VI
FISHERIES AND FORESTRY
Table 6.1 Quantity and Value of Fish Production, by Type of Production: CY 1946-72 174
Figure 6.1 Fishing: Quantity of Production, CY 1946-72 175 Table 6.2 Selected Characteristics of Commercial Fishing Vessels: CY
1954-72 176 Table 6.3 Selected Characteristics of Fishponds in Operation: CY 1953-72 178 Table 6.4 Exports of Fish and Fishery Products: CY 1953-72 180 Table 6.5 Imports of Fish and Fish Preparations: CY 1956-72 182 Table 6.6 Production and Exports of Gathered Fishery Products: CY
1953-72 184 Table 6.7 Vegetative Cover of the Philippines by Major Geographical
Division as of June i968, July 1969, June 1970, and June 30, 1972 186
Table 6.8 Vegetative Cover of the Public Forests of the Philippines by Region as of June 30, 1973 188
Table 6.9 Status of Land Classification by Provinces: FY 1972-73 190 Table 6.10 Status of Land Use, by Type and Stand Size as of June 30, 1973 192 Figure 6.2 Status of Land Use by Type and Stand Size as of June 30; I 973 I 93 Table 6.1 I Classified and Unclassified Land Area: FY I 95 I -52 to FY
1972-73 194 Table 6.12 Quantity of Production of Logs, Lumber, Plywood and Veneer:
FY 1955-56 to FY 1972-73 195 Figure 6.3 Quantity of Production of Logs, Lumber, Plywood and Veneer:
FY 1955-56 to FY 1972-73 196
I

■
CHAPTER VI
FISHERIES AND FORESTRY
This· chapter is concerned with statistics on production of some selected characteristics of the fisheries and forestry sector.
Fishery statistics on the quantity and value of production of commercial vessels (capacity of more than 3 tons); of fishponds and data from municipal and sustenance fishing are collected and published by the Bureau of Fisheries and Aquatic Resources (formerly Philippine Fisheries Commission) in its annual publication Fishery Statistics of the Philippines. Data on number of commercial fishing vessels classified by type of vessels, method of propulsion, type of fishing gear, tonnage and fuel used; quantity and value of production of commercial fishing vessels by type of species, and by type of gear used are compiled monthly from reports of fishing operators.
Fishpond production is estimated based on a regional yearly average yield per hectare, computed on the basis of report of yield by Fishery District Officers, and applied to the total land area of fishponds in operation. Estimates of production from municipal or sustenance fishing are made by multi~lying one-fifth of the total population by the average production per capita of two pre-determined towns.
Statistics on forestry are compiled by the Bureau of Forest Development (formerly Bureau of Forestry) and published annually in the Philippine Forestry Statistics. Data published include forest inventory, area under exploitation, reforestation and other silviculture treatment; quantity and value of production of timber, logs, lumber, plywood, veneer, and other forest products, value and destination of log and lumber exports; analysis of forest growth by climate type; and income derived from special permits and leases. Such data are by-products of the administrative and regulatory functions of the Bureau.
Forestry inventory statistics are being updated by the Bureau through its program of surveys using aerial photogrammetry where air strips are used for estimating purposes. Production data are obtained from monthly reports of district forestry officers, forest concessionaires arid sawmill operators.
172

The Central Bank also compiles data on production froin the same sources anil publishes them in the quarterly Central Bank Statistical Bulletin. Statistics prior to 1958 can be obtained from- the National Economic and Development Authority (formerly NEC) publication, The Raw Material Resources. Survey Bulletin.
173

Table 6.1 - QUANTITY AND VALUE OF FISH PRODUCTION, BY TYPE OF. PRODUCTION: CY 1946-72
(Quantity in I 000 metric tons and value in million pesos)
Commercial Municipal Fisheries Total Fishing Fish ponds and
Calendar Sustenance Fishing Year Vessel~
Quantity Value Quantity Value Quantity Value Quantity Value
1946 96.0 199.9 15.9 44.4 16.1 22.4 64.0 133.1 1947 251.4 399.7 63.0 124.8 20.8 25.2 • 167.6 249.8 1948 195.1 163.5 42.0 42.0 23.0 24.0 130.1 97.5 1949 238.0 296.9 54.8 50.3 24.5 39.7 158.7 206.9 1950 220.2 215.2 47.9 44.1 15.5 33.1 146.8 138.0 1951 296.1 283.2 69.0 49.2 29.7 38.6 197.4 195.4 1952 313.1 298.1 73.3 53.5 31.0 40.0 208.7 204.5 1953 305.6 294.5 72.9 55.7 33.5 43.5 199.3 195.3 ... 1954 343.6 298.8 103.2 . 70.2 35.0 43.8 205.4 184.8 1955 362.9 322.4' 107.2 75.0 36.7 45.9 219.0 201.5 1956 393.6 349.1 106.7 70.8 38.5 49.6 248.5 228.6 1957 387.2 365.5 93.9 68.6 39.4 63.5 253.8 233.5 1958 426.7 406.0 111.9 78.3 57.6 91.0 257.2 236.6 1959 436.5 450.9 I I 7.8 87.0 58.1 92.9 260.6 271.0 1960 444.6 464.4 120.0 93.6 60.1 96.2 264.5 274.6 1961 454.9 470.8 125.6 100.5 60.8 99.1 268.4 271.1 1962 483.9 541.0 150.9 138.0 61.4 108.2 272.5 294.7 1963 547.4 664.6 208.7 277.5 62.0 103.6 276.6 283.5 1964 603.5 · 785.0 258.1 389.7 62.7 104.0 282.7 291.2 1965 667.2 806.5 300.1 372.1 63.2 106.2 · 303.9 328.2 1966 705.3 826.0 314.9 366.1 63.7 129.9 326.7 330.0 1967 746.1 963.1 330.9 423.7 63.9 135.5 351.2 403.9 1968 937.7 1,361.9 406.8 548.4 86.7 182.4 444.2 631.1 1969 940.8 1,457.4 368.7 556.8 94.6 191.0 477.5 709.6 1970 988.9 1,725.3 381.9 614.8 96.5 252.7 510.5 857.7 1971 1,023.1 2,613.4 382.3 879.2 97.9 328.0 542.9 1,123.8 197°2 1,222.4 2.827.5 424.8 1,106.1 98.9 332.4 598.7 1,389.1
Note: Details may not add up_ to totals due to rounding. Sources of data: Data for 1946-1950 were taken from the Raw Material Resources Survey Bulletin, Series No. l GcncraJ Tables., published by the National Economic and Development Authority (formerly National Economic Council), Manila, June 1959; those for 1951 to the present, from the Fisheries Statistics of the Philippines. published annually by the Bureau of Fisheries and Aquatic Resources (formerly Philippine Fisheries Commission).
174 •

--..l V,
Figure 6.1 FISHING: QUANTITY OJ'" PRODUCTION, CY 1946-72
TOT AL
MUNICIPAL FISHERIES AND SUSTENANCE FISHING
IN MILLION METRIC TOtJS
---1.2
.8
.6
.4
---1
I)
1946 '47 '48 ·,;9 '50 ·51 ·s2 •5.3 •54 '55 '56 ·57 '58 '59 '60 '61 '62 '63 '64 '65 '66 ·57 ·5e '69 '7u ·11 ·12

Table 6.2 - SELECTED CHARACTERISTICS OF
Calendar Number Tonnage (1,000 mt.)
Year 1 Total Powered Total Powered 3 to 9
Metric Tons
1954 1_,346 1,009 40 n.a. 492 1955 1,238 887 32 29 560 1956 1,210 904 29 25 578 1957 1,112 900 25 23 460 1958 1,426 1,186 31 26 579
1959 1,477 1,198 48 43 589 1960 1,499 1,289 37 35 574 1961 1,560 1,270 47 45 605 1962. · 1,701 1,438 47 45 692 ~
1963 1,929 1,618 53 51 866
1964 1,947 1,677 56 54 849 1965 2,393 2,129 66 64 941 1966 2,544 2,255 71 68 955 1967 2,361 2,136 81 80 822 1968 2,225 2,054 82 81 711 • 1969 2;:273 2,091 84 83 677 1970. 2,284 2,105 90 88 666 1971 2,180 2,J-49. 91 90 664 1972. 2,222 2,169 100 99 608
n.a. - Data not available.
~ Source of data: Fisheries Statistics of the Phf/ippines. Bureau of Fisheries and Aquatic Rcsourc('~'--
1
i
l 176

COMMERCIAL FISHING VESSELS: CY 1954-72
Number by Tonnage Number o.f
10 to 19 20 to 49 50 to 99 100 Metric Not Llcensed
Metric Tons Metric Tons Metric Tons Tons &Over Classified Fisher-men
304 202 150 3 195 10,322 335 . 194 146 3 0 10,287 293 · 177 158 4 0 16,348 292 173 153 4 30 15,588 428 198 186 3 32 12,530
425 222 215 5· 21 10,746 385 236 229 12 63 15,453 392 243 250 30 40 16,546 407 264 272 54 12 18,609 406 259 324 63 11 20,486
374 272 322 81 49 26,981 430 330 364 121 207 31,170 501 345 359 133 251 21,991 534 411 416 156 12 29,723 · 476 431 440 162 18 25,514
469 414 480 182 51 28,433 478 426 478 192 44 28,379 443 422 440 211 0 29,844 477 444 458 235 0 30,493
0
177

Table 6.3 - SELECTED CHARACTERISTICS OF.
Calendar Area
Investments 1 Employment2 . Year
in Hectares (Thousand Pesos) (Number)
1953 95,633.32 · 191,266.6 95,633 1954 100,097.24 200,I 94.5 I 00,097 1955 I 04,952.52 209,905.0 104,952 1956 I 09,799.18 219,598.4 109,799 1957 112,610.95 225,221.8 112,611
1958 116,546.00 233,092.0 I 16,546 1959 119,582.00 239,164.0 I 1"9,582 1960 123,251.90 246,503.8 123,252
.1961 125,810.00 251,620.0 125,810 1962 129,062.00 258,124.0 129,062
1963 131,850.22 263,700.4 131,850 1964 134,242.25 268,484.5 134,242 1965 137,250.68 274,501.4 137,250 1966 138,967.63 277,935.3 138,967 _ 1967 140,054.84 280,109.7
' 140,054
19684 162,806.59 325,613.2 152,806 1969 164,414.09 328,828.2 154,414
· 1970 168,118.10 336;236.2 168,118 · I 971 171,446.39 342,892.8 I 71,446 1972 174,100.98 348,202.0 174,101
e: .
, I eased on the average development cost of P'2,000 per hectare. 2eased on the average of one man employed to c~el'f hectare. 3Tite sudden increase in production is due to. the change in factor foj, estiinating pi-oduction. Whereas a co~mon factor wac:
used to estimate produCtion all over the country, now each region is assigned a· factor equivalent to the average produ4;tion per hectare of that particular region.
4corrected data on area due tO enors in reported areas of private fishponds.
Sourct of data: Fisheries Starisrics of the Philippines. Bureau of Fisheries and Aquatic Rc>.sources . . ~·
178

FISHPONDS IN OPERATION: CY 1953-72
Average Value of Ratio of Value
Production Production Production of Production
(Metric Tons) (Kilograms (Thousand. to Investment per Hectare) Pesos) (Per Cent)
33,471.7 350 43,513.2 22.75 35,034.0 350 43,792.5 21.87 36,783.4 350 45,916.9 21.88 38,479.8 350 49,638.9 22.60 39,413.8 350 63,456.2 28.18
57,624.43 494 91,046.4 39.06 58,090.0 486 92,944.4 38.86 60,119.6 488 96,191.3 39.02 60,824.6 483 99,144.0 39.40 61,436.1 476 108,212.6 41.92
62,044.5 471 103,614.3 39.29 62,680.3 467 104,049.7 38.75 63,197.7 460 106,172.1 38.68 63,654.3 458 129,854.9 46.72 63,911.7 456 135,492.8 . 48.37
86;711.3 533 182,440.5 56.02 94,573.1 575 191,037.7 59.00 96,460.9 574 252,727.5 75.16 97,915.3 . 571 328,016.3 95.66 98,922.5 568 332,379.6 95.46
179

Table 6.4 - EXPORTS OF FISH AND
(Value in thousand pesos and
Total Fresh Fish Calendar Fish Year Value
Quantity Value Quantity
1953 94 3 7 4 1954 103 16 15 7 1955 160 31 56 15 1956 150 25 71 10 I 957 127 30- 60 10
1958 112 17 35 9 1959 155 21 43 13 1960 143 26 48 19 1961 110 3 7 24 1962 138 . I 2 30
1963 532 2 6 25 1964 600 203 255 19 1965 644 318 335 20 1966 2,170 1,064 1,850 18 1967 2,286 1,084, 1,329 17
196& 3,353 755. 1,273 5 1969 4,731 996 1,892 69 1970 12,811 ,I, 158 4,140 80 1971 34,252 3,186 11,992 146
- 1972 63,353 5,919 23,889 148
n.a. - Data not available.
Nore: Frc&l fish beginning from 1953 up to 1966 includes crustaceans and m~llusks.
Source of data: Fisheries Statistics of the Philippines.. Bureau of Fisheries and Aqiialic Resources.
180

FISHERY PRODUCTS: CY J 953-72
quantity in metric tons)
) Processed Fish Products Shrimps, Lobsters, Crabs
Sauce Dried, Salted, etc.
· Value Quantity Value Quantity Value
3 163 84 n.a. n.a. 5 130 _ ,83 n.a. n.a.
; 11 162 -93 n.a. n,a_
9 107 70 n.a. n.a. 8 93 59 n.a. n.a.
9 102 68 n.a. n.a.
12 125 JOO n.a. n.a. 17 86 78 n.a. n.a. 21 JOO 82 n.a. n.a. 31 96 84 3 21
25 102 117 76 384 24 97 98 53 223 24. 107 133 35 152
! 24 81 99 32 197 21 130 158 115 778
14 176 254 181 · I ,812 108 190 401 248 2,330 172 200 548 574 7,951 382 325 I ,I I 0 1,472 20,768 460 461 2,026 2,450 37,218
18 I

.__
Calendar · Total
Table 6.5 - IMPORTS OF FISH AND
(Quantity in metric tons and
Fresh Fish Salted, Dried Year Value Quantity Value Quantity
1956 22,508 I I . 56 1957 27,563 I I 42 1958 32,142 • * 9 1959 21,969 3
1960 44,469 22 12 1,426 . 1961 34,631 10 13 . '322 1962 35,396 11 28 105 1963 54,152 5 15 122 1964 56,160 25 27 51
1965 61,692 23 36 132 1966 59,509 19 36 170 1967 79,800 30 44 77 1968 98,780 151 247 126 1969 77,548 738 107 63
1970 108,119 7 45 19 1971 142,847 2 . 20 3 1972 143,131 I 16 2
*Les.,; than half of the unit employed. Note: lletails may not add up lo totals due to rounding. ·
. Source of data: FUhen·es Staristics of the Philippines, ~lureau of Fii-hcrics and Aquatic k"~,;ourcr-s.
182
/
•
f
l
I
1

FISH PREPARATIONS: CY 1956-72
value in thousand pesos) r
or Smoked Crustaceans and Mollusks Fish & Fish Preparations
Value Quantity Value Quantity Value
, 31 105 91 45,803 22,386 22 39 30 56,233 27,510
4 1 I 65,219 32,136 2 1 47,299 21,966
724 200 94 84,892 43,639 161 118 20 74,181 34,437 1n 215 191 38,039 35,065 · 140 185 137 49,537 53,861 35 . 153 66 49,209 56,033
89 175 43 51,401 61,523 68 368 145 49,564 59,260 52 286 174 67,296 79,530
127 419 345 87,595 98,061 72 243 202 70,690 77,166 ·
82 118 182 62,601 107,811 53 2 12 68,877 142,762
),.l 55 22 • 64,199 . 143,060
183

Calendar Year
Total Reptile Skins
Value Quan- Value tity
1953 1,693 23 36 I 954 1,761 8 13 1955 426 4 1,1 1956 . 574 4 7 1957 270 3 5 1958 102 5 8 J959 123 3 5 1960 214 4 7 1961 814 2 6 1962 644 3 12 1963 468 10 27 1964 638 7 47 1965 700 4 83 1.966 1,359 4 27 1967 2,043 2 8 1968 2,858 4 30 1969 816 * • 1970 1,165 • 1971 2,452 * * 1972 1,972 2
*Less than half of the unit employed or nil.
Table 6.6 - PRODUCTION AND EXPORTS OF (Value in thousand pesos and
Production
Seaweeds Shells Miscellaneous ·
Quan- Value Quan- Value Quan- Value tity tity tity
• 968 '1,638 112 19 • • 896 1,694 376 54 1 • 947 35? 497 56
2,2 9 1,069 267 577 293 15 4 908 207 447 56 11 2 252 64 444 28 41 6 210 64 721 48 95 17 348 1"53 550 35 97 36 351 141 695 629 85 61 529 186 427 385 92 52 395 . 183 300 205
101 52 448 440 310 98 305 199 329 330 235 88
1,133 530 1,768 667 302 135 878 633 3,091 606 1,452 798 600 410 2,666 , 495 898 1,923 405 236 2,200 333 770 246 209 71 1,067 716 780 376 474 164 24,366 1,815 811 474 259 237 24,132 1,374 824 358
· Note: Details may ~ot add up to totals duc,to rounding.
Source of Data": Fishe,ies Statistics af the Philippines, Bureau of Fisheries and Aquatic Resources.
184
' •
·'
( !
~ 1
l ,,
~ j
I ' t
(
1 J

GATHERED FISHERY PRODUCTS: CY 1953-72 quantity in metric tons)
Ex p·o rt s
Total Reptile Skins · Seaweeds
' Shells
Value Quan- Value tity Quan- Value Quan- Value tity tity
2,215 12 23 • • 318 2,174 2,229 6 14 .• • 425 2,173 1,924 4 9 • • 643 1,880 1,677 4 18 • • 497 1,623 1,698 4 12 * • 417 1,624 1,227 5 18 • • 519 1,188 1,139 4 18 * * 614 1,014
945 4 26 * • 670 881 · 938 2 15 • • 623 862 1,045 \ 2 27 • • 637 964 1,426 7 117 • • 483 1,225 1,840 8 130 • • 494 1,601
. 2,133 3 94 • • 451 1,892 2,740 6 60 805 462 - 555 2,135 3,006 2 39 675 352 1,181 2,082 1,603 I 29 264 221 567 1,193 3,918 2 65 428 478 842 2,948 5,176 2 80 318 527 990 4,274 5,801 5 381 340 676 1,747 4,384 6,934 ·97 607 484 1,414 1,095 4,564
185
Miscellaneous
Quan- Value tity
96 18 331 42 171 35 132 36 27 62 18 ,21 50 107 40 38 29 61
139 54 158 84
91 109. 171 147
13 84 325 · 533 30 160 65 427 87 294 79 360 93. 349
f

Table 6.7-VEGETATIVECOVER OF THE PHI°LIPPINES AS OF JUNE 1968, JULY _1969,
/ (Million
Geographical Region
Phil- Mindanao
ippines Luzon Visayas and Palawan Sulu
As of June 30, 1968
Total 30.00 12.11 6.20 10.20 1.49
Forest 15.90 6.01 2.35 6.20 1.34 Commercial 8.67 2.61 1.02 4.37 0.67
Old growth 5.01 1.56 0.70 2.20 .0.55 Young growth 3.66 - 1.05 0.32 2.17 0.12
Non-commercial 7.23 3.40 1.33 1.83 0.67 Rep-brush 5.44 2.48 1.17 1.47 0.32 Unproductive 1.79 0.92 0.16 0.36 0.35
Non-forest .14.10 6.10 3.85 4.00 0.15 Open and grassland 3.49 1.40 1.08 0.94, 0.07 Marshes 0.21 0.09 0.04 0.08 a Cultivated and ·others 10.40 4.61 2.73 2.98 0.08 l
As of July I 969
Total 30.00 12.11 6.20 10.20 1.49
Forest 16.08 6.09 2.40 6.25 1.34 Commercial 8.85 2.68 1.10 4.39 0.68
Old growth 5.23 1.63 0.79 2.25 0.56
. Young growth 3.62 1.05 0.31 2.14 0.12 Non-commercial 7.23 3.41 1.30 1.86 0.66
Rep-brush 5.45 2.49 1.14 1.50 0.32 Unproductive I. 78 0.92 0.16 0.36 0.34 1 Non-forest 13.92 "6.02 3.80 3.95 0.15
Open and grassland 3.31 1.42 1.11 0.72 0.06 Marshes 0.22 0.09 0.05 .Q.08 a Cultivated and others 10.39 4.51 . 2.64 3. 15 0.09
'- 8 Less than 0.01 ·million hectares.
Source of data: Philippine Forestry Statistics, Bureau of _Fore8t DcvelopmcnL
.1
186

• (
> BY MAJOR .GEOGRAPHICAL DIVISION i JUNE 1970 AND JUNE 30, 1972
Hecfares)
~ Geographical Region _ I
~ Phil- Mindanao
~ ippines Luzon Visayas and Palawan Sulu
• As of June 1970 ►
~ Total 30.00 12.11 6.20 10.20 1.49
Forest 16.66 6.32 2.15 6.82 1.37 Commercial 9.42 2.89 1.28 4.53 0.72
r Old growth 6.30 1.88 I.OS 2.75 0.62 Young growth 3.12 1.01 0.23 1.78 0.10
Non-commercial 7.24 3.42 0.87 2.29 .0.65 Rep-brush 5.06 2.50 0.32 1.94 0.30 Unproductive 2.18 0.93 0.55 0.35 . 0.35
Non-forest · 13.34 5.79 4.05 3.38 0.12 Open and grassland 3.13 1.23 0,80 0.99 0.12 Marshes 0.18 0.09 a 0.08 a Cultivated and others 10.03 4.47 3.25 2.31 a
As of June 1972
Total • 30.00 12.11 6.20 10.20 1.49
Forest 15.67 5.93 2.31 6.10 1.34 Commercial 8.24 2.31 0.97 4.31 0.66
Old growth 4.67 1.45 0.65 2.04 0.53 Young growth 3.57 0.86 0.32 2.27 0.13
Non-commercial 7.43 - 3.62 1.34 1.79. 0.68 Rep-brush . 5.43 2.48 1.18 1.43 0.33
• Unproductive 1.78 0.92 0.16 0.36 0.35 Pine type . 0.21 0.21 a .. a a
Non-forest 14.33 6.18 3.89 4.10 0.15 Open and grassland 3.40 1.35 1.04 0.93 0.07 Marshes 0.21 0.09 0.04 _·. 0.08 a Cultivated and others 10.72 4.74 .. 2.81 3.09 0.08
187

Table 6.8 - VEGETATIVE COVER OF THE PUBLIC FOREST
(In hectares)
Commercial Forest
Region Dipterocarp Mangrove -
Old Growth Young Growth Old Growth Young Growth
TOTAL 3,894,169 3,008,972 .·27,343 80,646
Region I 76,248 158,208 * * Region II 803,303 386,666 * 208 Region III 126,456 197,537 * 23,800 Region IV 742,788 "400,401 15,105. 4,745
·Region V 48,912 90,785 8 2,558 Region VJ 52,436 77,244 1,246 1,797 Region Vil 31,038 50,004 • 4,941 Region VIII 295,903 225,109 1,054 17,801 Region IX 248,125 168,978 6,966 4,796 Region~ 761,114 636,121 676 856 Region XI 707,846 617,919 2,288 I 9_,144
*Les8 thiin 0.5 hectare Source o( data: Bureau of Fom;t Development.
j
188

OF THE PHILIPPINES BY REGION AS OF JUNE 30, 1973.
Non-Commercial Forest Non-Forest
Pines Dipterocarp Mangrove Unproductive Rep-brush Rep-brush Mossy
268,618 .2,449,404 128,825 1,545,252 3,764,831 .·
207 ;782 324,468 4 108,480 449,590
43,758 274,198 1,781 367,227 506,095
16,862 74,162 306 64,090 239,001
216 426,017 24,210 360,211 402,904
• 82,022 18,137 13,578 192,519
• 129,175 6,013 65,46 I . 357,155
* 101,607 10,580 20,765 317,092
* 160,569 17,893 80,500 166,764
• 115,376 39,083 23,619 181,331
• 279,677 7,364 221;121 359,095
* 482,133 3,454 214,200 593,285
189

-·
Table 6.9 - STATUS OF LAND CLASS!
(In hectares)
Classified Area Unclassified Area
Alienable and Area Province Disposable
Timberland of Area Percent Province
Area Percent Area Percent
Philippines Total 12,807,993 42.69 8,935,369" 2'9.78 8,256,638 27.52 30,000,000
Luzon 5,266,656 43.49 3,654,745 30.18 3,188,104 26.33 11,966,285
Abra 93,926 26.62 269,978 67.90 33,651 8.46 397,555 Albay 206,072 80.73 47,835 18.73 1,350 0.52 255,257 Bataan 69,325 50.49 67,971 49.51 137,296 Batanes 5,576 26.64 13,954 66.68 1,398 6.68 20,928 Batangas 209,662 66.22 15,883 5.01 91,036 28.75 316,581 Bulacan- 144,471 54.07 70, I 3 I 26.25 52,061 19.69 267,203 Cagayari 323,676 35.93 213,542 23.71 363,049 40.33 900,267 Qimannes Norte 131,574 62.63 43,162 20.43 36,573 17.31 211,249 Camarines Sur 357,784 67.93' 143,220 27.19 25,678 4.89 526,682 Catanduanes 72,655 48.07 69,324 45.86 9,169 6.07 151,148 Cavite 36,167 28.09 2,799 . 2.17 89,789 69.74 128,755 Jlocos Norte 144,870 42.62 190,412 56.01 4,652 1.37 339,934 Jlocos Sur 120,500 46.71 39,020 15.13 98,438 38.16 257,958 lfugao 25,203 10.01 90,440 35.92 136,135 54.06 · 251,778 Isabela 454,935 42.65 280,752 26.32 330,769 31.01 1,066,456 La Union 75,496 50.65 11,278 7.55 62,535 41.88 149,309 L,,guna 86,461 49.13 20,201 11.48 69,311 39.39 175,973 Manila 3,828 100.00 3,828 Marinduque 73,720 76.85 18,310 19.09 3,895 4.06 95,925 Mindoro Occidental 154,002 26.19 253,810 43.17 180,173 30.64 587,985 Mindoro Oriental 220,931 50.62 210,447 48.22 5,094 1.17 436,472 Mountain Province 20,915 9.97 75,366 35.93 113,452 54.09 209,733 Benguet 32,082 12.08 95,430 35.94 138,026 57.98 265,538
· Kalinga-Apayao 72,810 10.33 272,131 38.61 359,823 51.06 704,764 Nueva Ecija 328,512" 62.17 162,927 30.83 36,994 . 7.00 528,433 Nueva Vizcaya 129,063 18.54 309,952 44.53 257,092 36.93 696,107 Pampanga 160,338 73.53 43,048 19.74 14,682 6.73 218,068 Pangasinan 401,269 74.75 51,450 9.58 84,099 15.67 536,818 Quezon 543,777 45.52 309,636 25.92 341,202 28.56 1,194,615 Rizal 100,792 54.20 46,676. 25.10 38,493 20.70 185,961 Sorsogon 172,864 80.72 24,536 11.46 16,744 7.82 214,144 Tarlac 181,607 59.48 42,625 13.96 81,113 26.56 305,345 Zambales 111,853 30.11 -148,499 39.98 111,088 29.91 371,440
- not available. Source of data: Bureau of Forest Development.
190
'
•
, I '
~
•
t
~

FICATION BY PROVINCES: FY 1972-73 ' .
'
Classified Area Unclassified Area
Alienable and-Area
Province Disposable
Timberland of Ar.ea Percent Province
Area Percent Area Perce(lt
Visayas 3,393,463 54.72 1,255,247 20.24 1,552,274 25.03 6,200,984 --Aklan 60,063 33.04 18,736 10.31 102,990 56.65 181,789 Antique 142,222 56.39 35,249 13.98 741730 29.63 252,201 Bohol 308,205 74.86 80,725 19.61 22,799 5.54 411,726 Capiz 144,306 54.80 50,318 19.11 68,693 26.09 263,317 Cebu 225,978 44.41' 97,965 19.25 184,896 36.34 508,839 lloilo 374,360 70.32 I 13,686 21.35 44,351 8.33 532,397 Ley,te de! Norte 400,169 63.84 85,104 13.58 141,553 22.58 626,826 Leyte del Sur 116,254 67.0.1 54,856 31.62 2,370 1.37 173,480 Masbate 263,035 64.98 130,508 32.24 11,226 2.77 404,769 Negros Occidental 570,798 72.02 221,383 27.93 426 0.05 792,607 Negros Oriental 266,177 46.33 206,641 35.96 101,759 17.71 574,577 Romblon 93,382 68.87 7,185 5.30 35,026 25,83 135,593 Samar del · Norte 113,126 32.51 46,129 13.26 I 88,705 54.23 347,960 Samar, East 135,265 31.17 43,828 10. 10 254,872 58.73 433,965 Samar, West 180,123 32.11 62,934 11.22 317,881 56.'67 560,938
Mindanao 3,846,79r" 37.71 3,678,527 36.06 2,674,561 26.22 10,199,885
Agusan del Norte 60,510 23.36 115,130 44.45 83,389 32. 19 259,029 Agusan del Sur 214,770 23.96 388,785 43.36 292,995 32.68 896,550 Basilan City 75,462 56.86 57,261 43.14 132,723
Bukidnon 282,861 34.10 197,975 23.87 348,542 42.02 829,378 Cotabato del Norte 653,655 39.76 501,356 30.49 489,127 29.75 1,644,138
Cotabato de! Sur 296,029 40.24 265,445 36.09 174,093 23.67 735,567
Uavao del Norte 262,631 32.30 306,484 37.70 243,860 30.00 812,975
l.Javao del Sur 203,934 31.98 209,749 32.89 224,079 35. 14 637,762
Davao Oriental 183,124 35.46 333,122 64.50 200 0.04 516,446 Lanao del Norte 152,175 49.22" 81,587 26.39 75,442 24.40 309,204 ·
Lanao del Sur 119,757 30.92 118,541 30.61 148,991 38.47 387,289 Misamis_. Occidental 122,572 63.20 27,720 14.29 43,640 22.50 193,932
Misamis Oriental . 1 9 I ,428 -· 50.38 70,564 18.57 117,991 31.05 379,983
Sulu 129,716 48.26 38,517 14.33 110,551 41. 13 268,784 '
·surigao de! Ncirte 115,453 42.15 115,989 42.35 42,460 15.50 273,902
Surigao de! Sur I 30,706 28.71 239,286 52.56 85,224 18.72 455,216
Zamboanga del Norte 250,674 41.26 306,279 50.41 50,566 8.32 607,519
Zamboanga de! Sur 401,340 46.70 304,737 35.46 153,411 17.85 859,488
Palawan 301,077 20.21 346,850 23.28 841,699 56.50 1,489,626

Table 6.10 - STATUS OF LAND USE, BY TYPE AND STAND SIZE , AS OF JUNE 30, 1973
Per Cent Percent-of Percent Public of Alienated Alienated
Type and stand size Total of Total Forest Public Land Land Area Land Forest (1,000 Ha.) (1,000 Ha.)
(1,000 Ha.) (1,000 Ha.) Land
Total land area 30,000.0 100.0 17,192.0 100.0 12,808.0 100.0
Total forest 13,893.9 46.3 l 2;298.8 71.5 1,595.1 12.5 Productive forest 12,134.8 40.4 l'0,570:6 61.5. 1,564.2 12.2
Dipterocarp type 11,670.9 38.9 10,134.1 58.9 1,536.8 12.0 Reproduction brush 4,025.7 13.4 2,939.8 11. I 1,085.9 8.5 Young growth 3,266.4 10.9 2,942.9 · 17. I · 323.5 8.5 Old growth 4,378.8 14.6 4,251.4 24.7 -· 127.4 1.0
Pine type 205.I 0.7 202.6 1.2 2.5 a Mangrove type 258.8 0.9 233.9 1.4 24.9 0.1
Reproduction brush 132.1 0.4 116.7 0.7 . 15.4 0.1 Young growth J 13.4 0.4 105.1 0.6 8.3 a Old growth 13.2 a 12.1 a I.I a
Unproductive forest I, 759.0 5.9 1,728.1 JO.I 30.9 0.2 Dipterocarp 1,421.8 4.7 1,397.9 8.1 23.9 0.2 Mossy 329.3 I. I 328.1 1.9 1.2 a Bamboo 7.9 a 2.1 a 5.8 a
Total non-forest 16,105.3 53.7 4,892.6 28.5 li,2P.7 87.5 Open land 1,548.9 5.2 778.3 4.5 .770.6 6.0 Managed pasture 845.6 2.8 815.5 4.7 30.1 0.2 Marsh and small water 137.1 0.5 85.0 . 0.5 52.1 0.4 Cultivated (including
plantations), urban and others 13,573.7 45.2 3,213.8 18.7 10,359.9 80.9
3Less than 0.1 per cent.
Note: Details may not add up to totals due to rounding
Sburce of data: Bureau of Forest DCvelopment.
192
- • j
1
~

·- UMLW .. • - 4 • • •
Figure 6.2 STATUS O,F LAND USE BY TYPE AND STAND SIZE AS OF JUNE 30, 1973
TYPE
PRODUCTIVE FOREST
UNPRODUCTIVE
FOREST
OPEN LAND .
MARSH AND
SMALL WATER
SIZE (IN MILLON HECTARES)
t:·:·:·:·:·:·:·l ·--; PUBLIC FOREST LAND
ALIENATED LAND
CULTIVATED ( INC LU D- ){•::}ff:{•\:,:/i:f\::::·•:•:•:::•::·•:::•::·::•::::::::=f,:,:;:;:;,;:;:;:,,,·:·:·:::::,,:;,;:;,,::,.,,·,·•:•·•::·:=:::=:::: . ING PLANTATIONS)
tJRBAN AND OTHERS . . . . . : ·. . . . _···.. . . . . . . . . . .. ·. ' . . , . .: .
0 2 3
'
4
- 44 •• •
- 10.3

Table 6.11 - CLASSIFIED AND UNCLASSIFIED LAND AREA:
FY 1951-52 TO FY 1972-73
Classified A re a Unclassified Area
As of June 30 Alienable and Timberland Disposable Area (Ha.) Per Cent
Area (Ha.) Per Cent Area (Ha.) Per Cent
19,52 9,606,645 32.02 3,434,408 11.44 16,958,947 59.54 1953 9,931,381 33.10 3,521,264 11.73 16,547,355 55.17 ◄ 1954 10,194,997 33.98 3,702,064 12.34 16,102,939 53.68 1955 10,470,634 34.90 4,079,231 13.59 15,450,135 . 51.51 1956 , I 0,904,810 36.34 4,464,698 14.88 14,630,492 48.78 1957 11,248,990 37.49 4,876,306 16.25 13,874,704 46.26 1958 11,525,256 38.41 5,230,220 17.43 13,244,524 44.16 1959 11,705,321 39.01 5,698,529 18.99 12,596,150 42.00 1960 11,883,353 39.61 6,300,979 21.00 11,815,168 39.39 1961 . 12,152,492 40.50 · "6,977,871 23.25 10,869,637 36.25 1962 - 12,265,058 40.88 7,588,874 25.30 10,146,068 33:83 1963 12,312,632 41.04 7,657,131 25.52 10,030,237 33.44 1964 12,364,668 41.21 7,718,086 25.72 9,917,246 33.07 1965 12,365,431 · 41.21 7,727,082' 25.75 9,907,482 33.04 1966 12,422,196 41.40 7,927,054 26.42 9,650,750 32.18 1967 12,446,059 41.48 8,056,449 · 26.85 9,497,492 31.67 1968 12,473,506 41.57 8,079,333 26.93 9,467,161 31.50 1969 12,498,776 41.66 8,193,092 27.31 9,308,132 31.03 1070 12,572,433 41.90 8,542,527 28.47 8,885,040 29.63 1971 12,651,472 42.17 8,794,789 29.31 8,553,739 28.52 1972 12,747,706 42.49 8,851,076 29.50 8,401,218 28.01 1973 I 2;807,993 42.69 8,935,369 29.78 8,256,638 27.52
Note: Based on total land area of 30 million hectares.
Source of data: Bureau of Forest Development.
194

TABLE 6.12 - QUANTITY OF PRODUCTION OF LOGS, LUMBER, PLYWOOD AND VENEER: FY 1955-56 TO FY 1972-73 ·
Fiscal Year Logs Lumber Plywood Veneer
~ (Cu.M.) ( 1000 Bd.Ft.) (1000 Sq.Ft.) ( 1000 Sq. Ft.)
! 1955-56 4,303,695 378,935 105,301 197,712 1956-57 4,631,209 479,137 135,204 204,892 1957-58 4,825,742 499,258 , 168,901 295,920 1958-59 5,45 I ,636 433,714 298,290 453,775 1959-60 6,314,737 384,227 324,027 254,231
1 960-61 6,596,458 441,286 260,308 239,481 1961-62 6,771,781 406,073 . 316,735 398,928 1962-63 7,668,078 482,047 400,325 738,245 1963-64 6,536,115 499,942 470,205 609,679 1964-65 6,175,142 531,413 597,427 742,327
1965-66 8,047,148 375,881 540,209' 785,731 1966-67 7,843,283 322,220 521,915 831,000 I 967-68 11,113,650 432,921 !595,034 . 1,205,910 1968-69 11,583,713 620,976 523,866 627,221 1969-70 11,004,564 568,420 573,048 305,280
' 1970-71 10,679,519 364,827 589,971 635,162 1971-72 8,416,099 598,166 785,353 764,303 1972-73 8,990,336 449,404 · 1,240,539 717,000
Source of data: Bureau of Forest Development.
y
195

~
"' -Cl> 2 u ·-
..CJ ::,
.U
C 0
i C -
-a,
if -u ~
8 CD
C 0
·-::E ..£
.... QJ
t1'. QJ ~
Cl ::, 0:-V)
6
~ C
12
11
10
9
8
7
6
5
4
3
2
I
0
700
600
500
400
300
200
100
0
1,300
1.200
I. I 00
1.000
900
800
700
600
500
400
300
200
100
0
Figure 6.3 QUANTITY OF PRODUCTION OF LOGS, LUMBER, PLYWOOD AND VENEER
FY 1955-56 TO FY 1972-73
1---LOGs--~---------
1---LUMBER---~--------
,___ PLYWOOD & VENEER------
·LEGEND· ll!lll Plywood
,__ _____ Veneer ---------
4

Figure 7.1
Figure 7.2
Table 7.1
Table 7.2 Table 7.3
Table 7.4
Table 7 .5
CHAPTER VII
ESTABLISHMENT CHARACTERISTICS
Employment Index by Industry Division: CY 1966-73 (1965 · = JOO) Paid-in Capital Investments of Newly Registered Business Or-ganizations: CY I 949-73 Number of Establishments by Major Industry Division and by Province_: CY I 972 Employment Index by Industry Division: CY 1966-73 Capital Investments of Newly Registered Business Organizations: CY 1949-73 Capital Investments of Newly Registered Business Organizations: by Nationality and Kind of Business: CY 1955-73 Capital Increases and Withdrawals of Corporations and Partner-ships, Philippines: CY 1949-73
200
201
202 206
208
210
■ .214

CHAPTER.VII
ESTABLISHMENT CHARACTERISTICS
Presented in this chapter are five major statistical tables showing the impbrtant characteristics of business establishments in the Philippines. The sources of these data are the NCSO 1972 Listing of Establishments. the CB Statistical Bulletin, the Bureau of Commerce, and ·the Securities and Exchange Commission.
The data published cover the following: (I) number of establishments by major industry division and by province; (2) employment index by industry division; (3) capital investments of newly registered business organizations; ( 4) capital · in.vestments of newly registered business organizations, by nationality and kind of business; and (5) capital increases and withdrawals of corporations and partnerships in the Philippines:
Taken as a whole, these data show interesting insights on how the business sector fares in the overall development scheme of the economy.
199

INDEX 170
160
150
140
. 130
120
N 0 110 0
100
\ 90
8
70
60
50
ol 1966
,. ot
q q 0
Figure 7.1 EMPLOYMENT INDEX BY INDUSTRY DIVISION: CY 1966-73
(1965 = 100)
AGRICULTURE "-
/!TRANSPORT & COMMUNICATION ~/ ,.,-----, \.:;;; ···-·
.,j .,. .... -
~' ·v ---------~ ---------~--..r- """--~-...e.._ ~- ~- i - I
ALL ITEMS
.. ·- -J ELS:TRICITY,GAS &. WATER
INDEX
l .l -- -"
-
' 170
160.
150
140
~ ...... .............................
130
120
110
100
90
........ \__COMMERCE
n
L.,, <:,
MINING &.QUARRYING "'.,,
\\ t
t \\ \\
. I 'o7 '68 '69 '70 171 '72 '73
COIIISTRUCTION \
\ ---o. -- ~.. ,di!, ' ~ c::ic:LZ::t~C:.o:; c::r~~c:::,.. .
' I ' ' ' ' ' ' I '
J F" M A M J J A S 0 N D
1973
70
60
so
0

N 0
Figure 7.2 PAID-IN CAPITAL INVESTMENTS OF NEWLY REGISTERED
BUSINESS ORGANIZATIONS: CY 1949-73
IN MILLION PESOS
1,000
900
800
700 . ~ J
600
l 500
/· I'\,........ ~
~ ,
\ I j .
TOTAL PAID - IN . : CAPITAL--..__,,/ SINGLE ~
/ PROiRliTORSHlfS •' / .. t i / .
- ' .. . . : ...
~ ./ - ! .... - J •• " I ,,, i ... .... I'-..,,,. .· .. .. . • ••• •,;_cfRPORAT1ois J . ! ···••::1• . ... v~· i -" J ~ .. .. -i--+--. -- -- __ 1 __ I I - .,/' .. ' I ! !
•• J. •••• .... ,• i ••••• •- I ·..:.·.:: •,!·:: --t--, --r--r .. •• ••.' .,,,. -,:: i • • ..,.._ .y,• h..a.~ • •. •.!. :.:-r - -'4-PARTNERSHIPS J
-- j i -
400
300
200
100
0 1949 '51 '53 'SS · '57 '59 '61 '63 '65 '67 '69 '71 '73
1950 '52 '54 '56 '58 . '60 '62 '64 '66 '68 '70 '72 ·
••

Province ·
PHILIPPINES
Abra Agusan del Norte Agusan del Sur Aklan Albay Antique Bataan Batanes Batangas Benguet Bohol Bukidnon Bulacan Cagayan Camarines Norte Camarines Sur Carniguin Capiz Catanduanes Cavite Cebu Cotabato Davao de! Norte Davao de! Sur Davao Oriental . Eastern Sarnar lfugao llocos Norte !locos Sur lloilo lsabela Kalinga-Apayao La Union Laguna
Table 7.1 - NUMBER OF ESTABLISHMENTS BY MAJOR
All Establish'.
rnents
S 19,890
1,653" 4,512 1,831 2,769
10,525 2,514 3,320
120 2,238 5,695 7,776 5,840
11,176 9,171 3,795
13,409 778
5,018 1,918
10,008 24il31 11,300 7,867
14,979 3,009 2,135
521 8,376 5,109
16,906 5,764 1,286 6,146
13,053
' Logging
612
0 29 34
0 5 0 4 0-0 2 0 6
15 16 9 9 0 0 4 0 0
32 32 31 14
2 0 2 l 0 6 "O 0 3
202
Mining and
Quarrying
1,699
3 143
0 0
l l 3 l 0 0
19 I I
2 86 9
13 16 0 5 0
144 33
112 . 8 37
2 2 0
419 112
43 l
. 1
7 7
Manufactur- Electricity, ing Gas and
Water
67,228 736
406 38 485 7 248 2
.358 6 1,622 19
709 14 365 6
4 0 191 2 469 7 599 28 759 9
2,035 13 1,624 8
426 2 1,493 18
50 6 790 9 157 6
1,050 14 2,332 61 1,688 14
978 8 1,606 14
365 9 174 6 21 0
2,948 l I 1.072 9 3.210 22
792 4 304 l 914 4
l.997 28 ~
41

INDUSTRY DNISION AND BY PROVINCE: CY 19'72 '
Financing In- Community, Wholesale Transport, surance, Real Social
Construction and Storage and Estate, Busi- and Retail· Communication ness, Serv- Personal
ices Services
740 355,550 43,389 9,529 40,407
0 871 205 23 107 4 3,336 150 72 286 0 1,382 56 8 101 0 1,620 531 48 206
24 7,042 1,026 156 620 8 1,285 185 84. 226
12 2.324 272 57 280 0 110 4 0 2
2 1,481 412 26 124 25 4,465 94 134 480
0 6,353 368 58 359 6 4,473 161 53 371 7 7,624 87 143 1,166 6 4,543 2,431· 96 438 ~ 2,823 103 58 359
26 9,719 1,161 220 747 0 637 38 4 43 5 3,286 537 90 296 2 1.504 139 13 93 5 6.721 1,201 84 789
53 18,490 1,335 444 1,683 5 7,405 1,080 140 824 2 5,160 1,096 67 516
21 I 0,281 1,360 359 1,2:70 l 2,309 75 23 211 1 1,486 388 5 71 0 430 38 ·4 28 8 3,547 1.001 • 60 380 2 2,507 1,095 25 286 4 10,841 1,333 291 1,162 2 3,801 587 61 510 2 783 100 17 77
2 3520 1,240 ·85 374 5 9,214 556 162 1,081
203
•

Table 7.1 .,-- NUMBER OF ESTABLISHMENTS BY MAJOR
Province
Lanao de! Norte Lanao de! Sur Leyte Manila Marinduque· Masbate Misamis Occidental Misamis Oriental Northern Samar Nueva Ecija Nueva Vizcaya Occidental Mindoro Oriental M indoro Palawan Pampanga Pangasina.n Quezon Quirino Rizal Romblon · Siguijcir Sorsogon South Cotabato Southern Leyte Sulu Surigao de! Norte Surigao de! Sur Tarlac Western Samar Zam bales Zamboanga de! Norte Zamboanga <lei Sur
All Establish
ments
5,249 3,981
12,182 41,834
1,866 2,963 5,360 9,865 3,320
11,723 3,071 2,726 4,925 3,413 .
15,938 20,598 14,716
459 60,877
2,469 636
5,559 7,924 3,820 2,,63 I 2,639 4,406
10,014 1,883
l 0,242 5,191
12,822
Logging
12 12 7
40 . I 0 4
28 0 3
12 I 9
10 0
18 49
5 34 9· 0
19 I 1 2 0 0
18 0 5
• 2 18 27
Mining and
Quarrying
37 0 4
37 3 I
I I 6 3 I 2
23 3
17 0
30 I I 0
93 I .
I 6
77 0 0 6
I 5 4 2
1 I 2
41
Source of data: Nalional Census and Statistics Office, J 972 Listing of Establishmen_ts.
204 .
Manufactur- Electricity, ing Gas and
Water
463 10 349 3
1,156 21 4,906 4
137 10 337 5 559· 20 972 44 250 4
1,254 12 294 4 457 5 571 6 378 2
1,6·1.6 17 2,437 39 1,842 14
76 0 9,832 23
227 5 44 I
522 9 1,184 6
278 5 330 6 207 12 393 3
1,022 5 187 9 999 8 405 .8
1,304 I I
~
j
1
· I

J
INDUSTRY DIVISION AND BY PROVINCE: CY I 972 (continued)
Financing In· Community, Wholesale Transport, s·urance, Real Social
Construction and· Storage and Estate, Busi- and , Retail Communication ness, Serv- Personal
· ices Services
5 4,066 212 95 349 I 3,247 210 13 146
21 9,848 381 197 547 117 27,884 1,142 2,233 5,471 . 0 1,135 462 21 97
I 2,320 127 22 150 5 3,746 567 79 369
30 7,180. 415 331 859 2 2,571 372 11 107 7 7,652 1,809 133 852 3 1,817 620 76 243
. I 1,604 410 51 174 0 3,116 845 57 318 4 2,547 262 28 165 4 11,630 1,210 202 1,259
17 12,395 3,909 248 1,505 5 10,124 1,259 200 1,212 0 324 19 I 34
237 41,652 1,053 1,461 6,492 0 1,861 .. 271 5 90
0 509 40 3 38 2 4,223 403 66 309 6 5,428 430 129 . 653 2 3,108 239 37 149 4 1,461 523 84 223
10 2,109 116 35 144 I 3,266 95 27 228 1 6,105 2,100 152 625 1 1,498 59 - 24 98 8 6,292 1,957 I 26. 839 I . 3,618 835 35 269 2 9,841 592 177 827
205

Period All Items (I)
1966 107.6 1~67 .113.4 1968 117.3 1969 .123.6 1970 116.4 1971 120.3 1972 123.1
January 122.4 February 123.1 March 123.4 April 121.6 May ·I 2 l.4 June 121.8 July 124.7 August 123.7 September 1_24.5 October 124.0 November 123.5 December 123.4
1973 132.2
January 127.5 February 126.3 March 127.0 · April 130.3 May I 31.6 June 130.0 July 134.6 August 134.0 September 134.4 October 135.2 November 137.1 December 138.3
Table 7.2 - EMPLOYMENT INDEX1
(1965
Mining and Agriculture Quarrying
(2) (3)
177.3 97.3 122.6 105.3 129.6 110.9 138.1 -114.4 129.0 115.8 117.0 117.3 122.3 125.2
127.2 121.9 125.7 122.0 125.7 122.5 122.4 123.6. 120.6 124.6 121.2 129.9 124.4 120.0 122.2 121.2 123.3 120.4 117.8 . 130.8 119.0 131.0 118.3 134.0 147.6 138.6
133.9 132.5 130.9 131.8 133.4 133.8 138.5 135.9 14L5 136.7 142.6 138.5 158.8 138.7 155.1 140.6 151.8 141.7. 158.8 142.8 163.0 145.1 162.7 145.7
1Revised series using an updated sampling f;amC ~ith 1965 as the ba~ year.
Source of ~ata: Central Bank of the Philippines.
206
1 i
' • I i
I
1 1
~ 4
1
' /

BY INDUSTRY DIVISION: CY 1966-73 = 100)
Manu- Construe- ·Electricity facturing lion Gas & Water
(4) (5) (6) .
107.4 112.4 101.8 113.0 123.4 107.3 119.9 130.2 112.3 I 31.0 158.1 108.8 124.2 94.4 106.2 135.9 92.2 119.1 131.4 79.2 I I 9.4 -134.8 83.1 · 124.1 I 35.1 85.7 124.3 I 35.4 89.1 124.3 127.5 89.9 1 I 7.2 128.6 89.2. I I 7.0 127.7 87.6 I 16.3 129.0 78.1 I I 7.5 I 29.3 75.7 I I 7.6 129. I 73.7 I I 7.2 132. I _ 69.4 119.8 133.4 61.1 118.9 134.4 · 68.3 118.4 135.5 56.8 120.3
134.9 58.8 118.0 134.5 59.1 I 18.6 134.7 57.9 119.2 136. I 57.7 122.1 133.9 57.9 121.3 131.8 60.2 120;2 )33.8 55.4 121.0 134.3 53.3 · 121.4 136.3 .55.4 · · 121.0 136.2 55.6 121.3 138.8 55.9 121.2 140.2 54.0 121.0
207
Transport & Commerce Communication Services
(7) (8) S9>
101.3 103.0 107.9 . 110.0 102.4 112.3 I 07.1 105.4 118.6 I 07.7 106.8 122.5 99.0 110.6 122.3
110.4 109.8 125.5 112.5 130.4 131.8 --107.7 120.5 124.7 111.5 I I 9.3 125.0 111.9 119.2 125.1 112.5 122.8 132.3 112.3 122.8 132.0 I 13.6 124,8 132.1 I 14.7 142.8 133.6 112.9 141.3 133.3 115.5 141.0 134.1 113.8 141.5 136.6 112.4 134.6 136.3 110.9 134.7 136.3 111.3 148.9 143.2
109.4 142.4 139.6 109.5 138.6 139.6 108.7 14 I. 7 139.3 112.7 147.1 140.6 116.6 149.2 140.9 111.4 148.6 142.0 110.4 154.0 145.2 I 10.6 153.0 146.5 113.0 . _150.6 147.3 111.0 150.6 144.6 111.8 149.7 145.2 I I 0.2 161.9 147.5

Table 7.3 - CAPITAL INVESTMENTS OF NEWLY
(Amount in
Calendar Total Corporations I Paid-in · Subscribed Year Number Capital Number Capital
1949 4,332 72,148 472 33,961. 1950 5,602 151,735 608 67,189 I 95 I 7,120 174,977 574 58,206 I 952 6,290· 152,824 467 58,606 1953 7,242 174,895 586 58,642 1954 7,961 154,167 605 55,666 1955 6,016 110,762 657 63,810 1956 5,629 135,496 927 102,726 1957 5,684 138,610 913 107,216 1958 6,285 142,607 968 I 10,223 1959 7,052 175,984 · 1,086 153,958 1960 7,150 184,855 1,217 173,339 1961 8,596 236,727 · 1,330 299,269 1962 9,709 282,266 1,574 260,252 1963 10,443 373,524. 1,730 387,569 1964 9,751 340,500 1,776 317,036
j · 1965 9,626 327,267 1,545 ,289,711 1966 10,577 388,009 2,066 414,028 1967 · 11,846 419,182 2,135 537,0 I 2 1968 12,121 470,815 2,400 563,172 1969 10,803 410,024 2,132 528,815 1970 11,591 437,967 2,179 595,489
1 1971 12,588 670,179 2,387 546.484 1972 14,901 604,273 2,672 · 662,267 1973 36,007 983,559 3,624 1,057,219
January 2,223 75,136 297 63,782 1 February 2,130 6 I ,34 I 298 59,112 · March 2,730 87,669 290 77,175
April 2,147 76,697 290 96,044 May 2,272 67,213 3 I 1 66,300 June 2,494 66,680 286 65,242 July 3,288 91,293 300 96,188 August 3,629 92,642 368 108,398 September 4,694 113,719 292 I 02,629 October 4,260 88,073 338 I 06,278 November 3,435 78,145 304 84,338 December 2,705 84,951 250 132,733
1 Jncluding cooperatives
Source: Department of Economic Research, CentraJ Bank of the Philippines
208

REGISTERED BUSINESS ORGANIZATIONS, CY 1949-73
thousand pesos)
Partnerships Single Proprietorships Paid-in Number Paid-in Number
Paid-in Capital Capital Capital
I 7,861 246 13,988 3,614 40,299 41,285 408 18,746 4,586 91,704 29,032 729 · 40,833 5,817 105,i 12 33,426 760 32,696 5,063 86,702 21,381 698 30,817 5,958 122,694. 23,910 681 20,729 6,675 . 99,528
24,944 505 20,307 4,854 65,511 39,802 596 22,468 4,106 73,226 39,393 610 24,860 4,161 74,357 36,743 694 29,543 4,623 76,321 50,798 734 29,483 5,232 95,703
64,083 807 34,375 5, I 26 86,397 100,688 792 33,969 6,474 102,070 109,491 873 45,260 7,262 127,515 176,308 1,048 58,428 7,665 138,788 133,854 925 50,125 _ 7,050 156,521
123,775 827 44,936 7,254 I 58,556 153,929 933 45,432 · 7,578 188,648 195,508 909 47,754 8,802 175,920 216,665 1,009 59,255 8,712 194,895 182,940 917 47,327 7,754 179,757
211,633 1,078 45,652 8,334 180,682 203,907 1,211 73,147 8,990 393,125 280,592 1,415 64,783 10,814 258,898 370,252 . 2,292 113,196 30,091 500,111
27,975 . 195 8,116 1,731 39,045 21,030 189 9,156 1,643 31,155 24,314 249 8,473 · 2,191 54,882 35,725 161 5,643 1,696 35,329 25,651 233 9,764 1,728 31,798 20,612 184 9,431 2,024 36,637 33,127 182 8,132 2,806 50,034 38,391 219 9,422 3,042 44,829 32,652 170 13,593 4,232 67,474 36,733 . 203 8,859 3,719 42,481 29,993. 163 13,482 2,968 34,670 44,049 144 ·9,125 2,311 31,777
209

Year/Nationality
I 955 1956 1957 1958 1959 1960 1961 1962 1963 1964 1965
Filipinos Chinese Americans Others
1966
Filipinos Chinese Americans Others
1967
Filipinos Chinese Americans Others
All Industries
110,762 135,496 138,610 142,607 175,984 184,855 236,727 282,266
. 373,524 384,753 327,267
268,835 36,641 I 7,776 4,0\5
388,009
354,334 27,994
4,066 1,615
419,182
381,802 28,962
2,599 5,817
Table 7.4- CAPITAL INVESTMENTS ORGANIZATIONS BY NATIONALITY
(Thousand
Agriculture Mining
5,513 415 10,701 2,603 7,341 3,122 6,930 2,067 7,929 2,438
14,445 835 14,780 1,404 20,862 2,062 38,279 4,445 23,624 2,603 12,621 11,722
12, I 00 I, 771 271 232 I 0,001
18 19,546 2,231
19,068 2,200 298 i53 31 27
32,042 5,361
3f,427 4,964 · 385 36 226 361
4
210
Manufacturing
33,857 31,965 40,695 40,257 41,816 47,071 46,997 64,222 77,801 71,408 64,700
48,246 I 1,651 2,701 2,102
95,944
85,325 9,319 · 815
485 85,620
70,603 · 10,004
597 4,416
~ I
~

-OF. NEWL Y
1 REGISTERED BUSINESS
AND KIND OF BUSINESS: CY 1955-73 pesos)
. Real Estate, Transport, Construe- Electricity,
Trade Insurance, Storage Services
tion Gas and Banks and and Com- . Water Financial munication
Institutions
1,582 507 . 48,164 11,547 3,468 5,709· 1,622 1,228 53,706 15,605 8,451 9,615 2,193 545 51,225 16,228 7,180 10,08+ 2,304 · 929 53,999 18,372 6,629 I I, 120 6,842 240 64,468 24,992 3,972 23,287 3,923 751 56,739 "36,317 7,152. 17,622 7,063 1,488 76,772 64,854 8,601 i4,768 8,071 375 98,485 53,204 · 11,315 73,670 7,138 738 I 04,566 99,015 10,053 31,489 7,346. 543 144,530 53,987 30,418 50,300
11,661 1,122 120,295 47,351 16,750 40,995
8,589 1,045 100,858 44,746 16, 128_ 35,352 369 70 17,8 I 5 551 545 5,369
2,678 ✓
7 629 1,233 72 223 25 993 · 821 5 51
21,119 690 118,790 65,657 21,473 42,559
21,059 558 100,874 64,109 21,320 39,821 60 132 15,275 768 8 2,134
1,752 647 I 15 553 889 133 30 51
14,6 I 0 626 130,182 '82,084 27,164 41,493
14,184 626 113,242 81,101 27,141 38,514 263 15,455 ?72 18 2,229 107 576 123 • 5 604 56 909 286 146
•
211

• I
Year/Nationality
· 1968
Filipinos Chinese Americans Others
1969
Filipinos Chinese Americans Others
1970
Filipinos Chinese Americans Others
1971
Filipinos Chinese Americans Others
1972
Filipinos Chinese Americans Others
1973
Filipinos Chinese Americans Others
- not available.
All Industries
470,815
426,691 29,811
6,121 8,192
410,024 . 391,212
13,115 4,539 r,098
437,967
425,018 9,576 1,928 1,445
670,179
645,108 8,230
814 16,027
604,273
577,887 12,079 2,764
11,543 983,559
946,645 23,602 · 6,814 6,498
Table 7.4 CAPITAL INVESTMENTS ORGANIZATIONS BY NATIONALITY
(Thousand
Agricul0
.ture
33,408 .
32,543 267 165 433
22,302
22,093 52
137 20
15,395
15,317 58 20
29,377
29,152 18
100 107
31,034
30,154 481 260 139
72,218
69,3 I I 697
1,602 608
Mining
8,410
7,843 286 281
30,544
29,839 20
530 , 155
_54,864
53,075 209. 743 837
·20,584
20,283 32
218 51
9,550
9;266 141 143
24,082
22, 1 19 1,636
242 85
Manufacturing
82,279
70,121 10,617
· 912 629
48,262
45,384 2,159
390 329
52,690
50,295 2,171
115 109
128,491 '
126,232 1,968
228 · 63
92,250
78,525 3,020
354 10,351
161,082
149,992 6,763 1,228 3,099
, ., Source of basic data: Department of Economic Research, Central Bank of the Philippines.
212
• I
4 i ~

r OF NEWLY REGISTERED BUSINESS AND KIND OF BUSINESS: CY 1955-73 (continued) pesos)
Real Estate, Transport
Construe- Electricity, Trade
Insurance, . Storage Services
tion Gas and Banks and and Com-
Water Financial munication Institutions
-✓
28,108 672 I 59,413 87,269 20,916 50,340
26,331 624 136,868 84,767 20,545 47,049 617 8 14,999 701 150 2,166 899 40 1,560 1,787 26 451 261 5,986 14 195 674
16,192 1,090 132,063 63,635 41,841 54,095
i5,864 1,090 122,548 60,357 41,641 52,456 296 - 8,874 164 42 1,508 -
32 56 3,114 158 122 585 9
21,847 1,506 137,953 84,433 · 15,482 53,797
21,813 1,506 · 131,313 83,615 15,396 52,688 34 5,890 388 71 755
298 400 352 452 30 15 2
42,298 I, 143 206,882 124,6) I 28,615 88,178
41,869 I, I 37 201,435 124,389 13,115 87,496 397 6 5,177 68 564
32 76 154 6 194 15,500 112
36,392 923 I 85,499 127,591 26,526 94,508 35,242 923 178,507 125,311 , 26,.:\16 93,543
85 6,061 1,684 40 567 1,050 487 289 70 11 I
15 :.. 444 307 287 43,03 I . 3,451 330,738 134,815 47,461 166,681
42,537 3,418 316,339 133,720 47,260 161,949 289 32 12,072 466 142 1,505 144 1,13 I 625 18 1,824 61 I ,196 4 41 1,403
213

Table 7.5 - CAPITAL INCREASES AND WITHDRAWALS OF CORPORATIONS AND PARTNERSHIPS, PHILIPPINES: CY 1949-73
(Amount in.thousand pesos)
Increases Withdrawals Net Effect Calendar
Year Number Amount Number Amount Amount
1949 64 . 30,802 94 3,377 27,425 1950 115 50,894 94 4,434 46,460.
1951 139 - 19,099 125 13,931 5,168 1952 I 100 13,135 148 9,532 3,603 1953 99 28;570 145 10,863 I 7,707 1954 140 28,493 158 i3,828 14,665 1955 114 I 8,375 121 15,764 2,611
1956 131 29,726 86 5,189 24,087 1957 · 82 29,144 72 5,461 23,683 1958 211 74,315 196 11,272 63,043 1959 234 99,092. · 209 18,963 80,129 1960 238 103,763 203 15,335 88,428
1961 274 162,155 186 21,594 140,561 1962 · 283 86,141 301 23,189 62,852 ◄ 1963 92 69,099 74 5,986 63,113 i 1964 280 146,974 356 37,885 ·I 09,06.8 1965 299 198,41_6 304 35,916 162,500
1966 . 315 221,966 293 22,816 199,150 1967 333 257,962 281 49,340 208,622 • 1968 · 326 325,542 295 44,561 280,981
'
1969 285 363,518- 250 42,624 320,894
1 1970 352 420,218 185 - 15,933 404,285 ·
' 1971 354 479,904 253 24,173 455,731 1972. 394 553,100 134 5_4,698 498,402 1973 540 654,9Q0 420 · 86,914 567,986 ' ....
~ Source of data: Central Bank of the.Philippines.
214
1

CHAPTER VIII
INDUSTRIAL SECTORS
Figure 8.1 Selected Characteristics of Manufacturing Establishments with 5 or more Workers: CY 1956-71 217
Table 8.1 General Statistics for Manufacturing: CY 1956-71 218
Table 8.2 General Statistics for ManufaCturing Establishments with 5 or more Workers, by Major Industry Group: CY 1971 . 220 ·
Table 8.3 Selected Characteristics of Manufacturing Establishments with 5 or more Workers by Industry: CY 1956-71 222
Table 8.4 Index of Physical Volume of Manufacturing Production: CY 1966-73 230
Table 8.5 Electric Energy Purchased, Generated, Sold and Consumed by Industry: CY 1970 and 1971 232
Table 8.6 Mining Production: _CY 1946-73
Figure 8.2 Gold Mining Production: GY 1949-73
Figure 8.3 Silver Mining Production: CY• 1949-73
Figure 8.4 Chromite Mining Production: CY 1949-73
Figure 8.5 Coal Mining Production: CY 1946-73
Figure 8.6 Manganese Mining Production: CY 1949-73
Table 8.7 Number, Floor Area and Value of Private Building Construction for Selected Areas by Type of Building and by Year: CY .1961 to
-236
245
246
247
-247
March 1974 248
Table 8.8· Expenditures on Government Construction: FY 1966-67 to FY 1972-73 256
Table 8.9 Electricity Generation of the Manila Electric Company and the National Power Corporation: CY 1960- to April 1974 258
Table 8.10 Amount of Foreign Investments Approved by the BO!, Under Approved Applications to Accept Permissible Investments, by Product and by Nationality, Under RA. 5455 (Foreign Business Regulation Act): 3rd-4th Quarter 1969 to_ 1st Quarter 1974 259
Table 8.11 Amount of Permitted Foreign Investments Under RA. 5455 (Foreign Business Regulation Act), 3rd-4th Quarter 1969 to 1st Quarter 1974 260
Table 8.12 Total Capital of Approved Applications to do Business in the Philippines Under RA. 5455 (Foreign Business Regulation Act) (Single Proprietorship & Partnership), 3rd-4th Quarter 1969 to 1st Quarter J974· 261
Table 8.,13 Subscribed Capital of Approved Applications·to do Business in the Philippines, Under RA. 5455 (Foreign Business Regulation Act (Corporations), 3rd-4th Quarter _1969 to 1st Quarter 1974 262
Table 8.14 Subscribed Capital of Projects Approved by the BO! Under RA. 5186 (Investment Incentives Act) • with Foreign Equity Classified by Products and by Nationality of Investors: C"( I 968 to 1st Quarter 1974 264
Table 8.15 Subscribed Capital of Projects Approved by the BO! Under RA. 6135 (Export Incentives Act) with Foreign Equity, Classified by Industry and by Nationality: CY 1971 to 1st Quarter_ 1974 266
:■

CHAPTER VIII
INDUSTRIAL SECTORS Data on the industrial sectors are important in that they provide
vital information on the extent to which an economy has attained progress in its industrial d_evelopment program. This assumes greater relevance to developing countries like the Philippines because of the close and positive correlation between industrial development on the one hand and overall economic and social development on the other hand. It is the industrial, particularly the manufacturing, sectors that should ideally lead the country in its thrust to a more accelerated pace of development. By giving more emphasis on the development of its indigenous industries, a country could broaden the base of its development, generate more employment opportunities for the populace, and expand aggregate production, than if it were to concentrate on traditional agriculture. Industrialization, therefore, would enable a country to progress at a faster pace.
Presented in this chapter are the vital statistical data on the industrial sectors of the Philippine economy covering the major portion of the post-war period. Nine (9) major statistical tables are presented. These are: general statistics for manufacturing, ge·neral statistics for manufacturing establishments with five or more workers by industry, selected characteristics of manufacturing establishments with five or more. workers by industry, index of the physical volume of manufacturing production, electric energy purchased, generated and consumed by industry, ·mining production, number, floor area and value of private building construction in the Philippines by type of building and by year, government construction by type, and electricity generation of the Manila Electric Company (MERALCO) and the National Power Corporation (NPC).
Data on manufacturing were culled from the National Census and Statist.ics Office's Annual Survey of Manufactures (ASM). Conducted annually by the NCSO since its inception in 1956, this study covers the entire country and presents basic statistics on the manufacturing sector
. such as employment, payrolls, fixed assets, inventories, shipments, costs, and gross value added. Included in the survey are·firrns with 5 or more workers while data on mining production come from the Bureau of Mines. Data on construction are also supplied by the NCSO.
216
1
l

Figure 8.1 SELECTED CHARACTERISTICS OF MANUFACTURING ESTABLISHMENTS
WITH 5 OR MORE WORKl,':RS: CY 1956-71
IN THOUSANDS VEAR IN THOUSANDS 10 8 6 4 2 0 0 100 200 300 400 500
NUMBER OF
ESTABLISHMENTS
IN BILLION PESOS 20 18 16 14 12 10 8 · 6 4 2. 0
I VALUE OF
SHIPMENTS
1956
1957
1958 1959
1960
1962.
1963
1964
1965
1966
1968 TOTAL
1969 EMPLOYMENT
1970 --1971
IN BILLION PESOS 0 .2 - .4 .6 .8
I · I LO
· 1955
1957
1958
1959
1960
1962
1963
1964
1965
1966
1968
1969
1970
1971
TOTAL CAPITAL
EXPENDITURES
217
1.2
1.34
'

I
r·
No. of Calendar Estab·
Year ments
(I)
Establishments with 5 or more workers 1956 ........... 7,208 1957 ........... 7,421 1958 ........... 7,41 I 1959: .......... 7,386 1960 ........... 7,221 1962 ........... 8,469 1963 ........... 8,833 1964 ........ •.· . 8,044 1965 .......... : 7,925 1966 ........... 8,036 1968 ........... 10,058 1969 ........... 10,494 1970 ........... 10,496 1971 ........... 10,238
Establishments with 20 ,or more workers
i956 ........... 1,833 1957 .... .-...... 2,075 1958 ........... 1,894 1959., ......... 1,858 1960 ........... 1,884 1962 ........... 2,180 · 1963 ........... 2,219 1964. <· ........ 2,196 1965 ........... 2,152 1966 .. •.· .... : .. 2,075 1968 ........... 2:385 1969 ........... 2,170 1970 ........... 2,156 1971 ........... 2,045
Table 8.1- GENERAL STATISTICS FOR (Value and cost figures
Employment (Average for Total the Year) Payrolls
Paid for Paid
Total Employ- Employees
-ees (2) (3) (4)
205,809 196,050 . 331.1 223,551 213,691 369.3 228,307 218,382 397.5 238,666 229,104 443.6 248,781 239,605 471.1 278,473 266,878 548.8 300,383 288,067 622.8 316,415 305,192 696.0 323,770 313,198 765.8 327,354 316,349 847.3 394,336 380,054 1,076.0 402,064 386,074 1,147.1 403,874 389,008 1,296.4 420,988 406,617 1,551.6
150,878 149,333 278.6 172,708 170,899 322.3 178,328 176,914 347.5 185,580 184,376 386.4 199,094 197,980 422.7 230,469 229,179 506.8 250,128 248,733 574.2 . 266,241 264,728 643.3 273,459 272,115 709.3 275,979 274,538 787;8 325,131 323,666 983.5 331,841 330,516 1,060.3 333,121 332,133 1,193.1 353,008 352,312 1,451.4
Source: National Census and Statisi:ics Office, Annual Survey of Manufactures.
218 I
~
·i
j 1 ~
1 I

MANUFACTURING: CY 1956-71 in million pesos)
Value of Gross Cost of Output
Materials Contract Shipments of
Work & Total Manufactured
Resale Products
. (5) (6) (7) •/
2,345.5 2,130.2 1,316.7 2,698.7 2,453.0 1,502.1 3,-099.4 2,806.9 1,673.4 3,490.2 3,194.4 1,879.4 3,934.3 3,560.7 2,171.4 5,398.9 4,881.2 3,199.0 6,708.4 6,027.9 3,970.5 7,423.4 6,702.5 4,528.8 7,467.0 6,698.7 4,593.1 8,205.9 7,477.2 5,063.0
11,281.4 I0,101.0 6,791.0 11,991.7 10,872.1 7,129.8 15,847.0 14,087.4 9,588.8 19,521.7 17,884.9 12,083.6
1,994.2 1,841.8 1,074.6 2,391.5 2,194.6 1,301.8 2,757.3 2,551.1 1,452.5 3,139.8 2,911.8 1,666.2 3,547.6 3,244.1 1,915.J 5,104.2 4,635.2 3,004.7 6,335.3 5;723.6 3,724.9 6,961.3 6,314.8 4,228.1 7,020.4 6,337.4 4,314.2 7,713.4 7,073.9 4,742.8
10,553.6 9,509.6 6,316.8 11,265.4 10,297.0 6,646.6 15,026.3 13,435.0 9,071.6 18,604.4 17,187.2 11,480.2
•
Census Value Added
(8)
1,028.8 1,19.6.5 1,425.9 1,610.7 1,762.9 2,199.9 2,737.9 2,894.5 2,873.9 3,142.9 4,490.4 4,862.0 6,258.1 7,438.1
919.7 1,089.7 1,304.8 1,473.5 1,631.7 2,099.6 2,610.3 2,733.2 2,706.2 2,970.5 4,236.8 4,618.8 5,954.7 7,124.2
' 219
I
Capital Expenditures Book · Durii;ig the Year Value New Struc-
of Fixed tures, Ma-Assets Total chinery &
Equipment (9) (10) (I I)
834.4 100.4 91.2 925.3 . 156.2 144.5
1,058.6 179,9 159.5 1,125.0 175.0 151.4 1,263.1 258.1 231.3 1,741.5 455.2 399.2 2,253.0 340.9 314.6 2,571.2 409.4 373.3 2,936.2 452.6 393.4 3,390.1 602.0 562.1 4,353.0 670.1 585.1 4,532.4 822.9 774.8 5,753.6 1,342.4 1,246.8 7,188.2 1,178.6 1,124.0
737.5 92.7 85.0 843.4 143.4 j 132.8 960.8 170.3 150.7
1,011.9 164.3 143.3 1,182.1 246.5 223.4 1,631.9 444.7 390.3 2,144.4 322.4 302.4 2,419.0 402.2 366.8 2,747.6 429.0 378.3 3,203.9 587.7 , 551.2 3,977.9 611.7 536.0 4;201.4 806.3 761.8 5,439.0 1,309.0 1,220.5 6,909.8 1,161.2 1,107.5

• Table 8.2-GENERAL STATISTICS FOR WITH 5 OR MORE WORKERS, BY
(Value and cost figures
·Employment (Average for the year)
Total No. of Est_ablish- Paid
Payrolls Code Major group for Paid ments Total Employ- Employees
ees
()) (2) (3) (4)
ALL INDUSTRIES 10,238 420,985 406,617 1,554.1
20 Food ........... 2,943 88,023 82,685 290.5 21 Beverages. . . . : . . . 98 15,921 15,898 84.8 22 Tobacco ........ 53 21,257 _ 21,231. 67.4 23 Textiles ......... 213 48,328 48,139 148.7 24 Footwear & wearing
apparel ......... 2,589 - 37,294 32,586 68.5 25 Wood &cork .... 551 41,708 41,085 127.8 26 Furniture & fixtures 298 6,349 5,876 15.3 27 Paper .......... 149 10,433 10,304 48.7 28 · · Printing ......... 505 15,343 14,908 72.3 29 Leather ..•..... 85 1,922 1,793 4.7
30 Rubber. ........ 70 9,186 9,143 34.1 31 Chemicals ....... 286 25,716 25,674 173.4
I 32 Petroleum & coal. 13 1,703 1,701 21.8 33 Non-metallic mineral 416 21,741 21,3 I 3 89.9. 34 Basic metal ..... , 88 11,686 11,653 · 54.4
35 Metal 11roducts .. 474 18,129 17,797 - 77.1
36 Machinery ..... 340 6,869 6,552 24.1 37 Electrical machinery. 232 14,906 14,724 64.9 38 Transport equipment 549 14,749 14,023 ' 55.5 39 Miscellaneous .... 286 9,722 9,532 30.2
Source of data: National Census and Statistics Office. Annual Survey of Manufacturtl.
220

MANUFACTURING ESTABLISHMENTS MAJOR INDUSTRY GROUP: CY 1971 in million pesos)
Value of Gross Cost of
Capital Expenditures Output Book During the Year
Materials, Census Value Shipments of Contract Value New Struc-
Work & of Fixed .tures, Mac-Manufactured Added Assets Total Products Resale Total hinery, & Equipment
(5) (6) (7) (8) (9) (10) (11)
19,521.7 17,884.8 12,083.5 7,438.2 7,188.9 1,178.7 1,123.9
4,833.8 4,531.7 2,964.4 1,869.4 1,569.0 309.2 298.3 1,017.3 996.8 430,6 586.7. 190.4 44.5 . 41.0
994.9 935.2 450.9 543.9 140.5 '42.3 40.8 1,441.2 1,356.5 935.4 505.8 605.1 87.l 86.0
336.4 210.9 174.6 161.7 94.7 10.9 8.9 796.3 682.7 482.5 313.8 388.8 74.8 67.7
67.2 64.1 36.2 31.0 31.3 2.7 2.4. 606.8 577.3 405.8 201.0 315.2 37.4 34.3 354.5 275.3 173.4 181.1 118.5 15.7 14.7 ·
37.2 35.4 25.2 12.0 13.0 I.I 1.0
377.5 348.8 221.0 156.5 92,9 23.7 20.8 2,872.2 2,538.5 1,891.5 980.8 615.4 95.9 91.2 1,758.0 1,706.3 1,317.2 '440.8 468.6 176.8 175',1
696.7 644.7 346.1 350.6 1,129.5 92.0 85.9 780.9 · 851.4 598.9 182.0 781.3 61.1 56.9
677.8 624.5 443.0 234.8 157.0 16.9 16.0 130.4 93.2 59.4 71.0 78.0 12.9 12.3 636.0 524.8 353.2 282.8 -130.3 · 40.6 39.5 868.3 671.8 627.3 241.0 179.2 16.2 15.1 238.3 214.9 146.9 91.5 90.2. 16.9 16.0
221

/
Table 8.3 __:_ SELECTED CHARACTERISTICS OF MANUFACTURING (Value and expenditure
F o o d !_'leverage
Calendar No. of Value
Expendi- No. of Year Employ- lure on · Employ-Establish- ment of New Fixed Establish- ment
ments Shipment Assets ments
1956 2,822 57,904 603,533.0 16,738.0 199 20,030 1957 2,556 58,520 677,340.0 22,237.0 185 20,820 1958 2,531 57,363 782,079.0 25,310.0 190 20,088 1959 2,429 58,291 866,424.0 25,990.0 178 21,382 1960 2,476 61,463 1,048,663.0 31,538.0 186 22,444
)962 2,967 64,667 1,440,280.0 64,212.0 196 24,176 1963 3,065 66,564 . 1,736,991.0 50,648.7 · 180 24,793 1964 2,506 65,954 1,939,074.2 85,252.7 221 26,360 1965 2,438 69,342 1,795,192.4 120,885.3 186 26,116 1966 2,473 · 67,688 1,918,559.5 138,576,0 I 71 28,614
1968 2,969 83,193 2,610,527.3 149,670.3 159 31,639 1969 2,913 82,987 2,881,840.4 120,003.2 . l 62. 35,3_74 1970 3,093 85,046 3,613,655.0 242,344.1 169 37,798 1971 2,943 88,023 4,35J ,709. l 309,227.7 151 37,178
~ Footwear and Wearing Apparel Wood
1956 I, 725 33,929 152,215.0 2,060.0 344 19,646 I 1957 1,923 34,552 150,495.0 2,588.0 462 22,436 1958 1 1,930 31, l 57 137,027.0 2,602.0 471 25,517 1959 1,868 31,813 189,566.0 7,329.0 442 21,428 1960 l,845 30,022 158,999.0 3,044.0 330 19,371 ,.
1962 2,196 28,301 145,377.0 7,182.0 407 23,649 I 1963 2,202 2~,133 166,969.4 5,199.4 452 26,942
.J.964 1,829 30,863 153,255.8 3,794.2 396 30,125 1965 1,794 29,037 153,477.6 3,763.2 408 32,851
◄ 1966 1,865 27,563 149,650.5 . 4,594.3 484 34, l,24
1968 2,432 37,848 181,109.4 6,471.7 566 39, l 95 1969 2,826 39,150 172,472.7. 6,511.0 531 38,563 1970 2,675 34,690 193;292. I 8,792.0 539 38,876 197} 2,589 37,294 210,943.0 I 0,902.8 551 41,708
Source: National Census and Statistic's Office, Annual _Survey of Manufactures.
222

ESTABLISHMENTS WITH SOR MORE WORKERS BY INDUSTRY: CY 1956-71 figures in thousand pesos)
and Tobacco T e X t i I e s
Value Expendi-
No. of Employ- Value Expendi-
of lure on Establish- of
ture on
Shipment New Fixed ments
ment Shipment New Fixed
Assets Assets -,
299,540.0 7,852.0 186 I 0,081 117,972.0 20,470.0 333,376.0 9,513.0 145 14,312 188,582.0 23,341.0 388,304.0 12,025.0 102 17,183 221,038.0 38,547.0 384,152.0 12,765.0 116 19,235, 236.977.0 29,447.0 392,156.0 18,097.0 99 24,574 259,133.0 ' 65,098.0
451,891.0 20,066.0 - I 06 30,245 366.428.0 54,450.0 561,993.4 14,189.3 119 34,687 466,013.'2 68,638.4 653,417.1 25,827.6 139 35,185
\ 434,775.3 42,862.3 .
722,196.4 25,527.5 136 33,720 423,213.4 37,153.0 850,888.0 36,441.5 144 36,222 520,166.1 48,048.1
1,156,600.6 33,673.5 205 46,605 747,907.6 72,160.3 1,322,273.9 38,404.8 211 47,318 756,711.7 69,249.7 1,645,969.8 64,265.2 197 52,439 980,112.7 91,937.3
1,932,020.8 86,804. l 213 48,328 1,356,497.8 87,053.2
and Cork Furnitur~ and Fixtures
121,722.0 5,834.Q 340 6,456 25,300.0 929.0 151,993.0 9,293.0 373 6,090 28,240.0 823.0 147,383.0 8,736.0 354 5,041 25,589.0 527.0 l 55.964.0 9,973.0 374 5,604 27,308.0 622.0 153,172.0 9,555.0 340 5,630 31,284.0 651.0
232,057.0 23,247.0 375 6,031 30,936:0 906.0 305,089.0 23,835.1 438 7,520 39,403.1 2,254.1 349,846.7 42,949.1 427 7,575 49,768.6 5,928.3 318,781.6 30,852.6 389 7,829 42,~62.7 1,466.0 336,185.5 40,758 I 378 7,228 54,717.2 1,318.9
466,957.6 19,053.5 . 361 7,962 52,752.4 1,406.4 440,404.8 43,967.5 414 8,308 59,002.9 I ;228.8 516,697.8 67,235.5 302 6,871 52,607.6 730.1 . 682,716.5 74,760.2 298 6,349 64,075.5 2,669.3
223

·- .,,
Calender Year
1956 1957 1958 1959 1960
1962 1963 1964 I 965 IQ66
1968 1969 1970 1971
1956 .1957 1958 . 1959 1960
1962 I 963 1964 1965 1966
1968 1969 1970 1971
Table 8.3 - SELECTED CHARACTERISTICS OF MANUFACTURING ESTA (value and expenditure
Paper and Printing L e a t
No. of Value Expendi-Employ- ture on · No. of Employ-
Estab- ment of · New Fixed Establish- ment
lishments Shipment Assets ments
374 13,003 105,667.0 8,087.0 29 714 435 14,739 124,175.0 6,616.0 48 1,061 389 13,521 139,053.0 14,228.0 40 1,006 478 16,371 173,707.0 15,664.0 35 1,069 454 16,708 204,147.0 23,528.0 48 ' 1,512
490 18,129 243,213.0 18,673.0 59 I ,559 537 19,715 291,158.7 17,508.3 67 1,740 502 21,234 353,651.2 17,342.5 , I 01 2,343 542 21,226 355,655.5 34,498.4 71 2,206 536 21,199 401,695.2 27,531.7 70 2,214
610 - 22,570 509,161.9 19,618.8 56 2,274 613 ' 23,204 514,672.8 15,849.5 65 2,523 671 24,985 722,179.5 63,724.0 68 1,766 654 25,776 852,632.6 53,062.2 85 1,926
Chemicals Petroleum
252 9,923 252,248.0 11,040.0 (a) (a) 218 10,167 291,420.0 15,705.0 (a) (a) 281 11,626 339,294.0 21,818.0 (a). (a) 293 12,512 406,546.0 9,150.0 (a) (a) 312 12,685 420,890.0 13,694.0 (a) (a)
303 15,387 585,521.0 24,439.0 10 1,219 303 16,290 730,181.4 25,953.9 12 1,344 298 18,375 866,806.0 32,814.8 . 7 1,198 317 19,767 950,322.0 44,361.7 7 1,054 356 20,897 1,082.353.6 89, 794.4 8 1_,043
275 23,202 1,436,606.9 75,593.8 11 1,139 335 23,964 1,361,406.3 29,271.4 15 1,138 280 22,777 1,950,583.2 70,609.5 14 1,525 286 25,716 2,517,288.8 103,5ll8.6 13 1,703
. _ Source of data: National Census and Statistics Office, Annual Suniey of Manufacru~s..
224
1
' C
~
◄
4

BLISHMENTS WITH 5 OR MORE WORKERS BY INDUSTRY: CY 1956-71 (continued
~ figures in thousand pesos)
•
I h e r R u b b e r
I Expendi- No. of Expendi-f Value Employ- Value
of ture on Establish- of ture on
New Fixed ment New Fixed Shipment Assets ments Shipment Assets
7,199.0 609.0 20 . 2,604 17,421.0 439.0 8,014.0 421.0 35 3,678 50,539.0 20,362.0 8,924.0 403.0 36 4,828 74,887.0 4,105.0
I 0, 189.0 720.0 3.4 5,219 92,946.0 3,711.0 18,511.0 774.0 34 4,986 I 05,837.0 6,533.0
15,853.0 476.0 56 5,955 139,741.0 11,851.0 17,213.9 587.4 65 6,823 156,247.1 7,299.1 21,905.2 553.2 72 6,644 163,955.7 9,054.6 21,594.0 797.3 66 6,738 157,788.9 9,833.6 21,663.4 283.5 63 7,454 182,559.1 13,841.7
26,161.6 472.9 106 9,111 229,130.5 11,724.5 28,653.2 324.1 104 8,449 236,337.6 I 0,058.6 32,903.0 456.9 84 8,620 341,058.8 11,345.1 35,382.0 1,131.2 70 9,186 348,764.9 23,70'f .. 5
and Coal Non-Metallic Mineral
(a) (a) 168 6,020 73,984.0 2,061.0 (a) (a) 175 7,268 75,904.0 14,470.0 (a) (a) 193 7,662 93,152.0 7,471.0 (a) (a) 167 8,056 100,534.0 11,234.0 (a) (a) 184 8,164 I 03,184.0 20,179.0
372,768.0 101,212.0 175 9,531 146,358.0 12,778.0 491,824.7 5,504.3 238 11,386 180,965.1 31,931.7 440,164.8 2,152.9 275 11,904 219,826.4 48,871.4 444,443.6 7,106.8 304 13,635 235,035.3 25,368.3 473,601.5 20,492.4 239 13,243 276,704.8 77,318.4
697,659.6 20,384.6 358 16,337 371,277.6 106,755.3 911,779,2 · 11,369.4 458 17,621 406,063.2 56,533.2
1,316,228.8 173,392.6 468 I 8,682 . 435,704.3 158,057.9 1,706,324.0 176,789.7 416 21,741 644,686.6 91,979.2
225

Table 8.3 - SELECTED CHARACTERISTICS OF MANUFACTURING ESTA ( value and expenditure
• • I
Basic Metal Metal
Calendar No. of Value
Expendi-No.of Year Estab-
Employ-of
·ture on ., Employ-ment New Fixed . Esta b- ment
lishments Shipment Assets hshments
1956 36 1,334 13,847.0 318.0 251 7,782 1957 39 1,441 21,928.0 406.0 235 9,021 1958 33 2,607 35,700.0 3,052.0 315 10,938 1959 34 3,174 54,702.0 3,795.0 259 10,486 1960 34 3,468 53,065.0 2,829.0 279 14,454
1962 84 4,491 74,179.0 6,774.0 274 14,110 1963 64 5,095 100,941.3 22,940.4 303 15,606 1964 50 4,837 132,185.5 3,945.0 326 16,760 1965 52 4,897 157,822.6 15,487.9 307 17,699 1966 68 5,254 203,274.0 23,709.0 347 18,139
1968 99 8,342 367,662.9 12,252.1 499 23,401 1969 61 9,195 472,563.0 315,959.3 477 23,152 1970 81 10,911 743,970.5 273,747.6 454 16,191
. 1971 88 11,686 851,370.5 61,105.0 474 18,129
Electrical Machinery Transport
~ 1956 58 1,451 15,873.0 2,0~0.0 141 6,048 1957 67 2,635 (s) (s) 180 6,267 1958 54 2,600 31,384.0 2,690.0 192 7,224 1959 '84 6,457 84,733.0 5,299.0 199 8,161 1960 93 7,476 95,329.0 9,633.0 205 7,210
1962 114 11,060 148,249.0 14,939.0 302 10,654 ~ 1963 106 11,007 184,564.4 13,240.2 297 11,836 1964 164 13,927 208,907.8 22,917.7 324 12,402 1965 184 14,066 210,542.3 8,704.7. 292 12,710
~ 1966 155 13,014 216,567.1 9,015.6 247 12,957 1968 218 13,080 271,382.3 8,966.6 .577 14,974 1969 207 12,290 300,531.4 I 0,239.2 493 15,207 1970 203 13,467 403,665.5 56,656.9 613 13,?07 1971 232 14,906 524,768.7 40,579.3 549 14,749
Source of data: National Census and Statistics Office, Annual Survey 0/ Manufacture1 .
. 226
..

BLISHMENTS WITH 5 ORE MORE WORKERS BY INDUSTRY: CY 1956-71 figures in thousand pesos)
Products Machinery
Value· Expenditure No. of Value Expenditure
of . on New Estab-Employ-
of On new
Shipment Fixed Jishments ment
Shipment Fixed
Assets Assets
81,480.0 4,647.0 89 4,087 18,927.0 2,749.0 93,908.0 5,144.0 123 5,191 22,507.0 1,605,0
135,399.0 5,726.0 118 4,896 29,374.0 2,644.0 145,098.0 6,571.0 145 4,309 14,151.0 (s) 205,962.0 14,121.0 95 3,841 26,845.0 1,917.0
234,930.0 . 24,430.0 164 4,658 38,719.0 2,869.0 282,041.6 15,001.3 132 4,007 20,652.6 888.8 319,112.8 12,371.7 150 3,974 18,427.4 1,047.2 319,439.9 10,784.7 138 4,016 · I 8,159.4 4,251.7 374,588.9 12,768.0 167 3,985 19,614.4 2,208.7
405,752.0 16,081.3 259 5,808 48,632.5 4,555.8 425,628.2 16,525.7 327 6,064 40,868.7 3,872.7 474,200.4 14;478.8 335 6,741 70,306.0 6,640.3 624,515.0 16,936.0 340 6,869 93,224.8 12,936.0
Equipment Miscellaneous
54,41 i.o 1,388.0 174 5,097 168,907.0 3,932.0 60,050.0 2,658.0 222 5,363 134,573.0 • 3,402.0 61,855.0 3,24 ?:o 182 5,050 I 56,438.0 (s) 74,845.0 3,544.0 251 5,099 176,518.0 4,008.0 93,666.0 5,186.0 207 4,773 · 189,876.0 4,945.0
177,415.0 5,384.0 191 4,651 37,237.0 5,348.0 252,163.6 6,385.8 253 5,895 43,460.5 2,567.2 324,578.7 12,245.4 257 6,755 52,798.8 3,403.8 284,072.8 8,425.5 294 6,861 80,309.7 4,137.8 315,358.8 8,818.1 265 6,516 79,032.0 6,563.3 434,760.7 21,349.9 298 7,656 86,917.2 4,956.1 418,956.4 16,385.6 282 7,557 121,937.9 9,063.9 410,404.8 9,704.1 250 8,982 183,849.5 I 5,330.1 671,789.9 16,182.9 286 9,722 214,928.8 16,902.2
227

Table 8.3-SELECTED CHARACTERISTICS OF MANUFACTURING SUMMARY·GROSS: MANUFACTURING
(in million·
Major Industry Group 1956 1957 1958 1959 1960 1962 1963
ALL INDUSTRIES 2,190 2,544 2.908 3,324 3,713. 5.131 6,331 Food 600 636 752 832 1,024 1,463 1,-784 Beverages 149 161 180 199 213 264 324 Tobacco 153 172 211 198 186 201 246
. Textiles 121 I 95 224 243 268 377 495 Footwear & wearing
apparel 166 167. 152 206 174 171 201 Wood &cork. 123 154 147 159 158 240 313 Furniture & fixtures 26 29 26 29 32 32 44 Paper 47 54 61 89 113 138 170 Printing 64 88 92 97 111 125 153 Leather 7 9 9 10 20 17 18 Rubber 18 54 81 100 115 152 166 Chemicals 255 293 347 409 418 590 733 Petroleum & coal (a) (a) (a) (ii) (a) 393 492 Non-metallic
mineral 74 78 94 104 107 . 149 182 Basic metal (s) 23 38 55 57 78 97 Metal products 83 102 144 160 224 264 300
~ Machinery 29 26 37 26 37 47 33 Electrical machinery 17 (s) 33 91 105 165 214 Transport equipment 66 74 82 94 118 225 319
. . Miscellaneous 163 171 197 223 232 40 46
(a) Combined with industry group 39 (Misc. mftrs) to avoid disclosure of lllformation. (s) The estimate even though derivable by substraction is suppressed because it,was found not accep~le for publiCation.
~ Source of data: National Census and Statistics Office. Annual Survty of Manufacture,.
(~
228

ESTABLISHMENTS WITH 5 OR MORE WORKERS OUTPUT BY INDUSTRY: 1956-71 pesos)
1964 1965 1966 1968 1969 1970
7,017 7,042 7 734 I 0,761 11,250 14,967 1,967 1,834 1,928 2,653 . 2,932 3,686
401 422 497 624 690 830 265 317 366 569 669 ' 859 458 442 504 764 789 1,042
191 193 191 280 246 263 361 331 348 491 456 533
53 46 59 56 : 61 54 184 195 235 318 314 504 188 223 193 231 263 305 22 23 23 29 29 33
182 171 203 244 249 373 892 972 I ,I 09 1,507 1,386 2,044 437 441 478 721 773 1,346
225 253 280 396 416 456 !40 167 216 339 506 888 344 353 417 533 500 490
31 29 36 100 63 106 239 231 229 295 321 459 377 310 345 518 461 495
60 87 78 92 127 201
229
1971
18,665 ALL INDUSTRIES 4,631 Food 1,002 Beverages
964 Tobacco 1,386 Textiles
Footwear & wearing 324 apparel 719 Wood & cork
67 Furniture & fixtures 592 Paper 352 Printing
36 Leather 364 Rubber
2,645 , Chemicals 1,714 Petroleum& coal·
Non-metallic 690 mineral 768 Basic-metal 663 Metal products 127 Machinery 595 Electrical machinery 797 Transport equip-
men! 229 Miscellaneous

Code
20 21 22 23 24
25 - 26
27 28 29
30 31 32 33 34
35 36 37 38 39
·Tabie 8.4 - INDEX OF PHYSICAL VOLUME OF 1965
Major Industry Group 1966 1967 1968 1969 1970
ALL INDUSTRIES I 06. 7 . 115.7 121.5 125. l 127.0
Food ... : ....... : ..... · 98.0 120.1 · 114.8 104.9 106.7 Beverages .............. 108.4 I I 8.8 126.4 143.4 178.2 Tobacco ........... ' .. 127.6 130.6 170.7 201.8 181.5 Textiles ................ 92.5 I 01.9 123.4 131.7 111.5 Footwear & wearing apparel .124.8 115.2 126.6 131.2 137.8 Wood and cork ......... 152.8 139.0 151.3 222.7 148.8 ' Furniture & fixtures ..... ·
99.2 98.4 126.8 107.2 133.0 Paper ................. 109.9 129.1 175.8 220.0 179.7 Printing ................ 33.3 206.3 240.0 240.3 '] 91.6 Leather .. · ............. 83.8 88.4 96.8 96.8 104.4
Rubber ............... 148.8 114.0 90.9 81.7 86.6 Chemicals ............. 110.0 103.3 97.2 108.4 105.8 Petroleum & coal ........ 128.8 122.6 175.0 180.S 165.0 Non-metallic mineral ..... 102.7 80.4 108.4 126.6 110.8 Basic metal ............ 137.7 135.5 130.4 165.2 475.7 Metal products ......... 106.5 133.2 134.5 141.5 150.2 Machinery ........ - .... 85.0 95.1 138.6 152.0 169.0 Electrical machinery .....
160.6 178.6 146.8 117.8 98.7 Transport equipment ..... 172.1 136.2 310.2 285.1 193.7 Miscellaneous .......... 147.0 1.24.1 214.2 253.8 350.2
Source of data: Central Bank of the Philippines.
230
I
j
◄
~
j ~ ", 1 .J

MANUFACTURING PRODUCTION: CY 196~-73 = 100
I 1971 1972 I 973
I st 2nd Quarter Quarter
140.5 153.6 170.6 165.5 175.6
121.1 137.4 163.5 154.4 I 77.1 . 181.1 227.8 221.0 225.3 225.3 203.0 212.5 182.9 233.1 195.0 139.4 131.2 132.2 130.5 131.8 156.1 158.4 201.5 160.3 204.3
I I 5.0 152.6 92.5 83.2 97.8 122.6 242.9 207.3 127.5 189.3 154.8 I 61.0 150.2 · 261.0 84.5 254.1 568.0 740.1 1,385.7 · 700.2
65.-6 77.2 80.2 97.6 73.3
99.5 108.6 195.6 400.0 145.9 139.2 164.3 148.5 153.6 123.8 146.4 166.0 172.3 164.0 I 87.4 119.9 96.3 127.2 121.1 137.9 325.2 195.0 464.6 346.1 502.8
119.1 136.8 149.4 93.0 131.4 155.9 I 16.0 126.2 127.0 116.7 98.0 77.0 83.6 85.0 91.5
200.5 203.9 188.3 209.0 156.7 355.5 264.1 307.'6 295.1 355.1
231
9 7 '3 Per Cent
3rd 4th. Change Quarter Quarter
174.2 167.0 I I. I
172.0 I SO.I I 9.0 197.9 235.4 (3.0) 146.6 156.6 (13.9) 134.3 132.0 0.8 207.9 233.4 27.2
114.2 74.6 · (39.4) 331.5 180.7 (14. 7) 116.9 138.2 (6.7) 658.3 216.0 30.3
74.5 75.3 3.9
108.6 127.7 80.1 158.1 158.4 (9.6) 170. 1 167.6 3.8 127.7 126.9 32.1 462.8 · _546.5 138.3
173.8 I 99.1 9.2 141.0 119.9 8.8
91.4 66. 1 8.6 199.2 187.9 (7.7) 305.0 275.0 16.5

Table 8.5 - ELECTRIC ENERGY PURCHASED, GENERATED,
Purchased Quantity Sold Industry Group No. of Estab- Quantity Cost Generated Quantity Value
lishments (1000 kwh)('l'JOOO) (1000 kwh) (1000 kwh)(l"lOOO) j
ALL.INDUSTRIES 2,156 2,052,731.7 118,292.6 682,692.5 6,668.4 450.2 Food industries 323 224,044.1 16,281.3 208,388.9 4,257.8 260.6
Sugar milling 34 19,256.7 983.4 153,221.3 3,906.5 224.3 Flour mills 7 20,502.9 1,430.4 13,166.1 Manufactured ice 16 22,752.9 1,879.8 2,492;0 Canned fruits 18 5,617.1 277.1 21,463.2 351.3 36.3 Starch 8 10,358.0 1,519.7 16,077.8
1 Others 240 145,556.5 10,190.9 1,968.5 Beverages 67 90,193.2 8,075.2 570.8
Dis.tilled spirits 31 65,090.1 5,986.8
4 Soft drinks 36 25,103.1 2,088.4 570.8 Tobacco products 49 26,123.9 1,990.2
Cigarettes 41 22,437.5 1,586.4 J Others 8 3,686.4 403.8
Textiles 107 324,507.6 18,622.9 485.I 151.9 14.0 • Cotton textile mills 30 229,975.9 12,881.1 151.9 14.0
~ Textile finishing 3 3,618.4 185.2 Others 14 90,913.3 5,556.6 485.1
Footwear & wearing apparel 234 21,135.4 15,819.0 -· Wood & cork products 217 36,373.2 4,477.4 248,428.4 1,111.9 107.7 ·
Veneer & plywood 33 14,448.5 2,597.9 205,936.5 873.7 95.8
~ Sawmills & planning mills· 131 18,244.3 1,558.8 26,847.7 238.2 11.9 Wood treating ·4 870.8 77.7 15,644.2 , Others 49 2,809.6 243.0
Furniture and fixtures 74 4,696.7 414.5 Paper and paper products 67 109,934.5 6,555.2 76.129.1 761.2 32.I ~ Pa per, mills 14 61,595.3 3,866.2 76,129.1. 761.2 32.1
Other paper products 53 48,339.2 2,689.0 Printing 134 27,788.0 1,990.3
~ Commercial printing IOI 14,043.2 1,081.6 Newspaper & periodicals 19 12,398.4 809.1 Others 14 1,346.4 99.6
Leather & leather products 27 4,318.8 347.5 Rubber products 50 63,409.2 3,993.8 1,971.0.
Tires & related products 17 43,193.0 2,460.1 Others 33 20,216.2 1,533.7 1,971.0
232
~

r--I. SOLD AND CONSUMED BY INDUSTRY: CY 1970 AND 1971
~ CY 1971
~ Quantity No. of Purchased Quantity Sold Quantity
Consumed Estab- Quantity Cost Generated Quantity Value Consumed (1000 kwh) lishments ( 1000 kwh) (YI 000) ( 1000 kwh) (I 000 kwh) (YI 000) (I 000 kwh)
2,728,755.8 2,045 2,375,405.5 167,505.1 692,563.4 I I ,938.2 964.3 3,056,030.7
428,175.2 293 258,607.1 20,299.4 280,056.9 955.S 121.8 537,708.5 168,571.5 33 27,074.7 1,164.8 232,158.6 604.7 86.8 258,628.6 33,669.0 7 32,063.6 2,763.6 11,632.0 43,695.6 25,244.9 13 18,838.3 2,089.7 2,492.0 21,330.3 26,729.0 5 3,590.4 139.9 21,020.2 350.8 35.0 24,259.8 26,435:8 8 8,012.5 I ,272.8 1,814.9 9,827.4
147,525.0 227 169,027.6 12,868.6 10,939.2 179,966.6
90,764.0 - 65 91,309.8 10,535.6 590.J 91,899.9 65 090.l 29 61,632.9 7,443.3 61,632.9 25,673.9 36 29,676.9 3,092.3 590.1 30,267.0
26,123.9 45 24,404.2 2,471.1 24,404.2 f2,437'.S 38 22,215.6 2,170.8 22,215.6
3,686.4 7 2,188.6 300.3 2,188.6
324,840.8 113 347,839.4 24,443.1 716.2 348,555.6 229,824.0. 30 '261,754.1 17,598.6 261,754.1
3,618A 3 40,555.3 3,219.7 40,555.3 91,398.4 80. 45,530.0 3,624.8 46,246.2
21,135.4 198 23,058.1 2,182.9 23,058.1 283,689.7 191 39,169.6 4,377.9 124,960.0 6,383.2 549.7 157,746.4
~ 219,511.3 35 . 22,997.7 2,595.5 85,447.0 615.1 86.8 107,829.6
44,853.8 . 114 11,425.6 1,351.1 24,183.9 5,768.1 462.9 29,841.4 16,515.0 4 2,092.4 166.7 15,329.1 17,421.5 2,809.6 38 2,653.9 264.2 2,653.9
' 4,696.7 68 4,333.9 455.4 4,333.9
J 185,302.4 69 138,465.4 9,258.1 78,337.8 606.5 27.2 216,196.7 136,963.2 16 91,513.9 5,800.2 78,337.8 606.5 27.2 169,245.2
48,339.2 53 46,951.5 3,457.9 46,951.5 27,788.0 125 24,'299.6 2,258.4 24,299.6 14,043.2 94 12,225.8 1,241.2· 12,225.8 12,398.4 18 10,803.7 902.8 10,803.7
1,346.4 13 1,270.1 114.4 1,270.1
4,318.8 23 5,240.5 501.3 344.5 37.9 4,896.0 65,380.2 50 64,456.6 5,030.9 1,9_71.0 66,427.6 43,193.0 18 44,957.2 3,117.5 44,957.2 22,187.2 32 19,499.4 1,913.4 21,470.4
233
~ (
I l ..-

Table 8.5 - ELECTRIC ENERGY PURCHASED, GENERATED, SOLD
CY 1970
Purchased Quantity So)d No: of Estab- Quantity . Cost
hshments (1000 kwh) ('.1'1000) Generated Quantity Value (1000 kwh)(I000 kwh)(i>J000)
Ch_e1.1icals & chemical products Fertilizer Veg. & animal oil and fat Com pressed gasses Soap and Detergents Drugs and pharmaceuticals Others
Products of Petroleum & coal Petroleum refineries Others
Non-metallic mineral products Hydraulic cement Glass container Clay tiles Others
· 168 4
13 16
n.a. 50 85 11 4
. 7
88 12 8 6
62 Basic metal industries 58
Iron & steel basic industries 46 Non-ferrous basic metarproducts 12 Metal products I 5 I Metal cans, boxes & containers 25 Fabricated structural metal products. 46 Others 80
Machinery 63 Electrical machinery 78
Batteries, electric lamps & wire 28 Refrigerators & equipment 19 Others · 31
Transport equipment 92 Motor vehicles assembly 19 Others· 73
Miscellaneous manufactures 21
- not available.
n.a-. - Data not available.
3 I 6,830.5 112,487.9 44,261.4 27,576.2
n.a. 20,182.5
. 112,322.5
9,864.7 8,245.1 1,6 I 9 .6
326,463.5 225,117.7
52,643.7 21,152.4 27,549.7
323,634.6 305,293:2
18,341.4 40,343.5 10,883.7 7,124.8
22,335.0-
11,392.2 39,450.3 14,031.5 13,675.8 11,743.0
20,831.2 9,758.5
11,072.7
2,966.0
16,481.5 4,883.0 2,556.9 · 1,665.8
n.a. 1,453.6 5,922.2
5,424.4 70.8
3,974.8 120.3 n.a. 396.6 861.9
5,304.0 115,174.6 419.0 115,174.6
4,885.0 .,
I 5 ,934.9-10,038.8 2,890.6 I ,I 56.4 1,849.1-
9,812.6 8,685.1 1,127.5
24,937.1 20,404.0
3,712.6
820.5
3,114.8 56.7 791.1, 56.7 559.5
1,164.2 ?:5 1,095.9 · 2,866.2 1,032.4
984.9 848.9
1,601.1 1,118.9 824.2 776.9 1,118.9
217.8
Source of data: National Census and Statistics Office, Annual Survey of Manufactures.
234
235.7
n.a. 235.7
51.9 51.9 0-4.7 4.7
93.0
93.0
I 7.0
n.a. 17.0
8.0 S.o
7.0 7.0
JO.I
JO. I
,I

AND CONSUMED BY INDUSTRY: CY 1970 AND 1971 (continued)
CY 1971
Quantity Purchased Quantity Sold Quantity Consumed No. of Estab- Quantity Cost Generated Quantity Value- Consumed
(1000 kwh) lishments (1000 kwh) (t"I000) (1000 kwh)(I000 kwh)(PI000) (1000 kwh)
322,019.2 174 461,474.7 24,807.4- 4,603.2 239.2 19.8 465,638.9 112,558.7 . 3 120,490.8 6,077.4 70.8 120,561.6 48,236.2 16 43,683.5 4,262.5 3,418.6 · 47,102.1 27,696.5 14 29,029.5 1,991.0 175.8 119,833.1
n.a. 8 27,671.2 1,385.0 5.1 27,676.3 20,343.4 54 20,832.4 1,782.6 10.6 239.0 19.8 20,604.0
I 13,184.4 79 219,767.3 9,308.9 922.3 129,861.8
124,987.4 9 10,554.7 719.2 119;254.0 43.0 6.0 129,765.7 123,367.8 4 8,813.0 551.0 119 ,_25_4.0 43.0 · 6.0 128,024.0
1,619.6 5 1,741.7 168.2 1,741.7
35 I ,395.9 86 459,670.4 31,25 I.I 80,917.4 3,366.5 201.9 537,221.3 245,517.0 16 348,179.2 23,007.7 77,283.4 3,366.5 201.9 422,096.1
56,356.3 8 47,361.9 3,787.5, 3,634.0 50,995.9 21,152.4 9 33,076.1 1,891.5 33,076.1 28,370.2 53 31,053.2 2,564.4 __ -:::-~-3.1,053 .. :2-.. --- ---·
323,634.6 63 247,206.2 I 3,551.4 247,206.2 305,293.2 49 226,157.3 11,977.9 226,l 57 .3
18,341.4 14 21,048.9 1,573.5 21,048.9 40,400.2 138 49,814.1 4,273.7 49,814.1 10,940.4 25 10,669.5 962.4 I 0,669.5 7,124.8 35 14,097.4 1,093.8 14,097.4
22,335.0 78 39,144.6 2,217.5 · 25,047.2
11,399.7 60 15,025.4 1,464.0 7.5 15,032.9 39,450.3 85 48,038.3 4,188.4 48,038.3 14,031.5 33 14,384.0 1,350.0 14,384.0 13;675.8 18 18,835.1 1,527.7 18,835.1 11,743.0 34 14,819.2 1,310.7 14,819.2
21,856.8 88 21,743.3. 2,222.7 1,13'5.3 22,878.6 9,758.5 19 7,879.6 1,017.7 7,879.6
12,098.3 69 13,863.7 1,205.0 14,999.0
2,966.0 25 2,515.5 250.9 14.0 2,529.5
235

Table 8.6- MINING PRODUCTION: (Value in thou
41
Precious Metals 1
Calendar Platinum -~ Year Gold Silver and Cadmium Chromite
Metal Metal Palladium Metal Ore Metals .
1946 20.81 ' 1.6
,_ 928.0 1947 4,558.21 64.9 3,501:3 i948 14,300.71 215.2 5,251.8 1949 25,066.7 308.4 5,850.6 1950 33,399.1 310.0 5,647.9 ' 1951 44,083.4 435.6 9,001.5
1 1952 47,105.1 1,110.2 17,249.1 . 1953 49,672.6 892.8 19,827.6
~ . 1954 44,808.8 896.2 15,486.5 1955 43,860.1 853.7 19,420.1 1956 44,580.5 919.8 27,785.9 1957 45,689.0 865.7 33,958.2
,411 ]·958-- - 52,135.3 855.6 17,676.2 1959 57,461.2 908.5 27,427.9 1960 57,987.5 2,043.4 1 33,937.1
1 1961 61,570:8 1,650.1 19.8 34,750.7 1962 74,009.3 2,3'.35.4 37.1 5.8 35,499.9 1963 71,516.8 3,689.5 112.5 29,524.1 . 1964 81,322.0 3,9Q4.8 .166.9 30,424.0
-~
1965 82,582.9 4,25~.7 199.9 37,441.1 1966 89,257.5 5,771.1 104.8 42,644.9 1967 I 04,956.5 7;636.7 31,466.7 1968 108,291.1 13,255.7 36.9 31,876.2 ~ 1969 118,239.7 I 0,501.7 34,185.9" 1970 130,349.5 15,500.4 254.0 63,570.5
• 1971 151,603.1 17,799.0 507.0 53,095.5 1972 225,172.7 18,080.0 3,292._4 48,084.2 1973 359,961.6 28,385.5 3,142.21 75,321.7
1 - not u·ailable.
1 The estimated average market price of gold pe~ troy ounce
0
is P-70.00.
Source _of d1ta: Bureau of Mines. ·
236
...

CY 1946-73 sand pesos)
/
Base Metals
' Copper Iron Lead Manganes~ Molybdenum Nickel Metal Ore Metal Ore· Metal Metal
1.3 0-_ 3,l 10.5 2.2 l 08.5
2,057.8 . 252.0 48.2 841.0 4,564.0 5,387.7 '292.3 944.2 8,254.2 7,633.5 497.6 1,16L5
14,987:5 14,238.3 426.2 · 1,283.8 19,385.7 21,983.0 1,607.5 1,291.8 14,901.9 23,242.7 1,369.5 1,415.1 18,973.1 24,878.2 1,026.8 499.7 29,795.4 24,039.9 I ,426.4 559.7 -47,073.1 23,201.1 1,308.2 304.7 46,871.3 23,107.9 476.2 2,549.9 49,923.7 19,498.8 733.5 1,599.1 61,160.0 22,233.0 208.2 2,204.2 242.4 59,067.2 20,706.3 65.5 1,147.8 150.0 78,285.1 28,685.0 52.2 935.7 687.8 15.8
116,691.9 43,301.5 56.6 1,108.8 963.5 67.7 140,127.2 44,671.2 61.3 998.2. 952.2 145,552.3 41,009.7 106.9 849.2 1,042.2 184,884.9 52)66.7 128.3 5,204.7 1,138.1 316,995.8 56,258.0 120.6 3,987.4 747.8
· 350,767.5 56,208.6 107.7 5,651.9 370.5 -469.639.1 47,148.4 105.0 4,643.6 562.8 657,503.9 53,684.3 79.2 1,498.9 151.7 ' 1,113,124.3, 83,123.4 24.6 733.7 456.8 1,699.6
1,233,494.2 102,141.1 910.1 71.0 3,298.'0 1,360,427.8 I 05,338.6 407.3 4,476.6 2,296,188.7 111,197.3 633.7 4,842.0
•
. 237
\ -

I
Calendar Base Metals
Year Pyrite Quick-Silver Cinders Ore Metal
1946 . 1947 1948 1949 1950 1951 1952, 1953 1954 1955 357.5
. 1956 1,567:9 1957 1,666.1 1958 1,528.0 1959 1,623.1 1960 1,299.9 1.961 1,659.5 1962 231.8 1,737.4 1963 271.5 1,553.8 1964 311.7 2,431.6 1965 410.7 5,076.8 1966 444.8 3,958.3 1967 842.3 4,802.9 1968 596.3 7,178.4 1969 1,778.3 6,586.1 1970 2,116.1 10,686.0 1971 2,578.8 8,653.5 1972 2,731.7 4,196.5 1973. 3,178.5 3,833.8
- not available.
2 .-Include salt and other non-metallics.
Source of data: Bureau of Mines.
238
Table 8.6,- MINING PRODUCTION (Value in thou
Zinc. Coal . Gypsum Metal
1,210.7 1,664.8
38.1 1,952.0 113.5 2,679.1 110.4 . 3,420.1
118.3 17.5 3,390.6 1,124.1 3,178.7
411.0 3,558.6 2,840.9 3,!04.1
480.8 3,631.8 166.6 4,574.5'
84.4 2,526.1 2.3 82.5 3,245.7
2,847.2 549.2 3,438.1 1,748.0 322.5 3,536.4 3,439.3 473.2 4,142.0 3,203.3 920.7 4,047.9 2,277.5 1,562.7 3,040.9 2,363.1 824.6 2,375.Q 21087.3 459.9 1,757.4 1,792.2 651.4 1,616.0 1,894.5 656.5 897:7 4,080.2 1,339.9 1,156.8 4,204.4 835.1 1,133.5 5,541.1 2,854.5 1,588.3 6,024.3 6,397.6 1,635.5 8,260.9 6,851.4 1,765.8
'
~
~
. J
1 . j
I
~

CY I 946-73 (continued) sand pesos)
Rock Sand .Asphalt , and Gravel
299.7 2
7,510.02
93.0 8,524.02
965.7 6,895.2 2
1,056.3 3,664.9 680.7 4)75.1 766.1' 3,582.5 218.0 '3,302.1
78.6 4,584.9 83.6 3,834.0 13.8 3,95 I. I 17.7 12,087.9 54.1 6,750.8
. 273.3 7,745.3 358.5 8,785.4 153.0 6,334.8 160.4 3;936.5 116.5 3,712.7
5,276.9 5,853.9 6,526.6
12,920.2 18,234.1 22,570.6 24,484.1 29,228.7
. 37,510.8 39,834.9
Non-Metallics _Total
Salt Silica Other non- All Minerals Sand metallics
2,462.1 '20,520.4 33,573.8 53,067.4
1,656.5 2,906.1 69,718.1 848.2 2,288.5 95,975.2 724.0 433.5 3,315.1 122,856.4
1,909.5 302.6 2,758.7 123.782.7 2-,061.1 242.9 5,498.4 121,876.1 3,913.5 508.0 4,521.4 136,277.4 4,040.0 534.6 4,698.9 164,092.2 7,886:o 754.9 7,730.4 188,402.3 8,879.0 165.2 8,305.1 170,714.9
I 0,750.9 316.2 I 5,588.2 211,472.6 7,533.5 2,143.5 17,852.6 219,912.7 5,711.7 1,487.7 29,513.3 257,119.9 5,585.3
\ I ;866.3 39,170.1 334,819.8
3,715.5 1,662.6 44,909.1 355,766.6 2,912.4 2,269.2 47,882.9 · 372,433.8
14,246.3 3,035.6 43,079.7 445,867.0 16,020.8 2,914.9 36,133.9 586.191.8 12,531.2 3,477.8 '55,340.2 651,140.3 17,453.4 4,189.6 58,532.0 785,191.6 28,683;8 5,595.3 58,103.1 1,005,739.4 26,518.3 8,601.2 54,708.7 1,542,124.2 32,709.0 5,353.4 72,513.4 1,723,007.7 30,203:3 6,706.2 73,773.3 1,934,458.8 30,360.0 6,799.3 105,291.0 3,085,848.3
239

Table 8.6- MINING PRODUCTION: (Quantity in
1 Precious Metals ,
Calendar Gold Silver Platinum & Cadmium · Year
Metal Metal Palladium Metals Metal (Ounces) (Ounces) (Ounces). (MT)
1946 .3. .9 1947 65.5 44.2 1948 209.2 I 50:8
4 1949 · 287.8 · 218.4 1950 334.0 216.0
~ 1951 393.6 274.6 1952 469.4 693.8 1953 . 480.6 572.0 1954 416.1 527.2 · 1955 419.1 502.1 1956 406.2 541.2 1957 380.0 4'.79.2 1958 422.8 498.0 1959 402.6 504.1 1960 410.6 1,133.3 1961 424.0 81 l.8 .4 1962 423.4 675.6 .3 1963 376.0 838.3 1964 425.8 907.5 1965 437.5 933.9 1966 453.5 1,162.9 1967 498.1 1,384.1 --
-1968 527.4 1,574.8 · 1969 571.1 1,561.3 I 1970 602.7 1,701.9 1.2 1971 637:0 1,939.8 2.5 1972 606.7 1,847.6 7.5 1973 572.3 1,891.6 6.7
Source of data: Bureau of !\Hnes.
240,

CY 1946-73 (continued) thousand units)
Ba s·e
Chromite Copper Ore Ore
(DMT) (MT)
58.0 195.1 3'.2 256.9 2.0 246.7 7.0 250.5 10.4 334.6 12.7 543.5 13.2 557.1 12.7 451.2 14.3 595.0 17.5
· 709.l 27.0 725.5 40.4 416.3 47.0 653.5 49.5 734.4 44.0 640.3 51.9 531.3 54.7 459.1 63.7 468.1 60.5 554.6 62.7 560.l 73.8 419.8 86.2 439.2 110.3 469.4 131.4 566.4 I 160.3 429.6 197.6 349.6 213.7 580.3 - 221.2
'
.Metals
Iron· Lead Manganese Molybdenum Ore Metal. Ore Metal (MT) (MT) . (DMT) (MT)
~ 3.3 18.3 25.6
370.2 .6 ·26.3 599.1 .9 29.9
-' 903.3 .6 22.3 1,170.4. 2.3 20.6 1,217.9 2.4 21.5 1,424.9 9.4 1,432.7 2.3 11.9 1,440.2 . 2.1 · . 4.4 1,346.4 .8 30.2 1,098.7 1.3 22.3 1,230.2 .4 34.8 1,138.8 .I 17.4 1,170.5 . I 19.0 . I 1,387.0 11.9 . I 1,384:7 7.7 . I 1,367.0 .1 8.0 . I 1,437.8 . I 51.7 1,475.2 56.1 1,477.8 . 80.2 1,353.2 66.0 1,561.5 20:0 1,869.9 5.1
· 2,250.1 5.1 2,204.9 2.5 2,254.6 4.0
241

Table 8.6- MINING PRODUCTION: (Quantity in
~ Bas e. -Metals
Calendar Nickel Pyrite Quick Zinc Year Metal Cinders Ore Silver Metal Metal I
(MT) (DMT) (Flask3) . (MT)
1946 -1947 1948
~ 1949 1950 -~ 1951 .2 1952 1.6 1953 .7 1954 1955 .6 1956 3.0 1.0 1957 3.4 .3 1958 3.3 1959 3.5 1960 3.0 5.0 1961 - 3.2 3.3 1962 - 7.7 2.8 4.5 1963 '13.3 3.7 3.9 1964 14.8 2.5 2.1 1965 19.4 2.4 · 2.1 1966 19.0 2.4 1.6 1967 30.6 2.6 1.5 1968 37.0 3.5 2.2 1969 114.0 3.5 3.3 1970 .1 101.7 4.6 3.2 1971 .2 129.5 5.0 8.9 1972 .4 105.0 3.3 4.6 1973 .4 125.7 2.2 5.4
3 A flask contains 76 lbs. of mercury. 4 Cavan,, 1950.1958; metric tons, 1959-1972.
One metric ton equals 20 cavllls of salt.
Source of data: Bureau of Mine&. 1 242

CY 1946-73 (continued) thousand units)
Gypsum Coal (MT) (MT)
48.4 73.7
.8 87.7 2.7 123.3 2.9 158.8
.4 150.7 139.4 154.9 119.6 130.2
·151.7 191.2
1.5 107.8. 1.8 · 139.9 9.1 147.9 8.4 152.3 · --. 14.5 163.0
30.7 156.5 41.0 114.9 27.5 94.5 15.3 75.3 20.3 6·9.8 20.7 32.2 31.0 53.3 17.5 42.4 42.8 40.0 85.0 38.9
101.7 39.0
•
Non-Metallics
Rock Sand Salt4 Silica
Asphalt and Gravel Sand (MT) (MT) (MT)
3.1 45.2 52.8 1,744.5 1,407.1 30.3 1,216.1 SI 7.6 28.4 1,034.2 335.4 34.6 10.0 1,013.7 954.8 24.5 3.0 1,372.9 961.4 18.2 3.3 1,213.1 1,599.9 - 30.6
.7 1,271.6 1,272.0 31.6 I.I 3,271.7 . 2,322.4 26.9 2.5 1,640.8 2,792.8 15.8
11.8 1,721.6 174.5 34.9 18.4 2,555.1 1,894.9 88.4 6.7 1,933.2 93.3 106.2 6.9 1,072.6 95.7 116.9
I
5.2 992.7 70.1 11.5 1,570.1 46.6 197.2 1,325.9 225.2 279.6 1,267.7 182.7 234.9· 2,683.9 115.6 311.4 3,323.9 216.9 429.2 4,307.8 231.2 637.8 4,619.1 210.3 684.6
- '4,627.5 235.0 497.5 5,598.6 219.5 411.6 5,690.7 220.0 504.9
•
243

,
• Figure 8.2
GOLD MINING PRODUCTION :
QUANTITY
CY 1949-73
CALENDAR
VEAR
1949
1950
1951
1952
1953
1954
1955
1956 '
1957
1958
1959
1960
1961
1962
1963
1964
1965
1966
1967
1968
1969
1970
1971
1972
1973
100 eoo 500 400 300 200 100 o IN THOUSANO.OUNCES
0
244
VALUE
100 200 300
IN MIL.LION PESOS 400
1

2.0
Figure 8.3 - SILVER MINING PRODUCTION:
QUANTITY
1.5 1.-0 ,5 IN MILLION OUNCES
CY 1949-73
CALENDAR
0
YEAR
1949
1950
1951
1952
1953
1954
· 1955
1956
1957
1958
1959
1960
1961
1962
1963
1964
1965
1966
1967
1968
1969
1970
1971
1972
1973
0
VALUE
5 10 15 IN MI.LLION
20 25 30 PESOS

Figure 8.4 CHROMITE MINING PRODUCTION :
CY 1949-73
CALENDAR QUANTITY YEAR VALUE
1000 800 _ 600 .. oo 200 0
IN THOUSAND ORY METRIC TONS
1949
1950
1951
1952
1953
1954
1955
1956
1957
1958
1959
1960
11161
1962
11163
1964
1965
1966 ,
1967
1968
1969
1970
1971
1972
1973
246
0 10 · 20 30 40 50 60 70
IN ~ILLIO~ PESOS
◄ 1
11
'

... ... "'
Figure 8.5 COAL MINING PRODUCTION ;
CY 1949-73
C.liL[NOAA T[AA
111411
11150
11,, 111,2 ,.,., .,, .. 111,, 11158
11157
11158
lll!UI
111110
IHI
111112
1083
IH-4 ... ,, IIIU
11117
10111
,oet
1170
11171
1012
1117.1 .. 0 0 • IN TMOUSAMO MtTAIC: TOMS
Figure 8.6
•
MANGANESE MINING PRODUCTION:
QUANTITY
CY 1949-73
CALENDAR YEAR
19-49
1950
1951
1952
1953
19S. 1955
1950
1957
1958
1959
,060
1961
1962
1963
19 ..
1965
1966
1067
1968 .... 1970
1971
1972
1973
VALUE
rOOflO IO 70 10 ,o -'O Ml ZO tO 0
IN TH01JSAND ORY METRIC TONS IN MILLION PESOS
'
• •

Table 8.7-NUMBER, FLOOR AREA AND VALUE SELECTED AREAS BY TYPE OF BUIL
(Value in thousand pesos, floor
, All Selected Areas
Type of Building/ Calendar Year. Total
Number2 Floor Value Area 1
Number2 Floor Value Number2 1 Are.a
All types ◄ 1961 16,245 n.a., 206,706 11,026 n.a. 171,652 5,385 1962 15,814 n.a. I 90,394 9,763 n.a. 149,687 4,974 • 1963 16,981 n.a. 309,358 I 0,375 n.a. 244,626 4,386 1964 I 9,680 n.a. 396,075 11,853 n.a. 301,814 4,840 _4 1%.i 18,786 n.a. 479,212 I 0,392 n.a. 372,905 3,650 ' 1966 17,492 2,793 390,330 8,771 1,740 279,207 3,718 1967 19,007 3,220 51 I ,613 10,557 1,939 355,052 4,208 1968 18,262 3,039 ·442,440 9,303 1,809 297,212 3,035 1969 18,180 . 2,994 444,217 8,782 1,836 294,159 2,705 1970 15,971 2,899 420,148 7,485 1,945 284,967 2,314 1972 19,589 2,746 529,210 7,453 1,650 364,091 2,-124 1973 20,668 2,656 589,430 8,338 1,584 395,3 I 8 2,677
.. January 2,088 207 42,126 773 . 112 27,532 254 February 1,898 258 54,080 829 175 41,103 258 March 2,121 3Q5 70,125 998 211 54,673 324 April 1,699 214 41,863 696 ·, 120 26,985 236 May 1,928 . 247 64,799 841 158 46,868 304 June 1,781 194 '41,516 705 110 28,030 230 July 1,482 152 32,257 547 73 · I 9,675 190 August 1,552 180 37,749 635 , 102 23,682 222 September I ,611 288 52,886 584 122 26,936 182 October 1,811 -307 59,262 702 203 39,029 195 November 1,505 182 42,923 595 93 37,235 168 December 1,192- 182 48,844 433 103 33,569 114
1974 January 1,718 219 . 61,58 I 603 101 32,432 174 February 1,310 193 60,520 536 97 41,550 172 March 1,357 2 I I 60,470 557 120 41,593 176
n.a. - Data not available. 1 lncludr,s Caloocan City, ()uezon City,· Pasay City, \1akati, Mandaluyong, Parafiaquc and San Juan. 2 Refers to the number of bui1ding constn1
1
ction pcnnits issued. 3 1-.:xcludes floor area of alteralions and repairs.
Details do not always add to lhe totals because of rounding. 4 Source of data: National Census alld Statistics Office data based on building permits issued by offices of municipal and
city mayors in sefoc'tcd areas. \
/ 248 ~

,---
~ ' r I
OF.PRIVATE BUILDING CONSTRUCTION FOR I DING AND BY YEAR: CY I 961 TO MARCH 1974
r area in thousand square meters)
Metropolitan Manila Other (32) Chartered Cities
Manila Suburbs1
Number2 Floor Value Floor Value Number2 Floor Value A,ea3 Area Area3
n.a. 86,875 5,641 n.a. 84,777 5.219 n.a. 35,054 n.a. 72,280 4,789 n.a. 77,407 6,051 n.a. 40,707 n.a. 91,530 5,989 n.a. 152,096 6,606 n.a. 64,732 n.a. 107,939 7,013 n.a. 193,875 7,827 n.a. 94,261 n.a. 121,190 6.742 n.a. 251,715 8,394 n.a. I 06,307 676 122,747 . 5,053 l,064 156,460_ 8,721 l,053 111,123 494 97,011 6,349 1,445 258,041 . 8,450 1,281 156,561 408 78,058 6,268 1,401 219,154 8,959 1,229 145,228 371 71,396 6,077 1,464 222,762 9,398 1,158 I 50,057 · 333 78,812 5, I 7 l 1,611 206,155 8,486 954 135,180 315 72,893 5,329 1,334- 291,166 12,136. 1,095 165,148 262 64,131 5,661 1,322 331,187 12,330 1,073 194,112
28 8,889 519 84 J 8,643 1,315 95 14,594 23 4,147 511 152 36,956 1,069 83 12,976 28 6,043 674 183 48,629 1,123 93 15,452 14 2,625 460 · 106 24,360 1,003 93 14,878 22 4,683 537 135 42.185 1.087 89 17,93 I 71
. -L 5,664 475 88 22,366 1,076 84 13,486 18 4,263 357 55 15,412 935 78 15,581 32 6,183 · 413 69 17,499 917 78 14,067 24 5,811 402 97 21,124 1,027 106 25,950 20 6,315 507 183 32,713 1,109 105 20,233 16 4,817 427 76 22,418 910 89 15,687 12 4,689 319 91 28,880 759 80 15,275
1 I 3,322 420 90 29,110 1,115 119 29,149 20 12,996 364 77 28,554 774 95 18,970 21 7,303 381 99 34,291 802 91 I 8,877
249

Table 8. 7 - NUMBER, FLOOR AREA AND VALUE
SELECTED AREAS BY TYPE OF BUILD (Value in thousand pesos, floor
All Selected Areas
1 Type of Building/ Totals Calendar Year
Numbers2 Floor Value Numbers2 Floor Value . 1
Area3 Arca3 '
~ Residential Buildings
1961 7,290 n.a. ?8,803 4,434 n.a. 75,028 1 1962 6,700 n.a. 82,754 3,495 n.a. 64,737
1963 7,918 n.a. 136,784 4,402 n.a. 115,136 ~ 1964 9,891 n.a. 175,221 5,504 n.a. 138,352
1965 9,539 n.a. 202,235 4;941 n.a. I 53,148 ~
1966 9,396 1,369 175,205 4,169 857 126,050 1967 10,033 1,663 211,437 4,901 991 ,151,926 1968 10,417 ·1 ,534 204,657 4,676 959 146,102 1969 10,822 1,541 222,889 4,672 952 146,919 1970 9,343 1,716 197,745 3,982 1,225 135,065
1971 9,058 1,355 230,248 4,173 892 166,052 1972 12,519 1,474 263,505 4,123 827 164.380 1973 10,596 1,328 296,737 3,622 764 186,603
January 1,135 107 21,147 · 343 SS 12,852 February 983 117 22,819 331 73 I 5,937 March 1,080 190 43,499 435 142 36,029. April 877 102 19,259 283 54 11,276 May 976 IIS 23,854 337 62 11,528 June 909 96 20,335 308 SI 12,805 July 787 81 17,488 234 37 9,959 August 769 96 22,338 - 271 53 I 3,6 I I September 949 138 34,954 282 76 16,413 October 1,031 115 25,508 330 62 14,542 November 780 88 21,847 263 SI 14,572
·December 680 83 23,688 205 46 f7,077
1974 January 1,068 116 34,580 272 48 16,088 February 697 92 24,224 214 47 15,374
March 679 106 25,867 250 60 16,493
n.a. - Data not available. 1 Includea Caloocan City, Quczon City, Pauy City, Makati, Mandaluyong, Parafutque and San Juan. 2 Rden to the number of building construction pennita issued. . 3 Excludes floor area of alteration, and repairs.
Details do not always add to the totals beulllle of rounding.
Source of data: National Ct:n81U and Statistic5 Office data based on building pennita issued by offices of municipal and city mayon in selected areas. - '
,ii
250 ~

I OF PRIVATE BUILDING CONSTRUCTION FOR
r ING AND BY YEAR: CY 1961 TO MARCH 1974 (continued) area in thousand square meters)
Metropolitan Manila Other (32)
Chartered Cities
Manila Suburbs!
Number2 Floor Value N b 2 Floor Value Number2 Flo·or Value
Area3 um er Area3 Area3
1,290 n.a. 24,662 3,144 n.a. 50,366 2,856 n.a. 13,775 I ,I 05 n.a. 22,821 2,390 n.a. 4 I ,916 3,205 n.a. I 8,0 I 7 1,056 . n.a. 25,615 3,346 n.a . 89,521 3,516 n.a. 21,648 1,563 n.a. 37,622 3,941 n.a. 100,730 4,387 n.a. 36,869 1,160 n.a. 43,311 3,781 n.a. 109,837 4,598 n.a. 49,087
1,096 262 34,137 3,073 595 91,913 5,227 512 49,155 901 190 24,840 4,000 801 127,086 5,132 672 59,511 780 159 22,024 3,896 800 124,078 5,741 575 58,554 818 159 25,853 3,854 791 121,066 6,150 589 75,969 606 126 22,026 3,376 1,098 113,039 5,361 491 62,679
715 147 27 316 3,458 743 138,736 4,885 462 64,196 583 I 19 23,314 3,540 709 14 I ,067 8,396 645 99,123 583 92 21;044 · 3,039 672 165,559 7,334 561 I 10,133
-41 6 1,;l!2 302 49 11,540 792 52 8,295 50 8 1,696 281 65 14,241 652 44 6,882 72 11 2,118 363 131 33,91 I 645 47 7,470 43 5 1,164 240 49 10,113 594 47 7,983 73 12 2,945 264 50 8,583 639 52 12,326 50 7 1,541 258 44 11,264 601 45 7,530 42 5 1,218 192 32 8,741 553 43 7,529 56 11 2,547 215 42 11,064 498 43 8,726 45 7 1,815 237 69 . 14,598 667 61 18,540 48 7 1,624 282 55 12,918 701 53 10,966 38 9 2,118 225 42 12,454 517 37 7,275 25 3 945 180 43 16,132 475 37 6,610
35 5 1,371 : 237 42 14,717 796 69 18,492
23 6 '1,647 191 41 13,727 483 45 8,850
31 8 2,29,9 212 52 14,194 429 46 9,375
251

Table 8. 7 - NUMBER, FLOOR AREA AND VALUE
SflLECTED AREAS BY TYPE OF BUIL • (Value in thousand pesos, floor
All Selected Areas
J Type of building/ Total Calendar Year
Number2 Floor Value Area3
Number2 Floor Value Number2
Area3 • Non-residential buildings
1961 2,684 n.a. 89,423 1,383 n.a. 69,932 646 ~ .1962 3,249 n.a. 79,655 1,642 n.a. 59,167 474
1963 3,794 n.a. 144,714 2,099 n.a. 105,320 604 1964 4,085 n.a. 180,029 2,090 n.a. 126,958 523
11! I 965 4,631 n.a. 232,264 2,231 n.a. 180,401 690
1966 3,222 1,160 182,894 1,282 687 127,417 591 1967 3,024 1,252 255,378 1,376 720 166,176 45.1 1968 2,829 1.210 195,343 912 647 I 17,015 251 1969 2,400 1,197 183,783 764 692 116,370 211 1970 1,867 904 179,173 574 516 115,316 165
1971 1,849 905 I 75,218 671 557 125,737 168 1972 2.419 1,057 224,183 845 679 165,940 154 1973 3,079 · 1,005 228,730 1,064 ~ 157,530 186
January 256 58 11,876 94 27 6,590 14 February 315 123 26,583 135 90 2 I ,4 75 12 March 361 96 20,774 165 57 13,667 20 April 218 94 17,469 56 55 11,293 12 May 264 115 36,232 82 84 3 I ,420 14 June 244 79 16,002 80 ·46 10,945 22 July 196 55 11,676 48 26 6,93P, 11 August 259 61 10,919 91 33 6,605 23 September 231 70 14,005 76 37 8,030 21 October 272 105 28,745 90 60 20,558 12 November 254 76 15,778 78 33 9,169 13 December 209 73 18,669 69 37 10,838 12
1974 January 236 91 20,715 81 48 11,949 16 February 219 78 20,914 71 34 12,143 15 March 284 92. 27,384 7~ 52 19,560 20 ,
n.a .. - Data not available. 1 Includes Caloocan City, Quezon City, Pa.say City, Makati, MandaJuyong. Parafiaque and San Juan. 2 Refer! to the number of building coru;truction permits issued. 3 Excludes·fl_oor area of alterations and repair!!.
Details do not always add to the totals becau11e of rounding.
Source of data: National Census and Statistics Office data ha!!cd on building pennits isrued by offices of municipal and city
' mayors in selected area.
252 ~
~

OF PRIVATE BUILDING CONSTRUCTION FOR
DING AND BY YEAR: CY 1961 TO MARCH 1974 (continued) area in thousand square meters)
Metropolitan Manila Other (32) Chartered Cities
Manila Suburbs1
Floor Area3
n.a. n.a. n.a. n.a. n.a.
357 241 204 175 160
143 154 88
10 9 9 2 3 8 6
13 IQ 5 5 6
4 3 9
Value
45,485 32,171 51,660 50,731 61,572
77,542 55,036 43,906 34,578
. 42,554
31,974 36,978 23,903
2,557 1,595 2,197
483 1,398 2,155 1,758 2,251 2,730 2,930 1,636 2,212
1,058 1,581 2,998
Number2
737 1,168 1,495 1,567 1,541
691 925 661 553 409
503 691 878 -
80 1_23 145 44 68 58 37 68 55 78 65 57
65 56 55
Floor Area3
.n.a. n.a. n.a. n.a. n.a.
330 479 443 516 356
414 524 498
17 81 48 53 81 38 20 19 27 55 27 32
45 30 44
Value
24,447 26,996 53,660 76,227 ·
I I 8,829
49,875 111,140 73,108 81,792 72,763
93,763 128,963 133,627
. 4,033 19,880 11,470 10,810 30,022
8,790 5,180 4,354 5,300
17,628 7,533 8,626
10,891 10,561 16,562
253
Number2
1,301 1,607 1,695 1,995 2,400
1,940 1,648 1,617 1,636 1,293 ·
1,178 1,574 2,015
162 180 196 162 182 164 148 168 155 182 176 140
155 148 209
Floor Area3
n.a. n.a. n.a. n.a. n.a.
473 532 562 505 388
347 377 420
32 33 39 39 31 33 29 28 33 45 43 35
42 44 39
Value
19,491 '20,488 39,394 53,071 51,862
55,477 89,202 78,328 67,412 63,857"
49,482 58,242 71,200
5,285 5,108 7,106 6,176 4,812 5,058 4,737 4,314 5,974 8,187 6,608 7,831
8,766 8,771 7,824

Table 8.7 - NUMBER, FLOOR AREA AND VALUE • SELECTED AREAS BY TYPE OF BUIL
(Value in thousand· pesos, floor
All Selected Areas
l Type of Building/ Total Calendar Year
Number2 Floor Value Area3 Number2 Floor Value Number2
Area3
~ Additions, alterations and repairs
1961 6,271 n.a. 28,478 5,209 n.a. 26,691 3,449 1962 5,865 n.a. . 27,985 4,626 n.a. 25,783 3,395 ~ 1963 5,269 n.a. 27,860 3,874 n.a. 24,170 2,726
~ 1964 5,704 n.a. 40,82.'l 4,259 n.a. 36,504 2,754 ]·965 4,616 n.a. 44,713 3,220 n.a·. 39,355 1,8.00
1966 4,874 264 32,231 3,320 195 25,740 2,031. 1967 S,950 304 44,798 4,280 227 36,950 2,856 1968 5,316 294 42,440 3,715 202 34,095 2,004 1969 4,958 256 37,545 · 3,346 192 30,868 1,676 1970 4,761 279 43,230 2,929 204 34,586 1,543
1971 3,805 217 36,620 2,408 162 30,407 1,294 1972 4,651 215 4 I ,321 2,485 141 33,737 1,387 1973 6,633 323 . 63,963 3,652 233 51,185 1,908
January 697 4.1 9,103 336 30 8,089 199 February 600 , 18 4,678 363 12 3,691 196 March 680 19 5,851 398 12 4,975 232 April 604 18 5,134 357 · 11 4,416 181 May 688 1 7 4,713 422 11 3,920 217 June 628 19 5,178 317 13 4,280 158 July 499 16 4,093 265 10 2,778 137 August 524 24 4,492 273 16 3,466 143 September 431 20 3,927 226 9 2,492 116 October 508 87 5,009 282 80 3,929 135 November 471 18 5;297 254· 9 3,493 117 December 303 26 6,487 159 19 . 5,654 77
1974
l January 414 12 6,286 250 4 4,395 123 February 394 23 15,382 251 16 14,033 134 March 396 14 7,219 232 8 5,54 I 118
n.a. - Data not available. 1 Includes Caloocan City, Quezon City, Pasay City, Makati, Mandaluyong, Parafiaquc and San Juan.
~ 2 Refers to the number of building construction permits issued.
3 Excludes floor area of alterations and rcpaiNi.
~clails do not a1ways add to the totals because of roundinJC.
~ Source of data: National Census and Statistics Office data based on building permits issued by ofiices of municipa1 and city mayors in selected areas.

OF PRIVATE BUILDING CONSTRUCTION FOR DING AND BY YEAR: CY I 96 I - MARCH I 974 (continued) area in thousand square meters)
Metropolitan Manila Other (32) Chartered Cities
Manila
Floor Area3
n.a. n.a. n.a .. n.a. n.a.
56 63 45 35 47
27 42 82
12 6 8 7 7 7 7 7 7 7 2 3
1 11 5
Value Number2
16,727 · l,760 I 7,288 l,23 l 15,255 l,148 19,586 1,505 16,307 1,420
l l ,068 1,289 17,135 1,424 12,127 l, 7_11 10,963 l,670 14,232 1,386
8,016 J',I-14 l 2,60 I l,098 !'9,184 1,744
5,019 137 856 167
1,727 166 · 978 - 176
340 205 1,968 159 l,287 128 1,385 130 1,265 l 10 1,76 l 147 1,063 137 1,532 82
893 l 27 9,767 l l 7 2,006 l l 4
Suburos1
Floor Area3
n.a. n.a. n.a. n.a. n.a.
139 164 157 156 157
134 99
151
18 6 4 4 4 6 3 8 1
73 7
16
3 4 3
Value
9,964 8,495 8,915
16,918 23,049
· 14,672 19,815 21,967 19,904 20,353
22,391 21,136 32,001
3,070 2,835 3,248 3,438 3,579 2,312 1,491 2,081 1,226 2,167 2,430 4,122
3,502 4,266 3,535
255
Number2
I,062 1,239 1,395 1,445 1,396
1,554 1,670 l ,601 1,612 1,832
1,397 2,166 2,981
361 237 282 247 266 311 234 251 205 226 217 144
164 143, 164 .
Floor Area3
n.a. n.a. n.a. n.a. n.a.
68 77 92 63 75
55 73 90
11 7 7 7 6 6 6 7
11 6 9 7
8 6 6
Value
1,787 2,202 3,690 4,321 5,358
6,490. 7,847 8,345 6,675 8,644
6,212 7,782
12,778
l,014 986 876 718 793 897
1,315 1,026 1,435 l ,080 1,804
833
1,890 1,349 1,678
✓

,
Table 8.8 - EXPENDITURES ON GOVERN
Type of Construction
Total Government Construction
Total National Government Construction Public Works
National bldg. & post telegraph bidg .. Hospitals, sanitaria & other hospitals Heal!!,, puericulture center & clinics Municipal capitol & other public bldg. Markets, tiendas & slaughter houses Academic schools & other schools Miscellaneous various public works projects Flood control Other national ports Municipal ports Shore protection Light houses . Port of Manila
Public Highways
Maintenance & <Operational expenses Construction Repairs, and maintenance
National Irrigation
Construction of national irrigation projects Rehab. of existing national irrigation pr(lj. Const. & improv. of national irrigation proj.
Civil Aeronautics
Airports Air navigation facilities
Community Development and Other Construction
Local Government Construction
Government Corporations
- not available. Sources of basic data: National Economic and Development Authority
Department of Public Works, Transportation and Communication Commission on Audit · Dcpartrilent of Local Government and Community DcvcJopment Civil Aeronautics Administration
256
1966-67
533,000
344,000
35,278
2,958 1,739
97. 2,091
515 3,431
289 3,625
19,501 804 165
63
261,656 16,661
·.141,471 I 03,524
21,218
12,332 7,717 1,169
11,40 I 7,814 3,587
14,447
92;000
97,000

MENT CONSTRUCTION: FY 1966-67 TO FY 1972-73 (thousand-pesos)
1967-68 1968-69 1969-70 1970-71 1971-72 · 1972-73
613,000 671,000 858,000 762,000 831,000 . 1,137,243
416,793 485,000 697;000 594,000 . 623,000 862,180
. 30,417 35;748 51,907 22,128 33,259 . 52,477 3,669 2,179 4,193 2,843 1,004 6,397 1,811 2,468 3,441 1,578 729 2,405
85 67 344 121 112 198 2,325 1,703 5,784 3,167 343 2,417
613 860 2,504 678 205 692 5,_578 2,567 I 0,163 1,560 743 15,611 , 526 327 2,278 · 723 10,703 549
'3,060 3,693 _ 7,307 2,832 5,700 7,118 10,839 17,519 8,039 3;484 1,795 12,324
1,386 3,931 4,669 2,760 3,453 2,593 304 304 3,111 489 3,555 724
. 221- . 130 74 20 75 40 1,873 4,842
336,146 329,440 469,383 382,649 466,581 575,335
26,996 23,982 25,950 65,534 60,950 127,764 182,094 179,645 339,383 213,831 265,901 299,225 · 127,056 125,813 104,050 103,284 139,730 148,346
. 26,724 25,972 16,38 I 8,201 13,006 34,629
23,02: 23,616 13,309 5,942 9,547 15,502 2,270 1,420 1,621 1,126 1,278 15,432 1,429 936 1,451 1,133 2,181 3,695
18,640 . 42,830 41,522 43,470 36,210 47,326
14,112 28,478 27,144 13,952 13,797 22,556 4,528 14,352 14,378 29,518 22,413 24,770
4,866 51,010 117,807 137,552 73,944 152,413 I
76,000 80,000 81,000 85,000 83,000 134,000
120,207 106,000 80,000 83,000 125,000 141,063
257

Table 8.9 - ELECTRICITY GENERATION OF THE MANILA ELECTRIC COMPANY AND THE NATIONAL POWER CORPORATION: CY 1960 TO APRIL 1974
(In million kilowatt hours)
National Calendar Total Power Meralco Others
Year · . Corporation
1960 2,313 1,134 981 198 1961 2,661 1,132 1,313 21 (; 1962 3,016 1,169 1,624 223 1963 3,407 1,378 1,789 240 1964 3,854 1,467 2,104 283 1965 4,275 1,431 2,514 330 1966 4,785 1,425 ·2,998 362 1967 5,329 1,750 3,183 396 1968 6,080 1,647 3,998 435 1969 6,924 1,635 4,812 477 1970 7,324 2,023 4,771 530 1971 7,992 2,450 4,932 610 1972 8,649 2,660 5,271 718 19731 8,718 2,305 6,413 ...!!.,_L
January 686.1 178.4 507.7 n.a. February 631.8 151.8 480.0 n.a. March 727.8 179.4 548.4 n.a. April 709.4 145.6 563.8 n.a.-May 791.3 173.9 617.4 n.a. June 765.7 173.3 592.4 n.a.· July 760.3 190.6 569.7 n.a. August 754.6 183.5 571.1 n.a. September 720.6 207.6 513.0 n.a. October 759.1 270.9 488.2 n.a. November 719.6 238.8 480.8 n.a. December 691.4 211.2 480.2 n.a.
19741
January 684.8 186.7 498.l n.a. February 657.3 177.1 480.2 n.a. ~larch 748.9 173.3 575.6 n.a. April· 737.3 147.8 589.5 n.a.
lTotah~ do not include electricity generation of other operators. n.a. - data not available. Sources: National Power Corporation
Manila Electric Company Utilities Division, National Census and StatistiC!' Office for data of other operators for 1960 to 1972. ·
258
,
~ ,
, '
\ ' ~
i
-1

Table 8.10 - AMOUNT OF FOREIGN INVESTMENTS APPROVED BY THE BO!, UNDER APPROVED APPLICATIONS TO ACCEPT PERMISSIBLE INVESTMENTS, BY PRODUCT AND
- BY NATIONALITY, UNDER R.A. 5455 (FOREIGN BUSINESS REGULATION ACT): 3RD-4TH QUARTERS 1969 TO !ST QUARTER 1974
(In thousand pesos)
Calendar Year/Sector Total American Chinese Japanese Others
3rd-4th Quarters 1969 Total 270 223 .1._ .1._ ..11.
Agro-based sector 30 30 Mining and mineral processing sector 148 106 42 Metal-based sector Chemical-based sector 12 10 2 Others 80 77 2 I
CY 1970 Total 23 17 I 5 Agro-based sector -5 4 -1-
Mining and mineral processing sector 2 I -Metal-based sector Chemical-based sector 3 3 Others 13 12 I
CY 1971 Total 34,413 24,915 574 7,000 394 Mining a(ld mineral processing sector 24,785 24,785 Metal-based Sector 1,000 1,000 Chemical-based sector 7,022 322 6,000 Others 1,606 130 252 394
CY 1972 Total 148,253 132,559 960 Agro-based sector 5,578 1,130 448 Mining and mineral pro!'essing sector 260 260 Metal-based ·sector 10,010 10,010 Chemical-based sector 54,711 49,511 400 Others 77,694 71,648 112
CY 1973 Total 166.766 26,742 9,010 ?,892 Agro-based sector 3,500 1,000 2,500 Mining and mineral processing sector 6,730 . 230 6,500 Metal-based sector 20,633 13,650 4,050 133 Chemical-based sector 106,467 2,505 1,610 Others 29,436 9,357 850 3,259
1st Quarter 1974 Total· 45,020 30,630 200 6,408 J.., 772
Mining and mineral processing sector 10 Metal-based sector 5,943 -· 200 5,743 Chemical-based sector 5,755 569 5,186 Others 33,312 30,061 ~ 665 2,586
Source of basic data: Board of Investment!.
259

Table 8.11 - AMOUNT OF PERMITTED FOREIGN INVESTMENTS UNDER RA. 5455 (FOREIGN BUSINESS REGULATION ACT): 3RD-4TH QUARTERS .1969 TO 1ST QUARTER 1974
(In thousand pesos)
Calendar Year/Sector Total American Chinese Japanese Swiss Others
3rd-4th Quarters Total 27,139 17 078 ..1..m 762 ...Lllli... 5 354 1969 0
Agro-based sector 4,041 1,471 412 1,069 1,089 Mining and mineral processing sector 6,250 2,025 179 4,046 Metal-based sector 822 45 135 642 Chemical-based sector 9,675 9,550 5 12Q Others 6,351 3,987 2,140 5 219
CY 1970 Total ·2,241.1 482 1,339 120 300.1 Agro-based sector 238 20 188 30 Mining and mineral processing sector 201 15 6 180 Metal-based sector 65. l 65 0.1 Chemical-based sector 792 431 361 Others 945 16 719 90 120
CY 1971 Total 4,376.6 434. l 1,732.6 1,440 . 60 ..1lQ_ Agro-based sector 236.1 86.1 150 Mining and mineral processing sector 171 126 5 40 Metal-based sector 262. l 160 102.2 Chemical-based sector 497.2 20 477.2 Others 3,210.3 128.1 1,062.2 1,440 60 520
CY 1972 Total 6,337.2 234.6 _2,420.8 1,913.8 768 Agro-based sector 650 182 362.6 105 Mining and mineral processing sector 120 120 Metal-based sector 3,631 177 2,700 754 Chemical-based sector 1,272.4 1,272.4
· Others 664.2 52.6 488.8 108.8 14 CY 1973 Total 17,964.8 4,199.2 6,022.5 4114.5 3.5 86i9
Agro-based sector 2,286.9 1,206.0 684.9 396.0 Mining and mineral processing sector 4,975.8 942.2 1,251.5 5 3.5 16.4 Metal-based sector 1,075.5 217.0 672.5 186.0 Chemical-based sector 1,420.5 1,060.5 360.0 Others 8,206.1 1,834.0 2,353.1 3,527.5 491.5
1st Quarter 1974 Total 59,910 17 078 I 570 37,098 ~ 3,981._
Agro,based sector 469 189 280 Mining and mineral processing sector 30 30
1 Metal-based sector 204 199 5.0 Chemical-based sector 4,639 39 4,420 180 Others 54,568 17,078 I, 113 32,398 3,979
Detail, may not add up lo totals due to rounding: Source of ba!!ii: d1la: Board of lnvcsbnentll. i
1
1 260
'11111

Table 8.12-TOTAL CAPITAL OF APPROVED APPLICATIONS TO DO BUSINESS IN THE PHILIPPINES UNDER RA. 5455 (FOREIGN BUSINESS REGULATION ACT) (SINGLE PROPRIETORSHIP & PARTNERSHIP)
3RD-4TH QUARTERS I 969 TO I ST QUARTER I 974 (In thousand pesos)
Calendar Year/Sector Total Filipino American Chinese British Spanish. Indian Others
3rd-4th Quarters 1969 Total 1,895 14. 60 ___Lfil_ -1.. .1Q
Agro-based sector 133 20 89 4 20 Mining a_nd mineral processing
sector Metal-based sector 179 40 139 Chemical-based sector 310 310 Others 1,273 14 1,259
CY 1970 Total · 2,501 _lQ_ .Lill 930 Agro-based sector 173 173 Mining and mineral processing
sector Metal-based sector 820 20 800 Chemical based sector 215 95 120 Others 1,293 20 1,263 10
CY 1971 Total 3,214 J_Q_ -1Q_ . 2 674 _s_ 505 Agro-based sector 195 195 Mining and mineral processing
sector 7 7 Metal-based sector 590 290 300 Chemical-based sector 630 455 175 Others 1,792 10 20 1,727 5 30
CY 1972 Total 4 324 19.2. -2L 3.718 100 ...1Q_ _JJj_ 11.. Agro-based sector 1,118 .155 · 98 845 20 Metal-based sector 51 51 Chemical-based sector 516 476 Others · 2,639 54 2,436 100 40 75 24
CY 1973 Total 11.061.2 273 203 I0.080.2 _IS_ _Ll. 390 _fil_ Agro-based sector 2,107 9 2,078 20 Mining and mineral processing
sector so so Metal-based sector 1,403 124 98 1,181 Chemical-based sector 181 13 158 10 Others 7,320.2 140 92 6,613.2 15 15 360 85
I st Quarter 1974 Total 2.043 266 ill lA.11. .QQ__ .J]Q_
Agro-based sector 223 7 216 130 Mining and min~ral proccss!ng
413 248 165 sector Metal-based sector JO 10 Chemical-based sector 50 so Others 1,347 11 10 1,136 60 130
~un:e of bas\e d•t•: Roud of lm·~1menL'<.
261

Table 8.13 - SUBSCRIBED CAPITAL OF APPROVED APPLICATIONS (FOREIGN BUSINESS REGULATION ACT) (CORPORATIONS):
. (In thou
Calendar Year/Sector Total
3rd-4 th Quarters Total 14,751 1969
Agro-based sector . 3,640 Mining and mineral processing sector 50 Metal-based sector 2,005 ChemicaH:>ased sector 100 Others 8,956
CY 1970 Total 16,428 Agro-based sector 6,297 Metal-based sector 2,386 Chemical-based sector 999 Others 6,746
CY 1971 Total 365,075 Agro-l:>ased sector Mining and mineral processing sector 352,798 Metal-based sector 1,080 Chemical-based sector 6,650 Others 4,547
CY 1972 Total · 346,093 Agro-based sector 1,790 Mining and mineral processing sector Metal-based sector 63,966 Chemical-based sector 4,345 Others 275,592
CY 1973 Total 1,040,868 Agro-based sector 3,380 Mining and mineral processing sector . 8,481· Metal-based sector 1,022 Chemical-based sector 712,678 Others 315,307
1st Quarter 1974 Total 134,518
Agro-based sector '
JOO Mining and mineral processing sector 750 Metal-based sector 400 Chemical-based sector 600 Others 132,668
Source of haaic data: Board of lnvettmenb.
262
. Filipino
5,362
1,565 30
420 20
3,327 I 997
522 1,201
274 ...ill.
6 141
10,431.24 519
9,350
562.24 9,667 1,710 2,400
43 4,378 JJ36
2,406 65
· 2,341
Total Foreign
9,389
2,075 20
1,585 80
5,629 14.431 · 5,775 1,185
999 6,472
364,928
352,798 1,080 6,644 4,406
335,661.76 1,271
54,616 4,345
275,429.76 1.031.201 .
1,670 6,081
979 708,300 314,171
132,112 · 35
750 400 600
130,327
~
l

TO DO BUSINESS ~N THE PHILIPPINES, UNDER RA. 5455 3RD-4TH QUARTERS 1969 TO 1ST QUARTER 1974 sand pesos)
• American· Chinese Japanese British
3,890 3,454 20 2,005
335 1,740 20
1,580 5 80
3,555 54 2,000 7,706 3,682 2,096 309
999 3,480 1,296 323 62 800 999
5,385 140 .309 7,382 356,013 - ill -
-2,s 10 349,988 1,055 25 -
644 6,000 3,173 3,173 181 ·
41,565.56 245 253,460 722 1,065 55 150
34,150 645 700
5,705.56 190 253,310 22 34,402 4,033 271.618 701.262
455 76 1,0 I 9 4,348 ·779
3,069 80 3,100 701,060 25,751 3,877 267,499 202
4,268 I.OS 1 525 --35
750
600 2,918 1,016 525
263
I
German Others
20 -
20 _§Q_ 578
60 578" - 1 044 -
1,044 15,898
-
15,898 17,002 --
160
16,842 .
5,688 --
400
5,288

Table 8.14 - SUBSCRIBED CAPITAL OF PROJECTS APPROVED
WITH FOREIGN EQUITY CLASSIFIED BY PRODUCTS AND BY (In thou
Sector Total Filipino Total
' CY 1968 Total 399,549 302,046 97,503
J . Mining and mineral processing sector 220,55 I 157,820 62,731 Manufacturing 178,998 144,226 34,772,
CY 1969 Total 167,008 89,754 77,254 -Agriculture 4,283 2,824 1,459 Mining and mineral processing sector 6,341 5,485 856 Manufacturing 156,384 81 ;445 74,939
CY 1970 _ Total 187,506 110,805 76,701 Agriculture 806 ' 775 31 Mining and mineral processing sector 66,721 50,186 16,535 Manufacturing ·) 19,979 59,844 60,135
CY 1971 Total 305,401 212,238 130,312 ,Agriculture 161,405 I 13,405 48,000
I Mining 71,446 53,148 Manufacturing 72,550 45,685 26,865
CY 1972 Total 201,470 140,575 60,526. Agriculture Mining 152,359 112,628 39,731 Manufacturing 49,111 27,947 21,164
CY 1973 Total 364,378 181,807 182,571 Agriculture Mining 132,052 71,887 60,165 Manufacturing 232,326 109,920 122,406
1st Quarter 1974 Total 273,870 114.869 159,001
Agriculture Mining 174,665 106,348 68,317 Manufacturing 99,205 8,521 · 90,684
Source of basic d3:ta: Board of Jnw:stments. 4
264

• l
I BY THE BO! UNDER RA. 5186° (INVESTMENT INCENTIVES ACT)
NATIONALITY OF INVESTORS: CY 1968-IST QUARTER 1974 sand pesos)
American· Spanish Chinese British Japanese Others
' 57,492 1,249 1,188 _1_1 1,668 35,895 33,917 1,668 27,146 23,575 1,249 I, 188 · 11 . 8,749 50,236 7,207_ 2,196 3,456 1,400 .12,759
59 1,400 247 609
49,930 7,207 2,196 3,456 12)50 34,055 1,092 ~ 6,02~ 34.71-6
31 . 3,518 13,017
30,537 1,092 815 6,023 21,668 46,669 16.516 6,186 2,544 4,600 16,648 21,733 16,516 6,186 3,565 10,05.7 . 8,241" 14,879 2,544 4,600 4,842 14,376 2,380 __ill_ 20,257 23,771
9,432 · 2,140 I 11 6,958 21,090 240 13,299 2,681
141,910 20,572 2,822 2,269 6,757 8,241
53,000 201 4,757 2,188 88,910 20,371 2,822 2,250 2,000 6,053
49,816 2,888 2,000 985 _,
1,292 2,728 985 48,524 160 2,000
265

Table 8.15 - SUBSCRIBED.CAPITAL O_F PROJECTS (EXPORT INCENTIVES ACT) Willi FOREIGN EQUITY,
CY 1971-lST (In thou
Sector Total Filipino Total
CY 1971 Total '100,416 76,940 23,476 t Agriculture Manufacturing 25,940 18,893 7,047 Services 74,476 58,047 16,429
CY 1972 Total 63,005 47,697 15,308 Agriculture . 2,000 1,955 45 Manufacturing 25,354 19,079 6,275 Services 35,651
' 26,663 8,988
CY 1973 Total 181.620 122,341 59,279 Agriculture I ,I 00 760 340 Manufacturing 180,120 121,318 58,802 Services 400 263 137
1st Quarter • 1974 Total 105.003 72,439 32.564 Manufacturing 105,003 72,439 32,564
Source 0~ basic data: Board of Investments.
4
266

APPROVED BY TI-IE.BOI UNDER RA. 6135 -CLASSIFIED BY INDUSTRY & BY NATIONALITY: QUARTER 1974 sand pesos)
American Chinese Japanese British Australian Other
19,087 2,020 1,990 379 1
2,658 2,020 1,990 379
16,429 9,530 2,386 I 376 710 200 1,106
45 498 2,386 1,376 710 200 1,106
8,987 36,975 8,108 1,200 1,555 470 10,971
340
36,838 8,108 . 860 1,555 470 10,971
137
3,874 9,522 14,236 600 - 4,332 -· 3,874 9,522 14,236 600 4,332
267

, CHAPTER IX
TRANSPORT AND COMMUNICATION
Table9.l Railroad Transport - number of 'Passengers, Freight and Express Tonnage and Revenue: CY 1946-73 272
Table 9.2 Freight Car Loading of Commodities by the Philippine National Railways (By Rail of Main Line and Branches): CY 1946-73 274
Table 9.3 Number of Motor Vehicles Registered According to Use: CY 1959-73 276
Table 9.4 Number of Vessels and Tonnage of Cargo Entered and Cleared in Selected Ports, Domestic and International: FY I 965-66 to FY 1972-73 278
Table 9.5 . Cumulative Number and Gross Tonnage of Philippine Vessels: CY 19~7;73 280
Figure 9.1 Number of Motor Vehicles Registered According to Use: 1959-73 282 Table 9.6 Domestic AirlinC Operation: Revenue Passengers, Passenger Miles,
Available Seat Miles and Revenue Payload Factor: CY 1955-72 283 ,
Table 9.7 Operating and Traffic Statistics of the Philippine Air I .ines: CY 1948 to First Quarter 1974 284
Table 9.8 Number of Airports in Operation: FY 1948-49 to FY 1971-72 298 Table 9.9 Number of Licensed Radio Stations.by Ownership: FY 1946-47
to.PY 1972-73 299 Table 9.10 Number of Licensed Radio Stations by Type: FY 1970-71 to FY
I 972-73 300 Table 9,.11 Summary of Mail Volume Handled: FY _1962-63 to FY 1972-73 301 Table 9.12 Details of Mail Volume Handled: FY I 971-72 and FY 1972-73 302 Table 9.13 Public Roads: National, Provincial, Municipal and City by Type
of Surface Materials Used: FY 1960-61 to FY 1972-73 303 Table 9.14 Number and Length of Existing Bridges in the Philippines: FY
1960-61 to FY 1971-72 304
269

CHAPTER IX
TRANSPORT AND COMMUNICATION
Chapter 9 presents basic statistics on transportation, communication and storage. Principal sources of data on transportation are the Philippine National Railways, the Bureau of Customs, the Civil Aeronautics Administration, the Land Transportation Commission, the Bureau of Post, Philippine Coast Guard, the Department of Public Works, Transportation and Communication, the Department of Public Highways and the Philippine Airlines.
Data on · all types of transport-water, rail, air and road are compiled regularly by the National Census and Statistics Office from the source agencies and published in the quarterly Journal of Philippine Statistics. Air transport data as well as statistics on international shipping movement entered and cleared at the Port of Manila by nationality of carrying vessels are also published in the annual Central Bank Statistical Bulletin.
Statistics on water transport such as the number of registered. vessels engaged· in domestic shipping and the number and tonnage of vessels cleared and entered in the Port of Manila on seaborne commercial traffic are by-products of the administrative and regulatory func· tions of the Bureau of .Customs. Data on the loading and unloading of vessels are compiled from manifestos submitted by shipowners or operators to the collector of Customs.
Rail transport statistics" obtained from the records of operation of the Philippine National Railway Company include the number, power and rated capacity of vehicles, by type; net freight-ton-kilometer · handled; passenger-kilometers performed; revenue tonnage carried by class of commodities; gross tonnage of· goods loaded and unloaded during the period, by month; gross capital formation during the year; and revenue and expenditure breakdowns. .
Statistics on air transport, also by-products of the administrative and regulatory functions of· the Civil Aeronautics Administration, include the number of aircraft of registered carriers by type of aircraft; passenger-kilometers, cargo and mail-ton-kilometers performed during· the period in domestic and in international traffic, by month; and revenue and cost breakdowns.
270
....
1

The Land Transportation Commission compiles data on the number of registered motor vehicles classified by type, make, and by place of .registration; number of drivers licenses issued; fees; accident and apprehension reports and other related information.
The Board· of Transportation prepares a list of road transport operators by place of registration. Although the Board requires the submission of annual financial reports, the information contained in these reports have never been processed and published . for lack of facilities.
Statistics on roads and bridges and operational data of the Bureau of Telecommunications and the Bureau of Post are compiled regularly by the Statistics unit in these government agencies and are published in their annual reports.
Statistics on the telephone services are compiled by the National Census and Statistics Office through a mailed inquiry of all telephone systems in the· country. Items of information collected include subscription rates, source of power, employment and payroll, number of telephone subscribers, and revenue, and are presented by province or city. Statistics _on the number of registered radio stations are a compiled by-product of the regulatory functions of the Telecommunication Control Bureau of the Department of Public Works, Transportation and Communication.
271

Table 9.1 - RAILROAD TRANSPORT - NUMBER OF PAS CY
Passengers Passenger Revenue Per Freight Tons Calendar Carried Revenue Passenger Carried
Year (Thousand) (Thousand Pesos) (Pesos) (Thousand)
1946 3,217.1 5,606.7 1.74 528.4 1947 3,464.3 6,122.8 1.77 . 794.9 1948 5,806.0 6,755.8 I. 16 961.0 1949 6,205.1 7,288.1 I.I 7 816.8 1950 6,430.0 7,025.6 1.09 787.2
1951 6,450.6 7,397.5 · 1.15 785.9 1952 6,740.7 7,396.9 1.10 913.4 1953 · 6,743.6 7,794.3 1.16 1,009.3 1954 7,336.0 7,897.0 1.08 1,110.7 · 1955 7,104.1 8,229.4 1.16 1,125.8
1956 8,097.8 10,166.5 1.26 . I ,063.2 1957 8,606.5 12,138.8 1.41 1,170.5 1958 8,975.5 l 2,538.3 1.40 1,162.3 1959 9,380.0 I 3,236.5' 1.41 , 1,179.2 -1960 9,546.5 13,684.3 1.43 1,337.1
1961 10,878.0 10,227.0 .94 1,152.1 1962 10,906.4 16,923.6 1.55 1,101.1 1963 11,103.8 18,218.4 1.64 1,147.6 1964 9,766.1 '17,191.2 1.76 940.0 1965· 8,088.0 15,945.8 1.97 837.3
1966 9,141.7 18,199.5 1.99 809.8 1967 5,8_56.4 21,493.7 3.67 650.3 1968 5,785.7 22,314.1 3.86 589.3 1969 6,050.1 26,077.4 . 4.31 559.0 1970 5,628.4 24,785.1 4.40 512.2 • I 971 4,794.0. 28,816.9 6.01 385.9 1972 3,955.0 26,301.3 6.65 218.5 41 1973 6,136.6 33,812.8 5.51 260.0
I st quarter 1,532.1 6,811.7 4.45 67.5 2nd quarter 1,638.4 10,155.3 6.20 51.8 3rd quarter 1,391.9 7,835.9 5.63 66.1 I 4th quarter 1,574.2 9,009.9 5.72 7,4.6
Source of basic data: P,!lilippine National Railways.
272.

I I ' t
SENGERS, FREIGHT AND EXPRESS TONNAGE, AND REVENUE 1946-73 •
Freight Revenue Per Express Express Revenue Per Revenue Freight Ton Tons Carried Revenue Express Ton
(Thousand Pesos) (Pesos) (Thousand) (Thousand Pesos) (Pesos)
3,404.7 6.44 9.4 3I0.3 33.01 5,725.5 7.20 28.6. 997.0 34.86 7,411.8 7 .71 45.7 1,631.9 35.71 6,996.5 8.57 46.7 1,731.4 37.07 6,812.0 8.65 44.3 1,674.6 37.79
6,316.2 8.04 52.2 1,858.0 35.59 . I 6,392.8 7.00 49.2 1,816.6 36.92
7,145.3 7.08 54.6 2,019.0 36.97 -. 6,707.3 6.04 '53.6 _2,084.6 38.88 7,357.4 6.54 48.9 1,975.7 40.40
I
7,133.3 6.71 e 53.0 2,082.0 39.28 8,375.4 7. I 6 55.7 2,216.1 39.80 7,694.2 6.62 57,.7 2,242.9 38.87 7,599.0 6.44 57.9 2,176.5 37.59 8,441 ,0 6.31 59.6 2,344.6 39.34
7,523.4' 6.53 64.4 2,531.0 39.29 7,092.4 6.44 66.4 2,608.9 39.29 7,507.0 I 6.54 72.8 2,858.1 39.26 - 5,937.6 6.32 67.0 2,639.1 39.39 5,263.8 6.29 61.6 2,421.1 39.30
5,166.2 6.38 66.4 2,610.0 39.31
' 5,811.2 8.94 62.7 3,017.4. 48.12 5,790.6 9.83 · 59.9 2,934.2 48.99 5,420.0 9.70 63.5 3,078.3 48.48 4,512.1 8.81 100:3 4,415.9 44.04 5,146.7 - 13.34 68.5 3,587.5 · 52.37 2,981.4 14.01 69.9 3,582.8 51.26 4,304.2 16 55 83.3 4,649.4 55.82
• 744.9 I 1.04 17.5 1,026.8 58.67 921.1 17.78 19.5 I, 176.5 60.33
1,258.4 19.04 23.3 1,251.7 53.72 1,379.8 18.50 23.0 1,194.4 51.93
l 273

• Table 9.2 - FREIGHT CAR LOADING OF COMMO
· (By rail ·of main line
(In metric
Period Total Rice Sugar Sugar Copra Coconut Molasses Cane
1946 528,448 I 1,989 4,256 66,837 11,921 239 590 1947. 794,918 24,398 7,395 66,487 33,854 1,728 264 1948 960,963 35,967 25,803 128,652 22,130 9,312 439 1949 816,758 33,212 9,059 89,351 20,760 5,151 3,871 1950 787,176 61,049 3 I ,708 97,362 22,928 6;514 36
1951 774,027 53,018 70,534 142,885 26,474 5,088 7,220 1952 913,410 28,995 122;323 252,066 24,240 3,648 13,701 1953 I ,009,275 32,893 97,027 321,544 19,749 3,135 6,836 1954 I ,I 10,663""_ 32,352 84,806 476,266 26,885 3,135 2,646 1955 1,125,836 38,364 198,732 393,606 29,435 12,377 8,070
1956 1,068,639 55,869 190,223 <257,677. 40,886 18,070 5,050 )
1957 1,172,106 . 68,812 138,901 249,671 30,363 21,134 967 1958 1,171,301 52,133 220,623 240,267 16,796 754 4,644 1959 I ,I 79,163 33,178 193,244 231,027 17,972 17 I ,394 -1960 1,337,072 33,959 · 220,119 333,451 18,111 63 16,287
1961 1,152,076 41,574 154,562 247,135 20,633 179 12,39 I 1962 1,097,243 30,683 134,485 320,676 23,034 7,685 3,456 1963 1,147,623 28,320 146,679 336,836 32,61 I 222 13,906 1964 939,995 12,671 104,276 289,915 28,485 35 I 1,527 1965 837,330 8,961 87,013 323,609 17,413 94 4,239
1966 809,808 8,157 55,160 251,457 52,5 I 3 601 I ,615 1967 n.a. 9,798 49,595 236,271 36,294 n.a. 393 1968 521,4341 8,919 32,35 I 151,823 10,626 2,446 149 ·
1969 n.a. 9,355 38,466 96,500 4,854 287 161 1970 327,876 4,348 29,398 97,033 1,447 1 1,825
1971 378,750 6,835 64,304 75,050 8,433 28 371 ◄ 1972 n.a. 4,891 52,656 43,357 10,390 n.a. 78
1973 n.a. 2,502 5,039 n.a. I 7,434 n.a. n.a. I
1 st quarter n.a. 386 436 13,423 11764 n.a. n.a.
2nd quarter n.a. 83 244 n.a. 1,574 n.a. -n.a. 3rd quarter n.a. 500 3,822 n.a. 6,172 n.a. n.a. 4th quarter n.a. 1,533 536 12,883 7,924 n.a. n.a. t n:a. - Data not available. 1
lExludesl non-revenue commodities as per adjustment of the Philippine National Railways.
21ncludcs miscellaneous.
Sources of data: Central Bank Sr;tlstfcal Bullt:tin, December I 972. Philippine National Kailways for l':}73.
274

~-DITIES BY THE PHILIPPINE NATIONAL RAILWAYS and branches), CY I 946-73
t tons)
Livestock and Mineral Forest .Manu- Miscel-Hemp Tobacco Animal Products
Products Products factures laneous Tons Head
12 286 358 9,233 133,963 35,393 255,482 7,122 11 5 717 552 24,426 63,33°3 .111,830 468,114 16,101 176 n.a. 7,665 48,396 45,861 195,500 442,395 47,064 535 85 7,893 54,673 11,645 273,708 250,675 110,813
1,108 340 10,285 . 41,874 4,789 222:i 13 217,875 111,069
1,057 199 10,638 28,709 8,627 157,767 186,477 104,043 1,239 615 8,270 28,974 8,745 147,201 205,831 96,536 · 1,024 . 133 11,453 35,578 17,843 177,273 228,435 91,930
138 27 6,681 32,271 I 5;288 143,592 243,644 75,203 361 536 6,042 39,529 12,013 127,339 212,575 91,386
715 42 4,147 29,591 12,608 180,192 182,968 120,192 1,277 464 7,884 43,190 29,195 243,023 2~9,502 141,824 1,251 195 8,530 42,900 28,284 206,986 217,687. 172,190 2,410 1,580 6,692 34,510 I 5,081 245,527 221,548 ,211,419 1,014 21 10,914 54,570 9,440 266,784 247,909 179,000
116 43 18,606 93,030 30,174 265,764 238,085 122,814 312 699 12,150 60,750 28,652 215,331 182,557 137,523-258 377 12,628 52,532 25,021 200,762 208,516 141,487 120 49 9,458 33,768 23,746 141,540 195,338 122,835 294 74 9,973 45,795 21,571 118,138 135,956 109,995 .,
14 189 6,734 27,010 21,952 112,142 177,102 122,172 n.a. 120 1-,475 3,550 25,323 161,029 161,084 122,842 115 50 1,139 140 13,824 92,286 92,575 115,131 97 117 961 n.a. I 5,288 84,15 I 120,836 187,949
19 119 474 n.a. 8,755 20,378 36,455 77,424
319 80 921 n.a. 11,354 82,249 70,869 57,937
n.a. n.a. 690 n.a. 5,952 35,] 78 32,229 27,365
n.a . . n.a. 3,491 n.a. 8,017 1,640 51,8762 n.a. --· n.a. n.a. 1,252 n.a: 727 d 11,739 n.a. n.a. n.a. 749 n.a. 1,448 n.a. 16,907 n.a. n.a. 175 810 n.a. 3,147 260 11,881 n.a. n.a: 63 680 n.a. 2,695 1,368 11,349 n.a.-
275.

,-------------------------------,------------ - - - -
-Table 9.3 - NUMBER OF MOTOR VEHICLES
Type of Vehicle 1959 1960 1961 ◄ 1962 19,63 1964
TOTAL MOTOR VEHICLES 170,741 .] 72,470 175,436 189,933 220,329 251,884 PRIVATE PASSENGER.
VECHICLES 68,723 73,048 78,535 8 I ,910 92,913 105,739 Cars 52,523 55,615 52,556 55,693 62,624 71,262 Jeeps 16,200 J?,433 25,979 26,217 30,289 34,477
PUBLIC UTILITY VEHICLES 49,969 45,603 42.891 42,016 49,689 47 481 1 Taxicabs 4,01 I 3,719 4,466 4,865 8,469 8,678 PU jeepneys1 13,354 9,552 15,302 14,353 15,744 16,685 AC jeepneys2 7,287 6,037 6,420 8,203 8,447 8,01 I • Cars for hire3 161 517 486 540 2,126 565 Buses4 25,156 25,778 16,217 14,055 14,903 13,542
SERVICE VEl-):ICLES 44;037 45,069 45,555 57,603 71,455 90,248 Cars5 102 68 326 51 I 0,754 Trucks 43,935 45,001 45,555 57,277 71,404 79 494
,--1 Freight trucks 34,531 34,713
0
33,513 38,620 46,511 48,377 Trucks for hire6 3,370 _3 ,51·2 6,443 7,775 4,763 5,537 Service vehicles 7 6,034 . 6,776 5,599 I 0,882 20,130 25,580
~ GOVERNMENT OWNED CARS AND TRUCKS 8,012 8,750 · 8,455 8.404 6,272 8.416 Cars 3,876 4,311 4,297 4,373 4,082 5,186 -~· Trucks 4,136 4,439 4,158 4,031 2,190 3,230
OTHERS '
Cars11 < Trucks9
Ipu jeepneys arc those that have definite routes to travel. 2Ac jeepneys ( auto calesa) are those that trav_el without definite route!. 3Jncludes cars for public utility and tourist cars.
◄ 4Jnclu~es touri!Jt buses, starting 1970. · 5Jncludes garage cars, exempt cars, and agent cars.
_ 6Jncludes garage trucks and contractors trucks carrying goods outside the customs zone. .. 7Jncludes school buses, service trucks, utility trucks, agent trucks and exempt trucks. 8Jncludes reserved official cars, official cars, diplomats' cars and cars with temporary plates. 9!ncludes official trucks, RP-US trucks and temporary. Sources of 'data: Land T~sportation Commission and National Census and Stati!t:ics O~fice.Journal of Philippine Statistics.
t 276

REGISTERED ACCORDING TO USE: CY 1959-73
1965 1966 1967 1968 1969 1970 1971 1972 1973
273.203 310.632 362,040 413,217 445,262 458,287 474 746 516.727 571,347
127.586 140,421 171.804 202,003 234.041 243.795 256,256 282.153 296,480 84,217 95,146 118,729 135,872 163,442 167,125 170,159 188,886 197,784 43.,369 45,275 53,075 66,131 70,599 '16,670 86,097 93,267 98,696
49,861 54,146 54,416 65,895 75,706 65.982 66.154 70.351 87,30~ 7,233 7,298 6,818 8,795 14,426 9,685 9,600 8,565 r 10,856
19,473 22,543 24,582 31,137 35,570 32,5'3 I 32,803 35, I 84 45,019 9,278 9,828 10,726 11,111 11,657 10,747 10,860 10,200 13,772
366 259 262 525 391 471 452 853 824 13,511 l4,2i8 12,028 14,327 I 3,662 12,548 12,439 15,549 16,837
89,120 101,7!4 122,860 1-38,715 122,714 132,039 137,337 150,268 176.155 1.225 9,259 22,296 21,429 3,976 2,415 2,152 1,384 4,084
87,895 92.455 100.564 117.286 118,738 129,624 135,185 148,884 172,071
53,582 57,669 66,756 79,379 79,325 87,707 92,728 101,296 _120,369 7,230 6,803 7,115 8,521 8,290 8,129 7,441 7,250 9,220
27,083 27,983 26,693 29,386 31,123 33,788 35,016 40,338 42,482
_6,165 13,991 12,451 6,572 11,791 14,498 12.931 13,746 9,242 4,186 7,745 7,533 4,433 6,688 10,087 7,995 8,840 4,725 1,979 6,246 4,918 2,139 5,103 4,411 4,936 4,906 4,517
471 · 360 509 __R_ 1,010 _ 1,973 2,068 209 2,162 471 360 509 32 1,004 1,972 2,066 141 1,492
6 I ·2 68 670
277

Table 9.4 - NUMBER OF VESSELS AND TONNAGE OF CARGO EN
FY 1965-66 to
(Tonnage in
Dome~tic Trade
' .Manila Cebu lloilo Zamboanga Others1
1965-66 Number of vessels 6,710 24,512 · 17,250 12,612 41,560 Tonnage of cargo · 1,635 2,819 1,186 299 5,267
1966-67 Number of vessels 6,518 26,325 17,189 13,710 40,940 Tonnage of cargo 1,623 2,539 I ,I 85 286 · 6,370
1967-68 Num her of vessels 7,062 26,400 9,899 12,838 42,658 Tonnage of cargo 1,296 2,748 241 279 9,489
1968-69 Num her of vessels 7,510 29,616 16,3 I 0 12,995 59,165 Tonnage of cargo 1,429 3,443 1,047 295 9,752
I 969-70 Num her of vessels 7,574 30,192 17,245 , 18,325 71,530 T onn_age of cargo 1,665 3,694 1,215 355 23,98'7
1970-71 Number of vessels 7,620 29,644 18,447 17,05 I 69,701. Tonnage of cargo 1,750 2,888 1,552 436 12,824
1971-72 Number of•vessels 7,334 29,296 18,790 11,457 68,811 Tonnage of cargo 1,666 2,484 1,511 399 9,700
I 972-73 Number of vessels 7,750 32,103 20,225 12,922 76,563 Tonnage of cargo ·t,640 2,669 1,059 1,059 9,890
l1ncludcs Aparri: Batangas, Cagayan de Oro, Ccbu, Lirnay, Masao, Parang, Dava~, Dumaguete, lligan, Jolo, Jose Panganiban, San· Fernando, San Jose, Tabaco, 'facloban. "
2Tota1s may nol tally due to rounding. 3Include! volume·of export and import cargo loaded and unloaded at the Manila International Airport.·
Source of data: Bureau ofCustor_ns.
278
•
t
1
~
4 1
◄ 1 1
I
4

,.
r ► ~ I
'
► r
~ ,
TERED AND CLEARED IN SELECTED PORTS, DOMESTIC & INTERNATIONAL
I 972-73
thousand tons) ·
International Trade
Total2 • Manila3 Cebu Iloilo Zamboanga Others1 Total2
102,644 3,959 1,109 492 1,018 7,022 13,600 11,206 I 6,447 4,317 1,877 3,436 24,566 50,643
104,6?2 14,653 1,207 634 1,005 6,719 24,218 12,003 19,832 4,130 2,228 3,218 22,312 51,720
98,857 4,912 1,140 598 1,157 8,096 I 5,903 14,053 20,382 3,856 2,190 3,271 26,643 56,342
125,597 4,909 1,090 599 1,046 8,137 15,871 15,967 18,734 2,976 2,021 2,947 24,867 51,545
144,866 4,742 912 733 839 9,003 16,229 30,916 I 8,172 3,254 2,205 2,205 27,768 53,604
142,463 5,042 888 772 872 9,412 16,986 19,450 17,959 2,685 2,334 2,158 28,039 53,175
135,688- 4,892 966 706 738 7,6 I 1 14,913 1,5,759 15,535· 3,145 2,124 1,929 25,733 48,466
,, 149,563 4,516 _. 856 739 753 8,258 15,1-22
15,731 18,378 3,050 2,162 2,099 27,161 52,850
279
'
,'
I I

Table 9.5 -CUMULATIVE NUMBER AND GROSS
Vessels by Gross Tonnage·
OCEAN-GOING VESSELS Less than 5,000 GT 5,000 to less than 10,000 GT 10,000 GT.or over Total
INTER-ISLAND VESSELS Less than 100 GT Over 100 to less than 500 GT 500 to·less than 1,000 GT 1,000 to less than 2,000 GT 2,000 to less than 3,000 GT 3,000 GT or over Total
BAY AND RIVER VESSELS
BARGES
SAILBOATS
PLEASURE YACHTS
FISHING VESSELS
GRAND TOTAL
No. of Vessels
40 36
7 .fil.
1,349 · 151
81 28 15 21
1,645 702
936
296
52
925
4.639
1967
Gross Tonnage
92.7 286.6
88.9 468.2
35.6 44.3 58.0 41.8 38.2
103.3 321.3
13.9
240.1
3.8
0.7
37.6
1.085.6
Note: Details may not add up to totals due to rounding. Source of data: Research and Development Office, Philippine Coast Guard.
280
(Gross Tonnage
1968
No. of Gross Vessels Tonnage
' 51 121.0 36 286.6
8 119.6 / ...2i 527.2
1,507 40.2 172 / 47.8" 88 63.7 33 48.5 20 51.1 25 117.7
1.845 369.I
812 15.7 I, 118 · 324.7
316 4.2
72 1.0 1,089 45.4 5,347 1,287.2
-7 \
• •
41
1 1 ' '
1

TONNAGE OF PHILIPPINE VESSELS: CY 1967-73 in thousands)
1969 No. of Gross Vessels Tonnage
59 140.1 37 292.8 8 119.6
104 552.5
1,692 46.0 206 55.0 92 66.8 36 . 52.5 23 58.7· 28 · 131.6
2,077 411.0
908 -18.0
1,181 348.5
333 4.6
113 1.2
1,246 53.8
5,962 1,389.6
1970 No. of Gross Vessels Tonnage
77 185.7 37 292.8 10 143.J
...ill.... 621.6
1,879 51.1 234 61.3
96 68.9 36 52.5 23 58.7 29 134.9
2,297 427.4
1,031 19.8
1,218 358.5
355 5.1
192 2.5
1,402 61.8
6,619 1,496.7
. ,
1971 No. of Gross Vessels Tonnage
85 195.7 38 302.3 10 . 143.1
133 641.1
2,101 57.1 273 70.J JOO 70.8 37 54.4 23 58.7 30 138.J
2,564 449.2
1,147 21.7
1,271 386.3 -
365 5.3
277 3.2
1,569 73.8
7,32.§_ 1 ;580.6
281
1972 No. of Gross Vessels Tonnage
91 216.0 41 325.8_ 11 159.0
143 700.9
2,419 65.1 307 77.6 105 73.1 45 66.2 23 58.7 34 163.8
2,933 504.5
1,333 23.7
1,353- 432.4
400 7.6
315 3.5
2,204 .95.9
8,681 , 1,768.2
1973 No. of Gross Vessels Tonnage
99 232.5 44 348.7 II. 159.0
154 740.2
2,770 73.2 357 90.4 128 91.1 55 79.8 29 73.3 38 183.8
3,377 591.4
1,492 25.0
1,408 452.7
427 8.1
353 4.6
3,321 129.7
10,532 1,951.7

'
Iv 00 Iv
NUMBER IN THOUSANDS
CIOO
500
400
300
200
100
. 0
Figure 9. I NUMBER OF MOTOR VEHICLES REGISTERED ACCORDING TO USE: CY 1959-73
TOTAL MOTOR VEHICLES-
PRIVATE PASSENGER VEHICLES
GOVE-RNMENT OWNED CARS AND TRUCKS .......................... , .............. . ····· ...... 1959 'so 's1 's2 's3 '64 '65 'ss '57 'ss '69 '70 '71 '72 '73
¼A

Table 9.6 - DOMESTIC AIRLINE OPERATION: REVENUE PASSENGERS, ·PASSENGER MILES, AVAILABLE SEAT MILES AND
REVENUE PAYLOAD FACTOR: CY 1955-72
Revenue Available Revenue Calendar Revenue- · .Passenger Seat · Payload
Year Passengers Miles Miles Factor (1,000) · (1,000) (1,000) {per cent)
1955 298,943 63,99~,943 112,579,304 56.85 1956 369,718 74,936,64 I J-30,098,260 .57 .60 1957 423,024 85,996,624 153,679,084 55.96 1958 . 477,625 98,879,362 169,967,797 58.18 1959 615,297 128,154,707 208,375,797 61 .so
1960 762,953 163,762,849 276,083,368 59.32 1961 752",609 159 ,831,5?3 276,207,531 57.87 1962 976,111 206,959,317 334,460,614 . 61.88 1963 1,137,854 244,285,226 363,715,664 67.16 1964 1,412,771 299,225,891 444,404,299 67.33
1965 1,934,573 422,803,615 610,981,766 69.20 1966 1,797,951 401,448,266 608,457,646 65.98 1967 2,141,134 439,912,478 730,721,312 60.20· 1968 2,108,432 . 490,346,998 845,850,292 57.97 1969 2,169,750* 531,021,070* 835,761,070* 63.54
1970 2,072,576 520,890,600 891,441,547 58.43 I 971 2,015;556 523,634,432 775,481,352 67.52 1972 2,043,597 519,348,829 868,639,442 59.79
*Data .were estimated by a 75% reduction of the preceding year's operation. Source of data: Civil Aeronautics Administration, Civil Aeronautics Board.
283
,

Table 9.7 - OPERATING AND TRAFFIC STATISTICS OF THE
1948
Total Domestic International Total
MILEAGES: (thousand miles) Scheduled miles 6,710 4,471 2,339 6,974 Scheduled miles flown 6,438 4,301 2,137 6,76I
. Scheduled perfonnance ratio (per _cent) 95.95 96.02 95.45 96.94 Special flights 34,095
479 147 332 346
' Charters 47 47. 0 264 Total revenue miles flown
30,868 6,964 4,495 2,469 7,370 Non-revenue miles flown
34,586 289 162 128 349 Total miles flown 30,407
7,253 4,657 2,596 7,720 '
Passenger service 33,737 6,654 4,185 2,469 6,684 t Cargo service 263 263 0 423
I
PASSENGER SERVICE: (thousand) Revenue passenger-miles 103,235 59,444 43,79!' 101,818 Available seat-miles I 93,772 97,201 96,571 ' 214,163 Revenue passenger load factor (per cent) 53.28- 61.16 45.35 47.54
◄ Revenue passengers carried 306 296 10 252-
CARGO SERVICE: (thousand) Revenue passenger ton-miles 9,199 5,053 4,146 I 0,275 Revenue freight ton-miles 3,163 1_,214 1,949 2,784 Excess baggage ton-miles 135 72 63 134 Mail ton-miles 355 60 295 427 Total revenue ton-miles 13,109 6,656 6,454 I 3,949
· Available ton-miles 24,125 11,170 12,955 27,825 Overall load factor (per cent) 54·,34 59.59 49.82 50.13
REVENUE CARGO CARRIED: (tons) Freight 3,949 3,691 258 4,637 Excess baggage 291 280 11 203 Mail 235 193 42 319 Total revenue cargo 5,200 4,889 311 6,1 I I
Note: Details may not add up t~ totals due to rounding. Source ~f data: Philippine Air Lines.
284

PHILIPPINE AIR LINES: CY 1948 TO FEBRUARY 1974
1949 1950 1951
~ Domestic International Total Domestic International Total · Domestic. International , 4,369 2,604· 6,449 3,567 2,882 6,316 3,365 2,950 4,238 2,523 6,365 3,487 2,878 6,232 3,302 2,930
r 96.99 96.86 98.69 97.76 90,85 98.68 98.11 99.32
186 160 635 423 213 780 648 133 69 195 100 55 46 148 106 42
4,493 2,877 7,100 3,964 · 3,137 7,160 4,055 3,105 I 183 166. 247 110 138 233 118 11 S,
4,676 3,044 7,348 4,074 3,274 7,394 4,174 3,220 4,001 2,683 6,598 3,507 3,091 6,549 3,486 3,063
423 0 402 402 0 464 464 0
47,815 54,003 116,493 47,961 68,532 130,258 57,194 73,064 91,725 122,439 238,456 . 82,565 155,892 241,558 89,585 151,974
52.13 44. I I 48.85 58.09 43.96 53.92 63.84 48.08 233 20 243 224 19 291 272 19
' 4,064 6,210 11,958 4,077 7,881 13,264 4,862 8,402 1,465 1,319 4,008 1,833 2,175 5,102 1,905 3,197
48 86 256 56 200 300 72 228 ,90 337 486 64 422 515 79 436
5,997 7,952 16,707 6,030 10,678 19,180 6,917 12,263 11,812 16,013. 24,443 9,226 15,217 . 23,973 8,964 15,009
50.77 49.66 68.35 65.36 70.17 80.01 77.16 81.71
4,364 273 5,638 5,264 374 6,944 5,532 513 183 20 247 205 42 320 254 66 267 52 · 240 173 67 272 201 71
5,766 346 6,125 5,641 483 6,636 5,987 650
I
285

Table 9.7 - OPERATING AND TRAFFIC STATISTICS OF THE
1952
Total Domestk International Total ~
MILEAGES: (thousand miles) 1 Scheduled miles 7,175 3,724 3,451 7,975 Scheduled miles ·flown 7,044 3,660 3;384 7,801 Scheduled performa_nce ratio (per cent) 98.17 98.26 98.07 97.82 Special flights 425 282 143 461 ~ Charters 87 SS 32 . 72 Total revenue miles flown 7,555 3,996 3,SS9 8,333 Non-revenue miles flown 274 139 135 334 Total miles flown 7,829 4,135 3,694 8,668 .·
~ Passenger service 7,071 3,S44 · 3,527 7,870 Cargo service 398 398 0 392
PASSENGER SERVICE: (thousand) Revenue passenger-miles 132,583 50,672 8 I ,91 I 141,49S" Available seat-miles 265,956 91,683 174,273 306,580 Revenue passenger load factor (per cent) 49.85 5S.27 47.00 46.15
◄ Revenue passengers carried 2S3 230 23 262
CARGO SERVICE: (thousand) Revenue passenger ton-miles 13,727 4,307 9,420 14,632 Revenue freight ton-miles S,209 1,858 "3,352 4,702
. Excess baggage ton-miles 233 65 167 224 Mail ton-miles 652 94 558 872 Total revenue ton-miles 19,821 6,324 13,497 20,430 Available ton-miles 26,766 8,843 17,923 3 I ,537 Overall load factor (per cent) 74.05 71.52 75.30 64.78
REVENUE CARGO CARRIED: (tons) 1 Freight 5,431 4,840 590 5,353 ◄ Excess baggage _298 229 68 277 j Mail 339 238 100 479 Total revenue cargo 6,067 5,308 759 6,108
Note: Details may not add up to totals due to rounding. Source of data: Philippine Air.Lines.
286

PHILIPPINE AIR LINES: CY 1948 TO FEBRUARY I 974 (continued)
1953 1954 1955
Domestic International Total Domestic International Total Domestic International
, 3,922 4,053 5,371 4,153 - 1,218 4,575 4,134 441 3,834 3,967 5,212 4,009 1,203 4,307 3,885 422
97.77 97.87 97.05 96.53 98.83 94.14 93.98 95.61 353 108 389 340 49 466 444 22
56 16 87. 78 9 170 159 11 4,243 4,091 5,688 4,428 1,261 4,952 4,496 455
171 163 245 191 54 134 109 26 4,414 4,254 5,933 4,619 1,315 5,086 4,605 481 3,795 4,075 5,160 3,908 1,252 · 4,243 3,799 -444 . 392 0 442 442 0 538 538 0
54,681 86,814 80,872 . 57,243 23,628 75,325 63,999 11,326 99,711 206,870 173,584 112,636 60,947 130,034 110,579 19,455
54.84 41.97 46.59 50.82 38.77 57.93 57.88 58.22 234 28 270 253 17 315 299 16
4,648 9,984 7,273 4,625 2,647 6,106 4,928 1,178 1,782 2,920 2,556 1,974 582 2,325· 2,248 77
59 165 141 68 72 134 81 ,52 135 737 271 102 168 130· 116 14
6,624 13;806 10,239 6,769 3,470 8;695 7,374 1,321 9,338 · 22,198 17,068 10,487 6,581 12,630 10,553 2,077
70.94 62.19 59.99 64.55 52.73 68.84 69.87 63.62
4,792 561 5,475 5,273 202 6,215 6,109 106 204 73 335 262 72 428 359 69 340 139. 306 270 36 375 356 19
5,336 772 6,117 5,806 311 7,018 6,825 193
287

Table 9.7 - OPERATING AND TRAFFIC STATISTICS OF THE
1956
Total Dome$tiC · International Total ◄
MILEAGES: (thousand miles) 41 Scheduled miles 5,013 4,590 423 5,895 Scheduled miles flown 4,797 4,392 405 5,627 Scheduled performance ratio (per cent) 95.69 95.69 95.70 95.46
•Special flights 690 668 22 571 Charters 134 132 I 198 Total revenue miles flown 5,621 5,192 428 6,396 Non-revenue miles flown 113 JOO 14 189 Total miles flown 5,734 5,292 442 6,585
' Passenger service 4,860 4,433 427 5,750 Cargo service 627 627 0 448 -PASSENGER SERVICE: (thousand) Revenue passenger-miles 87,564 74,937 12,627 103,996 Available seat-miles 148,259 130,098 18,161 176,006 1 Revenue passenger load factor (per cent) 59.06 57.60 69.53 59.09 Revenue passengers carried 388 370 18 449
CARGO SERVICE: (thousand) ~ Revenue passenger ton-miles 6,865 5,554 1,312 8,025 Revenue freight ton-miles 2,475 2,408 67 2,628 Excess baggage ton-miles 150 102 48 195
~ · Mail ton-miles 127 11 I 16 159 Total revenue ton-miles 9,617 8,174 1,443 11,006 Available ton-miles 14,280 12,295 1,985 I 6,235 Overall load factor (per cent) 67.34 66.48 72.69 67.79 ~
REVENUE CARGO CARRIED: (tons) I Freight 6,579 6,483 96 7,535 1 Excess baggage 525 457 69 638
1 Mail 384 362 22 462
-Total revenue cargo· 7,489 7,302 187 8,634
Note: Details may not add up to totals due to rounding. Source of data: Philippine Air Lines. 4
1 288

I. I
I l I
PHILIPPINE AIR LINES: CY 1948 TO FEBRUARY 1974 (continued)
1957 1958
Domestic · International Total Domestic International Totai
5,412 · 483 6;198 5,627 571 6,606 5,167 461 5,969 5,413 556 6,307
95.47 95.36 96.30 · 96.19 97.30 95.47 517 55 655 639 15 1,489 193 5 2i4 209 5 224
5,876 520 6,837 6,261 576 8,020 112 77 163 153 9 251
5,988 597 7,000 6,414 586 8,271 · 5,236 514 6,045 5,478 567 . 7,116
447 I 578 574 4 680
85,997 17,999 116,398 98,879 17,518 147,324 153,679 22,327 195,994 169,968 26,026 234,865
55.96 80.62 59.39 58.18 67.3 I 62.73 423 26 503 478 25 643
6,285 1,740 8,871 7,241 1,629 I 1,428 2,532 95 2,481 2,343 139 2,889
105 89 230 135 95 292 142 17 141 124 j7 164
9,065 1,941 11,723 9,843 1,880 14,773 13,936 , 2,299 18,370 I 5,781 2,589 21,5 I 9
65.04 84.46 63.82 62.38 72.60 68.65
7,396 138 7,438 7,234 204 8,603 510 · 128 764 628 136 1,002 438 24 449 425 24 528
8,345 290 8,651 8,288 . 363 10,133
,I
289
1959
Domestic International
6,'021 585 5,744 564
95.39 96.29 1,458 31
219 5 7,420 599
206 45 7,627 644 6,540 576
662 18
128,155 19,169 208,376 26,489
61.50 72.36 615 27
9,782 1,646 2,639 250
173 120 147 17
12,740 2,033 18,855 2,664
67.57 76.3 I
8,246 357 831 · I 71 504 24
9,581 552

Table 9.7 - OPERATING AND TRAFFIC STATISTICS OF THE
1960
Total Domestic International Total
MILEAGES: (thousand miles) Scheduled miles 8,699, 8,1 I 3 587 8,550 Scheduled miles flown 8,307 7,729 5;8 7,699 Scheduled performance ratio (per cent) 95.49 95.27 98.45 90:05
~ Special flights 1,308 1,269 39 1,740 Charters 206 ·201 4 140 Total revenue miles flown 9,820 9,199 621 9,551 Non-revenue miles ·flown 355 346 9 364
_ Total miles flown 10,175 9,545 629 9,916
~ Passenger service 8,877 8,261 616 8,395 Cargo service 737 737 0 1,017
PASSENGER SERVICE: (thousand) Revenue passe_nger-miles 185,530 163,762 21,768 185,887
· Available seat-miles 304,419 276,083 28,336 308,417
◄ Revenue passenger load factor (per cent) 60.95 59.32 76.82 60.27 Revenue passengers carried n.a. n.a. n.a. 790
CARGO SERVICE: (thousand) ~ Revenue passenger ton-miles 14,379 12,511 1,868 14,666 Revenue freight ton-miles 3,275 3,111 165 3,774 Excess baggage ton-miles 299 204 95 416
~ Mail ton-miles 180 153 27 215 Total revenue ton-miles 18,133 I 5,979 2,154 19 ,07 I Available ton-miles 27,589 24,800 2,789 28,561 Overall load factor (per cent) · 65.73 64.43 77.23 66.77
REVENUE CARGO CARRIED: (tons) , Freight· 9,726 9,491 235 I 0,650 Excess baggage I, 119 983 136 1,415 Mail 579 540 38 636
• Total revenue cargo 11,423 11,0 I 4 409 12,701
n.a. Data not available. 1 Source of data: Philippine Air Lines.
Note: Details may not add up to totals due to rounding.
i
290 .

PHILIPPINE AIR LINES CY 1948 TO FEBRUARY I 974 (continued)
1961 1962 1963.
Domestic International Total Domestic International Total · Domestic International
7,976 574 10,359 9,424 935 12,734 10,557 2,177 7,136 563 9,853 8,927 926 11,291 9,184 2,107
89.48 98.05 95.12 94.74 .99.02 88.66 86.99 96.76 1,623 116 1,350 1,346 4 1,208 1,190 18
138 . I · 158 ISO 8 185 175 10 8,871 681 11,361 10,424 938 12,683 10,549 2,135
348 17 303 303 0 290 276 14 9,219 697 11,664 10,726. 938 12,973 10,824 2,149 7,721 675 10,253 · 9,323 930 11,812 9,687 2,125 1,012 4 951 951 0 687 687 0
159,832 26,056 247,229 206,959 40,270 338,828 244,285 94,543 276,208 32,209 424,402 334,461 89,941 578,478 363,716 214,762
57.87 80.89 58.25 61.88 44.77 58.57 67.16 44.02 753 37 1,015 976 39 1,186 1,138 48
12,380 2,286 19,28 I 15,504 3,777 26,707 17,999 8,708
3,595 179 4,402 3,919 483 5,675 4,136 1,539 276 , 140 340 228 112 646 529 . 117
184 31 265 162 103 474 196 278
16,435 2,636 24,287 19,812 4,475 33,502 22,861 10,642
25,310 3,252 41,317 30,994 10,323 55,094 32,068 23,026
64.94 81.08 58.78 63.92 43.35 60.81 71.29 46.22
10,395 255 11,719 11,389 330 12,895 12,399 496 1,215 200 1,35 I 1,207 144 2,291 2,182 109
591 45 614 565 48 683 623 60 12,201 500 . 13,684 13,162 522 15,869 I 5,203 666.
291

Table 9.7 - OPERATING AND TRAFFIC STATISTICS OF THE
1964 -
Total Domestic International Total
MILEAGES: (thousancl miles) Scheduled miles 13,091 I 0,879 2,212 14,380 Scheduled miles flown 12,393 I 0, 194 2,199 I 3,646 Scheduled performance ratio (per cent) 94.67 93.70 99.41 94.89 Special flights 1,543 1,491 53 1,810 Charters 1 71 158 13 1°78 Total revenue miles flown 14,108 _l 1,843 · 2,265 15,634 Non-revenue miles flown 368 340 28 446 Total miles flown 14,476 12,183 2,293 16,080 Passenger service L3,365 11,106 2_,259 15,060 Cargo service 579 579 0 398
PASSENGER SERVICE: (thousand) Revenue passenger-miles 408,294 299,226 109,068 503,213 Available seat-miles 671,336 444,404 226,93 I 825,531 Revenue passenger load factor (per cent) 60.82 67.33 48.06 60.96 Revenue passe_ngers carried 1,468 1,413 56 1,670
CARGO SERVICE: (thousand) Revenue passenger ton-miles 32,i I 7 22,039 10,078 39,544 Revenue freight ton-miles 7,269 4,856 2,413 9,551 Excess baggage ton-miles 722 611 111 834 Mail ton-miles 672 189 482 711 Total revenue ton-miles 40,779 27,695 13,084 - 50,640 Available ton-miles 62,566 38,722 23,"844 -82,023 Overall load factor (per cent) 65.18 71.52 54.88 61.74
REVENUE CARGO CARRIED: (tons) Freight 15,329 14,575 755 17,229 Excess baggage 2,693 2,585. 108 2,980 Mail 739 647 92 7 I I _ Total revenue cargo 18,761 17,807 954 . 20,919
n.a. Data not available. Note: Details may not add up to totals due to rounding. Source of data: Philippine Air Lines. ·
292

PHILIPPINE AIR LINES CY 1948 TO FEBRUARY 1974 (continued),
1965 1966 1967
Domestic International Total Domestic International Total Domestic International
1,1 ,364 3,016 16,016 11,452 4,564 16,842 ll',713 5,129 10,671 2,974 14,505 10,040 4,465 15,774 10,728 5,046
. 93.90 98.62 87.67 97.83 93.66 91.59 · 98.39 1,785 25 1,393 1,349 43 1,734 1,700 35
177 . I 283 277 6 292 260 32· 12,633 3,001 16,181 11,667 4,515 I 7,800 12,687 5,113
405 40 570 557 12 638 615 23 13,039 3,041 16,751 12,224 4,527 18,438 I 3,302 5,136 12,060 3,000 15,226 10,717 4,509 16,596. 11,515 5,081
398 0 672 672 0 n.a. n.a. n.a.
351,618 151,596 541,905 304,081 237,824 596,564 316,016 280,548 495,6!'5 329,915 1,00.9,024 441,537 567,467 1,124,342 · 500,795 . 623,547
70.95 45.95 53.71 68.87 41.91 53.06 63.10 44.97 1,605 66 1,478 . 1,377 101 1,615 1,500 · 115
25,584 13,960 44,144 22,451 21,693 49,292 23,731 25,562 5,059 4,492 5,425 4,690 735 12,818 4,978 7,840
699 135 866 620 246 864 591 273 184 527 1,241 155 1,086 1,565 187 1,378
3 I ,527 19,113 58,675 '27,916 30,760 64,540 29,488 35,053 42,809 39,215 120,640 40,414 80,226 135,073 46,950 88,123
73.65 48.74 69.70 · 38.34 47.78 62.80 39.78
16,08 I I ,149 16,933 15,037 1,896 18,372 16,413 1,959 2,866' 114 2,663 2,480 183 2,617 2,422 195
617 93 712 515 197 907 666 241 19,563 1,355 20,308 18,03 I 2,276 21,896 19,501 2,395
293

Table 9.7 -OPERATING AND TRAFFIC STATISTICS OF THE
1968
Total Domestic International Total
MILEAGES: (thousand miles) Scheduled miles 19,188 13,040 6,148 21,176 Scheduled miles flown 17,848 11,755 6,093 20,563 Scheduled performance ratio (per cent) 93.02 90.45 99.18 97.10 Special flights 825 790· 35 516 Charters 129 90 40 71 Total'revenue miles flown 18,843 12,675 6,168 21,150 Non-revenue miles flown 610 566 44 734 Total miles flown 19,453 13,241 6,212 21,883 Passenger service n.at n.a. n.a. n.a. Cargo service n.a. n.a. n.a. n.a.
PASSENGER SERVICE: (thousand) Revenue passenger-miles 696,701 360,978 335,723 830,340 Available seat-miles 1,334,635 600,329 734,306 1,504,602 Revenue passenger load factor (per cent) 52.00 60.00 46.00 55.00 Revenue passengers carried I ,661 1,521 139 1,868
CARGO SERVICE: (thousand) Revenue passenger ton-miles 58,056 27,363 30,694 69,226 · Revenue freight ton-miles 14,340 5,359 8,981 14,488 Excess baggage ton-miles 1,124 821 303 1,134 Mail ton-miles 2,054 199 1,855 2,788 Totarrevenue ton-miles 75,574 33,742 41,832 87,637 Available ton-miles 155,820 56,573 99,246 159,471 Overall loa_d factor (per cent) 49.00 : 60.00 42.00 55.00
REVENUE CARGO CARRIED: (tons) Freight 17,861 15,522 2,339 19,157 Excess baggage 2,745 2,521 224 2,548 Mail 1,001 671 330 1,154 Total revenue cargo 607 714 93 22,889
n.a. Data not available. Note: Details may not add up to totals due to rounding. Source of data: Philippine Air Lines.
294
1

PHILIPPINE AIR LINES: CY 1948 TO FEBRUARY 1974 (continued)
1969 1970 1971
Domestic' International Total Domestic International Total Domestic International
13,582 7,324 22,262 14,021 8,241 16,895 8;526 8,369 13,392 7,170 19,865 12,470 7,394 16,427 8,142 8,286
· 96.68 97.91 89.23 88.94 89.72 97.23 95·.49 99.00 492 24 361 333 28 235 224 11
47 24 7' 7 0 76 53 23 13,932 · 7,218 20,232 12,810 7,423 16,738 8,419 8,320
664 70 510 455 55 901 785 117 14,595 7,288 20,742 13,265 7,478 17,639 9,204 8,437
n.a. n.a. n.a. n.a. n.a. n.a. n,a. n.a. n.a. n.a. n.a. n.a. n.a. n.a. n.a. n.a.
426,157 404,183 783,830 370,821 413,008 785;846 307,396 478,449 640,265 864,337 1,553,883 626,845 927,038 I ,488,691 441,791 1,046,900
67.00. 47.00 50.00 59.00 45.00 53.00 70.00 46.00 1,697 I 71 I ;666 1,491 174 1,324 1,146 177
32,264 36,964 66,278 28,156 38,122 66,923 23,514 43,410 5,666 8,822 13,066 5,191 7,875 17,803 4,779 13,023
751 384 810 · 543 268 820 458 362 221 2,567 1,958 171 1,787 2,307 183 2,124
38,901 48,736 82,112 34,061 48,051 87,854 28,935 58,919 56,097 103,373 168,842 56,055 112,787 168,296 40,643 127,653
69.00 47.00 61.00 49.00 43.00 52.00 71.00 46.00
16,535 2,622 20,737 17,795 2,942 19,083 14,964 4,118 2,'292 256 17,9 I 3 15,464 2,448 16,415 12,855 3,560
718 436 1,941 1,757 184 1,578 1,368 210 I 9,573 3,315 40,591 35,016 5,575 37,076 29,187 7,889
I
295

Table 9.7 - OPERATING AND TRAFFIC STATISTICS OF THE
1972
Total · Domestic International Total
MILEAGES: (thousand miles) Scheduled miles 17,95 I 8,891 9,060 16,673 Scheduled "miles flown 16,624 7,676 8,948 15,929 Scheduled performance ratio_(per cent) 97.60 86.33 98.77 95.53 Special flights 411 404 7 .237 Charters 107 76 31 217 Total revenue miles flown 17,142 8,155 8,987 16,798 Non-revenue miles flown 328 302 27 225 Total miles flown 17,470 8,457 .9,015 17,023 Passenger service n.a. n:a. n.a. n.a. Cargo service n.a. n.a. n.a. n.a.
PASSENGER SERVICE: (thousand) Revenue passenger-miles 843,548 309,521 534,028 986,736 Available seat-miles 1,715,194 501,573 1,213,621 . 1,784,855 Revenue passenger load factor (per cent) 49.00 62.00 44.00 55.00 Revenue.passengers carried (thousand) 1,399 1,216 183 1,527
CARGO SERVICE: (thousand) Revenue passenger ton-miles 70,185 23,108 47,077 79,464 Revenue freight ton-miles 21,040 5,409 I 5,631 26,775 Excess baggage ton-miles 862 475 387 859 Mail ton-miles 2,259 ,155 2,105 1,926 Total revenue ton-miles 94,346 29,146 65,200 109,024 Available ton-miles 188,307 46;764 141,543.- 201,319 Overall load factor (per cent) 50.00 62.00 46.00 54.00
REVENUE CARGO CARRIED: (tons) Freight 23,486 18,785 4,701 26,645 Excess baggage 20,444 16,276 4,168 1,657 Mail 1,727 1,520 207 1,759 Total revenue ca_rgo 45,656 · 36,581 9,076 30,061
n.a. Data .not available. Note: Details may not add up to total! due to rounding. Source of data: Philippine Air Lines.
296
l

PHILIPPINE AIR LINES: CY 1948 TO FEBRUARY 1974 (continued)
1973 1974 Jan. Feb.
Domestic International Total Domestic International Total Domestic International
7,990 8,683 1,887 1,125 763 3,362 1,91 I 1,451. 7,322 8,607 1,494 777 716 2,897 1,506 1,392
91.63 . 99.12 79.13 69.12 93.90 86.16 78.78 95.88 172 65 49 35 14 101 73 28 172 44 5 5 0 9 9 0
8,081 8,717 1,552 822 730 · 3,039 1,620 1,419 223 I 11 11 0 33 33 0
8,304 8,718 1,563 833 730 3,072 1,653 · 1,419 n.a. n.a. n.a. n.a. n.a. n.a. n.a. n.a. n.a. n.a. n.a. n.a. n.a. n.a. n.a. n.a.
331,606 655,129 129,936 45,364 84,572 242,293 83,970 158,324 514,335 1,270,520 171,400 59,811 111,590 331,759 116,727 215,032.
64.00 52.00 76.00 76.00 76.00 73.00 72.00 74.00 1,309 218 201 173 28 374 322 51
24,177 55,286 10,235 3,299 6,936 19,180 6,137 13,043 6,494 20,281 2,123 685 . 1,438 4,712 1,495 3,217
444· 415 89 53 36 172 90 81 161 1,764 163 13 150 317 24 293
31,276 77,748 12,609 4,050 8,559 24,380 7,746 16,634 47,885 153,435 21,157 5,723 15,433 41,539 11,209 30,330
65.00 51.00 60.00 71.00 55.00 59.00 69.00 55.00
20,988 5,657 2,657 2,239 419 5,703 4,806 897 1,449 208 182 168 14 334 301 33 1,474 285 77 53 26 148 100 48
23,9 I I 6,149 2,917 2,459 458 6,185 5,207 978
297

Table 9.8 - NUMBER, OF AIRPORTS IN OPERATION FY. 1948-4? TO FY I 971-72
'
Fiscal Year Total National Private
1948-49 61 45 16 1949-50 68 49 19 1950-51 62 49. 13 1951-52 63 49 14 1952-53 64 50 14
1953-54 66 .50 16 1954-55 70 52 18
· I 955--56 79 55 24 I 956-57 91 59 32 I 957-58 102 63 39
1958-59 96 63 33 1959-60 101 64 37 I 960-61 105 69 36 1961-62 105 70 35 1962-63 102 71 31
1963-64 106 71 35 I 964-65 117 74 43 I 965-66 110 ·75 35 1966-67 125 77 48 1967-68 136 77 59
I 968-69 125 77 48 I 969-70 123 75 48 1970-71 123 75 48 1971-72 135 76 59
Source of data: Civil Aeronautics A_dministration, Annual Report1 for 1949-i 965, 1966-1972. National Census and Statistics Office Yearbook of Philippine Statistic$ 1966.
298
I

Table 9.9 - NUMBER OF LICENSED RADIO STATIONS; BY OWNERSHIP: FY 1946-47 TO FY 1971-72
· Fiscal Year Total Government I Private .
1946-47 376· 0 376 1947-48 473. 0 473 1948-49 1,124 510 614 1949-50 1,337 595 742 1950-51 1,426 571 855 1951-52 1,503 553 950 1952-53 1,606 553 1,053 1953•54_ 1,718 578 1,140 1954-55 1,903 732 1,171 1955-56 2,430 1,126 1,304 1956-57 2,573 1,167 l,406 1957-58 2,903 1,286 1,61·7
. 1958-59 3,136 1,295 1,841 1959-60 . 3,746 1,517 2,229 1960-61 3,964 1,540 2,424
;
1961-62 4,111 1,550 2,561 1962-63 4,604 1,550 3,054 1963-64 5,155 . !,550 3,605 1964-65 5,898 1,550 4,348 1965-66 6,397 1,550 4,847 1966-67 7,816 2,195 5,621 1967-68 9,438 . 2,357 7,081 1968-69 10,026 2,405 7,621 1969-70 10,596 2,446 8,150 1970-71 I I ,I 98 2,447 8,751 1971-72 12,991 3,222 9,769
Ioocs not include radio stations operated by the Anncd F-orces of the Philippines.
Source of data: TelccommunicatiOns Control Bureau, Deparbnent of Public Works, Traruportation and Communication.
299

Table 9.10--NUMBER OF LICENSED RADIO STATIONS BY TYPE: FY 1970-71 TO FYI 972-73
Fiscal Year Fiscal Year Fiscal Year 1970-71 1971-72 1972-';,3
Type of Station Total Government1 Private Total GovernmenfI Private Tota12
Broadcastiilg 324 18 306 313 28 285 214
Television 25 . I 24 26 25 17
Fixed p_oint-to-point 5,681 1,700 3,981 6,742 2,269 4,473 3,263
Ship 1,91 S 93 1,822 1,987 93 1,894 1,227
Aircraft 590 ·o 590 620 0 620 351
Fixed aeronautical 189 52 137 226 52 174 181
Aeronautical 138 41 97 146 38 108 90
Aeronautical radio navigati6n 42 41 0 0 0 0
Commercial receiving 32 0 32 33 0 33 14
Coastal 218 73 145 .226 73 153 160
Land base 252 112 . , 140 332 149 183 173
Land mobile 1,517 316 1,201 1,993 516 . 1,477 519
Amateur 216 0 216 286 0 286 227
Radio training SS 0 SS 61 3 58 40
Land mobile (portable) 4 0 4 0 0 0 5503
Total II, 198 2,447 8,751 12,991 3,222 9,769 7,026
lDoCS not include radio statioru operated by the Armed Force!! of the Philippines. 2cta~ficntion by ownenftlp not yet available. 3Jncludee Citiun '11 Band and Special Sen·ice, , Source o'f data: Telecommunications Control Bureau, Department of Public Wotka, Transportation. and Communiention11.
300

Fiscal Year
1962 - 63 1963-64
1964 - 65
I 965 - 66
1966 - 67
1967...,. 68
1968 - 69
1969 - 70
1970-71
I 971 - 72
1972 - 73
Table 9.11 - SUMMARY OF MAIL VOLUME HANDLED FY 1962-63 TO FY 1972-73
(In thousand pieces)
• Surface Airmail Totals
205,100.4 55,626.9 260,727.3
212,472.7 57,640.7 270,113.5
245,618.5 66,632,7 312,251.2
271,754.0 73,595.8 345,349.8
289,039.9 78,412.3 367,452.2
278,923.5 75,667.9 354,591.3
332,755.5 90,271.7 423,027.2
355,077.1 96,327.3 451,404.4
379,837.3 100,457.0 480,294.3
399,514.4 109,021.7 508,536.1
424,284.3 115,781.0 540,065.4
Source of dlta: International Research Division. Bweau of Post.
301
Per Cent Increase
(Decrease)
(8.6)
3.6.
15.6
10.6
6.4
(3.5)
19.3
6.7
6.4
5.9
6.2

Table 9.12 - DETAILS OF MAIL VOLUME HANDLED FY 1971-72 AND FY 1972-73
(In thousand pieces)
1971-72 1972-73 Items
Total Surface Airmail Total Surface Airmail
Total volume handled 508,536.1 399,514.4 109,021.7 540,065.4 399,514.4
Received from foreign countries
Posted in the Philip-, pines
Dispatched to foreign countries
Delivered in the Philippines
54,395.6 . 22;973.0
454,140.5 376,541.4
29,455.2 7,649.7
424,685.3 368,891_.7
Source of data: International Research Division, Bureau of Post.
302
31,422.6 57,768.2 24,397.4
77,599.1 482,297.2 399,887.0 ,
21,805.5 31,281.4 8,124.0
55,793.6 451,105.1 391,763.0
115,781.1
33,370.8
82,410.2
23,157.4
59,252.8

Table 9.13 - P!JBLIC ROADS: NATIONAL, PROVINCIAL, MUNICJPAL AND CITY BY TYPE OF SURFACE MATERIALS USED:
FY 1960-61 TO FY 1972-73 (In kilometers)
Low High Fiscal All Earth
Maca- Type Type Con- Miscel-Year Types dam Bitu- Bitu- crete laneous
minous minous ,
Total 1960-61 49,604.51 10,872.25 31,192.80 4,558.00 2,006.28 946.02 29.16 1961-62 54,591.40 12,037.98 34,030.99 5,360.79 2,085.83 1,044.03 31.78
1962-63 55,298.97 11,890.81 33,642.63 5,369.99 2,256.43 1,121.16 17.89 1963-64 55,379.43 11,594.73 34,488.08 5,605.05 2,368.66 1,306.07 16.84 1964-65 55,777.95 11,738.21 34,314.60 5,745.05 2,465.45 1,461.97 52.67 1965-66 57,888.42 12,065.89 35,357.21 5,976.44 2,749.48 1,608.50 130.90. 1966-67 58,602.38 12,748.90 35,032.12 6,173.53 2,812.99 1,762.78 72.07 1967-68 60,525.49 13,985.69 35,505.59 6,106.47 2,790.14 2,014.05 123.55 1968-69 63,594.97 14,543.00 36,678.38 6,675.29 3,104.08 2,399,19 116.64 1969-70 68,025.50 16,327.54 37,711.81 6,828.56 3,625.64 3,047.35 484.60 1970-71 73,531.56 19,699.80 38,254.50 7,206.36 3,740.69 3,353.43 1,276.78 1971-72 74,768.53 20,445.21 38,354.23 7,278.18 3,741.20 3,565.04 1,384.67 1972-73 78,354.85 22,293.25 38,960.33 7;394.62 3,604.52 4,475.72 1,626.41
National 1960-61 15,143.09 645.71 9,888.58 2,481.89 1,265.46 849.97 11.48
1961-62 15,223.24 509.70 9,858.62 2,663.73 1,300.41 877.69 13.09
1962-63 15,456.86 "582.26 9,845.83 2,801.02 1,321.70 897.24 8.81
1963-64 15,678.02 584.53 9,940.67 2,861.47 1,340.27 942.95 8.13
1964-65 15,921.54 688.38 9,911.11 2,930.18 1,372.62 995.47 23.78
1965-66 16,189.35 657.26 10,006.24 3,067.06 1,354.59 1,082.36 21.84
1966-67 16,615.96 802.19 9,967.52 3,199.17 1,398.97 1,224.47 23.64
1967-68 17,434.01 1,291.26 10,094.66 3,221.54 1,318.86 1,450.97 56.72
1968-69 18,096.59 1,192.13 10,084.62 3,377.54 1,598.97 1,836.11 57.22
1969-70 19,698.40 1,411.00 10,806.85 3,276.00 1,847.91 2,268.63 88.01
1970-71 20,066.08 1,648.70 10,865.49 3,147.75 1,855.94 2,33 I.I 1 217.09
1971-72 21,315.38 1,604.07 11,342.22 3,220.72 2,341.70 2,542.26 264.41
I 972-73 21,643.28 2,018.67 11,202.87 3,321.03 1,838.43 2,731.69 530.59
Local 1960-61 34,461.42 10,226.54 21,304.22 2,076.11 740.82 · 96.05 17.68
1961-62 39,368.16 I 1,528.28 24,172.37 2,697.06 785.42 166.34 18.69
1962-63 38,842.11 11,308.61 23,796.80 2,568.97 934.73 223,92 9.08
1963'64 39,701.41 11,010.20 24,547.41 2,743.58 1,028.39 363.12 8.71
1964-65 39,856.41 11,049.83 24,403.49 2,814.87 1,092.83 466.50 28.89
1965-66 41,699.07 11,408.63 25,350.97 2,909.38 1,394.89 526.14. 109.06
1966-67 41,986.42 11,946.71 25,064.60 2,974.36 1,414.02 538.31 48.43
1967-68 43,091.48 12,694.43 25,410.93 2,884.93 1,471.28 563.08 66.83 1968-69 45,498.38 13,350.87 26,593.76 3,297.75 1,505.11 691.47 59.42 1969-70 48,327.10 14,916.54 26,904.96 3,552.56 1,777.73 778.72 396.59 1970-71 53,465.48 18,051.10 27,389.01 4,058.61 1,884.75 1,022.32 1,059.69 1971:72 53,453.15 18,841.14 27,012.01 4,057.46 1,399.50 1,022.78 1,120.26 1972-73 56,711.57 20,274.58 27,757.46 4,073.59 1,766.09 1,744.03 1,095.28
Source of data; Department of Public Highways.
303

Table 9.14 - NUMBER AND LENGTH OF EXISTING BRIDGES IN THE PHILIPPINES: FY 1960-61 TO FY ·1971-72
· (Length in linear meters) '
Number Length ~ Fiscal Year
Total National Local I Total Nationai . Local I
' 1960-61 10,377 5,134 5,243 209,738.99 126,595.61 83,143.38 .'-,
1961-62 I 1,017 5,359 5,658 233,463.32 134,191.13 99,245.19 ~ 1962-63 11,333 5,425 5,908 240,524.81 137,681.59 102,843.22 1963-64 11,444 5,572 5,872 241,879.50 137,355.86 104,523.64 1964-65 11,708 5,312 6,396 244,003.85 136,647.26 107,356.59 I 1965-66 12,033 5,936 6,097 247,706.28 141,421.39 106,284.89 • 1966-67 12,367 5,967 6,400 249,167.96 142,223.41 106,944.55 ◄ I 96'7-68 11,360 5,776 5,584 245,548.95 144,082.47 101,466.48 1968-69 11,866 5,937. 5,929 250,512.56 147,354.71 103,157.85 1969-70 12,846 6,561 · 6,285 265,338.97 162,670.99 102,667.98 1970-71 12,897 6,472 6,425 270,733.93 164,955.96 105,777.97 '
Coconut & timber 7,116 2,333 4,783 107,347.58 37,603.98 69,743.60 Bail~y 1,671 899 772 45,026.92 26,962.79 18,064.13 Masonry 311 190 121 4,629.17 1,825.02 2,804.15 Steel 583 390 193 35,273.42 30,345. I 9 4,928.23 Concrete 3,216 2,660 556. 78,456.84 68,218.98 10,237.86
1971-72 13,151 6,541 6,610 276,635.46 169,492.47 107,142.99 Coconut & timber 7,028 2,253 4,775 105,393.37" 37,232.71 68,160.66 Bailey 1,805 964 841 47,166.95 28,169.11 18,997.84 Masonry 320 172 148 4,739.97 1,832.76 2,907.21 Steel 606 387 219 36,893.57 30,597.33 6,296.24 Concrete 3,392 2,765 627 82,441.60 71,660.56 10,781.04
I Provincial, city and municipal governments. ·
Source of data: Department of Public Highways.
304

CHAPTER X
MONEY AND BANKING
Figure JO.I Money Supply and Its Composition: 1945 to April 1974 308
Figure I 0.2 International Reserve: I 945 to I 974 309
Table 10.1 Money Supply and Its Origin: CY 1940-4i;CY 1945-74 310
Table 10.2
Table 10.3
Table 10.4
Table 10.5
Table I 0.6
Composition and Growth of Money and Quasi-Money_: CY 1940-41; CY 1945-74
Total Loans and Investment Outstanding by Institution: CY 194 7 to Fir.lt Quarter 1974
Total Investment in Securities by Institutions: CY I 949 to Fir.;t Quarter 1974 ·
Credits Outstanding of Commercial and Savings Banl<s to the Private Sector by Industry: CY 1960-lst Quarter 1974
Loans Outstanding of Government and Private Non-Bank Financial Institutions Classified by Purpose: CY 1947-February I 974
Table 10.7 - Total Credits Granted by Commercial and Savings Banks,
312
316
318
320
322
Classified by Maturity: CY 1960-lst Quarter 1974 326
Table 10.8 Total Credits ·Granted by Commercial and Savings Banks Classified by Interest Rate: CY 1960-lst Quarter 1974 328
Table 10.9 Total Credits Granted by Comrnercial, Savings and Develop-ment Banks and Non-Banl<ing Financial Institutions by Indus-try: CY I 960-73 330
Table 10.10 Total Assets and Total Liabilities, by Institutions: CY 1949-lst Quarter 1974 332
Table 10.11 Demand, Savings and Time Deposit Liabilities of Banl<s: CY 1949-March 1974 334
Table 10.12 Interest Rates on Savings an!1 Time Deposits: 1965-74 338
Table 10.13 Financial Condition of the Government Service Insurance System: FY 1953-54 to FY 1972-73 3·39
Table I 0.14 Cash Collections of the Government Service Insurance System: FY 1961-62 to FY 1972-73 341
Table I 0.15 Benefit Payments of the Government Service Insurance System: FY 1953-54 to 1972-73 343
Table 10.16 Growth of Coverage of the Government Service Insurance System: FY 1953-54 to 1972-73 344
Table 10.17 Trend of Ir.vestments of the Governrnent Service Insurance System: FY 1953-54 to 1972-73 345
Table 10.18 Progress of Operations of the Social Security System: CY 1957-73 . . 346
Table I 0.19 Assets, Jnvestlhen.ts and Earnings of the Social- Security System: CY 1957-73 347
Table 10.20 Investrnent Portfolio of the Social Security System: CY 1965-73 348-
Table 10.21 Statement of Loans and Equities Approved and Total Resources of the Development Banl< of the Philippines: FY 1952-53 to 1972-73 349
Table 10.22 Total Resources and LQans Granted by Philippine National Banl<: CY 1950-73 351
■

CHAPTER X
MONEY AND BANKING
Statistical data on money and banking provide basic information on the level, growth, composition, origin' and movements of money supply, credits, loans and investments outstanding by institutions, assets and liabilities of commercial banks and different financial institutions, and demand, savings and time deposits liabilities of banks and other institutional sources 6f credit. These data are so essential to the proper understanding of the monetary and credit policies of the .
. economy as they are being implemented by the·authorities .. These data also provide empirical bases on the ·ability of the banking and credit• institutions of the economy to respond to the monetary problems, needs, and requirements of the economy. ·Data on money, )lanking and credit are particularly important to developing countries like the Philippines because of the 'pivotal role which these financial institutions play in providing scarce credit resources to the _rising demands of borrowers for credit. They also provide interesting insights into the role currently being played by these financial institutions in the task of national development.
The statistics presented in this chapter cover the following: money supply _and its origin; composition and growth of money and quasi-money; total loans and investments outstanding by institutions; credits outstanding of commercial and savings banks to the private sector by industry; loans outstanding of government and private non-bank financial institutions classified by purpose; total credits granted by commercial and savings banks classified by maturity and by . interest rates; total assets and liabilities by institutions and demand, savings_ and time ·deposit liabilities of banks. The Central Bank of the Philippines, Developm;;nt Bank of the Philippines, Philippine National Bank, Government Service Insurance System and the-Social Security System are the primary sources· of data for these tables.
307
\

Figure 10.1 MONEY SUPPLY AND ITS COMPOSITION: 1945 TO APRIL 1974
IN BILLION PESOS
9
8
7
6
5
4 i~~::~D OVERDRAFT LINES
-DEMAND DEPOSITS
-CURRENCY IN CIRCULATION
3
2
,;;_
Li" 11
0 ., "' r-• • • °' O> O>
s a Ott
--
11 7 3
IN BILLION PESOS 9
8
7
6
5
4
3
2
' ' 0
MA .
1974
• ._ ...... __ _

IN BILLION PESOS
12
10
8
6
2
0
"' .. r- .. .. o- N ... .. ... .. .... .. ,n ,n ,n ,n .,n .. .. .... .. .. .. ! .. ! - - - - -
Figure I 0.2 INTERNATIONAL RESERVE: 1945 TO APRIL 1974
,n .. r- .. .. 0 -N ...... ,n .. r- .. .. 0 ,_ N ... ,n ,n ,n ,n ,n .. .. ., ., .. ., ... ., .. .. r- r- r- r-O> .... .... ! .... .... O> ! .. .. O> .. .. O> .. - - -
IN BILLION PESOS
I 10
I I I I
) I ' l 8
I .I I II
~ /1 '
~ ~ I ,,,,.,.. I
I ) I
/ I I , I
~ I I I I
I I I I I I I I I
J F M A M J J A S O N 0
1973
6 -
4
2
0 J F M A
1974

/
Table I 0.1 - MONEY SUPPLY AND ITS (In million 1
l End of Period Money International Domestic
Non-money Miscellaneous 4 Supply Accounts
S~pply Reserve Credits Deposits (Net Balance)
1940. . 279.0 0 293.1 119.8 69.6 ~ 1941 295.0 0 268.8 104.5 65.0 1945 1,120.0 1,338,3 162.J 164.3 .78.9
◄ 1946· 940.0 885.1 348.6 250.2 58.8 1947 1,015.0 . 907.0 558.0 315.6 64.7 1948 1,194.0 840.2 689.5 302.2 60.6 1949 1,035.6 520.2 807.7 369.6 28.7 1950 1,229.4 711.8 .891.3 445.5 19.5
1951 1,160.7 607.7 1,105,8 582.7 61.3 1952 1,198.4 611.8 1,132.9 530.4 22.6 1953 1,224.6 592.0 1,228.0 573.5 33.5 1954 1,227.0 545.4 1,326.1 530.9 86.0 1955 1,337.3 418.4 1 ;729.3 712.6 31.4
1956 1,500.6 449.4 2,038.3 860.8 31.9 1957 1,600.0 280.1 2,460.7 885.2 168.0 1958 I, 740.1 290.6 2,718.5 998.7 260.8 1959 1,845.3 . 325.8 3,121.4 1,203.4 393.9 . 1960 1,895.8 472.3 3,275.2 1,366.0 '538.3
1961 2,219.3 292.0 4,449.9 1,881.9 640.7 1-962 2,504.7 418.3 4,955.8 2,347.5 521.8 1963 2,954.3 421.7 6,115.4 2,754.4 828.4 1964 2,873.8 324.8 6,855.1 2,930.1 1,376.0 1965 3,066.9 776.4 7,418.2 3 ,1.81.3 · 1,946.4
Source of data: Central Bank of the Philippines
' 1 310
~ \ ri

I I
,
ORIGIN: CY 1940-41; 1945 TO APRIL 1974 pesos)
End of Period Money International Supply Reserve
1966 3,371.3 916.4. 1967 3,782.5 1,015.6 1968 3,981.9 887.6 1969 4,753.8 644.2 1970 5,047.4 . 1,225.4
1971 5,567.4 1,311.4 1972' 6,796.6 1,890.3 1973 8,152.5 6,744.4
January 6,488.1 3,170.3 February 6,633.0 3,695.2 March 7,015.5 4,110,6 April 7,115.3 4,483.9 May 6,918.3 5,171.8 June 7,100.7 5,361.5 July 7,121.5 5,516.8 August 7,111.2 . 5,930.3
·september 7,405.1 5,931.2 October 7,203.0 5,991.9 November 7,258.0 6,239.3 December 8;152.5 6,744.4
1974 January 7,524.8 7,091.7 February .7,766.9 7,522.2 March 8,297.6 7,917.2 April 8,471.8 8,699.2
311
Domestic Non-money Miscellaneous
Supply Accounts Credits Deposits (Net Balance)
8,326.5 ..3,750.2 2,121.4 10,093.1 4,705.1 2,621.1 11,160.7 5,328.3 2,738.1 12,715.0 · 5,451.6 3,153.8 14,107.9 6,436.0 3,849.9
15,337.5 7,304.3 3,777.2 17,992.2 8,103.0 4,982,9 22,763.9 12,385.0 9,000.8
18,297.0 7,964.5 7,014.7 18,569.5 8,179.3 7,452.4 18,967.2 8,778.4 7,283.9 I 9,008.3 9,007.5 7,369.4 18,937.4 9,250.8 7,940.1 19,548.4 9,777.0 8,032.2 19,953.7 10,214.1 8,134.9 20,199.9 10,521.5 8,497.5 21,128.8 11,179.6_" 8,475.3 21,°581.5 11,470.8 8,899.6 21,867.3 11,465.6 9,383.0 22,763.9 12,385.0 9,000.8
23,481.8 I 2,617.6 10,431.1 23,808.2 12,785.1 10,778.4 24,886.5 · 13,013.6 11,492.5 26,045.5 13,691.4 12,571.9
I

T_able l 0.2 - COMPOSITION AND GROWTH OF MONEY.
(Amount in million pesos;
I ,, Demand Deposits ..
Money Currency Private Official · Unused End of Period Supply 1 Money. in Total Business & Entities Overdraft
Circulation Individuals Li11es
1940 279.0 255.5 . 144.0 111.5 50.6 60.9 23.5 1941 295.0 270.0 146.0 124.0 56.3 67.7 25.0 1945 1,120.0 1,091.0 882.0 209.0 130.8 ;78.2 29.0 1946 940.0 910.0 539.0 - 371.0 182.9 188.1 30.0 1947 1,015.0 964.0 558.0 406.0 203.6 202.4 51.0 1948 1,194.0 1,150.0 576.0 574.0 209.0 365.0 '44.0 1949 1,035.6 983.6 570.1 413.5 227.0 186.5 52.0 - , 1950 1,229.4 1,153.8 675.1 "478.7 352.9 125.8 75.6 1951 1,160.7 1,058.9 644.8 414.1 260.l I 54.0 101.8 1952 1,198.4 1,094.9 629.9 465.0 272.1 192.9 103.5 1953 1,224.6 1,111.0 666.5 444.5 259.3 185.2 113.6 1954 1,227.0 1,116.0 677:0 439.0 269:5 169.5 111.0 1955 · . 1,337.3 1,199.2 671.5 527.7 305.0 222.7 I 38.1 1956 1,500.6 1,313.1 720.2 592.9 351.5 241.4 187.5 1957 1,600.0 1,403.3 783.1 620.2 366.2 254.0 196.7 1958 1,740.1 1 ;511.8 820.6 691.2 459.2 232.0 228.3 1959 1,845.3 1,608.1 _ 897.3 710.8 480.J 230.7 237.2 1960 1,895.8 1,663.1 952.9 710.2 438.6 271.6 232.7 1961 2,219.3 1,939.8 1,049.6 890.2 533.8 356.4 279.5 1962 2,504.7 ·2,227.1 1,172.9 1,054.2 623.6. 430.6 277.6 1963 2,954.3 2,553.4 1,363.4 l, 190.0 831.0 359.0 400.9 1964 2,8n.8 2,492.9 1,324.7 1,168.2 768.0 .400.2' 380.9 1965. "3,066.9 2,687.9 1,483.2 1,204.7 8~1.5 353.2 379.0 ·1966 3,371.3 2,897.2 1,543.4 1,353.8 1,054.6 299.2 474.1 1967 3,?_82.5 3,345.4, 1,755.7 1,589.7 1,234.4 355.3 437.1 1968 3,981.9 3,462.5 1,777.5 1,685.0 1,314.0 371.0 519.4 1969 4,753.8 4,278.6 2,119.1 2,159.5 1,752.6 406.9 475.2 1970 5,047.4 4,660.4 2,410.0 2,250.4 1,829.0 421.4 387.0 1971 5,567.4 5,399.4 2,650.0 2,749.4 2,193.7 555.7 168.0 1972 6,796.6 6,796.6 3,434.6 3,362.0 2,651.1 710.9 1973 8,152.5 8,152.5 3,452.4 4,700.1 3,767.8 932.3 --
January 6,488.1 6,488. I 3,272.5 3,215.6 2,475.7 739.9 February 6,633.0 6,6~3.0 3-,276.4 3,356.6 2,625.7. 730.9
j March 7,015.5 7,015.5 3,413.8 3,601.7 2,734.5 867.2
312
-~
;

AND QUASI-MO~EY: CY ,1940-41·, CY I 945 TO APRIL 1974
annual increase in per cent)
Total Quasi- Time Savings Marginal Money &
Money 2 Deposits Deposits Deposits Quasi-money
98.1 98.1 353.6 89.3 89.3 359.3
119.3 119.3 1,210.3 232.2. 232.2 1,142.2 ·306.6 306.6 1,270.6 258.2 258.2 - 1,408.2 328.3 29.0 255.3 44.0 1,311.9 340.4 35.0 247.7 57.7 1,494.2 378.6 39.4 241.5 97.7 1,437.5 367.5 40.7 259.0 67.8 1,462.4 429.4 70.0 304.7 54.7 1,540.4 404.2 70.2 266.6 67.4 1,520.2 527.8 90.5 · 361.0 76.3 -1,727.0 587.0 97.0 428.l 61.9 1,900.1 718.8 115.5 498.2 I OS.I 2,122.1 775.0 141.3 .564.3 69.4 2,286.8 925.7 183.4 638.3 104.0 2,533.8
1,035.5 242.8 720.6 72.1 2,698.6 1,497.9 481.9 906.7 109.3 3,437.7 2,009.7 863.l 1,006.3 140.3 4,236.8 2,487.6 1,125.4 1,186.9· 175.3 5,041.0 2,570.7 1,035.1 1,345.0 190.6 5,063.6 2,729.8 1,051.6 1,437.4 24Q.8 SAi 7.7 3,367.8 1,202.1 1,967.8 197.9 6,265.0 4,300.2 1,416.1 2,505.9 378.2 7,645.7 4,909.5 1,280.9 2,820.9 807.7 8,372.0 5,007.6 1,261.5 3,193.6 552.5 9,286.2 5,875.0 1,309.5 3,776.6 788.9 . I 0,535.4 6,321.0 1,047.0 4,268.0 1,006.3 I I ,720.4 6,446.0 1,054.0 4,347.0 1,044.6 13,242'.6 8,685.0 996.0 5,758.0 1,931.0 16,837.5
6,261.0 1,023.0 4,337.0 901.0 12,749,1 6,344.0 1,031.0 4,349.0 964.0 12,977.0 6,657.0 1,017.0 4,588.0 I ,052.0. 13,672.5
313
Annual Increase
. Quasi- Money & Money Morley Quasi-
money
5.7 (9.0) 1.6 304.1 33.6 236.8 (16.6) 94.6 (5.6)
5.9 32.0 11.2 19.3 (15.8) 10.8
(14.5) 27.1 (6.8) 17.3 3.7 13.9 8.2 11.2 (3.8) 3.4 (2.9) 1.7 1.5 16.8 5.3 0.5 (5.9) (1.3) 7.5 30.6 13.6 9.5 11.2 10.0 6.9 22.5 11.7 7.7 7.8 7.8 6.4 19.4 10.8 3.4 11.9 6.5
16.6 44.7 27.4 14.8 34.2 23.2 14.7 23.8 ' 19.0 (2.4) .3.3 0.4 7.8 6.2 7.0
I
7.8 23.4 15.6 15.5 27.7 22.0 3.5 14.2 9.5
23.6 2.0 10.9 8.9 17.3 13.5
15.9 7.6 ' I 1.2 25.9 2.0 13.0
· 19.9 34.7 27.1

Table 10.2 - COMPOSITION AND GROWTH OF MONEY AND '(Amount in million pesos;
' ·Demand
Money Currency Private End of Period Supply1 Money in Total Business &
Circulation Individuals
April 7,1'15.3 7,115.3 · 3,317.3 3,798.0 2,799.4 May 6,918.3 6,918.3 3,213.6 3,704.7 2,806.7 June 7,100.7 7,100.7 3,143.7 3,957.0 3,070.8 July 7,121.5 7,121.5 3,029.0 4,092.5 3·,039.8 August 7,111.2 7,111.2 3,149.9 3,961.3 3,012.4
· September 7,405.1 7,405.1 3;094.5' 4,3i0.6 3,438.8 Oc.tober 7,203.0 7,203.0 3,0,93.7_ 4,109.3 3,142.0 November 7,258.0 7,258.0 3,198.5 4,059.5 3,120.9 December , 8,152.5 8,152.5 3,452.4. 4,700. I 3,767.8
1974 January 7,524.8 7,524.8 3,303.4 4,221.4 3,278.0 February 7,766.9 7,766.9 · 3,398.2 . 4,368.7 3,441.2
· March 8,297.6 8,297.6_ 3,647.7 4,649.9 3,681.5 April 8,471.8 8,471.8 3,686.0 4,785.8 3,674.3
- not_ available.
1 Beginning 1949. data were revised to con!ider only the trea~uy cWI holding!. the Central Bank and the Com~ercid Banking Sy8tem operations u the origin of money supply. ·
. 2 Beginning 1949, data on savings, time, marginal and other deposits were revised.1
to coMid~r only the deposi1
t liabilities of the Commercial Banking Syetem. Beginlling 1971, nationaJ government depoeilB are excluded under Quui~ohey.
Source of data: Central B~nk of the Philip~ine.5: a) Phntpplne Financial StatiJtiCJ - Quarterly Bulletin and h) Statistical Bulletin. • · · ·
'
'
314
7
'
i '
l

QUASI-MONEY: CY 1940-41; CY 1945 TO APRIL 1974 (continued) . . .
annual increase in per cent)
Deposits \ Total
Official Unused Quasi- Time Savings Marginal Money & Entities Overdraft Money2 Deposits Deposits Deposits Q4asi-
Lines "- money
9't_8.6 . 6,516.0 961.0 4,471.0 1,084.0 13,631.3 898.0 6,761.0 958.0 4,611.0 1,192.0 13,679.3 886.2 7,135.0 920.0 4,980.0 1,235.0 14,235.7
1,052.7 7,156.0 901.0 4,999.0 1,256.0 14,277.5 · 948.9 .' 7;623.0 934.0 · 5,325.0 1,364.0 · 14,734.2
871'8 8,106.0 951.Q '5,654.0 I ,SO 1.0 15,51 I.I 967.3. 8,150.0 966.0 5,523.0 1,661.0 15,353.0 :138.6 8,232.0 961.0 5,499.0 1,772.0 15,490.0 932.3 8,685.0 996.0 5,758.0 1,931.0 16,837.5
943.4 8,541.0 ·980.0 5,490.0 2,071.0 16,065.8 927.5 8,810.0 959.0 5,741.0 2,110.0 16,576.9 968.4 8,918.0 948.0 5,760.0 2,210.6 17;215.6
1,111.5 8,944.0 968.0 5,690.0 2,286.0 17,415.8 "r
'
315

1
' Table 10.3 -TOTAL LOANS AND INVESTMENT OUTSTANDING (Amount in million pesos;
Total Commercial Banks Rural Banks
~ End of Period Amount Per Cent Amount Per Cent Amount Per Cent
I 1947 94.0 100.0 1948 176.3 100.0
~ 1949 • 857.6 100.0 618.2 72.1
1950 893.1 · 100.0 626.9 70.2 1951 1,080.2 100.0 772.9 71.6 . I 1952 1,195.3 100.0 796.1 66.6 I 1953 1,386.5 100.0 884.0 63.8 2.0 0.1 1954 1,315.6 100.0 736.0 55.9 3.8 0.3
1955 1,639.4 100.0 985.3 60.1 6.6 0.4 19S6 2,173.1 100.0 1,428.9 65.8 15.7 0.7 1957 2,320.7 100.0 1,456.8 62.8 29.6 1.3 1958 2,437.2 100.0 1,495.7 61.4 43.4 1.8 1959 2,637.8 1,668.9 63.3 . ·. 51.6 1.9
1960 2,927.0 100.0 1,849.8 63.2 63.5 2.2 1961 4,171.6 100.0 2,762.9 66.2 88.5 2.1 1962 4,854.2 · 100.0 ,3,216.8 66.3 117.4 2.4 1963 6,107.4. 100.0 4,234.9 69.3 155.4 2.5 1964 7,200.5 100.0 4,912.3 68.2 212.1 3.0
1965 8,251.5 100.0 5,547.7 67.2 234.6 2.9 1966 9,491.7 100.0 16,229.8 65.6 272.0 2.9 1967 11,740.9 100.0 7,663.8 65.3 344.8 2.9· 1968 13,261.0 100.0 8,530.8 64.3 402.8 3.0 1969 15,009.1 100.0 9,463.7 63.1 463.1 3.1
1970 17,603.1 100.0 10,968.0 62.3 547.7 3.1 1971 20,467.9 100.0 12,497.6 61.1 663.2 3.2 '1972 24,574.0 100.0 14,983.3 61.0 808.7 3.3 1973 32,383.1 100.0 21,776.5 67.2 1,103.2 3.4
1st Quarter 24,805.62 100.0 15,929.9 64.2 n.a. n.a.
2nd Quarter 27,216.9 100.0 17,267.0 63.4 902.1 3.3 3rd Quarter 29,708.3 100.0 19,325.7 65.0 1,033.9 3.5 4th Quarter 32,383.1 100!0 21,776.5 67.2 1,103.2 3.4 .•
1974 January 38,201.93 100.0 22,168.9 58.0 11,259.0 29.5 February 27,286.94 100.0 22,467.2 82.3 n.a. n.a. March 24,649.45 100.0 23,821.2 96.6 · n.a. n.a.
- not available. n.a. - Data nol available. 1 Figures were revised beginning I 966. 2Excludes rural banks. 3E:J:cludes development banks. 4Excludes rural banks and development banks. 5Excludes rural hanks. deYelopment banks, private non-bank and government non-bank financial institutions. Souree of data: Central Bank of tht: PhUlppint:£ 316 -

,-------- .
' I
I
f BY INSTITUTION: CY 1947 TO FIRST QUARTER 1974 perc.entage distribution in per cent)
Private Non-bank' Government-Non-bank Development Banks Savings Bank Financial Institution Financial Institution
Amount Per Cent Amount Per Cent Amount Per Cent · Amqunt Per Cent·
91.6 97.4 2.4 2.6_ 169.9 96.4 3.1 1.7 3.3 1.9 228.6 26.7 LO 0.1 3.5 0.4 6.3 0.7 25·2.9 28.3 1.0 0.1 4.3 0.5 8.0 0.9 287.0 26.6 1.4 0.1 4.7 0.4 1.4.2 1.3 360.4 30.2 9.2 0.8 6.5 0.5 23.1 1.9 455.9 32.9 10.3 0.7 7.2 - 0.5 27.1 2.0 493.0 37.5 15.2 1.2 f,. 7 0.5 60.9 4.6 508.9 31.1 20.3 1.2 8.4 0.5 109:9 6.7 533.2 24.5 30.4 1.4 8.4 0.4 156.5 7.2 532.1 22.9 36..0 1.5 8.8 . 0.4 257.4 11. l 519.1 21.3 41.8 1.7 9.9 0.4 327.3 13.4 523.5 19.8 49.6 1.9 10.3 0.4 333.9 I 2.7 1
573.4 I 9.6 56.9 1.9 10.9 0.4 372.5 12.7 814.7 I 9.5 42.5 1.0 11.0 0.3 452.0 10.9 929.5 I 9.2 58.4 1.2 I 1.7 0.2 520.4 10.7
1,030.5 16.9 76.6 1.3 I 1.8 0.2 598.2 9.8 1,158.1 I 6.1 111.2 LS 14.6 0.2 792.2 I 1.0 1,288.9 15.6 141.2 1.7 15.6 0.2 1,023.5 12.4 ' 1,343.1 14.2 206.9 2.2 135.7 1.4 1,304.2 ·13_7 1,671.1 14.2 268.4 2.3 164.6 1.4 1,628.2 13.9 2,025.7 15.3 3!0.4 2.4 191.0 1.4 1,800.3 13.6 2,416.7 16.1 382.7. 2.5 207.8 1.4 2,07s.1 13.8
· 2,935.3 . 16.7 564.0 3.2 227.8 1.3 2,360.3 • 13.4 3,567.6 17.4 678.1 3:3 300.0 1.5 2,761.4 13.5 4,389.9 17.9 692.3 2.8 404.5 1.6 . 3,295-.3 13.4 4,845.0 15.0 819.3 2.5 247.6 0.8 3,591.5 I I. I -,--4,420.3 17.8 727.3 2.9 · 404.2 1.7 3,323.9 13.4 4,436.9 16.3 756.0 2.8 425.0 1.6 3,429.9 ·J 2.6 4,747.6 16.0 756.2 ~-5 168.1 0.6 3,"676.8 12.4 4,845.0 15.0 819.3 2.5 247.6 0.8 3,591.5 11.1
n.a. n.a. 828.8 2.2 124.6 0.3 3,820.6 10.0 n.a. n.a. 845.6 3.1 127.5 0.5 3,846.6 14.1 n.a. n.a. 828.2 3.4 n.a. n.a. n.a. n.a.
317

Table l0.4 - TOT AL INVESTMENT IN SECURITIES (Amount in i:nillion pesos;
Total Commercial Banks End of Period
Amount Per Cent ·Amount Per Cent
1949 53.7 .100.0 53.2 99.0 1950 77.9 100.0 77.5 99.5 1951 67.1 l00.0 66.4 -99.0 1952 80.5 100.0 79.8 99.0 1953 .. 120.5 100.0 90.9 75.5 1954 156.6 100:0 102.7 65.5 1955 282.2 100.0 226.9 80.4 1956 417.7' 100.0 332.4 79.6 1957 199.2 100.0 120.9 · 60:1 1958 174.5 100.0 111.0 63.6 1959 177.9 100.0 112.9 63.5 1960 189.6 100.0 131.9 69.6 1961 533.9 100.0 434.I 81.3 1962 480.4 100.0 367.3 76.5 1963 601.5 100.0 464.4 77.2 1964 599.3 100.0 465.8 77.7 1965 806.5 100.0 615.1 76.3 1966 996.5 100.0 826.3 82.9 1967 1,355.9 100.0 1,087:3 80.2 1968 1,610.4 100.0' 1,286.3 79.9. 1969 2,092.4 100.0 1,641.1 78.4 1970 2,249.9 100.0 1,762.3 78.3 1971 2,465.1 100.0 1,886.8 76.5 1972 3,044.7 1973
100.0 2,024.7 66.5
I st Quarter 3,605.01 100.0 2,615.1 72.5 2nd Quarter 3,968.1 100.0 3,045.9 76.8 3rd Quarter 4,911.5 100.0 3,767.8 76.7 4th Qua;ter 5,581.1 100.0 4,426.9 79.3
1974 January 4,520.92 100.0 4,156.9 91.9 February 4,658.43 100.0 . 4,321.7 92.8 March 4,845.33 , 100.0 4,537.7 93.7
8Beginning 1959, includes private development banks. n.a. - Data not available. · lExcludcs rural banks. 2Exdudcs development hanks. 3Excludes rural banks and development banks.
Source of data: Central Bank Statutical Bulletin.
,318
~
◄
,

~
BY INSTITUTIONS: CY 1949 TO FIRST QUARTER 1974 percentage distribution in per cent)
,·
Rural Banks Development Banks ' . Savings Banks
Amount Per Cent Amount Per Cent Amount. Per Cent
· 0.5 1.0 0.4 .5 0.7. 1.0 0:7 1.0
- 28.6 23.7 1.0 .8 52.4 · 33.5 1.5 1.0
. I 52.7 '18.7 2.5 .9
.3 .l 73·.7 17.6 11.3 2.7 1.2 .6 72.3 36.3 4.8 2.4 2.1 1.2 55.9 32.0 5.5 3.2 2.6 1.5 57.3• 32.2 5.1 . 2.9 3.9 2:1 49.4 26.0 4.4 2.3 4.9 .9 - 87.9 16.5 7.0 · 1.3 6.1 1.2 96.5 20.1 .10.5 · 2.2 8.2 1.4 110.5 18.4 18.4 , 3._o ' 8.5 1.4 108.2 18.1 16.8 2.8
10.0 1.2 161.6 20.0 19.8 2.5 6.9 .8 129.0 12.9 34.3 3.4 6.8 .5 217.0 16.0 44.8 3.3 . 6.8 .4 284.0 17.6 33.3 2.1 7.8 .4 328.5 15.7 115.0 5.5
12.9 .. 6 352.0 i5.6 122.7 5.5 17.0 .7 427.9 17.4 \ I 33.4 5.4 26.0 .9 . 861.4 28.3 132.6 4.3
. , n.a. n.a. 767.6 21.3 222.3 6.2
35.2 .9 626.9 15.8 260.1 6.5 38._9 .8 . 800.0 16.3 304.8 6.2 32.8 .6 800.3 14.3 321.1 5.8
35.1 0.8 n.a. n.a. 328.9 7.3 n.a. n.a. n.a. n.a. 336.7 7.2 n.a. n.a. n.a. n.a. 307.6 6.3
/
319

Table 10.5 - CREDITS OUTSTANDING OF COMMERCIAL AND SAVINGS (In million
End of Period Agriculture. Mining and Manu- Construe- Public Forestry and Quarrying factunng tion 2 Utility 3
Fishery I
.1 1960 453.2 21.7 547.2 20.2 41'.4 1961 526.0 22.5 805.5 27.6 61.8 1962 594.6 25.1 966.1 34.4 75.2 1963 771.9 32.9 1,103.4 56.6 97.8 1964 918.7 39.9 1,229.8 82.2 116.6 1965 1,035.7 · 32.1 1,268.4 89.2 126.5
• 1966 1,086.3 42.7 1,343.7 94.0 142.7 1967 1,209.1 48.5 1;398.5 113.5 165.0 l 968 1,47~.l 37.1 1,518.9 114.6 170.5 1969 1,617.0 40.0 1,500.6 I 20.4 144.6 1970 1,720.7 45.7 1,820.0 135.7 172.8 1971 i,"784.6 92.7 2,196.1 148.6 210.8 1972 1,777.3 194.5 3,323.5 210.7 344.0 1973 2,247.6 235.5 5,814.1 353.3 351.5
1st Quarter 1,755.4 205.9 4,058.5 303.5 468.3 2nd Quarter 1,825.4 202.2 4,094.0 292.1 360.1 3rd Quarter 2,152.3 123.1 4,546.2 380.0 345.9 4th Quarter 2,247.6 235.5 5,814.1 353.3 351.5
1974 1 st Quarter 2,465.4 264.9 6,032.6 336.0 368.0
, Compo
1960 26.1 1.2 31.5 l.l 2.4 1961 22.9 1.0 35.1 1.2 2.7 1962 2L5 0.9 35.0 1.2 2.7 1963 21.4 0.9 30.6 1.6 2.7 1964 21.6 0.9 28.9 1.9 2.7 1965 21.6 0.7 26.4 1.9 2.6 1966 21.8 0.9 26.9 1.9 2.8 1967 20.8 0.8 24.1 2.0 2.9 1968 23.4 0.6 24.0 1.8 2.7 ·1969 23.7 0.6 22.0 1.8 2.1 1970 21.1 0.6 22.3 1.7 2.1 1971 18.1 0.9 '22.2 1.5 2.1 1972 14.9 1.6 27.9 1.8 2.9 1973 12.8 1.3. 33.1 2.0 2.0
1st Quarter 13.3 1.6 30.9 2.3 3.5 2nd Quarter 13.1 1.4 29.4 2.1 2.6 3rd Quarter 14.2 0.8 30.0 2.5 2.3 4th Quarter 12.8 1.3 33.1 2.0 2.0
1974 · I st Quarter 13.0 1.4 31.8 1.8 1.9
1 Commercial hank component for 1962.1967 excludes fishery and forest ~rviccs. i Data_ for ~?6~1967 reprc11~t _"contral!t construction". .
4 Public Utd1ty 111_clude11 cltttncity, gas and steam; water Sipply system; common canter~; operation of wharves, rlrr
5 Data from 1960.1967 ~elude Qght drafts., loans, discount! advances and overdrafts are r:xcfuded. Commercial bank component for I.962-1967 includes fifflery and fore!!· services.
Source of data: Central Bank of the Philippines.
320

I BANKS TO TiiE PRIVATE SECTOR BY INDUSTRY: CY 1960-lst QUARTER 1974 pesos)
Trade4 Banking and
Real Estate ·servicesS Consumptioll Total Other Fin. Inst.
413.0 39.4 95.1 36.9 69.0 1,737.1 563.8 . 65.1 105.2 43.8 74.3 2,295.6 747.6 72.1 119.5 58.6 70.7 2,763.9
I ,I 1'4.9 124.3 138.S 75.3 91.3 3,606.9 1,374.3 142.6 164.9 83.3 99.7 4,252.0 1,656.4 192.0 201.4 82.4 114.9 4,799.0 1,606.6 152.6 271.6 97.6 155.4 4,993.2 2,023.7 235.5 351.0 142.4 117.5 5,804.7 1,940.0 183.9 471.l 182.7 225.0 6,321.9 2,063.6 275.6 581.4 181.4 · 295.5 6,820.1 2,490.5 587.0 624.3 249.9 313.1 8,159.7 3,061.1 422.9 902.2 302.1 759.1 9,880.2 3,580.5 774.9 847.9 398.7 463.7 11,915.7 5,823.1 660.5 987.6 392.8 703.3 17,569.3
3,861.9 743.4 928.6 377.7 447.6 13,150.8 4,476.9 707.2 955.6 335.1 672.0 13,920.6 4,912.9 750.2 977.7 355.4 615.6 15,159.3 5,823.1 660.5 987.6 . 392.8 703.3 17,569.3.
6,3 I 2.4 1,014.5 1,084.6 467.7 635.0 I 8,981.1
sit ion
23.8 2.3 5.5 2.1 4.0 100.0 24.6 2.8 4.6 1.9 3.2 100.0 27.1 2.6 4.3 2.1 2.6 100.0 30.9 3.5 3.8 2.1 2.5 100.0 32.3 3.4 3.9 2.0 2.4 100.0 34.5 4.0 4.2 1.7 2.4 100.0 32.2 3.1 5.4 1.9 3.1 100.0 34.9 4.0 6.0 2.5 2.0 100.0 30.7 2.9 7.4 2.9 3.6 100.0 30.3 4.0 8.5 2.7 4.3 100.0 30.5 7.2 7.6 3.1 3.8 100.0 31.0 4.3 9.1 3.1. 7.7 - 100.0 30.1 6.5 7.1 3.3 3.9 100.0 33.2 3.8 5.6 2.2 4.0 100.0 --29.4 5.6 7.1 2.9 3.4 100.0 32.2 5.1 6.9 2.4 4.8 rno.o 32.4 4.9 6.5 2.3 4.1 100.0 33.2 3.8 5.6 2.2 4.0 100.0
33.3 5.3 5.7 2.5 3.3 100.0
dock!, etc.; warehou~ing; communication, ice and ice refrigeration; and others.
321

Table 10.6 - LOANS OUTSTANDING OF GOVERNMENT CLASSIFIED BY
(In million t Tot a 1 A g r i c u ·I. t u r e
1 End of Period Total Government Private Total Government
1947 2.4 2.4 . ◄ 1948 6.4 3.3 3.1
1949 9.8 6.3 3.5 I 950 12.3 8.0 4.3
1951 18.9 14.2 4.7 1952 29.6 23.l 6.5 1953 34.3 27.1 7.2 2.7 2.7 1954 67.6 60.9 6.7 16.5 16.5 1955 ,18.3 109.9 8.4 43.5 43.5
il 1956 164.9 156.5 8.4 60.7 60.7 1957 266.2 25·7.4 8.8 71.3 71.3 1958 · 337.2 327.3 9.9 85.6 85.6 1959 344,2 333.9 10.3 81.4 81.4 1960 383.4 372.5 10.9 78.5 78 5 1961 462.9 451.9 11.0 79.1 79.1 1962 . 532.0 520.4 11.6 77.8 77.8 1963 . 610.0 . 598.2 11.8 79.1 79.1 1964 806.8. 792.2 14.6 78.8 78.8 1965 1,039.1 1,021.5 15.6 86.6 86.6 · 19661 I ,439.9 1,304.2 135.7 94.4 94.3 1967 I, 792.8 1,628.2 164.6 103.5 103.2 1968 1,991.3 1,800.3 191 .0 116.9 1 I 3.2 1969 2,282.9 !,075. l 207.8 120.0 112.6 1970 2,588.1 2,360.3 227.8 141.1 132.4 1971 I 3,061.4 2,76].4 300.0 147.1 · 139.7
' 1972 3,699.8 3,295.3 404.5 148.3 130 .. 8
~ 1973 3,839.1 3,591.5 247.6 122.4 112.5
March 3,728.1 3,323.9 404.2 140.5 122.8 June 3,854.9 3,429.9 425.0 143.5 125.4 September 3,844.9 3,676:8 168.1 127.6 122.2 December 3,839.1 3,591.5 247.6 122.4 112.5
1974 January 3,945.2 3,820.6 124.6 120.0 112.5 February 3,974.1 3,846.6 127.5 121.0 112.5
- not available.
1 Beginning I 966, data were revised:
Source of data: Central Bank of the Philippines. 322

\ I
AND PRIVATE NON-BANK FINANCIAL INSTITUTIONS PURPOSE: CY 194 ?-February 1974
pesos)
Industrial Commercial
Private Total Government Private Total Government Private
0.1 99.4 57.8 41.6 33.4 33.4
0.3 108.7 57.0 51.7 34.0 34.0
3.7 113.7 51.8 61.9 30.0 30.0
7.4 111.6 49.5 62.1 42.8 42.8
8.7 121.4 55.9 65.5 43.4 43.4
7.4 164.6 64.1 100.5 60.1 60.1 17.5 221.5 57.7 163.8 .77.2 77.2 9.9 105.9 64.6 41.3 59.1 59.1
-17.7 235.2 65.3 169.9 75.1 75.1 18.1 283.5 68.1 215.4 75.9 .75.9
5.4 87.l 51.7 35.4 57.4 57.4 9.9 105.9 64.6 41.3 59.1 59.1
7.5 94.5 56.9 37.6 7.5 7.5
8.5 110.9 72.0 38.9 7.5 7.5
323

Table 10.6 - LOANS OUTSTANDING OF GOVERNMENT . INSTITUTIONS CLASSIFIED BY PURPOSE:
(In million
(
Public Utility Real Estate End of Period
Total Government Private Total Government 4
1947 1948 3.0 l 1949 3.4 1950 4.2
1951 8.5 4.0 r ' 1952 18.1 11.8
1953 -. 17.7 I 0.9 I 954· 25.3 19.1 1955 28.1 20.3
l 956 48.8 41.0 I 957 133.0 124.8 1958 183 .I 173.9 I 959 187.9 178.2 196_0 199.3 189.2
1961 250.5 240.3 1962 301.7 290.7 1963 361.6 350.6 1964 505.1 491:3 1965 702.6 ' 688.2
19661 26.3 3.3 23.0 842.9 826.4 . 1967 46.5 9.9 36.6 1,031.7 1,013.7 1968 72.3 21.8 50.5 1,170.1 1,152.2 1969 78.6 29.3 49.3 1,374.3 1,358.2 1970 88.3 39.8 48.5 1,475.2 l ,4·56.1
1971 118.3 48..3 70.0 1,582.8 1,563.0 1972 159.6 77.7 81.9 1,996.8 1,973.4 1973 91.0 89.5 1.5 2,217.6 2,191.4
March 167.1 84.1 83.0 . ' 2,009.2 1,984.6 June 170.3 . 85.8 84.5 2,131.7 2,117.2 September 104.6 101.6 3.0 2,159.3 2,134.8 December 91.0 89.5 1.5 2,217.6 2,191.4
1974 January 95.0 92.1 2.9 2,220.6 2,195.4 February 95.1 92.1 3.0 2,226.3 2,20 I. I
- not available. 1 Beginning 1966 data were revi!cd.
Source of data! Central Bank of the Philippines.
324

AND PRIVATE NON-BANK FINANCIAL CY 194 ?-FEBRUARY 1974 (continued)
I . pesos)
I
, Consump t i o n Others
~ Private Total Government Private Total Government Private
I 2.4 2.4 , 3.0 3.4 • 3.3 0.1 3.4 6.4 6.3 0.1 4.2 . 8.1 8.0 0.1
i 4.5 10.4 10.2 0.2 I > 6.3 11.5 11.3 0.2
6.8 13.9 13.5 0.4 6.2 25.8 25.3 0.5 7.8 46.7 46.1 0.6
7.8 55.4 54.8 0.6 8.2 61.9 61.3 0.6 9.2 68.5 67.8 0.7 9.7 74.9 74.3 0.6
IQ.I 105.6 104.8 0.8
10.2 133.3 132.5 0.8 I 1.0 152.5 151.9 0.6 I 1.0 169.3 168.5 0.8 13.8 222.9 222.i 0.8 14.4 249.9 248.9 1.2
16.5 333.4 312.3 21.1 10.1 I 0.1 18.0 457.6 433.6 24.0 10.8 10.8 17.9 474.7 447.7 27.0 13.6 13.6 16.1 547.3 517.2 30.1 8.0 8.0 19.1 608.5 565.9 42.6 110.2 l 10.2
l 9.8 754.0 711.8 42.2 234.5 234.5 23.4 773.7 733.0 40.7 322.7 322.7 26.2 602.8 560.7 42.1 640.3 572.8 67.5 -24.6 765.5 731.6 33.9 335.5 335.5 14.5 726.3 709.7 16.6 323.7 323.7 24.5 774.6 734.2 40.4 : 534.3 532.3 2.0 26.2 602.8 560.7 42.1 640.3 572.8 67.5
25.2 802.6 759.9 42.7 605.0 603.8 1.2 25.2 808.3 765.2 43.1 605.0 603.7 1.3
325
•

Calendar Ye a r ·
1960 1961 1962 1963 1964
1965 1966 1967 1968 1969
1970 1971 I 972
1973
I st · Quarter 2nd Quarter 3rd Quarter 4th Quarter
1974 1st Quarter
- not available.
Table 10.7 - TOTAL CREDITS GRANTED BY COMMERCIAL AND
(In million
Tot a I Demand
Commer- Sav- Commer.- Sav-Total cial . ings· Total cial ings Total
Banks Banks Banks Banks
•· 2,874.1 2,849.1 25.0 667.2 667.2 2,060.5 4,159.3 4,133.6 25.7 1,100.3 1,099.3 0.6 2,934.0 4,947.9 4,916.4 31.5 768.0 768.0 . 4,032.6 6,861.4 6,826.3 35.J· 1,001.0 1,001.0 5,584.0 7,418.6 7,349.7 68.9 1,053.7 1,052.7 1.0 6,100.6
7,832.8 7,766.7 66.1 1,002.9 , 1,000.0 2.9 6,632.1 8,273.1 7,165.6 107.5 1,235.8 1,231.1 4.7 6,749.2 9,883.0 9,753.6 129.4 1,338.0 . 1,380.1 7.9 8,219.1
15,479.9 15,335.8 144.1 2,821.1 2,798.9 22.2 12,383.7 1_6,495.2 16,389.5 105.7 3,498.3 3,494.0 4.3 12,795.1
22,066.7 '21,951.7 115.0 4,710.1 4,701.0 9.1 17,001.7 29,084.2 28,820.4 263.8 5,721.1 5,691.7 29.4 22,596.9 32,905.0 32,689.4 215.6 6,878.9 6,866.9 12.0 24,824.2
46,836.6 46,684.6 152.0 9,088.9 9,088.9 - 35,496.4
9,580.4 9,546.2 34.2 1,827.9 1,827.9 7,409.5 10,249.5 10,225.4 24.1 1,864.5 1,864.5 7,820.9 12,008.0 11,973.5 24.5 2,369.1 2,369.1 8,981.3 14,998.7 14,939 .. 5 59.2 3,027.4 3,027.4 - 11,284.7
16,712.9 16,656.1 56.8 3,491.9 3,490.3 1.6 12,520.3
Source of data: Central Bank of the Philippines. . '
326
•
1
~ -

SAVINGS BANKS, CLASSIFIED BY MATURITY: CY 1960-lst QUARTER 1974
pesos)
Short Te.rm Intermediate Term Long Term-
Commer- Sav- Commer- Sav- Commer-cial ings Total cial ings Total 1 ciGI.
Banks Banks Banks Banks Banks
. 2,049.5 I 1.0 I 30.9 128.2 2.7 I 5.5 4.2 2,924.3 9.7 I 01.4 92.4 9.0 23.6 I 7 .l 4,020.8 11.8 101.6 95.0 6.6 45.7 32.6 5,570.1 13.9 196.9 191.0 5.9 79.5 64.2 6,062.9 37.7 136.9 132.5 4.4 127.4 I 01.6
6,590.8 41.3 1-59.4 158.7 0.7 38.4 · 17.2 6,682.3 66.9 221.3 214.5 6.8 66.8 37.7
. 8,134.0 85.1 ,212.2 210.0 2.2 63.7 29.5 12,319.2 64.5 216.1 195.6 20.5 59.0 . 22.1 12,729.5 65.6 113.4 110.7 2.7 88.4 55.3
16,929.0 72.7 255.0 247.8 7.2 99.9 73.9 22,446.0 150.9 557.9 529.6 28.3 208.3 153.1 24,720.2 104.0 780.2 757.4 22.8 421.7 344.9
35,457.3 39.1 859.6 826.9 32.7 1,391.7 1,311.5
7,399.2 10.3 118.8 116.3 2.5 224.2 202.8 7,807.7 13.2 326.6 326.3 0.3 237.5 226.9 8,973.1 8.2. 128.5 I I 9 .1 9.4 529.1 512.2
11,277.3 7.4 285.7 265.2 20.5 400.9 369.6
12,508.9 11.4 197.8 186.9 10.9 502.9 470.0
327
Sav-ings
Banks
I 1.3 6.4
13.1 15.3 25.8
21.2 29.1 34.2 36.9 33.1
26.0 55.2 76.8
80.2 ·
21.4 10.6 16.9 31.3
32.9

Table 10.8 -TOTAL CREDITS GRANTED BY COMMERCIAL AND (In million
Total I n t e r e s t
Credits 41 5 6 7
Total 1960 · 2,630.8 32.2 35.9 320.2 864.9 1961 3,915.1 30.7 24.5 533.9 1,477.3 1962 4,765.2 71.2 32.9 657.2 1,047.0 1963 6,636.2 70.0 109.4 863.5 801.8 1964 7,192.7 37.9 28.0 482.8 980.7
1965 7,694.6 44.1 3,3 314.9 1,050.5 1 1966 8,158.3 26.3 5,1 457.4 469.0 1967 9,759.4. 22.2 74.5 800.0 386.4 1968 12,572.5 24,9 122.2 309.4 1,168.6 .1969 13,700.8 58.4 23.4 I 25.7 1,087.2
1970 16,942.0 64.4 47.4 128.5 260.4 1971 23,081.0 62.2 28.3 92.8 82.8 1972 27,163.7 235.3 52.2 259.2 224.3 1973 37,378.0 2;689.4 444.4 521.0 690.7
--1st Quarter 7,725.0 455.6 126.3 103.2 104.1 2nd Quarter 7,907.1 480.0 72.5 IOI.I 159.8 3rd Quarter 9,582.9 1,309.6 13_1.5 169.7 I l 1.6 4th. Quarter 12,163.0 444.2 114.1 147.0 315.2
1974 ·e, 1st Quarter 13,435.1 495.0 169.8 107.1 67.8
Commercial banks
1960 2,605.8 32.2 35.9 320.1 864.1 1961 3,889.4 30.7 24.5 533.7 1,476.9 1962 4,733.7 71.2 32.9 657.0. 1,045.9 1963 6,601.1 70,0 109.4 8_63.2 801.4 1964 7,123.8 37.9 27.9 482.4 979.7
1965 7,628.5 44.1 2.7 314.6 1,049.5 1966 8,050.8 26.0 5.1 456.6 469.0 1967 9,630.0 22.2 74.5 800,0 3'86.3 1968 12,428.4 24.9 122.2 309.4 1,168.6 1969 13,595.1 58.4 23.4 125.7 1,087.2
~ 1970 16,827.0 64.4 47.7 128.5 260.4 1971 12,817.2 62.2 28.3 92.8 82.8 1972 26,948.1 235.3 52.2 256.4 223.3 1973 37,226.0 2,689.4 444.4 521.0 690,7
1st Quarter 7,690.8 455.6 126.3 103.2 104.1 1 2nd Quarter 7,883.0 480.0 72.5 IOI.I 159.8 3rd Quarter 9,548.4 1,309.6 131.5 169.7 111.6 4th Quarter 12,103.8 444.2 114. I 147.0 315.2
1974 I st Quarter 13,378.3 495.0 169.8 107.1 67.8
llndus:ivc of (),r, to 4-1/2%. Note: Credit! granted by Commcrcia1 Banks include export bills.
Source of d■ta: Central Hank of thc·Philippines.
328
/

I SAVINGS BANKS CLASSIFIED BY INTEREST RA,:E: CY 1960-lst QUARTER 1974 I I pesos)
~ Rat c (Per Cent)
8 9 10 I I 12 13 14
.6 79.4 356.2 214.6 3.0 124.4 780.2 592.6 299.6 3.0 173.6 877.2 1,176.5 591.3 61.0 250.9
2.069.1 1,374.6 804.5 175.0 368.3 1,894.5 1,701.2 1,050.4 341.1 574.3 1.8 I ,358.6 2,376.1 I ,I 94.4 488.0 823.8 16.7 24.2
508.5 1,919.2 2,012.4 I ,199.8 1,250.2 129.0 181.4 539.8 2,245.3 2,608.4 1,238.8 I ,517.5 I I 9.4 207.1
. 548.8 1,527.0 3,703.4 2,839.2 1,798.9 285.7 :'44.4 528.7 1,293.1 3,764.2 3,405.7 2,480.5 493.5 440.4
306.5 1,680.7 2,257.6 5,229.9 4,600.1 1,300.6 1.065.6 220.7 , I ,006.3 2,059.3 6,664.7 7,165.0 2,498.2 3,200.7 343.8 879.1 2,299.1 6,858.2 7,871.9 2,371.1 5,669.5 700.3 I, 115.5 1,976.9 9,902.4 10,007.2 2,477.8 6,852.4
145.4 223.2 490.9 1,961.9 1,900.7. 598.0 1,615.7 I 18.3 185.2 370.6 1,965.1 2,136.5 634.9 1.,683.1 192.6 270.2 378.6 2,609.0 2,441.9 682.1 1,286.1 244.Q 436.9 736.8 3,366.4 · 3,528.1 562.8 2,267.5
191.7 395.9 738.I 3,729.8 3,499.2 878.8 3,161.9
6·79.3 352.3 213.3 3.0 105.6 780.2 587.2 298.9 3.0 I 54.6 877.2 1,174.4 5.85.5 61.0 228.6
2,069.1 1,374.0 792.6 175.0 346.4 1.894.1 1,799.9 1,029.5 339.9 530.7 1.8 1,356.6 2,374.7 I ,I 79.1 479.3 787.0 16.7 24.2
505.4 1,915.6 1,996.1 1,195.3 1,171.3 129.0 181.4 537.2 2,228.2 2,592.9 1,236.7 1,425.5 119.4 207.1 545.8 1~514.7 3,695.5 2,834.3 1,682.9 285.7 244.4 526.0 1,267.3 3,757.6 3,405.2 2,410.4 493.5 440.4 303.8 I ,668.4 2.239.5 5,228.6 4,520.4 1,300.4 1,064.9 218.7 984.5 2,051.3 6,660.2 6,995.8 2,4&2.2 3,158.4 338.9 875.4 2,290.5 6,855.1 7,798.0 2,368.5 5,654.5 699.3 1,114.8 1,944.8 9,901.6 9,895.4 2,477.5 6,847.1
144.4 223.1 483.2 1.961.8 1,875.4 598.0 r,615.7 118.3 185.1 370.3 1,964.5 2,117.8 634,7 1,678.9 192.6 269.8 371.0 2,608.9 2,415.8 682.1 1,285.8 244.0 436.8 720.3 . 3,366.4 ~,486.4 562.7 2,266.7
I 91.7 395.9 718.4 3,729.7 3,465.2 878.7 3,159.0_
329

Table I 0.9 - TOTAL CREDITS GRANTED BY COMMERCIAL,
NON-BANKING FINANCIAL INSTITUTIONS (In million
Total Agric. Fishery Mining Manufac- Construe-Calendar Year Credits and and turing tion 1
Forestry. Quarrying ~
1960 2,079.5 501.6 36.7 886.4 45.7 1961 3,101.2 660.l 51.2 1,437.3 62.l 1962 4,078.6 842.0 59.9 1,901.1 77.5 1963 5,391.4 1,116.0 60.5 2,258.6 124.9 1964 5,913.5 1,194.6 85.5 2,361.9 I 15.2 1965 5,917.4 1,210.3 51.4 2,327.7 143.0
1966 6,999.0 1,343.8 70.8 2,652.-9 132.8. 1967 8,242.2 1,700.4. 62.7 3,122.3 151.9 1968 11,489.0 1,813.2 96.7 3,767.8 192.3 1969 12,374.6 1,888.8 93.4 4,039.7 223.8 1970 14,883.3 2,260.9 96.7 4, l 02.2 187.3
1971 21,237.3 2,575.4 322.3 5,985.4 227.7 19723 32,776.3 2,652.9 563.7 7,431.3 364.6 , 1973 46,221.6 2,988.6 . 835.9 10,447.4 368.8
January 3,075.0 232.l 71.3 704.9 31.7 February 3,057.7 216.5 77.4 108·.3 26.9 March 3,401.1 248.9 56.7 808.3 34.9 April 3,094.6 214.8 65.6 748.3 15.6 May 3,527.3 236.9 37.9 758. 7, 33.0 June 3,608.2 . 264.3 · 44.6 816.8 25.8 July 3,651.2 276.3 74.0 862.8 22.5 August 4,300.1 236.7 49.3 1,026.2 31.7 September 3,763.7 · 218.9 83.6 827.3 33.8 October 4,847.8 251.9 73.7 1,090.4 26.9 November 4,697.2 · · 271.3 55.3 981.1 48.4 December 5,197.7 320.0 146.5 1,114.3. 37.6
-~ Data from 196il to 1967 represent "Contract Construction." Data from 1960 to 1967 exclude sight drafts.
3 ·oata from 1972 include foreign trade. Source of ~ata: Central Bank Of the Philippines.
330
1

SA YIN GS AND DEVELOPMENT BANKS AND
BY INDUSTRY: CY 1960-73
pesos)
Public Banks and Real Utility Services · Trade2 Other F.inan- Estate Consumption
·cing Inst.
65.3 41.1 288.5 71.9 48.3 94.0 112.6 48.9 434.2 1 27.5 58.7 108.6 158.8 63.8 612.5 ·110.5 88.2 104,3 195.8 88.5 900.9 372.7 122.5 151.0 164.3 96.3 1,002. I 572.3 156.0 163.4 156.9 85.8 998.8 651.4 144.9 147.2
256.0 163.5 1,039.5 805.4 226.9 207.5 226.3 170.9 1,409.0 830.7 325.5 242.5 280.9 253.2 2,955.7 1,516.3 383.8 228.9 21 I :8 265.5 3,216.0 1,738.9 364.8 331.9 315.0 368.5 3,379.0 · 2,801.5 497.6 874.8
470.7 497 .. 3 4,373.7 4,932.0 683.2 1,169.6 821.8 551.7 13,872.9. 4,920.5 717.2 880.2 871.3 595.1 22,380.2 5,777.1 977.1 980.1 --
92.0 48.2 1,382.2 . 369.5 56.3 86.8 77.2 42.7 1,332.4 454.8 52.5 69.0 75.3 46.4 1,675.7 297.8 82.9 74.2 90.2 43.6 1,477.7 334.7 41.5 62.6 91.1 42.2 1,778.9 365.0 65.1 118.5
107.0 50.5 1,652.8 485.1 85.9 75.4 75.9 36.3 1,802.2 350.5 65.8 84.9 48.4 52.9 2,348.8 368.2 64.3 . 73.6 64.8 52.4 1,867.0 472.1 67.6 76.2 56.4 48.6 2,386.1. 726.4 114.4 73.0 44.6 54.9 2,366.1 664.3 129.2 82.0 48.4 76.4 2,310.3 888.7 151.6 103.9
331

Table I 0.10 - TOTAL ASSETS AND TOTAL LIABIL (In million
Central Bank Commercial Banks Savings Banks End of Period Total Total Total Total Total Total
Assets Liabilities Assets Liabilities Assets Liabilities
1949 · 793.6 777.1 1,008.8 934.2 7.6 6.6 l 1950 969.5 949.6 1,124.0 1,034.5 8.7 7.5
1951 943.4 915.9 1,117.1 1,01 I .4 9.5 8.1 1952 923.0 893.8· 1,186.4 1,071.6 I I. I 9.4
' 1953 900.0 867.4 1,247.7 1,134.4 13.4 . 11.4
i 1954 899.7 867.8 1,224.6 1,080.9 18. I 15.8 1955 966.4 932.5 1,412.9 1,254.9 25.2 22.5
I 1956 1,160.3 1,124.0 1,833.8 1,656.1 37.3 33.2 1957 1,285.8 1,240.2 1,886.1 1,683.5 43.6 38.5 1958 1,546.3 1,491.0 2,012.4 1,793.2 SO.I 43.8 1959 1,758.6 1,621.4 2,224.2 1,982.1 59.3 5 I .4 1960 1,948.3 1,637.2 2,336.8 2,052.9 71.6 61.6
1961 2,729.4 2,344.5 3,412.0 3,038.7 50.2 43.8 1962 2,376.8 2,080.7 4,076.6 4,515.3 71.1 59.3 1963 2,380.9 2,146.4 5,321.7 4,710.4 97.4 84. I 1964 3,749.5 2,530.2 5,928.9 5,191.8 145.6 123.2 1965 3,096.6 2,866.9 6,731.0 5,902.7 201.4 173.3
, 1966 . 3,373.3 3,131.1 7,631.3 6,691.7 297.3 262.8 1967 4,265.4 3,970.9 9,634.6 8,592.0 410.8 363.8
·t968 4,5 I 6.5 4,230.8 10,910.6 9,770.4 496.8 428.8 1969 5,111.3 4,837.0 12,049.7 10,755.5 579.2 510.4 1970 6,003.2 5,731.5 14,066.1 12,595.4 724.4 648.6
1971 6,912.6 6,620.8 16,054.0 14,384.1 856.5 770.3 1972 9,41"4.3 9,073.7 19;997.8 18,013.0 862.9 767.0
1973 14,744.7 14,433.2 29,940.3 27,047.1 1,003.8 892.2 ~ 1st Quarter 12,511.6 12,270.8 21,443.0 19,333.8 885.J 783.6 , 2ndQuarter 12,969.9 12,655.2 23,480.3 21,278.0 906.7 803.4 3rd Quarter 13,299.0 12,901.9 26,047.9 23,525.6 944.2 838.9 4th Quarter 14,744.7 14,433.2 29,940.3 27,047.1 1,003.8 892.2
1974 1st Quarter 15,997.3 15,660.5 32,344.7 29,174.0 1,002.2 ·887.5
l Exclude! other liabilities. n.a. - Data not available, Source of data: Central Bank of the Philippines, 1972 Sratisticai BulletirL
332

f !TIES, BY INSTITUTIONS: 1949-lst QUARTER 1974 pesos)
~ Rural Banks DeveloEment Banks Postal Savin~ Banks Total Total Total Total Savings Liabilities1
~ Assets Liabilities Assets Liabilities Deposits
' 34.6 31.6 31.6 29.8
- 33.0 29.8 34.3. 30.5
2.4 0.3 497.8 161.7 37.5 33.1 4.4 0.8 538.l 210.3 38.9 33.9 7.9 2.1 560.9 221.1 41.1 35.4
18.4 6.8 585.i 235.6 44.3 38.5 34.8 15.2 591.0 242.7 48.0 41.6 50.0 24.9 553.1 249.2 48.5 42.0 61.2 30.7 565.6 264.8 53.3 44.5 · 76.3 39.6 624.5 319.l 56.0 46.0
I 05.3 57.9 904.5 580.0 60.7 49.8 140.4 76.8 992.8 660.7 72.1 59.1 185.5 105.6 1,100.0 749.0 74.7 60.4 245.8 143.8 1,217.4 837.7 77.6 61.4 279.0 157.4 1,346.2 954.5 85.7 66.4
323.3 186.4 1,599.7 993.9 80.2 61.0 408.8 250.6 1,977.2 1,352.2 82.7 59.8 468.7 287.I 2,346.2 1,684.4 86.5 59.1 · 562.9 359.1 2,832.8 2,146.0 88.2 57.7 655.0 428.7 3,219.0 2,516.6 87.8 57.6
783.6 528.2 3,828.7 3,092.8 87.2 56.5 982.3 694.4 4,752:1 3,977.4 87.9 52.0
1,382.3 1,059.9 5,267.2 . 3,165.8 83.2 40.8 n.a. n.a. 4,823.1 4,029.9 84.5 48.5
1,126.2 821.9 4,862.7 2,834.5 84.1 46.1 1,291.3 976.3 5,178.2 3,093.8 83.9 43.5
· 1,38~.3 1,059.9 5,267.2 3,165.8 83.2 40.8
n.a. n.a. n.a. n.a. 81.1 36.5
333

End of Period
1949 1950 1951 1952 1953
1954 1955 1956" 1957 1958
1959 1960 1961 1962 1963
1964 1965 1966 1967 1968
Table I 0.11 - DEMAND, SAVINGS AND TIME DEPOSIT
(In mi)lion
Commercial Banks Savings
Rural Banks Bank
Savings Savings Savings Demand and Time and Time Demand and Time
455.0 278.0 6.5 566.9 288.I 7.4 "457.8 283.2 7.9 520.5 302.9 9.2 520.6 377.0 11.0 0.0
454.2 355.0 15.2 0.3 . 513.2 452.8 22.0 0.7
739.3 531.8 30.3 0.1 2.1 709.4 619.3 37.9 0.3 6.4 740.7 7_11.8 43.1 0.3 10.9
775.5 817.6 50.5 0.8 17.3 774.9 957.1 60.4 0.9 23.8 972.8 1,376.5 43.0 1.2 32.6
1,152.2 1,851.7 58.5 1.8 39.5 1,357.7 2,289.7 82.8 2.4 52.6
1,259.8 2,350.5. 119.2 2.2 62.5 1,545.7, 2,456.4 168.6 3.5 75.2 1,521.4 3,140.6 257.2 4.1 96.5 1;756.5 3,872.3 350.4 4.7 135.5 1,861.6 4,072.2 343.2 4.4 163.5
Source: Central Bank of the Philippines.
334
, ~
◄ r,

LIABILITIES OF BANKS CY 1949-March 1974
pesos)
Developmen r Banks Postal Savings Total
Savings Savings Demand
and Time
31.6 455.0 29.8 566.9 29.8 457.8 30.5 520.5 33.I 520.6
33.9 454.4 35.4 513.2 38.5 739.4 41.6 739.4 42.0 741.0
44.5 776.3 0.6 46.0 775.8
10.7 49.8 974.0 21.1 59.1 1,154.0 30.5 60.4 1,360.1
33.1 61.4 1,262.0 34.1 66.4 1,549.2
- 82.3 61.0 1,525.5 173.2 59.8 1,761.2 263.9 59.1 1,866.0
335
Total Savings Total
and Time
316.1 771.1 325.3 892.2 320.9 778.7 342.6 863.1 421.1 941.7
404.2 858.6 510.9 1,024.1 602.7 1,342.1 705.2 1,414.9 807.8 1,548.8
929.9 ·1 ,706.2 1,087.9 1,863.7 1,512.6 2,486.6 2,029.9 3,183.9 2,516.0 3,876.1
2,626.7 3,888.7 2,800.7 4,349.9 3,637.6 5,163.1 4,591.2 6,352.4 4,901.9 6,767.9

J
11
I
Table 10.11- DEMAND, SAVINGS AND TIME DEPOSIT
(In million
Commercial Banks Savings
Rural Banks Bank
End of Period Savings Savings Savings Demand Demand and Time · and Time and Time
1969 2,372.2 4,386.6 425.0 5.6 196.0 1970 2,458.9 5,226.8 557.8 7.7 252.7 1971 2,915.9 6,299.0 670.8 8.5 324.1 1972- · 3,735.4 7,228.6 652.8 9.oa 377.5 1973 5,276.4 9,909.6 811.7 14.4 626.5
January 3,505.7 7,389.7 647.2 n.a. n.a. February 3,651.4 7,491.2 659.9 n.a. n.a. March 3,805.2 7,955.6 679.9 n.a. n.a. April 4,036.4 · 7,742.3 679.I n.a. n.a. May 4,105.8 7,972.4 683.3 15.0 470.3 June 4,278.8 8,491.7 712.2 14.9 529.2 July 4,442.2 8,338.4 739,0 14.7 569.9 August 4,315.5 8,856.4 758.2 12.2 601.4 September 4,675.7 9,242.4 781.6 13.0 611.6 October 4,462.8 9,246.3 781.6 13.1 · 616.7 November 4,392.7 9,170.6 784.1 12.4 614.4 December 5,276.2 9,909.6 811.7 14.4 626.5
1974 January 4,835.6 9;398.3 816.4 14.4 631.2 February 5,129.4 9,607.2· 834.6 n.a. n.a. March 5,270.3 10,032.2 840.2 · n.a. n.a.
n.a. - Data not available. 8 As of July 1972.
!Excludes rural banks. 2Excludcs development banks. 3E~cludes rural banks and dcvelop~ent banks.
336
, ~
(
~ j

I
' LIABILITIES OF BANKS: CY 1949-MARCH 1974 (Continued)
pesos)
Developn\ent Postal Savings Total Total Banks
Savings Savings Demand · Savings and Time
and Time
I 316.5 57.7 2,377.8 5,381.8 324.6 57.6 2,466.6 6,4 I 9.5 418.2 ·56.5 2,924.4 7,768.6 538.2 52.0 3,744.4 8,849.1 772.7 40.8 5,290.6 12,161.3 544.2 51.3 3,505.7 8,632.4 543.J 49.9 3,651.4 8,744.1 548.9 48.5 3,805.2 9,232.9 539.2 47.1 4,036.4 9,007.7 548.2 45.4 4,120.8 9,719.6 546.8 · 46.1 4,293.7 10,326.0 547.2 '45.4 4,456.9 10,239.9 651.8 44.3 4,327.7 10,912.1 762.1 43.5 4,688.7 11,441.2 785.5 42.4 4,475.9 11,472.5 872.0 41.5 4,405.1 I 1,482.6 772'.7 40.8 5,2_90.6 12,161.3
n.a. 39.6 4,850.0 I 0,885.5 n.a. 38.4 5,129.4 10,480.2 n.a. 36.5 5,270.3 I 0,908.9
337
Total
7,759.6 8,886.1
10,693.0 12,593.5 17,451.9 12,138.1 1
12,395.51
13,038.J 1
13,044.1 13,840.4 14,619.7 14,696.8 15,239.8 16,129.9 15,948.4 15,887.7 17,451.9 ,
15,735.5 2
15,609.63
16,179.23

Table I 0.12 - INTEREST RA TES ON SAVINGS AND TIME DEPOSITS:
I 965-70
-I Date of Interest Commercial Savings Rural pevelopment Postal Savings & Cooperative ' Rate Change Banks Banks Banks Banks Savings Loans Banks
Banks Association
January 20, 1965 Savings 4.00 4.50 4.50 4.50 4.00 4.00 4.50 Tirric 4.50-5.00 4.75-5.00 4.75-5.00 4.75-5.00 3.50-4.50 4. 75-5.00
March 2, 1965 ' 1 Savings 4.00 4.50 4.50 4.50 4.00 4.50 4.50 Time 4:25-5.00 4.75-5.00 4.75-5.00 · 4. 75-5.00 4.75-5.00 4.75-5.00
November I 0,. I 965 Savings 5.75 5.75 5.75 5.75 4.00 5.75 5.75 Time 5.75-6.50 5.75:6.50 5.75-6.50 5.75-6.50 5.75-6.50 5.75-6.50 ' -
June 14, I 966 Savings 5.75 5.75 5.75 5.75. 4.00 5.75 5.75 Time 5.75-6.50 5.75-6.50 5.75-6.50 5.75-6.50 5.75-6.50 , 5.75-6.50
June 6, 1967 Savings 5.75 5.75 , 5.75 5.75 4.00 5.75 5.75 Time 5.75-6.50 -5.75-6.50 5.75-6.50 5.75-6.50 5. 75-6.50 5.75-6.50
April 16, 1969 Savings 6.00 6.00 6.00 6.00 4.00 6.00 6.00 Time 6.50-7.00 6.50-7.00 6.50-7.00 6.50-7.00 6.50-7 .00 6.50-7.00
February 21, 19701
Savings 6.00 6.00 6.00 6.00 4.00 6.00 6.00 Time 6.50-8.00 6.50-8.00 6.50-8.00 6,50-8.00 6.50~8.00 6.50-8.00
1 Thi: 1970 sche~ule of rates is still enforced up to the present., ' Source of data: Central Bank. of the Philippines, Philippine· Financial Statistics, Quarterly Bulletin.
' ◄ ' I
338

(
I -f Table 10. I 3 - FINANCIAL CONDITION OF THE GOVERNMENT SERVICE INSURANCE SYSTEM:
' FY !953-54'TO FY 1.972-73
~ (Cumulative statements in million pesos)
i Tot a I Assets '
~ Fiscal
Life Retirement Property ~ Life Year Per Cent Insurance Insurance Insurance Total Increase Insurance
Fund Fund Fund Fund
1954 100.0 102.6 4.3 206.9 88.6 1955 105.5 125.2 4.6 235.3 13.73 95.7 1956 I 16.2 144.0 5.9 266.1 13.09 108.7 1957 I 23.7 189.6. 7 .1 320.4 20.41 114.5 1958 139 .. 5 236.8 6.6 382.9 I 9.51 129.7 1959 ']59.3 285.8 I 0.3 455.4 18.93 149.0 1960 I 180.4 998.6 13.2 1,192.2 161.79 170.0
1961 209.9 947.9. 15.2 1,173.0 · (1.61) 197.9 19,62 246.4 909.0 18.3 1,173.7 0.06 226.7 1963 283.7 9843 25.5 1,293.5 10.21 259.6 1964 322:3 1,090.5 26.9 1,439.7 11.30 293.1 1965 373.3 I ,214.4 35.1 1,622.8 12.-72 . 341.8
1966 439.4 1,331.2 34.9 1,805.5 11.26 386.5 1967 49\.2 1,459.3 39.2 1,989.7 10.20 452.6 1968 563.1 1,634.5 41.6 2,239.2 12.54 514.6 1969 664.1 1,79'6.9 49.7 2,510.7 12:12 580.3 1970 710.4 1,904.7 52.7 2,667.8 6.26 637.9
1971 788.6 2,062.4 54.0 2,905.0 8.89 712.0 1972 1,039.0 2,288.8 63,0 3,390.8 16.72 789.6 1973 1,029.2 2,453.5 131.9 3,614.o 6.60 870.6
Source of data: .Annual Report of the GSIS for several years.
\
339 I

Table JO.I 3 - FINANCIAL CONDITION OF THE GOVERNMENT SERVICE INSURANCE SYSTEM: FY 1953-54 TO FY 1972-73 ( continued)
(Cumulative statements in million pesos) ·
Tot a I Reserves Free Sur p I u·s
Fiscal Retirement Property Per Cent Life Property Per Cent , j Year Insurance Insurance Total Increase Insurance Insurance Total Increase Fund Fund Fund Fund
j
1954 99.9 2.5 191.0 3.1 I.I 4.2
t 1955 124.0 2.8 222.5 16.49 2.5 0.4 2.9 (30.95) 1956 143.5 3.5 255.7 14.92 3.3 0.6 3.9 34.48 1957 189.4 3.9 307.8 20.38 4.3 1.2 5.5 41.03 1958 233.5 2.3 365.5 18.75 4.8 1.3 6.1 10.91 1959 285.2 4.9 439.1 20.14 6.0 0.8 6.8 11.48 1960 997.7 7.2 1,174.9 167.57 6.3 1.0 7.3 - 7.35
1961 946.0 8.3 1,152.2 (1.93) 7.0 1.3 8.3 13·_70 1962 906.2 8.2 1,141.1 (0.96) 10.5 2.9 13.4 61.45 1963 982.0 10.3 1,251.9 9.71 15.2 3.4 18.6 38.81 1964 1,082.3 10.7 1,386.1 10.72 19.9 4.3 24.2 30.11 1965 1-,195.4 10.7 1,547.9 11.67 20.2 4.9 25.1 3.72
1966 1,306.8 13.0 1,706.3 10.23 ~
23.8 6.9 30.7 22.31 1967 1,424.7 13.2 1,890.5 10.80 27.7 9.7 37.4 21.82
.~ 1968 1,572.9 13.2 2,100.7 11.12 29.9 13.6 43.5 16.31 1969 1,729.4 13.1 . 2,322.8 10.57 31.2 17.5 48.7 11.95 1970 1,886.4 13.4 2,537.7 9.25 37.7 16.6 54.3 11.50
1 1971 2,043.1 14.2 2,769.3 9.13 38.1 13.5 51.6 (4.97) 1972 2,264.6 19.1 3,073.3 10.98 25.2 9.6 34.8 (32756) 1973 - 2,418.9 54.0' 3,343.5 8.79 26.2 32.9 59.1 69.83
~
340
/

Table 10.14 - CASH COLLECTIONS OF THE GOVE!UsMENT SERVICE INSURANCE SYSTEM:
- Fiscal Year
1961-62 1962-63 1963-64 1964-65
I 965-66 19(i6-67 1967-68 1968-69 1969-70
1970-71 1971-72 1972-73
FY 1961-62 TO FY 1972-73 . {In million pesos; annual increase in per cent)
Annual Increase
15.47 24.09 31.37
16.15 40.33
5.69 14.32 30.83
9.71 21.02 (9.01)
Total
227.6 262.8 326.1 428.4
497.6 698.3 738.0 843.7
1,103.8
1,211.0 1,465.5 1,333.4
• Insurance Premiums
117.0 I 39. I 166.3 185.6
206.1 255.0 252.7 334.2 359.1
386.5 483.8 520.8
Bills Receivables
12.1 4.0
13.1 12.4
7.0 11.3 12.4 21.9 20.7
. 33.6 85.7 45.4
Source of data: GSJS - Annual Report for several years.
341
'-
Fire Insurance Premiums
I. I 1.7 5.1 1.5
3.5 4.7 6.8 3. I 7.8
5.3 6.9
14. l

Table 10.14 - CASH COLLECTIONS OF TiiE GOVERNMENT SERVICE INSURANCE SYSTEM: FY 1961-62 TO FY 1972-73 (continued)
(In million pesos; annual increase in per cent) ~
◄ Bills/Receiv•
Repayment able Discount· Interest Interest on ed & Short •· Other ,
Fiscal Year · on on Premium Loans Term Place· Investments Arrearages Sources ◄
ment
J
1962 71.4 16.4 9.6 ~ 1963 89.8 20.1 8.1 1964 105.9 19.9 0.1 15.7 1965 133.5 37.2 26.8 0.6 30.8
\ 1966 158.0 19.6 38.4 1.0 64.0 1967 227.7 21.5 58.9 1.3 117.9 1968 282.2 2.2 60.9 1.7 I I 9.1
/ 1969 263.7 51.7 2.7 166.4 1970 386.2 77.9 2.2 249.9
- 1971 521.9 0.1 77.8 2.7 183.1 1972 392.9 83.7 105.8 3.9 302.8
• 1973 394 .. 5 38.8 118.6 6.4 194.8
~
1 . '
' 342 1
4

Table I 0.15 - BENEFIT PAYMENTS OF THE GOVERNMENT SERVICE
~ INSURANCE SYSTEM: FY 1953-54 TO 1972-73
(In million pesos; annual increase in per cent) ,. I
Life Retirement Property Miscellaneous Annual Fiscal Year Medicare Insurance Insurance Insurance Dividend & Total Increase
Fund Fund Fund Pension
1953-54 9.5 3.2 1.5 2.6 16.8 1954-55 9.1 4.9 1.2 2.8 18.0 7.14 1955-56 10.0 6.6 1.4 3.3 21.3 18.33
· 1956-57 I I.I 10.6 2.7 2.9 27.3 28.17 1957-58 11.4 15.0 3.8 3.3 33.5 22.71 1958-59 12.8 15.1 5.6 4.4 37.9 I 3.13, I 959-60 ,- 14.6 12.8 4.9 4.5 36.8 (2.90) I 960-61 I 5.7 25.8 8.0 4.9 54.4 47.83 I 961-62 16.4 28.3 8.7 6.4 59.8 9.93 1962-63 18.2 31.3 10.7 8.9 69.1 15.55 1963-64 20.9
133.8 10.8 13.0 78.5 13.60
1964-65 23.6 36.5 14.8 16.3 91.2 16. I 8 1965-66 29.0 46.2 13.6 ,19.5 108.3 18.75 1966-67 34.9 53.3 • 12.7 22.7 123.6 14.13 1967-68 43.9 5,2.9 14.8 24.6 136.2 I 0. I 9 1968-69 50.6 78.9 12.7 . 26.8 169.0 24.08 1969-70 56.6 85.6. 12.5 28.7 183.4 8.52 1970-71· 63.5 126.6. 14-.5 3 I. 7 236.3 28.84 1971-72 74.4 121.3 16.0 36.9 248.6. 5.21 1972-73 16.9 98.4 199.3 31.8 72.2 418.7 68.42
- not available.
Source of data: Annual Report of the GSIS for :r.evcral years.
/
343 ,

Table 10.16 - GROWTH OF COVERAGE OF THE GOVERNMENT SERVICE INSURANCE SYSTEM: FY 1953-54 TO 1972-73
' (Cumulative figures in million pesos; annual increase in per cent)
Life . General Mortgage Salary Loan Total Annual Fiscal Year Insurance (Property) Redemption Redemption Coverage Increase
Insurance Insurance Insurance
1953-54 322.2 299.8 622.0 1954-55 364.9 374.5 739.4 18.87 1955-56 403.6 491.I .- 894.7 21.00 I 956-57 494.3 718.5 1,212.8 35.55
· 1957-58 544.0 790.J 12.0 40.3 1,386.4 14.31 · 1958-59 585.7 803.7 24.4 44.5 1,458.3 5.19
1959-60 629.3 922.1 36.6 49.6 ·1 ,637 .6 12.30 1960-61 719.2 1,371.7 50.5 89.3 2,230.7 36.22 1961-62 776.8 1,711.2 57.9 103.7 2,649.6 18.78 I 962-63 880.0 1,802.2 65.9 115.4 2,863.5 8.07 1963-64 1,031.0 I 1,917.0 73.4 136.4 3,157.8 1_0.28 1964-65 1,295.3 2,129.1 89.8 157.4 3,671.6 16.27 1965-66 1,548.6 2,456.2 106.9 172.2 4,283.9 . 16.68 1966-67 1,748.6 2,290.4 129.6 233.8 4;402.4 2.77 1967-68 1,968.1 2,949.0 162.7 258.4 5,338.2 21.26 1968-69 2,147.0 2,310.1 190.9 269.9 4,917.9 (7 .87) 1969-70 2,3 I 2.8 2,431.4 . 228.4 298.9 5,271.5 7.19 1970-71 2,510.5 2,366.8 285.7 393.3 5,556.3 5.40 1971-72 2,714.4 3,431.8 348.2 368.J 6,862.5 23.51 1972-73 2,919.1 5,830.8 454.1 346.2 9,550.2 39.17
- not available. Source of dala: Annual Report of the GSI~ for several-years. -
344
l
~
1
~
1
1 •

Table 10.17 - TREND OF INVESTMENTS OF THE GOVERNMENT SERVICE INSURANCE SYSTEM: FY 1953-54 TO 1972-73
(In million pesos)
Salary Policy Real Estate Stocks & Investments Fiscal Year Loans Loans Mortgage Bonds Thru DBP Miscellaneous Total
Loans
1953-54 7.5 9.4 11.4 26.2 49.1 8.8 112.4 I 954-55 31.8 14.8 20.6 52.9 32.3 8.6 161.0 1955-56 33.5 18.7 54.0 89.2 3.0 I 1.0· 209.4 1956-57 38.1 22.0 97.7 92.3 2.3 21.0 273.4 1957-58 40.3 24.1 163.4 . 41.6 31.4 1.4 302.2 I 958-59 44.5 27.9 177.0 67.6 33.0 1.3 351.3 1959-60 49.6 31.9 177.8 126.5 34.9 0.7 421.4 1960-61 89.3 36.9 202.7 138.5 36.7 1.5 505.6 1961-62 103.7 41.8 232.4 164.5 38.5 5.8 586.7 1962-63 115.4 47.2 249.6 199.7 41.3 4.4 657.6 1963-64 136.4 53.8 289.1 236.8 43.6 39.1 798.8 1964-65 15_7.4 64.0 430.6 248.2. 45.7 38.4 984.3 1965-66 172.2 75.8 559.5 290.0 25.8 1,123.3 1966-67 233.8 91.5 657.1 266.2 19.2 1,267.8 1967-68 258.4 I 08.3 758.2 298.1 23.0 1,446.0 1968-69 269.9 131.4 859.6 358.6 22.8 1,642.3 1969-70 298.9 156.3 1,005.7 370.5 22.6 1,854.0 1970-71 393.3 177.9 1,076.6 ,334.0 23.5 2,005.3 1971-72 368.1 202.5 1,343.5 · 346.1 - 92.7 2,352.9 -1972-73 346.2 229.2 1,517.1 338.0 137 .1 "2,567.6
- not available.
Source of data: .A.mwal Report of.GSIS for several years .
•
345 ,

Table I 0.18 - PROGRESS OF OPERATIONS OF THE SOCIAL SECURITY SYSTEM: CY 1957-73
(Amount in million pesos; annual_ increase i:1 per cen_t)
Calendar Constribution 1 Annual Benefit Annual Loading Income on Years-End Year Increase Payments Increase Fund Reserve Reserves
1957 6.6 0.1 0.5 6.1 1958. 26.9 307.58 0.8 700.0 1.9 0.5 30.8 !
1959 39.0 44.98 1.9 137.50 2.7 2.4 67.6 l 1960 45.9 17.69 4.1 115. 79 3.0 3.7 110.1 1961 59.2 28.98 6.3 53.66 4.6 6.0 164.5 1962 65.2 I 0.14 9.0 42.86 5.2 8.7 224.2 1963 74.9 14.88 11 .4 26.67 7.0 12.6 293.2 1964 85.9 14.69 14.7 28.95 9.2 16.8 371.9 19.65 97.4 · 13.39 14.4 (2.04) 10.0 20.5 465.5 1966 114.8 17.86 I 8.3 . 27.08 13.4 28.4 577.0 1967 123.8 . 7.84 28.3 54.64 18.9 36.6 690.1 1968 140.9 13.81 37.7 33.22 20.9 41.1 814.6 1969 · I 51.9 · 7.81 43.7 15.92 22.5 53.3 953.7 1970. 168.8 I LI 3 49.0 12. I 3 24.8 67.4 1,116.2 1971 202.0 19.67 ·55_2 12.65 28.4 81.3 1,315.9 1972 226.4 12.08 64.1 16. I 2 31.0 101.6 1,548.8 1973 382.6 68.99 90.8 41.65 46.l 130.6 1,925.0
I Pursuant to Presidential Decree No. 24, an increase in SSS contribution from 6 per cent lo 7 pCr cent of the monthly _ salary credit took effect January 1, 1974:
Source of data: Annual R~port of the Social Security System for se\'cral years.
•
.-
346

Table I 0.19 - ASSETS, INVESTMENTS AND EARNINGS OF THE SOCIAL SECURITY SYSTEM: CY. 1957-73
(Amount in million pesos; annual increase in per cent)
Annual Year-End Yearly Calendar Year
Year-End ~nnual Assets Increase Investments Increase Earnings
1957 ·6.4 6.0 1958 31.3 389.06 28.2 370.00 0.5 1959 68.2 117 .89 66.2 134.75 2.3 1960 110.7 62.32 108.5 63.90 3.6 1961 165.7 49.68 158.6 46.18 6.0 1962 225.2 35.91 212.9 34.24 8.6 1963 295.2 31.08 275.4 29.36 12.3 1964 376.9 27.68 348.9 26.69 16.3 1965 471.8 25.18 428.8 22.90 19.5 1966 583.5 . 23.68 534.2 24.58 27.4 1967 · 696.3 19.33 596.6 11.68 32.9 1968 820.6 17.85 780.8 30.87 40.5 1969 963.2 17.38 919.7 17.79 52.0 1970 1,128.2 17. l 3 1,085.5 18.03 66.4
. l 971 1,330.6 17.94 1,265_-8 l 6.61 79.3 1972 1,572.3 18. l 6 1,519.2 20.02 99.4 1973 1,949.2 23.97 1,890.5 24.44 128.6
Sotlrce of data: Annual Report of the Social Security System for several years.
347
Annual Increase
360.00 56.52 66.67 43.33. 43.02 32.52 19.63 40.51 20.07 23.10 28.40 27.69 l 9.43 25.35 29.38

Table 10.20 - INVESTMENT PORTFOLIO OF THE SOCIAL SECURITY SYSTEM: CY 1965-73
(In million pesos)
1965 ,] 966 1967 1968 1969 1970 1971
' Time/savings deposits 70:5 151.4 149.l 202.5 254.9 64.5 55.0 PNB/DBP notes receivable 2 I 9.4 232.9 Treasury notes/bills 80.0 51.2 9.3 35.o 109.0 Government bonds 41.2 41.3 43.4 75.2 I 16.2 114. 7 I I 3.7 National Orthopedic
Hospital 2.8 2.4 2.4 2.2 1.9 1.8 1.6 _Real estate housing loans 135.5 175.9 212.1 243.7 361.4 449.6 539.3 Salary/educational loans 19. I 36.2 55.3 68.9 90.6 I I 5. I 130.6 Investment incentive loans 0.4 2.3 3.2 Community hospital loans 1.4 4.6 7.0 ·Commercial/industrial
loans 50.9 40.3 89.4 143.9 54.5 49.9 46.5 Preferred/common stocks 15.9 21.4 23.0 31.4 27.0 24.3 23.8 Corporate bonds 12.9 12.6 11.2 10.6 . 8.5 4.3 3.2 Notes discounted 1.5 1.4 2.4 2.9
1972 1973
40.2 12. 7 319. I 564:1 300.0 332.3 107.7. 110.0
1.6 1.2 536.l 595.5 133.8 164.6
3:0 3.9 9.4 , I 1.2
44.4 69.5 21.2 22.8 2.7 2.7
Total 428.8 534.2 596.6 780.8 919.7 1,085.5 1,265.8 1,519.2 1,890.5
- not available.
Source of data: Annua'l Report of the Social Security.Sy.stem for sc,·eral years.
348
l

Table 10.21 - STATEMENT OF LOANS AND EQUITIES APPROVED AND TOTAL RESOURCES OF THE DEVELOPMENT BANK OF THE PHILIPPINES: FY 1952-53 TO 1972-73
(Amount in million pesos; annual increase in per cent)
Fiscal Year
1952-53 1953-54 1954-55 1955-56 1956-57
1957-58 1958-59 1959-60 1960-61 1961-62
1962-63 1963-64 1964-65 1965-66 1966-67
1967-68 I '>68-69 1969-70 1970-71 1971-72
1972-73
- not available.
Agricultural Loans
25.0 24.3 20.7 26.6 23.7
27.6 27.2 37.1 42.4 40.4
37.2 51.3 53.5 42.1 76.9
135.4 97.7 70.5 24.2 54.6
109.5
'
Industrial
Loans
36.4 25.7 23.8 19.9 38.5
29.3 21.8 79.4
155.6 360.2
152.0 186.5 107.5 42.1
271.3
269.7. 195.2 341.4
8.9 61.4
55.2·
Real Estate Loans
54.0 38.7 27.1 27.1 37.0
18.9 . 2.1
3.1 6.5 8.7
9.6 14.7
· 15.9 7-5
22.2
36.7 59.2 22.7
9.0 21.8
38.3
Source of data: .Annual Report of the DBP for several years.
349
,
Govem- · Landed ment Estate Loans Loans
2.4 4.3 4.0 0.4 5.7 0.5 3.2
2.4 3.0 3.7 0.2 5.2 2.0 0.5
6.0 17.1 20.9
8.8 24.3
12.4 0.) 14.3 6.8 1.6 8.0
4.9
Subscriptions to_ Capital
Stocks/Rural Banks
0.6 0.9 0.5 1.6 3.4
2.5 0.7 0.9 5.6 5.4
6.6 7.8 6.8 5.4 4.1
7.2 4.8 4.7 1.9 4.3
I 3.1

Table I 0.21 - STATEMENT OF LOANS AND EQUITIES APPROVED AND TOTAL RESOURCES OF THE DEVELOPMENT BANK OF THE PHILIPPINES: FY 1952-53 TO 1972-73 (continued)
i {Amount in million pesos; annual increase in per cent)
Advances & Subscrip- Resources tions to Preferred
Annual Fiscal Capital/ /Common 1 Year Stock Prl- · Stock Total Increase
Bank Trust Annual 1 vate Devel- . Investment Proper . Fund Total Increase
opment Banks
1 1953 118.4 254.0 206.1 460.1 1954 93.9 (20.7) 323.2 217.7 540.9 17.6 1955 76.5 (18.5) 338.5 210.2 548.7 1.4 ~ 1956 81.4 6.4 352.7 217.1 569.8 3.8 1957 105.8 300.0 366.3 229.1 595.4 4.5
1958 80.7 (23.7) 377.5 206.8 584.3 (1.9) 1959 0.5 55.3 (31.5) 392.5 164.8 557.3 (4.6) 1960 8.9 133.3 141.0 437.1 156.1 593.2 6.4 1961 4.5 219.8 64.9 510.6 173.5 684.1 15.3 1962 5.5 422.7 92.3 765.5 167.6 933.1 36.4
1963 10.7 222.1 (47.5) 824.6 171.7 996.3 6.8 1964 18.1 295.5 - 33.0 971.6 147.0 1,118.6 12.3 1965 13.7 218.3 (26.1) 1,080.2 155.0 1,235.2 10.4 1966 9.4 115.3 (47.2) 1,208.7 159.5 1,368.2 10.8 1967 14.3 129.5 542.6 370.6 1,529.8 163.0 1,692.8 23.7
1968 12. I 51.3 524.9 (3.3) 1,944.5 164.4 2,108.9 24.6 1969 13.0 22.9 407.1 (22.4) · 2,270.8 169.8 2,440.6 15.7 1970 8.9 4.5 459.5 12.9 2,645.9 176.2 2,822.1 15.6 1971 6.3 51.9 (88.7) 3,276.5 180.1 3,456.6 22.5 1972 12.0 149.0 3 I I.I 499.4 3,857.6 186.7 4,044.3 17.0
1973 12.6 233.6 (24.9) 4,578.6 124.3 4,702.9 16.3
(
350

Table I0.22 - TOTAL RESOURJ AND LOANS GRANTED BY PHILIPPINENATIONAL BANK: CY 1950-73 (Amount in .million1pesos; hnnual increase in per cent)
• . J,., Gmlod
Calendar lndusttal Commercial Others Year Total Annual Agricultural Total Annual
Resources Increase Increase
1950 438.7 118.6 158.~ 58.7 4.0 339.6 1951 442.8 0.9 146.3 197. 52.6 5.8 402.3 18.5 1952 513.4 I 5.9 · 158.2 147.1 55.9 4.9 366.7 (8.8) 1953 538.0 4.8 I 58.6 125.0 59.0 3.9 346.5 (5.5) 1954 572.3 6.4 150.4 136.8 79.2 6.4 372.8 7.6
1955 691.6 20.8 134.1 201.5 94.8 13.7 444.1 I 9.1 I 9-56 881.4 27.4 166.9 242.5 110.0 9.9 529.3 19.2 1957 790.5 (I 0.3) 193.1 361.5 166.1 20.8 741.5 40.1 1958 765.3 (3.2) I 81.7 265.9 103.9 11.8 563.3 (24.0) 1959 811.1 6.0 190.3 219.6 103.5 6.2 519.6 (7.8)
1960 837.6 . 3.3 177.1 223.1 111.9 5.6 51°7.7 (0.4) 1961 1,186.2 41.6 261.6 308.6 136.8 67.-3 774.3 49.6 1962 1,192.7 0.5 . 294.1 146.9 362.0 78.3 881.3 13.8 -1963 1,514.4. 27.0 351.6 122.7 396.4 242.0 1,112.7 26.3 1964 1,788.'9 18.1 411.4 138.6 655.0 141.0 1,346.0 21.0
1965 2,390.9 33.7 387.0 158.0 718.0 339.0 1,602.0 19.0 1966 2,372.3 (0.8) 409.6 122.0 391.1 89.1 1,011.8 (36.8) 1967 3,328.9 40.3 521.7 140.0 907.6 143.4 1,712.7 69.3 1968 - 3,471.2 4.3 .493.3 I 32.1 844.1 273.8 1,743.3 1.8 1969 ~.041.8 16.4 482.5 I 67.1 602.9 451.5 1,704.0 (2.3)
1970 4,444.1 10.0 553.0 133.0 643.6 500.4 1,830.0 7.4 1971 4,229.6 (4.8) 672.0 153.7 702.1 465.0 1,992.8 8.9 1972 4,637.6 9.6 585.2 277.7 482.2 765.i 2,110.3 5.9 1973 7,348.2 · 58.4 901.2 991.2 1,386.4 503.6 3,782.4 79.2
Source of data: Annual Report of the Philippine National Bank for sev alyeaJ'!.
351

l J
CHAPTER II
PUBLIC FINANCE
Figure I 1.1 National Government J;:xpenditures, FY 1958-59 to'FY 1972-73 355
Table 11.1 National and Local Government Tax Revenues Classified by Type of Tax: FY 1958-59 to FY 1972-73 356
Table 11.2 National Government Expenditures: FY I 958-59 to-FY I 972-73 358
Table 11.3 Consolidated Statement of Local Government Revenues and Expenditure~: FY. 1958-59 _to FY 1971-72 360
Figure 11.2 Percent Distribution of National Government Expenditures: I 972-73 362
Table 11.4 Expenditures on Infrastructure Program: FY I 966-{;7 to FY 1973-74 363
Table 11.~ Holders of Government Securities: 1957-73 365
Table 11.6 Internal Debt Outstanding Classified by Level of Government and Period Maturity: 1949 to 1st quarter 1974 366
Table 1 H7 External Debt Outstanding Classified 'by Institutional .Source: 1963-73 ' 368
Table 11.8 Total External Debt Outstanding (Disbursement Basis) by Maturity and Type of Borrower: 1963-73 370
I
-

CHAPTER XI
PUBLIC FINANCE
This chapter deals with statistics on public finance as they affect the three principal areas of fiscal policy - revenue. expenditure, and
· public debt. The Central Bank of the Philippines and the Department of Finance are primarily responsible for the computation and tabulation · of statistical series on public finance.
f!ata published include:
( 1) Internal revenue statistics together with statements of receipts _ of the Bureau of Internal Reveque from specific taxes, license and· business taxes, franchise taxes, income taxes, residence taxes, sales taxes, documentary stamp taxes, war profit taxes, estate. inheritance and gift taxes, revenue from public forests, compensating. taxes. and other sources of income; _
_ (2) Customs statistics including statements of receipts of the Bureau of Customs from import duties, tonnage- dues, wharf age fees, and other sources of income; _ · \ _
(3) Revenue and expenditure statistics of the General Fund including statements of revenues of government departrf,ents and_ agencies accruing to the General Fund and disbursements by said departments and agencies based on financial reports submitted by the Budget Commission;
( 4) ~evenue statistics of the national government from all sources and expenditures for education, defense, economic development, social welfare, administration, and the servicing of public debt, based on financial reports submitted by the Commission on A~dit.
(5) Statistics on public debt including statements on the amount of debt by all levels -of government classified as to origin (internal or external), by period of maturity (short-term, middle-term,. long-term) as to government level (national, local or government corporation). The principal sources of these data are the trial balances, books of accounts and reports of the Bureau of the Treasury, Commission on Audit,
' National Economic and Development Authority, Development Bank of the Philippines and government corporations; and
(6) Statistics on the cash reserves of the national government including statements on the aggregate revenue and receipts from the borrowing operations of the government and total disbursements and treasury balance, conipiled monthly by the Bureau of the Treasury.
354
r

Figure I J.l NATIONAL GOVERNMENT EXPENDITURES: FY I 958-59 TO FY 1972-73 ·
In mi II ion pesos
8,000
7,000
6,000
5,000
4,000
3,000
2,000 ·
1,000
0
TOTAL EXPEND ITU.RES
1959 '60 '61' '62 '63 '64 '65 '66 '67 '68 '69 '70 '71 '72 '73
Leg en~
~ - Economic Development E'Zm - Social Development - - National Defense llllirlil'I - General Governmeht ·- - De~t Service
}
TO TA L 'CURRENT 0 PERATING EXPENDITURE~
~ - TOTAL CAPITAL EXPENDITURES
355
TOTAL CURRENT OPERATING' EXPENDITURES
TOTAL CAPITAL. EXPENDITURES

Table I I.I - NATIONAL AND LOCAL GOVERNMENT TAX ; ,<in million
1958-59 1959-60 1960-61 1961-62 1962-63 1963-64
NATIONAL GOVERNMENT Direct Taxes 191 217 243 260. 325 355
Income taxes 178 209 235 250 312 342 Corporations 160 188 212 195 235 247 Individuals 18 21 23 54 76 92 Fines and penalties n.a. • • I I I Miscellaneous • • n.a. • n.a. 2
Amnesty tax n.a. n.a. n.a. n.a. n.a. n.a. 1 Estate, gift and inheritance taxes 6 s s 6 9 8 Residence tax 3 3 3 4 ·4 s
~ Immigration tax 4 • • • • • Real property tax n.a. n.a. n.a. n.a. n.a. n.a.
Indirect Taxes 575 692 735 843. 1,038 1,206 Excise taxes 235 235 227 221 266 341 License and business taxes 149 184 222 274 339 381 ( Import duties 163 240 249 300 373 419 Documentary stamp ta~ 12 12 13 14 18 18 Charges on forest products 7 7 7 11 19 17 Wharf age fees 14 16 IS 18 19 23 Franchise tax I .2 2 2 3 2 Fines and penalties • • • I I I Miscellaneous (6) (4) • 2 • 4 Stabilization tax n.a. n.a. n.a. n.a. n.a. n.a.
LOCAL GOVERNMENT Direct Taxes 67 71 96 119 139 170
Residence taxes 4 4 4 4 s s Taxes on income estate, legacies, inheri-
lance and gifts 6 9 29 46 57 83 . Real property taxes 57 58 63 69 77 82
Alien registration fees • • • • • . . Indirect Taxes 95 105 122 129 147 174
Internal revenue allotment 43 49 58 66 76 94 Taxes on agricultural p_roducts ' 6 s s 4 2 2 Franchise tax 3 3 4 4 s s Advalorem taxes • I • I I I Weights and measures • • • • • • Municipal licenses 42 45 49 52 58 64 Special license tax , • • • • • • Other revenues r 2 6 2 s 8
TOTAL REVENUE FROM TAXATION 928 1,085 1,196 1,351 1,649 1,905 National Government 766 909 978 1,103 1,363 1,561
Direct 191 217 243 260 325 355 Indirect 575 692 735 843 1,038 1,206
Local Government 162 176 218 248 286 344 Direct 67 71 96 119 139 170 Indirect 95 105 122 129 147 174
•Lesa than half of the UJUt employed. n.a. - Data not avallahle. Source: Reports of the ~bmoner on National md Loeal GoYemmenta.
◄
356
1

REVENUES CLASSIFIED BY TYPE OF TAX: FY 1958-59 TO FY 1972-73 pesos)
1964-65 1965-{;6 1966-67 1967-08 1968-09 1969-70 1970-71 1971-72 1972-73
389 392 418 513 681 738 886 1,012 2,~64 380 379 402 495 649 709 846 963 1,689 262 276 272 338 417 438 340 385 1,040 117 102 129 156 ·230 270 SOS 577 647
I I I I 2 I I I 2 n.a. n.a. n.a. • n.a. n.a. n.a. · n.a. n.a. n.a. n.a. n.a. n.a. n.a. n.a. n.a. n.a. n.a. 717
\ 8 12 IS 16 14 16 IS IS 21 I I I I I . I 2 2 I
• • • I I I I I • n.a. n.a. n.a. n.a. 16 11 27 31 36
1,135 1,168 1,498 1,649 1,813 1,988 2,939 · 3,355 3,775 320 323 379 341 393 446 562 539 552 372 414 538 667 711 739 892 1,095 1,138 381 356 497 547 584 613 862 1,087 1,438
18 22 22 26 33 27 34 35 76 16 20 24 23 26 22 35 36 45 24 27 32 36 31 26 58 43 so 3 3 3 4 6 7 9 11 19 I I 1 I I I I I I
• 2 2 4 28 107 378 508 456 n.a. n.a. n.a. n.a. n.a. n.a. 108 n.a. n.a.
191 213 250. 248 271 364 426 574 n.a. 5 11 10 10 12 12 14 22 n.a.
97 105 129 118 147 170 249 320 n.a: 89 97 111 120 112 182 163 230 n.a . • • • • • • • 2 n.a.
195 188 204 248 306 328 368 421 n.a. 106 88 99 128 172 194 204 236 n.a.
I I I I 2 2 2 3 n.a.
6 9 9 8 13 7 IS 23 n.a.
I I I I I 3 4 4. n.a .
• • • • • • • • n.a. 71 76 82 98 105 103 116 126 n.a . • • • • I I 1 • n.a. 10 13 12 12 12 18 26 29 n.a.
1,910 1,961 2,370 2,658 3,071 , 3,418 4,619 5,362 n.a. 1,524 1,560 1,916 2,162 2,494 2,726 3,825 4,367 6,239
. 389 392 418 513 681 738 886 1,012 2,464 1,135 1,168 1,498 1,649 1,813 1,988 2,939 3,355 3,775
386 401 454 496 577 692 794• 995 n.a. 191 213 250 248 271 364 426 574 n.a. 195 188 204 248 306- 328 368 421 • n.a.
357

Table 11.2 - NATIONAL GOVERNMENT (In
,-- Item 1958-59 1959-{;0 1960-{i] ]96J-{i2 1962-63
Total Current Operating Expenditures 832 980 1,064 1,245 1,471
Economic Development 169 219 229 262 325 Agriculture & Natural Resources 55 62 68 74 103· Transportatio'n & Cornmunica-
lions 95 124 129 124 141 Commerce & Industry 8 8 10 AO 51 I Other Economic Development 11 25 22 .24 30 ' Social Development 337 377 453 - 515 606 --Education 257 295 344 404 472 Public Health & Medical Care 64 64 76 90 IOI Labor & Welfare 16 18 33 21 33
National Defense 1.80 187 194 205 268
National Defense 150 15 l 155 159 205 Maintenance of Peace & . Order 30 36 39 46 - 63 I
I General Government 93 119 121 153 178
General Government 62 72 75 JOI 107 Legislative Services 13 14 17 28 36 Administration of Justice 14 15 19 21 25 Pensions &·Gratuities .4 18 · 10 3 10 Debt Service 53 78 67 I-JO 94
Total Capital Expenditures 180 216 347 224 281 -- --Economic Dev·elopmcnt 138 164 267 158 327 --
Agriculture & Natural Resources 40 49 60 30 139 Transportation & Communica-
tions 81 90 136 103 167 Commerce & Industry 5 I 42 15 ·4 Other Economic Development 12 24 '29 10' 17
Social Development 31 38 68 52 39 '◄ Eddcation 18 27 33 29 8
. Public Health & /Jedical Care 13 11 30 20 22
◄ Labor & Welfare 5 3 9
National Defense 3 3 2 I 4 --National Defense 2 2 I 4 ' Maintenance of Peace & Order I I I
General Government 8 11 10 13 j I --General Government 8 8 10 12 5 Legislative Services 3 I 5 Administration of Justice I
TOTAL EXPENDITURES 1,012 1,196 1,4I-1 1,469 1,852 -- -- -- --
Source of data: .Budget Commission, ".Performanc:e Budget .. for sevcra] years.
' 358 ~ j

! EXPENDITURES: FY 1958-59 TO 1972-73 million pesos)
1963-64 1964-65 1965-66 1966-67 1967-68. 1968-69 I 969-70 1970-71 1971-72 1972-73
1,765 1,791 2,020 2,1 SI 2,457 2,940 3,327 3,765 4,377 5,784
373 . 378 393 433 507 596 673 688 776 1lli... 114 114 117 125 137 201 201 200 254 884
166 172 183 209 242 268 245 335 360, 387 --58 54 46 58 72 71 79 58 71 58 35 38 47 41 56 56 148 95 91 120
704 737 845 905 1,003 I ,I so 1,320 1,485 1,700 1,887 -- --566 597 695 758 837 937 1,066 1,205 · 1,360 l ,445 110 114 120 · 118 136 168 204 219 260 328 28 26 30 ' 29 30 45 so 61 80 114
296 294 323 376 449 516 60_5 733 856 !..11L --. 228 223 248 286 336 377 450 531 583 771
68 71 75 90 113 139 I SS 202 273 350 235 280 305 308 338 394 485 502 718 1,327
146 182 190 197 215 241 309 314 371 430 52 SS 54 45 52 69 86 78 92 91 33 40· 48 so 53 63 68 86 105 111 4 3 13 16 18 21 22 24 150 206
157 102 154 129 160 284 244 357 327 489
302 286 208 380 487 671 726 664 1,211 2,157 --264 269 164 317 415 586 6i0 . 589 · ~ 1..211.__
99 64 SI 85 81 IOI 59 I 01 286 409
137 !81 89 199 279 293 441 307 432 801, 9 3 I 2 5 9 17 62 22 2
19 . 21 23 · 31 · 50 183 93 119 373 760 28 12 27 47 44 64 92 54 67 __2J__ -- --16 7 18 42 36 so 66 39 44 64 6 4 8 5 7 14 22 7 22 26 6 I I I 4 8 I 7 2 l l 4 10 9 10 14 23 81 --2 4 9 8 8 12 18 15
I l 2 2 5 6 8 4 i6 12 18 12 14 7· 8 7 --7 4 IS 11 17 10 14 4 7 7
I I 3 I I
2,067 2,077 2,228 2,531 2,944 3,611 4,053 4,429 5,588 7,941 -- -- -- -- -- -- -- --
359

Table 11.3 - CONSOLIDATED STATEMENT OF LOCAL
(In million
1958-59 1959-60 I 960-61 1961-62 1962-63
Revenue-Total Local Government 267 300 357 388 427 - -Revenue from taxation 162 176 218 249 286 .Incidental revenue 25 27 27 29 34 Receipts from operations 34 3~ 43 42 44 Aid from national government _26 36 38 40 35 Aid from city and municipal
government 4 4 5 6 6 _ Loans from national government
and other private entities (pro-vincial government and volun-tary contribution) 3 9 6 7
Other receipts 13 13 18 16 15 Expenditures - Total Local Gov-
ernment 272 301 329 363 416 General administration 130 144 159 170 188 Economic _development 49 56 58 64 71 Social1improvement 46 51 55 61 71 Debt service 5 5 6 6 6 Capital outlays 22 22 28 33 47 Other charges 20 23 23 29 33
Provincial 84 95 99 106 I I 5 General administration 31 35 38 40 43 Economic develorment 26 30 31 33 34 Social improvement 14 15 15 16 18 Debt service I I 2 I I Outlays and other charges 12 14 13 16 19
City 104 I 12 129 140 174 - - ' General administration 52 58 64 69 79 ~ Economic development 12 12 14 16 18 ' Social improvement 27 30 34 37 46 I
Debt service 2 2 2 3 3
~ Capital outlays 9 9 14 13 26 Other charges I I I 2 2
Municipal 84 94 IOI 117 127 -General administration 46 51 57 61 66 , Economic development 11 14. 13 15 19 Social improvement 5 6 6 8 7 Debt service 2 2 2 2 2 Capital outlays 13 13 14 20 21 ; ! Other charges 7 8 9 11 12 (
(
Source of data: Commission on Audit Report of the Commissioner on Local Govc~cnt. for several years.
360

GOVERNMENT REVENUES AND EXPENDITURES: FY 1958-59 TO 1971-72 pesos)
.. 1963-64 1964-65 1965-66 1966-67 1967-68 1968-69 1969-70 1970-71 1971-72
503 567 634 674 741 . 741 999 .1,086. 1,292 -344 386 401 453 496 496 692 794 9·28
38 44 47 51 54 54 64 69 74 51 · 52 60 65 69 69 76 83 88 36 46 61 43 68 68 88 68 110
.7 8 8 7 11 11 20 24 29·
4 7 25 12 12 12 6 4 9 23 24 32 43 · 31 31 53 44 · 54
510 541 638 698 757 817 933 1,033 1,264 -224 251 286 308 339 378 417 490 604
90 102 118 118 142 153 180 191 240 \. 86 75 86 102 112 109 144 143. 168 7 7 11 10 12 15 14 · 17 16
60 58 78 111 88 85 90 96 118 44 48 59 49 64 77 88 96 118
146 .161 185 175 201 241 280 290 348 54 58 62 61 70 76 87 96 115 42 48 54 55 65. 80 93 100 117 23 25 30 · 29 33 35 43 39 47
I I 2 3 4 5 5 5 5 26 29 37 27 29 45 52 50 64
214 209 254 338 337 332 359 389 451 -93 105 122 145 155 170 182 205 249 23 25 30 36 38 36, 39 45 55 54 41 45 61 64 58 77 77 86 3 3 7 5 5 7 5 8 8
37 32 45 86 61 53 47 43 43 4 3 5 . 5 14 8 9 10 10
150 171 199· 185 219 244 294 354 465 77 88 102 102 114 132 148 188 240 25 29 34 27 39 37 48 46 68 9 9 11 12 15 16 24 27 35 2 3 2 2 3 3 4 4 3·
23 26 33 25 27 32 43 53 75 14 16 17 17 21 24 27 36 44
361
I

. Figure 11.2 PER CENT DISTRIBUTION OF NATIONAL GOVERNMENT EXPENDITURES
FY 1972-73
TOTAL CAPITAL EXPENDITURES
I 27.16%
14J2%
362
L~end:
4%
23.76%
I
~ ~-Economic Development
•-Social · Development
--National Defense
Ill-General Government
•-Debt Service
Ill-TOTAL CAPl;AL EXPENDITURES
CURRENT OPERATING
EXPENDITURES ◄ l'
I

Table 11.4 - EXPENDITURES ON INFRASTRUCTURE PROGRAM, FY 1966-67 TO FY 1973-741
1966-67 1967-68 1968-69 1969-70 1970-71 19)1.72 1972-73 1973-742
Cash Releases from Domestic Sources3
(in million pesos)
Highways 170.9 217.5 226.5 149.7 227.7 307.4 590.2 289.0 Irrigation 25.0 25.0 37.9 33.3 71.2 70.6 157.3 106.9 Airport and air' navigation 7.3 10.2 32.1 33.3 16.6 41.0 56.S 7.0 Port works 15.4 27.0 22.3 18.7 35.7 15.9 41.4 27.6 Telecommunications 8.5 7.4 9.8 8.8 0.5 8.2 14.6 n.a. Schools 27.2 70.2 36.3 21.0 13.6 17.6 41.S 21.4 Waterworks 51.1 43.2 61.8 29.3 33.9 18.3 13. l 10.0 Flood control 0.8 2.9 11.2 5.1 8.3 5.6 60.7 70.0 National buildings 5.0 9.0 13.2 17.9 11.4 23.3 25.9 7.5 Power 46.8 SO.I 28.3 37.8 49.5 58.9 38.3 25.3 Community projects 4.7 7.0 5.9 162.9 n.a. n.a. n.a. n.a. Preliminary engineering 1.3 3.0 2.0 2.1 6.5 6.3 10.4 2.2 Rural electrification n.a. n.a. n.a. 0.3 8.5 14.9 37.4 88.4 Shore protection n.a. n.a. n.a. 2.6 2.1 1.3 3.0 0.9 Miscellaneous public works n.a. n.a . . n.a. n.a. 41.S 21.S . 12.4 8.5 Railroads n.a. n.a. n.a. n.a. n.a. I 3.1 27.6 33.S
Total 364.0 472.S 487.3 522.8 527.0 623.9 1,130.3 698.2
Cash Releases from Foreign Sources4
(in million US$)
Highways 2.0 10.7 0.8 16.9 2.6 7.8 8.6 13.5 lr;igation n.a. 2.0 2.0 0.2 7.5 5.6 6.0 7.0 Airport and air navigation 0.6 0.4 0.3 3.8 2.8 3.7 n.a. 8.2 Port works 3.5 1.9 n.a. n.a. n.a. n.a. 0.2 5.0 Telecommunications 1.8 2.6 3.0 9.2 n.a. n.a. n.a. n.a. Schools n.a. 2.1 13.6 2.2 2.2 3.0 6.0 n.a. Waterworks 3.0 5.0 5.6 3.3 0.2 n.a. n.a. n.a. Flood control n.a. n.a. n.a. n.a. n.a. n.a. n.a. n.a. National buildings n.a. n.a. n.a. n.a. n.a. n.a. n.a. n.a. Power 3.2 2.5 2.1 3.8 5.7 n.a. 0.9 • Community projects n.a. n.a. n.a. n.a. n.a. n.a. n.a. n.a. Preliminary engineering n.a. n.a. n.a. n.a. n.a. n.a. n.a. n.a. Rural electrification n.-a. n.a. n.a. n.a. n.a. n.a. n.a. 7.1 Shore protection n.a. n.a. n.a. · n.a. n.a. n.a. n.a. n.a. Miscellaneous public works n.a. n.a. n.a. n.a. n.a. n.a .. n.a. n.a. Railroads, n.a. n.a. n.a. n.a. n.a. n.a. n.a. n.a.
Total 14. l 27.2 27.4 39.4 21.0 20.1 21.7 40.8
I
'
~ I
363 L
t '
L

Table 11.4 - EXPENDITURES ON INFRASTRUCTURE PROGRAM, FY 1966-67 TO 1973-741(continued)
1966-67 1967-68 1968-69 1969-70 1970-71 1971-72 l 972-73-1973-742
Total Cash Releases5
(in million pesos)
Highways 178.9 260.3 229.7 216.9 243.2 359.7 647.8 379.3 Irrigation 24.8 32.8 45.4 · 53.7 116.2 108.1 197.5 153.7 Airport and air navigation 9.7 11.4 33.3 48.5 33.4 65.8 56.5 62.0 Port works 29.4 34.6 22.3 5.1 35.7 15.9 42.7 60.9 Telecommunications 15.7 , 17.8 21.8 45.6 0.5 8.2 14.6 n.a. Schools 27.2 78.6 90.7 42.5 26.8 37.7 81.7 21.4 Waterworks 63.1 63.2 84.2 21.4 35.1 18.3 13.1 10.0
· _Flood control 0.8 2.9 11.2 21.3 8.3 5.6 60.7 70.0 National buildings 5.0 9.0 13.2 53.0 11.4 23.3 25.9 7.5 Power 59.6 60.I 36.7 17.9 - 83.9 58.9 44.3 25.3 Community projects 4.7 7.0 5.9 162.9 n.a. n.a. n.a. n.a. Preliminary engineering 1.3 -3.0 2.0 2.1 6.5 6.3 10.4 2.2 Rural electrification n.a. n.a. n.a. 0.3 8.5 14.9 37.4 135.7 Shore protection· n.a. n.a. n.a. n.a. 2.1 1.3 3.0 0.9 Miscellaneous public works n.a. n.a. n.a. n.a. 41.5 21.5 12.4 8.5 Railroads n.a. fl.3. n.a. n.a. n.a. 13.1 27.6 33.5
Total 420.2 580.7 596.4 691.2 653.1 758.6 1,275.6 970.9
n.a. - Data not available. •Less than half of the unit employed. 1Cash releases reprcscnl replenishment of the common fund account or iS!illance treasury warrants ~ithcr as direct payment t':) the crtditor or for deposit to the account of a disbu.rsing officer of the implementing agency. Diii;bul'tlefflcnt _of cash expenditure represents actual payment to the creditor and i$ made from either or both the common account and treasury warrant& Cat1h releases may be carried over from one fi5c:aJ year to the next before disbufflement is made and hence is not exactly the same as actual expenditure during the fi~a.1 year. However, because of !Omc balancing effect of disbursement made against caffl releMC& during previous years and because year end balanc~ of undisbursed funds do not vary much in me, cffll relca&u arc approximately equal to actual expenditure.
2Arnf July 1, 1973 to December 31. 1973 only. 3Jncludcs commodity assistance.
4Project loans ~d reparations.' 5Convcrted at same exchange rates as ar~ used by the Infrastructure Operations Center; FY 1966..67 t_o 1969-70; P4.0., USSI; FY 1970-71; P6.0"' USSl; fY 1972-73; P-6. 7 • USSI. .
Source: Infrastructure Operations Center, lmplemenrarton of the lnfnut,ucture Program, various years.
364

Table 11.5 - HOLDERS OF GOVERNMENT SECURITIES: 1957-73 (Million pesos)
End of Central Commercial Semi- . Total and Other Trust G t Pnvate overnmen
Period Bank Banks Funds Entities Sector
1957 1,108 828 100 82· . 70 18 1958 1,300 1,027 88 101 66 21 1959 1,391 1,048 85 134 104 20 1960 1,484 1,027 106 175 147 29
1961 1,885 1,079 412 204 162 27 1962 1,885 1,083 345 245 182 29 1963 1,989 963 429- 283 274 40 1964 2,076 1,058 378 320 . 277 13 1965 2,316 · 1,000 451 387 366 53
1966 2,675 1,238 644 366 261 111 1967 3,231 1,507 906 450 196 121 1968 3,594 1,610 1,034 · 494 228 181 1969 4,847 2,2+5 1,396 594 272 317 1970 5,233 2,385 1,327 685 246 S48
1971 5,825 2,422 1,742 794 244 584 1972 7,646 3,022 1,770 865 329 1,630 1973 11,203 3,511 4,189 908 1,046 1,458
1st Quarter . 8,648 . 3,523 2,442 844 458 1,350 2nd Quarter 9,553 . 3,604 2,784 837 403 1,897 3rd Quarter 10,016 3,491 3,548 858 · 1,014 1,076 4th Quarter 11,203 . 3,57 I 4,189 908 · 1,046 1,458.
Foreign Holders
0 0 0
·O 0 0 0 0 59 ·
55 51 47 43 41
39 30 29 31 28 29 29
Note: Government securities include issues of . the Development Bank of the Philippines and Land Bank of the Philippines.
Source of data: Central Barik of the Philippines. Q
365·

Table 11.6 - INTERNAL DEBT OU'fSTANDING CLASSIFIED BY LEVEL (Million
End of Period Total National Local Government
Government Government Corporations
. 1949 485.1 335.5 66.0 83.6
1950 588.6 437.6 66.0 85.0 1951 634.5 483.1 66.3 85.1 1952 621.8 471.4 64.9 85.5 1953 905.0 705.2 63.3 136.5 1954 930.9 675.2 50.7 205.0
1955 1,181.0 867.4 43.9 269.7 1956 1,396.0 1,0 I 4.9 37.3 343.8 I 957 1,647.1 1,189.3 29.1 428.7 1958 1,823.9 1,294.6 44.4 484.9 1959 2,057.7 1,463.3 37.6 556.8
1960 2,137.5 1,454.0 26.5 657.0 1961 2,609.8 1,730.0 22.5 857.3 1962 2,747.4 1,789.0 23.3 935.1 1963 2,855.5 1,800.9 20.9 1,033.7 1964
✓ 2,945.1 1,858.9 22.9 1,063.3
I 9651 3,179.8 1,986.6 72.0 1,121.2 1966 3,560.5 2,234.0 87.7 1,238.8 1967 4,200.1 2,669.1 88.9 1,442.1 1968 4,596.6 2,825.5 110.4 1,660.7 JQ69 5,865.7 3,700.4 121.0 2,044.3
1970 7,191.0 4,019.5 107.2 2,145.6 1971 7,701.9 4,286.7 103.8 2,171.9 1972 9,701.9 5,607.8 106.3 2,265.4 1973 12,533.4 7,294.2 96.2 2,004.8
1st Quarter 9,993.7 6,211.3 100. J 2,253.7 2ndQuarter 10,5&6.9 6,375.5 89.8 2,260.4 3rdQuarter 11,275.0 7,015.5 94.7 1,962.2 4thQuarter 12,533.4 7,294.2 96.2 2,004.8
1974 1st Quarter I 3,755.5 8,762.5 100.3 1,553.3
lPrior to this year DBP ·and GSJS loans to local government were not included. 2No data prior to 1970. Note: Details may not add up to totals due to rounding. Source of data: Central Bank of the Philippines.
366
,
• 1
◄ I ,,,
t ~
-·"

~
OF GOVERNMENT AND PERIOD OF MATURITY: 1949-lst QUARTER 1974
pesos)
. Monetary Long Tenn· Middle Term Short Term End of Period Institutions
2 447.0 0.0 38.1 1949
2 498.5 0.0 90.1 1950 2 579.3 0.0 55.2 1951 2 567.9 0.0 53.9 1952 2 684.3 205.S 15.2 1953 2 752.5 163.4 15.0 1954
2 1,156.3 6.0 18.7 1955 2 1,181.4 185.9 28.7 1956 2 966.7 325.4 355:0 1957 2 941.3 425.0 457.6 1958 2 933.0 348.9 775.8 1959.
2 1,251.0 220.9 665.6 1960 2 1,811.1 177.3 621.4 1961 2 1,824.8. 336.6 586.0 1962 2 1,701.9 530.7 622.9 1963 2 1,332.3 663.1 949.7 1964
2 1,454.9 505.8 1,219.1 1965 2· 1,681.9 340.7 1,537.9 1966 2 2,419.0 979.4 ' 801.7 1967 2 2,482.8 1,127.9 · 985.9 1968 2 2,794.9 1,937.2 1,133.6 1969
918.7 2,810.1 1,569) 2,811.2 1970 1,139.5 2,751.8 2,893.5 2,056.6 1971 1,722.p 2,627.9 4,046.8 3,026.8. 1972 3,138.2 3,341.6 5,380.2 3,811.6 1973 1,428.3 2,641.0 4,909.2 2,443.2 1st Quarter 1,858.2 2,612.4 5,495.8 , 2,475.6 2nd Quarter 2,202.6 3,150.9 5,097.4 3,026.7 3rd Quarter 3,138.2 3,341.6 5,380.2 3,811.6 . 4th Quarter
1974 3,339.4 4,565.8 5,664.5 3,525.2 1st Quarter
367'

Table 11.7 - EXTERNAL DEBT OUTSTANDING CLASSIFIED
(Million U.S.
End of Period 1963 1964 1965 1966
Total 251.8 304.2 481.0 515.9 U.S. government & U.S. AID 3.4 4.7 25.4 14.1
IBRD2 31:8 41.3 58.4 66.7 IMF3 53.3 47.0 67.4 90.5 IDA4 3.2 3.6 3.7 3.7 ADB 5
US. EXIMBANK 47.8 45.8 44.6 45.2
U.S. commercial banks 88.0 105.2 238.3 253.2 European banks -Japanese banks Qther banks
Republic of China Government of Thailand Government of Japan Government of Belgium Government of Denmark
Private suppliers U.S.A. 3.4 Japan 24.4 19.5 22.3 i6.2 West Germany 0.3 2.3 2.1 France 2.3 Australia 0.2 2.1 1.8 Belgium I. I 2.5 Holland 0.6 0.7 Canada 0.0
Others 36.0 14.7 14.1
- not available.
lExcludes other institutiona1 sources of credit. 2J~temational Bank fof Reconstruction and Development. 3Jntemational Monetary Fund. 41ntemational Development Association. 5 Asian Development Bank. Source of data:· Central Bank of the Philii,pines.
368
~ ~
1
/
' ·~
i

BY INSTITUTIONAL SOURCE1: 1963-73
dollars)
1967 1968 1969 1970 ~
679.6 736.8 840.2 956.3 14.5 22.6 32.6 44.4
83.8 95.9 109.3 122.4 118.0 173.0 173.0 231.8
3.7 3.7 3.7 5.9 2.0 4.9
44.6 43.0 40.6 40.6
, 361.5 300.3. 330.8 310.4 20.0 49.7 54.9-
,- 66.8
41.4 30.5 19.7 16,6 11.3 11.5
1.8 1.4 1.0 0.7 I. I 1.9 -
-13.2 12.6 12.0 11.4
369
1971 1972 1973
1,009.4 1,171.4 1,224.9 SS.I 79.2 108.4
140.3 152.9 157.9 252.9 336.3 369.6
5.9 6.0 6.5 7.4 11.6 21.8
41.4 37.9 30.2
264.1 · 198.8 158.4 56.6 58.2 28.9 39.1 50.7 43.0
12.5 I 2.5
6.5 , 6.5 26,8 26.8-
2.3 21.7 1.0 1.0
2.0
75.5 87.2 69.6 14.0 · 65.7 113.0 10.4 9.1 7.3
I.I 0.9 0.7 0.4 0.1 0.5 0.2 0.1
14.6 18.5 . 18.2 10.2 9.0 8.3

Table 11.8 - TOTAL EXTERNAL DEBT OUTSTANDING (DISBURSEMENT
(Million U.S.
End of Period 1963 1964 1965 1966
Short-term 1 41.2 82.4 124.5 146.1---Public sector 10.7 29.4 73.3 102.8
Central bank 10.7 29.4 73.3 102.8 Others
Private sector 30.5 53.0 51.2 43.3 Commercial banks2 · 30.5 53.0 47.8 36.2 Others 3.4 7.1
Medium-term3 I 72.5 200.2 236.3 202.8
Public sector 126.4 .129.0 135.9 114.5 ce·ntral bank4 97.8 105.6 51.8 25.3 Others 28.6 23.4 84.1 89.2
Private sector 46.1 71.2 100.4 88.3
Long-term5 145.9 151.6 238.7 275.1
Public sector 49.1 62.7 149.6 ·154.4 Central bank Others 49.1 62.7 149.6 154.4
Private sector 96.8 88.9 89.1 120.6
Total 359.6 434.2 599.5 624.0 --
Total public sector 186.2 221.1 358.8 371.8 Central bank 108.5 135.0 125.1 128. l Others 77.7 86.1 233.7 243.7
Total private sector 173.4 213.1 240.7 252.2
- not available.
lOriginal maturity of one year or less. 2Jncludes PNB and NIDC. 3Qriginal maturity of over one year to five years. 4Jncludes !MF drawings outstanding at the end of 1973 valued at SOR! - US$1.2063. 50riginal maturity of over five years. Source: Management of External Debt and Investment Accounts Department, Ce"ntral
Bank ol the Philippines.
370
~
~ ~ •
◄
, -,
4

.,
••
BASIS) BY MATURITY AND TYPE OF BORROWER: 1963-73
dollars) ,
1967 1968 1969 1970 1971
354.5 319.7 472.8 349.7 339.6
209.0 120.1 196.4 62.8 38.5 r 209.0 120.1 196.4 62.8 38.5
145.5 '199.6 276.4 286.9 301.1 63.7 61.3 97.0 54.8 36.5 81.7 138.3 179.4 232.1 264.6
245.1 527.1 623.5 617.5 499.7
113.8 245.4 224.1 248.4 239.8 53.0 168.6 155.1 171.5 140.7 60.8 76.8 69.0 76.9 99.1
131.3 281.7 399.4 368.9 259.9
479.9 603.2 815.4 1170.2 1248.2 --166.7 187.1 255.6 490.0 528.4
1.6 4.6 4.4 205.1 195.9 165.1 182.5 251.2 284.9 332.5
313.2 416.1 559.8 680.2 719.8
1079.4 1450.0 1911.7 2137.2 2087.5
~ ill& 676.1 801.2 806.7 263.6 293.3 355.9 439.4 375.1 225.9 259.3 320.2 . 361.8 431.6
589.9 8_97.4 1235.6 1336.0 1280.8
371
1972 1973
320.0 332.9
31.5 27.5 4.0
288.5 332.9 25.5 24.2
263.0 308.7
468.9 398.0
254.2 224.0 141.8 142.4 112.4 81.6
214.7 174.0
1421.5 l ,6Q6.9 ,
653.0 739.9 231.3 257.3 421.7 482.6
768.5 867.0
2,210.4 2,337.8
938.7 963,9 400.6 399.7 538.1 564.2'
1,271.7 1,373.9

r CHAPTER XII
BALANCE OF PAYMENTS; FOREIGN TRADE
Table 12.1 Balan<:C of Payments: Goods and Services Account, CY 1960-73 376 Table 12.2 Balance of Payments: Consolidated Account, CY 1960-73 378
Table 12.3 Direction of External Trade: CY 1931-lst Quarter 1974 , 380 Figure 12.1 Direction of External Trade: CY 1971-lst Quarter 1974 (F.O.B.
value) 389
Figure 12.2 External Trade: Exports CY 1952-73 390
Figure 12.3 External Trade: Imports CY 1952-73 391
Table 12.4 Philippine Exports by Major Commodity Groups: CY 1953-lst Quarter 1974 392
Table 12.5 Philippine Trade Relations with the United States: CY 1900-lst Quarter 1974 , 394
Table 12.6 Total ·Exports and Ten Principal Exports: CY 1949-lst Quarter• 1974 396
Table 12.7 Imports by End Use, CY 1949; 1952-lst Quarter 1974 400
Table 12.8 Quantum, Price and Value Indices, Net Terms of Trade and Purchru;ing Power ·of Exports, (All Countries), CY 1950-lst Quarter 1974 404
I

CHAPTER XII
BALANCE OF PAYMENTS; FOREIGN TRADE'
Data on the balance of payments and external trade are important in that they present to the policy-maker, the economic planner, the analyst, and the public in general the overall position of the coun_try vis-<l-vis its relations with other countries or with the rest of the world, and how such relations in the economic sphere affect its overall economic performance during a given period. Balance of payments and external trade statistics are particularly important to a developing economy like the. Philippines because the bulk of the country's domestic output is destined for exports and because the country, owing to its still underdeveloped character, has to rely on other countries for most of its needs. Balance of payments and trade statistics, therefore, summarize the country's relation with the outside world and how such relations affect the overall performance of the economy. ·
The statistics shown in this chapter highlight the balance of payments (BOP) anci external trade position of the Philippine economy covering the major part of the post-war period, particularly the 1960 decade down to the first three years of the l 970's. Eight (8) major statistical tables sum up such performance - two on the balance of payments proper and six on external trade. The two BOP tables deal with the goods and services account and the consolidated account of the balance of payments while the six tables on external trade present the direction of the country's foreign trade, the ten principal exports and imports, imports by end-use, and· the quantum, price and value indices, the· net terms of trade and the purchasing power of exports of the Philippines. - '·
The major source of data for these tables is the Central Bank. Starting in I 973, however, the National Census and Statistics Office (NCSO) assumed primary responsibility in the tabulation and releases of statistics on foreign trade, although the Central · Bank continues compiling these data for its own internal u~e.
·,
375

Table 12.1 - BALANCE OF PAYMENTS:
(Million
Item 1960 I 961 1962 1963 1964
Receipts
Merchandise (f.o.b.) 560 500 556 727 742 Non-monetary gold 14 15 15 13 15 Freight and insurance 4 7 9 12 12 Other transportation Travel 3 4 4 I l 15 Investment income 6 5 9 9 12 Government (n.i.e.) 22 32 32 35 43
Military services 11 21 16 20 25 Others 11 11 16 15 18
· Other Services 34 48 92 86 103 Total receipts 643 61 I 717 893 942
Payments
Merchandise (f.o.b.) 604 611 587 618 780 Freight and insurance 56 54 55 53 69 Other transportation 7 5 4 2 4 Travel 7 21 42 33 29 Investment income 81 43 26 30 38
On direct investment 73 41 20 13 13 Others 8 2 6 17 25
Government (n.i.e.) 7 5 7 7 12 Other services 26 37 57 49 34
· Total payments 788 776 778 792 966
Goods arid services account SUf)))Us (+)/deficit(-) (145) _ (165) (61) +JOI· (24)
PpreJiminary /
Source of data: Central Bank of the Philippines. Note: Details may not add up to totals due to rounding.
376

r-• GOOD$ AND SERVICES ACCOUNT: CY 1960-73
U.S. dollars)
1965 1966 1%7 1968 • 1969 1970 1971 1972 1973P
769 828 · 821 858 855 1,062 1,129 1,109 1,768 15 16 17 18 20 21 19 29 103 14 17 17 17 18 29 20 · :14 20
6 15 8 6 8 24 21 30 28 64 - 80 48 · 49 95 66 122 74 19 is 15 15 7 10 16 23 65 68 81 106- 126 89 68 83 116 200 42 57 79 96 59 31 36 41 42 26 24 27 30 30 37 47 · 75 158
179 158 151 76- 80 48 56 51 248 1,092 . 1,187 1,222 1)66 1,123 1,341 1,413 1,485 2,508
808 853 1,062 1,150 1,132 1,090 1,186 .1,260 1,597 66 71 95 104·' 96' 107 102 109 167 '6 4 4 I 22 21 19 ' 13 I I 53 53 62 68 59 27 28 24 15 50 55 91 112 85 140 117 148 178 17 26 55 79 47 25 26 33 69 33 29 36 . 33 38 115 91 115 118
8 - 7 13 16 15 16 24 32 47 62 79 106 100 103 88 59 76 171
1,053 1,122 1,433 1,551 . 1,512 1,489 1,538 1,662 2,186
+39 +65 (211) (385). (389) . (148) (125) (177) +322
, 377 ·

Table 12.2 - BALANCE OF PAYMENTS:
(Million
Item 1960 1961 1962 1963 1964
Current account -5 -70 .32 180 84
Trade (net} -30 -96 --16 122 -23 Exports_ 574 515 571 740 757 Imports 604 6 I I 587 618 780
Services (net) -115 -69 -45 -21 I Receipts 69 96 146 153 ·185 Payments 184 165 191 ~ 174 · 186
Private transfers (net) 80 76 79 65 93 Receipts 81 77 83 70 ·97 Payments I I 4· 5 4
Official transfers (net) 60 19 14 14 15 Receipts . 60 20 14 15 16 Payments I I I
Capital account 64 -12 -16 11 -58 -.Direct investment (net) 29 -48 -3 -10 -4 Private loan capital (net) 44 51 -21 5 -93
Medium and long-term 45. 47 ~23 -24 14 Short-term -I 4 2 29 -107
Public loan capital (net) -9 -15 8 16 39 Monetary sector 6 67 -22 -4 143 --
Deposit money banks (net) I 13 -7 28 123 Liabilities -4 I "6 40- 109 Assets 5 12 -13 -12 14
Central banks (net) 5 54 -15 -32 20 Llabilities2 5 54 -15 -32 20 Assets (not related to reserves) - ~ Allocation of SDR's
-
' . Reserves and related items
(-; increase) -33 .73 -6 -35 -20
Use of !MF credit (other than_gold tranche) 22 -3 25 -6
Monetary gold -6 -12 -13 12 5 Reserve position with
!MF (gold tranche) -25 Foreign exchange holdings ►
·i of Central Bank -24 88 -18 .:_47 -19 Errors and ommissions -32 58 12 -152 -149 ---
lJncludcs non-monetary gold, 2The credit entries cover drawings, and the deb! entries cover repayments. on short-term and long-tenn loans received from
US and Ja pan and European banks.
Ppreliminary
Soun::e of data: Central Bank of the Philippines.
378

CONSOLIDATED ACCOUNT: CY 1960-73
U.S. dollars)
1965 1966 1967 1~68 1969 1970 ·I 971 1972 1973P
138 1.63 -25 -,-251 -234 -29 9 11 556
-24 -9 -224 -274 -257 -7 -38 -151 274 784 844 838 876 875 1,083 1,148 1,109. 1,871 808 853 1,062 1,150 1,132 1,090 1,186 1,260 1,597
63 74 13 -111 -132 --,141 -87 -26 48 308 343 384 290 248 . 258 265 376 638 245 269 371 401 380 399 352 402 590
73 53 114 91 106 93 103 152 172 77 71 124 9~ 108 95 106 158 - 176 4 18 10 .2 2 .. 2 3 6 4
26 45 72 43 49. 26 31 36 62 27 46 -73 45 50 29 38 40 69
1 I 1 . 2 1 3 7 4 7
-77 -22 .R 397 223 181 124 174 183 --10 -15 --9 -3 6 -29 -6 -22 77
-121 . 69 366 194 170 60 39 28 -4 ·14 57 188. 127 · 94 -32 -17 -36
-117 -14 12 178 67 76 92 56 64. 54 -7 -29 34 ·23 40 70 157 78 94 _·57 i!. -25 96 93 98 72 -165
~
-12 ~75 -55 8 29 35 94 136 -79 29 -53 -30 14 12 32 117 173 127
-17 -22 -25 -6 17 3 -23 -37 -206 82 18 106 -33 .67 58 4 -64 -86 82 18 106 -33 67 58 4 -64 -86
- - - 18 17 16 - -- --
-79 ~ 74 40 ~116 ' -104 -167 -:-520
-10 -14 28 55 14 21 7 -21 -15 -5 -17 -1 16 -11 -11 -4 31
-4 -9
-50 28 3 20 24 -119 -114 -170 -510"
-76 -84 -71 -195 -125 -147 -148 -117 -74
379

,
Table 12.3 - DIRECTION OF EXTERNAL (F .O.B. value in
Calendar All Countries North
Year Net Exports Imports Net
1931 4,793 103,972 99,179 21,221 1932 20,968 100,374 79,406 _36,320 1933 . 43,255 110,622 67,367 52;893 1934 32,623 116;238 83,615 43,508 1935. 16,391. I 01,926 85,535 27,812 1936 46,548 l47,677 101,129 56,969 1937 57,926 166,961 109,035 72,591 1938 . 14,383 147,001 132,618 29,939 1939 35,327 157,892 122,565 45,955 1940 21,194 155,925 . 134,731 23,099
-1941 25,544 . 161,135 135,591 27,803 1942-1944'
. 1945 ( 28,261) 672 28,933 ( 27,187) 1946 (231,670) 64,188 . 295,858 (230,480) 1947 (245,802) 265,548 511,350 (297,522) 1948 (249,000) · 319,205 568,205 (263,100) 1949 (338,039) 247,854 585,893 (302,703) 1950 ( 10,818) 331,035 341,853 ( 19,428) 1951 ( 61,507) 427,447 488,954 ( 82,386) 1952 ( 75,695) 345,727 421,422 ( 86,496) 1953 ( 54,121) 398,252 452,373 ( 84,774) 1954 ( 78,22.2) 400,504 478,726 _( 92,746) 1955 (147,085) 400,649 547,734 (133,543) 1956 ( 52,984) 453,179 506,163 ( 70,821) 1957 (182,168) 431,062 613,230 (123,97?) 1958 .( 65,901) 492,758 558,659 ( 24,445) 1959 5,913 529,493 523;580 47,049 1960 ( 43,481) 560,389 603,870 15,925 1961 (111,786) 499,5.12 611,298 3,064 1962 ( 30,717) 556,021 586,738 9,525 1963 108,916 _ 727,106 618,190 56,86 I 1964 ( 38,289) 742,036 780,325 21,259 1965 ( 39,131) . 768,448 807,579 50,548 1966 ( 24,577) 828,195 852,772 42,279 1967 · (240,735) 821,456 1,062,191 ( 23,032) 1968 (292,503) 857,715 1,150,218 ( 4,037) 1969 (276,885) 854,601 1,131,486. 15,556 1970 ( 28,418) 1,061,702 . 1,090,120 109,093 1971 (49,528) I, 136,431 1,185,959 140,949 1972 (124,049) 1,105,544 1,229,593 115,456 1973 289,696 1,886,315 1,596,619 217,776 1974-1 st Quarter 45,434 ·582,620 628,054, 80,849
awar Years. n.a. - Data not available. •Less than U.S. $500. Sources of data: National Ceru;u1 and Statistics Office. for data from 1931 to' 1938 and 1973 to 1974. Central Bank of
the Philippines, for data from 1949 to· 1972.
380

TRADE: CY 1931-lst Quarter 1974 thousand U.S. dollars)
America
Exports Imports
83,581 . 62,360 88,149 51,829 97,013 44,120 98,826 55,318 83,421 55,609
120,028 63,059 137,926 65,335
' 122,200 9·2,261 130,873 84,918 129,869 .106,770 139,016 111,213
229 27,416 ( 40,238 270,718 (
158,089 455,61 I (, 214,771 477,871 ( 180,064 482,767 .( 244;542 263,970 281,159 363,545 235,527, 322,023 273,552 358,326 245,028 337,774 240,920 374,463 245,733 316,554 228,579 352,557 276,05~ 300,501 293,873 246;824 ( 285,435 269,510 ( 269,989 266;925 281,520, 271,995 331,726 2:74,865 ( 355,831 334,572 350,852 300,304 ( 348,422 306,143 ( 354,310 377,342 ( 391,465 _ 395,502 '- ( 363,335 - 347,779 ( 443,639 334,546 ( 463,561 . 322,612 ( 454,203 338,747 ( 689,146 471,370 234,010 153,161 (
Central America & Antilles_
Net
20 3
12 54 69 59 56
· 127 142 157
133) 3,792)
79) · 90) 525) 189 421 355 175 .152 317 390) 251 603 297) 278) 161 402 403) 142
1,3 i 5) 837)
5,077) 3,058) -1,447). 2,162) 2,175) '1,659)
105 719)
I 381
Exports
28 11 20
' 58 77 66 61
132 1-51. 181 n.a.
85 470
1,168 340 301 · 478 355 194 . 420 550 460 453 841 418 378 427 890 -127
I ;017 1,686
406 184 488 241 735
1,265 1,514 2,868
991
Imports
8 8 8 4 8" 7 5 5 9
24 n.a.
133 3,877
549 I 1,258
865 -1-12
57
19 268
· 233 850 202 238 715 656 266 488 530 875
·3,001 1,243 5,261 3,546 1,688. 2,8?7 .3,440 3,173 2,763 l ,?°10

Table 12.3 - DIRECTION OF EXTERNAL {F.O.B. value
/
Calendar South America Northwestern
Year Net Exports Imports Net
24 134, { 2,358) • 1931 { 110) 1932 { 74) 9 83 { 5,551) 1933 { 96) 15 111 ( 2,2?3) 1934 8 96 88 ( 721) 1935 ( 70) 89 159 ( I, 787) 1936 76 220 144 334 1937 230 423 193 ( 114) 1938 ( 5) 297 302 ( . 2,464) 1939 { 207) 376 583 ( 1,872) 1940 ( 97) 322 419 1,349 1941 n.a. n.a. 1942-1944· 1945 l 855) ~ 855 . ( 56)
' 1946 ( 2,038) 908- 2,946 . 4,695 1947 ( 2,142) 3,638 5,780 46,009 1948 ( 2,666) ·. 4,483 '7,149 29,729 1949 ( 6,696) 838 7,534 10,834 1950 7,039 7,716 677 21,838 1951 3,566 7,941 4,375 54,483 1952 4,620 6,086 1,466 24,965 1953 10,208 11,187 979 27,766 1954 9,080 11,740 2,660 33,195 1955 11,575 14,168 2,593 19,375 · 1956 11,289 15,163 3,874 27,273 1957 10,723 14,288 3,565 ( 3,334) 1958 4,585 9,843 . 5,258 16,323 1959 5,890 9,595 3,705 5,451 1960 5,271 9,891. 4,620 25,291 1961 I 2,654 2,653 ( 19,.547) 1962 109 7,566 7,457 ( 13,408) 1963 ( 2,643) 2,102 4,745 48,964 1964 ( I, 187) ·4,171 5,358 21,443 1965 238 4,316 4,078 21,778 1966 ( 118) 5,917 6,035 . 12,269 1967 ( 1,891) 6,770 8,661 (62,409) 1968 777 7,842 7,065 (113,361) 1969 2,051 9,049 6,998 (151,468-) • 1970 ( 2,451) 1,843 4,294 ( 94,311) 1971 206 3,544 3,338 ( '74,592) 1972 { 4,350) 392 4,742 ( 18,048) 1973 ( 2,752) 901 3,653' 60,663 1974-lst Quarter ( 682) 452 1,134 ( 587)
' 382

TRADE: CY 1931-lst Quarter i974 (continued) in thousand U.S. dollars)
Europe - Southern Europe
Exports Imports Net Exports Imports
8,369 10,727 4,164 4,955 791 4,021 _9,572 3,298 3,897 599 5,903 8,182 2,137 2,611 474 ·8,059 8,780 1,137 1,570 433 6,504 8,291 2,510 2,853 343
11,782 . 1 I ,448 2,963 3,302 339 12,352 · 12,466 660 1,008 348 11,359 13,823 377 809 432 12,327 . 14,199 1,005 1,489 484 6,538 5,189 1,346 1,937 591 n.a. n.a. n.a. n.a.
56 ( 379) 379. 8,910 .. 4,215 ( 527) 821 · 1,348
57,063 11,054 · 7,508 9,433 1,925 46,439 16,710. 4,640 5,922 1,282 29,390 18,556 6,030 7,842 1,812 37,161 15,323 2,575 6,859 4,284 78,515 24,032 5,899 9,710 3,811 43,827_ 18,862 3,594 8,583 / 4,989 48,561 20,795 4,434 6,610 2,176
. 74,021 40,826 5,275 7,145 1,870 . . 66,603 47,228 3,285 5,665 2,380
88,481 61,208 1,928 5,627 ' 3,699 84,480 87,814 1,741 6,157 4,416
. 87,126 79,8(_)3 2,500 6,352 :3,852 82,370 76,919 2,455 7,501 5,046 99,933 74,642 3,667 8,812 5,145 71,956 91,503 ( 5) 8,747 8,752 90,03 I 103,439 1,916 9,054 7,138
151,557 ' 102,593 3,256 , 11,223 7,967 145,366 I 23,923 . 528 11,340 l 0,812 145.,642 123,864 1,749 12,545 10,796 147,270 135,001 549 10,665 10,116 97,399 159,808 (7,175) 8,462 15,637 87,032 200,393 ( 11,283) . 9,239 20,522 67,786 219,254 ( 7,477) 10;298 17,775 8fi,718 181,029 ( 6,118) 12,160 18,278
141,510· 216,102 3,626 . 18,445 14,819 164,939 182,987 4,971 18,106 13,135 281,451 220,788 2,340 15,863 13,523
79,168 79,755 ( 5,955) 2,824 8,779
383

/
Table 12.3 - DIRECTION OF EXTERNAL (F.O.B. value in
Calendar Eastern Europe Middle
Year Net Exports Imports Net
1931 ( 22) 7 - 29 1932 ( 27) 27 ( 1) 1933 .( 23) 2 25 3 1934 ( 42) 4 - 46 ( 1) 1935 ( 39) 4 43 . ( 1) 1936 ( · 46) 9 55 45 193-7 ( 54) 24 78 24 1~38 ( 68) 6, 74 7 1939 ( 65) 1 1 76 61 1940 166 198 32 11 2 1941 n.a. n.a. 1942-19448
1945 ( 18) 18 . · 1946 388 390 2 ( 104) 1947 5,328 5,419 91 ( 3,531) 1948 7,784 8,221 437 ( 4,771), 1949 862 1,022 , 160 ( 4,713) 1950 73 444 371 ( 9,269) 1951 ' ( 78) 20 98 ( 10,007) 1952 ( 211) 211 ( 9,100) 1953 ( . 137) 137 ( 13,069) 1954 . { 208) 208 ( 17,991) 1955 ( 14) 14 ( 9,887) 1956 ( 133) 133 ( 5,792) 195-7 ( 82) 82 ( 5,400) 1958 ( 117) 117 ( 2,000) 1959 .( 855) 16 871 ( 6,075) 1960 ( 247) 23 270 ( 9,907) 1961 ( 184) 11 195 ( 16,217) 1962. ( 462) 15 477 ( 18,199) 1963 ( 27) 40 67 ( 23,371) 1964 ( 99) 38 137 ( 37,528) 1965 ( 99) 35 134 ( 38,869) 1966 ( • 78) 40 118 ( 36,943) 1967 ( 399) 49 448 ( 52,742) 1968 ( 283) 26 309 ( 53,380)
· 1969 ( 614) 24 638 ( 50,209) 1970 ( 695) 49 744 ( 52,561)' 1971 ( 274) · I 31 405 ( 70,473) 1972 834 1,380 546 ( 7,474) 1973 · 6,078 8,618 2,540 (147,743) 1974-lst Quarter 612 4,978 4,3~6 (111,546)
I

~-
TRADE: CY 1931-lst Quarter 1974 (continued) thousand 0.S. dollars)
East Japan
Exports Imports Net . Exports Imports
( 7,389) 3,588 10_.977 ( 3,583) 2,572 6,155
3 ( 2,721) 2_,961 5,682 ( 6,084) 4,262 10,346 ( 6,812) 5,359 12,171
45 ( 4,871) 8,39~ 13,264 25 I ( 6,087) I 0,0.15 16,102 9 2 ( 5,194) 7,513 12,707
92 31 387 7,995 7,608 114 2 2,765 8,797 6,032
n.a. n.a. 4,340 7,913 3,573
• • 104 • •
2,303 5,834 1,300 2,253 953 725 5,496 13,422 15,518 2,096
1,356 6,069 ( 4, 7 I 7) 11 ,346 16.063 2,297 11,566 7,814 22,0 I 5 14:201 3,007 I 3 ,0 I 4 ( 2,945) 30,061 33,006 3,782 12,882 19,990 38,420 18,430 2,241 15 ,3 I 0 28,215 48,278 20,063 1,388 19,379 21,3 I 9 50,458 29,139 2,245 12,132 17,527 60,959 43,432 2,587 ' 8,379 29,240 80,425 51,185 2,840 8,240 4,142 77,845 73,703 2,048 4,048 15,522 96,562 81,040
270 6,345 12,230 I I 6,639 I 0,4,409 401 10)08 (27,845) 131,619. 159.464 323 16,540 16,625 ·125,080 I 08.455 295 18,494 30,332 136,686 I 06,354 241 23,6 I 2 93,326 198,272 I 04,946 212 37,740 28,789 187,741 158,952 120 38,989 22,087 217,565 195.478 902 37,845 20,350 264,262 243,912
94 52,836 ( 28,308) 278,619 306.927 411 53,791 ( 43,276) 283,336 326,612 730 50,939 ( 7 .907) 328,8 I I 336,718
2,747 55,308 75,874 420,753 344,879 2,199 72,672 39,470 398,570 359)00 '1 I 3<1 , 8,608 ( 17,346) 373,449 390,795 3,240 150,983 156,004 674,523 518,519
734 112,280 25,458 208,7 I 4 183,256

Table 12.3 - DIRECTION OF EXTERNAL (F.O.B. value in
Calendar Other Asia.
.i
Year Net Exports Imports Net
1931 ( 9,513) 2,395 11,908 ( 1,520) 1932 ( 8,372) 1,335 9,707 ( 1,009) . 1933 ( 5,632) 1,694 7,326 ( 970) 1934 ( 4,224) 2,723 6,947 ( 716) 1935 ( 4,293) 2,874 7,167 ( · 1,086) 1936 . ( 7,252) 2,849 10,101 ( 1,874) 1937 ( 7,816) 3,644 11,460 ( 1,949) 1938 ( 6,345) 3,520 9,865 ( 1,872) l 1939 ( 8,043) 3,496 11,539 ( 1,563) 1940 ( 6,746) 6,718 13,464. ( 1,383) 1941 n.a. n.a. 1942-19448
1945 430 443 13 ( 6) 1946 ( 5) 12,218 12,223 ( 87) 1947 ( 3,863) 19,915 2~,778 ( 1,498) 1948 ( 35,496) 16,508 52,004 ( 235) 1949 . ( 38,339) 11,328 49,667 586 1950 ( 21,566)' 7,516 29,082 ( 1,234) 1951 ( 39,522) 6,336 45,858 ( 568) 1952 ( 35,943) 5,188 41,131 ( I, 158) 1953 ( 27,569) 5,392 32,961 ( 996) 1954 ( 34,268) 7,504 41,772 ( 2,993) 1955 ( 51,881) 6,525 58,406 ( 4,659) 1956 ( 42,109) 11·,110 53,819 ( 4,901) 1957 ( 55,829) 13,789 . 69,618 ( 9,355) 1958 ( 63,160) 11,450 74,610 ( I 0,456) 1959 ( 48,195) 16,112 64,307 ( 10,397) 1960 ( 40,858) 19,317 60,175 ( 7,326) 1961 ( 44,303) 14,984 59,287 ( . 9,233) 1962 ( 25,097) 23,921 49,018 (11,533) 1963 ( 48,069) 25,470 73,539 ( 15,319) 1964 ( 49,426) 29,185 78,611 ( 22,610) 1965 ( 73,676) 29,748 I 03,424 ( 19,984) 1966 ( 28,296) 43,859 72,155 ( 33,309) 1967 ( 22,189) 69,030 91,219 ( 38,853) 1968 ( 16,063) 69,819 85,882 ( 51,189) 1969 ( 23,215) 64,719 87,934 (. 54,702) 1970 3,678 82,354 78,676 ( 52,240) 9171 ( 33,999) 95,793 129,792 ( 53,219) 1972 31,629 74,638 106,267 ( 69,302) 1973 58,940 172,344 113,404 ( 72,951) ·I I 9 7 4-1 st Quarter 1,607 40,666 39,059 ( 35,359)
386

TRADE: CY 1931-1 st Quarter 1974 (continued) thousand U.S. dollars) •
Oceania Africa
Exports Imports · Net Exports Imports
137 1,657 260 371 1 I I 122 I, 131 144 255 1 I I 166 1,136 128 173 45 341 1,057 246 288 42 407 1,493 252 293 41 .495 2,369 288 341 53 614 2,563 456 520 64 546 2,418 319 471 152 476 2,039 13 606 593 451 1,834 431 799 368
n.a. n.a. n.a. n.a ..
6 ( 57) .• 57 2 89 ( 13 1) 72 203
423 1,921 4,791 4,878 87 I, 129 1,364 2,229 2,277 48 2,273 1,687 1,542 1,576 34
301 1,535 1,289 1,334 45 431 999 4,124 4,132 8 250 1,408 2,997 2,998 I 196 1,192 974· 1,354 . 380 2_71 3,264 ( 66) 1,480 1,546 402 5,061 216 1,772 1.556 486 5,387 1,235 1,930 . 695 510 9,865 ( 483) 1,650 2,133 396 10,85~ ( 4,516) 1,705 6,221 513 10,910 ( 1,220) 1,687 2,907
1,253 8,579 ( 7,810) 2,044 9,854 1,268 10,501 ( J'0,418) 1,930 12 .348 1,646 q,179 ( 6,641) 1,052 7,693 2,359 17,678 ( 4,606j' 1_,956 6,562 3,747 26,357 505 2,630 2,125 3,482 23,466 ( 1,418) 1,830 3,248 3,718 37,027 ( 71 7) 1.768 2,485 4,235 43,088 634 866 232
. 3,33°9 54,528 738 1,582 844 4,873 59,575 1,678 2,203 525 4,729 56,969 1,610 2,763 I, 153 5,436 58,655 · 585 2,012 1.427 8,301 77,603 369 2,355 - 1,986
18,958 91,909 589 7,675 7,086 5,437 40,796 ( 1,949) 1,761 .3,710

Table li.3 DIRECTION OF EXTERNAL TRADE: CY 1931-1 st Quarter 1974 (continued) (f'.O.B. value in thousand U.S. dollars)
Calendar Rest of the World
~ .Year· Net Exports Im pons
1931 40 5·17 477 1932 ( 180) 3 183 1933. ( 203) 55 258 1934 ( 542) 11 . 553 1935 ( I 64) 45 209 1936 ( 143) 147 290 1937 ( 71) 349 420 1938 ( 438) 139 577 1939 ( 486) 486 1940 ( 5) 6 1941 n.a. n.a.
· 1.942-19448
1945 • • 1946 411 544 133 1947 (2,103) 1,664 3,767 1948 ( 445) 2,044 2,489 1949 ( 200) 479 679 1950 ( 138) 549 687 1951 5,506 5,657 151 1952 692 711 19 1953 652 687 35 1954 1,029 1,049 20 1955 604 840 236 1956 197 577 380 1957 ( 564) 471 1,035 1958 ( 7_40) 379 1,119 1959 ( 123) 499 · 622 1960 636 · 1,283 647 1961 (31,730) 2,143 33,873 1962 2,339 3,345, · 1,006 1963 947 2,033 1,086 1964 ( 105) · 758 863 1965 . ( 170) 627 797· 1966 274 966 692 1967 706 1,438 732 1968 · 1,912 3,136 1,224 1969 869 2,532 1,663 1970 (8,135) 3,212 11,34'1 1971 368 ·3,965 3,597 1972 - (95,871) 5,133 101,004 1973 10,647 10,728 81 1974-1 st Quarter 2,837 2,885 48

,......,.. __ .....,_~--,....----.----,-~-...,..-----------... -----~---------~-~~----~------
2,000
Figure 12.1 DIRECTION OF EXTERNAL TRADE: CY 1971 TO I ST QUARTER 1974
EXPORTS
li!IIlllilll I 9 7 I ' m;J I 9 7 2 DIii 1973 - 1974 (!ST.QUARTER
I.SOO 1,000 500
IN MILLION .U.S. DOLLARS
0
. (F.O.B. value) ·
ALL COUNTRIES
NORTH AMERICA
EUROPEAN COUNTRIES
JAPAN
REST OF ASIA
REST OF THE WORLD
IMPORTS
500 1,000. 1,500
IN MILLION U.S. DOLLARS
2,000

. _ Figure 12.2 EXTERNAL TRADE, EXPORTS: CY 1952-73
(f .o. b. value in million U.S.dollars) _
,---------------------------....---2,000
r-----------------------------1-l,800
l------------'--'------~--------f+--1,600
1------------------------~--+---l,400
I I I
1--------------------------+++--l,200
I
TEN PRINCIPAL EXPORTS
OT_HERS
0
390
1 1

Figure 12.3 EXTERNAL TRADE, IMPORTS: CY 1952-73
(f .o .b. value in million US. dollms)
1,600
1-------------------------...._l---l,400
1--~---------------#--------1--poo
0
391

Coconut Products Copra Coconut oil Desiccated coconut Copra meal or cake
Sugar and Sugar Products Centrifugal and refined sugar Molasses Others
Forest Products Logs Lumber Plywood Others
Mineral Products Copper concentrates Iron ore Iron concentrates Chromite ore Others
Fruits and Vegetables Pineapple products Bananas Others
Abaca and Products Abaca unmanufactured Abaca rope
Tobacco and Products Raw tobacco Cigars and others
Mineral Fuels and Lubricants
Chemicals
Textiles
Miscellaneous Manufactures and Others
Re-exports
. Total
Less than half of the unit employed.
Table 12.4 - PHILIPPINE EXPORTS BY MAJOR (F.O.B. value in
1953 1954 1955 1956 1957 1958 1959 1960
154 . 164 I I 7 130
17 I 7 16 13 4 4
99 110 96 106
3 3 • I
33 23 6 • 4
46 3
22
10 11
12 11
41 39
2
_i__ 4 I
I
3
4
•
.37 29 7 •
26 5
11
9 I
5 5
• 28 26
2
..i.. 3 I
2
14
9
400
152 119
16 13 4
176 J.11. 184 134 132 139
24 22 24 13 15 16 5 4 5
111 107
4
lQ§_ 89 123 102 84 118
3 4 5 • I I •
44. 52
33 42 8 7 I I 2 2
40 53 7 13
I O 11
·10 14 13 15
6 10 6 9
• 29 37 28 35
I 2
..i.. i 3 5 I •
I
49 79 39 61 6 8 2 6 2 4
55 52 , I 5 17 11 9
• 16 13 13 13
10 7 10 7 • • •
41 31 39 29 2 2
..2.. 8 5 8 • •
184 138
23 18 5
120 11.5
5 •
·i79 139
16 19 5
143 133
5 5
98 102 72 85 8 7
14 6 4 4
52 61 22 30 9 9 I •
17 17 3 5
10 10 10 8
• • 2
41 45 39 42.
2 3
~ 7 8 7 • •
• 2
2 3 3 3 3
2
3
7 _2-._ --2._
3
3 3 10
2 2 I
8Fim quarter of 1974 only. ' Sources of data: Central Bank, for data from 1953 to 1972; National Cenrus and Statistics Office, for data from 1~73 to 1974.

COMMODITY GROUPS: CY I 953-FJRST QUARTER I 974 million U.S. dollars)
1961 1962 I 963 1964 1965 1966 1967 1968 1969 1970 1971 1972 1973 1974•
123 169 245 247 270 267 216 236 163 209 254 228 372 133 --88 113 168 156 170 157 I 29 123 87 80 114 . I 10 166 43 16 32 47 60 68 75 59 77 51 96 103 84 ~-I 73 15 15 18 20 20 18 17 25 16 19 21 18 2· I I 4 9 12 . I I 12 17 11 I I 9 14 16 16 23 6
144 132 160 ill 147 142 ill ill 158 196 220 1il._ 295 104 135 122 147 148 132 133 142 144 149 188 212 211 275: 98
4 5 8 12 10 6 . 7 7 7 8 8 6 19 6 5 5 5 I I 5 3 2 * 2 * * I 1 •
105 128 179 178 195 240 249 262 259 295 264 235 444 100 85 107 146 135 155 197 207 208 215 237 215 164 304 64 7 5 7 8 8 7 6 9 11 13 I I 10 35 8 8 11 16 23 181 18 18 21 19 20 24 34 58 12 5 5 10 12 14 18 18 24 14 25 14 27 47 16
56 52 66 ..fil._ 77 107 104 l.!i. 160 224 216 212 334 123 27 29 41 34 47 75 75 89 133 185 185 , 191 275 108 8 9 I I I I 7 6 4 2 2 3 ·2 I I * 1 I 2 2 5 7 10 9 10 I I 8 17 4
17 9 9 10 I I 8 4 3 5 9 6 5 9 3. 4 4 4 4 10 13 14 10 11 17 12 .7 32 8
14 .J.i. 11 ...Ll. ..12. 12 J..i. ..n. 20 ..li. 41 52 ~ 17 12 13 JO I I 12 10 I I 20 18 22 20 21 21 6 • • * • • • I 5 15 24 28 8 2 I 2 3 2 3 2 I 7 6 7 9 3
32 ~ .li.. 33 26 ..11. 17 13 16 17 I 5 16 23 I I 29 · 25 32 30 24 19 1_5 I I 14 15 13 13 20 10 3 3 2 3 2 3 2 ·2 2 2 2 . 3 3 I
_.2_ ll. 13 17 16 I I 11 16 17 .l.i.. 15 ~ 27 5 8 I I 12 16 15 I 1 I I 15 16 14 14 17 26 5 I I I I I • • I I I I I I • • 2 3 4 6 9 12 15 13 r7 24 19 16 4 2 _l I i 2 ...1. 4 4 ..]_ 5 ...2... 6 10 4
...i. -1.. .2. 4 _J_ _§_ 4 4 _J_ _J_ 7 ...2.. 24 7 _2.._ 11 . _J_ 9 7 9 18 20 33 41 66 89 281 74
2 3 3 2 2 21 3 4 8 4 2 I --500 556 727 742 768 828 821 858 855 1062 1136 II06 1886 583
L

Table 12.5 -PHILIPPINE TRADE RELATIONS WITH THE UNITED STATES: CY I 900 - I ST QUARTER 1974
~ (Value in thousand U.S. d<?_llars)
Calendar Total United Per Cent Total United Per Cent ~ Year Exports States of Total Imports States of Total
i900 22,990 2,961 12.9 24,864 2,153 8.7 1901 24,503 4,546 18.6 30,162 3,534 11. 7 1902 28,672 11,476 40.0 33,342 4,153 12.5 1903 32,397 13,071 40.3 33,811 3,837 11.3 1904 29,150 11,655 40.0 29,578 5,099 17.2 1905 33,455 14,840 44.4 30,051 5,590 18.6 1906 32,643 11,869 36.4 26,404- 4,478 17.0 1907 33,098 10,329 31.2 30,454 5,068 16.6 1908 32,601 10,451 32.1 29,'186 5,1p2 17.5 1909 · 34,924 14,727 42.2 31,084 6,445 20.7 1910 40,628 17,242 42.4 49,719 20,069 40.4
· I 91 1 44,837 19,923 44.4 48,024 19,157 39.9 1912 54,923 22,882 41.7 61,668 24,306 39.4 1913 47,773 16,434 34.4 53,3 I 3 26,676" 50.0 1914 48,690 24,428 50.2 . 48,589 24,01 I 49.4
1 1915 53,8 I 3 23,653 44.0 49,312 26,381 53.5 1916 69,937 35,648 51.0 45;496 22,863 50.3 1917 95,604 63,234 . 66. 1 65,797 37,621 57.2 ◄
1918- 135,194 89,147 65,9 . 98,599 58,825 59.7 1919 113,118 56,653 50.1 118,639 75,491 63.6 1920 151,124 I 05,216 69,6 149,438 92,290 61.8 I 1921 88,115 50,357 57.1 115,839 74,130 64.0 1922 95,583 64,112 67.1 80,198 47,738 59.5 1923 120,753 85,047 70.4 87,500 50,353 57:5 1924 135,345 97,314 71.9 108,011 60,399 55.9 1925 148,877 109,045 73.2 119,733 69,298 57,9 1926 136,884 100,003 73.l 119,299 . -71,576 60.0
◄ 1927 155,574 116,038 74.6 115,851 71,478 61.7 1928 155,055 115,586 74_5- I 34,657 83,858 62.3 1929 164,447 124,456 75.7 147,160 92,593 62.9 1930 133,117 105,342 79.1 I 23,093 78,783 65.5
. 1931 103,972 83,422 80.2 99,179 62,140 62.7 1932 100,374 88,035 87.7 79,406 51,503 64.9 · 1933 110,622 96,529 87.3 67,367 43,791 65,0 1934 116,238 98,138 84.4 83,615 54,688 65.4 ~ 1935 101,926 83,154 81.6 85,535 54,714 64.0 1936. 147,677 119,266 80,8 101,129 61,854 -61.2 1937 I 66,961 137,364 82.3 109,035 63,665 58.4 1938 147,001 121,651 82.8 132,618 90,788 68.5 1939 157,892 129,530 82.0 I 22,565 83,69! 68.3 • 1940 155,925 129,154 82.8 134,731 105,187 78.1
~ 1941 161,135 138,591 86.0 135,591 109,477 80.7 I 942-441
◄ 1945 672 229 34-1 28,932 25,258 87.3 1946 64,188 38,435 59,9 295,858 257,515 87.0 1947 265,548 152,190 57.3 511,350 440,000 86,0 1948 319,205 209,092 65-5 568,205 469,614 82.6
394 j

Table 12.5 - PHILIPPINE TRADE RELATIONS WITH THE UNITED STATES:. CY 1900- 1st Quarter 1974 (continued)
(Value in thousand U.S. dollars)
Calendar Total United Per Cent Total United Per Cent Year . Exports States of Total · Imports States of Total
. 1949 247,854 176,451 71.2 · 585,893 469,252 80.1 1950 331,035' 240,120 72.5 341,853 255,121 74.6 1951 427,447 276,271 64.6 488,954 349,872 71.6 1952 345,727 231,688 67.0 421,422 307,245 72.9
· I 953 398,252 271,206 68.1 452,373 347,005 76.7 1954 400,524 241,541 60.3 478,726 322,868 67.4 1955 400,649 239,553 59.8 547,734 356,345 65.1 1956 453,179 244,026 53.8 506,163 300,382 59.3 1957 431,062 226,321 52.5 613,230 335,615 54.7 1958 492,758 27.4,590 55.7 558,659 288,920 51.7 1959 529,493 292,540 55.2 523,580 231,766 44.3 1960 560,389 284,103 50.7 603,870 255,301 42.3 1961 499,512 268,696 53.8 611,298 288,679 47.2 1962 556,021 280,663 50.5 586,738 253,089 43.1 1963 727,106 330,578 45.5 618,190 253,737 41.0 1964 742,036 353,632 47.7 780,325 331,545 42.5 1965 768,448 348,745 45.4 807,579 274,115 33.9 1966 828,195 346,355 41.8 852,772 284,500 33.4 1967 821,456 352,609 42.9 1,062,191 362,673 34.1 1968 857,715 391,463 45.6 1,150,218 372,167 32.4 1969 854,601 360,327 42.2 1,131,486 320,244 28.3 1970 1,061,702 440,172 41.5 1,090,120 315;083 28.9 1971 1,136,431 459,460 40.4 1,185,959 291,184 24.6 1972 1,105,538 446,551 40.0 1,229,593 312,625 25.4 1973 1,837,188 675,955 36.8 1,596,619 449,766 28.2 1974-1 st Quarter 582,620 231,368 39.7 628,054 137,947 22.0
lWarYears. Sources of data: National Census and Statistics Office for data from 1900 to 1948 and 1973 to 1974.
Central Bank of the Philipp~es. 1972 CB Statistical Bull~tin, for data from 1949 to 1972.
395

------------------------------------ --
Table 12.6 - TOTAL EXPORTS AND TEN
(F.O.B. value in thousand US dollars;
Copra Sugar Bananas Calendar
Year Quantity Value Quantity Value Quantity Value
1949 528,747 89,643 414,983 45,23 I 1950 707,186 137,953 420,475 45,906
. I 951 775,026 153,131 567,044 64,248 1952 670,843 90,670 ,793,357 89,88 I 1953 606,964 116,976 782,781 95,778 1954 763,230 130,075 869,403 105,624
1955 804,838 118,680 926,796 I 06,295 1956 966,303 134,100 893,596 100,609 1957 943,100 131,958 709,112 82,802 1 1958 811,878 139,079 969,599 115,533 .
i I 959 681,107 138,073 933,762 112,636.
1960 804,371 138,643 1,089,845 133,484 138 18 1961 627,532 88,196 1,071,127 135,076 138 ' 16 1962 779,441 112,955 960,569 121,977 '
1 1963 1,032,660 I 68,259 1,026,556 I 46,508 1964 910,019 156,091 1,094,228 148,264 96 10
1965 883,495 170,004 1,017,485 132,439 30 2 ◄ 1966 940,386 157,163 980,t-79 132,988 348 19
.1967 775,189 · 129,435 974,482 [41,736 387 34 1968 640,230 123,029 964,328 144,048 93 6 1969 508,754 87,295 979,543 148,796 23,320 1,346 4 1970 445,073 80,077 1,227,570 I 87,653 82,017 4,954
◄ I 971 692,464 114,040 1,344,677 2 I 2,348 267,243 15,389 1972 925,640 110,480 1,210,939 208,639 422,421 24,326 1973 734,431 165,764 1,470,337 173,966 465,786 27,831
1 1974 1st Quarter 83,917 43,133 370,582 98,127 141,126 8,249
- not available.
l tn tho~sa.nd board feet.
Source of data: Central Bank of the Philippines. 1
1 396 ◄
I l

,~~ ► ► I I
~-- PRINCIPAL EXPORTS: CY 1949-lst Quarter 1974
quantity in thousand kilograms)
!· Logs and Lumber Desiccated Coconut Coconut Oil
Quantity I Value Quantity Value Quantity Value
43,382 ' 3,260 57,637 19,366 61,304 17,510 144,247 10,691 73,050 24, I 57 69,806 12,482 265,902 17,267 47,452 14,902 77,854 24,496 326,433 18,946 39,081 9,740 80,548' I 5 ,42 I 523,401 28,937 49,496 15,748 59,473. 17,144 605,893 35,590 45,659 13,524 65,208 16,568
726,507 41,542 48,529 12,810 74,177 16,535 875,562 48,828 48,691 12,858 108,929 23,976 854,721 45,059 54,935 15,153 97,646 21,356
1,369,953 69,661 51,631 16,410 86,956 24,091 1,516,397 80,444 49,499 18,166 64,629 22,484
1,515,416 91,600 58,775 18,837 59,695 15,669 1,623,101 92,423 59,150 14,529 74,378 I 5,939 1,815,388 112,791 62,584 15,070 147,603 31,570 2,362,616 152,882 70,297 18,405 195,321 46,714 2,381,209 143,114 69,491 19,524 229,447 59,936
3,013,372 162,001 67,730 20,447 235,759 68,095 3,609,848 204,726 67,161 17,713 309,649 74,509 3,550,597 212,187 60,878 17,046 230,290 59,274 3,579,563 216,630 62,009 24,605 . 255,649 77,311 3,664,196 225,988 5_4,117 16,146 202,453 50,565
4,018,825 249,766 67,426 19,449 338,858 95,585 3,644,749 225,907 72,666 20,741 397,420 103,451 3,098,315 174,444 75,987 17,551 465,775 84,269 3,468,890 338,680 78,049 32,456 430,485 152,648
566,737 72,086 . 12,742 11,257 92,864 73, I 56
•
397

i
Table 12.6 - TOTAL EXPORTS AND TEN
(F.O.B. value in thousand US dollars;
Pineapples, Canned Gold2 Ply Calendar Quantity Vallie Quantity Value Quantity · Year
1949 40,429 6,837 19 1950 65,388 9,474 57 1951 53,436 . 8,146 90 1952 77,545 11,296 73 1953 74,635 11,045 24 1954 34,013 4,706 487
1955 36,180. 5,940 2,075 1956 23,452 5,487 5,997 1957 21,535 4,556 8,461 1958 21,330 4,404 28,452 1959 44,238 8,023 52,162
1960 44,839 7,400 27,985 1961 43,359 10,478 39,241 1962 39,593 11,387 47,278 1963 32,369 7,259 69,290 1964 34,393 7;741 98,092
1965 44,276 8,738 81,328 1966· 45,173 8,910 86,697 1967 56,539 I 0, 111 84,058 1968 110,728 18,838 92,378 1969 109,214 17,225 74,089
1970- 99,980 21,398 85,541 1971 100,488 19,683 203;556 7,942 13 I ,959 1972 108,106 19,552 500,909 26,898 I 82,752 1973 90,923 19,696 524,249 39,941 902,643 1974 1st Quarter 24,311 5,589 162,159 17,848 27,700 ·
- not available.
l1n thousand bo~ feet. 2Jn troy ounce. Source of data: Ceni:ral Bank of the Philippines.
398
!
.~ ~
,, ·1
~ 4
~ ;
' ' ◄ ' ~ ~ ~ 1
~ ' 1
4

PRINCIPAL EXPORTS: CY 1949-lst Quarter 1974 (continued)
quantity in thousand kilograms)
wood Copper Concentrates Value of Exports
Value Quantity Value Ten Others Principal
17 2,993 2,478 184,343 63,511 59 8,053 1,730 242,452 88,583 58 12,694 1,593 . 283,841 I 43,606 46 20,305 4,227 240,227 105 ,5_oo 14 11,923 3,269 288,911 109,341
236 22,634 5,030 311,353 89,151
923 38,880 7,391 310,116 90,533 1,516 74,109 13,595 340,969 112,210. 2;281 123,048 15,365 318,530 112,531 6,484 170,884 16,809 392,471 100,287
13,635 179,463 21,932 415,393 114,100
6,482 227,931 29,589 441,722 118,667 7,950 208,776 27,355 . 391,962 107,550
11,171 206,802 28,600 . 445,521 110,500 15,964 326,573 41,338 597,329 129,777 22,801 276,692 34,263 591,744 I 50,292
17,579 279,088 46,5 I 8 625,823 142,625 17,705 329,285 74,635 688,368 139,827 18,207 368,290 74,924 662,954 158,502 21,478 412,364 89,249 715,194' 152,521 I 9,481 470,083 132,810 699,652 l 54,949
19,666 '6°31,718 185,190 863,738 l 97,964 24, l I 5 815,131 185,135 928,751 207,680 33,717 823,116 190,867 890,743 214,795 58,057 763,747 290,281 1,339,320 486,995 11,846 210,676 108,184 1,449,475 133,245
399
Total
247,854 331,035
. 427,447 345,727 398,252 400,504
400,649 453,179 431,062 492,758 529,493,
560,389 499,512 556,021 727,l 06 742,036
768,448 828,195 821,456 857,715 854,601
1,061,702 1,136,431 l, I 05 ,538 1,886,315
582,620

Table 12.7 - IMPORTS BY END
(F.O.B. value
·c O n s u m. e r Calendar Total · Total Fish & Cereal & Fruits & Year Meat &
Imports Consumer Meat Pre- p D:iryt Fish Pre- Cereal Pre- Vegeta-Goods parations ro uc s parations parations bles
1949 585.9 215.7 6.9 27.2 16.3 58.9 20.6 1950 341.9 n.a. n.a. n.a. n.a. n.a. n.a. I 951 489.0 n.a. n.a. n.a. n.a. n.a. n.a. 1952 421.4 114.5 2.6 18.3 7.7 34.6 7.0 1953 452.4 113.2 3.3 24.1 10.2 21.6 9.8 1954 478.7 113.4 7.0 24.0 7.0 25.9 6.2 1955 547:7 139.1 8.1 28.5 12.9 36.9 6.1 1956 506.2 108.4 8.5 29.6 10.8 26.2 4.6 1957 613.2 126.4 8.3 31.5 13.2 37.5 5 .3 1958 558.7 136.0 10.0 29.2 15.3 52.1 2.8 1959 523.6 82.3 5.7 18.9 10.6 23.1 2.1 1960 603.9 99.6 6.0 24.4 21.7 24.5 2.4 1961 611.3 115.7 4.4 24.2 15.5 48.7 2.8 1962 586.7 102.1 . 8.9 3 I. I 9.1 28.1 3.7 1963 618.2 125.5 3.9 18.8 12.2 58.9 5.5 1964 780.3 150.4 6.0 ' 23.9 12.7 66.4 6.7 1965 807.6 185.0 5.5 26.0 13.9 94.8 7.6 1966 852.8 152.9 8.6 28.6 15.7 52.8 9.9 1967 I 062.2 192.0 5.7 29.4 19.5 84.9 9.2 1968 1150.2 168.2 9.6 34.9 22.7 .40.7 10.9 1969 1131.5 157.5 8.9 37.4 18.2 38.1 7.6 1970 I 090.1 125.5 5.1 32.4 16.6 32.5 4.2 1971 1186.0 169.8 5.5 38.5 · 20.5 65.1 3.5 1972 1229.6 202.6 4.0 45.6 19.6 84.3 5.4 1973 1596.6 287.5 2.2 45.2 19.7 111.8 4.0 1974 I st Quarter ,628.1 94.3 0.5 19.9 10.7 22.4 1.4
n.a. - Data not available.
!Consist of essential oils., perfume materials, toilet, polishing and cleaning preparations; silver platinum ge~s & jewelry; · travel goods., h8Jldbags & similar articles; clothing; footwear; miscCllaneous mfd articles n.e.s.j returned goods & special transactions; and leather manufactures n.e.s., & dressed furs.
Note: Details may not add up to totais due to rounding.
Source of data: Central Bank of the Philippines.
400

USEI CY 1949-1 st Quarter 1974
in million U.S. dollars)
G o o d s C a p i t a I G o o d s
Beverages Other Manufac- Total Mach Elec. Mach Trans- Prof. Scien-
&Part, Apparatus Port tific & and Food turers & Capital Other than &App- Equip· Control
Others . Products Others1 Goods Electric liances ment Instruments
20.1 17.4 48.3 80.6 29.7 17.3 28.3 5.4 n.a. n.a. n.a. n.a. n.a. n.a. n.a. n.a.
' n.a. n.a. n.a. n.a. n.a. n.a. n.a. n.a. I 9.9 5.8 18.6 .69.7 31.9 11.0 21.3 5.5 15.6 6.7 21.9 81.0 40.6 13.2 2.J.6. 5.6 11.0 7.5 24.8 "94.5 44.3 17.5 25.4 7.3 15.8 8.6 22.2 111.4 52.2 21.9 30.3 7.0
6.8 6.9 15.0 131.4 77.2 19.6 29.0 5.6 1.7 10.2 18.7 147.8 · 83.0 25.2 33.3 6.4 3.2 6.6 16.8 132.2 77.6 20.3 28.6 5.7 2.7 5.6 13.6 155.2 79.1 29.3 41.0 5.8 .
0.8 4.5 15.3 223.3 86.5 21.2 109.5 6.1
0.5 3.2 16.4 210.7 119.9 25.8 58.6 6.4 1.8 4.0 15.4 196.7 I 05 .3 · 21.5 62.9 -7.0 2.1 3.2 21.0 215.0 113.6 28.7 66.7 6.0 1.6 4.3 28.8 281.5 140.0 42.2 92,0 7.4 2.4 5.0 29.8 283.4 I4i.3 47.5 86.9 7.7
3.8 4.0 29.5 304.8 151.3 36.0 109.9 7.6 6.0 6.4 30.9 415.8 229.0 47.1 130.3 9.4 8.7 6.7 34.0 455.0 238.5 60.6 143.9 11.9
I 1.3 7. I 28.9 455.7 258.5 60.2 124.9 12.0 8 .5 4.6 21.6 413.7 235.2 59.2 106.0 13.2
6. 1 4.5 26.1 -456.3 255.1 66.3 122.2 12.7 8.6 5.1 30.0 433.8 239.9 54.0 123..7 16.2 9.6 . 5.9 89:J 490.9 296.0 70.8 102.3 21.8 4.5 2.6 32.3 150.9 · 89.6 21.0 34.2 6.1
401

Table 12.7 '--- IMPORTS BY END (F.O.B. value
Raw Materia I . s
Total Raw Textiles Mineral Chemi- Dyeing, Calendar Feeding Fibers, Fuels Medici- . Year Materials Stuffs Not Mfd. Lub, ea! Ele- Tanning · nal & and Inter- for Into & ments & Pharm.
mediate Animals Thread Rei. & Color- Products Ggods Yarn Mat. Comp. ing MaL
-------.--- -
1949 289.6 0.7 0.8 35.2 5.6· 6.7 11.6 1950 n.a. n.a. n.a. n.a. n.a. n.a. n.a.
1 1951 n.a. n.a. n.a. n.a. n.a. n.a. n.a. 1952 237.2 1.0 2.3 41.8 5.7 4.0 8.2 1953 258.2 0.9 3.2 48.9 6.2 . 5.2 12.0 1954 .270.8 l.5 2.4 54.1 7.8 5.9 11.3 1955 297.2 1.3 3.5 53.8 8.3 6.4 12.7
1956 266.4 1.5 5.8 52.4 9.0 4.9 10.0 1957 338.9 2.0 8.7 57.9 .11.4. 7.3 13.6
·. 1958 290.5 1.7 13. I 61.0 11.8 5.8 11.4 1959 286.1 2.1 14.7 59.7 13.7 6,2 10.2 1960 281.0 1.9 19.9 59.8 13.7 6.4 9.6 I
1961 284_.9 2.8 22.6 49.2 15.1 6.5 10.7
j 1962 287.8 2.6 29.2 59.8 13.2 6.4 6.3 . 1963 277.7 2.3 25.6 61.8 15. I 6.0 8.0 1964 348.3 2.6 23.2 77.0 19.4 6.3 7.9 1965 339.2 2.6 21.7 75.7 20.1 6.6 6.6
1966 395.'1 3.1 34.9 84.1 22.3 8.1 7.6 ~ 1967 454.2 5.2 29.1 93.7 26.2 7.6 12.2 1968 527.1 7.2 49.5 105.8 33.9 8.5 15.1 , 1969 518.4 7.2 41.8 106.7 34.5 7.1 15.5 1970 55L0 8.1. 40.2 118.9 36,7 8.8 16.5 1 1971 559.9·· 8.1 48.8 141.2 39.9 10.6 17.7
-1972 593.2 .11.0 45.8 148.8 48.2 11.9 16.5 t 1973 818.2 13.3 60.3 18.7.6 75.4 16.1 21.2 1974 1st Quarter 382.9 4.5 20.4 124.4 5'.7 35.5 7.3
2composed of _hides, skins and fur skins, undressed; oil seeds, oil nuts and oil ~kernels: crude rubber inc.luding
1 precious stones; metaliferous ores and scrap metals; animal & vegetable crude materials inedible n.e.s., mineral tar & mbbci' mantifactures; wood and cork manufactures; prefabricated sanitary plumbing, building, heating, fixtures and .. Source of data: Central_ Bank of the Philippines. i
1 ~
402 i l

-------------------------------------------
USE: CY 1949-lst Quarter 1974 in million U.S. dollars)
An d I n t ermediate G ·o o d s
Ferti- Explo" Paper /
Textiles, Non- Base Manu-lizers sives & & Yarns, Metalic Metals factures
Others2 Manu- Chem. Paper Fabrics Mineral of
factured Product Board and Manu. Metals· Mft. Made-up facture
Art-
3.4 3.1 17 .5 112.5 12.8 · 30.4 27.7 21.6 n.a. n.a. . n.a. - n.a . n.a. n.a. n.a. n.a,
n.a. n.a. n.a. n.a. n.a. n.a. n.a. n.a. 10.3 3.2 15.6 77.1 5.9 20.8 18.6 22.7 7.1 5.8 14.8 74.9 6.2 3 I.I 18.0 23.4 4.2 6.8 16.0 82.4 7.7 30.2 I '7 .9 22.6 5.8 7.7 19.0 85.3 8.1 38.5 18.3 28.5
4.2 8.0 18.2 59.6 7.8 44.4. 14.8 25.8 10.2 11.5 20.4 77.2 I 1.0 64.6 18.7 24.4 6.9 12.3 17. 1 53.9 6.4 50.3 18.9 19.9
10.6 . 15. 1 19.6 38.6 7.9 50.4 15. I 22.2 6.8 15.7 16.7 30.5 6.8 56.9 14.0 22.3
9.0 17.6. 21.8 23.3 6.8 . 58.8 15.9 24.8 14.2 18.4 16.5 26.3 · 6.5 50.3 16.1 22.0 4.0 18.9 16.0 20.8 7.5 53.4 15.8 22.5
11.6 22.2 23.2 19.0 11.0 74.2 20.0 30.8 I i.8 24.4 21.9 16.8 9.4 78.0 17.9 25.7
4.9 30.7 24.4 30.6 10.9 84.0 20.3 29.2 10.5 36.I 27.0 31.8 12.4 105.9 25.9 30.6 8.6 38.4 27.3 43.6 11.9 · 109.7 32.5 35.1 8.7 41.7· 28.7 33.6 10.6 116.3 33.8 32.2 9.0 49.8 29.3 23.9 10.1 144.4 21.8 33.5
14.4 56.4 34.1 23.4 · 13.5 90.7 26.0 35.1 11.8 54.3 35.4 25.3 10.8 112.4 22,8 38.2 14.8 80.1 34.0 47.2 16.2 150.4 47.8 53.8 7.4 28.6 16.? 18.9 5.8 76.9 13.3 17.4
~ynthetic and reclaimed; wood, lumber and cork; pulp and waste paper; crude fertilizers, minerals, except coal I crude chemicals from coal, petroleum and natural gas; live animals not for food; animal & vegetable oils (riot essential);
fittings; and furniture & fixtures.
403

. Table 12.8 - QUANTUM, PRICE AND VALUE INDICES;NET TERMS OF TRADE AND PURCHASING POWER OF EXPORTS (ALL COUNTRIES):
CY 19 50-1 st Quarter 1974 (1965 = I 00)
Quantum Index Price Indexl Value Index Net Purchasing Period Terms of Power of
Imports Exports Imports Expor,ts Imports Exports Trade Exports
1950 54.5 41.4 78.1 106.1 42.5 44.0 135.0 56.3 i
1951 68.1 46.4 88.1 113.2 59.9 53.2 128.5 59.6 ~ 1952 61.7 51.7 87.8 89.2 53.6 45.9 · 101.6 50.9 1953 68.2 48.4 82.8 108.9 56.5 52.7 131.5 63.6 1954 75.4 53.7, 79.2 96.6 59.6 52.0 122.0 65.7
1 1955 85.4 58.6 79.2 88.6 67.7 51.9 111.9 65.6 1956 78.6 65.4 80.3 89.9 63.2 58.8 112.0 73.2 1957 93.2 61.4 82.9 91.1 · 77.2 55.9 109.9 67.5 1958 82.3 67.7 84.8 94.8 69.8 64.3 111.8 75.7 1959 74.5 67.2 86.5 102.7 64.4 69.0 118.7 79.8
1960 82.4 72.2 88.4 101.2 72.8 73.0 114.5 82.7 1961 84.5 69.8 89.7 93.1 75.8 65.0 103.8 72.4 1962 80.0 76.5 91.4 94.1 73.1 72.1 103.0 78.8 1963 78.6 95.1, 97.5 99.1 76.7 94.2 101.6 96.6
. 1964 97.3 97.4 98.3 98.3 95.6 95.8 100.0 97.4
1965 100.0 100.0 100.0 100.0 100.0 100.0 100.0 100.0 1966 106.4 106.0 I 01.6 109.9 JOO.I 107.2 99.3 105.3 1967 126.7 102.3 103.9 102.7 131.7 105.1 98.8 I 01.1 1968 138.3 103.8 103.3 107.9 142.9 I I 2.0 104.4 108.4
l 1969 132.4 100.4 105.9 109:8 140.1 110.2 103.7, 104.0
1970 123.8 114.5 109.0 120.5 1311.9 137.8 110.6 126.6 1971' 124.8 131.2 119 .l 112.1 148.6 147.1 94.1 ,, 123.6 1 - 1972 I I 8.7 143.7 128.0 100.0 151.9 143.7 78.2 112.2 1973 132.8 163.5 149.1. 149:0 211.6 230.0 ·99.4 161. 7 , 1974 1st Quarter 143.7 128.3 218.1 237.6 310.8 304.0 109.6 419.9
1Unit value of imports are based on C.I.F. value whQe those for ex~rts are based on 1".0.B. value. ..
Source of data: Central Bank of the Philippines. ~
404

- --- ~-----:------------------------
CHAPTER XIII
FAMILY-INCOME AND EXPENDITURES
Figure 13.1 Cumulative Percentage Distribution of Families and of Total Family Income by Income Class, Philippines: 1956-57, 1961, 1965 and 1970-71 . 409
Table 13:I Median and Average ·income of Families, Urban and Rural: 1956-57, 1961, 1965 and 1971 410
Table 13.2 Percent of Family income Received by each Quintile and by the top 5 and 10 Percent of Families, 1956-57, 1961, 1965 and 1971° 410
Table 13.3 Total Number of Families and Total and Average Family lnoome and Expenditures, by Region: 1957, 1961, 1965, 1971 412
Table I 3.4 Total Number of Families by Income Class, Urban -and Rural: 1'957, 1961, 1965 and 1971 414
Table 13.5 Total Family Income by Income Class, Urban and Rural: 1957, 1961, 1965 and 1971 , . · . 416
Table 13.6 Distribution of Families by Income Class by Region: 1957, 1961, 1965.and 1971 418
Table 13.7 Total Family Income by Income Class by Region: 1957, 1961, 1965 and 1971 422
Table 13.8 Total Family Expenditures by Expenditure Group, Urban and Rural: 1957, 1961, 1965 and 1971 426
Table 13,9 Total Family Expenditures by Expenditure Group, by Region: 1957, 1961, 1965 and 1971 428
■

CHAPTER XIII
FAMILY INCOME AND EXPENDITURES
This chapter presents statistics on family income and .expenditures which serve as indicators of levels of limg. Data on family income reflect varying degrees of inequality among families which should be mitigated or rectified by appropriate public policies. Family income .data also provide important insights on the potential purchasing power of families and expenditures data serve as indicators of the extent and character of consumer demand for goods and services. ·
Family income and expenditures data are compiled and published by the National Census and Statistics Office in its pUblicl!tion NCSO Survey of Households Bulletin. Available series are published in the 1957, 1961, 1965 and 1971 issues of the Bulletin. Such series include data on· the distribution of households by income ·and expenditure class for every region and by urban-rural classificafioiii Households .are classified by characteristics such as size of family, types and sources of income, types and items of expenditures, number of family members employed, and other information.
·· All income and expenditures data were collected through direct interviews with the head of the family or his wife ,or with any other responsible member of the family. The family household is taken to comprise the immediate members of the nuclear family and other persons living with the household and related to the head of the family by blood, marriage or adoption, and who are not mere boarders, guests, or domestic help.
Household income consists of both cash and non-cash incomes which accrued to the members of the household during a specified period. Household income consists of income which accrued to the members of .the household during a specified period. It includes income of the members of the family who actually lived in the household at any time during the period of .coverage but who were not enumerated with the household during the survey. Hence only their income while living with the household is included.
Household income' is classified by source, either income from work or income from sources other than work. Income from work includes -wages, salaries, and income from self-employment and other
406 i

activities, whether in cash or in kind, before payment of taxes, retirement deductions, insurance premiums, etc. Income generated from self-employment or entrepreneurship comprise net profits or fees accruing to the individual as proprietor or partner of enterprises or as an independent worker in his own farm, profession, business, or trade.
Income from sources other than work includes re.nts from properties and of owner-occupied houses, interests and dividends, pensions and annuities, retirement and insurance benefits, gifts, etc.
Expenditures are those incurred for consumption by the family household individually or as a group. It excludes expenses relating to farm or business operations, expenses for investments, and other disbursements not considered household expenditure for consumption. Expenditures are classified into (I) food, beverages, and tobacco; (2) housing and household operations; (3) clothing and other kinds of wearing apparel; (4) personal care; (5) medical care; (6) transportation and communication; (7) recreation; and (8) other goods and services. They ·are also classified according to type of goods as follows: or consumables, i.e., goods that perish when used such as food, fuel, electricity, etc., (2) non-durable goods; i.e., articles, goods, or equipment that last not more than .a year; (3) durable goods, i.e,, goods, equipment, tools and other articles that will last more than one year; and ( 4) services rendered to the household.
Regional Grouping
Region I - Manila and Suburbs Manila; Quezon City; Caloocan .City; Pasay City; Makati;
Mandaluyong; San Juan; Navotas.
Region II - Ilocos-Mountain Province Abra; Ilocos Nort~; Ilocos Sur; La Union; Mountain Province.
Region III - Cagayan Valley and Batanes Batanes; Cagayan; Isabela; Nueva Vizcaya.
Region IV - Central Luzon Bataan; Bulacan; Nueva Ecija; Pampanga; Pangasinan; Tarlac;
Zam bales.
Region V - Southern Luzon and Islands Batangas; Cavite; Laguna; Marinduque; Occidental Mindoro;
Oriental Mindoro; Pala wan; Quezon; Rizal.
Region VI - Bicol Albay; Camarines· Norte; Camarines Sur; Catanduanes; Masbate;
Sorsogon.
407

Region VII. -- Western Visayas
Aklan; Antique; Capiz; Iloilo; Negros Occidental; Romblon ..
Region VIII -- Eastern Visayas
Bohol; Cebu; Leyte; Negros Oriental; Saniar;- Southern Leyte.
Region IX -- Northern Mindanao
Agusan; Bukidnon; Lanao de! Norte; Lanao de! Sur; Misamis Occidental; Misamis Oriental; Surigao de! Norte; Surigao de! Sur.
Region X -- Southern Mindanao and Suiu
Cotabato; Davao; Sulu; Zambcianga de! Norte; Zamboanga de! Sur._
'
408
•
• 1
• • 1
~ , t ◄
1 . '~

'
' '
..
100
Q)
90 E 0 u C
80 >.
E 70 C LL
C 60 ... 0 I-... 50 0 ... C Q)
40 u .. Q) .,_ Q) 30 > ... C 20 :, E :, u 10
0
Figure 13. l
CUMULATIVE PERCENT AGE DISTRIBUTION OF FAMILIES AND OF TOTAL FAMILY INCOME BY INCOME CLASS,
PHILIPPINES 1956-57, 1961, 1965 and 1970-71
I/
-
. -1/ I/
,.: V '!-0~ • 1 .0 10
~ A .. . C,
0
V ~ 0
6' ,
~ ,
... ,(
I/ ~
i/· F .Je ~-..
. 10
...... ~-,,.• 1,;!11, -:". ; '
J.• ••• •
.. . . ~ . .... 20 30 40 50 60 70 80 90 100
Cumulative Percent of Fam ii ies
Legend: - 1956-571 ----- - 1 961 ll ....... -·-·· - 1 9 6 5 Y -·-·-·- - 1970-713
1 Refers to the twelve-month period ending February 28, 1957. 2 Refers to the calendar year. 3 Refers to the twelve-month period ending April 30, 1971.
Source: National Census and Statistics Office.
409

Table 13.1 - MEDIAN AND AVERAGE INCOME OF FAMILIES,
Family Oass
Philippines Urban
Manila & suburbs Other urban·
Rural
Philippines1
Urban 2 .
Manila & suburbs Other urban
Rurat3
• Twelve month period ending February 28, 1957. b Calendar Y w-e Twdve month period ending April 1971.
1956-57'
924 1,517 2,691 1,309
779
1,283 2,075 3,681 1,791 1,091
I Deflated with Philippine conmmer price index, 1965 ~ 100.
Median Income
I 961 b. 1965b 1971<
Current
1,105 1,648 2,454 . 1,799 2,636 3,972 3,004 3,720 5,202 1,559 2,285- 3,650
900 1,359 1,954
·constant
1,384 1,648 1,532 2,232 2,636 2,593 3,727 3,720 3,396 1,934 2,285 2,383 I, 131 1,359. 1,206
Table 13.2 PER CENT OF FAMILY INCOME RECEIVED
. PER CENT OF FAMILIES, 1956-
Families (ranked from lowest Per Cent of Total Family Income Share of
income to highest) 1956-578
- Lowest 20 per cent 4.5 Second 20 per cent 8.1 Third 20 per cent 12.4 Fourth 20 per cent 19.8 Fifth 20 per cent 55.1
· Top I O per cent 39.4 Top 5 per.cent 27.7
Total 100.0
• Twelve month period ending February 28, 1957. b Calendar Year. -
1961 b
4.2 7.9
12.1 19.3 56.5
41.0 29.0
roo.o
1965b 1971<· 1956-57
3.5 3.6, 261,086 8.1 8.1 474,594
12.8 13.3 721,177 20.l 21.0 1,155,359 55.5 54.0 3,212,080
40.1 37.1 2,296,053 28.7 24.8 1,611,598
100.0 100.0 5,824,296
~
' r
"
-~

URBAN AND RURAL, 1956-57, 1961, 1965 AND 1971
Ave. Annual Average Income Ave. Annual Increase(%)
1961b .· 1965b 1971 C
Increase (%} 1956-1971 1956-571
'1956-71
Pesos
8.4 1,471 1,804 2,541 3,736 7.9 8.3 2,427 2,970 4,405 5,867 7.4 5.4 4,255 4,790 6,590 7,785 4.9
\ 9.0 1,902 2,395 3,463 5,14,1 · 8.5 7.9 989 1,203 1,755 2,818 9.4
1965·Pesos
.1.4 2,043 2,261 2,541 2,332 I.I 1.7 3,320 3,685 4,405 3,830 1.2
...:.0.5 5,821 5,943 6,590 5,082 --0.7 2.2 2,602 2,971 3,463 3,356 2.0 0.7 1,385 1,511 1,755 1,740 1.7
2 Deflated with M&hila conrumer price index, 1965 Cl' 100. ~ Deflated with consumer price index for regions outside Manila, 19~5 = 100.
Source: National Census and Stati!tica Office, Survey of Household,, Family lnCome and Expenditures, 1956-57, 1961, 1965 and 1971.
. . .
B)'. EACH QUINTILE AND BY THE TOP 5 AND 10
57, 1961, 1965, and 1971 •
Total Family Income (Pl,000) Average Income Within Group '(Pesos)
1961 · 1965 1971 . I 956-57 1961 1965 1971
337,401 458,108 872,237 331 383 447 687 632,500 1,046,104 1,932,718 598 712 1,020 1,523 965,504 1,672,018 3,134,705 909 1,090 1,631 2,470
1,541,002 2,626,133 4,981,219 1,494 1,738 . 2,562 3,924 4,505,359 7,221,245 12,793,406 4,024 5,094 7,044 10,079
5,800 3,273,668 5,217,118 .8,790,570 7,397 10,178 13,850 2,314,533 3,738,125 · 5,876,452 8,142 10,460 14,585 18,518
7,981,766 13,023,610 23;714,284 1,471 1,804 2,541 3,736
c Twelve month period ending April 1971. ~
Source: National Ceruus and Statistics Office, Survey of Households, Family Income and Expenditures, 1956-57, 1961,
I 965 and I 971.

----- - -- -----
Table 13.3 TOTAL NUMBER OF FAMILIES AND EXPENDITURES, BY REGION:
(Total Income or Expen
1957
No. of Income - Expenditures Region
Families Total
Average Average (Thousands) (Pesos) Total (Pesos)
Philippines 3,959 5,824,296 1,471 5,086,774 1,285 Region I 296 1,261,079 4,255 1,145,296 3,864 • Region II 286 369,315 1,292 _ 294,937 1,031 Region Ill 190 242,374 1,273 207,884 1,092 Region IV 517 780,247 1,509 708,407 1,370 Region V 477 717,887 1,504 617,813 _1,295 Region VJ 334 36 I ,932 1,084 331,225 992 Region VII 595 775,708 1,303 675,050 1,134 Region VIII 653 605,488 928 537,381 ·823 Region IX 347 408,709 1,178 322,308 929 Region X 263 301,558 1,146 '246,474 937
1965
Region No. of Income Expenditures
. Families Total
Average Total
Average • (thousands) (Pesos) (Pesos)
Philippines 5,126 13,023,610 2,541 14,748,076 2,877 l Region I 458 3,016,318 6,590 3,059,652 6,685· Region ll 302 493,987 1,633 618,799 2,046 Region III 175 231,655 1,322 320,331 · 1,828 Region IV 739 1,919,053 2,595 2;268,551 3,068 Region V 640 1,935,716 3,025 2,080,512 . 3,25 I Region VI 407 822,692 2,024 I ,I 04,897 2,718 Region VII 570 1,133,563 1,990 I ;295,074 2,273 Region VIII 859 1,393,454 1,622 1,618,427 1,884 Region IX 361 845,558 2,342 967,933 2,681 Region X 6r5 1,231,613 2,004 1,413,900 2,300
Source of data: National Census and' Statistics Office, Family Income and Expenditures Bulletin·
for 1957, 1961, 1965 and 1971.
412

TOTAL AND AVERAGE FAMILY INCOME AND 1957, 1961, 1965, 1971 diture in thousand pesos) .
1961
No.of Income Expenditures Region
Families Total Average Total
Average (Thousands) (Pesos) (Pesos)
4,426 7,981,766 1,804 7,934,063 1,793 PHILIPPINES 361 · 1,728,429 4,790 1,585,308 4,394. ltegion I 309 383,198 1,242 408,317 1,323 Region II 215 256,295 1,189 276,704 1,284 Region III 582 997,448 1,7-13 1,063,146 1,826 Region IV 548 1,146,249 2,092 1,058,510 1,932 Region V 374 561,971 1,501 5.37,706 1,436 Region VI 654 l,056,i98 1,614 1,054,816 1,612 Region VII 700 . 816,340 1,166 835,761 1,194 Region VIII
- 395 616,666 1,560 715,483 1,810 Region IX-286 418,973 l,463 398,312 1,391 Region X
1971
No. of Income Expenditures Region
F'amilies Total
Average Total Average_
.(Thousands) (Pesos) (Pesos)
6,347 23,714,284 3,736 28,430,424 4,479 PHILIPPINES
525 4,085,629 7,785 4,077,102 7,769 Region I 346 - .1,142,678 3,299 1,415 ,64 I 4,087 Region II 260 620,373 2,390 682,295 2,628' Region III 855 3,529,629 4,127 4,158,065 4,862 Region IV 869 3,763,519 4,332 4,741,639 5,458 Region V 496 1,379,438 2,784 2,013,613 4,064 Region VI 670 2,147,428 3,206 2,586,787 3,861 Region VII 980 2,495,547 2,548 2,941,332 3,003 Region VIII 522 1,598,148 3,062 1,858,567 3,561 > Region IX 825 2,951,896 3,577 3,955,382 4,793 Region X
413

Table 13.4 TOTAL NUMBER OF FAMILIES BY INCOME
y e a r I · 9 5 7
Total Manila Other
Income Class Philippines Rural Urban and Urban Suburbs Areas
Number of families (in thousands) 3,959 2,631 1,328 296 1,031
Per cent 100.0 -100.0 100.0 100.0 100·.o
Under I' 500 22.5 28.7 JO.I 1.5 12.6 I' 500 to I' 999 32.4 38.0 21.3 7.6 25.2 I' 1,000 to I' 1,499 16.5 I 5.7 I 8.1 12.4 19.8 I' I ,SOO to ·l' 1,999 10.5 8.5 14.4 14.7 14.2 I' _2,000 to I' 2,999 8.5 5.9 13.8 19.2 12;3 I' 3,000 to I' 4,999 5.7 2.4 12.3 20.2 9.9 I' 5,000 and over '. 3.9 0.7 I 0. I 24.4 6.0
y e a r I 9 6 ·5
Total ·total Manila Other Income Class Philippines Rural Urban and Urban
Suburbs Areas
Number of families (in thousands) 5,126 3,606 1,520 458 1,062
Per cent 100.0 100.0 100.0 100.0 100.0 --Under I' 500 11.6 14.5 4.5 0.8 6.2 I' 500 to I' 999 17.7 21.9 7.7 2.4 10.0 I' (,000 to I' 1,499 16.7 18.8 11.7 5.3 14.5 I' I ,SOO to I' 1,999 13.5 14.4 11.4 9.0 12.4 I' 2,000 to I' 2,999 I 7 .5 I 5,8 2-1.6 · 21.8 21.4 I' 3,000 to I' 4,999 13.5 10.7 20.0 25.1 17.8 I' 5,000 and over '9.ll 3.7 23.1 35.6 17.6
' Source of"data: National Census and Statistics Office. Family Income and Expenditures Bulletin for 1957, 1961, 1965, and 1971.
414

CLASS, URBAN AND RURAL: 1957, 1961, 1965 and 1971
y e a r 1 9 6 1
Total Manila Other
Philippines Rural Urban
and Urban Income Class Suburbs Areas
Number of famil/es 4,426 2,921 1,505 361 1,144 (in thousands)
100.0 100.0 100.0 100.0 100.0 Per cent ·--
17.0 21.2 8.8 I 0.9 11.3 Under I' 500 29.3 36.0 16.3 4.6 20.0 I' 500 to I' · 999 17.8 18.8 16.0 13.2 16.8 I' 1,000 to I' 1,499 12.0 10.5 14.9 ' 12.2 15.7 I' i-,500 to I' 1,999 . 10.8 8.2 15.9 18.9 15.0 I' 2,000 to I' 2,999 7.4 3.7 14.3 21.1 12.2 I' 3,000 to I' 4,999 5.8 1.6 13.7 28.9 9.1 I' 5,000 and over
y e a r 9 7 1
Total Total Manila Other
Philippines Rural Urban and Ur1'an Income Class
Suburbs Areas
Number of families
_6,347 4,434 1,913 525 1,388 (in thousands)
100.0 100.0 100.0 100.0 100.0 Per cent
5.2 6.6 1.9 0.2 2.6 Under I' 500 12. 1 15.8 3.5 0.9 4.4 I' 500 to I' 999 V
12.2 15.0 5.6 1.7 . 7.1 I' 1,000 to I' 1,499 11.8 13.9 7.0 4.0 . 8.1 I' 1,500 to I' 1,999
17.7 18.0 17.3 15.5 18.0 I' 2,000 to I' 2;999 20.0, 17.9 24.9 26.2 24.4 I' 3,000 to I' 4,999 21.0 12.8 39.8 51.4 35.4 f' 5,000 and over
415

Table 13.5 TOTAL FAMILY INCOME BY INCOME CLASS,
Y e a r 9.5 7
Total Total Manila Other Income Class Philippines Rural Urban and Urban
Suburbs Areas
. Amount (thsd. pesos) 5,824,296 2,601,799 3,222,497 I ,261,079 I ,96 I ,418
Per cent 100.0 100.0 100.0 100.0 100.0
Under f' 500 5.3 JO.I . 1.4 0.1 2.3 -j> 500 tot' 999 16. i 27.7 6.6 1.4 10.0 t' 1,000 to f> 1,499 13.7 19.2 9.3 3.7 12.9 t' 1,500 to f> 1,999 12.3 14.8 - 10.2 6.1 12.9 t' 2,000 to t' 2,999 14.1 14.4 13.9 11.1 15.6 t' 3,000 to f'-4,999 14.4 8:6 19. I 17.9 19.8 f' 5,000 and ove~ 24.2 5.3 39.5 59.7 26.5 .. Median income (pesos) 924 779 1,517 2,691 1,309
1, • Ave. income (pesos) 1,471 989 2,427 4,255 1,902
Y e a r I 9 6 5
Total Total Manila Other Income Class Philippines and Urban Rural Urban
Suburbs Areas
Amount (thsd. pesos) 13,023,6'10 6,327,716 6,695,894 3,016,318 3,679,575
Per cent 100.0 100.0 · 100.0 100.0 100.0
Under f' 500 1.4 2.6 0.3 l 0.5 t' 500 toi' 999 5.3 9.4 1.3 0.3 2.2 t' 1,000 tot' I ,499 8.1 13.2 3.3 1.0 5.2 t' 1,500 to f' 1,999 9.2 14.1 4.5 2:4 6.3 t' 2,000 to f' 2,999 16.9 22.0 12.0 8.2 I 5.2 t' 3,000 to f'4,999 20.1 23.0 17.3 14.8 1_9.4 f' 5,000 and over 39.0 15:7 61.2 73.3 51.2
Median income (pesos) 1,648 1,359 2,636 3,720 2,285 Ave. income (pesos) 2,541 I, 755 4,405 6,590 3,463
8Less than 0.05 per cent
Source of data: National Census and Statistics Office, Family Income and Expenditures Bulletin for 1957, 1961, 1965, and 1971.
416
~

URBAN AND RURAL: 1957, 1961, 1965 and.1971
Y e a r 9 6 I
Total Total Manila Other Philippines Rural Urban and Urban· Income Class
Suburbs Areas \
7,98 I ,766 3,512,793 4,468,973 1,728,429 2,740,544 Amount (thsd. pesos)
100.0 100.0 100.0 100.0 100.0 Per cent
3.3 6.3 1.0 0.1 1.6 Under -t> SOO 12.0 22.0 4.1 0.8 6.2 !" SOO to!" 999 12.2 19.1 6.7 3.6 8.7 !" 1,000 to 1" l ,499 I 1.5 1s·.o 8.6 4.4 11.3 !" I ,SOO to I" 1,999 14.S 16.2 I 3. I 9.7 I 5.2 P 2,000 to !"2,999 15.2 11.4 18.4 16.7 .19.4 · I" 3,000 to !"4,999 31.3 10.0 48.1 64.7 37.6 !" S ,000 and over
I ,!OS 900 1,799 3,004 1,559 Median income (pesos) . 1,804 · J,203 2,970 4,790 2,395 Ave. income (pesos)
Y e a r 9 7 I
Total Total Manila Other Philippines Rural Urban and Urban Income Class
Suburbs Areas
23,714,284 12,493,416 11,220,868 4,085,629 · 7,135,239 Amount (thsd. pesos)
100.0 100.0 100.0 100.0 100.0 Per cent
0.5 0.8 0.1 0.0 0.2 Under I" 500 2.4 4.2 0.4 0.1 0.6 ·p SOO to!" 999 4.1 6.6 1.2 0.3 1.7 I" 1,000 to -t> 1,499 5.5 8.5 2.1 0.9 2.8 I" 1,500 to I" I ,999
11.8 I 5.7 7.4 5.0 8.7 I" 2,000 to 1"2,999 20.4 24.1 16.3 13.0 18.2 P 3,000 to !"4,999 553 40.0 72.4 80.6 67.7 !" S ,000 and over
2,454 1,954 3,972 5,202 3,650 Median income (pesos) 3,736 2,818 5,867 7,785 S,14 I Ave. income (pesos)
417

Table 13.6 DISTRIBUTION OF FAMILIES BY INCOME
Number of Percentage Distribution
Region/Year Families All Income Untjer f'-500 to (In ·Thousands) Groups '!"SOO 1"999
Region I ( 1957 296 100.0 1.5 7.6 1961 361 100.0 0.9 4.6 1965 458 100.0 0.8 2.4 1971 525 100.0 0.2 0.9
Region II· 1957 286 100.0 23.4 32.3 1961 309 100.0 25.2 29.6. 1965 302 100.0 15.2 28.S I 971 346 100.0 5.5 18.7
Region Ill 1957 '·· 190 100.0 19.3 35.8 1961 215 100.0 26.0 38.3 I 965 175 100.0 . 23.3 28.1 1971 260 100.0 5.6 15.4
Region IV 1957 517 100.0 14.3 30.4 1961 582 100.0 I 1.5 28.1 1965 739 100.0 6.6 15.9 1971 855 100.0 4.2 8.9
Region· V . 1957 477 100.0 11.7 33.6 1961· 548 100.0 · 8.1 24.2 1965 · 640 100.0 6.9 10.3 1971 869 100.0 3.9 8.6
418

CLASS BY REGION: 1957, 1961, I 965 and I 971 '
By Income Group
PI ,000 to PI ,500 to P2,000 to P3,000 to 1'5,000 and Pl,499 PI ,999 !'2,999 !'4,999 over
12.4 14.7 I 9.1 20.3 24.4 13.2 12.2 18.9 21.1 28.9 5.3 9.0 21.8 25. I 35.6 1.7 4.0 15.5 26.2 51.4
21.8 8.9. 6.6 4.2 2.6 20.0 9.6 8.4 5.9 1.2 20.2 13.9 9.7 9.1 3.3 18.5 11.6 1,2.6. 16.0 17.0 ·
18.9 11.7 6.7 5.6 2.1 14.2 6.1 8.1 4.4 3:0 .. 20.4 15.0 7.6 2.5 3.3 23.6 17.6 16.5 12.9 8.2
19.1 13.9 13.3 6:1 2.8 19.7 16.0 13.1 7 .1 4.6 15.4 12.4 21.3 17.9 10.5 9.1 8.0 18.0 25.6 26.1
20.5 12.4 12.1 6.4 3.2 18.2 · 17.0 14.8 10.7 6.9 12.6 16.2 24.3 19.0 10.8
· 11.2 -10.1 16.8 22.9 . 26.4
,'
419

Table 13.6 DISTRIBUTION OF FAMILIES BY INCOME CLASS
Number of Percentage Distribution
Region/Year Families All Income Under '1"500 to (In Thousands) Groups P500 P999
Region VI 1957 334 100.0 31.0 36.7 1961 374 100.0 21.8 :U.3 1965 407 100.0 11.6 19.5 1971 496 I 00.0 3.5 18.1
· Region VII 1957 595 100.0 24.7 31.8 1961 654 100.0 15.9 33.8 1965 570 100.0 9.7 20.1 1971 670 100.0 3.4 ·s:r . ·'-"· -.
Region VIII 1957 653 100.0 37.3 36.0 1961 700 100.0 25.4 37.8 1965 859 100.0 21.0 22.8
· 1971 980 100.0 13.7 18.9
Region IX 1957 347 100.0 26.2 36.7 1961 395 100.0 13.9 29.2 1965 361 100.0 10.0 19.9 1971 522 100.0 4.3 14.6
Region X 1957 263 · 100.0 25,8 41.5 1961 286 100.0 29.1 30.6 1965 615 100.0 14.9 18.9 1971 825 100.0 3.2 I 1.8
Source of basic data: Natioital Census and Statisties·Offrce, FamUy lncom_e and E~pendltutu Bulletin for 1957, 1961, 1965 and 1971.
420 ·

.,
BY REGION: ' 1957, 1961, 1965 and 1971 (continued)
·' '
By Income Group
' 1'1,000 to l"l ,500 to 1"2,000 to 1"3,000 to 1"5 ,000 and P, 1,499 t"l,999 1"2,999 1"4,999 over
11.0· 6.7 3.6 3.0 2.0 17.3 9.3 8:8 6.0 4.4. 22.3 13.2 15.7 I 1.4 6.4 18.0 · 13.8 17.4 16.4 12.7
. 16.4 11.8 8.3 5.1 · 2.0 18. 1 12.1 ILi 5.8~ 3.2 22.0 15.0 16.9 10.7 5.5 13.8 14.8 24.7 I 9.1' 15.3
12.4 6.8 4.0 2.3 J.4 16.0 9.5 5.7 3.5 2.0 18.8 13.4 13.3 6.9 3.8 13. l · 14.l 14.5 13.1 12.5
14.4 · 10.2 6.2 4.5 -J.9 23.3 13.3 12.0 5.0 3.2 15.8 12.6 17.8 14.2 ·. 9.8 14. I 12.8 19.3 21.0 13.8
13.9 7.4 5.2 4.0 2.2 16.5 8.6 5.8 5.5 4.0.
. I 7.3 14.4 16.6 12.0 6.0 9.6 13.6 20.1 21.5 20.2
421

Table 13.7 TOTAL FAMILY INCOME BY INCOME
Total P e r c e n t a g e Distri bution-
Region/Year Family Income All (In thousand Under :r-500 to f>l ,000 to
pesos) Income P500 l.'999 PI ,499 Groups
Region I 1957 1,261,079 100.0 1961 1,728,429 100.0 0.1 0.8 3.6 1965 3,016,318 100.0 (c) . 0.3 1.0 1971 4,085,629. 100.0 0.0 0.1 0.3
Region II 1957 369,3 I 5 100.0 1961 . 383,198 100.0 6.6 17.8 19.8 1965 493,987 100.0 2.8 12.8 14.9 ~-971 1,142,678. 100.ff 0.5 4.2 6.8
Region III 1957 242,374 100.0 1961 256,295 100.0 7.8 22.7 14.4 1965 231,655 100.0 5.9 14.1 19.5 1971 620,373 100.0 0.8 4.8 12.4
Region IV 1957 780,247 100.0 1961 997,448" 100.0 2.5 12.1 14.1 1965 1,919,053 100.0 0.8 4.6 7.4 1971 3,529,629 100.0 0.4 1.6 2.7
· Region V 1957 717,887 100.0 1961 1,146,249 100.0 1.4 9.0 10.7 1965 1,935,716 100.0 0.8 2.6 5.2
. 1971 3,763,519 100.0 0.3 1.6 3.2
( c) Less than 0.05 per cent. lNo ·perce~tage distribution avo.il.ahle for• 1957.
1 ~ 1 1
422 Ill

CLASS BY REGION: 1957, 1961, 1965 and 1971
B y .Income Group 1
Pl ,500 to :1'2,000 to :1"3,000 to !>5,000 Median Average Income Income f>l ,999 :1'2,9.99 f"4,999 and Over (Pesos) (Pes9s)
2,691 4,255 4.4 9.7 l 6.7 64.7 3,004 4,790 2.4 8.2 14.8 73.3 3,720 6,590 0.9 5.0 13.0 . 8!.6 5,202· 7,785
863 l ,292 I 3.7 17.0 17.4 7.7 918 1,242 14.2 14.4 22.0 -19.0 l, l 55 l ,633 6.3 9.3
' 18.8 54.l 1,814 3,299
924 l ,273 8.7 16.5 13.4 16.5 813 1,189
20.5 14.8 7.3 l 7.9 975 1,322 12.8 16.9 20.4 3 l.8 1,652 2,390
1,122 1,509 l 6.0 18.2 15. 7 2 l .4 1.264 1,713 8.3 20.2 26.1 32.6 i :984 2,595 3.4 10,7 24.1 57.1 3,119 4,127
1,096 l·,504 14.0 1 7.1 l 9.0 · 28.3 1,486 2,092 9.3 19.6 23.8 38.8 2,139 3.025 4.1 9.7 20.1 61.0 2,960 4,332
423

Table 13.7 TOTAL FAMILY INCOME BY INCOME
( C 0 n t i
P e r c e n t a g e Distribution Total
· Region/Year Family Income All (In thousand Income Under t>500 to t'l ,000 to
pesos) Groups 1'500 P999 i>l ,499
Region VI
1957 361,932 100.0 1961 561,971 100.0 5.0 16.0 13.8 1965 822,692 100.0 2.0 7.5 13.6 I 971 1,379,438 100.0 0.5 4.9 8,2
Region VII
1957 775,708 100.0 I 961 1,056,198 100.0 3.7 15.4 13.9 1965 1,133,563 · 100.0 1.5 7.7 13.7 1971 2,147,428 100.0 0.4 2.1 5.6
Region VIII
1957 605,488 100.0 1961 816,340 100.0 7.5 23.4 16.6
t 1965 1,393,454 100.0 3.9 10.7 14.2 1971 2,495,547 100.0 1.7 5.5 6.4
Region IX
1957 408,709 100.0 1961 616,667 100.0 3.3 13.6 18.7 1965· 845,558 100.0 1.5 6.4 8.3 1971 1,598,148 100.0 0.5 3.6 . 5.7
Region X
1957 301,558 100.0 1961 418,973 100.0 7.2 15.3 13.9 1965 1,231,613 100.0 2.4 7.2 10.7 1971 2,951,896 100.0 0.3 2.6 3.3
Source of data: National Census and Statistics Office, Family Income and Expenditures Bulletin for 1957, 1961, 1965 and 1971.
4 424 -~
j
I I

CLASS BY REGION: 1957, 1961, 1965 and 1971
n u e d )
B. y Income Group 1
Median Average PI ,500 to 1"2,000 to P'.3,000 to 1'5,000 Income Income
t>-1,999 1"2,999 N,999 and Over (Pesos) (Pesos)
730 1,084 10.7 14.5 14.8 25.0 936 1,501 1 I. I 19.3 20.7 25.6 1,422 2,024 8.5 15.3 22.2 40.4 1,875 2,784
887 1,303 12.8 16.7 13.4 24.1 1,009 1,614 13.0 . 20.9 19.8 23.3 1,458 1,990
8.0 19.0 22.7 42.2 2,332 3,206
614 928 14.0 11.7 10.6 , 16.2 825, 1,166 14.1 20.0 15.9 21.2 1,167 1,622 9.5 14.1 I 9.3 43.6 1,652 2,548
804 1,178 14.8 18.3 12.4 18.9 1,147 1,560 9.4 18.6 22.2 33.6 1,670 2,342 7.3 15.5 26.3 40.9 2,187 3,062
763 1,146 I 0.1 8.9 14.4 30.1 842 1,463 12.4 19.~ 22.4 25.3 1,468 2,004 6.7 13.9 22.9 50.3 2,549 .3,577
425

Table 13.8 - TOTAL FAMILY EXPENDITURES BY EXPEND!
9
Expenditure Group Philippines Total Total
Rural Urban I
Amount (in thousand pesos) 5,086,774 2,277,376 2,809,398 Per Cent 100.0 100.0 100.0
Food 46.l 53.6 40.0 Alcoholic beverages 1.7 1.7 1.6 Tobacco I 2.9 2.9 2.9 Housing 10.5 7.1 13.2 Fuel, light and water 5.1 5.6 4.7 Household furnishings and equipment 2.1 2.3 2.0 Household operation 3.3 2.1 4.2 Clothing and other wear 7.9 8.6 7.3
t Personal care 2.0 1.7 2.2 Medical care 2.4 2.4 2.4 Transport and communication 3.1 .2.1 3.9 Recreation 1.9 1.3 2.4 Education 4.6 3.1 - 5.8 Gifts and contributions I. I 0.9 1.2 Taxes 0.6 0.2 1.0 Special occasions 2.9 3.3 2.6 Personal effects 0.6 0.6 0.6 Miscellaneous goods and services 1.3 0.5 2.0
9
Amount (in thousand pesos) 14,748,076 7,723,445 7,024,631
t Pei Cent 100.0 100.Q 100.0
Food 53.7 60.6 46.1 Alcoholic beverages 1.6 2.0 I. I Tobacco 3.2 3.3 3. I Housing 9.1 5.0 13.7 Fuel, light and water 3.6 3.7 3.6 Household furnishings and equipment 2.0 1.9 2.0 Household operation 2.5 1.8 3.2 Clothing and other wear 6.5 7.0 6.0 Personal care 1.8 1.5 2. I Medical care 1.7 1.7 1.7 Transport and communication 2.6 1.8 3.6 Recreation 1.8 I. 7 l.9 Education 3.5 2.7 4.4 Gifts and contributions 0.9 0.7 1.0 Taxes 0.6 0.1 I. I Special occasions 2.7 2.8 2.5 Personal effects 0.7 0.8 0.6 Miscellaneous goods and services 1.5 0.7 2.4
Source of data: National Census and Statisti~s Office, Family Income and Exptmdiru~s Bulletin for 1957, 1961, 1965 and 1971.
426

TURE GROUP: URBAN AND RURAL: 1957, 1961, 1965 and 1971
5 7 I 9 6 l Manila Other Total Total Manila Other
and Urban Philippines Rural Urban and Urban Suburbs Areas Suburbs Areas
1,145,296 1,664,102 7,934,063 3,889,032 4,045,031 1,585,308 2,459,'723 , 100.0 100.0 100.0 - 100.0 100.0 100.0 100.0 36.2 42.7 53.8 59.5 48.4 42.3 52.3
1.3 1.8 1.7 2.1 . 1.3 0.8 1.6 2.9 2.9 4.2 4.4 4.1 3.9 4.2
17.3 10.3 8.3 5.6 10.9 15.4 8.1 4.0. 5.2 4.0 4.1 3.9 3.8 4.0 1.7 2.1 2.1 2.2 2.1 2.3 2.0 4-.8 3.8 2.6 1.9 3.3 3.7 3.0 6.4 8.0 7.0 7.7 6.4 5.8 6.8 2.2 2.2 1.9 1.7 2.1 2.3 2.0 2.0 2.7 1.7 1.6 1.9 1.9 1.8 5.4 2.9 2.3 I 1.6 2.9 3.6 2.5 2.7 2.2 1.8 1.4 2.2 2.7 1.9 5.6 6.0 3.1 2.2 4.0 3.7 4.1 1.2 1.3 0.9 0.8 · 1.0 ·0.8 1.2 1.6 0.5 0.4 0.1. 0.7 1.4 0.3 2.0 2.9 2.3 2.2 2.3 2.2 2.4 0.6 0.7 0.4 0.4 0.4 0.5 0.4 2.2 1.9 1.4 0.6 .2.1 2.9 1.6 6 5 9 7 1
3,059,652 3,964,979 28,430,424 15,405,249 13,025,175 4,077,102 8,948,073 100.0 100.0 100.0 100.0 100.0 100.0 100.0 40.4 50.5 53.7 59.3 47.1 41.5. 49.6
0.6 1.5 1.7 2.0 1.3 0.8 · 1:6 2.9 3.2 3.3 3.5 3.0 2.8 3.1
20.I 8.7· 9.4 6.8 12.5 18.0 9.9 3.6 3.5 3.6 3.6 3.6 3.9 3.5 2.2 1.9 2.3 2. 1 2.6 2.1 2.9 3.7 2.8 2.4 1.9 3.0 3.3 2.8 4.8 6.9 6.2 6.2 6.3 5.9 6.5 1.9 2.2 1.6 1.4 1.8 1.7 J.8 · 1.7 1.8 1.8 1.7 2.0 1.9 2.0 4.3 3.0 .2.9 2.0 4.0 4.5 3.7 1.8 2.0 1.8 1.5 2.2 2.4 2.1 4.0 4.7 3.7 3.1 4.4 4.7 4.2 1·.2 0.8 0.6 0.5 0.7 0.6 0.7 1.9 0.5 b.3 0.2 0.5 0.9 0.3 2.0 2.9 2S 2.6 2.3 I. 7 2.6 0.3 0.9 0.6 0.6 , 0.6 0.7 0.6 2.7 2.2 1.5 0.9 2.2 2.5 I 2. I
427

Table 13.7 - TOTAL FAMILY EXPENDITURES. BY EXPEND!
Expenditure Group Philippines Region I Region II Region HI.
Total Expenditure (thousand pesos) 5,086,774 IJ45,296 294,937 207,884 Per Cent 100.0. 100.0 100.0 100.0
-Food 46.1 36.2 50.6 52.5 Alcoholic beverages 1.7 1.3 1.2 1.2 Tobacco 2.9 2.9 2.3 3.1 Housing 10.5 I 7.3 12.6 5.5 Fuel, light and water 5.1 4.0 4.6 5.0 Household furnishings and equipment 2.1 1.7 2.4 2.1 Household operation 3.3 4.8 2.1 2.8 t Oothing and other wear 7.9 6.4 7.3 9.0 Persona(. care 2.0 2.2 1.0 1.5 Medical care 2.4 2.0 1.4 2.9 l Transport and communication 3.1 5.4 1.7 2.2
~ Recreation 1.9 2.7 1.3 1.2 Education 4.6 5.6 6.6 4.9 Gifts and contributions I. I 1.2 0.8 0.9 Taxes 0.6 1.6 0.2 0.2 Special occasions 2.9 i.o 2.0 3.1 Personal effects 0.6 0.6 0.7 0.7 Miscellaneous goods and services 1.3. 2.2 1.3 1.3
.. I Total Expenditures (thousand pesos) 7,934,063 1,585,308 408,3 I 7 276,704
Per Cent 100.0 100.0 100.0 100.0 . Food 53.8 42.3 60.6 61.5
Alcoholic beverages 1.7 0.8 2.2 0.9 Tobacco 4.2 3.9 4.1 2.5 Housing· , 8.3 15.4 6.8 4.5 Fuel; light and water 4.0 3.8 3.6 3.8 Household furnishings and equipme~t 2.1 2.3 2.3 2.5 Household operation 2.6 3.7 2.2 2.5 Oothing and other wear -7.0 5.8 6.6 7.1 -Personal care 1.9 2.3 I. I 1.6 Medical care 1.7 1.9 1.4 2.0 Transport and communication 2.3 3.6 1.6 1.2 Recreation 1.8 2.7 1.2 1.3 Education 3.1 3.7 2.4 3.4 Gifts and contributions 0.9 0,8 0.7 1.0 Taxes 0.4 1.4 0.1 0.2 Special occasions 2.3 2.2 1.3 2.2 Personal effects 0.4 0.5 0.9 0.4 Miscellaneous goods and services 1.4 2.'9 1.0 1.5
~ Source of data: National Census and Statistics Office.
428 ◄ '

TURE GROUP, BY REGION; 1957, 1961, 1965 and 1971
9 5 7 ' Region IV Region V Region VI Region V11 Region VIII Region IX Region X ·
. 708,407 617,813 331,225 675,050 537,381 322,308 246,474 100.0 100.0 100.0 100.0 100.0 100.0 100.0 48.4 49.3 48.0 48.2 SO.I 48.4 46.6
1.2 1.5 1.0 2.6 2.8 .1.7 1.8 3.2 3.5 3.3 2.9 2.7 . 2.4 2.0 8.3 8.6 8.9 ,7.5 7.5 9.2 9.3 4.2 6.0 6.7 6.0 6.2 4.2 5.2 2.0 1.9 2.1 2.2 2.1 2.6 3.4 2.6 3.0 3.1 3.0 2.8 2.9 2.8 9.0 7.3 7.4 9.2 7.9 8.5 9.2 2.4 2.2 2.0 1.8 1.6 2.0 1.8 2.8 2.9 2.2 2.3 2.2 3.1 2.1 2.7 2.6 2.8 2.6 2.2 2.4 2.2 1.9 1.8 1.6 1.8 1.6 1.9 1.3 4.7 3.9 4,8 4.0 4.0 3.7 3.0 1.0 0.8 ; '3 I.I 1.0 1.3 2.0
'0.3 0.2 . .1.0 0.3 0.3 0.2 0.2 3.1 3.3 2.6 2.4 3.8 3.7 4.7 0.7 0.5 0.4 0.5 0.4 I. I -1.3 1.2 0.6 0.8 1.6 0.9 0.8 1.2
I 9 6
1,603,146 1,058,510 537,706 1,054,816 835,761 7! 5,483 398,312 100.0 100.0 100.0 100.0 100.0 100.0 100.0 57.4 55.6 60.4 53.4 57.2 56.3 54.2 ·o.8 I.I 1.,1 3.6 2.9 1.8 1.8 4.6 5.6 3.7 4.1 3.0 5.0 4.4 8.0 7.1 5.8 6.4 6.2 5.4 6.5 3.4 3.9 4.0 4.4 5.0 3.7 4.7 1.5 1.3 1.9 2.2 1.9 3.7 2.5 2.7 2.3 2.3 2.3 2.4 1.8 2.5 7.7 - 5.6· 7.6 8.6 7.2 7.5 8.1 2.1 2.0 1.7 1.7 1.6 2.0 1.7 1.6 1.7 ,1.5 1.8 1.5 2.0 1.6 1.9 3.2 1.5 1.8 1.7 1.8 1.6 1.2 1.6 1.5 2.3 1.4 1.6 1.5 3.0 3.4 2.7 3.2 2.8 2.5 2.7 1.2 1.2 0.6 0.5 0.7 I.I 1.3 0.2 0.3 0.1 0.1 0.2 0.1 0.1 1.7 2.7 2.1 2.0 3.0 2.3 3.2 0.2 . 0.3. 0.4 0.3 0.2 1.0 0.4 0.8 1.2 I. I 1.2 1.0 o.s 1.0
429

Table 13.9 - TOTAL FAMILY EXPENDITURES BY EXPEND!
Expenditure Group Philippines Region I ·Region II Region III
Total Expenditure (thousan:I pesos) 14,748,076 3,059,652 618,799 320,331 Per Cent 100.0 100.0 100.0 100.0
Food 53.-7 40.4 59.2 56.0 Alcoholic beverages. 1.6 0.6 1.3 1.4 Tobacco 3,2 2.9 2.9 3.5 Housing 9.1 20.1 5.9 5.9 Fuel, light and water 3.6 3.6 3.5 2.9 Household furnishings and equipment 2.0 2.2 1.6 2.5 Household operation 2.5 3.7 1.7 2.2 I Clothing and other wear· 6.5 4.8 6.1 9.8 Personal care 1.8 1.9 1.3 1.8 Medical care 1.7 1.7 1.9 2.4 ~
· Transport and communication 2.6 4.3 2.2 2.0 Recreation .1.8 1.8 I. I 0.7 Education 3.5 4j0 4.0 4.0
' Gifts and contributions 0.9 1.2 0.7 0.9 Taxes 0.6 1.9 0.2 0.1 ' Special occasions 2.7 2.0 2.0 2.8 Personal effects 0.7 0.3 2.3 0.4 Miscellaneous goods and services . 1.5 2.7 2.1 0.7
1 Total Expenditure (thousand pesos) 28,430,424 4,077,102 1,415,641 682,295 Per Cent 100.0 100.0 100.0 100.0 - Food 53.7 41.5 53.4 60.6
Alcoholic beverages . 1.7. 0.8 1.8 1.5 Tobacco 3.3 2.8 2.6 3.2 1 Housing 9.4 18.0 9.8 7.5 Fuel, light and water 3.6 3.9 3.4 4.8
. ' Household furnishings and equipment 2.3 2.1 3.2 I.6· Household operation 2.4 3.3 1.6 2.7 Clothing and other wear 6.2 5.9 . 6.2 4.1 Personal care 1.6 1.7 1.9 1.4 Medical care 1.8 1.9 1.8 1.2 Transport and communication 2.9 4.5 2.7 1.9 Recreation 1.8 2.4 1.5 0.8 Education 3.7 4.7 4.3 4.5
~ Gifts and contributions 0.6 0.6 • 0.7 0.3·
·Taxes 0.3 0.9 0.4 0.1 Special occasions 2.5 1.7 2;0 2.4 Personal effects 0.6 0.7 0.6 0.2 Miscellaneous goods and services 1.5 2.5 2.1 1.3
~ Source of data: National Census and Statistics Office, Famllj, Income and Expendltu~s Bulletin for 1957, 1961, 1965 and 1971.
430 1

TURE GROUP, BY REGION: 1957, 1961, 1965 and 1971 (Continued)
I . 9 6· 5
Region IV Region V Region VI Region VII Region VIII Region IX Region X
2,268,551 2,080,512 I ,I 04,897 1,295,074 1,618,427 967,933 1,413,900 100.0 100.0 100.0 100.0 I0Q.0 100.0 100.0 54.7 55.7 53.6 61.2 59.5 ./ 55.4 60.5 0.8 1.7 1.7 3.1 '.3. I 2.3 1.4 3.7 4.7 2.6 3.1 2.4 2.3 2.8 7.5 7.9 4.9 5.7 5.6 5.2 5.3 3.3 3.4 4.8 3.0 4.3 3.7 3.6 2.3 1.2 2.2 1.7 1.9 2.1 2.1 2.2 2.2 2.4 1.7 2.3 2.4 2.0 6.9 6.0 9.4 6.5 6.7 7.9 6.5 2.1 2.1 2.0 1.3 1.6 1.4 1.4 1.9 1.4 2.0 1.4 1.5 2.3 1.7 2.3 3.3 2.4 1.9 1.6 1.8 1.6 2.3 1.4 2.3 1.6 1.8 2.2 1.6 3.8 3.'6 3.9 , 3.0 2.6 3.6 2.9 0.9 0.5 0.7 0.7 0.5 1.0 I.I 0.2 0.5 0.2 0.2 0.2 0.2 0.3 3.4 2.8 2.7 2.1 3.2 3.6 2.2 0.8 0.4 0.9 0.6 0.3 0.9· 1.8 0.1 1.2 -1.4. 1.2 I.I 1.5 1.2
9 7 I
4,158,065 4,741,639 2,013,613 2,586,787 2,941,332 1,858,567 3,955,382 100.0 100.0 l00.0 100.0 100.0 100.0 100.0 55.5 52.6 54.3 55.4 59.0 59.2 56.7 0.9 1.4 1.9 2.8 2.7 2.2 ' 1.9 3.6 3.4 3.3 3.2 2.8 3.2 4.1 7.7 l0.0 10.0 7.1 6.9 6.3 6.2 3.1 3.6 3.3 3.5 4.3 3.7 3.5 1.7 2.4 1.8 2.4 2.3 2.6 3.2 2.2 2.5 3.0 1.7 2.5 1.9 1.9 6.7 5.8 · 6.7 7.4 4.9 6.3 6.8 1.8 1.8 1.5 1.5 1.2 1.6 1.4
. 1.7 2.3 2.4 1.6 1.6 1.5 1.6 3.2 3.5 1.8 2.8 2.5 1.9 2.0 1.8 1.8 2.1 1.7 1.4 1.3 1.8 4.5 3.0 3.8 · 3.6 2.7 3.2 3.2 0.7 o.8 · 0.4 0.6 0.4 0.5 0.6 0.3 0.2 0.2 0.2 0.2 0.2 0.2 3.0 2.6 2.4 2.4 3.0 2.8 2.1 0.3 0.4 0.6 0.7 0.5 0.5 I.I 1.2 1.9 0.6 1.4 1.0 0.9 1.5

CHAPTER XIV
I-
. PRICE AND WAGE INDICES
Figure 14.1 Consumers' Price for Manila and Suburbs, (Low Income Fa-milies), CT 1963 to June 1974' 436
Figure 14.2 Wholesale Price Indices for Manila: CY 1950 to April 1974 437 ·'Table 14.1 Consumers' Price Index for the Philippines, All Families, CY
1973 to June 1974 438 Table 14.2 Consumers' Price Index for Manila and Suburbs, All Families, CY
I 973 to June 1974 439 Table 14,3 Consumers' Price Index for Manila and Suburbs, Middle Income
Families, CY ·1970 to June 1974 440 Table 14.4 Consumers' Price Index for Manila and Suburbs, Low Income
Families, CY 1963 to June 1974 441 Table 14.5 Consumers' Price Index for Areas Outside Manila and Suburbs,.
Middle Income Families, CY 1973 to June 1974 442 Table 14.6 Consumers' Price Index for Areas Outside Manila and Suburbs,
Low Income Families, CY 1973 to June 1974 443 Table JA.7 Wholesale Price Indices for Manila: CY 1949 to April 1974 444 Table 14.8 Stock Price Index in Manila: CY 1952 to April 1974 446 Table 14.9 Wage-Indices: CY 1949 to 1973 447 Table 14.!0index of Average Monthly Earnings of Salaried Employees and
Wage Earners in Selected Non-Agricultural Industries in the Philippines by Industry Division, CY 1952-73 · 448.
,
I

CHAPTER XIV
PRICE AND WAGE INDICES
The present chapter ·deals with price indices, i.e., consumer,· wholesale, stock, wage indices and index of average monthly earnings of employees. Except for the consumers' price indices which are published monthly by the National Census and Statistics Office (NCSO), the other indices are published monthly by the Central Bank of the Philippines.
· Wl}ile ·the NCSO uses 1966 as its bas.e year period, the Central Bank series are expressed at 1965 prices. All price.indices and wage indices are base,weighted arit.hmetic avera-ges of price relatives.
The, consumer price ,index "is a measure of average changes in the retail prices of.a "fixed basket of goods .and services" purchased by an average .household. Weights are based on the.1965 Income and Expend- I iture Survey of the NCSO. · Consumer price indices published by the NCSO cover Metropolitan Manila, regions outside Metropolitan Manila, and the entire Philippines. Indices for component items like food, clothing, housing, utilities, and miscellaneous goods arid services are also computed.
' . The retail and wholesale price indices of the Central Bank use as
weights the volume of sales i1_1 the retail market to households in Manila. Monthly and annual indices are published by the Central Bank. The Central Bank has developed a comprehensive set of indices that provide a general measure of monthly changes in the wholesale prices of. domestic and . imported commodities in Manila. The index covers commodities for the home market and for export. It is based on 242. items individually weighted by the relative values of production and · retained importation in 1965, the base year.
The stock price index is computed based on 82 stocks of 78 companies which include 3 banks, 4 insurance companies, 29 commercial and industrial companies, 6 sugar centrals and 36 mining. companies. The index 'is also .a weighted arithmetic average of price relatives using the relative values of shares traded in the base year as weights.
The index of average monthly earnings reflects not only changes in the basic daily wage or monthly salary rates of salaried employees and wage earners but also .such variable factors as bonuses and gremium pay
'
434

I i
► I I I I I· I
. ,
.,
for overtime, _part-time work, stoppages, 'Jabor· turnover and . absenteeism. Unlike wage rates which represent the rates stipulated for a given unit of work or time, earnings refer to actual retum·s to the wor_ker fot a stated period of.time.
435 ' .
. '
' .

-I> w °'
500
450
400
350
300
· 250
200
150
100
50
______ ........
Figure 14.1 CONSUMERS' PRICE INDICES FOR MANILA AND SUBURBS: CY 1963 TO JUNE 1974
(Low Income Families) 1966 = 100
HOUSING
0 -1---t---+--+---l--+--t---+--+----!,---t 1963 '64 '65 '66 '67 '68 '69 '70 '71 '72 '73 J F M A M J J A S . 0 N D J F M A M J
CALE N DAR YE A R I 9 7 3 liiiiiiiiiiiiiiiiiiiiiiiiiiniiiiiii: 19 7 4 iiiw
/
500
450
400
350
2 50
200
150
100
50
0

.... w _,
Figure 14.2 , WHOLESALE PRICE INDICES FOR MANILA: CY 1950 TO APRIL 1974
(1965 = 100)
500 ~----------'--c-------'------------'--------------'--~
4S0
400
350
300
250
200 DOMESTIC PRODUCTS~,' '
, ,
150, EXPORT PRODUCTS
100 IMPORTED PRODUCTS-"'
__ -L G~~E~AL IND X ... .,.---
- - _. •· wa: "':'
500
4S0
400
350
·, ,
300
250
200
150
100
50 .__,__~~ 50 1950 '52 '54 '56 '58 '60 '62 '64 '66 '68 '70 '72 J F M A
1951 '53 '55 '57 'S9 '61 '63 · '65 '67 '69 '71 '73 1974·
'·

Table 14.1 - CONSUMERS' PRICE INDEX FOR THE PHILIPPINES; CY 1973-JUNE 1974 (All families) 1966 = 100
Alcoholic . Health Calendar All Item~ Food Beverages Clothing Housing Utilities Education & Miscellaneous
Year & Tobacco Transportati6n
1973 207.68 · 208.78 144.81 224.40 311.03 191.01 150.57 192.46 -- -.---~ January 183.85 176'.11 136. l 2 209.70 291.00 199.36 . i46.50 186.35
. February 183.58 · 174.74· 135.77 210.71 · 292.98 205.82 147.02 187.32 March . 189.68 178.60 136.81 214.75 296.22 211.68 147.23 189:54 April . ·192.34 183.15 137.04 215.60.- 296.29 209.55 147.54 f89.62 May. 196. 79 189.36 137.54 217.95 296.50 214.36 148.67 194.30 June 194.92 190.06 138.02 215.-11 296.34 222.30 150.91 193,79
. July 209.81 220.86 148.01 217. 73 3 l 8.25 224.40 150. 73 195.28 August 212.48 212.63 .139.6 I ~20.18 323.92 140.42 151.42 181.97 September 230.20 249. 75 143.13 222.82 325.55 140.53 152. 76 · 183,97 October· · 226,84, 242.13 155.44 - 225.3 l 327.30 142. 79 153.06 · 185.02 November 229.12 240.71 164.27 243.84 . 333. 14 157. 70 154.56 185.98 December 242.52 247.30 165.94 279.11 334.89 223.16 156.43 · 236.37
1974 . January 259. l 9 264.71 174. 75 299.30 341.23 253.78 159.91 249.39 February 267.56 270.0l 176.46 306.54 "343.48 285.58 184.55 262.54 March 271.95 · 271.98 179.99 314.04 344.18 331.99 186.3 l 269.3 l April · 283,69 28l.l3 192.14 334.81 362.15 . 362,84 189.66 283.18 May 291.59 283.94 205.78 367.08 364.42 39 l. 72 193.80 301.09 June 304.56 297.60 213.30 384.39 365.18 413.39 204.31 32 l.55
SoJrce: Nation~ Census and Statistics Office . .
'
438

Table 14.2 - CONSUMERS' PRICE INDEX FOR ·MANILA AND" S0
UBURBS, CY I 973-Ju"ne I 974 (All families) 1966 ·= 100.
Alco_hpljc Health Calendar All Items Food . Beverages Oothini _Hopslng Utilities Educ'ation & -Miscella'neous
Year· & Tobacco ~ .•, •' "fr;u'!sPortati~n
' 1973 202.S7 20S.9S 148. 74· 2 I 7.33 241..17 142.S8 I SS. I I 189.98
. . January 186.02 17,8.66 141.0S 208.21 228. 73 . 13S.72 1 S7.98 183.4S February 184.96 176.04 140.Si 208.35 228.72 139.90 -1S7.81 ' 183.3S . March 187.67 181.33 141.fS 212.9S . 229.16 140.SS 1S6.4S 184.20 April 190.04 186.S7 140. 79 213.40 229.1 S 139.30 I S6.68 183.96
' May 190.61 .194.40. 140.79 178.39 229.S3 140.98 lSJ°.40 180,76 June 194.20 '194.96 141.30 212.14 229.SS 138.88 1S7.22 188:20 July 206.76 203.66 142.87 21S.14 268.60 140.22 1S6.77 189._17 August 203.S6 207.40 141.37 216. 10 · 244.93 140.83 I S7.37 -, 190.30
' .September 21 S.66 232.86 ·145.91 217.72 246.60 I 38.44 . · l 57.86 · f9L89
r-· October: 216.69 · 231.41 I 62,53 219.46 ·247.17 140.91 159.49 196.87 November 223.20 237.31 J-73.34 . 233.6S 2S5.00 I S7.49 I 61.73 .197.69 De_cember 231.49 246.77 173.29. 2'72.49 , 2S6.93 1S7.78 164.60 209.88
1974 January 244.19 263.17 182.84 290.94 267.37 I 74.S4. 167.21 2.18.19 February 2S3.22 268.23 184.89 301.SS 270.68 179.88 200.41 23S'.I 7 March 259.10 276." 2- 18"7.6 I 30S.01 211.1 s· ;211.01 201.92 .242.16 · April 268.S2 286.73 197..31 324.23 276.87 21 S. IS 205.04 ·2s4.84 ·: May 279.02· 29S.6S 212.06 363.37 277.S8 255.42 211.59 270.8S · June 2_90.48 307.81. 219.86 392.6S . 278.Sfr 2S9.21 229.50 288.93
Source: Nati~naJ Ceruus and Sti.tislics OHiW.
• 439

Table 14.3 -CONSUMERS' PJUCE INDEX FOR MANILA AND SUBURBS, CY 1970-JUNE 1974 ~ (Middle income families) 1966 = I 00
◄ Alcoholic Health
Calendar 'All Items Food Beverages Clothing Housing Utilities Education & Miscellaneous Year & Tobacco Transportation i
1970 132.50 125.07 I 19.95 134.14 163.21 111.70 124.18 145.04 1971 I 63.33 167.07 I 3 I. 74 158.15 183.71 129.82 150.97 163.15 1972 189.10 196.90 136.15 168.51 203.32 123.70 157.88 184.49 1973 201.44 203.37 155.19 218.42 247.30 130.93 163.78 186.33
January . 183.34 176.05 143.67 209.62 229.57 126. 72 161.52 181.90 February 182.28 173.64 142.72 210.10 229.57 129.80 I 61.26 182.03 ~ March 185.86 180.54 143.64 216.34 229.81 129.79 160.63 181.12 April 188.56 185.72 149.18 216.50 230.00 128.74 160.72 180.82 May 187.54 19Q.90 149.42 169.31 230.01 129.94 160.99 175.80 June 191.61 ' 191.71 149.83 213.61 230.02 127.99 161.44 183.54 July 202.97 200.27 155.69 ·216.63 264. 78 129.10 163.62 185.17 August 204.47 204.24 154.22 218.02 261.34 129.24 164.13 186. 75 ·:111 September -218.41 231.57 161.71 219.76 262.34 127.16 165.51 188.61 October 218.35 229.78 167.47 221.50 262.64 129.94 166.72 190.86 November 222.05 231.99 172.08 234.48 267.92 137.63 168.42 193.58 December 231.85 243.98 172.66 275.17 269.11 145.09 170.35 205.78 I 1974 January 243.42 260.70 187.66 295.65 270.9(' -160. 71 · 172.43 212.57 February 252.30 264.43 188.37 306.60 277.18 166.43 207.36 226.34 March 254.49 . 265.23 190.09 305.56 277.47 194.81 209.01 230.80
~ April 264.80 . 278.40' 202.42 326.58 278.76 195.87 210.47 246.29 May 276.67 290.62 224.16 369.02 279.18 235.54 -212.60 26 I.OS June 289.23 305.82 232.52 397.29 279.77 ~36. 76 · 229.04 278.05
Sourt:e of basic data: National Census and Statistics Office.
f '
4 440 1/)

Table 14.4 - CONSUMERS' PRICE INDEX FOR MANILA AND SUBURBS, CY 1963-JUNE 1974 (Low income families) 1966 = 100 '
Alcoholic Health Calendar All Items Food · Beverages Clothing Housing Utilities Education & Miscellaneous
Year & Tobacco Transportation
1963 87.82 77.47 102.79 100.07 88.35 99.54 106.28 93.56 1964 91.36 88.98 98.87 97.30 91.3 I 99.54 95.36 96.14 1965 95.63 89.99 99.62 97.89 96.58 99.54 97.01 98.61
· 1966 100.00 100.00 100.00 100.00 10b.oo 100.00 100.00 100.00 1967 106.79 113.41 100.03 106.59 105.20 101.33 115.81 99.79 1968 107.23 108.63 100.03 107.38 106.01 104.02 131.29 101.53
- 1969 110.32 110.12 100.09 · 109.49 109.54 104.25 134.85 100.24 1970 116.37 120.95 104.32 125.10 I 13.96 109.65 144.87 117.54
l 1971 155.59 158.77 131.46 163.91 158.1·3 141.10 147.50 160.54
) 1972 186.56 194.32 138.50 236.35 204.40 147.98 152.36 193.98 1973 204.97 208.69 157.23 242.45 236.11 167.52 157.06 201.76 ·' ./ January 186.92 182.30 142.09 234.12 229.88 156.14 157.45 190.88
February 185.72 180.00 142.30 233.02 229.52 . 162.67 156.95 189.96 Match 187.59 183. 10 141.85 236.50 229.82 164.06 154.12 19 l.li3 April 191.4 7 189.36 147.92 237.4 7 230.14 162.20 154.99 191.36 May 191.60 193.50 148.60 201.38 230.14 164.90 152.44 190.1"2 June 196.15 196.95 149.49 235.90 230.14 161.90 I 55.62 197.10 July 209.83 208.30 156.40 238,91 275.25 163.96 156.75 199.45 August 204.86 210.74· 154.65 238,77 230.90 165.10 156.86 201.06 September 221.53 238.81 167.38 241.3 I 231.12 161.54 158.41 204.58 October 220.54 234.07 171.72 243.98 232.14 165.19 158. 75 216.40 Novcrnl,er 228.34 241.52 182.07 253.86 241.30 193.65 160.41 216.13 December 235.05 245.68 182.31 314.21 243,00 188.92 161.92 232.25
1974 January 253,90 267.52 197.69 337.34 262.52 213.09 164,99 241.38 February 261.14 273,86 197.69 347,36 263.29 218.85 189.69 254.62 March 273.42 288.44 208.91 359. 73 263.08 264.16 194,58 264.81 April 283.83 299.66 212.51 385.09 269.45 271.65 196.73 -282.62 May 293.33 303.14 238,60 431.85 269.96 3 I 1.36 . 200.94 304.39 June 303.00 310.50 249.71 467.14 270.95 318.23 213.94 327.48
Soum•: Nu lion al Census and St:ili~lics Officr.
441

Table 14.5 - CONSUMERS' PRICE INDEX FOR AREAS OUTSIDE MANILA.& SUBURBS, CY 1973-JUNE 1974 (Mfddle income families) I 966 ~ I 00
Alcoholic Health Miscellaneous Calendar All Items Food BCveq1ges Clothing Housing Utilities Education &
~ Year & Tobacco _ Transportation
1973 207.15 208. 79 149.45 188.67 378.31 I 58.56 150.42 174.86
Ja'nuary 177.32 .172.38 139.50 160.62 350.18 I 37.29 143.61 157.48 February 181.06 176.7 I 141.82 166.57 35 1.17 139.51 144.03 161.87 March 184.07 181.60 144.24 170.15 361.70 139.18 145.63 163.73
-~ April 185.96 183.84 145.59 173.13 360.82 142. 19 146.04 165.01 May 215.55 199.41 143.01 181.20 361.23 173.99 170.95 . 179.31 June 192.97 194.46 145.65 178.04 357.99 148.54 145.89 164.76 July 207.26 214.49 145.99 181.35 375.92 152.26 146.48 169.94 August 226.97 240.76 151.16 191.12 398.40 156.07 150.35 177.20 September 229.37 242.09 152.95 200.28 400.03 160.35 152.06 181.96 i
\ October 227.23 235.91 I 56.71 208.75 403.75 162.21 I 52.16 186.84 ' November 225.16 227.54 161.40 220.55 408.35 190.07 153.18 192.26 ' December 232.89 236.33 165.34 232.27 410.17 20 I.I I 154.66 197.95
I 974. January 246.98 254.65 168.77 243.35 412.06 236.16 156.23 204.74 February . 259.16 265.33 172.17 257.11 413.29 287.86 181.16 214.80. March 262.43 267.53 176.4t. 262.96 414.65 310.53 181.96 217.78 April 271.87 272.45 182.96 277.85 451.23 349.32 184.13 229.41 May 277.02 276.95 186.57 280.90 453. 74 388.59 185.30 233.06 June 281.23 280.66 192.93 289.42 454.37 391.60 187.45 240.53
Soun'.r:: Nalional Ccn::us and Stali~lir:s Office.
' ).
\ \ '
442

Table 14.6 - CONSUMERS' PRICE INDEX FOR AREAS OUTSIDE MANILA AND SUBURBS, CY 1973-JUNE 1974 (Low income families) 1966 = 100
Alcoholic Health Miscellaneous Calendar All Items Food Beverages Clothing Housing Utilities Edu,ation &
Year & Tobacco Transportation
1973 212.56 209.92 160.91 206.26 404.87 129.57 172.05 168.81
Ja_nuary 180.34 171.50 149.03 173.25 373.19 115.61 164.55 I 51.76 February 184.09 175.45 I 52.73 179.22 379.44 114.49 164.95 I 55.28
' March 184.67 180.55 156.23 · 183.70 383.68 117.03 165.91 I 55.57 April 187.03 183.33 157.25 187.54 383. 79 118.00 165.88 157.66 May 233.92 198.77 158.21 200.34 378. 78 134.64 188.34 174.98 June 196.20 · 196.19 154.56 192.18 385.60 122.26 166.40 I 59.40 July 212.03 217.96 I 56.49 195.46 397.02 123.93 168.61 163.06 August 235.11 246.95 161.82 209.28 428.52 130.60 173.82 170.73 September 235.59 244.84 163.48 219.80 430.60 134.80 175.40 176.10 October 233.69 238.41 169.63 230.79 434.62 136.13 · 175.79 181.44 November 230.24 228.22 172.97 245.26 44_0.5I· 149.66 176.94 187.14 December 237.87 236.92 178.51 258.35 442.68 157.75 178.01 192.55
1974 January 252.11 256.17 183.37 272.19 445.08 177.89 180.00 199.25 February 262.46 265.66 '186.33 290.36 446.4 7 207.26 194.89 208.98 March 267.31 270.88 191.59 296.45 447.22 217.07 195.72 210.95 April 275.07 275.44 198.01 310.95 478.84 239.02 198.19 223.28 May 280.74 281.18 201.97 314.4 7 482.62 260.11 199.56 226.4 7 June 285.45 285.45 208.38 323.63 483.14 266.64 202.69 232.79
Source: National Ccn._qis and Statisti~ Office.
443 ·

Table 14.7 - WHOLESALE PRICE · (1965
Calendar Indices Year General Domestic Export Imported
Index Products Products Products
1949 72.3 77.8 56.2 49.6 1950 70.1 72.1 61.6 60.2 1951 78.7 78.8 63.5 75.7
{ 1952 72.0 72.6 50,5 67.2 1953 71.3 72.7' 61.9 63.7 1954 67.6 68.6 54.4 61.8 1 1955 65.-8 67.1 50.1 58.8 1956 67.9 "68.6 52.3 63.9 1957 70.8 71.4 54.7 67.3 1958 73.2 73.8 60.5 70.0 1959 74.2 73.8 68.4 76.3. 1960 77.3 76.6 66.6 80.7 1961 81.1 80.3 69.2 84.9 1962 85.2 83.7 83.7 92.9 1963 93.5 92.4 100.2 98.6
~ 1964 97.8 . 97.4 97.3 99.5 1965 100.0 100.0 100.0 100.0 1966 104.3 105.0 101.3 100.7 1967 . 107.0 108.2. 107.5 100.8 1968 / 109.9 111.6 12G.4 100.5 1969 11 I .4 112.8 118.3 103.7 1970 137.7 137.9 146.9 136.3 1971 159.3 160.2 157.5 155.0 1972 175.4 177.0 161.2 166.4 1973 218.4 219.4 248.1 212.9
January 181.1 182.1 180.1 176T February 187.4 188.8 196.6 180.1 . March 191.0 191.3 203.8 189.6· ,i I
April 197.2 196.9 214.0 199.0 May 203.7 204.3 228.6 200.4 June 210.6 210.9 . -239.7 209.2 July 220.4 221.6 258.9 213.8 August 228.2 · 2'30.0 272.3 218.8 September 236.4 237.4 267.6 231.2 October 242.2 242.7 282.3 239.5 November 255.3 256.8 304.6 247.0 December 267.4 270.6 328.4 256.1
1974 January 288.8 294.4 399.4 258.7 February 309.7 316.9 423.2 271.3 March 324.1 332.6 444.6 278.4 April 335.9 343.4 462.4 295.5
Source of basic data: Central Bank of the.Philippines. ,. 444 r.

INDICES, MANILA: CY 1949-APRIL 1974 = 100)
Annual Increase (Decrease)
General Domestic Export Imported Index Products Products Products
3.0 7.3 9_.6 2.1 12.3 9.3 3.1 2.6 8.5 7.9 2.0 11.2 1.0 0.1 . 2.3 5.2
S.2 5.6 12.1 3.0 2.7 2.2 7.9 4.9· 3.2 2.2 4.4 8.7 4.3 4.1 4.6 5.3 3.4 3.4 IQ.6 4.0
1.4 13.I 9.0 4.1 4.0 (2.5) 5.7 4.9 4.8 3.9 5.2 5.1 4.2 21.0 9.4 9.7 0.4 19.7 6.1 4.6 5.4 (2.9) 0.9 2.2 . 2.7 2.8 0.5 4.3 5.0 1.3 0.7 2.6 3.0 6.1 0.1 2.7 3.1 12.0 (0.3) 1.4 I.I ( I. 7). 3.2.
23.6 22.3 24.2 31.4 I 5.7 16.2 7.2 13.7 10.0 10.5 1.7 6.9 24.5 23.9 53.9 27.9
•
445

\. Table 14.8 - STOCK PRICE INDEX IN MANILA, CY 1952-APRIL 1974
(1965 = 100)
Calendar All Commercial Banks Insurance and Mining Sugar Year Items
Industrial
1952 125.5 31.6 . 86.7 103.2 117. I 74.9 1953 105.7 31.6 79.7 87.5 97.6 65.3 1954 98.0 39 .. 4 79.9 91.2 79.2 69.3 1955 123.0 42.9 77.8 81.8 133.5 68.5 1956 214.0 43.4 . 78.8 94.0 244.1 67.1 1957 163.8 54.2 80.2 97.1 180.9 69.1 1958 99.8 60.1 78.8 107.8 .98.4 88.1 1959. 125.2 69.2 85.8 I 25 .1 125.9 98.1 · 1960 85.7 65.4 89. I 100.3 82.4 91.5 1961 81.2 57.8 92.2 95.8 77.7 I_O 1.9 1962 90.9 58.4 83.7 96.7 89.7 103.4 1963 118.8 71.9 97.7 1 15 .4 119.6 146.7 1964 122.1 86.2 97.7 106.5 125.6 150.5 1965 100.0 100.0 100.0 100.0 100.0 100.0 1966 122.3 105.7 113.8 101.6 134.2 72.7 1967 ·136.7 131.5 127.0 134.5 138.8 110.6 1968 196.5 168.6 133.6 169.4 212.3 132.2 1969 359.7 156.5 I 25.3 159.5 467.9 96.3 1970 257.2 149.1 122.6 1 I 5.4 333.1 76.7 1971 156.2 120.7 I 25.5 100.6 186.7 59.5 1972 120.2 99.0 93.7 85.9 138.9 47.4 1973 153. 7 99.2 83.7 107.5 180.4 48.9
January 102.5 . 87.5 83.7 75.1 118. 1 41.6 February 136.8 93.5 83.7 81.5 167.2 .43.5 March 165.8 100.4 83.7 96.6 204.1 48.0 April 167.0 105.3 83.7 96.6 206.0 49.6 May 158.9 108.0 83.7 99.7 191.9 51.9 June 156.2 104.6 I 33.7 101.2 187.2 48.5 July 174.5 94.2 83.7 101.0 215.3 48.3 August 189.6 95.9 83.7 111.0 233.8 47.3 September 173.8 98.7 83.7 127.4 201.6 50.0 October 158.9 102.5 83.7 141.3 172.1 51.6 November 138.6 103.2 83.7 136.8 143.l 53.0 December 122.0 96. I 83.7 122.0 124.9 53.6
1974 January I 34.4 90.8 85.0 126.9 141.7 49.9 February ·139.4 93.3 88.2 132.6 146.6 49.8 March 147.2 95.6 88.2 139.4 i 54.9 61.2 r April 159.2 95.1 88.2 130.5 177.8
' 64.2
Source: Central Bank of the Philippines.
~
4.46 ~
~

Table 14.9 - WAGE INDICES1 , CY 1952_-73 (1965 ; 100)
Nominal Wages2 Real Wages3 Real Wages4 Calendar
Year Skilled Unskilled Skilled Unskilled· Skilled Unskilled Labor Labor Labor Labor Labor Labor
1952 85.1 78.0 I 12.6 103.2 1953 87.0 80.2 119.2 109.9 1954 87.4 79.3 121.6 110.3 1955 87.4 81.6 122.8 l 14.6 1956 87.7 82.9 120.0 113.4
1957 97.4 82.0 117 .5 I 10.2 . 1958 90.5 82.4 117.7 107.2
1959 92.0 83.1 120.7 109.1 1960 91.9 83.2 I I 5.7 104.8 l 18.8 107.6 1961 91.6 85.2· 113.6 105.7 112.9 105.5
1962 92.7 87.8 108.7 102.9 108.8 103.5 1963 95.5 92.6 106.0 102.8 102.1 99.0 1964 97.2 93.4 99.7 95.8 99.8 95.5 1965 100.0 100.0 100.0 100.0 100.0 100.0
1966 105.0 107.3 99.6 101.8 100.6 102.8
1967 109.9 112.3 98.1 100.3 102.7 105.0 1968 I 18.7 125.0 103.6 109.1 108.0 I 13.7 1969 125.0 130.9 106.9 I I 2.0 112.2 117.5 1970 132.8 145.2 99.3 I 08.5 96.4 105.4 I 97 l 139.7 155.0 91.3 101.3 87.7 97.3
1972 146.6 164.3 86.8 97.4 83.5 93.7
1973 154.4 l!i.8..1. 82.8 90.4 70.6 77.2 January 151.6 166.6 89.8 98.7 83.7 91.9 February I 51.7 165.6 89.6 97.8 80.9 88.3 March 151.5. 164.8 88.5 96.3 79.3 86.'2 April 151.9 165.0 86.8 94.3 77.0 83.6 May . 152.3 165.6 85.1 92.5 74.7 81.2 June 152.6 164.8 84.1 · 90.8 72.4 . 78.2 July 155.8 170.7 84.7 92.8 70:6 77.4 August I 56.2 172.4 80.4 88.7 68.4 75.5 September 156.6 I 71.0 76.8 83.8 66.2 72.3 October 157.5 172.4 78.6· 86.0 65.0 71.1 November 15-Z.2 172.4 75.2 82.5 61.5 67.5 December I 57.3 172.9 73.6 80.9 58.8 64.6
1Ap~~es to laborers in indu~trial _establishments in ~1anila &. Suburbs.
3 ThtS is the 1955 = 100 senes shifted to 1965 = I.00 series.
4Money wage rate. index deflated by the co!lsumer price index (I 965 == 100) in Manila. Money wage rate mdcx deflated by the wholesale price inde,x (1965 ;:::: 100) in Manila.
Source: Central ·Bank of the Philippines.
447

Table 14.10- INDEX OF.AVERAGE MONTHLY EARNINGS! IN SELECTED NON-AGRICULTURAL INDUSTRIES IN
(1965
All Workers Mining and Calendar Number of Quarrying
Year Workers Salaried Wage Salaried Wage
Employees Earners Employees Earners
1952 143,448 66.2 67.9 55.9 53.0. 1953 151,022 68.5 69.5 59.6 57.6 1954 · 156,340 71.2 73.1 64.4 59.8 1955 159,930 73.7 75.2 69.5 63.2 1956 165,538 74.6 76.2 64.6 66.6 1957 171.320 76.2 78.9 65.5 68.8 1958 172,824 80.3 79.6 72.2 72.2 1959 175,503 84.0 83.0 78.5 77.3 1960 181,588 88.9 87.9 89.4 82.4 1961 185,697 90.8 88.1 92.4 86.5 1962 187,029 93.7 89.5 95.5 88.2 1963 190,341 96.8 90.4 95.6 • 92.1 1964 194,854 98.9 94.4 96.2 98.5 1965 200,907 100.0 100.0 100.0 100.0 1966 197,981 105.1 I 10.4 98.5 108.4
1 1967 199,361 I06.9 116:8 92.4 124.3 1968 205,258 112.2 117.4 97.6 127.3 1969 207,440 I I 7.5 122.3 104.3 134.8 1970 208,387 · 123.0 131.5 104.1 138.0 1971 211,106 132.3 142. I· 114.2 155.8 1972 216,773 14.1.6 156.9 119.6 168.3 1973 224,021 157.3 llil 135.3 184.3
January 222,327 154.7 172.4 134.8 185.9 February 223,432 154.5 168.2 133.5 174.6 March 223,012 154.3 174.5 131.7 183.6 April 223,808 156.8 176.6 134.9 185.3 May 223,775 157.2 176.0 135.4 186.4 June 224,378 157.0 174.5 135.1 186.4 July 224,890 '. 157.4 176.0 135.2 184.7 August 224,219 158.3 178.1 136.8 185.3 September 223,637 158.8 176.0 137.1 181.9 October 224,383 159.0 180.7 136.0 187.0 November 225,045 159.2 179.2 136.5 185.3 December 225,420 160.4 180.7 136.2 184.7
1 Docs not include privileges ruch as food ration,.Iodging, recreation, etc. Includes only money wages, overtime pay and pay for sfok leave, holidays and vacatior111 taken during pay period reported. before taxes.
2Salnried employees include ucrutives and supcnrisors. · 3This is lhc 1955 = 100 St:rtt'.S shifted to 1965:;;: 100 !Cries.
Source of data: Central Rank of the Philippines.
,-
448 I
1

OF SALARIED EMPLOYEES2 AND WAGE EARNERS THE PHILIPPINES BY INDUSTRY DIVISION, CY 1952-73 = 100)3
Manufacturing Electricity, gas,
Commerce Transport and Water & Sanitary Gommunication
Services
Salaried Wage Salaried Wage Salaried Wage, Salaried Wage Employees Earners Employees Earners Employees Earners Employees Earners
72.8 67.9 84.4 69.) 66.7 66.0 59.9 81.6 73.6 72.3 89.1 67.8 65.3 69.0 63.6 80.0 70.8 75.5 90.0 74.6 70.4 72.0 67.7 82.7 73.1 77.4 90.0 74.6 72.0 77.9 69.4 83.8 76.8 74.8 90.0 69.5 76.6 81.9 72.4 88.6 76.8 78.6 91.4 78.1 77.4 81.9 78.3 86.9 78.9 82.8 92.7 77.7 80.5 78.2 84.6 87.9 80.6 81.4 97.2 79.6 82.6 84.7 87.2 92.4 82.2 83.0 98.3 84.) 87.5 97.1 88.3 92.4 83.8 85.8 99.7 81.8 89.5 95.2 88.6 92.1 87.5 90.0 · 102.3 82.7 92.1 94.9 91.0 92.9 93.2 9f0 107.5 84.1 95.5 90.9 94.5 93.6 97.6 97.3 109.1 89.3 98.5 95.2 96.5 94.4
100.0 100.0 100.0 100.0 100.0 100.0 100.0 100.0 105.1 108.2 122.4 113.3 104.1 108.4 102.1 113.2 111.7 113.9 133.8 119.8 104.3 I 14.0 106.5 112.1 115 .4 115.7 144.7 118.5 107.3 111.3 110.8 I 15.6 122.4 120.4. 147.1 128.] 112.5 111.1 ·114.9 117.3 132.9 136.4 150.0 137.5 124.8 122.3 1 I 9.0 123.7 146.2 155.6 151.5 141.4 135.3 133.3 . 128.1 128.5 156.3 174.2 163.6 154.0 147.6 147.1 138.I 148.5 173.4 190.4 ..ill& .l8U. 164.8 162.7 148.2 J.£1.l 170.0 191.1 178.8 172.8 I 61.0 153.7 144.3 167.2 169.2 186.7 I 79.4 I 72.8 161.6 I 50.7 144.6 163.4 169.5 195.6 179.6 175.3 160.6 156.7 147. l 169.4 170.8 186.7 181.4. 183.4 I 64.3 164.7 148.2 167.7 172.6 189.2 181.4 179.6 164.I 162.7 148.7 167.7 172.3 188.6 180.5 179.6 164.3 158.7 149.0 165.6 174.2 186. I 178.8 184.3 165.3 162.2 149.3 167.7 173.9 193.0 179.6 185.1 166. I 163.7 151.0 168.3 177.0 187.3 18 I. I 184.7 166.I 162.7 148.5 166.7 177.5 195.6 183.5 185.5 166.5 172.1 148.5 167.7 176.2 189.2 183.:C 187.7 168.0 170.6 148.5 167.2 I 77.5i 195.6 184.7- 187.7 169.4 173.6 151.3 · 166.7
449

CHAPTER XV
EDUCATION
Figure IS.I Collegiate Enrolment in Private Schools by Major Fields of Study: School Year 1951-52 to 1971-72 453
Table IS. I Number of Public and Private Schools by Level of Education: School Year 1945-46 to 1971-72 454
Table 15.2 Number of Teachers in Public and Private Schools by Level of Education: School Year 1945-46 to 1972-73 456
Table 15.3 Elementary, Secondary and Collegiate Enrolment in Public and Private Schools ·and State Colleges and Universities: School Year 1930-31 to 1972-73 · 458
Table 15.4. Collegiate Enrolment in Private Schools by Major Fields of Study: School Year i930-31 to 1971-72 462
Table I 5.5 College Graduates of Private Schools by Selected Major Fields of Study: School Year 194748 to 1971-72 464
Table 15.6
Table 15.7
\
Drop-Out Rates in Public Elementary, Secondary and Collegiate Schools by Grade and Year: School Year 1946-47 to 1971-72 Current Operating Expenditures of the Department of Education as a Percentage of the National Budget and its Breakdown, by Bureau or Office: FY 1961-62 to 1972-73
Table 15.8 Cumulative Number of Registered Prof~ssionals, Philippines: CY
466
46_8
1950-73 470

' .
CHAPTER XV
EDUCATION
The importance of education to any country hardly needs emphasis. An educated citizenry is· indispensable in any society so that the people could · participate intelligently in the discussion of public issues and in the moulding of public opinion so necessary to the very existence of any society. An educated citizenry is also important so that the people could perform their assigned roles as agents of production in the crucial effort of economic and social development. · Progress could come only from ideas and ideas could emanate only from people. Education, therefore, is both an end in itself and a means to an end. It is an end because the acquisition of knowledge is an important-pursuit needed in the making of a more cultured citizenry. It is a means to an end because the acquisition of knowledge enhances a person's skills, thus equipping him as a more efficient agent of production in the economy and enabling him to contribute more fully and more efficiently to the expansion of the national output, to earn higher income and thus attain a higher level of living, and to participate more fully in the country's overall development efforts.
The statistics presented in this chapter cover important aspects of education in the Philippines spanning the greater part of the post-war period. These statistical data include: number of public and private schools and teachers by levels of education, enrollment in public and private schools, collegiate enrollment by major fields of study in private schools, expenditures on education as a percentage ratio of the national budget, collegiate graduates in private schools by selected major fields of study, cumulative number of registered professionals in the Philippines, and tables on drop-out rates. To the Department of Education and Culture is lodged the primary responsibility of compiling, tabulation and releasing of statistical data on education in · the Philippines.
452
,I

Figure 15.1 COLLEGIATE ENROLMENT AND GRADUATES JN PRIVATE SCHOOLS BY SELECTED
MAJOR FIELDS OF STUDY: SCHOOL YEAR 1951-52 TO 1971-72
NO. OF PERSONS !IN THOUSAN,DSl
SOO 50 0
400
300
200
" 100
90 eo 70
80
50
40
30
20
I 0 9 e 7
8
5
4 , 3
2
I
' ' \
\
---·'
---/
--/'
1951-1952
I/ 1./ -
,,, .. - r-.._ ,,-
!, '
\, --
.I ~ \ # . .,,,.
• 1, \
/ . _.,
----
1958,-1957
/
, ...... i/
-/ ,. /
I ,
I
~ '·i--.. I/ __., ... _ 1--
.. ,,. ,. ·--..I h .....
.... / ,, . , , ,' ' ' ,
.-·
1911-1962
453
~
-.... ' .. -
I I
i .t--.
I
' ·, ' , .,
~
~
' ,,
1966·1967
·-., ~ .
h:
•
-,-'
I/
r
✓
V
lr
r
TOTAL ENROLMENT
TOTAL GRADUATES
GRADUATES
COMMERCE AND BUSINESS ADMINISTRATION
EDUCATION
LIBERAL ARTS AND SCIENCES
MEDICAL SCIENCE
OTHERS
ENGINEERING AND
TECHNOLOGY
1971-1972

Table 15.1 - NUMBER OF PUBLIC AND PRIVATE ~ SCHOOL YEAR 1945-46
Bureau of Public Scho.ols 1 • School Year Total, Primary Intermediate Secondary1 Collegiate2
1945,1946 13,552 11,266 2,130 15 I 5 1946-194 7 I 6,129 13,366 2,539 212 12 1947-1948 16,772 13,162 3,310 288 12 1948-1949 18,980 14,773 3,877 317 13 1949-1950 21,110 15,593 5,175 328 14 1950-1951 22,238 16,037 5,853 333 15 1951-1952 23,000 16,365 6,276 344 15 -1952-1953 · 24,045 16,954 6,723 353 15 1953-1954 25,333 17,676. 7,286 355 16 1954-1955 25,630 18,032 7,213 . 359 26 1955-1956 26,279 18,487 7,406 358 28 1956-1957 27,376 19,268 7,712 365 31 1957-1958 28,445 19,986 8,056 365 38 1958-1959 29,049 20,127 8,508 376 38 1959-1960 29,461 20,296 8,748 376 41 1960-1961 30,025 21,011 . 8,574 395 45 1961-1962 30,954 21,303 9,189 417 45· ,,. 1962-1963 32,165 21,778 9,894 457 36 \
1963-1964 33,650 22,140 11,014 460 36 1964-1965 34,072 21,972 11,596 468 36 .. 1965-1966 36,645 23,495 12,648 .466 36 1966-1967 37,243 22,255 13,815 1,137 36 1967-1968 37,731 22,255 13,815 1,625 36 ~◄
1968-1969 38,833 22,090 14,915 1,793 35 1969-1970 39,648 21,911 15,824 1,876 37 1970-1971 40,268 22,838 15,268 2,125 37 1971-197-2 43,589 23,525 17,433 2,594 37
n. a. - Data not available. lJncludes Vocational Secondary Schools. 2Includes State Colleges and Universities. 3A private school is included under all lc,·els that it offers; e.g., a private school offering primary and inter-
mediate grades is included under "Primary" nnd also under "Jntcnnediate". Source's of data: Bureau of Public Schools; Bureau of P_rivate Schools; Office of·State Colleges and Univer-
sities, Deparbncnt of Education and Culture.
454 ~ 41

'
~
SCHOO[S BY.LEVEL OF EDUCATION TO 1971-72
Bureau of Private Schools
Total Actual . Number of Schools Offering3 -Number of
Schools Primary Intermediate Secondary
416 79 58 297 520 140 122 580
1,015 n.a. n.a. 613 1,448 n.a. n.a. 786 1,594 n.a. n.a. 943
1,610 n.a. n.a. 1,013 1,714 482 429 1,152 1,770 493 443 1,245 1,819 511 453 1,251 1,842 518 462 1,246
1,900 524 452 1,260 1,941 523 457 1,282 1,938 538 471 1,278
. 2,083 563 501 1,281 2,107 574 499 1,328-
2,190 689 600 1,361 2,219 751 664 1,394 2,286 757 678 1,435 2,291 775 691 1,464 2,405 792 711 1,541
·2,476 815 728 1,613 2,525 833 772 1,634 2,680 886 805 1,775 2,992 933 813 1,898 2;994 961 860 1,975
2,993 966 872 2,014 3,001 958 824 1,996
Collegiate
105 77
213 296 363 401 411 410 389 356 351 357 341 349 366 339 355 399 434 463
440 442 566 577
. 584
597' 554

Table 15.2 - NUMBER OF TEACHERS IN PUBLIC AND SCHOOL YEAR 1945-46
Public Schools
School Year
1945-1946 1946-1947 1947-1948 1948-1949 1949-1950
1950-1951 1951-1952 1952-1953 1953-1954 1954-19'55
1955-1956 1956-1957 1957-1958 1958-1959 1959-1960
I 960-1961 1961-1962 1962-1963 1963-1964 I 964-1965
I 965-1966 1966-1967 1967-1968 I 968-1969 1969-1970
1970-1971 1971-1972 1972-1973
Total
46,864 57,426 63,412 73,373 85,213
85,557 88,347 89,890 92,917 94,389
101,150 104,633 105,204 I 08,945 119,896
126,803 132,305 151,197 162,501 176,508
193,569 213,418 221,333 234,741 246,148
258,048 n.a. n.a.
Elementary I
43,3 I 9. 52,251 57,005 66,187 77,350
77,934 80,167 81,631 84,310 85,177
91,786 94,929 95,337 98,851
109,347
115,535 120,788 139,128 149,187 160,864
177,207 192,150 199,893 213,252 224,626
235,577 236,965 246,861
Secondary
3,507 5,074 6,247 6,984 7,607
7,398 7,940 8,014 8,331 8,820
8,897 9,234 9,342 9,636
10,063
10,726 10,950 11,824 13,100 15,334
16,087 21,006 21,153 21,232 21,362
22,311 21,991 26,053
I Teachers in service excluding principals and supervisors, 2Excludes teachers in independent state colleges and universities. 3Exclud~ teachers in government vocational schools offering collegiate cOUrses. n.a. - Data not available.
Collegiate2
38 I 01 160 202 256
225 240 245 276 392
467 470 sis 458 486
542 567 245 3
2143
3103
2753
2623
2873
2573
1603
1603
n.a. n.a.
Sources of data: Deparbnent of Education and Culture, Statistical Data and Information 1~72. Research Division and Statistics. Bureau of Public Schools, Department of Education and Culture. Division of Evaluation. Research and Statistics, Bureau of Private Schools, Deparbnent of Education and Culture. ·
456
r
• -

PRIVATE SCHOOLS BY LEVEL OF EDUCATION: TO 1972-1973
Private Schools
Total Elementary Secondary Collegiate
1,006 217 655 134 2,625 686 1,378 561 3,709 809 1,933 967
I 2,818 2,344 6,040 4,434 13,741 2,497 6,260 4,984 17,56 I 3,361 7,337 6,863 21,110 2,950 101106 . 8,054
- 19,428 3,135 9,622 6,671 18,390 2,894 9,409 6,087 18,509 2,992. ' 9,485. 6,032 23,225 3,723 11,682 7,820 24,626 3,984 11,646 8,996
. 25,533 4,145 11,788 9,600 26,145 4,844 12,333 8,968 26,925 4;989 12,815 9,121 28,622 5,768 13,384 9,470 3 I ,837 6,201 14,572 11,064 36,401 6,347 16,384 13,670 42,073. 6,784 16,698 18,591 44,539 7,268 17,663 19,608 . 47,905 ' 8,439 19,473 19,993 51,562 9,756 22,630 19;176 54,898 I 0,0 I 5 24,441 20,442 61,271 10,444 28,096 20,731 63,907 10,796 28,182 24,929 65,342 I 1,4 I 1 28;550 25,38 I 64,598 10,141 30,618 23,839
n.a. n.a. n.a .. n.a.
\
457

Table 15.3 - ELEMENTARY, SECONDARY AND COLLEGIATE COLLEGES AND UNIVERSITIES,
1 Elementary
Bureau of Bureau of U.P. & State j School Year Total Public Private -Colleges & Total Schools Schools Universities
l 1930-1931 1,143,708 48,268 n.a. n.a. n.a.
~ 1931-1932 n.a. 1,135,221 49,447 n.a. n.a. 1932-1933 n.a. 1,135,658 47,588 n.a. n.a. 1933-1934 n.a. 1,121,028 48,312 n.a. n.a. 1934-1935 n.a. 1,1,50,199 47,084 n.a. n.a.
1935-1936 n.a. 1,181,228 51,611 n.a. n.a. 1936-1937 n.a. 1,208,788 52,369 n.a. n.a. 1937-1938 n.a. 1,423,918 60,018 n.a. n.a. 1938-1939 n.a. 1,666,512 65,367 n.a.• n.a. 1939-1940 n.a. 1,850,213 65,367 n.a. n.a.
' 1941-19441
1944-1945 n.a. 2,182,2092 21,703 n.a. n.a. 1945-1946 n.a. 2,387,513 3 68,566 n.a. n.a. 1946-1947 n.a. 3,102,206 68,568 n.a. n.a. 1947-1948 n.a. 3,356,802 84,878 n.a. 366,778 1948-1949 n.a. 3,693,177 . 114,252 n.a. 414,694
I 949-1950 3,809,380 3,690,375 118,804 . 201 6· 451,435 1950-1951 3,882,941 3,73 I ,042 151,717 1826 485,030 1951-1952 3,930,744 3,796,325 134,209 2106 578,915 1952-1953 3,584,033 3,438,832 144,810 391 6 557,741 1953-1954 3,499,982 3,365,408 134,008 5466 550,865
1954-1955 3,444,417 3,303,541 139,314 1,562 559,868 1955-1956 3,500,394 3,354,913 143,864 . 1,617 542,430 1956-1957. 3,675,490 3,519,382 154,372 1,736 546,197 1957-1958 3,737,496 • 3,575,350 160,307 1,839 552,357 1958-1959 3,972,423 3,801,140 169,358 1,925 585,785
I 959-1960 4,150,743 3,968,880 179,993 1,870 611,544 1960-1961 · 4,199,669 4,001,331 196,419 1,919 609,721 1961-1962, 4,437,516 4,226,807 208,231 2,478 725,329 1962-1963 4,823,305 4,598,097 222,621 2,587 824,677 1963-1964 5,235,650 4,992,381 241,313 1,956 939,404
458
,

' ENROLMENT IN PUBLIC AND PRIV_ATE SCHOOLS AND STATE SCHOOL YEAR 1930-1931 TO 1972-1973
Secondary Collegiate
Bureau of Bureau of U.P. & State Bureau of Bureau of U.P. & State Public Private Colleges & Total Public Private Colleges &
Schools Schools Universities Schools4 Schools Universities5
79,054 36,968 n.a. n.a. 1,786 16,685 n.a. 76,355 35,696 . n.a. n.a . 1,843 18,390' n.a. 66,860 3 I ,53 I n.a. n.a. 1,857 17,720 n.a. 56,255 30,044 n.a. n.a. 1,749 16,586 n.a·. 52,689 26,706 n.a. n.a. 1,597 16,514 n.a. 53,485 28,839 n.a. n.a. 2,078 18,614 n.a. 58,830 30,017 · n.a. n.a. 2,570_ I 9,364 n.a. 68,084 36,892 n.a. n.a. 3,038 22,735 n.a. 76,758 63,589 n.a. n.a. 3,682 36,013 n.a. 90,579 63,589 n.a. n.a. 3,777 36,013 n.a.
98,286 63,750 n.a. . n.a. 855 10,695 n.a. 112,687 132,225 n.a. 47,690 664 44,878 2,1486 155,788 132,223 n.a. 45,458 1,861 40,879 2,7186 180,468 185,547 7636 83,813 2,350 77,366 4,0976 193,336 220,445 9p6 117,028 "4,633 107,300 5,0956
206,004, 244,608 8236 148,167 6,682 135,574 5 ,91 I 6 195,774 288,159 1,0976 189,445 5,909 176,996 6,5406 180,650 396,895 1,3706 220,035 5,992 206,431 7,6126 178,285 377,916 1,5406 180,187 5,068 166,791 8,3286 · 179,738 369,403 1,7246 171,175 5,054 156,208 9,9136
183,693 372,495 3,680 182,454 5,856 156,154 20,444 176,144 361,375 4,91 I 205,3~2 6,670 174,099 24,613 180,553 360,270 5,374 247,067 7,126 214,068 25,873 181,543 364,324 6,490 243,074 7,547 · 208;009 27,518 186,052 393,034 6,699 275,223 6,930 239,364 · 28,929 193,077 411,380 7,087 276,261 8,414 241,631 26,2 I 6 185.295 417,584 6,&42 300,572 9,860 261,477 29,235 262,616 455,403 7,310 325,453 6,939 279,713 38,801 289,728 527,002 7,947 358,770' 7,913 313,308 37,549 341.275 592,872 5,257 385,468 . 7,784 345,030 32,654
459
•

Table 15.3 - ELEMENTARY, SECONDARY A)'ID CbLLEGIATE COLLEGES AND UNIVERSITIES, SCHOOL YEAR
Elementary
School Year
1964-1965 1965-1966 1966-1967 1967-1968 1968-1969
1969-1970 1970-1971 1971-1972 1972-1973
Total
5,577,326 5,814,783 6,191,810 6,406,324 6,699,284
7,089,168 7,240,438 7,630,451 7,977,496
n.a. - Data not available. Iwar Years. 2AsofMay 1945. 3AsofMareh 1946. 4rechnical and nonn~ schools only.
Bureau of Public Schools
5;327,704 5,551,310 5,909,547 6,116,737 6,366,004
6,752,316 6,897,589 7,271,004 7,605,889
Su.P. and 16 State CoD~cs and Universities that reported. 6U.P. only. .
Bureau of U.P. & State Private Colleges & Schools Universities
247,567 2,055 261,344 2,129 280,069 2,194 287,111 2,476 330,640 2,640 334,358 2,494 341,244 1,605 357,712 1,735 369,513 2,094
Sources of data: National Census and Statistics Office, Statistical Yearbook of the PhDlppines 1944: Bureau of Public Schools, Statistical Bulletin 1953-1954. Division of Evaluation Research and Statistics, Bureau of Private Schools. Office of State Collegei and Universities, Deparbnent of Education and Culture. U.P. Office of the Registrar.
460
Total
1,024,115 1,157,083 1,276,564 1,354,106 1,421,031
1,590,479 1,692,280 1,793,260 1,878,425
'

.. ENROLMENT IN PUBLIC AND PRIVATE SCHOOLS AND STATE 1930-31 TO 1972-73 (continued)
Secondary Collegiate·
Bureau of Bureau of U.P. & State Bureau of Burea_u of U.P. & State Public Private Colleges & Total Public Private -Colleges &
Schools Schools Universities Schools4 Schools Universities5
375,655 . 643,061 5,399 430,715 8,545 388,780 33,390 420,794 730,83 I 5,458 517,751 8,899 469,038 . 39,814 486,1 I 9 784,587 5,858 , 544,913 8,961 49S,836 40,1,16 535,696 8 I 2,906 5,504 590,476 8,830 539,210 42,436 536,267 884,764_ 7,166 '615,461 7,047 565,035 43,379
669,280 915,516 5,683 620,097 5,200 574,020 40,877 728,788 956,402 7,09Q\ 629,770 3,518 584,171 42,081 ' . 773,485 1,012,708 7,067 647,822 2,807 601,835 43,180 842;679 1,028,820 6,926 n.a. n.a. n·.a. n.a.
461

Table 15.4-COLLEGIATE ENROLMENTlN PRIVATE SCHOOL YEAR 1930-1931
Commerce and Liberal Engineering
School Year Total. . Business Arts and Teacher and Administra- Sciences Training Technology
tion ·
1930 · 1931 16,685 1,647 n.a. 2,501 1,356 1931 -1932 18,390. 2,234 n.a. 2,955 1,753 1932 · 1933 17,720 2,109 n.a. 2,609 1,839 1933-1934 16,586 1,970 n.a. 1,736 1,710 1934·1935 16,514 2,103 n.a. · I ,124 2,308
1935-1936 18,614 2,508 n.a. 2,569 2,217 1936-1937 19,364 2,705 n.a. 1,522 4,621 1937-1938 22,735 4,063 n.a. 2,215 2,893 1938 -1946 n.a. n.a. n.a. n.a. n.a.
1947-1948 77,366 1,093 57 5,860 2,472 1948-1949 107,300 18,817 14,203 49,644 10,247 1949-1950 135,574 21,705. 20,024 63,748 12,114 1950-1951 176,996 24,446 22,110 86,345 16,406 1951 -1952 206,431 39,422 31,682 79,993 19,752
1952 -1953 166,791 32,946 · 25,615 56,697 14,816 1953 -1954 156,208 33,353 26,384 43,334 14,955 1954 -1955 156,154 37,892 28,408 . 33,200 19,060 . 1955 -1956 174,099 45,909 35,346 28,548 20,211 1956: 1957 214,068 54,955 58,076 28,198 26,183
1957 -1958 208,009 51,978 44,603 · 31,482 28,574. 1958-1959 239,364 69,833 40,171 40,448 36,499 1959-1960 241,631 74,007 40,233 36,499 34,990 1960-1961 261,477 94,757 41,563 45,913 23,384 1961 · 1962 279,713 82,375 44,959 59,043 30,059
1962-1963 313,308 83,616 48,691 84,"536 42,214 1963 • 1964 345,030 90,617 55,121 97,398 48,166 1964 • 1965 388,780 94,148 63,643 124,211 48,503 1965-1966 469,038 110,178 70,721 176,512 56,253 1966 • 1967 495,836 124,788 78,380 188,806 . 37,177
1967 -1968 539,210 · 139,490 93,516 190,653 52,985 1968-1969 565,035 167,188 103,149 165,602 57,191 1969-1970 574,020 187,644 106,939 146,631 60,414 .
' 1970-1971 584,171 217,218 113,225 108,309 61,263 1971 -1972 601,835 245,062 122,378 · 84,391 70,444
n. a. - Data not available. Source of data: Di-.-ision of £Valuation, Research and Statistics, Bureau of Private Schools, Department of Education and
Culture. '
462

SCHOOLS BY MAJOR FIELDS OF STUDY: TO 1971-72
Food
Medical Law and Music Nutrition Nautical Agri-Science Foreign and and Science culture Chemistry Others
Service Fine Arts Dietetics
3,506 1,503 . 27 37 n.a. n.a. n.a. n.a. 3,329 1,589 33 39 n.a. n.a. n.a. n.a. 3,121 1,682 37 43 n.a. n.a. n.a. n.a. 3,209 1,822 33 103 n.a. n.a. n.a. n.a. 3,233 2,060 29 48 n.a. n.a. n.a. n.a.
3,414 2,353 61 128 59 n.a. n.a. · n.a. 3,505 2,679 56 164 132 n.a. n.a. n.a. 3,582 2,920 144 241 142 n.a. n.a. n.a.
n.a. n.a. n.a. n.a. • n.a. n.a, n.a. n.a.
168 1,073 1,077 n.a. n.a. n.a. 117 .n.a. 9,728 3,858 710 n.a. n.a. I 97 n.a. 8,952 6,327. 586 n.a. n.a. 230 288 n.a.
14,903 8,284 778 n.a. n.a. 417 365 n.a. 17,505 10,997 · 2,887 1,170 510 327 462 n.a.
16,722 10,935 3,171 1 ;389 778 1,065 544, 2,113 16,644 10,892 4,416 1,665 785 1,306 595 1,87'9 17,186 I 0,412 2,506 1,964 1,047 1,698 850 1,931 18,337 11,670 4,700 2,373 1,299 (,961 1,286 2,459 20,528 11,103 4,990 2,678 1,520 2,550 1,547 1,740
22,320 11,585 5,4 I 1 2,837 1,271 3,350 2,487 2,111 26,295 12,656 2,196 2,366 990 3,566 2,303 2,041 27,243 11,529 2,016 4,994 1,037 4,171 2,806 2,106 26,113 10,736 3,906 5,937 920 . 3,792 1,840 2,616 25,516 9,186 1,873 6,287. 1,39? 3,295 3,522 12,201
22;013 9,633 1,847 6,105 1,623 3,231 3,444 6,355 22,329 8,729 1,033 6,114 2;251 3,540 3,187 6,545 24,446 8,740 2,090 · 6,141 2,289 3,686 3,542 7,341 22,195 11,026 1,678 5,252 1,607 3,297 2,544 · 7,775 21,986 12,414 5,427 3,529 5,101 · 3,285 2,473 12,470
22,512 13,428 6,228 3,769 2,676 3,279 · 2,498 8,176_ 23,488 15,195 6,557 4,337 3,342 3,340 3,882 . 33,854 24,947 15,654 6,506 4,568 2,899 3,444 2,095 12,279 31,305 15,094 7,617 4,463 3,337. 3,349 2,351 - 16,640 32,547 15,037 ·7,!)13 4,981 5,57'5 4,059 2,797 7,551
463

\
TABLE 15.5 _:_ COLLEGE GRADUATES SELECTED MAJOR FIELDS OF STUDY:
,,. Commerce , · and Liberal Engineering
School Year Total· Business Arts and Teacher and Administra- Sciences Training Technology
tion
1947 -1948 n.a. 266 510 1,634 12 l 1948-1949 n.a. 3,856 3,505 13,451 740 J 949·s J 950 n.a. 4,342 4,379 21,554 1,306 1950-1951 n.a. 5,107 4,572 36,789 f,550 1951 - 1952 44,887 4,161 4,458 29,770 1,594
1952- 1953 45,460 5,883 5,392 26,617 1,943 1953 -1954 33,074 6,286 5,199 13,832 1,895 1954-1955 33,682 · 8,015 6,232 11,283 2,309 1955-1956 ~8,934 12,565 6,437 · 3,967 4,890 1956-1957 34,841 9,932 7,446 7,903 2,216
1957 -1958 31,479 9,708 6,244 1,278 2,268 1958-1959· 35,704 10,900 5,604 8,664 2,497 1959-1960 35,137 11,i 55 4,639 7,716 2,828 1960 - 1961 38,647 12,468 3,960 10,675 3,447 1961 - I 962 47,676 15,322 4,417 . 14,344 4,266
1962- 1963 48,686 12,906 · 5,021 18,442 3,606 1963 - 1964 51,945 11 ;878 4,996 23,725 3,062 1964 - 1965 65,996 11,550 5,271 34,577 4,785 1965 - 1966 81,327 15,211 7,985 . 44,859 4,564 1966- 1967 86,075 14,665 8,132 46;868 5,767 .
1967 -1968 84,033 14,800 9,375 '46,831 · 4,588 1968 - 1969 83,127 24,199 7,724 39,616 4,442 1969 - 1970 96,642 27,702 13,825 41,151 5,465 1970 - 1971 82,469 28,075 12,505 27,902 4,287 · 1971 -1972 81,651 3o',648 11,765 21,896 4.263
n.a. - Data not available. Sources of data: ,Department of Education and Culture, Statistical Dara and Information 1972.
Bureau of Private Schools, Statistical Bulletin 19SJ-l 9S4.
464

OF PRIVATE SCHOOLS BY SCHOOL YEAR 1947-48 TO 1971-72
Law and Music Medical Foreign and Science Service Fine Arts
81 59 n.a. 916 861 11
1,7~2 1,125 8 1,476 1,233 15 2,797 1,342 120
2,945 1,824 172 3,276 1,8:38 119 3,564 1,349 · 156 5,861 3,738 195 3,775 2,161 221
2,894 1,742 306 3,801 2,360 161 5,330 1,824 170 3,944 2,092 1 I 9 4,527 2,264 254
3,737 2,398 169 .3,519 1,470 215 5,339 835 532 4,692 1,288 182 5,435 1,493 583
4,269 1,363 527 2,948 1,261 619 3,756 1,643 724 5,218 2,150. 488 8,093 2,356 613
Food Nutrition Nautical Agri-
and Science culture · Chemistry Dietetics
6 n.a. n.a. 15 n:a. n.a. 22 80 132 n.a. 44 73 238 n.a. 85 112 87 303 108 147
173 270 199 42 249 136 184 60 305 196 208 65 220 447 479 135 314 295 289 289
369 250 242 178 \ '880 397 253 187
690 209 354 222 943 160 542 297 994 123 6 I I 554
1,1 16 352 398 541 1,325 728 502 525 1,164 365 798 780 1,003 526 464 553 1,346 552 548 - 686
910 393 724 253 786 652 523 357 872 695 589 220 695 390 438 321 583 424 688 322
465

1 Table 15.6 - DROP-OUT RATES IN PUBLIC ELEMENTARY,
~ SCHOOL YEAR 1946-(In per
School Year Primary I n termediate ~
II III IV V VI VII
1946-1947 10.20 8.09 9.03 10.53 12.27 9.20 n.a. 1947-1948 10.71 6.98 6.98 8.21 10.36 7.53 n.a.
~ 1948-1949 11.58 8.95 8.42 8.84 I 1.06 9.82 n.a. 1949-1950 12.63 8.93 9.32 9.52 9.96 8.18 n.a. ' 1950-1951 12.71 10.19 l 0.47 11.88 12.57 10.12 n.a. t 1951-1952 14.77 11.92 12.44 13.51 I 5.42 12.40 n.a. I 952-1953 13.41 10.91 11.65 12.62 14.05 12.3.7 n.a. 19$3-1954 12.08 9.08 9.96 10.86 12.06 10.76 n.a. 1954-1955 12.19 8.94 9.58 10.67, 11.71 10.36 n.a. 1955-1956 11.16 8.00 8.96 9.54 9.97 8.85 . n.a.
1956-1957 10.48 7.66 8.54 8.98 10.11 7.81 n.a. 1957-1958 10.00 7.57 8.10 8.56 9.21 7.96 5.00 I 958-1959 8.88 6.22 7.03 7.79 8.69 6.92 8. 14 1959-1960 8.80 6.10 6.85 . 7.68 7.86 7.42 6.51 1960-1961 9.16 6.79 7.56 9.97 8.51 7.86 9.35
1961-1962 8.45 6.21 7.40 9.22 8.09 8.35 4.69 1962-1963 8.80 6.45 6.57 7.73 7.14 5.75 6.15 I 963-1964 8.85 6.14 7.04 8.24 8.10 6.49 9.05 1964-1965 7.50 5.33 6.01 6.60 6.90 7.04. 10.76 1965-1966 7.51 4.88 5.45 6.10 6.63 5.95 l I. 10
1966-1967 7.00 4.98 5.34 .6.22 6.80 5.68 11.10 1967-1968 6.99 4.83 . 5.25 5.64 6.93 6.04 14.00 I 968-1969 6.67 4.55 5.06 5.59 6.88 5.99 7.45 1969-1970 5.48 5.48 7.17 2.36 6.81 6.10 I .45 I 970-1971 6.05 4.88 5.11 6.32 6.76 6.36 n.a. 1971-1972 6.42 -4_90 5.53 5.83 6.63 n.a. n.a.
n.a. - Data not available. Note: Drop-0ut rate is thr: ratio ( expressed in per cent) of the number of srudents that have dropped out during the school
year to the total enrollment at the beginning of the school-year. Sources of data: ~escarch and Statistics Division, Bureau of Public Schools, Department of EducatiOn and Cul h1re.
466

SECONDARY AND COLLEGIATE SCHOOLS BY GRADE AND YEAR 1947 TO 1971-72 cent)
Seconda.ry Collegiate First Yr. Second Yr. Third Yr. Fourth Yr. First Yr. Second Yr. Third Yr. Fourth Yr.
6.43 7.14 6.20 5.26 13.82 5.51 22.22 n.a. 8.89 6.00 4.28 3.39 10.66 4.72 n.a. n.a. 9.78 6.33 4.24 2.59 "9.01 6.63. 3_.64 n.a.
· 10.64 6.49 4.29 2.41 6.20 2.44 2.60 . n.a. 10.44 7.53 6.24 3.34 7,59 3.21 n.a. n.a.
13,98 9.64 7.69 3.81 6.70 2.54 _6.90 n.a. 14.49 8.99 6.83 3.49 7.18 2.27 7.43 n.a. 14.4 I 9.38 6.15 3.00 8.71- 2.34 4.47 4.27 15,01 10.50 7.14 2.94 7.66 2.86 4.12 1.96
. 13.19 8.98 7.72 3.19 5.77 2.06 3.07 2.84
13.54. 9.93 7.70 3.58 7.85 3.52 2.01 0.96 12.50 9.04 7.97 3.63 8.35 2.51 1.40 1.83 13.20 9.83 7.78 3.50 9.33 3.08 0.87 -0.26 12.81 9.73 7.45 4.47 4.44. 1.55 1.14 I. 13 14.52 10.79 9.30 . 5.59 6.12 2.09 0.92 0.65
10.79 7.76 7.28 3.67 4.68 2,25 0.94 0.42 10.69 - 8.02 7.32 3.89 I.OS 0.43 -0.11 0.40 10.53 6.89 7.42 3.96 0.43 0.41 0.87 0.06 9.54 7.18 6.24 3.13 0.91 . 0.51 0 .. 16 0.22 9.88 7.96 7.17 3.14 1.03 ·0.97 1.46 2.26
10.59 8.38 7.69 3..46 0.55 1.32 0.31 0.22 . 10.84 · 8.52 7.84 4.31 0.8 I 0.80 0.55 0.36 10.56 8.30 7.79 4.64 0.68 0.59 0.90 0.68 10.14 7.86 7.57 4.27 n.a. -n.a. n.a. ·n.a. 10.51, 8.03 7.52 4.79 n.a. n.a. n.a. n.a. 8.54 10.79 8.67 8.04 n.a . n.a. n.a. n.a.
•
467

Table 15.7 - CURRENT OPERATING EXPENDITURES OF OF THE NATIONAL BUDGET AND ITS
FY 1961-62 (In thou
Total Expenditure Breakdown of
Per Cent of Bureau of Fiscal Year National Department of National Bureau of Private
Government Education Government Public Schools Schools Expenditure
1961-62 1,469,374 382,202 26.01 378,136 1,169 1962-63 1,852,058 445,356 24.05 411,549 1,243 1963-64 2,067,482 515,572 24.94 477,082 1,338
I 964-65 2,077,354 537,034 25.85 504,208 1,283
I 965-66 2,227,722, 655,942 29.44 620,086 1,482 I 966-67 2,531,038 709,173 28.02 667,329 . 1,523
I 967-68 2,944,327 761,761 25.87 717,766 1,483 1968-69 3,6 l l ,040 877,615 24.30 826,675 l ,714 1969-70 4,053,487 993,405 24.51 924,101 1,894 1970-71 4,428,986 1,108,351 25.02 1,029,902 2,142 1971-72 5,588,196 1,255,509 22.47 902,726 2,770
Total. Expenditure Breakdown of
Department of Per Cent of Bureau of Bureau of National •Education National Elementary Secondary
Government and Culture! Government Education Education Expenditure
I 972-73 1 7,990,463 2 1,320,5472 16.53 1,4782 1,5702
n.a. - Data not available. • lOepartment of Education was reorganized into the·Oepartment of Education and Culture under the Reorganization Plan of 1972.
2Estimates only. · Source of data: Budget Commis5ion, Performance Budget·for Several Years.
468
~
~ ~ ~
~ 4
. '
4
/

THE DEP_ARTMENT OF EDUCATION AND CULTURE AS A PERCENTAGE BREAKDOWN, BY BUREAU OR OFFICE: TO 1972-73 sand pesos)
Expenditure fer Cent of Department Expenditure.
Bureau of Other
Bureau of Bureau of Vocational Bureau of Private Vocational Other
Education · Offices Public Schools Schools Education Offices
n.a. 2,897 98.94 . 0.30 n.a. .0.76 30,927 1,637 92.41 ,0.28 6.94 0.37 34,683 2,469 92.53 0.26 6.72 0.48 28,958 2,585 93.89 0.24 ,S.39 0.48 3 I ,55 I 2,823 94.53 0.23 4,81 0.43 37,273 3,048 94.10 0.21 5.26 0.43 39,185 3,327 94.22 0.19 5. 14 0.44 45,229. 3,997 94.20 0.19 5. I 5 0.46 41,879 25,53 I 93.02 0.19 4.22· 2.57 49,397 26,910 92.92 0.19 4.46 2.43 81,892 268,121 71.90 0.22 6.52 21.36
Expenditure Per Cent of Department Expenditure
Bureau of Other
Bureau of Bureau of Bureau of' Other Higher
Offices Elementary Secondary Higher
Offices Education Education Education Education
2,0102 . 2 0.11 0.12 0.15 99.62 1,3 I 5,489 .
469

Table 15.8 - CUMULATIVE NUMBER OP-REGISTERED
Asof Civil Professional Associate
Accountants Lawyers · Architects Electrical Electrical End of Engineers Engineers Engineers
1950 2,053 1,858 404 2,405 142 217 ,
1951 2,323 3,047 515 2,985 146 221 j
1952 2,945 4,752 586 3,415 154 229 - 1953 3,452 6,322 667 3,849 167 237 1954 3,675 8,731 778 3,981 172 240 1955 4,055 9,561 899 4,246 181 240
1956 {302 11,844 952 4,488 189 _262 1957 4,968 12,459 1,009 5,053 200 271 1958 · 5,739 13,327 1,046 5,374 213 297 1959 5,739 14,127 1,351 5,771 249 330 1960 6,409 15,794 1,351 6,024 270 "362
1961 7,088 16,639 1,490 6,340 317 419 1962 7,734 17,538 1,647 6,475. 386 439 1963 8,586 18,752 1,723 6,904 424 475 1964 11,459 19,647 1,956 7,243 465 496 1965 12,983 20,290 2,116 7,750 495 524
1966 15,233 · 21,005 · 2,504 8,197 529 559 1967 17,032 21,416 2,647 8,773 559 589 1968 19,528 21,763 2,763 9,275 585 597 1969 · 20,961 22,258 2,892 10,035 613 630 1970 22,534 22,751- 3,121 10,941 652 674
1971 23,928 23,372 3,388 11,709 713 726 1972 25,148 24,193 3,814 12,570 769 800 1973 26,121 24,740 4,108 13,284 827 891
•
470

PROFESSIONALS, PHILIPPINES: CY 1950-73
• -Naval Archi-Assistant Professional Mechanical Junior
Mining Electrical Mechanical . Plant Mechanical Chemical tects/Marine Engineers Engineers Engineers Engineers Engineers Engineers Engineers ·
59 · 256 961 225 164 295 5,029
.] 23 274 .1,00 I 687 247 319 5,194 193 291. 1,013 1,018 327 336 7,382 273 337 1,042 1,221 - 407 346 7,725 -330 366 1,089 1,625 478 354 8,027 419 411 1,139 2,010 573 364 8,531
474 481 . 1,196 2;321 659 376 9,176 527 492 1,217 . 2,528 699 388 9,745 607 520 1,264 2,780 936 411 9,778 717 590 1,374 3,101 989 439 9,778 784 692 .1,500 3,436 1,288 465 :J, 778
• 918 828 1,671 3,921 1,384 474 9,778
1,055 988 1,813 4,390 1,965 514 9,778 1,159 1,093 1,885 4,726 2,041 561 9,778 1,296 1,883 1,913 5,118 2,376 561 9,778 1,488 1,247 1,943 5,445 2,511 660 9,781
_ 1,650 1,325 1,971 5,876 3,088 744 9,806 1,814 1,382 2,013 6,339 3,539 795 9,865 2,034 1,454 2,047 6,88'7 4,035 837 9,935 2,133 1,512 2,070 7,236 4,461 849 10,014 2,381 1,512 2,070 7,239 4,886 926 10,102
2,734 I ,SSS 2,070 7,239 5,233 1,425 I 0,204 3,054 I ,SSS 2,070 7,239 5,222 1,469 10,306
. 3,415 1,585 n.a. n.a. 5,984 1,053 n.a.
471

Table 15.8 - CUMULATIVE NUMBER OF REGISTERED
As of Professional . · . ·
Sanitary Agricultural Ge~debc 'End of Engineers Engineers Engineers Surveyors Geologists Dentists Physicians
1950 n.a. 1 n.a. 678 n.a. 3,751 9,306
1951 n.a. 1 n.a. 693 n.a. 4,289 9,399 1952 n.a. 1 n.a. 719 n.a. 5,038 9,684 1953 n.a. I n.a. 732 n.a. 5,789 9,851 1954 n.a. 1 n.a. 755 n.a. 6,416 10,610 1955 n.a. n.a .. 835 n.a. 7,141 11,236
1956 n.a. I 3 907 n.a. 7,443 12,893 1957 n.a. 1 70 1,009 n.a. 7,678 14,141 1958 n.a. 1 76 1,073 n.a. 7,952 15,354 1959 n.a. 1 106 1,289 . n.a. 8,193 16,118 1960 n.a. 1 111 1,412 .n.a. 8,513 17,190
·• ' 1961 n.a. . 1 131 1,583 n.a. 8,822 18,353 1962 n.a. 1 187 1,589 n.a. 9,444 19,223 1963 n.a. 1 209 1,930 n.a. 10,163 20,28 I 1964 n.a. 1 209 2,019 n.a. 10,625 22,557 1965 137 847 250 2,524 3 11,046 24,088
1966 183 1,829 269 2,552 52 11,266 25,640
~ 1967 193 2,695 276 2,566 199 11,600 27,095 1968 244 3,067 307 2 265 11,792 28,374 1969 269 3,156 319 2 275 11,967 29,704. 1970 304 3,170 347 2 334 12,174 31,515
1971 336 · 3,177 ,380 2 356 12,327 32,186 1972 369 3,186 390 2 373 .• 12,474 33,741 1973 411 3,193 419 2 392 12,596 35,286
n.a. - Data not available.
I Prior to 1965 there was no examination for Geodetic Engineers. _ 2Board of Examiners for Surveyors was replaced by the Board of Examiners _for Geodeti~ Engineers under Republic ·Act 4374. I
Source of data: Civil Service Board of Examiners Registration Section.
472

- PROFESSIONALS, PHILIPPINES: CY 1950-73 (continued)
Nurses Pharmacists Midwives Dieticians Opto- Vete- Chemists Chemical metrists rinarians Technicians
7,268 5,755 3,574 n.a. 456
. 7,766 7,032 3,662 n.a. 475 302 n.a. n.a. 8,311 7,494 3,814 n.a. 488 302 · 3 n.a. 8,851 8,897 3,857 n.a. 517 302 3 39 9,250 9.721 4,175 n.a. 542 302 385 39
10,267 10,463 4,349 n.a. 620 302 535 69
11,173 11,579 4,820 n.a. 704 302 784 125 12,033 11,962 5,338 n.a. 788 302 863 139 13,114 13,207 5,957 n.a. 810 302 1,000 150 14,304 13,630 6,840 n.a. 894 302 1,292 157 15,776 13,886 7,933 n.a. 1,210 302 1,292 163
17,388 14,038 8,547 1,476 423 1,434 164 19,310 - 15,768 9,645 132 1,515 531 1,605 164 20,953 16,017 10,831 199 1,699 497 1,782 164 22,953 16,831 11,914 291 1,699 497 2,020 164 24,838 17,418 12,868 392 2,089 571 2,327 164
27,306 17,866 13,497 544 2,266 632 2,550 164 29,870 18,150 13,924 651 2,360 632 2,848 164 32,474 18,653 14,319 758 2,520 685 3,111 175 35,428 18,747 14,812 864 2,586 727 3,234 187 38,918 19,076 16,002 940 2,677 727 3,423 219
42,636 19,332 17,167 1,014 2,889 774 3,656 236 43,703 19,620 18,312 1,055 2,940 842 3,787 236 51,563 19,765 19,931 1,130 2,951 879 4,121 305
473

CHAPTER XVI
INTERINDUSTRY RELATIONS AND
FOOD BALANCES
Figure 16.1 Daily Per Capita Available Food Supply, Philippines: CY 1953-1972 479
Table 16.1 Aggregated 12~sector Transactions Table at Producers' Prices, Philippines: 1965 480
Table 16.2 Matrix of Input Coefficient (A) (12 Sectors), 1965 484
Table 16.3 Matrix of Inverse Coefficient ([-At1 (I 2 Sectors), 1965 ' 486
Table 16.4 Daily Per Capita Available Foo'd Supply, Philippines: CY 1953-72 488
Table 16.5 Calorie and Nutrient Values of Daily Per Capita Available F.ood Supply, Philippines: CY 1953-72 490
■

CHAPTER XVI
INTERINDUSTRY RELATIONS AND
FOOD BALANCES This chapter presents in summary form the results of two. im
portant activities of the Statistics Office (formerly, the Office of Statistical Coordination and Standard or OSCAS) of the NEDA, viz., the preparation of interindustry (input-output) tables and the annual estimation of the net available food supply (Food Balance Sheet).
The 1961 and the 1965 interindustry relations studies of the Philippine economy were undertaken initially as a project of the National Economic Council from 1965 to 1968 and subsequently as a regular
· activity of the Statistical Research and Development Branch of the OSCAS upon integration in 1969 to pursue the following objectives: (I) to make available to planners a set of useful and eff~ctive tools for comprehensive economic analysis and for drawing up, evaluating, and reviewing the country's sub-economic plans; (2)' to ensure consistency in the concepts as well as the optimum use of basic statistics in an in/tegrated system of national accounts; and (3) to provide an effective means for a thorough check in the statistical system on the gaps and inconsistencies in the production of statistics.
The result of the first input-output study (for I 961) was published by the OSCAS, NEC in a special publication on the subject in 1967. The 1965 results, also at a SO-sector level of aggregation, were published in the July-September issue of the Statistical Reporter, Volume XV, No. 3. Both I 961 and 1965 accounts consisted of the transactions table at purchasers' prices, the transactions table at pro-
. ducers' prices, the trade and transport matrices; the matrix of input coefficients (A), and the inverse of the technology (I-A) matrix: Similar tables in 107-sector and 194-sector aggregation are available in IBM tabulation sheets. ·
The three tables presented in this chapter are an aggregation of the I 965 tables and 12 sectors corresponding to the divisional grouping of the classification of industrial activities since I 959-.
Presented in this chapter are the average daily per capita net available food supply in grams by type of food and the calorie and nutrient values of the total p_er capita daily food supply for the same period.
477

The Food Balance Sheet for a given year attempts to show the net available supply of food in the country from domestic production and importations by netting out exports and provisions for seeds, wastage, industrial and non-food uses. This set of derived statistics prc,vides a basis for assessing -the adequacy of food intake measured in terms of food availability as against nutritional re.quirements.
478
l 1 1

.,,. ...., \0
Figure 16. I DAILY PER CAPITA AVAILABLE FOOD SUPPLY, PHILIPPINES: CY 1953-72
GRAMS PER OAV 1,100
1,000
900 I I
800 - ....-~
700
600
500
400
300 ~
200 ~- - - - - f- -- - 1-•-100 .L. ·- . - -- -- ·- - ·- ·-..... .. . . ... -- .. . .. ..
+·--·-.---~-- --- --- ---0
-~ ~
.... ,,., ....., I>"" .
----..,·.J-••· .... c· .Te'P
- .. -1--- - -- ---·- -·-
~
...... t--
.....,
' --- . ···-u-••
----- -- --
- ALL TYPES
,t C EREAL ANO
EREAL PRODUCTS
V EGETABLES AND FRUITS
MEAT, FISH ANO OTHER MARINE PRODUCTS
~1s UGAR, SYRUP ANO OTHERS
N
1953 '54 155 '56 '57 '58 '59 160 '61 '62 '63 '64 '65 '66
ROOTS AND.TUBERS
EGGS, MILK ANO 161 '68 169 70 '71 '72 MILK PRODUCTS .
..
-

I I
'
4)
"" 0 u .... ::,
"' .... ::, 'i' .... ::,
"' C -I 2 3 4
5 6 7 8
.9
10 11
12
18 19 20
. 21 22
Table I 6.1 - AGGREGATED 12-SECTOR TRANSACTIONS
(Thousand
T bJ)
0 C "oi,
4) bJ)
~ "' ..3 4) .... -·.::: '3 ~ 4)
" . ..c:: .>, ·5, "' ~ ... .... < "' 4) ...
0 ~
F r 0 m
(I) (2) (3)
Agriculture 210,969 1,749 -Fisheries 880 11,599 -
Forestry and logging 2,177 . 7,048 2,487 Mining and quarrying 269 691 -
Food manufactures 96,473 32,377 -Other manufactures 168,149 99,697 71,468 Construction - - -Utilities 3,342 J ,048 889
Transportation, comm. & warehousing 20,174 7,422 5,187
Trade 64,818 29,326 ·14,938 Banking, insurance & real
estate 74,896 -5,607 6,885 Other services 19,350 12,268 22,309
Intermediate totals 661,497 208,832 I 24,163
Wages and salaries 2,123,775 407,687 303,286 Depreciation allowance 85,967 I 5 I ,689 52,238 Other value added 2,174,794 262,749 334,922 Indirect taxes less subsidies (33,481) 2,783 23,119 Statistical discrepancy - - -
Primary totals 4,351,055 824,908 7 I 3,565
Total Input 5.,012,552 1,033,740 837,728
Source: Statistics Office, National Economic and Development Authority.
480
1

TABLE AT PRODUCERS' PRICES, PHILIPPINES: 1965
pesos)
0!J ~ ~
C " " ·;;:, .. .. :I :I C .. - -.. " " _g
"' ,!? ,!? ~
;:I - .!! " QI :I :I :I -C C .. == .... "' "' -::. ::. ~ :5 Cl)
C C -0 .. 0
·2 0 " u .<::
i 0 -LI.. 0
(4) (5) (6) (7) (8)
1 2,436,735 432,527 273 127,049 730
5,906 4,819 113,471 7,700 319 2,107 5,968 286,436 26,556
385,913 · 43,985 87,442 238,598 - 1,630,53_5 722,641 65,884
265 856 2,309 26,668 777 3,104 13,734 48,409 3,026 21,627
9,594 92,662 128,977 27,905 1;559 14,214 403,033 365,372 125,469 13,799
9,607 60,236 109,588 25,019 7,381 16,243 63,855 254,358 81,056 12,670
I 48,483 3,833,458· 3,416,697 1,046,313 130,016
93,030 . 416,478 772,502 470,577 76,262 26,472 91,653 187,077 42,448 31,612
152,134 839,699 1,155,705 364,566 . 78,884 (13,468) 67,110 507,993 22,096 21,838
258,168 1,414,940 2,623,277 899,687 208,596
406,651 5,248,398 6,039,974 1,946,000 338,612
' 481
e 0 u cl~ 0!J
.2 g,~ " -0 ~:;:::::, "' - "'0 i= b -~ ..c:: C.. C f ~ :I "' §E~ .. !-
(9) (10)
5,332 · 3,709
105
28,795 42 279,830 96,235
988 3,208 7,591 ?8,420
78,897 95,278 59,371 18,715
40,193 308,907 63,639 232,258
568,450 783,063
403,353 1,310,341 94,216 91,902
270,652 1,533,458 49,415 90,026
817,636 3,025,727
1,386,086 3,808,790

" 'O 0 u -::, °' -::, 9 -::, °' ,::: -
l 2 .3 4
5 6 7 8
9
10 l I
12
18 19 20 21 22
Table 16.1 - AGGREGATED 12-SECTOR TRANSACTIONS TABLE
(Thousand
" T 0 u ,::: " "' "'- " -;;; .... "' u =- .E -"' "' ,:::~ 0
" I-;< -- Cl) . "' ,D
-~~ .... ::,· " ..c: Cl)
~ oe! -0 "' CQ
F r 0 m
(11) (12)
Agriculture - 124,792 3,212,378 Fisheries - 42,877 186,844 Forestry and logging - 284 144,211 Mining and quarrying 872 754 323,758
Food manufactures - 279,220 866,805 Other manufactures 95,405 302,1-83 3,858,067 Construction 38,778 3,677 77,526 Utilities 17,801 36,l 92 185,183
Transportation, comm. and warehousing 23,960 58,541 556,156
Trade 18,090 147,267 1,274,412 Banking, insurance & real
estate 99,416 111,766 859.,501 Other services 157,089 278,221 1,213,316
Intermediate totals 451,411 1,385,774 12,758,157
Wages and salaries 781,330 2,765,124 9,923,745 Depreciation allowance 229,762 99,819 1,184,855 Other value added 1,767,068 1,068,370 10,003,001 Indirect taxes· Jess subsidies 154,012 36,391 927,834 Statistical discrepancy - 310,278 310,278
Primary totals 2,932,172 4,279,982 22,349,713
TOTAL INPUT 3,383,583" 5,665,756 35,107,870
Source: Statistics Office, National Economic and Development Authority:
482
-

l AT PRODUCERS' PRICES, PHIL!];' PINES: I 965 (Continued) pesos)
c:: -0 c:: c:: .-z (I) " "' 0
~ " (.) 'Z c. " ~ ~ 'ZC'.I E 3 - :, :,
U;::: "'E .:3 - "' " ~ "' "'·- - -0 - E o -C: -0 c:: C: ~ O"-,
~
0 C: " " 0 o· u " E c. c. q_ c. c. C: >< >< "'!:l E " >< ~ UJ UJ "'·- -'oj UJ " 0 c. > > ~"' ·c 0 vu ~ v
(13) (14) (IS) (I 6) (17)
1,324,159 3,771 109,161 628,764 (265,681) 843,254 2,486 1,233 (77) 196,002 I SOI ,036 (3,522)
I 3,773 6,332 3,662 336,021 (276,895)
4,357,245 15,063 20,964 568,245 (579,924) 3,079,550 186,573 1,544,901 598,438 (3,227,555)
3,687 39,3 I 2 1,825,475 123,229 24,981 6,709 (1,490)
584,669 45,030 38,224 181,390 (19,383) l ,9 I 6,235 37,628 2 I 3,230 367,285 ,
1,724,855 l 00,438 480,357 287,264 . (68,832) 2,440,392 1,636,817 3,801 744,244 (377,814)
-
-:, -;:; c. -- :, 0 0 !-' ..0 "' :, 0 "' !-
1,800,174. 5,012,552 846,896 1,033,740 693,517 837,728
82,893 406,65]
4,381,593 5,248,398 2,l 8 I ,907 6,039,974 1,868,474 1,946,000
153,429 338,612
829,930 1,386,086 2,534,378 3,808,790
' 2,524,082 3,383,583 1,452,440 5,665,756
I 6,607,050 2,098,432 4,239,775 4,220,629 (4,816,173) 22,349,713 35,107,870
483

Table 16.2 - MATRIX OF INPUT
"" ~ ~
C " " ·;;, "" ... ... "" .5 :, :, - -0 >, 0 0
~ ..-l ... .!:! .!:! ~ ;a
" :, " ~ :, :, "C - ·.:: :, C C 0 3 " c O' "' "' u 0 ..c:: ~ ;:.: ;:.:
-~ ~ -... fi: ~ b1) "C ... 0 " " - < ... .5 0 ..c:: 0 0 C 0 -" "' ~ "' 0
VJ
(I) (2) (3) (4) (5) (6)
I 0.04208814 0.00169191 - 0.00000246 0.46428167 0.07161074 2 0.00017556 0.01122042 - - 0.02420720 0.00012086 3 0.00043431 0.00681796 0.00296875 0.01452351 0.00091818 0.01878667 4 0.00005366 0.00066845 - 0.00518135 0.00113711 0.04742338
5 0.01924628 0.03132026 - - 0.07352967 0.00728232 6 0.03354559 0.09644301 0.0853 I 170 0.21502960 0.04546111 0.26995729 7 - - - 0.00065166 0.00016310 0.00038229 8 0.00066673 0.00101379 0.00106120 0.00763308 0.00261680 0.00801477
9 0.00402470 0.00717976 0.006 I 9 I 75 0.02359271 0.01765529 0.02135390 10 0.01293114 0.02836884 0.01783156 0.0349538 l 0.07679162 0.06049231 11 0.01494169 0.00542399 0.00821866 0.02362468 0.01147702 0.01814379
, I 2 0.00386031 0.01186759 0.02663036" 0.03994334 0.01216657 0.04211243
Inter 0. I 3 I 968 I I 0.20201598 0.14821398 0'.36513620 0.73040534 0.56568075
18 0.42369136 0.39438059 0.36203398 0.22877111 0.07935336 0.12789823 19 0.01715035 0.14673806 0.06235676 0.06509759 0.01746305 0.03097315 20 0.43386961 0.25417320 0.39979802 0.37411441 0.15999149 0.19134271 21 (0.00667943) 0.00269217 0.02759726(0.03311931) 0.01278676 0.08410516 22 - - - - - -
PRIM 0.86803189 0.79798402 0.85178602 0.63486380 0.26959466 0.43431925
Total 1.00000000 1.00000000 1.00000000 1.000000000 l .00000000 1.00000000
Source: Statistics Office, National Economic and Development Authority.
484

. COEFFICIENT (A) (12 SECTORS), 1965 .
' ·2 ::, .,, E.5 " " - u-E ~
C: "' ~
C: 0::, "'- " ,g ;_;]€ .... ~ -~ ~ ::, w e: - -~ -" ., ~-u
::, - C: .... "0 C: "' " ·- 0"' "' - " en .::, "' +:l ::: f!::: o.ii~ .... ~ - :J~ " C: ::i -=~· ..c:: 0 .... .,,, -u 0 C: C: C o.o
~ - "' C: - ~
"'"' .... u f-
(7) (8) (9) (10) (11) (12)
0.00014029 0.00384680 · 0.02202566 0.00267588 0.00756775
0.00395683 0.00094208 0.00005013 0.01364645 0.00007575 0.00025772 0.00013308
0.02077433 0.00001103 0.04928204 0.37134687 0.19457078 0.20188502 0.02526656 0.02819644 . 0.05333498 0.01370401 0.00229466 0.00071280 0.00084226 0.01146063 . 0.00064899 0.00155499 0.06386956 0.00547657 0.00746169 0.00526099 0.00638785
0.01433967 . 0.02232348 0.05692071 0.02501529 0.00708125 0.01033242 0.06447533 0.04075166 0.04283356 0.00491363 0.00534641 0.02599247 0.01285663 0.02179781 0.02899748 0.08110371 0.02938187 0.01972658 0.04165262 0.03741746 0.04591274 0.06097947 0.04642682 0.04910571
0.53767369 0.38396749 0.41011164 0.20559364 0.13341213 0.24458766
0.24181758 0.22521943 0.29100142 0.34403078 0.23091793 0.48804149 0.02181295 0.09335759 0.06797269 0.02412892 0.06790494 0.01761795 0.18734121 0.23296280 0.19526350 0.40261028 0.52224757 0.I8856619 0.01135457 0.06449269 0.03565075 0.02363638 0.0455 I 743 0.00642297
0.05476374
0.46232631 0.61603251 0,58988836 0.79440636 0.86658787 0.75541234
1.00000000 1.00000000 1.00000000 1.00000000 1.00000000 1.00000000
485

Table 16.3 - MATRIX OF INVERSE COEF
Code (I) (2) (3) (4) (5) (6)
I 1.05961165 0.03187884 0.01221109 0.02984700 0.54021721 0.11764588 2 0.00085743 1.01252151 0.00042030 0.00083720 0.02723658 0.00135954 3 0.00158750 0.00991443 1.005~0429 0.02109286 0.00373184 0.02796056 4 0.00276474 0.00787605 0.00614104 1.02088365 0.00686962 0.06804615 5 0.02316912 0.03769617 0.00351663 0.00757156 1.09478246 0.01874405 6 0.05599987 0.14974992 0.12843220 0.32773369 0.11631849 1.42594973 7 0.00029047 0.00030609 0.00029006 0.00141404 0.00076903 0.00128382 8 0.00170396 0.003257 I 5 0.00293694 0.01257605 0.00592756 0.01470835 9 0.00713936 0.01380969 0.01112622 0.03634283 0.02930768 0.03915559
10 0.01987345 0.04321824 0.02815803 0.06 I 27498 0.10223337 0.09723198 11 0.01983551 0.01427392 0.01481137 0.03956300 0.03399804 0.04182223 12 0.00991689 0.02476577 0.03739980 0.0663~63 0,03198315 0.07832997
Source: Statistics Office, National Economic and Development Authority. 1
486

FICIENT (I-A)-I (12 SECTORS), 1965
(7) (8) (9) (I 0) (11) (12)
0.04883145 0.02863408 0.04527206 0.J0870086 0.00742980 0.06050854 0.00105527 0.00082096 0.00429570 0.00078650 0.00055397 0.00965196 0.01513786 0.00717485 0.00634961 0.00116293 0.001 I 8950 0.00211732 0.04044935 0.01500763 0.01541443 0.00281948 0.00316824 0.00488133 0.01054842 0.00736652 0.03162326 0.00528835 0.00380502 0.05925239 0.55570357 0.31322405 0.3198441 I 0.05768014 0.05707390 0.09727005 1.01476542 0.00320881 0.00159997 0.00201428 0.01211518 0.00115914 0.00867729 1.07250646 0.01062365 0.00980062 0.00690528 0.00893681 0.03376043 0.03603616 1.07220853 0.03014546 0.01054050 0.0 I 695452 0.10686064 0.06825751 0.07215106 1.01334833 0.01253430 0.04084159 0.03762729 0.03904918 0.04734462 0.08868435 1.03439154 0.02937253 0.08219187 0.06529110 0.07482921 0.07406224 0.05539848 1.06261226
487

,,
Table 16.4 - DMLY PER CAPITA AVAILABLE ~ (Grams
◄ ~ "' r:,, - " "' <.) .0 2 -:, :, :, "' ~-g E-- >, z " "' u:, :;5 " .... ~ -~ r:,, .!!l p.. ~ "' ~ -
Year >, .,_ "' .... "' " f-< " "' - "' " Oil - .... " 0 bO
~ " 1 " .... 0 > :;;: u " ~ :,
u u:,
1 1953 778.5 307.7 120.6 38.7 16.9 87.7 1954 784.6 310.4 119.5 38.7 16.2· 87.9 1955 804.4 320.8 119.2 35.2 15.5 87.5
1956 795.3 307.1 120.5 32.6 16.0 85.8 1957 804.7 305.1 119.1 37.3 16.7 85.3 1958 823.6 329.9 115.2 32.2 16.3 87.1 1959 795.0 308.0 113.6 32.'4 26.4 82.2 1960 813.5 .. 312.0 116.9 29.8 38.0 78.4
1961 843.1 331.0 109.5 33.2 .43.2 78.1 , '
1962 · 831.0' 312.6 106.9 42.5 42.0 79.8 1963 978.2 345.7. 116.7 49.3 43.5 · 72.6 1964 978.0 339.6 119.8 49.9 33.9 73.4 1965 1001.1 364.6 117.8 50.6 34.5 75.3
1966 973.1 324.1 103.4 50.4 4'1.6 75.9 1967 1001.1 354.8 93.6 49.8 55.9 75.3 1968 . 973.3 337.9 87.4 49.8 36.7 74.8 1969 1010.7 362.0 88.2 50.4 14.8 78.6 1970 1001.7 376.2 81.2 45.2 15.9 79.2
1971 965.7 39 J.9 · 58.2 49.3 14.8 78.1 ~ 1972 950.9 363.2 65.9 51.4 15.0 76.8
SOurce: Food Balance Sheets of the Philippines, Statistics Office, NEDA.
~
l 488
~

FOOD SUPPLY, PHILIPPINES: 1953-72 per day)
~ ~ -" -" . "
"O " ~ 0 '<! -g - .... ~it: ·3 ~ :-:= .... -"' "' ::. ~ " :s ::.
85.8 40.3 20. 1 84.4 41.7 21.7 88.4 43.2 26.6
87.8 44.4 31.3 88.0 44.9 36.7 87.2 43.8 37.8 83.3 44.2 32.9 85.0 43.2 33.6
95.7 40.4 35.0 103.6 39.4 31.8
· 131.8 36.9 30.7 130.3 36.5 40.7 125.8 35.9 39.8
130.4 49.0 41.5 126.9 47.1 39.9 123.8 45.1 47.8 '131.2 44.0 53.8 133.8 42.6 43.2
99.6 41.9 43.0 98.9 43.2 47.1
fill ·W
7.7 8.4 8.7
9.7 9.0 ·9_3 . 8.7 9.3
10.9 • 7.9 6.8 6.8 6.5
6.8 6.3 8.2 9.8 · 8.2
8.7 8.7
489
~ -.... " ~ ~
" " § " .z::: "O 0 - 0 " 0~ '<! C
'<! " .!;l ~
..c:: .5 - -;; "' ~ .... "' " ~ ·-"' :s "' ::.
45.8 5.2 2.0 47.9 6.1 1.7 51.8 5.8 1.7
53.4 4.4 2.3 52.3 7.7 2.6 55.9 6.3 2.6 53.4 6.9 3.0 56.8 6.8 · 3.7
54.5 7.2 4.4 52.3 7.2 5.0 79.9 7.4 56.9 82.7 7.4 57.0 85.7 7.1 57.5
87.1 8.3 54.6 89.6 8.3 53.9
102.2 8.5 5 I. I · 102.5 8.5 66.9
f03.3 8.2 64.7
103.3 8.4 68.5 107.3 9.8 63.6

Table 16.5 - CALORIE AND NUTRIENT VALUES OF DAILY PER 1 Per Capita Grams Per Day !'er Capita ◄ Year Per Cent of Value Value
Sufficiency
1953 778.5 64.5 1,69 I ,
1954 . 784.6 65.0 1,725
◄ 1955 804.4 66.6 1,766
1956 795.3 65.9 1,709 1957 804.7 66.7 1,756 1958 823.6 68.2 I ,814 1959 795.0 65.9 1,735 1960 813.5 67.4 1,782
. I 961 843.1 69.8 1,862 1962 831.0 68.8 1,8 I 5 1963 978.2 81.0 2,035 , 1964 978.0 81.0 2,010 1965 1,00 I. I 82.9 2,103
1966 973.1 80.6 1,991 1967 1,001.1 82.9 2,094
. 1968 973.3 80.6 2,006 1969 1,010.7 83:2 2,084 1970 1,001.7 83.0 i,097
1971 . 965.7 80.0 2,123 1972 950.9 78.8 2,047
Source: Food Balance Sheets of the Philippines, J 9~3-72, Statistics Office, Nationa1 Economic and Development Authority.
,
490

CAPITA AVAILABLE FOOD SUPPLY, PHILIPPINES: 1953-72
Calories Per Day Protein (grams) Per Day Fats (grams) Per Day
Per Gent of Per Cent of Per Cent of Sufficiency Value Sufficiency Value Sufficiency
77.3 41.5 76.3 19.0 65.5 78.9 41.6 76.5 21.7 74.8 80.7 44.1 81.1 23.4 80.7
78.1 44.2 81.2 22.5 77.6 80.3 43.0 79.0 24.4 84. l 82.9 46.0 84.6 26.4 91.0 79.3 · 43.3 80.0 25.3 87.2 81.5 43.4 80.0 26.4 91.0
85.1 45.2 83.1 28.6 98.6 83.0 43.0 79.0 27.3 94.1 93.0 48.9 90.0 27.4 94.5 91.9 48.4 89.0 26.7 92.1 96.2 50.7 93.2 26.7 92.1
91. 1 50.7 93.2 30.3 104.5 95.7 52.0 95.6 32.5 112.1 91.7 52.5 96.5 28.8 99.3 95.3 53.9 99.1 27.8 95.9 95.9 54.2 99.6 26.4 91.0
97. l 54.9 100.9 26.4. 91.0 -93.6 52.9 97.2 27.8 95.9
491

Figure 17.1
Table 17.1 Table 17 .2
Table 17.3 Table 17.4 Table 17.5·
Table 17.6 Table 17.7 Table 17.8
Table 17.9 Table 17.10 Table 17.11 Table 17.12 Table 17.13
Table 17.14
Table 17.15
Table 17.16 Table 17.17
Table 17.18
Table 17.19
Table 17 .20 Table 17.21
Table 17.22 Table 17 .23
CHAPTER XVII INTERNATIONAL STATISTICS
Estimates of Urban and Rural Population, Selected Countries: 1950-85 . 495 Population in Selected Countries 496 Estimates of Urban and Rural Population in Selected Coun-tries: 1950-85 498 Selected Housing ·Statistics 500 Educational Institutions in Selected Countries 50 I Hospital Establishments ·and Health Personnel in Selected Countries 504 Exchange Rates, July 16, 1973 506 Balance of Payments Summary, 1970-72 514 Countries' Official Reserves, Adjusted, 1953, 1960 and 1969-March 1973 516 Growth of World Output, 1960-72 520 Volume of World Trade: Exports, 1960-72 520 Volume of World Trade: Imports, 1960-72 521 Gross Domestic Product by Kind of Economic Activity 522 Index Numbers of Agricultural Production in Selected· Co~n-tries: CY 1967-71 528 Chromium Ore (Cr203 Cont~nt) Production in Selected Coun-tries: CY 1953, 1963-71 529 Copper Ore (Cu Content) Production in Selected Countries: CY 1953, 1963-71 530 Gold Production.in Selected Countries: CY 1953, 1963-71 532 Iron Ore (Fe Content) Production in Selected Countries: CY 1953, 1963-71 534 Molybdenum Ore (Mo Content) Production: CY 1953, 1963-71 534 Other Paper and Paperboard Production in Select~d Countries: CY 1953, 1963-71 536 Sugar Production in Selected Countries: CY 1953, 1963-71 538 Television .Receivers Production in Selected Countries: CY 1953, 1963-71 540 Tires Production in Selected Countries: CY 1953, 1963-71 542 Tobacco Products in Selected Countries: CY 1953, 1963-71 544
I

CHAPTER XVII INTERNATIONAL STATISTICS
This chapter attempts to give a picture of world developments and it presents statistics covering the world and selected countries. These have become very important and so widely used. Each country has recognized increasingly the scope and relevance of its statistics to those of the others in the analysis of its domestic economy. International statistics even bear greater significance in the determination, evaluation and implementation of foreign policy. They provide the· necessary information to indicate how a domestic economy is performing in comparison to the others.
Selected international statistics presented in this chapter pertain to growth of ·world output, volume of world trade, balance of payments summary, countries' official reserves and official exchange rates. Annual Reports of the International Monetary Fund are the main sources of these information.
Other statistical data include selected characteristics of some eighteen countries. For these selected countries, information available relate to population, index numbers of agricultural production, gross
- domestic product by kind of economic activity, hospital establishments and health personnel, selected housing characteristics and education. Of these eighteen countries, nine come from the Asian continent.
Mining and manufacturing production of some ten commodities are given for eleven countries, the Philippines being orie of them. The other ten countries chosen were the top ten producers of each commodity in 1971.
The United Nations Statistical Yearbook is the source for these latter information.
494
I
~
t t
1

Billions 5
4
3 -
2 - u I ,___
-
t-
0... -.195o'so'ss'1o'n; eo'es
WORLD
'i 1
Figure 17.l ESTIMATES OF URBAN AND RURAL POPULATION, SELECTED COUNTRIES: I 950--.85
Legend: l!lil- RURAL POPULATION • - URBAN POPULATION
1950 65 '75 185 '60 '70 '80
United Statos
195n '65 '75 '95 · 1950 165 '75
1
85 Tso '70 '80 '60 '70 'BO ·
Union of Soviet Jopon Socioli1t Republics
'
1950 ss 75 as 1950 's!5 '15 'as 's'o · '10 'ea ·so '10 'so
Phllipplnec Ind lo
Millions
I
: 2
1950 'e '1s ·'as '60 '70 '80
Pooplei Republic of Chino
1,000
900
800
700
600
500
400
300.
200
100
0

Table 17.1 - POPULATION IN
Country Latest Census (in thousands)
Date
United States2 I- IV-70
Canada4 I - VI-71
United Kingdom 25- IV-71
France I - III-68
Federal Republic of Germany 26- V-70
Netherlands 31- V-60
Union of Soviet Socialist Republic 15- 1-70
India7 I- 1v,71
Indonesia9 24- IX-71
Japan10 , 1- X-70
Republic of Korea I - X-70
Malaysia 24-25-VIIl-70
Pakistan I - 11-6 I
Philippines 6- V-70
Peoples Republic of China 30- VI-53
Thailand I- IV-70
Egypt 30- V-66
Australia 30- Vl-71
PPrcliminary . . . . Nature of base data not detcnnincd.
Both Sexes
203,235 3
21,569P
55,349P
49 779P,6 ,
59,378P
I 1,462
241,720
547,368P
] J 8,309P
103,720
3 I 469P•3 '
10,434
42,978
36,684
582 603 16 ,
34,152P
30,076
12,728P
lPopulation per square kilomctcr of area in 1971. , · 2ropulation i5 de jure but ex~ludes civilian citizen5 absent from country for extended period of time. 3F.xcludes anned forces overseas. · 4PoPulation is de Jure.
Male
98 882P• 3 ,
26,874P
5,707
111,399
283,252P
58,600P
50,918
I 5 779r.3 ,
5,263
18,250
297 55416 '
I 5,.176
6,402P
5Estimalf'.S not revised in accord with latest census. 6Excluding military personnel stationed outside the country who do nut'have a personal residence in France, numbering
ahout 16,000. 7 lncluding Andaman, Nicobar,. Laccadive, Minicoy and Amindi\·i Islands: excluding Sikkim shown separately: also
including the Indian-held part of Jammu and Kashmir, the final status of which has not yet been dctennined (area of lhis par! 13B, 9% km and populalion 4,615,176 at 1971 census). · ·
Bunilcd Nations estimate. 9Excluding West lrian, shown separately hereunder. · 10Comprising llokkaido. Honsn, Shikoku, Kyushu, The Amami Islands, and thr: Tokara A~chipelago. Populalion excludes
496
_j

·SELECTED COUNTRIES .
Female
104,284P,3
28,475P
5,755
130,321
264,116P
59,689P
52,802
15,690
5,171
18,434
276 652 16 ,
14,900
6,326P
Midyear Estimates
(in millions) I 963 . I 971
189 207
19 22
545 56P,5
48 SIP
55 59
12 13
255 245
4638 550P
IOOP,5 1258,5
96 105 278,12 328,12
98 11 8
45 IJ7P,14
30 38
6828 7878
298 358
28 34
11 13
Annual Rate of Increase
(Per cent)
I.I
1.6
0.4
0.9
0.8
1.2
I.I
2.2
2.8
I.I
2.2
2.9
15
3.0
1.8
2.7
2.5
1.9
Area (Km2 )
9,363,123
9,976; 139
244,044
547,026
247,973
40,844
22,402,200
3,280,483
1,491,564
370 0731] ,
98,477
329,749
803,943
300,000
9,596,961
514,000
1,001,449
7,686,848
Density 1971 1
22
2
228
94
239
323
11
168
84
283
324
3213
126
82
69
34
2
diplomatic pCIB{'!nnel outside the country and foreign military and civilian personnel and their dcpendents stationed in the arr:a. ·
lltncreasc in area due to land reclamation. 12Excluding alien annoi forces, civilian aliens employed by anned forces. and foreign diplomatic pcrsortncl and° their
depcndcnts.
13Area figure has been revised as a result of a recent survey. - . 14Latcsl official estimate based on Planning CommiS@on 'e adjustment for undcrenumeration of census is 128,430,000 as
of 1 January 1970. · ~5Rate not computed because of apparent lack of comparability between e8timatcs shown for 1963 and 1971. 1_6Population registered. Figure for "Both SexeB" incJudes an estimate of 8,397,477 for persons Jiving in outlaying areas
where local registration offices were not established. No adjustment his been made for 0.1 per cent estimates net underenurneration. Source: Hn·n Hua Monthly. ·
Source of basic data: United Nations Statistical Yearbootc, 1972.
497

Table 17.2 - ESTIMATES OF URBAN AND RURAL·
. Urban Population1 (In thousands) Country
~ . 1950 1960 1965 1970 1975 1980 1985
WORLD3 698,038 982,023 l ,156,6921,354,3441,592,2891,&71,859 2,194,506
United States. 97,458 126,101 140,124 _152,742 167,039 183,581- 201,891 • Canada 8,333 12,259 14,333 16,336 18,452 20,736 23,081
United Kingdom4 39,227 41,156 43,428 45,205 47,204 49,402 51,928
France 23,124 28,471 32,294 35,757 38,995 42,370 45,787
Federal Republic of Germany5 33,924 40,663 44,823 47,534 49,871 51,986 54,116
Netherlands6 7,342 8,663 9,632 I 0,512 , I 1,423 12,378 13,377
Union of Soviet Socialist Republic 71,210 I 06,018 123,211 138,568 155,179 173,756 193,788
India 61,555 77,534 91,442 108,964 ·134,236 164,198 199,052
J Indonesia 9,915 13,729 16,722 20,941 26,242 32,618 40,114
Japan7 ,8 29,654 40,917 47,418 55,653 64,939 74,685 83,80,7
Republic of Korea 3,750 6,997 9,346 12,175 15,639 19,854 /.
24,861
Malaysia 1,374 2,590 3,440 4,439 5,707 7,250 9,061
Pakistan9 7,620 11,880 14,994 19,193
t Philippines 5,575 8,195 10,339 12,992 16,453 20,847 26,152
Peoples Republic of China 63,507 122,271 155,776 197,162 246,547 304,832 372,833
Thailand 2,060 3,296 4,182 5,351 6,842 8,686 . 10,92 I
1 Egypt 6,518 9,781 11,942 14,617 17,971 22,080 26,876
Australia 6,329 8,399 9,411 . 10,555 11,909 13,420 15,056
... Nature of base data not determined. lAs nationnlly defined at latest censuses what~vcr applicable or as otherwise indicated. • 2obtaincd by subtraction of urban population from total projected population. 3Not adjusted to take into account the discrepancies between international immigration and emigration data. 4For 1950 and 1960 estimates see Kingsley Davis; World Urbanization 1950-1970 Vol. I (Berkeley: ln!titutc of inkmational Studies, Universit)' of C~ifornia, 1969).
~ 498 1
◄

POPULATION IN SELECTED COUNTRIES: 1950-85
Rural Population 2 (In thousands)
1950 1960 1965 1970 1975 1980 1985
1,786,680 1,999,598 2, I 32,307 2,280,840 2,436,259 2,595,465 2,753,757
54,813 54,583 54,468 -53,297 52,326 51,63 I 50,980
5,404 5,650 5,311 5,090 4,832 ' 4,563 4,267
11,389 11,403 11, I 67 10,784 10,449 10,146. 9,897.
I 8,6 I 2 17,213 16,478 15,386 14,143 12,950 11,791 ·
13,923 12,561 12,016 11,045 10,041 9,068 8,177
2,772 2,817 2,660 2,465 2,273 2,090 1,916
108,865 108,220 I 07,345 104,044 100,405 96,878 93,094
297,695 355,216 395,208 445,613 498,297 553,182 608,5 I 4
66,785 80,477 88,957 101,153 115,096 129,875 144,974 ·
53,971 53,179 51,463 48,858 46,107 42,851 38,828
16,606 17.,698 I 9,031 I 9,932 20,573 20,977 21,082
4,731 5,523 5,981 6,347 6,734 7,092 7,381 ~
69,000 88,497 101,336 117,705
14,741 19,215 22,016 25,122 28,894 -:33 ,248 37,871
r 476,836 524,286 551,667 576,492 594,915 606,491 611,160
17,575" 23,096 26,562 30,810 35,708 41,089 46,81 I
I 3,943 16,05 I 17,557 19,255 21,212 23,352 25,462
1,890 1,916 1,976 1,959 1,953 1,945 1,929
5As defined in 1950 CensusTe. communes of 2,000 or more inhabitants. Urban population not t'.xplicitly defined at the latest census.
6Urban population includr..s scmi-urhah l)opulation. , 7Urban population di:fincd as that of Densely Inhabited Districts(DID).
8Jncluding data for Ryukyu Islands. 9Jncluding data for Bangladesh.
Source of basic data: United Nations Statistical Yearbook, 1972.
\
499

Table 17.3 - SELECTED HOUSING STATISTICS
Country
United States
Canada
United Kingdom
France
Federal Republic ofGennany 12
Netherlands
Union of Soviet Socialist Republic
India
Indonesia
Japan
Republic of Korea
Malaysia 21
Pakistan
Philippines
Thailand
Egypt 1
Australia
n.o. - Data not available.
Census Years
Population
Living in Households
(in thousands)
I 9601 ·2 174,373 1970 199,384
1961 4.5 17,612 19677 19,4068
1961 50,933 I 9661 ·9 52,190
19621·4 · 45,287 1968 48,311
1961 13 53,794 1968 n.a.
1956 n.a. 1960 11,199
1960 n.a. 1965 n.a.
1960 n.a.-1961 n.a.
196819 95,617. I 9701 ·10 98,689-
1960 n.a. 1970 n.a. 195719 128
1960 n.a. 1960 n.a. 1967 3 I ,98024
"1962-63 n.a. 1960 9,319 I 9552,25 n.a. 1971 I 12,175
lOata ba.,r.d on Mmple tabulation of census returns.
2A ~t of lil·ing quarters ill defined in _tcnns of the ~pnee occupied by a household.
3oata rcfor to hou~ng units. .
4A household is dr.fined as the loin! ltumber of persons OCCUflYillg I~· of living quartr.n;.
SNumher of dwr.llin~ indutle mohilr. units.
''Data ttfer to occupied conventional dwdlinp.
<01ta 11.re bMed on a rnmplr. SUn'C)' of housing ond refer to households. Excludinn hou!!ehold~ in the Yukon and Northw,_.,t Tcrritorir.5; on Indian rtst'.rvc..~; in trailers; in summer collagl'S and hoals.
fll)atn are for l96fi.
9Kilchens art not counted--~ rooms.
IOnata rdr.r to oceupanl5 of dwellings.
I IData exclude housing of militnrr pcrronnd and ch-ilian cmploytt.s- of the military.
12Data rder to all dwellings in ruidential and occupied non-r,.sidr.ntial buildings which havr. a kitchen or kitchenette of lhdr own ciccpl dwelling in ha~ment kitchen~ arc
500
Households
Number (in thousands}
A vcrage Size (persons per household)
Owner Renters occupants
(per cent) (per cent)
53,024 3.3 61.93 38.1 3
62,874 3.2 62.93 37. 13
4,554 3.9 66.06 34.06
5,5898 3.7 65.4 33.2 16,623 9.8 74.23·6 I 06.43
•6 17,747 9.5 75.23 107.83
14,562 3.1 42.76 52.66
15,19010 n.a. 43.3 11 44.4 11
18,406 2.9 29.4 70.6 n.a. n.a. 34.3 14 65.7 14
2,940 3_715 25.7 72.6 3,130 3.6 n.a. n.a.
n.a. n.a. n.a. n.a. 50,33316,17 3_716,17 Il.a. n.a. 83,5241 5.2 1 85.2 1 ·18 14.81.18
20,928 10 4.4IO n.a. n.a.
24,687 3.9 59.5 39.2 26,747 3.7 58.2 18 34.9 18
4,361 5.6 79.5 20 15.3 20
5,864 5.4 n.a. n.a. 25 5.2 n.a. n.a.
16,76222 5.421 85.5 20 5.1 20
4,65322 5.8 22 87.93 6.4' 5,23423 6.1 23 89.411.2; 6. I 11,23
n.a. n.a. 85.924 7.9"1
1,992 4.8 43.020,19 57_020,19
3,15214 3_514 70.814 26.51'1
3,672 3.3 67.1 27.3
included as rooms irTCl!pt.clh"e of ~izr.. l3Data bascrl on us.ills of a building ccnru~ All hriu~holds aml
occupants entitled to lh·r. in hou~ing units "'"r.re counte,I. If lhr.rr. was I second dwt.lling, the household or parl of a hou~ehold and 1hr. oecupan!J: were also counted al lhal placr..
l4Dal1 rder to hou~Jwlds in hou~ing units.
l5Computed from total po1rnlatio11 and numhe:r of hou5tholds. 16Data nn': for 1%9.
· 17oota ttfor lo family housr-.hotd~.
18onta refer to hou~hold!I..
19oat:i. ba..~d on result!: of sample SUrvt".r. 20oata ttfer to livin~ quarter1;. 21Data ttfer to Sarnwak only.
· 22Jncluding persons not livinl? in household~. 23l)ata based on sa;inple rurve}; of hou!ing.
240111 based un reruhs of household ex:1tt'11diture sun·r.y and refer lo families.
25Data exclude housing. of full-blooded aborip;inals.
Souree of basic data: United Nntion~ Statistical Yearbook, 1972.
1
1 •

Table 17.4 - EDUCATIONAL INSTITUTIONS IN SELECTED COUNTRIES
Level Teaching · Country of Year Enrolment . Staff
Education
United States 1 st level 1969 31,955,000 1,269,000 2nd level 1969 19,674,000 994,000 3rd level 1969 7,916,991 646,000 Special 1967. 2,439,000 n.a.
Canada Pre-primary 1969 397,295 163,513 1 st level J 969 3,841,040· 2nd level 1969 1,812,871 n.a. 3rd level 1969 562,648 21,8401
Special 1969 4,122 719
United Kingdom Pre-primary 1969 · 50,709 1,993 1st level 1969 5,835,093 237,710 2nd level 1969 455,984 · 3 I, 113 3rd level 1969 71,258 7,243 Special 1969 43,567 I 0, 713
France Pre-primary 1969 2,115,876 41,3042
I st level 1969 5,019,837 220,295 2
2nd level 1969 4, I 06,64 7 251,243 3rd leve!3 i969 615,326 3 I ,039 Special 1969 279,729 19,070
Federal Republic of Germany Pre-primary 1969 I, 124,765 n.a. I st level 1969 6,098,425 232,022 2nd level 1969 4,280,996 253,588 3rd level 1969 440,647 n.a. Special 1969 294,910 20,891
Netherlands ·Pre-primary 1969 493;090 I 5,301 · I st level 1969 1,450,647 47,841 2
2nd level 1969 1,117,020 n.a. 3rd level 1969 211,513 n.a. Special 1969 72,310 ·5,863
Union of Soviet Socialist Republic Pre-primary 1969 7,835,000 557,700 I st level 1969 40,483,000 ·2·355 0004
' ' 2nd level 1969 8,857,700 n.a. 3rd level .1969 4,549,6005 n.a. Special 1969 346,000 41,000
' 501

Table 17.4 - EDUCATIONAL INSTITUTIONS IN SELECTED COUNTRIES (continued)
Level . Teaching Country of Year Enrolment Staff
Education
j India Pre-primary 1965 9,186,000 215,220 I st level · 1965 49,499,000 1,393,930 2nd level 1965 7,650,102 387,030 3rd level 1965 1,054,2736 n.a. Special 1966 4,991 2,112
Indonesia Pre-primary 1969 343,466 I 0,621 1st level 1969 12,802,415 323,218 2nd level 1968 1,637,375 129,467 3rd level 1967 192,416 21,309
Japan Pre-primary . 1969 1,551,017 69,095 I st level 1969 9,403,193 362,986 2nd level 1969 9,233,147 443,490 3rd level 1969 1,631 ,3 I 9 145,608 Special 1969 47,,772 11,976
Republic of Korea Pre-primary 1969 21,658 1,582 1 st level 1969 5,622,816 96,358 2nd level 1969 1,701,301 45,078 . ~ 3rd level 1969 186,675 9,417 r Special 1969 3,947 376
Malaysia 7 Pre-primary 1970 4,907 151 I st level 1970 144,007 4,404 2nd level 1970 36,071 1,507 3rd level 1970 430 n.a. Special . 1970 47 7
Pakistan I st level 1968 8,140,193 i90,880 2nd level 1968 3,386,672 115,833 3rd level 1968 357,675 I 3, I 94 Special 1968 12,624 507 t
Philippines Pre-primary 1967 38,975 840 I st level 1967 6,406,826' 207,§57 2nd level 1968 1,502,346 49,652 3rd level 1968 627,104 27,733 Special 1967 2,098 203
502

I
Table l 7.4 - EDUCATIONAL INSTITUTIONS IN SELECTED COUNTRIES (continued)
Country
Thaila_nd
Egypt
Australia
• n.a. - Data not ·available. PPrcliminary. lfull time teaching st.arr al universities only. 2Full time only.
Level of
Education
Pre-primary J st level 2nd level 3rd level Special
Pre-primary I st level 2nd level 3rd level Special
Pre-primary 9
I st level9
2nd level 3rd level Special
Year Enrolment
1968 l 02,370 1968 5,122,728 1968 4';19,119 1968 41,848 1-968 I 0,573
1969 23,769 1969 3,618,750 1969 1,357,972 1969 197,055 1969 4,932
1968 62,000 1968 I, 768,060 1968 1,080,524 1968 164,528 1968 21,099
3LJnivcrsity education only. 4oata on general education at the second level are included with the first level of education. 5Jncluding evening and correspondence courses. 6Not including intcnncrliate colleges. 7Data refer to Sarawak only. Boata refer to public education only. 9tncluding: special education.
Teaching Staff
127,7378
18,431 5,470
560
630 97,268 57,113
· 11,316 792
n.a. 64,90QP n.a, 64,875 1
n.a.
The definitions for the different levels and types of education are given below, they are based on the Recommendation· concerning the international standardization of educational statistics Pod opted by the General Confercnc·e or Unesco at its tenth session (1958): Pre-primary: Education preceding the first lcv_cl provided for children who are not old enough to enter a school at the first level ( e.g. al nur.;ery .school, kindergarten, infant school); First level: Education whose main function is lo provide ·basic instruction in the tools or learning (e.g. at elementary t:r.hool, primary ~chool). Its length may vary from 4 to·9 yean; depending on the organization or the school system in each country. • Second level: Education based upon at least four years or previous iQstruction at the first level, and pro'"·iding general or specialized instruction, or both ( e.g. at middle school, secondary school, high school, vocational school, teacher trainirig school at this level): a) General education docs not aim at preparing the pupils directly for a given trade or occupation; b) Vocational educaticin aims at preParing the pupils directly for a trade or occupation other than teaching. c) Teacher training aims at preparing the pupils directly for teaching; Third level: Education whic_h requires, as a minimum condition of admission, the Sllccessful completion or education at ihe second level, or evidence of the attainment of an equivalent lC\·cl of knowledge (e.g. at university, teachers' college, higher professional school);
Special: Educa_tion coVcring all general qr vocational education given to children who are physically handicapped, mentally handicapped, socially maladjusted or are in other special categories. Source of basic data: United NationsStatl~cal Yearbook, 1972.
503

Table 17.5 - HOSPITAL ESTABLISHMENTS AND
(Un
Hospital Establishments
Country
United States Canada United Kingdom France Federal Republic
of Germany Netherlands • Union of Soviet
Socialist Republi~ India Indonesia Japan Republic of Korea Malaysia6 _ Pakistan 7
Philippines Thailand Egypt Australia
PPreliminary
n.a. - Data not available.
Year
1970 1970 1970 1970
1970 1970
19'70 1968 1971 1970 1971 1971 1968 1969 1970
1968-<59 1969
Number of Population per Hospital beds Hospital bed
1,615,771 127 211,637 100 526,0341 280 366,385 1 1-39
683,254 87 68,527 190
2,663;300 91 325,500P 1,571
86,022 1,452 1,311,729 79
17,506 1.,823 36,993 1,172 42,609 2,570 43,492 ' 822. 40,781' 843 68,793 472
147,687 83
lGovemment establishments only (administered by a govemm·Cntal authOrity at any level, whether central, intermediate or local). •
2Number of persons employed in'a government service or in a service of the Ministry of Health onlr, 3S tomatologists and odontologists who are physicians ( doctors in medicine) arc included with physicians .and not with dentists in the following countries: Austria, Belgium, France, Italy, Portugal and Spain.
4Number of registered persons. Not all of them are resident and working in the country ( deaths, retirements, emigrations, etc. are not always erased every year).
5Jncluding non-university level "dentists". 6oata refer to Sarawak only. . 7"Health personnel" excluded data for Bangladesh shown separately above. 8oata for midwifery personnel arc included with nursing personnel. Source of basic data: UnitCd Natio"n.s Statistical Yearbook, 1972.
504
r

~·
HEAL TH PERSONNEL IN SELECTED COUNTRIES
its)
Health Personnel
Population Nursing Midwifery Year Physicians per Physician Dentists. Pharmacists · Personnel Personnel
' 1969 ·314,366 · 645 101,874 123,500 1 ,'026,000 4,400 1970 31,166 · 684 7,156 10,775 131.259 n.a. · 1971 72,023 ' 2,237 15,4452 17,391 2 195,9952 24,3072 ... 1970 68,0003 747 21 ,0003 31,802 185,000 8,500
l 1970 105,976 561 31,175 23,060 178,284 6,857 1970 15,644 832 3,205 1,057 57,6464 775
1970 577,249 421 91,1765 n.a. '1,033,800 297,300 · 1970 112,000 4,795 9,000 51,000 66,000 n.a. 1971 .. 4,516 27,655 547 31 I 15,008 6,977 1969 113,857 898 36,367 62,441 268,387 28,963 1971 . 14,9644 2,133 2,0854 15,5164 16,351 4 6,2664
1971 2,543 23,281 424 190 9,651 4,753 1969 13,011 4 4,018 3284 n.a. 6,5634 5024
1969 3,6352 9,840 4202 3172 4,7502 2,5392
1970 4,313. 7,971 389 1,155 5,171 9,974 1969 16,219 2,004 1,999 5,3544 9,0404 11,0544
1966 13,697 847 3,467 8,374 77,2378 n.a.
505

,. TABLE i ?:6 - EXCHANGE
(Currency units
Par. Central · Value Rate ~ Member Currency SDRs ~DRs
~ Afghanistan2 afghani
• Algeria dinar 4.937063
Argentina2 peso Australia dollar 0.851544 t Austria4 schilling
'
*Bahrain dinar 0.476190 Bangladesh taka Barbados dollar
*Belgium2 •5 franc 48.6572 *Bolivia peso 24.1270
Botswana rand Brazil2
•6 cruzeiro *Burma kyat 5.80717 *Burundi franc 95.0000
Carrteroon2 franc I
Canada4 dollar Central African
Republic2 franc Chad2 franc Chile2 escudo
*China, new Taiwan Republic of dollar 45.8413
Colombia2 •6 peso Congo, People's
Republic of the2 franc Costa Rica2 colon Cyprus4 .__
pound Dahomey2 franc
*D.enmark5 krone 7.57831 Dominican Republic peso 1.20635 Ecuador2 sucre 30.1587 Egypt2 pound El Salvador colon
506

RATES, JULY 16, 1973 per unit listed)
. U.S. dollar
45.00
5.00
0.671141 6.08
65.0000
·23.35
6.63500
0.392479 2.50000
Member Maintains Exchange Rate Against1
Pound sterling · · French franc
J 8.9677 4.80
50.0000 -
50.0000 50.0000
50.0000
50.0000
507
Other ·
'
Market · ·Rate
U.S. dollar
17.42
l.00055
0.344828

Table 17.6 - EXCHANGE (_Currency units
Par Central Value Rate
Member Currency SDRs SDRs l .> \
Equatorial Guinea peseta . *Ethiopia dollar 2.50000
Fiji dollar Finland 4 markka
*France2 •5 franc 5.55419 ~
' ' ( , Gabon2 franc
Gambia, The dalasi ·•Germany, Federal deutsche
Republic of5 mark 3.21979 Ghana cedi
*Greece drachma "36.1905
Guatemala quetzal Guinea· syli Guyana dollar Haiti gourde 6.03176 Honduras lempira
Iceland4 krona India rupee Indonesia2 •6 rupiah Iran rial 82.2425
*Iraq dinar 0.357143
Ireland pound *Israel pound 5.06665 ltaly4 .2 lira Ivory Coast2 franc
*Jamaica dollar 1.09668
Japan 4 yen *Jordan dinar 0.387754
Kenya . shilling 8.32377 Khmer Republic2 ·6 riel Korea6 won
/
· *Kuwait dinar 0.357143 Laos2 kip Lebanon4 pound
508

RATES, JULY 16, 1973 (continued) per unit listed)
U.S. dollar
1.15385
1.00000
· 2.00000
415.000
230.000 398.900
600.000
Member Maintains Exchange Rate Against1
Pound sterling French franc
1.98
50.0000 4.00
5.2U4
18.9677
50.0000
509
"-Market Rate
Other , U.S. dollar
. 1.007
3.631
0.0368
86.80
579.15
265.05
. 2.34,
/J

\
Lesotho Liberia
Member
*Libyan Arab Republic *Luxembourg2 •5
Malagasy Republic2
Malawi Malaysia4
Mali2
Malta4
Mauritania2
Mauritius Mexico
Morocco4
*Nepal *Netherlands5
New Zealand Nicaragua
Niger2
*Nigeria *Norway5
Oman *Pakistan
Panama Paraguay2 ,
Peru2
Philippines6
Portugal4
*Qatar Romania
*Rwanda Saudi Arabia Senegal2
Sierra Leone Singapore 4 ·
Currency.
rand dollar
dinar franc franc kwacha dollar
franc pound ouguiya rupee peso
dirham rupee guilder dollar cordoba
franc naira krone rial Omani rupee
balboa guarani sol peso, escudo
riyal leu franc riyal franc
leone dollar
510
Par Value
SDRs
Table 17.6- EXCHANGE (Currency units
Central Rate
SDRs
0.357143
11.9428
4.76_190
100.000 4.50000
48.6572
12. 7390 3.52282
0.793648 7.21500
1.20635

"
RATES, JULY 16, 1973 (continued) per unit lisied)
U.S. dollar
0.671141 1.00000
12.5000
·o. 7297679 ·
7.00000
127.260 38.70
6.78
Member Maintains Exchange Rate A~ainst1
Pound sterling French franc
50.0000 2.00
100.000
10.0000 13.3333
50.0000
50.0000
2.0
511
Other
2.13281 8
0.1481128
Market Rate
U.S. dollar
2.32558
0.377358
4.02
22.4719
2.32558

Table 17.6 - EXCHANGE (Currency units
·Member
. *Somalia South Africa
*Spain -
Sri·Lanka2
Sudan2
Swaziland *Sweden5
Syrian Arab Repubiic2
*Tanzania *Thailand Togo2
. Trinidad and Tobago *Tunisia
*Turkey2
Uganda United Arab Emirates10
United Kingdom4
United States11
Upper Volta2
Uruguay2 •6
Venezuela2
Vietnam 2 •6
*Western Samoa ,.
Yemen Arab Rep.4
Yemen, People's Dern. Republic of
Yugoslavia4
*Zaire *Zambia·
Currency
shilling rand peseta
rupee pound rand .krona pound
shilling bah! franc dollar dinar
lira shilling
pound dollar
franc peso bolivar piastre tala ·
rial
dinar dinar zaire kwacha
Par ·\!alue
SDRs ·
7.51881
70.0000
24.1270
0.525000
1.08571
0.775509
Central Rate
SDRs
5.50094
8.32377
16.8889 8.32377
0.719193 12
0.603176
*Member is availing itself of wider margins of up to 2 1/4 per cent on either side of parity relationship based on par values or ccntraJ rates. _
lAs notified to the Fund. Members having par values and central rates may also maintain their exchange rates agai~st ·another currency or othcr·currcncies.
2Member maintains multiple currency practice and/o; dual exd1angc market. 3Jnitial par value agreed·to July 20, 1973. 4rhe·member has notified the Fund that its currency is floating. Sseigium, Denmark, France, Germany, Luxembourg, the' Netherlands, Norway, and Sweden maintain maximum margins of 2 1/4 per cent for exchange rates in transactionS in the official markets between UJ:eir currencies and those of the other countries in this group. ·
512
, ' ' ,.
_,..

' RATES, JULY 16, 1973 (continued) per unit listed)
Member Maintains Exchange Rate Against1
U.S. dollar
0.671141.
0.348242 0.67114]
4.025
872.50 4.285
475.000
Pound sterling
15.60
4.80
6Membcr periodically ~djusts exchange. rate. 7Peseta per Spanish peseta.
French franc
50.0000
50.0000
Other
2.1328 I 8
Market Rate
U.S. dollar
0.392696
4.575
Scrams of fine gold per currency uniL 9Rate adjusted daily. H}fhe Bahrain·dinar and the Qarat/Dubai riyal have circulated in the United Arab Emirates; a new currency, the dirhani,
has recently been introduced. llThe United States has announced that the President is requesting Congress to authorize a proposal to the Fund to
reduce the par value of the U.S~ dollar to the equivalent of USSl.20635 per SOR. 12Effective July 26, 1973. Source: International Monetary Fund, Annual Report, 1973.
513

Table 17..7 - BALANCE OF PAYMENTS SUMMARY, 1970-72 · (In billions of U.S. dollars)
Balance on
Services & C t Capital Alloca- Overall Trade private urren account tion of transfers account balancel SDRs balance2
Industrial countries 1970 10.9 (0.8) 10.1 (5.1) 2.3 7.2 · 1971 12.2 1.2 13.4 (14. 7) 2.0 0.6
1972 8.9 0.6 9.4 (12.5) 2.1 (0.8)
Primary producing 1970 (6.1) (5.3) (i 1.3) 14.6 · I. I 4.3 countries I 971 (6.6) (4.7) (11.2) 18.4 1.0 8.2 ·
1972 (I.I) (4.7) (5.8) 20.4 I.I. 15.7 1 More developed areas 1970 (5.7) 2.7 (3.1) 4.1 0.3 1.3 ~ 1971 (6.5) 4.2 (2.3) 6.1 0.2 4.0
1972 (4.1) 5.5 1.4 5.8 0.3 7.4
Less developed areas 1970 (0.3) (8.0) (8.3) 10.5 0.8 3.0
1971 (0.1) (8.9) (8.9) t'2.3 0.7 4.2 1972 3.0 (I 0.2) (7.2) 14.6 0.8 8.2
In the Western Hemi~phere 1970 (3.1) (3.1) 4.1 0.3 1.3
1971 (1.2) (3.2) "(4.4) · 4.6 0.3 0.5 1972 (1.4) (3.5) (4.9) 7.3 0.3 2.7
In the Middle East 1970 I.I (2.0) (0.9) 0.9 0.1 0.1
1971 3.8 (2.9) 0.9 · 1.3 0.1 2.4 1972 5.1 (3.1) 2.0 1.2 0.1 3.3
In Africa 1970 2.3 (2.7) (0.4) 1.3 0.1 I. I 1971 1.3 (2.6) (1.2) 1.9 0.1 0.8 1972. 2.3 (3.3) (1.0) 1.7 0.1 0.8
In Asia 1970 (3.7) (0.2) (3.9) 4.2 0.3 0.6 1971 (4.0) (0.2) (4.3) 4.5 0.2 0.5 1972 (2.9) (0.3) (3.3) 4.4 0.3 .1.4
514

Table 17. 7 - BALANCE OF PAYMENTS SUMMARY, I 970-72 (continued) (In billions of U.S. dollars)
Services & Current Capital Alloca- Overall Trade private account account tion of balance2
transfers balance1 SDRs
Total, all 1970 4.8 (6.1) (1.3) 9.5 3.4 11.6 countries 1971 5.6 (3.5) 2.1 3.7 2.9 8.8
1972 7.8 (4.2) 3.6 8.0 3.2 14.7
Memorandum: . Oil exporters3 1970 5.5 (5.3) 0.3 0.4 0.1 0.8
1971 8.8 (6.7) 2.1 1.0 0.1 3.3 1972 10.2 (8.4) 1.7 1.7 0.1 3.6
Other less d_eveloped countries 1970 (5.8) (2.7) 8.6 10.1 0.7 2.2
1971 (8.9) (2.2) (11.0) 11.3 0.6 0.9 1972 (7.2) (1.8) (8.9) 12.9 0.6 4.6
-- indicates that the figure .is zero or)~ than half the final digit shown, or that the item does not exist:
lThis balance is computed residually, as the difference between the overall balance (less SDR allocations) and the current account balance; it includes official transfers and net errors and omissions, as well as recorded capital movements.
2.overall balances are measured by changes in official gold holdings, in _SDRs, in reserve positions in the Fund, in foreign exchange assets, in use of Fund credit, and, where data are available, in liabilities to foreign monetary authorities.
:!The oil exporters included here are Algeria, Indonesia, Iran, Iraq, Kuwait, the Libyan Arab Republic, the Netherlands Antilles, Nigeria, _Saudi Arabia, Trinidad and Tobago, and Venezuela. ·
Source: International Monetary Fund, Annual Report. 1973.
· ' 515

Table 17.8 - COUNTRIES' OFFICIAL RESERVES,
(In billions
◄ Total at End of Period
~ ~
1953 1960 1969 1970
~ Industrial countries ·~
United States 23.5 I 9.4 14.2 13.9 I
United Kingdom 4.0 5.1 2.5 2.8 ~ Total 27.5 24.5 16.7 16.7
Belgium I. I 1.5 2.4 2.8 France 0.8 2.3 3.8 5.0 ~ .. Germany, Fed. Rep: of ·1.8 7.0. 7.1 13.6. Italy 0.8 3.3 5.0 5.4 ~~
Netherlands 1.2 1.9 2.5 3.2 Switzerland 1.8 2.3 4.4 5.1 Other industrial Europe2 1.2 1.8 3.4 3.8
Total, continental industrial· Europe
. .
8.8 20.1 28.7 39.0
Canada 1.9 2.0 3.1 4.7 Japan 0.9 1.9 3.7 4.8
Total, industrial countries 39.1 48.5 52.2 65.2
Primary producing countries More developed areas
Other European countries3 1.8 2.3 4.9 5.7 Australia, New.Zealand, and
South Africa 2.0 1.3 2.8 2.8
Total, more developed areas 3.8 3.7 7.6 8.5
516

r
ADJUSTED, I 953, 1960 AND I 969-MARCH I 973 1
of SDRs)
Composition of Reserves at End of March 1973
1971
11.9 8.1
20.0
3.2 7.6
16.6 6.3 3.5 6.4 4.9
48.5
5.3 14.1
87.9
8.1
4.0
12.1
1972
11.9 5.2
I 7.1
3,6 9.2
· 21.3 · 5.6
4.4 6.9 6.0 ·
57.0
5.6 16.9
96.6
11.9
7.4
19.3
March 1973
I 1.9 5.0
16.9
4.0 9.3
26.3 5.2 5.0 6.5 6.2
62.6
5.1 15.0
<J9.6
11.5
7.0
18.5
Gold
9.7 0.7
10.4
1.5 3.5 4.1 2.9 1.9 2.9 1.0
17.9
0.8 0.7
29.8
1.9
0.9
2.8
517
SDRs
1.8 0.6
2.4
0.5 0.6 0.8 0.3 0.6
0.4
3.3
0.5 0.4
6.6
0.3 ·
0.3
0.6
Reserve positions
in tli:e Fund
0.4 0.1
0.5
0.5 0.4 I.I 0.3 0.5
0.4
3.3
0.3 0.6
4.7
0.4
0.3
. 0.7
Foreign exchange
3.5
3.5
1.5 4.7
20.2 1.6 2.0 3.6 4.5
38.2
3.6 13.3
58.6
8.9
5.4
14.3

Table I 7. 8- COUNTRIES' OFFICIAL RESERVES,
" (In billions
Total at End of Period
1953 1960 1969 1970
Less developed areas Western Hemisphere4 3A 3.0 4.5 5.6 Middle East5 1.3 1.4 3.0 3.1 Asia6 3.7 3.1 4.9 5.3 Africa7 1.8 2.1 3.1 4.2
·Total, less developed areas8 I 0.1 9.6 15.7 18.4
of which selected oil exporting countries9 1.8 2.5 4.0 4.8
Grand Total 53.2 61.8 75.5 92.1 -- -- -- ·=
lFor the nature of the adjustments,. excluding U.S. holdings of foreign exchu'igc and including throughout the period amounts incorporated in published U.K. reserves in 1966 and -1967 from proceeds of liquidation of U.K. official portfolio of dollar securities. The figures for 1971 include the U.K. official assets "swapped forward" ·with overseas monetary
. authorities, as reported in U.K. Central Statistical Office, Economic Trends. Totals may not add because some totals include unpublished data for component areas.
2Austria, Denmark. Luxembourg, Norway, and Sweden. 3finJand, Greece, Iceland, Ireland, Malta. Portugal, Spai~ Turkey, Yugoslavia, and, beginning in 1972, Romania's reserve position in the Fund. ·
4Argentin~ Bolivia, Brazil, Central America, Chile,. Colombia, the Dominican Republic. Ecuador, Guyana, Haiti, J mnaica, Mexico, Panama, Paraguay, Peru, Trinidad and Tobago, Uruguay, Venezuela, and, beginning in 1970, Barbados:
518
·~

' ADJUSTED, 1953, 1960 AND 1969-MARCH 1973 1 (continued)
of SDRs)
Composition of Reseives at End of March 1973
March Reseive Foreign I 971 1972 1973 Gold SDRs positions exchange
in the Fund
6.1 9.5 9.2 I. I 0.6 0.4 7.2 4.8 7.0 7.4 1.0 0.1 0.2 6.0 5.? 6.7 6.6 0.7 0.5 0.2 5·_3 5.1 5.5 5.3 0.4 0.3 0.2 4.4
21.4 28.7 28:5 3.2 1.5 0.9 22.9 --
7.7 9.9 9.7 1.2 0) 0.3 7.9
121.5 144.6 146.5 35.8 8.7 6.2 95.7 -- -- -- -- - -- --
5Cyprus, Egypt, Iran, Iraq, Israel, Jordan, Kuwait, Lebanon, Saudi Arabia, the Syrian Arab Republic, and, beginning in, 1965, the People's Democratic Republic of Yemen.
6Afghanistan, Bunna, the Republic of China, India, Indonesia,· Korea, Malaysia., Nepal, Pakistan, the Philippines,. Singapore, Sri Lanka, Thailand, and Viet-Nam and, for the Khmer Republic and Laos, SRDs and reserve positions in the Fund.
7Excluding Egypt and South Africa. 8Jncludes residual. 9Algeria, Indonesia, lran, Iraq, Kuwait, the Libyan Arab Republic, Nigeria, Saudi Arabia, Trinidad and Tobago, and Venezuela. · --indicates that the figure is zero or less than half the final digit shown, or,that the item does not exist;
Source: International Monetary Ft.ind, Annual Report, I 973.
519

Table 17.9 - GROWTH OF WORLD OUTPUT 1960-72 (Percentage changes in real GNP)
Annual Average1 Change from Preceding Year
1960-70 1960-65 1965-70 1968 1969 1970 1971 . 1972
Industrial Countries 4.8 5.2 4.5 5.7 4.8 2.5 3.5 Canada 5.2 5.6 4.8 4.9 5.3 2.6 5.8 United States 4.0 4.8 3.2 4.7 . 2.7 (0.4) 3.2 Japan II. I 10.1 12.1 14.2 12.1 10.3 6.2 France 5.8 5.8 5.8 5.0 7.7 5.9 5.0 Germany.Fed. Rep.of 4.8 5.0 4.6 7.3 8.2 5.8 2.7 Italy 5.7 5.3 6.1 6.4 5.7 4.9 1.6 United Kingdom 2.8 3.4 2.2 3.3 2.2 2.4 1.6 Other Industrial countries2 4,8 5.0 4.6 4.7 6.3 5.2 3.2
Primary Producing Countries 5.7 5.6 5.8 5.9 7.0 6.4 5.6 More developed areas3 6.4 7.1 5.6 5.1 7.2 5.7 5.2 Less developed areas4 5.5 5.1 5.8 6.2 6.9 6.6 5,7
World5 5.0 5.3 4.7 5.7 5.4, 3.5 3.9
lCompowid annual rale11 of chan~.
2Austria. Belgium, Denmark, Luxembourg, the Netherlands, Norway, Sweden, and Switzerland. 3Comprise Australia, Finl1Dd, Grecee,Jceland, Ireland, Malta, New Zealnnd, Portuglll, South Africa, Spain, Turkey, and Yu~avla.
4comprisc Fund member countries not listed above as "lndu~tria1 countries." ore being in "More developed areas" (footnote 3, above). Srund member counlrics(listed in Table 17,6) plus Swib:ttland.
Source: lntcmationa1 Mondary Fund, Annual Report, 1973,
Table 17.10 - VOLUME OF WORLD TRADE: EXPORTS, 1960-72 (Percentage changes, except as noted)
Relative Annual .Change from Preceding Year Magnitude Average
5.5
5.8 6.1 9.2 5.7 2.9 3.2 2.2 3.9
5.9
5.4 6.1
5.6
in 19721 1960-702 1968 1969 1970 1971 1972
World3 100 lndu.strial countries 74
Canada 6 United States 13 Japan 8 France 7 Germany, Federal Republic of 13 Italy 5 United Kingdom 7
Other industrial ~ountries4 16 Primary· producing countries 26
More developed areas 5 7
Less developed areas6 19 Oil ex porters 7 8
Other Jess developed countries II
l Based on U.S. dollar valucc; of export11 (f.o.b., c:ufttoms ba~i5}. 2Compound annual rates of eh11.1tge.
8.3
8.7
9.8 5.6
16.4 8.6 9.6
12.8 4.8
9.1
6.8
7.4
6.6
8.8
5.8
31-·or coverage,Fundmemhcr countries(listed in Table 17.6) plus Switzcrl.ond.
13.0 10.6 9.0 6.1 8.5
14.2 11.0 9.3 5.9 8.9
15.2 6.6 9.9 5.7 9.8 8.0 6.3 8.0 ( 1.2) 9.3
24.1 18.0 14.5 17.5 5.5 12.7 15.9 14.9 8.6 14.3 16.0 12.1 8.5 6.7 8.6 17.6 10.4 8.4 7.0 14.2 14.2 10.8 2.7 6.1 1.5
13.4 15.4 10.0 6.5 10.I 10.0 9.5 8.3 6.5 7.3
10.4 11.8 7.8 6.5 10.8
9.8 · 8.8 8.5 6.5 6.1
9.1 12.9 9.Q 8.5 7.2
10.1 7.6 6.2 4.8 5.1
4For cow:t8$:e, Austria. Belgium, Denmark, Luxr.mbourp;, lhc Netherland~ Norway, Sweden, and Switzerland.
Sfor coverage, compri<;c Australia, l'"inland, Gree«, Iceland. Ireland, Malta, Nr.w 7.ea1and, Pbrtugal, South Africa. Spain, Turkey nnd Yugoslavia. bFor coverage, comprise Fund mrmbc~ oounlrieti not li~tr,d abovr, as "Industrial countries," or ti being in "Mort devdoped arcu" 7For coverage. the oil exportel'\! included here arc Iran, Iraq, Kuwait, Saudi Arabia, Barhrain, Oman, Qatar, the United Arab Emirate., Algeria.
Indonesia, the Libyan Arab Republic, the Netherlands Antille&, Nigtrit, Trinidad and Tabago, and Venezuela.
Source: International Monetary Fund,Annual Rt:port. 1973.
~

' ) '
' J
Table 17.11 - VOLUME OF WORLD TRADE: IMPORTS, 1960-72 (Percentage changes, except as noted)
Relative Annual Change from Preceding Year Magnitude in Average
. 19721 . I 960-702 1968 1969 1970 1971 1972
Worid3 JOO 8.3 12.7 10.7 9.2 5.7 8.2
Industrial countries 73 9.2 14.2 11.8 9.1 6.0 10.6
Canada 5 7.4 11.2 12.0 (3.1) 10.0 16.3 United States 15 8.4 22.2 5.3 3.5 8.5 13. 7 Japan 6 14.7 13.0 I 5.9 20.4 I. 7 10.2 France 7 11.2 16.3 22.3 6.4 8.0 13.S Germany,Fed.Rep.of 10 10.S 18.4 18.0 14. J 10.9 9.2 Italy 5 I I. I 4.2 20.3 16.3 (3.3) 12.0 United Kingdom 7 4.5 l 0.3 2.0 5.2 4.0. 8.9
Other Industrial countries4 17 9.2 10.9 14.1 12.0 ·3_9 6.8
Primary producing countries 27 6.4 9.2 7.9 9.5 5.1 2.3
More developed areas5 8 8.7 7.6 10.5 12. 7 2.7 . 0.7
Less developed areas6 19 5.5 9.9 6.8 8.1 6.2 3.1
Oil exporters 7 4 4.4 12 .. S 7.5 7.5 11.S 8.2
Other Jess developed countries JS 5.8 9.4 6.6 8.3 4.7 1.7
lBased on U.S. doUar values of imports ( c.i.f., customs basis). 2compound annual rates of change. 3Fund member countries (listed in Table 17.6) plu-s Switzerland. 4Austria, Belgium, Denmark, Luxembourg, the Netherlands, Norway, Sweden, and Switzerland. Scomprise Australia, Finland, Greece, lceland, Ireland, Malta, ~cw Zealand: t'ortugal, South Africa, Spain; Turkey, and
Yugoslavia. 6comprise Fund member countries not listed above' as "Industrial countric~," or as being in "More de\'eloped areas" (foobtote 3, above).
7The oil exporters included here are Iran, Iraq, Kuwait, Saudi Arabia, Bahrain, Oman, Qatar, and United Arab Emirates, Algeria, Jndonesia, the Libyan Arab Republic, the N("therlands Antilles, Nigeria, Trinidad and Tobago, and Venezuela.
Source: International Monetary Fund, Annual Report, 197Jl.
521

Table 17 .12 - GROSS DOMESTIC PRODUCT
Gross Industrial Country
Domestic Agricul ture1 Total -and Currency Unit ·1s1c Product
0-8 0 1-3,5
Year Value
United States 1960 509.0 4 33 4 (1,000 million dollars) 1963 59o.3 4 33
I ·19691 •2 527.9 3 32 19702 - 972.6 3 30 1971 2 1,045.8 3 29
Canada 1960 38,720.0 6 29 I (million dollars) 1963 46,542.0 6 29 j
1969 _ 80,418.9 4 27 --1 1970 86,150.9" 4 27 1971 93,838.9 4 27 -1
United Kingdom _1960 25,403.03 3 37 (million pounds) 1963 30,151.03 3 35 -
· 1969 45,385.0 3 3 32 1970 49,699.03 3 32 1971 55,014.03 2 32
France 1960 301.4 9 40 (1,000 million francs) 1963 411.4 8 39 ,·
1969 629.l 7 38 \~ 1969 731.0 6 38
1970 818.2 6 38
Federal Republic of Germany 1960 302.5 6 47 j.. (1,000 million D. marks) 1963 384.8 5 46 1969 605.7 4 46 1970 687.0 3 46 ·{ 1971 759.6 - 3 46
Netherlands 1967 82,302.0 7 34 (million guilders) 19691.• 2 101,611.0 7 32
522

BY KIND OF ECONOMIC ACTIVITY
Ac~ivity Wholesale Transport
Manufacturing Construction· and and Others Industries Retail trade Communications
2-3 4 61 7 62-64,8
J'ercentage Distribution
28 4 17 6 35 28 4 16 6 37 28 5 17 ·6 35 26 5 18 6 37 25 5 18 6 37
23 . 5 11 8 28 23 5 I I 8 29 22 6 I I 8 32 21 5 I I 8 32 21 6 10 8 33
32 5 I I 8 25 30 6 10 8 27 28 6 9 7 28 28 5 9 7 29 28 5 9 7 30
37 8 12 5 24 36 8 12 5 25 35 10 . I I 5 28 36 10 11 5 28 36 10 10 5 28
42 7 15 6 19 41 . 8 15 6 20 43 7 14 6 24 43 . 8 14 6 24 42 _8 12 6 26
31 ·8 12 8 27 29 7 - 12. 8 27
523

Table I ?.12 ~ GROSS DOMESTIC PRODUCT
Gross In dust.rial
Country Domestic Agriculture1 Total and
Currency Unit !SIC Product 0-8 0 1-3,5 4
Year Value
Union of Soviet Socialist 1960 145.04 20 52 Republic 1963 168.84 21 54 (1,000 million roubles) 1969 261.94 19 54.
1970 289.94 22 51 1971 304.1 4 20 52
Japan 1960 15,873.1 13 38 (1,000 million yen) 1963 24,908.4 1 I 38
'~
1968 50,502.2 9 36 1969 58,808.1 8 39 1970 69,267.6 7 39
Republic of Korea 1960 244.9 37 17 (1,000 million won) 1963 484.6 42 18
1968 1,552.5 29 23 1969 2,022.1 29 23 1970 2,534.0 28 24
Philippines 1960 13,390.03 27 18 (million pesos) 1963 19,048.03 26 18
1968 . 29,616.03 30 18 1969 31,782.03 32 18 1970 39,346.03 30 19
Indonesia 1960 0.4 54 10 (1,000 million new 1963 3.2 58 10
rupiahs) 1968 1,993.9 52 13 1969 2,593.9 50 15 1970 3,196.2 48 16
Malaysia6 1960 3 34 14 5,886.0 (million M. dollars) 1963 6,504.03 30 16
.1967 8,243.03 26 19
524

BY KIND OF ECONOMIC ACTIVITY (continued)
Activity Wholesale Transport
Manufacturing Construction and and Others Industries Retail trade Communications
2-3 4 61 7 62-64,8
Percentage Distribution
n.a. 10 6 5 55 n.a. 9 6 5 55 n.a. 10 7 6 55 n.a. 10 6 5 55 n.a. I I 6 6 55
34 6 14 8 20 34 6 16 9 21
,
33 7 18 8 22. 36 7 17 7 23 36 7 17 7 23
14 3. 13 5 24
' 15 3 13 4 18 20 5 16 6 18 21 6 17 6 17 21 6 17 6 17
16 3 I I 3 24 16 3 9 3 23 16 3 9 3 24 16 3 9 3 24 16 2 8 3 22
8 3 15 3 13 7 2 15 2 13 9 2 1 7 2 13
10 3 18 2 13 10 3 19 3 13
7 3 14 4 16 8 4 15 4 18
10 4 14 4 20
525

Table 17.12 - GROSS DOMESTIC PRODUCT
• Industrial Country Gross
1 and Domestic Agriculture1 Total Currency Unit !SIC Product l
0-8 0 1-3,5 • • Year Value
India 7 1960· I 50.43 47 15 (1,000 million new rupees) 1963 I 97.23 44 16
1968 331.03 44 '
15 1969 368. I 3 45 15
Thailand 1960 54.0 40 14 (1,000 million bah!) · 1963 68.1 36 16
1969 128.6 32 18 1970 135.9 · 29 19 I 971 144.6 29 20
Pakistan8 1960 36,717.03 50 10 (million rupees) 1963 44,161.03 45 l l
1969 77,394.93 42 13 ,., 1970 73,724.9 45 14 f 1971 1 •9 44,288.0 38 19 I
. I
Australia8 1960 14;629.03 12 30 (million A. dollars) 1963 17,892.03 12 30
I 968 1•2 26,955.03 9 ' 31 19692 ' 3
29,738.0 n.a. n.a.
n.a. - Data not available. •' ·-' lBeginning with this year, data not strictly comparabfo with those of previous years. 2Estimates relate to the present System of National Accounts (SNA). 3Jneludes a statistical discrepancy.
4Nct material product. 5Qther activities of the material sphere. ~West Malaysia only. 7Year beginning I April. By ear beginning l July. 9Exclu_ding data £or Bang]adesh.
Source of basic data: United Nations Statistical Yearbook, 1972. •
• 526
•

BY KIND OF ECONOMIC ACTIVITY (continued)
Activity Wholesale Transport
Manufacturing Construction and and Others Industries Retail trade Communications
2-3 4 61 7 62-64,8
Percentage Distribution
13 4 9 5 15 14 4 9. 5 15 13 4 10 5 14 13 4· 9 5 14
13 5 15 7 19 14 5 16 7 19 15 6 17 6 20 16 6 19 6 21 16 6 18 6 22
9 2 I I 6 16 10 4 12 6 16 12 3 12 ·6_ 16 13 3 13 7 18 17 4 15 7 16
26 7 13 7 19 25 7 13 7 20 25 7 12 7 ·24
n.a. n.a. n.a. n.a. n.a.
527

., \ I
. " ·t
Table 17.13 - INDEX NUMBERS OF AGRICULTURAL I 1963 =
' Food All Commodities
Country 1967 1968 I 969 1970 ]971P 1967 1968· 1969 1970 ]97]P
United States I 14 114 I 14 1 I 3 123 108 109 108 108 116 I
' Canada 97 106 105 96 113 97 106 106 99 112
United Kingdom. 11 I 109 I I 0 116 123 I I I 109 109 I I 6 122
France 116 I 21 116 124 128 11 S 120 116 123 127
Federal Republic of· Germany I 06 1 11 109 110 I 15 106 I I I 109 I I 0 I IS
Netherlands 108 110 112 125 130 107 109 I I I 123 128
India 102 108 112 119 120 102 107 1 I I I 17 119
Indonesia 107 1·1 7 118 128 132 105 115 I I 5 125 129
Table 17.14-CHROMIUM ORE (Cr20 3 CONTENT) PROD
(Thousand
Country I 953 I 963 1964 1965
WORLD1 1,660 1,660 1,800 2,090 Union of Soviet
Socialist RepubJicP, 2 250.0 520.0 550.0 600.0 South Africa· 323.8 352.8 380.0 421.4 Turkey 433.5 120.9 184.9 242.2 Albania 20.0 126.0 132.0 134.0 India 32.1 32.7 16:4 30.4 Finland 0 0 0 0 Madagascar 0 4.6 4.9 1.0 Cyprus 3.7 2.4 1.5 2.4 Pakistan I I. 7 7.1 6.6 7.1 Sudan 0 8.8 15.6 5.7 Philippines 206.J 160.5 162.8 I 91.6
Prreliminary. 1Excluding Bu1garia, Romania and Democratic Republic of Viet-Nam for which no data are available. 2Source: U.S. Bureau of Mines. · ' Source of basic data: United Nations Statistical Yearbook, 1972.
528

r-PRODUCTION IN SELECTED COUNTRIES: CY 1967-71
100
Food All Commodities Country
1967
) 1968 1969 1970 I 971P 1967 1968 1969 1970 1971'
Japan I 19 125 I 24 122 118 I I 8 I 24 123 120 I I 6
Republic of Korea 123 122 142. 140 142 125 125 144 143 146
Malaysia 112 122 132 142 157 I I 8 130 145 I 51 162
Pakistan 11 I 119 I 24 124 I 21 , 11 2 119 _ 124 124 121
Philippines 115 113 I 23 127 129 I I 3 113 122 125 128 ·
Thailand IOI I I 0 118 121 124 104. 11 I 121 124 128
Egypt 105 118 119 122 126 104 116 120 121 125 ... Australia 102 128 I 19 119 126 I 01 123 118 11 7 I 21
Pprcliminary. Source of basic data: United Nations Statistical :Yearbook, 1972.
UCTION IN SELECTED COUNTRIES: CY 1953, 1963-71
metric tons)
1966 1967 1968 1969 1970 1971P
2,175 2,120 2,320 2,490 2,730 2,980
630.0 660.0 690.0 710.0 735.0 765.0 472.8 514.0 569.2 594.0 · 642.5 737.0 277.7' 249.6 235.0 259.3 294.9 365.0 130.0 141.0 157,0 185.0 200.0 230.0 39.4 58.9 -101.3 I 10.3 135.2 137.7
0 2.6 15.0 30.1 50.5 82.5 0 0 0 18.6 43.4 62.2 5.1 10.5 12.1 11.5 16.0 19.5
19.9 12.9 ·12.8 12.7 J4.QP 14.6 13.0 • 9.0 11.5 12.5 13.92 I 3.5
I 95.1 155.8 161.2 168.1 196.5 150.4
,
529

Table 17.15 - COPPER ORE (Cu CONTENT) PRODUCTION IN
Country 1953 1963 1964
WORLD1 · ·2,790 4,630 , 4,865
United States2 840.5 1,110.6 1,131.1
Union 'of Soviet Socialist RepublicP, 3 305.0 600.0 700.0
Chi!e4 361.1 ~01.5 633.5
Zambia5•6 372.7 SSS.I 632.3
Canada4 229.7 410.6 441.7 Zairc4
214.1 271.3 276.6
Peru 33.64 180.0 176.4
Australia5 38.1 I 14.8 105.7
South Africa4 35.9 54.8 59.2
Poland 4.3 13.2 14.5
Philippines4 12.7 63.7 60.5
Pprcliminary. I1ncluding.small quantities in Dominican Republic, Ecuador, Fiji and United Republic of Tanzania. 2calculated as recoverable. 3souree: Metallgesellschaft Aktiengesellschaft (Franfurt). 4conteni of all copper-bearing materials in the fonn they arc to be used or exported. Scontent of concentrates.
(Thousand
1965
5,070
1,226.3
·150.0
590.0
695;7
460.7
288.6 .
180.3
91.8
60.2
15.1
62.7
6sourcc: World Metal Statistics(LondOn)(Namibia: beginning 1967;Southern Rhodesia and Uganda: beginning 19661. ?Beginning 1969, 12 months ending 30 June of year stated. Source of basic data: United Nations Statistical Yearbook, 1972,
•
530
I
~ ~
~ ,: ~
r
·-"

i SELECTED COUNTRI_ES: CY 1953, 1963-71 metric tons)
' 'I '
1966 1967 1968 1969 1970 1971P
5,340 5,050 5,480 5,950 6,320 6,390 1,296.5 865.5 1,092.8 1,401.2 1,560.0 1,380.9
800.0 825.0 850.0 875.0 925.0 990.0 661.3 663.5 666.7 699.1 710.7 · 716.1
623.4 663.0' . 684.9 719.5 684.1 651.4 . 459.1 556.4 5_74.5 520.0 610.3 648.2
316.9 321.0 · 326.0 364.1 387.1 406.8
200.7 192.7 212.5 210.4 205.9 ·212.96
111.3 91.8 109.6 124.87 142.2 173.2 112.8 122.7 140.7 138.5 148.2 152.0
16.0 16.2 26.5 ·48.3 83.0 122.3 73.8 85.8 110.3 131.4 160.3 188.5
•
531

Table 17. 16 - GOLD PRODUCTION JN SELECTED (Kilo
Country 1953 - 1963 1964 1965
, . WORLD1 751,P00 1,202,000 1,248,000 1,28 I ,000
South Africa 371,395 853,229 905,470 950,332 Canada I 26, I SO - 1·24,514 119,299 112,163 United States 61,274 45,225 45,296 53,031 Japan 8,030 I 3,454 l 4,3 l 3 16,148 Ghana 22,736 28,654 26,902 23,490 Australia 33,438 3 I ,845 29,979 27,298 Federal Republic of Gennany 582 3,950 3,383 2,480 Colombia I 3,60 I 10,094 11,352 9,933 Zaire n.a. 6,674 5,869 2,812 Brazil 3,604 4,100 4,433 4,822 Philippines 14,948 11,675 13,243 13,607(
n.a. - Data tlot available.
Ppreliminary. I Excluding USSR and China. Source of basic data: United Nations Statistical Yearbook, 1972.
Table 17.17 - IRON ORE (Fe CONTENT) PRODUCTION IN
Country 1953
WORLD 158,600 Union of Soviet Socialist
Republic 31,297 United States 60,179 Australia1 2,161 Canada2 3,366 Swe&n 10,176 India 2,977 France I 3,790 Liberia 893 Venezuela 1,470 South Africa 1,228 Philippines 682
PFreliminary. lBeginning I 969, twelve months ending 30 June of year stated. 2Shipment from mines. Source of basic data: United Nations Statistical Yearbook, 1972.
532
(Thousand
1963 1964 1965
266,612 301,135 326,309
71,206 76,129 80,996 41,542 47,681 50,175
3,61 S 3,714 4,366 16,J so 20,766 · 21,822 14,436 16,294 18,045 -12,567 13,079 14,520
- 18,815 19,805 19,348 4,963 8,843 10,985 7,518 10,013 11,296 2,859 3,111 3,745 . 789 779 801 .
1 ',
_.,.

COUNTRIES: CY 1953, 1963-71 grams)
~ 1966 1967 1968 1969 1970 1971 P
~- 1,283,000 1,242,000 1,256,000 1,260,000 1,288,000 1,250,000 960,466 943,413 966,880 969,800 1,002,400 976,400 101,830 92,129 83,607 79,162 74,916 68,664 56,093 47,448 - 47,899 53,400 56,390 46,503 · 17,277 21,092 19,108 21,072 22,063 24,032 21,287 23,720 22,616 22,001 21,892 21,695·
· 2s;521 25,049 24,342 21,751 19,424 20,902 3,170 2,287 2,639 5,990 3,166 6,169 8,735 8,030 7,451 6,808 6,293 5,896 4,971 4,758 5,341 5,516 5,509 5,314 5,224 5,340 5,290 5,503 5,601 4,895
14,08() 15,258 16,403 17,765 18,747 19,814 .
~--SELECTED COUNTRIES: CY 1953, 1963-71
metric tons)
1966 1967 1968 -1969 1970 1971P
-339;637 · 339,817 370,697 388,050. 417,043 424,792
85,440 90,326 95,491 100,985 106,058 110,341 51,750 49,152 50,172 52,5 I 2 53,312 48,799
7,065 11,104 I 7,192 20,831 28,676 36,360 22,702 23,610 26,469 22,347 29,187 27,045 17,465 17,595 20,298 20,691 I 9,804 21,612 16,557 · 16,024 17,474 18,459 I 9,654 21,246 17,894 I 5,997 1 7,5 J 4 17,403 I 7,759 17,133 11,538 . 12,575 13,292 14,786 15,388 16,728 11,418 I 0,959 9,922 12,410 14,080 12,522 4,366 5,418 5,284 5,594 5,887 6;070
860 939 861 991 I, 166 1,381
533

Table 17.18 - MOLYBDENUM ORE (Mo
(Metric
Country 1953 1963 1964 1965
WORLD 1 27,760 41,250 43,100 52,800 Australia2 I 6 0 1 1 Canada 2 •3 88 378 556 4,335 Chile2 1,364 2,906 3,852 3,725 China4 •" n.a. 1,500 1,500 1,500 Japan 2 181 332 281 277 Repub
0
1ic of Korea 2 8 70 120 203 Mexico 0 41 53 49 Norway 2 144 · 2 I 3 225 235 Peru 5 538 639 1,134
· Union of Soviet Socialist
)
Republic n.a. 5,700 6,000 6,200 lJl)ited States2 25,965 29,488 29,758 35,095 Philippines2
· 0 107 I 05 · 77
l>prcliminary
n.a ...... Data not available.
lJn addition to countries shown, molybdenum is also produced in Bulgaria and Spain, b~t prod~ction is negligible. No estimates for China and the USSR arc included in the 1953 world' total.
2contcnl of conccntrate5. -3Shipments from mines. ~Source: U.S. Bureau of Mines. 5Beginning 1969, 12 months ending 30 June of year stated.
Source of basic data: United Natiqns Statistical Yearbook, 1972.
534

f
'I
I
i
f CONTENT) PRODUCTION: CY 1953, 1963-71
~ tons)
I
1966 1_,967 1968 1969 1970 1971P
65,300 66,500 67,100 7_3,800 82,340 77,450
2 o· 9 41 5 100 52
f · 9,342 9,696 10,190 13,450 · 15,319 10,265
4,668 4,740 , 3,853 4,841 5,701 6,3004
f
1,500 1,500 - 1,500 1,500 1,500 n.a.
246 252 281 268 265 ., 277
299 278 192 129 -25 I 213
150 64 48 121 85 7_9
227 292 239 288 303 n.a. ' 6074 808 4
1,289 1,830- 1,343 374
~ 6,500 7,000 7,000 7,500 7,700 7,980
_ 41,065 40,867 42,400 45,272 50,508 49,624
49 25 43 16 324 .234
-----------_,
535

Table I 7.19 - OTHER PAPER AND PAPERBOARD1 PRODUCTION
(Thousand
Country 1953 1963 19(i4 ")965
J United States 21,919 3 I ,679 33,738 35,889 Japan 1,349 5,358 6,229 6,114
Federal Republic of Germany 1,767 3,535 3,822 4,020
France 1,090 2;5622 2,665 2,716
United Kingdom 2,073 3,454 3,639 3,756
Canada 1,329 2,179 2,337 2,755
Sweden 888 2,105 2,264 2,442
Finland 493 I, 77 I 1,900 1,992
Italy 551 1,595 1,667 1,829
Austria , 276 514 · 557 601
PhilippinesP 6 125 J27 130
Ppreliminary.
lExcluding newsprints. 2se~g 1963, data not sbietly comparable with data for 1953.
Source of basic data: United Nations Statistical Yearbook, 1972.
...,
536 1
I

·-
/ft .
. ')·t/,; ~-'i IN SELECTED COUNTRIES: CY 1953, 1963-71 . -·
metric tons)
1966 1967 1968 1969 1970 1971
38,576 38,147 41,435 43,540 42,864 43,340
7,018 7,723 8,487 9,696 11,055 10,956
4,106 3,964 4,457 4,854 5,108 . 5,137
2,991 3,081 3,195 3,569 3,704 3,845
3,791 3,722 3,925 4,146 4,146 3,760
2;824 2,884 2,965 3,245 3,257 3,419
2,493 2,592 -2,826 3,179 3,329 3,270
2,144 2,156 2,462 2,820 2,955 3,117
2,116 2,419 2,692 3,106 3,238 3,021
607 638 707 781 847 904 -.....
130 130 · 130 130 130 130
537

I
L
Table 17.20 - SUGAR PRODUCTION I~ SELECTED
(Thousand
Country 1953 1963 1964 1965
WORLD. 38,429 52,584 60,213 64,878 E.E.C~ n.a. n.a. n.a. n.a.
Union of Soviet Socialist Republic 3,733 5,978 7,643 9,700
Cuba 5,159 3,821 4,590 6,082
India 1,318 2,497 2,839 3,493
ChinaP 638 1,800 2,000 2,200
Australia 1,237 1,799 2,002 2,073
Mexico I 868 1,735 1,933 2,121
Poland 1,203 l,350 1,763 1,539 -
South Africa2 679 1,294 1,456 1,014
Dominican Repu_blic 552 806 825 583
Philippines 1,101 .....
1,501 1,733 1,658
n.a. - Data not available.
Pp,eliminary. lBeginning-1969,separate data for the individual members ~f the European Economic Community are shown under, E.E.C. Prior to 1969' the data are shown under the individual countries:" Belgium-Luxembourg, France (Metropolitan, Guadaloupe, Martinique, Reunion), Federal Republic of Germany, Italy, Netherlands.
2prior to I 965, data for _Swaziland inclu~ed with data· for South Africa.
Source of basic data: United Nations Statistical Y~arbook,' 1972.
538
◄
j

i
l COUNTRIES: CY 1953, 1963-71
metric tons)
' 1966 1967 1968 1969 1970 1971P
·64,059 66,365 66,823 69,602 72,880 74,000
n.a. n.a. n.a. 8,112 7,705 · 8,733
9,019 9,188 9,815 L0,078 8,847 8,402
4,/_l67 6,236 5,315 5,534 7,559 5,950 •
3,633 2,357 2,375 4,1-90 4,634 3,959
2,400 2,575 2,650 2,750 2,900 3,100
2,447 2,389 2,800 2,269 2,507 2,732
2,266 2;411 2,336 2,564 2,402 2,489
1,700 1,863 1-,852 1,723 1,542 1,761
1,536 1,732 1,788 1,498 1,649 ~ 1,720 --~ 691 826 666 -886 f,014 1,132
1,443 1,599 1,612P 1,578 1,980 2,171 ,-
\
539

Table 17.21 - TELEVISION RECEIVERS PRODUCTION (Thou
I
Country 1953 1963 1964 1965
TOTAL 8,880 25,299 _ 28,939 \_ 29,814 -
Japan 14 4,916 5,273 4,190
United States1 6,779 7,734 8,813 9,889
Union of Soviet Socialist ' Republic 84 2,473 2,927 3,655
Federal Republic of Germany 41 1,920 2,304 2,776
United Kingdom 1,147 1,663 2,183 1,591
' Spain n.a. · 315 439 555 ) Poland· 0 365 414 452
f.----- Democratic ReJlublic of Germany/ 38 . 580 591 537 -·
Mexico. 65 2 116 189 212 •
Hungary 0 251 270 267
Philippines 0 10 14 14
Ppreliminary c.-n.a. - Data not a\·ailab1e. lF actory shipments.
21955_ Soul"('e of basic data: United Nations·s,aristfcal Yearbook, 1972.
,
◄ , ◄ •
540 r,I
◄ {~

I
IN SELECTED,COUNTRIES: CY 1953, 1963-71 sands)
1966
33,405
5,652
11,673
4,415
2,276
1,396 ·
464
412
562
299
298
20
1967
32,654
7,038
'9,701
4,.9-55
1,917
1,272
360
495
475
274
316
_.18
1968
39,177
9,140
10,328
5,742
~2,587
1,963
678
560
400
360
339
23'
541
1969
43,643
12,685
8,721
6595
2,894 ·
1,902
704
600
357
403
345
32
1970
44,990
13,641
8,298
6,682
2,936
2,214
618
616
.. 380
431
3.64'
44
1971 P
44,764
. 13,231
8,664
5,814
2,538
2,390
660
630
41 I
391
371 ·
42
d

Table 17.22 -TIRES PRODUCTION JN SELECTED (Thou
~
Country 1953 1963 1964 1965
United States1 96,121 139,073 158,113 167,743 '
Japan 1,879 21,747 26·,001 28,432
France 6,502 20,293 20,941 23,374 ,
Federal Republic of Germany 4,519 19,675 22,693 25,566
Unit.ed Kingdom 8,843 20,370 22,841 24,697
Canada 6,284 i 2,370 13,405 . 14,338
Brazil 1,735 3,815 -4,048 3,858
Australia1•2
•3 1,683 . 5,009 5,092 5,523-
·swe<l'en 821 2,714 3,262 · 3,766 I,
Argentina 784 1,884 2,4691 3,137 f---
· Philippines 0 518 503 548
l]ncluding tires for m'otorcycles· beginning 1963. 2'rwelve months ending 30 June of year stated. 3Jncluding tires for vehicles operating off the road.
Source of basic data: United Nations Statistical Yearbook. 1972
'
-
, ◄ •
542 .,i
◄ I
~ b~

t - ~ --
[ COUNTRIES: CY 1953, 1963-71 sands)
1966 1967 1968 1969 ~ 1970 I 971
177,388 163,061 203,052 207,691 190,251 212,902
32,948 39,916 49,464 57,967 63,823 64,958
26,009 28,884 29,300 33,829 39,415 · 44,135
-25,699 24,020 29,443 34,276. 37,548 37,580
25,182 26,297 . 30,673 30,452 31,825 33,371
16,121 16,647 18,379 20,060 20,441 19,900
4,938 ,- 5,492 6,226 6,553 7,836 · 9,425
5,605 5,798 6,751 7,437 8,022 8,106
3,578 4:052 5,278 5,360 5,349 5,072
2,766 2,788 2,948 3,772 . 3,824 4,145 ~------·. 621 680 701 581 598 780
• I
543
;
d

\
Table 17.23 - TOBACCO PRODUCTS IN
.. 1965 Country 1953 1963 1964
i
A. Cigarettes1 (Millions) " /
WORLD 1,446,995 2,107,085 2,144,881 2,295,727 United States2 423,070 543,687 534,973 562,368 Union of Soviet
Socialist Republic 183,237 257,748 280,313 304,400 Japan3 . 90;077 151,174 162,899 178,794 Federal Republic of Germany 36,295 90,023 95,558 103,260 United Kingdom
~
112,3324 115,117 _115,398 112,796 Poland 32,478 53,058 53,294 60,465 Brazii 41,599 59,964 59,190 48,607 France6 37,391 51,674 50,180 55,622 Italy 35,375 55,651. 58,899 58,798 India 18,423 40,062 46,196 54,033' Philippines2 13,340 23,716 17,622 27,664
B. Tobacco (Metric tons) United States2 , 94,967 75,988 81,683 75,578 Netherlands 10,900 12,300 14,000 15,000 France 19,502 18,833 17,645 16,527 South Africa 7 . 9,499.2 10,536 10,731 10,730
~---· United Kingdom 17,0134 16,271 16,187 15,2_87 Canada8 13,127 10,201, 9,348 8,894 Federal Republic of Germany9 16,735. 6,885 9,676 9,025
◄ Iran n.a. 5,069 5,219. 5,044 Belgium 10,401 7,561 7,358 7,198 Republic of Korea 4,488 9,773 8,680 8,757 Philippines2 425 977 858 856
C. Cigars (Millions) ,J
Union of Soviet t Socialist Republic 8,780 I 5,832 15,823 16,877
United States2 5,973 6,656 8,648 8,883 Netherlands 1,011 1,735 1,987 .1,927 Federal Republic of Germany_ 4,388 2,856 2,788 2,738 Democratic Repu~lic of Germany -6204 2,043 1,861 1,629 United Kingdom 1194 37.0 483 531 Italy1 o _ 2,331 1,103 1,~31 1,346 Switzerland 496 612 680 665 Canada8 236 393 477 501 Belgium 104 287 369 441 Philippines2 98 87 86 82
n.a. - Data not available. PPreliminary. lExcluding China and Democratic People's Republic ~f Korea. -~ 2Twelvc months ending 30 June of Year stated (Pakistan and United States. be~ 1963). 3twelvc months beginning 1 April of year stated. • ., 41954 . Ssource: U.S. Departmerlt of Agi:iculture.
~ 544 ◄
I.~ II'· ::::-- i (

SELECTED COUNTRIES: CY 1953, 1963-71
1966 1967 1968 1969 1970 1971•
,2,349,536 2,406,523 2,458,050 2,583,698 2,671,414 . 2,760,768 562,667 572,790 . 570,748 573,002 562,153 '. ' 585,056_.,
' . 303,460 286,598 288,543 307,602 322,687
..... p"\. 334,055
179,780 194,992 196,471 216,233 221,957 232,214 109,572 108,405 118,072 124,483 131,005 137,388 115,292 114,975 115,842 115,993 117,301 111,534 59,138 58,551 64,212 68,477 69,193 77,182 49,933 64,733 69,323 69,672 . 73,842 75,8195
57,627 61,963 62,822 70,938 70,279 74,730 63,131 65,197 63,634 60,382 71,618 67,067 58,230 54,511 60,375 59,662 62,168 65,778 29,616 32,558 36,968 37,808 39,671 41,988
73,502 71,892 72,012 73,164 74,707 71,804 i4,000 15,500 16,700 16,900 18,500' 16,300 15,845 15,433 15,128 15,080 13,723 11,769 11,248 11,135 11,748 11,996 12,086 .11,224 15;151 15,263 14,476 14,282 12,783 9,670 8,707 8,308 8,82b 8,601 8,644 8,869 --8,670 9,113 8;619 7,980 7,585 6,984 5,129 5,527 5,239 5,281 5,320 5,359 6,820 6,954 6,648 6,066 5,490 5,173 7,209 5,594 5,453 3,604 3,872 3,992
903 786 751 ' 957· 821 713
20,159 n.a. n.a. n.a. 25,979 27,534 7,992 7,303 7,696' 7,499 7,979 7,868 1,886 1,898 1,992 1,924 2,085 2,400 2,621 2,277 2,080 1,961 1,784 1,618 ' 1,543 1,654 1,436 1,387 1,321 l,3'36
610 755 745 747 773 944 1,390 1,228 1,289 1,166 1,068 861
694 727 758 747 757 762 -445 446 475 510 569 634 556 587 671 682 632 632
82 75· 72 68 60 53
6Jncluding cigarillos. 7Pipe tobacco only. 8Prior to 1969, IW.pmcnts. ) 9Excluding chewing tobacco. 1 Ooata refer to metric" tons. Source of basic data: United Nations Statistical Yl.'arboot, 1972. ,
545 1
~ •·I
\

I Guide to Finger Index
I
Summary of Major Statistical Series I · • Population and Housing; Labor Force
and Employment \
Vital and Health Statistics
Travel and Tourism
National Income
Agriculture
Fisheries and Forestry
Establishment Characteristics
Industrial Sectors I
• . I .
Transport and Communication
Money and Banking
Public Finance
Balance of Payments; Foreign Trade
Family Income and Expenditures
Prices and Wage Indices
Education
· Interindustry Relations and Food Balances
· International Statistics
f
I !
'