OCTOBER 2020 VOLUME LXXIV NUMBER 10 - Reserve ...
198
OCTOBER 2020 VOLUME LXXIV NUMBER 10
-
Upload
khangminh22 -
Category
Documents
-
view
0 -
download
0
Transcript of OCTOBER 2020 VOLUME LXXIV NUMBER 10 - Reserve ...

OCTOBER 2020
VOLUME LXXIV NUMBER 10

Chair Michael Debabrata Patra
Editorial Committee
Deba Prasad RathRajiv RanjanSitikantha PattanaikG. P. SamantaPallavi ChavanSnehal HerwadkarS. Gangadaran
Editor Shashidhar M. Lokare
The Reserve Bank of India Bulletin is issuedmonthly by the Department ofEconomic and Policy Research,Reserve Bank of India, under the direction ofthe Editorial Committee.The Central Board of the Bank is notresponsible for interpretation andopinions expressed. In the case of signedarticles, the responsibility is that of theauthor.
© Reserve Bank of India 2020
All rights reserved.Reproduction is permitted provided an acknowledgment of the source is made.
For subscription to Bulletin, please refer toSection ‘Recent Publications’
The Reserve Bank of India Bulletin can beaccessed at http://www.bulletin.rbi.org.in

Governor’s Statement
Governor’s Statement 1
Monetary Policy Statement for 2020-21
Monetary Policy Statement, 2020-21 Resolution of the Monetary Policy Committee (MPC), October 2020 9
Statement on Developmental and Regulatory Policies
Statement on Developmental and Regulatory Policies 13
Monetary Policy Report for 2020-21
Monetary Policy Report - October 2020 17
Speech
What Forces Could Drive the Recovery? Shaktikanta Das 105
Articles
GDP Growth Forecasts of the Reserve Bank of India – A Performance Assessment 113
Demystifying Equity Prices using Dividend Discount Model: An Indian Context 123
Current Statistics 133
Recent Publications 179
CONTENTS


GOVERNOR’S STATEMENT
Governor’s Statement


GOVERNOR’S STATEMENT
RBI Bulletin October 2020 1
Governor’s Statement
a brighter tomorrow even in the bleakest of times. As
Dr. A.P.J Abdul Kalam, our visionary former President
said: “You have to dream before your dreams can
come true…A dream is not that which you see while
sleeping, it is something that does not let you sleep.”
Charting the Recovery
After the steep decline into which the global
economy plunged in the second quarter of 2020,
global economic activity appears to have rebounded
sequentially in the third quarter, but unevenly
among and within economies. Improvement in
manufacturing, labour markets and retail sales
powered strong recoveries in some countries;
whereas in others, a rise in new infections prompted
a slower pace of unlocking or re- imposition of
restrictions which, in turn, stalled the upturn.
Generally, investment has remained in retrenchment
while consumption and exports have started to
improve. Massive policy support across all countries
has prevented a deeper downslide, providing a floor
underneath employment, household incomes and
businesses. Financial conditions continue to remain
benign.
The Indian economy is entering into a decisive
phase in the fight against the pandemic. Relative to
pre-COVID levels, several high- frequency indicators
are pointing to the easing of contractions in various
sectors of the economy and the emergence of impulses
of growth. Rather than enumerating them, I have, in
the interest of time, set them out in an Annex to this
statement. By all indications, the deep contractions
of Q1:2020-21 are behind us; silver linings are visible
in the flattening of the active caseload curve across
the country. Barring the incidence of a second wave,
India stands poised to shrug off the deathly grip of the
virus and renew its tryst with its pre-COVID growth
trajectory.
In this environment, the focus must now shift
from containment to revival. Undeterred by the
The newly appointed Monetary Policy Committee
(MPC) with Dr. Ashima Goyal, Professor Jayanth
R. Varma and Dr. Shashanka Bhide as external
members met on 7th, 8th and 9th October, 2020 in
its first meeting and the 25th under the monetary
policy framework that was instituted in June 2016. I
welcome the new members and thank them for their
valuable contributions to the setting and conduct of
monetary policy in India. I take this opportunity to
thank our teams in the Reserve Bank of India (RBI) for
their analytical support and logistic assistance.
The MPC evaluated domestic and global
macroeconomic and financial conditions and voted
unanimously to leave the policy repo rate unchanged
at 4 per cent. It also decided to continue with the
accommodative stance of monetary policy as long as
necessary – at least during the current financial year
and into the next year – to revive growth on a durable
basis and mitigate the impact of COVID-19, while
ensuring that inflation remains within the target
going forward. The Marginal Standing Facility (MSF)
rate and the Bank rate remain unchanged at 4.25 per
cent. The reverse repo rate stands unchanged at 3.35
per cent.
Let me take this opportunity to briefly review
the state of the economy and its prospects. I have
always dared to be an optimist, believing firmly in
the ability of humankind to overcome the pandemic.
In the months gone by, when COVID-19 raged in
fury across the world, our hopefulness might have
appeared impudent, like a flame flickering amidst a
gathering storm. Today, there is a turn in the wind,
which suggests that it is not imprudent to dream of
Governor’s Statement*Shaktikanta Das
* Governor’s Statement - October 9, 2020

GOVERNOR’S STATEMENT
RBI Bulletin October 20202
Governor’s Statement
pandemic, the rural economy looks resilient. Kharif
sowing has already surpassed last year’s acreage as
well as the normal sown area. Improved soil moisture
conditions, along with healthy reservoir levels, have
brightened the outlook for the rabi season. Early
estimates suggest that food grains production is set
to cross another record in 2020-21. Job creation under
the Mahatma Gandhi National Rural Employment
Guarantee Act (MNREGA) has provided incomes and
employment in rural areas. Meanwhile, migrant labour
is returning to work in urban areas, and factories and
construction activity are coming back to life. This is
also reflected in rising levels of energy consumption
and population mobility. In cities, traffic intensity
is rising rapidly; online commerce is booming; and
people are getting back to offices. The mood of the
nation has shifted from fear and despair to confidence
and hope.
Some of this optimism is being reflected in
people’s expectations. In the September 2020 round
of the RBI’s survey, households expect inflation
to decline modestly over the next three months,
indicative of hope that supply chains are mending.
Our projections indicate that inflation would ease
closer to the target by Q4:2020-21. Our other surveys,
also conducted in September, indicate that consumer
confidence is turning upbeat on the general economic
situation, employment and income over a one year
ahead horizon. While the current assessment of the
overall business situation remains in contraction
in Q2, it has moved up from a low in Q1. Forward-
looking business expectations are optimistic on the
overall business situation, production, order books,
employment, exports and capacity utilisation.
The manufacturing purchasing managers’ index
(PMI) for September 2020 rose to 56.8, its highest
mark since January 2012, supported by acceleration
in new orders and production. The services PMI for
September at 49.8 remained in contraction but has
risen from 41.8 in August. These expectations are also
reflected in our growth projections which suggest that
GDP growth may break out of contraction and turn
positive by Q4.
There is currently an animated debate about
the shape of the recovery. Will it be V, U, L, or W?
More recently, there has also been talk of a K-shaped
recovery. In my view, it is likely to predominantly be a
three- speed recovery, with individual sectors showing
varying paces, depending on sector-specific realities.
Sectors that would ‘open their accounts’ the earliest
are expected to be those that have shown resilience in
the face of the pandemic and are also labour-intensive.
Agriculture and allied activities; fast moving consumer
goods; two wheelers, passenger vehicles and tractors;
drugs and pharmaceuticals; and electricity generation,
especially renewables, are some of the sectors in this
category. In several of these areas, reforms such as in
agricultural marketing and value chains encompassing
cold storage, transport and processing; changes in
labour laws; and creation of capacity for production
and distribution of vaccines have already opened up
new vistas for fresh investment to step in.
The second category of sectors to ‘strike form’
would comprise sectors where activity is normalising
gradually. The third category of sectors would include
the ones which face the ‘slog overs’, but they can
rescue the innings. These are sectors that are most
severely affected by social distancing and are contact-
intensive.
The modest recovery in various high-frequency
indicators in September 2020 could strengthen
further in the second half of 2020-21 with progressive
unlocking of economic activity. Agriculture and allied
activities could well lead the revival by boosting
rural demand. Manufacturing firms expect capacity
utilisation to recover in Q3:2020-21 and activity to
gain some traction from Q3 onwards. Both private
investment and exports are likely to be subdued,
especially as external demand is still anaemic. For

GOVERNOR’S STATEMENT
RBI Bulletin October 2020 3
Governor’s Statement
the year 2020-21 as a whole, therefore, real GDP is
expected to decline by 9.5 per cent, with risks tilted to
the downside. If, however, the current momentum of
upturn gains ground, a faster and stronger rebound is
eminently feasible.
Financial Market Guidance
Over the last few weeks, there has been some
disconnect between the rationale underlying the RBI’s
debt management and monetary operations on the one
hand, and expectations in the market, on the other.
I thought I should take this opportunity to address
these issues squarely so that market participants and
the RBI share a common set of expectations, which, in
turn, should engender orderly market conditions.
As the monetary policy authority with the
responsibilities for development and regulation of
financial markets and the management of public debt,
the RBI has prioritised the orderly functioning of
markets and financial institutions, easing of financing
conditions and the provision of adequate system-level
as well as targeted liquidity. This is important from the
point of view of smooth and seamless transmission of
monetary policy impulses as well as the completion
of market borrowing programmes of the centre and
states in a non-disruptive manner with a normal
evolution of the yield curve. Since February 2020, the
RBI has taken a series of measures in this direction.
The RBI stands ready to undertake further measures
as necessary to assure market participants of access to
liquidity and easy financing conditions.
Notwithstanding an augmented market borrowing
programme for 2020-21, the issuances for the first half
of the year have been seamlessly managed both for
the centre and the states. The weighted average cost
of borrowings by the central government during the
first half of 2020-21 at 5.82 per cent is the lowest in
the last 16 years. The weighted average maturity of
the outstanding stock of the centre has also been the
highest so far. The RBI has assured that the borrowing
programme of the centre and states for rest of 2020-21
will be completed in a non-disruptive manner without
compromising on price and financial stability. In
pursuit of this objective, the limit for Ways and Means
Advances (WMA) for the centre has been kept higher
at `1.25 lakh crore compared to `35,000 crore in H2 of
the previous year. Similarly, the 60 per cent increase
in WMA limit for states in the first half of 2020-21 has
been extended for a further period of 6 months till
March 31, 2021.
Market participants should be assured that in
keeping with the monetary policy stance announced
today, the RBI will maintain comfortable liquidity
conditions and will conduct market operations in the
form of outright and special open market operations.
In response to feedback from market participants, the
size of these auctions will be increased to `20,000
crore. It is expected that the market participants will
respond positively to this initiative.
Yields in the government securities (g-sec)
market, both primary and secondary segments, also
need to evolve in alignment with the comfortable
liquidity conditions. This is important for those
segments of the financial markets that rely on the
g-sec yield curve as a benchmark for pricing financial
instruments so as to benefit from the easy financing
conditions engendered by the RBI’s policy measures
and operations.
Financial market stability and the orderly
evolution of the yield curve are public goods and
both market participants and the RBI have a shared
responsibility in this regard. The augmented borrowing
programme for 2020-21 has been necessitated due to
the exigencies imposed by the pandemic in the form of
the fiscal stimulus and the loss of tax revenue. While
this has imposed pressures on the market in the form
of expanded supply of paper, the RBI stands ready
to conduct market operations as required through a
variety of instruments to assuage these pressures,

GOVERNOR’S STATEMENT
RBI Bulletin October 20204
Governor’s Statement
dispel any illiquidity in financial markets and maintain
orderly market conditions. Market participants, on
their part, need to take a broader time perspective and
display bidding behaviour that reflects a sensitivity to
the signals from the RBI in the conduct of monetary
policy and debt management. We look forward to
cooperative solutions for the borrowing programme
for the second half of the year. It is said that it takes at
least two views to make a market, but these views can
be competitive without being combative.
In this context, it is appropriate that I set out
our assessment of underlying inflation dynamics
and the outlook. Abstracting from the period April-
May, 2020 when imputations imposed a break in the
CPI inflation series, headline inflation has moved
up from March 2020 levels and has persisted above
the tolerance band of the target. Our assessment is
that it will remain elevated in the September print,
but ease gradually towards the target over Q3 and Q4.
Our analysis suggests that supply disruptions and
associated margins/mark-ups are the major factors
driving up inflation. As supply chains are restored,
these wedges should dissipate. Meanwhile, aggregate
demand remains subdued and there is evidence of
considerable resource slack. Large excess supply
conditions characterise food grains and horticulture
production, and the outlook for agriculture is bright.
Crude prices remain range-bound. The MPC has hence
decided to look through the current inflation hump
as transient and address the more urgent need to
revive growth and mitigate the impact of COVID-19.
This has provided the space for continuing with the
accommodative stance with forward guidance as set
out in the MPC’s resolution.
Additional Measures
Against this backdrop and to provide impetus
towards reviving the economy, certain additional
measures are being announced today. These measures
are intended to (i) enhance liquidity support for
financial markets; (ii) regulatory support to improve
the flow of credit to specific sectors within the ambit
of the norms for credit discipline; (iii) provide a boost
to exports; and (iv) deepen financial inclusion and
facilitate ease of doing business by upgrading payment
system services.
(i) Liquidity Measures
(a) On Tap TLTRO
The focus of liquidity measures by the RBI will
now include revival of activity in specific sectors
that have both backward and forward linkages,
and multiplier effects on growth. Accordingly, it
has been decided to conduct on tap TLTRO with
tenors of up to three years for a total amount of
up to `1,00,000 crore at a floating rate linked to
the policy repo rate. The scheme will be available
up to March 31, 2021 with flexibility with regard
to enhancement of the amount and period after
a review of the response to the scheme. Liquidity
availed by banks under the scheme has to be
deployed in corporate bonds, commercial papers,
and non-convertible debentures issued by entities
in specific sectors over and above the outstanding
level of their investments in such instruments
as on September 30, 2020. The liquidity availed
under the scheme can also be used to extend
bank loans to these sectors. Moreover, banks
that had availed of funds earlier under targeted
long-term repo operations (TLTRO and TLTRO
2.0) will be given the option of reversing these
transactions before maturity. In view of the
borrowing requirements of the centre and states
in the second half of 2020-21 and the likely pick-
up in demand for credit as the recovery gathers
strength, on tap TLTROs are intended to enable
banks to conduct their operations smoothly and
seamlessly without being hindered by illiquidity
frictions. The objective is to ensure that liquidity
in the system remains comfortable.

GOVERNOR’S STATEMENT
RBI Bulletin October 2020 5
Governor’s Statement
(b) SLR Holdings in Held to Maturity Category
On September 1, 2020 the RBI increased the
investments permitted to be classified as Held
to Maturity (HTM) from 19.5 per cent to 22 per
cent of NDTL in respect of SLR securities acquired
on or after September 1, 2020 up to March 31,
2021. In order to provide certainty to banks as
regards their investments and to foster orderly
market conditions while ensuring congenial
financing costs, it has been decided to extend
the dispensation of the enhanced HTM limit of
22 percent up to March 31, 2022 for securities
acquired between September 1, 2020 and March
31, 2021. It is expected that banks will be able
to plan their investments in SLR securities in an
optimal manner.
(c) Open Market Operations (OMOs) in State
Development Loans (SDLs)
In order to impart liquidity to SDLs and thereby
facilitate efficient pricing, it has been decided to
conduct open market operations (OMOs) in SDLs
as a special case during the current financial year.
This would improve secondary market activity
and rationalize spreads of SDLs over central
government securities of comparable maturities.
This measure, along with the extension of HTM
till March 2022, should ease concerns about
illiquidity and absorptive capacity for the total
government borrowing in the current year.
(ii) Export Support: Review of System-based
Automatic Caution
Listing of Exporters
Exports have been adversely impacted by the
pandemic-related contraction in external demand. In
this environment, it is crucial to provide flexibility
to exporters in the realisation of export proceeds
and to empower them to negotiate better terms with
overseas buyers. In order to facilitate the same, and
make the caution-listing process exporter-friendly
and equitable, it has been decided to discontinue the
system-based automatic caution-listing. The RBI will
henceforth undertake caution-listing on the basis of
case-specific recommendations of the Authorised
Dealer (AD) banks.
Regulatory Measures
At the current juncture, the financial sector has a
crucial role in leading the nascent economic revival.
It is in this context that the RBI is announcing certain
measures aimed at catalysing augmented credit flows
to the productive sectors of the economy.
(a) Revised Regulatory Limits for Retail Portfolio of
Banks
Under the extant framework, the maximum
aggregated retail exposure to one counterparty
should not exceed the absolute threshold limit of
`5 crore. In order to facilitate higher credit flow to
this segment, which mainly consists of individuals
and small businesses (i.e. with turnover of upto
`50 crore), and in harmonization with the Basel
guidelines, it has been decided to increase this
threshold to `7.5 crore in respect of all fresh as
well as incremental qualifying exposures. This
measure is expected to expand credit flow to
small businesses.
(b) Rationalisation of Risk Weights on Individual
Housing Loans
Under the extant regulations, differential risk
weights are applicable to individual housing
loans, based on the size of the loan as well as
the loan-to-value ratio (LTV). In recognition of
the role of the real estate sector in generating
employment and economic activity, it has been
decided to rationalise the risk weights and link
them to LTV ratios only for all new housing loans
sanctioned up to March 31, 2022. This measure is
expected to give a fillip to the real estate sector.

GOVERNOR’S STATEMENT
RBI Bulletin October 20206
Governor’s Statement
(iv) Financial Inclusion
Review of the Co-origination Model
In 2018, the RBI put in place a framework for co-origination of loans by banks and a category of Non Banking Financial Companies (NBFCs) for lending to the priority sector, subject to certain conditions. Based on the feedback received from stakeholders, it has been decided to extend the scheme to all NBFCs, including HFCs, in respect of all eligible priority sector loans, and allow greater operational flexibility to the lending institutions. This “Co-Lending Model” is expected to leverage the comparative advantages of banks and NBFCs in a collaborative effort, and improve the flow of credit to the unserved and underserved sectors of the economy.
(v) Payment and Settlement Systems
(a) Round-the-Clock Availability of Real Time Gross Settlement (RTGS) System
In December 2019, the RBI made available the National Electronic Funds Transfer (NEFT) system on a 24x7x365 basis and the system has been operating smoothly since then. In order to facilitate swift and seamless payments in real time for domestic businesses and institutions, it has been decided to make available the RTGS system round the clock on all days from December 2020. India will be among very few countries globally with a 24x7x365 large value real time payment system. This will facilitate innovations in the large value payments ecosystem and promote
ease of doing business.
(b) Perpetual Validity for Certificate of Authorisation (CoA) issued to Payment System Operators (PSOs)
Under the Payment and Settlement Systems Act,
2007 the RBI currently gives on tap authorisation
to payment system operators (PSOs) for limited
periods of up to five years. In order to obviate
licensing and business uncertainty for PSOs, it
has been decided to grant authorisation for all
PSOs (new applicants as well as existing PSOs) on
a perpetual basis, subject to certain conditions.
This will reduce compliance costs and create
a climate conducive for investment activities,
increased employment, and infusion of new
talent and technologies into value chains.
Conclusion
COVID-19 has tested and severely stretched our
resources and our endurance. Our travails are not
over yet and a renewed rise in infections remains a
serious risk. We have, however, come far on an un-
travelled road, with self-belief and the courage of
hope. We will reach deep into our fortitude and inner
strength to overcome whatever formidable challenges
COVID-19 may unleash going forward. If we have the
resolve to be steadfast till we emerge victorious, I am
confident we will muster the forces needed to subdue
the pandemic. In the words of Mahatma Gandhi, and
I quote”...if I have the belief that I can do it, I shall
surely acquire the capacity to do it…”1. Against all
odds, we shall strive and revive. Thank you. Stay safe
and stay well. Namaskar.
1 The Collected Works of Mahatma Gandhi (Electronic Book), New Delhi, Publications Division, Government of India, 1999, Volume 79.

GOVERNOR’S STATEMENT
RBI Bulletin October 2020 7
Governor’s Statement
Sr. No.
Indicators Feb Mar Apr May Jun Jul Aug Sep
1
Agriculture / Rural demandDomestic Sales of tractors* 100 41 15 76 89 101 137
Two wheelers Sales* 100 69 0 20 72 94 104
Three wheelers Sales* 100 64 0 7 29 33 30
Agriculture Export* 100 78 63 88 95 109 100
Fertiliser Sales* 100 80 135 105 93 107 96
Agriculture Credit (Outstanding) 100 100 100 99 100 101 101
MGNREGA work demand (households) 100 93 60 168 201 144 109 109
2
Industrial ProductionIndex of Industrial Production* 100 79 42 65 82 88
IIP: Manufacturing* 100 77 33 61 82 88
IIP: Capital Goods* 100 68 9 40 69 83
IIP: Infrastructure & Construction Goods* 100 75 15 60 78 87
IIP: Consumer Durables Goods* 100 66 5 33 67 80
IIP: Consumer Non-Durables Goods* 100 78 53 91 114 109
Eight Core Industries (ECI) Index* 100 88 60 76 83 88 85
ECI: Steel* 100 78 18 63 75 92 90
ECI: Cement* 100 73 14 71 83 81 74
Electricity Demand* 100 95 82 99 101 108 105 108
Production of Automobiles
Passenger Vehicles* 100 67 0 11 43 72 84
Two wheelers* 100 77 0 17 59 87 105
Three wheelers* 100 69 0 37 43 39 58
Production of tractors* 100 52 0 37 104 92 98
3
Construction
Steel Consumption* 100 82 20 58 79 105 94 101
Cement production* 100 73 16 71 82 80 74
4
TransportAutomobiles sales* 100 65 0 19 67 88 98
Passenger vehicles sales* 100 53 0 14 47 74 86
Domestic air passenger traffic* 100 66 0 3 18 18 29
Domestic air cargo* 100 66 7 17 49 58 63
International air cargo* 100 70 24 42 61 71 72
Freight traffic net tonne kilometre* 100 81 60 70 84 87 91 102
Port Cargo* 100 92 78 73 84 86 88 94
Toll Collection: Volume 100 77 9 50 74 79 88 100
Petroleum consumption* 100 81 50 77 86 86 79
5
Domestic tradeGST E-way bill 100 71 15 45 76 85 86 100
GST revenue 100 93 31 59 86 83 82 91
Annex: High Frequency Indicators - as on October 8, 2020 (Contd.)
February 2020 = 100 unless specified otherwise

GOVERNOR’S STATEMENT
RBI Bulletin October 20208
Governor’s Statement
Sr. No.
Indicators Feb Mar Apr May Jun Jul Aug Sep
6
Tourism and hospitality
Foreign tourist arrivals 100 32 0 0 0 0 0
7
External Trade
Merchandise Exports 100 77 37 69 79 85 82
Merchandise Imports 100 83 46 59 56 76 79
Non-Oil Non-Gold Imports 100 82 50 75 63 81 78
Services Exports 100 102 93 95 96 96
Services Imports 100 100 84 90 90 91
8 Apple Mobility Index 100 60 15 28 46 51 65 79
9
Payment and Settlements Indicators (Volume)
RTGS 100 89 41 68 90 94 88
10
Monetary, Banking and financial aggregates
Credit outstanding 100 103 102 101 102 102 101 102
Bank Deposits 100 102 103 105 104 106 106 107
Life insurance first year premium 100 137 36 74 156 124 146 137
Non-life insurance premium 100 113 0 0 100 122 126
M3 100 102 103 105 105 107 107 108
Reserve Money 100 102 102 105 107 107 107 108
CP: Monthly Outstanding 100 86 104 106 98 94 93 105
CD: Monthly Outstanding 100 93 97 86 65 56 49
FPI Net (US$ million) 1271 -15924 -1961 -973 3441 451 6662 -157
MF Investment - Equity (INR crore) 9863 30131 -7966 6523 -502 -9195 -8400 -3982
MF Investment - Debt (INR crore) 18026 -16190 -9795 10699 41365 31898 24494 16009
Corporate Bond Issuance (INR crores) 80555 75734 54741 84871 70536 48122 58419
Corporate Bond Spread: AAA (3-year) (Basis Points) 90 159 239 173 103 50 54 43
11
PMI
PMI: Manufacturing (>50 indicates growth over previous month)
54.5 51.8 27.4 30.8 47.2 46.0 52.0 56.8
PMI: Services (>50 indicates growth over previous month)
57.5 49.3 5.4 12.6 33.7 34.2 41.8 49.8
PMI: Composite (>50 indicates growth since previous month)
57.6 50.6 7.2 14.8 37.8 37.2 46.0 54.6
12
Employment
CMIE Unemployment rate (%) 7.8 8.8 23.5 21.7 10.2 7.4 8.4 6.7
* indicates seasonally adjusted data.Sources: CMIE, CEIC, NSO, MOSPI, RBI, SEBI, FIMMDA
Below pre-Covid level Normalisation / recovery of activity
Annex: High Frequency Indicators - as on October 8, 2020 (Concld.)

MONETARY POLICY STATEMENT FOR 2020-21
Monetary Policy Statement, 2020-21 Resolution of the Monetary Policy Committee (MPC), October 2020


MONETARY POLICY STATEMENT FOR 2020-21
RBI Bulletin October 2020 9
Monetary Policy Statement, 2020-21
although downside risks have risen with the renewed
surge in infections in many countries. Global trade
is expected to be subdued. The rebound could turn
out to be stronger among advanced economies
(AEs) than in emerging market economies (EMEs).
Global financial markets remain supported by highly
accommodative monetary and liquidity conditions.
Soft fuel prices and weak aggregate demand have kept
inflation below target in AEs, although in some EMEs,
supply disruptions have imparted upward price
pressures.
Domestic Economy
3. On the domestic front, high frequency indicators
suggest that economic activity is stabilising in
Q2:2020-21 after the 23.9 per cent year-on-year (y-o-y)
decline in real GDP in Q1 (April-June). Cushioned
by government spending and rural demand,
manufacturing – especially consumer non-durables
– and some categories of services, such as passenger
vehicles and railway freight, have gradually recovered
in Q2. The outlook for agriculture is robust. With
merchandise exports slowly catching up to pre-COVID
levels and some moderation in the pace of contraction
of imports, the trade deficit widened marginally
sequentially in Q2.
4. Headline CPI inflation increased to 6.7 per cent
during July-August 2020 as pressures accentuated
across food, fuel and core constituents on account
of supply disruptions, higher margins and taxes.
One year ahead inflation expectations of households
suggest some softening in inflation from three
months ahead levels. Selling prices of firms remain
muted, reflecting the weak demand conditions.
5. Domestic financial conditions have eased
substantially, with systemic liquidity remaining in
large surplus. Reserve money increased by 13.5 per
cent on a year-on- year basis (as on October 2, 2020),
driven by a surge in currency demand (21.5 per
cent). Growth in money supply (M3), however, was
On the basis of an assessment of the current and evolving macroeconomic situation, the Monetary Policy Committee (MPC) at its meeting today (October 9, 2020) decided to:
• keep the policy repo rate under the liquidity adjustment facility (LAF) unchanged at 4.0 per cent.
Consequently, the reverse repo rate under the LAF remains unchanged at 3.35 per cent and the marginal standing facility (MSF) rate and the Bank Rate at 4.25 per cent.
• The MPC also decided to continue with the accommodative stance as long as necessary – at least during the current financial year and into the next financial year – to revive growth on a durable basis and mitigate the impact of COVID-19 on the economy, while ensuring that inflation remains within the target going forward.
These decisions are in consonance with the objective of achieving the medium-term target for consumer price index (CPI) inflation of 4 per cent within a band of +/- 2 per cent, while supporting growth.
The main considerations underlying the decision are set out in the statement below.
Assessment
Global Economy
2. Incoming data point to a recovery in global economic activity in Q3 of 2020 in sequential terms,
* Released on October 9, 2020.
Monetary Policy Statement, 2020-21 Resolution of the Monetary Policy Committee (MPC)*

RBI Bulletin October 202010
Monetary Policy Statement, 2020-21MONETARY POLICY STATEMENT FOR 2020-21
contained at 12.2 per cent as on September 25, 2020.
Banks’ non-food credit growth remains subdued.
India’s foreign exchange reserves stood at US$ 545.6
billion on October 2, 2020.
Outlook
6. Turning to the outlook for inflation, kharif sowing portends well for food prices. Pressures on
prices of key vegetables like tomatoes, onions and
potatoes should also ebb by Q3 with kharif arrivals.
On the other hand, prices of pulses and oilseeds are
likely to remain firm due to elevated import duties.
International crude oil prices have traded with a
softening bias in September on a weak demand
outlook, but domestic pump prices may remain
elevated in the absence of any roll back of taxes. Pricing
power of firms remains weak in the face of subdued
demand. COVID-19-related supply disruptions,
including labour shortages and high transportation
costs, could continue to impose cost-push pressures,
but these risks are getting mitigated by progressive
easing of lockdowns and removal of restrictions on
inter-state movements. Taking into consideration all
these factors, CPI inflation is projected at 6.8 per
cent for Q2:2020-21, at 5.4-4.5 per cent for H2:2020-
21 and 4.3 per cent for Q1:2021-22, with risks broadly
balanced (Chart 1).
7. Turning to the growth outlook, the recovery in
the rural economy is expected to strengthen further,
while the turnaround in urban demand is likely
to be lagged in view of social distancing norms and
the elevated number of COVID-19 infections. While
the contact-intensive services sector will take time to
regain pre-COVID levels, manufacturing firms expect
capacity utilisation to recover in Q3:2020-21 and
activity to gain some traction from Q4 onwards.
Both private investment and exports are likely to
be subdued, especially as external demand is still
anaemic. Taking into consideration the above factors
and the uncertain COVID-19 trajectory, real GDP
growth in 2020-21 is expected to be negative at (-)9.5
per cent, with risks tilted to the downside: (-)9.8 per
cent in Q2:2020-21; (-)5.6 per cent in Q3; and 0.5 per
cent in Q4. Real GDP growth for Q1:2021-22 is placed
at 20.6 per cent (Chart 2).
The MPC is of the view that revival of the economy
from an unprecedented COVID-19 pandemic assumes
the highest priority in the conduct of monetary policy.
While inflation has been above the tolerance band for

MONETARY POLICY STATEMENT FOR 2020-21
RBI Bulletin October 2020 11
Monetary Policy Statement, 2020-21
several months, the MPC judges that the underlying
factors are essentially supply shocks which should
dissipate over the ensuing months as the economy
unlocks, supply chains are restored, and activity
normalises. Accordingly, they can be looked through
at this juncture while setting the stance of monetary
policy. Taking into account all these factors, the MPC
decides to maintain status quo on the policy rate in
this meeting and await the easing of inflationary
pressures to use the space available for supporting
growth further.
All members of the MPC – Dr. Shashanka Bhide,
Dr. Ashima Goyal, Prof. Jayanth R. Varma, Dr.
Mridul K. Saggar, Dr. Michael Debabrata Patra
and Shri Shaktikanta Das – unanimously voted for
keeping the policy repo rate unchanged and continue
with the accommodative stance as long as necessary
to revive growth on a durable basis and mitigate the
impact of COVID-19 on the economy, while ensuring
that inflation remains within the target going
forward. Dr. Shashanka Bhide, Dr. Ashima Goyal, Dr.
Mridul K. Saggar, Dr. Michael Debabrata Patra and
Shri Shaktikanta Das voted to continue with this
accommodative stance at least during the current
financial year and into the next financial year, with
Prof. Jayanth R. Varma voting against this formulation.
The minutes of the MPC’s meeting will be
published by October 23, 2020.


STATEMENT ON DEVELOPMENTAL AND REGULATORY POLICIES
Statement on Developmental and Regulatory Policies


RBI Bulletin October 2020 13
Statement on Developmental and Regulatory Policies STATEMENT ON DEVELOPMENTAL AND REGULATORY POLICIES
Even as the threat of COVID-19 is yet to abate,
with the gradual lifting of restrictions on movement
of people and opening of business establishments
across the country, a resumption of economic
activities is well underway. The role of the financial
sector during this phase of recovery will continue to
remain important in facilitating businesses to reach
the pre-COVID levels of economic activity. The focus
of the Reserve Bank’s regulatory actions over the
past few months was to first, provide an immediate
relief to the borrowers from the impact of COVID-19,
through extension of moratorium and other
measures, and then to facilitate resolutions through
the Resolution Framework for COVID-19 related
Stress. Concomitantly, the lending institutions
will need to start focusing on revival of activity
and their core activity of lending. Accordingly, the
measures are intended to (i) enhance liquidity
support for financial markets so as to revive activity
in targeted sectors of the economy with linkages to
other sectors; (ii) provide a boost to exports; (iii)
regulatory support to improve the flow of credit to
specific sectors within the ambit of the norms for
credit discipline; (iv) deepen financial inclusion; and
(v) facilitate ease of doing business by upgrading
payment system services so as to improve customer
satisfaction, while supporting growth.
I. Liquidity Measures and Financial Markets
1. On Tap TLTRO
The focus of liquidity measures by the RBI will
now include revival of activity in specific sectors
that have both backward and forward linkages, and
multiplier effects on growth. Accordingly, it has been
decided to conduct on tap TLTRO with tenors of up
to three years for a total amount of up to `1,00,000
crore at a floating rate linked to the policy repo rate.
The scheme will be available up to March 31, 2021
with flexibility with regard to enhancement of the
amount and period after a review of the response
to the scheme. Liquidity availed by banks under
the scheme has to be deployed in corporate bonds,
commercial papers, and non-convertible debentures
issued by the entities in specific sectors over and above
the outstanding level of their investments in such
instruments as on September 30, 2020. The liquidity
availed under the scheme can also be used to extend
bank loans and advances to these sectors. Investments
made by banks under this facility will be classified as
held to maturity (HTM) even in excess of 25 percent
of total investment permitted to be included in the
HTM portfolio. All exposures under this facility will
also be exempted from reckoning under the large
exposure framework (LEF). Moreover, banks that had
availed of funds earlier under targeted long-term repo
operations (TLTRO and TLTRO 2.0) will be given the
option of reversing these transactions before maturity.
In view of the borrowing requirements of the centre
and states in the second half of 2020-21 and the likely
pick-up in demand for credit as the recovery gathers
strength, on tap TLTROs are intended to enable banks
to conduct their operations smoothly and seamlessly
without being hindered by illiquidity frictions. The
objective is to ensure that liquidity in the system
remains comfortable. The details of the scheme would
be announced separately
2. SLR Holdings in Held to Maturity (HTM) category
To engender orderly market conditions and
ensure congenial financing costs, the Reserve Bank on
September 1, 2020, increased the limits under Held
to Maturity (HTM) category from 19.5 per cent to 22
percent of NDTL, in respect of SLR securities acquired
on or after September 1, 2020, up to March 31, 2021.
To give more certainty to the markets about the status
of these investments in SLR securities after March 31,
2021, it has been decided to extend the dispensation
of enhanced HTM limits of 22 percent up to March
Statement on Developmental and Regulatory Policies

RBI Bulletin October 202014
Statement on Developmental and Regulatory Policies STATEMENT ON DEVELOPMENTAL AND REGULATORY POLICIES
31, 2022 for securities acquired between September 1,
2020 and March 31, 2021. The HTM limits would be
restored from 22 per cent to 19.5 percent in a phased
manner starting from the quarter ending June 30,
2022. It is expected that banks will be able to plan
their investments in SLR securities in an optimal
manner with a clear glide path for restoration of HTM
limits.
3. Open Market operations (OMOs) in State
Developments Loans (SDLs)
At present, SDLs are eligible collateral for Liquidity
Adjustment Facility (LAF) along with T-bills, dated
government securities and oil bonds. To improve
liquidity and facilitate efficient pricing, it has been
decided to conduct open market operations (OMOs)
in SDLs as a special case during the current financial
year. The OMOs would be conducted for a basket of
SDLs comprising securities issued by states.
II. Support to Exports
4. Automatic Caution Listing of Exporters- Review
As part of automation of Export Data Processing
and Monitoring System (EDPMS), the ‘Caution /
De-caution Listing’ of exporters was automated in
2016. Accordingly, the exporters were to be caution-
listed automatically, if any shipping bill against
them remained outstanding for more than 2 years in
EDPMS and no extension was granted for realisation
of export proceeds against the outstanding shipping
bill. Additionally, the normal system of caution-listing
based on the recommendations of the Authorised
Dealer (AD) bank before the expiry of 2 years in
certain cases continued. In order to make the system
more exporter friendly and equitable, it has been
decided to discontinue the Automatic Caution-listing.
The Reserve Bank will continue with caution-listing
based on the case-specific recommendations of the AD
bank. Related instructions in this regard will be issued
shortly.
III. Regulatory Measures
5. Regulatory Retail Portfolio – Revised Limit for Risk Weight
As per the present RBI instructions, the exposures
included in the regulatory retail portfolio of banks are
assigned a risk weight of 75 per cent. For this purpose,
the qualifying exposures need to meet certain
specified criteria, including low value of individual
exposures. In terms of the value of exposures, it has
been prescribed that the maximum aggregated retail
exposure to one counterparty should not exceed
the absolute threshold limit of `5 crore. In order to
reduce the cost of credit for this segment consisting
of individuals and small businesses (i.e. with turnover
of upto `50 crore), and in harmonisation with the
Basel guidelines, it has been decided to increase this
threshold to `7.5 crore in respect of all fresh as well
as incremental qualifying exposures. This measure is
expected to increase the much needed credit flow to
the small business segment.
6. Individual Housing Loans – Rationalisation of Risk Weights
In terms of the extant regulations on capital
charge for credit risk of individual housing loans by
banks, differential risk weights are applicable based
on the size of the loan as well as the loan to value ratio
(LTV). Recognising the criticality of real estate sector in
the economic recovery, given its role in employment
generation and the interlinkages with other industries,
it has been decided, as a countercyclical measure, to
rationalise the risk weights by linking them only with
LTV ratios for all new housing loans sanctioned up to
March 31, 2022. Such loans shall attract a risk weight
of 35 per cent where LTV is less than or equal to 80
per cent, and a risk weight of 50 per cent where LTV
is more than 80 per cent but less than or equal to 90
percent. This measure is expected to give a fillip to
bank lending to the real estate sector.
STATEMENT ON DEVELOPMENTAL AND REGULATORY POLICIES

RBI Bulletin October 2020 15
Statement on Developmental and Regulatory Policies STATEMENT ON DEVELOPMENTAL AND REGULATORY POLICIES
IV. Financial Inclusion
7. Review of the Co-origination Model
The Reserve Bank had, in 2018, put in place a
framework for co-origination of loans by banks and
a category of Non Banking Financial Companies
(NBFCs) for lending to the priority sector subject to
certain conditions. The arrangement entailed joint
contribution of credit at the facility level, by both
the lenders as also sharing of risks and rewards
between them for ensuring appropriate alignment of
respective business objectives. Based on the feedback
received from the stakeholders, to better leverage
the respective comparative advantages of the banks
and NBFCs in a collaborative effort, and to improve
the flow of credit to the unserved and underserved
sector of the economy, it has been decided to extend
the scheme to all the NBFCs (including HFCs), to
make all priority sector loans eligible for the scheme
and give greater operational flexibility to the lending
institutions, while requiring them to conform to the
regulatory guidelines on outsourcing, KYC, etc. The
proposed framework will be called as “Co-Lending
Model”. The revised guidelines will be issued by end
of October 2020.
V. Payment and Settlement Systems
8. Round-the-Clock availability of Real Time Gross
Settlement System (RTGS)
In December 2019, the National Electronic Funds
Transfer (NEFT) system was made available on a
24x7x365 basis and the system has been operating
smoothly since then. The large-value RTGS system
is currently available for customers from 7.00 am to
6.00 pm on all working days of a week (except 2nd
and 4th Saturdays of the month). To support the
ongoing efforts aimed at global integration of Indian
financial markets, facilitate India’s efforts to develop
international financial centers and to provide wider
payment flexibility to domestic corporates and
institutions, it has been decided to make available the
RTGS system round the clock on all days. With this,
India will be one of the very few countries globally
with a 24x7x365 large value real time payment system.
This facility will be made effective from December
2020.
9. Perpetual Validity for Certificate of Authorisation
(CoA) issued to Payment System Operators (PSOs)
Currently, the Reserve Bank issues “on-tap’
authorisation under the Payment and Settlement
Systems Act, 2007 to non-banks issuing Prepaid
Payment Instruments (PPIs), operating White Label
ATMs (WLAs) or the Trade Receivables Discounting
Systems (TReDS), or participating as Bharat Bill
Payment Operating Units (BBPOUs). Authorisation
(including renewal of authorisation) of such PSOs has
been largely for specified periods up to five years. While
such limited period licences were necessitated in the
initial period of evolution of the payment system,
it can lead to business uncertainty for the PSOs and
involves avoidable use of regulatory resources in the
process of renewal. Furthermore, the Reserve Bank’s
oversight framework has gradually developed into
a more mature and comprehensive system, which
clearly lays out its oversight expectations and the
methodologies adopted for oversight of PSOs. To
reduce licensing uncertainties and enable PSOs to
focus on their business and optimise utilisation of
scarce regulatory resources, it has been decided to
grant authorisation for all PSOs (both new applicants
as well as existing PSOs) on a perpetual basis, subject
to certain conditions. Detailed instructions will be
issued separately.


MONETARY POLICY REPORT FOR 2020-21
Monetary Policy Report - October 2020


17
OCTOBER 2020Monetary Policy Report
RBI Bulletin October 2020
The global economy plunged into its deepest contraction in living memory in April-June 2020 as COVID-19 took its toll. In India, real GDP fell by a record low. Supply bottlenecks and higher taxes pushed inflation above the upper tolerance band of the target. Downside risks from a delayed vaccine, persistence of supply bottlenecks, volatile international financial markets and high food inflation acquiring a structural character are clear and present dangers to the macroeconomic outlook.
1.1 Key Developments Since the April 2020 MPR
The COVID-19 pandemic has fundamentally
altered the setting and conduct of monetary policy
across the world. With the global economy having
plunged into its deepest contraction in living
memory in Q2:2020, with over 3.5 crore infections,
including 10.4 lakh confirmed deaths as on October
7, 2020, with massive supply disruptions and demand
destruction from employment and income losses on a
scale not seen before, the unconventional has become
conventional in the ethos of monetary policy making.
Central banks have gone where they have feared to
tread before: below the so-called zero lower bound on
interest rates; to the outer limits of quantitative and
credit easing and beyond. They have undertaken what
even until recently they considered as the commission
of original sins – the monetisation of fiscal deficits
and the management of yield curves.
Central bank communication has also turned
a radical corner. Ultra-accommodative stances and
more policy actions to fight the pandemic have been
assured into the foreseeable future, even at the
cost of volatility in financial markets shaken by this
resolve, and untoward currency movements. This
unprecedented monetary policy activism appears to
have put equally unprecedented fiscal stimuli in the
shade.
In the event, their combined impulses have eased
financial conditions substantially, helped buoy up
global financial markets, and have driven up asset
and commodity prices to a point widely regarded
as a disconnect with the real economy. Crude oil
prices have recovered since May on a gradual rise
in demand and production cuts, before softening
in September on concerns arising out of the surge
in new infections. Gold prices remained elevated as
heightened uncertainty continues to boost its safe
haven appeal. Inflation, too, has rebounded, although
it remains well below targets in advanced economies
(AEs), but has risen more strongly on food prices in
some emerging market economies (EMEs).
The efficacy of these actions in reconstructing
economic activity from the ravages of COVID-19
is yet to gain traction on a broad scale. In several
economies, rebounds from troughs have begun in
Q3, but the resurgence of infections and the lingering
risk of a second wave in the absence of the elusive
vaccine overshadows these early signs of revival, and
contractions persist in several sectors. The balance
of risks remains slanted to the downside. The next
few quarters can be challenging. Global public debt is
projected by the International Monetary Fund (IMF) at
over 100 per cent of gross domestic product (GDP) in
2020. The G20 has supported time-bound suspension
of the debt service obligations of the poorest countries.
Model-based projections suggest that it could take
several years for output and activity to recover to
pre-pandemic levels in view of the lasting impact on
potential output from the loss of human and physical
capital.
In India, with the second highest caseload in the
world – over 67 lakh infections including 1 lakh deaths
as of October 7, 2020, the highest daily infections, the
severest lockdown in the world during April-May, and
re-clamping of containment measures and localised
lockdowns thereafter as infections surged into the
interior, real GDP fell by a record 23.9 per cent year-
17
I. Macroeconomic Outlook

18
Monetary Policy Report OCTOBER 2020
RBI Bulletin October 2020
on-year (y-o-y) in Q1:2020-21 (April-June 2020). Private
consumption and investment slumped precipitously,
only partly cushioned by government spending. On
the supply side, industry as well as services sectors
recorded deep contractions, and only agriculture
exhibited resilience. Meanwhile, supply bottlenecks
exacerbated by social distancing and higher taxes
pushed up inflation sharply, with pressures evident in
prices of both food and non-food items. At 6.7 per cent
in August, consumer price index (CPI) inflation was
ruling above the upper tolerance band of the inflation
target, posing testing challenges for the conduct of
monetary policy, going forward.
Monetary Policy Committee: April-September 2020
The Monetary Policy Committee (MPC) met off-
cycle on May 20-22, 2020 advancing its scheduled
meeting in view of the exigencies imposed by
COVID-19. The MPC noted that various sectors of
the economy were experiencing more acute stress
than initially anticipated and financial conditions
needed further easing to prevent the deep distress
in the economy, especially among the vulnerable and
disadvantaged. While the inflation outlook remained
uncertain, the forecast of a normal monsoon, subdued
international commodity prices, deficient demand
and favourable base effects offered some policy space.
Against this backdrop, the MPC decided to cut the
policy repo rate by 40 basis points (bps) to 4.0 per
cent (5 members voted for a reduction of 40 bps while
one member voted for a reduction of 25 bps) on top
of the sizeable cut of 75 bps in its March 27 off-cycle
meeting.
Inflation surprised on the upside in the run
up to the August 2020 meeting of the MPC. The
persistence of supply chain disruptions and broad-
based cost-push pressures were seen as keeping
inflation elevated in Q2:2020-21 with some
moderation only in H2:2020-21, aided by large
favourable base effects. Real GDP growth for 2020-
21 was expected to be negative. In these conditions,
the recovery of the economy assumed primacy,
but the MPC noted that the headline CPI prints of
April-May 2020 required more clarity as the National
Statistical Office (NSO) had to resort to imputations
for many items as data collection was affected by the
lockdowns. Given the uncertainty surrounding the
inflation outlook and taking into consideration the
extremely weak state of the economy in the midst
of the unprecedented shock from the pandemic, the
MPC decided unanimously that it was prudent to
pause and remain watchful for a durable reduction
in inflation to use the available space to support the
revival of the economy. All members also voted to
continue with the accommodative stance as long as
necessary to revive growth and mitigate the impact
of COVID-19 on the economy, while ensuring that
inflation remains within the target going forward.
The MPC’s voting pattern reflects the diversity in
individual members’ assessments, expectations and
policy preferences, a feature that is also reflected in
voting patterns of other central banks (Table I.1).
Table I.1 Monetary Policy Committees and Voting Patterns
Country Policy Meetings: April - September 2020
Total Meetings
Meetings with Full Consensus
Meetings without Full Consensus
Brazil 4 4 0
Chile 4 4 0
Colombia 6 3 3
Czech Republic 4 3 1
Hungary 6 6 0
India 2 1 1
Israel 4 0 4
Japan 5 0 5
South Africa 4 1 3
Sweden 3 3 0
Thailand 4 3 1
UK 4 4 0
US 4 4 0
Source: Central bank websites.

19
OCTOBER 2020Monetary Policy Report
RBI Bulletin October 2020
Table I.2: Baseline Assumptions for Projections
Indicator MPR April 2020 MPR October 2020
Crude Oil (Indian basket)
US$ 35 per barrel during 2020-21
US$ 40.9 per barrel during 2020-21
Exchange rate ` 75/US$ ` 73.6/US$
Monsoon Normal for 2020 9 per cent above long period average
Global growth Contraction in 2020 -4.9 per cent in 2020 5.4 per cent in 2021
Fiscal deficit (per cent of GDP)
To remain within BE 2020-21 Centre: 3.5 Combined: 6.1
Given the Covid-19 impact on activity, revenues and expenditures and factoring in the additional borrowings announced, fiscal deficits are expected to be significantly higher
Domestic macroeconomic/ structural policies during the forecast period
No major change No major change
Notes: 1. The Indian basket of crude oil represents a derived numeraire comprising sour grade (Oman and Dubai average) and sweet grade (Brent) crude oil.
2. The exchange rate path assumed here is for the purpose of generating the baseline projections and does not indicate any ‘view’ on the level of the exchange rate. The Reserve Bank is guided by the objective of containing excess volatility in the foreign exchange market and not by any specific level of and/or band around the exchange rate.
3. BE: Budget estimates. 4. Combined fiscal deficit refers to that of the Centre and States
taken together.Sources: RBI estimates; Budget documents; and IMF.
Macroeconomic Outlook
Chapters II and III analyse macroeconomic
developments during H1:2020-21 (April-September).
For the projections set out in this Chapter, the
evolution of key macroeconomic and financial
variables over the past six months warrants revisions
in the baseline assumptions made in the April 2020
MPR (Table I.2).
First, global crude prices have remained volatile
on COVID-19-related uncertainty. An unprecedented
spike occurred on April 20 when, for the first time ever,
West Texas Intermediate (WTI) front month prices
turned negative (US$ (-) 37.6 per barrel). Supported
by the agreement between the Organization of the
Petroleum Exporting Countries (OPEC) and non-OPEC
partners (OPEC plus) in April 2020 to cut oil production
by a record 9.7 million barrels a day, Brent prices
recovered from US$ 19 per barrel in April to around
US$ 45 in August, before softening in September
(Chart I.1). Considering these developments, crude
prices (Indian basket) are assumed at US$ 40.9 in the
baseline, 17 per cent above the April MPR baseline.
Second, the nominal exchange rate (the Indian
Chart I.1: Crude Oil: Demand-Supply Balance and Prices
Source: International Energy Agency. Source: Bloomberg.
a: Crude Oil: Global Demand and Supply b: Brent Prices

20
Monetary Policy Report OCTOBER 2020
RBI Bulletin October 2020
rupee or INR vis-à-vis the US dollar) has moved in both directions since April 2020. The INR remained under depreciating pressures in April due to the generalised flight out of EMEs to the safety of the US dollar amidst COVID-related concerns. After being largely range-bound during May-July, the INR exhibited an appreciating bias in August. This was driven by the surge in portfolio inflows to India on expectations of highly accommodative monetary policies in advanced economies continuing for longer, and improving prospects of potential vaccines for COVID-19. In the light of these developments, the exchange rate is assumed at INR 73.6 per US dollar in the baseline.
Third, global economic activity has underperformed significantly relative to the April outlook. Global merchandise trade volumes fell by 14.3 per cent in Q2:2020 and the World Trade Organization’s Goods Trade Barometer points to only partial upticks in Q3. The global composite Purchasing Managers’ Index (PMI) moved into expansion zone in July-September after remaining in contraction for five months, but the outlook remains uncertain in view of the resurgence in infections in some AEs and EMEs. The IMF expects the global economy to contract by 4.9
per cent in 2020 (Chart I.2), while the World Bank and
the OECD have projected a decline of 5.2 per cent and
4.5 per cent, respectively.
I.2 The Outlook for Inflation
Headline CPI inflation breached the upper
tolerance band of the target during June-August
2020, propelled by a broad-based propagation of
strong upside pressures (Chapter II). Supply chain
disruptions and higher taxes on petroleum products
and other items imparted these upward pressures on
inflation in spite of muted demand conditions. Data-
related uncertainties, as complete coverage of markets
and quotes was disrupted by lockdowns, complicate
the assessment of the outlook.
Looking ahead, three months ahead median
inflation expectations of urban households fell by
10 bps in the September 2020 round of the Reserve
Bank’s survey while one year ahead median inflation
expectations remained unchanged.1 The proportion
of respondents expecting the general price level to
increase by more than the current rate rose for both
horizons vis-à-vis the previous round (Chart I.3).
According to the Reserve Bank’s consumer confidence
survey for September 2020, one year ahead inflation
expectations remained at elevated level.
Manufacturing firms polled in the July-September
2020 round of the Reserve Bank’s industrial outlook
survey expected selling prices to remain unchanged in
Q3:2020-21 on the back of benign input cost pressures
(Chart I.4).2 The PMI for the manufacturing sector
reported higher input prices in September though
the rate of cost inflation softened from August 2020;
output prices broadly stabilised in September after
falling for five months in a row. Services sector firms
also reported higher input costs due to fuel, meat and
vegetables and some increase in output prices.
1 The Reserve Bank’s inflation expectations survey of households is conducted in 18 cities and the results of the September 2020 survey are based on responses from 5,652 households.2 The results of the July-September 2020 round of the industrial outlook survey are based on responses from 959 companies.
Chart I.2: Global GDP Growth
Source: IMF.

21
OCTOBER 2020Monetary Policy Report
RBI Bulletin October 2020
Professional forecasters surveyed by the Reserve
Bank in September 2020 expected CPI inflation to
moderate from 6.7 per cent in August 2020 to 4.2 per
cent in Q4:2020-21 and 3.8 per cent in Q2:2021-22
(Chart I.5).3
A bumper rabi crop, moderate increases in
minimum support prices (MSPs) for kharif crops, a
normal monsoon, sizeable buffer stocks and good
water storage levels in major reservoirs augur well
for the inflation outlook. At the same time, the
persistence of COVID-related supply bottlenecks,
higher taxes and their cost-push implications
could impart upward pressures on inflation. The
inflation outlook will also depend on trade policies
and effective supply management measures with
respect to key inflation-sensitive items. As noted
in the Monetary Policy Report of April 2020, the
uncertainty about the depth, spread and duration
of COVID-19 can produce drastic changes in the
outlook. Hence, macroeconomic forecasts are subject
to large revisions with every incoming data on the
pandemic. The RBI Act, however, enjoins the Reserve
Bank to, inter alia, publish and explain in the MPR
the forecasts of inflation for 6-18 months from the
date of its publication. Taking into consideration
the statutory requirements, the initial conditions,
the signals from forward-looking surveys and
estimates from time-series and structural models,
CPI inflation is projected at 6.8 per cent in Q2:2020-
Chart I.3: Inflation Expectations of Households
Source: Inflation Expectations Survey of Households, RBI.
Chart I.4: Expectations about Cost of Raw Materials and Selling Prices
Note: Net response is the difference between the respondents reporting optimism and those reporting pessimism. The range is -100 to 100. An increase/decrease in net responses in respect of the selling price is optimistic/pessimistic, while the increase/decrease in net response in respect of the cost of raw materials is pessimistic/optimistic from the view point of respondent firms. Therefore, higher negative values for the cost of raw materials indicate higher input price pressures and vice versa.Source: Industrial Outlook Survey, RBI.
Chart I.5: Inflation Expectations of Professional Forecasters
Sources: Survey of Professional Forecasters, RBI and National Statistical Office.
3 33 panellists participated in the September 2020 round of the Reserve Bank’s survey of professional forecasters.
20
30
40
50
60
70
4
5
6
7
8
9
10
11
12M
ar-1
6
Sep-
16
Dec
-16
May
-17
Sep-
17
Dec
-17
May
-18
Sep-
18
Dec
-18
May
-19
Sept
-19
Jan-
20
May
-20
Sep-
20
Prop
orti
on o
f re
spon
dent
s(P
er c
ent)
Infla
tion
rat
e (P
er c
ent)
Three months ahead (Median) One year ahead (Median)
Three months ahead price increase more than the currentrate (RHS)One year ahead price increase more than the current rate (RHS)

22
Monetary Policy Report OCTOBER 2020
RBI Bulletin October 2020
21; subsequently, large favourable base effects are
expected to pull it down to 5.4 per cent in Q3, and
4.5 per cent in Q4 (Chart I.6). The 50 per cent and
the 70 per cent confidence intervals for headline
inflation in Q4:2020-21 are 3.2-5.9 per cent and 2.4-
6.6 per cent, respectively.
For 2021-22, assuming a normalisation of supply
chains with the availability of effective vaccines
against COVID-19, a normal monsoon, and no
major exogenous or policy shocks, structural model
estimates indicate that inflation will move in a range
of 4.1-4.4 per cent. The 50 per cent and the 70 per
cent confidence intervals for Q4:2021-22 are 2.5-5.8
per cent and 1.6-6.6 per cent, respectively.
As explained earlier, an unusually high amount
of uncertainty surrounds the inflation outlook. In
particular, the persistence of the pandemic and delay
in vaccine development could render projections of
Chart I.6: Projection of CPI Inflation (y-o-y)
Note: The fan chart depicts uncertainty around the baseline projection path. The baseline projections are conditioned upon the assumptions set out in Table I.2. The thick red shaded area represents 50 per cent confidence interval, implying that there is 50 per cent probability that the actual outcome will be within the range given by the thick red shaded area. Like-wise, for 70 per cent and 90 per cent confidence intervals, there is 70 per cent and 90 per cent probability, respectively, that the actual outcomes will be in the range represented by the respective shaded areas. Source: RBI staff estimates.
Under COVID-19 conditions, real GDP in India is projected to contract in 2020-21 under the baseline scenario, reflecting both demand and supply shocks. In contrast, consumer price inflation remains elevated, suggesting that supply bottlenecks are outweighing the softening impact expected from weaker demand. These counterintuitive inflation dynamics have complicated the macroeconomic outlook.
The baseline scenario assumes that the recent spike in inflation is transient, and that there is no second wave of infections. Accordingly, two alternate scenarios are explored. A favourable scenario (Scenario 1) assumes a faster normalisation of supply chains on the back of an early breakthrough in the development of vaccines. On the other hand, an adverse scenario (Scenario 2) is built on assumptions of (i) a second wave of infections, pulling down global and domestic growth even further; (contd.)
Box I.1: What will the Post-COVID Growth-Inflation Trajectory Look Like? Illustrative Simulations from the Quarterly Projection Model
(ii) recent inflation pressures taking a more persistent path a la 2009-10; (iii) a structural component crystallising in higher fiscal deficit and public debt, with implications for the inflation outlook; and (iv) heightened volatility in capital flows and exchange rates. The Quarterly Projection Model (QPM)4 - a semi-structural, forward-looking, open economy, calibrated, gap model in the New Keynesian tradition - is used to explore these alternate scenarios.
In Scenario 1, the faster normalisation of supply chains leads to lower output losses in 2020-21 relative to the baseline. Real GDP contracts by 7.5 per cent in this scenario vis-à-vis the baseline of 9.5 per cent (Chart I.1.1). The GDP growth rebound in 2021-22 is stronger at 11.6 per cent in this benign scenario relative to 10.1 per cent in the baseline. Favourable base effects, normal supply chains and anchored inflation expectations contribute
4 Benes, Jaromir, et al. (2016), “Quarterly Projection Model for India: Key Elements and Properties”, RBI Working Paper Series, No. 08/2016.
0
2
4
6
8
10
Q1 Q2 Q3 Q4 Q1 Q2 Q3 Q4 Q1 Q2 Q3 Q4 Q1 Q2 Q3 Q4
2018-19 2019-20 2020-21 2021-22
Per
cent
50 per cent CI 70 per cent CI 90 per cent CICI - Confidence Interval
key macroeconomic variables even more uncertain
(Box I.1).

23
OCTOBER 2020Monetary Policy Report
RBI Bulletin October 2020
demand remains weak. Indicators relating to industry
and services present a mixed picture.
Turning to the forward-looking surveys,
consumer confidence for the year ahead improved
in the September 2020 round, driven by improved
sentiments on the general economic situation, the
employment scenario and income (Chart I.7).5 The
current situation index, however, fell to an all-time
low in September 2020.
Sentiments in the manufacturing sector for the
quarter ahead bounced back into the expansion zone
in the July-September 2020 round of the Reserve
Bank’s industrial outlook survey, reflecting optimism
to a reduction in inflation from 4.1 per cent in the baseline to 4.0 per cent in Q4:2021-22, aligning it with the target.
In the adverse case (Scenario 2), real GDP records a deeper contraction in 2020-21 (-11.5 per cent) and the recovery is tepid in 2021-22 (7.2 per cent). Persistent supply distortions, pressures on operating costs and unhinged expectations keep inflation elevated, more
than offsetting the impact of weak demand conditions
both in 2020-21 and 2021-22. Volatile capital flows and
downward pressure on the exchange rate add to pressure
on inflation, keeping it at 5.9 per cent in Q4:2021-22, close
to the upper tolerance band, and 1.8 percentage points
above the baseline. Overall, this scenario brings to the fore
the trade-offs between the inflation objective and that of
stabilising output.
Chart I.1.1. COVID-19 Outbreak: Illustrative Growth and Inflation Scenarios
Source: RBI staff estimates.
b: Inflation
5 The survey is conducted by the Reserve Bank in 13 major cities and the September 2020 round is based on responses from 5,364 respondents.
a: GDP Growth
I.3 The Outlook for Growth
Real GDP declined by an unprecedented 23.9 per
cent in Q1:2020-21 and domestic economic activity
remains badly hit by the unrelenting pandemic. High
frequency indicators, which were looking up in June
with the phased unlocking of the economy, levelled
off in July amidst re-imposition of local lockdowns
due to a surge in fresh cases. In August, some
indicators started improving again and strengthened
in September. The agricultural sector remains a bright
spot, supported by a normal monsoon, robust kharif sowing and adequate reservoir levels. The Pradhan Mantri Garib Kalyan Rojgar Yojana and increased
wages under the Mahatma Gandhi National Rural
Employment Guarantee Act (MGNREGA) are also
supporting rural demand. On the other hand, urban

24
Monetary Policy Report OCTOBER 2020
RBI Bulletin October 2020
on the overall business situation, production, order
books, employment, exports and capacity utilisation
(Chart I.8).
Surveys by other agencies indicate a mixed picture
on future business expectations (Table I.3). According
to the PMI for September 2020, the one year ahead
business expectations of firms in the manufacturing
sector strengthened on hopes of improvement in
demand, while the expectations of firms in the
services sector also turned somewhat optimistic after
four months of negative or neutral sentiment.
Professional forecasters polled in the September
2020 round of the Reserve Bank’s survey expected real
GDP growth to remain in negative territory through
Q3:2020-21, with a sharp pick up in Q1:2021-22 driven
by base effects (Chart I.9 and Table I.4).
Overall, the uncertainty about COVID-19’s
spread and trajectory continues to fog the outlook
and makes forecasts of real GDP growth extremely
challenging. The baseline assumes that economic
activity will gradually normalise in H2:2020-21,
but a wide range of outcomes is possible. Taking
into account the baseline assumptions, the survey
indicators, and model forecasts, real GDP is projected
to contract by 9.5 per cent in 2020-21, with risks tilted
to the downside: (-)9.8 per cent in Q2, (-)5.6 per cent
Chart I.7: Consumer Confidence
Source: Consumer Confidence Survey, RBI.
Table I.3: Business Expectations Surveys
Item NCAER Business
Confidence Index
(August 2020)
FICCI Overall
Business Confidence
Index (August 2020)
Dun and Bradstreet Composite Business
Optimism Index
(August 2020)
CII Business
Confidence Index
(July 2020)
Current level of the index
46.4 50.6 29.4 41.0
Index as per previous survey
77.4 42.9 49.4 53.4
% change (q-o-q) sequential
-40.1 17.9 -40.6 -23.2
% change (y-o-y) -62.0 -14.4 -58.0 -31.2
Notes:1. NCAER: National Council of Applied Economic Research.2. FICCI: Federation of Indian Chambers of Commerce & Industry.3. CII: Confederation of Indian Industry.
Chart I.8: Business Assessment and Expectations
Source: Industrial Outlook Survey, RBI.

25
OCTOBER 2020Monetary Policy Report
RBI Bulletin October 2020
Table I.4: Projections - Reserve Bank and Professional Forecasters
(Per cent)
2020-21 2021-22
Reserve Bank’s Baseline Projections
Inflation, Q4 (y-o-y) 4.5 4.1
Real GDP growth -9.5 10.1
Median Projections of Professional Forecasters
Inflation, Q4 (y-o-y) 4.2 -Real GDP growth -9.1 8.2Gross domestic saving (per cent of GNDI) 26.0 27.0Gross capital formation (per cent of GDP) 25.4 27.7Credit growth of scheduled commercial banks 5.0 8.5Combined gross fiscal deficit (per cent of GDP) 12.0 9.0Central government gross fiscal deficit (per cent of GDP)
7.5 5.5
Repo rate (end-period) 4.0 -Yield on 91-days treasury bills (end-period) 3.4 4.0Yield on 10-year central government securities (end-period)
6.0 6.5
Overall balance of payments (US$ billion) 71.3 50.0Merchandise exports growth -14.7 10.2Merchandise imports growth -22.7 20.6Current account balance (per cent of GDP) 0.5 -0.6
Note: GNDI: Gross National Disposable Income.Sources: RBI staff estimates; and Survey of Professional Forecasters (September 2020).
in Q3 and 0.5 per cent in Q4 (Chart I.10 and Table
I.4). For 2021-22, assuming supply chains are fully
restored with the availability of effective vaccines,
a normal monsoon, no major exogenous or policy
shocks and a large favourable base effect, structural
model estimates indicate real GDP growth at 10.1
per cent. In such an environment, the significant
monetary accommodation already provided through
cuts in the policy repo rate, and ample liquidity
infusion through conventional and unconventional
measures and fiscal stimulus and other structural
reform measures announced by the government
would be expected to add to the upside. On the other
hand, a more protracted spread of the pandemic,
delayed development and availability of vaccines,
deviations from the forecast of a normal monsoon in
2021-22 and global financial market volatility are the
key downside risks. The recent inflation elevation
acquiring a persistent character also poses downside
risks to the baseline.
I.4 Balance of Risks
The baseline projections of inflation and growth
are conditional on the assumptions relating to the
key variables set out in the preceding sections.
Chart I.9: Professional Forecasters' Projection of Real GDP Growth
Source: Survey of Professional Forecasters, RBI and National Statistical Office.
Chart I.10: Projection of Growth in Real GDP (y-o-y)
Note: The fan chart depicts uncertainty around the baseline projection path. The baseline projections are conditioned upon the assumptions set out in Table I.2. The thick green shaded area represents 50 per cent confidence interval, implying that there is 50 per cent probability that the actual outcome will be within the range given by the thick green shaded area. Like-wise, for 70 per cent and 90 per cent confidence intervals, there is 70 per cent and 90 per cent probability, respectively, that the actual outcomes will be in the range represented by the respective shaded areas. Source: RBI staff estimates.
-23.9
-10.0
-3.2
0.6
17.8
8.8
-25.0
-20.0
-15.0
-10.0
-5.0
0.0
5.0
10.0
15.0
20.0
25.0
2016-17 2017-18 2018-19 2019-20 2020-21 2021-22
Per
cent
Actual Projected
Q1 Q3 Q1 Q3 Q1 Q3 Q1 Q3 Q1 Q3 Q1Q2 Q4 Q2 Q2 Q2 Q2 Q2Q4Q4Q4Q4
CI - Confidence Interval
50 per cent CI 70 per cent CI 90 per cent CI
-25
-15
-5
5
15
25
35
Q1 Q2 Q3 Q4 Q1 Q2 Q3 Q4 Q1 Q2 Q3 Q4 Q1 Q2 Q3 Q4 Q1
2017-18 2018-19 2019-20 2020-21 2021-22
Per
cent

26
Monetary Policy Report OCTOBER 2020
RBI Bulletin October 2020
Uncertainties surrounding these assumptions,
especially relating to COVID-19, could lead to large
deviations in either direction. This section assesses
the balance of risks to the baseline projections in
plausible alternative scenarios.
(i) Global Growth Uncertainties
The global output losses from COVID-19 have
turned out to be more severe than anticipated,
despite sizeable monetary and fiscal stimuli by
many countries. Given the spread of the pandemic
and recurrent bouts of resurgence, the recovery is
expected to be protracted and there are large downside
risks to the baseline assumptions. In such a scenario,
the quarterly projection model’s simulations suggest
that if global growth slips by 100 bps vis-à-vis the
baseline, domestic growth and inflation could be
lower by around 40 bps and 20 bps, respectively,
from the baseline trajectories. Conversely, an early
breakthrough in the development of an effective
COVID-19 vaccine and its widespread distribution
could boost global trade and demand. In this scenario,
assuming global growth surprises by 100 bps on the
upside, domestic growth and inflation could edge
higher by around 40 bps and 20 bps, respectively
(Charts I.11a and I.12a).
(ii) International Crude Oil Prices
Crude prices rebounded from May 2020 on the
back of supply cuts by oil producing countries (OPEC
plus) and improved demand prospects due to the
gradual easing of lockdown restrictions. Looking
ahead, international crude prices may increase more
than expected in the event of a quicker containment of
COVID-19, a sharper global recovery or an agreement
among suppliers on further production cuts. For
a net energy importer like India, the dynamics of
international crude price movements have significant
macroeconomic implications. Assuming crude prices
are 10 per cent higher, inflation could increase by 30
bps and growth could be weaker by around 20 bps over
the baseline. Conversely, crude prices could soften
from the current levels if the agreed production cuts
are not adhered to or a second wave of the pandemic
further weakens the demand for oil. In this event, if
crude prices fall by 10 per cent, inflation could ease by
around 30 bps with a boost of 20 bps to growth (Charts
I.11a and I.12a).
Chart I.11: Impact of Risk Scenarios on the Baseline Inflation Path
Source: RBI staff estimates.
a: Crude Oil Prices and Global Demand Shocks b: Exchange Rate and Food Price Shocks

27
OCTOBER 2020Monetary Policy Report
RBI Bulletin October 2020
(iii) Exchange Rate
The INR has exhibited two-way movements over
the past six months, reflecting global risk-on risk-
off sentiments driven by vacillating views on the
spread and containment of COVID-19. A renewed
surge in COVID-19 infections and safe haven
demand could induce capital outflows across EMEs,
putting depreciation pressure on the INR. If the INR
depreciates by 5 per cent from the baseline, inflation
could edge up by around 20 bps and GDP growth could
be higher by 15 bps (Charts I.11b and I.12b). On the
other hand, if COVID-19 normalises quicker than
assumed under the baseline, strong capital inflows
could put appreciating pressure on the INR. In such a
scenario, if the INR appreciates by 5 per cent, inflation
and GDP growth could moderate by around 20 bps and
15 bps, respectively, vis-à-vis the baseline.
(iv) Food Inflation
Food inflation has remained elevated in recent
months driven by price pressures in vegetables,
cereals and protein items such as pulses, eggs and
meat. The normal south-west monsoon, increased
sowing of kharif crops, moderate MSP hikes, and high
Chart I.12: Impact of Risk Scenarios on the Baseline Growth Path
Source: RBI staff estimates.
a: Crude Oil Prices and Global Demand Shocks b: Exchange Rate and Food Price Shocks
reservoir storage are expected to soften food inflation going forward. However, a delayed normalisation of supply chains, heavy rains and floods in some states and demand-supply imbalances in key items such as pulses could exert further upward pressure on the headline inflation and keep it higher by around 50 bps (Charts I.11b and I.12b). On the other hand, an accelerated softening of food inflation due to an early restoration of supply chains, ample buffer stocks and efficient food stock management by the Government could bring headline inflation below the baseline by up to 50 bps.
I.5 Conclusion
At this juncture, global outlook is heavily contingent upon the uncertain trajectory of COVID-19, with significant implications for key variables such as crude oil and commodity prices, global growth, and financial markets. Consequently, the forecasts for domestic inflation and output could change significantly relative to baseline expectations. The behaviour of inflation holds the key to the conduct of monetary policy going forward. The gradual restoration of supply lines, good progress of kharif
sowing, sizeable buffer stocks, effective food supply
-0.6
-0.4
-0.2
0.0
0.2
0.4
0.6
1 2 3 4 5 6 7 8
Perc
enta
ge p
oint
Quarters
Higher crude price Lower crude price
Global growth recovery Global growth slowdown
-0.6
-0.4
-0.2
0.0
0.2
0.4
0.6
1 2 3 4 5 6 7 8
Perc
enta
ge p
oint
Quarters
Exchange rate appreciation Exchange rate depreciation
Higher food inflation Lower food inflation

28
Monetary Policy Report OCTOBER 2020
RBI Bulletin October 2020
management and a faster progress on the vaccine could
pull inflation down from current elevated levels and
open up space for addressing the urgent need to repair
and revive the economy from the blows it has suffered
from the pandemic. Yet, the downside risks from a
delayed vaccine, more than expected persistence of
supply bottlenecks, volatile international financial
markets and high food inflation acquiring a structural
character and spilling to non-food items are clear and
present dangers that could potentially push inflation
above the baseline. By current assessment, real GDP
growth can post a modest recovery during H2:2020-
21, aided by early containment of COVID-19 and
the monetary and fiscal stimuli. Nonetheless, it is
prudent to recognise and brace up for the downside
risks described earlier.

29
OCTOBER 2020Monetary Policy Report
RBI Bulletin October 2020
A broad-based elevation in consumer price index (CPI) inflation between March and July 2020 emanated from tight demand supply balances in protein-based food items, floods damaging the output of vegetables, increase in retail margins due to the pandemic, tax increases in petrol and diesel, safe haven demand for gold and cost-push pressures.
At the time of the Monetary Policy Report (MPR)
of April 2020, headline inflation1, which was ruling
above the upper tolerance level of the inflation target,
was projected to decline, with rabi crop arrivals
inducing a softening of food inflation. COVID-19 has
drastically altered that prognosis. The pandemic and
the response in the form of social distancing and
the severest lockdown in the world caused a virtual
seizure of transactions in non-essential items and
threw into complete disarray the price collection
system. The National Statistical Office (NSO)
suspended the publication of the headline consumer
price index (CPI) for April and May. It was not until
July 13, 2020 with the lifting of some pandemic-
related restrictions and the partial restoration of
non-essential activities that the provisional index
for June 2020 could be compiled. Even so, prices
could be collected from 1030 urban markets and 998
villages that accounted for only 88 per cent of the
total sample. As such, the data collected did not meet
the adequacy criteria for generating robust estimates
of CPI at the state level. Headline indices for April and
May were imputed for business continuity purposes.
In its resolution of August 6, 2020, the monetary
policy committee (MPC) expressed the view that
for the purpose of monetary policy formulation
and conduct, the imputed prints for April and May
can be regarded as a break in the CPI series. In
terms of acceptable standards of data collection,
it is appropriate to compare the headline inflation
reading for July 2020 with that of March 2020. The
surge in inflation by 90 basis points between these
reference dates was diffused across the board, partly
offset by a significant moderation in fuel inflation
(Chart II.1).
1 Headline inflation is measured by year-on-year changes in all India CPI Combined (Rural and Urban).
Sources: National Statistical Office (NSO); and RBI staff estimates.
Chart II.1: CPI Inflation (y-o-y)
II. Prices and Costs

30
Monetary Policy Report OCTOBER 2020
RBI Bulletin October 2020
The Reserve Bank of India (RBI) Act, 1934
(amended in 2016) enjoins the RBI to set out
deviations of actual inflation outcomes from
projections, if any, and explain the underlying
reasons thereof. The April 2020 MPR had projected a
moderation in CPI inflation during H1:2020-21 from
6.6 per cent in Q4:2019-20 to 4.8 per cent in Q1:2020-
21 and to 4.4 per cent in Q2:2020-21, with the caveat that the uncertainty about the depth, spread and
duration of COVID-19 could produce drastic changes
in these forecasts. With data for Q1 being regarded
as a break in the CPI series as cited above, actual
inflation outcomes overshot projections by 2.3
percentage points in Q2 (Chart II.2), largely reflecting
the destructive impact of COVID-19.
Price spikes became evident in April during the
nation-wide lockdown as usurious margins chased
panic buying and stocking. Although there was some
ebbing in May, these price pressures resurfaced in
June and persisted in July-August due to a variety of
shocks: an increase in the prices of vegetables due to
floods in eastern India; elevated edible oils prices on
the back of higher international prices; pressures on
meat and fish prices once the initial apprehension
of their link with COVID-19 infections was allayed;
and supply bottlenecks in the availability of cereals
and pulses. From February 2020, international gold
prices increased to historic highs on safe haven
demand, pushing up prices of personal care and
effects by around 10 per cent. International crude
oil prices jumped from US $35 per barrel assumed
in the April MPR to US $44 per barrel by end-August.
Domestic petrol and diesel pump prices rose more
than proportionately in view of the sharp increase
in excise duties on petrol and diesel by `10 per litre
and `13 per litre, respectively, and state VAT by up
to `7 per litre in the post-lockdown period. Inflation
excluding food, fuel, petrol, diesel and gold from the
CPI edged up as costs associated with disruption of
supply chains, labour shortages and transportation
fed into a host of goods and services. Overall, the
supply shocks caused by COVID-19 overwhelmed the
collapse in demand.
II.1 Base Effect and Momentum
A decomposition of changes in year-on-year
(y-o-y) inflation2 indicates that the sharp increase
in headline inflation between March and July was
the result of a substantial and broad-based jump in
price momentum. By August, the price momentum
moderated across food and core groups, and declined
in respect of the fuel group; however, favourable
2 A change in CPI year-on-year (y-o-y) inflation between any two months is the difference between the current month-on-month (m-o-m) change in the price index (momentum) and the m-o-m change in the price index 12 months earlier (base effect). For more details see Box I.1 of the MPR, September 2014.
Chart II.2: CPI Inflation (y-o-y): Projection versus Actual
#: The NSO did not publish inflation rates for April and May 2020.*: Projections for entire Q2:2020-21 vis-a-vis actual average inflation during July-August 2020.Sources: NSO; and RBI staff estimates.

31
OCTOBER 2020Monetary Policy Report
RBI Bulletin October 2020
base effects across food and core also diminished
in August, resulting in headline inflation remaining
broadly unchanged at 6.7 per cent during July and
August (Chart II.3).
The distribution of CPI inflation over January-
August 20203 reveals that the median inflation rate
shifted up to 4.6 per cent from around 4 per cent
in recent years, indicating a broad-based increase in
price pressures (Chart II.4). The diffusion indices
of price changes in CPI items4 on a non-seasonally
3 Excluding April-May 2020 imputed inflation data.4 The CPI diffusion index, a measure of dispersion of price changes, categorises items in the CPI basket according to whether their prices have risen, remained stagnant or fallen over the previous month. A reading above 50 for the diffusion index signals a broad expansion or generalisation of price increases and a reading below 50 signals broad-based price decline.
adjusted basis5 also attest to this cross-sectional
spread of price increases in the post-lockdown period
(Chart II.5).
II.2 Drivers of Inflation
A historical decomposition in a vector
autoregression (VAR) framework can help to
disentangle the relative role of various factors
driving the inflation process. This empirical analysis
indicates the predominant role of unfavourable
supply side shocks in keeping inflation at elevated
levels in recent quarters. Food supply and crude
Chart II.3: CPI Inflation – Momentum and Base Effects
Sources: NSO; and RBI staff estimates.
a: CPI Headline b: CPI Food and Beverages
c: CPI Fuel and Light d: CPI excluding Food and Fuel
5 The non-availability of CPI item level data for the period March-May 2020 hindered seasonal adjustments in the item level series for the recent period.

32
Monetary Policy Report OCTOBER 2020
RBI Bulletin October 2020
oil price shocks together contributed around 80
per cent of the deviation in inflation from target in
Q2:2020-21 (Chart II.6a). Muted demand conditions
contributed negatively to the inflation deviation
by around 10 per cent in Q2 but were dwarfed by
Chart II.5: Diffusion Indices: CPI (M-o-M Non-Seasonally Adjusted)
Sources: NSO; and RBI staff estimates.
the supply-side shocks. The sizeable repo rate cuts,
expansion in money supply and the firming up of
equity prices – representing asset prices – together
contributed around 10 per cent to the inflation
deviation in Q2.6
Chart II.4: Average CPI Inflation (y-o-y) (Kernel Density Estimates)
* The inflation numbers for 2020 do not include April-May imputed inflation rates.Sources: NSO; and RBI staff estimates.
Chart II.6: Drivers of CPI Inflation
a: Decomposition of CPI Inflation*
* Deviation from deterministic trend.Note: Estimated using a vector autoregression with changes in oil prices in US$, changes in INR/US$ exchange rate, changes in BSE Sensex, CPI inflation, output gap, changes in rural wages, policy rate and changes in money supply using data from Q4:2010-11 to Q2:2020-21.Sources: NSO; RBI; Petroleum Planning & Analysis Cell (PPAC); BSE; Labour Bureau; and RBI Staff estimates.
6 Historical decomposition is used to estimate the individual impact of shocks on movements in inflation over a sample period, based on a vector auto regression (VAR). The VAR can be written in reduced form as: Yt =c + A Yt-1 + et; where et represents a vector of shocks [oil price shock; exchange rate shock; asset price shock; supply shock (inflation shock); demand shock; wage shock; policy rate shock; and money supply shock]. Using Wold decomposition, Yt can be represented as a function of its deterministic trend and sum of all the shocks et. This formulation facilitates decomposition of the deviation of inflation from its deterministic trend into the sum of contributions from various shocks. The supply shocks represent the unexplained component of the CPI inflation.
(Contd.)

33
OCTOBER 2020Monetary Policy Report
RBI Bulletin October 2020
The contribution of perishable goods (non-
durable goods with a 7-day recall7) in overall inflation,
during June-August 2020, remained elevated at 46.8
per cent due to supply disruptions. Semi-perishable
goods (non-durable goods with a 30-day recall) and
durable goods contributed to headline inflation to
the extent of 35.7 per cent. During June-August 2020,
the contribution of services to headline inflation
also edged up to 17.5 per cent compared to February
2020 (15.1 per cent), indicating generalised cost-push
pressures (Chart II.6b). Contributions to headline
inflation from imported components8 turned positive
and amounted to 0.2 percentage points in August
2020 (Chart II.6c).
Food Group
Food inflation, which was at 7.8 per cent in March,
increased to 8.4 per cent by July-August, reflecting
primarily the impact of adverse supply shocks. Protein-
based food items, especially meat products and pulses,
emerged as the key driver and their contribution
to overall food inflation also remained elevated
(Chart II.7a). Elevated inflation pressures in milk
prices also contributed to the surge (Chart II.7b).
Inflation in prices of oils and fats and spices was in
double digits in H1:2020-21 creating another pressure
point. Taken together, the price build-up was close to
historical average (Chart II.8).
In the case of cereals (weight of 9.7 per cent in
the CPI and 21.1 per cent in the food and beverages
group), the conundrum of co-existing supply gluts
and price pressures complicated inflation dynamics.
Cereals inflation remained elevated despite massive
buffer stockpiling after the nation-wide lockdown
on account of higher procurement. With the easing
of lockdown conditions, cereals prices moderated in
July-August 2020.
Inflation in prices of vegetables (weight of 6.0
per cent in the CPI and 13.2 per cent in the food and
beverages group) exhibited high volatility (Chart II.9).
Potato price inflation remained elevated at 79.5 per
cent in August 2020, contributing 10.6 per cent to
headline inflation. Unseasonal rain in Uttar Pradesh
in March 2020 and cyclone-related damage to the crop
in West Bengal in May 2020, the two major potato
7 The CPI weighting diagrams use the modified mixed reference period (MMRP) data based on the 2011-12 Consumer Expenditure Survey conducted by the National Sample Survey Office (NSSO). Under MMRP, data are collected on expenditure incurred for frequently purchased items – edible oil, eggs, fish, meat, vegetables, fruits, spices, beverages, processed foods, pan, tobacco and intoxicants – during the last seven days; for clothing, bedding, footwear, education, medical (institutional), durable goods, during the last 365 days; and for all other food, fuel and light, miscellaneous goods and services including non-institutional medical services, rents and taxes, data relate to the last 30 days.8 Petrol; diesel; liquefied petroleum gas (LPG); kerosene; electronic goods; gold; silver; chemical and chemical products; metal and metal products; and vegetables oils.
Sources: NSO; and RBI staff estimates.
Note: Figures in parentheses indicate weights in CPI.
b: Contribution of Goods and Services c: Contribution of Imported Inflation

34
Monetary Policy Report OCTOBER 2020
RBI Bulletin October 2020
producing states, resulted in considerable supply disruptions. Price pressure in potatoes were further exacerbated by labour shortages at mandis, lower stock availability in cold storage and higher exports during 2019-20.
Inflation in onion prices surged from September 2019 onwards and reached a peak of 327.4 per cent in December 2019, contributing 4.8 percentage points to food inflation and 2.1 percentage points to headline
inflation. These spikes generally occur in the lean months of July-September during which the entire domestic supply is met through onions procured in the rabi season. With the arrival of the late kharif crop and a large rabi crop, onion prices went into deflation of (-) 4.0 per cent in August 2020.
Prices of tomatoes picked up during June-July 2020 due to lower supplies coming from damage to crops in some regions from pre-monsoon rains. Anecdotal
Chart II.8: Financial Year Price Build-up (August over March)
Chart II.9: Drivers of Vegetable Inflation (y-o-y)
Note: Figures in parentheses indicate items’ weights in CPI-vegetables.Sources: NSO; and RBI staff estimates.
Note: Figures in parentheses indicate weights in CPI- food and beverages.Sources: NSO; and RBI staff estimates.
Chart II.7: CPI Food Inflation (y-o-y)
Sources: NSO; and RBI staff estimates.
a: Contributions b: Drivers of CPI Protein-based Food Inflation
Note: Figures in parentheses indicate weights in CPI-Protein based food.
*: Includes meat & fish, egg, milk and pulses. **: Includes cereals, fruits, sugar, non-alocoholic beverages and prepared meals.Note: Figures in parentheses indicate weights in CPI food and beverages.

35
OCTOBER 2020Monetary Policy Report
RBI Bulletin October 2020
evidence suggests that farmers in some states/areas planted less area with tomatoes than a year ago due to the collapse of prices in major centres in May 2020, which might have also contributed to the spike in prices in July. Tomato prices eased slightly in August 2020, with fresh supplies coming into the market.
Inflation in prices of fruits (weight of 2.9 per cent in the CPI and 6.3 per cent within the food and beverages group) declined from a peak of 5.8 per cent in January 2020 to 0.1 per cent in July 2020 but picked up to 1.0 per cent in August 2020 due to higher demand for dry fruits during the pandemic.
Within protein-based food items (weight of 13.0 per cent in the CPI and 28.4 per cent in the food and beverages group), inflation in prices of pulses (weight of 2.4 per cent in the CPI and 5.2 per cent in the food and beverages group) exhibits a cobweb phenomenon – lower production and higher prices in a deficit season spur increased acreage in the following season, leading to excess supply and consequent fall in prices. In the short-run, demand-supply mismatches are met mainly through imports, the transit time varying and imposing volatility (Chart II.10). The decline in kharif pulses production (by 4.6 per cent in the 4th advance estimates for
2019-20 over 2018-19 final estimates) and especially, urad production (by 44.9 per cent) led to persistent price pressures, which were accentuated by lockdown-related supply uncertainties and stockpiling by consumers during April-May 2020. With the easing of the lockdown and improved kharif sowing, pulses inflation eased to 14.4 per cent in August.
Inflation in prices of meat and fish (weight of 3.6 per cent in the CPI and 7.9 per cent within the food and beverages group) increased from 9.2 per cent in March to 18.9 per cent in June 2020 before moderating to 16.5 per cent in August 2020. Prices of chicken and eggs eased during February-March 2020 due to a fall in consumption demand on pandemic fears, with poultry farmers culling to avoid feeding costs. With demand recovering from May, inflation in prices of chicken rose to 25.4 per cent in June 2020 while inflation in prices of eggs increased to 10.1 per cent in August 2020. With the onset of the rainy season, prices of mutton, fish and chicken eased as per the usual seasonal pattern in July-August 2020.
Milk and products price inflation (weight of 6.6 per cent in the CPI and 14.4 per cent in the food and beverages group), which were impacted by price hikes by major co-operatives last year (in May 2019 and December 2019), remained elevated at 6.2 per cent in August due to supply disruptions. Higher global prices of skimmed milk products also impacted domestic prices.
Inflation in prices of sugar and confectionery (weight of 1.4 per cent in the CPI and 3.0 per cent in the food and beverages group) moderated from 3.9 per cent in March to 2.9 per cent in June due to the decline in demand from bulk segments (hotels and restaurants). In July 2020, Andhra Pradesh increased the PDS sugar prices from `20 per kg to `34 per kg imparting pressures to both PDS and non-PDS sugar prices.
Inflation in prices of oils and fats (weight of 3.6 per cent in the CPI and 7.8 per cent in the food and beverages group) increased in January 2020 and
Chart II.10: Pulses - Demand Supply Balance
Sources: Ministry of Agriculture and Farmers Welfare; DGCIS; CACP; NSO; Labour Bureau; and RBI staff estimates.

36
Monetary Policy Report OCTOBER 2020
RBI Bulletin October 2020
remained elevated, reaching 12.4 per cent in August 2020. The rise in global prices of this highly import dependent item was the major reason for the firming up of domestic prices. Domestically, lower production of rapeseed, mustard and soybeans (as per the 4th advance estimates for 2019-20) added to the price pressures.
Fuel Group
Inflation in fuel prices moderated from 6.4 per cent in February 2020 to 0.5 per cent in June due to a steep fall in domestic LPG and kerosene prices in tandem with the collapse in international benchmark product prices (Chart II.11a). Subsidised domestic kerosene prices firmed up till March and the domestic kerosene price was higher than international prices for the first time. Accordingly, oil marketing companies (OMCs) stopped the calibrated
increase in administered kerosene prices from April and linked them to international prices movements with price revisions at the start of every month. As a result, domestic kerosene prices fell sharply during April-May, tracking international prices. By July 2020, international prices reversed, and domestic LPG and kerosene prices edged up (Chart II.11b and Chart II.11c). Prices of items of rural fuel consumption registered some moderation in the post-lockdown period, but the contribution of electricity prices to overall fuel inflation increased (Chart II.11a).
CPI excluding Food and Fuel
CPI inflation excluding food and fuel (core inflation) rose from 3.9 per cent in February-March 2020 to 5.6 per cent in July-August (Chart II.12). This price build-up was much higher than the historical average
(Chart II.13).
Chart II.11: CPI Fuel Group Inflation
Notes: (1)The international price for LPG is based on spot prices for Saudi Butane and Propane, combined in the ratio of 60:40 respectively. These international product prices are indicative import prices. Further details are available at www.ppac.org.in.
(2) The indicative international price for kerosene is the Singapore Jet Kero spot price. (3) The domestic prices of LPG and kerosene represent the average prices at four metros from Indian Oil Corporation Limited (IOCL).
Sources: NSO;Bloomberg; IOCL; and RBI staff estimates.
a: Drivers (y-o-y)
b: LPG Price Movements c: Kerosene Price Movements
*: Includes diesel [excl. conveyance], coke, coal, charcoal and other fuels.Note: Figures in parentheses indicate weights in CPI- fuel and light.

37
OCTOBER 2020Monetary Policy Report
RBI Bulletin October 2020
International crude oil prices plummeted after the imposition of lockdowns globally, pulling down the price of Indian basket of crude oil to around US$ 16 per barrel on April 21, 2020. Thereafter, the Indian basket crude oil price increased to US$ 44 per barrel by end-August 2020. With the incidence of higher taxes, domestic petrol pump prices9 increased from `72.4
per litre at end-March to `84.8 per litre by end-August (Chart II.14a). On May 6, 2020, the central government raised the excise duty on petrol and diesel again10 by `10 per litre and `13 per litre, respectively. There was, however, no commensurate increase in the pump prices, as it was absorbed into the large mark-up over international prices.11 Faced with large
Notes: (1) Figures in parentheses indicate weights in CPI. (2) Derived as residual from headline CPI.Sources: NSO; and RBI staff estimates.
Chart II.12: Exclusion-based CPI Inflation (y-o-y) Chart II.13: CPI excluding Food and Fuel – Financial Year Price Buildup (August over March)
Note: Figures in parentheses indicate weights in CPI excluding food and fuel.Sources: NSO; and RBI staff estimates.
9 Proxied by the average pump prices for petrol in the 4 major metros. 10 Excise duty on petrol and diesel was earlier increased by ` 3 per litre each on March 14, 2020. 11 Petrol and diesel pump prices were largely unchanged during the lockdown period by the OMCs.
Chart II.14: Movements in International and Domestic Petroleum Product Prices
Sources: NSO; Ministry of Commerce and Industry; Bloomberg; IOCL; and RBI staff estimates.
Note: International petrol prices denote the spot price of Singapore gasoline. Domestic prices represent the average pump prices of four metros as reported by Indian Oil Corporation Limited (IOCL).
a: Petrol - Domestic and International Prices b. Petrol and Diesel Inflation (y-o-y)

38
Monetary Policy Report OCTOBER 2020
RBI Bulletin October 2020
revenue shortfalls, various states also increased value added taxes (VATs) since early April12. Coupled with the increase in international prices, this pushed up domestic pump prices sharply during June. CPI petrol inflation jumped from 3.2 per cent in February to 12.1 per cent in August 2020. On the other hand, inflation in respect of wholesale prices of petrol and diesel, which captures prices net of any tax impact, moved from (-) 1.5 per cent in February to (-) 33.4 per cent in May and to (-) 14.2 per cent in August, broadly mirroring international price movements (Chart II.14b).
Even abstracting from the effects of prices of petroleum products, CPI inflation excluding food,
fuel, petrol and diesel increased from 4.0 per cent in February to 5.4 per cent in July-August 2020. A major contributor was the increase in gold prices to historic highs by August 2020. CPI inflation excluding food, fuel, petrol, diesel, gold and silver also increased from 3.6 per cent in February 2020 to 4.5 per cent in July-August 2020, indicating broad-based cost-push pressures in the post-lockdown period that were more acute in urban areas than in rural areas (Box II.1).
Inflation in the prices of goods component of CPI excluding food, fuel, petrol, diesel, gold and silver (with a weight of 20.7 per cent in CPI) rose from 2.9 per cent in February 2020 to 4.7 per cent in August
Compilation of all-India CPI entails a bottom-up aggregation process, starting from state-wise price indices for rural and urban areas. Any inflation impulse at the national level has thus an underlying rural-urban distinction as was evident in the onion price shock of November 2019-February 2020 and the COVID-19 related lockdown shock of June-August 2020. The former saw similar inflation distributions in the rural and urban areas with fat tails due to spike in vegetable inflation, whereas the rural-urban inflation distributions showed divergence post lockdown (Chart II.1.1).
Box II.1: Whose Inflation is It? The Rural-Urban Divide
During June-August, 2020 urban inflation was predominantly concentrated in the non-food sub-groups. Inflation in the prices of household goods and services was higher in urban areas by 2.9 percentage points. On the other hand, rural areas saw substantially higher vegetables inflation in the post-lockdown period (Chart II.1.2).
In the past, these divergences have been short-lived; over time, there is an inherent tendency for rural and urban inflation to converge and this is reflected in data for most recent months (Bhoi et al., 2020). An
(Contd.)
Sources: NSO; and RBI staff estimates.
Chart II.1.1: Distribution of Rural and Urban Inflation during Recent Price Shocks
a: Onion Price Shock (Nov 2019-Feb 2020) b: Post-lockdown (Jun-Aug 2020)
12 During April-May 2020, VAT on petrol was increased in a range of `1 per litre to `3.25 per litre while that on diesel was increased in a range of `1 per litre to `7.10 per litre in the four metropolitan cities (Chennai, Delhi, Mumbai and Kolkata). On July 31, 2020, Delhi reduced the VAT on diesel, effectively reducing its prices by `8.4 per litre.

39
OCTOBER 2020Monetary Policy Report
RBI Bulletin October 2020
Chart II.1.2: CPI Rural-Urban Inflation
Source: NSO; and RBI staff estimates.
empirical exercise using fully modified ordinary least
squares (FMOLS), based on monthly inflation data
for January 2012-July 2020 confirms a co-integrating
relationship, i.e., there exists a long-run co-movement
between rural and urban inflation at the all-India level.
Moreover, the significant error correction term [(-)
0.12] suggests that 12 per cent of the previous period’s
deviation between actual and long-run inflation is
corrected every month.
Long run-cointegration Equation
urban inflation =0.11+ 0.87 rural inflation + 1.62 DUM 2013 + 1.90 DUM 2018 ...(1)
(0.73) (0.00) (0.00) (0.00)
Adj. R2 = 0.93; Engle-Granger tau-statistic and z-statistic confirms cointegration at 1 per cent level of significance.
Error Correction Mechanismurban inflation =
–0.00 – 0.12 t-1 + 0.78 rural inflation + (0.99) (0.02) (0.00)
0.19 urban inflation (–1) – 0.18 rural inflation (–1) ...(2)(0.07) (0.04)
Adj. R2 = 0.78; LM test for the null hypothesis of no serial correlation up to 3 lags (p-value) =0.26.
Note: Figures in parentheses denote p-values.
References:
Bhoi, Binod. et al. (2020) “Rural Urban Inflation Dynamics”, mimeo.
2020 due to pan, tobacco and intoxicants, transport
and communications goods, clothing and footwear
and household goods (Chart II.15a).
Core services inflation (with a weight of 23.0
per cent in CPI) rose from 4.4 per cent in February
2020 to 4.7 per cent in August 2020, led by prices of
transportation and communications services as well
as those of household services, the latter due to an
increase in price of services provided by domestic
servants, cooks and sweepers (Chart II.15b).
Other Measures of Inflation
Inflation measured by sectoral CPIs for
agricultural labourers (CPI-AL) and rural labourers
(CPI-RL) after hovering above the headline CPI
inflation during 2019-20, with a sharp fall in food
and fuel components, fell below CPI-Combined
inflation during July and August 2020. Inflation in
terms of CPI for industrial workers (CPI-IW) also
fell below headline CPI inflation in March 2020
with a steep decline in food inflation. Thereafter, a

40
Monetary Policy Report OCTOBER 2020
RBI Bulletin October 2020
further moderation in inflation in the food group,
coupled with disinflation in the clothing group,
kept CPI-IW inflation below headline CPI
(Chart II.16a).
Chart II.15: Contribution to CPI Inflation excluding Food, Fuel, Petrol, Diesel, Gold and Silver
Note: Figures in parentheses indicate weights in CPI. Sources: NSO; and RBI staff estimates.
a: Goods (y-o-y) b: Services (y-o-y)
Chart II.16: Alternative Inflation Measures
Sources: NSO; Labour Bureau; Ministry of Commerce and Industry; and RBI staff estimates.
a: Various Measures of Inflation (y-o-y) b: CPI-WPI Divergence among Selected Commodities(Average during June-August 2020)

41
OCTOBER 2020Monetary Policy Report
RBI Bulletin October 2020
Inflation in terms of the wholesale price index
(WPI) was on a different trail altogether. It sank into
deflation in April, which persisted through till July,
with non-food manufactured products in deflation
for over a year. Fuel inflation moved into negative
territory in March 2020 as a result of the large
contraction in mineral oil inflation during March that
persisted till August 2020. In August, WPI inflation
turned marginally positive (0.2 per cent) due to a
sharp uptick in inflation in non-food manufactured
products. WPI food inflation remained above 4 per
cent but exhibited lower inflationary pressures than
in CPI across major sub-groups (Charts II.16b). The
WPI measures basic prices less trade discounts,
thereby leaving out indirect taxes by definition while
retail prices are inclusive of taxes. Gross domestic
product (GDP) and gross value added (GVA) deflators
sank in Q1:2020-21 in line with the WPI.
Trimmed means of inflation provide a measure
of underlying inflation dynamics and are computed
by statistically eliminating large positive and negative
changes. Exclusion based measures of CPI also
capture persistent trends in inflation by removing
volatile components. Both trimmed means and
Chart II.17: Trimmed Means of CPI Inflation (y-o-y)
Sources: NSO; and RBI staff estimates.
exclusion-based measures have moved up – barring
a slight reversal in August – suggesting generalised
inflationary pressures (Charts II.12 and II.17).
II.3 Costs
The wholesale cost of farm inputs and industrial
raw materials entered into deflationary territory in
March and dipped to a 55-month low in May 2020,
mirroring soft global oil and other commodity prices,
and subdued demand (Chart II.18). There was a
moderation in coal inflation, given low demand
from end-user industries for steel and power, and
contraction in international coal prices. Among
other non-food items, deflation in prices of fibres
intensified during April-August 2020 on account of
subdued exports and domestic demand.
Amongst farm sector inputs, inflation in the
case of fodder prices moderated during June-August
2020, owing to the early onset and good distribution
of monsoon. In the case of fertilisers and pesticides,
inflation remained muted, reflecting deflation in
international prices of phosphate, di-ammonium
phosphate (DAP), triple superphosphate (TSP) and
urea. Electricity prices have eased since April in view
Chart II.18: Farm and Non farm Input Cost Inflation (y-o-y)
*: Comprises primary non-food articles, minerals, coal, aviation turbine fuel, high speed diesel, naphtha, bitumen, furnace oil, lube oil, petroleum coke, electricity, cotton yarn and paper & pulp from WPI.$: Comprises high speed diesel, fodder, electricity, fertilisers, pesticides, and agricultural and forestry machinery from WPI.Sources: Ministry of Commerce and Industry; and RBI staff estimates.

42
Monetary Policy Report OCTOBER 2020
RBI Bulletin October 2020
of weak demand conditions. Inflation in agricultural
machinery and implements eased to 1.2 per cent
during April-August 2020 due to subdued momentum
in prices of tractors and agriculture implements.
Growth in nominal rural wages, both for
agricultural and non-agricultural labourers, showed a
sharp uptick in May 202013 (Chart II.19).
Growth in staff costs in the organised sector
decreased for listed firms in the manufacturing and
services sectors during Q1:2020-21 over layoffs and
salary cuts. However, unit labour costs (measured as
a ratio of staff cost to value of production) increased
during Q1:2020-21 due to contraction in the value
of production14. Unit labour cost rose from 6.8 per
cent in Q4:2019-20 to 10.2 per cent in Q1:2020-21 for
firms in the manufacturing sector15 and from 29.2 per
cent to 35.5 per cent for firms in the services sector16
(Chart II.20).
Manufacturing firms polled in the Reserve
Bank’s industrial outlook survey reported higher
input cost pressures during Q2:2020-21 owing to
supply shortages and transport delays (Chart II.21).
Salary outgoes, which fell in Q1 as firms reported
Chart II.19: Wage Growth (y-o-y) and Inflation in Rural Areas (y-o-y)
Sources: NSO; Labour Bureau; and RBI staff estimates.
13 Data for April 2020 could not be collected by the Labour Bureau due to the lockdown. Data collection remained constrained for May 2020 as well.14 The results hold for the common set of companies also: unit labour cost for common 1521 manufacturing firms increased from 6.9 per cent in Q4:2019-20 to 10.2 per cent in Q1:2020-21 and for common 543 services firms increased from 31.0 per cent to 38.0 per cent.15 Provisional estimate based on 1601 manufacturing firms16 Provisional estimate based on 613 services firms.
Chart II.21: Manufacturing Firms’ Cost Conditions based on Industrial Outlook Survey
Chart II.20: Labour Cost in Manufacturing and Services: Staff Cost Per Unit Value of Production
*: Listed companies with net worth more than Rs.5 billion were required to adopt the new accounting standards, ‘Ind-AS’, by Q1:2016-17 and rest of the listed companies by Q1:2017-18, as mandated by the Ministry of Corporate Affairs. The impact of the transition appears muted at the aggregate level in terms of growth rates, although the same may not hold for the ratios. The data may be accordingly read with appropriate caveats.
Note: ‘Net response’ is the difference between the percentage of respondents reporting increase in prices and those reporting decrease.Sources: Reserve Bank’s Industrial Outlook Survey; and RBI staff estimates.Sources: Capitaline database; and RBI staff estimates.

43
OCTOBER 2020Monetary Policy Report
RBI Bulletin October 2020
contraction in the level of employment, rose in Q2
and are expected to increase further in Q3. The cost of
finance remained subdued. Reflecting cost pressures,
selling prices edged up in Q2 and are expected to
firm up further in Q4 and Q1:2021-22. Households’
inflation expectations, as polled in the September
2020 round of the Reserve Bank’s survey, remained
elevated but eased modestly over the three-months
ahead horizon.
Manufacturing as well as services firms polled
for the purchasing managers’ index (PMI) reported
sharp declines in both input cost and selling prices
during Q1:2020-21. In August-September 2020, input
prices for the manufacturing firms registered an
uptick as raw material costs, particularly for iron and
steel, rose. Output prices, however, remained tepid
and broadly stabilised in September after declining
for five months in a row. For services firms, higher
fuel and food prices pushed up input costs during
Q2:2020-21, leading to a soft uptick in selling prices
in August-September.
II.4 Conclusion
Inflationary pressures have firmed up in H1 on
supply shocks and cost push pressures brought about
by COVID-19. In this situation, proactive supply side
management holds the key to containment of price
pressures within broader supply side reforms. Timely
and adequate release of cereal stocks including
sales, meeting shortfalls in the availability of pulses
through imports, rationalisation of the import duty
structure for pulses and for edible oils for which
around two-thirds of domestic demand is met by
imports, steps to fully restore supply chains for
poultry, goat and sheep, and adequate procurement
and buffer stocks for stabilisation of vegetables
prices, particularly key vegetables like onions and
potatoes are the main elements of this approach.
Furthermore, the high level of taxes on petroleum
products needs to be revisited to ameliorate cost
push pressures as the economy recovers. Effective
supply side interventions and the presence of large
favourable base effects are expected to bring about
a moderation in inflation in H2:2020-21 but the
uncertainties surrounding the COVID-19 trajectory
pose substantial risks to the outlook. In absence
of sufficient supply-side responses, the risk of cost
push pressures translating to a generalised increase
in inflation and its persistence is a serious threat to
the evolving macroeconomic outlook.

44
Monetary Policy Report OCTOBER 2020
RBI Bulletin October 2020
After an unprecedented decline in fixed investment, private consumption and exports in Q1:2020-21, aggregate demand recorded sequential improvement in Q2 on the back of robust rural demand and some uptick in urban consumption. On the supply side, the steep decline in manufacturing and plummeting construction activity in Q1 was followed by a gradual easing of contraction in Q2.
In the period following the release of the
April 2020 MPR, economic activity plunged into
a contraction in Q1:2020-21 that is unparalleled
in India’s history. The combined impact of
demand compression and supply disruptions
has produced an unprecedented decline in fixed
investment, private consumption and exports.
Government expenditure, including in the form
of counter-pandemic measures, has cushioned the
deterioration. Without it, the downturn would have
been even deeper. On the supply side, the stringent
nation-wide lockdown, social distancing norms
and the mass exodus of migrant workers led to a
steep decline in manufacturing and plummeting
construction activity. Trade and transportation went
down to a fraction of their pre-COVID-19 levels.
Credit conditions also remained muted. The only
silver lining was the resilience of agriculture and
allied activities on the back of record production of
rabi and horticulture crops in 2019-20. The bountiful
and widespread southwest monsoon in the 2020
season and higher kharif sowing have brightened
the outlook for rural consumption. With the gradual
unlocking of the economy from May/June 2020,
signs of stabilisation appeared but the resurgence
of infections especially in the interior part of the
country levelled them off in July. High frequency
indicators exhibited signs of some recovery again in
August, which strengthened in September 2020.
III.1 Aggregate Demand
The August 2020 data release of the National
Statistical Office (NSO) revealed that aggregate
demand measured in terms of year-on-year changes
in real gross domestic product (GDP) underwent a
contraction of 23.9 per cent in Q1:2020-21, taking
GDP to its lowest in the history of the quarterly series
(Table III.1 and Chart III.1a). As reflected in quarter-
on-quarter (q-o-q) seasonally adjusted annualised
rates (SAAR) of GDP, this was essentially a cliff effect
embodied in a sudden and steep drop in momentum
Table III.1: Real GDP Growth(y-o-y, per cent)
Item 2018-19 2019-20 Weighted Contribution*
2018-19 (FRE) 2019-20 (PE) 2020-21
(FRE) (PE) 2018-19 2019-20 Q1 Q2 Q3 Q4 Q1 Q2 Q3 Q4 Q1
1. Private final consumption expenditure 7.2 5.3 4.0 3.0 6.7 8.8 7.0 6.2 5.5 6.4 6.6 2.7 -26.7
2. Government final consumption expenditure 10.1 11.8 1.0 1.2 8.5 10.8 7.0 14.4 6.2 14.2 13.4 13.6 16.4
3. Gross fixed capital formation 9.8 -2.8 3.0 -0.9 12.9 11.5 11.4 4.4 4.6 -3.9 -5.2 -6.5 -47.1
4. Exports 12.3 -3.6 2.4 -0.8 9.5 12.5 15.8 11.6 3.2 -2.2 -6.1 -8.5 -19.8
5. Imports 8.6 -6.8 2.0 -1.6 5.9 18.7 10.0 0.8 2.1 -9.4 -12.4 -7.0 -40.4
GDP at market prices 6.1 4.2 6.1 4.2 7.1 6.2 5.6 5.7 5.2 4.4 4.1 3.1 -23.9
FRE: First Revised Estimates; PE: Provisional Estimates.*: Component-wise contributions to growth do not add up to GDP growth in the table because change in stocks, valuables and discrepancies are not included.Source: National Statistical Office (NSO).
III. Demand and Output

45
OCTOBER 2020Monetary Policy Report
RBI Bulletin October 2020
in that quarter (Chart III.1b). Moreover, excluding
the support from government expenditure, real GDP
would have slumped by 29.3 per cent.
In Q2, aggregate demand recorded sequential
improvement on the back of robust rural demand
and some uptick in urban consumption. Indicators
of rural demand, viz., tractor sales, fertilisers
production and non-durable consumer goods, have
exhibited resilience. Amongst indicators of urban
demand, passenger vehicles sales emerged out of
contraction in August. The contraction in production
of consumer durables is still high. We can not say
that a revival has taken place, while domestic air
passenger traffic trailed below pre-COVID levels. In
Q2, investment remained subdued, as reflected in
coincident indicators – steel consumption; cement
production; and production and imports of capital
goods. The record issuance of corporate bonds in
H1:2020, however, suggests financing conditions
remain congenial for enabling traction in investment
appetite. Although government expenditure
tapered off in August after robust growth in July,
it strengthened in later part of September with
additional support from supplementary demands of `1.67 lakh crore by the central government.
Nowcasting – the prediction of the present or the very near future of the state of the economy – has become popular among central banks in the face of long lags and frequent revisions in official measures of economic activity. Historically, nowcasting techniques have been based on simplified heuristic approaches, but more recently, they rely on statistical approaches to produce predictions that eliminate the need for informal judgement. Nowcast models can exploit information from a large quantity of data series at different frequencies and with different publication lags to extract signals from noise on economic activity1. Methods based on social media content have also been developed to estimate hidden sentiment analysis on the 'mood' of a population. Regression-based approaches, mixed data sampling, Bayesian approaches and dynamic factor models are now being employed to improve the forecasting power of nowcasting models.
Chart III.1: GDP Growth, its Constituents and Momentum
Note: SAAR - Seasonally adjusted annualised rate. Sources: NSO, Government of India; and RBI staff estimates.
a: Weighted Contribution of the Components to GDP Growth
b: GDP Growth and its Momentum
1 Banbura, M., Giannone, D., Modugno, M., and Reichlin, L. (2013), “Now-casting and the real-time data flow”, European Central Bank (ECB), Working Paper No. 1564.
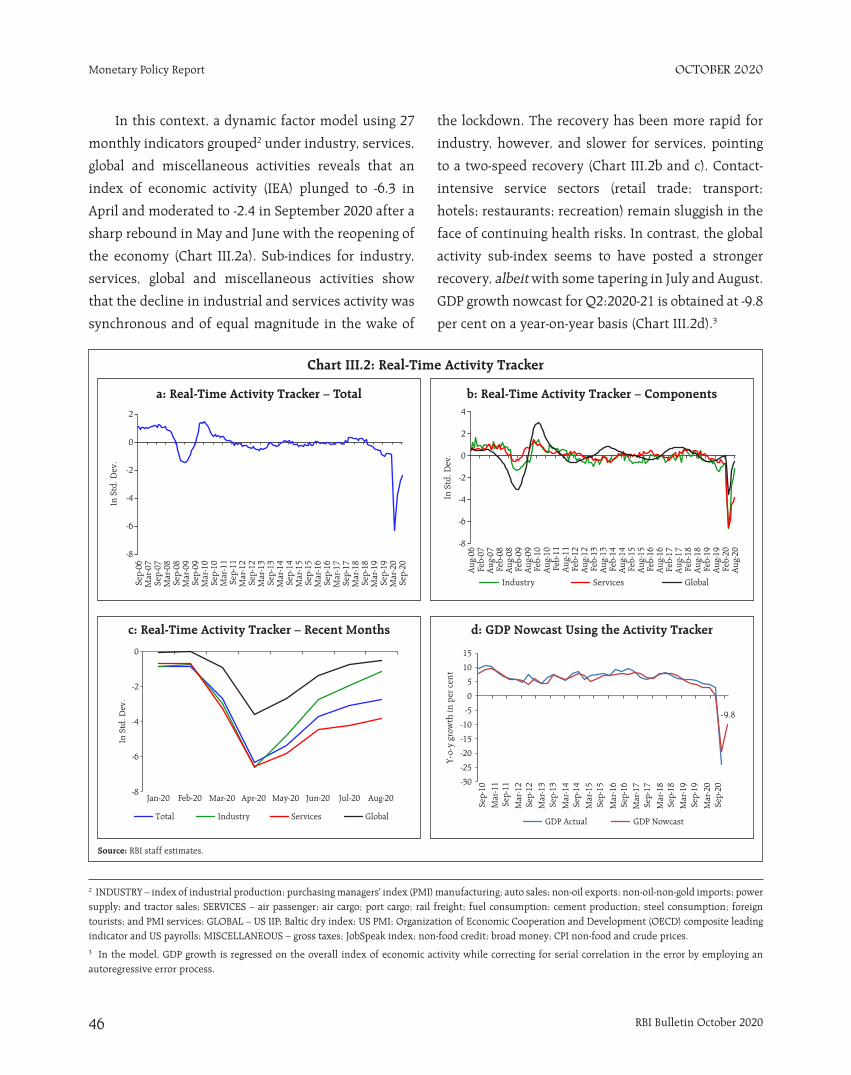
46
Monetary Policy Report OCTOBER 2020
RBI Bulletin October 2020
In this context, a dynamic factor model using 27
monthly indicators grouped2 under industry, services,
global and miscellaneous activities reveals that an
index of economic activity (IEA) plunged to -6.3 in
April and moderated to -2.4 in September 2020 after a
sharp rebound in May and June with the reopening of
the economy (Chart III.2a). Sub-indices for industry,
services, global and miscellaneous activities show
that the decline in industrial and services activity was
synchronous and of equal magnitude in the wake of
the lockdown. The recovery has been more rapid for
industry, however, and slower for services, pointing
to a two-speed recovery (Chart III.2b and c). Contact-
intensive service sectors (retail trade; transport;
hotels; restaurants; recreation) remain sluggish in the
face of continuing health risks. In contrast, the global
activity sub-index seems to have posted a stronger
recovery, albeit with some tapering in July and August.
GDP growth nowcast for Q2:2020-21 is obtained at -9.8
per cent on a year-on-year basis (Chart III.2d).3
Chart III.2: Real-Time Activity Tracker
Source: RBI staff estimates.
a: Real-Time Activity Tracker – Total
c: Real-Time Activity Tracker – Recent Months
b: Real-Time Activity Tracker – Components
d: GDP Nowcast Using the Activity Tracker
2 INDUSTRY – index of industrial production; purchasing managers' index (PMI) manufacturing; auto sales; non-oil exports; non-oil-non-gold imports; power supply; and tractor sales; SERVICES – air passenger; air cargo; port cargo; rail freight; fuel consumption; cement production; steel consumption; foreign tourists; and PMI services; GLOBAL – US IIP; Baltic dry index; US PMI; Organization of Economic Cooperation and Development (OECD) composite leading indicator and US payrolls; MISCELLANEOUS – gross taxes; JobSpeak index; non-food credit; broad money; CPI non-food and crude prices. 3 In the model, GDP growth is regressed on the overall index of economic activity while correcting for serial correlation in the error by employing an autoregressive error process.
-9.8
-30
-25
-20
-15
-10
-5
0
5
10
15
Y-o
-ygr
owth
inpe
rce
nt
GDP Actual GDP Nowcast
Sep-
10M
ar-1
1Se
p-11
Mar
-12
Sep-
12M
ar-1
3Se
p-13
Mar
-14
Sep-
14M
ar-1
5Se
p-15
Mar
-16
Sep-
16M
ar-1
7Se
p-17
Mar
-18
Sep-
18M
ar-1
9Se
p-19
Mar
-20
Sep-
20

47
OCTOBER 2020Monetary Policy Report
RBI Bulletin October 2020
Nowcasting exercises offer rich scope of
refinement to enhance predictive efficiency by
augmenting existing models with spatial and real-time
indicators on a daily basis that are becoming available,
including through the application of machine learning
tools, web scraping and artificial intelligence (Box III.1).
4 https://www.philadelphiafed.org/research-and-data/regional-economy/indexes/coincident5 https://www.newyorkfed.org/research/policy/weekly-economic-index#/6 In the DFM, the N variables (i = 1, …, N) are assumed to be the sum of two unobservable orthogonal components, viz. common factors for the set of variables (yit), and an idiosyncratic component (zit) at each time period t = 1,…T. The component (yit) is obtained by extracting r common factors (Fjt), j = 1,…, r from all variables in the data set while the idiosyncratic component (zit) covers the shocks specific to each variable. Thus, a dynamic factor model can be represented as: xit = λi1F1t + ….. + λirFrt + zit
where λij for i = 1, … , N and j = 1,…, r, are factor loadings relating the data xit to r latent common factors.
Indicators with monthly frequency such as electricity consumption, industrial activity, automobile sales, cargo handling and air passenger traffic are used to monitor economic activity in normal times. In a pandemic environment, however, monitoring economic activity in real time becomes critical to draw appropriate inferences for nimble-footed policy decisions. In this context, coincident indices (CIs) based on high frequency data have been employed by combining indicators over time and space (Federal Reserve Bank of Philadelphia4 and Federal Bank of New York5).
In the Indian context, a CI is constructed with four indicators representing a mix of demand and supply dynamics and based on availability of data at daily frequency at the state level: (i) total vehicle registrations
Box III.1: Real-Time Economic Activity Index
[Vahan dashboard of Ministry of Road Transport &
Highways (MoRTH), Government of India]; (ii) electricity
consumption (Power System Operation Corporation
Limited); (iii) air quality index (Central Pollution Control
Board); and iv) Google and Apple mobility data. Y-o-Y
growth in these indicators, standardised with the year
2019 as base, reflect movements in consumer demand,
activity in trade and transportation, commercial and
industrial activity, agricultural and domestic energy
demand, manufacturing activity and movements of the
labour force. The choice of states for the construction of
the CI is largely based on data availability. Accordingly,
data from 14 states were used, accounting for 81 per cent
of total national GVA. A dynamic factor model (DFM)6 is
applied using the factor analyser module of Python.
Source: RBI staff estimates. (contd.)
Chart III.1.1: Real-Time Momentum Indicator of Economic Activity 2020: Region-wise
a: Northern Region b: Eastern Region
Wee
k38Wee
k38

48
Monetary Policy Report OCTOBER 2020
RBI Bulletin October 2020
c: Southern Region d: Western Region
Source: RBI staff estimates.
The CI shows that all regions experienced sharp fall in the cyclical component of economic activity in April before registering a slow recovery in the following months. The northern region registered positive momentum from mid-June but lost steam in the second half of August before gaining traction again in September. On the other hand,
western and southern regions have experienced a fall in the momentum in the September after registering some signs of recovery.
An All-India CI, constructed as a weighted average of state CIs by using the share of states in overall GVA as weights (Chart III.1.2), captures the collapse in activity in Q1 and a hesitant recovery in ensuing months with the gradual opening of the economy.
References:
Crone, T. (2004), “A Redefinition of Economic Regions in the U.S.”, Federal Reserve Bank of Philadelphia Working Paper No. 04-12.
Osborne, J. W., Costello, A. B., & Kellow, J. T. (2008), "Best Practices in Exploratory Factor Analysis", In J. W. Osborne (Ed.), Best Practices in Quantitative Methods, Thousand Oaks, CA: Sage Publishing.
Stock, J. H., & Watson, M. W. (1998, April), “Business Cycle Fluctuations in US Macroeconomic Time Series.”, NBER Working Paper 6528.
III.1.1 Private Final Consumption Expenditure (PFCE)
Private consumption, with a share of around
55 per cent in GDP, is the mainstay of aggregate
demand. The destruction of consumption demand
by COVID-19 can be gauged from the sheer
decline in nominal expenditure on private final
consumption in Q1:2020-21– it fell by a third
to `21.7 lakh crore from its pre-COVID level of
`32.5 lakh crore recorded in Q3:2019-20 ahead of the
onset of the coronavirus in the world. In Q2:2020-21,
Chart III.1.2: Real-Time Momentum Indicator of Economic Activity 2020: All India
All-India CI
Wee
k38
Wee
k38
Wee
k38

49
OCTOBER 2020Monetary Policy Report
RBI Bulletin October 2020
there were signs of recovery in private consumption
in terms of high frequency indicators, but it is far
from gaining full and broad-based traction in the
face of rising infections as lockdowns are hesitantly
eased.
Drilling down into underlying dynamics of PFCE,
it is found that though the retrenchment occurred
across constituents, the contraction in private
consumption seems to have been more pronounced
in urban areas. Illustratively, domestic air passenger
traffic and production of consumer durables remained
dormant during the entire period of the lockdown
(Chart III.3a & b). Turning to Q2, the recovery in
this segment that became evident in May 2020 has
been tepid. Although passenger vehicles sales and
production of consumer durables have shown a better
revival relative to domestic air passenger traffic in July
and August, they still trail below pre-COVID levels.
The subdued movements in household credit in the
form of credit card outstanding, vehicle loans and
other personal loans corroborates the muted state of
urban consumption (Chart III.4).
Indicators of rural demand reveal a relatively better
picture. The production of consumer non-durables and
sales of tractors, for instance, exhibited robust growth
from June onwards (Chart III.5a and b). Rainfall in the
current monsoon season has been 9 per cent above the
long period average (LPA) (till September 30), which
should augur well for the prospects of rural income and
demand. This is also reflected in accelerated growth in
fertilisers production and progress of kharif sowing.
The increasing spread of COVID-19 infections into
smaller towns and rural areas, however, imparts some
Chart III.4: Household Credit – YoY Growth
Source: RBI.
Chart III.3: High Frequency Urban Demand Indicators
Sources: Directorate General of Civil Aviation; Society of Indian Automobile Manufacturers (SIAM); NSO; and RBI.
a: Urban Demand Indicators Index Seasonally Adjusted (Feb 2020=100)
b: Urban Demand Indicators – YoY Growth

50
Monetary Policy Report OCTOBER 2020
RBI Bulletin October 2020
uncertainty to the outlook, with implications for public
health infrastructure in these areas. A priority,
therefore, is to build on the government’s relief
package and offset reduction in remittance flows to
rural households post the exodus of migrant workers
by actions that restore jobs and livelihood.
III.1.2 Gross Fixed Capital Formation (GFCF)
Investment, which was already in contraction
mode since Q2:2019-20, suffered a massive knock-on
effect from the pandemic. Fixed investment shrank
by 47.1 per cent in Q1:2020-21, taking its share in
aggregate demand down to 22.3 per cent from 32 per
cent year ago. In Q2, the investment climate remained
subdued. Still muted consumption demand and
excess capacity are holding back new investments,
despite easing of financial conditions. Investment in
dwellings, other buildings and structures, dropped
precipitously under the weight of a confluence of
factors working in tandem, viz., large inventory
overhang in housing, tapering of incomes and hence,
EMI-servicing capacity, and high stress in the balance
sheets of non-banking finance companies (NBFCs)
and housing finance companies (HFCs). This is also
reflected in proximate coincident indicators – steel
consumption; cement production; and production
and imports of capital goods (Chart III.6).
As per the order books, inventories and capacity
utilisation survey (OBICUS) of the Reserve Bank,
capacity utilisation (CU) in the manufacturing sector
declined sharply to 48.2 per cent in Q1:2020-21 from
Chart III.5: High Frequency Rural Demand Indicators
Sources: Society of Indian Automobile Manufacturers (SIAM); NSO; and RBI.
a: Rural Demand Indicators Index Seasonally Adjusted (Feb 2020=100)
b: Rural Demand Indicators – YoY Growth
Chart III.6: Indicators of Investment Demand
Sources: NSO; and DGCI&S, Government of India.

51
OCTOBER 2020Monetary Policy Report
RBI Bulletin October 2020
68.2 per cent in the previous quarter on a seasonally
adjusted basis (Chart III.7). Manufacturing firms
responding to the Reserve Bank’s industrial outlook
survey expect domestic demand to recover gradually
from Q2:2020-21 and to sustain through Q1:2021-22.
Meanwhile, a favourable configuration is forming
to support a revival in investment appetite. Domestic
financial conditions have eased substantially, with
systemic liquidity in large surplus and a significant
narrowing of spreads on all financial instruments,
irrespective of ratings, spurring a record issuance
of corporate bonds in H1:2020 relative to a year
ago. Even though bank lending remains lacklustre,
especially to large, medium and small industries, the
mandated linking of interest rates on new floating
rate loans to external benchmarks for select sectors
has improved transmission of changes in policy
rates to banks’ lending rates (Chapter IV). Among the
emerging risks, a decrease in the interest coverage
ratio, indicating falling debt servicing capacity, could
weigh on investment going forward (Chart III.8).
III.1.3 Government Final Consumption Expenditure
(GFCE)
In recent years, government expenditure has
counter-cyclically supported aggregate demand as
evident in a growth of 16.4 per cent in government
final consumption expenditure (GFCE) in Q1:2020-
21. In Q2, the overall fiscal stimulus of around 10
per cent of GDP to support vulnerable sections of
the population continues to play out, providing
direct and indirect fiscal support to the economy.
Furthermore, speedier implementation of the
National Infrastructure Pipeline (NIP), which involves
an investment of around `111 lakh crore by 2025
in various projects with participation of central
government, state governments and the private sector,
could boost overall investment spending (Chart III.9).
Government finances have come under stress due
to a sharp fall in revenues. The central government’s
gross fiscal deficit (GFD) and revenue deficit (RD)
stood at 109.3 and 121.9 per cent of BE, respectively,
Chart III.8: Interest Coverage Ratio in Manufacturing and Services Firms
Note: The result of Q1:2020-21 is based on 1,601 listed private manufacturing companies and 613 listed private non-finacial services companies.Source: RBI staff estimates.
Chart III.7: Capacity Utilisation in Manufacturing
Source: RBI.
45
50
55
60
65
70
75
80
Q1 Q2 Q3 Q4 Q1 Q2 Q3 Q4 Q1 Q2 Q3 Q4 Q1 Q2 Q3 Q4 Q1
2016-17 2017-18 2018-19 2019-20 2020-21
Per
cent
CU CU_SA Long-term average

52
Monetary Policy Report OCTOBER 2020
RBI Bulletin October 2020
Chart III.9: Projected Sector-wise Expenditure under National Infrastructure Pipeline 2020-25
Source: Department of Economic Affairs, Ministry of Finance, Government of India.
during April-August 2020-21 (Table III.2). This has led
to some expenditure reprioritization. Accordingly,
expenditure rationalisation measures have been
stipulated for the ministries during Q1-Q3 to curb
avoidable outgoes. The central government, however,
sought parliament’s nod for net additional spending of
`1.67 lakh crore in 2020-21. On the other hand, states’
expenditure has not shown any significant pick-up so
far remaining broadly in line with budget estimates.
This could be attributed to the curtailment of some
revenue expenditure by various state governments
[e.g., dearness allowances (DA) freeze; deferment of
part of full salary and wages; deduction of salary].
Going ahead, the contribution of government
expenditure could taper as revenue shortfalls stretch
the finances of both the central government and state
governments.
The central government’s revenue receipts were
impacted during April-August 2020 by large declines
in both direct and indirect tax collections (Table III.3)
in all categories except union excise duties which
were supported by increases in taxes on petroleum
products. The decline in customs duty collections
mirrored the ongoing contraction in imports. Total
GST collections were severely hit by the lockdown
during April-May 2020 but recovered partly during
June-September 2020 (Chart III.10).In September GST
collections were recorded at ` 95 thousand crore.
During April-August 2020, the central government’s
revenue expenditure received a boost from increased
agricultural, rural, and defence spending, while
there were lower outgoes on major subsidies (food,
fuel and fertilizers). Capital expenditure registered a
Table III.2: Budgetary Position of the Central Government during April-August 2020-21Item (` thousand crore) (Per cent)
Budget Estimates Actuals Percent to BE Growth Rate
2019-20 2020-21 Apr-Aug Apr-Aug Apr-Aug Apr-Aug Apr-Aug Apr-Aug
2019 2020 2019 2020 2019 2020
1. Revenue Receipts 1,963 2,021 603 371 30.7 18.3 29.8 -38.6
2. Tax Revenue (Net) 1,650 1,636 405 284 24.5 17.4 10.5 -29.7
3. Non-Tax Revenue 313 385 199 86 63.4 22.4 102.0 -56.6
4. Non-Debt Capital Receipts 120 225 18 7 15.2 3.0 21.6 -63.5
5. Total Receipts (1+4) 2,083 2,246 621 377 29.8 16.8 29.6 -39.3
6. Total Expenditure (7+8) 2,786 3,042 1,175 1,248 42.2 41.0 9.8 6.2
7. Revenue Expenditure 2,448 2,630 1,039 1,113 42.5 42.3 10.7 7.1
8. Capital Expenditure 339 412 136 134 40.2 32.6 3.0 -1.3
9. Revenue Deficit (7-1) 485 609 436 743 89.9 121.9 -8.1 70.3
10. Fiscal Deficit (6-5) 704 796 554 870 78.7 109.3 -6.3 57.1
11. Gross Primary Deficit 43 88 335 633 773.4 717.9 -10.0 89.0
Source: Controller General of Accounts.

53
OCTOBER 2020Monetary Policy Report
RBI Bulletin October 2020
Table III.3: Central Government’s Tax CollectionItem ` thousand crore Per cent
Budget Estimates Actuals Percent to BE Growth Rate
2019-20 2020-21 Apr-Aug 2019 Apr-Aug 2020 Apr-Aug 2019 Apr-Aug 2020 Apr-Aug 2019 Apr-Aug 2020
A. Direct Taxes 1,335 1,319 281 187 21.0 14.2 9.4 -33.3
Of which
1. Corporation Tax 766 681 111 65 14.5 9.5 4.6 -41.8
2. Income Tax 556 625 166 118 29.8 18.8 13.2 -28.9
B. Indirect Taxes 1,126 1,104 380 316 33.7 28.6 0.7 -16.8
Of which
1. Total GST 666 694 240 182 36.0 26.3 1.0 -23.9
2. Custom Duties 156 138 62 32 39.8 23.4 16.5 -47.9
3. Union Excise Duties 300 267 76 100 25.3 37.6 -6.6 32.0
C. Gross Tax Revenue 2,461 2,423 661 504 26.8 20.8 4.2 -23.7
D. Assignment to States/UTs 809 784 256 218 31.6 27.8 -4.4 -14.7
E. Net Tax Revenue 1,650 1,636 405 284 24.5 17.4 10.5 -29.7
Source: Union Budget Documents and Controller General of Accounts.
contraction of 1.3 per cent in this period (Chart III.11).
Over 75 per cent of the capital expenditure was
incurred by the ministries of defence, railways, and
road transport and highways. With the continuing
decline in private investment, a step-up in government
capital expenditure could perform the twin roles of
gap-fill and potential crowding-in.
Several states had presented their budgets before the onset of the pandemic, which implies substantial revisions as the year progresses. States’ own tax revenue as well as central transfers have been adversely impacted, while pandemic-related expenditure has been heavy. In this context, the additional borrowings limits for states of up to 2 per cent of gross state domestic product (GSDP) or `4.28 lakh crore, partly linked to specific reforms7, can expand their total borrowing during 2020-21. Most states may be able to meet the first two specified reforms (viz., one-nation-one-ration-card and ease of doing business), which would allow them to borrow up to 4.0 per cent of GDP, on an average. The central government is also working out modalities to compensate states with respect to the expected shortfall of compensation
cess during 2020-21.
7 It is stipulated that relaxations in borrowings limits will be partly unconditional and partly conditional to carrying out specified actions, namely 1) universalisaton of the one-nation-one-ration card system 2) ease of doing business reforms; 3) power sector reforms 4) urban local body/ utility reform: out of the 2 per cent increase, the first 0.5 per cent will be unconditional while the next 1 per cent will be divided into four equal tranches of 0.25 per cent each, with each tranche linked to reform actions in above four areas. The last 0.5 per cent of the extra borrowing will be allowed to states if milestones are completely achieved in at least three out of four reform areas.
Chart III.10: Month-wise GST Collections
Source: Press Information Bureau.
20
30
40
50
60
70
80
90
100
110
120
Apr
May Jun Jul
Aug
Sep
Oct
Nov Dec Jan
Feb
Mar
�th
ousa
ndcr
ore
2018-19 2019-20 2020-21

54
Monetary Policy Report OCTOBER 2020
RBI Bulletin October 2020
Given the stress on state finances, the Reserve
Bank increased ways and means advances (WMA)
limits by 60 per cent over and above the level as
on March 31, 2020, which has been extended for
a further period of 6 months till March 31, 2021.
Rules governing withdrawals from the Consolidated
Sinking Fund (CSF) scheme were relaxed to enable
them to meet a larger proportion of their redemptions
from the CSF. Given the fact that capital expenditure
by states accounts for two-thirds of total capital
expenditure of general government, it is imperative
not to cut down capital expenditure in the coming
quarters if the revival in overall economic activity
has to be supported (Chart III.12 a and b).
The limit for WMA for the centre for the first
half of 2020-21 was revised upward to `2 lakh crore
from `1.2 lakh crore. Furthermore, Center's WMA
limit for H2:2020-21 has been kept higher at ̀ 1.25 lakh
crore vis-a-vis ̀ 35,000 crore in the same period of last
year. Moreover, limits for foreign portfolio investment
in government securities have been expanded
and a fully accessible route has been introduced
for investment by non-residents in government
securities without any limit. As at end-September,
`7.66 Lakh crore or 63.8 per cent of the revised
gross market borrowings of the central government
for the full year 2020-21 has been completed
(Table III.4). The central government’s market
borrowing calender for H2 has planned gross
issuances of `4.34 Lakh crore, sticking to the
revised estimate of `12 Lakh crore for the full fiscal
Chart III.11: Revenue and Capital Expenditure during (April-August)
Source: Controller General of Accounts.
15
20
25
30
35
40
45
5020
14-1
5
2015
-16
2016
-17
2017
-18
2018
-19
2019
-20
2020
-21
Per
cent
to B
E
Revenue Expenditure Capital Expenditure
Chart III.12: Capital Expenditure by States
a: Capex cut by States vis-a-vis Budgeted b: Capital Expenditure in 2019-20 (PA)
Sources: Budget Documents of State Governments, Comptroller Auditor General of India and RBI.
0
20
40
60
80
100
120
And
hra
Prad
esh
Chh
atti
sgar
hG
ujar
atH
arya
naJh
arkh
and
Kar
nata
kaK
eral
aM
adhy
a Pr
ades
hM
ahar
asht
raM
anip
urM
egha
laya
Miz
oram
Nag
alan
dO
disa
Punj
abR
ajas
than
Sikk
imTa
mil
Nad
uTe
lan
gana
Trip
ura
Utt
ar P
rade
shU
ttar
akha
ndW
est
Beng
al
Per
cent
toBE
States

55
OCTOBER 2020Monetary Policy Report
RBI Bulletin October 2020
year. States completed gross market borrowings of
`3,53,596 crore during the year (up to September
30), comprising 115.8 per cent of the calendar for
H1:2020-21.
III.1.4 External Demand
In spite of the deterioration of external demand,
net exports contributed positively to aggregate
demand in Q1:2020-21, as imports contracted faster
than exports (Chart III.13).
India’s exports marked a turnaround and entered
positive territory in September after six months of
contraction, while imports declined for the seventh
consecutive month (Chart III.13a). In Q2, India’s
exports were US$ 73.7 billion and imports were US$
88.3 billion. Despite limited participation, India’s
merchandise exports were impacted by the massive
disruption in global value chains (GVCs) inflicted
Table III.4: Government Market Borrowings(` crore)
Item 2018-19 2019-20 2020-21 (up to Sep 30, 2020)
Centre States Total Centre States Total Centre States Total
Net borrowings 4,22,737 3,48,643 7,71,380 4,73,972 4,87,454 9,61,426 6,35,428 2,98,989 9,34,417
Gross borrowings 5,71,000 4,78,323 10,49,323 7,10,000 6,34,521 13,44,521 7,66,000 3,53,596 11,19,596
Sources: Government of India; and RBI staff estimates.
by COVID-19. Disaggregated data available for July-
August 2020 suggests that among non-oil exports,
the decline was pronounced in respect of gems and
jewellery, engineering goods, readymade garments
and electronic goods (Chart III.14a). On the other
hand, exports of drugs and pharmaceuticals, iron
ore and rice recorded robust growth due to increased
demand even during the pandemic, underlying their
innate resilience.
The decline in imports was broad-based. During
July-August, 25 out of 31 major commodity groups,
which accounted for 81 per cent of the import
basket, witnessed contraction (Chart III.14b). A steep
reduction in crude oil prices and lower domestic
demand for petroleum products led to a decline in
POL imports, while gold imports plunged with a slump
in domestic demand and high gold prices, although
a revival of investment demand for gold rekindled
Chart III.13: Growth in Merchandise and Services Trade
Sources: DGCI&S and RBI.
a: Merchandise Tradeb: Services Trade
-30
-20
-10
0
10
20
30
40
Q1
Q2
Q3
Q4
Q1
Q2
Q3
Q4
Q1
Q2
Q3
Q4
Q1
Jul-2
0
2017-18 2018-19 2019-20 2020-21
Y-o-
ygr
owth
inpe
rce
nt
Exports Imports

56
Monetary Policy Report OCTOBER 2020
RBI Bulletin October 2020
imports in August 2020. The decline in non-POL
non-gold imports in July-August 2020 was primarily
contributed by electronic goods, pearls, precious and
semi-precious stones, machinery and coal, coke and
briquettes.
The merchandise trade deficit had narrowed
substantially to US$ 9.0 billion in Q1:2020-21 from
US$ 49.2 billion a year ago with the first trade surplus
of US$ 0.8 billion after a gap of over eighteen years in
June 2020. The trade balance, however, turned into
deficit in Q2 (US$ 14.5 billion). The current account
balance, which had recorded a marginal surplus of
US$ 0.6 billion (0.1 per cent of GDP) in Q4:2019-20
after a gap of twelve years, posted a record surplus of
US$ 19.8 billion (3.9 per cent of GDP) in Q1:2020-21.
Invisible receipts moderated marginally in
Q1:2020-21, mainly due to a decline in inward
remittances on account of the global recession,
decline in crude oil prices and loss of employment
opportunities overseas. Notwithstanding the sharp
decline in travel receipts due to restrictions on tourist
arrivals and a few other categories of services, net
services receipts remained relatively stable due to
steady software earnings, which accounted for 48 per
cent of total services receipts in Q1:2020-21. Despite a
fall in the overall global IT spending, software exports
may remain relatively resilient with companies
focusing on digital workplace support, adoption of
cloud services and infrastructure modernisation in
the face of pandemic challenges. Net outgo on account
of investment and other income increased in Q1:2020-
21, with an uptick in dividend payments on foreign
equity and investment funds in India.
In the financial account, portfolio flows made
a gradual rebound with the renewal of risk-on
sentiment. Net FPI inflows stood at US$ 8.3 billion in
2020-21 (up to October 6) as compared with US$ 2.8
billion a year ago. While the equity segment recorded
inflows of US$ 11.1 billion as against outflows of US$
0.6 billion a year ago, in the debt segment (general
route), there were outflows of US$ 4.2 billion as
against inflows of US$ 3.4 billion a year ago. Under
the voluntary retention route (VRR), there were net
inflows of US$ 1.4 billion during the same period.
Net FDI flows moderated in April-July 2020 on the
back of higher repatriation relative to fresh equity
investments. Net ECBs to India recorded an outflow of
US$ 8.5 billion in April-August 2020 due to slowdown
in fresh disbursals and higher repayments, while net
flows under NRI deposits were higher than a year
ago. As on October 02, 2020, India’s foreign exchange
reserves stood at US$ 545.6 billion, equivalent to 15.9
Chart III.14: Relative Contribution to Exports and Import Growth
Sources: DGCI&S and CPB, Netherlands.
a: Relative Contribution: Exports Growth b: Relative Contribution: Imports Growth

57
OCTOBER 2020Monetary Policy Report
RBI Bulletin October 2020
months of imports, reflecting an increase of US$ 67.8
billion over the level at end-March 2020.
III.2 Aggregate Supply
Gross value added (GVA) at basic prices which
contracted in Q1:2020-21 (Table III.5) on a steep
downswing in industrial and services sectors, appears
to have stabilised. in Q2. The first advance estimates
of production of major kharif crops for 2020-21 placed
foodgrains production 0.8 per cent higher than last
year’s level. Coincident indicators of industry and
some indicators of services also suggest that the pace
of contraction is moderating in Q2.
III.2.1 Agriculture
Value added in agriculture and allied activities
improved on the back of higher production
of foodgrains and oilseeds. The fourth advance
estimates for 2019-20 released in August 2020 placed
foodgrains production at 2,966.5 lakh tonnes – 4.0
per cent higher than in the previous year – driven
by the rabi output (Table III.6). While rice and
wheat achieved record production levels for the
fourth consecutive year, coarse cereals and oilseeds
notched a record production level. Horticulture
crops achieved production of 3,195.7 lakh tonnes in
2019-20 (growth of 2.7 per cent), driven by
productivity growth (0.8 per cent) and increased area
under cultivation of vegetables (2.4 per cent) and
fruits (1.6 per cent) (Table III.6).
Table III.6: Agriculture ProductionItem Lakh tonnes Growth (%)
2018-19 2019-20 2019-20 over final estimate
2018-19
I. Total foodgrains 2,852.1 2,966.5 4.0
Rice 1,164.8 1,184.3 1.7
Wheat 1,036.0 1,075.9 3.9
Coarse cereals 430.6 474.8 10.3
Pulses 220.8 231.5 4.8
II. Commercial crops
Sugarcane 4,054.2 3,557.0 -12.3
Cotton 280.4 354.9 26.6
Oilseeds 315.2 334.2 6.0
III. Total Horticulture Crops 3,110.5 3,195.7 2.7
III.1 Total Fruits 979.7 1004.5 2.5
Banana 304.6 317.8 4.3
Citrus 134.0 140.3 4.7
Mango 213.8 205.3 -4.0
III.2 Total Vegetables 1,831.7 1,894.6 3.4
Onion 228.2 261.5 14.6
Potato 501.9 486.6 -3.0
Tomato 190.1 212.0 11.5
III.3 Plantation Crops 165.9 160.3 -3.4
III.4 Total Spices 95.0 97.5 2.7
III.5 Flowers and Aromatics 29.1 29.9 2.9
Source: Ministry of Agriculture and Farmers’ Welfare, Government of India.
Table III.5: Sector-wise Growth in GVA(y-o-y, per cent)
Sector 2018-19 (FRE)
2019-20 (PE)
Weighted Contribution
2019-20
2018-19 (FRE) 2019-20 (PE) 2020-21
Q1 Q2 Q3 Q4 Q1 Q2 Q3 Q4 Q1
Agriculture, forestry and fishing 2.4 4.0 0.6 3.8 2.5 2.0 1.6 3.0 3.5 3.6 5.9 3.4
Industry 4.5 0.8 0.2 7.8 4.7 4.4 1.4 3.8 -0.2 -0.4 0.0 -33.8
Mining and quarrying -5.8 3.1 0.1 -7.3 -7.0 -4.4 -4.8 4.7 -1.1 2.2 5.2 -23.3
Manufacturing 5.7 0.0 0.0 10.7 5.6 5.2 2.1 3.0 -0.6 -0.8 -1.4 -39.3
Electricity, gas, water supply and other utilities 8.2 4.1 0.1 7.9 9.9 9.5 5.5 8.8 3.9 -0.7 4.5 -7.0
Services 7.5 5.0 3.1 7.3 7.2 7.3 8.3 5.5 6.1 4.9 3.5 -24.3
Construction 6.1 1.3 0.1 6.4 5.2 6.6 6.0 5.2 2.6 0.0 -2.2 -50.3
Trade, hotels, transport, communication 7.7 3.6 0.7 8.5 7.8 7.8 6.9 3.5 4.1 4.3 2.6 -47.0
Financial, real estate and professional services 6.8 4.6 1.0 6.0 6.5 6.5 8.7 6.0 6.0 3.3 2.4 -5.3
Public administration, defence and other services 9.4 10.0 1.3 8.8 8.9 8.1 11.6 7.7 10.9 10.9 10.1 -10.3
GVA at Basic Prices 6.0 3.9 3.9 6.9 6.1 5.6 5.6 4.8 4.3 3.5 3.0 -22.8
FRE: First Revised Estimates; PE: Provisional Estimates.Source: NSO.

58
Monetary Policy Report OCTOBER 2020
RBI Bulletin October 2020
the sub-divisions received normal and above normal rainfall, the cumulative rainfall in North-West India remained 16 per cent below LPA (Chart III.15b). As on October 1, 2020, the live storage in major reservoirs was 87 per cent of the full reservoir level (FRL), marginally lower than previous year's level (88 per cent) but higher than decadal average of of 76 per cent (Chart III.15c).
Spurred by the progress of precipitation, kharif sowing also started on higher note in the month of June. Standing at 4.6 per cent higher than the full season normal area, the overall kharif acreage has set a new record as on September 25, 2020 (Chart III.15d). Accounting for 48.9 per cent of the overall kharif acreage, rice and pulses sowing were higher by 5.6 per cent and 4.1 per cent, respectively, over the previous year’s level which augurs well for foodgrains
The stock of cereals at the end of October 1, 2020 was 2.2 times the buffer norms for Q3:2020-21. Minimum support prices (MSPs) announced for various crops for the both kharif and rabi season were higher in the range of 2.1 per cent to 12.7 per cent than in the previous year and assured a return of at least 50 per cent over the cost of production (as measured by A2 plus FL) across all crops.
The 2020 southwest monsoon arrived on time and made rapid progress, covering the entire country by June 26, 2020, i.e., 12 days prior to the normal date. Notwithstanding a loss of momentum in the month of July, the monsoon revived subsequently, and the cumulative southwest monsoon rainfall stood at 9 per cent above the long period average (LPA) as on September 30, 2020 (Chart III.15a). As regards the spatial distribution, while 85 per cent of
Chart III.15: Progress of Rainfall and Kharif Sowing
Source: India Meteorological Department (IMD), Central Water Commission, and Ministry of Agriculture and Farmers' Welfare, Government of India.
a: Cumulative Weekly Progress of South-west Rainfall
c: Reservoir Level
b: Sub-division-wise Comparative Rainfall Position (June 1 to September 30)
d: Kharif Sowing Progress
-60
-40
-20
0
20
40
60
80
Wee
k 1
Wee
k 2
Wee
k 3
Wee
k 4
Wee
k 1
Wee
k 2
Wee
k 3
Wee
k 4
Wee
k 5
Wee
k 1
Wee
k 2
Wee
k 3
Wee
k 4
Wee
k 1
Wee
k 2
Wee
k 3
Wee
k 4
June July August September
Dev
iati
onfr
omLP
A (P
erce
nt)
2018 2019 2020
0
20
40
60
80
100
All India Northern Eastern Western Central Southern
Rese
rvoi
ras
per
cen
tofc
apac
ity
2019 2020 10 years average

59
OCTOBER 2020Monetary Policy Report
RBI Bulletin October 2020
availability. The first advance estimates of production
of major kharif crops for 2020-21 placed foodgrains
production at 1,445.2 lakh tonnes, 0.8 per cent higher
than last year’s level. Production of total kharif pulses
and oil seeds is estimated to be substantially higher
than in the previous year (Chart III.16).
High frequency indicators relating to the farm
sector also reflect a strong momentum. After a
dip in April, tractor sales improved sharply in the
Table III.7: High Frequency Indicators for Rural Economy (Per cent)
Items Growth Jan-20 Feb-20 Mar-20 Apr-20 May-20 Jun-20 Jul-20 Aug-20 Sep-20
Tractor sales y-o-y 4.8 21.3 -49.9 -79.4 4.0 22.4 38.5 74.7
Two wheeler sales y-o-y -16.1 -19.8 -39.8 0.0 -83.8 -38.6 -15.2 3.0
Fertliliser Sales y-o-y 48.2 13.8 -15.1 47.5 22.2 10.9 25.4 8.1
Demand for employment (MGNREGA) m-o-m 10.8 17.9 -6.6 -35.6 178.6 20.0 -28.6 -24.0 0.3
y-o-y -11.2 4.8 2.5 -37.2 48.9 74.2 73.6 66.6 71.1
Export - agri and allied sector y-o-y -5.5 1.4 -23.7 -26.4 -0.1 22.0 24.4 19.1
Agriculture credit (Outstanding) y-o-y 6.5 5.8 4.2 3.9 3.5 2.4 5.4
Stocks-cereals (ratio of actual stocks to quarterly buffer norms)
Rice 5.4 6.6 6.5 3.3 3.1 2.9 2.8 2.2 2.4
Wheat 2.2 2.0 1.8 4.8 7.5 7.4 2.0 1.7 2.1
Chart III.16: Kharif Production (2020-21)
Source: Ministry of Agriculture and Farmers' Welfare, Government of India.
subsequent months (Table III.7). Farm exports recorded a turnaround from June after experiencing contraction in the three preceding months. The demand for jobs under the Mahatma Gandhi National Rural Employment Guarantee scheme (MGNREGA) has surged, with a y-o-y growth of 74.2 per cent in June, although increased employment opportunities during the kharif sowing season and reverse migration to cities is also underway.
Under the Atmanirbhar Bharat Abhiyan Package, the government has announced measures to strengthen infrastructure logistics, capacity building, governance and administrative reforms for agriculture, animal husbandry, fisheries and food processing. These measures include 8 development schemes8 with fund allocation of `1.6 lakh crore. In addition, the government has also legislated three important governance and administrative reforms to attract private investments to the agriculture sector and make it competitive, viz., amendment of the Essential Commodities Act, and promulgation of the Farming Produce Trade and Commerce (Promotion and Facilitation) bill and Farmers (Empowerment and Protection) Agreement on Price Assurance and Farm Services bill. These measures represent long awaited reforms in the agriculture sector, and much hinges
around successful implementation.
8 Agriculture Infrastructure Fund, Promotion of Herbal Cultivation, Extension of Operation Greens to all fruits and vegetables (currently only for tomato, onion and potato), Formalisation of Micro Food Enterprises, PM Matasya Sampada Yojana, National Animal Disease Control Programme, National Animal Husbandry Infrastructure Development Fund and Scheme on Beekeeping.

60
Monetary Policy Report OCTOBER 2020
RBI Bulletin October 2020
III.2.2 Industry
Massive supply side disruptions due to COVID-19 and the ensuing lockdown resulted in industrial GVA contracting by 33.8 per cent during Q1:2020-21. (Chart III.18a). The fall was widespread across manufacturing and mining and quarrying activity (Chart III.17).
The index of industrial production (IIP) shrank by an unprecedented 35.5 per cent during Q1:2020-21. The extent of contraction in IIP, however, moderated in July, cushioned by electricity generation and this was also reflected in exclusion-based measures (Chart III.18b). On the other hand, the momentum gained in May, weakened in June and July due to re-imposition of lockdowns by some states (Chart III.18c).
In terms of the use-based classification, the contraction in Q1:2020-21 was dispersed across all categories (Chart III.18d).
Chart III.17: Weighted Contribution to Industrial GVA growth
Sources: NSO and RBI staff estimates.
Chart III.18: Index of Industrial Production (IIP)
Source: NSO; and RBI staff estimates.
a: IIP Index Seasonally Adjusted (Feb 2020=100)
c: IIP Base and Momentum
b: Exclusion-based IIP
d: Use-based Contribution to IIP Growth

61
OCTOBER 2020Monetary Policy Report
RBI Bulletin October 2020
Consumer non-durables production, however,
exhibited resilience and registered growth in June-
July on the back of increase in the output of essential
goods. Consumer durables fell substantially, with
auto components, two wheelers, passenger cars,
jewellery and textiles contributing the most to
the decline. Capital goods, already on a declining
trajectory since January 2019, plunged further
during Q1:2020-21 and recorded moderation in
contraction in July 2020, with commercial vehicles
contributing highest to the decline. A silver lining,
however, was provided by agricultural machinery,
tractors, and solar power, which recorded positive
growth.
Electricity generation also contracted during
Q1:2020-21 due to shrinking demand, although the
pace moderated considerably in May and June. Some
signs of recovery became evident in July-August 2020
as demand improved with the easing of the lockdown.
Hydro-electricity generation registered double-digit
growth in July but contraction in August. while
thermal power production remained in contraction
during July-August 2020 (Chart III.19).
Chart III.19: Electricity Generation and Demand Growth
Source: Central Electricity Authority.
Chart III.20: Nominal Sales Growth in Industrial and Services Sectors
Note: The result of Q1:2020-21 is based on 1,601 listed private manufacturing companies and 613 listed private non-finacial services companies.Source: RBI staff estimates.
Chart III.21: Components of Manufacturing GVA
Note: The result of Q1:2020-21 is based on 1,601 listed private manufacturing companies.Source: RBI staff estimates.
The contraction in manufacturing GVA in Q1:2020-
21 was mirrored in sales of manufacturing companies
(Chart III.20). Profit before taxes of manufacturing
firms also dropped substantially (Chart III.21). Only
IT companies maintained sales growth although at a
decelerating pace.

62
Monetary Policy Report OCTOBER 2020
RBI Bulletin October 2020
(Chart III.23a). Indicators of construction activity –
finished steel consumption and cement production
– bottomed out in April 2020, the month of complete
shutdown, and recovered in the following months,
albeit still in contraction on a year-on-year basis
(Chart III.23b).
Commercial vehicle sales – a lead indicator of
transportation services – contracted by 84.8 per
cent in Q1:2020-21. Vehicle registrations for July
and August, however, showed signs of sequential
improvement. Other indicators of transport segment
– rail freight traffic, cargo handled by major ports
and air cargo – registered sequential recoveries. Rail
freight posted growth for the second consecutive
month in September (Table III.8). Air passenger traffic,
both domestic and international, came to an abrupt
halt during April-May owing to restrictions on travel
and posted sluggish growth thereafter. The services
PMI sequentially improved to 49.8 in September 2020,
albeit remained in contraction zone reflecting subdued
domestic and tepid external demand (Chart III.22b).
The rural sector showed resilience, with robust sales
of tractors – a key agricultural machinery investment
– during May-August.
As regards the overall business environment, the
Reserve Bank’s business assessment index moved to
96.2 in Q2 (the 91st round of the industrial outlook
survey) from 55.3 – the lowest in the series starting
March 2000 after large deterioration in demand
conditions but it remained in contraction zone. The
business expectations index (BEI) also improved to
111.4 for Q4:2020-21 from 99.5 for Q3:2020-21. The
manufacturing purchasing managers’ index (PMI)
reached 56.8 in September, the highest reading since
January 2012, supported by accelerated increases in
new orders and production (Chart III.22a). Almost
one-third of manufacturers expect output growth
in the coming 12 months, as against 8 per cent that
foresee a contraction, resulting in the strongest degree
of overall optimism.
III.2.3 Services
In Q1:2020-21, COVID-19 brought major
services activities to a near halt and the sector
contracted in a broad-based manner by 24.3 per
cent as against a growth of 5.5 per cent a year ago.
Construction recorded the steepest decline (by
50.3 per cent), followed by trade, hotels, transport,
communication and services related to broadcasting
b: PMI Services
Chart III.22: PMI - India and Global
Note: >50: expansion, <50: contraction.Source: IHS Markit.
a: PMI Manufacturing

63
OCTOBER 2020Monetary Policy Report
RBI Bulletin October 2020
In Q1:2020-21, decline in private education,
health, entertainment and recreation activity led
to fall in public administration, defence and other
(PADO) services. Growth in revenue expenditure,
excluding interest payments and subsidies of
central government, was robust in Q1:2020-21
and upto July before it tapered off in August.
Supplementary demands of `1.67 lakh crore
Table III.8: Services Sector: High Frequency Indicators(YoY Growth in Per cent)
Sr. No. Indicator Jan-20 Feb-20 Mar-20 Apr-20 May-20 Jun-20 Jul-20 Aug-20 Sep-20
1 Transport
Commercial Vehicles Sales -14.0 -32.9 -88.1 -84.8
Passenger Vehicles Sales -6.2 -7.6 -51.8 -100 -85.3 -49.6 -3.9 14.2
Two-wheeler Sales -16.1 -19.8 -39.8 -100 -83.8 -38.6 -15.2 3.0
Tractor Sales 4.8 21.3 -49.9 -79.4 4.0 22.4 38.5 74.7
Railway Freight Traffic 2.8 6.5 -13.9 -35.3 -21.3 -7.7 -4.6 3.9 15.5
Port Freight Traffic 2.2 4.6 -5.3 -21.1 -23.3 -14.6 -13.2 -10.4 -1.9
Domestic Air Passenger Traffic 1.5 9.8 -32.9 -99.9 -97.4 -83.5 -82.6 -75.8
Domestic Air Cargo Traffic 0.8 1.7 -32.6 -92.8 -82.9 -48.0 -41.4 -36.0
International Air Passenger Traffic 0.2 -3.4 -56.2 -99.1 -98.0 -93.0 -90.4 -89.7
International Air Freight Traffic -2.9 -3.1 -31.7 -77.0 -58.2 -35.7 -30.1 -24.9
2 Communications
Telephone Subscribers Base -2.2 -2.0 -0.5 -1.2 -1.6 -2.2
Mobile/Wireless -2.2 -2.0 -0.4 -1.1 -1.6 -2.1
3 Construction
Cement Production 5.1 7.8 -25.1 -85.2 -21.4 -6.8 -13.5 -14.6
Steel Consumption 4.1 -6.5 -29.2 -85.5 -48.3 -28.3 -11.7 -16.5 -5.7
4 Financial services
Non-food Credit 8.5 7.3 6.7 7.3 6.8 6.0 5.4 5.5 5.3
Aggregate Deposits 9.9 9.0 7.9 9.9 10.6 11.0 11.1 10.9 10.5
5 Public Administration & Defence
Revenue Expenditure* -7.0 14.3 69.8 53.4 -26.4 97.7 24.4 -26.6
Chart III.23: Service Sector: Components and Construction Indicators
Sources: Office of Economic Adviser, Joint Plant Committee, Department of Industrial Policy & Promotion, Ministry of Commerce & Industry.
a: Service Sector Components b: Construction Indicators
*: excluding Interest payments and Subsidies.

64
Monetary Policy Report OCTOBER 2020
RBI Bulletin October 2020
Chart III.24: Housing Sector- Launches, Sales and Prices
Source: PropTiger and RBI staff estimates.
a: Housing Activity in India b: Housing Price Index
by the central government will support GVA in
PADO during Q2. GVA in financial, real estate and
professional services fell in Q1:2020-21 due to weak
performance of information technology companies
after closing down of businesses in travel, tourism
and hotel industries due to the pandemic. Real estate
companies also suffered due to subdued sales growth.
In financial services, bank credit growth decelerated
while deposits growth marginally improved during
May-September.
In residential real estate, both sales and new
launches contracted in Q1:2020-21, primarily due
to the lockdown and sluggish consumer sentiment,
leading to rise in inventory overhang (Chart III.24a).
The all-India housing price index of RBI decelerated
in Q1:2020-21. The sub-indices for Delhi contracted
substantially from the previous quarter while
that for Bengaluru registered a substantial growth
(Chart III.24b).
III.3. Conclusion
Available information suggests a gradual
recovery is under way with the re-opening of the
economy. While the rising number of COVID-19
infections continues to weigh on the near-term
outlook, private consumption may recover faster
than other components of aggregate demand with
a boost from rural demand on the back of bright
agricultural prospects. Private investment may,
however, take longer to stabilize, hamstrung by
low capacity utilisation, still subdued bank credit
and the global recession. The prospects for the
industrial sector hinge around the response to
the government’s initiatives, including Make in
India. The gamechanger would be public capital
spending, given its high multiplier effect. An early
containment of the pandemic should also speed
up the revival. The outlook for the services sector
also improved with activity gaining some momentum
in Q2.

65
OCTOBER 2020Monetary Policy Report
RBI Bulletin October 2020
During H1:2020-21, domestic financial markets returned to normalcy with a recovery in trading volumes, narrowing of spreads and rebounds in financial asset prices. Equity markets recovered strongly from panic sell-offs in March tracking global movements. The Indian rupee (INR) appreciated vis-à-vis the US dollar with the return of investor appetite for EME assets. In the credit market, transmission has improved considerably relative to the historical experience. Going forward, liquidity conditions would continue to be calibrated, consistent with the stance of monetary policy while ensuring normalcy in the functioning of financial markets and institutions and conducive financial conditions.
In Q2:2020-21, global financial markets have
stabilised after recovering from the tailspin during
February and March 2020. In more recent weeks,
sentiments have been intermittently dampened
by rising infections and geo-political tensions or
lifted by news on the progress on the vaccine. In
large measure, the calm in financial markets after
the turbulence in March has been engendered by
liquidity infusions, monetary policy actions by
central banks and stimulus measures undertaken
by national governments. Equity markets in major
advanced economies (AEs) and emerging market
economies (EMEs) have registered handsome gains
with the return of risk-on sentiments. Gold prices
surged to record highs in early August, but have been
range-bound more recently. Bond yields softened
and spreads narrowed in the wake of substantial
unconventional liquidity operations and strong
demand for safe assets; relative to other segments,
however, bond markets have moved sideways and in
a narrow range. In currency markets, the US dollar
depreciated markedly as fatalities increased amid
rising infection numbers and with signals from
the US Federal Reserve (FED) that monetary policy
would continue to remain accommodative for a long
period, reinforced by an average inflation targeting
framework allowing transitory target overshoot
to support maximum employment. Most EME
currencies have appreciated against a weakening
dollar and the return of capital flows after a hiatus.
IV.1 Domestic Financial Markets
During H1:2020-21, domestic financial markets returned to normalcy with a recovery in trading volumes, narrowing of spreads and rebounds in financial asset prices after a near collapse in market activity, post the imposition of the nation-wide lockdown to combat COVID-19. A slew of monetary, liquidity, credit easing and regulatory measures by the Reserve Bank of India (RBI) and the government’s stimulus package enthused market sentiment. Nevertheless, concerns about the duration of the pandemic, the large expansion in market borrowings by the public sector, border tensions and rising inflation prints intermittently kept markets on edge.
In money and bond markets, spreads compressed to below pre-COVID levels, spurring record corporate bond issuances. Equity markets recovered strongly from panic sell-offs in March tracking global movements. The Indian rupee (INR) initially came under pressure with the spread of the pandemic, but has subsequently appreciated vis-à-vis the US dollar with the return of investor appetite for EME assets. In the credit market, transmission has improved considerably relative to the historical experience, facilitated by large policy rate cuts, persisting abundance of liquidity and the introduction of the external benchmark system for the pricing of loans in select sectors. Bank credit growth has, however,
remained tepid.
IV. Financial Markets and Liquidity Conditions

66
Monetary Policy Report OCTOBER 2020
RBI Bulletin October 2020
IV.1.1 Money Market
Money markets have remained broadly stable
during H1:2020-21 due to proactive liquidity
management by the Reserve Bank. In the overnight
uncollateralised segment, the weighted average call
rate (WACR) – the operating target of monetary policy
– remained within the policy corridor although it
traded with a distinct downward bias, reflecting
the comfortable liquidity and financing conditions
(Chart IV.1).
In the call money segment, the weighted average
rate on traded deals persisted above rates on reported
deals.1 The share of reported deals increased to
57 per cent in May 2020 from 49 per cent in the
previous month due to increase in lending activity
by co-operative banks whose share increased to 68
per cent in May (Chart IV.2). The increasing share of
reported deals also contributed to pulling down the
WACR closer to the reverse repo rate in May 2020.
The share of reported deals moderated in September
(41 per cent) in tandem with reduced lending (58 per
cent) by co-operative banks.
The secured segments (triparty repo and market
repo) remained dominant in overnight money market
activity in H1:2020-21, with a share of more than 95 per
cent in total volumes (Chart IV.3). Within the secured
segment, market repos gained in turnover, reflecting
Chart IV.2: Share of Traded/Reported Deals in Call Money Market
Sources: Clearing Corporation of India Ltd. (CCIL); RBI.
1 ‘Traded deals’ are made directly on the negotiated dealing system (NDS)-Call platform whereas ‘reported deals’ are over-the-counter (OTC) transactions and reported on the NDS-Call platform after the deals are negotiated.
Chart IV.1: Policy Corridor and WACR
Source: Reserve Bank of India (RBI).
3.00
3.25
3.50
3.75
4.00
4.25
4.50
4.75
5.00
5.25
5.50
5.75
6.00
Per
cent
WACR Repo Reverse repo MSF
01-O
ct-1
9
15-O
ct-1
9
12-N
ov-1
9
10-D
ec-1
9
07-Ja
n-20
04-F
eb-2
0
03-M
ar-2
0
17-M
ar-2
0
14-A
pr-2
0
12-M
ay-2
0
09-Ju
n-20
07-Ju
l-20
04-A
ug-2
0
01-S
ep-2
0
30-S
ep-2
0
Chart IV.3: Share in Overnight Money Market Volumes
Sources: CCIL; RBI.

67
OCTOBER 2020Monetary Policy Report
RBI Bulletin October 2020
(i) increase in participant base and (ii) increased
lending by mutual funds. The shares of borrowings
by public sector banks in both the triparty repo and
market repo segments moderated in H1, while private
sector banks increased their share of borrowings in
the triparty repo segment.
Interest rates in the secured overnight segments
traded below the reverse repo rate in H1 reflecting
the surplus system liquidity conditions and
increased lending by mutual funds. As a result, the
spread between the collateralised rates and the
uncollateralised rate (WACR) widened (Chart IV.4):
the triparty repo rate and the market repo rate traded
below the WACR by 59 basis points (bps) and 58 bps,
respectively, in H1:2020-21 as against 36 bps and 37
bps, respectively, in H2:2019-20.
Interest rates on money market instruments such
as certificates of deposit (CDs), commercial papers
(CPs) and Treasury Bills (T-bills) of 3-month maturity
softened by 156 bps, 155 bps and 97 bps, respectively,
in H1:2020-21, reflecting the policy rate cuts and
liquidity augmenting measures. Fresh issuance of CDs
by banks moderated to `45,165 crore during H1:2020-
21 (up to September 11, 2020) from around `1.75 lakh
crore in the corresponding period of H1:2019-20 in
view of surplus liquidity and muted credit demand.
Aggregate CP issuances declined to `7.9 lakh crore
during H1:2020-21 from `11.9 lakh crore during
H1:2019-20 (Chart IV.5a), although corporates took
advantage of lower interest rates and increased their
share. The share of non-banking financial companies
(NBFCs) in CP issuances, which was low at the
Chart IV.4: Money Market Rates
Sources: RBI; CCIL: F-TRAC; CCIL: FBIL; and RBI staff estimates.
Chart IV.5: Primary Issuances of Commercial Paper
a: Systemic Liquidity, Issuances and WADR b: Institutional Break-up
Source: RBI; CCIL: F-TRAC; and RBI staff estimates.
0123456789
10111213
Per
cent
WACR Triparty repo Market repo
3-month CP 3-month CD 91-day T-bill
01-A
pr-1
9
13-M
ay-1
9
24-Ju
n-19
05-A
ug-1
9
16-S
ep-1
9
28-O
ct-1
9
09-D
ec-1
9
20-Ja
n-20
02-M
ar-2
0
13-A
pr-2
0
25-M
ay-2
0
06-Ju
l-20
17-A
ug-2
0
30-S
ep-2
0
8.04
3.79
4.22
3.5
4.5
5.5
6.5
7.5
8.5
-2,00,000
-1,00,000
0
1,00,000
2,00,000
3,00,000
4,00,000
5,00,000
6,00,000
Per
cent
�cr
ore
Average daily liquidity deficit (-) /surplus (+)
Issuance WADR (RHS)
Apr
-19
May
-19
Jun-
19Ju
l-19
Aug
-19
Sep-
19O
ct-1
9N
ov-1
9D
ec-1
9Ja
n-20
Feb-
20M
ar-2
0A
pr-2
0M
ay-2
0Ju
n-20
Jul-2
0A
ug-2
0Se
p-20

68
Monetary Policy Report OCTOBER 2020
RBI Bulletin October 2020
beginning of H1, increased sharply in September 2020
in response to the measures taken by the Government
to provide liquidity support to the non-bank lenders
through the special liquidity scheme and partial credit
guarantee scheme. The share of government owned
NBFCs, however, declined in September 2020 as they
preferred longer-term borrowings (Chart IV.5b).
IV.1.2 Government Securities (G-sec) Market
During H1:2020-21, yields on government
bonds moderated, with the 10-year paper softening
by 29 bps in response to the slew of conventional
and unconventional measures taken by the Reserve
Bank to enhance systemic liquidity and compress
term spreads. These measures headed off persistent
upward pressures on yields from the higher supply of
paper.
The hardening of yields at the beginning of
Q1:2020-21 was mitigated by liquidity augmenting
measures announced in the second half of April
and May (Section IV.3 provides details).2 With the
announcement of an enhancement of Central
Government market borrowings by about 54 per
cent – from `7.8 lakh crore to `12.0 lakh crore – for
2020-21, however, the benchmark yield rose by 20
bps on May 11, 2020. In June, several factors viz., low
demand for dated securities; border tensions; rating
downgrade by Fitch Ratings; and supply fatigue from
increased issuances of T-bills and state development
loans (SDL) kept yields firm. Subsequently, however,
softening US treasury yields, fall in crude oil futures,
and the announcement of special open market
operations (OMOs) or “Operation Twist”, eased
pressure on yields by end-June (Chart IV.6). Overall,
the 10-year benchmark yield softened by 15 bps in
Q1:2020-21.
In Q2:2020-21, yields exhibited a hardening bias
on a rise in fuel prices and higher inflation prints
for June and July. The Reserve Bank conducted five
operation twist auctions during July-September and
backed them up with an increase in the limit of SLR
securities kept under the held to maturity (HTM)
category by 2.5 per cent of NDTL – from 19.5 per cent
to 22 per cent. Overall, the 10-year yield (5.79 per cent
GS 2030) hardened by 12 bps in Q2, mainly reflecting
a 24 bps rise in August.
Trade in Dated Securities
Owing to the near cessation of market activity
after the imposition of the nation-wide lockdown, the
growth of average trading volume in G-sec segment
was 32.3 per cent lower during H1:2020-21 than a year
ago (Chart IV.7a). In contrast, the growth of average
trading volume in T-bills (including cash management
bills) was 62.3 per cent higher, reflecting the market
preference for securities of shorter tenor to minimise
duration risk amidst the uncertainty caused by the
pandemic (Chart IV.7b). 2 In the first week of May, yields also eased tracking the lower cut-off in auction for a new 10-year security.
Chart IV.6: 10-year Generic Yield, Repo Rate and Liquidity Conditions
Sources: RBI; and Bloomberg.
0
1,00,000
2,00,000
3,00,000
4,00,000
5,00,000
6,00,000
7,00,000
3.50
4.00
4.50
5.00
5.50
6.00
6.50
7.00
�cr
ore
Per
cent
Net liquidity position surplus (+)/ deficit (-) (RHS)
10-year yield Repo rate
13-M
ay-2
0
21-A
ug-2
0
3-A
pr-2
0
23-A
pr-2
0
2-Ju
n-20
22-Ju
n-20
12-Ju
l-20
1-Au
g-20
10-S
ep-2
0
30-S
ep-2
0
Large supply ofpapers, lockdown
effect and thinvolume of trade
Fall in crudeprices, US treasury
yields and reporate cut
Higher inflationprint and risein crude oil
prices
Hikein excise
duty
Announcementof Special
OMOSpecial OMOs

69
OCTOBER 2020Monetary Policy Report
RBI Bulletin October 2020
The yield curve responded to policy measures
as well as to evolving global/domestic developments
during H1:2020-21, as reflected in shifts in latent
factors viz., level and slope (Chart IV.8a).3 The average
level softened by 15 bps in H1 while the slope of the
yield curve steepened considerably (76 bps), the latter
reflecting the softening of rates at the shorter-end due
to monetary easing and persistent pressures at the
longer end from apprehensions of higher supply of
papers in that segment (Chart IV.8b).
FPI Investment in G-Sec
After the outbreak of the pandemic, foreign
portfolio investors (FPIs) turned net sellers in both
the equity and the debt segments in April 2020. With
receding uncertainty and improvement in market
sentiment, FPIs turned net buyers in the equity markets
beginning in May. In the debt segment, however, they
largely remained net sellers during May and July owing
to India’s outlook downgrade by Fitch and Moody’s
Chart IV.7: Trading Volumes and Yield
Chart IV.8: G-Sec Yield Curve
a: G-secs
a: Shifts
b: T-bills
b: Changes in Level and Slope
Sources: CCIL; and RBI staff estimates.
Sources: FBIL; and RBI staff estimates.
3 While the level is the average of all yields across maturities, the slope is given by the difference in yield between the longest and the shortest maturity (term spread).
5.2
5.4
5.6
5.8
6.0
6.2
6.4
6.6
6.8
7.0
0
2,00,000
4,00,000
6,00,000
8,00,000
10,00,000
12,00,000
H1:2019-20 H1:2020-21
Per
cent
�cr
ore
Volume
Weighted average yield of traded maturities (RHS)
3.0
3.5
4.0
4.5
5.0
5.5
6.0
6.5
7.0
7.5
0
20,000
40,000
60,000
80,000
1,00,000
1,20,000
1,40,000
1,60,000
1,80,000
2,00,000
H1:2019-20 H1:2020-21
Per
cent
�cr
ore
Volume
Weighted average yield of traded maturities (RHS)
6.74
7.02
6.676.47
6.816.74
3.003.504.004.505.005.506.006.507.007.508.00
0.25
2.00
3.75
5.50
7.25
9.00
10.7
512
.50
14.2
516
.00
17.7
519
.50
21.2
523
.00
24.7
526
.50
28.2
530
.00
31.7
533
.50
35.2
537
.00
38.7
540
.50
Yiel
d(P
er c
ent)
Maturity in years
March 27, 2020 April 17, 2020 May 22, 2020
August 6, 2020 August 31, 2020 Sep 30, 2020
10
-31-17
26
-2-15
-39
-4
55
32 32
76
-60
-40
-20
0
20
40
60
80
100
March 27-April 16
April 17-May 21
May 22-Aug 05
Aug 06-Aug 30
Aug 31-Sep 30
Cumulative(March 27-
Sep 30)
Basi
spo
ints
Level Slope

70
Monetary Policy Report OCTOBER 2020
RBI Bulletin October 2020
and escalation of trade tension between the US and
China. Measures to infuse additional liquidity globally
and favourable domestic and international factors
turned FPIs into net buyers in the equity segment
(May-August) and in the debt segment during August.
Renewed concerns about domestic growth prospects,
coupled with weak global cues, turned FPIs into net
sellers in the equity segment as against net buyers in
the debt segment in September (Chart IV.9).
Treasury Bills
After a 75 bps policy rate cut and the announcement
of liquidity augmenting measures on March 27, 2020,
yields on T-bills softened sharply, dipping below
the reverse repo rate (Chart IV.10). In the face of
pandemic-induced uncertainty, the demand for short-
term and liquid securities increased significantly.
Accordingly, the Reserve Bank in consultation with
the GoI increased the issuance limit of T-bills from
`25,000 crore per week to `45,000 crore per week
for the quarter ending June. This was subsequently
reduced to `35,000 crore per week in Q2:2020-21.
State Development Loans
The weighted average spread of cut-off yields on
state development loans (SDLs) over the G-sec yield
of corresponding maturity at 53 bps during H1:2020-
21 was marginally higher by 1 bps on a year-on-year
basis (Chart IV.11). The average inter-state spread on
securities of 10-year maturity (fresh issuance) was
higher at 9 bps in H1:2020-21 (4 bps in H1:2019-20).
In order to enable states/UTs to counter the pandemic-
related stress on their finances, the ways and means
advances (WMA) limit for State Governments was
increased by 60 per cent in two stages (April 1 and
April 17). The number of days for which a state/UT
can be in overdraft was also increased, effective April
7, 2020.
Switching of Securities
In order to facilitate debt consolidation, the
Reserve Bank conducted five switch operations on
behalf of the government amounting to `76,047 crore
during H1:2020-21. Reflecting these operations, the
weighted average maturity (WAM) of outstanding
Chart IV.9: FPI Investment in Equity and Debt Chart IV.10: FBIL -T-Bill Benchmark (Yield to Maturity)
Source: National Securities Depository Limited (NSDL). Source: FBIL.
2.50
2.80
3.10
3.40
3.70
4.00
4.30
4.60
4.90
7 D
ays
14 D
ays
1 M
onth
2 M
onth
s
3 M
onth
s
4 M
onth
s
5 M
onth
s
6 M
onth
s
7 M
onth
s
8 M
onth
s
9 M
onth
s
10 M
onth
s
11 M
onth
s
12 M
onth
s
Per
cent
TenorMarch 27, 2020 April 17, 2020May 22, 2020 August 06, 2020August 31, 2020 Sep 30, 2020
4.0
3.423.45
3.653.55
4.8

71
OCTOBER 2020Monetary Policy Report
RBI Bulletin October 2020
stock of G-secs increased to 10.97 years as at end-
September from 10.54 years at end-March 2020. As at
end -September, the weighted average coupon (WAC)
at 7.44 per cent was lower than 7.69 per cent at end-
March 2020.
IV.1.3 Corporate Bond Market
The corporate bond market, which experienced
severe stress during March-April 2020 after the
outbreak of COVID-19, regained normalcy during the rest of H1:2020-21 with decadal low yields, record primary market issuances and increased secondary market turnover. During H1:2020-21, yields on AAA-rated 3-year bonds issued by NBFCs; corporates; and public sector undertakings (PSUs), financial institutions (FIs) and banks moderated significantly – by 157 bps, 170 bps and 114 bps, respectively – aided by surplus liquidity conditions, targeted long-term repo operations (TLTROs) and “operation twist” auctions (Chart IV.12a). The fall in yields (of similar maturity) was also evident across issuer categories and credit ratings (Chart IV.12b).
Resource mobilisation through issuances of corporate bonds in the primary market at `3.2 lakh crore during H1:2020-21 (up to August 2020) was higher by 23.5 per cent than `2.6 lakh crore during the corresponding period of the previous year (Chart IV.13a). Almost the entire resource mobilisation in the corporate bond market (99.7 per cent) was through the private placement route. Outstanding investments by FPIs in corporate bonds declined to `1.5 lakh crore at end-September 2020 from `1.7 lakh crore at end-March 2020. Consequently, FPIs’ utilisation of the approved limit for investment in corporate bonds
Chart IV.11: SDLs - Amount Raised and Spread
Source: RBI.
Chart IV.12: Corporate Bond Yields (3-years maturity)
a: AAA Bonds b: Lower Rated Bonds
Sources: Fixed Income Money Market and Derivatives Association of India (FIMMDA).
0
25
50
75
100
125
150
0
5,000
10,000
15,000
20,000
25,000
30,000
35,000
Basi
s po
ints
�cr
ore
Total accepted amount
Cumulative weighted average spread (RHS)
07-A
pr-2
0
21-A
pr-2
0
05-M
ay-2
0
19-M
ay-2
0
02-Ju
n-20
16-Ju
n-20
30-Ju
n-20
14-Ju
l-20
28-Ju
l-20
11-A
ug-2
0
25-A
ug-2
0
08-S
ep-2
0
29-S
ep-2
0
4.04.55.05.56.06.57.07.58.08.59.0
01-O
ct-1
917
-Oct
-19
04-N
ov-1
919
-Nov
-19
03-D
ec-1
917
-Dec
-19
01-Ja
n-20
15-Ja
n-20
29-Ja
n-20
12-F
eb-2
028
-Feb
-20
16-M
ar-2
031
-Mar
-20
21-A
pr-2
006
-May
-20
21-M
ay-2
005
-Jun-
2019
-Jun-
2003
-Jul-2
017
-Jul-2
031
-Jul-2
014
-Aug
-20
28-A
ug-2
011
-Sep
-20
30-S
ep-2
0
Per
cent
NBFCs Corporates PSUs, FIs & Banks
5.5
6.5
7.5
8.5
9.5
10.5
11.5
12.5
13.5
01-O
ct-1
915
-Oct
-19
29-O
ct-1
912
-Nov
-19
26-N
ov-1
910
-Dec
-19
24-D
ec-1
907
-Jan-
2021
-Jan-
2004
-Feb
-20
18-F
eb-2
003
-Mar
-20
17-M
ar-2
031
-Mar
-20
14-A
pr-2
028
-Apr
-20
12-M
ay-2
026
-May
-20
09-Ju
n-20
23-Ju
n-20
07-Ju
l-20
21-Ju
l-20
04-A
ug-2
018
-Aug
-20
01-S
ep-2
015
-Sep
-20
30-S
ep-2
0
Per
cent
AA-NBFCs AA-Corporates
BBB (minus)-NBFCs BBB (minus)-Corporates

72
Monetary Policy Report OCTOBER 2020
RBI Bulletin October 2020
declined to 33.8 per cent at end-September 2020 from
54.5 per cent at end-March 2020. The daily average
secondary market trading volume in the corporate
bond market increased by 8.9 per cent to `8,985 crore
during H1:2020-21 over the corresponding period
of the previous year (Chart IV.13b), boosted by the
regulatory requirement of investing a part of TLTRO
funds in the secondary market.
Following the outbreak of the pandemic, global
spillover effects resulted in a significant tightening of
domestic financial conditions, which peaked between
end-March and mid-April but moderated gradually
thereafter (Chart IV.14a). The spread on 3-month CPs
(over 91-day T Bills) reduced from 170 bps on March
26, 2020 to 105 bps by September 30, 2020 while that
on AAA-rated 3-year bonds (over 3-year G-sec) issued
by corporates fell from 276 bps to 43 bps during the
same period (Chart IV.14b).
Over the same period, the spreads on lower
rated corporate bonds also moderated significantly:
by 223 bps for AA-rated 3-year bonds and by 140 bps
on BBB- (BBB minus) rated 3-year bonds – the lowest
rated investment grade bonds (Table IV.1). The market
perception of credit risk also eased with the gradual
Chart IV.13: Corporate Bond Market Activity
Chart IV.14: Financial Conditions, Systemic Liquidity and Spreads
a: Primary Market Issuances
a: Financial Conditions in 2020 (spread over repo rate)
b: Secondary Market Turnover - Daily Average
b: Surplus Liquidity and Risk Premium
Source: SEBI.
Sources: FIMMDA; RBI and Bloomberg.
0
10,000
20,000
30,000
40,000
50,000
60,000
70,000
80,000
90,000A
pr-1
9
May
-20
Jun-
19
Jul-1
9
Aug-
20
Sep-
19
Oct
-19
Nov
-20
Dec
-19
Jan-
20
Feb-
20
Mar
-20
Apr
-20
May
-20
Jun-
20
Jul-2
0
Aug-
20
`cr
ore
0
1,500
3,000
4,500
6,000
7,500
9,000
10,500
12,000
13,500
15,000
Mar
-19
Apr
-19
May
-19
Jun-
19
Jul-1
9
Aug
-19
Sep-
19
Oct
-19
Nov
-19
Dec
-19
Jan-
20
Feb-
20
Mar
-20
Apr
-20
May
-20
Jun-
20
Jul-2
0
Aug
-20
Sep-
20
`cr
ore
0
1,00,000
2,00,000
3,00,000
4,00,000
5,00,000
6,00,000
7,00,000
0
100
200
300
400
500
600
700
800
1-O
ct-1
9
29-O
ct-1
9
26-N
ov-1
9
24-D
ec-1
9
21-Ja
n-20
18-F
eb-2
0
17-M
ar-2
0
14-A
pr-2
0
12-M
ay-2
0
9-Ju
n-20
7-Ju
l-20
4-A
ug-2
0
1-Se
p-20
30-S
ep-2
0
�cr
ore
Basi
spo
ints
Net surplus liquidity (RHS) CPsAAA AA BBB-

73
OCTOBER 2020Monetary Policy Report
RBI Bulletin October 2020
unlocking of the economy: State Bank of India’s and
ICICI Bank’s 3-year credit default swap (CDS) spreads
reduced by 77 bps and 85 bps, respectively, during
H1:2020-21.
Summing up, the measures undertaken by the
Reserve Bank and the Government have restored
stability in financial markets and institutions.
Fears of illiquidity, which froze market activity
across various segments, have been dispelled as
reflected in softening of yields and narrowing of
spreads across money and bond market instruments
(Box IV.1).
Table IV.1: Financial Markets - Rates and Spread Interest Rates (per cent) Spread in bps (over corresponding risk-free rate)
Instrument As on March 26, 2020
As on September 30, 2020
Variation(in bps)
As on March 26, 2020
As on September 30, 2020
Variation(in bps)
(1) (2) (3) (4 = 3-2) (5) (6) (7 = 6-5)
CP (3-month) 6.74 4.32 -242 170 105 -65Corporate Bonds#
(i) AAA (1-yr) 7.76 4.35 -341 246 47 -199(ii) AAA (3-yr) 8.47 5.35 -312 276 43 -233(iii) AAA (5-yr) 7.84 6.10 -174 141 50 -91(iv) AA (3-yr) 9.15 6.13 -302 344 121 -223(v) BBB-minus (3-yr) 12.29 10.10 -219 658 518 -14010-yr G-sec 6.22 6.01 -21 - - -
#: Issued by Corporates.Sources: CCIL: F-TRAC; FIMMDA; and Bloomberg.
Various measures undertaken by the Reserve Bank to augment system-level and targeted liquidity produced differential responses in terms of varying intensity of appetite for funds as reflected in the bid-cover ratio (Chart IV.1.1).
The announcement effects of LTROs and TLTROs on the benchmark 10-year G-sec yield is examined over a 3-hour period (windows of 15 minutes interval) prior to and after the announcement. Based on the two-sample Wilcoxon rank-sum (Mann-Whitney) tests, six out of the eight announcements had a statistically significant downward impact on yields prior to and post announcement of auctions (Table IV.1.1).4
Box IV.1: Unconventional Monetary Policy Measures: Impact on Bond Market
4 Although there were ten auctions of LTROs and TLTROs in all, there were eight announcements for these auctions, as two auctions (February 17 and 24) were announced on February 7 and another two auctions (March 2 and 9) on February 25, 2020.
Chart IV.1.1: LTRO and TLTRO Auctions
Source: RBI.
Table IV.1.1: Difference in G-Sec Yields Pre- and Post-Announcement of Auctions – Tests of Significance
Announcement Dates LTROs TLTROs
Feb,07 Feb,25 Mar,16 Mar,27 Mar,30 Apr,03 Apr,15 Apr,17
z-stat 4.157 0.693 -3.637 2.744 4.157 -4.157 3.465 4.157
Probability that post-announcement yield is lower than pre-announcement 1.000 0.583 0.063 0.830 1.000 0.000 0.917 1.000
(contd.)

74
Monetary Policy Report OCTOBER 2020
RBI Bulletin October 2020
For the six announcements for which the decline in yields was statistically significant, the duration and magnitude of the announcement effect on intra-day yields can be examined by the average difference in yields at intervals of 15 minutes post-announcement from that of the average yield an hour prior to the auction announcement. The maximum average impact is found fifteen minutes after the announcement with a moderation of about 4 bps in yields from the average of the hour before announcement (Chart IV.1.2). An hour after the announcement, the moderation in yields turns statistically insignificant.
In order to explore the impact of the actual auction outcome on yields and their persistence in an event study framework (Hartley and Rebucci, 2020), an autoregressive (AR) model is estimated, based on data spanning December 2019-August 2020, for daily changes in 10-year bond yields (G-sec as well as corporate bonds separately) regressed on LTRO and TLTRO auction dates (as dummies) with controls for other key variables that can impact yields,
viz., changes in the policy repo rate, and changes in the US
economic policy uncertainty5 (as a proxy for factors such
as international oil prices and yield movements), with the
following specifications:
(1);
(2)
The estimates indicate that the LTRO and TLTRO auctions
softened yields on 10-year G-secs and on 10-year corporate
bonds by around 29 bps and 47 bps, respectively (Table
IV.1.2)6. The reduction in the policy rate (from 5.15 per
cent to 4.0 per cent over the sample period) is estimated
to have softened G-sec and corporate bond yields by
another 8-9 bps. Overall, the measures undertaken by
the Reserve Bank had a sobering impact on yields and
risk spreads, which helped in easing market stress and
softening financing conditions.
Chart IV.1.2 Average Decline in Yields Post-Announcement of Auctions
Note: Deeper, moderate and lighter shades indicate that median difference is significantly different from zero at 5 per cent level, 20 per cent and 30 per cent level of significance, respectively, using Wilcoxon signed-rank test.Source: RBI staff estimates.
Table IV.1.2: UMP Impact on Bond Yields
Variables ΔG-sec ΔCorporate bond
ΣLag (-1 to -2) -0.067 0.025
ΔPolicy rate 0.082*** 0.069***
ΔUS policy uncertainty (-1) 0.00006 0.0003
ΣLTRO -0.0566* -0.227***
ΣTLTRO -0.238*** -0.242***
ΣLTRO + ΣTLTRO -0.294*** -0.470***
Diagnostic tests (p-values)
BG LM test for the null of no autocorrelation of residuals
0.325 0.192
ARCH LM test for conditional heteroscedasticity 0.310 0.923
Notes: *,**, ***: Denote 10, 5 and 1 per cent level of significance, respectively; Source: RBI staff estimates.
Reference:
Hartley, J. S. and A. Rebucci (2020), “An Event Study of COVID-19 Central Bank Quantitative Easing in Advanced and Emerging Economies”, NBER Working Paper No. 27339, June.
5 Baker, S. R. Bloom, N. and S. J. Davis (2016), “Measuring Economic Policy Uncertainty” The Quarterly Journal of Economics, Vol 131:4, pp. 1593-1636; Data source: US Federal Reserve Bank of St. Louis website.6 TLTRO2 is not considered as the auction date of April 3, 2020 coincided with (i) the announcement of TLTRO3; (ii) change of market timing by RBI; and (iii) announcement of large borrowing programme for H1:2020-21.
Time periods (interval of 15 minutes)

75
OCTOBER 2020Monetary Policy Report
RBI Bulletin October 2020
IV.1.4 Equity Market
After undergoing intense volatility in Q4:2019-
20 following the COVID-19 outbreak with a massive
disruption in business activity, the Indian equity
market made a strong V-shaped recovery in H1:2020-
21. The BSE Sensex gained 46.5 per cent in H1:2020-21
after hitting a low of 25981 on March 23, 2020 (Chart
IV.15a). Strong rallies in global equity markets on the
back of massive fiscal and monetary stimuli in major
countries and the measures undertaken in India
boosted domestic market sentiments.
In Q1:2020-21, the equity market had posted its
biggest monthly gain in 11 years in April 2020, with
the BSE Sensex increasing by 14.4 per cent. In the later
part of April, the closure of six debt fund schemes by
a mutual fund weighed adversely on domestic market
sentiment. This was quickly reversed, however,
following the Reserve Bank’s announcement of
liquidity augmenting measures, including the special
liquidity facility for mutual funds (SLF-MF) on April
27, 2020.
Bearish sentiments gripped the stock market in
early May, with the Sensex declining by 2002 points
(5.9 per cent) on May 4 in sync with global peers
amidst (i) escalating tensions between US and China;
(ii) dismal quarterly earnings results of corporates;
and (iii) extension of lockdown till end-May. The
announcement of the `20 lakh crore “Atmanirbhar Bharat” stimulus package by the Government and a
large policy repo rate cut by the Reserve Bank on May
22 boosted investor sentiment. The market rebounded
in June 2020 with the BSE Sensex posting its best
quarterly return (18.5 per cent) since 2009. Border
tensions and downward revision in India’s GDP
growth projections for 2020-21 by various agencies
capped the upside in equities.
The recovery continued in July and August
on the back of positive news from encouraging
trials of the coronavirus vaccine and hopes of more
supportive measures by national authorities globally.
On the domestic front, the rally in equities was also
supported by improvement in the manufacturing PMI
for June 2020, reports of disengagement between
India and China over border issues and better than
expected Q1:2020-21 corporate earnings results.
Domestic market sentiment was tempered during
August by contraction in manufacturing PMI and
higher-than-expected CPI inflation print for July 2020.
The stock market plummeted sharply in the last
trading session of the month due to fresh escalation
in Indo-China border tensions and witnessed cautious
Chart IV.15: Stock Market Indices and Investment
a: BSE Sensex and Dow Jones Industrial Average b: Net Investment in Equity by Institutional Investors
Sources: Bloomberg; NSDL; and SEBI.
19000
21000
23000
25000
27000
29000
31000
26000
28000
30000
32000
34000
36000
38000
40000
BSE Sensex Dow Jones (RHS)
01-A
pr-2
08-
Apr
-20
15-A
pr-2
022
-Apr
-20
29-A
pr-2
006
-May
-20
13-M
ay-2
020
-May
-20
27-M
ay-2
003
-Jun-
2010
-Jun-
2017
-Jun-
2024
-Jun-
2001
-Jul-2
008
-Jul-2
015
-Jul-2
022
-Jul-2
029
-Jul-2
005
-Aug
-20
12-A
ug-2
019
-Aug
-20
26-A
ug-2
002
-Sep
-20
09-S
ep-2
016
-Sep
-20
23-S
ep-2
030
-Sep
-20 -65,000
-55,000-45,000-35,000-25,000-15,000
-5,0005,000
15,00025,00035,00045,000
Mar
-19
Apr
-19
May
-19
Jun-
19Ju
l-19
Aug-
19Se
p-19
Oct
-19
Nov
-19
Dec
-19
Jan-
20Fe
b-20
Mar
-20
Apr
-20
May
-20
Jun-
20Ju
l-20
Aug-
20Se
p-20
�cr
ore
Foreign portfolio investors Mutual funds

76
Monetary Policy Report OCTOBER 2020
RBI Bulletin October 2020
trading ahead of the implementation of new trading
norms on margin requirements by the Securities
and Exchange Board of India (SEBI) from September
1, 2020. Investor sentiment remained insipid in
September 2020 amidst concerns over steady increase
in coronavirus infections and weak global cues. After
registering moderate gains due to improvement in
domestic manufacturing PMI for August 2020, equity
sentiments turned negative with the BSE Sensex
witnessing its biggest intra-day fall in more than four
months on September 24 as spike in infections in some
European countries triggered fears of a second round
of lockdown. Bullish sentiments, however, returned
towards the end of the month amid expectations of
further stimulus measures by the government.
During H1:2020-21, FPIs turned net buyers in
the Indian equity market after panic sales in March
due to flight to safety. MFs, however, were net sellers
to the tune of `24,801 crore during H1:2020-21
(Chart IV.15b). Resource mobilisation through public
and rights issues of equity increased to `76,830
crore during H1:2020-21 from `60,133 crore in the
corresponding period of the previous year.
IV.1.5 Foreign Exchange Market
The INR exhibited movements in both directions
against the US dollar during H1:2020-21. After
depreciating to its lowest level of `76.81 on April 22,
2020, the INR subsequently appreciated owing to FPI
flows to the domestic equity market with the return
of risk appetite for EME assets and the depreciation of
the US dollar. The appreciation of the INR against the
US dollar was modest as compared with EME peers
(Chart IV.16a).
In terms of the 36-currency nominal effective
exchange rate (NEER), the INR depreciated by 0.6 per
cent (as at end-September 2020 over the average of
March 2020), but it appreciated by 2.1 per cent in terms
of the 36-currency real effective exchange rate (REER)
during the same period (Table IV.2). Between March
Chart IV.16: Cross-Currency Movements
a: Movement of Major EME Currencies against US Dollar (end-September 2020 over end-March 2020)
b: Movement in REER (August 2020 over March 2020)
Note: Appreciation (+)/Depreciation (-).Sources: RBI; FBIL; IMF; Bloomberg; Thomson Reuters; and Bank for International Settlements (BIS).
-5.2
9.7
6.2
6.1
5.3
4.2
3.9
3.5
3.3
2.2
-1.3
-7.8
-14.3
-15.7
-25.0 -15.0 -5.0 5.0 15.0
US (DXY)
Indonesia
South Africa
Mexico
Philippines
China
Taiwan
Malaysia
Thailand
India
Russia
Brazil
Turkey
Argentina
Per cent
3.3
1.2
1.1
0.7
0.7
0.1
-0.6
-1.1
-2.5
-2.7
-3.3
-5.7
-12.2
-12.7
-15.0 -10.0 -5.0 0.0 5.0
Philippines
Taiwan
Indonesia
Thailand
India
Mexico
Malaysia
Russia
US
China
Argentina
South Africa
Brazil
Turkey
Per cent

77
OCTOBER 2020Monetary Policy Report
RBI Bulletin October 2020
and August 2020, the appreciation of the INR in terms
of the REER was lower than that of the Indonesian
rupiah, the Taiwan dollar and the Philippine peso
(Chart IV.16b).
Financial Markets Barometer
A cross-market barometer illustrates vividly the
recovery in financial markets from the disruptions
caused by the pandemic.7 The barometer consists of
nine indicators across markets (money, bonds, foreign
exchange and equities) and compares the level of each
indicator on a certain day with its pre-turmoil level
(calibrated as zero on the scale) and with its level at
a ‘peak’ in the turmoil (calibrated as 100).8 The pre-
turmoil level for all indicators is taken as January 1,
2020, while the peak turmoil day is indicator specific
and happens to concentrate around March 24, 2020
(the day of imposition of country-wide lockdown) and
in some cases in May 2020 (Chart IV.17). The barometer
presents four different stages after the declaration of
the COVID-19 pandemic (by construction, a decreasing
tendency indicates recovery of the market segment).
In response to the gradual opening of the economy
and the proactive measures taken by the Reserve
Bank and the Government, an improvement in
sentiments in the foreign exchange and stock market
indicators took hold from May onwards. Money and
bond market spreads started easing following (i) the
introduction of the new benchmark paper on May 8,
2020; (ii) the announcement of Atmanirbhar Bharat stimulus package by the Government; and (iii) policy
rate cut of 40 bps on May 22, 2020. All nine indicators
suggest improvement in financial market sentiments
Chart IV.17: Financial Markets Barometer
a: 24-Mar-20 b: 8-May-20
Table IV.2: Nominal and Real Effective Exchange Rates – Trade-based Weights
(Base: 2004-05 = 100)Item Index:
end-September 2020(P)
Appreciation (+) /Depreciation (-)
(Per cent)
end-September 2020 over March (average)
2020
36-currency REER 117.0 2.1
36-currency NEER 70.8 -0.6
6-currency REER 123.8 1.8
6-currency NEER 59.6 -2.0
`/US$ 73.8 0.7
P: Provisional. Sources: RBI; and FBIL.
7 European Central Bank (2007): Financial Stability Review, December.8 Negative column for an indicator indicate values lower than its pre-turmoil level.
(contd.)
-40
-20
0
20
40
60
80
100
USD
/IN
R
Impl
ied
Vol
atili
ty-1
mon
th
Forw
ard
Prem
ia-1
mon
th
NIF
TY 5
0
SEN
SEX
VIX
3-m
onth
CP
and
T-Bi
llSp
read
3-ye
ar A
AA
NBF
Can
dG
-Sec
Spr
ead
3-m
onth
MIB
OR
and
T-Bi
llSp
read
Foreign Exchange Equity Markets Money and BondMarkets
-40
-20
0
20
40
60
80
100
3-m
onth
MIB
OR
and
USD
/IN
R
Impl
ied
Vol
atili
ty-1
mon
th
Forw
ard
Prem
ia-1
mon
th
NIF
TY 5
0
SEN
SEX
VIX
3-m
onth
CP
and
T-Bi
llSp
read
3-ye
ar A
AA
NBF
Can
dG
-Sec
Spr
ead
T-Bi
llSp
read
Foreign Exchange Equity Markets Money and BondMarkets

78
Monetary Policy Report OCTOBER 2020
RBI Bulletin October 2020
in September vis-à-vis the elevated stress levels of
March and May.
IV.1.6 Credit Market
During H1:2020-21, bank credit offtake was
anaemic, reflecting weak demand and uncertainty in
the wake of the pandemic. Non-food credit growth
(y-o-y) at 5.1 per cent as on September 25, 2020 was
lower than 8.6 per cent a year ago, driven by weak
momentum and base effects (Chart IV.18).
The slowdown in credit growth was spread
across all bank groups, especially foreign banks.
Credit growth of the public sector banks remained
modest, although with some uptick since March 2020
(Chart IV.19a). Of the incremental credit extended
by the scheduled commercial banks (SCBs) on a year-
on-year basis (September 27, 2019 to September 25,
2020), 62.3 per cent was provided by the public sector
banks and 41.2 per cent by the private sector banks,
while the share of the foreign banks turned negative
(Chart IV.19b).
The deceleration in non-food credit growth was
broad-based with credit offtake slowing down in all
the major sectors. Though personal loans and credit to
agriculture registered some improvement in July 2020,
c: 7-Jul-20 d: 22-Sep-20
Sources: Bloomberg; CCIL: F-TRAC; FBIL; and RBI staff estimates.
Chart IV.18: Non-food Credit Growth of SCBs
Note: Monthly numbers are based on average of the fortnights. Source: RBI
-40
-20
0
20
40
60
80
100
USD
/IN
R
Impl
ied
Vol
atili
ty-1
mon
th
Forw
ard
Prem
ia-1
mon
th
NIF
TY 5
0
SEN
SEX
VIX
3-m
onth
CP
and
T-Bi
llSp
read
3-ye
ar A
AA
NBF
Can
dG
-Sec
Spr
ead
3-m
onth
MIB
OR
and
T-Bi
llSp
read
Foreign Exchange Equity Markets Money and BondMarkets
-40
-20
0
20
4060
80
100
USD
/IN
R
Impl
ied
Vol
atili
ty-1
mon
th
Forw
ard
Prem
ia-1
mon
th
NIF
TY 5
0
SEN
SEX
VIX
3-m
onth
CP
and
T-Bi
llSp
read
3-ye
ar A
AA
NBF
Can
dG
-Sec
Spr
ead
3-m
onth
MIB
OR
and
T-Bi
llSp
read
Foreign Exchange Equity Markets Money and BondMarkets
-4.0
-3.0
-2.0
-1.0
0.0
1.0
2.0
3.0
4.0
4.0
6.0
8.0
10.0
12.0
14.0
16.0O
ct-1
8N
ov-1
8D
ec-1
8Ja
n-19
Feb-
19M
ar-1
9A
pr-1
9M
ay-1
9Ju
n-19
Jul-1
9Au
g-19
Sep-
19O
ct-1
9N
ov-1
9D
ec-1
9Ja
n-20
Feb-
20M
ar-2
0A
pr-2
0M
ay-2
0Ju
n-20
Jul-2
0Au
g-20
Sep-
20
Perc
enta
ge p
oint
s
Per
cent
Base effect (RHS) Momentum (RHS)
y-o-y growth rate

79
OCTOBER 2020Monetary Policy Report
RBI Bulletin October 2020
the momentum could not be sustained in August.
Credit growth to services and industrial sectors has
also tapered off after showing some promise in Q1;
2020-21 (Chart IV.20a). Personal loans accounted for
the largest share of total credit flow in August 2020,
followed by services. While the share of personal
loans, services and agriculture increased in August
2020 vis-a-vis the previous year, the share of industry
contracted (Chart IV.20b).
Within industry, credit growth to food processing,
mining and quarrying, petroleum, coal products and
nuclear fuels, leather and leather products, wood
and wood products, and paper and paper products
accelerated in August 2020 as compared with a year
ago. In contrast, credit growth to chemicals and
chemical products, rubber plastic and their products,
infrastructure, construction, gems and jewellery, glass
and glassware, basic metal and metal products and
beverage and tobacco decelerated/contracted. In the
services sector, credit growth to computer software
picked up significantly in recent months, reflecting
the increased use of digital technology during the
Chart IV.19: Credit Flow across Bank-Groups
a: Growth b: Share
Source: RBI
Chart IV.20: Sectoral Deployment of Credit
a. Growth b: Share
Source: RBI.
11.8
62.3
85.0
41.2
3.2
-3.5
-20
0
20
40
60
80
100
120
Sep-19 Sep-20
Public sector banks Private sector banks Foreign banks
Per
cen
t
9.3 10.713.5 2.6
36.239.2
40.9 47.5
0102030405060708090
100
Aug-19 Aug-20
Per
cen
t
Personal loans Services
Industry (micro and small, medium and large)Agriculture and allied activities
4.9
0.5
8.610.6
0.0
5.0
10.0
15.0
20.0
25.0
30.0
Apr
-18
Jul-1
8
Oct
-18
Jan-
19
Apr
-19
Jul-1
9
Oct
-19
Jan-
20
Apr
-20
Jun-
20
Per
cent
(y-o
-y)
Agriculture & allied activities
Industry (micro & small, medium and large)
Services Personal loans
Aug-
20
Public sector banks (including regional rural banks)
Private banks (including small finance banks)Foreign banks All SCBs
6.0
-4.3
5.2
-12-606
12182430
Mar
-16
Jun
-16
Sep
-16
Dec
-16
Mar
-17
Jun
-17
Sep
-17
Dec
-17
Mar
-18
Jun
-18
Sep
-18
Dec
-18
Mar
-19
Jun
-19
Sep
-19
Dec
-19
Mar
-20
Jun
-20
Sep
-20
Per
cen
t(y
-o-y
)
5.3

80
Monetary Policy Report OCTOBER 2020
RBI Bulletin October 2020
Chart IV.21: Non-Food Credit to Select Sub-Sectors
a: Growth b: Share
Source: RBI.
Chart IV.22: Stressed Assets and Non-Performing Assets of SCBs
a: Overall Loan Portfolio of SCBs b: Sectoral Non-Performing Assets
Source: RBI.
COVID-19 period (Chart IV.21a). Credit to the NBFC
sector decelerated to 17.1 per cent in August 2020 from
38.8 per cent a year ago. In the personal loan segment,
growth in vehicle loans accelerated from 3.7 per cent
in August 2019 to 8.4 per cent in August 2020; during
the same period, growth in housing loans decelerated
from 16.6 per cent to 11.1 per cent. The share of trade
in non-food credit flow increased sharply in August
2020 vis-a-vis its level in the corresponding month of
the previous year (Chart IV.21b).
The asset quality of SCBs improved during 2020-
21 (up to June), with the overall non-performing assets
(NPA) ratio declining to 8.0 per cent in June 2020 from
9.4 per cent a year ago (Chart IV.22a). The NPA ratio in
respect of agriculture and services increased over the
same period (Chart IV.22b).
Boosted by TLTROs, non-SLR investments of banks
(comprising investments in CPs, bonds, debentures
and shares of public and private corporates) increased
by 1.8 per cent in H1:2020-21 as against a decline of
3.9 per cent in H1:2019-20 (Chart IV.23a). Adjusted
non-food credit growth decelerated from 8.4 per
cent in Q2:2019-20 to 5.1 per cent in Q2:2020-21
(Chart IV.23b).
0
5
10
15
20
25
30
35
40
45
-5
0
5
10
15
20
Jun-
19
Jul-1
9
Aug
-19
Sep-
19
Oct
-19
Nov
-19
Dec
-19
Jan-
20
Feb-
20
Mar
-20
Apr
-20
May
-20
Jun-
20
Jul-2
0
Aug
-20
Per
cent
Trade Computer software Vehicle loan
NBFCs (RHS) Commercial real estate (RHS)
12.5
7.1
8.4
17.1
6.6
Per
cent
(y-o
-y)
3.8
12.3
25.0
22.60.1
0.3
0.9
3.3
3.8
2.8
0.0
5.0
10.0
15.0
20.0
25.0
30.0
35.0
40.0
45.0
Aug-19 Aug-20
Per
cen
t
Trade NBFCs Computer software
Vehicle loan Commercial real estate
10.36
12.92
7.22
1.820.0
2.5
5.0
7.5
10.0
12.5
15.0
17.5
20.0
22.5
25.0
Mar
-15
Jul-1
5
Nov
-15
Mar
-16
Jul-1
6
Nov
-16
Mar
-17
Jul-1
7
Nov
-17
Mar
-18
Jul-1
8
Nov
-18
Mar
-19
Jul-1
9
Nov
-19
Mar
-20
Per
cent
Agriculture Industry Services Retail loans
Jun-
20

81
OCTOBER 2020Monetary Policy Report
RBI Bulletin October 2020
Chart IV.23: Non-SLR Investments and Adjusted Non-Food Credit
a: Non-SLR Investments b: Adjusted Non-Food Credit
Source: RBI.
Chart IV.24 : Excess SLR of Banks
Note: Excess SLR is based on the average of all reporting Fridays in the quarter. Data for Q2:2020-21 is up to August 28, 2020.Source: RBI.
Banks augmented their SLR portfolios in the wake of deceleration in credit offtake and higher government borrowings. Consequently, excess SLR maintained by all scheduled commercial banks increased to 11.1 per cent of net demand and time liabilities (NDTL) in Q2:2020-21 (up to August 28) from 7.1 per cent a year ago (Chart IV.24).
IV.2 Monetary Policy Transmission
The transmission of policy repo rate changes to deposit and lending rates of banks improved since the April 2020 MPR. The weighted average lending rate (WALR) on fresh rupee loans declined by 91 bps since March 2020 in response to the reduction of 115 bps in the policy repo rate and comfortable liquidity conditions (Table IV.3).
Table IV.3: Transmission from the Repo Rate to Banks’ Deposit and Lending Rates(Basis points)
Period Repo Rate
Term Deposit Rates Lending Rates
Median Term
Deposit Rate
WADTDR 1 - Year Median MCLR
WALR - Outstanding Rupee Loans
WALR - Fresh Rupee
Loans
February - September 2019 (Pre-external benchmark) -110 -9 -7 -30 2 -40October 2019 - September 2020* (Post-external benchmark) -140 -157 -98 -114 -64 -122March 2020 - September 2020* -115 -125 -59 -80 -46 -91February 2019 - September 2020* -250 -190 -105 -138 -62 -162
*: Latest data on WALRs and WADTDR pertain to August 2020.WALR: Weighted Average Lending Rate. WADTDR: Weighted Average Domestic Term Deposit Rate; MCLR: Marginal Cost of Funds-based Lending Rate. Source: RBI.
-40,000
-30,000
-20,000
-10,000
0
10,000
20,000
30,000
40,000
H1:2019-20 H1:2020-21
`cr
ore
Commercial paper Bonds/Shares/Debentures

82
Monetary Policy Report OCTOBER 2020
RBI Bulletin October 2020
February 2019 and 3.25-3.50 per cent immediately prior to the introduction of the external benchmark, were placed at 2.70-3.00 per cent in September 2020. The flexible adjustment of saving deposit rates bodes well for monetary transmission to lending rates in comparison to the rigidity characterising saving deposit rates in earlier years.
The decline in both the lending and deposit rates is more pronounced for foreign banks (Chart IV.27). The deposit base of foreign banks is primarily made up of low cost and lower duration wholesale deposits, which adjust quickly to policy rate changes. On the other hand, the public sector banks depend more on retail term deposits and face competition from alternative saving instruments like small savings, which constrains them from lowering rates in sync with the policy rate. While the private sector banks exhibited greater transmission in terms of WALR on fresh rupee loans and WADTDR compared to public sector banks, the decline in WALR on outstanding rupee loans is more for public sector banks.
The 1-year median marginal cost of funds-based lending rate (MCLR) charged by public sector banks and private sector banks declined further during H1:2020-21 (Chart IV.28).
Chart IV.25: Monetary Transmission - Banks and Markets
Sources: Bloomberg and RBI.
Chart IV.26: Median Term Deposit Rate and Liquidity Conditions
Source: RBI.
The pass-through to WALR on fresh rupee loans
was higher than the softening of yield on 5-year
corporate bonds (79 bps) and yield on 10-year G-Secs
during March – August 2020 (Chart IV.25). The WALR
on outstanding rupee loans declined by 46 bps during
this period, but this transmission is an improvement
over the earlier period.
Of the 105 bps reduction in the weighted average
domestic term deposit rate (WADTDR) on outstanding
rupee deposits during the ongoing easing cycle (i.e.,
since February 2019), a little over half of the decline,
i.e. 59 bps occurred since March 2020. The median
term deposit rate, which reflects the prevailing card
rates, has registered a sizable decline of 125 bps
since March 2020, reflecting the combined impact
of surplus liquidity, the introduction of external
benchmark-based pricing of loans and weak credit
demand conditions (Chart IV.26).
Apart from the reduction in term deposit rates,
many banks also lowered their saving deposit rates
during the current easing cycle. The saving deposit
rates of five major banks, which ranged 3.50-4.00
per cent at the beginning of the easing cycle in early
Per
cent
-150000
-50000
50000
150000
250000
350000
450000
550000
4.0
4.5
5.0
5.5
6.0
6.5
May
-18
Jul-1
8Se
p-18
Nov
-18
Jan-
19M
ar-1
9M
ay-1
9Ju
ly-1
9Se
p-19
Nov
-19
Jan-
20M
ar-2
0M
ay-2
0Ju
ly-2
0Se
p-20
�cr
ore
Net LAF surplus(+) / deficit (-) (RHS)
Median term deposit rate

83
OCTOBER 2020Monetary Policy Report
RBI Bulletin October 2020
Chart IV.28: MCLR of Domestic Banks
Source: RBI.
Spreads of WALRs on outstanding rupee loans and fresh rupee loans over 1-year median MCLR were uneven across sectors (Chart IV.29). In personal loans, the spread was among the lowest in respect of housing loans, reflecting lower defaults and the availability of collateral. Personal loans - other than
Chart IV.29: Sector-wise WALRs Relative to 1-Year Median MCLR (August 2020)#
#Pertain to domestic banks.Source: RBI.
housing and vehicle loans - are mostly unsecured and involve higher credit risk; hence, the spread charged was the highest for other personal loans. The lower WALRs on rupee export credit reflect the interest rate subvention provided by the government.
There has been a significant improvement in transmission to all new loans sanctioned since October 2019 when the new floating rate loans to retail and MSME sectors were mandatorily linked to the external benchmark (Chart IV.30). The quantum of decline in WALRs on personal and MSME loans was more than that for aggregate fresh rupee loans to all sectors (120 bps).
The introduction of external benchmark linked loans has incentivised banks to adjust their term as well as saving deposit rates in line with the benchmark rates to protect their net interest margins (NIMs). The reduction in term deposit rates applies only to fresh term deposits, while it is across the board in the case of saving deposits.9 The latter brings
9 Saving deposits accounted for 32.2 per cent of aggregate deposits of scheduled commercial banks (excluding regional rural banks, payment banks and small finance banks) as on September 25, 2020.
7.35
8.65
7.00
7.50
8.00
8.50
9.00
9.50
10.00
Jan-
2019
Feb-
2019
Mar
-201
9A
pr-2
019
May
-201
9Ju
ne-2
019
July
-201
9Au
g-20
19Se
p-20
19O
ct-2
019
Nov
-201
9D
ec-2
019
Jan-
2020
Feb-
2020
Mar
-202
0A
pr-2
020
May
-202
0Ju
ne-2
020
July
-202
0Au
g-20
20Se
p-20
20
1-Yr median MCLR-public sector banks
1-Yr median MCLR-private sector banks
Per
cent
Chart IV.27: Transmission across Bank Groups (February 2019 - August 2020)
Source: RBI.
- 85
-131
-271
-105
-128
-100
-198
-128
-140
-188
-250
-162
-72
-42
-148
-62
-300
-250
-200
-150
-100
-50
0
Public sectorbanks
Private sectorbanks
Foreignbanks
Scheduledcommercial
banks
Basi
s po
ints
WADTDR 1-Yr Median MCLR
WALR-Fresh rupee loans WALR-Outstanding rupee loans

84
Monetary Policy Report OCTOBER 2020
RBI Bulletin October 2020
about an instantaneous reduction in the banks’ cost
of funds, and in turn, in the MCLR and the lending
rates on fresh rupee loans (provided the spread over
the MCLR remains relatively stable). Thus, the impact
of introduction of external benchmark-based pricing
of loans on monetary transmission has encompassed
even sectors that are not linked to external benchmark
loan pricing.
In respect of fresh rupee loans linked to the policy
repo rate, the median spread charged by domestic
banks was the highest in the case of other personal
loans, followed by that for the MSME sector, whereas
housing loans have the lowest spread. Among the bank
groups, the median spread charged by public sector
banks for different categories of loans was lower than
those of private sector banks (Table IV.4).
Administered interest rates on small savings are
linked to market yields on G-secs with a lag and are
fixed on a quarterly basis at a spread of 0-100 bps over
and above G-sec yields of comparable maturities. After
Table IV.4: Loans linked to External Benchmark – Median Spread over Policy Repo Rate
(August 2020)(Percentage points)
Personal Loans MSME Loans
Housing Vehicle Education Other Personal
Loans
Public Sector Banks (12) 3.4 4.7 4.5 6.6 5.7
Private Sector Banks (20) 5.8 7.0 7.2 6.8 7.2
Domestic Banks (32) 4.4 5.1 5.2 6.6 6.4
Source: RBI.
lowering these rates sharply during Q1:2020-21, small
saving interest rates were left unchanged for Q2:2020-
21 and Q3:2020-21 notwithstanding the decline in
G-sec yields during the reference period, resulting in
a wedge of 40-120 bps in Q2 and 83-203 bps in Q3 in
respect of various small savings instruments relative
to the formula-based rates, with implications for
monetary transmission (Table IV.5).
IV.3 Liquidity Conditions and the Operating Procedure of Monetary Policy
The RBI Act 1934 requires the RBI to place the
operating procedure relating to the implementation
of monetary policy and changes thereto from time to
time, if any, in the public domain. During H1:2020-
21, liquidity management operations by the RBI were
conducted as per the revised liquidity management
framework introduced on February 14, 2020 and
guided by the need to expand liquidity in the
system sizeably to ensure that financial markets and
institutions function normally in the face of COVID-
related dislocations, consistent with the monetary
policy stance (see Chapter III of Annual Report 2019-
20 for details).10
10 Reserve Bank of India (2020): Annual Report 2019-20, Monetary Policy Operations, August 25.
Chart IV.30: WALR on Personal Loans and Loans to MSMEs - Variation (October 2019 - August 2020)
Source: RBI.

85
OCTOBER 2020Monetary Policy Report
RBI Bulletin October 2020
Table IV.5: Interest Rates on Small Savings Instruments - Q3:2020-21
Small Savings Scheme Maturity (years)
Spread (Percentage
point) $
Average G-sec Yield (%) of
Corresponding Maturity (June -
August 2020)
Formula based Rate of Interest (%) (applicable for Q3:2020-21)
Government Announced Rate of Interest (%) in
Q3:2020-21
Difference (basis points)
(1) (2) (3) (4) (5) = (3) + (4) (6) (7) = (6) - (5)
Savings Deposit - - - - 4.00 -
Public Provident Fund 15 0.25 6.02 6.27 7.10 83
Term Deposits
1 Year 1 0 3.47 3.47 5.50 203
2 Year 2 0 3.92 3.92 5.50 158
3 Year 3 0 4.38 4.38 5.50 112
5 Year 5 0.25 5.29 5.54 6.70 116
Recurring Deposit Account 5 0 4.38 4.38 5.80 142
Monthly Income Scheme 5 0.25 5.27 5.52 6.60 108
Kisan Vikas Patra 124 Months 0 6.02 6.02 6.90 88
NSC VIII issue 5 0.25 5.40 5.65 6.80 115
Senior Citizens Saving Scheme 5 1.00 5.29 6.29 7.40 111
Sukanya Samriddhi Account Scheme 21 0.75 6.02 6.77 7.60 83
$: Spreads for fixing small saving rates as per Government of India Press Release of February 2016.Note: Compounding frequency varies across instruments.Sources: Government of India; and RBI staff estimates.
In view of the COVID-19 pandemic and its adverse
impact on real economic activity, the Reserve Bank
reduced the policy repo rate by 40 bps on May 22, 2020
on top of a 75 bps reduction on March 27. In order to
make it relatively unattractive for banks to passively
park funds with the Reserve Bank and to encourage
their deployment for on-lending to productive sectors
of the economy, the policy interest rate corridor was
widened to 90 bps through a reduction of 25 bps in
the reverse repo rate on April 17, 2020. Liquidity
augmenting measures initiated since February 2020
were further reinforced during H1:2020-21, including
those targeted at specific sectors and entities to
alleviate liquidity and funding stress (Box IV.2).
(i) Auctions of long term repo operations (LTRO) during February-March 2020 for one-year and three-year tenors to facilitate monetary transmission and augment credit flows to productive sectors.
(ii) Scheduled commercial banks were allowed exemption on incremental credit disbursed by them between January 31-July 31, 2020 on retail loans for automobiles, residential housing and loans to
Box IV.2: Measures Augmenting Liquidity and Fostering Orderly Market Conditions
MSMEs from the maintenance of cash reserve ratio (CRR), with a view to revitalise the flow of bank credit to productive sectors having multiplier effects on growth.
(iii) Two 6-month US dollar/INR sell/buy swap auctions were conducted on March 16 and March 23, 2020 cumulatively providing dollar liquidity amounting to US$ 2.7 billion.
(contd.)

86
Monetary Policy Report OCTOBER 2020
RBI Bulletin October 2020
(iv) Fine-tuning variable rate repo auctions were conducted during March 2020 to provide flexibility to the banking system in its liquidity management towards the year end. As a special case, standalone primary dealers (SPDs) were allowed to participate in these auctions along with other eligible participants.
(v) To facilitate year-end liquidity management of SPDs, liquidity available to them under the Standing Liquidity Facility (SLF) was temporarily enhanced from `2,800 crore to `10,000 crore on March 24, 2020. The facility was available till April 17, 2020.
(vi) The CRR requirement of banks was reduced by 100 bps – from 4.0 per cent of net demand and time liabilities (NDTL) to 3.0 per cent of NDTL on March 27, 2020 – effective fortnight beginning March 28, 2020, for a period of one year ending March 26, 2021, augmenting primary liquidity in the banking system by about `1.37 lakh crore.
(vii) Taking cognisance of hardships faced by banks in terms of social distancing of staff and consequent strains on reporting requirements, the requirement of minimum maintenance of daily CRR balance was reduced from 90 per cent to 80 per cent effective from the fortnight beginning March 28, 2020. This dispensation was available up to September 25, 2020.
(viii) Banks’ limit for borrowing overnight under the marginal standing facility (MSF) by dipping into their statutory liquidity ratio (SLR) was raised to 3 per cent of NDTL from 2 per cent – effective up to March 31, 2021 – allowing them to avail additional liquidity under the LAF window at the reduced MSF rate.
(ix) Targeted long-term repo operations (TLTROs) of up to three years tenor at a floating rate linked to the policy repo rate for deployment in investment grade corporate bonds, commercial paper, and non-convertible debentures over and above the outstanding level of investments in these bonds as on March 27, 2020.
(x) Targeted long-term repo operations (TLTRO) 2.0 auctions in tranches of appropriate sizes, with at
least 50 per cent of the total amount availed going to small and mid-sized non-banking financial companies (NBFCs) and micro finance institutions (MFIs).
(xi) Special refinance facilities for a total amount of `75,000 crore at the policy repo rate to the National Bank for Agriculture and Rural Development (NABARD), the Small Industries Development Bank of India (SIDBI), the National Housing Bank (NHB) and the Export-Import Bank of India (EXIM Bank) to meet sectoral credit needs.
(xii) Special liquidity facility for mutual funds (SLF-MF) to alleviate intensified liquidity pressures from redemption burdens faced by MFs.
(xiii) As part of the Atmanirbhar Bharat package announced by GoI in May, a scheme was introduced through a Special Purpose Vehicle (SPV) to improve the liquidity position of NBFCs including MFIs and housing finance companies (HFCs) registered with the Reserve Bank for avoiding any potential systemic risks to the financial sector.
(xiv) Term repo operations at floating rates (i.e., at the prevailing repo rate) in September to assuage liquidity pressures on account of advance tax outflows. Banks that had availed of funds under LTROs (at 5.15 per cent) were allowed to reverse these transactions before maturity and avail fresh funds at 4 per cent (current repo rate).
(xv) From September 1, 2020, banks were allowed to hold fresh acquisitions of SLR securities under held to maturity (HTM) category up to an overall limit of 22 per cent (increased from 19.5 per cent) of NDTL up to March 31, 2021.
(xvi) Purchases of government securities under OMOs of `1.91 lakh crore since February 6 and up to September 30, 2020.
(xvii) In order to distribute liquidity more evenly across the yield curve and improve transmission, six ‘operation twist’ auctions were conducted in H1:2020-21 (on April 27, July 2, August 27, September 3, 10 and 17) for `10,000 crore each.11
11 While operation twist is intended to be liquidity neutral, the outcome of the 6 auctions resulted in net liquidity absorption of `2,768 crore (sales of `59,900 crore vis-a-vis purchases of `57,132 crore).

87
OCTOBER 2020Monetary Policy Report
RBI Bulletin October 2020
Overall, total liquidity support announced by the
Reserve Bank since February 6 (up to September 30,
2020) amounted to `11.1 lakh crore (5.5 per cent of
GDP) (Table IV.6).
Drivers and Management of Liquidity
During H1:2020-21, the key drivers of systemic
liquidity were currency in circulation (CiC), net forex
operations by the Reserve Bank and Government of
India (GoI) cash balances. The large expansion in CiC
was the major source of leakage, particularly during
Q1. Liquidity was augmented by a large drawdown of
excess CRR balances by commercial banks consequent
to the one percentage point reduction of CRR. While
the steady build-up of GoI cash balances in Q2
moderated the level of surplus, the Reserve Bank’s
forex purchase operations augmented systemic
liquidity throughout H1 (Chart IV.31a). In terms of
liquidity management, durable liquidity was injected
through TLTROs and OMO purchases (mainly in Q1),
while transient liquidity movements were managed
through LAF operations (Chart IV.31b).
CiC growth (y-o-y) of `2.36 lakh crore (9.6 per cent)
during H1:2020-21 significantly outpaced the
expansion of `49,378 crore (2.3 per cent) in H1:2019-20
(Chart IV.32). The large scale of CiC expansion
Table IV.6: Monetary and Liquidity Measuressince February 6
(up to September 30, 2020)(` crore)
Measures Announcement
LTRO 2,00,000
Variable rate repo 1,75,000
SLF for PDs 7,200
CRR cut 1,37,000
MSF (dip by 1% in SLR) 1,37,000
TLTRO 1,00,000
TLTRO (2.0) 50,000
Net OMO purchases 50,000
Special liquidity facility for mutual funds 50,000
Refinance to NABARD,SIDBI,NHB and EXIM bank 75,000
Special liquidity scheme for NBFCs 30,000
56-day term repo 1,00,000
Total 11,11,200
As proportion of GDP* (Per cent) 5.5
*: Nominal GDP 2019-20.Source: RBI.
Chart IV.31: Systemic Liquidity – Drivers and Management
a: Drivers b: Management
Note: (+) implies injection of liquidity while (-) implies absorption/leakage of liquidity; Data are based on the last Friday of the quarter.Source: RBI.
-4,00,000
-3,00,000
-2,00,000
-1,00,000
0
1,00,000
2,00,000
3,00,000
Q3:2019-20 Q4:2019-20 Q1:2020-21 Q2:2020-21
�cr
ore
CiC Net forex purchases GoI cash balances Excess CRR
-1,50,000
-1,00,000
-50,000
0
50,000
1,00,000
1,50,000
Q3: 2019-20 Q4: 2019-20 Q1:2020-21 Q2:2020-21
�cr
ore
Net OMO purchases LTRO TLTRO (1.0 + 2.0)
CRR reduction Net LAF operations

88
Monetary Policy Report OCTOBER 2020
RBI Bulletin October 2020
indicates heightened precautionary demand for cash
in a pandemic-stricken environment.
Fuelled by the infusion of `87,891 crore through
four TLTRO auctions in April, systemic liquidity
remained in abundance with average daily net
absorptions under the LAF progressively increasing
from `3.02 lakh crore in March to `4.75 lakh crore
in April and further to `5.31 lakh crore in May 2020,
notwithstanding large liquidity withdrawal from the
banking system due to CiC expansion (Chart IV.33).
Sustained government spending through higher
recourse to WMA/OD (average of `1.01 lakh crore and
`1.14 lakh crore in April and May, respectively) also
added to the liquidity surplus. With the onset of the
monsoon season, government spending decelerated
and GoI cash balances turned into surplus in June
(average of `34,838 crore); consequently, average
daily net absorptions under the LAF moderated to
`4.08 lakh crore. Overall, net average absorption of
surplus liquidity at ̀ 4.71 lakh crore in Q1:2020-21 was
the highest since January-March 2017 – the quarter
immediately following demonetisation.
Chart IV.32 Currency in Circulation
Source: RBI.
Surplus liquidity conditions persisted in Q2,
although with some moderation relative to Q1.
Large liquidity injection through the Reserve Bank’s
net forex purchase operations in July was offset by
moderate CiC expansion and gradual build-up of GoI
cash balances as government spending remained
subdued. Daily net absorptions under the LAF
averaged `3.95 lakh crore in July as average GoI cash
surplus increased to `95,938 crore. Thereafter, daily
net absorptions increased to ̀ 4.03 lakh crore in August
but moderated to `3.68 lakh crore in September due
to higher GoI cash surplus (average of `1.68 lakh crore
in August and `2.80 lakh crore in September). The
RBI also injected liquidity through OMO purchases,
particularly during Q1:2020-21. Total injection of
durable liquidity (including forex purchases, OMOs
and TLTRO) in H1:2020-21 amounted to `5.38 lakh
crore as compared to `5.86 lakh crore in H2:2019-20
(Chart IV.34).
Summing up, systemic liquidity surplus increased
during H1:2020-21 reflecting the conventional and
unconventional measures by the Reserve Bank to
Source: RBI.
Chart IV.33: Liquidity Management
0.0
5.0
10.0
15.0
20.0
25.0
-30,000
-20,000
-10,000
0
10,000
20,000
30,000
40,000
Y-o
-Y g
row
th (p
er c
ent)
Wee
kly
Var
iati
ons
(�cr
ore)
2019-20 2020-21
2019-20 (RHS) 2020-21 (RHS)
03-A
pr-2
0
10-A
pr-2
0
24-A
pr-2
0
08-M
ay-2
0
22-M
ay-2
0
05-Ju
n-2
0
19-Ju
n-2
0
03-Ju
l-20
17-Ju
l-20
31-Ju
l-20
14-A
ug-
20
28-A
ug-
20
11-S
ep-2
0
25-S
ep-2
0
Total repo (including LTRO and TLTRO) Total reverse repo
Marginal standing facility Net OMO sales (-)/purchases (+)
Net injection (+)/ absorption (-)
-9,00,000-8,00,000-7,00,000-6,00,000-5,00,000-4,00,000-3,00,000-2,00,000-1,00,000
01,00,0002,00,0003,00,000
1-O
ct-1
916
-Oct
-19
31-O
ct-1
915
-Nov
-19
30-N
ov-1
915
-Dec
-19
30-D
ec-1
914
-Jan-
2029
-Jan-
2013
-Feb
-20
28-F
eb-2
014
-Mar
-20
29-M
ar-2
013
-Apr
-20
28-A
pr-2
013
-May
-20
28-M
ay-2
012
-Jun-
2027
-Jun-
2012
-Jul-2
027
-Jul-2
011
-Aug
-20
26-A
ug-2
010
-Sep
-20
30-S
ep-2
0
�cr
ore

89
OCTOBER 2020Monetary Policy Report
RBI Bulletin October 2020
Chart IV.34: Durable Liquidity Injections
Note: Data are based on the last Friday of the quarter.Source: RBI.
Chart IV.35: Discretionary Liquidity, Autonomous Drivers and Reverse Repo
Note: Data are based on a weeekly basis (as on Friday).Source: RBI.
of capital inflows is an indicator of growing investor
confidence in the Indian economy. The pace of
monetary transmission has also quickened, but credit
growth remains feeble, clouding the outlook. Going
forward, liquidity conditions would continue to be
calibrated, consistent with the stance of monetary
policy while ensuring normalcy in the functioning
of financial markets and institutions and conducive
financial conditions. Efficient monetary policy
transmission, particularly to the credit market, would
continue to assume priority in the hierarchy of policy
objectives.
ensure conducive financial conditions and stability in
financial markets and institutions. The extent of the
surplus is gauged from the large amounts absorbed
under the reverse repo facility, which peaked at more
than `8.5 lakh crore on May 5, 2020 (Chart IV.35).
IV.4 Conclusion
Domestic financial markets have gradually
regained normalcy in the wake of sizable conventional
and unconventional measures by the Reserve Bank.
Turnover in various market segments is increasing
and spreads have narrowed appreciably. The return
-9,00,000-8,00,000-7,00,000-6,00,000-5,00,000-4,00,000-3,00,000-2,00,000-1,00,000
01,00,0002,00,0003,00,0004,00,0005,00,000
�cr
ore
Reverse repo
Discretionary liquidity (LTROs, TLTROs and OMOs)
Forex operations GoI cash balances
29-M
ay-2
0
03-Ja
n-20
24-Ja
n-20
14-F
eb-2
0
06-M
ar-2
0
27-M
ar-2
0
17-A
pr-2
0
08-M
ay-2
0
19-Ju
n-20
10-Ju
l-20
31-Ju
l-20
21-A
ug-2
0
25-S
ep-2
0

90
Monetary Policy Report OCTOBER 2020
RBI Bulletin October 2020
The global economy is still reeling under the impact of the unprecedented shock caused by COVID-19. Even as high frequency indicators suggest that the economic activity may have begun to bottom out in Q3, the near-term outlook remains hostage to the virus and the attendant uncertainty regarding its vaccine. Inflation has remained largely subdued and below central banks’ target for advanced economies (AEs) as also for some emerging market economies (EMEs). Monetary policy remained highly accommodative with key policy rates reduced to their lowest level in most countries. Global financial markets remained buoyant, supported by signals that the highly accommodative monetary policy would continue for long.
The pandemic has plunged the global economy
into its deepest contraction in history in Q2:2020.
World merchandise trade volume contracted by 14.3
per cent (q-o-q) in Q2. Just as various economies
were engaging in unlocking activity, and a general
sense emerging of the global economy stabilising
and getting poised for a recovery in Q3, fresh waves
of infections have surged, threatening these positive
impulses. Meanwhile, commodity prices have firmed
up, pushing up inflation. Although headline and core
inflation remain subdued and below target in several
economies, food price pressures are firming up.
Global spillovers have accentuated, mainly through
financial channels. Although financial markets have
recovered from the panic sell-offs in Q1:2020 and
capital flows to EMEs have resumed on the return
of risk sentiment, asset prices are volatile, out of
alignment with underlying fundamentals, and the
outlook is uncertain. Monetary policy guidance
from systemic central banks has led to weakening
of the US dollar with corresponding appreciation in
other currencies, especially EME currencies, with
implications for export performance and growth.
In addition, disruptions in global value chains
(GVCs) have amplified supply shocks inflicted by the
pandemic.
Some near-term indicators have improved. Global
purchasing managers’ index (PMI) indicates that on a
month-on-month basis, the output and new orders as
also business sentiments have revived since July and new export orders returned to growth in September. The recovery, however, is nascent and hinges on the duration of the pandemic and discovery of the vaccine.
Underlying the stabilisation of financial markets, the easing of financial conditions and the hesitant recovery is the unprecedented policy response of monetary and fiscal authorities. These actions have led to a renewal of risk appetite and search for yields, slowing the precautionary flight to cash. Notwithstanding this defence, the outlook is highly uncertain, policy space is largely used up and the virulence of the pandemic is yet to abate for recovery to gain traction.
V.1 Global Economic Conditions
In the US, GDP growth contracted by a record 31.4 per cent [q-o-q, seasonally adjusted annualised rate (SAAR)] in Q2:2020, marking the worst plunge since the present GDP series began in 1947. Coming on the heels of a 5.0 per cent contraction in Q1:2020, the US economy was pushed into a technical recession (Table V.1). Most US states imposed complete shutdowns in April and for most part of May with only gradual and uneven reopening and relaxation in preventive measures towards the end of the quarter. While the unemployment rate has declined markedly from an all-time high in April, it remains much above the pre-COVID level. Industrial output continued to contract through August, though the momentum appears to be picking up as reflected in robust growth in retail sales since end of Q2. The manufacturing PMI moved back into expansion zone from June. The
recent resurgence of COVID-19 cases has increased
downside risks as many states hold off or reverse
unlocking.
V. External Environment

91
OCTOBER 2020Monetary Policy Report
RBI Bulletin October 2020
Economic activity in the Euro area plunged at a
record pace in Q2 as frozen business and household
activity caused by stringent lockdowns and social
distancing measures inflicted an unprecedented
blow to all constituent economies. GDP of the Euro
area contracted by 39.4 per cent (q-o-q, SAAR) in
Q2 – the sharpest since the series began in 1995 – following a contraction of 14.1 per cent in Q1.
Industrial production and retail sales collapsed, while employment situation and consumer sentiments worsened in April-May as most member countries adopted extensive and prolonged lockdown measures to fight the health crisis. With retail sales improving in June and the composite PMI moving back into the expansion zone in July, the Euro economy exhibited signs of recovery in the early part of Q3. However, the momentum has slowed down as increase in fresh wave of infections prompted some countries in the region to reinstate restrictions.
The Japanese economy contracted by 28.1 per cent (q-o-q, SAAR) per cent in Q2, marking the third straight quarter of contraction and the steepest on record, as private consumption and industrial production slumped, while public spending and business fixed investment declined sharply following the nation-wide state of emergency. Furthermore, plummeting exports on disrupted supply chains and weak external demand led to further deterioration in economic conditions. While gradual reopening, both domestically and abroad, has eased demand and supply conditions and helped stabilise manufacturing activity, available high frequency indicators remained in contraction zone through August.
The UK economy fell into a technical recession in Q2 as prolonged confinement measures weighed heavily on economic activity. While the economy rebounded in June as gradual withdrawal of restrictions released pent-up demand, it was not strong enough to offset the magnitude of economic slack that the country experienced during the period of complete shutdown. The recovery continued into Q3 as both manufacturing and services PMI strengthened since July on robust output and new orders, reflecting improved consumer and business spending. The unemployment rate, however, remains high and investment intentions have remained weak. In September, some lockdown measures were re-
imposed as a second wave of infections hit the UK.
Table V.1: Real GDP Growth (Per cent)
Country Q2-2019
Q3-2019
Q4-2019
Q1-2020
Q2-2020
2020 (P)
2021 (P)
Quarter-over-quarter (q-o-q) seasonally adjusted, annualised rate
Canada 3.4 1.1 0.6 -8.2 -38.7 -8.4 4.9
Euro area 0.5 1.3 0.2 -14.1 -39.4 -10.2 6.0
Japan 1.6 0.2 -7.0 -2.3 -28.1 -5.8 2.4
South Korea 4.1 1.5 5.4 -5.0 -12.0 -2.1 3.0
UK -0.1 1.3 0.6 -9.7 -58.7 -10.2 6.3
US 1.5 2.6 2.4 -5.0 -31.4 -8.0 4.5
Year-on-year (y-o-y)
Advanced Economies
Canada 2.0 1.6 1.5 -0.9 -13.0 -8.4 4.9
Euro area 1.2 1.4 1.0 -3.2 -14.7 -10.2 6.0
Japan 0.9 1.7 -0.7 -1.8 -9.9 -5.8 2.4
South Korea 2.1 2.0 2.3 1.4 -2.7 -2.1 3.0
UK 1.3 1.0 1.0 -2.1 -21.5 -10.2 6.3
US 2.0 2.1 2.3 0.3 -9.0 -8.0 4.5
Emerging Market Economies
Brazil 1.1 1.2 1.7 -0.3 -11.4 -9.1 3.6
China 6.2 6.0 6.0 -6.8 3.2 1.0 8.2
India 5.2 4.4 4.1 3.1 -23.9 -4.5 6.0
Indonesia 5.1 5.0 5.0 3.0 -5.3 -0.3 6.1
Philippines 5.5 6.0 6.7 -0.7 -16.5 -3.6 6.8
Russia 1.1 1.5 2.1 1.6 -8.0 -6.6 4.1
South Africa 0.9 0.1 -0.5 0.1 -17.1 -8.0 3.5
Thailand 2.4 2.6 1.5 -2.0 -12.2 -7.7 5.0
Memo: 2019 (E) 2020 (P) 2021 (P)
World Output
2.9 -4.9 5.4
World Trade Volume
0.9 -11.9 8.0
E: Estimate P: Projection q-o-q: quarter-over-quarter y-o-y: year-on-year Note: India's data correspond to fiscal year (April-March). Sources: Bloomberg; and International Monetary Fund.

92
Monetary Policy Report OCTOBER 2020
RBI Bulletin October 2020
Table V.2: Select Macroeconomic Indicators for BRICS
Country 2013 2019 2020(P) Country 2013 2019 2020(P)
Real GDP growth rate (per cent)
Brazil 3.0 1.1 -9.1 General Govt. gross debt (as per cent of GDP)
Brazil# 60.2 89.5 102.3
Russia 1.8 1.3 -6.6 Russia 13.1 13.9 18.5
India 6.4 4.2 -4.5 India 67.4 72.2 84.0
China 7.8 6.1 1.0 China 37.0 52.0 64.1
South Africa 2.5 0.2 -8.0 South Africa 44.1 62.2 79.9
Inflation rate (per cent) Brazil 6.2 3.7 3.6 CAB as per cent of GDP Brazil -3.2 -2.7 -1.8
Russia 6.8 4.5 3.1 Russia 1.5 3.8 0.7
India 9.4 4.5 3.3 India -1.7 -1.1 -0.6
China 2.6 2.9 3.0 China 1.5 1.0 0.5
South Africa 5.8 4.1 2.4 South Africa -5.8 -3.0 0.2
General Govt. net lending/borrowing (as per cent of GDP)
Brazil -3.0 -6.0 -9.3 Forex reserves* (in US$ billion)
Brazil 358.8 356.9 356.5
Russia -1.2 1.9 -4.8 Russia 510.1 554.4 594.5
India -7.0 -7.4 -7.4 India 294.8 461.8 545.5
China -0.8 -6.4 -11.2 China - 3388.7 3464.2
South Africa -4.3 -6.3 -13.3 South Africa 49.6 55.1 55.7
P: Projection *: Data on forex reserves for 2020 pertains to the forex reserves holding as of August 2020 for all countries except for China whose data was avaialble till July 2020.#: Gross debt refers to the non-financial public sector, excluding Eletrobras and Petrobras, and includes sovereign debt held by the central bank.Notes: India's data correspond to fiscal year (April-March). Data for India are IMF's projections.Sources: WEO, IMF; and IRFCL, IMF.
The Chinese economy bounced back in Q2
with GDP growing at 3.2 per cent (on y-o-y basis) as
against a record contraction of 6.8 per cent in Q1. The
turnaround was spearheaded by rising investment in
infrastructure, supported by government spending, and
increase in exports of medical products and electronics.
The uptrend continued into Q3 as exports improved
further since July amidst a modest improvement in
external demand, and industrial production remained
stable despite heavy floods experienced in some parts
of the country. Manufacturing activity as measured by
the manufacturing PMI recorded expansion in each
month since May, supported by rising output and
new orders. On the other hand, retail sales remain
weak on depressed private consumption under social
distancing measures. While the Chinese economy
is expected to maintain the pace of its recovery, the
prolonged global downturn, re-escalating tensions
with the US and persistent risk of a second wave of
COVID-19 infections remain major headwinds, going
forward.
Among other BRICS countries, economic activity
plunged markedly in Q2. Brazil, India and Russia are
among the top five COVID-19 infected countries in the
world. Key macroeconomic indicators among BRICS
nations suggest that macroeconomic performance in
2020 could worsen further (Table V.2).
The Russian economy shrank in Q2, birched by
the pandemic induced lockdowns and sharp fall in oil
prices. All sectors, barring agriculture, were severely
impacted amidst stringent measures adopted to
stem the pandemic. Industrial production and retail
sales contracted through August on muted business
and consumer confidence, while the unemployment
rate has risen. The Brazilian economy entered into a
technical recession in Q2, following sharp declines
in household consumption, industrial and services
sector activity. The growth outlook remains clouded
as external demand is expected to remain weak, while
domestic spending and industrial activity are likely
to stay subdued with social distancing measures in

93
OCTOBER 2020Monetary Policy Report
RBI Bulletin October 2020
place. The South African economy experienced a
severe disruption in Q2, the steepest on record, as
industrial production and retail sales plummeted
to record low levels in April and remained in
contraction through the entire quarter. South-East
Asian countries also registered sharp contraction in
Q2, in tandem with other major EMEs and AEs as
economic activity came to near standstill following
widespread lockdowns.
The global composite PMI moved back to
the expansion zone in July and improved further
in August and September after remaining in
contraction for five months and a record low level
in April. The revival in output and new orders as
also improved business optimism, led the recovery
(Chart V.1a). Among OECD economies, composite
leading indicators (CLIs) suggest firming up of the
growth momentum across major AEs and EMEs since
June, recovering from lows in April. Notwithstanding
the recovery, the levels still remain below the long-
term trend and much lower than the pre-COVID levels
(Chart V.1b).
Global trade which was sluggish prior to the
outbreak of COVID-19, moved into deep contraction
in Q2:2020, with AEs contributing more to the decline
than EME peers (Chart V.2a). The WTO’s Goods Trade
Barometer posted a steep decline – its constituent
indices pertaining to automotive products and air
freight contracted, although components such as
export orders witnessed incipient signs of recovery,
and contraction eased in electronic components and
raw materials.
Forward looking indicators also suggest a
tentative nascent recovery in world trade. The Baltic
Dry Index, that had declined sharply during H2:2019
and Q1:2020, recovered sharply in June but has
since softened moderately (Chart V.2b). However,
uncertainty over a possible recovery remains a
cause of concern due to rise in fresh virus cases in
some parts of Europe, along with the rapid spread
Chart V.1: Survey Indicators
Source: Bloomberg; and OECD.
a: Composite PMI b: OECD CLIs
86
88
90
92
94
96
98
100
102
104
Jan-
19Fe
b-19
Mar
-19
Apr
-19
May
-19
Jun-
19Ju
l-19
Aug-
19Se
p-19
Oct
-19
Nov
-19
Dec
-19
Jan-
20Fe
b-20
Mar
-20
Apr
-20
May
-20
Jun-
20Ju
l-20
Aug-
20
Inde
x
US Japan Brazil
Russia South Africa China
Euro Area

94
Monetary Policy Report OCTOBER 2020
RBI Bulletin October 2020
After the 1990s, international trade proliferated on the back of the rise of global value chains (GVCs) which contributed to increase in productivity and came to be viewed as a fast track to industrialisation for the emerging market economies (Baldwin, 2011; Ignatenko et al., 2019). After the global financial crisis, however, GVCs slowed down with the confluence of protectionist trade policies. More recently, COVID-19 has accentuated the contraction in global trade volumes with major supply disruptions – around 80 countries have imposed export restrictions and prohibitions on medical supplies and pharmaceuticals (WTO, 2020).
A survey of 23 industry value chains conducted by Mckinsey Global Institute (2020) revealed that the semiconductor industry, followed by communication equipment, medical devices, pharmaceuticals, aerospace, automobile, machinery and chemical industry would be the most affected by trade-related disruptions (Chart V.1.1a). The apparel industry followed by aerospace, furniture and petroleum products, transport, automobile and textile would be exposed to higher risks
(contd.)
Box V.1: Global Value Chains: Regaining Foothold
during the pandemic (Chart V.1.1b). The survey estimates that potential restructuring in global value chains could shift 16 to 26 per cent (US$ 2.9 trillion to US$ 4.6 trillion) of global goods exports to new countries in the next five years. It identifies three sectors, viz., pharmaceuticals, petroleum and apparel where the shift in supply chain networks might happen (McKinsey Global Institute, 2020).
The extent to which a country is integrated into these supply chains can be measured by the GVC participation index, which is a sum of backward and forward linkages. With the pandemic expected to diversify the supply chains from the current manufacturing hub, beneficiaries could be countries such as Vietnam, Mexico and India. The determinants of GVC participation such as economic fundamentals, factor endowments, geography, market size and institutional environment can be examined in an empirical framework (Fernandes et al., 2020) specified as follows:
Vit = a0 + ai X it + Tt + eit
in major EMEs. The pandemic has also exposed the
integrated global economy to significant supply chain
disruptions reconfiguring the global value chains
(Box V.1).
Chart V.2: World Trade Volume
Source: CPB Netherlands; and CEIC.
a: World Trade Volume: Relative Contribution b: Movement in World Trade Volume and Baltic Index
-20.0
-15.0
-10.0
-5.0
0.0
5.0
10.0
Q1
Q2
Q3
Q4
Q1
Q2
Q3
Q4
Q1
Q2
Q3
Q4
Q1
Q2
Q3
Q4
Q1
Q2
July
2016 2017 2018 2019 2020
Perc
enta
gepo
ints
EMEs AEs World Trade (per cent, y-o-y)
-5.5
-1.1
-6.6
-60.0
-40.0
-20.0
0.0
20.0
40.0
60.0
80.0
100.0
-21.0
-18.0
-15.0
-12.0
-9.0
-6.0
-3.0
0.0
3.0
6.0
Feb-
17A
pr-1
7Ju
n-17
Aug-
17O
ct-1
7D
ec-1
7Fe
b-18
Apr
-18
Jun-
18Au
g-18
Oct
-18
Dec
-18
Feb-
19A
pr-1
9Ju
n-19
Aug-
19O
ct-1
9D
ec-1
9Fe
b-20
Apr
-20
Jun-
20
Per
cent
,y-o
-y
Per
cent
,y-o
-y
World Trade Baltic Dry Index (RHS)
-6.6
-12.8

95
OCTOBER 2020Monetary Policy Report
RBI Bulletin October 2020
(contd.)
Chart V.1.1: Exposure of Industry Value Chains to Shocks
Note: Chart considers exposure to shocks, but no action taken to build resilience or mitigate impact. Source: McKinsey Global Institute.
a: Trade b: Pandemic
where the dependent variable (V) is either backward or forward participation expressed in logarithmic terms and subscripts i and t represent country and time period, respectively. X represents a vector of trade policy related explanatory variables viz., net foreign direct investment (FDI) inflows; weighted average tariff rates; resource endowments, viz., ratio of capital to GDP, ratio of land to GDP and rents from resources; domestic industrial capacity measured in terms of manufacturing sector’s value-added; logistic performance index; political stability and distance from GVC hub e.g., the US, Germany and China. Variable Tt controls for time fixed effects. The model is estimated on 144 countries for the period 1990-2018 using UNCTAD (Eora database).
The decomposition of backward participation reveals that better logistic performance, higher capital endowment, stable political environment and higher FDI are central to strengthening backward linkages in the supply chain. These results assume significance in the context of several initiatives to strengthen logistic infrastructure through national trade facilitation plan which aims to transform the trade ecosystem by reducing the time and cost of doing business. Consequently, relaxation in
local procurement norms for single-brand retail trade has generated interest among global tech and retail giants such as Apple and Ikea. Manufacturing units in India may provide a unique opportunity to expand the country’s foothold in GVCs. Lower tariff rates and better connectivity with the GVC hub can also contribute to stronger backward linkages. However, the estimates also show that countries with a larger domestic industrial capacity exhibit lower backward participation as they may rely less on imported inputs and use more domestic inputs for exports (Chart V.1.2a).
Countries with better performance in logistics, lower distance from the GVC hub and greater land and natural resource endowment exhibit significantly stronger forward participation than peers (Chart V.1.2b). As in the case of backward linkages, a country’s capital affects forward participation positively, though the effect is not statistically significant. Countries seeking to expand foothold in GVCs need to lower trade barriers, demonstrate higher reliance on regional or free trade agreements, provide cutting edge logistics infrastructure, increase industrial capacity and strengthen political stability.
Phar
mac
euti
cal
Med
ical
dev
ices
Food
and
beve
rage
Agr
icul
ture
Sem
icon
duct
ors
and
com
pone
nts
Basi
c m
etal
Elec
tric
al e
quip
men
tC
hem
ical
Com
pute
rs a
nd e
lect
roni
csFa
bric
ated
met
al P
rodu
cts
Com
mun
icat
ion
equi
pmen
tW
oode
n Pr
oduc
tsG
lass
, cem
ent a
ndce
ram
ics
Min
ing
Mac
hine
ryan
d eq
uipm
ent
Rubb
er a
ndpl
asti
cTe
xtile
Auto
mot
ive
Tran
spor
tati
onEq
uipm
ent
Petr
oleu
m P
rodu
cts
Furn
itur
eA
eros
pace
App
arel
High
Low
Global innovations (11) Resource-intensive (5)
Regional processing (4) Labor-intensive (3)

96
Monetary Policy Report OCTOBER 2020
RBI Bulletin October 2020
V.2 Commodity Prices and Inflation
Global commodity prices fell sharply in March-
April, with oil prices plunging to record lows as
lockdowns across countries depressed demand.
From May, however, prices recovered as demand
prospects improved following the gradual withdrawal
of lockdown restrictions. The Bloomberg commodity
price index increased by 14.5 per cent between April
and September.
The food price index of the Food and Agriculture
Organization (FAO) increased by 1.0 per cent
between April and August. Global food prices eased
since February before witnessing some uptick
in June on the back of rising vegetable oil, dairy
products and sugar prices. Excess stockpiles amidst
weakening external demand, diminishing restaurant
sales and reduced demand from food manufacturers
resulting from COVID-19 restrictions, pulled down
prices for most food products between February
and May. However, since June, food prices have
edged up as global import demand improved, while
export supplies tightened due to weather shocks
and production slowdown across major producing
countries (Chart V.3a).
References:
Baldwin, R. (2011), “Trade and Industrialisation after Globalisation’s 2nd Unbundling: How Building and Joining a Supply Chain are Different and Why It Matters”, NBER Working Paper 17716.
Fernandes, A., H. L. Kee and D. Winkler (2020), “Determinants of Global Value Chain Participation: Cross-Country Evidence”, World Bank.
Ignatenko, A., F. Raei and B. Mircheva (2019), “Global Value Chains: What are the Benefits and Why Do Countries Participate?”, IMF Working Papers, WP/19/18.
Mckinsey Global Institute (2020), Risk, Resilience and Rebalancing in Global Value Chains.
World Trade Organization (2020), Export Prohibitions and Restrictions.
Chart V.1.2: GVC – Forward and Backward Participation
Note: (1) The analysis is based on a five-year average of the variables. GVC participation and factors exhibit more variation in a five-year span compared to year-on-year variation.
(2) The dependent variable is average backward or forward participation in logarithmic terms. The variable “distance” is the distance from the GVC hub, i.e., the average distance of the country from China, the US and Germany. Resources/GDP represents rent from resources as a ratio of gross domestic product and DIC represents domestic industrial capacity.
(3) The slope coefficients of the determinants are shown as bars in the chart. Regression coefficients with *, ** and *** reflects significance at 1, per cent, 5 per cent and 10 per cent, respectively.
Source: UNCTAD (Eora); and RBI staff estimates.
a: Backward Participation b: Forward Participation

97
OCTOBER 2020Monetary Policy Report
RBI Bulletin October 2020
Crude oil prices plunged in March-April,
with West Texas Intermediate (WTI) prices falling
below zero to US$ (-)37.63 per barrel on April 20,
2020, as the unprecedented shock due to COVID-19
amidst the escalating Saudi-Russia price war over
production cuts, flooded the oil market with excess
supply. Crude oil prices have increased since then,
recouping April losses, as optimism on demand
following gradual withdrawal of lockdown in some
countries and continued production cut by major
energy producers buoyed sentiments. Major oil
producers, both inside and outside the Organization
of the Petroleum Exporting Countries (OPEC)
planned to partially restore production from August
following the cuts agreed to in the OPEC plus
agreement of April, and this kept oil price range
bound in July. Oil price firmed up for the larger part
of August on news of falling inventories and recovery
in fuel demand. However, the rally lost steam in
September as fears of a second wave of COVID-19
infections, lack of visibility of the expected demand
recovery and ramping up of production by some
smaller OPEC members changed expectations again
(Chart V.3b).
Base metal prices, measured by the Bloomberg’s
base metal spot index, increased by 27.5 per cent
between April and September 2020 as against a
decline of 19.3 per cent in Q1 and regained all the
losses incurred after the outbreak of COVID-19.
Most industrial metal prices have exhibited bullish
movements since April-May, underpinned by China’s
restocking due to its early recovery and the massive
stimulus packages by global central banks. Gold
prices remained elevated, increasing by almost 24.3
per cent on a year-to-date (YTD) basis (till September
30, 2020) as heightened uncertainties and highly
accommodative policies of central banks continue
to boost the safe haven appeal of the yellow metal,
pushing prices above the US$ 2000 mark in early
August. However, the bullion witnessed sell-offs in
mid-August on Russia’s announcement of potential
vaccine and profit booking by investors and have
remained broadly range bound for larger part of
September before falling by 3.3 per cent in last week
on strong US dollar and flight to cash (Chart V.4).
CPI inflation remained largely benign in major
AEs, but exhibited modest upticks in some EMEs
since June. Barring India, inflation remained at sub-
Chart V.3: Commodity Prices
Source: Food and Agriculture Organization (FAO); and World Bank.
a: FAO Food Price Indices b: Energy and Crude Oil Prices

98
Monetary Policy Report OCTOBER 2020
RBI Bulletin October 2020
target levels in most of the AEs and EMEs, reflecting
subdued demand amid lockdowns (Table V.3).
In the US, inflation measured by the personal
consumer expenditures (PCE) price index eased
during February-June on the back of subdued
aggregate demand and lower consumer energy prices.
Although it has edged up since June, the pick up has
been modest and drawing strength from the recovery
in spending for consumer goods and services due
to resumption of activities. Notwithstanding the
increase, the PCE price index based inflation remained
well below the Fed’s 2 per cent target. In the Euro area
too, actual inflation remained much below the target
as prices have edged down since March and inflation
rate slipped below zero since August on falling prices
of energy products and non-energy industrial goods.
In Japan, CPI inflation remained subdued, despite a
slight uptick in July, on weak core consumer prices
and inflation expectations. In the UK, rising prices of
recreation and culture activities led to an increase in
CPI inflation in June-July; however, inflation edged
down in August on easing meal prices led by the ‘Eat
Out to Help Out’ scheme by the Government, falling
air fares and clothing prices (Chart V.5a).
CPI inflation across major EMEs eased during
March-May on weak demand and depressed global
Chart V.4: Metal Price Indices
Source: Bloomberg.
Table V.3: Inflation Performance(Per cent)
Country Target Q2-2019 Q3-2019 Q4-2019 Q1-2020 Q2-2020
Advanced Economies
Canada 2.0 2.1 1.9 2.1 1.8 0.0Euro area 2.0 1.4 0.9 1.0 1.1 0.2Japan 2.0 0.8 0.3 0.5 0.5 0.1South Korea 2.0 0.7 0.1 0.3 1.2 -0.1UK 2.0 2.0 1.8 1.4 1.7 0.6US 2.0 1.5 1.5 1.5 1.7 0.6
Emerging Market Economies
Brazil 4.0 ± 1.5 4.3 3.2 3.4 3.8 2.1Russia 4.0 5.0 4.3 3.4 2.4 3.1India 4.0 ± 2.0 3.1 3.5 5.8 6.7 6.2South Africa 3.0-6.0 4.5 4.1 3.8 4.4 2.4Indonesia 3.0 ± 1.0 3.1 3.4 2.9 2.9 2.3Philippines 3.0 ± 1.0 3.0 1.7 1.5 2.7 2.3Thailand 1.0-3.0 1.1 0.6 0.4 0.4 -2.7
Notes: (1) The ECB aims at inflation rates of below, but close to, 2% over the medium term. The Federal Reserve in August 2020 adopted a new policy strategy of ‘average inflation targeting’ under which it would allow the inflation rate to go above the target of 2 per cent rate for brief periods to make up for the shortfall from the targets in earlier periods. Central Bank of Canada aims to keep inflation at the 2 per cent mid-point of an inflation control target range of 1-3 per cent.
(2) Brazil’s, Indonesia’s and Thailand’s inflation target for 2019 were 4.25 ± 1.5 per cent, 3.5 ± 1 per cent and 2.5 ± 1.5 per cent, respectively.
(3) Quarterly inflation numbers are monthly averages. (4) India’s inflation is based on calendar year basis. Data for
Q2:2020 refer to June only as NSO did not provide inflation rates for April and May.
Sources: Central Bank Websites; and Thomson Reuters.

99
OCTOBER 2020Monetary Policy Report
RBI Bulletin October 2020
crude oil prices, but has recorded modest increases
since June. Nonetheless, it remained below pre-
COVID-19 levels and even below central bank targets
for some economies. In China, consumer price
inflation edged up in June-July on higher food prices
resulting from an increase in pork prices and supply
disruptions caused by floods. However, it fell in
August as supply disruptions eased, restoring demand-
supply balance. In Brazil, CPI inflation has recorded
modest gains since June on the back of rising prices
for transportation, increasing housing prices and cost
of health and personal care, but remains below the
central bank’s target. CPI inflation in South Africa
started picking up in June and moved back into the
central bank’s target range of 3-6 per cent since July,
primarily driven by high prices of food and beverages.
CPI inflation in Russia, unlike its peers, has been
increasing since March, with only a modest drop in
May. Increasing food, non-food and services prices
amidst supply disruptions and the gradual release
in pent-up demand as also weak ruble, supported
the uptrend. However, inflation remains below the
central bank’s target of 4 per cent through September
(Chart V.5b).
V.3 Monetary Policy Stance
With the onset of the pandemic, fiscal authorities
around the world have unveiled stimulus packages
to overcome the downturn. Estimates as of mid-June
2020 by the IMF show more aggressive support by
the AEs (Table V.4). Central banks have also provided
unprecedented monetary accommodation. The key
Table V.4: Fiscal Support in Response to COVID-19 (Amount in US$ billion; Per cent as proportion of GDP)
Country Amount Per cent
Advanced Economies - 19.8Canada 137 8.9
European Union 484 4.1
Japan 1720 35.4
UK 578 23.0
US 2953 14.8
Emerging Market Economies - 5.1Brazil 157 11.9
China 705 4.6
India 180 6.1
Indonesia 40 3.6
Russia 40 2.9
South Africa 26 9.6
Thailand 61 11.8
Source: WEO Update, June 2020, IMF.
Chart V.5: CPI Inflation (y-o-y) – Select Economies
Source: Bloomberg.
a: Advanced Economies b: Emerging Market Economies

100
Monetary Policy Report OCTOBER 2020
RBI Bulletin October 2020
policy rates are at their lowest level in most countries.
One important difference is that while the AE central
banks used up the limited policy space available
to them in March, the EMEs continued to cut rates
through Q2 and Q3 of 2020.
In August 2020, following a comprehensive and
a public review of its monetary policy strategy, tools
and communication practices, the Federal Reserve
announced its new monetary policy strategy under
which it seeks to achieve inflation that averages 2 per
cent over time. As per this ‘flexible average inflation
targeting’ paradigm, the Fed would allow the inflation
rate to be moderately above the 2 per cent rate for brief
periods to make up for the shortfall from the target
in earlier periods. Furthermore, according primacy to
maximum employment, the Fed would henceforth
respond to ‘shortfalls’ of the employment from its
maximum level rather than its ‘deviations’.
As regards the actual conduct of monetary policy,
the US Fed has maintained a pause on the target
range of the policy rate in all Federal Open Market
Committee (FOMC) meetings since the emergency rate
cut in mid-March. In April 2020, the Fed announced
the Main Street Lending Programme, a package of
support for households and businesses, worth US$ 2.3
trillion. Since June, the Fed has indicated that it would
continue asset purchases at the current pace over the
coming months to sustain smooth market functioning.
In its September meeting, the first after the adoption
of the new monetary policy framework, the Fed stated
that it would keep the target range for the federal
funds rate at 0-0.25 per cent till labour conditions
become consistent with the FOMC’s assessment of
maximum employment and inflation has risen to 2 per
cent and moderately exceeds it for some time. In Q3,
the Fed increased the duration and made favourable
changes to the scope as also pricing of several facilities
announced in March/ April in response to COVID-19.
Some facilities1 that were to expire in September
have been extended up to December 2020, while
the temporary US dollar liquidity swap lines and the
temporary repurchase agreement facility for foreign
and international monetary authorities (FIMA repo
facility) have been extended up to March 2021.
The European Central Bank (ECB) has not changed
key rates in response to the pandemic so far. In its
April 2020 meeting, the ECB eased conditions for
accessing targeted longer-term refinancing operations
(TLTRO III) and introduced a new series of non-
targeted pandemic emergency longer-term refinancing
operations (PELTROs) to support liquidity conditions
in the euro area financial system. In its June meeting,
the ECB expanded the envelope for the pandemic
emergency purchase programme (PEPP) by 600 billion
(about US$ 530 billion)2 to a total of 1,350 billion
(about US$ 1192 billion), while also extending the
time horizon for net purchases under the programme
to June 2021. There were no new announcements in
the two meetings in Q3.
The Bank of Japan (BoJ) has also not changed key
rates in response to the pandemic. In April, the BoJ
announced significant enhancement of monetary
easing including removing the limit of 80 trillion yen
(about US$ 746 billion) on additional annual holdings
of government bonds. The limits on additional
purchases of commercial papers and corporate bonds
were enhanced. The BoJ also strengthened the Special
Funds-Supplying Operations to facilitate financing in
response to COVID-19. In May, it introduced a new
1 These include the Primary Dealer Credit Facility, the Money Market Mutual Fund Liquidity Facility, the Primary Market Corporate Credit Facility, the Secondary Market Corporate Credit Facility, the Term Asset-Backed Securities Loan Facility, the Paycheck Protection Program Liquidity Facility, and the Main Street Lending Program. 2 The US$ approximations for all the amounts mentioned in another currency in this Chapter are based on the exchange rate prevailing on the date/month of announcement of the particular measure.

101
OCTOBER 2020Monetary Policy Report
RBI Bulletin October 2020
measure under these operations for fund provisioning
against interest-free and unsecured loans. The
maximum amount of financing under the Special
Funds Supplying Operations is about 100 trillion yen
(about US$ 933 billion).
The Bank of England (BoE) has maintained a pause
on the Bank Rate, which is at its all-time low of 0.1
per cent since March 2020. In its June meeting,
however, the BoE increased the target stock of
purchase of UK government bonds by an additional
£100 billion (about US$ 124 billion), taking the stock
of total asset purchases to £745 billion (about US$ 926
billion) for 2020. There were no new announcements
in its meetings held in Q3.
The Bank of Canada (BoC) has maintained a pause
on the policy rate at 0.25 per cent since March. In
April, the BoC announced new measures for provincial
bond and corporate bond purchases, a temporary
increase in weekly purchases of Treasury bills and
enhancement of funding under term repo facility to
two years. In June, with improvement in short-term
funding conditions, the BoC reduced the frequency
of term repo operations and its bankers’ acceptance
Chart V.6: Policy Rate Changes – Select Major Economies
Note: The policy rate changes are mapped to the time when the decision was announced and not when it took effect. Source: Bloomberg.
a: Advanced Economies b: Emerging Market Economies
purchase facility. The Reserve Bank of Australia (RBA)
maintained the targets for the cash rate and the yield
on 3-year Australian Government bonds at 25 basis
points each in its monthly meetings held during Q2
and Q3 of 2020. In September, the RBA announced an
increase in the size of its term funding facility and
extended it up to June 2021. The Reserve Bank of
New Zealand (RBNZ) maintained its policy rate at its
historic low of 0.25 per cent in each of its meetings
since April. The RBNZ, however, increased the limit
on its large scale asset purchase programme from
NZ$ 30 billion (about US$ 17 billion) to NZ$ 33 billion
(about US$ 20 billion) in April, to NZ$ 60 billion (about
US$ 36 billion) in May and further to NZ$ 100 billion
(about US$ 66 billion) in August.
The central banks of South Korea and Norway
were the only two AE central banks to effect a rate
cut beyond Q1:2020. Both reduced their policy rate by
25 bps each in May to 0.5 per cent and 0 per cent,
respectively (Chart V.6a). The Swedish Riksbank
maintained its policy rate at 0 per cent, but in its June
meeting it increased the amount of asset purchases
from SEK 300 billion (about US$ 30 billion) to SEK

102
Monetary Policy Report OCTOBER 2020
RBI Bulletin October 2020
500 billion (about US$ 54 billion) and extended the time period of the purchases up to June 2021, while also announcing purchase of corporate bonds from September onwards.
EMEs, on the other hand, continued to cut rates well into Q3. The People’s Bank of China (PBoC) effected a 20 bps cut in the one-year Loan Prime Rate (LPR) to 3.85 per cent in April and has maintained a pause since. Prior to the policy decision in April, the PBoC had reduced the interest rate on excess reserves to a record low of 0.35 per cent, while also reducing the reserve requirement ratio for smaller banks by one per cent. In May, the PBoC lowered the reserve requirement rate for all large financial institutions by another 150 basis points to 11 per cent.
Other BRICS central banks remained in accommodative mode. The central bank of Brazil reduced the Selic rate by 75 bps each in May and June, following it up with a 25 bps cut in August as inflation remained below the target. The central bank of Brazil took a pause in its September meeting, the first after nine consecutive rate cuts since August 2019. The Bank of Russia cut its policy rate by 50 bps, 100 bps and 25 bps in April, June and July, respectively before pausing in September. The South African Reserve Bank cut its policy rate by 100 bps, 50 bps and 25 bps in April, May and July, respectively, as overall risks to inflation outlook remained balanced and took a pause in September (Chart V.6b).
The central bank of Turkey cut its policy rate by 100 bps in April and 50 bps in May and maintained a pause thereafter. In August, the central bank increased the Turkish Lira and forex reserve requirement ratios for banks fulfilling real credit growth conditions. In September, however, the central bank increased its policy rate by 200 bps to restore the disinflation process and support price stability. The central bank of Mexico cut its policy rate by 50 bps in each month of Q2:2020 and effected 50 bps cut in August and another 25 bps cut in September. Bank Indonesia cut
its policy rate by 25 bps each in June and July and has maintained a pause since August. Amongst other major EME central banks, the Bank of Thailand and Bangko Sentral ng Pilipinas cut their rates in Q2 while Bank Negara Malaysia and the Central Bank of Sri Lanka reduced rates in both Q2 and Q3.
V.4 Global Financial Markets
Global financial markets went into a tailspin in March that continued up to March 23, 2020 when the US Federal Reserve announced extensive measures to support the economy, including removing the upper bound on its asset purchases. The announcements engendered a recovery in financial markets across the world. Aided by equally extensive and in some cases, co-ordinated monetary policy action by central banks, financing conditions have improved.
Among AEs, the US equity market has continued to recover from the slide in March, with intermittent corrections. In July, equity indices moved higher on prospects of successful development of a vaccine and better than expected corporate performance. Towards the end of July, there was some correction due to resurgence of infections and increasing tensions with China, but the exceptional performance of the prime technology companies helped in overriding the pessimism. In August, the S&P 500 index closed at all-time highs on seven occasions. It peaked further in early September followed by correction, with shares of technology companies registering a large decrease.
In the other major AEs, even as stock indices have been rising gradually, they are yet to recover year-to-date losses. In the Euro area, despite news on the finalisation of the Next Generation EU fund3, the stock
3 In July, the European Council has agreed on the Next Generation EU (NGEU) fund, under which 750 billion will be borrowed on the capital markets and spent only to address the challenges/consequences of the COVID-19 pandemic. Spending will commence in 2021, of which 390 billion will be in the form of grants. The debt issuance will end by 2026 and repayment will be scheduled until 2058.

103
OCTOBER 2020Monetary Policy Report
RBI Bulletin October 2020
market remained flat with differential pace of opening
of multiple economies and localised resurgence of
infections. The uptrend in the stock market in the UK
was even more gradual, with the country registering
the worst economic contraction among major AEs.
The stalemate over Brexit negotiations has dampened
sentiment on the outlook. Japanese stocks also slowly
recovered from the slide in the earlier part of the year
in Q2, and thereafter the index has almost stalled.
In the second half of September, stock markets in
the Euro area and UK corrected further with rising
possibility of a second wave of infections and need
for lockdown.
Stock markets in EMEs have seen rapid recovery,
starting from Q2 (Chart V.7). Risk-on sentiments
following massive monetary accommodation by
central banks led to resumption of capital flows to
EMEs, which have strengthened further in Q3. In
September, however, stock markets in EMEs have also
corrected on global cues.
The flight to cash phase in bond yields ended on
March 23, 2020. Thereafter, yields softened in AEs
and remained range-bound in Q2, in part due to the
Chart V.7: Equity Markets
Sources: Bloomberg; and RBI staff estimates.
a:Equity Indices (MSCI) b: Change in Equity Indices
unprecedented policy accommodation and continuing
safe haven demand. There has been some hardening
of yields in Q3 in the AEs, particularly in August,
mainly on account of mixed news on the economic
front (Chart V.8a). With renewed virus concerns,
safe haven demand for US Treasuries has resurged.
Yields in EMEs, on the other hand, have witnessed
considerable softening since Q2:2020 after the rout in
the earlier part of the year. This has been on the back
of large monetary loosening, including bond purchase
programmes undertaken by a few EME central banks.
China has, on the contrary, seen a rise in yields after
the pause following the 20 bps cut in policy rate in
April.
In currency markets, the US dollar has weakened
considerably since March 23, 2020. Expectations of
the policy rates staying low for a considerable time
horizon, largest number of COVID-19 infections and
fatalities in the world, grim employment news and
tensions with China have imparted weakness to the
US dollar (Chart V.8b). The euro has strengthened
considerably against the dollar. With resumption of
capital flows, most emerging market currencies have

104
Monetary Policy Report OCTOBER 2020
RBI Bulletin October 2020
strengthened since Q2:2020. However, the US dollar
strengthened in September on safe haven demand
as waning vaccine optimism amidst rising infections
in Europe and the UK and uncertainty regarding US
stimulus package triggered risk-off sentiments. The
MSCI Emerging Market Currency Index increased by
1.6 per cent in Q2:2020 and by a further 2.7 per cent
in Q3:2020.
V.5 Conclusion
In sum, the global economy is still reeling under
the impact of the unprecedented COVID-19 shock.
Even as high frequency indicators suggest that the
Chart V.8: Bond Yields and Currency Movements
Sources: Bloomberg.
a: 10-year Sovereign Bond Yields in Select AEs b: Currency Indices
economic activity may be beginning to bottom out
in Q3, the near-term outlook remains hostage to the
virus and attendant uncertainty around the discovery
of the vaccine. The slight uptick in inflation of some
EMEs in recent months notwithstanding, risks to the
recovery remain on the downside due to the sizeable
aggregate demand compression effect and continued
disruption of supply. As major central banks have
pledged to keep rates at the current historic low
levels and governments are implementing large fiscal
support programmes, the improvement in financing
conditions that is still unfolding should impart upside
to the recovery when it takes hold.

SPEECH
What Forces Could Drive the Recovery? Shaktikanta Das


SPEECH
RBI Bulletin October 2020 105
What Forces Could Drive the Recovery?
and a subsequent recovery is underway in several
economies, such as the USA, UK, Euro- area and
Russia. The global manufacturing and services PMIs
rose to 51.8 and 51.9, respectively, in August from
50.6 for both in July. Yet, infections remain stubbornly
high in the Americas and are increasing again in many
European and Asian countries, causing some of them
to renew containment measures.
On the back of large policy stimulus and
indications of the hesitant economic recovery, global
financial markets have turned upbeat. Equity markets
in both advanced and emerging market economies
have bounced back, scaling new peaks after the
‘COVID crash’ in February- March. Bond yields have
hardened in advanced economies on improvement in
risk appetite, fuelling shift in investor’s preferences
towards riskier assets. Portfolio flows to emerging
market economies (EMEs) have resumed, and this has
pushed up EME currencies, aided also by the US dollar’s
weakness following the Fed’s recent communication
on pursuing an average inflation target. Gold prices
moderated after reaching an all-time high in the
first week of August 2020 on prospects of economic
recovery.
Financial market conditions in India have eased
significantly across segments in response to the
frontloaded cuts in the policy repo rate and large
system-wide as well as targeted infusion of liquidity
by the Reserve Bank. Despite substantial increase
in the borrowing programme of the Government,
persistently large surplus liquidity conditions have
ensured non-disruptive mobilisation of resources at
the lowest borrowing costs in a decade. In August
2020, the yield on 10-year G-sec benchmark surged
by 35 basis points amidst concerns over inflation and
further increase in supply of government papers.
Following the Reserve Bank’s announcement of
special open market operations (OMOs) and other
measures to restore orderly functioning of the G-sec
market, bond yields have softened and traded in a
Thank you for this opportunity to interact with
eminent business leaders of India and distinguished
members of the Federation of Indian Chambers of
Commerce & Industry (FICCI). I wish to thank the
organisers for hosting this event, undeterred by this
still unfolding pandemic that, on a daily basis, tests
our resilience and capacity to save lives, households,
businesses and the economy.
The end-August press release of the National
Statistics Office (NSO) was a telling reflection of the
ravages of COVID-19. Nevertheless, high frequency
indicators of agricultural activity, the Purchasing
Managers’ Index (PMI) for manufacturing and
private estimates for unemployment point to some
stabilisation of economic activity in Q2, while
contractions in several sectors are also easing. The
recovery is, however, not yet fully entrenched and
moreover, in some sectors, upticks in June and July
appear to be levelling off. By all indications, the
recovery is likely to be gradual as efforts towards
reopening of the economy are confronted with rising
infections.
The global economy is estimated to have suffered
the sharpest contraction in living memory in April-
June 2020 on a seasonally adjusted quarter-on-quarter
basis. World merchandise trade is estimated to have
registered a steep year-on-year decline of more than
18 per cent in Q2 of 2020, according to the Goods
Trade Barometer of the World Trade Organisation
(WTO). High frequency indicators point to a trough
in global economic activity in April-June quarter
What Forces Could Drive the Recovery?*Shaktikanta Das
* Address by Shri Shaktikanta Das, Governor, Reserve Bank of India on September 16, 2020 at the FICCI’s National Executive Committee Meeting

SPEECH
RBI Bulletin October 2020106
What Forces Could Drive the Recovery?
narrow range in September. Although bank credit
growth remains muted, scheduled commercial banks’
investments in commercial paper, bonds, debentures
and shares of corporate bodies in this year so far (up
to August 28) increased by `5,615 crore as against a
decline of ̀ 32,245 crore during the same period of last
year. Moreover, the benign financing conditions and
the substantial narrowing of spreads have spurred a
record issuance of corporate bonds of close to `3.2
lakh crore during 2020-21 up to August.
The immediate policy response to COVID in India
has been to prioritise stabilisation of the economy
and support a quick recovery. Polices for durable and
sustainable high growth in the medium-run after the
crisis, nevertheless, are equally important, and in
my address today I propose to dwell upon that issue
squarely – what could potentially lift up the Indian
economy to trend growth as the recovery begins?
While interacting with members of the National
Council of the Confederation of Indian Industry (CII)
on July 27, 2020, I had covered five major dynamic
shifts taking place in the economy: (i) fortunes shifting
in favour of the farm sector; (ii) changing energy mix
in favour of renewables; (iii) leveraging information
and communication technology (ICT) and start-ups
to power growth; (iv) shifts in supply/value chains,
both domestic and global; and (v) infrastructure as
the force multiplier of growth. Today, I would like to
touch upon five areas that, I feel , would determine
our ability to step up and sustain India’s growth in
the medium-run: (i) human capital, in particular
education and health; (ii) productivity; (iii) exports,
which is linked to raising India’s role in the global
value chain; (iv) tourism; and (v) food processing and
associated productivity gains.
(i) Human Capital: The Importance of Education and Health
Investing in people adds to the stock of skills,
expertise and knowledge available in a country, and
that is critical to maximise its future growth potential.
The assignment of importance to education dates
back to Plato, Aristotle, Socrates and Kautilya. Its
significance for economic development has received
progressively increasing attention in recent decades,
especially in the work of several Nobel laureates,
including T.W. Schultz, Gary Becker, Robert Lucas
and James Heckman. There has come about an
explicit recognition of education as human capital
in endogenous growth theory, backed up by cross-
country empirical evidence.
In India, states with higher literacy rates are
found to have higher per capita income, lesser
infant mortality, better health conditions and also
lower poverty. Education and skill development,
however, contribute less than half a percentage
point to our overall labour productivity growth. In
order to reap the demographic dividend, we have to
raise expenditure on education and acquisition of
skills substantially. It is important to recognise that
investment in education pays by raising average wages.
In its Global Education Monitoring Report 2012, the
United Nations Educational, Scientific and Cultural
Organization. (UNESCO) highlighted that every
US$1 spent on education generates additional income
of about US$10 to US$15. A World Bank (2014) study
showed that an additional year of schooling increases
earnings by 10 per cent a year. Higher education also
contributes to economic development through greater
sensitivity to environment/climate change, energy
use, civic participation and healthy lifestyle.
The New Education Policy 2020 (NEP), a historic
and much needed new age reform, has the potential
to leverage India’s favourable demographics by
prioritising human capital. The goal to increase
public investment in the education sector to 6 per
cent of GDP must be pursued vigorously. Public-
private partnerships (PPPs) can develop necessary
infrastructure, without jeopardising financial

SPEECH
RBI Bulletin October 2020 107
What Forces Could Drive the Recovery?
viability of private investment while ensuring quality
education at affordable costs. Indian banks and the
financial system would need to respond proactively to
opportunities arising from the NEP for new financing.
Besides improving access to education, focus
on quality of education and research will be critical
to shape the outcome of education on economic
development. Skill acquisition is more important
than mere mean years of schooling. The assessment
of quality aspect of education often requires a
multi-dimensional approach: reading and language
proficiency; mathematics and numeracy proficiency;
and scientific knowledge and understanding1. The
emphasis on quality of education must begin at the
foundation stage in schools up to plus 2 level. At
another level, the formation of the National Research
Foundation as announced in the NEP is a welcome step
to fund outstanding peer- reviewed research and to
actively promote research in universities and colleges.
The creation of a National Educational Technology
Forum as a platform for use of technology in education
is a necessary step to meet the requirement of rapidly
changing labour market.
Health is another vital component of human
capital. Good health increases life expectancy and
productive working years. In high income countries,
per capita health expenditure in 2017 was about
US$ 2937, as against US$ 130 in low middle-income
countries (which include India). Initiatives such as
the Pradhan Mantri Bharatiya Jan Aushadi Pariyojana
(PMBJP) and Pradhan Mantri National Dialysis
Programme (PMNDP), free drugs and diagnostic
service provision initiatives are expected to improve
the quality and affordability of healthcare. The
most important step towards providing affordable
healthcare has been the launch of the Ayushman
Bharat Yojna, which lays down the foundation of a 21st
century health care system, covering both government
and private sector hospitals.
COVID has brought to the fore the importance
of easy access to health services to contain the
mortality rate, given significant inter-state and intra-
state differences in healthcare infrastructure. While
laudable crisis time response to scale up health
infrastructure has helped in dealing with the health
emergency, a more comprehensive approach similar
to NEP for the health sector may be warranted, which
must also cover deeper penetration of insurance,
given the high burden of out of pocket expenses in
India, and also preventive care. Greater attention is
required to improve the health ecosystem by ensuring
creation of new medical colleges, higher number of PG
seats and colleges for paramedics and nursing.
(ii) Productivity Growth
By any reckoning, COVID-19 will leave long lasting
scars on productivity levels of countries around the
world. According to a recent World Bank assessment2,
COVID-19 could entail adverse effects on productivity
because of dislocation of labour, disruption of value
chains and decline in innovations. During earlier
episodes of epidemics in the past – Severe Acute
Respiratory Syndrome (SARS), Middle East Respiratory
Syndrome (MERS), Ebola and Zika – productivity is
estimated to have declined by about 4 per cent over
three years. The COVID impact on productivity could
be expected to be much larger.
KLEMS (capital; labour; energy; materials; and
services), a database hosted by the Reserve Bank,
shows that the Indian economy experienced an
overall productivity growth of 0.9 per cent per annum,
on an average, over the period 1980-81 to 2017-18.
In the immediate post Global Financial Crisis (GFC)
period – from 2008-09 to 2012-13 – there was a
decline in productivity by 0.3 per cent annually, while
the period thereafter upto 2017-18 recorded annual
1 worldindata.org 2 World Bank, 2020 “Global Productivity: Trends, Drivers and Policies” (Chapter 3: What Happens to Productivity during Major Adverse Events).

SPEECH
RBI Bulletin October 2020108
What Forces Could Drive the Recovery?
productivity growth of 2.4 per cent. The contribution
of productivity growth to the overall GDP growth of the Indian economy over the period 1980-81 to 2017-18 was about 15 per cent. During 2013-14 to 2017-18, its contribution increased significantly to about 34 per cent.
The share of patents applied and granted to India in total patents granted globally has been rising in recent years. India’s share, however, continues to be low at less than 1 per cent. Globally, the private sector plays a major role in Research and Development (R&D) expenditure, while in India, a major part of R&D expenditure is incurred by the government, particularly on atomic energy, space research, earth sciences and biotechnology. Stepping up R&D investment in other areas would require more efforts by the private sector, with the government focusing on creating an enabling environment.
With a view to further promoting innovations in financial services, the Reserve Bank has announced an Innovation Hub with a focus on new capabilities in financial products and services that can help deepening financial inclusion and efficient banking services. Ongoing efforts are yielding results. India has recently entered the group of top 50 countries in the global innovation index (GII) list of 2020 for the first time. The India Innovation Index, released by Niti Aayog last year, has been widely accepted as a major step in the direction of decentralisation of innovation across all states of the country. Sustaining this process will be vital, given particularly the trend decline in saving and investment rate in India.
(iii) Exports and Global Value Chains (GVCs)
In the post GFC period, a view has emerged that the era of export-led growth is over, and India missed the opportunity by not prioritising exports at the right time. Globally, the key impediments to exports post-GFC include: (a) generalised increase in protectionism by trading partners; (b) weak global demand conditions; (c) race to the bottom (to gain
unfair competitive advantage, by using a policy mix of competitive depreciation, subsidies, tax and regulatory concessions); and (d) automation, reducing the cost advantages stemming from cheap labour.
Notwithstanding these impediments, and also the significant decline in trade intensity of world GDP growth in the post-GFC period, opportunities for expanding exports arise from the vastly altered global landscape for trade where more than two thirds of world trade occurs through global value chains (GVCs)3. The higher the GVC participation of a country, the greater are the gains from trade as it allows participating countries to benefit from the comparative advantage of others participating in the GVC. Services such as transportation, banking, insurance, IT and legal services, branding, marketing and after sale services are integral to GVCs.
India’s participation in GVCs has been lower than many emerging and developing economies. India has global presence in low GVC products such as gems and jewellery, rice, meat and shrimps, apparels, cotton, and drugs and pharmaceuticals.
Among the sunrise sectors that offer potential for higher exports in the post-COVID period are drugs and pharmaceuticals where India enjoys certain competitive advantages. With strong drug manufacturing expertise at low cost, India is one of the largest suppliers of generic drugs and vaccines. Some Indian manufacturers have already entered into new partnerships with global pharma companies to produce vaccines on a large scale for both domestic and global distribution. The Government has also approved an investment package for promotion of bulk drug parks and a production-linked incentive scheme is in place to enhance domestic production of drug intermediates and active pharmaceutical ingredients. A sharp policy focus on other GVC intensive “network products”, including equipment
3 Dollar, David (2019), “Global Value Chain Development Report”, World Trade Organisation, Geneva.

SPEECH
RBI Bulletin October 2020 109
What Forces Could Drive the Recovery?
for IT hardware, electrical appliances, electronics and telecommunications, and automobiles would also provide the cutting edge to India’s export strategy
with considerable scope for higher value additions.
Domestic policies need to focus on the right
mix of local and foreign content in exports while
aiming to enhance participation in GVCs. Firms that
engage in both imports and exports are found to be
far more productive than non-trading firms (World
Bank, 2020)4. While choosing trade partners through
free trade agreements (FTAs), it is also important to
learn from global experience and nurture those trade
agreements that go beyond traditional market access
issues. Provisions relating to investment, competition,
and intellectual property rights protection have a
larger positive impact on GVC trade and need to be
assiduously cultivated and ingrained into India’s
export ecosystem.
(iv) Tourism as an Engine of Growth
Tourism has been one of the sectors in the
economy most severely impacted by COVID-19. At the
same time, this is also a sector where pent up demand
could drive a V shaped recovery when the situation
normalises.
India has immense potential to meet a diverse
range of tourist interests – religion; adventure; medical
treatment; wellness and yoga; sports; film making;
and eco-tourism. We have four major biodiversity
hotspots, 38 UNESCO World heritage sites5, 18
biosphere reserves, over 7,000 km of coastline, rain
forests, deserts, tribal habitation and a multi-cultural
population. The challenge nevertheless is to scale up
our tourism market and enhance its contribution to
economic development.
As per the Third Report of Tourism Satellite
Account for India (TSAI) 2018, the share of tourism
in GDP was 5.1 per cent in 2016-17 and the share
in employment was 12.2 per cent (with the direct
and indirect shares at 5.32 per cent and 6.88 per
cent, respectively). In 2018-19, tourism’s share in
employment increased further to 12.8 per cent, with
the total size of employment at 87.5 million. The
employment elasticity in this sector, thus, appears to
be high. India attracted 10.89 million foreign tourists
in 2019, an increase of 3.2 per cent over the previous
year. The foreign exchange earnings generated by the
sector during the same period was about `2 trillion,
a year-on-year increase of more than 8 per cent. The
country also jumped six positions to 34 out of 140
counties in the Travel and Tourism Competitiveness
Index 2019 of the World Economic Forum (WEF).
Recognising the potential of the sector, the
Government has provided targeted policy support. The
Ministry of Tourism has two major schemes: Swadesh
Darshan for Integrated Development of Theme-
Based Tourist Circuits; and PRASHAD as a Pilgrimage
Rejuvenation and Spiritual, Heritage Augmentation
Drive for development of tourism infrastructure in
the country, including historical places and heritage
cities.
The multi-pronged supportive policy interventions
in the sector may have to be reviewed and revamped,
if tourism has to contribute more to the economy
matching its potential. A closer look at some of the
global leaders in travel and tourism such as France
and Spain would suggest that these countries not only
have excellent natural and cultural resources, but
policies to support an exceptionally attractive tourist
infrastructure, including a high hotel density offering
all range of choices, quality public transport systems,
networked air connectivity with considerable route
capacity, and most importantly, safety and security.
Initiatives need to be taken in the direction
of improving and integrating various modes of
transportation (linking air/train/metro/road/sea)
with the provision for single point of booking,
4 World Bank (2020), World Development Report, Washington, D.C. 5 30 cultural, 7 natural and 1 mixed.

SPEECH
RBI Bulletin October 2020110
What Forces Could Drive the Recovery?
e-registration of service providers (travel agents,
transport operators, hotels, tourist guides, etc.). Strict
provisions of penalty for non- compliance would
boost confidence of tourists, alongside an effective
and speedy grievance redressal system for both
domestic and foreign tourists. Research conducted
by a private agency6 suggested that if we can increase
international tourist arrivals to 20 million (i.e., about
double of current arrivals), the incremental income
would be US$19.9 billion, benefiting an additional
1 million people in the travel and tourism industry.7
(v) Food Processing for Surplus Management
COVID has brought the importance of food
security and food distribution or supply chain
network to the forefront of public policy debate
in India. Successive years of record production of
foodgrains and horticulture crops has transformed
India into a food surplus economy. Recognising this
challenge, much of the policy attention in recent
years for the sector has focused on addressing post-
production frictions, comprising agri-logistics, storage
facilities, processing and marketing. Greater focus
on processed food is one option that could help in
dealing with multi-pronged challenges of surplus
management. Development of the food processing
industry is likely to benefit the farm sector and the
economy through greater value addition to farm
output, reducing food wastages, stabilising food
prices, expanding export opportunities, encouraging
crop diversification, providing direct and indirect
employment opportunities, increasing farmers’
income and enhancing consumer choices.
Food processing is a sunrise industry. Globally,
its importance in the consumer basket has increased
over time, led by rising per capita incomes,
urbanisation, and change in consumer perceptions
regarding quality and safety. Despite having huge
growth potential, the food processing industry in India is currently at a nascent stage, accounting for less than 10 per cent of total food produced in the country. As a result, despite being one of the largest producers of several agricultural commodities in the world, India ranks fairly low in the global food processing value chain.
There is a need to move up the value chain. Moreover, the food processing industry in India is largely domestically oriented, with exports accounting for only 12 per cent of total output. India can move up in the global agricultural value chain by increasing its share of processed food exports, for which quality standards will be a critical factor.
Food processing also offers huge employment potential. In India, while the food processing industry’s contribution to overall Gross Value Added (GVA) is only 1.6 per cent, it accounts for 1.8 million (12.4 per cent) and 5.1 million (14.2 per cent) jobs in registered and un- incorporated sectors, respectively. Recognising this, the government has set the target for raising the share of processed food to 25 per cent of the total agricultural produce by 2025. The food processing sector was also opened up for 100 per cent Foreign Direct Investment (FDI) in 2016 under the automatic route. Further, in 2017, 100 per cent FDI under the government route for retail trading, including through e-commerce, was permitted in respect of food products manufactured and/or produced in India. For ensuring adequate credit flows, the Reserve Bank has accorded priority sector status to the food processing industry in 2015.
Conclusion
In my address today, I have highlighted five critical areas that can determine the shape of our post-COVID trend growth. While dealing with the immediate crisis management challenges, we need to strategically prepare for our combined overriding
6 Bain and Company (2017), “Tourism Opportunity for India”, Draft Discussion Document prepared for the World Economic Forum, September 2017.7 “Incredible India 2.0, India’s $20 billion Tourism Opportunity”, World Economic Forum, 2017.

SPEECH
RBI Bulletin October 2020 111
What Forces Could Drive the Recovery?
goal – the pursuit of strong and sustainable growth. The private business sector has a critical role in each
of the five areas I covered today. The enabling policy
environment would evolve around the initiatives taken
by India’s businesses to seize these opportunities and
actualise the potential of the Indian economy as a
rising economic power of the 21st century. COVID-19
has changed our lives and it is increasingly clear that
life will never be the same again. We should look upon
these fundamental changes as opportunities rather
than threats, converting them into game changing
new vistas of progress. I do believe that together as a
nation, we can certainly do it. Let me conclude on this
optimistic note.


ARTICLES
GDP Growth Forecasts of the Reserve Bank of India – A Performance Assessment
Demystifying Equity Prices using Dividend Discount Model: An Indian Context


ARTICLE
RBI Bulletin October 2020 113
GDP Growth Forecasts of the Reserve Bank of India - A Performance Assessment
limited. A study specifically assessed the Reserve Bank’s forecast performance of the headline inflation for identifying the episodes of large forecast errors and understanding the underlying factors [Raj, et. al. (2019)]. In a related study, attempt has been made to examine the accuracy of median forecasts of Professional Forecasters’ (SPF) relative to official actual data on growth and inflation [Bordoloi, et. al. (2019)]. In a cross-country setting, another study analysed the inflation and GDP growth forecasts of 17 select central banks (including RBI) for 2018 and 2019 in a panel regression framework and sought to examine the determinants of growth forecast errors (RBI, 2020). No study, however, has made an assessment of the performance of the Reserve Bank’s growth forecasts vis-à-vis the final GDP estimates that is released by the Central Statistics Office1 (CSO) after a lag of about three years. This article seeks to bridge this gap. In particular, it investigates two issues: whether forecast errors have any systematic bias and are auto-correlated; and whether forecast performance improves with the flow of new information that are incorporated in revised GDP growth forecasts. The article is structured in four sections. Section II briefly covers literature review on the area, while data and methodology issues are discussed in Section III. Section IV presents the empirical findings. Section V sums up the discussions.
II. Review of Literature
The field of forecast evaluation was pioneered by Henri Theil (Mincer and Zarnowitz, 1969). In the last one decade or so, research interest in forecast accuracy assessment has gained momentum. Many central banks2 (particularly in the advanced economies and
This article evaluates the annual gross domestic product (GDP) growth projections of the Reserve Bank of India (RBI) against final official estimates of GDP, which are normally released with a lag of about three years. During 1998-99 to 2016-17, on an average, growth projections underestimated realised growth. Forecast errors, committed in both directions, were free of any systematic bias, and remained modest in a cross-country context.
Introduction
For the conduct of monetary policy, central banks devote considerable time and resources to generate reliable forecasts of key macro-economic variables. Realised outcomes, however, often deviate from forecasts, leading to forecast errors. Assessment of forecast errors enables policy makers to recognise biases in forecasts, if any, and thereby helps in more informed and better decision-making (Lees, 2016).
Historical forecast errors provide a reference for assessing uncertainty surrounding projections (Nakamura and Nagae, 2008). Error assessment can help mitigate the risk of policy mistakes which, in turn, can contribute to enhanced credibility (Binette and Tchebotarev, 2017). Given the significance of forecasts to policy making, a number of central banks across the world, both advanced and emerging market economies, regularly track forecast performance and emphasise incorporation of learnings from past errors in forecasting exercises.
In India, literature on the assessment of forecast performance of key macro-economic variables is
* This article has been prepared by Raj Rajesh and Vineet Kumar Srivastava, Department of Economic and Policy Research, Reserve Bank of India. Authors are thankful to Dr. Janak Raj and Dr. Bhupal Singh for their valuable comments. Views expressed in this article are those of the authors’ and do not necessarily represent the views of the Reserve Bank of India.
GDP Growth Forecasts of the Reserve Bank of India – A Performance Assessment*
1 In 2019, the Central Statistics Office (CSO) and the National Sample Survey Office (NSSO) were merged together into National Statistical Office (NSO).
2 Given the imperative of precision of forecast of key macro-economic variables in the formulation of forward-looking monetary policy decisions, many central banks (such as Bank of England, Federal Reserve Bank, Bank of Japan, European Central Bank, Sveriges Riksbank, Central Bank of Iceland, Reserve Bank of Australia, Reserve Bank of New Zealand, and Central Bank of Brazil) themselves carry out such assessment of forecast errors.

ARTICLE
RBI Bulletin October 2020114
GDP Growth Forecasts of the Reserve Bank of India - A Performance Assessment
also in a few EMEs), and multilateral institutions such
as the International Monetary Fund (IMF), the World
Bank, the Organisation for Economic Co-operation
and Development (OECD) have started assessing and
discussing in public their forecast performance on key
macro-economic variables, mainly real GDP growth
and inflation. Most of these assessments, however,
have predominantly been done for inflation forecasts.
Researchers have also assessed the forecasting
performance of multilateral institutions. Hong and
Tan (2014) assessed the forecast performance of
the UN, the IMF and the World Bank in respect of
global growth and individual country growth for the
period 2000-2012. They found that the forecasting
performance of the UN was marginally better than
that of the IMF and the World Bank at the global as
well as country-group levels.
Research in this area has also focused on
comparing the forecasts of multilateral institutions
with forecasts generated by other institutes [Oller
and Barot (2000); Lees, op. cit.]. Oller and Barot, op. cit. analysed the performance of GDP growth and
inflation as forecasted by the OECD and the respective
national institutes of 13 European countries. They
found that inflation forecasts were significantly
more accurate than growth forecasts. They found
no significant difference in forecast accuracy of the
OECD and the institutes. Lees, op. cit. analysed the
performance of the Reserve Bank of New Zealand’s
forecasts (one-year and two-year ahead forecasts)
during 2009 to 2015 in respect of a number of variables
such as GDP growth, inflation, interest rates and the
nominal exchange rate and compared it with the
forecasts made by external forecasters. He reported
that the Reserve Bank of New Zealand outperformed
the median forecast for output growth. He did not
find any evidence of bias in the Reserve Bank’s one-
year ahead GDP growth forecasts but the mean two-
year ahead error was relatively high at 0.48.
Chang and Hanson (2015) analysed the forecasts
made by the Board of Governors of the Federal Reserve
System for a number of macro-economic variables,
besides GDP, from 1997 to 2008. They found that
forecasts of the Federal Reserve System significantly
outperformed benchmark forecasts for horizons of
less than one-quarter ahead. However, the accuracy
of such forecasts weakened for the one-year ahead
horizon.
An Independent Evaluation Office (2015) assessed
and compared the forecast performance of the Bank
of England in respect of several variables such as
growth, inflation, unemployment rate, wage growth,
investment, house prices, etc., and compared it with
private sector forecasts and the ECB. For UK GDP
growth, it did not report any statistically significant
evidence of bias. It also found that the accuracy of the
Bank of England’s UK GDP growth forecasts compared
favourably with that of the UK private sector forecasts,
and other central banks, particularly at the one-year
ahead horizon.
Binette and Tchebotarev, op. cit. assessed the
quality of annual GDP growth forecasts (annual
and two-years ahead projections) made by the Bank
of Canada for the period 1997 to 2016 in respect of
Canadian economy. They found that bias in the
growth forecast was often statistically insignificant.
III. Data and Methodology
The Reserve Bank has been publishing its
GDP growth projections in the monetary policy
statements. Till August 2016, the growth projections
were published in the Governor’s policy statement.
Since then, with the constitution of the Monetary
Policy Committee (MPC) in September 2016, growth
projections are published in the resolution of the MPC.
The Monetary Policy Report (MPR), being published bi-
annually from September 2014, also provides growth
projections.

ARTICLE
RBI Bulletin October 2020 115
GDP Growth Forecasts of the Reserve Bank of India - A Performance Assessment
In the present study, annual growth projections3 made by the Reserve Bank in its annual (April) and mid-term review policy statements (September / October / November) from 1998-99 onwards, as sourced from the Reserve Bank website, are considered. It is pertinent to mention that till 2004-05, only two policy statements were published – one in April/ May (Annual Policy Statement) and the other in September/ October/ November (Mid-term Review). From 2005-06 to 2009-10, four policy statements were published in a year. From 2010-11 to 2013-14, eight policy statements were announced in a year with the introduction of mid-quarter reviews. From April 2014, six bi-monthly monetary policy statements are being released every year.
Annual realised growth numbers (final estimates) for the respective years are sourced from the CSO’s website. CSO’s final estimates4, which are updated using latest available data, provide the most accurate assessment of economic activity. So far, the CSO has published final GDP estimates only upto 2016-17. Hence, this study uses GDP data for the period from 1998-99 to 2016-17.
Forecast error (Et) for a variable, say growth ‘X’, at time ‘t’ is measured as deviation of forecasted value (Ft) from the actual (observed) value (At).
(1)
Thus, a negative mean forecast error shows that forecasted growth, on an average, exceeds the realised growth and represents over-prediction. In contrast, if the forecasted values, on an average, are lower than the actual growth, then it is a case of under-prediction.
The performance on forecasting can be assessed
by aggregating these forecast errors (Et) over a period
using various statistical measures, which, inter alia
include mean forecast error (MFE) and root mean
square forecast error (RMSE). While average error or
MFE is a measure of bias, the RMSE is a measure of
accuracy.
Mathematically, MFE is defined as follows:
(2)
One of the weaknesses of MFE is that it may
unduly get influenced by outliers.
RMSE is defined as follows:
(3)
RMSE is a widely used measure of forecast
accuracy. A desirable property of an efficient forecast
is that its errors should remain unbiased, which
implies that over a considerable period of time, a
forecaster would make positive errors as often as
negative errors. Another desirable property of an
efficient forecast is that the forecast error should not
be autocorrelated (i.e., correlated with its past values).
Both the properties of an optimal forecast can be
assessed through regression estimates.
Forecast error (Et) is said to be unbiased when the
value of intercept (α) in the following regression is
equal to zero (equation 4):
(4)
where, is the error term.
The absence of biasedness and autocorrelation
in forecast errors is attributed as ‘weak form
informational efficiency’ and regarded as rational
forecasting in the limited sense of McNees (1978)
[Oller and Barot, op. cit.]. Forecast error (Et) would
satisfy both the properties of unbiasedness and
uncorrelatedness when the value of intercept (α) and
3 For the said period, the RBI’s growth projection has a maximum forecast horizon of one-year.
4 GDP data undergoes various revision cycles before the final estimates are published. After the advance estimates are released in February month of the fiscal, the CSO releases provisional estimates in May of the succeeding fiscal year, which undergoes further subsequent revisions in three rounds of revised estimates in the following 10 months; 1 year and 10 months; and 2 years and 10 months, respectively, after the completion of the year. As a result, there is a three year time lag for every annual final estimate of GDP in India.

ARTICLE
RBI Bulletin October 2020116
GDP Growth Forecasts of the Reserve Bank of India - A Performance Assessment
the coefficient of one-period lagged term of forecast
error estimates (β) are both equal to zero in the
following regression (equation 5):
(5)
Mincer-Zarnowitz (MZ) (Mincer and Zarnowitz,
op. cit.) regression has been widely used by researchers
for assessing the efficiency of forecast estimates. MZ
regression jointly evaluates the bias and efficiency
of forecast estimates. In the MZ regression scheme,
actual estimates (Yt) are regressed on forecast estimates
(equation 6).
(6)
where, i = 1 or 2 depending on whether growth
forecast is made in annual policy statement (APS) and
mid-term review (MTR), respectively.
An efficient forecast should generate coefficients:
α = 0 and β = 1. Furthermore, rejection of F-test
of joint null hypothesis indicates inefficiency of
forecasts.
This study uses equation (6) to assess the
quality of GDP forecast by the Reserve Bank utilising
data on annual growth projections made by the
Reserve Bank in its APS (in April/ May) and MTR
(in September/ October/ November) and realised
growth, which, published by the CSO, comes with a
significant lag. The first estimate of GDP for a fiscal
year is released by the CSO towards the fag end of
the fiscal, i.e., at end-February, which undergoes
further three rounds of sequential revision and the
final GDP estimate of a year is available after a lag of
2 years and 10 months post the completion of the
fiscal. Growth numbers, here, are based on real gross
domestic product (GDP) at factor cost (erstwhile
headline growth number), which was used as a
reference for gauging economic activity. From 2012-
13 onwards, the new headline GDP – real GDP at market price has been considered5.
IV. Evaluation of Forecast Performance
Magnitude and Variability
Descriptive statistics of the forecast errors (i.e. deviation of realised figure from the forecast) for the period from 1998-99 to 2016-17 suggests under-prediction of GDP growth, on an average, for the entire period. Forecast errors, both of APS and MTR, are found to be normally distributed (Table 1). Comparatively, mean forecast errors of mid-term reviews were larger in magnitude. Mean forecast error of the MTR was, however, found to have lesser volatility than that of the APS. This is in line with the property of an optimal forecast that variance of forecast error should decline with availability of more information (Timmermann, 2006).
An analysis of forecast errors for various years suggests that errors for both the APS and MTR have occurred on both the sides suggesting instances of both under-estimation and over-
estimation (Charts 1.a and b).
5 For 2016-17, gross value added (GVA) actuals and RBI forecast figures have been considered since RBI forecast was available in respect of the GVA.
Table 1: Descriptive Statistics of Growth Forecast Errors
(1998-99 to 2016-17)
Annual Policy (APS)
Mid-term Review (MTR)
Mean 0.26 0.53
Median 0.40 0.68
Maximum 2.59 2.59
Minimum -2.60 -2.10
Std. Dev. 1.62 1.27
Skewness -0.31 -0.35
Kurtosis 1.95 2.37
Jarque-Bera Statistics (p-value) 0.56 0.70
Source: Author's calculations.

ARTICLE
RBI Bulletin October 2020 117
GDP Growth Forecasts of the Reserve Bank of India - A Performance Assessment
However, on an average, forecasted growth
figures for both APS and MTR were found to be
under-estimates; the instances of under-prediction
was higher in the case of the latter (Chart 2). Higher
frequency of under-prediction was found to persist
for the MTR forecast errors even after excluding the
drought years (Chart 3).
As per the pattern of revision of growth forecasts
from APS to MTR, the instances of downward revisions
in growth forecasts outweighed the upward revisions
(Chart 4).
Forecast error, as measured by RMSE, using CSO’s
realised growth and growth projections by the RBI
in its APS for 1998-99 to 2016-17, was estimated at
± 1.60 per cent for the longer horizon (Table 2). For
G-7 central banks, Bloomberg (2018) reported growth
forecast errors in the range of 1.8 to 3.1 percentage
points in respect of central banks of Japan, Euro Area,
Chart 1: Realised Growth, Forecast Estimate and Forecast Error
Sources: CSO and RBI.
a: APS b: MTR
Chart 2: Instances of Overprediction and Underprediction of Growth by Forecast Estimates - Share (1998-99 to 2016-17)
Source: Authors’ calculations.
Chart 3: Instances of Overprediction and Underprediction of Growth by Forecast Estimates - Share (1998-99 to 2016-17 -
excluding the drought years)
Source: Authors’ calculations.

ARTICLE
RBI Bulletin October 2020118
GDP Growth Forecasts of the Reserve Bank of India - A Performance Assessment
Canada, USA, and England for period 2006 to 2016
(Table 3).
The forecast error for annual growth projections
made by the the Reserve Bank is observed to shrink as
one moves from APS to MTR, as the latter incorporates
more incoming information for generating forecasts.
RMSE of the growth projections for the period from
1998-99 to 2016-17 was estimated to reduce from ±
1.60 per cent for the APS projections to ± 1.35 per
for the MTR projections.6 It may also be noted that
since the signing of Monetary Policy Framework
Agreement between the Government of India and
the Reserve Bank in February 2015 and adoption of
flexible inflation targeting (FIT) framework, the RMSE
of growth projection for 2015-16 to 2016-17 is found
to decline. Nevertheless, it may be too early to make
a judgement whether forecasting errors have got
reduced in the post-FIT regime. Furthermore, the ratio
of RMSE over the standard deviation of the realised
growth (a metric of forecaster’s performance in
relation to variability of the forecasted variable) also
suggests that the ratio declines as one moves from
APS to MTR. This again highlights that when more
information becomes available for the economy as the
year progresses, growth forecast error gets reduced.
This is in line with the studies conducted in respect of
other economies such as the USA, and Iceland [Binette
and Tchebotarev, op. cit.7, Danielsson (2008)8].
Chart 4: Pattern of Revision in Growth Forecast from APS to MTR
Source: Authors’ calculations.
Table 2: RBI’s Forecast of Annual Growth Projections: Estimates of Error
MFE RMSE Std. Dev. (Realised Growth)
RMSE / Std. Dev. (Realised
Growth)
Annual policy state-ment
Mid-term
review
Annual policy state-ment
Mid-term
review
Annual policy state-ment
Mid-term
review
1998-99 to 2006-07
0.23 0.51 1.78 1.46 1.98 0.90 0.74
2007-08 to 2016-17
0.29 0.55 1.45 1.30 1.16 1.25 1.12
2013-14 to 2014-15
1.30 1.65 1.43 1.67 0.50 2.86 3.34
2015-16 to 2016-17
0.30 0.30 0.32 0.32 0.00 - -
1998-99 to 2016-17
0.26 0.53 1.60 1.35 1.63 0.98 0.82
Note: MFE – Mean Forecast Error; RMSE – Root Mean Square Forecast Error.Source: Authors’ calculations.
Table 3: Forecast Error Based on Average Squared Forecast Error Between 2006 and 2016 For Select
Advanced CountriesCountry/ Region Agency Forecast error
USA Federal Reserve Board 2.14
Canada Bank of Canada 2.27
Euro Area European Central Bank 2.86
England Bank of England 1.83
Japan Bank of Japan 3.11
Note: Based on Central Bank GDP forecast one-year ahead.Source: Bloomberg (2018).
6 At the time of mid-term review of the financial year, GDP data for Q1, first advance estimates on production of major food, non-food and horticulture crops; data of 4-5 months of high frequency indicators such as industrial production, cement production and steel consumption, trade, government expenditure, credit, insurance premium, transport, air passenger and cargo traffic, foreign tourists arrival etc. become available, which help in better assessment of prevailing economic condition.
7 While assessing the quality of annual GDP growth projections made by Bank of Canada for 1997 to 2016, Binette and Tchebotarev (2017) also reported improvement in forecast performance with the narrowing down of forecast horizon and improved availability of information.
8 Danielsson (2008) analysed the performance of forecasts made by the Central Bank of Iceland in respect of a number of macro-economic time series for the period 1974-2002 and found that performance of forecasts made by the Central Bank improved with the passage of time and availability of additional information.

ARTICLE
RBI Bulletin October 2020 119
GDP Growth Forecasts of the Reserve Bank of India - A Performance Assessment
A comparison of the scatter plot of realised growth with the forecasts made in APS and MTR also suggests lower dispersion for the MTR as compared to APS, implying reduction in forecast error as the forecast horizon shrinks and more information becomes available for assessing the economic condition (Chart 5).
For testing the unbiasedness property of forecast estimates, equation 4 (as discussed in Section III) was estimated using OLS estimation. If α is significantly different from zero, then the forecasts are said to be biased. The intercept was not found to be significantly different from zero for the forecast errors of the APS and the MTR at 5 per cent level of significance
(Table 4).
For testing, the unbiasedness and non-
autocorrelation properties of the forecast estimates,
following equation 5 framework, forecast error series
was regressed on intercept and its one-period lag,
using APS and MTR data separately. Regression results
based on equation 5 suggest that coefficients of the lag
term as also the intercept are statistically insignificant,
validating no biasedness or auto-correlation in forecast
errors (Table 5).
To reaffirm unbiasedness, whether or not forecast
errors followed the same pattern during the drought
Table 5: OLS Regression (Dependent Variable – Forecast Error)
Annual Policy Mid-term Review
Constant 0.28(0.41)
0.55(0.34)
Forecast Errort-1 0.01(0.25)
-0.05(0.25)
Diagnostics
Adj. R2 -0.06 -0.06
Prob. (Jarque-Bera statistics) 0.53 0.65
Prob (BGSLM test F-stats) 0.78 0.66
Prob. (BPG F-test) 0.41 0.95
Notes: 1. ***, **, & *: denote statistical significance at 1%, 5%, & 10%, respectively.
2. Figures in parentheses are heteroscedasticity and autocorrelation consistent (HAC) adjusted standard errors.
3. BGSLM - Breusch-Godfrey Serial Correlation Lagrange Multiplier; BPG - Breusch-Pagan-Godfrey.
Table 4: OLS Regression (Forecast error regressed on intercept)
Annual Policy Mid-term Review
Full Period (1998-99 to 2016-17) 0.26(0.37)
0.53*(0.28)
1998-99 to 2006-07 0.24(0.70)
0.51(0.53)
2007-08 to 2016-17 0.29(0.35)
0.55*(0.25)
Notes: 1. ***, **, & *: denote statistical significance at 1%, 5%, & 10%, respectively.
2. Figures in parentheses are standard errors. 3. Heteroscedasticity and autocorrelation consistent (HAC)
standard errors.
Chart 5: Scatter Plot of Realised Growth versus Forecast Values
Sources: CSO and RBI.
a: Annual Policy Statement b: Mid-term Review

ARTICLE
RBI Bulletin October 2020120
GDP Growth Forecasts of the Reserve Bank of India - A Performance Assessment
years was also examined. For the drought years
2002-03 and 2015-16, the Reserve Bank’s GDP growth
forecast was found to have exceeded the actual
outcome (over prediction), while for another spell of
drought years in 2004-05, 2009-10 and 2014-15, GDP
growth forecasts were lower than the realised growth
(under prediction) (Chart 6). This implies that even
in abnormal years, forecast errors were neither biased
and nor skewed.
How good is the quality of growth forecast?
Another metric for assessing the quality of forecast
is through understanding the extent of association
between forecast figures and realised values. For the
same, Mincer-Zarnowitz regression is employed, which
involves regressing the realised values of a variable
on a constant and its forecast. Mincer-Zarnowitz
(MZ) regression (as in equation 6) was estimated
separately for the annual GDP growth forecast made
in the APS and the MTR. Results suggest that bias is
not significantly different from zero. Secondly, the
coefficients of forecasts for AP and MTR were found
to be statistically significant. Wald test with the null
hypothesis of slope coefficients being equal to unityfor
both the equations was not rejected implying one-to-
one correspondence between forecasted growth and
actual growth (Table 6). The slope coefficient for the
MTR equation is much higher than that of the slope
Chart 6: Forecast Errors for Annual Headline Growth Estimates and Drought Episodes
Note: FER - Forecast Error.Source: Author’s own calculations.
Table 6: OLS Regression (Mincer-Zarnowitz Regression) (Dependent Variable – Realised growth)
Annual Policy Mid-term Review
Constant 2.95(2.39)
0.74(2.00)
Forecasted Growth 0.62*(0.32)
0.97**(0.28)
Diagnostics
Adj. R2 0.06 0.39
Durbin Watson stats. 1.72 2.07
Prob. (Jarque-Bera statistics) 0.53 0.75
Prob. (BGSLM test F-stats) 0.43 0.94
Prob. (BPG F-test) 0.52 0.29
Joint F-test (α = 0; β = 1)(p-value)
0.45 0.18
Notes: 1. ***, **, & *: denote statistical significance at 1%, 5%, & 10%, respectively.
2. Figures in parentheses are heteroscedasticity and autocorrelation consistent (HAC) adjusted standard errors.
3. BGSLM - Breusch-Godfrey Serial Correlation Lagrange Multiplier; BPG - Breusch-Pagan-Godfrey.

ARTICLE
RBI Bulletin October 2020 121
GDP Growth Forecasts of the Reserve Bank of India - A Performance Assessment
coefficient for the APS equation and very close to
one. Furthermore, the R2 of the regression increases
from 0.06 to 0.39 as one moves from APS to MTR. The
findings confirm that the growth forecast performance
of the Reserve Bank is good and improves with
availability of more information. Further, F-test did
not reject null hypothesis of α = 0 and β = 1 for both
APS and MTR, which validates that the Reserve Bank’s
growth forecasts are efficient. Also, the forecast errors
get reduced as more information becomes available
on various macro-economic indicators.
Directional Accuracy
A good forecast correctly tracks the turning points of
business cycles. For measuring directional accuracy,
the ‘hit ratio’, which indicates how often a forecaster
correctly predicts an increase or a decrease in growth
was calculated (Binette and Tchebotarev, op. cit.). Towards the start of forecast cycle when the annual
policy was announced, forecast was found to correctly
predict the change in sign of annual real GDP growth
roughly 33 per cent of the time, which improves to
about 67 per cent at the shorter forecast horizon for
mid-term reviews (Chart 7).
V. Conclusion
Accuracy in forecasts of key macro-economic variables
is of paramount importance to central banks for
conducting forward-looking monetary policy. In
India, final estimates of GDP, after several rounds
of revisions, become available after a lag of two
years and ten months. Currently, for example, final
GDP numbers are available only for 2016-17. An
assessment of annual GDP growth forecasts made by
the Reserve Bank during 1998-99 to 2016-17 relative
to the final estimates of the GDP suggests that growth
forecast errors were relatively lower for MTR than
that of the APS. Growth forecast errors were also not
found to have any systematic bias. Mincer-Zarnowitz
regression results suggest improved quality of forecast
with improved capture of information in MTR.
Under-prediction of GDP growth on an average was
also observed. The directional accuracy of forecast
estimates, viz., tracking of turning points, was also
found to be better for the MTR than for the APS.
References
Anderson, Palle S. (1997). “Forecast Errors and
Financial Developments”, BIS Working Papers No. 51,
November.
Binette, Andre and Dmitri Tchebotarev (2017).
“Evaluating Real GDP Growth Forecasts in the Bank of
Canada Monetary Policy Report”, Staff Analytical Note
2017-21, Bank of Canada.
Bloomberg (2018). “Which Central Bank Is the Most
Accurate Forecaster?”, Special Report – Central Banks,
Q1: 2018, January 17.
Bordoloi, Sanjib; Rajesh Kavediya; Sayoni Roy; and
Akhil Goya (2019). “Changes in Macroeconomic
Perceptions: Evidence from the Survey of Professional
Forecasters”, RBI Bulletin, November.
Chang, Andrew C. and Tyler J. Hanson (2015). “The
Accuracy of Forecasts Prepared for the Federal
Open Market Committee,” Finance and Economics
Chart 7: Hit Ratio for Various Forecast Horizons
Source: Authors’ calculations.

ARTICLE
RBI Bulletin October 2020122
GDP Growth Forecasts of the Reserve Bank of India - A Performance Assessment
Discussion Series 2015-062. Washington: Board of
Governors of the Federal Reserve System.
Danielsson, Asgeir (2008). “Accuracy in forecasting
macroeconomic variables In Iceland”, Central Bank of Iceland Working Papers No. 39, May.
Government of India, Ministry of Statistics and
Programme Implementation, www.mospi.gov.in
Hong, Pingfan and Zhibo Tan (2014). “A Comparative
Study of the Forecasting Performance of Three
International Organizations”, DESA Working Paper
No. 133, June.
Independent Evaluation Office (2015). “Evaluating
forecast performance”, Bank of England, November.
Lees, Kirdan (2016). “Assessing forecast performance”,
Reserve Bank of New Zealand Bulletin, Vol. 79, No 10,
June.
McNees, S. K. (1978). “The ‘rationality’ of economic
forecasts” American Economic Review 68(2), 301–305.
Mincer, Jacob A. and Victor Zarnowitz (1969). “The
Evaluation of Economic Forecasts”, in Mincer, Jacob
A., (Ed.), Economic Forecasts and Expectations, NBER,
New York.
Nakamura, Koji and Shinichiro Nagae (2008). “The
Uncertainty of the Economic Outlook and Central
Banks’ Communications”, Bank of Japan Review,
2008-E-1, June.
Oller, Lars-Erik and Bharat Barot (2000). “The
accuracy of European growth and inflation forecasts”,
International Journal of Forecasting, 16:293–315.
Raj, Janak; Muneesh Kapur; Praggya Das; Asish
Thomas George; Garima Wahi; and Pawan Kumar
(2019). “Inflation Forecasts: Recent Experience in
India and a Cross-country Assessment”, Mint Street
Memo No. 19, Reserve Bank of India, May.
Reserve Bank of India (2020). “Monetary Policy
Report”, April.
Reserve Bank of India, www.rbi.org.in
Timmermann, Allan (2006). “An Evaluation of the
World Economic Outlook Forecasts”, IMF Working
Paper, WP/06/59, March.

ARTICLE
RBI Bulletin October 2020 123
Demystifying Equity Prices using Dividend Discount Model: An Indian Context
Assessment of equity prices may also help to identify
financial imbalances or risks in an economy as it
contains information about the degree of uncertainty
around the economic outlook. The analysis of equity
prices and understanding of the drivers of change in
equity prices assumes significance as it interacts with
monetary policy and could have different implications
for policy actions.
Against this backdrop, this article attempts to
decompose equity price movements in India since
2005 to 2020 into contribution of changes in growth
expectations, interest rates and Equity Risk Premium
(ERP) using DDM. Section II discusses the relevance of
understanding movement in equity prices. Section III
discusses the DDM framework and the specification of
the model deployed for the study. Section IV outlines
the estimates of unknown variable, i.e., ERP. Section V
discusses the results of DDM model, followed by the
conclusion.
II. Why Equity Prices are Relevant?
Financial variables provide useful information
in assessing economic conditions and consequently
serve as an important input in monetary policy
making. Further, monetary policy transmission
also takes place through financial channel, which
eventually influences the real sector. The immediate
impact of monetary policy actions is mirrored in
the prices and returns of financial assets, which is
transmitted to broader economy through resultant
actions of economic agents including households and
firms. Unlike other lagging macroeconomic indicators
including GDP and inflation, these variables are
available on continuous basis and are also not subject
to revisions, and hence can be used for real-time
monitoring of macroeconomic conditions.
In this context, understanding the movement of
equity prices, which directly reveals the expectations
of economic agents about future economic activity
assumes critical importance. This is premised on the
Financial variables, both prices as well as quantities, provide useful information in assessing economic conditions and consequently serve as important inputs for policy making. In this article, we attempt to study the movement in equity prices using a fundamental tool of valuation termed as Dividend Discount Model (DDM). The DDM framework values equities using the present discounted value approach and helps to attribute the changes in equity prices to factors including growth expectations, risk-free rate and equity risk premium (ERP). Decomposition of changes in equity prices indicate that the rise in equity prices during 2016 to early 2020 was mainly supported by decrease in interest rates and ERP, with increase in forward earnings expectations contributing to a lesser extent. Thereafter, spike in ERP on COVID-19 concerns initially contributed significantly to equity prices declining sharply to compensate for increased risks. However, equity prices registered impressive recovery subsequently aided by easing of ERP.
Introduction
Movements in equity prices alongside a range of other assets reveal expectations of economic agents and provide important information to central banks for shaping appropriate policy actions in pursuit of their mandate of price stability, financial stability and economic growth. Equity prices contain information about both current and future economic conditions. Transmission of monetary policy actions to the broader economy takes place through various channels, including asset price channel, which leads to change in market value of equities and other securities.
* This article is prepared by Priyanka Sachdeva and Abhinandan Borad under the guidance of Mohua Roy and Subrat Kumar Seet in the Division of Financial Markets of the Department of Economic and Policy Research, Reserve Bank of India. The views expressed in this article are those of the authors and do not represent the views of the Reserve Bank of India.
Demystifying Equity Prices using Dividend Discount Model: An Indian Context*

ARTICLE
RBI Bulletin October 2020124
Demystifying Equity Prices using Dividend Discount Model: An Indian Context
traditional equity valuation model, which suggests
that stock prices equal the present value of expected
future earnings. Ceteris paribus, rising equity prices
reflect optimism over future profitability of companies.
Other than economic outlook, equity prices may also
convey information about risk perception. High risk
perception is associated with low equity prices and
vice versa because investors demand higher premium
to compensate for higher risk against alternate safer
investments in bonds thereby driving equity prices
lower. Thus, movement of equity prices represents
the interplay of different forces and hence there is a
need to identify these separate factors for effective
policy making.
Monitoring equity prices is also relevant from the
standpoint of its linkages with the macro economy
defined within the demand side framework, i.e., consumption and investment. Easy monetary policy
boosts asset prices including equity prices which,
increases households’ wealth, prompting them to
consume more. This is popularly known as wealth
effect. Moreover, higher equity prices also increase
business demand by reducing the cost of equity
finance and enable them to finance investment at
a reduced cost. This relationship between equity
market and investment was propounded by James
Tobin and is known as Tobin’s ‘q’ theory. Conversely,
tighter monetary policy lower equity prices and
dampens the aggregate demand of both consumers
and business firms. However, the quantum and
timing of effect of monetary policy changes on
equity prices will depend on the extent to which the
policy changes were ex-ante anticipated by market
participants and also the extent to which future
policy expectations are altered in response to central
bank’s actions.
Central banks also monitor equity prices in
pursuit of their objective of maintaining financial
stability, which is a prerequisite for price and
economic stability. Financial stability risks may arise
when equity prices deviate from fundamental levels as
dictated by the present value of future income stream
and the market is characterised by wide fluctuations
in prices. Easy monetary policy for a sustained period
may lead to build up of financial excesses by raising
equity prices which foster excessive credit risk taking
being translated into excessive investments and
thereby fuelling asset prices further. These kinds of
unsustainable booms not only lead to misallocation
of resources but also create systemic risk with serious
ramifications for real economy in an event of inevitable
market correction, which would warrant appropriate
action from monetary policymakers.
III. Equity Valuation: Dividend Discount Model
(DDM) Approach
Equities can be valued using Gordon Growth
Dividend Discount Model (DDM), a fundamental tool
for valuation that involves discounting of the expected
cash flows in the future by using an appropriate
discount rate. The basic intuition that underlies this
model is that the value of stock is measured by the
cash flows it generates for its shareholders, which
primarily include dividend payments. The basic DDM
is represented by the following equation:
In this equation, P0 is the current equity price,
D1, D2, D3, …,Dn are the expected dividend payouts by
companies to shareholders in periods 1, 2, 3 up to
n, and ke is the cost of equity or expected return on
equity.
Assuming expected growth rate of dividends (g)
to be constant and cost of equity (ke) to be greater than
growth rate of dividends (i.e. ke > g), the equation
may be re-written as:

ARTICLE
RBI Bulletin October 2020 125
Demystifying Equity Prices using Dividend Discount Model: An Indian Context
To incorporate greater flexibility in the set of
assumptions, this article uses a two-stage DDM,
which assumes high growth phase for short-term, and
the terminal growth rate for long-term. Further, the
model considers potential dividends instead of actual
dividends as companies hold back cash and do not
pay out the entire amount that they can afford to in
the form of dividends or sometimes distribute cash
through stock buybacks due to tax considerations and
other reasons. Potential dividends are measured using
free cash flow to equity (FCFE)1. Incorporating these
modifications, the DDM is re-written as:
In this equation, n represents the number of years
of high growth, P0 is the current equity price, FCFEt is the
expected free cash flow to equity (potential dividends)
in period t, ke is the cost of equity or expected return
on equity and gn is the long-term stable growth rate.
All these factors drive the valuation of equity indices.
Required return on equity can be computed using
the model by incorporating the current price, which
is observable, free cash flow to equity and long-term
stable growth rate that are estimable. In our DDM
framework, the value of equity benchmark Sensex is
considered as representative price of Indian equities.
Expected FCFE is assumed to be 60 per cent of
expected net profits of constituent Sensex companies,
which are derived using consensus forward earnings
estimates of equity analysts for a three-year period
(high growth phase) available on Bloomberg. Terminal
growth rate is assumed to be equivalent to 10-year
G-sec rate, which is also considered to be the risk-free
rate.
Further, the expected return on equity is equal to
the risk-free rate plus a risk premium that investors
demand for taking additional risk by investing in
equities. Since risk-free rate is observable, implied ERP can be computed as residual of expected return on equity (ke) and risk-free rate (Rf).
ERP = ke - Rf
Implied ERP, calculated using this approach, is a forward-looking estimate of ERP and is consistent with the generally accepted belief that return on equities is driven by expectations. However, the reliability of implied ERP largely depends upon the accuracy of estimated future earnings, which may be subject to miscalculation and/or the bias of analysts. It is different from historical ERP that computes the premium over the risk-free rate earned by equity investors in the past. ERP is influenced by multiple factors, such as, risk-profile of investors, volatility in markets, etc. The details of ERP will be discussed in following section.
Thus, DDM helps to establish the changes in equity prices on account of factors including growth expectations, risk free rate and ERP, which is implied from the model. For instance, the rise in equity prices can be attributed to improved growth outlook, which raises profitability expectation or decline in ERP. However, higher contribution from low ERP for prolonged period is likely to signal stretched valuations, raising concerns over financial stability. Similarly, equity prices might be falling not only because of weak growth prospects but may be due to rise in ERP.
IV. Equity Risk Premium (ERP)
ERP is conceptualised as the excess return that makes an investor indifferent between holding a risk-free investment, usually a government bond, and a risky equity investment. ERP is an indicator of uncertainty and is dependent upon various factors, such as, investors’ risk preferences, macro-economic fundamentals, savings rate, market liquidity, political stability, government policies, monetary policy, etc.
1 Free cash flow to equity (FCFE) is the amount of cash a business generates that is available to be potentially distributed to shareholders. In other words, FCFE is the cash left over after taxes, re-investment needs and debt repayments.

ARTICLE
RBI Bulletin October 2020126
Demystifying Equity Prices using Dividend Discount Model: An Indian Context
ERP serves as a key input in determining cost of equity and thus warrants the need for monitoring. While the central bank’s action directly influences part of this cost by affecting the cost of debt, ERP is indirectly altered based on ability of monetary policy to influence risk taking behaviour of investors. From the financial stability point of view, a significantly lower ERP than what is implied by economic factors may lead to sharp and sudden drop in asset prices in any adverse event.
The first key determinant of ERP is the risk aversion of investors that suggest equity risk is higher, if investors are risk averse and vice versa. Risk aversion amongst investors varies with age, i.e., older investors are more risk averse and, therefore, demand higher premium compared to the younger investors. This risk aversion increases if investors value current consumption more than future consumption and vice versa. Since risk aversion varies across individual investors, it is the collective risk aversion, which determines the movement in equity risk premium.
Another important determinant is the economic risk. A more predictable economic scenario offers conducive environment for investment in equity resulting into lower risk premium and higher equity prices. Similarly, concerns over future equity returns in an environment of heightened macroeconomic uncertainty translates into higher ERP and lower equity prices. In this regard, several studies have established the relationship between risk premium and macroeconomic factors. In a study on the impact of macro-economic variables on stock prices as well as risk premium, the impact of GDP and inflation on ERP was found to be significant (Roll. et al.., 1986). Similarly, the inflation and GDP growth rates were found to influence risk premium in the US during the period 1802-2002 (Arnott and Beinstein, 2002). Also, declining ERP and persistently high stock valuations in the US during 1990s were ascribed to fall in macroeconomic risk, or volatility in the aggregate economy (Lettau, et al.., 2008).
One important risk, which arises from investment in equity is the liquidity risk. An illiquid market means
that the transaction cost of liquidating positions will
be higher, making investors demand higher ERP. A
study on the US stock returns between 1973 to 1997
concluded that liquidity accounts for a significant
component of the overall ERP, and that its effect
varies over time (Gibson and Mougeot, 2002). Another
research showed that liquidity across the markets
can partially explain the differences in equity returns
and risk premiums across emerging markets (Baekart,
Harvey and Lundblad, 2007).
Further, several studies examined macroeconomic
disasters which are low probability high consequence
events and contributed to the strand of literature on
the key reasons for existence of risk premium on
equity (Rietz, 1988; Barro, 2006; Gabaix, 2008; Barro,
Nakamura, Steinsson and Ursua, 2013).
Broadly, there are three methods to compute
ERP categorised into survey-based approach, ex-post calculation giving historical ERP and ex ante or implied
ERP based on valuation models, which considers
current market prices and interest rates. While the
survey-based approach suffers from individual biases,
historical ERP yields backward looking estimate.
In this respect, implied ERP is considered a better
indicator and is consistent with the generally accepted
belief that return on equities is driven by market
expectations.
The DDM framework for Indian equity market
yields average ERP estimates for the period under
study (2005-2020) at 4.7 per cent. ERP peaked at 8.2 per
cent during global financial crisis in 2008 followed by
surge in 2020 to 6.0 per cent on account of coronavirus
induced stress in the market (Chart 1). Since this
framework is based on a set of assumptions, the ERP
estimates are uncertain and, therefore, it is prudent to
focus on change in ERP over time than its precise level.
In the Indian context, ex-post ERP calculated using the
difference between actual return on Sensex and 10-

ARTICLE
RBI Bulletin October 2020 127
Demystifying Equity Prices using Dividend Discount Model: An Indian Context
year G-sec yield for the period 2005-20 averaged at 4.8 per cent, which is close to the implied ERP estimated using DDM framework.
The DDM model enables the ascertainment of factors behind changing cost of equity. During the global financial crisis of 2008, the sharp spike in ERP translated into higher cost of equity/required return on equity even as risk-free rates were declining (Chart 2). The subsequent policy actions in the form of monetary and fiscal stimulus aided in lowering of risk premia and the cost of equity. Thereafter, the decline in cost of equity is attributable to easing of policy rates by the Reserve Bank amidst low inflation environment and reduction in risk-free rate. However, escalating coronavirus induced stress during 2020 pushed ERP higher and consequently resulted in higher cost of equity. The subsequent policy actions lowered interest rates and led to easing of ERP, helping to bring down cost of equity from elevated levels.
ERP and Economic Activity
In economic sense, rising uncertainty as reflected by higher ERP tends to have negative impact on economic activity. This is mainly because both businesses and consumers will prefer to postpone their
investment and consumption decisions, respectively,
in an environment of increased uncertainty, thus
having negative impact on economic growth.
However, the decrease in the risk premium need not
necessarily translate into increased economic growth
(Stein, 2014). Low ERP over sustained period could
potentially lead to a build-up of financial vulnerability,
which can translate into macroeconomic instability
(Annex 1).
The computed ERP through DDM method shows
high correlation with other measures of risk premium
including India VIX and corporate bond spreads.
Chart 3 depicts co-movement of India VIX, which
measures market perceptions of risk, and ERP. Surge
in volatility (VIX) is associated with unwillingness of
investors to hold risky assets raising the premium
(ERP) they demand for bearing risk or a flight to safety
against sharp changes in asset prices.
Another way of looking at risk perceptions is
through measures of credit risk, which is determined
by the spread of corporate bond yield over the risk-
free rate. Changes in corporate bond spread reflects
risk perceptions of investors, i.e., increase in corporate
bond spread would mean increase in yield that
Chart 1: Equity Risk Premium Chart 2: Decomposing Cost of Equity
GFC
Covid-19

ARTICLE
RBI Bulletin October 2020128
Demystifying Equity Prices using Dividend Discount Model: An Indian Context
investors demand for holding a corporate bond over an equivalent maturity government bond without any default risk suggesting prevalence of risk aversion and vice versa. Chart 4 outlines the co-movement of corporate bond spread and ERP for the period under study. However, the relationship weakened somewhat during 2018, which can plausibly be attributed to the asymmetric impact of default on its debt obligations by Infrastructure Leasing & Financial Services (IL&FS) on corporate bond market.
V. Decomposing Indian Equity Prices using DDM
A second important application of DDM is that it helps to understand the underlying factors driving movement in equity prices by enabling decomposition of change in equity prices into contributions of changes in risk-free rate, ERP and growth expectations. Such a decomposition is arrived by varying, one at a time, each of the three terms on the right side of DDM equation and determining the associated impact on change in equity prices. The impact on equity prices
due to simultaneous change in two or more variables
is captured by the interaction term.
Indian equity market witnessed strong rally
during the period 2005-08 before the contagion from
global financial crisis beginning in 2007 triggered
sharp decline in the BSE Sensex (Chart 5). However,
the domestic equity market recovered from the stress
Chart 3: Equity Risk Premium and Implied Volatility
Chart 4: Equity Risk Premium and Corporate Bond Spread
Chart 5: Movement of Sensex

ARTICLE
RBI Bulletin October 2020 129
Demystifying Equity Prices using Dividend Discount Model: An Indian Context
at a faster pace during 2009-10, declining thereafter
between 2010-13 amidst renewed global uncertainty
owing to Euro crisis and taper tantrum. During this
period, the negative sentiment was compounded by
domestic factors including downgrade of India’s long-
term rating outlook to negative from stable, worries
over retrospective tax and general anti-avoidance
rules (GAAR) and sharp slide of the Indian rupee.
The positive momentum in the equity market from
2013 was restored by the Reserve Bank’s measures
to rebuild appropriate liquidity buffers coupled with
accommodative monetary policy stances of European
Central Bank (ECB) and the Bank of Japan (BoJ) as
well as relaxed approach of the US Federal Reserve
to monetary policy normalisation. Going ahead,
concerns over slowdown in China and asset quality in
the banking system on the domestic front contributed
to the fall in equity market during 2015-16. Since
February 2016, equity market has generally exhibited
uptrend barring transient blips till mid-January
2020. However, the Indian equity markets retreated
thereafter in sync with global markets on fears over
COVID-19 induced recession. Subsequently, markets
made impressive recovery enthused by extraordinary
monetary policy support and fiscal stimulus measures
coupled with improvement in macro indicators
amidst gradual unlocking of economy. All these
factors driving market manifest into the components
of DDM including earning expectations, risk premium
and interest rates.
Application of the model
The Chart 6 illustrates the contribution of
different factors in driving the Indian equity prices
since 2005:
August 2005-January 2008: The sharp rally in
the Indian equity market during this period pushed
the BSE Sensex nearly three times to 20,000 levels.
The DDM decomposition attributes this surge mainly
to the increase in earnings expectations with the
equity risk premium playing relatively minimal role.
The cumulative positive impact of these factors was
substantially large to offset the negative contribution
from interest rates.
January 2008 - March 2009: This phase is marked
by the global financial crisis, which roiled financial
markets across the globe. During this period, the BSE
Sensex declined around 60 per cent in a short span
of 15 months. According to the DDM decomposition,
earnings expectations and equity risk premium
Chart 6: DDM Decomposition of Change in Equity Prices

ARTICLE
RBI Bulletin October 2020130
Demystifying Equity Prices using Dividend Discount Model: An Indian Context
contributed to the fall in equity market. Earnings
expectations corrected sharply as economic outlook
deteriorated, and equity risk premium spiked owing
to increased perception of risk and uncertainty.
However, the impact of accommodative monetary
policy stance is reflected in the positive contribution
of interest rate to the movement in equity prices.
March 2009 - November 2010: Equity prices
rebounded sharply during this period and the results
of DDM illustrates the positive impact of ERP and
earnings expectations. During this period, ERP fell
sharply from peak of 8.2 per cent during crisis period
to average of 4.8 per cent during this period. This can
be attributed to the revival of risk sentiment due to
both monetary and fiscal support in the aftermath of
crisis. Further, Indian economy weathered financial
crisis relatively well which meant outlook on earnings
growth also recovered quickly.
November 2010 - September 2013: DDM
decomposition suggests that the decline in Indian
equity market during this phase is explained by ERP
and interest rates, even though earnings expectation
contributed positively. Market was unsettled by the
Euro area crisis beginning 2010 followed by the taper
tantrum episode during May-August 2013, which
drove ERP higher. Higher ERP amidst improved
earnings expectations suggest that even as economic
outlook remained positive, uncertainty surrounding
that outlook had risen.
September 2013 - January 2015: With concerted
policy actions post the taper tantrum episode,
the equity market resumed upward momentum
helped both by ERP and interest rates as the DDM
decomposition highlights. However, role of earnings
expectations in driving equity prices declined
compared to the previous period.
January 2015 - February 2016: The downturn in
equity prices was witnessed during this phase led by
worsening outlook on earnings and rise in ERP, with
interest rates causing negligible impact as illustrated
by the DDM decomposition.
February 2016 - January 2020: Since 2016,
the BSE Sensex gained over 80 per cent touching a
lifetime high of 41953 on January 14, 2020. However,
this uptrend is driven largely by a combination of
ERP and interest rates, with earnings expectations
contributing to a lesser extent. Low interest rate
environment attributable to low inflation prevailed
alongside compression of risk premium. ERP touched
a low of 3.7 per cent during this period and remained
lower than the long-term average in the previous
years.
January 2020 - March 2020: This phase saw
sharp correction in the Indian equity market in sync
with the global markets due to COVID-19 pandemic.
The BSE Sensex plummeted over 30 per cent during
this period and the DDM decomposition suggests
significant impact from the increase in ERP followed
by faltering earnings expectations. At the same time,
monetary accommodation is reflected in positive
contribution from interest rates.
March 2020 - September 2020: The BSE Sensex
recovered nearly 50 per cent from the low of 25,981
on March 23, 2020 aided by sizable policy support
on both monetary and fiscal fronts along with rally
in global equity markets. DDM decomposition
suggest significant contribution from the easing of
ERP. However, unlike previous episodes of upswing,
there is negligible contribution from earnings
expectations.
Conclusion
The study uses Dividend Discount Model
framework to determine implied Equity Risk
Premium for Indian equities. The average ERP during
2005-2020 is estimated at 4.7 per cent. The empirical
evidence suggests that ERP shot up sharply during

ARTICLE
RBI Bulletin October 2020 131
Demystifying Equity Prices using Dividend Discount Model: An Indian Context
global financial crisis of 2008 and during COVID-19
pandemic in March 2020. The relationship between
change in ERP and GDP growth is found to be inverse
and asymmetric with increase in ERP assuming
significance in explaining the fall in GDP growth.
ERP is also found to be highly correlated with other
measures of uncertainty such as India VIX and
corporate bond spread. Decomposition of change in
equity price indicates that the rise in equity prices
during 2016 to early 2020 was mainly supported
by decrease in interest rates and ERP, with increase
in forward earnings expectations contributing to a
lesser extent. Thereafter, spike in ERP on COVID-19
concerns contributed significantly to the plunge in
the equity prices. However, subsequently post-March
2020, markets registered impressive recovery aided
by easing of ERP, even as the contribution of earnings
expectations was negligible.
References
Dison, Will and Rattan, Alex (2017), “An improved
model for understanding equity prices,” Bank of England Quarterly Bulletin, Bank of England, vol.
57(2), pages 86-97.
Damodaran, Aswath (2019), “Equity Risk Premiums
(ERP): Determinants, Estimation and Implications –
The 2019 Edition”.
Guangye Cao & Daniel Molling & Taeyoung Doh, (2015)
“Should monetary policy monitor risk premiums in
financial markets?”,Economic Review, Federal Reserve
Bank of Kansas City.
Norges Bank (2016), “Discussion Note on the Equity
Risk Premium”.
Remarks by Governor Ben S. Bernanke (2003),
“Monetary Policy and the Stock Market: Some Empirical
Results”, At the Fall 2003 Banking and Finance Lecture,
Widener University, Chester, Pennsylvania.
Panigirtzoglou, Nikolaos and Scammell, Robert (2002),
Analysts’ Earnings Forecasts and Equity Valuations,
Bank of England Quarterly Bulletin.
Chen, Nai-Fu, Roll, Richard and Ross, Stephen A.
(1986), “Economic Forces and the Stock Market”, The Journal of Business, Vol. 59, No. 3
Arnott, Robert D. and Bernstein, Peter L. (2002),
“What Risk Premium is ‘Normal’?”, Financial Analysts Journal, Vol. 58, No. 2, 64-85
Lettau, M., Ludvigson, S., Wachter, J. (2008), “The
declining equity risk premium: What role does
macroeconomic risk play?”, Review of Financial Studies, 21, 1653-1687.
Gibson, R., Mougeot, N. (2004), “The pricing of
systematic liquidity risk: Empirical evidence from the
US stock market”, Journal of Banking and Finance, 28,
157-178.
Bekaert, G., Harvey, C., Lundblad, C. (2007), “Liquidity
and expected returns: Lessons from emerging
markets”, Review of Financial Studies, 20(6), 1783-
1831.
Rietz, T. (1988), “The equity risk premium: A solution”,
Journal of Monetary Economics, 22, 117-131.
Barro, R. (2006), “Rare disasters and asset markets
in the twentieth century”, Quarterly Journal of Economics, 121(3), 823-866.
Nakamura, E., Steinsson, J., Barro, R., Ursua, J. (2013),
“Crises and recoveries in an empirical model of
consumption disasters”, American Economic Journal: Macroeconomics, 5(3), 35-74.
Xavier Gabaix (2008), “Variable Rare Disasters: An
Exactly Solved Framework for Ten Puzzles in Macro-
Finance,” The Quarterly Journal of Economics, Oxford University Press, vol. 127(2), pages 645-700.

ARTICLE
RBI Bulletin October 2020132
Demystifying Equity Prices using Dividend Discount Model: An Indian Context
Annex I: ERP and Economic Activity
To understand the macroeconomic implications of changes in equity risk premium, we have regressed both IIP and GDP on ERP as well as its past values. A distinction is made between increase and decrease in ERP, which are included separately to estimate their asymmetric impact.
In evaluating the impact on IIP, monthly IIP is regressed on previous six months change in ERP and similarly, quarterly GDP on previous two quarters change in ERP (Chart 7). Lagged values of both IIP and GDP are included in regression to gauge the predictive power of ERP over and above the past values of independent variables (GDP and IIP). Lagged terms are identified based on improvement to the overall fit of the model.
Table 1: Regression Results for GDP (Sample period: December 2006-September 2019)
Explanatory variables
Coefficient Std. Error Prob.
C 0.02* 0.01 0.04GDP (-1) 0.63* 0.15 0.00GDP (-2) -0.08 0.17 0.63GDP (-3) 0.13 0.14 0.36INCREASE_ERP -1.30* 0.61 0.04DECREASE_ERP -1.13 0.73 0.13R-squared 0.58 F-statistic 12.57Adjusted R-squared 0.53 Prob(F-statistic) 0.00Log likelihood 145.68
Note: * Significant at 5 per cent level of confidence.
Table 2: Regression Results for IIP (Sample period: March 2006-October 2019)
Explanatory variables
Coefficient Std. Error Prob.
C 0.01* 0.01 0.02IIP (-3) 0.58* 0.08 0.00IIP (-6) 0.24* 0.08 0.00INCREASE_ERP -2.98* 0.72 0.00DECREASE_ERP -0.86 0.83 0.30R-squared 0.55 F-statistic 48.25598Adjusted R-squared 0.54 Prob (F-statistic) 0Log likelihood 313.81
Note: *Significant at 5 per cent level of confidence.
Chart 7: Relationship Between ERP and Economic Activity Indicators
a: Real GDP vs. ERP b: IIP vs. ERP
The negative coefficients of increase as well as decrease in ERP establish the inverse relationship between economic activity indicators (IIP and GDP) and equity risk premium. However, both the regression results suggest that while the increase in ERP assumes significance in explaining the dependent variables, i.e., IIP and GDP, decrease in ERP is
insignificant in line with the economic theories. This is largely consistent with the divergence between real economy and market observed in 2019 wherein ERP stayed low contributing to surge in equity markets to record-highs and GDP growth stayed muted. Overall, while the ERP has stayed below 4 per cent levels since 2016, real GDP growth has remained below 2016 level which was 8.7 per cent.

CURRENT STATISTICS
Select Economic Indicators
Reserve Bank of India
Money and Banking
Prices and Production
Government Accounts and Treasury Bills
Financial Markets
External Sector
Payment and Settlement Systems
Occasional Series


CURRENT STATISTICS
RBI Bulletin October 2020 133
No. Title Page
1 Select Economic Indicators 135
Reserve Bank of India
2 RBI – Liabilities and Assets 136
3 Liquidity Operations by RBI 137
4 Sale/ Purchase of U.S. Dollar by the RBI 138
4A Maturity Breakdown (by Residual Maturity) of Outstanding Forwards of RBI (US$ Million) 139
5 RBI's Standing Facilities 139
Money and Banking
6 Money Stock Measures 140
7 Sources of Money Stock (M3) 141
8 Monetary Survey 142
9 Liquidity Aggregates 142
10 Reserve Bank of India Survey 143
11 Reserve Money – Components and Sources 143
12 Commercial Bank Survey 144
13 Scheduled Commercial Banks' Investments 144
14 Business in India – All Scheduled Banks and All Scheduled Commercial Banks 145
15 Deployment of Gross Bank Credit by Major Sectors 146
16 Industry-wise Deployment of Gross Bank Credit 147
17 State Co-operative Banks Maintaining Accounts with the Reserve Bank of India 148
Prices and Production
18 Consumer Price Index (Base: 2012=100) 149
19 Other Consumer Price Indices 149
20 Monthly Average Price of Gold and Silver in Mumbai 149
21 Wholesale Price Index 150
22 Index of Industrial Production (Base: 2011-12=100) 154
Government Accounts and Treasury Bills
23 Union Government Accounts at a Glance 154
24 Treasury Bills – Ownership Pattern 155
25 Auctions of Treasury Bills 155
Financial Markets
26 Daily Call Money Rates 156
27 Certificates of Deposit 157
28 Commercial Paper 157
29 Average Daily Turnover in Select Financial Markets 157
30 New Capital Issues by Non-Government Public Limited Companies 158
Contents

CURRENT STATISTICS
RBI Bulletin October 2020134
No. Title Page
External Sector
31 Foreign Trade 159
32 Foreign Exchange Reserves 159
33 NRI Deposits 159
34 Foreign Investment Inflows 160
35 Outward Remittances under the Liberalised Remittance Scheme (LRS) for Resident Individuals 160
36 Indices of Real Effective Exchange Rate (REER) and Nominal Effective Exchange Rate (NEER) of the Indian Rupee
161
37 External Commercial Borrowings (ECBs) 161
38 India’s Overall Balance of Payments (US $ Million) 162
39 India's Overall Balance of Payments (` Crore) 163
40 Standard Presentation of BoP in India as per BPM6 (US $ Million) 164
41 Standard Presentation of BoP in India as per BPM6 (` Crore) 165
42 International Investment Position 166
Payment and Settlement Systems
43 Payment System Indicators 167
Occasional Series
44 Small Savings 169
45 Ownership Pattern of Central and State Governments Securities 170
46 Combined Receipts and Disbursements of the Central and State Governments 171
47 Financial Accommodation Availed by State Governments under various Facilities 172
48 Investments by State Governments 173
49 Market Borrowings of State Governments 174
Notes: .. = Not available. – = Nil/Negligible. P = Preliminary/Provisional. PR = Partially Revised.

CURRENT STATISTICS
RBI Bulletin October 2020 135
2018-19 2019-20 2020-21
Q4 Q1 Q4 Q1
2 3 4 5
5.6 4.8 3.0 -22.81.6 3.0 5.9 3.41.4 3.8 -0.01 -33.88.3 5.5 3.5 -24.37.3 5.6 4.2 -19.24.4 4.6 -6.5 -47.1
Item2019-20
11 Real Sector (% Change) 1.1 GVA at Basic Prices 3.9 1.1.1 Agriculture 4.0 1.1.2 Industry 0.8 1.1.3 Services 5.0 1.1a Final Consumption Expenditure 6.3 1.1b Gross Fixed Capital Formation -2.8
2019-20
1 1.2 Index of Industrial Production -0.82 Money and Banking (% Change) 2.1 Scheduled Commercial Banks 2.1.1 Deposits 7.9 2.1.2 Credit 6.1 2.1.2.1 Non-food Credit 6.1 2.1.3 Investment in Govt. Securities 10.6 2.2 Money Stock Measures 2.2.1 Reserve Money (M0) 9.4 2.2.2 Broad Money (M3) 8.93 Ratios (%) 3.1 Cash Reserve Ratio 3.00 3.2 Statutory Liquidity Ratio 18.25 3.3 Cash-Deposit Ratio 4.6 3.4 Credit-Deposit Ratio 76.4 3.5 Incremental Credit-Deposit Ratio 60.3 3.6 Investment-Deposit Ratio 27.6 3.7 Incremental Investment-Deposit Ratio 36.24 Interest Rates (%) 4.1 Policy Repo Rate 4.40 4.2 Reverse Repo Rate 4.00 4.3 Marginal Standing Facility (MSF) Rate 4.65 4.4 Bank Rate 4.65 4.5 Base Rate 8.15/9.40 4.6 MCLR (Overnight) 7.40/7.90 4.7 Term Deposit Rate >1 Year 5.90/6.40 4.8 Savings Deposit Rate 3.00/3.50 4.9 Call Money Rate (Weighted Average) 5.05 4.10 91-Day Treasury Bill (Primary) Yield 4.36 4.11 182-Day Treasury Bill (Primary) Yield 4.97 4.12 364-Day Treasury Bill (Primary) Yield 4.94 4.13 10-Year G-Sec Par Yield (FBIL) 6.715 Reference Rate and Forward Premia 5.1 INR-US$ Spot Rate (Rs. Per Foreign Currency) 74.84 5.2 INR-Euro Spot Rate (Rs. Per Foreign Currency) 82.64 5.3 Forward Premia of US$ 1-month (%) 8.98 3-month (%) 5.93 6-month (%) 5.056 Inflation (%) 6.1 All India Consumer Price Index 4.76 6.2 Consumer Price Index for Industrial Workers 7.54 6.3 Wholesale Price Index 1.69 6.3.1 Primary Articles 6.77 6.3.2 Fuel and Power -1.63 6.3.3 Manufactured Products 0.297 Foreign Trade (% Change) 7.1 Imports -7.66 7.2 Exports -5.06
No. 1: Select Economic Indicators
2019 2020Jul. Aug. Jul. Aug.
2 3 4 54.9 -1.4 -10.4 -
9.6 9.7 12.1 10.912.1 10.2 6.4 5.512.1 10.1 6.3 5.51.3 2.1 22.5 21.8
12.9 13.1 14.9 14.710.6 9.8 13.2 12.6
4.00 4.00 3.00 3.00
18.75 18.75 18.00 18.004.8 4.9 3.7 3.7
76.5 75.7 72.6 72.1-186.1 -44.4 -15.0 -25.4
27.7 28.0 30.3 30.7207.1 96.5 93.1 101.9
5.75 5.40 4.00 4.005.50 5.15 3.35 3.356.00 5.65 4.25 4.256.00 5.65 4.25 4.25
8.95/9.40 8.95/9.40 7.40/9.00 7.40/9.008.00/8.40 7.90/8.40 6.65/7.30 6.65/7.206.25/7.30 6.35/7.10 5.10/5.50 5.00/5.503.25/3.50 3.25/3.50 2.70/3.00 2.70/3.00
5.59 5.36 3.46 3.435.65 5.41 3.30 3.245.88 5.63 3.39 3.495.94 5.72 3.52 3.596.47 6.70 5.78 6.12
69.06 71.76 74.77 73.3576.94 79.24 88.87 87.07
4.00 3.85 3.61 3.764.09 4.18 3.74 3.904.31 4.24 3.80 4.01
3.1 3.3 6.7 6.76.0 6.3 5.3 5.61.2 1.2 -0.6 0.25.5 6.5 0.6 1.6
-3.6 -3.5 -9.8 -9.70.3 0.0 0.5 1.3
-8.9 -12.9 -29.6 -26.01.9 -6.5 -9.9 -12.7
Note : Financial Benchmark India Pvt. Ltd. (FBIL) has commenced publication of the G-Sec benchmarks with effect from March 31, 2018 as per RBI circular FMRD.DIRD.7/14.03.025/2017-18 dated March 31, 2018. FBIL has started dissemination of reference rates w.e.f. July 10, 2018.
No. 1: Select Economic Indicators

CURRENT STATISTICS
RBI Bulletin October 2020136
No. 2: RBI - Liabilities and Assets *
(` Crore)
L 2019 2020
Sep. Aug. 28 Sep. 4 Sep. 11 Sep. 18 Sep. 25
2 3 4 5 6 7
1
1 1. 2160124 2654096 2660905 2669875 2664016 2656476
1. 13 23 14 13 13 13
1. 2160137 2654119 2660919 2669888 2664029 2656489
2 1. 89945 119425 120034 122287 120286 115902
1. 2069429 2533943 2540141 2546866 2543012 2539862
1. 763 751 744 735 731 725
1. – – – – – –
2
1 2. 882826 1373902 1376772 1372450 1300884 1311570
2. 101 100 101 100 101 100
2.
2. 42 42 42 42 42 42
2. 532442 439411 455304 434587 454414 429915
2. 4199 5183 5264 5156 5227 5213
2. 2743 2416 2448 2432 2403 2453
2. 30680 25785 25809 25892 25745 26029
2. 311557 897611 881149 897188 808719 843575
2. 1061 3354 6655 7053 4233 4243
2. 1064818 1419535 1390255 1406505 1407134 1383243
2. 1947644 2793437 2767027 2778955 2708018 2694813
2 2. 13 23 14 13 13 13
2. 789658 1151725 1134612 1141544 1170219 1169932
2.
2. – – – – – –
2. 459 9033 18834 26615 23430 10516
2. 47478 253645 248425 239017 125449 121495
2. – – – – – 35
2. – – – – – –
2. – 24803 24447 24447 24447 25286
2. – – – – – –
2. 6139 9619 11725 11880 11880 12776
2. 5 2626 3728 4125 14507 15290
2.2. – – – – – –
2. – – – – – –
2. 1000116 1186206 1168492 1171609 1180396 1187027
2. 103776 155757 156750 159705 157677 152443
2. 100272 153600 154383 157281 154707 149069
Item
2019-20
1
1 Issue Department
1.1 Liabilities
1.1.1 Notes in Circulation 2412993
1.1.2 Notes held in Banking Department 10
1.1/1.2 Total Liabilities (Total Notes Issued) or Assets 2413003 1.2 Assets
1.2.1 Gold Coin and Bullion 103439
1.2.2 Foreign Securities 2308718
1.2.3 Rupee Coin 846
1.2.4 Government of India Rupee Securities –
2 Banking Department
2.1 Liabilities
2.1.1 Deposits 1187409
2.1.1.1 Central Government 100
2.1.1.2 Market Stabilisation Scheme
2.1.1.3 State Governments 43
2.1.1.4 Scheduled Commercial Banks 536186
2.1.1.5 Scheduled State Co-operative Banks 7603
2.1.1.6 Non-Scheduled State Co-operative Banks 3445
2.1.1.7 Other Banks 32641
2.1.1.8 Others 605100
2.1.1.9 Financial Institution Outside India 2291
2.1.2 Other Liabilities 1350333
2.1/2.2 Total Liabilities or Assets 2537742 2.2 Assets
2.2.1 Notes and Coins 10
2.2.2 Balances held Abroad 1006357
2.2.3 Loans and Advances
2.2.3.1 Central Government 50477
2.2.3.2 State Governments 1967
2.2.3.3 Scheduled Commercial Banks 285623
2.2.3.4 Scheduled State Co-op.Banks –
2.2.3.5 Industrial Dev. Bank of India –
2.2.3.6 NABARD –
2.2.3.7 EXIM Bank –
2.2.3.8 Others 10064
2.2.3.9 Financial Institution Outside India 2300
2.2.4 Bills Purchased and Discounted
2.2.4.1 Internal –
2.2.4.2 Government Treasury Bills –
2.2.5 Investments 1042951
2.2.6 Other Assets 137993
2.2.6.1 Gold 127644
As on the Last Friday/ Friday
* Data are provisional
Reserve Bank of IndiaNo. 2: RBI - Liabilities and Assets *

CURRENT STATISTICS
RBI Bulletin October 2020 137
No. 3: Liquidity Operations by RBI
(` Crore)
Date
Repo ReverseRepo
VariableRateRepo
VariableRate
ReverseRepo
MSFStandingLiquidityFacilities
MarketStabilisation
SchemeSale Purchase
Long TermRepo
Operations
TargetedLong Term
RepoOperations
#
SpecialLiquidity
Facility forMutualFunds
SpecialLiquidity
Scheme forNBFCs/HFCs **
Net Injection (+)/Absorption (-)
(1+3+5+6+9+10+11+12+13-2-4-7-8
)
1 2 3 4 5 6 7 8 9 10 11 12 13 14Aug. 1, 2020 - 10180 - - 0 – - - - - - - - -10180Aug. 2, 2020 - 0 - - 0 – - - - - - - - 0Aug. 3, 2020 - 681241 - - 0 -496 - - - - - - - -681737Aug. 4, 2020 - 704691 - - 53 -100 - - - - - - - -704738Aug. 5, 2020 - 705114 - - 45 – - - - - - - - -705069Aug. 6, 2020 - 637700 - - 0 -150 - - - - - - - -637850Aug. 7, 2020 - 649389 - - 65 -50 - - - - - - 984 -648390Aug. 8, 2020 - 24 - - 0 – - - - - - - - -24Aug. 9, 2020 - 59 - - 0 – - - - - - - - -59Aug. 10, 2020 - 613376 - - 0 -520 - - - - - - - -613896Aug. 11, 2020 - 614916 - - 0 – - - - - - - - -614916Aug. 12, 2020 - 604875 - - 0 1500 - - - - - - - -603375Aug. 13, 2020 - 600451 - - 0 – - - - - - - - -600451Aug. 14, 2020 - 600298 - - 12 – - - - - - - 491 -599795Aug. 15, 2020 - 8118 - - 0 – - - - - - - - -8118Aug. 16, 2020 - 191 - - 2 – - - - - - - - -189Aug. 17, 2020 - 597878 - - 0 – - - 850 - - - - -597028Aug. 18, 2020 - 600526 - - 0 – - - - - - - 236 -600290Aug. 19, 2020 - 590036 - - 2 – - - - - - - 493 -589541Aug. 20, 2020 - 648114 - - 0 – - - - - - - - -648114Aug. 21, 2020 - 636574 - - 0 -34 - - - - - - 1025 -635583Aug. 22, 2020 - 933 - - 0 – - - - - - - - -933Aug. 23, 2020 - 871 - - 0 – - - - - - - - -871Aug. 24, 2020 - 614757 - - 202 -30 - - - - - - - -614585Aug. 25, 2020 - 634837 - - 1 -1355 - - - - - - 493 -635698Aug. 26, 2020 - 632916 - - 4 -30 - - - - - - - -632942Aug. 27, 2020 - 644363 - - 0 – - - - - - - 493 -643870Aug. 28, 2020 - 674095 - - 300 1025 - 10000 10000 - - - - -672770Aug. 29, 2020 - 16122 - - 0 – - - - - - - - -16122Aug. 30, 2020 - 25 - - 0 – - - - - - - - -25Aug. 31, 2020 - 685707 - - 250 1754 - - 800 - - - - -682903
Notes: # Includes Targeted Long Term Repo Operations (TLTRO) and Targeted Long Term Repo Operations 2.0 (TLTRO 2.0)**As per the RBI Notification No. 2020-21/01 dated July 01, 2020
No. 3: Liquidity Operations by RBI

CURRENT STATISTICS
RBI Bulletin October 2020138
2019 2020
Aug. Jul. Aug.
2 3 4
-4072 15973 5307
615 16903 8524
4687 930 3217
-29493 119677 39505
5737 29008 34315
35413 217659 257164
-7848 -379 10351
No. 4: Sale/ Purchase of U.S. Dollar by the RBI
Item2019-20
1
1 Net Purchase/ Sale of Foreign Currency (US $ Million) (1.1–1.2) 45097
1.1 Purchase (+) 72205
1.2 Sale (–) 27108
2 equivalent at contract rate 312005
3 Cumulative (over end-March) (US $ Million) 45097
(` Crores) 312005
4 Outstanding Net Forward Sales (–)/ Purchase (+) at the end of month (US $ Million)
-4939
Item2019-20
1
1 Net Purchase/ Sale of Foreign Currency (US $ Million) (1.1–1.2) 0
1.1 Purchase (+) 7713
1.2 Sale (–) 7713
2 Outstanding Net Currency Futures Sales (–)/ Purchase (+) at the end of month (US $ Million)
-500
2019 2020
Aug. Jul. Aug.
2 3 4
0 0 0
1521 0 0
1521 0 0
-475 0 0
i) Operations in onshore / offshore OTC segment
ii) Operations in currency futures segment
` (` Crores)

CURRENT STATISTICS
RBI Bulletin October 2020 139
Item As on August 31, 2020
Long (+) Short (-) Net (1-2)
1 2 3
1. Upto 1 month 5150 1235 3915
2. More than 1 month and upto 3 months 3570 0 3570
3. More than 3 months and upto 1 year 11901 0 11901
4. More than 1 year 985 10020 -9035
Total (1+2+3+4) 21606 11255 10351
No. 4 A : Maturity Breakdown (by Residual Maturity) of OutstandingForwards of RBI (US $ Million)
No. 5: RBI's Standing Facilities
Item
2019-20
1
1 MSF 1262
2 Export Credit Refinance for Scheduled Banks
2.1 Limit -
2.2 Outstanding -
3 Liquidity Facility for PDs
3.1 Limit 10000
3.2 Outstanding 4782
4 Others
4.1 Limit -
4.2 Outstanding -
5 Total Outstanding (1+2.2+3.2+4.2) 6044
(` Crore)
2019 2020
Sep. 27 Apr. 24 May 22 Jun. 19 Jul. 31 Aug. 28 Sep. 25
2 3 4 5 6 7 8
48 45 1400 310 80 300 50
– - - - - - -
– - - - - - -
2800 10000 4900 4900 4900 4900 4900
2372 4162 1372 326 30 – –
– 50000 50000 50000 65000 65000 65000
– – 21369 26894 34376 34166 37691
2420 4207 24141 27530 34486 34466 37741
As on the Last Reporting Friday
Note :1.Special refinance facility to Others, i.e. to the EXIM Bank, is reopened since May 22, 2020 2.Refinance facility to Others, i.e. to the NABARD/SIDBI/NHB U/S 17(4H) of RBI ACT,1934, since, April 17, 2020.
No. 5: RBI’s Standing Facilities
No. 4 A : Maturity Breakdown (by Residual Maturity) of Outstanding Forwards of RBI (US $ Million)

CURRENT STATISTICS
RBI Bulletin October 2020140
Money and Banking
Item
2019-20 2019 2020
Aug. 30 Jul. 31 Aug. 14 Aug. 28
1 2 3 4 5
1 Currency with the Public (1.1 + 1.2 + 1.3 – 1.4) 2349748 2082634 2576293 2593814 2583111
1.1 Notes in Circulation 2420964 2150382 2646131 2665391 2654096
1.2 Circulation of Rupee Coin 25605 25258 25686 25686 25708
1.3 Circulation of Small Coins 743 743 743 743 743
1.4 Cash on Hand with Banks 97563 93749 96267 98007 97436
2 Deposit Money of the Public 1776199 1511661 1688504 1623813 1702537
2.1 Demand Deposits with Banks 1737692 1480680 1648797 1584270 1662573
2.2 ‘Other’ Deposits with Reserve Bank 38507 30982 39707 39543 39964
3 M (1 + 2) 4125948 3594295 4264797 4217627 4285648
4 Post Office Saving Bank Deposits 141786 147931 141786 141786 141786
5 M (3 + 4) 4267734 3742226 4406583 4359413 4427434
6 Time Deposits with Banks 12674016 12082795 13361006 13343888 13362349
7 M (3 + 6) 16799963 15677090 17625803 17561514 17647997
8 Total Post Office Deposits 409246 396704 409246 409246 409246
9 M (7 + 8) 17209209 16073794 18035049 17970760 18057243
No. 6: Money Stock Measures
(` Crore)
Outstanding as on March 31/last reporting Fridays of the month/reporting Fridays
1
2
3
4
No. 6: Money Stock Measures

CURRENT STATISTICS
RBI Bulletin October 2020 141
No. 7: Sources of Money Stock (M )
Sources
2019-20 2019 2020
Aug. 30 Jul. 31 Aug. 14 Aug. 28
1 2 3 4 5
1 Net Bank Credit to Government 4906583 4720650 5609914 5534710 5613739
1.1 RBI’s net credit to Government (1.1.1–1.1.2) 992192 934922 1078662 979844 1015146
1.1.1 Claims on Government 1047808 1000337 1184492 1191910 1194026
1.1.1.1 Central Government 1045314 999731 1179635 1181161 1184993
1.1.1.2 State Governments 2494 606 4857 10749 9033
1.1.2 Government deposits with RBI 55616 65415 105830 212066 178880
1.1.2.1 Central Government 55573 65373 105788 212023 178838
1.1.2.2 State Governments 43 42 42 43 42
1.2 Other Banks’ Credit to Government 3914391 3785728 4531252 4554866 4598593
2 Bank Credit to Commercial Sector 11038644 10289159 10941684 10879171 10876306
2.1 RBI’s credit to commercial sector 13166 7597 11588 11613 11565
2.2 Other banks’ credit to commercial sector 11025478 10281562 10930096 10867558 10864741
2.2.1 Bank credit by commercial banks 10370861 9680153 10282057 10219502 10216227
2.2.2 Bank credit by co-operative banks 637776 590119 637599 638051 638172
2.2.3 Investments by commercial and co-operative banks in other securities 16842 11290 10440 10005 10342
3 Net Foreign Exchange Assets of Banking Sector (3.1 + 3.2) 3801036 3262191 4194144 4204344 4168356
3.1 RBI’s net foreign exchange assets (3.1.1–3.1.2) 3590402 3050903 3983510 3993710 3957722
3.1.1 Gross foreign assets 3590636 3051112 3983748 3993953 3957965
3.1.2 Foreign liabilities 234 209 238 243 243
3.2 Other banks’ net foreign exchange assets 210634 211288 210634 210634 210634
4 Government’s Currency Liabilities to the Public 26348 26001 26429 26429 26451
5 Banking Sector’s Net Non-monetary Liabilities 2972648 2620910 3146368 3083140 3036855
5.1 Net non-monetary liabilities of RBI 1378342 1106106 1547264 1487770 1421949
5.2 Net non-monetary liabilities of other banks (residual) 1594306 1514804 1599104 1595370 1614906
M (1+2+3+4–5) 16799963 15677090 17625803 17561514 17647997
(` Crore)
Outstanding as on March 31/last reporting Fridays ofthe month/reporting Fridays
3
3
No. 7: Sources of Money Stock (M3)

CURRENT STATISTICS
RBI Bulletin October 2020142
No. 8: Monetary Survey
Item
2019-20 2019 2020Aug. 30 Jul. 31 Aug. 14 Aug. 28
1 2 3 4 5Monetary AggregatesNM1 (1.1 + 1.2.1+1.3) 4125948 3594295 4264797 4217627 4285648NM (NM + 1.2.2.1) 9745776 8951941 10199513 10145989 10223166NM (NM + 1.2.2.2 + 1.4 = 2.1 + 2.2 + 2.3 – 2.4 – 2.5) 16923893 15844360 17727030 17658222 177528011 Components1.1 Currency with the Public 2349748 2082634 2576293 2593814 25831111.2 Aggregate Deposits of Residents 14226198 13386559 14837053 14758408 14857059 1.2.1 Demand Deposits 1737692 1480680 1648797 1584270 1662573 1.2.2 Time Deposits of Residents 12488506 11905879 13188256 13174138 13194485 1.2.2.1 Short-term Time Deposits 5619828 5357646 5934715 5928362 5937518 1.2.2.1.1 Certificates of Deposit (CDs) 169419 174259 106526 97486 88084 1.2.2.2 Long-term Time Deposits 6868678 6548234 7253541 7245776 72569671.3 ‘Other’ Deposits with RBI 38507 30982 39707 39543 399641.4 Call/Term Funding from Financial Institutions 309439 344185 273977 266458 2726682 Sources2.1 Domestic Credit 16802627 15886848 17550995 17400821 17466357 2.1.1 Net Bank Credit to the Government 4906583 4720650 5609914 5534710 5613739 2.1.1.1 Net RBI credit to the Government 992192 934922 1078662 979844 1015146 2.1.1.2 Credit to the Government by the Banking System 3914391 3785728 4531252 4554866 4598593 2.1.2 Bank Credit to the Commercial Sector 11896044 11166198 11941081 11866110 11852618 2.1.2.1 RBI Credit to the Commercial Sector 13166 7597 36601 36810 36368 2.1.2.2 Credit to the Commercial Sector by the Banking System 11882878 11158601 11904480 11829300 11816250 2.1.2.2.1 Other Investments (Non-SLR Securities) 846284 868005 965520 952261 9402132.2 Government’s Currency Liabilities to the Public 26348 26001 26429 26429 264512.3 Net Foreign Exchange Assets of the Banking Sector 3612303 3018164 4087513 4057197 4067798 2.3.1 Net Foreign Exchange Assets of the RBI 3590402 3050903 3983510 3993710 3957722 2.3.2 Net Foreign Currency Assets of the Banking System 21900 -32739 104003 63487 1100762.4 Capital Account 2670439 2419473 2826533 2906683 28286472.5 Other items (net) 846946 667180 1111374 919542 979157
(` Crore)
Outstanding as on March 31/last reporting Fridays of themonth/reporting Fridays
12
3
1
2
No. 9: Liquidity Aggregates(` Crore)
Aggregates 2019-20 2019 2020Aug. Jun. Jul. Aug.
1 2 3 4 51 NM 16923893 15844360 17431047 17727030 17752801
2 Postal Deposits 409246 396702 409246 409246 4092463 L ( 1 + 2) 17333139 16241062 17840293 18136276 18162047
4 Liabilities of Financial Institutions 57479 2932 53474 43664 40801 4.1 Term Money Borrowings 7928 2656 10666 8425 7940 4.2 Certificates of Deposit 46249 31 39450 31750 29300 4.3 Term Deposits 3302 245 3358 3489 35615 L (3 + 4) 17390618 16243994 17893767 18179940 18202848
6 Public Deposits with Non-Banking Financial Companies 31905 .. 31905 .. ..7 L (5 + 6) 17422523 .. 17925672 .. ..
1
2
3
3
Note : Since November 2019, updated data on liabilities of financial institutions have been incorporated in this table , and hence, are not comparable with past data
No. 8: Monetary Survey
No. 9: Liquidity Aggregates

CURRENT STATISTICS
RBI Bulletin October 2020 143
No. 10: Reserve Bank of India Survey
Item
2019-20 2019 2020Aug. 30 Jul. 31 Aug. 14 Aug. 28
1 2 3 4 51 Components1.1 Currency in Circulation 2447312 2176383 2672560 2691820 26805471.2 Bankers’ Deposits with the RBI 543888 575794 469087 470719 472795 1.2.1 Scheduled Commercial Banks 505131 538143 435414 436470 4394111.3 ‘Other’ Deposits with the RBI 38507 30982 39707 39543 39964Reserve Money (1.1 + 1.2 + 1.3 = 2.1 + 2.2 + 2.3 – 2.4 – 2.5) 3029707 2783158 3181354 3202082 31933052 Sources2.1 RBI’s Domestic Credit 791299 812361 718679 669713 631082 2.1.1 Net RBI credit to the Government 992192 934922 1078662 979844 1015146 2.1.1.1 Net RBI credit to the Central Government (2.1.1.1.1 + 2.1.1.1.2 + 2.1.1.1.3 + 2.1.1.1.4 – 2.1.1.1.5) 989741 934358 1073847 969138 1006155
2.1.1.1.1 Loans and Advances to the Central Government – – – – – 2.1.1.1.2 Investments in Treasury Bills – – – – – 2.1.1.1.3 Investments in dated Government Securities 1044468 998945 1178867 1180403 1184242 2.1.1.1.3.1 Central Government Securities 1044468 998945 1178867 1180403 1184242 2.1.1.1.4 Rupee Coins 846 786 768 758 751 2.1.1.1.5 Deposits of the Central Government 55573 65373 105788 212023 178838 2.1.1.2 Net RBI credit to State Governments 2451 564 4815 10706 8991 2.1.2 RBI’s Claims on Banks -214059 -130158 -396584 -346941 -420432 2.1.2.1 Loans and Advances to Scheduled Commercial Banks -214059 -130158 -371571 -321744 -395629 2.1.3 RBI’s Credit to Commercial Sector 13166 7597 36601 36810 36368 2.1.3.1 Loans and Advances to Primary Dealers 5920 1879 30 30 – 2.1.3.2 Loans and Advances to NABARD – – 25013 25197 248032.2 Government’s Currency Liabilities to the Public 26348 26001 26429 26429 264512.3 Net Foreign Exchange Assets of the RBI 3590402 3050903 3983510 3993710 3957722 2.3.1 Gold 230527 196879 281463 281589 273025 2.3.2 Foreign Currency Assets 3359893 2854041 3702064 3712138 36847142.4 Capital Account 1165066 992582 1248046 1322142 12548542.5 Other Items (net) 213276 113524 299218 165628 167095
(` Crore)
Outstanding as on March 31/last reporting Fridays of themonth/reporting Fridays
No. 11: Reserve Money - Components and Sources
Item
2019-20 2019 2020Aug. 30 Jul. 31 Aug. 7 Aug. 14 Aug. 21 Aug. 28
1 2 3 4 5 6 7
Reserve Money(1.1 + 1.2 + 1.3 = 2.1 + 2.2 + 2.3 + 2.4 + 2.5 – 2.6) 3029707 2783158 3181354 3187375 3202082 3192999 3193305
1 Components1.1 Currency in Circulation 2447312 2176383 2672560 2686184 2691820 2688436 26805471.2 Bankers' Deposits with RBI 543888 575794 469087 461436 470719 464794 4727951.3 ‘Other’ Deposits with RBI 38507 30982 39707 39755 39543 39769 399642 Sources2.1 Net Reserve Bank Credit to Government 992192 934922 1078662 1075013 979844 994754 10151462.2 Reserve Bank Credit to Banks -214059 -130158 -371571 -371737 -321744 -358066 -3956292.3 Reserve Bank Credit to Commercial Sector 13166 7597 11588 11588 11613 11613 115652.4 Net Foreign Exchange Assets of RBI 3590402 3050903 3983510 4017184 3993710 4007883 39577222.5 Government's Currency Liabilities to the Public 26348 26001 26429 26429 26429 26429 264512.6 Net Non- Monetary Liabilities of RBI 1378342 1106106 1547264 1571102 1487770 1489614 1421949
(` Crore)
Outstanding as on March 31/ last Fridays of the month/ Fridays
No. 10: Reserve Bank of India Survey

CURRENT STATISTICS
RBI Bulletin October 2020144
No. 13: Scheduled Commercial Banks' Investments
(` Crore)
Item As onMarch 27,
2020
2019 2020
Aug. 30 Jul. 31 Aug. 14 Aug. 28
1 2 3 4 51 SLR Securities 3747349 3581075 4293409 4315166 43612222 Commercial Paper 104526 95879 91396 92884 852593 Shares issued by 3.1 PSUs 14106 11514 11656 11636 9102 3.2 Private Corporate Sector 75415 66751 73007 72764 67493 3.3 Others 5734 5582 5201 5055 63574 Bonds/Debentures issued by 4.1 PSUs 125710 129335 127045 126631 124385 4.2 Private Corporate Sector 226559 247426 308784 308714 306447 4.3 Others 191690 162785 152655 151907 1503135 Instruments issued by 5.1 Mutual funds 35610 52891 45359 46545 44412 5.2 Financial institutions 97665 90292 125695 127163 137483
No. 12: Commercial Bank Survey
Item
2019-20 2019 2020Aug. 30 Jul. 31 Aug. 14 Aug. 28
1 2 3 4 51 Components1.1 Aggregate Deposits of Residents 13381983 12603282 13988520 13910760 14008954 1.1.1 Demand Deposits 1617003 1365634 1528034 1463567 1541081 1.1.2 Time Deposits of Residents 11764979 11237647 12460486 12447193 12467873 1.1.2.1 Short-term Time Deposits 5294241 5056941 5607219 5601237 5610543 1.1.2.1.1 Certificates of Deposits (CDs) 169419 174259 106526 97486 880841.1.2.2 Long-term Time Deposits 6470739 6180706 6853267 6845956 68573301.2 Call/Term Funding from Financial Institutions 309439 344185 273977 266458 2726682 Sources2.1 Domestic Credit 14913131 14129568 15541150 15487711 15520259 2.1.1 Credit to the Government 3684917 3578218 4291521 4313713 4359336 2.1.2 Credit to the Commercial Sector 11228214 10551350 11249629 11173997 11160923 2.1.2.1 Bank Credit 10370861 9680153 10282057 10219502 10216227 2.1.2.1.1 Non-food Credit 10319097 9617761 10202769 10146420 10150286 2.1.2.2 Net Credit to Primary Dealers 11378 9297 9126 9744 11559 2.1.2.3 Investments in Other Approved Securities 8653 2857 1888 1453 1886 2.1.2.4 Other Investments (in non-SLR Securities) 837321 859043 956558 943299 9312502.2 Net Foreign Currency Assets of Commercial Banks (2.2.1–2.2.2–2.2.3) 21900 -32739 104003 63487 110076 2.2.1 Foreign Currency Assets 315641 277568 355425 308951 364293 2.2.2 Non-resident Foreign Currency Repatriable Fixed Deposits 185510 176916 172750 169750 167864 2.2.3 Overseas Foreign Currency Borrowings 108231 133392 78672 75714 863532.3 Net Bank Reserves (2.3.1+2.3.2–2.3.3) 899410 752195 893214 846115 922291 2.3.1 Balances with the RBI 536186 538143 435414 436470 439411 2.3.2 Cash in Hand 87260 83894 86229 87901 87251 2.3.3 Loans and Advances from the RBI -275964 -130158 -371571 -321744 -3956292.4 Capital Account 1481202 1402720 1554316 1560370 15496232.5 Other items (net) (2.1+2.2+2.3–2.4–1.1–1.2) 661818 498837 721555 659725 721381 2.5.1 Other Demand and Time Liabilities (net of 2.2.3) 495445 398201 444800 457336 481042 2.5.2 Net Inter-Bank Liabilities (other than to PDs) 65654 -54206 73877 73015 73801
(` Crore)
Outstanding as on last reporting Fridays of the month/reporting Fridays of the month
No. 12: Commercial Bank Survey
No. 13: Scheduled Commercial Banks’ Investments

CURRENT STATISTICS
RBI Bulletin October 2020 145
No. 14: Business in India - All Scheduled Banks and All Scheduled Commercial Banks
(` Crore)
All Scheduled Commercial Banks
2019-202019 2020
Aug. Jul. Aug.
5 6 7 8
142 142 134 133
314513 266047 304773 282629
234348 180832 227270 217476
64001 72095 61085 49330
16163 13121 16417 15824
14480607 13655975 14958717 15016882
13567492 12780197 14161269 14176819
1617003 1365634 1528034 1541081
11950489 11414563 12633235 12635738
309439 344185 273977 272668
603676 531592 523472 567395
285623 31140 258425 253645
– – – –
285623 31140 258425 253645
623446 622037 521643 526662
87260 83894 86229 87251
536186 538143 435414 439411
260238 329550 240022 220387
155401 237150 162911 148259
14457 14732 21275 12611
140945 222418 141637 135648
20273 26827 13592 13348
30531 25309 24276 24490
54032 40264 39243 34290
3747349 3581075 4293409 4361222
3738696 3578218 4291521 4359336
8653 2857 1888 1886
10370861 9680153 10282057 10216227
51763 62392 79287 65941
10149509 9466745 10115236 10050903
25658 23883 19465 19153
145683 133578 104766 103201
20458 23822 17202 16321
29554 32125 25387 26649
Item
All Scheduled Banks
2019-202019 2020
Aug. Jul. Aug.
1 2 3 4
Number of Reporting Banks 219 218 210 209
1 Liabilities to the Banking System 320240 271325 310011 287863
1.1 Demand and Time Deposits from Banks 239943 185890 232324 222515
1.2 Borrowings from Banks 64001 72192 61085 49330
1.3 Other Demand and Time Liabilities 16295 13243 16602 16018
2 Liabilities to Others 14905949 14011903 15391502 15447438
2.1 Aggregate Deposits 13975551 13122736 14576206 14589411
2.1.1 Demand 1653242 1396102 1563327 1576870
2.1.2 Time 12322309 11726634 13012879 13012540
2.2 Borrowings 313908 347772 278344 277264
2.3 Other Demand and Time Liabilities 616491 541394 536952 580763
3 Borrowings from Reserve Bank 285623 31140 258425 253645
3.1 Against Usance Bills /Promissory Notes – – – –
3.2 Others 285623 31140 258425 253645
4 Cash in Hand and Balances with Reserve Bank 643038 637531 536304 541240
4.1 Cash in Hand 89671 85740 88242 89429
4.2 Balances with Reserve Bank 553367 551791 448062 451811
5 Assets with the Banking System 323680 381137 300944 280371
5.1 Balances with Other Banks 181460 262604 195372 180136
5.1.1 In Current Account 17204 17577 23597 14500
5.1.2 In Other Accounts 164256 245027 171775 165635
5.2 Money at Call and Short Notice 43335 41424 35509 35137
5.3 Advances to Banks 38266 28583 25030 25018
5.4 Other Assets 60619 48526 45033 40080
6 Investment 3865544 3676373 4421093 4488300
6.1 Government Securities 3850819 3667293 4412593 4479899
6.2 Other Approved Securities 14724 9080 8500 8401
7 Bank Credit 10705336 9961383 10614263 10548169
7a Food Credit 82172 89424 109692 96346
7.1 Loans, Cash-credits and Overdrafts 10480934 9743969 10445518 10380861
7.2 Inland Bills-Purchased 26214 24827 19744 19424
7.3 Inland Bills-Discounted 147209 135740 105755 104510
7.4 Foreign Bills-Purchased 20866 24132 17440 16563
7.5 Foreign Bills-Discounted 30114 32716 25806 26811
As on the Last Reporting Friday (in case of March)/ Last Friday
No. 14: Business in India - All Scheduled Banks and All Scheduled Commercial Banks

CURRENT STATISTICS
RBI Bulletin October 2020146
No. 15: Deployment of Gross Bank Credit by Major Sectors
(` Crore)
Item Outstanding as on Growth (%)
Mar. 27,2020
2019 2020 Financialyear so far
Y-o-Y
Aug. 30 Jul. 31 Aug. 28 2020-21 2020
1 2 3 4 5 61 Gross Bank Credit 9263134 8594549 9148074 9112035 -1.6 6.0
1.1 Food Credit 51590 62182 79023 65708 27.4 5.7
1.2 Non-food Credit 9211544 8532367 9069051 9046327 –1.8 6.0
1.2.1 Agriculture & Allied Activities 1157796 1113026 1169273 1168075 0.9 4.9
1.2.2 Industry 2905151 2765215 2821316 2778672 –4.4 0.5
1.2.2.1 Micro & Small 381825 358885 354728 354546 –7.1 -1.2
1.2.2.2 Medium 105598 104436 101994 107386 1.7 2.8
1.2.2.3 Large 2417728 2301894 2364594 2316740 –4.2 0.6
1.2.3 Services 2594945 2350197 2547228 2551467 –1.7 8.6
1.2.3.1 Transport Operators 144466 141243 148727 148575 2.8 5.2
1.2.3.2 Computer Software 20051 18761 21167 20089 0.2 7.1
1.2.3.3 Tourism, Hotels & Restaurants 45977 40221 47383 47282 2.8 17.6
1.2.3.4 Shipping 6557 5955 5178 4987 –23.9 -16.3
1.2.3.5 Professional Services 177085 169097 176815 175191 –1.1 3.6
1.2.3.6 Trade 552392 504278 560579 567367 2.7 12.5
1.2.3.6.1 Wholesale Trade 263397 221053 267712 265152 0.7 19.9
1.2.3.6.2 Retail Trade 288995 283225 292867 302215 4.6 6.7
1.2.3.7 Commercial Real Estate 229770 216388 233200 230759 0.4 6.6
1.2.3.8 Non-Banking Financial Companies (NBFCs) 807383 680360 793451 796763 –1.3 17.1
1.2.3.9 Other Services 611264 573894 560728 560454 –8.3 -2.3
1.2.4 Personal Loans 2553652 2303929 2531234 2548113 –0.2 10.6
1.2.4.1 Consumer Durables 9298 5484 9127 9053 –2.6 65.1
1.2.4.2 Housing 1338964 1214771 1347565 1349501 0.8 11.1
1.2.4.3 Advances against Fixed Deposits 79496 62607 62317 62568 –21.3 -0.1
1.2.4.4 Advances to Individuals against share & bond 5334 5087 6392 6313 18.4 24.1
1.2.4.5 Credit Card Outstanding 108094 97650 101391 104833 –3.0 7.4
1.2.4.6 Education 65745 68457 65100 64865 –1.3 -5.2
1.2.4.7 Vehicle Loans 220609 202662 217697 219769 –0.4 8.4
1.2.4.8 Other Personal Loans 726112 647211 721645 731211 0.7 13.0
1.2A Priority Sector 2897461 2721947 2828526 2842996 –1.9 4.4
1.2A.1 Agriculture & Allied Activities 1146624 1105805 1155451 1154411 0.7 4.4
1.2A.2 Micro & Small Enterprises 1149394 1048364 1100578 1104504 –3.9 5.4
1.2A.2.1 Manufacturing 381826 358885 354728 354546 –7.1 -1.2
1.2A.2.2 Services 767568 689479 745850 749958 –2.3 8.8
1.2A.3 Housing 449945 444823 464437 473151 5.2 6.4
1.2A.4 Micro-Credit 38237 31376 32817 32139 –15.9 2.4
1.2A.5 Education Loans 51906 53983 51434 52013 0.2 -3.6
1.2A.6 State-Sponsored Orgs. for SC/ST 388 402 410 443 14.2 10.2
1.2A.7 Weaker Sections 731409 682231 742426 743473 1.6 9.0
1.2A.8 Export Credit 16114 13139 15237 13959 –13.4 6.2
No. 15: Deployment of Gross Bank Credit by Major Sectors

CURRENT STATISTICS
RBI Bulletin October 2020 147
No. 16: Industry-wise Deployment of Gross Bank Credit(` Crore)
Industry Outstanding as on Growth (%)
Mar. 27,2020
2019 2020 Financialyear so far
Y-o-Y
Aug. 30 Jul. 31 Aug. 28 2020-21 2020
1 2 3 4 5 6
1 Industry 2905151 2765215 2821316 2778672 –4.4 0.5
1.1 Mining & Quarrying (incl. Coal) 43927 40938 43632 41419 –5.7 1.2
1.2 Food Processing 154146 145210 159112 155228 0.7 6.9
1.2.1 Sugar 27382 27889 23023 21348 –22.0 –23.5
1.2.2 Edible Oils & Vanaspati 19240 18929 18149 18156 –5.6 –4.1
1.2.3 Tea 5375 5356 5252 5373 –0.0 0.3
1.2.4 Others 102149 93036 112688 110351 8.0 18.6
1.3 Beverage & Tobacco 16522 13857 14382 14430 –12.7 4.1
1.4 Textiles 192424 186307 188874 188159 –2.2 1.0
1.4.1 Cotton Textiles 89283 84473 86201 85318 –4.4 1.0
1.4.2 Jute Textiles 2116 2117 2059 2059 –2.7 –2.7
1.4.3 Man-Made Textiles 26074 25423 27004 26792 2.8 5.4
1.4.4 Other Textiles 74951 74294 73610 73990 –1.3 –0.4
1.5 Leather & Leather Products 11098 11051 11704 11809 6.4 6.9
1.6 Wood & Wood Products 12233 11881 12794 12792 4.6 7.7
1.7 Paper & Paper Products 30965 29864 32338 32742 5.7 9.6
1.8 Petroleum, Coal Products & Nuclear Fuels 75834 51976 57756 54850 –27.7 5.5
1.9 Chemicals & Chemical Products 202949 177006 175432 173975 –14.3 –1.7
1.9.1 Fertiliser 49066 35572 35651 35383 –27.9 –0.5
1.9.2 Drugs & Pharmaceuticals 53427 48566 49751 48558 –9.1 –0.0
1.9.3 Petro Chemicals 42233 39987 35707 36176 –14.3 –9.5
1.9.4 Others 58223 52881 54323 53858 –7.5 1.8
1.10 Rubber, Plastic & their Products 50415 46501 48827 48780 –3.2 4.9
1.11 Glass & Glassware 8777 9942 8477 8666 –1.3 –12.8
1.12 Cement & Cement Products 58689 59223 58597 57809 –1.5 –2.4
1.13 Basic Metal & Metal Product 350325 348467 338908 344005 –1.8 –1.3
1.13.1 Iron & Steel 262396 266309 256893 256866 –2.1 –3.5
1.13.2 Other Metal & Metal Product 87929 82158 82015 87139 –0.9 6.1
1.14 All Engineering 157259 166488 141558 139390 –11.4 –16.3
1.14.1 Electronics 30159 37284 28591 27558 –8.6 –26.1
1.14.2 Others 127100 129204 112967 111832 –12.0 –13.4
1.15 Vehicles, Vehicle Parts & Transport Equipment 82606 83022 87668 89286 8.1 7.5
1.16 Gems & Jewellery 59515 66361 54576 54220 –8.9 –18.3
1.17 Construction 104288 95990 102507 103744 –0.5 8.1
1.18 Infrastructure 1053913 1004812 1054581 1023148 –2.9 1.8
1.18.1 Power 559774 558892 566977 549080 –1.9 –1.8
1.18.2 Telecommunications 143760 109762 132283 125386 –12.8 14.2
1.18.3 Roads 190676 190895 196306 196875 3.3 3.1
1.18.4 Other Infrastructure 159703 145263 159015 151807 –4.9 4.5
1.19 Other Industries 239266 216319 229593 224220 –6.3 3.7
No. 16: Industry-wise Deployment of Gross Bank Credit

CURRENT STATISTICS
RBI Bulletin October 2020148
2019 2020
Jul. 26 May. 29 Jun. 05 Jun. 19 Jun. 26 Jul. 03 Jul. 17 Jul. 31
2 3 4 5 6 7 8 9
Number of Reporting Banks 32 31 31 31 31 31 31 30
1 Aggregate Deposits (2.1.1.2+2 64001.4 125375.1 125603.8 126309.6 126689.0 126452.9 127076.2 125038.9
2 Demand and Time Liabilities
2.1 Demand Liabilities 18565.5 24755.4 25014.4 24214.0 23797.4 25074.2 25271.3 23857.6
2.1.1 Deposits
2.1.1.1 Inter-Bank 5531.0 5276.6 4937.7 4365.2 4100.6 4876.4 4823.2 4000.0
2.1.1.2 Others 10214.2 13674.1 13552.1 13836.4 13675.2 13533.9 13870.4 13215.5
2.1.2 Borrowings from Banks 0.0 25.0 100.0 199.9 110.0 0.0 0.0 268.7
2.1.3 Other Demand Liabilities 2820.3 5779.7 6424.7 5812.5 5911.7 6663.9 6577.6 6373.3
2.2 Time Liabilities 106495.7 177855.8 177766.6 177293.4 177574.4 176605.2 176793.3 173363.0
2.2.1 Deposits
2.2.1.1 Inter-Bank-Bank 51818.0 64012.5 64066.2 62670.0 62430.6 62166.3 61276.4 59247.7
2.2.1.2 Others 53787.3 111701.0 112051.8 112473.2 113013.8 112919.0 113205.8 111823.4
2.2.2 Borrowings from Banks 0.0 755.9 749.9 635.1 630.0 629.9 629.9 629.9
2.2.3 Other Time Liabilities 890.4 1386.3 898.7 1515.1 1500.1 890.0 1681.1 1662.1
3 Borrowing from Reserve Bank 0.0 0.0 0.0 0.0 0.0 0.0 0.0 0.0
4 Borrowings from a notified ban 44842.5 56219.3 55134.5 54148.6 55983.2 55890.4 56131.0 57274.5
4.1 Demand 14152.3 13701.3 12712.3 11750.2 12464.4 12098.1 12152.6 14236.6
4.2 Time 30690.2 42517.9 42422.2 42398.4 43518.8 43792.3 43978.5 43037.9
5 Cash in Hand and Balances wi 5421.2 7525.9 7825.5 7247.2 7422.0 6999.4 7149.1 7095.6
5.1 Cash in Hand 315.2 711.2 737.9 751.6 710.0 685.9 677.3 536.0
5.2 Balance with Reserve Bank 5106.1 6814.7 7087.6 6495.6 6712.1 6313.4 6471.7 6559.6
6 Balances with Other Banks in 1003.6 1338.0 907.9 2099.1 2019.9 1049.6 1134.0 935.6
7 Investments in Government Se 30500.4 53179.8 54158.8 53092.2 53708.4 55424.4 55598.4 56634.2
8 Money at Call and Short Notic 19124.6 30633.2 29102.7 29405.7 29380.8 29114.7 28181.5 25327.5
9 Bank Credit (10.1+11) 63334.2 110987.9 111445.1 112198.2 111349.3 110067.3 111344.7 111280.7
10 Advances.
10.1 Loans, Cash-Credits and O 63332.9 110987.2 111444.5 112197.6 111348.7 110066.6 111344.0 111280.0
10.2 Due from Banks 77427.1 79337.2 79353.7 79958.6 80858.7 80854.4 81068.7 80109.4
11 Bills Purchased and Discount 1.2 0.6 0.6 0.6 0.6 0.6 0.6 0.7
Item
2019-20
1
Number of Reporting Banks 32
1 Aggregate Deposits (2.1.1.2+2.2.1.2) 124101.8
2 Demand and Time Liabilities
2.1 Demand Liabilities 26213.8
2.1.1 Deposits
2.1.1.1 Inter-Bank 5295.0
2.1.1.2 Others 14,523.6
2.1.2 Borrowings from Banks 100.0
2.1.3 Other Demand Liabilities 6295.2
2.2 Time Liabilities 167684.5
2.2.1 Deposits
2.2.1.1 Inter-Bank 56564.0
2.2.1.2 Others 109578.2
2.2.2 Borrowings from Banks 630.2
2.2.3 Other Time Liabilities 912.1
3 Borrowing from Reserve Bank 0.0
4 Borrowings from a notified bank / Government 52772.2
4.1 Demand 13764.4
4.2 Time 39007.8
5 Cash in Hand and Balances with Reserve Bank 9428.2
5.1 Cash in Hand 750.5
5.2 Balance with Reserve Bank 8677.8
6 Balances with Other Banks in Current Account 1521.7
7 Investments in Government Securities 50626.9
8 Money at Call and Short Notice 25283.9
9 Bank Credit (10.1+11) 110905.5
10 Advances
10.1 Loans, Cash-Credits and Overdrafts 110901.5
10.2 Due from Banks 81300.1
11 Bills Purchased and Discounted 4.0
Last Reporting Friday (in case of March)/Last Friday/Reporting Friday
(` Crore)
No. 17: State Co-operative Banks Maintaining Accounts with the Reserve Bank of IndiaNo. 17: State Co-operative Banks Maintaining Accounts with the Reserve Bank of India

CURRENT STATISTICS
RBI Bulletin October 2020 149
No. 18: Consumer Price Index (Base: 2012=100)
Rural Urban Combined
Aug. '19 Jul. '20 Aug '20(P) Aug. '19 Jul. '20 Aug '20(P) Aug. '19 Jul. '20 Aug '20(P)
4 5 6 7 8 9 10 11 12
144.0 155.3 156.1 149.1 159.9 161.3 145.9 157.0 158.0
139.2 147.6 146.9 142.1 151.6 151.5 140.1 148.9 148.4
161.9 187.2 183.9 158.3 197.8 193.1 160.6 190.9 187.1
137.1 148.4 149.4 140.8 154.5 157.3 138.5 150.8 152.5
144.6 153.3 153.5 144.9 153.4 153.9 144.7 153.3 153.6
124.7 139.8 140.4 119.9 133.4 134.3 122.9 137.4 138.2
145.5 146.9 146.9 153.9 154.5 155.5 149.4 150.4 150.9
156.2 171.0 178.5 189.1 191.9 202.1 167.4 178.1 186.5
131.5 149.9 149.4 129.8 151.3 150.7 130.9 150.4 149.8
111.7 114.2 115.1 112.7 116.8 118.9 112.0 115.1 116.4
142.7 160.0 159.9 142.5 160.0 160.9 142.6 160.0 160.2
138.5 143.5 145.2 129.8 136.5 137.7 134.9 140.6 142.1
156.9 161.5 161.6 156.2 163.3 164.3 156.6 162.3 162.9
165.1 180.9 182.9 167.9 187.2 188.6 165.8 182.6 184.4
151.1 154.3 154.6 143.0 147.8 148.1 147.9 151.7 152.0
151.8 155.1 155.4 145.0 150.0 150.2 149.1 153.1 153.4
146.6 149.3 149.9 132.2 135.2 136.4 140.6 143.4 144.3
-- -- -- 151.6 155.5 156.3 151.6 155.5 156.3
146.4 145.8 146.2 125.5 138.3 137.2 138.5 143.0 142.8
144.9 153.0 153.7 135.3 144.8 146.0 140.2 149.0 150.0
150.2 151.9 151.8 138.1 144.5 145.5 144.5 148.4 148.8
152.7 158.8 159.0 141.5 148.7 149.8 148.5 155.0 155.5
131.4 143.6 144.7 120.8 133.9 135.2 125.8 138.5 139.7
148.0 152.2 152.7 135.4 141.2 141.8 140.9 146.0 146.6
159.7 162.7 161.1 151.5 155.5 154.8 154.9 158.5 157.4
138.8 153.6 157.4 137.8 155.2 159.7 138.4 154.3 158.4
145.7 154.7 155.4 144.2 152.9 154.0 145.0 153.9 154.7
Group/Sub group 2019-20
Rural Urban Combined
1 2 3
1 Food and beverages 146.3 149.6 147.5
1.1 Cereals and products 140.7 143.2 141.4
1.2 Meat and fish 163.3 161.4 162.6
1.3 Egg 142.1 145.7 143.5
1.4 Milk and products 146.5 146.0 146.3
1.5 Oils and fats 127.1 121.8 125.1
1.6 Fruits 144.0 148.8 146.2
1.7 Vegetables 163.5 187.8 171.7
1.8 Pulses and products 133.7 132.0 133.1
1.9 Sugar and confectionery 112.0 113.4 112.5
1.10 Spices 145.6 145.1 145.5
1.11 Non-alcoholic beverages 138.8 130.2 135.2
1.12 Prepared meals, snacks, sweets 157.6 156.7 157.2
2 Pan, tobacco and intoxicants 166.3 169.0 167.0
3 Clothing and footwear 151.3 143.7 148.3
3.1 Clothing 152.0 145.7 149.5
3.2 Footwear 146.9 132.4 140.9
4 Housing -- 152.2 152.2
5 Fuel and light 148.6 131.5 142.2
6 Miscellaneous 145.6 135.9 140.9
6.1 Household goods and services 150.6 138.7 145.0
6.2 Health 153.6 142.1 149.3
6.3 Transport and communication 132.6 122.2 127.1
6.4 Recreation and amusement 148.3 135.9 141.3
6.5 Education 159.8 150.9 154.5
6.6 Personal care and effects 139.2 138.4 138.9
General Index (All Groups) 147.3 145.1 146.3
Source: National Statistical Office, Ministry of Statistics and Programme Implementation, Government of India.
P: Provisional
No. 19: Other Consumer Price Indices
2019 2020Aug. Jul. Aug.
4 5 6
320 336 338
965 1021 1026
972 1028 1033
Item Base Year LinkingFactor
2019-20
1 2 3
1 Consumer Price Index for Industrial Workers 2001 4.63 323
2 Consumer Price Index for Agricultural Labourers 1986-87 5.89 980
3 Consumer Price Index for Rural Labourers 1986-87 – 986
Source: Labour Bureau, Ministry of Labour and Employment, Government of India.
No. 20: Monthly Average Price of Gold and Silver in Mumbai
Source: India Bullion & Jewellers Association Ltd., Mumbai for Gold and Silver prices in Mumbai.
Item 2019-20 2019 2020
Aug. Jul. Aug.
1 2 3 4
1 Standard Gold ( per 10 grams) 37018 37356 49878 529172 Silver ( per kilogram) 42514 43747 54813 67717
`
`
Prices and ProductionNo. 18: Consumer Price Index (Base: 2012=100)
No. 19: Other Consumer Price Indices
No. 20: Monthly Average Price of Gold and Silver in Mumbai

CURRENT STATISTICS
RBI Bulletin October 2020150
No. 21: Wholesale Price Index(Base: 2011-12 = 100)
Commodities Weight 2019-20 2019 2020
Aug. Jun. Jul. (P) Aug. (P)
1 2 3 4 5 61 ALL COMMODITIES 100.000 121.8 121.5 119.3 120.6 121.71.1 PRIMARY ARTICLES 22.618 143.3 144.0 140.9 143.7 146.3 1.1.1 FOOD ARTICLES 15.256 155.8 156.1 155.4 160.6 162.1 1.1.1.1 Food Grains (Cereals+Pulses) 3.462 159.6 159.2 161.6 161.2 159.5 1.1.1.2 Fruits & Vegetables 3.475 174.7 180.1 159.3 181.8 187.4 1.1.1.3 Milk 4.440 146.7 145.9 151.9 152.0 152.1 1.1.1.4 Eggs,Meat & Fish 2.402 147.0 144.4 152.5 151.9 153.4 1.1.1.5 Condiments & Spices 0.529 143.9 141.6 145.6 143.0 143.8 1.1.1.6 Other Food Articles 0.948 144.0 142.8 147.9 152.5 157.7 1.1.2 NON-FOOD ARTICLES 4.119 128.7 129.8 125.1 124.1 127.9 1.1.2.1 Fibres 0.839 128.2 130.1 116.9 117.7 118.9 1.1.2.2 Oil Seeds 1.115 151.4 151.7 154.8 154.0 155.7 1.1.2.3 Other non-food Articles 1.960 104.8 105.8 103.8 104.8 104.8 1.1.2.4 Floriculture 0.204 238.0 239.2 200.5 173.3 235.0 1.1.3 MINERALS 0.833 154.5 158.4 166.3 150.9 166.3 1.1.3.1 Metallic Minerals 0.648 147.4 153.7 162.5 144.4 162.5 1.1.3.2 Other Minerals 0.185 179.0 175.0 179.7 174.0 179.7 1.1.4 CRUDE PETROLEUM & NATURAL GAS 2.410 85.3 86.4 67.7 67.8 71.01.2 FUEL & POWER 13.152 102.2 101.2 85.6 90.7 91.4 1.2.1 COAL 2.138 125.3 124.0 126.4 126.4 126.4 1.2.1.1 Coking Coal 0.647 138.1 133.9 141.6 141.6 141.6 1.2.1.2 Non-Coking Coal 1.401 119.0 119.0 119.0 119.0 119.0 1.2.1.3 Lignite 0.090 129.1 129.9 131.1 131.1 131.1 1.2.2 MINERAL OILS 7.950 92.3 91.4 68.6 77.2 78.2 1.2.3 ELECTRICITY 3.064 111.8 110.7 101.0 101.0 101.01.3 MANUFACTURED PRODUCTS 64.231 118.3 117.8 118.6 118.6 119.3 1.3.1 MANUFACTURE OF FOOD PRODUCTS 9.122 133.9 132.5 137.5 137.7 138.7 1.3.1.1 Processing and Preserving of meat 0.134 137.5 138.1 134.8 136.0 135.2 1.3.1.2 ProcessingandPreservingoffish,Crustaceans,Molluscsand
products thereof0.204 136.1 136.6 139.3 137.0 136.7
1.3.1.3 Processing and Preserving of fruit and Vegetables 0.138 114.3 114.5 119.3 119.6 119.8 1.3.1.4 Vegetable and Animal oils and Fats 2.643 119.3 113.9 128.5 130.1 133.7 1.3.1.5 Dairy products 1.165 145.0 143.1 148.7 146.2 144.3 1.3.1.6 Grain mill products 2.010 146.3 146.6 145.1 144.3 144.1 1.3.1.7 Starches and Starch products 0.110 135.5 136.9 117.2 114.1 110.4 1.3.1.8 Bakery products 0.215 133.5 132.3 137.5 137.5 137.8 1.3.1.9 Sugar, Molasses & honey 1.163 118.3 119.0 119.2 120.5 120.0 1.3.1.10 Cocoa, Chocolate and Sugar confectionery 0.175 127.2 127.2 127.9 128.1 127.5 1.3.1.11 Macaroni, Noodles, Couscous and Similar farinaceous products 0.026 132.7 131.7 133.8 140.3 134.4 1.3.1.12 Tea & Coffee products 0.371 139.7 143.8 163.8 167.7 174.3 1.3.1.13 Processed condiments & salt 0.163 132.4 129.8 143.8 146.4 145.8 1.3.1.14 Processed ready to eat food 0.024 128.7 128.5 129.7 130.0 133.6 1.3.1.15 Health supplements 0.225 159.9 159.6 147.0 144.3 146.8 1.3.1.16 Prepared animal feeds 0.356 173.6 177.2 167.7 167.5 168.3 1.3.2 MANUFACTURE OF BEVERAGES 0.909 123.6 123.7 125.5 124.8 125.1 1.3.2.1 Wines & spirits 0.408 117.8 117.8 121.0 120.7 120.6 1.3.2.2 Malt liquors and Malt 0.225 125.7 126.8 127.5 126.7 126.7 1.3.2.3 Soft drinks; Production of mineral waters and Other bottled waters 0.275 130.5 129.8 130.5 129.2 130.4 1.3.3 MANUFACTURE OF TOBACCO PRODUCTS 0.514 153.4 153.9 158.6 157.0 155.2 1.3.3.1 Tobacco products 0.514 153.4 153.9 158.6 157.0 155.2

CURRENT STATISTICS
RBI Bulletin October 2020 151
No. 21: Wholesale Price Index (Contd.)(Base: 2011-12 = 100)
Commodities Weight 2019-20 2019 2020
Aug. Jun. Jul. (P) Aug. (P)
1.3.4 MANUFACTURE OF TEXTILES 4.881 117.7 118.1 113.6 113.2 113.1 1.3.4.1 PreparationandSpinningoftextilefibres 2.582 107.9 109.0 100.6 100.6 100.3 1.3.4.2 Weaving & Finishing of textiles 1.509 130.1 129.3 129.1 128.0 128.0 1.3.4.3 Knitted and Crocheted fabrics 0.193 114.5 115.4 117.0 115.7 114.9 1.3.4.4 Made-up textile articles, Except apparel 0.299 134.5 135.8 131.5 131.4 131.3 1.3.4.5 Cordage, Rope, Twine and Netting 0.098 143.1 140.8 149.4 150.3 149.0 1.3.4.6 Other textiles 0.201 116.8 116.4 118.3 117.2 119.1 1.3.5 MANUFACTURE OF WEARING APPAREL 0.814 138.3 137.6 137.3 137.0 136.4 1.3.5.1 Manufacture of Wearing Apparel (woven), Except fur Apparel 0.593 139.2 138.4 137.7 138.7 137.2 1.3.5.2 Knitted and Crocheted apparel 0.221 135.9 135.4 136.3 132.7 134.3 1.3.6 MANUFACTURE OF LEATHER AND RELATED PRODUCTS 0.535 118.6 119.2 117.6 117.9 118.3 1.3.6.1 Tanning and Dressing of leather; Dressing and Dyeing of fur 0.142 105.5 108.6 102.2 100.9 102.5 1.3.6.2 Luggage, HandbAgs, Saddlery and Harness 0.075 136.3 136.6 138.5 138.8 137.9 1.3.6.3 Footwear 0.318 120.3 119.9 119.6 120.5 120.8 1.3.7 MANUFACTURE OF WOOD AND PRODUCTS OF WOOD AND
CORK0.772 133.7 134.3 134.1 134.3 134.7
1.3.7.1 Saw milling and Planing of wood 0.124 122.2 120.1 121.1 120.3 119.1 1.3.7.2 Veneer sheets; Manufacture of plywood, Laminboard, Particle
board and Other panels and Boards0.493 135.5 136.0 136.4 137.0 137.2
1.3.7.3 Builder's carpentry and Joinery 0.036 176.2 174.9 179.8 180.2 188.0 1.3.7.4 Wooden containers 0.119 125.7 129.7 124.5 124.4 124.6 1.3.8 MANUFACTURE OF PAPER AND PAPER PRODUCTS 1.113 121.1 121.4 120.4 120.1 119.6 1.3.8.1 Pulp, Paper and Paperboard 0.493 125.0 125.3 122.6 122.1 121.3 1.3.8.2 Corrugated paper and Paperboard and Containers of paper and
Paperboard0.314 115.0 115.5 119.0 118.7 118.7
1.3.8.3 Other articles of paper and Paperboard 0.306 121.2 121.2 118.2 118.4 117.9 1.3.9 PRINTING AND REPRODUCTION OF RECORDED MEDIA 0.676 150.6 149.2 150.8 151.1 153.3 1.3.9.1 Printing 0.676 150.6 149.2 150.8 151.1 153.3 1.3.10 MANUFACTURE OF CHEMICALS AND CHEMICAL PRODUCTS 6.465 117.5 118.2 115.7 115.9 115.8 1.3.10.1 Basic chemicals 1.433 119.9 121.2 114.9 114.9 114.8 1.3.10.2 Fertilizers and Nitrogen compounds 1.485 123.1 123.0 123.4 123.8 123.5 1.3.10.3 Plastic and Synthetic rubber in primary form 1.001 112.4 114.3 109.1 109.7 111.3 1.3.10.4 Pesticides and Other agrochemical products 0.454 122.6 122.9 123.2 124.2 124.6 1.3.10.5 Paints, Varnishes and Similar coatings, Printing ink and Mastics 0.491 114.7 115.5 113.5 113.6 112.6 1.3.10.6 Soap and Detergents, Cleaning and Polishing preparations,
Perfumes and Toilet preparations0.612 118.6 118.8 120.1 119.7 119.7
1.3.10.7 Other chemical products 0.692 114.2 114.0 113.6 113.7 112.5 1.3.10.8 Man-madefibres 0.296 97.9 98.9 91.3 90.5 88.4 1.3.11 MANUFACTURE OF PHARMACEUTICALS, MEDICINAL
CHEMICAL AND BOTANICAL PRODUCTS1.993 127.3 126.4 129.3 129.1 130.2
1.3.11.1 Pharmaceuticals, Medicinal chemical and Botanical products 1.993 127.3 126.4 129.3 129.1 130.2 1.3.12 MANUFACTURE OF RUBBER AND PLASTICS PRODUCTS 2.299 108.5 108.3 107.7 107.6 107.5 1.3.12.1 Rubber Tyres and Tubes; Retreading and Rebuilding of Rubber
Tyres0.609 98.9 99.7 98.4 98.3 97.5
1.3.12.2 Other Rubber Products 0.272 93.5 94.0 92.7 92.7 91.6 1.3.12.3 Plastics products 1.418 115.4 114.8 114.7 114.5 114.8 1.3.13 MANUFACTURE OF OTHER NON-METALLIC MINERAL
PRODUCTS3.202 116.7 116.7 118.3 117.7 117.2
1.3.13.1 Glass and Glass products 0.295 124.5 126.8 127.5 126.1 127.5 1.3.13.2 Refractory products 0.223 108.7 109.7 109.1 108.5 108.1 1.3.13.3 Clay Building Materials 0.121 102.8 101.3 110.8 105.3 107.0 1.3.13.4 Other Porcelain and Ceramic Products 0.222 113.9 114.5 109.1 108.6 106.9 1.3.13.5 Cement, Lime and Plaster 1.645 119.5 118.5 121.9 121.9 120.9

CURRENT STATISTICS
RBI Bulletin October 2020152
Commodities Weight 2019-20 2019 2020
Aug. Jun. Jul. (P) Aug. (P)
1.3.13.6 Articles of Concrete, Cement and Plaster 0.292 121.6 120.9 127.1 127.3 126.1 1.3.13.7 Cutting, Shaping and Finishing of Stone 0.234 120.2 122.7 120.9 119.5 119.6 1.3.13.8 Other Non-Metallic Mineral Products 0.169 86.6 90.4 77.6 77.6 77.6 1.3.14 MANUFACTURE OF BASIC METALS 9.646 106.2 104.6 103.8 104.1 106.5 1.3.14.1 Inputs into steel making 1.411 100.6 96.2 97.0 97.1 101.5 1.3.14.2 Metallic Iron 0.653 107.7 104.1 101.3 102.4 109.2 1.3.14.3 Mild Steel - Semi Finished Steel 1.274 95.1 93.6 94.4 94.9 97.5 1.3.14.4 Mild Steel -Long Products 1.081 105.5 104.2 104.8 103.1 103.9 1.3.14.5 Mild Steel - Flat products 1.144 108.7 107.9 106.5 106.7 109.0 1.3.14.6 Alloy steel other than Stainless Steel- Shapes 0.067 102.8 99.9 102.3 101.5 102.6 1.3.14.7 Stainless Steel - Semi Finished 0.924 102.9 98.3 101.3 103.1 102.8 1.3.14.8 Pipes & tubes 0.205 126.2 124.5 120.9 123.6 125.1 1.3.14.9 Non-ferrous metals incl. precious metals 1.693 107.0 106.9 105.1 106.6 109.2 1.3.14.10 Castings 0.925 112.8 115.1 107.6 107.0 108.1 1.3.14.11 Forgings of steel 0.271 146.5 145.1 147.5 146.1 145.1 1.3.15 MANUFACTURE OF FABRICATED METAL PRODUCTS, EXCEPT
MACHINERY AND EQUIPMENT3.155 115.5 114.7 113.8 113.8 113.2
1.3.15.1 Structural Metal Products 1.031 113.9 114.0 112.0 111.5 110.8 1.3.15.2 Tanks, Reservoirs and Containers of Metal 0.660 124.4 121.9 123.3 121.7 120.6 1.3.15.3 Steam generators, Except Central Heating Hot Water Boilers 0.145 104.7 100.9 99.0 104.3 99.0 1.3.15.4 Forging, Pressing, Stamping and Roll-Forming of Metal; Powder
Metallurgy0.383 100.5 101.6 96.1 96.3 98.4
1.3.15.5 Cutlery, Hand Tools and General Hardware 0.208 100.5 100.3 100.8 101.8 101.9 1.3.15.6 Other Fabricated Metal Products 0.728 124.0 123.2 123.6 124.5 123.6 1.3.16 MANUFACTURE OF COMPUTER, ELECTRONIC AND OPTICAL
PRODUCTS2.009 110.4 110.2 109.9 109.5 109.1
1.3.16.1 Electronic Components 0.402 98.1 98.0 96.7 96.6 97.2 1.3.16.2 Computers and Peripheral Equipment 0.336 135.0 135.1 135.1 135.0 135.1 1.3.16.3 Communication Equipment 0.310 117.0 117.2 115.4 114.8 114.2 1.3.16.4 Consumer Electronics 0.641 98.8 99.0 99.5 99.4 98.0 1.3.16.5 Measuring, Testing, Navigating and Control equipment 0.181 111.5 110.5 109.2 106.0 106.0 1.3.16.6 Watches and Clocks 0.076 139.1 138.7 142.0 141.7 141.9 1.3.16.7 Irradiation, Electromedical and Electrotherapeutic equipment 0.055 103.6 100.3 102.0 102.0 103.5 1.3.16.8 Optical instruments and Photographic equipment 0.008 110.2 109.5 112.1 112.1 108.8 1.3.17 MANUFACTURE OF ELECTRICAL EQUIPMENT 2.930 111.3 110.9 112.0 112.5 113.0 1.3.17.1 Electric motors, Generators, Transformers and Electricity
distribution and Control apparatus1.298 109.0 108.0 112.2 114.2 114.5
1.3.17.2 Batteries and Accumulators 0.236 117.0 117.5 118.1 116.6 117.0 1.3.17.3 Fibre optic cables for data transmission or live transmission of
images0.133 109.9 106.6 96.9 93.7 93.0
1.3.17.4 Other electronic and Electric wires and Cables 0.428 109.7 109.9 109.5 110.0 111.6 1.3.17.5 Wiring devices, Electric lighting & display equipment 0.263 111.1 112.1 110.4 110.4 110.9 1.3.17.6 Domestic appliances 0.366 119.9 120.5 117.8 118.2 118.3 1.3.17.7 Other electrical equipment 0.206 108.6 107.7 109.9 107.4 108.4 1.3.18 MANUFACTURE OF MACHINERY AND EQUIPMENT 4.789 113.1 113.6 112.7 112.9 113.6 1.3.18.1 Engines and Turbines, Except aircraft, Vehicle and Two wheeler
engines0.638 104.8 105.0 104.0 104.8 106.2
1.3.18.2 Fluid power equipment 0.162 119.9 120.3 117.0 117.1 118.2 1.3.18.3 Other pumps, Compressors, Taps and Valves 0.552 111.2 111.5 111.1 111.0 112.2 1.3.18.4 Bearings, Gears, Gearing and Driving elements 0.340 110.1 110.8 110.3 111.4 109.2 1.3.18.5 Ovens, Furnaces and Furnace burners 0.008 80.0 79.8 81.3 81.5 81.6 1.3.18.6 Lifting and Handling equipment 0.285 111.5 112.4 110.9 111.4 111.8
No. 21: Wholesale Price Index (Contd.)(Base: 2011-12 = 100)

CURRENT STATISTICS
RBI Bulletin October 2020 153
No. 21: Wholesale Price Index (Concld.)(Base: 2011-12 = 100)
Commodities Weight 2019-20 2019 2020
Aug. Jun. Jul. (P) Aug. (P)
1.3.18.7 OfficemachineryandEquipment 0.006 130.2 130.2 130.2 130.2 130.2 1.3.18.8 Other general-purpose machinery 0.437 130.9 135.2 127.9 128.0 128.2 1.3.18.9 Agricultural and Forestry machinery 0.833 120.6 120.6 120.6 120.6 121.5 1.3.18.10 Metal-forming machinery and Machine tools 0.224 108.1 108.0 108.2 109.5 107.7 1.3.18.11 Machinery for mining, Quarrying and Construction 0.371 75.1 74.5 75.1 75.1 75.3 1.3.18.12 Machinery for food, Beverage and Tobacco processing 0.228 125.2 123.7 125.6 125.1 128.1 1.3.18.13 Machinery for textile, Apparel and Leather production 0.192 119.7 118.7 122.7 123.1 123.9 1.3.18.14 Other special-purpose machinery 0.468 126.3 127.6 126.1 126.0 127.2 1.3.18.15 Renewable electricity generating equipment 0.046 66.0 66.6 64.6 64.6 64.3 1.3.19 MANUFACTURE OF MOTOR VEHICLES, TRAILERS AND SEMI-
TRAILERS4.969 114.5 113.0 117.0 116.9 116.9
1.3.19.1 Motor vehicles 2.600 115.2 114.5 117.9 117.6 117.6 1.3.19.2 Parts and Accessories for motor vehicles 2.368 113.7 111.3 116.0 116.2 116.1 1.3.20 MANUFACTURE OF OTHER TRANSPORT EQUIPMENT 1.648 118.0 117.7 124.5 125.0 125.7 1.3.20.1 Building of ships and Floating structures 0.117 158.8 158.8 158.8 158.8 158.8 1.3.20.2 Railway locomotives and Rolling stock 0.110 106.4 106.6 106.3 106.3 105.8 1.3.20.3 Motor cycles 1.302 114.3 113.9 122.6 123.2 124.1 1.3.20.4 Bicycles and Invalid carriages 0.117 128.9 128.2 128.5 128.7 128.7 1.3.20.5 Other transport equipment 0.002 126.1 124.7 127.2 127.4 127.5 1.3.21 MANUFACTURE OF FURNITURE 0.727 130.9 131.9 128.3 129.3 128.2 1.3.21.1 Furniture 0.727 130.9 131.9 128.3 129.3 128.2 1.3.22 OTHER MANUFACTURING 1.064 112.7 114.3 127.8 128.7 135.6 1.3.22.1 Jewellery and Related articles 0.996 109.9 111.6 125.7 126.7 134.0 1.3.22.2 Musical instruments 0.001 174.0 173.4 172.7 166.5 159.1 1.3.22.3 Sports goods 0.012 129.7 129.1 130.9 130.6 130.9 1.3.22.4 Games and Toys 0.005 136.9 137.1 141.2 142.9 144.2 1.3.22.5 Medical and Dental instruments and Supplies 0.049 162.1 162.1 167.2 167.3 167.52 FOOD INDEX 24.378 147.6 147.3 148.7 152.0 153.3
Source: OfficeoftheEconomicAdviser,MinistryofCommerceandIndustry,GovernmentofIndia.

CURRENT STATISTICS
RBI Bulletin October 2020154
Gen Ge
Sect ElMa
Mi
Use-PriCa
Int
Inf
Co
Co
No. 22: Index of Industrial Production (Base:2011-12=100)
Industry Weight2018-19 2019-20
1 2 3General IndexGeneral Index 100.00 130.1 129.0
1 Sectoral Classification 1.1 Mining 14.37 107.9 109.6 1.2 Manufacturing 77.63 131.5 129.6 1.3 Electricity 7.99 156.9 158.4
2 Use-Based Classification 2.1 Primary Goods 34.05 126.1 127.0 2.2 Capital Goods 8.22 108.4 93.3 2.3 Intermediate Goods 17.22 126.2 137.7 2.4 Infrastructure/ Construction Goods 12.34 141.7 136.6 2.5 Consumer Durables 12.84 130.4 119.0 2.6 Consumer Non-Durables 15.33 145.5 145.3
Source : National Statistical Office, Ministry of Statistics and Programme Implementation, Government of India.
July
2019 20206 7
131.8 118.1
100.2 87.2133.7 118.8170.5 166.3
128.1 114.191.8 70.9
140.4 122.9140.1 125.2130.3 99.5146.6 156.4
April-July
2019-20 2020-214 5
130.8 92.6
106.2 84.8131.2 88.2171.0 149.7
128.4 105.498.5 44.5
134.9 88.8140.2 86.4127.8 56.2143.6 130.0
Government Accounts and Treasury BillsNo. 23: Union Government Accounts at a Glance
(` Crore)
Source: Controller General of Accounts, Ministry of Finance, Government of India and Union Budget 2020-21.
April - August
2020-21(Actuals)
2019-20(Actuals)
Percentage to BudgetEstimates
2020-21 2019-20
2 3 4 5
370642 603201 18.3 30.7284495 404580 17.4 24.586147 198621 22.4 63.46664 18260 3.0 15.26635 5902 44.3 39.8
29 12358 0.0 11.8377306 621461 16.8 29.8
1113206 1039125 42.3 42.5237662 219026 33.6 33.2134447 136176 32.6 40.2
1247653 1175301 41.0 42.2742564 435924 121.9 89.9870347 553840 109.3 78.7632685 334814 717.9 773.4
Item
FinancialYear
2020-21(Budget
Estimates)
1
1 Revenue Receipts 2020926 1.1 Tax Revenue (Net) 1635909 1.2 Non-Tax Revenue 3850172 Non-Debt Capital Receipt 224967 2.1 Recovery of Loans 14967 2.2 Other Receipts 2100003 Total Receipts (excluding borrowings) (1+2) 22458934 Revenue Expenditure 2630145 4.1 Interest Payments 7082035 Capital Expenditure 4120856 Total Expenditure (4+5) 30422307 Revenue Deficit (4-1) 6092198 Fiscal Deficit (6-3) 7963379 Gross Primary Deficit (8-4.1) 88134
No. 22: Index of Industrial Production (Base:2011-12=100)
No. 23: Union Government Accounts at a Glance

CURRENT STATISTICS
RBI Bulletin October 2020 155
(` Crore)
2019 2020Aug. 30 Jul. 24 Jul. 31 Aug. 7 Aug. 14 Aug. 21 Aug. 28
2 3 4 5 6 7 8
19939 26310 24530 15634 9433 9209 81007196 20648 20849 19820 16021 15931 17932
54141 25097 31204 37199 37164 42164 4409485510 150462 148881 156433 163487 160782 157140
64410 151472 159639 166707 174888 171880 17089246639 57795 58945 58300 56535 65468 638532667 13067 12972 12997 1453 4453 4348
33619 98307 96263 96925 97574 99218 110486
59867 134188 133242 132283 133881 135072 13314468176 66555 75696 79868 85856 84137 9362017745 12224 12213 12243 12321 17526 1667657147 128231 126462 129053 127487 133781 132012
177224 158150 139180 90945 103668 134404 138620677 592 552 667 719 659 687
517055 884355 900895 917462 916100 939620 952296
No. 24: Treasury Bills – Ownership Pattern
Item 2019-20
11 91-day
1.1 Banks 101651.2 Primary Dealers 91901.3 State Governments 81731.4 Others 48004
2 182-day2.1 Banks 664192.2 Primary Dealers 433022.3 State Governments 133862.4 Others 22465
3 364-day3.1 Banks 496603.2 Primary Dealers 706723.3 State Governments 119453.4 Others 70576
4 14-day Intermediate4.1 Banks4.2 Primary Dealers4.3 State Governments 1551124.4 Others 617
Total Treasury Bills (Excluding 14 day Intermediate T Bills) #
423957
# 14D intermediate T-Bills are non-marketable unlike 91D, 182D and 364D T-Bills. These bills are ‘intermediate’ by nature as these are liquidated to replenish shortfall in the daily minimum cash balances of State Governments
No. 25: Auctions of Treasury Bills
(Amount in ` Crore)
Date ofAuction
NotifiedAmount
Bids Received Bids Accepted TotalIssue(6+7)
Cut-offPrice
Implicit Yieldat Cut-offPrice (per
cent)
Number Total Face Value Number Total Face Value
Competitive Non-Competitive
Competitive Non-Competitive
1 2 3 4 5 6 7 8 9 1091-day Treasury Bills
2020-21 Jul. 29 12000 96 41163 6698 38 11992 6698 18690 99.18 3.2979Aug. 5 12000 115 51332 7004 34 11996 7004 19000 99.19 3.2815Aug. 12 12000 117 97921 2062 14 11988 2062 14050 99.19 3.2689Aug. 19 12000 89 86592 7072 9 11978 7072 19050 99.22 3.1491Aug. 26 12000 105 90881 4045 20 11996 4045 16041 99.20 3.2367
182-day Treasury Bills2020-21 Jul. 29 13000 100 44970 0 44 13000 0 13000 98.34 3.3901Aug. 5 13000 123 58325 15 31 13000 15 13015 98.34 3.3752Aug. 12 13000 126 51022 10 30 12990 10 13000 98.33 3.4100Aug. 19 13000 104 40048 3005 53 12995 3005 16000 98.32 3.4320Aug. 26 13000 91 43819 0 51 13000 0 13000 98.29 3.4889
364-day Treasury Bills2020-21 Jul. 29 10000 137 38420 0 63 10000 0 10000 96.61 3.5195Aug. 5 10000 123 40305 550 40 10000 550 10550 96.63 3.4971Aug. 12 10000 123 39360 0 36 10000 0 10000 96.59 3.5383Aug. 19 10000 119 37515 5505 58 10000 5505 15505 96.59 3.5372Aug. 26 10000 83 31265 0 43 10000 0 10000 96.54 3.5891
No. 24: Treasury Bills – Ownership Pattern
No. 25: Auctions of Treasury Bills

CURRENT STATISTICS
RBI Bulletin October 2020156
No. 26: Daily Call Money Rates
As on Range of Rates Weighted Average Rates
1 Borrowings/ Lendings Borrowings/ Lendings
1 2
August 3, 2020 1.80-4.10 3.46
August 4, 2020 1.80-4.10 3.39
August 5, 2020 1.80-4.10 3.41
August 6, 2020 1.80-4.10 3.41
August 7, 2020 1.80-4.10 3.44
August 10, 2020 1.80-4.10 3.43
August 11, 2020 1.80-4.10 3.41
August 12, 2020 1.80-4.10 3.49
August 13, 2020 1.80-4.10 3.44
August 14, 2020 1.80-4.10 3.45
August 17, 2020 1.80-4.10 3.48
August 18, 2020 1.80-4.10 3.42
August 19, 2020 1.80-4.10 3.41
August 20, 2020 1.80-4.10 3.43
August 21, 2020 1.80-4.10 3.43
August 24, 2020 1.80-4.10 3.42
August 25, 2020 1.80-4.10 3.43
August 26, 2020 1.80-4.10 3.43
August 27, 2020 1.80-4.10 3.43
August 28, 2020 1.50-4.10 3.42
August 29, 2020 2.80-3.30 3.14
August 31, 2020 1.80-4.10 3.44
September 1, 2020 1.80-4.10 3.42
September 2, 2020 1.80-4.10 3.42
September 3, 2020 1.80-4.05 3.42
September 4, 2020 1.80-4.05 3.39
September 5, 2020 2.15-3.95 2.63
September 7, 2020 1.80-4.10 3.41
September 8, 2020 1.80-4.05 3.39
September 9, 2020 1.80-4.05 3.42
September 10, 2020 1.80-4.05 3.41
September 11, 2020 1.50-4.05 3.41
September 14, 2020 1.80-4.00 3.42
September 15, 2020 1.80-4.05 3.41
(Per cent per annum)
Note: Includes Notice Money.
Financial MarketsNo. 26: Daily Call Money Rates

CURRENT STATISTICS
RBI Bulletin October 2020 157
(` Crore)
2019 2020
Aug. 30 Jul. 24 Jul. 31 Aug. 7 Aug. 14 Aug. 21 Aug. 28
2 3 4 5 6 7 8
35391 21228 23100 22404 22201 23599 19387
10155 526 1192 607 1185 426 5150
697 788 594 895 580 936 492
309833 306217 352688 324705 339168 413808 420081
203504 266679 348069 387793 348461 319124 388951
1809 200 2112 1680 1536 560 300
78536 57816 63829 47143 49018 53940 63978
94875 67018 73654 60094 57502 62320 69966
6356 5161 3989 4213 3646 3397 3552
2604 4621 7702 7269 6232 502 4053
1735 2453 2885 2333 3416 9678 9139
2665 1116 1532 2604 2272 1892 2105
66 626 1603 3412 3850 3228
108301 80994 91365 79925 76918 81017 88815
98 597 367 174 217 445 4457
No. 29: Average Daily Turnover in Select Financial Markets
Item 2019-20
1
1 Call Money 26815
2 Notice Money 3660
3 Term Money 790
4 CBLO/TRIPARTY REPO 300691
5 Market Repo 221719
6 Repo in Corporate Bond 2468
7 Forex (US $ million) 67793
8 Govt. of India Dated Securities 93960
9 State Govt. Securities 5800
10 Treasury Bills
10.1 91-Day 3720
10.2 182-Day 2380
10.3 364-Day 2900
10.4 Cash Management Bills 2310
11 Total Govt. Securities (8+9+10) 111070
11.1 RBI –
Note : Collateralised Borrowing and Lending Obligation (CBLO) segment of the money market has been discontinued and replaced with Triparty Repo with effect from November 05, 2018.
No. 27: Certificates of Deposit
Item 2019 2020
Aug. 30 Jul. 17 Jul. 31 Aug. 14 Aug. 28
1 2 3 4 5
1 Amount Outstanding ( Crore) 179455.00 112455.00 104705.00 99835.00 90410.00
1.1 Issued during the fortnight ( Crore) 15568.45 4045.08 1292.97 1358.53 3502.17
2 Rate of Interest (per cent) 5.40-7.22 3.43-5.43 3.39-4.45 3.66-6.19 3.44-6.37
`
`
No. 28: Commercial Paper
Item 2019 2020
Aug. 31 Jul. 15 Jul. 31 Aug. 15 Aug. 31
1 2 3 4 5
1 Amount Outstanding ( Crore) 497176.75 402660.50 374817.20 380587.65 372600.80
1.1 Reported during the fortnight ( Crore) 77603.30 37730.15 53608.10 61152.00 68405.75
2 Rate of Interest (per cent) 5.37-13.39 2.98-12.04 3.18-12.33 3.31-11.79 3.17-13.14
`
`
No. 27: Certificates of Deposit
No. 28: Commercial Paper
No. 29: Average Daily Turnover in Select Financial Markets

CURRENT STATISTICS
RBI Bulletin October 2020158
Aug. 2019 Aug. 2020
No. ofIssues
Amount No. ofIssues
Amount
7 8 9 10
1 5 4149 9 6108
1 5 4118 9 5832
1 4 4047 2 11
1 4 4029 2 6
1 1 102 7 6096
1 1 89 7 5825
2 – – – –
2 – – – –
2 – – – –
3 5 3122 – –
3 – – – –
3 – – – –
3 – – – –
3 5 3122 – –
3 5 3122 – –
3 – – – –
5 10 7271 9 6108
5 9 7169 2 11
5 1 102 7 6096
2019-20 (Apr.-Aug.) 2020-21 (Apr.-Aug.)
No. ofIssues
Amount No. ofIssues
Amount
3 4 5 6
1 37 58964 19 75159
1 37 37659 19 71945
1 28 7944 10 15539
1 28 7826 10 13035
1 9 51020 9 59620
1 9 29833 9 58911
2 – – – –
2 – – – –
2 – – – –
3 16 7297 5 882
3 – – – –
3 – – – –
3 – – – –
3 16 7297 5 882
3 16 7297 5 882
3 – – – –
5 53 66261 24 76041
5 44 15242 15 16420
5 9 51020 9 59620
No. 30: New Capital Issues By Non-Government Public Limited Companies
Security & Type of Issue 2019-20
No. ofIssues
Amount
1 2
1 Equity Shares 72 64926
1A Premium 70 43259
1.1 Public 57 9867
1.1.1 Premium 55 9434
1.2 Rights 15 55059
1.2.1 Premium 15 33825
2 Preference Shares – –
2.1 Public – –
2.2 Rights – –
3 Bonds & Debentures 34 14984
3.1 Convertible – –
3.1.1 Public – –
3.1.2 Rights – –
3.2 Non-Convertible 34 14984
3.2.1 Public 34 14984
3.2.2 Rights – –
4 Total(1+2+3) 106 79910
4.1 Public 91 24851
4.2 Rights 15 55059
(Amount in ` Crore)
Note : Since April 2020, monthly data on equity issues is compiled on the basis of their listing date.
Source : Securities and Exchange Board of India.
* *
* : Data is Provisional
No. 30: New Capital Issues By Non-Government Public Limited Companies

CURRENT STATISTICS
RBI Bulletin October 2020 159
No. 31: Foreign Trade
Item Unit 2019-20 2019 2020Aug. Apr. May Jun. Jul. Aug.
1 2 3 4 5 6 7
1 Exports` Crore 2219854 184921 78301 145135 165953 177271 169514
US $ Million 313361 25992 10271 19183 21915 23638 22701
1.1 Oil` Crore 292340 22821 10229 12900 13959 13253 14393
US $ Million 41289 3208 1342 1705 1843 1767 1927
1.2 Non-oil` Crore 1927514 162101 68072 132236 151994 164019 155121
US $ Million 272072 22784 8929 17478 20071 21871 20774
2 Imports` Crore 3360954 283530 130560 168006 159558 213524 220084
US $ Million 474709 39852 17126 22205 21070 28472 29473
2.1 Oil` Crore 925168 78256 35773 26610 37340 48974 47949
US $ Million 130550 10999 4692 3517 4931 6530 6421
2.2 Non-oil` Crore 2435787 205275 94787 141396 122218 164550 172135
US $ Million 344159 28853 12433 18688 16139 21942 23052
3 Trade Balance` Crore -1141100 -98609 -52259 -22870 6395 -36253 -50570
US $ Million -161348 -13860 -6855 -3023 844 -4834 -6772
3.1 Oil` Crore -632828 -55435 -25544 -13710 -23381 -35722 -33556
US $ Million -89262 -7792 -3351 -1812 -3088 -4763 -4494
3.2 Non-oil` Crore -508273 -43174 -26715 -9160 29776 -531 -17014
US $ Million -72087 -6068 -3504 -1211 3932 -71 -2278Source: DGCI&S and Ministry of Commerce & Industry.
1.4 Reserve Tranche Position in IMF ` Crore 25703 34605 34700 34158 34083 34066 34090
US $ Million 3623 4628 4634 4657 4647 4637 4651
1.3 SDRs SDRs Million 1046 1048 1048 1048 1048 1048 1048
` Crore 10196 11082 11085 10868 10841 10895 10889
US $ Million 1435 1479 1481 1481 1482 1482 1483
No. 32: Foreign Exchange Reserves
Item Unit 2019 2020
Sep. 20 Aug. 14 Aug. 21 Aug. 28 Sep. 4 Sep. 11 Sep. 18
1 2 3 4 5 6 7
1 Total Reserves ` Crore 3045895 4009058 4023360 3973733 3964198 3982893 4003182
US $ Million 428572 535252 537548 541431 542013 541660 545038
1.1 Foreign Currency Assets ` Crore 2819216 3681783 3698667 3655683 3644856 3658364 3683211
US $ Million 396670 491550 494168 498094 498362 497521 501464
1.2 Gold ` Crore 190780 281589 278907 273025 274417 279568 274993
US $ Million 26843 37595 37264 37200 37521 38020 37440
* Difference,if any, is due to rounding off.
No. 33: NRI Deposits
(US$ Million)
Flows
2019-20 2020-21
Apr.-Aug. Apr.-Aug.
5 6
4043 4864
725 -1771
2496 6042
822 592
2019 2020
Aug. Jul. Aug.
2 3 4
130515 135097 137812
23895 22471 22473
91136 96076 98436
15483 16550 16904
Scheme
2019-20
1
1 NRI Deposits 130581
1.1 FCNR(B) 24244
1.2 NR(E)RA 90367
1.3 NRO 15969
Outstanding
External SectorNo. 31: Foreign Trade
No. 32: Foreign Exchange Reserves
No. 33: NRI Deposits

CURRENT STATISTICS
RBI Bulletin October 2020160
No. 34: Foreign Investment Inflows(US$ Million)
2019 2020
Aug. Jul. Aug.
4 5 6
1.1 Net Foreign Direct Investment (1.1.1–1.1.2) 1851 3156 17800
1.1.1 Direct Investment to India (1.1.1.1–1. 1.1.2) 2762 3988 18482
1.1.1.1 Gross Inflows/Gross Investments 4256 4638 19260
1.1.1.1.1 Equity 2669 3165 17602
1.1.1.1.1.1 Government (SIA/FI 43 10 64
1.1.1.1.1.2 RBI 2004 1539 17314
1.1.1.1.1.3 Acquisition of shares 506 1500 109 1.1.1.1.1.4 Equity capital of unincorporated bodie 116 116 116
1.1.1.1.2 Reinvested earnings 1155 1155 1155
1.1.1.1.3 Other capital 433 319 504
1.1.1.2 Repatriation/Disinvestment 1494 650 779
1.1.1.2.1 Equity 1482 648 777
1.1.1.2.2 Other capital 12 2 2 1.1.2 Foreign Direct Investment by India (1.1.2.1+1.1.2.2+1.1.2.3–1.1.2.4) 911 833 682
1.1.2.1 Equity capital 623 370 283
1.1.2.2 Reinvested Earnings 263 263 263
1.1.2.3 Other Capital 284 289 196
1.1.2.4 Repatriation/Disinvestment 258 90 60
1.2 Net Portfolio Investment (1.2.1+1.2.2+1.2.3–1.2.4) -363 1247 6769
1.2.1 GDRs/ADRs – – –
1.2.2 FIIs -520 619 6737
1.2.3 Offshore funds and others – – –
1.2.4 Portfolio investment by India -157 -628 -32
1 Foreign Investment Inflows 1488 4403 24569
2019-20 2020-21
Apr.-Aug. Apr.-Aug.
2 3
1.1 Net Foreign Direct Investment (1.1.1–1.1.2) 19326 20564
1.1.1 Direct Investment to India (1.1.1.1–1. 1.1.2) 24638 24564
1.1.1.1 Gross Inflows/Gross Investments 31602 35727
1.1.1.1.1 Equity 23922 27760
1.1.1.1.1.1 Government (SIA/FI 2809 171
1.1.1.1.1.2 RBI 17957 24514
1.1.1.1.1.3 Acquisition of shares 2589 2414 1.1.1.1.1.4 Equity capital of unincorporated bodie 567 662
1.1.1.1.2 Reinvested earnings 5658 6266
1.1.1.1.3 Other capital 2022 1701
1.1.1.2 Repatriation/Disinvestment 6965 11164
1.1.1.2.1 Equity 6921 11150
1.1.1.2.2 Other capital 44 14 1.1.2 Foreign Direct Investment by India (1.1.2.1+1.1.2.2+1.1.2.3–1.1.2.4) 5312 4000
1.1.2.1 Equity capital 2810 1770
1.1.2.2 Reinvested Earnings 1313 1321
1.1.2.3 Other Capital 2090 1203
1.1.2.4 Repatriation/Disinvestment 901 294
1.2 Net Portfolio Investment (1.2.1+1.2.2+1.2.3–1.2.4) 4937 8658
1.2.1 GDRs/ADRs – –
1.2.2 FIIs 4936 8454
1.2.3 Offshore funds and others – –
1.2.4 Portfolio investment by India -1 -204
1 Foreign Investment Inflows 24262 29222
Item 2019-20
1
1.1 Net Foreign Direct Investment (1.1.1–1.1.2) 43013
1.1.1 Direct Investment to India (1.1.1.1–1. 1.1.2) 56006
1.1.1.1 Gross Inflows/Gross Investments 74390
1.1.1.1.1 Equity 51734
1.1.1.1.1.1 Government (SIA/FIPB) 3265
1.1.1.1.1.2 RBI 39364
1.1.1.1.1.3 Acquisition of shares 7348 1.1.1.1.1.4 Equity capital of unincorporated bodies 1757
1.1.1.1.2 Reinvested earnings 14175
1.1.1.1.3 Other capital 8482
1.1.1.2 Repatriation/Disinvestment 18384
1.1.1.2.1 Equity 18212
1.1.1.2.2 Other capital 173 1.1.2 Foreign Direct Investment by India (1.1.2.1+1.1.2.2+1.1.2.3–1.1.2.4) 12993
1.1.2.1 Equity capital 7572
1.1.2.2 Reinvested Earnings 3151
1.1.2.3 Other Capital 5674
1.1.2.4 Repatriation/Disinvestment 3403
1.2 Net Portfolio Investment (1.2.1+1.2.2+1.2.3–1.2.4) 1403
1.2.1 GDRs/ADRs –
1.2.2 FIIs 552
1.2.3 Offshore funds and others –
1.2.4 Portfolio investment by India -851
1 Foreign Investment Inflows 44417
No. 35: Outward Remittances under the Liberalised Remittance Scheme (LRS) for Resident Individuals
(US$ Million)2019 2020Aug. Jun. Jul. Aug.
2 3 4 51875.77 780.67 995.16 1156.62
33.68 44.53 48.43 46.556.81 3.64 5.03 5.85
25.47 34.16 33.84 27.37177.16 108.81 129.75 124.9910.35 0.82 1.42 0.68
784.67 195.11 246.17 303.21281.57 185.33 243.61 232.86
2.69 3.07 2.54 1.65531.18 198.82 277.50 405.4822.19 6.38 6.87 7.98
Item 2019-20
11 Outward Remittances under the LRS 18760.69 1.1 Deposit 623.37 1.2 Purchase of immovable property 86.43 1.3 Investment in equity/debt 431.41 1.4 Gift 1907.71 1.5 Donations 22.33 1.6 Travel 6955.98 1.7 Maintenance of close relatives 3439.74 1.8 Medical Treatment 33.90 1.9 Studies Abroad 4991.07 1.10 Others 268.75
No. 34: Foreign Investment Inflows
No. 35: Outward Remittances under the Liberalised Remittance Scheme (LRS) for Resident Individuals

CURRENT STATISTICS
RBI Bulletin October 2020 161
No. 36: Indices of Real Effective Exchange Rate (REER) and Nominal Effective Exchange Rate (NEER) of the Indian Rupee
63.80 59.05 59.76
125.99 122.50 124.04
93.95 86.95 88.01
97.53 94.82 96.02
2019 2020
September August September
3 4 5
73.20 69.81 70.83
116.16 115.36 117.05
74.17 70.79 71.94
118.89 118.79 120.712018-19 2019-20 6-Currency Trade Based Weights
1 Base: 2004-05 (April-March) =100
1.1 NEER 63.07 63.59
1.2 REER 121.70 125.76
2 Base: 2017-18 (April-March) =100
2.1 NEER 92.88 93.63
2.2 REER 94.20 97.32
Item
2018-19 2019-20
1 2
36-Currency Export and Trade Based Weights (Base: 2004-05=100)
1 Trade-Based Weights
1.1 NEER 72.64 73.28
1.2 REER 114.01 116.75
2 Export-Based Weights
2.1 NEER 74.18 74.33
2.2 REER 116.32 119.61
(Amount in US$ Million)
2019 2020
Aug. Jul. Aug.
2 3 4
115 96 97
3167 848 1715
1 2 1
150 1300 36
116 98 98
3317 2148 1751
5.20 8.03 4.92
1.43 2.40 1.86
0.00-10.59 0.00-10.29 0.00-9.03
No. 37: External Commercial Borrowings (ECBs) – Registrations
Item 2019-20
1
1 Automatic Route
1.1 Number 1292
1.2 Amount 38011
2 Approval Route
2.1 Number 41
2.2 Amount 14921
3 Total (1+2)
3.1 Number 1333
3.2 Amount 52932
4 Weighted Average Maturity (in years) 6.00
5 Interest Rate (per cent)
5.1 Weighted Average Margin over 6-month LIBOR or reference rate for Floating Rate Loans 1.34
5.2 Interest rate range for Fixed Rate Loans 0.00-25.00
No. 36: Indices of Real Effective Exchange Rate (REER) and Nominal EffectiveExchange Rate (NEER) of the Indian Rupee
No. 37: External Commercial Borrowings (ECBs) – Registrations

CURRENT STATISTICS
RBI Bulletin October 2020162
No. 38: India's Overall Balance of Payments
(US $ Million)
Item
Apr-Jun 2019 Apr-Jun 2020(P)
Credit Debit Net Credit Debit Net
1 2 3 4 5 6
Overall Balance of Payments(1+2+3) 299344 285360 13984 249201 229355 198461 CURRENT ACCOUNT (1.1+ 1.2) 160681 175686 -15004 122408 102634 197741.1 MERCHANDISE 82707 129481 -46774 52308 62326 -100171.2 INVISIBLES (1.2.1+1.2.2+1.2.3) 77974 46204 31769 70100 40309 29791 1.2.1 Services 52196 32120 20075 46807 26304 20503 1.2.1.1 Travel 6950 6203 747 1848 2757 -909 1.2.1.2 Transportation 5343 6104 -761 4866 4216 649 1.2.1.3 Insurance 588 409 179 565 378 186 1.2.1.4 G.n.i.e. 151 307 -155 148 330 -182 1.2.1.5 Miscellaneous 39164 19098 20066 39380 18622 20758 1.2.1.5.1 Software Services 22811 1812 20998 22622 1849 20773 1.2.1.5.2 Business Services 11475 11715 -239 11282 11514 -232 1.2.1.5.3 Financial Services 1287 519 769 1009 1062 -52 1.2.1.5.4 Communication Services 700 284 415 707 304 403 1.2.2 Transfers 19963 1999 17964 18223 1237 16986 1.2.2.1 Official 35 295 -260 27 258 -231 1.2.2.2 Private 19928 1705 18224 18196 979 17217 1.2.3 Income 5815 12085 -6270 5070 12768 -7698 1.2.3.1 Investment Income 4463 11446 -6983 3706 12098 -8392 1.2.3.2 Compensation of Employees 1352 639 713 1364 669 6952 CAPITAL ACCOUNT (2.1+2.2+2.3+2.4+2.5) 138298 109674 28624 126793 126241 5522.1 Foreign Investment (2.1.1+2.1.2) 88733 69898 18835 74487 74237 250 2.1.1 Foreign Direct Investment 21555 7563 13993 11973 12365 -392 2.1.1.1 In India 21171 3976 17194 11829 9735 2094 2.1.1.1.1 Equity 16665 3957 12708 6993 9725 -2732 2.1.1.1.2 Reinvested Earnings 3349 3349 3957 3957 2.1.1.1.3 Other Capital 1157 19 1138 879 10 869 2.1.1.2 Abroad 384 3586 -3202 144 2630 -2486 2.1.1.2.1 Equity 384 1592 -1208 144 1117 -972 2.1.1.2.2 Reinvested Earnings 0 788 -788 0 796 -796 2.1.1.2.3 Other Capital 0 1206 -1206 0 718 -718 2.1.2 Portfolio Investment 67178 62335 4843 62514 61872 642 2.1.2.1 In India 67073 61916 5156 61869 60772 1098 2.1.2.1.1 FIIs 67073 61916 5156 61869 60772 1098 2.1.2.1.1.1 Equity 50491 47378 3112 52749 48334 4414 2.1.2.1.1.2 Debt 16582 14538 2044 9121 12437 -3317 2.1.2.1.2 ADR/GDRs 0 0 0 0 0 0 2.1.2.2 Abroad 105 419 -314 644 1100 -4562.2 Loans (2.2.1+2.2.2+2.2.3) 22209 12648 9561 18508 16227 2281 2.2.1 External Assistance 3018 1550 1468 5735 1645 4090 2.2.1.1 By India 2 29 -27 2 27 -26 2.2.1.2 To India 3016 1521 1495 5733 1618 4116 2.2.2 Commercial Borrowings 9763 3660 6103 3756 5369 -1613 2.2.2.1 By India 881 742 140 442 1003 -562 2.2.2.2 To India 8881 2918 5963 3315 4366 -1051 2.2.3 Short Term to India 9428 7438 1990 9017 9213 -196 2.2.3.1 Buyers' credit & Suppliers' Credit >180 days 8028 7438 590 9017 8412 605 2.2.3.2 Suppliers' Credit up to 180 days 1400 0 1400 0 801 -8012.3 Banking Capital (2.3.1+2.3.2) 17713 14280 3433 17690 15460 2230 2.3.1 Commercial Banks 17713 13897 3816 17690 14693 2997 2.3.1.1 Assets 6339 3595 2744 6865 4383 2482 2.3.1.2 Liabilities 11375 10302 1072 10825 10310 515 2.3.1.2.1 Non-Resident Deposits 10780 8026 2754 10653 7653 3000 2.3.2 Others 0 383 -383 0 767 -7672.4 Rupee Debt Service 0 60 -60 0 55 -552.5 Other Capital 9643 12789 -3146 16108 20261 -41533 Errors & Omissions 365 0 365 0 480 -4804 Monetary Movements (4.1+ 4.2) 0 13984 -13984 0 19846 -19846 4.1 I.M.F. 0 0 0 4.2 Foreign Exchange Reserves (Increase - / Decrease +) 13984 -13984 19846 -19846
Note : P : Preliminary
No. 38: India’s Overall Balance of Payments

CURRENT STATISTICS
RBI Bulletin October 2020 163
No. 39: India's Overall Balance of Payments
(` Crore)
Item
Apr-Jun 2019 Apr-Jun 2020(P)
Credit Debit Net Credit Debit Net
1 2 3 4 5 6
Overall Balance of Payments(1+2+3) 2081832 1984578 97254 1890800 1740218 1505821 CURRENT ACCOUNT (1.1+ 1.2) 1117480 1221831 -104351 928766 778731 1500341.1 MERCHANDISE 575199 900495 -325296 396887 472892 -760061.2 INVISIBLES (1.2.1+1.2.2+1.2.3) 542281 321335 220945 531879 305839 226040 1.2.1 Services 363004 223387 139617 355144 199578 155566 1.2.1.1 Travel 48335 43139 5196 14024 20918 -6894 1.2.1.2 Transportation 37157 42451 -5294 36918 31992 4926 1.2.1.3 Insurance 4088 2846 1242 4286 2872 1415 1.2.1.4 G.n.i.e. 1052 2133 -1081 1123 2504 -1381 1.2.1.5 Miscellaneous 272372 132817 139554 298793 141293 157500 1.2.1.5.1 Software Services 158639 12604 146036 171642 14027 157615 1.2.1.5.2 Business Services 79808 81470 -1663 85604 87365 -1761 1.2.1.5.3 Financial Services 8953 3608 5346 7659 8056 -396 1.2.1.5.4 Communication Services 4865 1976 2889 5364 2309 3055 1.2.2 Transfers 138837 13904 124933 138268 9387 128881 1.2.2.1 Official 242 2048 -1806 205 1959 -1754 1.2.2.2 Private 138595 11855 126740 138063 7428 130635 1.2.3 Income 40440 84045 -43605 38467 96874 -58407 1.2.3.1 Investment Income 31039 79602 -48563 28120 91796 -63677 1.2.3.2 Compensation of Employees 9401 4443 4958 10347 5077 52702 CAPITAL ACCOUNT (2.1+2.2+2.3+2.4+2.5) 961814 762747 199067 962034 957847 41872.1 Foreign Investment (2.1.1+2.1.2) 617107 486115 130992 565164 563268 1895 2.1.1 Foreign Direct Investment 149908 52595 97313 90846 93819 -2973 2.1.1.1 In India 147234 27655 119579 89752 73864 15889 2.1.1.1.1 Equity 115899 27522 88377 53061 73787 -20726 2.1.1.1.2 Reinvested Earnings 23291 0 23291 30021 0 30021 2.1.1.1.3 Other Capital 8045 133 7911 6671 77 6594 2.1.1.2 Abroad 2673 24939 -22266 1094 19955 -18862 2.1.1.2.1 Equity 2673 11075 -8402 1094 8472 -7378 2.1.1.2.2 Reinvested Earnings 0 5478 -5478 0 6038 -6038 2.1.1.2.3 Other Capital 0 8386 -8386 0 5446 -5446 2.1.2 Portfolio Investment 467199 433520 33679 474318 469449 4869 2.1.2.1 In India 466467 430607 35860 469430 461102 8328 2.1.2.1.1 FIIs 466467 430607 35860 469430 461102 8328 2.1.2.1.1.1 Equity 351144 329501 21644 400227 366734 33493 2.1.2.1.1.2 Debt 115323 101107 14216 69203 94368 -25165 2.1.2.1.2 ADR/GDRs 0 0 0 0 0 0 2.1.2.2 Abroad 732 2913 -2181 4888 8347 -34592.2 Loans (2.2.1+2.2.2+2.2.3) 154456 87960 66495 140429 123124 17305 2.2.1 External Assistance 20988 10780 10208 43513 12481 31031 2.2.1.1 By India 14 201 -187 12 208 -197 2.2.1.2 To India 20974 10579 10395 43501 12273 31228 2.2.2 Commercial Borrowings 67896 25451 42446 28501 40739 -12238 2.2.2.1 By India 6131 5157 974 3350 7612 -4262 2.2.2.2 To India 61766 20294 41472 25151 33127 -7976 2.2.3 Short Term to India 65571 51730 13841 68416 69904 -1488 2.2.3.1 Buyers' credit & Suppliers' Credit >180 days 55835 51730 4105 68416 63825 4591 2.2.3.2 Suppliers' Credit up to 180 days 9737 0 9737 0 6079 -60792.3 Banking Capital (2.3.1+2.3.2) 123189 99311 23878 134220 117303 16917 2.3.1 Commercial Banks 123189 96648 26540 134220 111481 22739 2.3.1.1 Assets 44083 25000 19082 52088 33257 18831 2.3.1.2 Liabilities 79106 71648 7458 82132 78223 3908 2.3.1.2.1 Non-Resident Deposits 74973 55820 19153 80826 58063 22763 2.3.2 Others 0 2662 -2662 0 5823 -58232.4 Rupee Debt Service 0 418 -418 0 419 -4192.5 Other Capital 67063 88944 -21881 122221 153732 -315113 Errors & Omissions 2538 0 2538 0 3640 -36404 Monetary Movements (4.1+ 4.2) 0 97254 -97254 0 150582 -150582 4.1 I.M.F. 0 0 0 0 0 0 4.2 Foreign Exchange Reserves (Increase - / Decrease +) 0 97254 -97254 0 150582 -150582
Note : P: Preliminary
No. 39: India’s Overall Balance of Payments

CURRENT STATISTICS
RBI Bulletin October 2020164
(US $ Million)
Item Apr-Jun 2019 Apr-Jun 2020(P)Credit Debit Net Credit Debit Net
1 2 3 4 5 61 Current Account (1.A+1.B+1.C) 160681 175657 -14977 122408 102610 19798 1.A Goods and Services (1.A.a+1.A.b) 134903 161602 -26699 99115 88629 10486 1.A.a Goods (1.A.a.1 to 1.A.a.3) 82707 129481 -46774 52308 62326 -10017 1.A.a.1 General merchandise on a BOP basis 82183 118031 -35848 52172 61638 -9466 1.A.a.2 Net exports of goods under merchanting 524 0 524 137 0 137 1.A.a.3 Nonmonetary gold 11450 -11450 0 688 -688 1.A.b Services (1.A.b.1 to 1.A.b.13) 52196 32120 20075 46807 26304 20503 1.A.b.1 Manufacturing services on physical inputs owned by others 33 18 14 77 6 71 1.A.b.2 Maintenance and repair services n.i.e. 45 413 -368 32 128 -97 1.A.b.3 Transport 5343 6104 -761 4866 4216 649 1.A.b.4 Travel 6950 6203 747 1848 2757 -909 1.A.b.5 Construction 754 754 0 659 625 34 1.A.b.6 Insurance and pension services 588 409 179 565 378 186 1.A.b.7 Financial services 1287 519 769 1009 1062 -52 1.A.b.8 Charges for the use of intellectual property n.i.e. 319 2091 -1771 399 1847 -1448 1.A.b.9 Telecommunications, computer, and information services 23604 2207 21397 23395 2269 21126 1.A.b.10 Other business services 11475 11715 -239 11282 11514 -232 1.A.b.11 Personal, cultural, and recreational services 532 631 -99 500 347 153 1.A.b.12 Government goods and services n.i.e. 151 307 -155 148 330 -182 1.A.b.13 Others n.i.e. 1114 750 364 2026 823 1203 1.B Primary Income (1.B.1 to 1.B.3) 5815 12085 -6270 5070 12768 -7698 1.B.1 Compensation of employees 1352 639 713 1364 669 695 1.B.2 Investment income 3247 11246 -7999 3096 11916 -8820 1.B.2.1 Direct investment 1607 4790 -3183 1349 7410 -6061 1.B.2.2 Portfolio investment 46 2503 -2457 24 1222 -1198 1.B.2.3 Other investment 163 3938 -3774 66 3280 -3214 1.B.2.4 Reserve assets 1431 15 1415 1657 4 1653 1.B.3 Other primary income 1216 200 1016 610 182 428 1.C Secondary Income (1.C.1+1.C.2) 19963 1971 17992 18223 1212 17010 1.C.1 Financial corporations, nonfinancial corporations, households, and NPISHs 19928 1705 18224 18196 979 17217 1.C.1.1 Personal transfers (Current transfers between resident and/ non-resident households)
19303 1217 18086 17596 739 16857 1.C.1.2 Other current transfers 625 487 138 600 240 360 1.C.2 General government 34 266 -232 26 234 -2072 Capital Account (2.1+2.2) 87 909 -822 91 871 -780 2.1 Gross acquisitions (DR.)/disposals (CR.) of non-produced nonfinancial assets 11 824 -813 5 790 -786 2.2 Capital transfers 76 85 -9 86 81 53 Financial Account (3.1 to 3.5) 138212 122778 15434 126703 145241 -18538 3.1 Direct Investment (3.1A+3.1B) 21555 7563 13993 11973 12365 -392 3.1.A Direct Investment in India 21171 3976 17194 11829 9735 2094 3.1.A.1 Equity and investment fund shares 20014 3957 16057 10950 9725 1225 3.1.A.1.1 Equity other than reinvestment of earnings 16665 3957 12708 6993 9725 -2732 3.1.A.1.2 Reinvestment of earnings 3349 3349 3957 0 3957 3.1.A.2 Debt instruments 1157 19 1138 879 10 869 3.1.A.2.1 Direct investor in direct investment enterprises 1157 19 1138 879 10 869 3.1.B Direct Investment by India 384 3586 -3202 144 2630 -2486 3.1.B.1 Equity and investment fund shares 384 2380 -1996 144 1912 -1768 3.1.B.1.1 Equity other than reinvestment of earnings 384 1592 -1208 144 1117 -972 3.1.B.1.2 Reinvestment of earnings 788 -788 0 796 -796 3.1.B.2 Debt instruments 0 1206 -1206 0 718 -718 3.1.B.2.1 Direct investor in direct investment enterprises 1206 -1206 0 718 -718 3.2 Portfolio Investment 67178 62335 4843 62514 61872 642 3.2.A Portfolio Investment in India 67073 61916 5156 61869 60772 1098 3.2.1 Equity and investment fund shares 50491 47378 3112 52749 48334 4414 3.2.2 Debt securities 16582 14538 2044 9121 12437 -3317 3.2.B Portfolio Investment by India 105 419 -314 644 1100 -456 3.3 Financial derivatives (other than reserves) and employee stock options 6703 5182 1521 11241 11303 -63 3.4 Other investment 42776 33714 9061 40975 39854 1121 3.4.1 Other equity (ADRs/GDRs) 0 0 0 0 0 0 3.4.2 Currency and deposits 10780 8409 2371 10653 8420 2233 3.4.2.1 Central bank (Rupee Debt Movements; NRG) 0 383 -383 0 767 -767 3.4.2.2 Deposit-taking corporations, except the central bank (NRI Deposits) 10780 8026 2754 10653 7653 3000 3.4.2.3 General government 0 0 0 3.4.2.4 Other sectors 0 0 0 3.4.3 Loans (External Assistance, ECBs and Banking Capital) 19714 11080 8633 16528 14054 2474 3.4.3.A Loans to India 18830 10310 8520 16085 13024 3061 3.4.3.B Loans by India 884 770 113 443 1031 -588 3.4.4 Insurance, pension, and standardized guarantee schemes 46 176 -131 40 47 -7 3.4.5 Trade credit and advances 9428 7438 1990 9017 9213 -196 3.4.6 Other accounts receivable/payable - other 2808 6611 -3803 4737 8119 -3382 3.4.7 Special drawing rights 0 0 0 0 3.5 Reserve assets 0 13984 -13984 0 19846 -19846 3.5.1 Monetary gold 0 0 0 3.5.2 Special drawing rights n.a. 0 0 0 3.5.3 Reserve position in the IMF n.a. 0 0 0 3.5.4 Other reserve assets (Foreign Currency Assets) 0 13984 -13984 0 19846 -198464 Total assets/liabilities 138212 122778 15434 126703 145241 -18538 4.1 Equity and investment fund shares 77743 59493 18250 75768 72422 3346 4.2 Debt instruments 57661 42691 14971 46198 44853 1345 4.3 Other financial assets and liabilities 2808 20594 -17787 4737 27966 -232285 Net errors and omissions 365 365 0 480 -480
No. 40: Standard Presentation of BoP in India as per BPM6
Note : P : Preliminary
No. 40: Standard Presentation of BoP in India as per BPM6

CURRENT STATISTICS
RBI Bulletin October 2020 165
(` Crore)
Item Apr-Jun 2019 Apr-Jun 2020(P)Credit Debit Net Credit Debit Net
1 2 3 4 5 61 Current Account (1.A+1.B+1.C) 1117477 1221634 -104157 928760 778544 150216 1.A Goods and Services (1.A.a+1.A.b) 938203 1123882 -185679 752031 672471 79560 1.A.a Goods (1.A.a.1 to 1.A.a.3) 575199 900495 -325296 396887 472892 -76006 1.A.a.1 General merchandise on a BOP basis 571553 820866 -249314 395848 467673 -71825 1.A.a.2 Net exports of goods under merchanting 3646 0 3646 1038 0 1038 1.A.a.3 Nonmonetary gold 0 79629 -79629 0 5219 -5219 1.A.b Services (1.A.b.1 to 1.A.b.13) 363004 223387 139617 355144 199578 155566 1.A.b.1 Manufacturing services on physical inputs owned by others 227 127 100 588 45 542 1.A.b.2 Maintenance and repair services n.i.e. 312 2872 -2560 241 975 -733 1.A.b.3 Transport 37157 42451 -5294 36918 31992 4926 1.A.b.4 Travel 48335 43139 5196 14024 20918 -6894 1.A.b.5 Construction 5245 5244 1 5003 4743 260 1.A.b.6 Insurance and pension services 4088 2846 1242 4286 2872 1415 1.A.b.7 Financial services 8953 3608 5346 7659 8056 -396 1.A.b.8 Charges for the use of intellectual property n.i.e. 2221 14539 -12318 3026 14016 -10990 1.A.b.9 Telecommunications, computer, and information services 164158 15349 148809 177507 17215 160292 1.A.b.10 Other business services 79808 81470 -1663 85604 87365 -1761 1.A.b.11 Personal, cultural, and recreational services 3700 4390 -690 3792 2632 1160 1.A.b.12 Government goods and services n.i.e. 1052 2133 -1081 1123 2504 -1381 1.A.b.13 Others n.i.e. 7747 5217 2529 15373 6247 9126 1.B Primary Income (1.B.1 to 1.B.3) 40440 84045 -43605 38467 96874 -58407 1.B.1 Compensation of employees 9401 4443 4958 10347 5077 5270 1.B.2 Investment income 22585 78213 -55628 23494 90414 -66921 1.B.2.1 Direct investment 11179 33314 -22134 10234 56223 -45989 1.B.2.2 Portfolio investment 321 17407 -17086 185 9273 -9088 1.B.2.3 Other investment 1136 27386 -26250 500 24885 -24385 1.B.2.4 Reserve assets 9949 107 9842 12574 34 12540 1.B.3 Other primary income 8454 1389 7065 4626 1382 3244 1.C Secondary Income (1.C.1+1.C.2) 138835 13707 125128 138262 9200 129063 1.C.1 Financial corporations, nonfinancial corporations, households, and NPISHs 138595 11855 126740 138063 7428 130635 1.C.1.1 Personal transfers (Current transfers between resident and/ non-resident households)
134248 8465 125782 133511 5606 127905 1.C.1.2 Other current transfers 4347 3390 957 4553 1822 2731 1.C.2 General government 239 1852 -1612 199 1772 -15732 Capital Account (2.1+2.2) 603 6322 -5719 690 6611 -5921 2.1 Gross acquisitions (DR.)/disposals (CR.) of non-produced nonfinancial assets 76 5731 -5655 34 5996 -5961 2.2 Capital transfers 527 591 -64 656 615 413 Financial Account (3.1 to 3.5) 961214 853875 107338 961350 1102005 -140655 3.1 Direct Investment (3.1A+3.1B) 149908 52595 97313 90846 93819 -2973 3.1.A Direct Investment in India 147234 27655 119579 89752 73864 15889 3.1.A.1 Equity and investment fund shares 139190 27522 111668 83082 73787 9295 3.1.A.1.1 Equity other than reinvestment of earnings 115899 27522 88377 53061 73787 -20726 3.1.A.1.2 Reinvestment of earnings 23291 0 23291 30021 0 30021 3.1.A.2 Debt instruments 8045 133 7911 6671 77 6594 3.1.A.2.1 Direct investor in direct investment enterprises 8045 133 7911 6671 77 6594 3.1.B Direct Investment by India 2673 24939 -22266 1094 19955 -18862 3.1.B.1 Equity and investment fund shares 2673 16553 -13880 1094 14510 -13416 3.1.B.1.1 Equity other than reinvestment of earnings 2673 11075 -8402 1094 8472 -7378 3.1.B.1.2 Reinvestment of earnings 0 5478 -5478 0 6038 -6038 3.1.B.2 Debt instruments 0 8386 -8386 0 5446 -5446 3.1.B.2.1 Direct investor in direct investment enterprises 0 8386 -8386 0 5446 -5446 3.2 Portfolio Investment 467199 433520 33679 474318 469449 4869 3.2.A Portfolio Investment in India 466467 430607 35860 469430 461102 8328 3.2.1 Equity and investment fund shares 351144 329501 21644 400227 366734 33493 3.2.2 Debt securities 115323 101107 14216 69203 94368 -25165 3.2.B Portfolio Investment by India 732 2913 -2181 4888 8347 -3459 3.3 Financial derivatives (other than reserves) and employee stock options 46618 36037 10581 85289 85765 -476 3.4 Other investment 297489 234470 63019 310898 302390 8507 3.4.1 Other equity (ADRs/GDRs) 0 0 0 0 0 0 3.4.2 Currency and deposits 74973 58482 16490 80826 63886 16940 3.4.2.1 Central bank (Rupee Debt Movements; NRG) 0 2662 -2662 0 5823 -5823 3.4.2.2 Deposit-taking corporations, except the central bank (NRI Deposits) 74973 55820 19153 80826 58063 22763 3.4.2.3 General government 0 0 0 3.4.2.4 Other sectors 0 0 0 3.4.3 Loans (External Assistance, ECBs and Banking Capital) 137100 77059 60042 125407 106637 18770 3.4.3.A Loans to India 130956 71701 59255 122045 98817 23228 3.4.3.B Loans by India 6145 5358 787 3361 7820 -4459 3.4.4 Insurance, pension, and standardized guarantee schemes 318 1226 -908 306 358 -53 3.4.5 Trade credit and advances 65571 51730 13841 68416 69904 -1488 3.4.6 Other accounts receivable/payable - other 19527 45974 -26447 35943 61605 -25662 3.4.7 Special drawing rights 0 0 0 3.5 Reserve assets 0 97254 -97254 0 150582 -150582 3.5.1 Monetary gold 0 0 0 3.5.2 Special drawing rights n.a. 0 0 0 3.5.3 Reserve position in the IMF n.a. 0 0 0 3.5.4 Other reserve assets (Foreign Currency Assets) 0 97254 -97254 0 150582 -1505824 Total assets/liabilities 961214 853875 107338 961350 1102005 -140655 4.1 Equity and investment fund shares 540675 413751 126924 574885 549501 25384 4.2 Debt instruments 401012 296897 104115 350523 340318 10205 4.3 Other financial assets and liabilities 19527 143227 -123700 35943 212187 -1762445 Net errors and omissions 2538 0 2538 0 3640 -3640
No. 41: Standard Presentation of BoP in India as per BPM6
Note : P: Preliminary
No. 41: Standard Presentation of BoP in India as per BPM6

CURRENT STATISTICS
RBI Bulletin October 2020166
(US$ Million)
2019 2020
Jun. Mar. Jun.
Assets Assets Assets
3 4 5
-451601 -375345 -345658
Item 2019-20
Assets
1
6 IIP (Assets - Liabilities) -375345
(US$ Million)
2019 2020
Jun. Mar. Jun.
Assets Liabilities Assets Liabilities Assets Liabilities
3 4 5 6 7 8
173165 417609 182957 418239 185442 419312
113118 399712 118442 395426 120210 395918
60047 17897 64515 22813 65233 23394
5012 266822 3847 246701 4303 241581
1806 151162 602 134778 824 138961
3206 115660 3246 111923 3480 102621
54140 429324 52422 427438 52489 432702
2121 107226 1460 104277 1233 103988
9762 173725 6741 179767 7435 184385
24169 133846 26011 130761 27741 132942
18089 14529 18210 12634 16080 11387
429837 477807 505702
662155 1113756 717033 1092378 747937 1093595
No. 42: International Investment Position
Item2019-20
Assets Liabilities
1 2
1 Direct Investment Abroad/in India 182957 418239
1.1 Equity Capital and Reinvested Earnings 118442 395426
1.2 Other Capital 64515 22813
2 Portfolio Investment 3847 246701
2.1 Equity 602 134778
2.2 Debt 3246 111923
3 Other Investment 52422 427438
3.1 Trade Credit 1460 104277
3.2 Loan 6741 179767
3.3 Currency and Deposits 26011 130761
3.4 Other Assets/Liabilities 18210 12634
4 Reserves 477807
5 Total Assets/ Liabilities 717033 1092378
As on Financial Year /Quarter End
No. 42: International Investment Position

CURRENT STATISTICS
RBI Bulletin October 2020 167
PART I - Payment System Indicators - Payment & Settlement System Statistics
Value (` Crore)
2019 2020
Aug. Jul. Aug.
6 7 8
– – –
– – –
– 14102229 12576300
– 9407660 8614891
– 1146554 867395
– 4098668 3793333
– 4162438 3954162
– 4544294 3749569
– 150275 211840
– – –
– – –
– 8335279 7292380
– 7137945 6382552
– 1197334 909828
– – –
– 2587356 2556825
– 45 46
– 8976 8313
– – –
– 225775 235137
– 98909 84468
– 1963113 1930552
– 290538 298308
– 15 15
– 68356 67146
– 216 253
– – –
– 68083 66830
– 56 63
– 112039 122089
– 45558 50311
– 20107 21001
– 25451 29310
– 66481 71778
– 25821 29525
– 40660 42253
– 15521 16808
– 12892 13000
– 2629 3808
– 628 737
– 2002 3072
– 434072 425462
– 433799 425252
– 272 210
– 3217344 3188330
– 11552623 10480709
– 11118551 10055248
FY 2019-20
5
–
–
–
–
–
–
–
–
–
–
–
–
–
–
–
–
–
–
–
–
–
–
–
–
–
–
–
–
–
–
–
–
–
–
–
–
–
–
–
–
–
–
–
–
–
–
–
Volume(Lakh )
2019 2020
Aug. Jul. Aug.
2 3 4
– – –
– – –
– 2.52 2.28
– 1.22 0.96
– 0.73 0.52
– 0.29 0.27
– 0.20 0.18
– 1.28 1.28
– 0.02 0.03
– – –
– – –
– 124.76 116.77
– 123.22 115.29
– 1.55 1.49
– – –
– 21832.34 23968.09
– 0.86 0.89
– 1182.38 1196.39
– 0.00 0.00
– 2220.99 2461.25
– 1053.54 1775.18
– 2401.03 2346.09
– 14973.54 16188.28
– 0.91 0.92
– 855.71 857.28
– 15.96 19.50
– 0.00 0.00
– 801.08 791.81
– 38.67 45.96
– 4578.31 4914.48
– 1319.66 1425.11
– 601.63 659.47
– 718.03 765.64
– 3258.65 3489.38
– 1461.94 1647.47
– 1796.71 1841.91
– 3987.42 4932.61
– 3205.59 3967.82
– 781.83 964.79
– 24.49 29.20
– 757.34 935.59
– 532.38 519.83
– 532.24 519.72
– 0.14 0.11
– 31786.17 35192.30
– 31910.93 35309.07
– 31378.55 34789.24
System
FY 2019-20
1
A. Settlement Systems –
Financial Market Infrastructures (FMIs) –
1 CCIL Operated Systems (1.1 to 1.3) –
1.1 Govt. Securities Clearing (1.1.1 to 1.1.3) –
1.1.1 Outright –
1.1.2 Repo –
1.1.3 Tri-party Repo –
1.2 Forex Clearing –
1.3 Rupee Derivatives @ –
B. Payment Systems –
I Financial Market Infrastructures (FMIs) –
1 Credit Transfers - RTGS (1.1 to 1.2) –
1.1 Customer Transactions –
1.2 Interbank Transactions –
II Retail –
2 Credit Transfers - Retail (2.1 to 2.7) –
2.1 AePS (Fund Transfers) @ –
2.2 APBS $ –
2.3 ECS Cr –
2.4 IMPS –
2.5 NACH Cr $ –
2.6 NEFT –
2.7 UPI @ –
2.7.1 of which USSD @ –
3 Debit Transfers and Direct Debits (3.1 to 3.4) –
3.1 BHIM Aadhaar Pay @ –
3.2 ECS Dr –
3.3 NACH Dr $ –
3.4 NETC (linked to bank account) @ –
4 Card Payments (4.1 to 4.2) –
4.1 Credit Cards (4.1.1 to 4.1.2) –
4.1.1 PoS based $ –
4.1.2 Others $ –
4.2 Debit Cards (4.2.1 to 4.2.1 ) –
4.2.1 PoS based $ –
4.2.2 Others $ –
5 Prepaid Payment Instruments (5.1 to 5.2) –
5.1 Wallets –
5.2 Cards (5.2.1 to 5.2.2) –
5.2.1 PoS based $ –
5.2.2 Others $ –
6 Paper-based Instruments (6.1 to 6.2) –
6.1 CTS (NPCI Managed) –
6.2 Others –
Total - Retail Payments (2+3+4+5+6) –
Total Payments (1+2+3+4+5+6) –
Total Digital Payments (1+2+3+4+5) –
Value(` Crore)
Volume(Lakh )
Payment and Settlement SystemsNo.43: Payment System Indicators

CURRENT STATISTICS
RBI Bulletin October 2020168
PART II - Payment Modes and Channels
Value (` Crore)
2019 2020
Aug. Jul. Aug.
6 7 8
– – –
– 637489 667279
– 130568 138564
– 506921 528715
– 3251167 3006656
– 1595612 1494618
– 1655556 1512038
– – –
– 234119 238675
– 167 184
– 233256 237778
– 697 713
– 136 134
– 132 129
– 3 5
– 17469 19513
– 17469 19513
Volume(Lakh )
2019 2020
Aug. Jul. Aug.
2 3 4
– – –
– 17281.26 19521.47
– 1574.10 1682.30
– 15707.16 17839.17
– 2673.76 2651.34
– 582.31 557.18
– 2091.45 2094.17
– – –
– 4708.63 4884.50
– 3.29 3.66
– 4686.13 4860.29
– 19.20 20.55
– 33.57 32.48
– 30.67 27.89
– 2.90 4.60
– 743.41 814.30
– 743.41 814.30
System
FY 2019-20
1
A. Other Payment Channels –
1 Mobile Payments (mobile app based) (1.1 to 1.2) –
1.1 Intra-bank $ –
1.2 Inter-bank $ –
2 Internet Payments (Netbanking / Internet Browser Based) @ (2.1 to 2.2) –
2.1 Intra-bank @ –
2.2 Inter-bank @ –
B. ATMs –
3 Cash Withdrawal at ATMs $ (3.1 to 3.3) –
3.1 Using Credit Cards $ –
3.2 Using Debit Cards $ –
3.3 Using Pre-paid Cards $ –
4 Cash Withdrawal at PoS $ (4.1 to 4.2) –
4.1 Using Debit Cards $ –
4.2 Using Pre-paid Cards $ –
5 Cash Withrawal at Micro ATMs @ –
5.1 AePS @ –
Note : 1. Data is provisional.2. The data from November 2019 onwards for card payments (Debit/Credit cards) and Prepaid Payment Instruments (PPIs) may not be comparable with earlier months/ periods, as more granular data is being published along with revision in data definitions.3. Only domestic financial transactions are considered. The new format captures e-commerce transactions; transactions using FASTags, digital bill payments and card-to-card transfer through ATMs, etc.. Also, failed transactions, chargebacks, reversals, expired cards/ wallets, are excluded.
2019 2020
Aug. Jul. Aug.
2 3 4
– – –
– 9099.87 9165.41
– 576.32 578.31
– 8523.55 8587.10
– 19272.63 20134.06
– 17749.31 18482.49
– 1523.32 1651.58
– 2.34 2.33
– 2.10 2.09
– 0.24 0.24
– 3.06 3.07
– 50.80 51.07
– 22.37 22.99
SystemFY 2019-20
1
Payment System Infrastructures –
1 Number of Cards (1.1 to 1.2) –
1.1 Credit Cards –
1.2 Debit Cards –
2 Number of PPIs @ (2.1 to 2.2) –
2.1 Wallets @ –
2.2 Cards @ –
3 Number of ATMs (3.1 to 3.2) –
3.1 Bank owned ATMs $ –
3.2 White Label ATMs $ –
4 Number of Micro ATMs @ –
5 Number of PoS Terminals –
6 Bharat QR @ –
PART III - Payment Infrastructures (Lakh)
FY 2019-20
5
–
–
–
–
–
–
–
–
–
–
–
–
–
–
–
–
–
Volume(Lakh )
@: New inclusion w.e.f. November 2019 $ : Inclusion separately initiated from November 2019 - would have been part of other items hitherto.
Value(` Crore)
@: New inclusion w.e.f. November 2019$ : Inclusion separately initiated from November 2019 - would have been part of other items hitherto.
Note : 1. Data is provisional. 2. The data for November 2019 for card payments (Debit/Credit cards) and Prepaid Payment Instruments (PPIs) may not be comparable with earlier months/
periods,asmoregranulardataisbeingpublishedalongwithrevisionindatadefinitions. 3.Onlydomesticfinancialtransactionsareconsidered.Thenewformatcapturese-commercetransactions;transactionsusingFASTags;digtalbillpaymentsand
card-to-card transfer through ATMs, etc.. Also, failed transactions, chargebacks, reversals, expired cards/ wallets, are excluded.

CURRENT STATISTICS
RBI Bulletin October 2020 169
No. 44: Small Savings
(` Crore)
2019 2020
Feb. Dec. Jan. Feb.
2 3 4 5
9839 15814 15184 16911
899191 1015010 1030037 1046766
7130 12117 11091 11460
606920 693812 704903 716363
2360 3455 3106 2690
134863 150462 153568 156258
-19 -31 -25 -20
2877 2984 2959 2939
0 -827 -2 -3
-8 -18 -20 -23
928 1753 1712 1887
191653 203460 205172 207059
1184 2070 2133 2131
54446 69464 71597 73728
2451 4296 3999 4494
121687 152622 156621 161115
70179 86344 88247 90327
5824 6749 6854 6970
6910 7328 7397 7464
38774 52201 54123 56354
215 1401 168 281
101407 114842 115010 115291
11 0 0 0
-26 -25 -25 -25
0 0 0 0
21 21 21 21
1732 3326 3524 3937
219257 240900 244267 248022
1262 2272 2458 2619
94795 110050 112508 115127
3 0 0 1
300 -289 -289 -288
-1609 -971 -1713 -1120
21232 6782 5069 3949
2065 2025 2782 2452
91314 113273 116055 118507
12 0 -1 0
-47 -179 -180 -180
-1 0 -2 -15
-82 -82 -84 -99
11745 11345 11188 11006
977 371 569 1514
73014 80298 80867 82381
Scheme 2018-19
11 Small Savings Receipts 115714
Outstanding 918459
1.1 Total Deposits Receipts 91108
Outstanding 618418
1.1.1 Post Office Saving Bank Deposits Receipts 31037
Outstanding 140247 1.1.2 MGNREG Receipts
Outstanding 1.1.3 National Saving Scheme, 1987 Receipts -31
Outstanding 3107 1.1.4 National Saving Scheme, 1992 Receipts 53
Outstanding 10 1.1.5 Monthly Income Scheme Receipts 10967
Outstanding 192658 1.1.6 Senior Citizen Scheme 2004 Receipts 13990
Outstanding 55708 1.1.7 Post Office Time Deposits Receipts 25000
Outstanding 124292 1.1.7.1 1 year Time Deposits Outstanding 71534 1.1.7.2 2 year Time Deposits Outstanding 5910 1.1.7.3 3 year Time Deposits Outstanding 6901 1.1.7.4 5 year Time Deposits Outstanding 39947 1.1.8 Post Office Recurring Deposits Receipts 10081
Outstanding 102401 1.1.9 Post Office Cumulative Time Deposits Receipts 11
Outstanding -26 1.1.10 Other Deposits Receipts 0
Outstanding 21 1.2 Saving Certificates Receipts 16067
Outstanding 221517
1.2.1 National Savings Certificate VIII issue Receipts 11318
Outstanding 98492 1.2.2 Indira Vikas Patras Receipts 334
Outstanding 263 1.2.3 Kisan Vikas Patras Receipts -18678
Outstanding 19303 1.2.4 Kisan Vikas Patras - 2014 Receipts 23018
Outstanding 93630 1.2.5 National Saving Certificate VI issue Receipts 93
Outstanding 2 1.2.6 National Saving Certificate VII issue Receipts -18 Outstanding -80 1.2.7 Other Certificates Outstanding 9907 1.3 Public Provident Fund Receipts 8539
Outstanding 78524
Source: Accountant General, Post and Telegraphs.
Occasional SeriesOccasional SeriesOccasional SeriesNo. 44: Small Savings
Note : Data on receipts from April 2017 are net receipts, i.e., gross receipt minus gross payment.

CURRENT STATISTICS
RBI Bulletin October 2020170
TABLE 45 : OWNERSHIP PATTERN OF CENTRAL AND STATE GOVERNMENTS SECURITIES
Central Government Dated Securities
Central Government Dated Securities
Category2019 2020
Jun. Sep. Dec. Mar. Jun.1 2 3 4 5
(A) Total 6072243 6314426 6512659 6486585 67049831 Commercial Banks 39.05 39.66 39.05 40.41 38.982 Non-Bank PDs 0.36 0.42 0.39 0.39 0.363 Insurance Companies 24.88 24.86 24.90 25.09 26.244 Mutual Funds 0.64 0.77 1.53 1.43 2.025 Co-operative Banks 2.17 2.01 1.97 1.90 1.866 Financial Institutions 1.05 1.15 1.14 0.53 1.197 Corporates 0.99 0.92 0.84 0.81 0.788 Foreign Portfolio Investors 3.27 3.31 3.33 2.44 1.799 Provident Funds 5.35 4.87 4.93 4.72 4.9610 RBI 15.67 14.99 14.72 15.13 14.7011. Others 6.57 7.05 7.23 7.17 7.11 11.1 State Governments 2.02 1.99 1.97 2.05 1.99
(Per cent)
(in `. Crore)
State Development Loans
State Governments Securities
Category2019 2020
Jun. Sep. Dec. Mar. Jun.1 2 3 4 5
(B) Total 2826935 2905169 3047353 3265990 33930991 Commercial Banks 32.57 32.53 32.46 34.99 33.542 Non-Bank PDs 0.81 0.72 0.64 0.76 0.743 Insurance Companies 33.94 33.39 32.50 31.63 30.854 Mutual Funds 1.24 1.12 1.20 1.14 1.745 Co-operative Banks 4.65 4.24 4.16 4.12 4.386 Financial Institutions 0.44 0.33 0.31 0.11 1.967 Corporates 0.32 0.28 0.31 0.30 0.318 Foreign Portfolio Investors 0.08 0.05 0.04 0.02 0.029 Provident Funds 21.88 22.36 23.66 22.22 21.7010 RBI 0.00 0.00 0.00 0.00 0.0011. Others 4.08 4.98 4.73 4.71 4.78 11.1 State Governments 0.14 0.16 0.17 0.18 0.18
(in `. Crore)
Treasury Bills
Treasury Bills
Category2019 2020
Jun. Sep. Dec. Mar. Jun.1 2 3 4 5
(C) Total 524618 538041 514588 538409 8813621 Commercial Banks 53.60 50.81 45.19 61.06 46.112 Non-Bank PDs 1.85 1.92 2.07 2.26 1.483 Insurance Companies 5.13 5.55 5.76 7.45 4.644 Mutual Funds 13.00 14.08 20.42 13.24 23.455 Co-operative Banks 2.54 2.55 2.07 2.55 1.956 Financial Institutions 2.14 1.82 2.12 0.58 1.677 Corporates 1.67 1.57 1.66 1.89 1.438 Foreign Portfolio Investors 0.00 0.00 0.00 0.00 0.009 Provident Funds 0.07 0.01 0.01 0.02 0.0510 RBI 0.00 0.00 0.00 0.00 11.2711. Others 19.99 21.70 20.70 10.95 7.95 11.1 State Governments 15.59 17.91 16.36 6.22 4.35
(in `. Crore)
Notes : "-" represents nil of negligible1. The revised table format since June 2016, incorporates the ownership pattern of State Governments Securities and Treasury Bills along with the Central Government Securities.2. State Government Securities include special bonds issued under Ujwal DISCOM Assurance Yojana (UDAY) scheme. 3. Bank PDs are clubbed under Commercial Banks. However, they form very small fraction of total outstanding securities.4. The category ‘Others’ comprises State Governments, Pension Funds, PSUs, Trusts, HUF/Individuals etc.
No. 45 : Ownership Pattern of Central and State Governments Securities

CURRENT STATISTICS
RBI Bulletin October 2020 171
No. 46: Combined Receipts and Disbursements of the Central and State Governments (` Crore)
Item 2015-16 2016-17 2017-18 2018-19 2019-20 RE 2020-21 BE
1 2 3 4 5 61 Total Disbursements 3760611 4265969 4515946 4592774 5384046 5891729 1.1 Developmental 2201287 2537905 2635110 2561817 3136568 3399617 1.1.1 Revenue 1668250 1878417 2029044 1969188 2429965 2600308 1.1.2 Capital 412069 501213 519356 536064 631770 701186 1.1.3 Loans 120968 158275 86710 56564 74832 98122 1.2 Non-Developmental 1510810 1672646 1812455 1961322 2163599 2405700 1.2.1 Revenue 1379727 1555239 1741432 1851432 2049076 2283365 1.2.1.1 Interest Payments 648091 724448 814757 857042 931418 1043241 1.2.2 Capital 127306 115775 69370 108929 113301 120954 1.2.3 Loans 3777 1632 1654 960 1222 1381 1.3 Others 48514 55417 68381 69635 83878 864132 Total Receipts 3778049 4288432 4528422 4575665 5286292 5953495 2.1 Revenue Receipts 2748374 3132201 3376416 3422206 3938252 4364500 2.1.1 Tax Receipts 2297101 2622145 2978134 3009930 3282501 3670364 2.1.1.1 Taxes on commodities and services 1440952 1652377 1853859 1844705 1970009 2232599 2.1.1.2 Taxes on Income and Property 852271 965622 1121189 1162411 1308313 1433265 2.1.1.3 Taxes of Union Territories (Without Legislature) 3878 4146 3086 2814 4180 4500 2.1.2 Non-Tax Receipts 451272 510056 398282 412276 655751 694136 2.1.2.1 Interest Receipts 35779 33220 34224 35055 32612 30156 2.2 Non-debt Capital Receipts 59827 69063 142433 138195 124128 230396 2.2.1 Recovery of Loans & Advances 16561 20942 42213 42587 57120 16526 2.2.2 Disinvestment proceeds 43266 48122 100219 95608 67008 2138703 Gross Fiscal Deficit [ 1 - ( 2.1 + 2.2 ) ] 952410 1064704 997097 1032373 1321665 1296834 3A Sources of Financing: Institution-wise ----- ----- ----- ----- ----- ----- 3A.1 Domestic Financing 939662 1046708 989167 1026854 1316732 1292212 3A.1.1 Net Bank Credit to Government 231090 617123 144792 387091 518093 ----- 3A.1.1.1 Net RBI Credit to Government 60472 195816 -144847 325987 190241 ----- 3A.1.2 Non-Bank Credit to Government 708572 429585 844375 639763 798639 ----- 3A.2 External Financing 12748 17997 7931 5519 4933 4622 3B Sources of Financing: Instrument-wise ----- ----- 997097 ----- ----- ----- 3B.1 Domestic Financing 939662 1046708 989167 1026854 1316732 1292212 3B.1.1 Market Borrowings (net) 673298 689821 794856 750757 904031 1016941 3B.1.2 Small Savings (net) -78515 -105038 -163222 -198597 -311548 -286577 3B.1.3 State Provident Funds (net) 35261 45688 42351 40944 35814 37517 3B.1.4 Reserve Funds -3322 -6436 18423 -18298 -241 2978 3B.1.5 Deposits and Advances 13470 17792 25138 66289 32949 35987 3B.1.6 Cash Balances -17438 -22463 -12476 17108 97754 -61765 3B.1.7 Others 316908 427343 284095 368651 557975 547131 3B.2 External Financing 12748 17997 7931 5519 4933 46224 Total Disbursements as per cent of GDP 27.3 27.7 26.4 24.2 26.5 26.25 Total Receipts as per cent of GDP 27.4 27.9 26.5 24.1 26.0 26.56 Revenue Receipts as per cent of GDP 20.0 20.3 19.7 18.0 19.4 19.47 Tax Receipts as per cent of GDP 16.7 17.0 17.4 15.9 16.1 16.38 Gross Fiscal Deficit as per cent of GDP 6.9 6.9 5.8 5.4 6.5 5.8
…: Not available. RE: Revised Estimates; BE: Budget EstimatesSource : Budget Documents of Central and State Governments. Note : GDP data is based on 2011-12 base. GDP data from 2019-20 pertains to the Provisional Estimates of National Income released by
Central Statistics Office on 29th May 2020. GDP for 2020-21 is from Union Budget 2020-21.Data upto 2017-18 pertains to all States and Union Territories. From 2018-19 onwards, data is provisional and pertains to 25 States only.Total receipts and total expenditure exclude National Calamity Contingency Fund expenditure.1 & 2: Data are net of repayments of the Central Government (including repayments to the NSSF) and State Governments.1.3: Represents compensation and assignments by States to local bodies and Panchayati Raj institutions.2: Data are net of variation in cash balances of the Central and State Governments and includes borrowing receipts of the Centraland State Governments.3A.1.1: Data as per RBI records.3B.1.1: Includes borrowings through dated securities.3B.1.2: Represent net investment in Central and State Governments’ special securities by the National Small Savings Fund (NSSF).3B.1.6: Include Ways and Means Advances by the Centre to the State Governments.3B.1.7: Include Treasury Bills, loans from financial institutions, insurance and pension funds, remittances, cash balance investment account.
No. 46: Combined Receipts and Disbursements of the Central and State Governments

CURRENT STATISTICS
RBI Bulletin October 2020172
No. 47: Financial Accommodation Availed by State Governments under various Facilities
Sr.No
During August-2020
State/Union Territory Special DrawingFacility (SDF)
Ways and MeansAdvances (WMA)
Overdraft (OD)
Averageamountavailed
Numberof daysavailed
Averageamountavailed
Numberof daysavailed
Averageamountavailed
Numberof daysavailed
1 2 3 4 5 6 7
1 Andhra Pradesh 1195 31 1637 31 1297 6
2 Arunachal Pradesh - - - - - -
3 Assam - - - - - -
4 Bihar - - - - - -
5 Chhattisgarh - - - - - -
6 Goa 103 14 35 7 - -
7 Gujarat - - - - - -
8 Haryana 278 17 258 8 - -
9 Himachal Pradesh - - 413 13 - -
10 Jammu & Kashmir UT - - 1171 31 349 2
11 Jharkhand - - - - - -
12 Karnataka - - - - - -
13 Kerala 196 22 961 16 147 3
14 Madhya Pradesh - - - - - -
15 Maharashtra 1483 14 - - - -
16 Manipur 41 15 116 8 - -
17 Meghalaya - - - - - -
18 Mizoram - - - - - -
19 Nagaland 327 31 194 31 102 6
20 Odisha - - - - - -
21 Puducherry - - - - - -
22 Punjab 232 13 262 3 - -
23 Rajasthan - - - - - -
24 Tamil Nadu - - - - - -
25 Telangana 1329 31 1092 29 756 8
26 Tripura - - - - - -
27 Uttar Pradesh - - - - - -
28 Uttarakhand 195 27 - - - -
29 West Bengal 810 9 - - - -
(` Crore)
Notes: 1. SDF is availed by State Governments against the collateral of Consolidated Sinking Fund (CSF), Guarantee Redemption Fund (GRF) & Auction Treasury Bills (ATBs) balances and other investments in government securities.2. WMA is advance by Reserve Bank of India to State Governments for meeting temporary cash mismatches.3. OD is advanced to State Governments beyond their WMA limits.4. Average Availed is the total accommodation (SDF/WMA/OD) availed divided by number of days for which accommodation was extended during the month.5. - : Nil.6. The State of J&K has ceased to exist constitutionally from October 31, 2019 and the liabilities of the State continue to remain as liabilities of the new UT of Jammu and Kashmir.
Source: Reserve Bank of India.
Note: The State of J&K has ceased to exist constitutionally from October 31, 2019 and the liabilities of the State continue to remain as liabilities of the new UT of Jammu and Kashmir.Source: Reserve Bank of India.
No. 47: Financial Accommodation Availed by State Governments under various Facilities

CURRENT STATISTICS
RBI Bulletin October 2020 173
Note: The State of J&K has ceased to exist constitutionally from October 31, 2019 and the liabilities of the State continue to remain as liabilities of the new UT of Jammu and Kashmir.
No. 48: Investments by State Governments
As on end of August 2020
Sr.No State/Union Territory
ConsolidatedSinking Fund
(CSF)
GuaranteeRedemption Fund
(GRF)
GovernmentSecurities
Auction TreasuryBills (ATBs)
1 2 3 4 51 Andhra Pradesh 8271 815 -- -2 Arunachal Pradesh 1446 2 -- -3 Assam 4436 54 -- -4 Bihar 6974 -- -- -5 Chhattisgarh 4416 -- 1 47506 Goa 593 299 -- -7 Gujarat 12033 480 -- -8 Haryana 2082 1199 -- -9 Himachal Pradesh -- -- -- -
10 Jammu & Kashmir UT -- -- -- -11 Jharkhand 89 -- -- -12 Karnataka 4222 -- -- 1300013 Kerala 2141 -- -- -14 Madhya Pradesh -- 915 -- -15 Maharashtra 41069 428 -- 1900016 Manipur 378 100 -- -17 Meghalaya 665 36 9 -18 Mizoram 462 39 -- -19 Nagaland 1635 33 -- -20 Odisha 13370 1452 84 1676021 Puducherry 292 -- -- 93122 Punjab 695 -- 8 -23 Rajasthan -- -- 129 200024 Tamil Nadu 6620 -- 40 867725 Telangana 5658 1233 -- -26 Tripura 372 9 -- -27 Uttar Pradesh 375 -- 180 -28 Uttarakhand 3146 79 -- -29 West Bengal 10124 531 214 -
Total 131563 7705 664 65118
(` Crore)
Note: 1. The State of J&K has ceased to exist constitutionally from October 31, 2019 and the liabilities of the State continue to remain as liabilities of the new UT of Jammu and Kashmir.
No. 48: Investments by State Governments
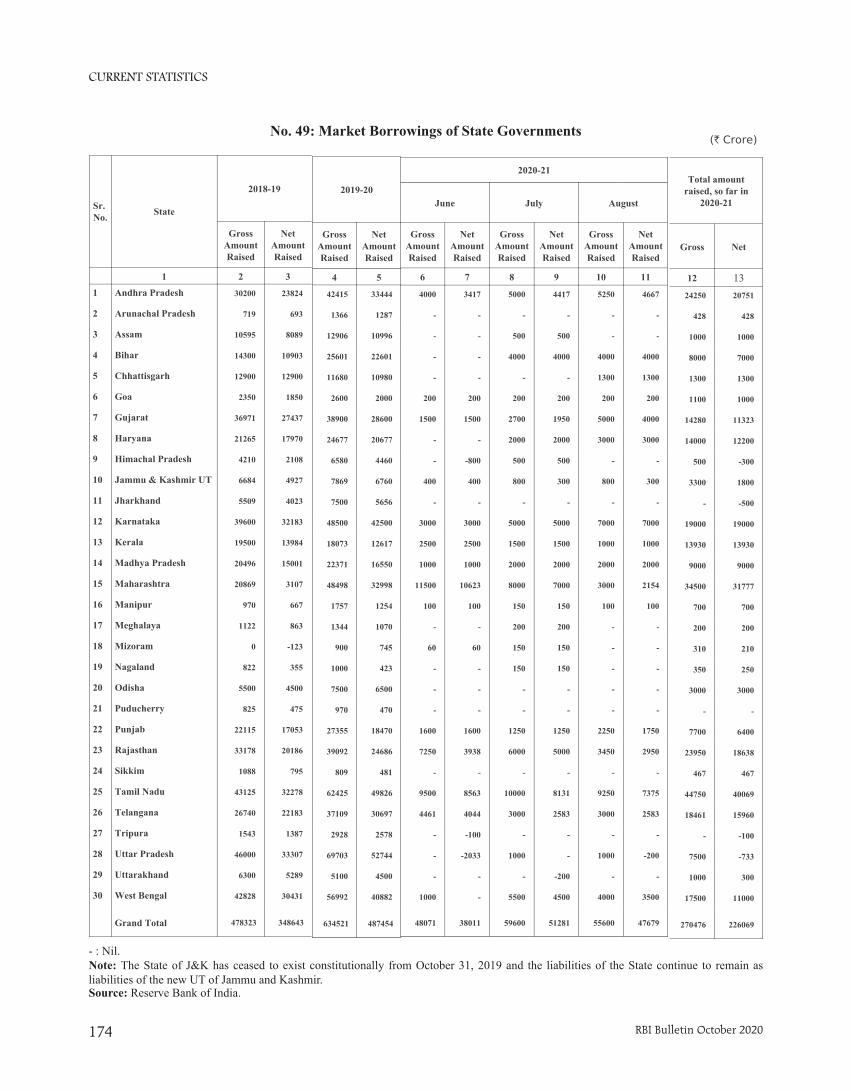
CURRENT STATISTICS
RBI Bulletin October 2020174
No. 49: Market Borrowings of State Governments(` Crore)
- : Nil.
Total amountraised, so far in
2020-21
Gross Net
12 1324250 20751
428 428
1000 1000
8000 7000
1300 1300
1100 1000
14280 11323
14000 12200
500 -300
3300 1800
- -500
19000 19000
13930 13930
9000 9000
34500 31777
700 700
200 200
310 210
350 250
3000 3000
- -
7700 6400
23950 18638
467 467
44750 40069
18461 15960
- -100
7500 -733
1000 300
17500 11000
270476 226069
Sr. No. State
2018-19
GrossAmountRaised
NetAmountRaised
1 2 3
1 Andhra Pradesh 30200 23824
2 Arunachal Pradesh 719 693
3 Assam 10595 8089
4 Bihar 14300 10903
5 Chhattisgarh 12900 12900
6 Goa 2350 1850
7 Gujarat 36971 27437
8 Haryana 21265 17970
9 Himachal Pradesh 4210 2108
10 Jammu & Kashmir UT 6684 4927
11 Jharkhand 5509 4023
12 Karnataka 39600 32183
13 Kerala 19500 13984
14 Madhya Pradesh 20496 15001
15 Maharashtra 20869 3107
16 Manipur 970 667
17 Meghalaya 1122 863
18 Mizoram 0 -123
19 Nagaland 822 355
20 Odisha 5500 4500
21 Puducherry 825 475
22 Punjab 22115 17053
23 Rajasthan 33178 20186
24 Sikkim 1088 795
25 Tamil Nadu 43125 32278
26 Telangana 26740 22183
27 Tripura 1543 1387
28 Uttar Pradesh 46000 33307
29 Uttarakhand 6300 5289
30 West Bengal 42828 30431
Grand Total 478323 348643
2020-21
June July August
GrossAmountRaised
NetAmountRaised
GrossAmountRaised
NetAmountRaised
GrossAmountRaised
NetAmountRaised
6 7 8 9 10 11
4000 3417 5000 4417 5250 4667
- - - - - -
- - 500 500 - -
- - 4000 4000 4000 4000
- - - - 1300 1300
200 200 200 200 200 200
1500 1500 2700 1950 5000 4000
- - 2000 2000 3000 3000
- -800 500 500 - -
400 400 800 300 800 300
- - - - - -
3000 3000 5000 5000 7000 7000
2500 2500 1500 1500 1000 1000
1000 1000 2000 2000 2000 2000
11500 10623 8000 7000 3000 2154
100 100 150 150 100 100
- - 200 200 - -
60 60 150 150 - -
- - 150 150 - -
- - - - - -
- - - - - -
1600 1600 1250 1250 2250 1750
7250 3938 6000 5000 3450 2950
- - - - - -
9500 8563 10000 8131 9250 7375
4461 4044 3000 2583 3000 2583
- -100 - - - -
- -2033 1000 - 1000 -200
- - - -200 - -
1000 - 5500 4500 4000 3500
48071 38011 59600 51281 55600 47679
Notes: 1. The State of J&K has ceased to exist constitutionally from October 31, 2019 and the liabilities of the State continue to remain as liabilities of the new UT of Jammu and Kashmir.
2019-20
GrossAmountRaised
NetAmountRaised
4 5
42415 33444
1366 1287
12906 10996
25601 22601
11680 10980
2600 2000
38900 28600
24677 20677
6580 4460
7869 6760
7500 5656
48500 42500
18073 12617
22371 16550
48498 32998
1757 1254
1344 1070
900 745
1000 423
7500 6500
970 470
27355 18470
39092 24686
809 481
62425 49826
37109 30697
2928 2578
69703 52744
5100 4500
56992 40882
634521 487454
Source : Reserve Bank of India.
No. 49: Market Borrowings of State Governments
- : Nil.Note: The State of J&K has ceased to exist constitutionally from October 31, 2019 and the liabilities of the State continue to remain as liabilities of the new UT of Jammu and Kashmir. Source: Reserve Bank of India.

CURRENT STATISTICS
RBI Bulletin October 2020 175
Explanatory Notes to the Current Statistics
Table No. 11.2& 6: Annual data are average of months.3.5 & 3.7: Relate to ratios of increments over financial year so far.4.1 to 4.4, 4.8,4.9 &5: Relate to the last friday of the month/financial year.4.5, 4.6 & 4.7: Relate to five major banks on the last Friday of the month/financial year.4.10 to 4.12: Relate to the last auction day of the month/financial year.4.13: Relate to last day of the month/ financial year7.1&7.2: Relate to Foreign trade in US Dollar.
Table No. 22.1.2: Include paid-up capital, reserve fund and Long-Term Operations Funds.2.2.2: Include cash, fixed deposits and short-term securities/bonds, e.g., issued by IIFC (UK).
Table No. 4Maturity-wise position of outstanding forward contracts is available at http://nsdp.rbi.org.in under ‘‘Reserves Template’’.
Table No. 5 Special refinance facility to Others, i.e. to the EXIM Bank, is closed since March 31, 2013.
Table No. 6 For scheduled banks, March-end data pertain to the last reporting Friday.2.2: Exclude balances held in IMF Account No.1, RBI employees’ provident fund, pension fund, gratuity and superannuation fund.
Table Nos. 7 & 113.1 in Table 7 and 2.4 in Table 11: Include foreign currency denominated bonds issued by IIFC (UK).
Table No. 8NM2 and NM3 do not include FCNR (B) deposits.2.4: Consist of paid-up capital and reserves.2.5: includes other demand and time liabilities of the banking system.
Table No. 9Financial institutions comprise EXIM Bank, SIDBI, NABARD and NHB. L1 and L2 are compiled monthly and L3 quarterly. Wherever data are not available, the last available data have been repeated.
Table No. 13Data against column Nos. (1), (2) & (3) are Final (including RRBs) and for column Nos. (4) & (5) data are Provisional (excluding RRBs)
Table No. 14Data in column Nos. (4) & (8) are Provisional.

CURRENT STATISTICS
RBI Bulletin October 2020176
Table No. 15 & 16
Data are provisional and relate to select 41 scheduled commercial banks, accounting for about 90 per cent of total non-food credit extended by all scheduled commercial banks (excludes ING Vysya which has been merged with Kotak Mahindra since April 2015).
Export credit under priority sector relates to foreign banks only.
Micro & small under item 2.1 includes credit to micro & small industries in manufacturing sector.
Micro & small enterprises under item 5.2 includes credit to micro & small enterprises in manufacturing as well as services sector.
Priority Sector is as per old definition and does not conform to FIDD Circular FIDD.CO.Plan.BC.54/04.09.01/2014-15 dated April 23, 2015.
Table No. 172.1.1: Exclude reserve fund maintained by co-operative societies with State Co-operative Banks2.1.2: Exclude borrowings from RBI, SBI, IDBI, NABARD, notified banks and State Governments.4: Include borrowings from IDBI and NABARD.
Table No. 24Primary Dealers (PDs) include banks undertaking PD business.
Table No. 30 Exclude private placement and offer for sale. 1: Exclude bonus shares.2: Include cumulative convertible preference shares and equi-preference shares.
Table No. 32Exclude investment in foreign currency denominated bonds issued by IIFC (UK), SDRs transferred by Government of India to RBI and foreign currency received under SAARC SWAP arrangement. Foreign currency assets in US dollar take into account appreciation/depreciation of non-US currencies (such as Euro, Sterling, Yen and Australian Dollar) held in reserves. Foreign exchange holdings are converted into rupees at rupee-US dollar RBI holding rates.
Table No. 341.1.1.1.2 & 1.1.1.1.1.4: Estimates.1.1.1.2: Estimates for latest months. ‘Other capital’ pertains to debt transactions between parent and subsidiaries/branches of FDI enterprises.Data may not tally with the BoP data due to lag in reporting.
Table No. 351.10: Include items such as subscription to journals, maintenance of investment abroad, student loan repayments and credit card payments.
Table No. 36 Increase in indices indicates appreciation of rupee and vice versa. For 6-Currency index, base year 2016-17 is a moving one, which gets updated every year. REER figures are based on Consumer Price Index (combined). Methodological details are available in December 2005 and April 2014 issues of the Bulletin.

CURRENT STATISTICS
RBI Bulletin October 2020 177
Table No. 37Based on applications for ECB/Foreign Currency Convertible Bonds (FCCBs) which have been allotted loan registration number during the period.
Table Nos. 38, 39, 40 & 41 Explanatory notes on these tables are available in December issue of RBI Bulletin, 2012.
Table No. 43
Part I-A. Settlement systems1.1.3: Tri- party Repo under the securities segment has been operationalised from November 05, 2018.
Part I-B. Payments systems 4.1.2: ‘Others’ includes e-commerce transactions and digital bill payments through ATMs, etc. 4.2.2: ‘Others’ includes e-commerce transactions, card to card transfers and digital bill payments through
ATMs, etc. 5: Available from December 2010. 5.1: includes purchase of goods and services and fund transfer through wallets. 5.2.2: includes usage of PPI Cards for online transactions and other transactions. 6.1: Pertain to three grids – Mumbai, New Delhi and Chennai. 6.2: ‘Others’ comprises of Non-MICR transactions which pertains to clearing houses managed by 21 banks.
Part II-A. Other payment channels
1: Mobile Payments – o Include transactions done through mobile apps of banks and UPI apps.o The data from July 2017 includes only individual payments and corporate payments initiated,
processed, and authorised using mobile device. Other corporate payments which are not initiated, processed, and authorised using mobile device are excluded.
2: Internet Payments – includes only e-commerce transactions through ‘netbanking’ and any financial transaction using internet banking website of the bank.
Part II-B. ATMs3.3 and 4.2: only relates to transactions using bank issued PPIs.
Part III. Payment systems infrastructure3: Includes ATMs deployed by Scheduled Commercial Banks (SCBs) and White Label ATM Operators (WLAOs). WLAs are included from April 2014 onwards.
Table No. 45(-): represents nil or negligibleThe revised table format since June 2016, incorporates the ownership pattern of State Governments Securities and Treasury Bills along with the Central Government Securities.State Government Securities include special bonds issued under Ujwal DISCOM Assurance Yojana (UDAY) scheme.Bank PDs are clubbed under Commercial Banks. However, they form very small fraction of total outstanding securities.The category ‘Others’ comprises State Governments, Pension Funds, PSUs, Trusts, HUF/Individuals etc.

CURRENT STATISTICS
RBI Bulletin October 2020178
Time series data of ‘Current Statistics’ is available at https://dbie.rbi.org.in. Detailed explanatory notes are available in the relevant press releases issued by RBI and other publications/releases of the Bank such as Handbook of Statistics on the Indian Economy.
The concepts and methodologies for Current Statistics are available in Comprehensive Guide for Current Statistics of the RBI Monthly Bulletin (https://rbi.org.in/Scripts/PublicationsView.aspx?id=17618)
Table No. 46GDP data is based on 2011-12 base. GDP data from 2019-20 pertains to the Provisional Estimates of National
Income released by Central Statistics Office on 29th May 2020. GDP for 2020-21 is from Union Budget 2020-21.
Data upto 2017-18 pertains to all States and Union Territories. From 2018-19 onwards, data is provisional and
pertains to 25 States only.
Total receipts and total expenditure exclude National Calamity Contingency Fund expenditure.
1 & 2: Data are net of repayments of the Central Government (including repayments to the NSSF) and State
Governments.
1.3: Represents compensation and assignments by States to local bodies and Panchayati Raj institutions.
2: Data are net of variation in cash balances of the Central and State Governments and includes borrowing
receipts of the Central and State Governments.
3A.1.1: Data as per RBI records.
3B.1.1: Includes borrowings through dated securities.
3B.1.2: Represent net investment in Central and State Governments’ special securities by the National Small
Savings Fund (NSSF).
3B.1.6: Include Ways and Means Advances by the Centre to the State Governments.
3B.1.7: Include Treasury Bills, loans from financial institutions, insurance and pension funds, remittances, cash
balance investment account.
Table No. 47SDF is availed by State Governments against the collateral of Consolidated Sinking Fund (CSF), Guarantee
Redemption Fund (GRF) & Auction Treasury Bills (ATBs) balances and other investments in government
securities.
WMA is advance by Reserve Bank of India to State Governments for meeting temporary cash mismatches.
OD is advanced to State Governments beyond their WMA limits.
Average amount Availed is the total accommodation (SDF/WMA/OD) availed divided by number of days for
which accommodation was extended during the month.
- : Nil.
Table No. 48CSF and GRF are reserve funds maintained by some State Governments with the Reserve Bank of India.
ATBs include Treasury bills of 91 days, 182 days and 364 days invested by State Governments in the primary
market.
--: Not Applicable (not a member of the scheme).

RECENT PUBLICATIONSRECENT PUBLICATIONS
RBI Bulletin October 2020 179
Name of Publication Price
India Abroad
1. Reserve Bank of India Bulletin 2020 `300 per copy (over the counter)`350 per copy (inclusive of postage)`4,200 (one year subscription - inclusive of postage)`3,150 (one year concessional rate*)`3,360 (one year subscription - inclusive of postage@)`2,520 (one year concessional rate@)
US$ 15 per copy (inclusive of postage) US$ 180 (one-year subscription)(inclusive of air mail courier charges)
2. Handbook of Statistics on the Indian States 2018-19
`650 (Normal)`700 (inclusive of postage)
US$ 24(inclusive of air mail courier charges)
3. Handbook of Statistics on the Indian Economy 2018-19
`600 (Normal)`650 (inclusive of postage)`450 (concessional)`500 (concessional with postage)
US$ 50(inclusive of air mail courier charges)
4. State Finances -A Study of Budgets of 2019-20
`600 per copy (over the counter)`650 per copy (inclusive of postal charges)
US$ 24 per copy(inclusive of air mail courier charges)
5. Report of the committee on Fuller Capital account Convertibility (Tarapore Committee Report II)
`140 per copy (over the counter)`170 per copy (inclusive of postal charges)
US$ 25 per copy(inclusive of air mail courier charges)
6. Banking Glossary (2012) `80 per copy (over the counter)`120 per copy (inclusive of postal charges)
7. Anuvad Ke Vividh Aayam (Hindi) `165 per copy (over the counter)`205 per copy (inclusive of postal charges)
8. Bank Me Rajbhasha Niti Ka Karyanvayan: Dasha Aur Disha (Hindi)
`150 per copy (over the counter)`200 per copy (inclusive of postal charges)
9. Reserve Bank of India Occasional Papers Vol. 38, 2017
`200 per copy (over the counter)`250 per copy (inclusive of postal charges)
US$ 18 per copy(inclusive of air mail courier charges)
10. Reserve Bank of India Occasional Papers Vol. 39, 2018
`200 per copy (over the counter)`250 per copy (inclusive of postal charges)
US$ 18 per copy(inclusive of air mail courier charges)
11. Reserve Bank of India Occasional Papers Vol. 40, No. 1, 2019
`200 per copy (over the counter)`250 per copy (inclusive of postal charges)
US$ 18 per copy(inclusive of air mail courier charges)
12. Perspectives on Central Banking Governors Speak (1935-2010) Platinum Jubilee
`1400 per copy (over the counter) US$ 50 per copy(inclusive of air mail courier charges)
Recent Publications of the Reserve Bank of India
Notes1. Many of the above publications are available at the RBI website (www.rbi.org.in).2. Time Series data are available at the Database on Indian Economy (http://dbie.rbi.org.in).3. The Reserve Bank of India History 1935-1997 (4 Volumes), Challenges to Central Banking in the Context of Financial Crisis and the Regional
Economy of India: Growth and Finance are available at leading book stores in India.* Discount of 25% is available for students, teachers/lecturers, academic/education institutions, public libraries and Booksellers in India provided
the proof of eligibility is submitted from institution.@ In order to promote electronic payments it has been decided to offer 20% discount to domestic subscribers who are willing to pay through NEFT.

RECENT PUBLICATIONSRECENT PUBLICATIONS
RBI Bulletin October 2020180
General Instructions
1. Publications once sold will not be taken back.
2. Publications will not be supplied on a consignment VPP basis.
3. Wherever concessional price is not indicated, a discount of 25 per cent is available for students, teachers/lecturers, academic/education institutions, public libraries and book sellers in India provided the proof of eligibility is submitted from the concerned institution. Back issues of the publication are generally not available.
4. The publications are available for sale (Monday to Friday), at Sales Section, Division of Reports and knowledge dissemination, Department of Economic and Policy Research, Reserve Bank of India, Amar Building, Ground Floor, Sir P. M. Road, Fort, P. B. No.1036, Mumbai - 400 001. The contact number of Sales Section is 022-2260 3000 Extn.: 4002, Email: [email protected].
5. Subscription should be made preferably by NEFT & forwarding letter enclosing NEFT details should be addressed to the Director, Division of Reports and knowledge dissemination, Department of Economic and Policy Research, Reserve Bank of India, Amar Building, Ground Floor, Sir P. M. Road, Fort, P. B. No.1036, Mumbai - 400 001.
Following information is required to be filled in NEFT form by you:
Beneficiary Name Department of Economic and Policy Research, RBI
Name of the Bank Reserve Bank of India
Branch and addess Fort, Mumbai
IFSC of Bank Branch RBIS0MBPA04
Type of Account Current Account
Account Number 41-8024129-19
Sender to reciver information Name of Subscriber........Subscriber No. ..........
6. Every endeavour will be made to despatch publications expeditiously. In case of rush of orders, dispatch will be executed on a first-come first-served basis. It may take a minimum of a month’s time to complete formalities and then to dispatch the available publications. Complaints regarding ‘non-receipt of publication’ may be sent within a period of 2 months.
7. Kindly send your subscription number, name, address, and email id to [email protected] enabling us to communicate with you in an efficient manner.