Ocean Drilling Program Initial Reports Volume 134
91
Collot, J.-Y., Greene, H. G., Stokking, L. B., et al., 1992 Proceedings of the Ocean Drilling Program, Initial Reports, Vol. 134 12. SITE 832 1 Shipboard Scientific Party 2 HOLE 832A Date occupied: 21 November 1990 Date departed: 23 November 1990 Time on hole: 1 day, 20 hr, 45 min Position: 14°47.78'S, 167°34.35'E Bottom felt (rig floor; m; drill-pipe measurement): 3100.6 Distance between rig floor and sea level (m): 11.30 Water depth (drill-pipe measurement from sea level, m): 3089.3 Total depth (rig floor; m): 3316.50 Penetration (m): 215.90 Number of cores (including cores with no recovery): 27 Total length of cored section (m): 215.90 Total core recovered (m): 146.26 Core recovery (%): 67.7 Oldest sediment cored: Depth below seafloor (m): 206.20 Nature: volcanic ash interbedded with clayey volcanic silts Age: Pleistocene Measured velocity (km/s): 1.610 HOLE 832B Date occupied: 23 November 1990 Date departed: 1 December 1990 Time on hole: 8 days, 18 hr, 45 min Position: 14°47.78'S, 167°34.35'E Bottom felt (rig floor; m; drill-pipe measurement): 3100.6 Distance between rig floor and sea level (m): 11.30 Water depth (drill-pipe measurement from sea level, m): 3089.3 Total depth (rig floor; m): 4207.30 Penetration (m): 1106.70 Number of cores (including cores with no recovery): 100 Total length of cored section (m): 962.30 Total core recovered (m): 450.95 Core recovery (%): 46.9 Oldest sediment cored: Depth below seafloor (m): 846.4 Nature: basaltic breccia with sandstone and siltstone Age: late Miocene Measured velocity (km/s): 2.350 1 Collot, J.-Y., Greene, H. G., Stokking, L. B., et al., 1992. Proc. ODP, Init. Repts., 134: College Station, TX (Ocean Drilling Program). Shipboard Scientific Party is as given in the list of participants preceding the contents. Principal results: We arrived at Site 832 on 21 November 1990 at 0645 Universal Time Coordinated (UTC). After 10 days and 15.5 hr on site drilling two holes (Holes 832A and 832B) we departed Site 832 at 2215 UTC on 1 December 1990. Because we penetrated into older sedi- mentary rocks sooner than expected in Hole 832B and were experi- encing good core recovery, we requested and received permission to drill past 700 meters below seafloor (mbsf). The early recovery of upper Pliocene or lower Pleistocene sediments at about 550 m suggested that the intra-arc basin of the central New Hebrides Island Arc may have formed earlier than most workers anticipated. We were unable to log Hole 832B as fully as desired because of infilling problems in the upper part of the hole, near the seafloor. Site 832 (proposed site IAB-1) is located on the flat intra-arc basin floor at 3089.3 meters below sea level (mbsl) in the central part of the North Aoba Basin (NAB), approximately 50 km northeast of the Queiros Peninsula of Espiritu Santo Island and 45 km due south of the smoking volcanic island of Santa Maria (Gaua). The NAB lies between uplifted bedrock masses of Espiritu Santo and Maewo islands and is separated from the northern Vanikolo summit basin by Santa Maria Island and from the South Aoba Basin (SAB) by the active volcanic island of Aoba. After a brief seismic reflection survey to confirm site location, we began drilling without problems. In Hole 832A we cored 215.9 mbsf and recovered 146.26 m of core for a recovery rate of 67.7%. We drilled Hole 832B to a total depth (TD) of 1106.7 mbsf, coring 962.3 m and recovering 450.95 m of core for a recovery rate of 46.9%. Seven lithostratigraphic units were identified in the cores collected at Site 832. Lithostratigraphic Unit I (0-206.2 mbsf in Hole 832A; 144.4-385.6 mbsf in Hole 832B) is a 385.6-m-thick series of Pleistocene volcanic clays, silts, and sands, and is subdivided into two subunits (Subunits IA and IB) based on differences in grain size. Subunit IA (0-141.0 mbsf) is a 141-m- thick zone of coarse vitric volcanic ashes interbedded with sandy to clayey volcanic silts. Subunit IB (141.0-206.2 mbsf in Hole 832A; 144.4-385.6 mbsf in Hole 832B) is a 244.6-m-thick unit similar to Subunit IA but with finer vitric ashes. Lithostratigraphic Unit II (385.6-461.5 mbsf) is a 75.9-m-thick Pleistocene sequence of sandstone, siltstone, and claystone largely volcanogenic in the upper part and more calcareous in the lower part. Unit II is a transitional unit between a more volcanic unit above and a more calcareous unit below. Lithostratigraphic Unit III (461.5-625.7 mbsf) is a 164.2-m-thick Pleistocene sequence of chalk, limestone, and calcareous mixed sedimentary rocks interbedded with vol- canic siltstone, sandstone, and sed-lithic breccia containing vol- canic clasts. The bottom of the unit is late Pliocene or early Pleistocene in age. Lithostratigraphic Unit IV (625.7-702.0 mbsf) is a 76.3-m-thick upper Pliocene or lower Pleistocene sequence of basaltic breccias with subordinate volcanic siltstones and sand- stones. Lithostratigraphic Unit V (702.0-865.7 mbsf) is a 163.7- m-thick upper Miocene to upper Pliocene sequence of foraminif- eral, nannofossil, calcareous, and silty limestone with some clayey siltstone, mixed sedimentary rocks, and vitric ash layers overlying a 1.5-m-thick basaltic breccia. Lithostratigraphic Unit VI (865.7- 952.6 mbsf) is a 86.9-m-thick, middle to upper(?) Miocene lithified volcanic sandstone that grades downward to coarser material. Lithostratigraphic Unit VII (952.6-1106.7 mbsf) is a 154.1-m-thick layer of lithified basaltic breccia with subordinate lithified volcanic sandstone, siltstone, and vitric ash. The top of the unit is latest early to earliest middle Miocene in age. Foraminifers and nannofossils were the best source of age information. Abundant to common, well-preserved foraminiferal and nannofossil assemblages were recovered between the seafloor 387
-
Upload
khangminh22 -
Category
Documents
-
view
3 -
download
0
Transcript of Ocean Drilling Program Initial Reports Volume 134

Collot, J.-Y., Greene, H. G., Stokking, L. B., et al., 1992Proceedings of the Ocean Drilling Program, Initial Reports, Vol. 134
12. SITE 8321
Shipboard Scientific Party2
HOLE 832A
Date occupied: 21 November 1990
Date departed: 23 November 1990
Time on hole: 1 day, 20 hr, 45 min
Position: 14°47.78'S, 167°34.35'E
Bottom felt (rig floor; m; drill-pipe measurement): 3100.6
Distance between rig floor and sea level (m): 11.30
Water depth (drill-pipe measurement from sea level, m): 3089.3
Total depth (rig floor; m): 3316.50
Penetration (m): 215.90
Number of cores (including cores with no recovery): 27
Total length of cored section (m): 215.90
Total core recovered (m): 146.26
Core recovery (%): 67.7
Oldest sediment cored:Depth below seafloor (m): 206.20Nature: volcanic ash interbedded with clayey volcanic siltsAge: PleistoceneMeasured velocity (km/s): 1.610
HOLE 832B
Date occupied: 23 November 1990
Date departed: 1 December 1990
Time on hole: 8 days, 18 hr, 45 min
Position: 14°47.78'S, 167°34.35'E
Bottom felt (rig floor; m; drill-pipe measurement): 3100.6
Distance between rig floor and sea level (m): 11.30
Water depth (drill-pipe measurement from sea level, m): 3089.3
Total depth (rig floor; m): 4207.30
Penetration (m): 1106.70
Number of cores (including cores with no recovery): 100
Total length of cored section (m): 962.30
Total core recovered (m): 450.95
Core recovery (%): 46.9
Oldest sediment cored:Depth below seafloor (m): 846.4Nature: basaltic breccia with sandstone and siltstoneAge: late MioceneMeasured velocity (km/s): 2.350
1 Collot, J.-Y., Greene, H. G., Stokking, L. B., et al., 1992. Proc. ODP,Init. Repts., 134: College Station, TX (Ocean Drilling Program).
Shipboard Scientific Party is as given in the list of participants precedingthe contents.
Principal results: We arrived at Site 832 on 21 November 1990 at 0645Universal Time Coordinated (UTC). After 10 days and 15.5 hr on sitedrilling two holes (Holes 832A and 832B) we departed Site 832 at 2215UTC on 1 December 1990. Because we penetrated into older sedi-mentary rocks sooner than expected in Hole 832B and were experi-encing good core recovery, we requested and received permission todrill past 700 meters below seafloor (mbsf). The early recovery ofupper Pliocene or lower Pleistocene sediments at about 550 msuggested that the intra-arc basin of the central New Hebrides IslandArc may have formed earlier than most workers anticipated. Wewere unable to log Hole 832B as fully as desired because of infillingproblems in the upper part of the hole, near the seafloor.
Site 832 (proposed site IAB-1) is located on the flat intra-arcbasin floor at 3089.3 meters below sea level (mbsl) in the centralpart of the North Aoba Basin (NAB), approximately 50 kmnortheast of the Queiros Peninsula of Espiritu Santo Island and 45km due south of the smoking volcanic island of Santa Maria(Gaua). The NAB lies between uplifted bedrock masses of EspirituSanto and Maewo islands and is separated from the northernVanikolo summit basin by Santa Maria Island and from the SouthAoba Basin (SAB) by the active volcanic island of Aoba.
After a brief seismic reflection survey to confirm site location, webegan drilling without problems. In Hole 832A we cored 215.9 mbsfand recovered 146.26 m of core for a recovery rate of 67.7%. Wedrilled Hole 832B to a total depth (TD) of 1106.7 mbsf, coring 962.3m and recovering 450.95 m of core for a recovery rate of 46.9%.
Seven lithostratigraphic units were identified in the corescollected at Site 832. Lithostratigraphic Unit I (0-206.2 mbsf inHole 832A; 144.4-385.6 mbsf in Hole 832B) is a 385.6-m-thickseries of Pleistocene volcanic clays, silts, and sands, and issubdivided into two subunits (Subunits IA and IB) based ondifferences in grain size. Subunit IA (0-141.0 mbsf) is a 141-m-thick zone of coarse vitric volcanic ashes interbedded with sandyto clayey volcanic silts. Subunit IB (141.0-206.2 mbsf in Hole832A; 144.4-385.6 mbsf in Hole 832B) is a 244.6-m-thick unitsimilar to Subunit IA but with finer vitric ashes. LithostratigraphicUnit II (385.6-461.5 mbsf) is a 75.9-m-thick Pleistocene sequenceof sandstone, siltstone, and clay stone largely volcanogenic in theupper part and more calcareous in the lower part. Unit II is atransitional unit between a more volcanic unit above and a morecalcareous unit below. Lithostratigraphic Unit III (461.5-625.7mbsf) is a 164.2-m-thick Pleistocene sequence of chalk, limestone,and calcareous mixed sedimentary rocks interbedded with vol-canic siltstone, sandstone, and sed-lithic breccia containing vol-canic clasts. The bottom of the unit is late Pliocene or earlyPleistocene in age. Lithostratigraphic Unit IV (625.7-702.0 mbsf)is a 76.3-m-thick upper Pliocene or lower Pleistocene sequence ofbasaltic breccias with subordinate volcanic siltstones and sand-stones. Lithostratigraphic Unit V (702.0-865.7 mbsf) is a 163.7-m-thick upper Miocene to upper Pliocene sequence of foraminif-eral, nannofossil, calcareous, and silty limestone with some clayeysiltstone, mixed sedimentary rocks, and vitric ash layers overlyinga 1.5-m-thick basaltic breccia. Lithostratigraphic Unit VI (865.7-952.6 mbsf) is a 86.9-m-thick, middle to upper(?) Miocene lithifiedvolcanic sandstone that grades downward to coarser material.Lithostratigraphic Unit VII (952.6-1106.7 mbsf) is a 154.1-m-thicklayer of lithified basaltic breccia with subordinate lithified volcanicsandstone, siltstone, and vitric ash. The top of the unit is latestearly to earliest middle Miocene in age.
Foraminifers and nannofossils were the best source of ageinformation. Abundant to common, well-preserved foraminiferaland nannofossil assemblages were recovered between the seafloor
387

SITE 832
and 840 mbsf in both Holes 832A and 832B. Below this depth onlyoccasional samples of moderately to poorly preserved foraminifersand nannofossils were reported. Two barren intervals were iden-tified (856-923 mbsf and 972-1106 mbsf). Ages assigned to sedi-ments at Site 832 are as follows: Pleistocene (0 to —600 mbsf), latePliocene or early Pleistocene(?) (600-711 mbsf), late Pliocene(711-740 mbsf), early Pliocene to late Miocene (740-856 mbsf),earliest middle Miocene (924-962 mbsf), and latest early Miocene(962 to —972 mbsf). However, the presence of reworked speci-mens of the larger benthic foraminifers and calcareous nannofos-sils in samples below 952 mbsf suggests that the host rock may beyounger than early Miocene.
Sediment accumulation rates determined from the biostrati-graphic data indicate an important change at —700 mbsf where therates vary from less than 100 m/m.y. below this depth to greaterthan 286 m/m.y. above this depth. Interpretations of seismicreflection profiles and lithostratigraphic examinations of coresfrom Hole 832B indicate an unconformity at about 700 mbsf, butthe biostratigraphic data do not indicate a hiatus that would belonger than about 0.2 m.y. Between the lower Pliocene at 856 mbsfand the lowermost Miocene at 952 mbsf there may be anotherunconformity.
Correlation between biostratigraphic and paleomagnetic datasuggests that the lower boundary of the Olduvai is near 707 mbsfand consequently the Matuyama-Brunhes transition (early Pleis-tocene) is missing between 640 and 700 mbsf. Several othermagnetic reversals that were observed between 707 mbsf and thetotal depth (TD) of Hole 832B appear to correlate with Pliocene tolate Miocene ages. Benthic foraminifers, where found, indicatethat sediments of Site 832 were deposited in the lower bathyalzone.
More than 10 volcanic ash layers >3 cm thick and several tensof reworked volcanic ash layers were recovered at Site 832.Fragments of clinopyroxene-phyric basalt or ankaramite werefound in the cores between 395 and 1100 mbsf and show vesiculartexture and little oxidation, indicating that they underwent littleweathering or seawater alteration before burial. Between 1050 and1100 mbsf, the altered volcanic breccia of lithostratigraphic UnitVII consists of clasts of scoria and lavas within a matrix ofchloritized glass, clay minerals, and zeolite. This volcanic brecciawas probably derived from submarine volcanism, as suggested bythe abundant alteration products contained in the matrix.
Structural studies indicate that deformation observed in coresfrom Site 832 appears to result from small- to large-scale slumping,normal microfaulting, and compaction processes. Five tectonicunits were identified. Tectonic Unit A (0-415 mbsf) includeslithostratigraphic Unit I and the upper part of Unit II and ischaracterized by subhorizontal bedding, rare slump features,vertical normal microfaults, contorted bedding, and load featuresthat developed in a finely laminated siltstone. Tectonic Unit B(415-626 mbsf) includes the lower part of lithostratigraphic Unit IIand all of lithostratigraphic Unit III, which is characterized byabundant slump folds. Tectonic Unit C (696-702 mbsf) corre-sponds to lithostratigraphic Unit IV, which has laminated siltstonebeds dipping 30°-60°, suggesting the presence of slumps. TectonicUnit D (702-866 mbsf) corresponds to lithostratigraphic Unit Vand exhibits mainly horizontal bedding, a few veins filled withgypsum, and normal microfaults with well-developed slickensides.Some sigmoidal features oblique to the bedding are interpreted asforming in response to bedding-parallel extension. Tectonic Unit E(866-1107 mbsf) corresponds to lithostratigraphic Unit VI and VIIand is characterized by rarely observable bedding that dips be-tween 20° and 40°; microfaults and an overturned layer areindicative of slumping.
The concentrations of all measured solutes at Site 832 rangewidely, particularly those of calcium (1.9-215.9 mM), magnesium(0-50.6 mM), sodium (344-501 mM), potassium (2.3-15.2 mM),and chloride (551-742 mM). Each solute exhibits distinct maximaand minima, and the calcium minimum corresponds to the maximain the concentrations of other solutes. The changes in concentra-tions probably result from diagenetic alteration of volcanogenicmaterial and from precipitation of authigenic carbonate and phos-phate minerals. Sulfate concentration decreases to 0.6 mM in theupper 40 mbsf, but exhibits two maxima at 520.7 mbsf (23.8 mM)
and 802.3 mbsf (22.9 mM), which correspond to the calciumminimum and the sodium, potassium, magnesium, and chloridemaxima. Accompanying the decrease in sulfate at approximately75 mbsf, resulting from sulfate reduction, are maxima of phos-phate, ammonia, methane, and alkalinity. These maxima probablyreflect organic matter diagenesis and the solutes may provide asource of phosphate and bicarbonate for the authigenic minerals.Organic carbon contents are low, mostly less than 0.5%, but rapidsediment accumulation rates cause high concentrations of thevarious solutes.
Physical properties measurements at Site 832 were nearlyconstant from the mudline to below 300 mbsf. This uniformity andconsistently low shear strength values (around 50 kPa from 0 to260 mbsf) indicate underconsolidation, which is typical of an areaof rapid sedimentation. Porosity and water content have highvalues that vary from 50% to 80%. Silty ash layers in lithostrati-graphic Unit I are the most porous, least consolidated, and containthe greatest amount of fluid of all material at Site 832. Below 300mbsf, downhole porosity and water content decrease but maintainrelatively high values that rarely fall below 40% and 25%. Bulkdensity increases from 1.60 to 2.00 Mg/m3 in the upper 300 mbsf ofHole 832B and varies between 2.00 and 2.40 Mg/m3 from 300 to1103 mbsf. A distinct decrease in porosity (—20%) and an increasein bulk density (>2.50 Mg/m3) are associated with the breccias andcoarse sandstones in lithostratigraphic Units II and IV, between300-400 mbsf and 600-700 mbsf. Sonic velocities are generallylow in the upper silty ash of lithostratigraphic Unit I, where theyrange from 1520 meters per second (m/s) near the seafloor to 1600m/s at 260 mbsf. Velocity varies between 2000 and 3500 m/s from260 mbsf to TD of Hole 832B at 1103.3 mbsf. However, theinterval between 625 and 702 mbsf exhibits an increase in velocityto over 4000 m/s, which correlates with a sharp bulk densityincrease and the presence of a volcanic sandstone horizon inlithostratigraphic Unit IV.
Because of deteriorating hole conditions, including bridgingand rapid infilling from the upper parts, the complete complementof logging tools could not be used. However, the geophysicalstring and the formation microscanner were run and producedgood data.
Initial heat-flow analyses indicate that a high thermal gradientexists within the intra-arc basin and this, along with porous andfractured volcaniclastic rocks, caused the anomalous alterationand diagenesis reported above. The volcaniclastic rocks encoun-tered at this site are surprisingly unlithified with the exception ofisolated layers, as indicated by the high porosity and watercontent. At one point during the logging operations, high-pressurewater flow occurred through the drill string, which is believed to bethe result of a highly pressured, highly permeable formationalsalt-water layer.
BACKGROUND AND OBJECTIVES
Site 832 is the first of two sites (Sites 832 and 833) locatedwithin the intra-arc basin of the central New Hebrides IslandArc (Vanuatu). The site is located on the flat basin floor at3089.3 mbsl in the north central part of the North Aoba Basin(NAB), approximately 50 km northeast of the northern tip ofthe Queiros Peninsula of Espiritu Santo Island and 45 km duesouth of the active volcanic island of Santa Maria (Fig. 1).
The NAB is part of a broad arc platform with substantialintra-arc basins, known collectively as the Central Basins ofVanuatu (Fig. 2). The Central Basins lie between the upliftedbedrock masses of Malakula and Espiritu Santo islands (theWestern Belt) on one side, and Pentecost and Maewo islands(the Eastern Belt) on the other. The active volcanic island ofAoba divides the basin into two major physiographic andsedimentary basins, the North Aoba Basin, and the SouthAoba Basin (SAB) (Katz, 1981) (Fig. 1). The Central Basinsare primary depocenters, being filled with detritus transportedfrom the islands and with planktonic biogenic material.
The NAB and SAB were first described as a single inter-arcbasin (Karig and Mammerickx, 1972) and then as a late-stage
388

SITE 832
14°S
15°
16C
North FijiMaewo Island Basin
827
lltfr~~®, iEspiritu Santo Island829 ( y (
Southd'EntrecasteauxChain
North Loyalty Basin
166°E 167° 168°
Figure 1. Bathymetric map of intra-arc basin (Central Basins) area of the central New Hebrides Island Arc showing location of Leg 134 sites.Solid line in North Aoba Basin is location of seismic reflection profile, a line drawing of which is shown in Figure 4. Bold line with teeth indicatesapproximate position of subduction zone; teeth are on upper plate. Bathymetry (in meters) modified after Chase and Seekins (1988).
389

SITE 832
14°S
16'
W7Z,North Aoba Basin
Espiritu Santo) Island
WousilBank * East ^ant0 &
lo lλ 1
Malakula Basin
South
Aoba
% XsPasil? y Pentecost I.
km *5S3^fr167°E 168 C
Figure 2. Sedimentary (structural) basins of the central New HebridesIsland Arc (Vanuatu) summit platform area. Modified after Greeneand Johnson (1988). Bathymetry in meters.
extensional feature (Luyendyk et al., 1974). Ravenne et al.(1977) considered these basins to be part of a nearly continu-ous "median sedimentary basin" of the New Hebrides IslandArc. Carney and Macfarlane (1980) described the two basinsas an asymmetrical intra-arc basin containing thick deposits ofMiocene to Pliocene sediments. Katz (1981) estimates asedimentary fill more than 2 km thick based on a 1972geophysical investigation by ORSTOM (France) and suggeststhat each basin contains different rock types deposited underdifferent sedimentary conditions. Gravity and seismic refrac-tion data indicate that the Central Basins formed on 12- to13-km-thick crust (Collot and Fisher, 1988). This contrastswith a 25-km-thick crust in the southern part of the arc, andCollot and Fisher (1988) propose this as an explanation for theunusually great depths of the basins. These authors furthersuggest that the crust of the Central Basins may have origi-nated either as a trapped piece of oceanic crust or from crustalthinning by extension.
Many hypotheses have been set forth to explain the for-mation of the Central Basins and of the islands and ridges thatborder them (e.g., Dickinson, 1973; Chase, 1971; Pascal et al.,1973; Falvey, 1975; Coleman and Packham, 1976; Ravenne etal., 1977; Carney and Macfarlane, 1977, 1978, 1980, 1982,1985; Katz, 1988). One school of thought supposes that areversal of subduction polarity during the late middle Mio-cene, from a west-dipping subduction of the Pacific plate alongthe Vitiaz Trench to the present underriding of the Australia-India plate at the New Hebrides Trench, formed the basins(Chase, 1971; Carney and Macfarlane, 1978, 1980; Kroenke,1984; Macfarlane et al., 1988). Other workers propose that noshift in subduction direction has occurred and that the presentarc configuration is the result of a continuous eastwardconvergence with variation in the steepness of the Benioffzone (Luyendyk et al., 1974; Carney and Macfarlane, 1977;Hanus and Vanek, 1983; Katz, 1988). Hanus and Vanek (1983)conclude, on the basis of the distribution of earthquakefocuses along the New Hebrides Benioff zone, that twodifferently inclined slabs exist at intermediate depths. Theyargue that these slabs were produced from two consecutivesubduction cycles of the same polarity and that these twocycles can explain the formation of the three belts of volcanicislands that make up the New Hebrides Island Arc. In asimilar manner, Louat et al. (1988) conclude that only east-ward subduction and a steepening Benioff zone are responsi-ble for the formation of the various volcanic belts and of theNAB and SAB.
Collot et al. (1985) used the model of Chung and Kanamori(1978) to explain the uplift of the Western and Eastern beltsand the depression of the intra-arc basins. The d'Entrecast-eaux Zone (DEZ) collision applied pressure to the westernedge of what Chung and Kanamori (1978) would call asemi-infinite elastic plate; upward loading due to the buoyancyof the subducting DEZ caused the buckling of the CentralBasins area and the uplift of the Western Belt only. Collot etal. (1985) refined this model to a finite plate by having theEastern Belt islands break along faults along their easternflanks, which caused these islands to uplift as well. Geologicallong-range imaging asdic (GLORIA) data, recently collectedby the South Pacific Applied Geosciences Commission (SO-PAC), and Seabeam bathymetric data, collected by the Officede la Recherche Scientifique et Technique Outre-Mer (ORS-TOM), show thrust sheets along the base of the eastern flankof the Eastern Belt, which suggests that compressional stressis transmitted completely across the arc.
The islands of Vanuatu are divided geologically into threedifferent provinces based on three separate episodes of vol-canism: the Western Belt, the Eastern Belt, and the CentralChain. Volcanism took place between the late Oligocene andearly middle Miocene in the Western Belt, between the lateMiocene and Pliocene in the Eastern Belt, and between thelate Miocene and Holocene in the Central Chain (Mitchell andWarden, 1971; Mallick, 1973).
The sequence of Eastern Belt rocks underlies horsts thatsupport Maewo and Pentecost islands (Mallick and Neef,1974). The older rocks of this belt (Sighotara Group andTafwutmuto Formation on Maewo) consist of lower to upperMiocene volcaniclastic rocks and conglomerate (Fig. 3). OnMaewo, they contain clasts of terrigenous lava with island-arctholeiitic affinities (Carney and Macfarlane, 1982). Overlyingthese older sediments are upper Miocene to middle Plioceneisland-arc rocks (Maewo Group) of transitional calc-alkaline/tholeiitic composition. On Maewo Island these are both in-tergradational with and succeeded unconformably by upperMiocene to upper Pliocene Globigerinα ooze of the MarinoFormation. These abyssal rocks were uplifted and eroded
390

SITE 832
o-
_
-
5
-
10-
-
-
-
15-
-
20-
-
25-
-
•
Ple
i
Φ
ioce
r
CL
cene
g
goc
ene
O
to
σj
<D
Φ
JO
> •
COΦ
Φ
—
mid
dle
early
late
PZ
N23
N22
N21N?0
N19
N18
N17
N16
N15
N14N13
N12
N11
N10
N9
N8
N7
N6
N5
N4
I
Espiritu Santo
Eastern Plateau Limestones
TawoliFormation
Pialapa and WailapaFormations
llava Volcanic Complex; Kerevinopu Formation;Wambu and Matanwai Divisions; Pua, J^eteao,-and Pelapa Formations
Kerewai DivisionOra Limestone Formation
Buvo, Batekala, andVakola Divisions
Maewo
Raised Limestone Group
V/////////////7//////ANasawa Formation
//77/777/7/7//////
MarinoFormation
TafwutmutoFormation
SaravaFormation
SighotaraGroup
WustoroghaFormation
- 0
- 1 0
r 15
- 2 0
- 2 5
Figure 3. Principal stratigraphic units of Espiritu Santo Island (Western Belt) and Maewo Island (Eastern Belt) with Neogene time scale andplanktonic foraminiferal zones (PZ) from Berggren et al. (1985b). Modified after Macfarlane et al. (1988).
during the middle to late Pliocene. Deposition of NasawaFormation calcarenites and calcilutites followed, and MaewoIsland also has a partial cap of Quaternary raised reef lime-stones (Macfarlane et al., 1988).
The Central Chain is the presently active volcanic arc,which is as old as 5.8 Ma in the southern part of the NewHebrides Island Arc, but Pleistocene in age in the central part(Colley and Ash, 1971; Bellon et al., 1984). Rocks of this chainconsist primarily of basalt and andesite with some dacite.These rocks show a varied alkali content ranging from low-potassium tholeiite to high-potassium calc-alkaline rocks (Car-ney et al., 1985). Ankaramitic and picritic lavas are commonon Ambrym and Aoba islands (Gorton, 1974). Carney andMacfarlane (1982) and Macfarlane et al. (1988) conclude fromage dates that initial volcanism of the Central Chain was
contemporaneous, at least in part, with volcanism in theEastern Belt.
The rocks of the Western Belt are exposed on the islands ofMalakula and Espiritu Santo islands. Older rocks (volcanicrocks of Espiritu Santo Island) of this belt consist of upperOligocene to middle Miocene submarine calc-alkaline lava andassociated volcaniclastic rocks that are intruded by late-stagegabbro, andesite, and microdiorite stocks. East of the mainvolcanic axis of the belt, middle Miocene graywacke fillsgrabens (summit basins) caused by block faulting of theseOligocene and Miocene rocks. A major middle Mioceneunconformity truncates these basinal rocks. On Espiritu SantoIsland, the Tawoli Formation overlies this unconformity andconsists of shallow marine sediments, which include terrige-nous clasts that grade upward into deeper water sediments.
391

SITE 832
Uplifted Quaternary reef limestones cover the older se-quences of rocks (Macfarlane et al., 1988).
The North Aoba Basin has been described as a half graben,tilted to the east (Katz, 1988; Fisher et al., 1988), althoughisland structure (Carney and Macfarlane, 1982) and structuremapped along the island shelves and shallow slopes indicate itis a graben. The basin is filled with at least 5 km of sedimen-tary deposits (Holmes, 1988). In the central part of the basin,seismic reflection profiles (Fisher et al., 1988; Greene andJohnson, 1988) do not show acoustic basement, and the floorof the sedimentary basin cannot be determined from thesedata (Fig. 4).
On the basis of dredge samples and correlation of acousti-cal units with island geology, the oldest rocks in NAB appearto be upper Oligocene to lower middle Miocene volcanic rocksthat underlie the west slope of the basin (unit E in Fig. 4), andmiddle Miocene volcaniclastic graywacke and limestone (unitD in Fig. 4) (Greene and Johnson, 1988; Johnson et al., 1988).Unit C in Figure 4 is interpreted as a gently faulted sequenceof probable upper Miocene calcarenite more than 1.8 kmthick, which laps onto the east and west flanks of the basin.Dredge samples collected along the northwestern flank ofMaewo Island where acoustic units D and C crop out (DR-20,Fig. 4) are volcanic sandstone and mudstone, generally com-posed of vitric and crystal ash with scattered foraminifers andother skeletal debris (Johnson et al., 1988). Foraminifersindicate ages from middle-late Miocene to Pliocene, withsome ranging into Pleistocene, thus correlating with the Mi-ocene to Pliocene Marino Formation and Maewo Group onMaewo Island (Fig. 3). Another 0.8 km of uppermost Plioceneand lowermost Pleistocene calcarenite and calcilutite (unit Bin Fig. 4) overlie the upper Miocene sedimentary rocks of
acoustic unit C, as indicated by dredge samples from north-western Maewo that correlate with the late Pliocene and earlyPleistocene Nasawa Formation of northern Maewo Island(Johnson et al., 1988). These rocks are, in turn, overlain by 0.8km of Quaternary volcanic ash and pelagic sediments (unit Ain Fig. 4) in the central area of the physiographic basin(Johnson and Greene, 1988). The flanks of the basin arecovered by 10-100 m of unstable Quaternary slope sediments(slumps in Fig. 4). This thick sequence of basin fill laps ontothe east and west flanks of the basin, and the younger basinalrocks become less extensive through time, indicating eitherrelative elevation of the basin flanks or depletion of sedimentinput, or both. Thus, the basin's structural relief (deepening)grew contemporaneously with sediment infilling.
As noted by many previous authors (e.g., Mallick, 1975;Carney and Macfarlane, 1977; Carney et al., 1985), the centralNew Hebrides Island Arc is a product of multiple phases ofarc evolution. Seismic reflection profiles (Fisher, et al., 1988;Greene and Johnson, 1988) indicate that the Central Basinsare a product of four (numbered 1 through 4 in Fig. 4)tectono-sedimentary phases separated by unconformities, al-though the relationships tend to be more conformable towardthe center of the Central Basins. In addition to the majorhorsts (Espiritu Santo, Malakula, Maewo, and Pentecostislands) and major grabens (NAB and SAB), smaller subsid-iary fault blocks rose and subsided, alternately allowingerosion and deposition. Along the eastern shelf of EspirituSanto Island a fault block defines East Santo Basin (Fig. 2).This block is downdropped to the east and is separated fromNAB by a fault-controlled structural ridge capped by reefs.This block is inferred to be a graben or half graben thataccumulated sediments to thicknesses of approximately 2 km.
Site 832 Site 833USGS line 20A
2100 hri
EasternNorth AobaBasin fault
Figure 4. Line drawing of single-channel seismic reflection profile USGS L6-82-SP line 20A showing structure and acoustical stratigraphy of theNorth Aoba Basin. Letters relate to estimated age of acoustic units: A = Quaternary; B = uppermost Pliocene to lowermost Pleistocene; C =upper Miocene; D = middle Miocene; E = upper Oligocene to middle Miocene. Circled numbers refer to unconformities. Dredge locations areshown as heavy dashed lines with numbers prefixed by DR; numbers refer to dredge samples described by Johnson et al. (1988). Approximatelocation of Sites 832 and 833 are shown. Location of profile is indicated in Figure 1. Modified after Greene and Johnson (1988).
392

SITE 832
14°45'S
14°50' ~
MCS trackline andshotpoint numberSCS trackline andshotpoint number
167°30'E 167°35'
Figure 5. Trackline map showing the locations of Site 832, single-channelseismic lines 21 and 22, as well as migrated multichannel seismic lines 19(USGS, L5-82-SP) and 41 (French Multipso, C1-87-SP).
The East Santo Basin is likely a subsiding step block; theentire basin fill is layered almost horizontally and the presentseabed has a low gradient of 2.5° slope.
The presence of erosional and buttress unconformities inthe Central Basins attests that vertical tectonism elevated anddepressed local horsts and grabens. In addition to the verticaltectonics, transcurrent motion divided the Central Basinsthrough arc-transverse faulting and extrusion of volcanicrocks at Aoba and Ambrym islands (Greene et al., 1988). Thissegmentation of the Central Basins appears to be the result ofthe collision of the DEZ with the New Hebrides Island Arc.Onset of the DEZ collision resulted in the uplift of the WesternBelt islands that is reflected in a buttress unconformity withinthe Central Basins. Unconformity 3 (Fig. 4) is thought torepresent the approximate time of collision and thus is themajor objective for Site 832.
The principal objectives of drilling at Site 832 are closelyrelated to those of Site 833, as correlation between these twoholes is necessary to determine basin-wide sedimentary andtectonic events. These objectives are as follows:
1. To determine if the central New Hebrides Island Arc(Vanuatu) is a product of cyclic arc volcanism and tectonismsince the Oligocene, with the axis of volcanism shifting at leastthree times, from the Western Belt to the Eastern Belt to theCentral Chain; and to refine the relationship of the volcanismto changing subduction direction and angles.
2. To determine if the thick sedimentary sequence of theintra-arc basin formed as a result of uplift of the westernmargin by the end of the middle Miocene and uplift of theeastern margin starting from the middle Pliocene, and toestablish whether the basin floor was a sloping platform formost of its history or whether it evolved rapidly into its deepdownbowed (graben) form during the Quaternary.
3. To determine the role of extraneous events, such as arcpolarity reversals and collision with ridges, in the formation ofthe intra-arc basin in light of the major differences betweenthis arc-platform complex and other more "standard" vol-canic arcs such as Tonga, Kermadec, and the Marianas.
SEISMIC STRATIGRAPHY
Multichannel Seismic DataMultichannel seismic line 19 crosses east-west over the
North Aoba Basin (Fig. 5), and the whole line (not shownhere) reveals that the older fill in this basin has been depressedinto a broad syncline that trends north-south; the younger,horizontally stratified basin fill laps with an angular unconfor-mity onto the sides of this syncline (Fig. 6). The unconformity,about 700 mbsf at Site 832, reveals abrupt development ofrelief within the arc-summit areas that flank the basin on theeast and west. One explanation for this relief is that the basinbegan to subside when stress from the collision of the Northd'Entrecasteaux Ridge and the arc intensified sufficiently toaffect the intra-arc Aoba Basin. This time of heightened stressdoes not necessarily coincide with the inception of the colli-sion. The rapidity of relief development is apparent from thenear absence of offlap sequences along the west basin flankand is borne out by the Pleistocene and Pliocene(?) age of the700 m of sediment over the unconformity that were recoveredat the drill site.
Multichannel seismic sections reveal that the seafloor overthe west flank of the basin has locally irregular morphology;this irregularity may signify mass wasting of west-flank rocksthat began as a consequence of basin deepening. Mass wastingapparently affects rock bodies that are as thick as 500 m. Thismass wasting may explain the origin of the coarse volcanicbreccia that was found during drilling to directly overlie theunconformity in the basin.
Water over the drill site is about 3000 m deep; even so,velocity information derived from seismic reflection and seis-mic refraction data indicate that, in the upper 300 m of thewell-bedded basin fill, the acoustic velocity does not differsignificantly from that of seawater, indicating very unconsol-idated sediment. In fact, many of the volcanic ash-rich layersin the upper 300 m of the hole were unconsolidated anddescribed as "soupy" in core descriptions (see "Lithostratig-raphy" section, this chapter).
Multichannel seismic line 19 crosses over Site 832 andreveals the angular bedding intersection at the unconformitythat was the main target at this site (Figs. 5 and 6). Strong,parallel reflections from the shallow part of the basin fill lapprogressively onto the western basin flank. Below the un-conformity is a thin rock body that primarily returns weakreflections, which parallel the seismic events from beds thatmake up the basin fill below the unconformity. This weaklyreflective unit thins toward the basin center. Rocks belowthe unconformity return mainly weak, discontinuous reflec-tions.
Single-Channel Seismic DataSingle-channel seismic reflection data were collected over
Site 832, using two 80-in.3 water guns for the source and astreamer that has a 100-m-long active section. Aboard-shipprocessing included predictive deconvolution, bandpass filter-ing, and automatic gain control. Velocity data used to convertdepth in the hole to traveltime come primarily from the soniclog and partly from physical properties measurements, whichwere used where well logs are not available, from the part ofthe hole shallower than 275 m.
Site 832 lies just west of the intersection of single-channelseismic lines 21 and 22 that were collected aboard ship (Figs.5, 7, and 8). These seismic lines show substantially similaracoustic images of the basin fill, but these images differ fromthat presented by the multichannel seismic section (Fig. 6) in
393

SITE 832
MCS Iine19
Shotpoints
2.5 km
Figure 6. Part of migrated multichannel seismic line 19 (USGS, L5-82-SP) that crosses the arc near Site 832.
that the single-channel image of the unconformity includesmainly discontinuous reflections, whereas the multichannelreflection from the unconformity is strong and continuous.Single-channel seismic section 21 shows parallel, consistent,acoustic layering within 0.5 s of the seafloor. Reflectionswithin the next 0.1 s are poorly reflective, and still-deeperrocks return strong discontinuous reflections.
A preliminary correlation between seismic data and lithos-tratigraphy (see "Lithostratigraphy" section, this chapter)shows a moderate correspondence between rock-unit bound-aries and seismic reflections (Fig. 9). Lithostratigraphic Sub-units IA and IB both include volcanic silts, clays, and sandsbut are distinguished on the basis of the generally coarsesediment that makes up Subunit IA. The contact betweenthese subunits is marked by a strong, three-peaked reflection.The causes for two other continuous reflections, at traveltimescorresponding to 242 and 344 mbsf (Fig. 9), were not identifiedduring core descriptions.
The reflection at 344 mbsf occurs just above the top oflithostratigraphic Unit II, which includes Pleistocene sand-stone, siltstone, and clay stone, that have a higher degree ofconsolidation than does the sediment of Unit I. The volcanicfraction of Unit II decreases downward, inversely to anincreasing calcareous content.
The contact between lithostratigraphic Units II and IIIcorresponds to a prominent reflection that lies at the base ofthe continuously parallel-layered basin fill. Unit III consists ofPleistocene and Pliocene(?), highly calcareous volcanic sand-stones, siltstones, and breccias. These rocks produce onlyweak, discontinuous reflections. The weakly reflective zonealso includes rocks of Unit IV, an upper Pliocene or Pleis-tocene basalt breccia with subordinate amounts of volcanicsandstone and siltstone.
The unconformity that was the main target of drilling at thissite occurs at the traveltime of 4.8 s, which corresponds to thebase of lithostratigraphic Unit IV (Fig. 9). The unconformityseparates the weakly reflective Units III and IV from under-lying rocks of Unit V that return strong, discontinuous reflec-tions. Unit V is an upper Miocene, Pliocene, and Pleis-tocene^) limestone. The unconformity, therefore, is the con-tact between a limestone below and a coarse volcanic brecciaabove.
Reflections from rocks of lithostratigraphic Units V, VI,and VII are indistinguishable. The two deeper units include, indownward succession, a middle to upper Miocene volcanicsandstone and a lower to middle Miocene basalt breccia.
OPERATIONSSite 832, proposed site IAB-1, is in the North Aoba Basin,
located between the islands of Espiritu Santo, Maewo, Aoba,and Santa Maria. The vessel approached the site from thesouthwest along a reference profile, then conducted a 6-hrpreliminary survey (see "Seismic Stratigraphy" section, thischapter) before dropping a positioning beacon at 0645 UTC on21 November 1990, the third time the site was crossed.
Hole 832AThe first advanced piston coring system (APC) core pene-
trated the seafloor at 3089.3 mbsl. Oriented APC cores wereattempted from 0 to 116 mbsf, although piston strokes wereincomplete after the second core. The volcanic sandy and siltysediments were soupy and freely flowed into the core barrelbelow the cored interval. Unoriented short-stroke APC coreswere taken to 151 mbsf, the point of APC refusal. Theextended core barrel system (XCB) was then used, but corerecovery averaged only 9% (Table 1), and at 215.9 mbsf the
394

SITE 832
3.5
Line 21Shotpoints1555 1565 15,75
4.0 -
15,85
Line 22
1595 1605 16.15 1625 16J35
Site 832
*^£*«5^TrSöf»^^
5.5
500 m
Figure 7. Part of single-channel seismic line 21 that crosses east-west over Site 832.
395

SITE 832
Line 22Shotpoints
Line 21
Figure 8. Part of single-channel seismic line 22 that trends north-south over Site 832.
396

SITE 832
Line 21Shotpoints
15804.0
15,90 1600 1610
Gap opened,no data missing
Lithostratigraphic
u n i t s
250 m
Figure 9. Detailed part of single-channel seismic line 21. Lithostratigraphic units, indicated by Roman numerals inthe center of the figure, are explained in the "Lithostratigraphy" section (this chapter). Depths (mbsf) to someprominent reflections are shown along the vertical line in the center of the figure.
397

SITE 832
Table 1. Coring summary, Holes 832A and 832B.
Core
134-832A-
1H2H3H4H5H6H7H8H9H
10H11H12H13H14H15H16H17H18H19H20H21X22X23X24X25X26X27X
Coring totals
134-832B-
1R2R3R4R5R6R7R8R9R
10R11R12R13R14R15R16R17R18R19R20R21R22R23R24R25R26R27R28R29R30R31R32R33R34R35R36R37R38R39R40R41R42R43R
Date(1990)
21 November21 November21 November21 November21 November21 November21 November22 November22 November22 November22 November22 November22 November22 November22 November22 November22 November22 November22 November22 November22 November22 November22 November22 November22 November22 November22 November
23 November23 November23 November23 November23 November23 November23 November23 November23 November24 November24 November24 November24 November24 November24 November24 November24 November24 November24 November24 November24 November24 November24 November24 November24 November24 November24 November24 November24 November25 November25 November25 November25 November25 November25 November25 November25 November25 November25 November25 November25 November25 November25 November
Time(UTC)
134514451605193020152100231500150100023003300415050005450700073008100855101512451400144515301615170019302015
1450154016301830194521002145223023150100020002450330041505000545063007301000105011351255141515501700195021152230235001000210031504300540070008200930105012401355155017001840
Depth(mbsf)
0.0-5.95.9-15.4
15.4-18.518.5-28.028.0-37.537.5-47.047.0-56.556.5-63.063.0-72.572.5-82.082.0-91.591.5-101.0
101.0-102.0102.0-106.5106.5-116.0116.0-125.5125.5-131.5131.5-141.0141.0-145.0145.0-151.3151.3-158.6158.6-168.1168.1-177.7177.7-187.0187.0-196.7196.7-206.2206.2-215.9
144.4_154.1154.1-163.8163.8-173.7173.7-183.3183.3-193.0193.0-202.2202.2-211.9211.9-221.4221.4-231.0231.0-240.7240.7-250.4250.4-260.0260.0-269.7269.7-279.4279.4-289.0289.0-298.7298.7-308.4308.4-318.1318.1-327.7327.7-337.4337.4-346.9346.9-356.6356.6-366.3366.3-376.0376.0-385.6385.6-395.3395.3-404.9404.9-414.2414.2-423.6423.6-433.2433.2-442.9442.9-451.9451.9-461.5461.5-471.1471.1-480.8480.8-490.4490.4-500.1500.1-509.8509.8-519.5519.5-529.2529.2-538.9538.9-548.5548.5-558.2
Lengthcored
(m)
5.99.53.19.59.59.59.56.59.59.59.59.51.04.59.59.56.09.54.06.37.39.59.69.39.79.59.7
215.9
9.79.79.99.69.79.29.79.59.69.79.79.69.79.79.69.79.79.79.69.79.59.79.79.79.69.79.69.39.49.69.79.09.69.69.79.69.79.79.79.79.79.69.7
Lengthrecovered
(m)
5.899.403.129.579.649.669.636.519.769.849.875.754.182.603.709.575.586.782.926.310.340.010.004.810.000.820.00
146.26
0.150.251.100.240.000.001.141.043.120.000.180.001.471.171.561.902.734.202.523.326.851.262.890.000.001.371.967.177.309.285.335.451.562.933.613.376.012.173.732.352.394.254.19
Recovery(%)
99.898.9
100.0101.0101.0101.0101.0100.0103.0103.0104.060.5
418.057.838.9
101.093.071.373.0
100.04.70.10.0
51.70.08.60.0
67.7
1.52.6
11.12.50.00.0
11.710.932.50.01.90.0
15.112.016.219.628.143.326.234.272.113.029.80.00.0
14.120.477.177.696.654.960.516.230.537.235.161.922.438.424.224.644.343.2
Age
Pleistocene-HolocenePleistocene-HolocenePleistocene-Holocene
PleistocenePleistocenePleistocenePleistocenePleistocenePleistocenePleistocenePleistocenePleistocenePleistocenePleistocene
PleistocenePleistocenePleistocenePleistocenePleistocene
PleistocenePleistocenePleistocenePleistocenePleistocene
PleistocenePleistocenePleistocenePleistocene
PleistocenePleistocenePleistocene
Pleistocene
PleistocenePleistocenePleistocenePleistocenePleistocenePleistocenePleistocene
PleistocenePleistocenePleistocenePleistocenePleistocenePleistocene
PleistocenePleistocenePleistocenePleistocenePleistocenePleistocenePleistocenePleistocenePleistocenePleistocene
late Pliocene
398

SITE 832
Table 1 (continued).
Core
44R45R46R47R48R49R50R51R52R53R54R55R56R57R58R59R60R61R62R63R64R65R66R67R68R69R70R71R72R73R74R75R76R77R78R79R80R81R82R83R84R85R86R87R88R89R90R91R92R93R94R95R96R97R98R99R
100R
Coring totals
Date(1990)
25 November25 November25 November26 November26 November26 November26 November26 November26 November26 November26 November26 November26 November26 November26 November26 November26 November26 November27 November27 November27 November27 November27 November27 November27 November27 November27 November27 November27 November27 November27 November27 November27 November27 November28 November28 November28 November28 November28 November28 November28 November28 November28 November28 November28 November28 November28 November28 November28 November29 November29 November29 November29 November29 November29 November29 November29 November
Time(UTC)
203021402250003001450300041505300715085010501240150017301915204522002345012002450400052006550820093011001215140515401700181519302115223000000130025004150545070508301000112013351520172019002040021000000200043006400800093011001315
Depth(mbsf)
558.2-567.7567.7-577.4577.4-587.0587.0-596.7596.7-606.4606.4-616.1616.1-625.7625.7-635.3635.3-645.0645.0-654.7654.7-664.4664.4-673.0673.0-682.7682.7-692.3692.3-702.0702.0-711.6711.6-720.8720.8-730.5730.5-739.8739.8-749.5749.5-759.2759.2-768.8768.8-778.6778.6-788.2788.2-797.8797.8-807.7807.7-817.4817.4-827.0827.0-836.7836.7-846.4846.4-856.1856.1-865.7865.7-875.3875.3-885.0885.0-894.7894.7-904.4904.4-914.0914.0-923.7923.7-933.3933.3-942.9942.9-952.6952.6-962.2962.2-971.8971.8-981.1981.1-990.8990.8-1000.5
1000.5-1010.11010.1-1019.71019.7-1029.31029.3-1039.01039.0-1048.61048.6-1058.31058.3-1068.01068.0-1077.71077.7-1087.31087.3-1097.01097.0-1106.7
Lengthcored
(m)9.59.79.69.79.79.79.69.69.79.79.78.69.79.69.79.69.29.79.39.79.79.69.89.69.69.99.79.69.79.79.79.69.69.79.79.79.69.79.69.69.79.69.69.39.79.79.69.69.69.79.69.79.79.79.69.79.7
962.3
Lengthrecovered
(m)1.773.933.673.761.534.805.446.718.209.845.807.426.347.522.389.207.699.204.979.847.739.275.323.360.418.709.917.567.967.304.750.000.080.269.557.515.814.678.154.923.477.334.524.775.089.469.862.992.387.834.525.277.019.298.717.386.34
450.95
Recovery(%)
18.640.538.238.715.849.556.669.984.5
101.059.886.365.378.324.595.883.694.853.4
101.079.796.554.335.04.3
87.9102.078.782.075.248.90.00.82.7
98.477.460.548.184.951.235.876.347.151.352.497.5
103.031.124.880.747.154.372.295.890.776.165.3
46.9
Age
late Pliocenelate Pliocenelate Pliocenelate Pliocenelate Pliocenelate Pliocene
late Pliocene
late Pliocenelate Pliocenelate Pliocenelate Pliocene
early Plioceneearly Pliocene
late Miocenelate Miocene
late Miocene
hole was terminated. Five downhole temperature measure-ments were attempted in Hole 832A, but only two producedusable data.
Hole 832BThe ship was offset 25 m north of Hole 832A to drill Hole
832B. The hole was washed (drilled without coring) from 0 to144.4 mbsf, then cored with the rotary core barrel system(RCB). From 144.4 to 327.7 mbsf, recovery averaged only12% (see Table 1). Downhole temperature runs were made at174 and 319 mbsf, and indicated that the geothermal gradient
in this part of the North Aoba Basin is relatively high (see"Downhole Measurements" section, this chapter).
Core recovery improved with depth as induration of thevolcaniclastic sediments and the amount of clay and carbonateincreased (see "Lithostratigraphy" section, this chapter).Hole conditions and rate of penetration (ROP) remained goodas the target depth of 700 mbsf was approached. Because thesediments were younger than expected (see "Biostratigra-phy" section, this chapter), clearance was requested andreceived to continue coring first to 1000 mbsf and subse-quently to a maximum of 1200 mbsf. Although hole conditions
399

SITE 832
and ROP remained favorable, near 1020 mbsf the lithologychanged to unfossiliferous basaltic breccia. At 1107 mbsf,coring was discontinued at the request of the co-chief scien-tists. A total of 962.3 m were cored for a recovery rate of46.9% (Table 1).
A wiper trip made in preparation for logging encounteredconsiderable resistance between about 250 and 154 mbsf and asubstantial bridge at about 890 mbsf. Although these intervalswere cleaned, logging was done in stages because of potentialbridging problems (see "Downhole Measurements" section,this chapter). The end of the pipe was pulled up from the totaldepth (TD) of 1106.7 to 902 mbsf for the first logging tool runs.The geophysical tool string, consisting of the dual inductiontool (DIT), the long-spaced sonic tool (LSS), the lithodensitytool (HLDT), and the LDGO temperature tool (TLT), was runsuccessfully from 25 m above TD to 902 mbsf. While loggingtools were being assembled for the second run, the pipe beganto stick. The logging plan was revised to place the end of thepipe at 250 mbsf, the bottom of the upper interval in whichresistance was encountered during the wiper trip, to run theremainder of the logs from as deep as possible to 250 mbsf.The hole then was cleaned out to TD and the pipe was pulledto 277 mbsf, where it became stuck.
When the pipe could not be freed after 2.5 hr of pulling,the logging program resumed, using the stuck pipe as surfacecasing. The seismic stratigraphy tool string (DIT, LSS, andTLT) was successfully deployed in the hole. This second runoverlapped the first and the upper part of the hole waslogged. The formation microscanner (FMS) was deployed towithin 23 m of total depth and successfully recorded data upto about 520 mbsf, where it became stuck. It was freed andrecovered without any further attempt at logging. A thirdlogging run was made with the magnetic susceptibility toolstring, but was aborted when the tool would not passcompletely out of the drill string. Because of deterioratinglogging conditions, the remaining scheduled logs were can-celed. The drill string was worked free and recovered. Afterretrieving the positioning beacon, the JOIDES Resolutiondeparted for the final site.
LITHOSTRATIGRAPHY
Sedimentary UnitsOn the basis of smear slides made from samples repre-
sentative of visually distinct lithologies, and coulometricdeterminations of carbonate content, the stratigraphic succes-sion at Site 832 is divided into seven lithologic units (Figs. 10,11, and Table 2). The uppermost unit is subdivided into twosubunits.
Because deep-sea drilling procedures do not cover theentire sediment sequence at any site, lithologies must beextrapolated across gaps in the recovery if the sum of thethicknesses of lithologic units is to equal the length of thedrilled section. Where a compositional change occurs be-tween recovered intervals, we have arbitrarily chosen toplace the lithologic boundary at the top of the lower core. Ineffect, we assume for this purpose that the missing intervalhas the same composition as the bottom of the upper core. InTable 2 the entries in the columns for "interval," "depth,"and "thickness" reflect this convention of extrapolation.
Lithostratigraphic Unit I (385.6 m thick, Pleistocene) com-prises mainly sandy to clayey volcanic silts with interbeddedvolcanic ash layers, coarser in Subunit IA than in Subunit IB.Sandstones, siltstones, and claystones, largely volcanic in theupper part and more calcareous below, constitute lithostrati-graphic Unit II (75.9 m thick, Pleistocene). LithostratigraphicUnit III consists mainly of chalks, limestones, and mixed
sedimentary rocks, with interbedded volcanic sandstones andbreccias (164.2 m thick, Pleistocene and possibly latePliocene). Basaltic breccias, with subordinate volcanic sand-stones and siltstones, constitute lithostratigraphic Unit IV(76.3 m thick, late Pliocene and/or Pleistocene). Below anabrupt transition, lithostratigraphic Unit V is composed pre-dominantly of limestones (foraminiferal, nannofossil, andsilty) and siltstones (163.7 m thick, mostly Pliocene with someMiocene). These are underlain by the volcanic sandstones,gradually coarsening downward, of lithostratigraphic Unit VI(86.9 m thick, middle to late Miocene). Basaltic breccias, withsubordinate volcanic sandstones and siltstones, constitutelithostratigraphic Unit VII (154.1 m thick to the bottom of thehole, early to middle Miocene in the upper part, indeterminatebelow).
Lithostratigraphic Unit I
Depth: 0-206.2 mbsf (Hole 832A) and 144.4-385.6 mbsf (Hole832B)
Interval: Sections 134-832A-1H-1, 0 cm, to 134-832A-26X-CC, 10cm, and Sections 134-832B-1R-CC, 0 cm, to 134-832B-23R-CC, 22 cm
Thickness: 385.6 m (thickness in Hole 832A—206.2 m; in Hole832B—241.2 m)
Age: Pleistocene
Unit I comprises a thick series of rapidly accumulatedvolcanic clays, silts, and sands, divided into two subunits onthe basis of grain size: the upper beds are generally coarserthan those below.
Subunit IADepth: 0-141.0 mbsf (Hole 832A)Interval: Sections 134-832A-1H-1, 0 cm, to 134-832A-19H-1, 0 cmThickness: 141.0 mAge: Pleistocene
The main constituents of Subunit IA are unlithified, verydark gray to black (5Y 3/1 to 2.5/1) coarse vitric volcanic ashlayers within gray to dark gray (5Y 5/1 to 4/1), sandy to clayeyvolcanic silts (Fig. 12). These lithologies alternate usually onscales of a few centimeters to a few decimeters. Notablythicker beds are 2 m of vitric volcanic ash at 57-59 mbsf(Sections 134-832A-8H-1 and -8H-2), and almost 20 m of siltyvolcanic clay at 72-92 mbsf (Cores 134-832A-10H and -11H).Thick beds of coarse vitric volcanic ash may be representedby soupy recoveries of this lithology at, for example, 101-105mbsf and 131-138 mbsf (Cores 134-832A-13H to -14H, and-18H).
Volcanic lapilli occur at 32-37, 47, 48, and 73 mbsf(Sections 134-832A-5H-4 to -5H-7; Section 134-832A-7H-1,0-39 cm, and 120-150 cm; and Section 134-832A-10H-1,0-24 cm). Pumice clasts occur at 103-105 and 107-109 mbsf(Sections 134-832A-13H-3 and -13H-CC, and Sections 134-832A-15H-1 and -15H-2). Wood fragments are noted at 86mbsf (Section 134-832A-11H-3, 60-80 cm). Calcareous nan-nofossils, and usually foraminifers, occur in all but thecoarsest beds. Section 134-832A-16H-1, 0-18 cm (116 mbsf),contains gravel-sized fragments of corals, bivalves, andpumice.
Subunit IBDepth: 141.0-206.2 mbsf (Hole 832A) and 144.4-385.6 mbsf (Hole
832B)Interval: Sections 134-832A-19H-1, 0 cm, to 134-832A-26X-CC,
12 cm, and Sections 134-832B-1R-CC, 0 cm, to 134-832B-26R-1, 0 cm
Thickness: 244.6 m (thickness in Hole 832A—65.2 m; in Hole832B—241.2 m)
Age: Pleistocene
400

SITE 832
Hole 832A
300
350 -
400
450 -
500
550 -
300 600
I I
I I
I
--
-
-
-
Cor
e
17R18R19R20R21R22R23R
24R25 R26R2/R^8R"29R30R31R32R33R
34 R35R36 R37R38R39R
40 R41R42R43R1
44R45R46R1
47R
Rec
over
y
iüii•SSHS
=
•m• i
:
-
IIMIillil
• • • i
^ • i
• i• • i• i
Lith
olog
y
? •y •{\ \ • \ \ 'it it i
<?-i? •iit it y.•o •i•
it it iit it i
i? • i ' •i
±,_
5- i -
- T -T—r•
Lith
. un
it
IB
II
III
Hole 832B
600
650
700-
750-
800-
850-
900
1 1
1 1
II
-
-
Cor
e
48R
49R50R51R52R53R54R55R56R57R58R
59R60R61R62R63R64R65R66R67R
68R69R70R71R72R73R74R
75R
76R77R78R79R
Rec
over
y
.,..,,..,....,,„
• i
• n
Lith
olog
y
T - l - l
iI
Lith
. un
it
III
IV
V
VI
900-
9 5 0 -
1000-
1050-
---
-
1100-
1150-
Λ inn
oü
80R81R
82R83R
84R85R
~86R~87R
88R
89R
90R91R
92R93R94R
95R96R97R98R
99RI00R
very
8α>DC
imm•lll
m••m—H U H
B
—
••
log
y
o£_J
MMA ,
A*!
>
; *
•." ,
unit
£
VI
VII
k. A. Λ. A.
Basaltic breccia
Silt/siltstone
Volcanic ash/tuff
Silty sand/sandy silt
Sand/silt/clay
Volcanicsandstone 1 1
1 I
• I
Foraminiferalchalk
Limestone
Figure 10. Lithostratigraphy at Site 832.
The main recovered constituents of Subunit IB are grayto very dark gray (5Y 5/1 to 3/1) silty volcanic clay andclayey volcanic silt with foraminifers and calcareous nanno-fossils. The upper part of the subunit is unlithified, but below281 mbsf (Core 134-832B-15R) most of the recovery is ofclay stones, siltstones, and partially lithified, fine vitric vol-canic ash. There is substantially more carbonate, in the formof calcareous volcanic siltstone and chalk, below 285 mbsfthan there is above.
Scoriaceous rock fragments occur at 164 mbsf (Section134-832B-3R-1, 15-20 cm). Two chalk beds were sampledbetween 310 and 321 mbsf (Section 134-832B-18R-2, 57-80cm, and Sections 134-832B-19R-1, 110 cm, to -19R-CC); theupper limit of the latter is shown in Figure 13. Contorted beds,small-scale slumps, load features, and clastic dikes are re-
markably well developed in the finely laminated silty clay-stone of Core 134-832B-21R at 337-344 mbsf (Figs. 14 and15).
It is not clear to what extent the finer texture of this subunitmay represent a real in-situ difference from the coarsersubunit above, as opposed to its being a result of poorrecovery of coarse, poorly consolidated sediments by therotary drilling method employed (see discussion under the"Remarks" subheading below).
Lühostratigraphic Unit II
Depth: 385.6-461.5 mbsf (Hole 832B)Interval: Sections 134-832B-26R-1, 0 cm, to 134-832B-34R-1, 0 cmThickness: 75.9 mAge: Pleistocene
401

SITE 832
Table 2. Lithostratigraphic units, Site 832.
Interval
Sections 134-832A-1H-1, 0 cm,to 134-832B-26R-l,0cm
Sections 134-832A-1H-1, 0 cm,to 134-832A-19H-l,0cm
Sections 134-832A-19H-1, 0 cm,to 134-832B-26R-1, 0 cm
Sections 134-832B-26R-1, 0 cm,to 134-832B-34R-l,0cm
Sections 134-832B-34R-1, 0 cm,to 134-832B-51R-l,0cm
Sections 134-832B-51R-1, 0 cm,to 134-832B-59R-l,0cm
Sections 134-832B-59R-1, 0 cm,to 134-832B-76R-CC, 0 cm
Sections 134-832B-76R-CC, 0 cm,to 134-832B-85R-l,0cm
Sections 134-832B-85R-1, 0 cm,to 134-832B-100R-CC, 15 cm
Unit
I
II
III
IV
V
VI
VII
Subunit
IA
IB
Depth(mbsf)
0-206.2(Hole 832A)
144.4-385.6(Hole 832B)
0-141.0
141.0-206.2(Hole 832A)
144.4-385.6(Hole 832B)
385.6-461.5
461.5-625.7
625.7-702.0
702.0-865.7
865.7-952.6
952.6-1106.7
Thickness(m)
385.6
141.0
244.6
75.9
164.2
76.3
163.7
86.9
154.1
Age
Pleistocene
Pleistocene
Pleistocene
Pleistocene
Pleistocene andPliocene(?)
Pleistocene and/orPliocene
mostly Pliocene andsome Miocene
middle to lateMiocene
Miocene andindeterminate
Unit II consists predominantly of sandstones, siltstones,and claystones, with substantial volcanic contributions in itsupper part and calcareous components in its lower part. It isthus transitional between the more pyroclastic unit above andthe more calcareous one below.
The upper volcanic claystones to coarse-grained sand-stones range in color from light gray to black (5Y 6/1 to 2.5/1)and show occasional laminae and burrow traces (see, forexample, Fig. 16). A few wood fragments occur at about405-412 mbsf (Core 134-832B-28R). The lower calcareoussilty sandstones to silty claystones range in color from gray tovery dark gray (5Y 5/1 to 3/1) and contain varying amounts offoraminifers and calcareous nannofossils. Contorted lensesand laminae occur at 406-409 mbsf (Sections 134-832B-28R-2and -28R-3), and a large slump seems to have emplaced thebottom 20 cm of Section 134-832B-31R-2 and the top 30 cm ofSection 134-832B-31R-3, at 436 mbsf.
The bottom 50 cm of Core 134-832B-26R and most of Core134-832B-27R is a gray (5Y 5/1) sed-igneous breccia. A verydark gray (5Y 3/1) basaltic breccia constitutes the top 124 cmof Core 134-832B-28R. There is a 59-cm calcareous sed-lithicbreccia in Section 134-832B-30R-2 (Fig. 17), and 130 cm ofbasaltic breccia with a matrix of calcareous sandy siltstoneconstitutes most of Core 134-832B-33R (452-453 mbsf).
Lithostratigraphic Unit IIIDepth: Hole 832B, 461.5-625.7 mbsfInterval: Sections 134-832B-34R-1, 0 cm, to 134-832B-51R-1, 0 cmThickness: 164.2 mAge: Pleistocene, and possibly late Pliocene below about 600 mbsf
The distinguishing feature of Unit III is its highly calcare-ous character relative to adjacent units: about 40% of itcomprises chalks, limestones, and calcareous mixed sedimen-tary rocks. The remainder comprises volcanic sandstones,siltstones, and breccias, the finer-grained varieties slightlypredominating. Beds of the different lithologies are commonlydecimeters to a few meters in thickness, the thinner onesoccurring notably at about 500, 551, and 597 mbsf (Sections134-832B-38R-1, -43R-2, -43R-3, and -48R-1). One of the
limestone/breccia contacts is shown in Figure 18. The chalksand limestones are gray to greenish gray (5Y 5/1 to 5GY 5/1),foraminiferal and calcareous (in the sense of containing a highproportion of calcareous grains of indeterminate origin), oftenwith substantial amounts of calcareous nannofossils and vol-canic grains.
Interbedded volcanic sandstones and mixed sedimentaryrocks are commonly gray (5Y 5/1) and contain some foramin-ifers and calcareous nannofossils, pebbles of pumice andbasalt, and altered volcanic glass. These sandstones andmixed sedimentary rocks, as well as the chalks and lime-stones, exhibit faults, steeply dipping beds, and slump struc-tures. The breccias are gray to greenish gray (5Y 5/1 to 5G0Y5/1), with angular to subrounded clasts of basalt, volcanicsandstone, and occasionally limestone, and a matrix of vol-canic sand or silt with calcareous grains.
Lithostratigraphic Unit IVDepth: Hole 832B, 625.7-702.0 mbsfInterval: Sections 134-832B-51R-1, 0 cm, to 134-832B-59R-1, 0
cmThickness: 76.3 mAge: Pleistocene and/or Pliocene
The upper limit of this unit is arbitrarily placed betweentwo successive cores, as its transition to the one above isgradual. Approximately 60% of Unit IV consists of basalticbreccia and approximately 40% is volcanic sandstone andsiltstone. Most of the breccias and finer-grained beds in theupper part of the unit are 50 cm to 2 m thick, but below 659mbsf (Section 134-832B-54R-3) the beds of breccia arethicker. The breccia is lithified, usually black (5Y 2.5/1),occasionally very dark gray (5Y 3/1) or greenish gray (10Y4/1), and usually matrix-supported. Most clasts are vesicularbasalt fragments, usually 2-10 cm in size but occasionallymuch larger; two pieces of basalt extend over 67 cm and 45 cmin Section 134-832B-57R-2 (684-686 mbsf). In addition, thereare clasts of limestone, corals, and bioclastic limestone withmoldic porosity resulting from the removal of bivalves. Thematrix is a sandstone similar in composition to the volcanic
402

SITE 832
Hole 832A
_Q
E100
125
150
175
200
0
100-
200-
-300-
400-
-. 500 -!
EB 60° :Q 700 J
800 π
900-1
1000-!
1100-
ionn_
Carbonate
0 50 100
Jfc+ + +
•f•+*
m ~ • +
c •
•
i
Lith.
unit
I IB
II
MI111
IV
-V
VI
VII
Hole 832B
Volcaniccomponents
0 50 100
mm
Volcanic glass
0 50 100
*•• '•w~ \wr &
t^ ^ l:‰ !•
•• Coulometric data+ Smear-slide data
Clinopyroxene
Amphiboles
Orthopyroxene
Feldspar
Opaque minerals
Figure 11. Variation in carbonate content and volcanogenic minerals with depth in Holes 832A and 832B. Carbonate content was determined byboth coulometric and smear-slide analyses; percentage of volcanic components was estimated from smear slides.
sandstone that constitutes the subdominant lithology of thisunit.
The volcanic sandstone is lithified, black to greenish gray(5Y 2.5/1 to 5G 4/1), and usually coarse-grained. Prominentconstituents are basaltic grains, palagonite, pyroxene, fora-minifers, and calcareous grains. Interbedded with the sand-stone at about 650 mbsf (Core 134-832B-53R) is a lithified,very dark gray (5Y 3/1) volcanic siltstone. This siltstone andsome of the sandstones exhibit faulting, convoluted slumpedbeds, fractures, and wavy laminae (Fig. 19).
Lithostratigraphic Unit V
Depth: 702.0-865.7 mbsf (Hole 832B)Interval: Sections 134-832B-59R-1, 0 cm, to 134-832B-76R-CC, 0
cmThickness: 163.7 mAge: Pliocene to late Miocene
Sharply demarcated from the coarser Unit IV above, UnitV consists predominantly of light gray to dark greenish gray(5Y 6/1 to 5GY 4/1) limestone (variously described asforaminiferal, nannofossil, calcareous, or silty according toits high percentage of foraminifers, calcareous nannofossils,calcareous grains of uncertain origin, or silt-sized nonbio-genic grains, respectively), and siltstone. [Coulometric de-
terminations of carbonate in samples from this unit are oftenlower than the estimates from smear slides, indicating thatsome of these "limestones" might more correctly thoughcumbersomely be recorded as "mixed sedimentary rocks."It is also possible that the criteria applied in choosingsamples for analysis of physical properties, and subsequentcoulometry, are different from those applied in selectinglevels for preparation of smear slides.] Gray to greenish gray(5Y 5/1 to 5GY 6/1), calcareous clayey siltstone and mixedsedimentary rock occur in Cores 134-832B-59R, -60R, and-72R (702-720 and 827-835 mbsf), the latter containing shellfragments. Gray to dark greenish gray (5Y 5/1 to 5GY 4/1)calcareous volcanic siltstones to silty volcanic sandstonesoccur at about 725 and 769-788 mbsf (Cores 134-832B-61Rand -66R to -68R). Very dark gray to dark greenish gray (5Y3/1 to 5GY 4/1) vitric ash layers, 1-15 cm thick, are presentat about 725, 750-768, and 798-835 mbsf (Cores 134-832B-61R, -64R, -65R, and -69R to -72R). Slickensides are com-mon at 740-757 mbsf (Cores 134-832B-63R and -64R).Pieces of wood up to 1 × 10 mm occur in intervals134-832B-67R-1, 83-84 cm, 134-832B-67R-CC, 35-36 cm,and 134-832B-68R-CC, 22-23 cm (779, 782, and 788 mbsf).At 820 mbsf (Section 134-832B-71R-2, 60-70 cm), a white tolight gray (10YR 8/1 to 5Y 6/1) waxy vein of gypsum (by
403

SITE 832
cm15
2 0 -
2 5 -
3 0 -
35
cm100
102-
104
106
108-
110
112
40 J
Figure 12. Layers of vitric ash within clayey volcanic silt in interval134-832A-9H-3, 15-40 cm. There is no burrow-mottling such as isoften evident in the upper parts of ash layers and turbidites.
114
Figure 13. Contact between the chalk bed that extends from Section134-832B-19R-1, 110 cm, to Section 134-832B-19R-CC, and overlyingvolcanic sandstone found in lithostratigraphic Subunit IB.
X-ray diffraction) several centimeters thick fills a fracturethat cuts the core at an angle of 55° to the vertical.Throughout the unit, bioturbation is commonly intense, butit is only slight at 808-818 mbsf in Core 134-832B-70R.
Near the base of this unit, at 837-838 mbsf (interval134-832B-73R-1, 0 cm, to -73R-2, 23 cm), is a partiallylithified, black (5Y 2.5/1) basaltic breccia containing a fewneritic carbonate clasts. At the base of the unit, in interval134-832B-74R-3, 73 cm, to -74R-CC is a very dark gray (5Y3/1) clayey volcanic siltstone with a convoluted interval inSection 134-832B-74R-3 73-100 cm, underlain by inclinedbeds at 100-125 cm with a slump at their base.
404

SITE 832
cm85
8 7 -
8 9 -
91
9 3 -
9 5 -
9 7 -
99-
101
cm38"
103
Figure 14. Wet-sediment deformation in the finely laminated siltyclaystone of interval 134-832B-21R-3, 85-104 cm, in lithostratigraphicSubunit IB.
4 0 -
42
4 4 -
46"
4 8 -
5 0 -
Figure 15. Clastic dike in the laminated silty claystone of interval134-832B-21R-4, 38-51 cm, in lithostratigraphic Subunit IB.
Lithostratigraphic Unit VIDepth: 865.7-952.6 mbsf (Hole 832B)Interval: Sections 134-832B-76R-CC, 0 cm, to 134-832B-85R-1,0 cmThickness: 86.9 mAge: middle to late Miocene
Unit VI consists of lithified, dark greenish gray to black (5GY4/1 to 5Y 2.5/1) volcanic sandstone. Cores 134-832B-76R and-77R (865-885 mbsf) recovered only a few cobbles of thismaterial as core-catcher samples. The unit shows a generalcoarsening from the top downward, but within it are graded bedsthat fine upward and occasionally downward. Granule- to peb-ble-sized clasts of pumice, basalt, and mud occur sporadicallythroughout, and two 8-cm basalt cobbles occur in Section134-832B-78R-1,0-15 cm, at 885 mbsf (perhaps washed from thepoorly recovered interval above). Grains of neritic carbonateoccur at about 930-938 mbsf (lower part of Cores 134-832B-82Rthrough -83R). Small fractures and faults are observed at 892,894, and 916 mbsf (Sections 134-832B-78R-5, 70-80 cm; 134-832B-78R-7, 10-19 cm, and 40-46 cm; and 134-832B-81R-2,36-49 cm). Fractures are filled with calcite at about 930 and
405
SITE 832
cm140
141 -\
142
143 -\
144
145 -\
146
147
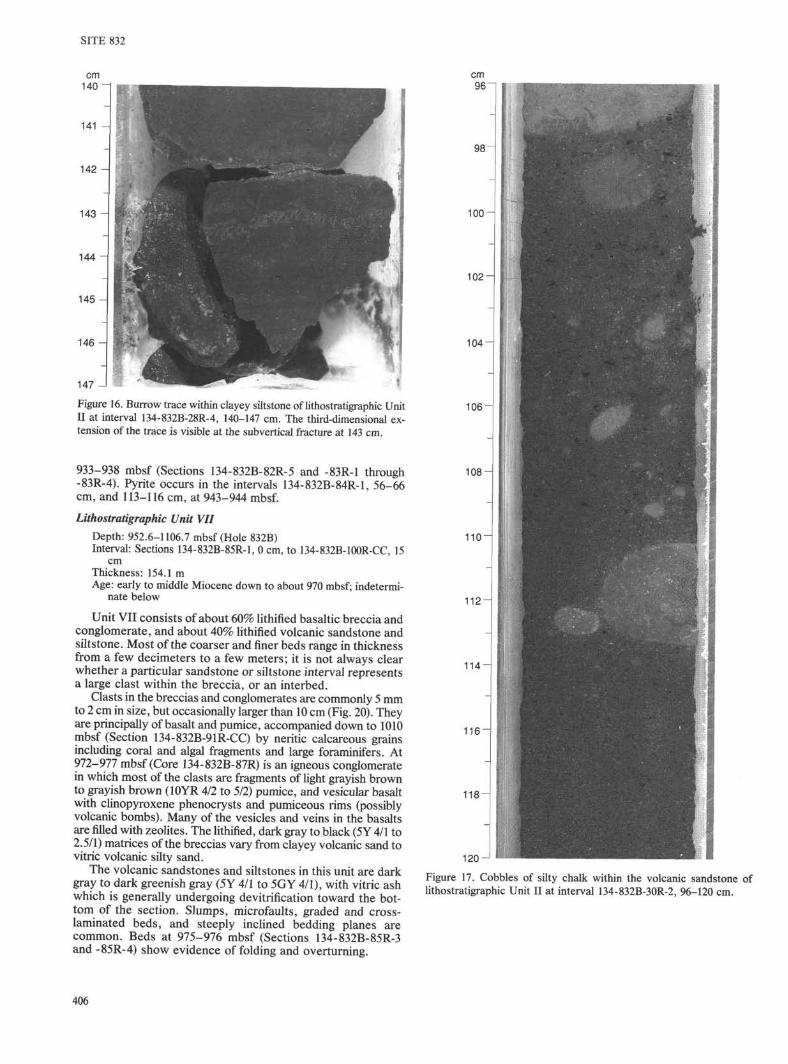
Figure 16. Burrow trace within clayey siltstone of lithostratigraphic UnitII at interval 134-832B-28R-4, 140-147 cm. The third-dimensional ex-tension of the trace is visible at the sub vertical fracture at 143 cm.
933-938 mbsf (Sections 134-832B-82R-5 and -83R-1 through-83R-4). Pyrite occurs in the intervals 134-832B-84R-1, 56-66cm, and 113-116 cm, at 943-944 mbsf.
Lithostratigraphic Unit VIIDepth: 952.6-1106.7 mbsf (Hole 832B)Interval: Sections 134-832B-85R-1, 0 cm, to 134-832B-100R-CC, 15
cmThickness: 154.1 mAge: early to middle Miocene down to about 970 mbsf; indetermi-
nate below
Unit VII consists of about 60% lithified basaltic breccia andconglomerate, and about 40% lithified volcanic sandstone andsiltstone. Most of the coarser and finer beds range in thicknessfrom a few decimeters to a few meters; it is not always clearwhether a particular sandstone or siltstone interval representsa large clast within the breccia, or an interbed.
Clasts in the breccias and conglomerates are commonly 5 mmto 2 cm in size, but occasionally larger than 10 cm (Fig. 20). Theyare principally of basalt and pumice, accompanied down to 1010mbsf (Section 134-832B-91R-CC) by neritic calcareous grainsincluding coral and algal fragments and large foraminifers. At972-977 mbsf (Core 134-832B-87R) is an igneous conglomeratein which most of the clasts are fragments of light grayish brownto grayish brown (10YR 4/2 to 5/2) pumice, and vesicular basaltwith clinopyroxene phenocrysts and pumiceous rims (possiblyvolcanic bombs). Many of the vesicles and veins in the basaltsare filled with zeolites. The lithified, dark gray to black (5Y 4/1 to2.5/1) matrices of the breccias vary from clayey volcanic sand tovitric volcanic silty sand.
The volcanic sandstones and siltstones in this unit are darkgray to dark greenish gray (5Y 4/1 to 5GY 4/1), with vitric ashwhich is generally undergoing devitrification toward the bot-tom of the section. Slumps, microfaults, graded and cross-laminated beds, and steeply inclined bedding planes arecommon. Beds at 975-976 mbsf (Sections 134-832B-85R-3and -85R-4) show evidence of folding and overturning.
Figure 17. Cobbles of silty chalk within the volcanic sandstone oflithostratigraphic Unit II at interval 134-832B-30R-2, 96-120 cm.
406

SITE 832
cm60"
62
6 4 -
6 6 -
68"
70
72
cm32"
7 4 -
Figure 18. Contact between basaltic breccia and limestone withforaminifers in lithostratigraphic Unit III at 65 cm in interval 134-832B-47R-1, 60-75 cm.
Remarks
Influence of Coring Technique on Lithologies Recovered
Hole 832A was drilled using the hydraulic piston corer(HPC) and the XCB until the sediments became so lithifiedthat recovery dropped to an unacceptable level, at about 200mbsf. The RCB was then used to drill Hole 832B, from about150 to 1100 mbsf. The uppermost sedimentary unit at this site,lithostratigraphic Unit I, a 360-m-thick sequence of vitricvolcanic ash layers within sandy to clayey volcanic silts, isdivided into two subunits at about the level at which poor corerecovery with the XCB motivated the change to RCB coring.Subunit (IA) is distinguished from Subunit IB on the basis ofthe former being characterized by coarser vitric ash than thelatter. This distinction is apparently partly real, since unlithi-
3 4 -
3 6 -
38-
40
42
4 4 -
4 6 -
' ,1
• >'Figure 19. Microfaulted and contorted siltstone within coarse-grainedvolcanic sandstone of lithostratigraphic Unit IV in interval 134-832B-53R-4, 32-47 cm.
fied sediments in Cores 134-832A-21X and -24X, in the 50 m ofoverlap of Holes 832A and 832B, are volcanic silt and finevitric volcanic ash, but it is probably artificially exaggerated asa result of the fact that rotary coring does not recoverunconsolidated sands as well as does the hydraulic pistoncorer.
Though evidence for such selective recovery was not notedin the cores representing Subunit IB, there is clear evidencefor this process occurring on a small scale in Unit V, at about750-770 mbsf (Cores 134-832B-64R and -65R). In this inter-val, at some breaks in the limestone core, the surface belowthe break has a thin veneer of very coarse volcanic sand, andimmediately above the break is much finer sediment, darkerthan the limestone and burrow-mottled in the manner charac-teristic of the upper parts of graded sand layers. Obviously,
407

SITE 832
cm16
18
20-
2 2 -
24 -
2 6 -
28"
3 0 -
3 2 -
3 4 -
Figure 20. A large and a smaller clast (at 19.5-32 cm and 32.5-35 cm)of vesicular basalt within the breccia of lithostratigraphic Unit VII ininterval 134-832B-100R-3, 16-35 cm.
the greater part of the less coherent volcanic sand of interme-diate grain sizes has been lost. Instances were noted inSections 134-832B-64R-1, 5-8 cm; -65R-2, 25-39 cm; and-65R-4, 115-118 cm.
Nonvolcanogenic Components of the Sediments
At many localities on the seafloor, where layers of volcanicash or turbidites constitute a substantial part of the sedimentsequences, it is nevertheless possible to identify some non-volcanogenic, nonturbiditic intervals that can be consideredas the normal, background sediments at those places. Candi-dates for such "normal" intervals were not found in theQuaternary part of the sequence at Site 832, and possiblereasons for this were sought in a comparison with Deep SeaDrilling Project (DSDP) sequences from this general region.There are few nearby DSDP sites, and only two of them arenot strongly influenced by the influx of Quaternary volcanicash or turbidites. At Site 209 (15°56'S, 152°11'E, in a waterdepth of 1428 m; Burns, Andrews, et al., 1973) the Quaternaryforaminiferal-nannofossil oozes are 24 m thick, and at Site 587(21°11'S, 161°20'E, in a water depth of 1101 m; Kennett, vonder Borch, et al., 1986) similar oozes are about 31m thick. Thecomponent of that "normal" lithology would constitute only3‰5% of the 600-700 m of Quaternary deposits at Site 832.That small proportion (and more) is accounted for by thecalcareous microfossils in the volcanic silts and clays.
The only DSDP sequence in this region with a complete,nonvolcanogenic, nonturbiditic Pliocene sequence is at Site587, where foraminiferal-nannofossil oozes of that epoch are56 m thick. This is to be compared with the 100-200 m ofPliocene at Site 832, represented largely by the limestones andsiltstones of Unit V.
The middle to late Miocene sequence of nannofossil-bearing ashes and tuffs at DSDP Site 205 (25°31'S, 177°54'E, ina water depth of 4320 m; Burns, Andrews, et al., 1973) is 252m thick, and thus accumulated more rapidly than the approx-imately 150 m of sediments of this age at Site 832.
Connotations of the Term "Reworked"
The collaboration of a number of geologists with diversebackgrounds in describing the sediments from Site 832 re-vealed two distinct senses in which the term "reworked" isused. Igneous petrologists characterize volcanic ash as being"reworked" when there is evidence of its having been movedfrom its original site of deposition to its present location,without regard to the mechanism or context of the transport,or relative age (though there will always be some difference inage, however slight, between the original emplacement ofautochthonous and transported grains). An association offresh shards with partially devitrified ones is taken as evidenceof probable reworking of the latter, as, for example, in thedescription of Core 134-832A-13H. Discrete ash layers occur-ring within sediments also containing dispersed ash is inter-preted as indicating that the dispersed shards are reworked (inCore 134-832A-8H).
In the paleontological literature, the term "reworked" isapplied practically exclusively to fossils that are considerablyolder than the associated sediment or in-situ assemblage (i.e.,the stratigraphic ranges of the reworked species do notoverlap the age that can be assigned to the containing sedi-ment on the basis of other evidence). The difference in agebetween the reworked elements and the autochthonous as-semblage has to be substantial in order for the reworking to berecognized unambiguously. In the case of the mixing of fossilsfrom different water-depth habitats, but of approximately thesame age (a situation analogous to some of the petrologists'usages), the terms "downslope transport" or "displacement"
408

SITE 832
are usually used (see discussion by Boltovskoy and Wright,1976, pp. 376-377, for example). Thus, igneous petrologistsuse the term "reworked" in a wider sense than do paleontol-ogists, and an understanding of the different usages canfacilitate effective communication.
BIOSTRATIGRAPHY
Calcareous NannofossilsThe calcareous nannofossil biostratigraphy in Holes 832A
and 832B is typified by moderately to well-preserved assem-blages, indicating a discontinuous geologic sequence rangingin age from late Pleistocene or Holocene to possibly latestearly Miocene (Fig. 21). Biostratigraphic interpretation ishindered by dilution from volcaniclastic sediments that resultsin nannofossil abundances fluctuating between common andrare. Further complications result from the presence of barrensamples in Sections 134-832B-53R-CC (702.0 mbsf) through-59R-CC (711.6 mbsf), and Sections 134-832B-74R-CC (856.1mbsp through -83R-CC (942.9 mbsf). The absence of nanno-fossils across these intervals prevents the precise determina-tion of the Pleistocene-Pliocene boundary and of the ages ofmost of the upper and middle Miocene sequences. The occur-rence of mass wasting and associated downslope processesare manifested in an erratic record, containing reworkedassemblages that hinder the biostratigraphic utility of severallast occurrence datums, particularly in the upper parts ofHoles 832A and 832B.
Pleistocene
Samples 134-832A-1H-CC through -6H-CC (47.0 mbsf)contain an assemblage typified by the presence of Gephyro-capsa oceanica, Gephyrocapsa caribbeanica, Helicosphaerakamptneri, Calcidiscus leptoporus, and the late Pleistocenezonal marker Emiliania huxleyi (Zone CN14). Neogene spec-imens of Discoaster brouweri, Calcidiscus macintyrei, andDiscoaster variabilis are often present as reworked compo-nents.
In Samples 134-832A-7H-CC (56.5 mbsf) through -27X-CC(215.9 mbsf), the nannofossil assemblage is dominated by G.oceanica, G. caribbeanica, Rhabdosphaera claviger, H. kampt-neri, and C. leptoporus. Neogene and possibly Paleogenenannofossils occur as sporadic reworked specimens, as evi-denced by the presence of D. brouweri, D. variabilis, Sphe-nolithus abies, Discoaster pentaradiatus, and Cyclicar-golithus floridanus.
From Samples 134-832B-26R-CC (395.3 mbsf) through-53R-CC (654.7 mbsf) the nannofossil data are inconsistentbecause of fluctuating abundances of the marker species G.oceanica and G. caribbeanica. The difficulty in determiningthe first occurrence of G. oceanica centers upon the generaldecrease in the placolith size (<4 µm) concomitant with adecrease in the birefringence of the cross-bar in gephyrocap-sids below Sample 134-832B-26R-CC. Common specimens ofG. oceanica are recognized above this sample, whereas belowit distinctive specimens of G. oceanica occur only sporadi-cally. Because the significance placed upon the abundance ofthis species directly affects the placement of the CN14/CN13zonal boundary in this hole, no precise interpretation is madeat this time. These samples are referred to herein as ZoneCN14/CN13 until a less subjective evaluation can be made asa result of more extensive, shore-based studies.
Pliocene
The presence of D. brouweri and the absence of gephyro-capsids in Samples 134-832B-59R-CC (711.6 mbsf) to-62R-CC (739.8 mbsf) indicate deposition during the latest
Pliocene. The accompanying assemblage comprises C. macin-tyrei, H. kamptneri, Calcidiscus leptoporus, and small retic-ulofenestrids (<5 µm). There is no evidence for reworking inthese samples. The presence of Sphenolithus albies in Sam-ples 134-832B-63R-CC (749.5 mbsf) to -65R-CC (768.8 mbsf)indicates that these sediments are no younger than late earlyPliocene (Zone CN11). Also found in these samples wereSphenolithus neoabies, D. brouweri, D. variabilis, H. kampt-neri, C. leptoporus, and small reticulofenestrids (<5 µm).These samples display no evidence of reworking.
Miocene
Samples with nannofossil assemblages indicative of the lateMiocene were found in Samples 134-832B-66R-CC (778.6mbsf) through -74R-CC (856.1 mbsf). The presence of Dis-coaster quinqueramus in association with D. brouweri, H.kamptneri, D. variabilis, C. macintyrei, Dictycoccites sp. (<5µm), and Reticulofenestra sp. (<5 µm) suggests that thesesamples are from Zone CN9. There is no evidence for rework-ing in these samples and the preservational state is moderate.Abundances vary from common to rare.
Early Miocene(?)
It is difficult to determine the ages of Samples 134-832B-84R-CC (952.6 mbsf) through -92R-CC (1029.3 mbsf) becauseof the paucity of nannofossils. Most samples from this intervalcontain varying proportions of Sphenolithus heteromorphusand C. floridanus, indicating deposition during the earlyMiocene (Zone CN4). Some samples contain what appear tobe discoasters that would suggest a younger origin. Samples134-832B-85R-2, 62-63 cm, and 134-832B-90R-CC containdiscoasters that resemble D. brouweri and D. quinqueramus.The occurrence of D. brouweri would indicate that thesesamples are no older than middle Miocene, whereas thepresence of D. quinqueramus would further constrain the ageto within the uppermost Miocene Zone CN9. The presence oftwo distinct nannofossil assemblages suggests that most of thespecimens interpreted as lower Miocene are displaced. De-spite conflicting data, these samples have tentatively beenassigned to the early Miocene Zone CN4; however, furthershore-based analysis of additional data should clarify thesignificance of the enigmatic discoasters.
Planktonic Foraminifers
Abundance and preservation of planktonic foraminifers inHoles 832A and 832B vary greatly because of dilution byvolcaniclastic sediments and progressive lithification downhole.Good preservation and abundant assemblages were found inCores 134-832A-1H to -74R (0-856.1 mbsf), whereas below 856mbsf preservation varies from moderate to poor, specimens arefew, and samples are commonly barren. Although sedimento-logical information (turbidites, slumps, etc.; see "Lithostratigra-phy" section, this chapter) suggests intensive reworking, this isonly readily apparent within some core sections and in a fewcore-catcher samples that contain shallow-water larger benthicforaminifers (see core description forms near the back of thisvolume). The planktonic foraminiferal assemblage shows fairlylittle evidence of reworking, usually in sediments from thepreceding biostratigraphic age.
A continuous foraminiferal biostratigraphy from the Ho-locene to latest late Miocene is recognized between the intervalfrom the seafloor to 856.1 mbsf, followed by an interval with nodata (between 865.7 and 923.7 mbsf). Continuing down in Hole832B, the first indication of earliest middle Miocene is recordedfrom 933.3 to 962.2 mbsf and is followed subsequently by anuppermost lower Miocene assemblage noted from Samples134-832B-88R-CC and 134-832B-90R-CC (between 990.8 and
409

SITE 832
Planktonicforam. N zones
Kennett andSrinivasan
(1983)
Benthic foraminifersNannofossilsOkada and
Bukry(1980)
PaleodepthAkimoto(1990)
Assemblagezones
Lowerbathyalzone
late Pliocene orearly Pleistocene
earliest middleMiocene
latest early Miocene
1000
1100
Figure 21. Biostratigraphic summary of Site 832.
410

SITE 832
1010.1 mbsf). The age of sediments between the interval from1029.3 to 1106.7 mbsf in Hole 832B cannot be determinedbecause of the lack of age-diagnostic species and the generalabsence of planktonic foraminifers.
Within Zone N22 we distinguished informally the late Pleis-tocene to Holocene and the early Pleistocene. The formerassemblage zone is characterized by the occurrence of Globoro-talia truncatulinoides and the latter by the co-occurrence of G.truncatulinoides and Globorotalia tosaensis. Planktonic fora-miniferal Zone N18 is adopted here as early Pliocene followingthe work of Berggren et al. (1985a, 1985b). Major discrepancieswithin the Neogene planktonic foraminiferal datum levels havebeen discussed by Haig and Perembo (1990), who have placedZone N18 of Kennett and Srinivasan (1983) in the early Pliocene.We use here the term Zone N17 (late Miocene) because of thesampling spacing and absence of index species to distinguishZone N17B from N17A.
Late Pleistocene to Holocene
The late Pleistocene to Holocene (Zone N22) is representedby the interval from the seafloor to 308.4 mbsf (Samples 134-832A-1H-CC to -27X-CC; 134-832B-1R-CC to -17R-CC) at Site832. Foraminiferal assemblages in this interval are composedpredominantly of Globorotalia truncatulinoides, Globorotaliamenardii, Globorotalia tumida, Globorotalia ungulata, Glob-orotalia crassaformis, Pulleniatina obliquiloculata, Neoglobo-quadrina dutertrei, Candeina nitida, Globigerinoides congloba-tus, and Sphaeroidinella dehiscens, among others.
Early Pleistocene
Samples between 318.1 and 529.2 mbsf (Samples 134-832B-18R-CC to -40R-CC) from Hole 832B are assigned to theearly Pleistocene (Zone N22), based on the co-occurrence ofGloborotalia truncatulinoides and Globorotalia tosaensis.Planktonic assemblages in this interval are very similar tothose described for the late Pleistocene to Holocene. Uncer-tainty in the first occurrence of G. truncatulinoides is recordedbetween 529.2 and 625.7 mbsf (Samples 134-832B-40R-CC to-50R-CC), as this species is distinguished from its ancestral G.tosaensis by the presence of a well-defined keel in the lastchamber (cf. Kennett and Srinivasan, 1983). This morpholog-ical trait is poorly defined in this stratigraphic interval.
Late Pliocene
The samples between 625.7 and 739.8 mbsf (Samples 134-832B-50R-CC to -62R-CC) in Hole 832B are assigned to the latePliocene (Zone N21), based on the presence of G. tosaensis andthe absence of G. trucatulinoides. Some species that predomi-nate in this interval include S. dehiscens, Globorotalia cf.multicamerata, G. menardii, G. tumida, G. tumida cf.flexuosa,G. crassaformis, Globigerinoides fistulosus, Pulleniatina prae-cursor, and P. obliquiloculata.
Early Pliocene
Sample 134-832B-63R-CC at 749.5 mbsf represents the earlyPliocene (Zones N19-N20), based on the presence of G. cras-saformis, in addition to Dentoglobigerina altispira, Sphaeroid-inellopsis kochi, Globorotalia tumida flexuosa, and Pulleniatinapraecursor, among others. The interval from 759.2 to 768.8 mbsf(Samples 134-832B-64R-CC to -65R-CC) is assigned to ZoneN19, also of early Pliocene age, based on the presence of G.tumida and the absence of G. crassaformis. Common species inthis interval include D. altispira, G. tumida tumida, S. sem-inulina seminulina, and S. paenedehiscens. In addition, theinterval from 778.6 to 817.4 mbsf (Samples 134-832B-66R-CC to-70R-CC) is assigned to the earliest Pliocene (Zone N18). Fora-miniferal species present throughout this interval include Pulle-niatina primalis, D. altispira, S. kochi, S. paenedehiscens, S.
seminulina seminulina, G. tumida, P. praecursor, Globigeri-noides conglobatus, and Globorotalia juanai to G. margaritaeprimitiva.
Late Miocene(?)
The interval from 817.4 to 856.1 mbsf (Samples 134-832B-71R-CC to -74R-CC) is assigned to the late Miocene(?) (ZoneN17), based on the occurrence of Globorotalia plesiotumida, S.paenedehiscens, Globoquadrina baraemoensis, and the absenceof typical Pliocene fauna occurring in the overlying interval.
Middle and Early Miocene
The basal part of middle Miocene (Zone N9) was recordedin Sample 134-832B-85R-2, 29-32 cm (954 mbsf), based onthe presence of Orbulina universa and Orbulina suturalisassociated with Sphaeroidinellopsis disjunta and D. altispira.The latest early Miocene (Zone N8) was noted in Sample134-832B-86R-CC at 971.8 mbsf based on the co-occurrenceof Globigerinoides sicanus and G. triloba; also present areGlobigerinoides altiapertura and Globigerinoides immaturus.
A reworked larger benthic foraminifer Lepidocyclina(Nephrolepidina) sumatrensis occurs in Sample 134-832B-89R-1, 25-28 cm, and indicates the early Miocene (T-letterstage Te5; planktonic Zones N4 to N5). This species waspreviously recorded (cf. Carney, 1986) in the lower Miocene(Upper e = Te5) Sarava Formation on Mae wo Island.
Radiolarians
Rare, well- to moderately preserved radiolarians occur inthe first 11 cores of Hole 832A. Well-preserved fragmentsoccur also in the highly indurated silt of Sample 134-832B-86R-CC, Careful preparation of samples from around thislevel may yield a fauna sufficient to make a contribution to thedetermination of the age of these silts.
Benthic Foraminifers
Rare to few benthic foraminifers occur in core-catcher sam-ples examined from Site 832. Preservation is generally moderateto good in the samples from the seafloor to 778.6 mbsf (Samples134-832A-1H-CC to 134-832B-66R-CC), but becomes poor be-low this depth. No benthic foraminifers are found in samples inthe intervals from 13.4 to 18.5 mbsf, 72.5 to 82.0 mbsf, 116.0 to125.5 mbsf and below 206.2 mbsf in Hole 832A, or from 144.4 to163.8 mbsf, 173.7 to 183.3 mbsf, 221.4 to 318.1 mbsf, 509.8 to519.5 mbsf, 529.2 to 538.9 mbsf, 625.7 to 711.6 mbsf, 846.4 to962.2 mbsf, and below 971.8 mbsf in Hole 832B.
The assemblages recognized in the Neogene sequence atSite 832 mainly consist of several species such as Cibicideswuellerstrofi, Melonis barleeanus, M. pacificus, M. sphae-roides, Pyrgo murrhina, and Uvigerina hispidocostata. Theoccurrence of Melonis sphaeroides and the constancy offaunal components indicate that the Neogene strata at Site 832were deposited in the lower bathyal zone under normaloceanic conditions.
Sublittoral species such as Amphistegina radiata and El-phidium advena also occur in coarse-grained volcanic samplesin the intervals from 28.0 to 47.0 mbsf, 91.5 to 106.5 mbsf, and131.5 to 141.0 mbsf in Hole 832A, and 962.2 to 971.8 mbsf inHole 832B. The presence of these specimens indicates that thevolcanic clasts were derived from the sublittoral zone.
Summary
The sediments at Site 832 were deposited during thefollowing times: Pleistocene (0 to around 600 mbsf), latePliocene or early Pleistocene(?) (600 to 711 mbsf), latePliocene (711 to 769 mbsf), early Pliocene (769 to 856 mbsf),(possibly late Miocene at 817 to 856 m), earliest middleMiocene (924 to 962 mbsf), and latest early Miocene (962 to
411

SITE 832
972 mbsf). The occurrence of Melonis sphaeroides in se-quences from Holes 832A and 832B indicates that sedimentswere deposited in the lower bathyal zone.
A plot of sediment accumulation rate (Fig. 49) shows achange in slope near 700 mbsf, above which rates are >IOOm/m.y. and below which rates vary from about 50 m/m.y.Although the presence of a hiatus at this depth is implied by achange in lithology (see "Lithostratigraphy" section, this chap-ter) and in seismic reflection profile (see "Seismic Stratigraphy"section, this chapter), biostratigraphic data do not indicate anymissing section. Any hiatus within this interval must be of veryshort duration (<200,000 yr). Between the lower Pliocene at 856mbsf and the lowermost middle Miocene at 952 mbsf is anotherpossible unconformity. The presence of reworked specimens oflarger benthic foraminifers and calcareous nannofossils in sam-ples below 924 mbsf suggests that all of these samples arereworked and therefore younger than early Miocene.
IGNEOUS PETROLOGYNumerous volcanic ash layers containing unaltered glass,
plagioclase, and clinopyroxene were found in the cores recov-ered from Hole 832A and the upper part of Hole 832B,between 0.15 and 840 mbsf. Fragments of volcanic rocks,mainly clinopyroxene-phyric basalts ("ankaramite") and theirassociated rocks, were recovered between 395 and 1100 mbsf.The lowermost part of the core, between 1050 and 1100 mbsf,consists of altered volcanic breccia, in which volcanic clastsof scoria and lavas are set in a matrix of chloritized glass, clayminerals, and zeolite. In this discussion, the petrologicaldescriptions are divided into two parts: volcanic ash and lavaclasts found in volcanic breccias.
Volcanic AshMore than 10 volcanic ash layers thicker than 10 cm were
found, mostly above 150 mbsf. The number of ash layers thinnerthan 10 cm is quite high, probably over 100 when smears of ashare included. Most of these thin layers are found in the intervals0-213 mbsf (in lithostratigraphic Unit I), 471-481 mbsf (inlithostratigraphic Unit III), and 802-840 mbsf (in lithostrati-graphic Unit V). The volcanic ash is mostly within the range ofsand size, varying from fine-grained to coarse-grained, althoughlapilli and pieces of pumice up to 2 cm are also observed. Thecolor of the ash varies from black (5Y 2.5/1), gray (5Y 5/1), todusky yellowish brown (10YR 3/2), probably reflecting thecompositional trend from basaltic to dacitic. The ash layersalways include crystals of clinopyroxene and plagioclase as wellas unaltered vesicular brown glass. Vesicles are generally sub-rounded, but in grains of ash that are light brown in color,vesicles are elongated subparallel to the walls of stretched glass.Some glass fragments show contraction cracks on their surface.Additional constituents of the ash are opaque minerals and
crystals of either olivine or orthopyroxene. In two volcanic ashsamples (Samples 134-832A-18H-1, 42-44 cm, and 134-832A-18H-4, 89-91 cm) there are fragments of both very light-coloredglass and dark brown glass, indicating the existence of twomagmatic liquids with different compositions. There are nofragments of intermediate color or banded varieties, whichseems to suggest that the two types of glass came together onlyat the depositional stage.
Several reworked volcanic ash layers are also found: thesecontain foraminifers and altered volcanic glass or volcanicgroundmass in addition to unaltered glass. The glass fragments inthese reworked ash layers lack vesicles and cuspate margins.Also, the proportion of glass is usually small, and the reworkedlayers are often graded, with grains becoming finer toward thetop. In contrast, volcanic ash layers show little grading and arewet when interbedded with less permeable silt.
In addition to volcanic ash, gray (5Y 5/1) to olive gray (5Y4/1) pumice fragments, 1 cm or less in diameter, are found inthe volcanic breccia between 957 and 994 mbsf (in lithostrati-graphic Unit VII). Occasionally scoriae of similar size arefound in the volcanic sandstone.
Seven volcanic ash samples were collected between 5.08and 145.76 mbsf (in lithostratigraphic Unit I) and were sepa-rated for onboard chemical analyses (see "Igneous Geochem-istry" section, this chapter, for analytical results). Smear slidedescriptions of these volcanic ash samples are listed in Table3 and show mineral assemblages of plagioclase + clinopyrox-ene ± olivine. Orthopyroxene was not found in the volcanicash layers in lithostratigraphic Unit I. Smear slide data forselected ash layers from all the horizons, however, show thatorthopyroxene is also absent in the volcanic ash layers oflithostratigraphic Unit III, but that it appears again in ashlayers of lithostratigraphic Unit V. This change in mineralassemblage will be further discussed in the following part,which discusses lava clasts.
Volcanic ClastsClasts of mostly basaltic composition are found in a matrix
of volcanic sandstone, which is mainly composed of rockfragments that have undergone varying degrees of alterationand have colors ranging from dark gray, oxidized brown, tochloritized green. This lithology is repeated several timesthroughout the core, and is referred to as "basaltic breccia" inthe "Lithostratigraphy" section (this chapter). The basalticclasts, subrounded or subangular, are mostly pebble-sized(1-3 cm) but occasionally exceed 10 cm. Dark gray (5Y 4/1) todark greenish gray (5GY 4/1) basaltic breccias are especiallyabundant in the lower parts of the core, which correspond tolithostratigraphic Units IV and VII.
Table 4 lists modal compositions of phenocryst phases,vesicles, and alteration products such as zeolite, palagonite,
Table 3. Modal analyses (vol%) of volcanic ash from Hole 832A derived from smear-slide descriptions.
Core, section,interval (cm)
134-832A-1H-4, 58-602H-5, 82-874H-3, 28-347H-1, 26-28
18H-1, 42-4418H-4, 89-9120H-1, 76-80
Depth(mbsf)
5.0812.7221.7847.26
131.92136.89145.76
Unit
IIIIIII
Dark brownglass
3040
025253630
Transparent orpale brown
glass
00
550
37100
Plagioclase
121010101520tr
Clinopyroxene
1755
2054
12
Olivine
10050tr3
Rockfragment
40453040183055
Note: tr = trace amount. Modal analysis was carried out for the coarse fraction (38-125 µm, except for Sample 134-832A-7H-1,26-28 cm, which is 63-125 µm) separated for chemical analyses.
412

SITE 832
chlorite, and clay minerals for lava clasts recovered from Site832. Most of the lava clasts are highly vesicular and have beenaltered; those recovered from the lower levels are especiallyhighly altered. Oxidation is hardly observed at all among thelava clasts recovered from Site 832. As shown in Table 4, thephenocryst assemblage of the clasts varies with depth. Thus,in the following descriptions the volcanic clasts are dividedinto three groups, each representing different levels of coreand different phenocryst assemblages.
1. Clinopyroxene (10%-35%) and plagioclase (0%-25%)are the dominant phases with opaque minerals always appear-ing as minor phases in the lava clasts occurring between 396and 617 mbsf (within lithostratigraphic Units II and III).Euhedral to subhedral clinopyroxenes of augite compositionare characteristically large, generally varying in size between1 and 6 mm. Plagioclase is smaller than clinopyroxene with ausual size range of 0.2 to 1 mm. It is euhedral to subhedral,and almost all samples contains inclusions of brown glass. Intwo instances (Samples 134-832B-38R-1, 18-19 cm, and 134-832B-41R-1, 22-23 cm), phenocryst-size plagioclase is absent.In Sample 134-832B-43R-3, 23-26 cm, amphibole is found asa phenocryst phase in addition to clinopyroxene, plagioclase,and opaque minerals. Amphibole is anhedral and has reactionrims 0.02 mm thick of opaque minerals, pyroxenes, andplagioclase. This is the only case of a hydrous mineraloccurring as a phenocryst phase in volcanic rocks recoveredfrom the cores drilled in the central New Hebrides Island Arc.Opaque minerals, probably titanomagnetite, are of microphe-nocryst size (mostly from 0.1 to 0.4 mm); they are usuallysubrounded and often euhedral. They appear as discretegrains in the groundmass but are also included in clinopyrox-ene phenocrysts. The groundmass is composed of fine-grainedplagioclase, clinopyroxene, opaque minerals, and very darkbrown glass. The exception is the amphibole-bearing basalticandesite (Sample 134-832B-43R-3, 23-26 cm), which showsintersertal texture with brown glass, plagioclase, orthopyrox-ene, clinopyroxene, and opaque minerals.
2. The phenocryst assemblage changes to clinopyroxene,plagioclase, and olivine in the lava clasts occurring between631 and 686 mbsf (within lithostratigraphic Unit IV). Olivinephenocrysts are euhedral to subhedral, varying in size from0.2 to 2 mm. They are generally fresh but olivine in threesamples is partly altered to iddingsite. Other than olivine,phenocrysts are the same as described from lithostratigraphic
Units II and III with the following exceptions. Clinopyroxeneoften shows zoning with an inner core having a differentextinction angle. Dusty plagioclase is pervasive in Sample134-832B-56R-2, 55-56 cm. The groundmass minerals, show-ing intergranular texture, are more coarse-grained than in thelava clasts at higher levels except in Sample 134-832B-55R-4,127-128 cm. The average groundmass mineral size reaches 0.1mm in Sample 134-832B-57R-2, 124-125 cm.
3. Orthopyroxene joins the phenocryst phases of clinopy-roxene, plagioclase, and olivine, but either plagioclase orolivine may be absent from lava clasts occurring below 983mbsf (within lithostratigraphic Unit VII). Orthopyroxene iseuhedral to subhedral and ranges in size between 0.2 and 2mm. Unlike olivine, in which rims are often altered to idding-site and chlorite, the orthopyroxene is fresh. Clinopyroxene isnot usually as large as in other samples described above. Theabsence of microphenocryst-sized opaque minerals is alsonoteworthy. As a result, the texture of lavas recovered fromthis level is completely different from those of lithostrati-graphic Units II, III, and IV. Sample 134-832B-100R-4, 7-8cm, is an unusually fresh two-pyroxene andesite having unal-tered brown glass that occupies 45% volume of the rock. Thisprobably represents one of the most siliceous of the lavasrecovered from Site 832.
The overall petrological trends observed among recoveredlava clasts indicate a definite change upward from two-pyroxeneandesite or olivine-bearing two-pyroxene basalt to ankaramite,distinctive basaltic lava in which clinopyroxene is the dominantphase. The descriptions of the mineralogy of ash layers showthat orthopyroxene is present in lithostratigraphic Unit V butabsent from lithostratigraphic Units I and III, a trend consistentwith that observed in the lava clasts. These trends suggest achange of magmatism from a mature island-arc type volcanismto a rifting-type volcanism (e.g., Barsdell et al., 1982).
Potential sources of these volcanic clasts are the islands ofAoba, Santa Maria, Mere Lava, Maewo, and Espiritu Santo, allof which are located about equal distance from Site 832. Generalpetrological descriptions by Carmichael et al. (1974) indicate thatthe lavas of Aoba Island, built up above sea level during the latePliocene, are picrite basalts and ankaramites. The former con-tains more than 35% olivine phenocrysts with less abundantaugite and no plagioclase. The latter contains 30% to 40% augitephenocrysts and only rarely plagioclase. Lavas with less abun-dant olivine and pyroxene phenocrysts are also found. Occur-
Table 4. Modal analyses of phenocryst assemblages for lavas from Hole 832B.
Core, section,interval (cm)
Opaque AlterationUnit Clinopyroxene Plagioclase Olivine Orthopyroxene minerals Amphibole Vesicles products
134-832B-27R-1, 54-5628R-1, 1-331R-2, 9-1138R-1, 18-1941R-1, 22-2343R-3, 23-2650R-2, 46-4851R-5, 7-855R-4, 125-12655R-4, 127-12856R-2, 55-5657R-2, 124-12588R-2, 105-10994R-2, 107-109
100R-3, 146-147100R-4, 7-8
IIIIIIIIIIIIIIIIIIIVIVIVIVIVVIIVIIVIIVII
3530201025101515201520257
12105
151015
257
204
2010352016—18
8tr53426
17
4337
5132363115
101815301575
108
35
4020
3
8843
15
—
22453610174419
Note: tr = trace amount; — = not observed.
413

SITE 832
rences of picrite and ankaramite were also reported from MaewoIsland, though from upper Miocene to upper Pliocene formations(Macfarlane et al., 1988). Pleistocene to Holocene volcanism atSanta Maria Island includes outpourings of olivine basalt andandesite lavas and extensive ash eruptions (Macfarlane et al.,1988). Lavas occurring on Espiritu Santo Island are porphyriticbasalts with dominant plagioclase, erupted during the Miocene(Mallick and Greenbaum, 1977; Robinson, 1969). The occur-rence of orthopyroxene phenocrysts has been reported onlyfrom the Miocene volcanic rocks of Espiritu Santo Island andfrom Maewo Island. Similarly, amphibole phenocrysts are re-ported only from the Miocene volcanic rocks of Espiritu SantoIsland (Mallick and Greenbaum, 1977; Robinson, 1969; Carney,1986).
Thus, clinopyroxene-phyric basalts recovered from theupper part of the succession, in cores belonging to lithostrati-graphic Units II, III, and IV, may have been derived fromeither Aoba Island or Maewo Island, but not from EspirituSanto Island or Santa Maria Island. Maewo Island representsthe most likely source for the older lavas. Although somedifferences are recognized between the lavas recovered fromlithostratigraphic Units II and IV, picrite and ankaramite,lacking plagioclase, are found only in two samples from Site832. Most of the lavas are more evolved types containingplagioclase. In contrast, lavas recovered from cores belongingto lithostratigraphic Unit VII are likely to have been derivedfrom Espiritu Santo Island or Maewo Island, where orthopy-roxene phenocrysts are found in the basalts and andesites. Inaddition, amphibole-bearing basaltic andesite recovered fromlithostratigraphic Unit III has probably been derived fromEspiritu Santo Island. The volcanic ash in lithostratigraphicUnit I may have originated from any of the islands of theCentral Chain of the New Hebrides Island Arc. Extensive ashdeposits from Santa Maria Island are likely to be found in theupper part of the cores recovered from Site 832.
The breccias of the lowest layers, especially below 1050mbsf, were probably the product of submarine volcanismbecause they contain a matrix with abundant alteration prod-ucts such as palagonite, chlorite, clay minerals, and zeolite.However, drilling ended far above the basement, as the totaldepth of 1106.7 m is much less than the thickness of horizontalsedimentary layers (>3 km) inferred from the seismic reflec-tion data (see "Seismic Stratigraphy" section, this chapter).All the volcanic rocks recovered from Site 832 were probablyderived from nearby islands or submarine volcanic centerssince the Miocene.
IGNEOUS GEOCHEMISTRYNumerous ash layers and many lava clasts were encountered
during drilling at Site 832 in the North Aoba Basin. Theirmineralogical and petrographic characteristics are described inthe "Igneous Petrology" section (this chapter). From these,seven ash layers and seven volcanic fragments were chosen forX-ray fluorescence analyses on board (see "Explanatory Notes"chapter, this volume). The results are reported in Table 5. Beforecrushing, the pyroclastic material was treated with 1-N HCl in anultrasonic bath to remove calcite and organic matter.
AshesThe volcanic ash deposits from Hole 832A represent a
considerable compositional range. SiO2 varies between 51.36and 58.02 weight percent (wt%), and the magnesium number(Mg# = MgO/[MgO + FeOtotal] mol%) ranges from 0.59 to 0.36.As pointed out in the "Igneous Petrology" section (this chapter),crystals and glass do not appear to have undergone significantalteration. This is reflected in the low value of loss on ignition
(LOI; Table 5), which ranges from 0.72 to 1.94, averaging around1%. The total alkali content varies between 3.60 and 8.71 (Table5) and the Na2O/K2O ratio ranges from 2.10 to 1.15, indicating arelatively potassic affinity for the parental magma.
On the K2O-SiO2 diagram (Fig. 22) ash compositions ploteither in the calc-alkaline or in the high-potassium calc-alkalinefields, except for Samples 134-832A-2H-5, 82-87 cm, and 134-832A-4H-3, 28-34 cm, which lie in the shoshonitic field. Theyrange from basalts (Samples 134-832A-7H-1, 26-28 cm, and134-832A-20H-1, 76-80 cm) to basaltic andesites (Samples 134-832A-1H-4, 58-60 cm, 134-832A-2H-5, 82-87 cm, and 134-832A-18H-4,89-91 cm) and andesites (Samples 134-832A-4H-3,28-34 cm, and 134-832A-18H-4, 89-91 cm). This diagram doesnot reveal any covariation between SiO2 and K2O in the differentashes, but a strong correlation is apparent in the K2O vs. Zr plot(Fig. 23). Similarly, a positive correlation exists between Zr andother elements such as Ba, Rb, and Nb (Fig. 23). These trendsare consistent with a common origin via crystal fractionationfrom a single parental magma, though varying proportions ofcrystals and glass in the samples will also have influenced theplots.
Figure 22 also shows the field for lava compositions ofseveral islands in the New Hebrides Central Chain (data fromGorton, 1974; Dupuy et al., 1982; Barsdell et al., 1982;Marcelot et al., 1983; Briqueu, 1984). The great majority of thelavas fall in the calc-alkaline field, and only a few samplesfrom Santa Maria and one from Ambrym show K2O contentsin excess of 2% and plot in or close to the shoshonitic field. InFigure 24 the compositional range of the ashes is displayed ina mid-ocean ridge basalt (MORB)-normalized incompatibleelement diagram (normalizing values from Pearce, 1982). Thehigh contents of the trace elements in the analyzed samples(up to 30 × MORB) are comparable with the sample fromSanta Maria, though, Ba, Ce, and Nb analyses are notavailable for the latter. In this diagram the slightly positive Zranomaly in the ashes is also significant, because only SantaMaria among the neighboring islands has erupted lavas with aZr content greater than MORB (i.e., > l in the normalized plot[Briqueu, 1984]). All these features point to the nearby islandof Santa Maria as the most probable source of the ash layersencountered in the upper part of Site 832.
LavasThe compositions of the lava clasts from Hole 832B (Table
5) fall well within the calc-alkaline field (Fig. 22) and show anarrower chemical range than that of the ashes previouslydescribed. All except one are basalts (SiO2 between 47.3 and50.01 wt%; Mg# from 0.62 to 0.55). Sample 134-832B-43R-3,22-26 cm, is more differentiated (SiO2 54.46 wt%; Mg# 0.51)and is a basaltic andesite. The latter is the only sample thatbears abundant amphibole crystals (8%; see "Igneous Petrol-ogy" section, this chapter). Variation diagrams suggest twogroups of clasts, particularly apparent on the plots of Nb andY vs. Zr (Fig. 23). Samples 134-832B-27R-1, 51-54 cm,134-832B-31R-1, 126-128 cm, 134-832B-41R-1, 17-21 cm,and 134-832B-55R-5, 47-50 cm, tend to have lower SiO2,K2O, Ba, Rb, and Sr, and higher Nb and Y concentration thanthe other lavas (Samples 134-832B-43R-3, 22-26 cm, 134-832B-51R-4, 123-125 cm, and 134-832B-57R-2, 122-124 cm).The distinction is even more evident in the Ti-Zr diagram ofFigure 25 where all but one of the samples plot in thecalc-alkaline field. However, Samples 134-832B-27R-1, 51-54cm, 134-832B-31R-1, 126-128 cm, 134-832B-41R-1, 17-21cm, and 134-832B-55R-5, 47-50 cm, form a distinct group,more enriched in TiO2 and plotting toward the MORB field. Asimilar calc-alkaline affinity is apparent from the Ti-Zr-Y
414

Table 5. Major and trace element analyses of ashes (numbers 1-7) and lava clasts (numbers 8-14) recovered from Site 832.
Numbera
Hole, core, sectionSample interval (cm)Rock typeb
Depth (mbsf)
Major elements (wt%)SiO2
TiO2
A12O3
Fe2O3(t)MnOMgOCaONa2OK2OP 2O 5
Total
LOIMg#Na2O/K2ONa2O + K2O
Trace elements (ppm)TiNiCrVCuZnSrRbCeBaNbZrY
1832A-1H-4
58-60HK-BA
5.08
54.690.82
16.318.290.184.098.153.132.130.26
98.02
1.140.491.475.26
48863391
23812179
6123530
5624
17520
2832A-2H-5
82-87Sh-BA12.72
55.330.89
16.549.270.212.726.334.143.180.42
99.00
0.720.371.307.31
53361011
257185106759
5250
7454
22024
3832A-4H-3
28-34Sh-A21.78
58.020.63
17.306.040.201.754.464.674.050.26
97.36
1.940.361.158.71
374746
11194
110669
6764
8726
24722
4832A-7H-1
26-28HK-B47.26
51.530.84
15.5210.590.195.039.252.932.180.24
98.27
0.890.481.345.10
50364087
30315496
8143429
5483
18717
5832A-18H-1
42-44CA-A131.92
57.990.74
16.288.370.173.227.323.111.740.19
99.11
1.550.431.794.85
44061840
2029486
4102925
5154
14625
6832A-18H-4
89-91CA-BA136.89
55.610.76
16.548.880.173.938.262.861.360.18
98.52
0.970.472.104.22
45262358
2319680
4202224
4323
13522
7832A-20H-1
76-80CA-B145.76
51.360.80
13.5311.010.188.01
11.142.191.420.20
99.82
1.070.591.543.60
479687
31430915271
7492129
3642
16211
8832B-27R-1
51-54CA-B395.81
48.761.09
14.0210.920.177.18
14.091.950.740.21
99.12
0.960.572.642.69
653550
192331
8673
4165
30178
5114
22
9832B-31R-1
126-128CA-B434.46
48.831.21
14.3811.780.207.29
12.382.050.770.24
99.11
0.860.552.662.82
725464
21332410878
5407
25177
615226
10832B-41R-1
17-21C A B529.37
47.341.43
14.1911.530.197.34
13.472.180.790.28
98.72
1.450.562.752.97
854355
181349
9484
4578
29209
914826
11832B-43R-3
22-26CA-BA551.72
54.460.71
17.128.200.164.338.933.011.520.26
98.68
0.850.511.994.53
42562034
2728352
6272733
3523
16318
12832B-51R-4
123-125CA-B631.37
49.910.77
12.9410.150.168.25
12.851.671.290.33
98.29
1.790.621.302.96
458685
33632213364
6211441
2382
15220
13832B-55R-5
47-50CA-B670.87
47.911.14
14.7911.200.217.83
13.002.150.740.23
99.17
2.620.582.922.88
680455
17034813978
4669
28221
513224
14832B-57R-2
122-124CA-B685.36
50.010.76
14.8010.650.176.75
11.692.270.970.17
98.22
0.940.562.353.24
452638
117317
8355
5331220
2711
11718
Note: LOI = loss on ignition; Mg# = MgO/(MgO + FeOtotal) mol%.
a See Figures 22 through 27.Rock-type abbreviations: HK = high-potassium calc-alkaline series; Sh = shoshonitic series; CA = calc-alkaline series; B = basalt; BA = basaltic andesite; A = andesite.

SITE 832
4 -
3 -
O 2 –
1 "
_, BasaticBasalt . ._
andesite
Shoshoniticseries i M
2 j
Am
- ' 9^ D14
• - ' f 3 . ? . ' ' "I I I
o1
:o6
i i
Andesite
O5
•
i i i
Dacite
^ ^
_—
i i
High-Kcalc-
alkalineseries
Calc-alkalineseries
Low-Kseries
48 53 57SiO2 (wt%)
63 68
Figure 22. K2O-SiO2 diagram for ashes (circles) and basaltic clasts(squares) drilled at Site 832, North Aoba Basin. Numbers correspondto those in Table 5. Dotted line encloses compositions of lavas fromseveral islands of the Central Chain of the New Hebrides Island Arc.Triangles refer to more alkali-rich magmas erupted at Tongoa (T),Aoba (Ao), Ambrym (Am), and Santa Maria (SM) islands. Fieldboundaries from Wilson (1989).
diagram (Fig. 26), although the same four basalts are displacedtoward the MORB-island arc tholeiite (IAT) field.
When the two groups of lavas are plotted on a MORB-normal-ized incompatible element diagram (Fig. 27) it is evident thatSamples 134-832B-43R-3, 22-26 cm, 134-832B-51R-4, 123-125cm, and 134-832B-57R-2,122-124 cm, are lower in Ti, Y, and Nb,and higher in K, Rb, Ba, and Sr (i.e., have more obvious calc-alkaline features compared with the other samples). From thepetrographic observations (see "Igneous Petrology" section, thischapter), three groups of lavas with different parageneses wereidentified. Unfortunately, we do not have analyses of lava frag-ments from deeper in Hole 832B than Core 134-832B-57R (690mbsf), and only four of the seven samples recovered from higherthan this were sufficiently large for chemical analysis. Despite this,the different trends observed suggest there may be some composi-tional variations with depth in the stratigraphic sequence. How-ever, we are dealing entirely with reworked material, which mightrepresent an inversion of the sequence of material actually erupted.A progression from MORB-IAT upward to more calc-alkalinerocks in the original volcanic pile might, on erosion, give a domi-nance of calc-alkaline rocks at the base.
SEDIMENT AND FLUID GEOCHEMISTRYThe principal objective for measuring pore-fluid chemistry
at Site 832 was to observe diagenesis in undeformed intra-arcsediment in order to compare with diagenesis in the deformedforearc sediment. The pore-fluid chemistry at Sites 827, 829,and 830 reflects much diagenesis that may have resulted partlyfrom processes associated with the collision of the d'Entrecas-teaux Zone with the New Hebrides Island Arc. A secondaryobjective was to determine if meteoric water from the sur-rounding islands mixes with the fluids in the Aoba Basin. Suchmixing apparently occurs along continental margins such asthe coasts of Oman (Prell, Niitsuma, et al., 1989) and Peru(Kastner et al., 1990). The Aoba Basin contains a thicksedimentary section (see "Background and Objectives" sec-tion, this chapter) that may contain large amounts of organic
matter shed off of the surrounding islands. An additionalgeochemical objective, therefore, was to measure the organiccarbon contents of the sediments and to assess the hydrocar-bon potential of the basin.
ResultsA total of 30 fluid samples were collected from whole-
round sections of cores at the two holes drilled at Site 832(Table 6). Seven samples were obtained using the APC andone sample using the XCB at Hole 832A. The remainingsamples were obtained with the RCB at Hole 832B. As usual,the parts of the samples that had been contaminated withdrilling mud were removed prior to squeezing. The degree ofcontamination is difficult to determine; sulfate concentrationsincrease in the deepest samples, but other solute concentra-tions indicate that this sulfate is not from contamination (Fig.28).
Samples were taken approximately every 20 m, exceptwithin hard, well-lithified units, and through zones with lim-ited core recovery. Because such units occur at severalhorizons, the sample density is lower between —180 and 280mbsf and between 611 and 706 mbsf. Below 740 mbsf, sampleswere taken approximately every 30 m because samples 20 cmlong were required to obtain sufficient quantities of fluid. Nopore-fluid samples were taken below 832.8 mbsf because thesediment appeared hard and well cemented and thus probablycontained little fluid.
Where samples were taken, however, the volume of waterobtained was greater at comparable depths than at the forearcsites (Fig. 29). Only one sample (Sample 134-832B-51R-1,130-150 cm) provided no fluid although it was squeezed forseveral hours at 35,000 psi. This sample was taken from thewell-cemented, coarse graywacke at 627.0 mbsf and is char-acterized by low porosity and water content (see "PhysicalProperties" section, this chapter).
Chloride and Salinity
The chloride concentration and salinity exhibit similar overalltrends (Fig. 28). The chloride concentration gradient increasesslightly to 622 mM at 280.0 mbsf and increases sharply to amaximum of 700 mM (—25% seawater concentration) at a depthof 341.8 mbsf. A second maximum of 742 mM (—34% seawaterconcentration) occurs at a depth of 611.2 mbsf. These chloridemaxima correspond to maxima in salinity of 46.3%o and 50.6%o.
Sodium, Potassium, Calcium, and Magnesium
The concentration gradients of sodium, potassium, calcium,and magnesium exhibit small but significant changes above 280mbsf and extraordinarily large variations below this depth (Fig.28). Between the sediment-water interface and —280 mbsf, thepotassium and magnesium concentrations decrease continu-ously, and the calcium concentration also initially decreases to1.9 mM at 42 mbsf, but increases slightly to 4.7 mM at 222.9 mbsf(Fig. 30). The sodium concentration increases steadily to amaximum of 501 mM at 280 mbsf. Below 280 mbsf, the pore-fluidgradients exhibit several maxima and minima with large gradi-ents between the extremes (Fig. 28). The calcium maxima andthe potassium, sodium, and magnesium minima correspond tothe chloride and salinity maxima. The sodium and calciumprofiles are mirror images (Fig. 31) but the potassium profilediffers slightly from the smooth sodium and calcium profiles; itexhibits a sharp maximum of 15.2 mM at a depth of 280 mbsf andonly a slight gradient below 700 mbsf. No measurable magne-sium exists in the fluid sampled between 341.8 and 428.0 mbsfand the deepest sample at 832.8 mbsf. Between 428.0 and 802.3mbsf the magnesium concentrations are low, generally <IO mM.
416

SITE 832
1U
8
6
4
2
26
22
18
14
800
600
400
200
-
~. π8 D 1 C
o€
_14
Di
1
13R °- α 8 o c
14- D
_
-
_
_
'_ o<
14D 13
" D8 ° 1
D 1 0
D 9
O 5 O 1
D 1 1 O 4
D O_12 7
1
0 9
o D
5
D 1 2 θ 1
D11 ° 4
P 7
1O 5 O O 4
D 1 2
0 D D 9
o2
2O
2O
-
O 3
_
-
_
-
-
3
cr
—
1 o3
_
-
5
4
O 3<M
coZ
2
1
4
3O
<M
2
1
80
DC40
20
1 '
5 11 1O 6 O 1 1
D O
" o4° 13π 1 O cu o 7
- 8 D gD
12
-
14 7
D D CD• 8 10 9
I I
1Λ 5 11 O
6 O D
" 1 t 1 3 1 π °7
1
o 2
Q 4
o 2
°
o 2
1 1
°3
o 3
o3
1
—
Il
l,
-
-
-
1 '
1 '
1 '
1 '
100 140 180 220 260 300 100 140 180 220 260 300Zr Zr
Figure 23. Plots of selected major and trace elements against Zr for volcanic ash deposits (circles) and lava clasts (squares) from Site 832, NorthAoba Basin. Na2O and K2O are in weight percent; Rb, Nb, Y, Ba, and Zr in parts per million. Numbers correspond to those in Table 5.
Alkalinity, Phosphate, Ammonia, Sulfate, Methane, and Silica
The profiles of alkalinity, phosphate, ammonia, and methaneare similar: all are characterized by sharp, distinct maximaaround 77 mbsf (Figs. 28 and 32). The maxima in alkalinity (30.0mM), phosphate (119.8 µM), and ammonia (2307 µM) are higherthan values measured in the forearc sites. The maximum meth-ane concentration is 28,211 parts per million (ppm) at 77 mbsfand 11,511 ppm at 164.7 mbsf; otherwise, the methane concen-tration is < 10,000 ppm in both holes. Below the maxima,alkalinity, phosphate, and methane concentrations decrease tonear-zero values at a depth of 280 mbsf and remain near zero to832.8 mbsf, the deepest sample measured. The ammonia profileexhibits some variations but is characterized by two small butdistinct maxima at 462.9 and 723.6 mbsf. Close to the depths ofthe chloride minima (Table 6).
The sulfate concentration decreases rapidly to a minimumof 0.6 mM at 42 mbsf (Fig. 28). The sulfate concentrationremains low, although not zero (Table 6) to 280.0 mbsf,below which depth it exhibits a broad but distinct maximumfrom 428.0 to 588.3 mbsf and a smaller and more distinctmaximum at 802.3 mbsf. These depths also correspond tothe potassium, sodium, and magnesium minima and thechloride and calcium maxima.
The silica concentration is variable, but averages —500 µMfrom the sediment-water interface to a depth of —400 mbsf.From this depth, silica decreases to 150 µM in the deepestsample at 832.8 mbsf. The silica concentration does not
appear to correspond to maxima or minima in any other soluteconcentration.
Sedimentary Carbon
All of the carbon data are reported in Table 7. The CaCO3
contents are plotted against depth in the "Lithostratigraphy"section (this chapter) and the total organic carbon contents areplotted vs. depth in Figure 33. The organic carbon content islow typically <0.5%.
Discussion
Diagenesis apparently controls the solute concentrationsat Site 832. Above 250 mbsf, the maxima of ammonia,phosphate, alkalinity, and methane concentrations probablyrelate to the bacterially mediated, coupled oxidation oforganic matter and reduction of sulfate (e.g., Clay pool andKaplan, 1974). This interval is characterized by rapid sedi-mentation rates (see "Sediment Accumulation Rates" sec-tion, this chapter). The pore fluids are thus quickly cut offfrom diffusive exchange with the overlying seawater, whichcauses an increase in concentration of the regeneratedsolutes. Where the sulfate concentrations are high in thedeeper section of the site, however, alkalinity, phosphate,and methane concentrations remain low and the ammoniamaxima are much smaller than in the shallower section eventhough the sediments contain roughly the same organiccarbon concentrations as in the shallow sediments (Fig. 33).
417

0.10
Figure 24. MORB-normalized incompatible element patterns for seven ash layers recovered at Site 832, North Aoba Basin (normalizing valuesfrom Pearce, 1982). Numbers refer to samples in Table 5.
Within the sediments above 250 mbsf, changes in calciumand magnesium concentrations (Fig. 31) are consistent withthe precipitation of authigenic carbonate or phosphate miner-als, particularly calcite, dolomite, and apatite. The high alka-linity may provide a source of bicarbonate for the carbonatemineral precipitation reactions and the high phosphate con-centrations may provide phosphate for the precipitation ofapatite. No authigenic calcite, dolomite, or apatite wereobserved in the sediments, however (see "Lithostratigraphy"section, this chapter), which suggests that these mineralsconstitute a small fraction of the sediment.
In addition to the carbonate and organic matter diagenesis,diagenesis of volcanogenic material appears to be important incontrolling magnesium, calcium, potassium, sodium, andchloride concentrations (Fig. 31). The maxima in chloride andcalcium concentrations, and the minimum in sodium concen-tration correspond to the tops of lithostratigraphic Units IIand IV, which are characterized by a greater concentration ofvolcanogenic material (see "Lithostratigraphy" section, thischapter). Similar changes in concentrations of magnesium andcalcium are attributed to alteration of volcanic ash and basal-tic basement in DSDP sites (Gieskes, 1981; Lawrence andGieskes, 1981).
Summary
The overall control of the pore-fluid gradients at Site 832appears to be diagenesis—in particular, oxidation of organicmatter, precipitation of authigenic carbonate and phosphate
15000
110000
5000
-
//BV C D 8
-
/10/ ftαi3 u
1
50 100Zr (ppm)
150 200
Figure 25. Ti-Zr tectono-magmatic discrimination diagram (Pearceand Cann, 1973) for ashes and basaltic rocks drilled at Site 832. A andB = island-arc basalts, C = calc-alkaline basalts, and D = mid-oceanridge basalts. Symbols and numbers as in Figure 22.
418

SITE 832
Ti/100
50
Zr 50 Y* 3
Figure 26. Ti-Zr-Y tectono-magmatic discrimination diagram (Pearceand Cann, 1973) for volcanic ashes (including more differentiatedsamples) and lava clasts recovered at Site 832, North Aoba Basin.WPB = within-plate basalts, IAT = island-arc tholeiites, CAB =calc-alkaline basalts, and MORB = mid-ocean ridge basalts. Symbolsand numbers as in Figure 22.
minerals, and alteration of volcanogenic sediments. The porefluids show no evidence of flow of meteoric water from thesurrounding islands, perhaps because Site 832 is located nearthe geographic center of the Aoba Basin. The lack of hydro-logic flow implies that if hydrocarbons are generated they willnot be flushed from the sediments, but the low organic carboncontents suggest that the sediment penetrated at Site 832 maynot contain large volumes of hydrocarbon source material.
STRUCTURAL STUDIESAll deformational structures observed at Site 832 result
from small- to large-scale slumping, normal microfaulting, andcompaction processes. Structural features observed in Hole832B (144-1107 mbsf) are illustrated in Figure 34. Attitude ofbedding planes and distribution of deformational structuretypes allow us to distinguish five structural units (A through E)that are described below from top to the base of the hole.Boundaries between these structural units are poorly definedbecause they are never outlined by tectonic features. Thesestructural units often correspond to lithostratigraphic units(see "Lithostratigraphy" section, this chapter).
Structural Unit A spans the interval from 0 to about 415mbsf (from Core 134-832A-1H to top of Core 134-832B-29R.Vitric ashes and sandy to clayey volcanic silts of lithostrati-graphic Unit I (see "Lithostratigraphy" section, this chapter)and the upper part of the sandstones, siltstones, and clay-stones of lithostratigraphic Unit II are the dominant sedimenttypes of Unit A. Structural Unit A is primarily characterizedby horizontal to subhorizontal bedding surfaces and raredeformational structures. Above 270 mbsf (Core 134-832B-14R), the presence of unconsolidated sediments and soupyvitric ash layers complicates the interpretation of the observedfeatures in the cores. However, almost vertical or steeplyinclined beds bounded above and below by subhorizontallayers at 15 mbsf (interval 134-832A-2H-6, 120-150 cm) and at76-80 mbsf (from Section 134-832A-10H-3 to Section 134-832B-2H-5) are interpreted as slump induced. Steeply dippingor vertical microfaults with small normal displacement (fewmillimeters to 1 cm) are noted at 10 mbsf (interval 134-832A-
2H-3, 100-105 cm), 14 mbsf (interval 134-832A-2H-6, 20-25cm), and 74 mbsf (interval 134-832A-10H-2, 57-60 cm). Below270 mbsf, sediments are partially lithified. Some subverticalfaults occur between 312 and 320 mbsf (Cores 134-832B-18Rand -19R).
Structural Unit B spans the interval from 415 to 626 mbsf(from the top of Core 134-832B-29R to the top of Core134-832B-51R), and is composed of sandstones, siltstones,and clay stones of the lower part of lithostratigraphic Unit II,and chalks and calcareous volcanic mixed sedimentary rocksinterbedded with volcanic sandstones and breccias of litho-stratigraphic Unit III. This structural unit is characterized byextreme variations in bedding plane dip angles (e.g., horizon-tal to vertical) (Fig. 34). These attitudes are attributed to thepresence of abundant slump folds. Slump-fold hinges wererecovered in the intervals Section 134-832B-31R-2, 130 cm, toSection 134-832-31R-3, 50 cm; Section 134-832B-32R-3, 25-70cm; Section 134-832B-35R-2, 87-95 cm; Section 134-832B-36R-2, 5-25 cm; Section 134-832B-39R-2, 45-55 cm; and Sec-tion 134-832B-45R-2, 110-135 cm. One of the best examples ofslump-fold hinges is shown in the Figure 35. Some microfaultswith a normal (interval 134-832B-36R-2, 5-10 cm) or reverse(interval 134-832B-32R-3, 25-30 cm) sense of movement arelocally associated with the slump structures.
Structural Unit C spans the interval from 626 to 702 mbsf(from the top of Core 134-832B-51R to the top of Core134-832B-59R) and corresponds to lithostratigraphic Unit IV,which is composed of basaltic breccia and volcanic sandstoneand siltstone. In this unit bedding planes are only observed inthe intervals of laminated siltstones with dips of 30° to 65°(from Section 134-832B-51R-2 to the top of Core 134-832B-53R). Large variations in the dip of bedding planes and thepresence of a flat shear plane at the base of a steeply dippingbed in Section 134-832B-53R-5 suggest that the observedbedding attitudes may result from slumping. Structural Unit Cis also characterized by the occurrence of tilted conjugatenormal faults. The best examples of these structures areobserved in the laminated siltstones of intervals 134-832B-53R-4, 35-45 cm, and 134-832B-53R-6, 12-37 cm (Fig. 36).The faults at interval 134-832B-53R-4, 35-45 cm, can bedivided into two conjugate sets: one set dips steeply (80° tovertical) and shows dip slip motion, whereas the other set dipsgently (30°-45°), showing a normal sense of movement. Whenbedding is restored to horizontal, both sets of faults representa normal displacement and dip steeply in the opposite direc-tion. These structures indicate that the siltstones of Unit Cwere affected by normal faulting prior to tilting.
Structural Unit D spans the interval from 702 to 866 mbsf(from the top of Core 134-832B-59R to the top of Core 134-832B-76R) and corresponds to lithostratigraphic Unit V, whichpredominantly consists of silty limestone with calcareous vol-canic siltstone and vitric ash. This structural unit is characterizedby the presence of vein structures (tension gash arrays; Fig. 37),normal microfaults with very well-developed slickensides on thefault planes (Fig. 38), and horizontal bedding except in its basalpart where slumps occur (Core 134-832B-74R). Moreover, ininterval 134-832B-71R-2, 56-68 cm, a gypsum vein (1 to 1.5 cmwide) occurs (Fig. 39). Microfaults occur from Core 134-832B-63R to Core 134-832B-74R, but are especially abundant from 740to 769 mbsf (Core 134-832B-63R to Core 134-832B-65R). Mostfault planes dip 30° to 50° although some are shallower (up to 10°)and steeper (up to vertical). Well-developed slickensides can beobserved on most of the fault planes (Fig. 38). Offsets of beddingor steps on the thin mineralizations that coat the fault planesalways indicate a normal sense of motion. Displacements areonly of small magnitude, ranging from 1 to 5 mm. Vein structureshave been observed at different levels between 750 and 846 mbsf(intervals 134-832B-64R-1,45-55 cm; 134-832B-65R-1,115-125
419

SITE 832
100.00
JQ•
8 •
9 D
1011 O
12 A
13 Δ
14 +
10.00 XT
CDcrO
1.00
0.10Sr K Rb Ba Nb Ce Zr Ti
Figure 27. MORB-normalized incompatible element patterns for basaltic clasts encountered at Site 832, North Aoba Basin (normalizing valuesfrom Pearce, 1982). Dashed lines emphasize samples with more distinct calc-alkaline geochemical affinities (see text for explanation). Numbersrefer to samples in Table 5.
cm; 134-832B-65R-2, 30-35 cm; 134-832B-70R-6, 23-24 cm;134-832B-71R-5, 25-35 cm; 134-832B-72R-5, 62-67 cm; and134-832B-73R-3, 105-120 cm). These small-scale (1-6 cm) veinsare vertical to oblique with respect to the bedding and show aplanar to sigmoidal trace on the core face. The sigmoidal featureof Figure 37 is composed of tension gashes associated withnormal microfaults. Similar structures have been found in sev-eral DSDP cores and are interpreted as a response to bedding-parallel extension (Lundberg and Moore, 1986).
Structural Unit E spans the interval from 866 to 1107 mbsf(from the top of Core 134-832B-75R to the base of Core134-832B-100R), and corresponds to lithostratigraphic UnitsVI and VII, which consist predominantly of volcanic sand-stone and basaltic breccia. In this structural unit beddinggenerally is poorly defined. However, when it can be ob-served in the fine-grained layers, the dip angles rangebetween 20° to 40°, which is remarkably different fromstructural unit D, in which bedding is almost horizontal.Locally the bedding is vertical (Section 134-832B-84R-1)and even overturned (intervals 134-832B-85R, 30 cm, to-85R-4, 65 cm, and in the top of Section 134-832B-86R-3).This attitude of bedding results from slumps as indicated bythe slump fold-hinge recovered in the interval 134-83 2B-85R-4, 55-85 cm, and located below a 2-m-thick overturnedsequence. Reverse and left lateral strike slip microfaults areassociated with these slump structures. In Section 134-
832B-87R-1, tilted conjugate normal microfaults indicatethat sediments at the base of Hole 832B were affected bynormal faulting prior to tilting.
PALEOMAGNETISM
The natural remanent magnetization (NRM) and the mag-netization after alternating field (AF) demagnetization using apeak field intensity of 10 mT were measured in archive halvesof APC and selected XCB and RCB cores at 5-cm intervalsusing the cryogenic magnetometer. A pilot set of 144 discretesamples taken from the working halves of cores (32 samplesfrom Hole 832A and 112 samples from Hole 832B) wasprogressively demagnetized using the Schonstedt AF demag-netizer and measured with the Molspin spinner magnetome-ter. Cores 134-832A-2H to -11H were oriented using themultishot orientation technique. Magnetic susceptibility wasmeasured at 5-cm intervals on all cores from Holes 832A and832B.
Paleomagnetic Results at Hole 832A
Most sediments recovered at Hole 832A are unlithifiedsandy to clayey volcanic silts. Remanent magnetizations inCores 134-832A-2H to -11H (0-91.5 mbsf) after AF demag-netization at 10 mT are of normal polarity (Fig. 40). Theobserved scatter in inclination and declination is best ex-plained by incomplete removal of a strong drilling-induced
420

SITE 832
Table 6. Pore-fluid chemistry, Site 832.
Core, section,interval (cm)
134-832A-
1H-3, 145-1504H-3, 145-1506H-3, 145-1508H-2, 144-150
10H-3, 143-15016H-3, 145-15019H-1, 145-15024X-2, 145-150
134-832B-
9R-2, 140-15015R-2, 58-6817R-1, 10-2019R-1, 140-15021R-3, 140-15023R-2, 16-3128R-2, 135-15030R-4, 138-15032R-2, 135-15034R-1, 135-15037R-3, 130-15040R-1, 123-13542R-2, 0-1345R-1, 130-15047R-1, 130-15049R-CC, 0-2059R-3, 130-15061R-2, 130-15063R-6, 0-2066R-3, 130-15069R-4, 0-2072R-4, 127-146
Depth(mbsf)
4.523.042.059.577.0
117.5142.5180.7
222.9280.0300.3319.5341.8358.2407.8428.0445.8462.9494.7520.7540.4569.0588.3611.2706.3723.6747.3773.1802.3832.8
pH
7.97.88.08.18.17.88.07.8
8.08.27.97.8
8.18.98.58.38.38.1
8.16.77.78.07.98.2
Salinity(‰)
34.535.134.034.034.034.034.034.5
34.236.038.041.045.045.046.343.242.242.041.044.042.546.248.050.648.545.144.240.044.046.0
Chloride(raM)
551560566568566573577583
596622642673700692674653645645637655674698719742708682678631680704
Sodium(mM)
477486483484489489490495
499501484443392363344410441477488488481447415344374401431448462450
Potassium(mM)
12.1011.7310.8010.8610.329.579.749.24
10.8215.2412.559.114.433.862.334.776.808.918.267.896.385.675.113.964.344.204.054.203.873.63
Magnesium(mM)
50.6046.1047.2746.7143.7942.3042.5542.69
35.4714.2415.7112.0500002.902.523.337.842.690.903.330.543.233.86
9.2310.080
Calcium(mM)
9.293.011.932.322.172.282.533.35
4.6630.5954.48
102.27168.30177.33192.44140.78116.6797.4190.5185.08
110.25148.43166.78215.93180.15150.59
98.37122.78147.03
Sulfate(mM)
26.14.50.60.70.80.81.22.4
0.62.94.87.9
12.813.817.021.522.022.022.023.823.421.320.416.514.514.614.419.922.920.8
Alkalinity(mM)
4.923.028.030.030.027.326.321.7
11.00.70.50.5
0.40.90.50.30.30.3
0.40.30.40.30.10.3
Phosphate(µM)
12.075.099.7
104.5119.889.386.442.5
14.81.00.70.7
0.50.50.50.50.50.5
0.50.50.50.50.5
Ammonia(µM)
711336168019732307229122461897
20541599115969320316846
142261429386323261301203145272349
298352207
Silica(µM)
396425437425542484530501
458316389446473511121389477379404358429439282408586270
156230150
component of magnetization and by drilling disturbance.Several layers of unconsolidated sands are interbedded in theclayey volcanic silt. This type of lithology usually gives poorerrecovery and is easily disturbed during drilling.
Intensities of remanent magnetization of the Pleistocenesediments after demagnetization at 10 mT are about 0.1 to 0.3A/m, similar to intensities of Pleistocene sediments observedat Sites 827, 828, 829, and 830. Characteristic magnetizationsof discrete samples of the Pleistocene sediments (Fig. 41) wereeasily identified from the orthogonal demagnetization dia-grams and secondary magnetizations are generally removedby demagnetization at 20 mT. Although recovery was poor inCores 134-832-12H to -26X (91.5-206.2 mbsf), paleomagneticresults suggest that these sediments were deposited within theBrunhes Chron.
Paleomagnetic Results at Hole 832BPaleomagnetic results at Hole 832B reflect lithologic vari-
ation. Hence, discussion of the paleomagnetic data from Hole832B is organized according to the major lithologic changesobserved in the cores. Seven lithostratigraphic units wereidentified at Site 832 (see "Lithostratigraphy" section, thischapter for a description of the units). Paleomagnetic datafrom Cores 134-832B-2R through -50R (154.1-625.7 mbsf;lithostratigraphic Subunit IB and Units II and III) are summa-rized in Figure 42. Inclinations, although scattered, are pre-dominantly negative, indicating a normal polarity for thesecores. However, Stepwise AF demagnetizations performed onsome discrete samples taken from these cores revealed com-plicated demagnetization behavior. As shown in Figure 43,several samples from Core 134-832B-43R (548.5-558.2 mbsf)exhibited demagnetization curves that missed the origin of thevector plots, indicating that some components of magnetiza-tion were not removed from the samples. This demagnetiza-
tion behavior seems to coincide with cores that displayedslump structures.
The basaltic breccias (lithostratigraphic Unit IV, Core134-832B-51R to -58R, 625.7-702.0 mbsf), also exhibit dis-tinctive magnetic behavior. As shown in Figure 42, NRMintensities of the basaltic breccias are higher than those fromthe overlying sediments of lithostratigraphic Unit III, as aremagnetic susceptibilities. AF demagnetization of 15 discretesamples of the basaltic breccias yielded a stable characteristiccomponent of magnetization after removal of a soft drilling-induced component of magnetization. However, the fact thatthis magnetic signature is well behaved does not ensure thatthe magnetization is of primary origin. For example, volcanicsiltstones and sandstones from Core 134-832B-53R exhibitfaulting, convoluted slumped beds, and steeply dipping beds.Results of AF demagnetization of five samples taken from thiscore indicate that the magnetization might postdate all theobserved sedimentary structures and tectonic activities. Amore detailed study of additional discrete samples is requiredfor further interpretations of the paleomagnetic data.
A major change in lithology occurs at the top of Core134-832B-59R near 700 mbsf (see "Lithostratigraphy" sec-tion, this chapter). The sediments below this depth consistpredominantly of light gray to dark greenish gray limestoneand volcanic sandstones (lithostratigraphic Unit V). The NRMintensities and magnetic susceptibilities of this unit are lowerthan those of the overlying volcanic sandstone and basalticbreccia of lithostratigraphic Unit IV and the sedimentaryrocks of lithostratigraphic Units I—III discussed above. Pass-through cryogenic magnetometer measurements revealed sev-eral intervals of magnetic polarity changes (Fig. 44) through-out this unit, which were later confirmed by detailed AFdemagnetization measurements of 27 corresponding discretesamples. The determination of polarity change is based pri-
421

SITE 832
200
<fi 400.Q
E
600
800
1000
•
i . i
500 600 700 30 50 70 90 0 10 20 0 20 40 0 100 200 300 400 500Chloride (mM) Salinity (‰) Potassium (mM) Magnesium (mM) Calcium (mM) Sodium (mM)
200-
400
Q_CD
Q 600
1 '•j••
••
ri
i
i
••
•
•
i
•
•
•
\
i/-•-•
I . I .
• • • > . ' •
• _
•
•••• ••••i i i
I*••»*•• • •// _•
•800 -
10000 20 40 0 40 80 120 1000 2000 0 10 20 30 40
Alkalinity (mM) Phosphate (µM) Ammonia (µM) Sulfate (mM)
Figure 28. Pore-fluid gradients, Site 832. The arrows indicate seawater concentrations.
200 400 600Silica (µM)
800
marily on the change in sign of the inclination. However,when cores contain long, continuous pieces, changes in incli-nation may sometimes be correlated with near-180° variationin declination. An example is given by the two discretesamples taken from the same piece of core at the bottom ofSection 134-832B-70R-6 (Fig. 45), from which negative andpositive inclinations, as well as nearly antiparallel declina-tions, are observed.
Cores 134-832B-78R to -84R (870-950 mbsf) recoveredmainly volcanic sandstones of lithostratigraphic Unit VI.Demagnetization of these cores at 10 mT revealed onlypositive inclinations (Fig. 46).
The deepest rocks recovered at Site 832, from Cores134-832B-84 to -100R (942.9-1106.7 mbsf), consist mainly ofbasaltic breccia and conglomerate (lithostratigraphic UnitVII). The NRM intensities (Fig. 46) and magnetic susceptibil-
ities (Fig. 47) of this unit are significantly lower than those ofthe overlying units, probably reflecting an increase in theamount of alteration (see "Igneous Petrography" section, thischapter).
MagnetostratigraphyThe first polarity reversal was found in Core 134-832B-59R
at a depth of 707 mbsf. However, biostratigraphic data suggestthat sediments below this depth may be of late Pliocene ageand that the last occurrence of the foraminifer Globorotaliatosaensis, which became extinct at approximately 0.6 Ma ago,was in Core 134-832B-18R (308.4-318.1 mbsf). This informa-tion suggests that sediments from about 400 to 700 mbsf weredeposited during the early Pleistocene, corresponding mostlyto a period of reversed polarity (Matuyama Chron). Apartfrom a short piece of core (about 30 cm long) from the top of
422

SITE 832
200 -
400 -
fCD
Q
1000
600 -
800 -
5 10Fluid yield (cm3/cm)
15
Figure 29. The yield of fluid per centimeter of core that was squeezed,Site 832. This value is only a qualitative measure of the watercontained in the sample because some variable amount of the samplewas removed from each sample prior to squeezing.
Core 134-832B-26R (385.6 mbsf) that recorded a positiveinclination (confirmed by progressive AF demagnetization ofone discrete sample), there is no evidence for reversed polar-ity interval from Core 134-832B-1R to -58R (160-707 mbsf).Unfortunately, we cannot dismiss the possibility that thereversed interval in Core 134-832B-26R has been displaced byslumps. Assuming that the biostratigraphic ages are correct,the failure to recognize the Brunhes/Matuyama boundaryfrom cores recovered at Site 832 may result from an unrecog-nized sedimentary hiatus or by a possible large magneticnormal overprint during the Brunhes Chron.
Both cryogenic magnetometer measurements and AFdemagnetizations of discrete samples identified several mag-netic reversals from 700 to 850 mbsf. Key biostratigraphicmarkers permitted the tentative correlation of some polarityintervals found at Site 832 with the geomagnetic time scale(Berggren et al., 1985a, 1985b; see Fig. 48). On the basis offoraminiferal and nannofossil assemblages, the age of Core134-832B-59R is placed at the Pliocene-Pleistocene bound-ary. Thus, the first magnetic polarity shift from normal toreversed may correspond to the bottom of the Olduvaievent. The Matuyama-Gauss boundary may correspond tothe reversal recorded in Core 134-832B-61R at a depth of724.7 mbsf. Preliminary biostratigraphic evidence also sug-
CDD
u
50
100
150
200
250
-
-
I . I .
y
•
*
•
-
I . I . I .
10 20 30 40 50 60Magnesium (mM) Calcium (mM)
Figure 30. Calcium and magnesium pore-fluid concentrations from 0 to250 mbsf plotted vs. depth. Arrows indicate seawater concentrations.
gests that the reversal in Core 134-832B-64R at a depth of750 mbsf may represent the boundary between the Gaussand Gilbert chrons. Furthermore, the reversal at 808.7 mbsf(Core 134-832B-69R) is placed at the bottom of GilbertChron on the basis of nannofossil ages in sediments fromCore 134-832B-69R.
Short polarity intervals may be correlated with geomag-netic subchrons, assuming that these age determinations andthe major corresponding boundaries have been correctlyrecognized. The short normal polarity interval from 713.2 to713.7 mbsf may correspond to the Reunion event in theMatuyama Chron at about 2.1 Ma. If we assume that the topof the Gilbert Chron is found at 750 mbsf, we do not observethe reversed polarity intervals delimiting the Kaena andMammoth events at the base of the Gauss Chron. However,the correlation of the three normal polarity intervals (753.5-755.2 mbsf; 760.2-762 mbsf; 763.3-766.5 mbsf) with theCochiti, Nunivak, and Sidufjall events within the GilbertChron (Fig. 48) is questionable.
The poor recovery in Cores 134-832B-67R and -68R(778.6-797.8 mbsf) introduces a gap in the magnetostrati-graphic record. Although progressive AF demagnetization at50 mT of two discrete samples from Cores 134-832B-66R and-67R revealed positive inclinations, no stable endpoints werereached for the magnetizations. A similar situation was alsofound in Cores 134-832B-78R to -100R (885.0-1106.7 mbsf). Inaddition, several discrete samples from these cores exhibitedsteep negative inclinations even after AF demagnetization at80 mT, indicating incomplete removal of a strong normalmagnetic overprint. We therefore consider these paleomag-netic results to be uncertain (shaded areas in Figs. 44 and 48).The normal polarity intervals (808.7-816.6 mbsf; 819.7-830.5mbsf) in Figure 48 may correspond to Chron 5 (or anomaly3A).
The magnetic polarity sequence is often not well defined bymeasurements using the cryogenic magnetometer because theapplied AF fields of 10-15 mT are usually not sufficient toisolate the primary magnetization. Much more detailed workon the remaining discrete samples from Site 832 is needed torefine these correlations.
Magnetic SusceptibilityMagnetic susceptibilities of sediments and igneous rocks
recovered at Site 832 exhibit large variations, sometimes even
423

SITE 832
200
900500 600600 700 800 0 100 200 300 300 400 500
Chloride (mM) Calcium (mM) Sodium (mM)
Figure 31. Chloride, calcium, and sodium pore-fluid concentrations from 200 to 900 mbsf plotted vs. depth. Arrows indicate seawaterconcentrations.
within a single core, because of the variability in the amount ofvolcanic material present (Fig. 47). Magnetic susceptibilitiesof the volcanic silt and sandstone in lithostratigraphic UnitsI—III (from 0 to 625.7 mbsf) average about 0.01 SI units. Thebasaltic breccia of lithostratigraphic Unit IV (from 625.7 to702.0 mbsf) is easily distinguished by its much higher magneticsusceptibility values, typically of about 0.02 to 0.04 SI units. Amajor stratigraphic unconformity that corresponds to a litho-logical transition from the basaltic breccia to the underlyingsilty limestones of lithostratigraphic Unit V is also revealed bythe susceptibility data with values from about 0.005 to 0.01 SIunits. The rather high susceptibilities in the silty limestonesmay reflect the abundance of volcanic material in the lime-stones. The susceptibilities of the underlying volcanic sand-stone of lithostratigraphic Unit VI are even lower than thoseof the limestones. The susceptibilities of the basaltic breccia inlithostratigraphic Unit VII (from 952.6 to 1106.7 mbsf) are
generally less than 0.01 SI units. The lowest susceptibilitiesrecorded at Site 832 occur from about 1040 to 1100 mbsf,corresponding to a zone in which the matrix of the basalticbreccia is rich in alteration minerals including palagonite,chlorite, clay, and zeolite (see "Igneous Petrography" sec-tion, this chapter).
SEDIMENT ACCUMULATION RATESThe sediment accumulation rates at Site 832 are estimated
from lines constructed by the extrapolation of points repre-senting observed nannofossil and foraminiferal datums (Fig.49). As with the biostratigraphy, the sediment accumulationrate interpretations at Site 832 are limited by the discontinu-ous nature of the microfossil record resulting from extensivebarren intervals.
The estimated rate of accumulation in the interval fromSection 134-832A-1X-CC to 134-832B-22R-CC (0-356 mbsf)
424

SITE 832
1000
12000 10000 20000
Methane (ppm)
Figure 32. Methane concentrations in the headspace samples.
30000
is 356 m/m.y. The estimated rate of accumulation decreased to286 m/m.y. over the interval from Section 134-832B-22R-CCto 134-832B-59R-CC (356-711 mbsf); however, because therate across this interval relies upon the placement of the firstoccurrence of the Globorotalia truncatulinoides, some uncer-tainty exists for this rate.
Unlike the other datums used in determining sedimentaccumulation rates at Site 832, the first occurrence of G.truncatulinoides is represented by two error bars. The verticalerror bar represents the uncertainty in the first clear appear-ance of a keel in the last chamber of Globorotalia tosaensis(the ancestral species of G. truncatulinoides), which occurs inthe interval between Samples 134-832B-40R-CC and -50R-CC(519-625 mbsf). The horizontal error bar indicates the uncer-tainty in age for this datum, which has been shown to occurbetween 1.9 and 2.7 m.y. (Hills and Thierstein, 1989). Themidpoint of the resulting rectangle created by the two errorbars is the point from which sediment accumulation rates arecalculated in this study. Considering the degree of possiblevariation in the G. truncatulinoides datum, it is reasonable toaccept a generalized sediment accumulation rate greater than250 m/m.y. for the interval from Section 134-832A-1X-CC to134-832B-59-CC (0-711 mbsf).
A change in the sediment accumulation rate occurs be-tween Samples 134-832B-59R-CC and 134-832B-76R-CC(711-875 mbsf). Although a possible short hiatus within theupper Pliocene or lower Pleistocene complicates the estima-tion of rates across this interval (see "Biostratigraphy" sec-
tion, this chapter), the microfossil datums suggest that the rateis less than 100 m/m.y. This slower rate of deposition, relativeto the overlying cores, is also supported by a lithologic changeas evidenced by the presence of fine-grained, hemipelagicsediments below Sample 134-832B-59R-CC (711 mbsf).
The nannofossil and foraminiferal datums in Samples 134-832B-84R-CC (952 mbsf) and 134-832B-85R-CC (962 mbsf)suggest that a second unconformity exists somewhere withinthe barren interval above Sample 134-832B-84R-CC (952mbsf). Due to the lack of datums below Sample 134-832B-85R-CC (962 mbsf), no further estimates for the remainder ofHole 832B can be made on the basis of microfossils.
PHYSICAL PROPERTIESMeasurements of index properties and Hamilton Frame
sonic velocities were completed on sediments and rocks atSite 832. Full APC and XCB cores from Hole 832A weremeasured using the gamma-ray attenuation porosity evaluator(GRAPE) and the P-wave logger (PWL) on the multisensortrack. Undrained shear strength measurements were com-pleted on the APC/XCB cores of Hole 832A (2.35-196.8 mbsf)and on the undisturbed upper cores of Hole 832B (164.2-260.5mbsf). All measurements at Site 832 were made according tothe procedures described in the "Explanatory Notes" chapter(this volume).
Index PropertiesValues of porosity (wet and dry), water content (wet and
dry), and bulk density (wet-, dry-, and grain) for Site 832 arelisted in Table 8. Figure 50 illustrates the variation of porosity,water content, and bulk density as a function of depth belowseafloor. Bulk density trends often mirror those of porosityand water content; therefore, bulk density and porosity areplotted against depth along with the lithostratigraphic units inFigure 51.
At Site 832, porosity ranges from 9.2% to 80.3%, watercontent ranges from 3.4% to 85.5%, and bulk density rangesfrom 1.45 to 3.31 Mg/m3. The index properties data can beseparated into three distinct zones. The zones are closelyassociated with the lithostratigraphic division at the site, withexception of the lithostratigraphic Unit I/Unit II boundary.The zones are associated with the lithostratigraphic units asfollows:
Index Zone 1 == 0-312.4 mbsf in lithostratigraphic Unit I, Unit III(Hole 832B, 461.5-625.7 mbsf), Unit V (Hole 832B, 702.0-865.7mbsf), Unit VI (Hole 832B, 865.7-952.6 mbsf), and Unit VII (Hole832B, 952.6-1106.7 mbsf);
Index Zone 2 = 312.4-385.6 mbsf in lithostratigraphic Unit I, andUnit II (Hole 832B, 385.6-461.5 mbsf); and
Index Zone 3 = lithostratigraphic Unit IV (Hole 832B, 625.7-702.0mbsf).
Index Zone 1 (0-312.4, 461.5-625.7, and 702.0-1106.7 mbsf)includes most of the total depth and is composed of severallithologies (see "Lithostratigraphy" section, this chapter). Zone1 is characterized by porosity and water content values whichdecrease very slowly with depth. In the upper part of the zone,particularly from 0 mbsf to about 160 mbsf, water content valuesare high and somewhat scattered (Fig. 50). The near-verticalgradient suggests that the sediments are underconsolidated,possibly as deep as 300 mbsf. Between the surface (at 2.3 mbsf)and 1099.8 mbsf, porosity and water content decrease from78.3% to 35.3% and from 85.9% to 18.6%, respectively (Table 8).The bulk density also increases slowly within index Zone 1, from1.74 Mg/m3 at 2.3 mbsf to 2.31 Mg/m3 at 1099.8 mbsf. IndexZone 2 (312.4-461.5 mbsf) is an interval which is composed ofsed-lithic- and basaltic-breccia, volcanic clay, silt, and sand.This zone is characterized by index property values which are
425

SITE 832
Table 7. Sediment carbon contents, Site 832. Table 7 (continued).
Core, section,interval (cm)
134-832 A-
1H-2, 80-831H-4, 80-832H-2, 80-832H-4, 77-802H-6, 81-843H-2, 80-834H-1, 130-1334H-3, 115-1184H-5, 117-1204H-6, 147-1505H-1, 130-1335H-3, 130-1335H-5, 130-1335H-7, 50-536H-1, 127-1306H-3, 132-1356H-4, 75-786H-7, 40-437H-2, 117-1207H-4, 117-1207H-6, 117-1208H-1, 120-1238H-3, 65-688H-5, 29-329H-2, 104-1069H-5, 103-1069H-74, 53-56
10H-1, 140-14310H-3, 127-13010H-6, 140-14311H-1, 130-13311H-4, 130-13311H-6, 130-13312H-2, 77-8012H-4, 78-7913H-2, 79-8014H-2, 79-8015H-2, 73-8016H-2, 80-8316H-2, 127-13016H-4, 78-8917H-1, 77-8017H-3, 78-9018H-2, 79-8018H-4, 78-7919H-2, 77-8020H-1, 145-14820H-3, 130-13321X-CC, 7-824X-2, 131-13524X-4, 7-826X-1, 9-12
134-832B-1R-CC, 4-62R-CC, 18-193R-1, 54-553R-CC, 14-154R-CC, 18-197R-1, 60-638R-1, 85-889R-1, 6-89R-2, 100-103
11R-CC, 7-1013R-1, 10-1313R-1, 125-12814R-1, 87-9015R-2, 5-716R-1, 45-4716R-2, 16-1817R-1, 17-2017R-3, 71-7318R-2, 72-7518R-3, 117-120
Depth(mbsf)
2.305.308.20
11.1714.2117.7019.8022.6525.6727.4729.3032.3035.3037.5038.7741.8242.7546.9049.6752.6755.6757.7060.1562.7965.5470.0372.5373.9076.7781.4083.3087.8090.8093.7796.78
102.80103.80108.70118.30118.80121.30126.30129.30133.80136.80143.30146.50149.30151.30180.50182.30196.80
144.44154.28164.34164.85173.88202.80212.75221.45223.90240.77260.10261.25270.57280.12289.45290.66298.87300.91310.62312.41
Totalcarbon(wt%)
1.59
1.35
0.76
0.33
0.66
0.79
0.48
0.27
0.33
0.37
0.88
0.69
0.380.470.400.81
1.35
0.44
0.92
1.130.830.65
2.72
0.801.122.971.16
1.091.721.18
0.431.05
0.470.36
1.06
0.22
1.55
Inorganiccarbon(wt%)
1.42.21.12.50.50.60.70.31.50.71.10.60.30.51.70.60.30.23.20.40.40.60.30.20.30.90.70.31.61.41.10.70.70.60.60.40.40.40.70.60.11.10.40.40.40.70.70.90.70.50.52.5
0.70.92.82.70.91.0
0.40.70.41.00.60.30.35.10.81.20.23.41.4
TOC(wt%)
0.19
0.25
0.16
0.03
0.06
0.19
0.08
0.00
0.03
0.07
0.18
0.09
0.000.070.000.11
0.25
0.04
0.22
0.230.130.15
0.22
0.120.250.220.00
0.13
0.74
0.050.09
0.130.04
0.26
0.03
0.17
CaCO3(wt%)
11.218.09.2
21.23.84.85.52.3
12.35.79.44.72.23.8
14.05.12.81.7
26.33.23.34.62.11.92.37.35.82.3
13.711.38.95.85.95.05.23.23.53.05.74.90.98.73.33.43.16.15.77.76.24.54.1
20.7
5.77.2
22.922.27.78.0
3.75.73.28.04.62.82.7
42.86.7
10.11.6
28.711.5
Core, section,interval (cm)
19R-1, 105-10819R-2, 87-8820R-3, 26-2821R-1, 105-10721R-3, 106-10822R-1, 57-5923R-1, 87-8923R-3, 68-7026R-1, 65-6826R-1, 114-11627R-1, 101-10328R-1, 17-2028R-2, 80-8328R-3, 70-7228R-3, 147-15029R-1, 37-3929R-3, 38-4029R-5, 38-4030R-2, 83-8430R-3, 88-9030R-6, 92-9531R-1, 127-13031R-3, 127-13032R-1, 137-14032R-3, 137-14033R-1, 122-12534R-2, 60-6335R-2, 110-11236R-2, 75-7837R-2, 96-9838R-1, 84-8639R-2, 85-8740R-1, 94-9741R-1, 93-9642R-2, 81-8443R-1, 47-5043R-3, 44-4744R-1, 117-12045R-1, 107-11045R-3, 72-7546R-1, 37-3946R-3, 32-3547R-1, 70-7347R-2, 87-9048R-1, 100-10349R-1, 100-10349R-3, 100-10350R-2, 63-6650R-4, 100-10351R-2, 27-2951R-4, 75-7752R-2, 85-8752R-4, 85-8752R-6, 85-8753R-2, 88-9053R-4, 88-9053R-6, 88-9054R-2, 80-8354R-4, 79-8155R-2, 140-14355R-4, 140-14356R-2, 137-14056R-4, 137-14057R-2, 67-6957R-4, 97-9958R-2, 37-4059R-2, 120-12359R-4, 120-12359R-6, 120-12360R-2, 140-14360R-4, 140-14360R-5, 127-13061R-1, 147-14861R-3, 147-15061R-6, 147-15062R-2, 25-28
Depth(mbsf)
319.15320.47330.89338.45341.46347.47357.47359.09386.25386.74396.31405.07407.20408.60409.37414.57417.58420.58425.93427.48432.02434.47437.47444.27447.27453.12463.60473.70483.06492.86500.94512.15520.44530.13541.21548.97551.94559.37568.77571.42577.77580.72587.70589.37597.70607.40610.40617.27620.62627.47630.89637.46640.19643.13647.38650.38653.38657.00660.01667.30670.30675.87678.84684.81687.97694.17704.70707.71710.71714.50717.50718.87722.27725.25729.73732.25
Totalcarbon(wt%)
4.660.49
1.062.38
4.444.20
0.79
2.05
2.03
1.35
0.093.58
5.341.883.532.413.383.832.482.963.503.263.794.89
2.79
2.67
4.53
7.472.152.87
4.21
1.41
0.73
0.09
0.04
0.67
0.040.03
0.04
3.63
5.25
4.81
3.47
Inorganiccarbon(wt%)
1.04.10.40.40.92.02.34.03.81.30.70.81.41.90.90.81.81.71.30.42.10.13.43.35.11.83.42.23.23.62.32.83.33.13.64.61.92.74.12.52.64.31.67.21.82.73.9
1.60.11.30.20.70.10.10.10.12.50.00.10.60.40.00.00.10.02.63.52.02.44.96.04.54.51.33.3
TOC(wt%)
0.520.05
0.210.38
0.470.37
0.08
0.16
0.20
0.07
0.030.18
0.200.070.160.180.170.200.150.150.170.160.180.27
0.12
0.13
0.23
0.320.310.15
0.07
0.03
0.01
0.00
0.03
0.020.00
0.00
0.14
0.31
0.28
0.19
CaCO3(wt%)
8.434.5
3.73.77.1
16.718.733.131.910.95.96.7
11.715.77.26.8
15.214.210.73.2
17.40.5
28.327.142.815.128.118.626.730.219.423.427.725.830.138.515.822.234.421.221.635.813.459.615.322.732.3
13.10.6
11.21.65.80.50.50.70.5
20.70.30.45.33.50.20.20.40.3
21.429.116.719.941.249.637.537.710.727.3
426

SITE 832
Table 7 (continued).
Core, section,interval (cm)
62R-4, 25-2863R-2, 23-2563R-4, 23-2563R-6, 21-2364R-2, 90-9264R-4, 92-9465R-2, 123-12565R-4, 124-12665R-6, 124-12666R-1, 118-12066R-3, 119-12167R-2, 112-11469R-2, 122-12469R-4, 145-14769R-6, 45-4770R-1, 149-15070R-3, 146-14870R-5, 145-14771R-2, 125-12871R-5, 104-10772R-2, 21-2372R-4, 30-3172R-6, 22-2573R-1, 10-1373R-2, 11-1473R-4, 122-12474R-1, 143-14674R-2, 140-14374R-3, 140-14376R-CC, 0-877R-CC, 20-2378R-2, 127-13078R-4, 122-12578R-6, 120-12379R-2, 115-11879R-4, 109-11280R-2, 103-10680R-4, 99-10281R-2, 137-14082R-2, 137-14082R-5, 137-14083R-1, 123-12583R-3, 123-12584R-2, 42-4485R-1, 91-9285R-2, 80-8385R-3, 123-12485R-4, 88-9085R-5, 90-9286R-1, 72-7486R-3, 71-7387R-1, 117-12087R-3, 117-12088R-1, 135-13788R-2, 130-13388R-3, 131-13389R-2, 130-13289R-4, 130-13289R-6, 134-13690R-2, 122-12492R-2, 52-5493R-2, 15-1893R-5, 15-1894R-2, 82-8495R-2, 132-13596R-2, 137-14096R-4, 137-14097R-2, 133-13697R-4, 123-12697R-6, 127-13098R-2, 120-12398R-5, 120-12399R-2, 120-12299R-4, 118-120
100R-2, 131-134100R-4, 131-134
Depth(mbsf)
735.25741.53744.53747.51751.90754.92761.93764.94767.94769.98772.79781.22800.52803.75805.75809.19812.16815.15820.15824.44828.71831.81834.69836.80838.31842.23847.83849.30850.80865.70875.50887.77890.72893.63897.35900.29906.95909.91916.81926.57930.90934.53937.53944.82953.51954.90956.83957.98959.50962.92965.91972.97975.97982.45983.84985.33993.60996.51999.55
1003.101021.501031.001035.001041.001051.001061.001064.001071.001074.001077.001080.001085.001090.001093.001100.001103.00
Totalcarbon(wt%)
1.63
7.02
8.23
2.743.40
6.08
7.97
5.380.35
0.21
8.11
0.080.89
0.06
0.050.060.09
0.61
0.260.37
0.45
0.65
0.34
0.71
0.380.940.30
0.110.100.11
0.09
0.07
0.12
0.09
Inorganiccarbon(wt%)
4.34.01.67.46.26.67.17.87.79.82.33.15.55.73.25.87.56.53.85.10.61.62.70.70.20.71.07.60.50.00.80.0.0.0.0.10.0.0.0.
))
0.80.60.40.10.42.41.02.80.40.40.30.60.50.10.40.40.70.50.60.30.90.30.40.0.0.0.0.0.0.0.0.0.0.0.00.1
TOC(wt%)
0.08
0.38
0.45
0.420.29
0.34
0.49
0.31
0.00
0.49
0.060.07
0.01
0.000.010.00
0.04
0.200.02
0.03
0.02
0.00
0.03
0.040.040.04
0.030.030.05
0.02
0.01
0.03
0.05
CaCO3
(wt%)
35.733.712.962.051.655.359.364.864.481.419.325.945.747.826.747.962.354.031.942.2
5.313.622.3
5.61.85.68.3
63.54.20.26.80.50.40.40.40.20.30.40.40.76.74.73.00.52.9
19.98.5
23.73.73.52.35.24.20.82.93.15.74.04.72.87.52.22.90.70.60.50.50.60.70.50.50.70.70.70.30.7
200 -
400 -
£ 600Φ
a
800 -
1000
1200
a
a
«
•- a
a
; ;
a
a
»
a
a
%
»
't
a
aa
i
a
ia
a
a
•a
1
a
a
a
*
•
a
a•
ia
1 '
a
• aa
•
i
1 '
a
-
-
-
-
-
i ,
0 0.80.2 0.4 0.6Total organic carbon (wt%)
Figure 33. Total organic carbon content of sediments at Site 832plotted vs. depth.
more scattered than measurements in index Zones 1 and 3.Porosity ranges from 30.4% to 80.3%, water content ranges from14.0% to 63.7%, and bulk density ranges from 1.83 to 2.92Mg/m3. Index Zone 3 (625.7-702.0 mbsf) is a similar interval,which is composed of basaltic breccia and coarse-grained vol-canic sandstone. Porosity decreases sharply from 38.8% at 627.5mbsf to 9.2% at 684.8 mbsf, and water content decreases withinthe same interval from 22.0% to 3.4%. Bulk density values arescattered in index Zone 3 and vary from 2.21 to 3.31 Mg/m3.
Sonic Velocity
Sonic velocities were measured using the PWL and theHamilton Frame in Hole 832A. In Hole 832B, the PWLcollected velocities down to 182.2 mbsf, while measurementswere taken with the Hamilton Frame throughout the hole.Hamilton Frame velocities are listed in Table 9, and thevariation in velocity with depth for Hamilton Frame is shownin Figure 50. The discussion concerning the velocities at Site832 focuses on Hamilton Frame data since PWL data wascollected only down to 182.2 mbsf, and since this data agreeswell with Hamilton Frame data within the measured interval.
At Site 832, vertical velocity ranges from 1502 to 5282 m/s andhorizontal velocity ranges from 1522 to 5337 m/s. The velocitydata generally divides into three zones, which correlate with theindex zones and the lithostratigraphic units as discussed above in"Index Properties" (this section). The vertical and horizontal
Note: TOC = total organic carbon.
427

SITE 832
150-
-
-
200 -
250 -
.Q
E,i ~
Q.ΦQ
300 "
350 -
α>
oowash
1R
2R
3R
4R
5R
6R
7R
8R
9R
10R
11R
12R
13R
14R
15R
16R
17R—18R
—19R
—20 R
91 Rc. \ π
22 R
23R
24R
25R
26R
><
$ooα>
OC
F
-
• i
^ •
• i
•
•
z
Φσ>
<
(11
cCD
ooenle
i
CL
!
σ>
o =5Sü30 60• l l ..
••
"E3
Lit
IB
II
nit
3753
O
λ••
CO
A
Structuralfeatures
i
1I
A
Comments
Slumps, loadmarks, clasticdike, convo-uted bedding
400-
450-
500-
ibsf
)
3Q.ΦQ
550-
-
600-
-
-
Eloü
27R
28R
29R
30 R
31R—32R
33R—34R
—35R
—36R
37R
38R
39R
40R
41R
42R
—43R
44R
—45R
—46R
47R
48R
49R
—50 R—51R
C O R
-
>ooα>
OC
• i
I
•
!
••-1
-•
-•m
••
•••-•
••m•
-
Φ
•
1OO
CO
lei
Φ
Φ
sto
cP
lei
• = 1
COΦ
oΦCCDü
ePIic
lat
**.
σ>M- Eo •o
Q E30 60I,I
. «>
• V
: v
• '•
••
••••
• .
••
"E3
JZ
Lit
II
III
IV
nit
3
23
O3
s>
A
B
C
Structuralfeatures
ftvs /
Jl ^
Jl
f/f/
Comments
Convolutedbedding
^Figure 35
Figure 34. Structural log of Hole 832B. Hole 832A (0-216 mbsf) is not shown because no identifiable structures wereobserved.
428

SITE 832
650-
700-
750-
800"
850 -
900 -
Co
re
53R
54R
55R
56R
57R
58R
59R
60R
61R
62R
63R
64 R
65R
66R
67R
68R
69R
70R
—71R
72R
73R
74R
75R
76R
77R—78R
>.i—
s>
I Re
co
•
1
1
•
1
•-
1
•
-1
| A
ge
Φ
So00
Φ
E
1Φ
δ
1S
»Pli
o
-
£<® «o (
°1Q.
Φ
lat
1
ΦC
soQ_>,
•
:
;
<
1
1
'
ΦcΦO
oΦ
σ>*- .EO "5o.-σ
30 60
:.;
• -
L
a
•
\
• F
f1
>1
1
»» <
<—"E3
Lith
. i
IV
'E3
"<ö•_3
Str
ucC
igure 38
V
VI
D
E
Structuralfeatures
Figure 36
f
j ^ / / . . .
v / / JJ), / , I , I . . .
fll
/Jj\ •jjj>wj/
Comments
Tilted conju-gate normalfaults
_.
Figure 37
Normalfaultswith slicken-sides
-
Normalfaultswith slicken-sides
Large veinof gypsum
Figure 39
Normalfaultswith slicken-sides
900-
950-
1000-
Φ
Q
1050-
1100-
Co
oc<
79R[
80R
81R
82R
83R
84R|
85R
86R
87R
88R
89R
90R
91R|
92R
93R
9 4 R |
95R
96R
97R
98R1
99R
100RI
σ>
30 60, , i , ,i , ,
VI
VII
Structuralfeatures Comments
//
Small verticalveins
Someslickensides
Overturnedbeds
Faults withslickensides
Tilted conju-gate normalfaults
Figure 34 (continued).
429

SITE 832
6 -
8 -
1 0 -
1 2 -
1 4 -
1 6 -
1 8 -
2 0 -
2 2 -
24"
Figure 35. Photograph of a slump fold observed in interval 134-832B-36R-2, 3-25 cm. The location is indicated in Figure 34.
cm35~
36"
37-
38
3 9 "
40 -
41
42"
43"
44-
45
Figure 36. Photograph of tilted conjugate normal faults observed ininterval 134-832B-53R-4, 35-45 cm. The location is indicated inFigure 34.
velocities are essentially isotropic at Site 832; therefore, onlyvertical velocity values are discussed.
The vertical velocity steadily increases within velocityindex Zone 1 from 1510 m/s at 5.3 mbsf to 3608 m/s at 1090.0mbsf. A subzone exists within Zone 1 in which verticalvelocity increases from 2395 to 2701 m/s between 473.7 and620.6 mbsf (index Zone 1/lithostratigraρhic Unit III). Thevelocities in this subzone of mixed volcanic and calcareousrocks increase at the same rate as in the rest of Zone 1, butthe velocities are generally higher. In velocity zone 2,vertical velocities increase sharply and are scattered. Thevelocity values range from 1738 to 3364 m/s and probablyreflect varying lithology of volcanic clay, silt, sand, andmatrix of sed-lithic breccia. One extreme value for Site 832of 5082 m/s was measured in a breccia layer at 434.5 mbsf,and this value may be the velocity of a breccia clast. Mostvelocity values (15 of 17) in velocity Zone 3 range from 3440to 4757 m/s and correlate with the coarse-grained sandstoneand matrix of breccia of lithostratigraphic Unit IV (625.7-702.0 mbsf). Two high values, 5282 m/s and 4882 m/s, at660.0 and 684.8 mbsf, may also be the velocities of brecciaclasts.
Shear Strength
Shear strength data for Site 832 are listed in Table 10.Shear-strength measurements were made only in the uncon-solidated volcanic silt of lithostratigraphic Unit I. Data withinthe measured interval (0-260.5 mbsf) are steady but scattered.The values were low, reflecting the unconsolidated nature of
430

SITE 832
cm38
40
4 2 -
4 4 -
4 6 -
48-
50"
5 2 -
Figure 37. Photograph of an array of sigmoidal tension gashesobserved in interval 134-832B-64R-1, 38-53 cm. The location isindicated in Figure 34.
numerous wet ash layers, and varied from 12.5 to 73.3 kPa(Fig. 52), an average of about 50 kPa.
Thermal ConductivityAt Site 832 thermal conductivity was measured to a depth of
181.5 mbsf in Hole 832A using the soft sediment "full-spacemethod," and from 642.8 to 1071.5 mbsf in Hole 832B using thehard-rock "half-space method." Details of these thermal con-ductivity measurement procedures are given in the "Explanato-ry Notes" chapter (this volume). No thermal conductivity mea-surements could be completed from 181.5 to 642.8 mbsf becausethe state of lithification of the cores in that interval fell betweenthe capabilities of both measurement methods.
From 0 to 181.5 mbsf in Hole 832A, thermal conductivityvalues hovered around 0.9 W/(m K), ranging from 0.75 to
Figure 38. Photograph of a fault surface with slickensides indicating anormal sense of movement along the fault. The structure was ob-served in interval 134-832B-64R-2, 105-110 cm. The location isindicated in Figure 34.
1.13 W/(m K) (Table 11). These relatively low thermalconductivity values are consistent with the wet, unconsoli-dated nature of the sediments from 0 to 200 mbsf, asindicated by other physical properties data (Fig. 50). Thehighest thermal conductivity value was recorded in theinterval from 600 to 800 mbsf, where most values are above1.20 W/(m K) (Fig. 53). These data points also correlatewith other physical properties in that interval, correspond-ing to sharp decreases in water content and sharp increasesin bulk density and velocity in the basaltic breccia oflithostratigraphic Unit IV. A pore-water sample taken in thisinterval (627.0 mbsf) provided absolutely no fluid, althoughit was squeezed for several hours at high pressure (see"Sediment and Fluid Geochemistry" section, this chapter).
SummaryPhysical properties at Site 832 varied only slightly from
the mudline to below 300 mbsf in sediments which consistedlargely of unconsolidated silty ash. This is probably theresult of the extremely rapid sedimentation rate at this siteduring the Pleistocene (see "Sediment Accumulation Rates"section, this chapter) associated with rapid tectonic subsid-ence of the Aoba Basin. Porosity and water content havehigh values, consistently the highest in the upper section ofany of the seven sites drilled on Leg 134. From 300 mbsfdownward, porosity and water content decrease slowly butcontinued to have relatively high values. Bulk density dis-plays a similar trend over the total depth of the hole. A sharpdecrease in porosity and water content and concomitantincrease in bulk density at the top of lithostratigraphic UnitIV (625.7 mbsf) is associated with well-cemented sandstonesand breccia within this unit. Maximum sonic velocities forSite 832 are also measured within this interval. A similar butless obvious trend occurs in lithostratigraphic Unit II(385.6-461.5 mbsf), suggesting that Unit II, which alsoconsists of sandstone and breccia, may be a less matureversion of Unit IV.
DOWNHOLE MEASUREMENTS
Logging OperationsLogging operations in Hole 832B began at 1430 local time
(L) on 30 November 1990 after several wiper trips down to thetotal hole depth of 1107 mbsf. A solid bridge that barred thehole at 890 mbsf had to be cleared, and to prevent hole
431

SITE 832
cm
54
56 -
5 8 -
60-
62
6 4 -
6 6 -
6 8 -
70-
72-
Figure 39. Photograph of a large gypsum vein, observed in interval134-832B-71R-2, 53-73 cm. The location is indicated in Figure 34.
collapse, the bottom of the drill pipe remained at 907 mbsf forthe first logging effort. The 1087-907 mbsf depth interval waslogged with the geophysical tool string: long-spaced sonic,lithodensity, natural gamma-ray spectrometry, dual inductionresistivity, and the Lamont temperature probe.
After this initial logging run, the drill pipe stuck for a shorttime and a strong backflow of water jeopardized logging of theentire hole, so the end of the drill pipe was positioned at 250mbsf to stabilize the borehole wall. However, after anotherwiper trip to clear the hole to 1107 mbsf, the drill pipe stuckfast with its end at 277 mbsf, where it remained for theduration of the logging. The second logging run also used thegeophysical tool string and logged the 939-277 mbsf depthinterval. The data from the two logging runs correlate well inthe zone of overlap. Because of the hole problems, the secondlogging run was done without the lithodensity tool, whichcontains a radioactive source, so no bulk density data isavailable above 907 mbsf.
The formation microscanner, combined with natural gam-ma-ray spectrometry and Lamont temperature probe, wasused during the third logging run. The log was run for1088-591 mbsf, where problems were encountered. Afterthe logging runs were finished, it became apparent that partof the bit release mechanism had fallen down around thelogging cable. We were fortunate that the tool string was notlost.
The susceptibility tool was lowered but it failed to exit fromthe bottom of the drill pipe, and to avoid damaging or losingthis tool, logging operations ceased at 2300 L on 1 December1990 after 32.5 hr. Logs obtained in Hole 832B are of goodquality, as shown in the Log Summary at the end of thischapter.
Comparison of Well-Log Data to Core LithologyIn this section the well-log data (see Log Summary) are
compared to the lithostratigraphy. Well-log data were collectedonly below 277 mbsf, beginning within lithostratigraphic Unit I(0-385.6 mbsf), which includes Pleistocene volcanic sand, silt,and clay. The shapes of the well-log curves in the lower part ofUnit I are indistinguishable from those in lithostratigraphic UnitII (385.6-461.5 mbsf). Unit II also consists of Pleistocenevolcanic sand, silt, and clay but contains an increasing amount ofcalcareous material downhole. The signature of the resistivitylog over Units I and II includes sharp peaks that reveal alternat-ing high and low resistivity beds. The high resistivity bedsalsotend to have relatively high velocity values (low transittimes) and low gamma-ray readings. The gamma-ray log showsa gradual, linear decrease downward across the upper two units;this gamma-ray decrease may result from the increased calcar-eous content in Unit II.
The shapes of well-log curves over lithostratigraphic UnitsI and II contrast with those from the underlying Unit III(461.5-625.7 mbsf), which includes Pliocene(?) and Pleis-tocene chalks, limestones, and calcareous volcanic sand-stones, siltstones, and breccias. Throughout Unit III theresistivity log shows generally low values with subdued peaksthat are much lower than those of the overlying Unit II. Thesonic log shows less variation than it does over Units I and II.The gamma-ray log decreases gradually in Unit III, reaching aminimum value at about 600 mbsf, and then the valuesincrease gradually, indicating a greater clay content down-ward toward the underlying breccia of Unit IV.
Unit IV (625.7-702.0 mbsf) is an upper Pliocene andPleistocene basalt breccia, having a transitional upper contactthrough which the grain size increases gradually. The resis-tivity- and sonic-log readings support the concept of a transi-tional upper contact, in that both logs increase over the depth
432

SITE 832
interval 620-642 mbsf. The lower part of the basaltic brecciahas the highest resistivities and velocities of any rocks pene-trated at Site 832. The lower contact with the limestone oflithostratigraphic Unit V is abrupt in all logs, for over a shortdepth interval (2 to 3 m), resistivity decreases to some of thelowest values obtained at this site, and the velocity andgamma-ray logs drop precipitously. The large decrease in thesonic log should produce a strong reflection, and such areflection is evident in the multichannel seismic data but not insingle-channel data. This discontinuity in logs correlates withan angular unconformity evident on seismic sections (see"Seismic Stratigraphy" section, this chapter).
Upper Miocene and Pliocene limestone of Unit V (702.0-865.7) underlies the basaltic breccia of Unit IV. Log readingsover the limestone are subdued, and in this respect are similarto readings over the calcareous rocks of Unit III. The gamma-ray log increases gradually with depth through Unit V, indi-cating progressively more clay, and this increase parallels agradually increasing rock resistivity. From core descriptions,the base of this limestone has been placed at 865.7 mbsf,within an interval of little to no core recovery. A largediscontinuity in the resistivity log and a small one in the soniclog occur deeper, at about 887 mbsf, where core recoveryincreases dramatically.
Unit VI (865.7-952.6 mbsf) is a possibly middle Miocenevolcanic sandstone. The unit is distinguished from the over-lying one on the basis of a much higher resistivity and aslightly higher velocity. The bottom of this unit is marked inlog readings by a very low-resistivity, low-velocity intervalthat is about 7 m thick. Bulk density also drops dramatically inthis interval while the caliper indicates a much smaller holediameter.
Unit VII (952.6-1106.7 mbsf) is a possibly lower Miocenebasaltic breccia. Sonic-log values from this unit differ littlefrom readings obtained from the lower part of Unit VI, butboth sonic and resistivity and bulk density logs increasesuddenly deep within this unit, at 1042 mbsf. This abruptincrease corresponds to the presence of basaltic breccia andvolcanic sandstones (see core description forms near the backof this volume). The increased density and sonic velocity isalso observed in measurements on core samples (see "Phys-ical Properties" section, this chapter).
FMS LoggingFMS data were recorded at Hole 832B between 630 and
1090 mbsf. Difficulty in moving the tool when it was above 630mbsf resulted in a decision to make only one logging pass.Except in a few depth zones (782-785 mbsf, 865-870 mbsf,and 950-955 mbsf), the small diameter of the hole (between 10and 14 in.) provided good contact between the pads and theborehole wall, and excellent data were obtained. FMS datawere processed aboard the JOIDES Resolution, and theprocessed data are presented on microfiche at the back of thisvolume. Data processing available aboard ship includes theautomatic computation of dip and dip azimuth of planarfeatures—mainly bedding, faults, fractures, and veins—thatintersect the borehole. The dip and dip azimuth of steeplydipping features (more than 60°) had to be measured by handon the images and are therefore imprecise.
Faults, fractures, and bedding planes are described below(see summary in Fig. 54) from FMS images and compared toobservations reported from core descriptions (see "StructuralStudies" section, this chapter). The shallowest usable FMSdata were collected at 630 mbsf, within lithostratigraphic UnitIV, which is composed of basaltic breccia and interbeds ofvolcanic sandstone. The FMS image of the basaltic brecciaexhibits high contrast between small, irregular resistive fea-
tures that are embedded within a more conductive matrix.Sequences of volcanic sandstone or siltstone produce imageshaving less contrast and finely laminated bedding. In litho-stratigraphic Unit IV dips show no predominant value butrange from 0° to 60°. In the sandstone sequences of this unit,vertical fractures (Fig. 55) parallel the borehole, perpendicularto the bedding. Those fractures are apparently drilling-in-duced fractures (Serra, 1989) which would not be present incores. The fractures are observed in only one plane (i.e., foropposite pads of the FMS). Oblique fractures that dip from 70°to 85° are also evident in lithostratigraphic Unit IV at 674-676mbsf, 694-700 mbsf, and 703-706 mbsf. These fractures arediscontinuous, irregular, spaced apart by about 50 cm, andthey have a constant orientation (Fig. 56). Like verticalfractures, oblique fractures are evident on opposite sides ofthe borehole, but the two types of fractures do not appearwithin the same depth intervals.
Lithostratigraphic Unit V (702-865.7 mbsf) consists offoraminiferal limestone with layers of volcanic siltstone andvitric ash. The FMS images indicate that these rocks are veryfinely laminated and show clearly that bedding planes aregenerally horizontal or dip slightly at 10° to 20° with a dipazimuth of 100-130°. Sequences of more resistive siltstonesand vitric ashes contrast with the more conductive limestones.Highly conductive faults that cross the borehole in the intervalbetween 742 and 774 mbsf dip 50° to 60° and dip azimuthally340° to 10° (Fig. 57). Where faults are present, observationsfrom both cores (see "Structural Studies" section, this chap-ter) and FMS data indicate a slight increase in the dip ofbedding planes, from 0°-5° to 10°-20°. Faults in the intervalfrom 608 to 821 mbsf are thick (10-15 cm) and have a dipazimuth of 150°.
Lithostratigraphic Unit VI, a basaltic breccia with volcanicsandstone, begins at 853 mbsf and is marked by alternatingpebbly beds and fine laminations. In the volcanic sandstones,the beds dip 10° to 40° and have a dip azimuth of 50° to 100°(Fig. 58).
The transition between lithostratigraphic Unit VI and VIIis apparent in FMS images from between 948 and 953 mbsf bya sudden increase in the hole diameter from about 30 cm tomore than 40 cm over a depth interval of less than 20 cm. Theincreased hole diameter renders FMS data much less usefulsince the pads are often not in contact with the borehole wall.FMS images of lithostratigraphic Unit VII are generally sim-ilar to those of Unit VI, except that the bedding planes in thevolcanic siltstone of Unit VII, which appear to be moresteeply inclined (30°-70°; Fig. 59) than are those of Unit VI(less than 40°).
Vertical drilling-induced fractures are present in brecciaand volcanic sandstones in the bottom part of lithostrati-graphic Unit VI, as well as in Unit VII. The fracture orienta-tion is consistent in Units IV, VI, and VII (Fig. 54). Thedirection of the principal stress, parallel to the direction of thevertical fractures, ranges from 50° to 80°. Few oblique frac-tures are evident in these units (Fig. 54), and their interpreta-tion is less obvious than for the vertical fractures. The obliqueones may be fractures enhanced by drilling (Serra, 1989); if so,they would parallel the direction of the principal stress. Thedip azimuth of oblique fractures is locally constant at 10°-30°in the lower part of Unit IV, at 13O°-15O° in Unit VI, and at320°-360° in Unit VII (Fig. 54), but these orientations do notagree with those of the vertical fractures.
Heat FlowEight runs of the water sampler temperature probe (WSTP)
temperature tool were performed at Site 832, only three ofwhich were successful. This low rate of success was due to the
433

90 -
100
• *+<*- •
1 1 1 1 1 1 1
0 90 180 270 360 -90 -60 -30 0 30 60 90 -2 -1Declination (°) Inclination (°)
Figure 40. Depth plot of stable magnetization (after AF demagnetization at 10 mT) for cores in Hole 832A.
0 1 2 3 4
Intensity (mA/m)
434

SITE 832
0.1 +A/m
Sample 134-832A-3H-2,69-71 cm
Sample 134-832A-10H-3,97-99 cm
Figure 41. Representative orthogonal demagnetization plots of dis-crete samples from APC cores in Hole 832A. Open circles representvector endpoints projected onto the vertical plane; solid circles,endpoints projected onto the horizontal plane. NRM = naturalremanent magnetization.
presence of extensive ash layers in the sediments, whichprevented the probe from being properly inserted into thesediment below the drill bit. The data reduction techniquesused at this site were the same as those used at other Leg 134sites. The thermal conductivity values are given in the "Phys-ical Properties" section (this chapter) (Table 11 and Fig. 53).
Run 4H in Hole 832A (18.5 mbsf; Fig. 60) was successful,and its reduction to equilibrium temperature is plotted inFigure 61. Run 7H in Hole 832A (Fig. 62) at a depth of 47.0mbsf was unsuccessful as the probe did not fully penetrate thesediment. Run 20H in Hole 832A (Fig. 63) at a depth of 145.0mbsf was also unsuccessful: the probe was pulled out of thesediment just after penetration. Run 27X in Hole 832A (Fig.64) at a depth of 196.7 mbsf was unsuccessful because againthe probe did not fully penetrate the sediment. Run 28X inHole 832A (215.9 mbsf; Fig. 65) was successful. However, theprobe was slowly raised upward after only a few minutes inthe bottom, so only the beginning of the penetration record isused to calculate the equilibrium temperature (Fig. 66). Run4R in Hole 832B (Fig. 67) at 173.3 mbsf was successful with nodisturbance. The reduction to equilibrium temperature isgiven in Figure 68. Run 10R in Hole 832B (Fig. 69) at 231.0mbsf was unsuccessful, as the probe hit a hard ash layer anddid not fully penetrate the bottom. The final temperature run,19R in Hole 832B (318.1 mbsf; Fig. 70), struck an extremelyhard layer. Frictional heating from penetration increased theprobe temperature to 56°C, and invalidates some of theassumptions used in the I/time approximation of the temper-ature probe decay curve (Fig. 71), resulting in an invalidestimated equilibrium temperature. More detailed numericalanalysis may determine a valid equilibrium temperature forthis measurement.
The three valid sub-bottom temperature measurementsand the seafloor water temperature are plotted vs. theintegrated thermal resistivity in Figure 72. The surficial heatflow at this site is 41.8 mW/m2, higher than was expected forthe intra-arc basin sites. The high sedimentation rate in theNorth Aoba Basin will reduce the surficial heat flow suchthat it is less than the heat flow at depth. The exact amountthat the heat flow is reduced depends not only on thesedimentation rate but also upon the duration of the sedi-mentation. An idea of the amount that the heat flow isreduced is given by the calculations of Hobart and Weissel
(1987) for sedimentation in the New Georgia Sound basin ofthe Solomon Islands. If the thermal diffusivity of the sedi-ment is taken as 10~6 m2/s, a typical value, then 1 km ofsediment deposited uniformly over 1 m.y. would depress thesurficial heat flow by 19% and the heat flow at depth is 1.23times the value at the surface. If this rate continues for 5m.y. (i.e., 5 km in 5 m.y.), then the surficial heat flow wouldbe depressed by 38% and the value at depth would be 1.61times the surface value. Basement temperatures as a func-tion of time may also be calculated once a sedimentation ratehistory has been determined.
SUMMARY AND CONCLUSIONSSite 832 is located at 14°47.78'S, 167°34.35'E in water depth of
3089.3 mbsl. This site is located on the flat intra-arc North AobaBasin (NAB) floor, approximately 50 km northeast of theQueiros Peninsula of Espiritu Santo Island and 45 km due southof the active volcanic island of Santa Maria. The NAB issurrounded by several islands, including the uplifted horst blockislands of Maewo and Espiritu Santo and the active or recentlyactive volcanoes of Aoba, Mere Lava, and Santa Maria.
Two holes were drilled at Site 832. Hole 832A was drilledand cored to 215.9 mbsf and recovered 146.26 m of core for arecovery rate of 67.7%. Hole 832B was washed down to 144.4mbsf, then drilled to a total depth (TD) of 1106.7 mbsf, andcored 962.3 m, from which 450.95 m of core were recoveredfor a recovery rate of 46.9%.
Seven lithostratigraphic units were identified in the coresobtained at Site 832 (Fig. 73). Lithostratigraphic Unit I (0-206.2 mbsf in Hole 832A and 144.4-385.6 mbsf in Hole 832B)is a 385.6-m-thick Pleistocene sequence of sandy to clayeyvolcanic silts with interbedded volcanic ash layers. This unit isdivided into two subunits. Lithostratigraphic Subunit IA (0-141.0, Hole 832A) is a 141.0-m-thick Pleistocene sequence ofcoarse-grained vitric volcanic ash layers with sandy to clayeyvolcanic silt interbed. The subunit is very soupy and containsvolcanic lapilli, pumice clasts, and gravel-sized corals andwood fragments. Subunit IB (141.0-385.6 mbsf) is a 244.6-m-thick Pleistocene sequence of silty volcanic clay to clayeyvolcanic silts with foraminiferal and calcareous nannofossils.Below 281 mbsf lithification occurs within the clay stones andsiltstones, and partial lithification occurs in the fine vitricvolcanic ash, with substantially more carbonate componentsbelow 285 mbsf.
Lithostratigraphic Unit II (385.6-461.5 mbsf) is a 75.9-m-thick Pleistocene sandstone, siltstone, and clay stone se-quence with substantial volcanic material in the upper bur-rowed part and significantly more carbonate material near thelowermost of the unit. The bottom 50 cm contain sed-igneous(basaltic) breccia. Lithostratigraphic Unit III (461.5-625.7mbsf) is a 164.2-m-thick Pleistocene highly calcareous se-quence composed of 40% chalks, limestones, and calcareousmixed sediments, with the remaining 60% composed of vol-canic sandstones, siltstones, and breccias. The bottom of theunit is late Pliocene or early Pleistocene in age. Lithostrati-graphic Unit IV (625.7-702.0 mbsf) is a 76.3-m-thick lowerPleistocene or upper Pliocene(?) breccia that is composed ofabout 60% lithified basaltic breccia which also contains lime-stone and coral clasts in a sandstone matrix and 40% volcanicsandstone and siltstone. Lithostratigraphic Unit V (702-865.7mbsf) is a 163.7-m-thick upper Miocene to upper Pliocenelimestone comprised of layers of foraminiferal, nannofossil,calcareous, or silty limestone with occasional layers of vitricash. Intense bioturbation is common and some wood ispresent. A sharp upper contact occurs with the overlying UnitIV and a basal breccia occurs which contains a few neriticcarbonate fragments overlying clayey volcanic siltstone.
435

SITE 832
ibO i ' I " I i ' i " | r•i H'V i I P *l I I1 I '/ I' I I I I I I I I I I I I
240
320
400
Q.ΦQ
480
560
640
720
* 4 4- 44-» H<•IMI » 44*4 4 44
4 4 4* +44- 4> *--!•* 44
4 4*111
«• 4» 4 44 IWII 4
4 * 4 41**. 4H4- 44 4 4
4 ««•» S»•M•4-t•»*»V% «S
44 * 4 * » ' » | i | 1*4 4
***•»*• 4*4+4+ *+ * *
* ** ++*%-*%+**. •**‰t•*++*\
4 +4+ 4 # » 4 'I »*HI 4
44
* * «
44 4 * # • # » # t * 4 * 4 *
4 4 4 -4 4
44 4 4
. h * +
+ 4 4
4 4
4 44
4 4 4 4 4 4
i . 44 * 4 44 4 *•%* *
I I , , , i , I , , • i ! i I i i i I i i • I i
i
-
_
-
4
4 4 4 4
_
-
-
1
1
4 4
*
4 4
4 4
+4
+4-
1
1
*
4 4
4 4
4
4 4
* *
r~ " i
4 44 4 4 | l • 1 1 ' I H
******
$$É -+ 4 4#***. » *
+- 4
4
4*• +" t •<
4
4
1
*4*jnr^ ^HIIIIIIWIH• + 4 44
4 4 4 ^ 4 • ^ H | B £ *
1 1-90 -60 -30 0 30 60 90 -2 -1 0 1 2 3 4
Inclination (°) Intensity (mA/m)
Figure 42. Variation of inclination and intensity after demagnetization at 10 mT with depth (from 160 to 720 mbsf) in Hole 832B.
Lithostratigraphic Unit VI (865.7-952.6 mbsf) is an 86.9-m-thick middle to upper(?) Miocene lithified volcanic sandstonethat becomes coarser-grained from top to bottom and hasgraded beds. Rare pyrite occurs. Lithostratigraphic Unit VII(952.6-1106.7 mbsf) is a 154.1-m-thick breccia composed of60% lithified basaltic breccia and 40% lithified volcanic sand-stone and siltstone, which contains neritic calcareous grains,including corals, algae fragments, large foraminifers, and
occasional basaltic scoriae. The top of this Unit is early tomiddle Miocene in age.
Foraminifers and nannofossils were the best source of ageinformation. Ages determined range from Pleistocene or Ho-locene to latest early Miocene(?), with the foraminifers giving thefirst indication of earliest middle Miocene fauna at 954.4 mbsfand a latest early Miocene fauna at 971.8 mbsf. Biostratigraphicages range as follows: late Pleistocene to Holocene, 0-308.4
436

SITE 832
- 0.04 A/m
-Y—t
5mT
- - 0.04 A/m -• 0.06 A/m
Sample 134-832B-43R-1,117-119 cm
Sample 134-832B-43R-1,134-136 cm
Sample 134-832B-43R-1,139-141 cm
Figure 43. Representative orthogonal demagnetization plots of discrete samples from Core 134-832B-43R. Open circles representvector endpoints projected onto the vertical plane; solid circles, endpoints projected onto the horizontal plane.
mbsf; early Pleistocene, 308.4-600 mbsf; late Pliocene or earlyPleistocene, 600-711 mbsf; late Pliocene, 711-768.8 mbsf; earlyPliocene, 768.8-817.4 mbsf; possible late Miocene, 817.4-856.1mbsf; and middle to early Miocene, 924-972 mbsf. Benthicforaminifers indicate a depositional environment of lowerbathyal for most all the sediments found at Site 832.
Biostratigraphic analyses were used to estimate the sedi-ment accumulation rate for the deposits cored at Site 832.Generally, a sediment accumulation rate of 286 m/m.y. orgreater was estimated for the interval of 0-711 mbsf. At 711mbsf a major change in sedimentation rate appears to haveoccurred with the sediments beneath this level (711-875 mbsf)having been deposited at less than 100 m/m.y., as supportedby the presence of hemipelagic sediments.
More than 10 volcanic ash layers greater than 10 cm thickand several tens of reworked volcanic ash layers were recov-ered at Site 832. Chemistry of these ashes suggests that theyhave a related origin from a fairly potassic parental magma.These ashes share a common chemistry with the volcanicrocks of Santa Maria Island and are most likely derived fromthere. Fragments of clinopyroxene-phyric basalt or an-karamite were found in the cores between 395 and 1100 mbsfand show vesicular texture and little oxidation, indicating thatthey underwent little weathering or seawater alteration beforeburial. Clinopyroxene-phyric basalts recovered from brecciaswithin lithostratigraphic Units II, III, and IV may have beenderived from either Aoba or Mae wo islands. Lavas recoveredfrom the lower part of lithostratigraphic Unit VII appear tohave resulted from submarine volcanism and contained ortho-pyroxene phenocrysts, which suggests that these rocks werederived from Mae wo or Espiritu Santo islands. Generally,these volcanic rocks varied in composition with depth, withthe upper Pliocene rocks being of MORB-like or I AT compo-sition and the upper Miocene rocks being calc-alkaline; how-ever, a stratigraphic inversion may have resulted from re-working.
In addition to the lithostratigraphic units, four structuralunits were identified on the basis of deformation observed inthe sedimentary rocks. Structural Unit A (0-415 mbsf) corre-sponds to lithostratigraphic Unit I and the upper part of UnitII and is relatively (relative to the other structural units)devoid of deformation structures, with the exception of a fewisolated vertical or steeply inclined beds that appear to beslump induced. Structural Unit B (415-626 mbsf), corre-
sponding to the lower part of lithostratigraphic Unit II and allof Unit III, shows extreme variations in dip angles of beddingwith good examples of slump fold hinges; abundant slumpstructures are present. Structural Unit C (626-702 mbsf)corresponds to lithostratigraphic Unit IV and exhibits beddingplanes with a 30°-65° dip with flat shear planes that suggestdownslope sediment creep; normal faulting appears to haveoccurred before tilting. Structural Unit D (702-866 mbsf),corresponding to lithostratigraphic Unit V, is defined on thebasis of abundant microfaults with 30°-50° dips and slicken-sides, especially concentrated at interval 740-769 mbsf, andslump structure illustrated by tension gash arrays and hori-zontal bedding that defines the base of slumps. Bedding-parallel extension appears to have occurred in this unit.Structural Unit E (866-1107 mbsf) corresponds to lithostrati-graphic Units VI and VII and shows poorly defined bedding,which presently dips 20°-40° and are considerably differentlyoriented than the beds of the overlying structural unit. Lo-cally, bedding is vertical or overturned, resulting from slump-ing, and reverse and left-lateral strike-slip microfaults arepresent. At the base of structural Unit E tilted conjugatenormal microfaults indicate that the sedimentary rocks at thislevel were normally faulted before tilting.
Analyses made of the pore fluids at Site 832 indicate thatthe concentration gradients of sodium, potassium, calcium,and magnesium have extraordinary variations below 280mbsf. Above 250 mbsf the maxima of ammonia, phosphate,alkalinity, and methane concentrations appear to relate tobacterially mediated, coupled oxidation of organic matter andreduction of sulfate. In the deeper parts of the drilled se-quence, below 280 mbsf, sulfate concentrations are high;however, alkalinity, phosphate, and methane concentrationsare low. Concentration of organic carbon is low (<0.5%)throughout the sequence. Diagenesis appears to be the resultof oxidation of organic matter, precipitation of authigeniccarbonate and phosphate minerals, and alteration of volcano-genie sediments. The cause of the intense diagenesis is notknown, but may relate to the specific mineralogic or chemicalcomposition of the volcanic materials that compose the cen-tral New Hebrides Island Arc. Pore fluids show no evidence ofmeteoric water flow from the surrounding islands. This lack ofhydrologic flow implies that any hydrocarbons generated willnot be flushed from the sediments, but the low organic carboncontents suggest that the sedimentary rocks penetrated may
437

SITE 832
720 -
740 -
760
— 780f
800 -
820
I I I l*U
_
-
" * ***
+ ** *
+**
* +
**?
*i*»j* *
i + **
* J * *
*****
ft*^ *****%
»*
* * t **
******•*(** + * * * * *
*
T* * * ^
, i , , 1 , , , , ,
* H<
If + +
* * * * *
> *
%
+ ++
*** I •H
*** +
i *
** T * *
» * ** *-
*••
T^ * » * **
+ ++ -
-
t t***^1*-** * * * ^
* *5
Λ ; , , , , - , .
. "-.v••WJö•• "
* ******+*** ****+ Λ * * ^
1 1
+ (J*tf*++*+
*.t*S***
J5^^^*
&%—**
*
SBS.
*++ % +
++++++
+ •t#-H• +
+ *•• + +
1 I < M M
840 7
3 6 0 i , i , , , ! i i i i i i i Magnetic
0 90 180 270 360 -90 -60 -30 0 30 60 90 -2 -1 0 1 2 3 4 polarity
Declination (°) Inclination (°) Intensity (mA/m)
Figure 44. Declination, inclination, intensity, and magnetic polarity after demagnetization at 10 mT plotted against depth (from 700 to 860 mbsf)in Hole 832B. Black indicates normal polarity; white, reversed polarity; and shaded area, uncertain polarity.
not contain large volumes of source material. At approxi-mately 800 mbsf the organic carbon content is about 0.5 wt%.
Physical properties at Site 832 varied only slight from themudline to below 300 mbsf in sediments which consisted largelyof unconsolidated silty ash. This is probably the result of theextremely rapid sedimentation rate at this site during the Pleis-tocene, associated with rapid tectonic subsidence of the AobaBasin. Porosity and water content have high values, consistentlythe highest in the upper section of any of the seven sites drilledon Leg 134. From 300 mbsf downward, porosity and watercontent decrease slowly but continue to have relatively highvalues. Bulk density displays a similar trend over the total depthof the hole. A sharp decrease in porosity and water content anda concomitant increase in bulk density at the top of lithostrati-
graphic Unit IV (625.7 mbsf) is associated with well-cementedsandstones and breccia in that unit.
Initial interpretations of the drilling results at Site 832indicate that basin formation is the product of island-arcvolcanism and tectonic deformation. The unconformity atabout 700 mbsf appears to represent the time uplift of thecentral part of the Western Belt occurred in response to thecollision of the DEZ. The existence of clayey foraminiferaland nannofossil limestones interbedded with ash and siltyvolcanic sandstones of lithostratigraphic Unit V beneath theunconformity suggests relatively (relative to the overlyingunit) quiet water sediment deposition devoid of volcanic andterrestrially derived material. In contrast, the coarser-grainedbasaltic breccias of the overlying lithostratigraphic Unit IV
438

SITE 832
Sample 134-832B-70R-6,116-118 cm
Sample 134-832B-70R-6,141-143 cm
Figure 45. Representative vector endpoint diagrams showing the resultsof AF demagnetization of samples from Core 134-832B-70R. Opencircles represent vector endpoints projected onto the vertical plane; solidcircles represent endpoints projected onto the horizontal plane.
suggest uplift of a volcanic province close to Site 832 thatsupplied the breccia. Central Chain volcanoes, either Aoba orSanta Maria islands, are the likely source of these materials.Timing of the uplift and formation of the unconformity is notwell constrained, but biostratigraphic analyses indicate that itappears to be close to the late Pliocene-early Pleistoceneboundary. In contrast, the basaltic breccia encountered at thebottom of Hole 832A (lithostratigraphic Unit VII) appears torepresent submarine eruptions associated with the volcanicformation of Espiritu Santo Island. The upper 385 mbsf(lithostratigraphic Unit I) represents recent (Pleistocene) ba-sin filling from the effusive products of the Central Chainvolcanoes, specifically from Aoba, Santa Maria, and MereLava islands. Structural analyses of the cores indicated thatthere have been several tectonic events that changed theinclination of the NAB's flanks, thereby dislodging sedimentsand forming slumps. These events appear to have beenparticularly active during the earliest middle Miocene, middleMiocene, late Miocene to early Pliocene, and latest earlyPliocene to earliest late Pliocene. Many of the lithostrati-graphic units identified at Site 832 can be correlated with thelithostratigraphic units of Site 833.
REFERENCES
Akimoto, K., 1990. Distribution of Recent benthic foraminiferalfaunas in the Pacific off Southwest Japan and around HachijojimaIsland. Sci. Rep. Tohoku Univ., Ser. 2, 60:139-223.
Barsdell, M., Smith, I.E.M., and Sporli, K. B., 1982. The origin ofreversed geochemical zoning in the Northern New HebridesVolcanic Arc. Contrib. Mineral. Petrol, 81:148-155.
Bellon, H., Marcelot, G., Lefevre, C , and Maillet, P., 1984. Le volcande File d'Erromango (République de Vanuatu): calendrier de l'ac-tivité (données ^K-^Ar). C. R. Acad. Sci. Ser. 2, 299:257-262.
Berggren, W. A., Kent, D. V., Flynn, J. J., and Van Couvering, J. A.,1985a. Cenozoic geochronology. Geol. Soc. Am. Bull., 96:1407-1418.
Berggren, W. A., Kent, D. V., and Van Couvering, J. A., 1985b. TheNeogene: Part 2. Neogene geochronology and chronostratigraphy.In Snelling, N. J. (Ed.), The Chronology of the Geological Record.Geol. Soc. London Mem., 10:211-260.
Boltovskoy, E., and Wright, R., 1976. Recent Foraminifera: TheHague (W. Junk).
Briqueu, L., 1984. Etude du magmatisme associé auz zones desubduction à 1'aide de traceurs géochimiques multiples: elementstraces et rapports isotopiques ^Sr/^Sr et 143Nd/lif4Nd. [These].Univ. Montpellier, Documents et Travaux du Centre de Géologieet de Géophysique, No. 5.
Burns, R. E., Andrews, J. E., et al., 1973. Init. Repts. DSDP, 21:Washington (U.S. Govt. Printing Office).
Carmichael, I.S.E., Turner, F. J., and Verhoogen J., 1974. IgneousPetrology: New York (McGraw Hill).
Carney, J. N., 1986. Geology of Maewo. Regional Rept.—VanuatuDep. Geol., Mines and Rural Water Supplies.
Carney, J. N., and Macfarlane, A., 1977. Volcano-tectonic events andpre-Pliocene crustal extension in the New Hebrides. Int. Symp. onGeodynamics in South-west Pacific, Noumea, New Caledonia,1976. Paris (Editions Technip), 91-104.
, 1978. Lower to middle Miocene sediments on Maewo, NewHebrides, and their relevance to the development of the Outer-Melanesian Arc system. Australas. Soc. Explor. Geophys. Bull.9:123-130.
., 1980. A sedimentary basin in the central New HebridesArc. Tech. Bull.—U. N. Econ. Soc. Comm. Asia Pac, Comm.Co-ord. Jt. Prospect Miner. Resour. South Pac. Offshore Areas,3:109-120.
., 1982. Geological evidence bearing on the Miocene toRecent structural evolution of the New Hebrides Arc. Tectono-physics, 87:147-175.
., 1985. Geology and mineralisation of the Cumberland Pe-ninsula, north Espiritu Santo. Vanuatu Dept. of Geol., Mines andRural Water Suppl. Rep.
Carney, J. N., Macfarlane, A., and Mallick, D.I.J., 1985. The Vanuatuisland arc—an outline of the stratigraphy, structure, and petrology.In Nairn, A.E.M., Stehli, F. G., and Uyeda, S. (Eds.), The OceanBasins and Margins (Vol. 7): New York (Plenum), 685-718.
Chase, C. G., 1971. Tectonic history of the Fiji Plateau. Geol. Soc.Am. Bull., 82:3087-3110.
Chase, T. E., and Seekins, B. A., 1988. Submarine topography of theVanuatu and southeastern Solomon Islands regions. In Greene,H. G., and Wong, F. L. (Eds.), Geology and Offshore Resourcesof Pacific Island Arcs—Vanuatu Region. Circum-Pac. Counc.Energy and Miner. Resour., Earth Sci. Ser., 8:201-224.
Chung, W. Y., and Kanamori, H., 1978. A mechanical model for platedeformation associated with aseismic ridge subduction in the NewHebrides arc. Tectonophysics, 50:29-40.
Claypool, G. E., and Kaplan, I. R., 1974. The origin and distributionof methane in marine sediments. In Kaplan, I. R. (Ed.), NaturalGases in Marine Sediments: New York (Plenum), 99-140.
Coleman, P. J., and Packham, G. H., 1976. The Melanesian borderlandsand India-Pacific plate boundaries. Earth-Sci. Rev., 12:197-233.
Colley, H., and Ash, R. P., 1971. The Geology of Erromango.Regional Rept.—New Hebrides Geol. Surv.
Collot, J.-Y., Daniel, J., and Burne, R. V., 1985. Recent tectonicsassociated with the subduction/collision of the d'Entrecasteauxzone in the central New Hebrides. Tectonophysics, 112:325-356.
Collot, J.-Y., and Fisher, M. A., 1988. Crustal structure, from gravitydata, of a collision zone in the central New Hebrides Island Arc.In Greene, H. G., and Wong, F. L. (Eds.), Geology and OffshoreResources of Pacific Island Arcs—Vanuatu Region. Circum-Pac.Counc. Energy and Miner. Resour., Earth Sci. Ser., 8:125-140.
Dickinson, W. R., 1973. Reconstruction of past arc-trench systems frompetrotectonic assemblages in the island arcs of the western Pacific. InColeman, P. J. (Ed)., The Western Pacific: Island Arcs, MarginalSeas, Geochemistry: Perth (Univ. of Western Australia Press),569-601.
Dupuy, C , Dostal, J., Marcellot, G., Bougault, H., Joron, J. L., andTreuil, M., 1982. Geochemistry of basalts from central and south-ern New Hebrides arc: implication for their source rock composi-tion. Earth Planet. Sci. Lett., 60:207-225.
Falvey, D. A., 1975. Arc reversals, and a tectonic model for the NorthFiji Basin. Australas. Soc. Explor. Geophys. Bull., 6:47-49.
Fisher, M. A., Falvey, D. A., and Smith, G. L., 1988. Seismicstratigraphy of the summit basins of the New Hebrides Island Arc.In Greene, H. G., and Wong, F. L. (Eds.), Geology and OffshoreResources of Pacific Island Arcs—Vanuatu Region. Circum-Pac.Counc. Energy and Miner. Resour., Earth Sci. Ser., 8:201-224.
Gieskes, J. M., 1981. Deep-sea drilling interstitial water studies:implications for chemical alteration of the oceanic crust, layers Iand II. In Warme, J. E., Douglas, R. G., and Winterer, E. L.(Eds.), The Deep Sea Drilling Project: A Decade of Progress. Soc.Econ. Paleontol. Mineral. Spec. Publ., 32:149-167.
439

SITE 832
Gorton, M. P., 1974. The geochemistry and geochronology of the NewHebrides [Ph.D. dissert.]. Australian National Univ., Canberra.
, 1977. The geochemistry and origin of Quaternary volcanismin the New Hebrides. Geochim. Cosmochim. Acta, 41:1257-1270.
Greene, H. G., and Johnson, D. P., 1988. Geology of the CentralBasin region of the New Hebrides Arc inferred from single-channel seismic-reflection data. In Greene, H. G., and Wong,F. L. (Eds.), Geology and Offshore Resources of Pacific IslandArcs—Vanuatu Region. Circum-Pac. Counc. Energy and Miner.Resour., Earth Sci. Ser., 8:177-200.
Greene, H. G., Macfarlane, A., Johnson, D. A., and Crawford, A. J.,1988. Structure and tectonics of the central New Hebrides Arc. InGreene, H. G., and Wong, F. L. (Eds.), Geology and OffshoreResources of Pacific Island Arcs—Vanuatu Region. Circum-Pac.Counc. Energy and Miner. Resour., Earth Sci. Ser., 8:377-412.
Haig, D. W., and Perembo, R.C.B., 1990. Foraminifera as stratigraphicguides for Papua New Guinea. In Carmen, G. J., and Carmen, Z.(Eds.), Petroleum Exploration in Papua New Guinea: Proceedingsof the First PNG Petroleum Convention. Port Moresby.
Hanus, V., and Vanek, J., 1983. Deep structure of the Vanuatu (NewHebrides) islands arc: intermediate depth collision of subductedlithospheric plates. N. Z. J. Geol. Geophys., 26:133-154.
Hills, S. J., and Thierstein, H. R., 1989. Plio-Pleistocene calcareousplankton biochronology. Mar. Micropaleontol., 14:67-96.
Hobart, M. A., and Weissel, J. K., 1987. Geothermal surveys in theSolomon Islands—Woodlark Basin Region. In Taylor, B., andExon, N. F. (Eds.), Marine Geology, Geophysics, and Geochem-istry of the Woodlark Basin-Solomon Islands. Circum-Pac. Counc.Energy and Miner. Resour., Earth Sci. Ser., 7:49-66.
Holmes, M. L., 1988. Seismic refraction measurements in the summitbasins of the New Hebrides Arc. In Greene, H. G., and Wong,F. L. (Eds.), Geology and Offshore Resources of Pacific IslandArcs—Vanuatu Region. Circum-Pac. Counc. Energy and Miner.Resour., Earth Sci. Ser., 8:163-176.
Johnson, D. P., Belford, D. J., Carter, A. N., and Crawford, A. J., 1988.Petrology and age of dredge samples collected in the Central Basin,Vanuatu. In Greene, H. G., and Wong, F. L. (Eds.), Geology andOffshore Resources of Pacific Island Arcs—Vanuatu Region. Circum-Pac. Counc. Energy and Miner. Resour., Earth Sci. Ser., 8:141-162.
Johnson, D. P., and Greene, H. G., 1988. Modern depositionalregimes, offshore Vanuatu. In Greene, H. G., and Wong, F. L.(Eds.), Geology and Offshore Resources of Pacific Island Arcs—Vanuatu Region. Circum-Pac. Counc. Energy and Miner. Re-sour., Earth Sci. Ser., 8:287-300.
Karig, D. E., and Mammerickx, J., 1972. Tectonic framework of theNew Hebrides island arc. Mar. Geol., 12:187-205.
Kastner, M., Elderfield, H., Martin, J. B., Suess, E., Kvenvolden,K. A., and Garrison, R. E., 1990. Diagenesis and interstitial-waterchemistry at the Peruvian continental margin—major constituents andstrontium isotopes. In Suess, E., von Huene, R., et al., Proc. ODP, Sci.Results, 112: College Station, TX (Ocean Drilling Program), 413-440.
Katz, H. R., 1981. Report on interpretation of seismic profiling datacollected on the Vauban cruise in Vanuatu waters. Tech. Bull.—U. N. Econ. Soc. Comm. Asia Pac, Comm. Co-ord. Jt. ProspectMiner. Resour. South Pac. Offshore Areas, No. 12.
, 1988. Offshore geology of Vanuatu-previous work. InGreene, H. G., and Wong, F. L. (Eds.), Geology and OffshoreResources of Pacific Island Arcs—Vanuatu Region. Circum-Pac.Counc. Energy and Miner. Resour., Earth Sci. Ser., 8:93-124.
Kennett, J. P., and Srinivasan, M. S., 1983. Neogene PlanktonicForaminifera: A Phylogenetic Atlas: Stroudsburg, PA (Hutchin-son Ross).
Kennett, J. P., von der Borch, C. C , et al., 1986. Init. Repts. DSDP,90: Washington (U.S. Govt. Printing Office).
Kroenke, L. W., 1984. Cenozoic tectonic development of the southwestPacific. Tech. Bull.—U. N. Econ. Soc. Comm. Asia Pac, Comm.Co-ord. Jt. Prospect Miner. Resour. South Pac. Offshore Areas, No. 6.
Lawrence, J. R., and Gieskes, J. M., 1981. Constraints on watertransport and alteration in the oceanic crust from the isotopiccomposition of pore water. J. Geophys. Res., 86:7924-7934.
Louat, R., Hamburger, M., and Monzier, M., 1988. Shallow andintermediate-depth seismicity in the New Hebrides Arc: con-straints on the subduction process. In Greene, H. G., and Wong,F. L. (Eds.), Geology and Offshore Resources of Pacific IslandArcs—Vanuatu Region. Circum-Pac. Counc. Energy and Miner.Resour., Earth Sci. Ser., 8:329-356.
Lundberg, N., and Moore, J. C , 1986. Macroscopic structural featuresin Deep Sea Drilling Project cores from forearc regions. In Moore,J. C. (Ed.), Structural Fabrics Preserved in Deep Sea DrillingProject Cores From Forearcs: Mem. Geol. Soc. Am., 166:13-44.
Luyendyk, B. P., Bryan, W. B., and Jezek, P. A., 1974. Shallowstructure of the New Hebrides island arc. Geol. Soc. Am. Bull.,85:1287-1300.
Macfarlane, A., Carney, J. N., Crawford, A. J., and Greene, H. G.,1988. Vanuatu—a review of the onshore geology. In Greene,H. G., and Wong, F. L. (Eds.), Geology and Offshore Resourcesof Pacific Island Arcs—Vanuatu Region. Circum-Pac. Counc.Energy and Miner. Resour., Earth Sci. Ser., 8:45-92.
Mallick, D.I.J., 1973. Some petrological and structural variations inthe New Hebrides. In Coleman, P. J. (Ed.), The Western Pacific-Island Arcs, Marginal Seas, Geochemistry: Perth (Univ. of West-ern Australia Press), 193-211.
, 1975. Development of the New Hebrides Archipelago.Philos. Trans. R. Soc. London, B, 272:277-285.
Mallick, D.I.J., and Greenbaum, D., 1977. Geology of SouthernSanto. Regional Rept.—New Hebrides Geol. Surv.
Mallick, D.I.J., and Neef, G., 1974. Geology of Pentecost. RegionalRept.—New Hebrides Geol. Surv.
Marcelot, G., Maury, R. C , and Lefevre, C , 1983. Mineralogy ofErromango lavas (New Hebrides): evidence of an early stage offractionation in island arc basalts. Lithos, 16:135-151.
Mitchell, A.H.G., and Warden, A. J., 1971. Geological evolution ofthe New Hebrides island arc. J. Geol. Soc. London, 127:501-529.
Okada, H., and Bukry, D., 1980. Supplementary modification and intro-duction of code numbers to the low-latitude Coccolith biostratigraphiczonation (Bukry, 1973; 1975). Mar. Micropaleontol, 5:321-325.
Pascal, G., Dubois, J., Barazangi, M., Isacks, B. L., and Oliver, J.,1973. Seismic velocity anomalies beneath the New Hebrides islandarc: evidence for a detached slab in the upper mantle. J. Geophys.Res., 78:6998-7004.
Pearce, J. A., 1982. Trace element characteristics of lavas from destruc-tive plate boundaries. In Thorpe, R. S. (Ed.), Andesites: OrogenicAndesites and Related Rocks: New York (Wiley), 525-548.
Pearce, J. A., and Cann, J. R., 1973. Tectonic setting of basic volcanicrocks determined using trace element analysis. Earth Planet. Sci.Lett., 24:419-426.
Prell, W. L., Niitsuma, N., et al., 1989. Proc. ODP, Init. Repts., 117:College Station, TX (Ocean Drilling Program).
Ravenne, C , Pascal, G., Dubois, J., Dugas, F., and Montadert, L.,1977. Model of young intra-oceanic arc: the New Hebrides islandarc. In Int. Symp. on Geodynamics in South-west Pacific,Noumea, New Caledonia, 1976. Paris (Editions Technip), 63-78.
Robinson, G. P., 1969. The Geology of North Santo. RegionalRept.—New Hebrides Geol. Surv.
Serra, O., 1989. Formation Microscanner Image Interpretation:Houston (Schlumberger Educational Services).
Wilson, M., 1989. Igneous Petrogenesis: A Global Tectonic Ap-proach: London (Unwin Hyman).
Ms 134A-112
NOTE: All core description forms ("barrel sheets") and core photographs have been printed oncoated paper and bound as Section 4, near the back of this volume, beginning on page 581.
440

SITE 832
900
930
960
.Q
E990
1020
1050
1080
1110
I ++ + ++^
i i i i i I i i i i i I i i i i i
i i i i i i i i i i i i i i i i i
f • * #
-90 -60 -30 0 30 60 90 - 2 - 1 0 1 2 3
Inclination (°) Intensity (mA/m)
Figure 46. Variation of inclination and intensity after demagnetization at 10 mT with depth (from 870 to 1100 mbsf)in Hole 832B.
441

SITE 832
0
200
400
600Q.
Q
800
1000
1200
Geomagnetic polarity
time-scale
Age (Ma)
Magnetic polarity
Hole 832B
Jaramillo
0.73
0.910.98
IV
VI
VII
CO
CD
1.66Olduvai
1.88
Reunion
2.47
Kaena
2.922.993.083.18
Mammoth3.40
0.01 0.02 0.03 0.04Susceptibility (SI)
0.05 0.06
Figure 47. Plot of variation of the magnetic susceptibility with thedepth below seafloor at Site 832. Lithostratigraphic units are indicatedon the right side of the diagram.
Cochiti3.883.97
, 4 • 1 0Nunivak4.24
CD Sidufjall 4-40
4^57Thvera
4.77
5.35
|
δ
Depth (mbsf)
700 m
707
713.2713.7
724.7
760.2-762
763.3-766.5
808.7
816.6819.7
830.5
850.9
Figure 48. Comparison of polarity time scale derived by Berggren etal. (1985a, 1985b) with magnetic polarity stratigraphy observed at Site832. Black indicates normal polarity; white, reversed polarity; andshaded area, uncertain polarity.
442

SITE 832
1200
w • • • Hiatus
Y ^ * 25 m/m.y.
\ ^ 50 m/m.y.100m/m.y.
< 100 m/m.y.
Barren interval • ? :
9° 1O
Barreninterval
0 1 2 3 4 5 6 7 8 9 10 1112 13 14 15 16 17Age (m.y.)
Figure 49. Sediment accumulation rates for Site 832. The followingfirst appearance and last appearance datums (FAD, LAD) were usedto compile this plot: 1 = FAD Emiliania huxleyi at 0.28 Ma fromSample 134-832A-6H-CC; 2 = LAD Globorotalia tosaensis at 0.60Ma from Sample 134-832B-18R-CC, 21-25 cm; 3 = FAD largeGephyrocapsa at 1.36 Ma from Sample 134-832B-22R-CC; 4 = FADGloborotalia truncatulinoides at 5.90-2.70 Ma from between Samples134-832B-40R-CC and 134-832B-50R-CC; 5 = FAD Sphenolithusabies at 3.47 Ma from Sample 134-832B-63R-CC; 6 = FAD Globoro-talia crassaformis at 4.30 Ma from Sample 134-832B-63R-CC; 7 =LAD Discoaster quinqueramus at 5.00 Ma from Sample 134-832B-66R-CC; 8 = FAD Globigerinoides conglobatus at 5.30 Ma fromSample 134-832B-70R-CC; 9 = LAD Sphenolithus heteromorphus at13.60 Ma from Sample 134-832B-84R-CC; 10 = FAD Orbulina spp. at15.20 Ma from Sample 134-832B-85R-2, 29-32 cm.
443

u
100-
200-
300-
400-
-
_ 500-
.Q
E
S" 600-Q
700-
-
800-
900-
1000-
1100-
11
mm••sa•
—
=
—
B=•
•==
Uni
IA
1
IB
II
III
IV
_
V
VI
1
VII
Porosity (%)
20 40 60 801 i • i i \ m
mi
• • •
• •. " _
• •
• •
*•
•
a •— a a —
• -Bj
— •
• "" •
•
•
••
- a
• •
: •• B
' "* • •• B
a m
a
a
••V.•
a m • ••
• • • 1 "Z a
. " •'•*
•- • . " *
m
m •.
• •
- i i i ••i i i i i i -
Water content (%)
20 40 60 80• t • i • i • * Λ \ • •
•• ^
• • •
- . —
v;• •
•
• •
— a a —a •
m a
a a
a •
* 5 " •••" •
•
•
• •• H
— • —
• •
••. V-"r
•
• \ ' ^ '
•^_— a • —
a •
_ • •••
."••• *• •• i
••• "" •
• „
• •
- , •¥ , 1 , 1 , 1 , -
Bulk density (Mg/m3)
2.0 2.5 3.0• Y i | i | i
" t"'••i
. "• •• #
t
• •— • —•
•
• •
••— a a —
• a
• •• -
• a
* / '1 "•
"• B
•••
• •• •
• •
• •
a "" •• •
• ••
£••
• ••
• ' - .
• .•
-• ••
••*
••. \m
•• •• 2
*••
• •
- , 1 , • "I, , 1 , -
Vertical velocity (m/s)
2500 4000i ' i ' i '«•. "•
• •
_ 1 "
•
•
m •
• •a a
• •
• •1
m
•• . '"'• a " "
•
••
•• •
*
-
a •
• •• a
• " " •a a
a •
• •a•
. ••• .
i .i ' .•I • •
• a• •
\ a •
• • a_ • • _
.•
• B • "
- , i • r . " i , -
Horizontal velocity (m/s)
2500 4000I i • i
* •"
• %• •
- *•
• ••
•
m
a •
a a
a a
• a•
- • —
• •
• • "•1
•
•
•
a " a
• •
• r .
"•••
• •
"•• r.
a • •
•
• a a
" • • m a
a • a
" ••a •
. • .
._ ;••
- i - I . • i , -
I
Figure 50. Porosity, water content, bulk density, and sonic velocity vs. depth, Site 832.

SITE 832
Bulk density (Mg/m3)
1.5 2.0 2.5 3.0
110040 60Porosity (%)
Figure 51. Bulk density (solid line) and porosity (dashed line) vs.depth, Site 832.
445

SITE 832
Table 8. Index properties data, Site 832.
Sample (cm)
134-832 A-
1H-2, 801H-4, 802H-2, 772H-4, 772H-6, 803H-2, 804H-1, 1304H-3, 1154H-5, 1174H-6, 1475H-1, 1305H-3, 1305H-5, 1305H-7, 506H-1, 1276H-3, 1326H-4, 756H-7, 407H-2, 1177H-4, 1177H-6, 1178H-1, 1208H-3, 658H-5, 309H-2, 1039H-5, 1039H-7, 50
10H-1, 14010H-3, 12710H-6, 14011H-1, 13011H-4, 13011H-6, 13013H-2, 7914H-2, 7915H-2, 7916H-2, 8016H-2, 12716H-4, 7816H-6, 7817H-1, 7717H-3, 7818H-2, 7818H-4, 7819H-2, 7720H-1, 14120H-3, 13021X-CC, 424X-2, 13224X-4, 726X-1, 9
134-832B-
1R-CC, 42R-CC, 173R-1, 273R-CC, 144R-CC, 187R-1, 609R-1, 59R-1, 1229R-2, 100
11R-CC, 713R-1, 1013R-1, 12514R-1, 8715R-2, 416R-1,4516R-2, 1617R-1, 1717R-3, 7018R-2, 7218R-3, 11719R-1, 419R-1, 10519R-2, 87
Depth(mbsf)
2.305.308.17
11.1714.2017.7019.8022.6525.6727.4729.3032.3035.3037.5038.7741.8242.7546.9049.6752.6755.6757.7060.1562.8065.5370.0372.5073.9076.7781.4083.3087.8090.80
102.81103.81108.79118.30118.77121.28124.28126.27129.28133.78136.78143.27146.41149.30151.34180.52182.27196.79
144.44154.27164.07164.85173.88202.80221.45222.62223.90240.77260.10261.25270.57280.12289.45290.66298.87300.90310.62312.41318.14319.15320.47
Unit
IAIAIAIAIAIAIAIAIAIAIAIAIAIAIAIAIAIAIAIAIAIAIAIAIAIAIAIAIAIAIAIAIAIAIAIAIAIAIAIAIAIAIAIAIBIBIBIBIBIBIB
IBIBIBIBIBIBIBIBIBIBIBIBIBIBIBIBIBIBIBIBIBIBIB
Wet-bulkdensity(Mg/m3)
1.741.671.671.681.691.931.771.801.721.97L.711.571.751.871.751.821.981.991.961.891.741.831.911.89.92.74.79
2.001.641.721.451.871.83.97
2.022.011.962.062.032.031.791.89
::
.66
.85
.92
.92
.99
.921.80.87
1.73
:::
.97
.94
.74
.97
.75
.83
.771.761.762.021.981.812.031.971.871.811.762.032.131.862.222.59
.83
Dry-bulkdensity(Mg/m3)
0.930.960.940.950.911.321.171.221.031.421.020.861.101.281.071.231.461.481.411.341.111.191.361.311.371.071.161.470.921.050.951.291.231.431.471.501.341.491.501.501.161.323.981.27L.351.321.381.331.181.311.07
1.311.301.021.181.071.221.161.111.141.491.441.181.511.411.291.18.09.53.56
1.23.78
2.2i1.24
Graindensity(Mg/m3)
2.932.582.602.702.482.822.622.732.742.792.792.712.742.782.802.652.652.672.782.682.602.722.642.712.692.762.702.852.712.662.732.752.732.842.812.852.872.862.852.872.622.672.582.762.672.762.742.802.562.612.64
2.892.742.722.892.552.642.572.692.592.762.712.542.772.752.642.562.722.743.092.732.832.882.65
Porosity
Wet(%)
78.369.270.972.076.259.459.257.467.053.467.670.163.056.966.557.750.349.653.253.761.062.653.556.453.365.060.852.170.465.648.956.858.652.353.049.660.354.852.152.061.356.366.556.455.358.959.657.160.554.464.3
64.362.770.077.167.059.859.863.360.451.852.661.150.954.756.662.265.149.555.161.743.131.058.3
Dry(%)
71.465.466.467.567.856.257.356.564.351.465.269.261.455.563.855.747.947.551.552.159.059.351.154.151.362.958.850.467.762.858.655.156.951.150.548.856.651.450.050.258.353.563.955.352.555.554.654.857.152.361.6
59.057.265.465.761.956.857.360.858.149.250.057.148.651.954.057.862.147.352.358.240.928.455.9
Watercontent
Wet(%)
46.242.643.543.846.131.534.232.639.927.840.545.637.031.238.932.526.025.627.929.235.935.128.630.628.538.334.926.643.939.134.431.132.927.227.025.331.527.326.326.335.130.440.931.329.531.430.730.534.529.938.1
33.533.141.240.239.233.534.636.935.126.327.234.625.728.431.135.237.924.926.534.019.912.332.6
Dry(%)
85.974.276.977.985.546.151.948.466.438.468.083.858.745.463.648.235.234.438.641.256.154.140.244.139.862.253.536.378.264.252.545.249.037.336.933.946.137.535.735.654.143.869.345.541.945.744.444.052.742.661.6
50.449.470.267.264.450.452.958.554.235.637.453.034.639.745.154.261.133.236.151.524.914.048.4
446

SITE 832
Table 8 (continued).
Sample (cm)
20R-1, 4220R-3, 2622R-23R-23R-:26R-26R-27R-28R-
, 58, 87
>, 68,66, 114, 102
I, 1728R-2, 5028R-3, 14728R-5, 7029R-1, 3729R-3, 3729R-5, 3730R-2, 8330R-3, 8830R-4, 9230R-6, 9231R-3, 12732R-1, 13732R-3, 13733R-1, 12234R-2, 6035R-2, 11036R-2, 7537R-2, 9639R-2, 8540R-1, 9541R-1, 9442R-2, 8443R-1, 4743R-3, 4444R-1, 11745R-1, 10745R-3, 7246R-1, 3746R-3, 3247R-1, 7047R-2, 8748R-1, 10049R-1, 10049R-3, 10050R-2, 6350R-4, 10051R-2, 2751R-4, 7552R-2, 8552R-3, 8552R-6, 8553R-2, 8753R-4, 8753R-6, 8754R-2, 8055R-2, 14055R-4, 14056R-2, 13756R-4, 13757R-2, 6757R-4, 9758R-2, 3759R-2, 12059R-4, 12059R-6, 12060R-1, 14060R-3, 14060R-5, 12761R-1, 14761R-3, 14761R-6, 14762R-2, 2562R-4, 2563R-2, 2263R-4, 2263R-6, 2264R-2, 9064R-4, 92
Depth(mbsf)
328.12330.89347.48357.47359.09386.26386.74396.32405.07406.90409.37411.57414.57417.57420.57425.93427.48429.02432.02437.47444.27447.27453.12463.60473.70483.06492.86512.15520.45530.14541.24548.97551.94559.37568.77571.42577.77580.72587.70589.37597.70607.40610.40617.27620.62627.47630.89637.46638.78643.13647.37650.37653.37657.00667.30670.30675.87678.84684.81687.97694.17704.70707.71710.71713.00716.00718.87722.27725.25729.73732.25735.25741.52744.52747.52751.90754.92
Unit
IBIBIBIBIBIIIIIIIIIIIIIIIIIIIIIIIIIIIIIIIIIIIIIIIIIIIIIIIIIIIIIIIIIIIIIIIIIIIIIIIIIIIIIIIIIIIIIIIIIIIIIIIIIIIIIIIVIVIVIVIVIVIVIVIVIVIVIVIVIVIVIVVVVVVVVVVVVVVVVV
Wet-bulkdensity(Mg/m3)
1.952.761.912.922.212.022.332.502.262.092.081.931.941.912.012.222.301.931.942.111.851.932.271.922.001.922.092.032.062.061.971.822.182.131.961.882.122.102.161.932.052.132.002.042.242.212.402.662.572.752.442.393.002.212.632.453.312.502.872.672.371.942.062.022.002.002.162.022.142.002.042.072.092.192.192.212.43
Dry-bulkdensity(Mg/m3)
1.272.371.312.231.501.431.772.09
:::::::::::::::::
.83
.62
.62
.38
.43
.33
.48
.80
.89
.62
.40
.29
.26
.36
.85
.32
.44
.36
.511.481.451.451.361.181.701.681.391.28.60.61.72.37.54.64.47.52.84.81
2.102.392.242.462.082.052.241.642.382.173.112.222.782.482.06
::::::::::
::
.40
.55
.51
.41
.45
.75
.50
.69
.44
.52
.62
.63
.79
.78
.79
.97
Graindensity(Mg/m3)
2.842.882.614.362.752.732.592.722.822.682.432.722.482.742.772.802.783.032.652.772.712.702.862.732.672.762.822.752.742.662.722.732.822.762.742.732.822.732.772.682.742.752.702.702.792.422.732.692.692.612.582.552.732.552.712.743.612.752.892.772.622.682.732.702.772.762.672.742.772.832.752.702.712.622.742.702.81
Porosity
Wet(%)
65.938.559.067.768.856.954.140.141.345.344.453.249.757.051.641.339.830.452.680.357.455.141.258.254.353.956.353.359.659.058.762.646.444.255.458.151.047.643.354.249.748.051.550.838.738.829.126.031.428.034.533.174.655.424.027.520.027.59.2
17.829.952.849.449.457.653.340.250.544.154.250.744.244.639.739.940.645.0
Dry(%)
59.732.154.457.256.052.344.434.539.143.040.251.446.654.449.339.337.136.450.263.555.552.439.154.850.452.451.449.953.352.154.259.443.742.252.455.647.544.941.451.747.144.848.847.837.234.427.622.827.523.130.129.447.946.521.626.018.925.68.8
16.727.750.646.747.153.350.638.348.242.251.948.042.642.837.138.238.139.3
Watercontent
Wet(%)
34.614.331.623.732.028.923.816.418.822.221.928.326.330.626.319.017.716.127.838.931.829.318.631.127.828.827.626.929.729.330.635.121.821.229.031.724.623.220.528.824.823.126.425.517.718.012.410.012.510.414.514.225.425.79.3
11.56.2
11.33.36.8
12.927.924.625.129.527.319.125.621.127.825.421.821.918.618.718.819.0
Dry(%)
53.016.746.331.147.040.731.319.723.128.628.039.535.644.135.723.521.619.238.663.746.741.422.845.138.540.538.136.842.241.544.154.127.926.940.846.332.730.325.940.533.030.035.934.321.522.014.211.114.311.617.016.634.134.610.313.06.6
12.73.47.3
14.938.832.633.541.737.623.634.526.738.634.127.92822.822.923.223.4
447

SITE 832
Table 8 (continued).
Sample (cm)
65R-2, 12465R-4, 12465R-6, 12466R-1, 11966R-3, 11967R-2, 11269R-2, 12169R-4, 14569R-6, 4570R-1, 14770R-3, 14570R-5, 14571R-2, 12571R-5, 10572R-2, 2272R-4, 2972R-6, 2273R-1, 1073R-2, 1273R-4, 12274R-1, 14374R-2, 14074R-3, 14076R-CC, 677R-CC, 2078R-2, 12778R-4, 12278R-6, 12079R-2, 11579R-4, 11080R-2, 10480R-4, 10081R-2, 13482R-2, 13782R-5, 13783R-1, 12383R-3, 12385R-1, 9285R-2, 8085R-3, 12385R-4, 8885R-5, 9186R-1, 7286R-3, 7287R-1, 11787R-3, 11888R-1, 12588R-2, 13088R-3, 13089R-2, 13089R-4, 13189R-6, 13590R-2, 12090R-4, 12090R-6, 12091R-2, 9792R-2, 5293R-2, 1593R-5, 1594R-2, 8095R-2, 13296R-2, 13796R-4, 13797R-2, 13397R-4, 12397R-6, 12798R-2, 12098R-5, 12099R-2, 12099R-4, 118100R-2, 131100R-4, 131
Depth(mbsf)
761.94764.94767.94769.99772.79781.22800.51803.75805.75809.17812.15815.15820.15824.45828.72831.80834.69836.80838.32842.23847.83849.30850.80865.76875.50887.77890.72893.63897.35900.30906.%909.92916.78926.57930.90934.53937.53953.52954.90956.83957.98959.51962.92965.92972.97975.98982.35983.84985.32993.60996.52999.56
1003.111006.111009.111012.571021.461030.951035.411041.271051.391061.131064.031070.831073.731076.771080.401084.901090.011092.991099.811102.82
Unit
VVVVVVVVVVVVVVVVVVVVVVVVIVIVIVIVIVIVIVIVIVIVIVIVIVIVIIVIIVIIVIIVIIVIIVIIVIIVIIVIIVIIVIIVIIVIIVIIVIIVIIVIIVIIVIIVIIVIIVIIVIIVIIVIIVIIVIIVIIVIIVIIVIIVIIVIIVII
Wet-bulkdensity(Mg/m3)
2.692.252.472.412.112.102.302.282.012.242.322.392.021.912.002.132.082.202.422.042.262.292.192.262.382.292.182.112.052.202.232.082.062.202.112.262.242.302.122.072.052.342.182.412.142.342.072.281.982.132.022.132.242.162.132.202.162.192.072.292.292.272.262.112.072.202.232.132.222.062.312.26
Dry-bulkdensity(Mg/m3)
2.241.832.032.111.631.641.821.801.391.791.941.961.531.481.451.701.591.772.051.561.871.961.781.872.031.88
:;
:
.76
.681.591.77.83.62.60.81.66.92.85.94.67.57.54.92.71
>.O9.70.94
1.531.871.461.691.531.641.881.761.531.771.741.801.631.931.931.961.901.671.63.82.89.72.85.62.95.88
Graindensity(Mg/m3)
2.352.62.672.642.712.692.592.582.462.712.682.712.662.322.712.672.682.712.812.662.762.692.682.772.802.742.702.632.612.722.752.632.612.632.682.712.672.732.562.642.642.682.632.712.632.702.772.762.482.622.552.572.672.582.792.632.732.612.562.452.632.382.432.512.452.372.522.552.512.482.692.64
Porosity
Wet(%)
43.640.543.328.846.644.846.747.360.543.837.142.147.542.653.642.348.141.735.647.037.831.939.238.833.539.941.042.744.942.038.845.145.338.343.733.037.634.843.748.249.740.845.331.242.539.752.839.750.842.548.247.235.539.958.941.741.738.143.135.335.930.834.642.843.437.733.540.536.342.835.338.0
Dry(%)
31.636.736.626.643.842.640.240.751.940.234.137.045.440.350.340.145.139.133.044.736.030.637.336.731.737.038.740.442.639.437.042.542.836.041.531.935.333.140.345.146.236.541.329.039.935.849.237.246.639.844.942.733.837.252.138.539.835.840.631.133.127.430.839.439.833.231.137.833.239.833.035.0
Watercontent
Wet(%)
16.618.518.012.222.621.920.821.230.820.116.418.024.122.827.420.323.719.415.123.617.114.318.417.514.417.919.220.722.419.517.822.222.517.821.215.017.215.521.123.924.817.921.313.320.417.426.217.926.220.424.422.716.218.928.319.419.717.821.315.816.013.915.720.821.517.515.419.416.821.315.717.2
Dry(%)
2022.621.91429.22826.326.944.525.119.62231.729.637.825.53124.117.830.920.616.622.521.316.921.823.826.128.924.221.728.52921.726.917.620.818.426.831.53321.827.115.325.62135.521.735.625.732.329.419.423.339.524.124.621.727.118.719.116.118.626.327.421.318.224.120.127.018.620.7
448
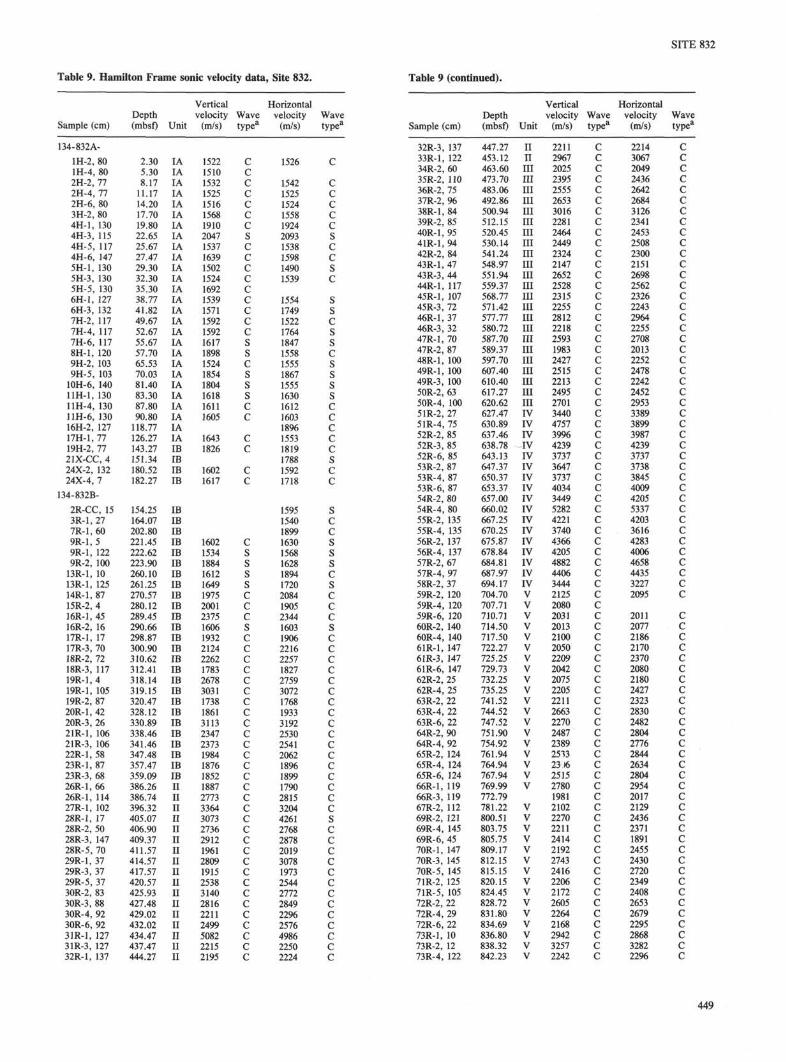
SITE 832
Table 9. Hamilton Frame sonic velocity data, Site 832. Table 9 (continued).
Sample (cm)
134-832A-
1H-2, 801H-4, 802H-2, 772H-4, 772H-6, 803H-2, 804H-1, 1304H-3, 1154H-5, 1174H-6, 1475H-1, 1305H-3, 1305H-5, 1306H-1, 1276H-3, 1327H-2, 1177H-4, 1177H-6, 1178H-1, 1209H-2, 1039H-5, 10310H-6, 14011H-1, 13011H-4, 13011H-6, 13016H-2, 12717H-1, 7719H-2, 7721X-CC, 424X-2, 13224X-4, 7
134-832B-2R-CC, 153R-1, 277R-1, 609R-1, 59R-1, 1229R-2, 10013R-1, 1013R-1, 12514R-1, 8715R-2, 416R-1, 4516R-2, 1617R-1, 1717R-3, 7018R-2, 7218R-3, 11719R-1, 419R-1, 10519R-2, 8720R-1, 4220R-3, 2621R-1, 10621R-3, 10622R-1, 5823R-1, 8723R-3, 6826R-1, 6626R-1, 11427R-1, 10228R-1, 1728R-2, 5028R-3, 14728R-5, 7029R-1, 3729R-3, 3729R-5, 3730R-2, 8330R-3, 8830R-4, 9230R-6, 9231R-1, 12731R-3, 12732R-1, 137
Depth(mbsf)
2.305.308.1711.1714.2017.7019.8022.6525.6727.4729.3032.3035.3038.7741.8249.6752.6755.6757.7065.5370.0381.4083.3087.8090.80118.77126.27143.27151.34180.52182.27
154.25164.07202.80221.45222.62223.90260.10261.25270.57280.12289.45290.66298.87300.90310.62312.41318.14319.15320.47328.12330.89338.46341.46347.48357.47359.09386.26386.74396.32405.07406.90409.37411.57414.57417.57420.57425.93427.48429.02432.02434.47437.47444.27
Unit
IAIAIAIAIAIAIAIAIAIAIAIAIAIAIAIAIAIAIAIAIAIAIAIAIAIAIAIBIBIBIB
IBIBIBIBIBIBIBIBIBIBIBIBIBIBIBIBIBIBIBIBIBIBIBIBIBIBIIIIIIIIIIIIIIIIIIIIIIIIIIIIIIIIII
Verticalvelocity(m/s)
1522151015321525151615681910204715371639150215241692153915711592159216171898152418541804161816111605
16431826
16021617
1602153418841612164919752001237516061932212422621783267830311738186131132347237319841876185218872773336430732736291219612809191525383140281622112499508222152195
Wavetypea
ccccCccscccccccccsscssscc
cc
cc
csssscccsccccccccccccccccccccccccccccccc
Horizontalvelocity(m/s)
1526
1542152515241558192420931538159814901539
155417491522176418471558155518671555163016121603189615531819178815921718
1595154018991630156816281894172020841905234416031906221622571827275930721768193331922530254120621896189917902815320442612768287820193078197325442772284922962576498622502224
Wavetype3
c
ccCccsCcsc
sscsscsssscccccscc
sccssscscccscccccccccccccccccsccccccccccccc
Sample (cm)
32R-3, 13733R-1, 12234R-2, 6035R-2, 11036R-2, 7537R-2, 9638R-1, 8439R-2, 8540R-1, 9541R-1, 9442R-2, 8443R-1, 4743R-3, 4444R-1, 11745R-1, 10745R-3, 7246R-1, 3746R-3, 3247R-1, 7047R-2, 8748R-1, 10049R-1, 10049R-3, 10050R-2, 6350R-4, 10051R-2, 2751R-4, 7552R-2, 8552R-3, 8552R-6, 8553R-2, 8753R-4, 8753R-6, 8754R-2, 8054R-4, 8055R-2, 13555R-4, 13556R-2, 13756R-4, 13757R-2, 6757R-4, 9758R-2, 3759R-2, 12059R-4, 12059R-6, 12060R-2, 14060R-4, 14061R-1, 14761R-3, 14761R-6, 14762R-2, 2562R-4, 2563R-2, 2263R-4, 2263R-6, 2264R-2, 9064R-4, 9265R-2, 12465R-4, 12465R-6, 12466R-1, 11966R-3, 11967R-2, 11269R-2, 12169R-4, 14569R-6, 4570R-1, 14770R-3, 14570R-5, 14571R-2, 12571R-5, 10572R-2, 2272R-4, 2972R-6, 2273R-1, 1073R-2, 1273R-4, 122
Depth(mbsf)
447.27453.12463.60473.70483.06492.86500.94512.15520.45530.14541.24548.97551.94559.37568.77571.42577.77580.72587.70589.37597.70607.40610.40617.27620.62627.47630.89637.46638.78643.13647.37650.37653.37657.00660.02667.25670.25675.87678.84684.81687.97694.17704.70707.71710.71714.50717.50722.27725.25729.73732.25735.25741.52744.52747.52751.90754.92761.94764.94767.94769.99772.79781.22800.51803.75805.75809.17812.15815.15820.15824.45828.72831.80834.69836.80838.32842.23
Unit
IIIIIIIIIIIIIIIIIIIIIIIIIIIIIIIIIIIIIIIIIIIIIIIIIIIIIIIIIIIIIIIIIIIIIIIIIIVIVIVIVIVIVIVIVIVIVIVIVIVIVIVIVIVVVVVVVVVVVVVVVVVVVV
VVVVVVVVVVVVVVV
Verticalvelocity(m/s)
221129672025239525552653301622812464244923242147265225282315225528122218259319832427251522132495270134404757399642393737364737374034344952824221374043664205488244063444212520802031201321002050220920422075220522112663227024872389253323J6251527801981210222702211241421922743241622062172260522642168294232572242
Wavetype3
Ccccccccccccccccccccccccccccccccccccccccccccccccccccccccccccccccccccccccccccc
Horizontalvelocity(m/s)
2214306720492436264226843126234124532508230021512698256223262243296422552708201322522478224224522953338938993987423937373738384540094205533742033616428340064658443532272095
201120772186217023702080218024272323283024822804277628442634280429542017212924362371189124552430272023492408265326792295286832822296
Wavetypea
Ccccccccccccccccccccccccccccccccccccccccccc
ccccccccccccccccccccccccccccccccc
449

SITE 832
Table 9 (continued). Table 10. Shear-strength data, Site 832.
Sample (cm)
74R-1, 14374R-2, 14074R-3, 14076R-CC, 077R-CC, 2078R-2, 12778R-4, 12278R-6, 12079R-2, 11579R-4, 11080R-2, 10480R-4, 10081R-2, 13782R-2, 13782R-4, 13783R-1, 12383R-3, 12384R-2, 4285R-1.9285R-2, 8085R-3, 12385R-4, 8885R-5, 9186R-1, 7286R-3, 7287R-1, 11787R-3, 11888R-1, 12588R-2, 13088R-3, 13089R-2, 13089R-4, 13189R-6, 13590R-2, 12090R-4, 12090R-6, 12091R-2, 9792R-2, 5293R-2, 1593R-5, 1594R-2, 8095R-2, 13296R-2, 13796R-4, 13797R-2, 13397R-4, 12397R-6, 12798R-2, 12098R-5, 12099R-2, 12099R-4, 118100R-2, 131100R-4, 131
Depth(mbsf)
847.83849.30850.80865.70875.50887.77890.72893.63897.35900.30906.96909.92916.81926.57929.42934.53937.53944.82953.52954.90956.83957.98959.51962.92965.92972.97975.98982.35983.84985.32993.60996.52999.56
1003.111006.111009.111012.571021.461030.951035.411041.271051.391061.131064.031070.831073.731076.771080.401084.901090.011092.991099.811102.82
Unit
VVVVIVIVIVIVIVIVIVIVIVIVIVIVIVIVIVIIVIIVIIVIIVIIVIIVIIVIIVIIVIIVIIVIIVIIVIIVIIVIIVIIVIIVIIVIIVIIVIIVIIVIIVIIVIIVIIVIIVIIVIIVIIVIIVIIVIIVII
Verticalvelocity
(m/s)
23502690219526183272305831413124297930023017292129923063267635293294190536822249287723043419322340743229317531253813270329402599273829802908241432302935320927793729377436423900368330693350356330343608328031893332
Wavetypea
C
cccccccccccccccccccccccccccccccccccccccccccccccccccc
Horizontalvelocity
(m/s)
238126792164
3436301031233149305631083126292330403068272935603235187934412224277823613394323837863227338431073477260728252522269131012965248931913089321127843643367435323757365031153503352832223645322431993385
Wavetypea
C
ccccccccccccccccccccccccccccccccccccccccccccccccccc
Sample (cm)
134-832A-
1H-2, 851H-4, 852H-2, 832H-2, 1222H-4, 832H-6, 913H-2, 904H-1, 1354H-5, 1225H-1, 165H-1, 1275H-5, 1265H-7, 466H-3, 1286H-4, 716H-7, 367H-1, 627H-4, 1238H-1, 1159H-2, 939H-5, 989H-7, 46
10H-1, 14710H-3, 12310H-6, 14611H-1, 13517H-1, 8319H-2, 8420H-1, 14320H-3, 12624X-2, 12624X-4, 426X-1, 6
134-832B-
3R-1, 377R-1, 678R-1, 689R-2, 106
13R-1, 54
Depth(mbsf)
2.355.358.238.62
11.2314.3117.8019.8525.7228.1629.2735.2637.4641.7842.7146.8647.6252.7357.6565.4369.9872.4673.9776.7381.4683.35
126.33143.34146.43149.26180.46182.24196.76
164.17202.87212.58223.96260.54
Unit
IAIAIAIAIAIAIAIAIAIAIAIAIAIAIAIAIAIAIAIAIAIAIAIAIAIAIAIBIBIBIBIBIB
IBIBIBIBIB
Undrainedshear strengtha
(kPa)
12.516.122.728.624.243.320.513.256.522.013.242.558.730.822.735.938.951.331.518.347.713.261.673.355.051.344.035.263.855.014.716.942.5
49.126.438.940.954.3
Values determined by Wykeham-Farrance springvane-shear apparatus.
C = compressional (P-wave) and S = shear (5-wave.
450

SITE 832
Shear strength (kPa)
10 20 30 40 50 60 70 80
.αE
Q.ΦQ
I I I I I I I I I I I I I I I I I I I I I I I I I I I I I I I I I I I
200 -
250 -
300
Figure 52. Shear strength vs. depth, Site 832.
100
200
IB
© 600
700
800
900
1000-
1100-
VI
VII
Thermal conductivity (W/[m K])
0.4 0.8 1.2 1.6
•
•
Table 11. Thermal conductivity data, Site832.
Sample (cm)
134-832A-
2H-3, 682H-4, 682H-5, 682H-6, 753H-1, 753H-2, 754H-1, 754H-2, 754H-4, 755H-2, 755H-6, 755H-7, 306H-1, 756H-2, 756H-3, 756H-4, 757H-1, 757H-2, 757H-4, 757H-6, 758H-1, 758H-2, 758H-3, 759H-1, 759H-2, 759H-3, 759H-5, 75
10H-1, 7510H-2, 7510H-4, 7510H-6, 7511H-1, 7511H-2, 7511H-4, 7511H-6, 7516H-1, 7516H-2, 7517H-1, 7517H-2, 7519H-1, 6519H-2, 6520H-1, 7520H-2, 9020H-3, 7520H-4, 6024X-2, 7524X-3, 75
134-832B-
52R-6, 4852R-6, 4855R-5, 1055R-5, 1061R-3, 061R-3, 064R-2, 764R-2, 782R-3, 6982R-3, 6982R-3, 6997R-3, 5097R-3, 50
Depth(mbsf)
9.5811.0812.5814.1516.1517.6519.2520.7523.7530.2536.2537.3038.2539.7541.2542.7547.7549.2552.2555.2557.2558.7560.2563.7565.2566.7569.7573.2574.7577.7580.7582.7584.2587.2590.25
116.75118.25126.25127.75141.65143.15145.75147.40148.75150.10179.95181.45
642.76642.76670.50670.50723.IS723.78751.07751.07927.33927.33927.33
1071.501071.50
Unit
IAIAIAIAIAIAIAIAIAIAIAIAIAIAIAIAIAIAIAIAIAIAIAIAIAIAIAIAIAIAIAIAIAIAIAIAIAIAIAIBIBIBIBIBIBIBIB
IVIVIVIVVVVVVIVIVIVIIVII
Value(W/[m K])
1.11430.94390.91920.83590.96350.94770.89740.83790.90130.93050.86820.90050.92810.93250.90950.93540.91770.91730.75110.89290.90310.94631.12960.95711.02771.07450.90140.92800.93250.90750.90760.98760.90690.92780.87671.09451.01010.97540.92810.96620.96681.00431.04630.91320.96280.82540.8992
1.37681.24181.43491.92131.32761.40961.49681.44421.30941.06961.16161.23661.1399
Figure 53. Thermal conductivity vs. depth, Site 832.
451

SITE 832
600
1 A'
If
CDQ
800
900
1000 -
11000 30 60 90
Dip (°)
:. %
I
>0 120i240 360
Direction (°)
600
700
800
CL
Q
900
1000
1100
rrr™
i • .
I. á
600
700
800
900
1000
1100
-4 >
r
0 30 60 ! 90Dip (°)
0 1120 ! 240'360Direction (°)
0 120 240 360Direction (°)
Units
Figure 54. Summary of structures measured from FMS data. A. Bedding. B. Faults (circles) and oblique fractures (triangles). C. Verticalfractures.
452

672
673
60Orientation (°)
120 180 240 300 360
674
Figure 55. Drilling-induced vertical fracture in sandstone that isparallel to the principal-stress direction. FMS images.
922
923
924
925
60
Orientation (°)
120 180 240
SITE 832
300 360
926
Figure 56. Drilling-enhanced oblique fracture in sandstone. FMSimages.
453

SITE 832
75060
Orientation (°)120 180 240 300 360
752
Figure 57. Example of faults that dip 50°-60° in lithostratigraphic UnitV. FMS images.
929
Orientation (°)120 180 240 300 360
Figure 58. Parallel bedding that dips 45° in volcanic sandstonelithostratigraphic Unit VI. FMS images.
of
454

SITE 832
97660
Orientation (°)120 180 240 300 360
978
Figure 59. Finely laminated bedding that dips 40° to 60° and has a dipazimuth of 355° in lithostratigraphic Unit VII. FMS images.
ü
30
25
20
α>
I 158.
10
5 -
I ' I ' I '
I
20 40 60Time (min)
80 100
Figure 60. Temperature vs. time for water sampler temperature probe(WSTP) run 4H in Hole 832A at a depth of 18.5 mbsf.
0
5
(0.)Te
mpe
ratu
reC
O
J*.
2
1
1 i • i
7=4.5114 +
-
-
-
, i i i
1
(-32.828X)
i
i
R = 0.96097'
-
-
-
-
i
0 0.002 0.004 0.006 0.008 0.011/time (s)
Figure 61. Reduction to equilibrium temperature for WSTP run 4H inHole 832A. The temperature value at I/time = 0 is the equilibriumvalue.
25
-^20J3
1)
I 1 5
1S 10
5
n
I ' I ' I ' I,
T \ l ^
-
-\
V A Ji , i , i , i
20 40 60Time (min)
80 100
Figure 62. Temperature vs. time for WSTP run 7H in Hole 832A at adepth of 47.0 mbsf.
455

20 40 60Time (min)
80 100
Figure 63. Temperature vs. time for WSTP run 20H in Hole 832A ata depth of 145.0 mbsf.
40 60Time (min)
Figure 64. Temperature vs. time for WSTP run 27X in Hole 832A ata depth of 196.7 mbsf.
10 20 30 40 50 60Time (min)
70 80
Figure 65. Temperature vs. time for WSTP run 28X in Hole 832A ata depth of 215.9 mbsf.
15
14
üo
Φ
3
< δ •
ECD
13
11
10
y = 12.795 + 77.819x R = 0.99261
0.010.002 0.004 0.006 0.0081/time (s)
Figure 66. Reduction to equilibrium temperature for WSTP run 28X inHole 832A. The temperature value at I/time = 0 is the equilibriumvalue.
35
30
25
ügT 20
ε8. 15
I10
5
-
-
I r ,, I , I , I
I ' I
J-
, I ,
800 10 2 0 3 0 4 0 5 0 6 0 7 0
Time (min)
Figure 67. Temperature vs. time for WSTP run 4R in Hole 832B at adepth of 173.3 mbsf.
13.0
12.5
ü 12.0
<ç 1 1 . 5
IΦI- 11.0
10.5
10.0
y = 11.102 + 31.226* R = 0.98323
0.002 0.004 0.0061/time (s)
0.008 0.010
Figure 68. Reduction to equilibrium temperature for WSTP run 4R inHole 832B. The temperature value at 1/time = 0 is the equilibriumvalue.
456

SITE 832
30 40Time (min)
Figure 69. Temperature vs. time for WSTP run 10R in Hole 832B at adepth of 231.0mbsf.
30 40 50Time (min)
Figure 70. Temperature vs. time for WSTP run 19R in Hole 832B at adepth of 318.1 mbsf.
25
ü 20
15
10
y = 13.382 + 1127.7* R = 0.99754
0.002 0.004 0.0061/time (s)
0.008 0.010
Figure 71. I/time reduction for WSTP run 19R in Hole 832B. Theextreme frictional heating of this measurement causes this approxi-mation to underestimate the equilibrium temperature.
0
y= 3.191 +0.041784X R = 0.99381250
6 8 10Temperature (°C)
14
Figure 72. Temperature vs. integrated thermal resistivity at Site 832.The least-squares fit reduction line gives the surficial heat flow of 41.8mW/m2.
457
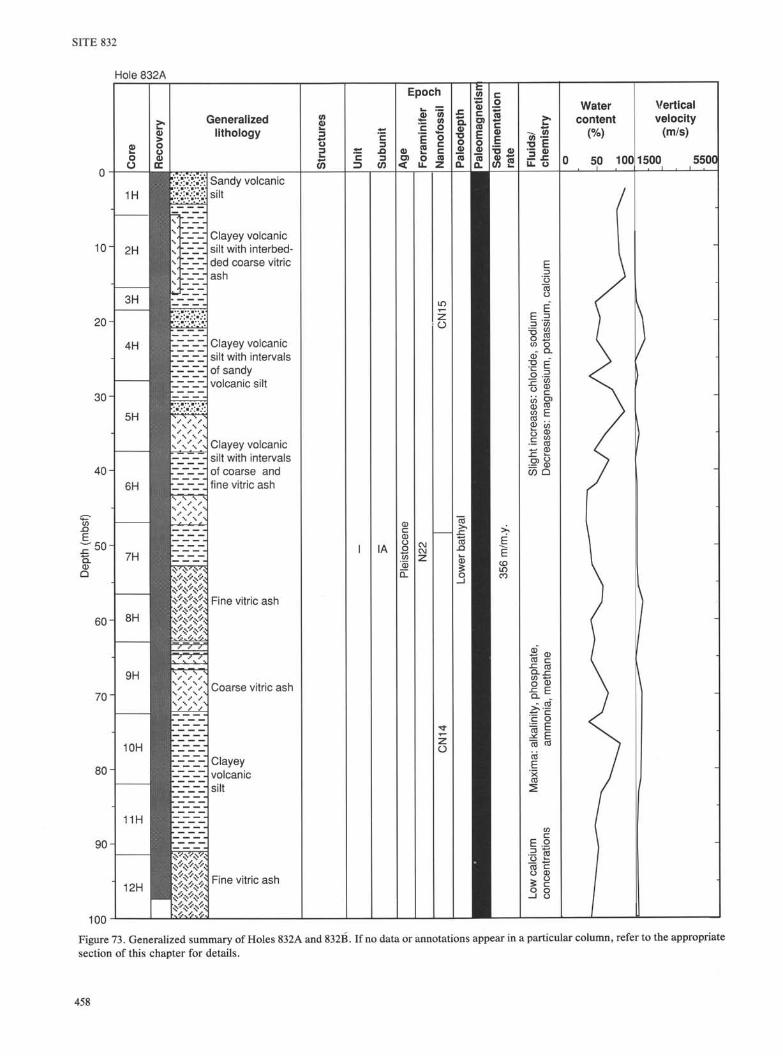
SITE 832
Hole 832A
3 0 -
4 0 -
5 0 -
6 0 -
70
8 0 -
90-
100-
1H
2H
3H
4H
5H
6H
7H
8H
9H
10H
11H
12H
Generalizedlithology
Sandy volcanicsilt
Clayey volcanicsilt with interbed-ded coarse vitricash
Clayey volcanicsilt with intervalsof sandyvolcanic silt
Clayey volcanicsilt with intervalsof coarse andfine vitric ash
Fine vitric ash
Coarse vitric ash
Clayeyvolcanicsilt
Fine vitric ash
IA
Epoch
£ 8s aE c
Φ 2 Cσ o n< u. z
•5 β>
EE
CDinCO
^ 1T3 E
5 2LL ü
E13 55
o £CO O
5 E2
IS05 CO
SS8CO Q
CΛ
cE .2
Watercontent
50 100
Verticalvelocity
(m/s)
500 5500
Figure 73. Generalized summary of Holes 832A and 832B. If no data or annotations appear in a particular column, refer to the appropriate
section of this chapter for details.
458

SITE 832
Hole 832A (continued)
100
110
120-
130
140-
'150CLΦQ
160
170
180
190-
200 J
O
Generalizedlithology
14H
15H
16H
17H
18H
19H
20H
21X
22X
23X
26X
Coarsevitric ash
Clayey volcanicsilt
Finevitric ash
Coarsevitric ash
Finevitric ash
Coarse vitric ash
Plagioclasevolcanic silt
Fine vitric ash
Silty volcanic clayand claystone
55
IB
Epoch
I 1c o
ε °σ> o< u.
O
dep
ieo
CO3.
fc<Λ
c
mag
oα>CO
CLm m rti * ^
T3T3 ε
LJ. ü
- CO
itE E
Watercontent
50 100
Verticalvelocity
(m/s)
1500 550C
Figure 73 (continued).
459

SITE 832
200-
210-
Hole 832A (continued)
ΦCOü
26X
27X
>5ooΦ
DC
Generalizedlithology
"I~Z~I~ Silty volcanic clayand claystone
(AΦ
ctu
r
3
ft
un
it
= .QC 3
= > CO
1 I B
Epoch
Φ
σ><
α>
§o'05CL
ife
cE2o
LL
CMCM
—(A(A
nofc
cCO
Z
zü
f
>ode
(0
α.
5.
ath
°
ism
Φ
CcnAt(W
EoΦCO
Q .
co
Φ
Se
dra
te
εCO
« 12 EC o
Watercontent
(%)
0 50 100
I
Verticalvelocity
(m/s)
1500 5500I . I ,
-
Figure 73 (continued).
460

SITE 832
110-
120-
130-
140-
»st)
JJ
E1 5 0 -Q.Φ
160-
I70-
iftfl-I OU
190-
200-
Hole 832B
Φ
Oü
•σΦ
COCO
1R
2R
3R
4R
5R
6R
?•>
co
vei
Φ
oc
IfSI
Generalizedlithology
I-I-I~~I-"-—"-—'"ij
. _ _ _
11
11
11
11
i [ 11111 [_ — _ _
- — - ~
• • • • i • •
v•• !
••••"••'
T T1 T "
' T •T T1 T •T TT T1 T -T -r• T
* * * * * * *
* * * * * * *
* * * * * * *
* * * * * * *
* * * * * * *
&?*?*?'* '*'*?**********************************
Clayey volcanicsilt with thin ashlayers
Foraminiferalsandy silty mixedsediment
Fine vitric ash
COΦ
uct
ur
CO
A
it bu
nit
1 IB
Epoch
Φ
<?
>to
cem
leij
‰-
ife
ram
in
ou_
3 N
22
_'to(A
nn
ofc
CO
;N14
t
leo
de
r b
athy
%
ism
ΦCU)3
LU
O9
|
raQ.
I
coraΦ
w 2
m/m
.y.
CO
mCO
jids/
em
ist
E o
nts
die
coσ>'ocg <D
3 SC CO
81
Watercontent
(%)
0 50 100
I
\
\\\
r
/
Verticalvelocity
(m/s)
1500 5500
-
-
-
-
-
-
-
-
-
Figure 73 (continued).
461

SITE 832
Hole 832B (continued)
200
210-
220-
230
240-
250-CLCD
Q
260
270-
280-
290
300
Generalizedlithology
10R
11R
12R
13R
14R
15R
16R
Calcareousvolcanic silt
Clayeyvolcanic silt
Clayey volcanicsiltstone
Calcareoussilty volcanicclay
c/>
c
C 33 (0
IB
EpochWater
content
o 59
Verticalvelocity
(m/s)
1001500 5500
Figure 73 (continued).
462

SITE 832
Hole 832B (continued)
310-
320
330-
340-
360-
370-
380-
390-
400
17R
18R
19R
20R
Generalizedlithology
21R
22R
23 R
24R
25R
26R
Silty volcanicclaystone
Volcanicsandstone
Calcareous chalk
Volcanicsandstone
Silty claystone
Fine vitric ash
Calcareousvolcanicsiltstone
Calcareousclayeyvolcanicsiltstone
^ Sed-igneousbreccia
Silty claystone
Sed-igneousbreccia
55
v/
bu
ni
IB
Epoch
Zü
εε
CO00CM
ε
Iciu
re
ity
_g
sal
Φ~
o
rëε'×re
ε*3
issi
+2o
ε"
Φ
a?εrëε
ini
Watercontent
50 100
Verticalvelocity
(m/s)
1500 5500
Figure 73 (continued).
463

SITE 832
400-
410-
420"
430"
440"
4b(J-
460"
4/0-
480-
490-
Hole 832B
2!oü
P7R
28R
—
29R
—
30R
31R
-
32R
33R
34R
35R
36R
—
37R
>>
cove
r
Φ
CC
II••mI
••
-_
_
m
I1
continued)
Generalizedlithology
. A. A. Λ.A. A. A. A
b A, A AA. j*. .*. .4i Λ. A. A.
r"_•~_~_"
£#££*•"•••* ••" •
: - : - : - :
:•. :••.•>".•:i
r •.v•-.y• .v•
'•'i'' 'm'' 'm''im•M•n•
pi
—-:-::-::•••• •
—
? ?
1 11 1 —
1 11 1
1 ' 1 '
1 1—
1 1-i—rI-T—
i—i—i i
i—i—i i
i—i—
i ii i
i—i—
i—i—i i
Sed-igneousbreccia
Volcanicsandstone
Silty volcanicclaystone
Silty calcareous
volcanicsandstone
Volcanicsandstone
Calcareoussiltyclaystone
Calcareoussandy
siltstone
Basaltic breccia
Sandy volcanicsiltstone
Foraminiferalchalk withclay
Foraminiferalsilty mixedsedimentaryrock
Foraminiferalchalk with clay
and volcanicsilt and layersof ash
COΦ
uc
tur
£±á.
/ ^ /
A
m\
it bu
nit
C 33 (/)
II
III
Epoch
<
CD
Φü
<n
a>Q_
i - •—Φ CO
ram
in
nn
ofc
o coU. Z
CM
zΦ
εivt
eo
de
CO
Q.
yal
Dath
i _
3
UIS
Φ
eo
mj
COQ.
cgi2Φ
T5 Φ
CO k•
fcCOCM
7ò •=• D E
E
CO
^1CO w
o >
ium sal
S5 Φc !2
E l
(ima
ma:
CO . c
Watercontent
(%)
0 50 100
\
(
)
//(\
\\
\/
//
//
/
\
\
Verticalvelocity
(m/s)
1500 5500i , i .
)
\
\
)
/
\
^ ^
\
\
)
/
/
•
III
-
\Figure 73 (continued).
464

SITE 832
Hole 832B (continued)
500
510-
520-
530-
540-
.Q
E550-
ΦQ
560-
5 7 0 -
5 8 0 -
5 9 0 -
Generalizedlithology
38R
39R
40R
41R
42R
43R
44R
45R
46R
47R
600
Figure 73 (continued).
Basaltic breccia
Foraminiferalsilty sandymixedsedimentaryrock
Clayeycalcareousmixedsedimentaryrock
Silty volcanicsandstone
Volcanicconglomerate
Basaltic breccia
Silty limestone
Basaltic breccia
Siltylimestone
Basaltic breccia
\
as IC 3
13 </)
Epoch
£ 8.E a
α> 2 iσ> o «< LJ. Z
5 a)
Sis U- O
T3COO)Q.CDΦ
Oü
Watercontent
50i
100
\
Verticalvelocity
(m/s)
1500 5500
465

SITE 832
Hole 832B (continued)
600
Generalizedlithology I
o3
*—
E
bun
3CO
Φ
<
[E
ram
o
ou
u
COz
Epoch
P E
EI
Watercontent
0 50 100
Verticalvelocity
(m/s)
1500 5500
610^
620"
630
6 4 0 -
<Λ-Q
650-
α.ΦQ
660-
670-
680-
48R
49R
50R
51R
52R
53R
54R
55R
56R
57R
[A A Ai
A Λ. Λ. 4
690-
58 R
700
Silty limestoneinterbedded withbasaltic breccia
Volcanicsandstone
v/
Basaltic brecciainterbedded withvolcanicsandstone
y
IV
COΦ
E 5,
„ E
II« w
w -
Φ 3
O %
oR
11co .E
Figure 73 (continued).
466

SITE 832
Hole 832B (continued)
700o
Generalizedlithology
I I
Epoch
£ 8
Φ 2 iO) o <B< U. Z
-– (0
11 2U. ü
Watercontent
50 100
Verticalvelocity
(m/s)
1500 5500
710-
7201
730-
740-
750-Q .CDQ
760-
770-
780-
790-
800
59R
60R
61R
62R
63 R
64R
65R
66R
67R
68R
IV
Calcareoussiltyclaystone
Clayeycalcareous siltymixedsedimentary rock
Foraminiferallimestone
Calcareousvolcanic siltstone
Silty limestonewith clay
Clayeyforaminiferalandnannofossillimestone withash layers
Sandy volcanicsiltstone
Finelyinterbeddedsilty clayeyforaminiferallimestone andvolcanicsandstone
CLΦCD
CO
ü
ü
o
Figure 73 (continued).
467

SITE 832
Hole 832B (continued)
Figure 73 (continued).
468

SITE 832
Hole 832B (continued)
900
910-
920"
930-
940-
E950-
CLCDQ
960-
970-
980-
990-
Generalizedlithology
79R
80R
81R
82R
83 R
84R
85R
86R
87R
88R
89R
1000
Figure 73 (continued).
Volcanicsandstone
Volcanic siltstone
Volcanicconglomerate
Sandy volcanicsiltstone
Volcanic brecciaandconglomerateinterbedded withvolcanicsandstone andsiltstone
Volcanicsandstone
Mmtr•×
\mΘ|×
11
VI
VII
Epoch
Φ ö)
C O
I 2o 2σ> o
< LL
si
Watercontent
50 100 1500
Verticalvelocity
(m/s)
5500
469

SITE 832
Hole 832B (continued)
1000
Generalizedlithology
IC 3
Z> CO
Epoch
£ 8c oE £
Φ 2 Co> o co
< LL. Z
o
CO
Φ
TJ Φ
-a. toen •=
•σ E
Watercontent
50 100
Verticalvelocity
(m/s)
1500 5500
90R
1010 -
91R
1030-
1040-
1050-
1060
1070-
1080-
92R
93R
94R
95R
96R
97R
98R
1090-
99R
fjk Jk A J
ik
1100
Figure 73 (continued).
Volcanicsandstone
Zeolitic, silty claystone
Basaltic breccia
Interbeddedclayey silt,sandy silt andvolcanic breccia
v/
VII
Basaltic breccia
Basaltic sandstone
Basaltic brecciainterbedded withvitric volcanicsandstone
CO CO
470

SITE 832
Hole 832B (continued)
o 11 nn
<DQ
Φ
Oü
100R
>,Φ
OUΦ
DC
Generalizedlithology
Basaltic breccia
Volcanicsandstone
COΦ
3
ü3
COC
z>
VII
nit
3
3CO
Epoch
ife
c
Iα> o
< U-
? ?
—
T>ccCO
z
?
nΦ
oΦCO
Q.
?
LUS
eti
cσ>
εoΦ
Pal
?
co
ita
Φ
εTJ Φ
Se
rat
•σ E
Watercontent
(%)
0 50 100i i i
I
Verticalvelocity
(m/s)
1500 5500
\
-
• V W l BasalticbrecciaSilt/siltstone
TlTlTlj Sand/silt/clay
Volcanicsandstone
Foraminiferalchalk
Limestone
I j Silty clay/ ^ SI 1 clayey silt B ahr••;•• •;••••;•?•] S i l t y s a n d /t•. v-'•. •••i sandy silt
^ M R Calcareous
^ S 3 chalk
Figure 73 (continued).
471

SITE 832
Hole 832B: Resistivity-Sonic-Natural Gamma Ray Log Summary
RESISTIVITY
FOCUSED
5 ?SPECTRAL GAMMA RAY I 0 3 o h m # m '
I COMPETED .^HALLOW
I 0 API units 50 I 0.3 ohm m 30 |LU to O
CC 8 fc< I TOTAL I DEEP I TRANSIT TIME
8 a. Dw l~ö API units 50 I 0.3 ohm m 30 | 200 µs/ft 50
UJOmoiCL<LULU
14
15
16
17
18
19
20
21
22
23
24
25
26
27
28
29
30
31
300 -
350 -
400 -
< ~
DATA RECORDED OPEN HOLE
300
350
" 400
472

SITE 832
Hole 832B: Resistivity-Sonic-Natural Gamma Ray Log Summary (continued)
RESISTIVITY
FOCUSED
SPECTRAL GAMMA RAY I ° 3 ohm m 30
cπ LU oLU CO O
LU O fu-CC ü Q-<O LU LULU
0 API units 50 | 0.3 ohm m 30 |
TOTAL DEEP TRANSIT TIME
API units 50 | 0.3 ohm m 30 I 200 µs/ft 50
5εLU O
moQ-<LULU
32
33
34
35
36
37
38
39
40
41
42
43
44
45
46
47
48
450 "
500 -
550 -
6 0 0 -
- 450
- 500
- 550
- 600
473

SITE 832
Hole 832B: Resistivity-Sonic-Natural Gamma Ray Log Summary
RESISTIVITY
FOCUSED
Lx W OI 11 mo> i—'
LU o f— -<T ü Q-<O LU LU LUü CE Q W
49
50
51
52
_ SPECTRAL GAMMA RAY I ° 3 o h m * m 3 0 I
^COMPUTED SHALLOW
0 API units 5 0 1 0.3 ohm m 30 |TOTAL DEEP TRANSIT TIME
API units 50 | 0.3 ohm m 30 I 200 µs/ft 50
53
54
55
56
57
58
59
60
61
62
63
64
65
66
650 -
700 -
750 J
IILUOmo
Ü-<LULUQ CO
- 650
- 700
- 750
474

SITE 832
Hole 832B: Resistivity-Sonic-Natural Gamma Ray Log Summary (continued)
RESISTIVITY
FOCUSED
_ SPECTRAL GAMMA RAY I ° 3 3°O~ COMPUTED SHALLOW
m S | θ API units 50 0.3 ohm m 30 |
TOTAL DEEP TRANSIT TIME
API units 50 I 0.3 ohm m 30 | 200 µs/ft 50 | 9
CALIPER
in 19
5?3 ^
5Ü-<LJULUQOT
67
6 β
70
71
72
74
76
78
79
80
82
83
800 -
850 -
900 -
950
- 800
- 850
- 900
950
475

SITE 832
Hole 832B: Resistivity-Sonic-Natural Gamma Ray Log Summary (continued)
RESISTIVITY
FOCUSED
8 δO LLJü CC
αiOCDQ
Ü-<LULU
SPECTRAL GAMMA RAY I ° 3 ohm m 30 |
COMPUTED SHALLOW
I 0 API units 50 | 0.3 ohm m 30 |
TOTAL DEEP TRANSIT TIME
API units 50 | 0.3 ohm m 30 I 200 µs/ft 50 | 9
CALIPER
in 19
LUO
moQ-<LULU
950
85
86
87
88
89
90
91
92 I
93
94
95
96
97
1000 -
1050 -
U&l950
- 1000
- 1050
476

Hole 832B: Density-Natural Gamma Ray Log Summary
SITE 832
5 ?
CQQ
O-<LULU
SPECTRAL GAMMA RAY
I TOTAL
API units 50PHOTOELECTRIC
^COMPUTED EFFECT I DENSITY CORRECTION I URANIUM
0 API units 50 T o barns/e 10 T-0.25 "g/crr3 0.25 T 5 ppm 0 1CALIPER BULK DENSITY POTASSIUM THORIUM
in 19 1.5 g/cm3 2.5 0 wt.% 2.5 I -1 ppm
IfLULUQCO
80
81
82
83
84
85
86
87
88
89
90
91
92
93
94
95
96
97
925 -
975 -
1025 -
1075
- 925
- 975
- 1025
1075
477