Ocean currents structuring the mesozooplankton in the Gulf of Mannar and the Palk Bay, southeast...
22
Ocean currents structuring the mesozooplankton in the Gulf of Mannar and the Palk Bay, southeast coast of India L. Jagadeesan a , R. Jyothibabu a,⇑ , A. Anjusha a , Arya P. Mohan a , N.V. Madhu a , K.R. Muraleedharan a , K. Sudheesh b a CSIR National Institute of Oceanography, Regional Centre, Kochi 682 018, India b CSIR National Institute of Oceanography, Dona Paula, Goa 403 004, India article info Article history: Received 24 May 2012 Received in revised form 14 October 2012 Accepted 17 December 2012 Available online 29 December 2012 abstract The Gulf of Mannar and the Palk Bay, located between India and Sri Lanka, are the two least studied mar- ine environments in the northern Indian Ocean. We hypothesis, perceptible physical barriers that exist between the deep Gulf of Mannar and shallow Palk Bay, and seasonally reversing surface circulation pat- terns in the region have a concerted effect on the ecology of these oceanographically important areas. In the present study, data collected from 30 locations in the Gulf of Mannar and the Palk Bay in March 2010 (Spring Intermonsoon), September 2010 (Southwest Monsoon) and January 2011 (Northeast Monsoon) were used to investigate the role of ocean currents in molding mesozooplankton community character- istics in these, geographically closer and ecologically important transitional zones. Spatial difference in salinity was evident in the area with consistently higher values in the Gulf of Mannar as compared to the Palk Bay. The surface salinity was maximal during the Southwest Monsoon followed by the Spring Intermonsoon, and the Northeast Monsoon. These variations in salinity were closely linked with the sea- sonally reversing ocean currents as revealed in MIKE 21 flow model results. The mesozooplankton com- munity dominated by copepods showed significant difference in species richness between the Gulf of Mannar (81 species) and the Palk Bay (63 species). Non-metric Multidimensional Scaling (NMDS) and Agglomerative Hierarchical Cluster Analysis (AHCA) on Bray–Curtis copepod similarity clearly estranged the Gulf of Mannar and the Palk Bay waters during the Spring Intermonsoon, and the Northeast Monsoon, attributable to the truancy of durable mixing typical of these seasons. In contrast, aided by strong cur- rents, the increased mixing resulted in a homogenous copepod population in the Gulf of Mannar and the Palk Bay during the Southwest Monsoon. Furthermore, the indicator and dominant species analysis for copepods divulged the spatial heterogeneity in species composition during the Spring Intermonsoon and the Northeast Monsoon periods. Multivariate Redundancy Analyses showed salinity as the most important variable accountable for the observed variance in copepod distribution. In general, the copepod community in the Gulf of Mannar was composed both of coastal and offshore species whereas, coastal species largely inhabited the Palk Bay. This kind of a study depicting zooplankton community organiza- tion as governed by seasonally reversing monsoon circulation patterns forms the first record from the Indian coastal waters. The findings attain absolute significance considering its ecological implications on oceanographically transitional systems like the Gulf of Mannar, and the Palk Bay. Ó 2012 Elsevier Ltd. All rights reserved. 1. Introduction The Gulf of Mannar (GoM) and the Palk Bay (PB) are located be- tween India and Sri Lanka. The GoM opens to the Arabian Sea (AS) in the west and the PB opens to the Bay of Bengal (BoB) in the east. The GoM is separated from the PB by Pamban (Rameswaram) Is- land and a chain of submerged sandbars known as Ramsethu or Adams Bridge (Fig. 1a). The Ramsethu acts as a subsurface physical barrier between the Rameswaram Island of India and Mannar Is- land of Sri Lanka. The PB waters have more characteristics of the BoB such as lower salinity and higher turbidity (Rao et al., 2008). Conversely, the GoM has a narrow shelf and steeply sloping sea floor, which cause the oceanic waters flow closer to the coastline (Kumaraguru et al., 2006). Thus the GoM waters possess interme- diate characteristics of the AS and the PB (Rao et al., 2008). In marine pelagic food web, zooplankton plays a significant role in transferring organic carbon from the phytoplankton and bacteria to higher trophic levels. Zooplankton serves as a measure of biolog- ical productivity and responds to any subtle changes in physical, 0079-6611/$ - see front matter Ó 2012 Elsevier Ltd. All rights reserved. http://dx.doi.org/10.1016/j.pocean.2012.12.002 ⇑ Corresponding author. E-mail address: [email protected] (R. Jyothibabu). Progress in Oceanography 110 (2013) 27–48 Contents lists available at SciVerse ScienceDirect Progress in Oceanography journal homepage: www.elsevier.com/locate/pocean
Transcript of Ocean currents structuring the mesozooplankton in the Gulf of Mannar and the Palk Bay, southeast...
Progress in Oceanography 110 (2013) 27–48
Contents lists available at SciVerse ScienceDirect
Progress in Oceanography
journal homepage: www.elsevier .com/ locate /pocean
Ocean currents structuring the mesozooplankton in the Gulf of Mannarand the Palk Bay, southeast coast of India
L. Jagadeesan a, R. Jyothibabu a,⇑, A. Anjusha a, Arya P. Mohan a, N.V. Madhu a, K.R. Muraleedharan a,K. Sudheesh b
a CSIR National Institute of Oceanography, Regional Centre, Kochi 682 018, Indiab CSIR National Institute of Oceanography, Dona Paula, Goa 403 004, India
a r t i c l e i n f o
Article history:Received 24 May 2012Received in revised form 14 October 2012Accepted 17 December 2012Available online 29 December 2012
0079-6611/$ - see front matter � 2012 Elsevier Ltd. Ahttp://dx.doi.org/10.1016/j.pocean.2012.12.002
⇑ Corresponding author.E-mail address: [email protected] (R. Jyothibab
a b s t r a c t
The Gulf of Mannar and the Palk Bay, located between India and Sri Lanka, are the two least studied mar-ine environments in the northern Indian Ocean. We hypothesis, perceptible physical barriers that existbetween the deep Gulf of Mannar and shallow Palk Bay, and seasonally reversing surface circulation pat-terns in the region have a concerted effect on the ecology of these oceanographically important areas. Inthe present study, data collected from 30 locations in the Gulf of Mannar and the Palk Bay in March 2010(Spring Intermonsoon), September 2010 (Southwest Monsoon) and January 2011 (Northeast Monsoon)were used to investigate the role of ocean currents in molding mesozooplankton community character-istics in these, geographically closer and ecologically important transitional zones. Spatial difference insalinity was evident in the area with consistently higher values in the Gulf of Mannar as compared tothe Palk Bay. The surface salinity was maximal during the Southwest Monsoon followed by the SpringIntermonsoon, and the Northeast Monsoon. These variations in salinity were closely linked with the sea-sonally reversing ocean currents as revealed in MIKE 21 flow model results. The mesozooplankton com-munity dominated by copepods showed significant difference in species richness between the Gulf ofMannar (81 species) and the Palk Bay (63 species). Non-metric Multidimensional Scaling (NMDS) andAgglomerative Hierarchical Cluster Analysis (AHCA) on Bray–Curtis copepod similarity clearly estrangedthe Gulf of Mannar and the Palk Bay waters during the Spring Intermonsoon, and the Northeast Monsoon,attributable to the truancy of durable mixing typical of these seasons. In contrast, aided by strong cur-rents, the increased mixing resulted in a homogenous copepod population in the Gulf of Mannar andthe Palk Bay during the Southwest Monsoon. Furthermore, the indicator and dominant species analysisfor copepods divulged the spatial heterogeneity in species composition during the Spring Intermonsoonand the Northeast Monsoon periods. Multivariate Redundancy Analyses showed salinity as the mostimportant variable accountable for the observed variance in copepod distribution. In general, the copepodcommunity in the Gulf of Mannar was composed both of coastal and offshore species whereas, coastalspecies largely inhabited the Palk Bay. This kind of a study depicting zooplankton community organiza-tion as governed by seasonally reversing monsoon circulation patterns forms the first record from theIndian coastal waters. The findings attain absolute significance considering its ecological implicationson oceanographically transitional systems like the Gulf of Mannar, and the Palk Bay.
� 2012 Elsevier Ltd. All rights reserved.
1. Introduction
The Gulf of Mannar (GoM) and the Palk Bay (PB) are located be-tween India and Sri Lanka. The GoM opens to the Arabian Sea (AS)in the west and the PB opens to the Bay of Bengal (BoB) in the east.The GoM is separated from the PB by Pamban (Rameswaram) Is-land and a chain of submerged sandbars known as Ramsethu orAdams Bridge (Fig. 1a). The Ramsethu acts as a subsurface physical
ll rights reserved.
u).
barrier between the Rameswaram Island of India and Mannar Is-land of Sri Lanka. The PB waters have more characteristics of theBoB such as lower salinity and higher turbidity (Rao et al., 2008).Conversely, the GoM has a narrow shelf and steeply sloping seafloor, which cause the oceanic waters flow closer to the coastline(Kumaraguru et al., 2006). Thus the GoM waters possess interme-diate characteristics of the AS and the PB (Rao et al., 2008).
In marine pelagic food web, zooplankton plays a significant rolein transferring organic carbon from the phytoplankton and bacteriato higher trophic levels. Zooplankton serves as a measure of biolog-ical productivity and responds to any subtle changes in physical,
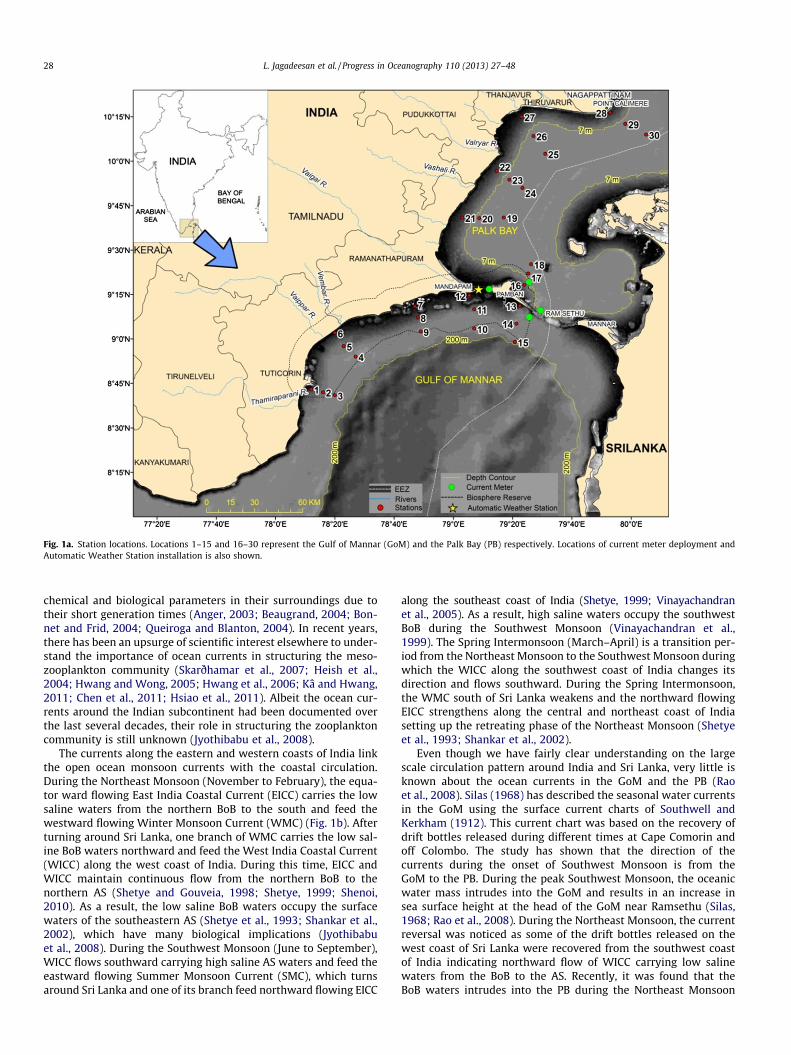
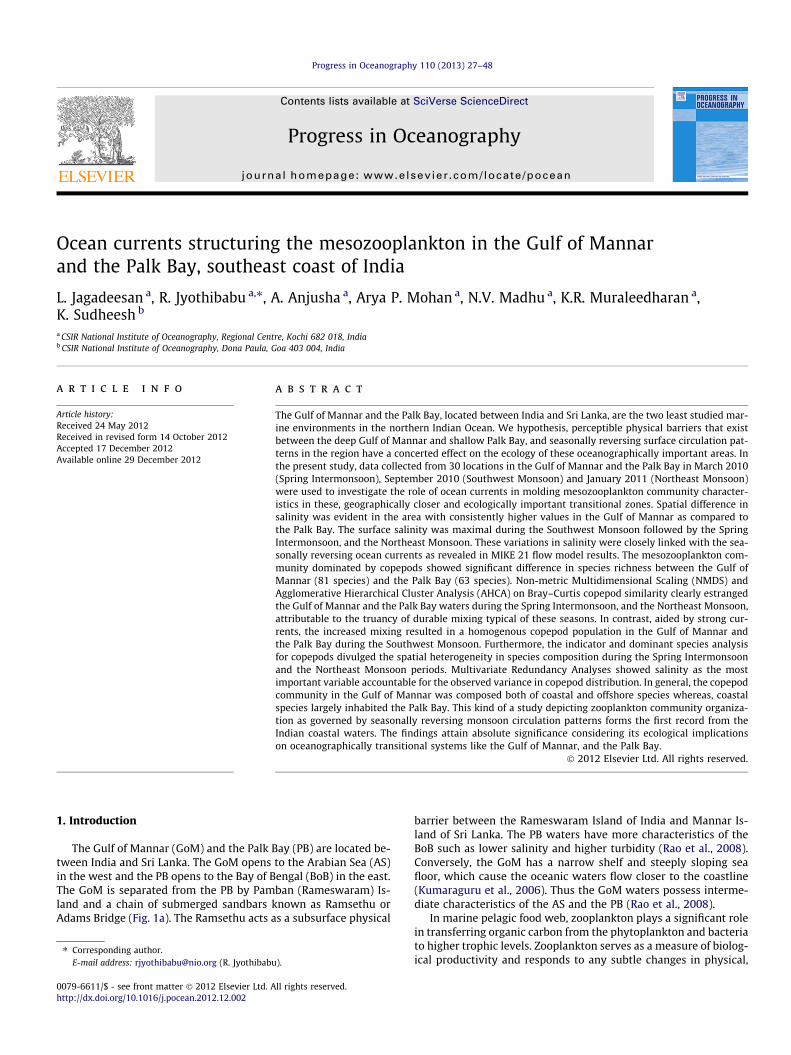
Fig. 1a. Station locations. Locations 1–15 and 16–30 represent the Gulf of Mannar (GoM) and the Palk Bay (PB) respectively. Locations of current meter deployment andAutomatic Weather Station installation is also shown.
28 L. Jagadeesan et al. / Progress in Oceanography 110 (2013) 27–48
chemical and biological parameters in their surroundings due totheir short generation times (Anger, 2003; Beaugrand, 2004; Bon-net and Frid, 2004; Queiroga and Blanton, 2004). In recent years,there has been an upsurge of scientific interest elsewhere to under-stand the importance of ocean currents in structuring the meso-zooplankton community (Skarðhamar et al., 2007; Heish et al.,2004; Hwang and Wong, 2005; Hwang et al., 2006; Kâ and Hwang,2011; Chen et al., 2011; Hsiao et al., 2011). Albeit the ocean cur-rents around the Indian subcontinent had been documented overthe last several decades, their role in structuring the zooplanktoncommunity is still unknown (Jyothibabu et al., 2008).
The currents along the eastern and western coasts of India linkthe open ocean monsoon currents with the coastal circulation.During the Northeast Monsoon (November to February), the equa-tor ward flowing East India Coastal Current (EICC) carries the lowsaline waters from the northern BoB to the south and feed thewestward flowing Winter Monsoon Current (WMC) (Fig. 1b). Afterturning around Sri Lanka, one branch of WMC carries the low sal-ine BoB waters northward and feed the West India Coastal Current(WICC) along the west coast of India. During this time, EICC andWICC maintain continuous flow from the northern BoB to thenorthern AS (Shetye and Gouveia, 1998; Shetye, 1999; Shenoi,2010). As a result, the low saline BoB waters occupy the surfacewaters of the southeastern AS (Shetye et al., 1993; Shankar et al.,2002), which have many biological implications (Jyothibabuet al., 2008). During the Southwest Monsoon (June to September),WICC flows southward carrying high saline AS waters and feed theeastward flowing Summer Monsoon Current (SMC), which turnsaround Sri Lanka and one of its branch feed northward flowing EICC
along the southeast coast of India (Shetye, 1999; Vinayachandranet al., 2005). As a result, high saline waters occupy the southwestBoB during the Southwest Monsoon (Vinayachandran et al.,1999). The Spring Intermonsoon (March–April) is a transition per-iod from the Northeast Monsoon to the Southwest Monsoon duringwhich the WICC along the southwest coast of India changes itsdirection and flows southward. During the Spring Intermonsoon,the WMC south of Sri Lanka weakens and the northward flowingEICC strengthens along the central and northeast coast of Indiasetting up the retreating phase of the Northeast Monsoon (Shetyeet al., 1993; Shankar et al., 2002).
Even though we have fairly clear understanding on the largescale circulation pattern around India and Sri Lanka, very little isknown about the ocean currents in the GoM and the PB (Raoet al., 2008). Silas (1968) has described the seasonal water currentsin the GoM using the surface current charts of Southwell andKerkham (1912). This current chart was based on the recovery ofdrift bottles released during different times at Cape Comorin andoff Colombo. The study has shown that the direction of thecurrents during the onset of Southwest Monsoon is from theGoM to the PB. During the peak Southwest Monsoon, the oceanicwater mass intrudes into the GoM and results in an increase insea surface height at the head of the GoM near Ramsethu (Silas,1968; Rao et al., 2008). During the Northeast Monsoon, the currentreversal was noticed as some of the drift bottles released on thewest coast of Sri Lanka were recovered from the southwest coastof India indicating northward flow of WICC carrying low salinewaters from the BoB to the AS. Recently, it was found that theBoB waters intrudes into the PB during the Northeast Monsoon
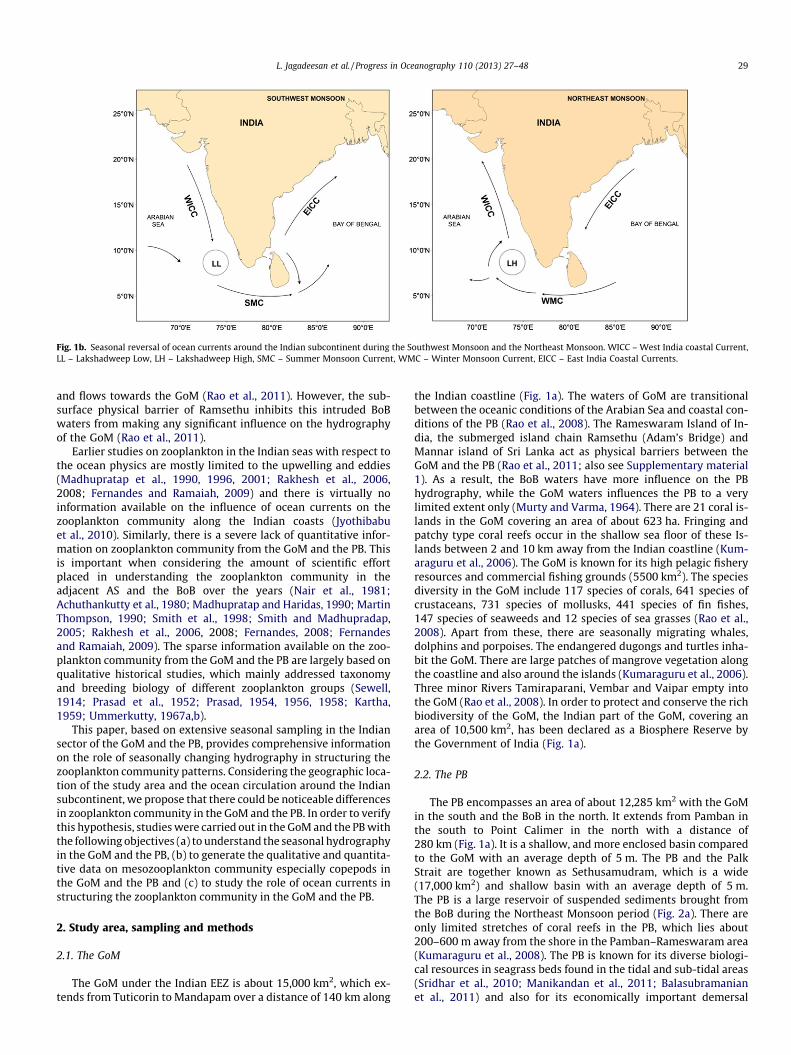
Fig. 1b. Seasonal reversal of ocean currents around the Indian subcontinent during the Southwest Monsoon and the Northeast Monsoon. WICC – West India coastal Current,LL – Lakshadweep Low, LH – Lakshadweep High, SMC – Summer Monsoon Current, WMC – Winter Monsoon Current, EICC – East India Coastal Currents.
L. Jagadeesan et al. / Progress in Oceanography 110 (2013) 27–48 29
and flows towards the GoM (Rao et al., 2011). However, the sub-surface physical barrier of Ramsethu inhibits this intruded BoBwaters from making any significant influence on the hydrographyof the GoM (Rao et al., 2011).
Earlier studies on zooplankton in the Indian seas with respect tothe ocean physics are mostly limited to the upwelling and eddies(Madhupratap et al., 1990, 1996, 2001; Rakhesh et al., 2006,2008; Fernandes and Ramaiah, 2009) and there is virtually noinformation available on the influence of ocean currents on thezooplankton community along the Indian coasts (Jyothibabuet al., 2010). Similarly, there is a severe lack of quantitative infor-mation on zooplankton community from the GoM and the PB. Thisis important when considering the amount of scientific effortplaced in understanding the zooplankton community in theadjacent AS and the BoB over the years (Nair et al., 1981;Achuthankutty et al., 1980; Madhupratap and Haridas, 1990; MartinThompson, 1990; Smith et al., 1998; Smith and Madhupradap,2005; Rakhesh et al., 2006, 2008; Fernandes, 2008; Fernandesand Ramaiah, 2009). The sparse information available on the zoo-plankton community from the GoM and the PB are largely based onqualitative historical studies, which mainly addressed taxonomyand breeding biology of different zooplankton groups (Sewell,1914; Prasad et al., 1952; Prasad, 1954, 1956, 1958; Kartha,1959; Ummerkutty, 1967a,b).
This paper, based on extensive seasonal sampling in the Indiansector of the GoM and the PB, provides comprehensive informationon the role of seasonally changing hydrography in structuring thezooplankton community patterns. Considering the geographic loca-tion of the study area and the ocean circulation around the Indiansubcontinent, we propose that there could be noticeable differencesin zooplankton community in the GoM and the PB. In order to verifythis hypothesis, studies were carried out in the GoM and the PB withthe following objectives (a) to understand the seasonal hydrographyin the GoM and the PB, (b) to generate the qualitative and quantita-tive data on mesozooplankton community especially copepods inthe GoM and the PB and (c) to study the role of ocean currents instructuring the zooplankton community in the GoM and the PB.
2. Study area, sampling and methods
2.1. The GoM
The GoM under the Indian EEZ is about 15,000 km2, which ex-tends from Tuticorin to Mandapam over a distance of 140 km along
the Indian coastline (Fig. 1a). The waters of GoM are transitionalbetween the oceanic conditions of the Arabian Sea and coastal con-ditions of the PB (Rao et al., 2008). The Rameswaram Island of In-dia, the submerged island chain Ramsethu (Adam’s Bridge) andMannar island of Sri Lanka act as physical barriers between theGoM and the PB (Rao et al., 2011; also see Supplementary material1). As a result, the BoB waters have more influence on the PBhydrography, while the GoM waters influences the PB to a verylimited extent only (Murty and Varma, 1964). There are 21 coral is-lands in the GoM covering an area of about 623 ha. Fringing andpatchy type coral reefs occur in the shallow sea floor of these Is-lands between 2 and 10 km away from the Indian coastline (Kum-araguru et al., 2006). The GoM is known for its high pelagic fisheryresources and commercial fishing grounds (5500 km2). The speciesdiversity in the GoM include 117 species of corals, 641 species ofcrustaceans, 731 species of mollusks, 441 species of fin fishes,147 species of seaweeds and 12 species of sea grasses (Rao et al.,2008). Apart from these, there are seasonally migrating whales,dolphins and porpoises. The endangered dugongs and turtles inha-bit the GoM. There are large patches of mangrove vegetation alongthe coastline and also around the islands (Kumaraguru et al., 2006).Three minor Rivers Tamiraparani, Vembar and Vaipar empty intothe GoM (Rao et al., 2008). In order to protect and conserve the richbiodiversity of the GoM, the Indian part of the GoM, covering anarea of 10,500 km2, has been declared as a Biosphere Reserve bythe Government of India (Fig. 1a).
2.2. The PB
The PB encompasses an area of about 12,285 km2 with the GoMin the south and the BoB in the north. It extends from Pamban inthe south to Point Calimer in the north with a distance of280 km (Fig. 1a). It is a shallow, and more enclosed basin comparedto the GoM with an average depth of 5 m. The PB and the PalkStrait are together known as Sethusamudram, which is a wide(17,000 km2) and shallow basin with an average depth of 5 m.The PB is a large reservoir of suspended sediments brought fromthe BoB during the Northeast Monsoon period (Fig. 2a). There areonly limited stretches of coral reefs in the PB, which lies about200–600 m away from the shore in the Pamban–Rameswaram area(Kumaraguru et al., 2008). The PB is known for its diverse biologi-cal resources in seagrass beds found in the tidal and sub-tidal areas(Sridhar et al., 2010; Manikandan et al., 2011; Balasubramanianet al., 2011) and also for its economically important demersal
Fig. 2a. MODIS-Terra satellite imagery showing extensive sediment plumes in the Palk Bay in January (www.visibleearth.nasa.gov). The movement of sediment plumes fromthe PB to the GoM through the Pamban Pass (I) and Ramsethu (II) is evident.
30 L. Jagadeesan et al. / Progress in Oceanography 110 (2013) 27–48
fishery resources (prawns and crabs). The seagrass meadows func-tion as specialized ecosystem serving as feeding, breeding andnursery ground for many fishes, shrimps, and crabs. The riversVaigai, Vaishali and Vaiyar are the major sources of freshwaterand sediment input to the PB (Rao et al., 2008). The tidal amplitudein the PB is low (0.5–0.8 m) (Durve and Alagarswami, 1964; Raoet al., 1987; Nayar et al., 1988). There are mangrove swamps andwild life sanctuaries in the PB, which are associated with mud flats,wet lands, brackish water and saline lagoons.
2.3. Sampling and methods
The field sampling was carried out in 30 locations (15 each inthe GoM and the PB) in March 2010 (spring-intermonsoon), Sep-tember 2010 (Southwest Monsoon) and January 2011 (NortheastMonsoon). The locations were distributed in 10 transects (5 eachin the GoM and the PB), oriented perpendicular to the coastline(Fig. 1a). Each transect consisted of three locations; coastal, middleand inshore. In each location, water samples were collected fromsurface using 5 L Niskin samplers (Hydrobios-Kiel) for measuringchlorophyll a and dissolved oxygen. General climatic features inthe GoM and the PB were inferred from (a) air temperature datafrom AWS installed at Mandapam (midpoint between the GoMand the PB) and (b) the mean rainfall data for the last 5 years(Indian Meteorological Department (IMD), Pune) for the districtsof Tuticorin, Ramnathapuram and Nagapattinam (three major dis-tricts bordering the study area). The vertical salinity and tempera-ture features were recorded using a portable Conductivity
Temperature Depth profiler. The synoptic picture of the currentsand estimations of exchange of waters between the GoM and thePB were obtained using model simulations. The circulation in theGoM and the PB has been simulated with MIKE 21 FM model.The model has been validated with currents measurements usingRCM9 current meters deployed at selected locations in the studyarea (Fig. 1a), which showed significant correlation between theobserved and simulated features (NIO Report, 2012; Sudheeshet al., 2013; also see Supplementary materials 2a–c). During theNortheast Monsoon, intrusion of low saline PB waters into theGoM was investigated by deploying an ADP across the PambanPass (between Mandapam and Pamban Island).
The dissolved oxygen was measured from the surface watersfollowing Winkler’s method (Grasshoff et al., 1983) and chloro-phyll a using a Turner flourometer following standard procedure(UNESCO, 1994). Zooplankton samples were collected fromwaters just below the surface (�0.5 m) by horizontal hauls usinga standard WP net (200 lM mesh size), attached with a calibrateddigital flow meter (Hydro-bios, Germany). Onboard, the sampleswere filtered through a 200 lm nylon sieve and excess water inthe samples was removed using blotting papers. The biomass ofthe zooplankton was measured as displacement volume (Postelet al., 2000). Zooplankton samples were then preserved in 4% for-malin in filtered seawater for detailed taxonomic analysis.Zooplankton sub-samples (50%) were sorted and taxonomic grouplevel abundance was estimated (Postel et al., 2000). Amongvarious taxonomic groups, copepods were further analyzed andidentified down to the species level using standard literature
L. Jagadeesan et al. / Progress in Oceanography 110 (2013) 27–48 31
(Tanaka, 1956; Kasturirangan, 1963; Sewell, 1999; Conway et al.,2003).
2.3.1. Data analysisIn order to study the spatial and seasonal variation in environ-
mental and biological parameters in the GoM and the PB, the datacollected were tested for their normality in distribution. Later,parametric ANOVA was carried out on data having normal distri-bution. The Tukeys HSD post hoc test was used to compare the sig-nificance of pair wise variations obtained in parametric ANOVA. Onthe other hand, non-parametric ANOVA was used for data havingirregular distribution. Here, Dunn’s post hoc test was used to ana-lyze the significance of pair wise differences. The tests of normal-ity, parametric and non-parametric ANOVA were carried out inXL stat pro-software package.
2.3.2. Segregation of locations and dominant speciesCluster analysis followed by NMDS was used to segregate loca-
tions with similar properties. Copepod species abundance datawere initially log (X + 1) transformed to normalize the differencesin numerical abundance (Clarke and Warwick, 2001). The Bray–Curtis similarity matrix based on group average method was usedfor the spatial grouping of locations in different seasonal collec-tions. In addition to cluster analysis, similarity profile (SIMPROF)permutation test was also performed to identify significant assem-blages of stations (p < 0.01) (Clarke and Gorley, 2006).
The dominant species (common and numerically abundant spe-cies) of copepods in each group of locations was analyzed based onstandard procedures (Yang et al., 1999; Lee et al., 2009; Lin et al.,2011)
Yi ¼ ðNi=NÞ � fi
where Yi is the dominance of species i, Ni is the number of individ-uals of species i in all locations, N is the number of individuals of allspecies in all locations, and fi is the frequency of locations at whichspecies i occurs. Species of copepods with a Y value of more than orequal to 0.02 were defined as dominant species (Yang et al., 1999;Lee et al., 2009; Lin et al., 2011).
2.3.3. Diversity and indicator speciesThe diversity of plankton communities were represented using
three common diversity indices (i) Pielou’s evenness (J0 – Pielou,1969), (ii) Simpson’s dominance (C – Simpson, 1949) and (iii)Shannon Wiener diversity (H0 – Shannon and wiener, 1963).
The statistical index, Indicator value (IndVal), is used to find outthe most characteristic species in each group of locations (Dufrêne
0
100
200
300
400
500
600
700
800
Jan. Feb. Mar. Apr. May Jun. J
Rai
nfal
l (m
m)
Rainfall -Tuticorin Rainfall -NagapatinumAir temperature-Mandapam
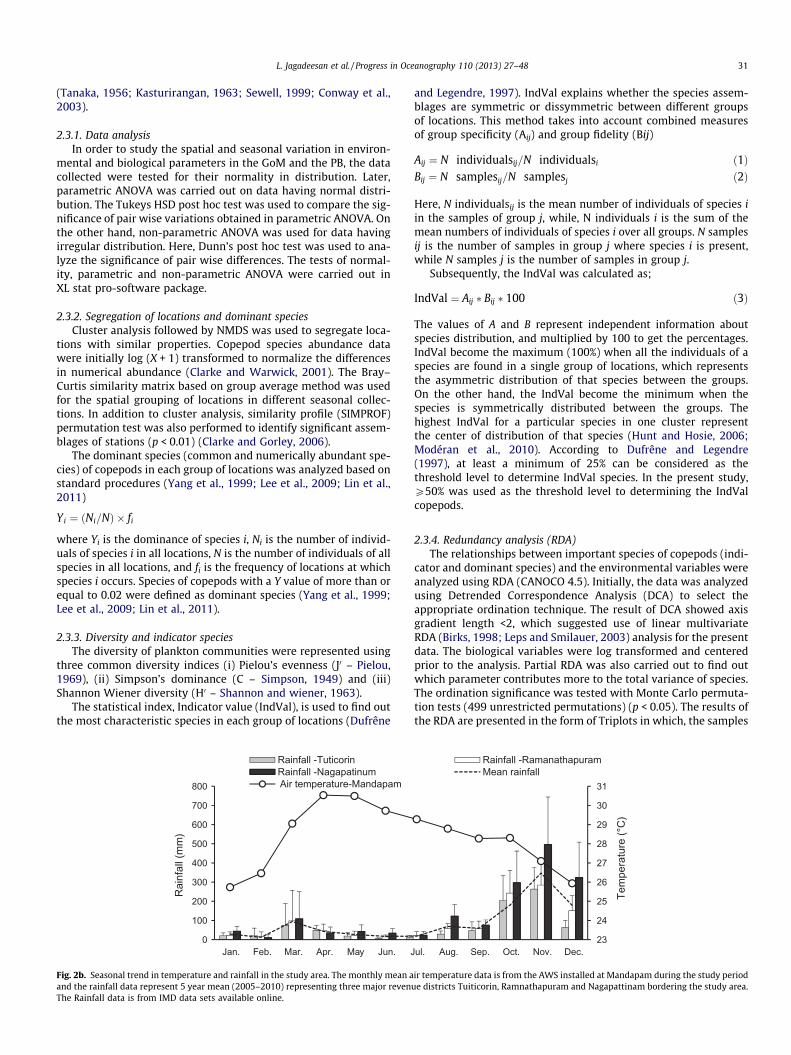
Fig. 2b. Seasonal trend in temperature and rainfall in the study area. The monthly mean aand the rainfall data represent 5 year mean (2005–2010) representing three major revenThe Rainfall data is from IMD data sets available online.
and Legendre, 1997). IndVal explains whether the species assem-blages are symmetric or dissymmetric between different groupsof locations. This method takes into account combined measuresof group specificity (Aij) and group fidelity (Bij)
Aij ¼ N individualsij=N individualsi ð1ÞBij ¼ N samplesij=N samplesj ð2Þ
Here, N individualsij is the mean number of individuals of species iin the samples of group j, while, N individuals i is the sum of themean numbers of individuals of species i over all groups. N samplesij is the number of samples in group j where species i is present,while N samples j is the number of samples in group j.
Subsequently, the IndVal was calculated as;
IndVal ¼ Aij � Bij � 100 ð3Þ
The values of A and B represent independent information aboutspecies distribution, and multiplied by 100 to get the percentages.IndVal become the maximum (100%) when all the individuals of aspecies are found in a single group of locations, which representsthe asymmetric distribution of that species between the groups.On the other hand, the IndVal become the minimum when thespecies is symmetrically distributed between the groups. Thehighest IndVal for a particular species in one cluster representthe center of distribution of that species (Hunt and Hosie, 2006;Modéran et al., 2010). According to Dufrêne and Legendre(1997), at least a minimum of 25% can be considered as thethreshold level to determine IndVal species. In the present study,P50% was used as the threshold level to determining the IndValcopepods.
2.3.4. Redundancy analysis (RDA)The relationships between important species of copepods (indi-
cator and dominant species) and the environmental variables wereanalyzed using RDA (CANOCO 4.5). Initially, the data was analyzedusing Detrended Correspondence Analysis (DCA) to select theappropriate ordination technique. The result of DCA showed axisgradient length <2, which suggested use of linear multivariateRDA (Birks, 1998; Leps and Smilauer, 2003) analysis for the presentdata. The biological variables were log transformed and centeredprior to the analysis. Partial RDA was also carried out to find outwhich parameter contributes more to the total variance of species.The ordination significance was tested with Monte Carlo permuta-tion tests (499 unrestricted permutations) (p < 0.05). The results ofthe RDA are presented in the form of Triplots in which, the samples
23
24
25
26
27
28
29
30
31
ul. Aug. Sep. Oct. Nov. Dec.
Tem
pera
ture
(°C
)
Rainfall -RamanathapuramMean rainfall
ir temperature data is from the AWS installed at Mandapam during the study periodue districts Tuiticorin, Ramnathapuram and Nagapattinam bordering the study area.

Table 1Seasonal data of physico-chemical parameters, zooplankton biomass and diversity indices in the Gulf of Mannar (GoM) and the Palk Bay (PB). Mean and standard deviations arepresented.
Parameter Spring intermonsoon (SIM) Summer monsoon (SM) Northeast monsoon (NEM)
GoM PB GoM PB GoM PB
Temperature (�C) 30.31 ± 1.20 31.47 ± 0.81 29.64 ± 1.11 30.29 ± 0.64 26.55 ± 0.49 25.45 ± 0.61Salinity 33.9 ± 0.54 30.44 ± 1.13 35.39 ± 0.41 34.9 ± 0.60 32.0 ± 0.58 28.9 ± 1.42Chl. a (mg m�3) 0.92 ± 0.45 0.87 ± 0.47 1.6 ± 1.3 0.76 ± 0.4 1.8 ± 1.7 0.75 ± 0.4DO (mg L�1) 7.81 ± 0.93 6.34 ± 0.68 7.92 ± 0.75 6.76 ± 1.11 7.92 ± 0.75 8.12 ± 1.32
ZooplanktonBiomass (ml m�3) 0.10 ± 0.07 0.15 ± 0.13 0.20 ± 0.23 0.07 ± 0.06 0.26 ± 0.145 0.20 ± 0.15Shannon diversity (H0) 0.92 ± 0.36 0.57 ± 0.32 0.57 ± 0.38 0.44 ± 0.26 0.41 ± 0.44 0.34 ± 0.23Pielou’s evenness (J0) 0.46 ± 0.18 0.33 ± 0.19 0.29 ± 0.19 0.26 ± 0.14 0.20 ± 0.19 0.19 ± 0.15Simpson dominance (C) 0.47 ± 0.20 0.30 ± 0.19 0.25 ± 0.18 0.18 ± 0.16 0.20 ± 0.23 0.13 ± 0.13
CopepodShannon diversity (H0) 3.12 ± 0.26 2.43 ± 0.34 2.6 ± 0.54 2.3 ± 0.41 2.03 ± 0.25 1.69 ± 0.25Pielou’s evenness (J0) 0.93 ± 0.02 0.84 ± 0.06 0.85 ± 0.13 0.81 ± 0.17 0.71 ± 0.06 0.67 ± 0.08Simpson dominance (C) 0.94 ± 0.02 0.87 ± 0.04 0.80 ± 0.12 0.76 ± 0.11 0.79 ± 0.06 0.66 ± 0.10
Fig. 3. MIKE 21 simulated seasonal current pattern in the Gulf of Mannar (GoM) and the Palk Bay (PB) during (a) January representing the Northeast Monsoon, (b) Marchrepresenting Spring Intermonsoon and (c) September representing Southwest Monsoon. The simulated pattern of currents were validated using RCM 9 current meters datacollected from selected locations shown in Fig. 1a. The currents that flow from the PB to the GoM during the northeast mosoon and spring intermonsoon are weak whencompared with the currents that flow from the GoM to the PB during the Southwest Monsoon period. Consider Sudheesh et al., 2013 for details.
32 L. Jagadeesan et al. / Progress in Oceanography 110 (2013) 27–48
are displayed by points, species and quantitative environmentalvariables are shown by arrows.
3. Results
3.1. Temperature, rainfall and coastal currents
The monthly mean air temperature and rainfall in the studyarea are presented in Fig. 2b. The air temperature showed an in-
crease from January (25.5 �C) to April–May (30.5 �C) and then a de-crease towards December (25.9 �C). The SST was higher during theSpring Intermonsoon and the Southwest Monsoon as compared tothe Northeast Monsoon (Table 1). During the Spring Intermonsoon,SST was higher in the PB (av. 31.47 ± 0.81 �C) as compared to theGoM (av. 30.31 ± 1.20 �C) whereas, the GoM had higher SST (av.26.55 ± 0.49 �C) than the PB (av. 25.45 ± 0.61 �C) during the North-east Monsoon. However, the difference in SST between the GoMand the PB was found to be minor during the Southwest Monsoon
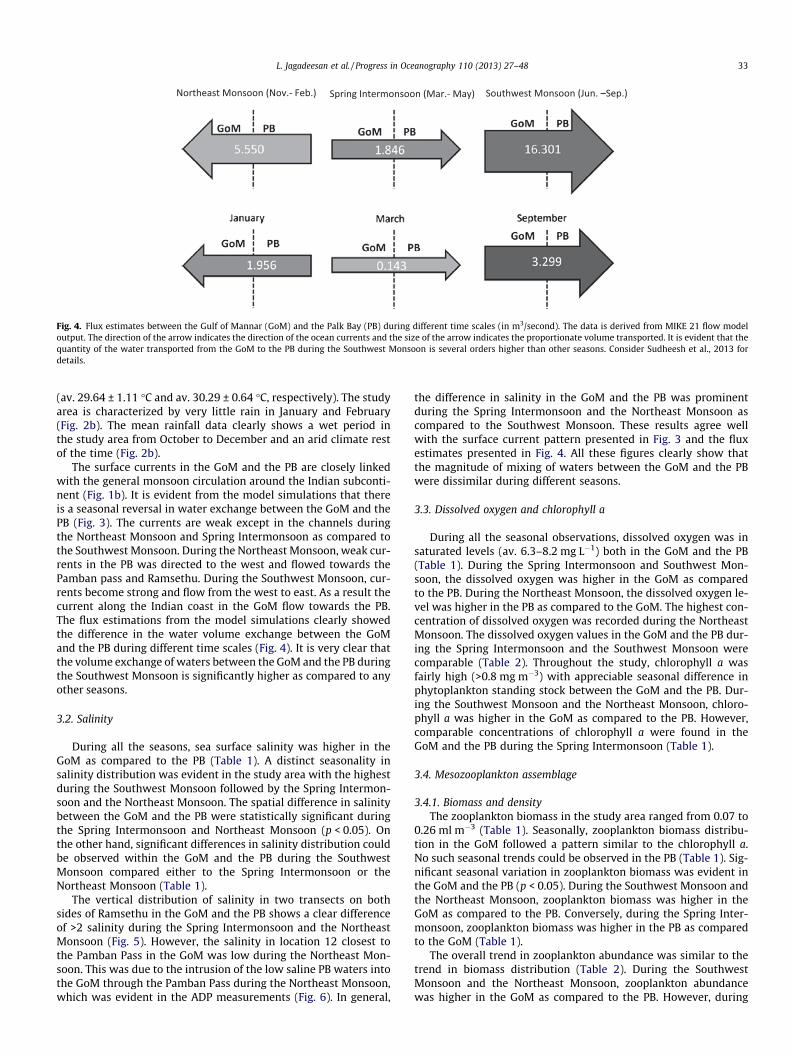
Fig. 4. Flux estimates between the Gulf of Mannar (GoM) and the Palk Bay (PB) during different time scales (in m3/second). The data is derived from MIKE 21 flow modeloutput. The direction of the arrow indicates the direction of the ocean currents and the size of the arrow indicates the proportionate volume transported. It is evident that thequantity of the water transported from the GoM to the PB during the Southwest Monsoon is several orders higher than other seasons. Consider Sudheesh et al., 2013 fordetails.
L. Jagadeesan et al. / Progress in Oceanography 110 (2013) 27–48 33
(av. 29.64 ± 1.11 �C and av. 30.29 ± 0.64 �C, respectively). The studyarea is characterized by very little rain in January and February(Fig. 2b). The mean rainfall data clearly shows a wet period inthe study area from October to December and an arid climate restof the time (Fig. 2b).
The surface currents in the GoM and the PB are closely linkedwith the general monsoon circulation around the Indian subconti-nent (Fig. 1b). It is evident from the model simulations that thereis a seasonal reversal in water exchange between the GoM and thePB (Fig. 3). The currents are weak except in the channels duringthe Northeast Monsoon and Spring Intermonsoon as compared tothe Southwest Monsoon. During the Northeast Monsoon, weak cur-rents in the PB was directed to the west and flowed towards thePamban pass and Ramsethu. During the Southwest Monsoon, cur-rents become strong and flow from the west to east. As a result thecurrent along the Indian coast in the GoM flow towards the PB.The flux estimations from the model simulations clearly showedthe difference in the water volume exchange between the GoMand the PB during different time scales (Fig. 4). It is very clear thatthe volume exchange of waters between the GoM and the PB duringthe Southwest Monsoon is significantly higher as compared to anyother seasons.
3.2. Salinity
During all the seasons, sea surface salinity was higher in theGoM as compared to the PB (Table 1). A distinct seasonality insalinity distribution was evident in the study area with the highestduring the Southwest Monsoon followed by the Spring Intermon-soon and the Northeast Monsoon. The spatial difference in salinitybetween the GoM and the PB were statistically significant duringthe Spring Intermonsoon and Northeast Monsoon (p < 0.05). Onthe other hand, significant differences in salinity distribution couldbe observed within the GoM and the PB during the SouthwestMonsoon compared either to the Spring Intermonsoon or theNortheast Monsoon (Table 1).
The vertical distribution of salinity in two transects on bothsides of Ramsethu in the GoM and the PB shows a clear differenceof >2 salinity during the Spring Intermonsoon and the NortheastMonsoon (Fig. 5). However, the salinity in location 12 closest tothe Pamban Pass in the GoM was low during the Northeast Mon-soon. This was due to the intrusion of the low saline PB waters intothe GoM through the Pamban Pass during the Northeast Monsoon,which was evident in the ADP measurements (Fig. 6). In general,
the difference in salinity in the GoM and the PB was prominentduring the Spring Intermonsoon and the Northeast Monsoon ascompared to the Southwest Monsoon. These results agree wellwith the surface current pattern presented in Fig. 3 and the fluxestimates presented in Fig. 4. All these figures clearly show thatthe magnitude of mixing of waters between the GoM and the PBwere dissimilar during different seasons.
3.3. Dissolved oxygen and chlorophyll a
During all the seasonal observations, dissolved oxygen was insaturated levels (av. 6.3–8.2 mg L�1) both in the GoM and the PB(Table 1). During the Spring Intermonsoon and Southwest Mon-soon, the dissolved oxygen was higher in the GoM as comparedto the PB. During the Northeast Monsoon, the dissolved oxygen le-vel was higher in the PB as compared to the GoM. The highest con-centration of dissolved oxygen was recorded during the NortheastMonsoon. The dissolved oxygen values in the GoM and the PB dur-ing the Spring Intermonsoon and the Southwest Monsoon werecomparable (Table 2). Throughout the study, chlorophyll a wasfairly high (>0.8 mg m�3) with appreciable seasonal difference inphytoplankton standing stock between the GoM and the PB. Dur-ing the Southwest Monsoon and the Northeast Monsoon, chloro-phyll a was higher in the GoM as compared to the PB. However,comparable concentrations of chlorophyll a were found in theGoM and the PB during the Spring Intermonsoon (Table 1).
3.4. Mesozooplankton assemblage
3.4.1. Biomass and densityThe zooplankton biomass in the study area ranged from 0.07 to
0.26 ml m�3 (Table 1). Seasonally, zooplankton biomass distribu-tion in the GoM followed a pattern similar to the chlorophyll a.No such seasonal trends could be observed in the PB (Table 1). Sig-nificant seasonal variation in zooplankton biomass was evident inthe GoM and the PB (p < 0.05). During the Southwest Monsoon andthe Northeast Monsoon, zooplankton biomass was higher in theGoM as compared to the PB. Conversely, during the Spring Inter-monsoon, zooplankton biomass was higher in the PB as comparedto the GoM (Table 1).
The overall trend in zooplankton abundance was similar to thetrend in biomass distribution (Table 2). During the SouthwestMonsoon and the Northeast Monsoon, zooplankton abundancewas higher in the GoM as compared to the PB. However, during
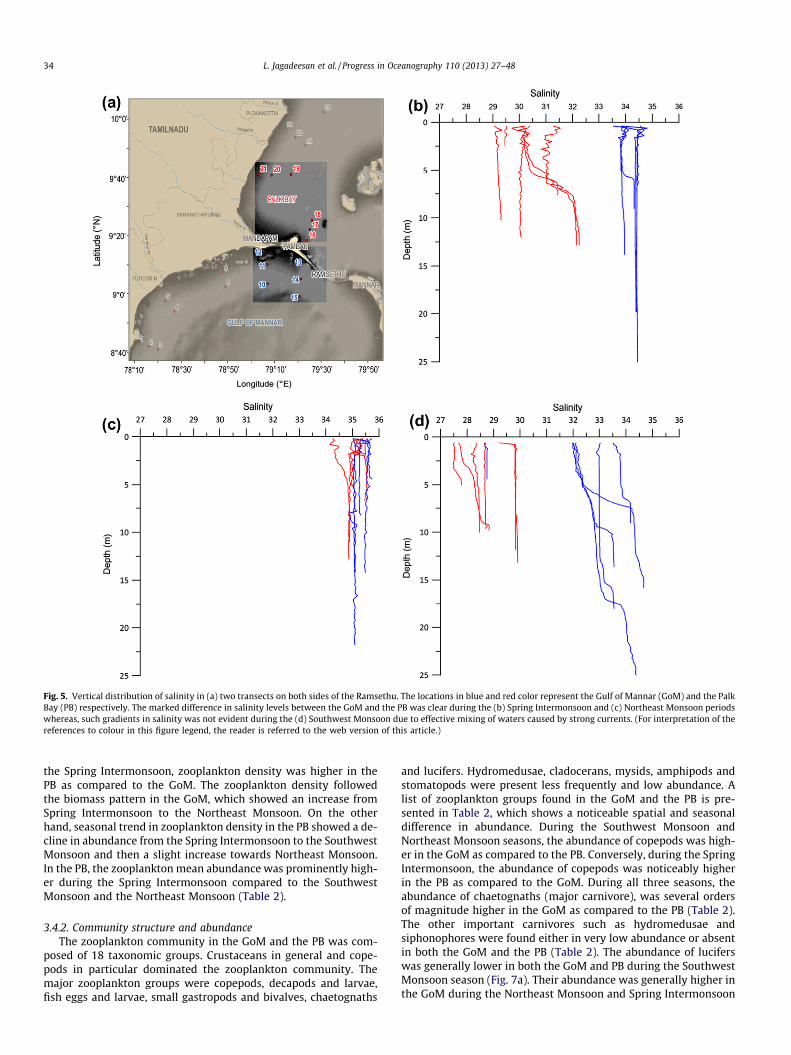
Fig. 5. Vertical distribution of salinity in (a) two transects on both sides of the Ramsethu. The locations in blue and red color represent the Gulf of Mannar (GoM) and the PalkBay (PB) respectively. The marked difference in salinity levels between the GoM and the PB was clear during the (b) Spring Intermonsoon and (c) Northeast Monsoon periodswhereas, such gradients in salinity was not evident during the (d) Southwest Monsoon due to effective mixing of waters caused by strong currents. (For interpretation of thereferences to colour in this figure legend, the reader is referred to the web version of this article.)
34 L. Jagadeesan et al. / Progress in Oceanography 110 (2013) 27–48
the Spring Intermonsoon, zooplankton density was higher in thePB as compared to the GoM. The zooplankton density followedthe biomass pattern in the GoM, which showed an increase fromSpring Intermonsoon to the Northeast Monsoon. On the otherhand, seasonal trend in zooplankton density in the PB showed a de-cline in abundance from the Spring Intermonsoon to the SouthwestMonsoon and then a slight increase towards Northeast Monsoon.In the PB, the zooplankton mean abundance was prominently high-er during the Spring Intermonsoon compared to the SouthwestMonsoon and the Northeast Monsoon (Table 2).
3.4.2. Community structure and abundanceThe zooplankton community in the GoM and the PB was com-
posed of 18 taxonomic groups. Crustaceans in general and cope-pods in particular dominated the zooplankton community. Themajor zooplankton groups were copepods, decapods and larvae,fish eggs and larvae, small gastropods and bivalves, chaetognaths
and lucifers. Hydromedusae, cladocerans, mysids, amphipods andstomatopods were present less frequently and low abundance. Alist of zooplankton groups found in the GoM and the PB is pre-sented in Table 2, which shows a noticeable spatial and seasonaldifference in abundance. During the Southwest Monsoon andNortheast Monsoon seasons, the abundance of copepods was high-er in the GoM as compared to the PB. Conversely, during the SpringIntermonsoon, the abundance of copepods was noticeably higherin the PB as compared to the GoM. During all three seasons, theabundance of chaetognaths (major carnivore), was several ordersof magnitude higher in the GoM as compared to the PB (Table 2).The other important carnivores such as hydromedusae andsiphonophores were found either in very low abundance or absentin both the GoM and the PB (Table 2). The abundance of luciferswas generally lower in both the GoM and PB during the SouthwestMonsoon season (Fig. 7a). Their abundance was generally higher inthe GoM during the Northeast Monsoon and Spring Intermonsoon

Fig. 6. Water velocity in the Pamban Pass during the Northeast Monsoon sampling. The data was collected by using Acoustic Doppler Profiler (ADP) across the Pamban passand it is clear in the figure that the currents were towards northwest. This direction of the current caused the intrusion of the low saline Palk Bay (PB) waters into the Gulf ofMannar (GoM) through the Pamban Pass, which was reflected in location 12. Please see Fig. 5 for the vertical profiles of the salinity.
Table 2Abundance of various mesozooplankton groups in the Gulf of Mannar (GoM) and the Palk Bay (PB) during different seasons. Mean abundance (No. 100 m�3) and coefficient ofvariations (in parenthesis) are presented.
Major groups GoM (SIM) PB (SIM) GoM (SWM) PB (SWM) GoM (NEM) PB (NEM)
Hydromedusae 8 (1.5) 6 (3.3) 43 (2.37) 6 (3.33) - 2 (3.5)Siphonophores � � 287 (2.31) 3(4) 16 (3.92) 1(3)Ctenophores � � 8 (1.75) - 42 (2.62) -Thaliacea � � 49 (3.92) - 80 (1.56) -Chaetognaths 520 (2.72) 33 (2.27) 1553 (3.0) 58 (1.7) 567 (1.05) 71 (1.89)Copepods 27873 (1.05) 63158 (1.07) 53059 (1.36) 19823 (1.37) 84220 (0.75) 31629 (0.80)Cladocerans 220 (0.84) 750 (0.48) 24 (2.38) - 215 (3.87) 1120 (0.77)Mysids 20 (2.7) 5 (3.4) 10 (3.7) 135 (4.24) 182 (3.75) 33 (1.36)Isopods � 13 (1.15) � - - 7 (1.29)Amphipods 2 (2) 2 (2) 128 (3.20) 1(5) 5 (2.8) 5 (5)Lucifers 3960 (1.96) 645 (2.17) 359 (2.79) 155 (2.49) 8112 (3.0) 769 (1.90)Appendicularians 3 (4) � 5 (0.32) 9 (1.22) - 11 (3.73)Stomatopods 10 (0.5) 2 (3) 7 (2.71) 3 (2) 31 (1.77) 149 (3.32)Polychaete larvae 3 (3.3) 1 (3) � 2 (3.5) - 42 (0.82)Decapods and larvae 767 (1.58) 844 (1.67) 1035 (2.05) 129 (1.34) 1993 (1.93) 963 (2.0)Cirriped larvae � � � 10 (4) - 279 (3.86)Gastropods, bivalves and larvae 9000 (0.16) 16320 (0.89) 737 (1.89) 5867 (2.67) 3913 (2.87) 100 (2.1)Fish eggs and larvae 2100 (1.32) 1153 (1.14) 903 (1.44) 444 (1.21) 500 (1.71) 833 (3.18)
Total abundance 56663 (0.93) 82414 (1.03) 58053 (1.24) 26644 (1.29) 99837 (0.64) 34542 (0.83)
Abbreviations: Spring Intermonsoon (SIM), Southwest Monsoon (SWM) and Northeast Monsoon (NEM). Minus sign indicate absence.
L. Jagadeesan et al. / Progress in Oceanography 110 (2013) 27–48 35
seasons when salinity was 32–34 (Fig. 7a). On the other hand, thedistribution of lucifers in the study area did not show any notice-able link with temperature. The highest abundance of gastropods
and bivalves in the GoM and the PB was found during the SpringIntermonsoon. The abundance of gastropods and larvae were sig-nificantly lower in the GoM during the Southwest Monsoon and
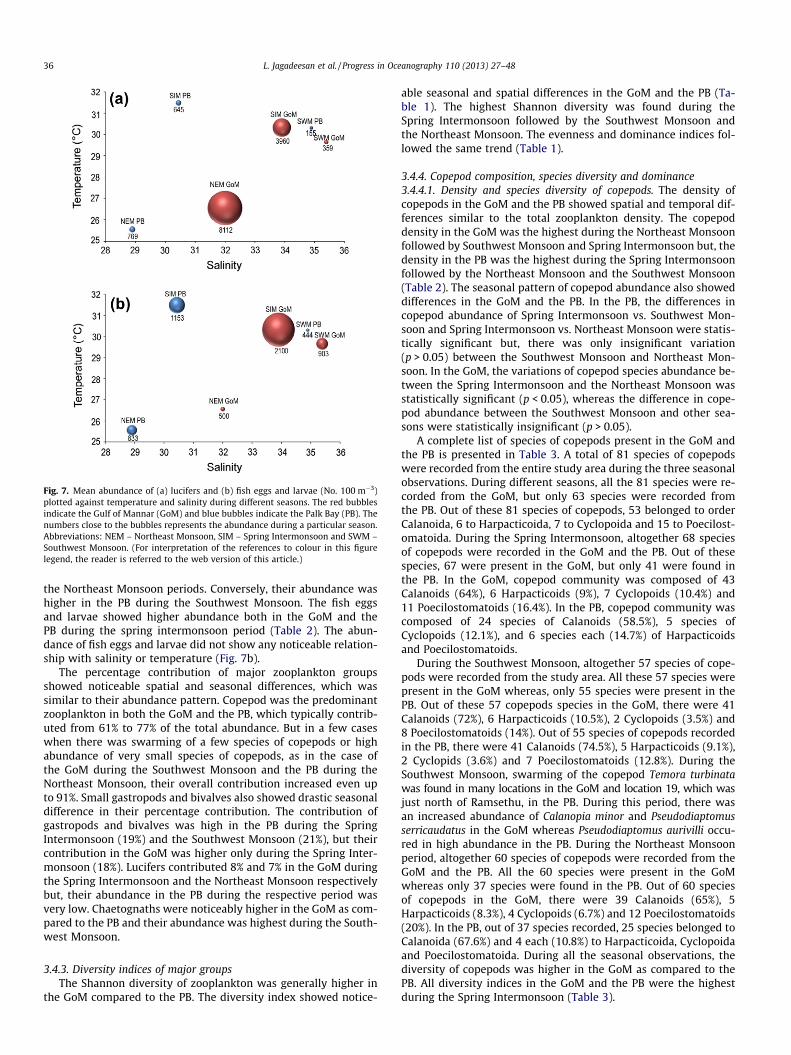
Fig. 7. Mean abundance of (a) lucifers and (b) fish eggs and larvae (No. 100 m�3)plotted against temperature and salinity during different seasons. The red bubblesindicate the Gulf of Mannar (GoM) and blue bubbles indicate the Palk Bay (PB). Thenumbers close to the bubbles represents the abundance during a particular season.Abbreviations: NEM – Northeast Monsoon, SIM – Spring Intermonsoon and SWM –Southwest Monsoon. (For interpretation of the references to colour in this figurelegend, the reader is referred to the web version of this article.)
36 L. Jagadeesan et al. / Progress in Oceanography 110 (2013) 27–48
the Northeast Monsoon periods. Conversely, their abundance washigher in the PB during the Southwest Monsoon. The fish eggsand larvae showed higher abundance both in the GoM and thePB during the spring intermonsoon period (Table 2). The abun-dance of fish eggs and larvae did not show any noticeable relation-ship with salinity or temperature (Fig. 7b).
The percentage contribution of major zooplankton groupsshowed noticeable spatial and seasonal differences, which wassimilar to their abundance pattern. Copepod was the predominantzooplankton in both the GoM and the PB, which typically contrib-uted from 61% to 77% of the total abundance. But in a few caseswhen there was swarming of a few species of copepods or highabundance of very small species of copepods, as in the case ofthe GoM during the Southwest Monsoon and the PB during theNortheast Monsoon, their overall contribution increased even upto 91%. Small gastropods and bivalves also showed drastic seasonaldifference in their percentage contribution. The contribution ofgastropods and bivalves was high in the PB during the SpringIntermonsoon (19%) and the Southwest Monsoon (21%), but theircontribution in the GoM was higher only during the Spring Inter-monsoon (18%). Lucifers contributed 8% and 7% in the GoM duringthe Spring Intermonsoon and the Northeast Monsoon respectivelybut, their abundance in the PB during the respective period wasvery low. Chaetognaths were noticeably higher in the GoM as com-pared to the PB and their abundance was highest during the South-west Monsoon.
3.4.3. Diversity indices of major groupsThe Shannon diversity of zooplankton was generally higher in
the GoM compared to the PB. The diversity index showed notice-
able seasonal and spatial differences in the GoM and the PB (Ta-ble 1). The highest Shannon diversity was found during theSpring Intermonsoon followed by the Southwest Monsoon andthe Northeast Monsoon. The evenness and dominance indices fol-lowed the same trend (Table 1).
3.4.4. Copepod composition, species diversity and dominance3.4.4.1. Density and species diversity of copepods. The density ofcopepods in the GoM and the PB showed spatial and temporal dif-ferences similar to the total zooplankton density. The copepoddensity in the GoM was the highest during the Northeast Monsoonfollowed by Southwest Monsoon and Spring Intermonsoon but, thedensity in the PB was the highest during the Spring Intermonsoonfollowed by the Northeast Monsoon and the Southwest Monsoon(Table 2). The seasonal pattern of copepod abundance also showeddifferences in the GoM and the PB. In the PB, the differences incopepod abundance of Spring Intermonsoon vs. Southwest Mon-soon and Spring Intermonsoon vs. Northeast Monsoon were statis-tically significant but, there was only insignificant variation(p > 0.05) between the Southwest Monsoon and Northeast Mon-soon. In the GoM, the variations of copepod species abundance be-tween the Spring Intermonsoon and the Northeast Monsoon wasstatistically significant (p < 0.05), whereas the difference in cope-pod abundance between the Southwest Monsoon and other sea-sons were statistically insignificant (p > 0.05).
A complete list of species of copepods present in the GoM andthe PB is presented in Table 3. A total of 81 species of copepodswere recorded from the entire study area during the three seasonalobservations. During different seasons, all the 81 species were re-corded from the GoM, but only 63 species were recorded fromthe PB. Out of these 81 species of copepods, 53 belonged to orderCalanoida, 6 to Harpacticoida, 7 to Cyclopoida and 15 to Poecilost-omatoida. During the Spring Intermonsoon, altogether 68 speciesof copepods were recorded in the GoM and the PB. Out of thesespecies, 67 were present in the GoM, but only 41 were found inthe PB. In the GoM, copepod community was composed of 43Calanoids (64%), 6 Harpacticoids (9%), 7 Cyclopoids (10.4%) and11 Poecilostomatoids (16.4%). In the PB, copepod community wascomposed of 24 species of Calanoids (58.5%), 5 species ofCyclopoids (12.1%), and 6 species each (14.7%) of Harpacticoidsand Poecilostomatoids.
During the Southwest Monsoon, altogether 57 species of cope-pods were recorded from the study area. All these 57 species werepresent in the GoM whereas, only 55 species were present in thePB. Out of these 57 copepods species in the GoM, there were 41Calanoids (72%), 6 Harpacticoids (10.5%), 2 Cyclopoids (3.5%) and8 Poecilostomatoids (14%). Out of 55 species of copepods recordedin the PB, there were 41 Calanoids (74.5%), 5 Harpacticoids (9.1%),2 Cyclopids (3.6%) and 7 Poecilostomatoids (12.8%). During theSouthwest Monsoon, swarming of the copepod Temora turbinatawas found in many locations in the GoM and location 19, which wasjust north of Ramsethu, in the PB. During this period, there wasan increased abundance of Calanopia minor and Pseudodiaptomusserricaudatus in the GoM whereas Pseudodiaptomus aurivilli occu-red in high abundance in the PB. During the Northeast Monsoonperiod, altogether 60 species of copepods were recorded from theGoM and the PB. All the 60 species were present in the GoMwhereas only 37 species were found in the PB. Out of 60 speciesof copepods in the GoM, there were 39 Calanoids (65%), 5Harpacticoids (8.3%), 4 Cyclopoids (6.7%) and 12 Poecilostomatoids(20%). In the PB, out of 37 species recorded, 25 species belonged toCalanoida (67.6%) and 4 each (10.8%) to Harpacticoida, Cyclopoidaand Poecilostomatoida. During all the seasonal observations, thediversity of copepods was higher in the GoM as compared to thePB. All diversity indices in the GoM and the PB were the highestduring the Spring Intermonsoon (Table 3).
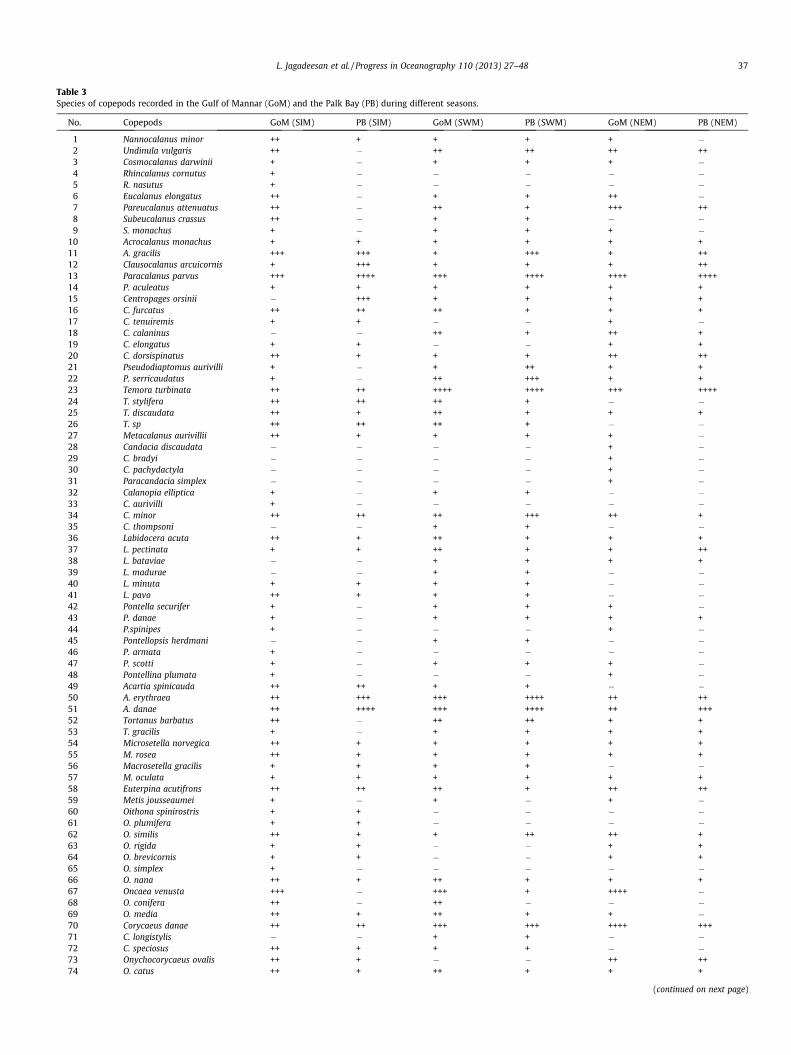
Table 3Species of copepods recorded in the Gulf of Mannar (GoM) and the Palk Bay (PB) during different seasons.
No. Copepods GoM (SIM) PB (SIM) GoM (SWM) PB (SWM) GoM (NEM) PB (NEM)
1 Nannocalanus minor ++ + + + + �2 Undinula vulgaris ++ � ++ ++ ++ ++3 Cosmocalanus darwinii + � + + + �4 Rhincalanus cornutus + � � � � �5 R. nasutus + � � � � �6 Eucalanus elongatus ++ � + + ++ �7 Pareucalanus attenuatus ++ � ++ + +++ ++8 Subeucalanus crassus ++ � + + � �9 S. monachus + � + + + �
10 Acrocalanus monachus + + + + + +11 A. gracilis +++ +++ + +++ + ++12 Clausocalanus arcuicornis + +++ + + + ++13 Paracalanus parvus +++ ++++ +++ ++++ ++++ ++++14 P. aculeatus + + + + + +15 Centropages orsinii � +++ + + + +16 C. furcatus ++ ++ ++ + + +17 C. tenuiremis + + � � + �18 C. calaninus � � ++ + ++ +19 C. elongatus + + � � + +20 C. dorsispinatus ++ + + + ++ ++21 Pseudodiaptomus aurivilli + � + ++ + +22 P. serricaudatus + � ++ +++ + +23 Temora turbinata ++ ++ ++++ ++++ +++ ++++24 T. stylifera ++ ++ ++ + � �25 T. discaudata ++ + ++ + + +26 T. sp ++ ++ ++ + � �27 Metacalanus aurivillii ++ + + + + �28 Candacia discaudata � � � � + �29 C. bradyi � � � � + �30 C. pachydactyla � � � � + �31 Paracandacia simplex � � � � + �32 Calanopia elliptica + � + + � �33 C. aurivilli + � � � � �34 C. minor ++ ++ ++ +++ ++ +35 C. thompsoni � � + + � �36 Labidocera acuta ++ + ++ + + +37 L. pectinata + + ++ + + ++38 L. bataviae � � + + + +39 L. madurae � � + + � �40 L. minuta + + + + � �41 L. pavo ++ + + + � �42 Pontella securifer + � + + + �43 P. danae + � + + + +44 P.spinipes + � � � + �45 Pontellopsis herdmani � � + + � �46 P. armata + � � � � �47 P. scotti + � + + + �48 Pontellina plumata + � � � + �49 Acartia spinicauda ++ ++ + + � �50 A. erythraea ++ +++ +++ ++++ ++ ++51 A. danae ++ ++++ +++ ++++ ++ +++52 Tortanus barbatus ++ � ++ ++ + +53 T. gracilis + � + + + +54 Microsetella norvegica ++ + + + + +55 M. rosea ++ + + + + +56 Macrosetella gracilis + + + + � �57 M. oculata + + + + + +58 Euterpina acutifrons ++ ++ ++ + ++ ++59 Metis jousseaumei + � + � + �60 Oithona spinirostris + + � � � �61 O. plumifera + + � � � �62 O. similis ++ + + ++ ++ +63 O. rigida + + � � + +64 O. brevicornis + + � � + +65 O. simplex + � � � � �66 O. nana ++ + ++ + + +67 Oncaea venusta +++ � +++ + ++++ �68 O. conifera ++ � ++ � � �69 O. media ++ + ++ + + �70 Corycaeus danae ++ ++ +++ +++ ++++ +++71 C. longistylis � � + + � �72 C. speciosus ++ + + + � �73 Onychocorycaeus ovalis ++ + � � ++ ++74 O. catus ++ + ++ + + +
(continued on next page)
L. Jagadeesan et al. / Progress in Oceanography 110 (2013) 27–48 37
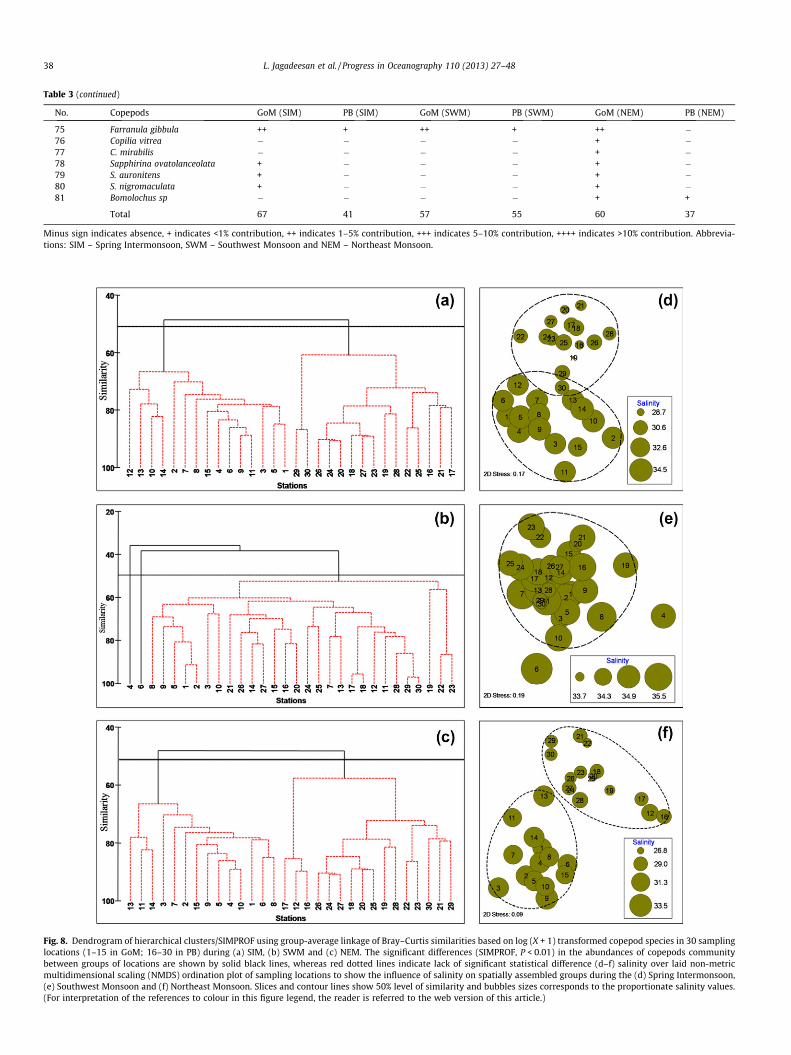
Table 3 (continued)
No. Copepods GoM (SIM) PB (SIM) GoM (SWM) PB (SWM) GoM (NEM) PB (NEM)
75 Farranula gibbula ++ + ++ + ++ �76 Copilia vitrea � � � � + �77 C. mirabilis � � � � + �78 Sapphirina ovatolanceolata + � � � + �79 S. auronitens + � � � + �80 S. nigromaculata + � � � + �81 Bomolochus sp � � � � + +
Total 67 41 57 55 60 37
Minus sign indicates absence, + indicates <1% contribution, ++ indicates 1–5% contribution, +++ indicates 5–10% contribution, ++++ indicates >10% contribution. Abbrevia-tions: SIM – Spring Intermonsoon, SWM – Southwest Monsoon and NEM – Northeast Monsoon.
Fig. 8. Dendrogram of hierarchical clusters/SIMPROF using group-average linkage of Bray–Curtis similarities based on log (X + 1) transformed copepod species in 30 samplinglocations (1–15 in GoM; 16–30 in PB) during (a) SIM, (b) SWM and (c) NEM. The significant differences (SIMPROF, P < 0.01) in the abundances of copepods communitybetween groups of locations are shown by solid black lines, whereas red dotted lines indicate lack of significant statistical difference (d–f) salinity over laid non-metricmultidimensional scaling (NMDS) ordination plot of sampling locations to show the influence of salinity on spatially assembled groups during the (d) Spring Intermonsoon,(e) Southwest Monsoon and (f) Northeast Monsoon. Slices and contour lines show 50% level of similarity and bubbles sizes corresponds to the proportionate salinity values.(For interpretation of the references to colour in this figure legend, the reader is referred to the web version of this article.)
38 L. Jagadeesan et al. / Progress in Oceanography 110 (2013) 27–48
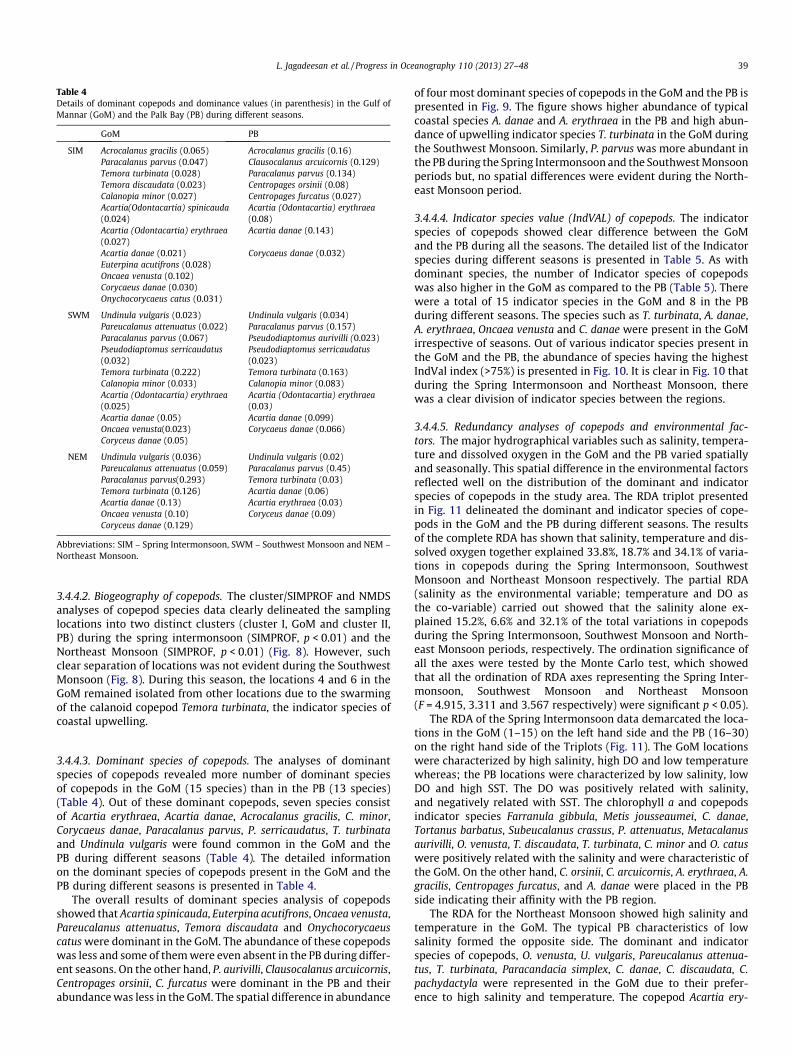
Table 4Details of dominant copepods and dominance values (in parenthesis) in the Gulf ofMannar (GoM) and the Palk Bay (PB) during different seasons.
GoM PB
SIM Acrocalanus gracilis (0.065) Acrocalanus gracilis (0.16)Paracalanus parvus (0.047) Clausocalanus arcuicornis (0.129)Temora turbinata (0.028) Paracalanus parvus (0.134)Temora discaudata (0.023) Centropages orsinii (0.08)Calanopia minor (0.027) Centropages furcatus (0.027)Acartia(Odontacartia) spinicauda(0.024)
Acartia (Odontacartia) erythraea(0.08)
Acartia (Odontacartia) erythraea(0.027)
Acartia danae (0.143)
Acartia danae (0.021) Corycaeus danae (0.032)Euterpina acutifrons (0.028)Oncaea venusta (0.102)Corycaeus danae (0.030)Onychocorycaeus catus (0.031)
SWM Undinula vulgaris (0.023) Undinula vulgaris (0.034)Pareucalanus attenuatus (0.022) Paracalanus parvus (0.157)Paracalanus parvus (0.067) Pseudodiaptomus aurivilli (0.023)Pseudodiaptomus serricaudatus(0.032)
Pseudodiaptomus serricaudatus(0.023)
Temora turbinata (0.222) Temora turbinata (0.163)Calanopia minor (0.033) Calanopia minor (0.083)Acartia (Odontacartia) erythraea(0.025)
Acartia (Odontacartia) erythraea(0.03)
Acartia danae (0.05) Acartia danae (0.099)Oncaea venusta(0.023) Corycaeus danae (0.066)Coryceus danae (0.05)
NEM Undinula vulgaris (0.036) Undinula vulgaris (0.02)Pareucalanus attenuatus (0.059) Paracalanus parvus (0.45)Paracalanus parvus(0.293) Temora turbinata (0.03)Temora turbinata (0.126) Acartia danae (0.06)Acartia danae (0.13) Acartia erythraea (0.03)Oncaea venusta (0.10) Coryceus danae (0.09)Coryceus danae (0.129)
Abbreviations: SIM – Spring Intermonsoon, SWM – Southwest Monsoon and NEM –Northeast Monsoon.
L. Jagadeesan et al. / Progress in Oceanography 110 (2013) 27–48 39
3.4.4.2. Biogeography of copepods. The cluster/SIMPROF and NMDSanalyses of copepod species data clearly delineated the samplinglocations into two distinct clusters (cluster I, GoM and cluster II,PB) during the spring intermonsoon (SIMPROF, p < 0.01) and theNortheast Monsoon (SIMPROF, p < 0.01) (Fig. 8). However, suchclear separation of locations was not evident during the SouthwestMonsoon (Fig. 8). During this season, the locations 4 and 6 in theGoM remained isolated from other locations due to the swarmingof the calanoid copepod Temora turbinata, the indicator species ofcoastal upwelling.
3.4.4.3. Dominant species of copepods. The analyses of dominantspecies of copepods revealed more number of dominant speciesof copepods in the GoM (15 species) than in the PB (13 species)(Table 4). Out of these dominant copepods, seven species consistof Acartia erythraea, Acartia danae, Acrocalanus gracilis, C. minor,Corycaeus danae, Paracalanus parvus, P. serricaudatus, T. turbinataand Undinula vulgaris were found common in the GoM and thePB during different seasons (Table 4). The detailed informationon the dominant species of copepods present in the GoM and thePB during different seasons is presented in Table 4.
The overall results of dominant species analysis of copepodsshowed that Acartia spinicauda, Euterpina acutifrons, Oncaea venusta,Pareucalanus attenuatus, Temora discaudata and Onychocorycaeuscatus were dominant in the GoM. The abundance of these copepodswas less and some of them were even absent in the PB during differ-ent seasons. On the other hand, P. aurivilli, Clausocalanus arcuicornis,Centropages orsinii, C. furcatus were dominant in the PB and theirabundance was less in the GoM. The spatial difference in abundance
of four most dominant species of copepods in the GoM and the PB ispresented in Fig. 9. The figure shows higher abundance of typicalcoastal species A. danae and A. erythraea in the PB and high abun-dance of upwelling indicator species T. turbinata in the GoM duringthe Southwest Monsoon. Similarly, P. parvus was more abundant inthe PB during the Spring Intermonsoon and the Southwest Monsoonperiods but, no spatial differences were evident during the North-east Monsoon period.
3.4.4.4. Indicator species value (IndVAL) of copepods. The indicatorspecies of copepods showed clear difference between the GoMand the PB during all the seasons. The detailed list of the Indicatorspecies during different seasons is presented in Table 5. As withdominant species, the number of Indicator species of copepodswas also higher in the GoM as compared to the PB (Table 5). Therewere a total of 15 indicator species in the GoM and 8 in the PBduring different seasons. The species such as T. turbinata, A. danae,A. erythraea, Oncaea venusta and C. danae were present in the GoMirrespective of seasons. Out of various indicator species present inthe GoM and the PB, the abundance of species having the highestIndVal index (>75%) is presented in Fig. 10. It is clear in Fig. 10 thatduring the Spring Intermonsoon and Northeast Monsoon, therewas a clear division of indicator species between the regions.
3.4.4.5. Redundancy analyses of copepods and environmental fac-tors. The major hydrographical variables such as salinity, tempera-ture and dissolved oxygen in the GoM and the PB varied spatiallyand seasonally. This spatial difference in the environmental factorsreflected well on the distribution of the dominant and indicatorspecies of copepods in the study area. The RDA triplot presentedin Fig. 11 delineated the dominant and indicator species of cope-pods in the GoM and the PB during different seasons. The resultsof the complete RDA has shown that salinity, temperature and dis-solved oxygen together explained 33.8%, 18.7% and 34.1% of varia-tions in copepods during the Spring Intermonsoon, SouthwestMonsoon and Northeast Monsoon respectively. The partial RDA(salinity as the environmental variable; temperature and DO asthe co-variable) carried out showed that the salinity alone ex-plained 15.2%, 6.6% and 32.1% of the total variations in copepodsduring the Spring Intermonsoon, Southwest Monsoon and North-east Monsoon periods, respectively. The ordination significance ofall the axes were tested by the Monte Carlo test, which showedthat all the ordination of RDA axes representing the Spring Inter-monsoon, Southwest Monsoon and Northeast Monsoon(F = 4.915, 3.311 and 3.567 respectively) were significant p < 0.05).
The RDA of the Spring Intermonsoon data demarcated the loca-tions in the GoM (1–15) on the left hand side and the PB (16–30)on the right hand side of the Triplots (Fig. 11). The GoM locationswere characterized by high salinity, high DO and low temperaturewhereas; the PB locations were characterized by low salinity, lowDO and high SST. The DO was positively related with salinity,and negatively related with SST. The chlorophyll a and copepodsindicator species Farranula gibbula, Metis jousseaumei, C. danae,Tortanus barbatus, Subeucalanus crassus, P. attenuatus, Metacalanusaurivilli, O. venusta, T. discaudata, T. turbinata, C. minor and O. catuswere positively related with the salinity and were characteristic ofthe GoM. On the other hand, C. orsinii, C. arcuicornis, A. erythraea, A.gracilis, Centropages furcatus, and A. danae were placed in the PBside indicating their affinity with the PB region.
The RDA for the Northeast Monsoon showed high salinity andtemperature in the GoM. The typical PB characteristics of lowsalinity formed the opposite side. The dominant and indicatorspecies of copepods, O. venusta, U. vulgaris, Pareucalanus attenua-tus, T. turbinata, Paracandacia simplex, C. danae, C. discaudata, C.pachydactyla were represented in the GoM due to their prefer-ence to high salinity and temperature. The copepod Acartia ery-

Fig. 9. Bray–Curtis similarities based on group averaging of Non-metric Multidimensional Scaling (NMDS) plot of copepod abundance based on log (X + 1) transformed dataover laid with the bubble plots of major dominant species showing their densities and distribution during (A1–A4) March, (B1–B4) September and (C1–C4) January onspatially assembled groups of locations. In figures A, B and C, the numbers represents the locations (1–15 in the GoM and 16–30 in the PB). The bubble positions in figure A1–A4, B1–B4 and C1–C4 correspond to the stations positions in figure A, B and C respectively. Bubble size is proportional to the number of ind.m-3. Contour lines indicate the50% similarity level. In figure: SIM – Spring Intermonsoon; SWM – Southwest Monsoon; NEM – Northeast Monsoon; ADA – Acartia danae; AER – Acartia erythrae; TTU –Temora turbinata; PPA – Paracalanus parvus.
40 L. Jagadeesan et al. / Progress in Oceanography 110 (2013) 27–48
thrae, C. arcuicornis, A. gracilis and P. parvus were placed, alongthe direction of negative gradient of salinity and positive gradi-ent of dissolved oxygen indicating their preference to the PBregion.
Due to increased homogeneity of environmental conditions andsimilarity of copepod community in the GoM and the PB, RDAcould not explain the biotic - abiotic interactions during the South-west Monsoon. The environmental variables salinity and dissolved
oxygen together with chlorophyll a showed increasing gradientstowards the GoM. The abundance of dominant copepods in theGoM and the PB differed significantly, which was also evident inthe Triplot. The indicator species C. danae, Macrosetella gracilis, P.serricaudatus, O. venusta, O. catus, Oithona similis, Labidocera acuta,and T. turbinata were more abundant in the GoM side. Similarly,indicator species A. erythraea, C. minor, P. aurivilli were more abun-dant in the PB side.
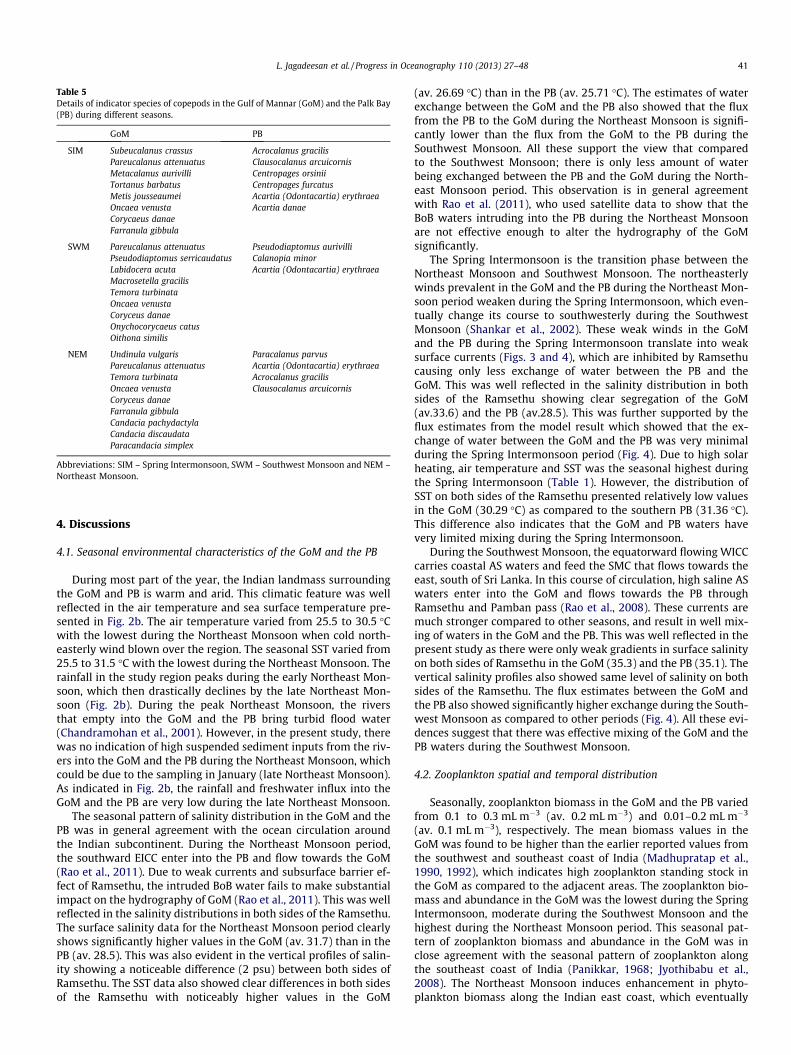
Table 5Details of indicator species of copepods in the Gulf of Mannar (GoM) and the Palk Bay(PB) during different seasons.
GoM PB
SIM Subeucalanus crassus Acrocalanus gracilisPareucalanus attenuatus Clausocalanus arcuicornisMetacalanus aurivilli Centropages orsiniiTortanus barbatus Centropages furcatusMetis jousseaumei Acartia (Odontacartia) erythraeaOncaea venusta Acartia danaeCorycaeus danaeFarranula gibbula
SWM Pareucalanus attenuatus Pseudodiaptomus aurivilliPseudodiaptomus serricaudatus Calanopia minorLabidocera acuta Acartia (Odontacartia) erythraeaMacrosetella gracilisTemora turbinataOncaea venustaCoryceus danaeOnychocorycaeus catusOithona similis
NEM Undinula vulgaris Paracalanus parvusPareucalanus attenuatus Acartia (Odontacartia) erythraeaTemora turbinata Acrocalanus gracilisOncaea venusta Clausocalanus arcuicornisCoryceus danaeFarranula gibbulaCandacia pachydactylaCandacia discaudataParacandacia simplex
Abbreviations: SIM – Spring Intermonsoon, SWM – Southwest Monsoon and NEM –Northeast Monsoon.
L. Jagadeesan et al. / Progress in Oceanography 110 (2013) 27–48 41
4. Discussions
4.1. Seasonal environmental characteristics of the GoM and the PB
During most part of the year, the Indian landmass surroundingthe GoM and PB is warm and arid. This climatic feature was wellreflected in the air temperature and sea surface temperature pre-sented in Fig. 2b. The air temperature varied from 25.5 to 30.5 �Cwith the lowest during the Northeast Monsoon when cold north-easterly wind blown over the region. The seasonal SST varied from25.5 to 31.5 �C with the lowest during the Northeast Monsoon. Therainfall in the study region peaks during the early Northeast Mon-soon, which then drastically declines by the late Northeast Mon-soon (Fig. 2b). During the peak Northeast Monsoon, the riversthat empty into the GoM and the PB bring turbid flood water(Chandramohan et al., 2001). However, in the present study, therewas no indication of high suspended sediment inputs from the riv-ers into the GoM and the PB during the Northeast Monsoon, whichcould be due to the sampling in January (late Northeast Monsoon).As indicated in Fig. 2b, the rainfall and freshwater influx into theGoM and the PB are very low during the late Northeast Monsoon.
The seasonal pattern of salinity distribution in the GoM and thePB was in general agreement with the ocean circulation aroundthe Indian subcontinent. During the Northeast Monsoon period,the southward EICC enter into the PB and flow towards the GoM(Rao et al., 2011). Due to weak currents and subsurface barrier ef-fect of Ramsethu, the intruded BoB water fails to make substantialimpact on the hydrography of GoM (Rao et al., 2011). This was wellreflected in the salinity distributions in both sides of the Ramsethu.The surface salinity data for the Northeast Monsoon period clearlyshows significantly higher values in the GoM (av. 31.7) than in thePB (av. 28.5). This was also evident in the vertical profiles of salin-ity showing a noticeable difference (2 psu) between both sides ofRamsethu. The SST data also showed clear differences in both sidesof the Ramsethu with noticeably higher values in the GoM
(av. 26.69 �C) than in the PB (av. 25.71 �C). The estimates of waterexchange between the GoM and the PB also showed that the fluxfrom the PB to the GoM during the Northeast Monsoon is signifi-cantly lower than the flux from the GoM to the PB during theSouthwest Monsoon. All these support the view that comparedto the Southwest Monsoon; there is only less amount of waterbeing exchanged between the PB and the GoM during the North-east Monsoon period. This observation is in general agreementwith Rao et al. (2011), who used satellite data to show that theBoB waters intruding into the PB during the Northeast Monsoonare not effective enough to alter the hydrography of the GoMsignificantly.
The Spring Intermonsoon is the transition phase between theNortheast Monsoon and Southwest Monsoon. The northeasterlywinds prevalent in the GoM and the PB during the Northeast Mon-soon period weaken during the Spring Intermonsoon, which even-tually change its course to southwesterly during the SouthwestMonsoon (Shankar et al., 2002). These weak winds in the GoMand the PB during the Spring Intermonsoon translate into weaksurface currents (Figs. 3 and 4), which are inhibited by Ramsethucausing only less exchange of water between the PB and theGoM. This was well reflected in the salinity distribution in bothsides of the Ramsethu showing clear segregation of the GoM(av.33.6) and the PB (av.28.5). This was further supported by theflux estimates from the model result which showed that the ex-change of water between the GoM and the PB was very minimalduring the Spring Intermonsoon period (Fig. 4). Due to high solarheating, air temperature and SST was the seasonal highest duringthe Spring Intermonsoon (Table 1). However, the distribution ofSST on both sides of the Ramsethu presented relatively low valuesin the GoM (30.29 �C) as compared to the southern PB (31.36 �C).This difference also indicates that the GoM and PB waters havevery limited mixing during the Spring Intermonsoon.
During the Southwest Monsoon, the equatorward flowing WICCcarries coastal AS waters and feed the SMC that flows towards theeast, south of Sri Lanka. In this course of circulation, high saline ASwaters enter into the GoM and flows towards the PB throughRamsethu and Pamban pass (Rao et al., 2008). These currents aremuch stronger compared to other seasons, and result in well mix-ing of waters in the GoM and the PB. This was well reflected in thepresent study as there were only weak gradients in surface salinityon both sides of Ramsethu in the GoM (35.3) and the PB (35.1). Thevertical salinity profiles also showed same level of salinity on bothsides of the Ramsethu. The flux estimates between the GoM andthe PB also showed significantly higher exchange during the South-west Monsoon as compared to other periods (Fig. 4). All these evi-dences suggest that there was effective mixing of the GoM and thePB waters during the Southwest Monsoon.
4.2. Zooplankton spatial and temporal distribution
Seasonally, zooplankton biomass in the GoM and the PB variedfrom 0.1 to 0.3 mL m�3 (av. 0.2 mL m�3) and 0.01–0.2 mL m�3
(av. 0.1 mL m�3), respectively. The mean biomass values in theGoM was found to be higher than the earlier reported values fromthe southwest and southeast coast of India (Madhupratap et al.,1990, 1992), which indicates high zooplankton standing stock inthe GoM as compared to the adjacent areas. The zooplankton bio-mass and abundance in the GoM was the lowest during the SpringIntermonsoon, moderate during the Southwest Monsoon and thehighest during the Northeast Monsoon period. This seasonal pat-tern of zooplankton biomass and abundance in the GoM was inclose agreement with the seasonal pattern of zooplankton alongthe southeast coast of India (Panikkar, 1968; Jyothibabu et al.,2008). The Northeast Monsoon induces enhancement in phyto-plankton biomass along the Indian east coast, which eventually

Fig. 10. Bray–Curtis similarities based on group averaging of Non-metric Multidimensional Scaling (NMDS) plot of copepod abundance based on log (X + 1) transformed dataover laid with bubble plots of important Indicator species (having >75 IndVal index value during any one of the season) showing their densities and distribution during (A1–A4) Spring Intermonsoon, (B1–B4) Southwest Monsoon and (C1–C4) Northeast Monsoon on spatially assembled groups of locations. In figure A, B and C, the numbersrepresents the locations (1–15 in the GoM and 16–30 in the PB). The bubble positions in figures A1–A4, B1–B4 and C1–C4 corresponds to the stations positions in figure A, Band C respectively. The bubble size is proportional to the number of ind.m-3. Contour lines indicate the 50% similarity level of separation. In figure SIM – SpringIntermonsoon; SWM – Southwest Monsoon; NEM – Northeast Monsoon; OVE – Oncaea venusta; FGI – Farranula gibbula; PAT – Pareucalanus attenuatus; COR – Centropagesorsinii.
42 L. Jagadeesan et al. / Progress in Oceanography 110 (2013) 27–48
translates into high zooplankton stock (Madhu et al., 2006;Rakhesh et al., 2006; Rakhesh et al., 2008). Similarly, during theSouthwest Monsoon period, the biologically productive watersfrom the southwest coast of India brought by the WICC supporthigh zooplankton stock in the GoM. The Spring Intermonsoon is alow productive season with low zooplankton stock along thesoutheast coast of India (Jyothibabu et al., 2008). It is importantto see that the zooplankton seasonal trend in the GoM has a close
coupling with phytoplankton, which was well reflected in the RDAtriplot (Fig. 11). The significant enhancement in zooplankton bio-mass associated with the enhancement of phytoplankton biomasshas been reported earlier from the Indian coast (Ashadevi et al.,2010; Jyothibabu et al., 2008 and references therein). Earlierstudies also showed that the salinity differences can influencethe overall composition and community structure of zooplanktonin coastal waters (Gaudy et al., 2000; Blanco-Bercial et al., 2006;
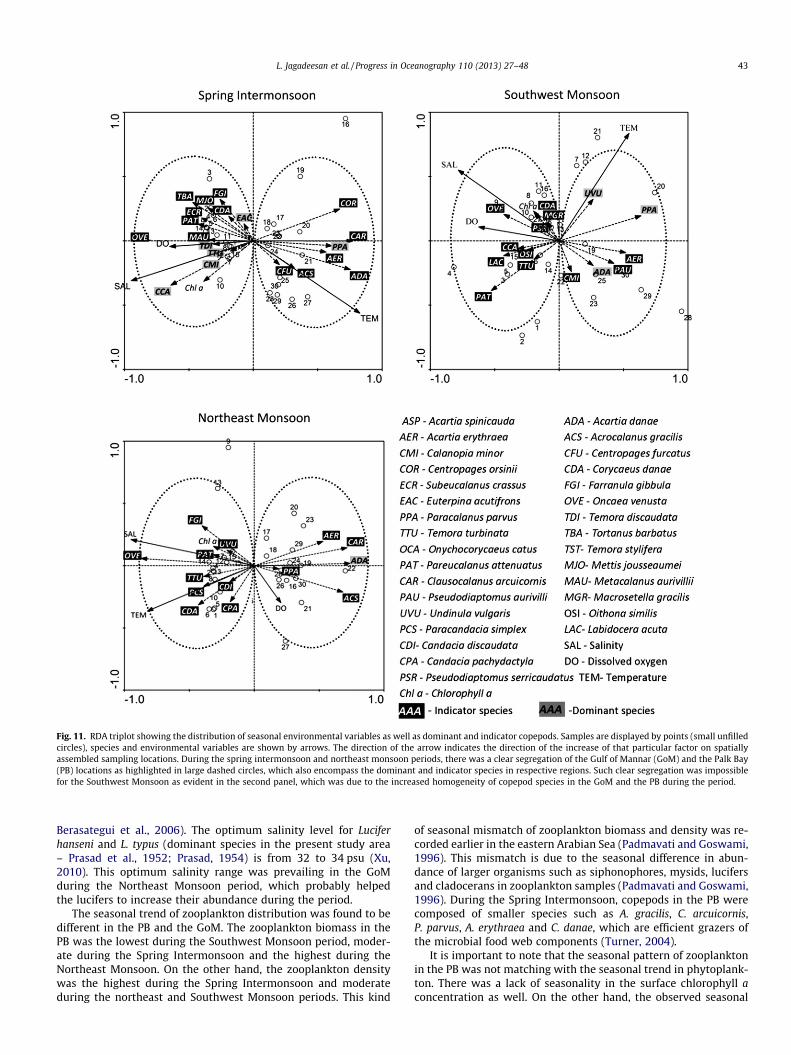
Fig. 11. RDA triplot showing the distribution of seasonal environmental variables as well as dominant and indicator copepods. Samples are displayed by points (small unfilledcircles), species and environmental variables are shown by arrows. The direction of the arrow indicates the direction of the increase of that particular factor on spatiallyassembled sampling locations. During the spring intermonsoon and northeast monsoon periods, there was a clear segregation of the Gulf of Mannar (GoM) and the Palk Bay(PB) locations as highlighted in large dashed circles, which also encompass the dominant and indicator species in respective regions. Such clear segregation was impossiblefor the Southwest Monsoon as evident in the second panel, which was due to the increased homogeneity of copepod species in the GoM and the PB during the period.
L. Jagadeesan et al. / Progress in Oceanography 110 (2013) 27–48 43
Berasategui et al., 2006). The optimum salinity level for Luciferhanseni and L. typus (dominant species in the present study area– Prasad et al., 1952; Prasad, 1954) is from 32 to 34 psu (Xu,2010). This optimum salinity range was prevailing in the GoMduring the Northeast Monsoon period, which probably helpedthe lucifers to increase their abundance during the period.
The seasonal trend of zooplankton distribution was found to bedifferent in the PB and the GoM. The zooplankton biomass in thePB was the lowest during the Southwest Monsoon period, moder-ate during the Spring Intermonsoon and the highest during theNortheast Monsoon. On the other hand, the zooplankton densitywas the highest during the Spring Intermonsoon and moderateduring the northeast and Southwest Monsoon periods. This kind
of seasonal mismatch of zooplankton biomass and density was re-corded earlier in the eastern Arabian Sea (Padmavati and Goswami,1996). This mismatch is due to the seasonal difference in abun-dance of larger organisms such as siphonophores, mysids, lucifersand cladocerans in zooplankton samples (Padmavati and Goswami,1996). During the Spring Intermonsoon, copepods in the PB werecomposed of smaller species such as A. gracilis, C. arcuicornis,P. parvus, A. erythraea and C. danae, which are efficient grazers ofthe microbial food web components (Turner, 2004).
It is important to note that the seasonal pattern of zooplanktonin the PB was not matching with the seasonal trend in phytoplank-ton. There was a lack of seasonality in the surface chlorophyll aconcentration as well. On the other hand, the observed seasonal
44 L. Jagadeesan et al. / Progress in Oceanography 110 (2013) 27–48
difference in zooplankton biomass could be attributed to the sea-sonal shift in the alternative nutritional pathway of zooplankton(microbial loop) in the study area. In the western AS, the total or-ganic carbon (TOC) concentrations in the upper mixed layer are attheir annual maximum during the SIM (Hansell and Peltzer, 1998).During the period, biomass of heterotrophic bacteria and nano-plankton are also higher in the region as compared to other sea-sons (Ducklow et al., 2001; Garrison et al., 2000). This food websetting support an active microbial loop, which sustain high zoo-plankton biomass during the SIM when phytoplankton biomass isgenerally low in the western Arabian Sea (Smith and Madhupradap,2005). The abundance of heterotrophic bacteria, heterotrophicnanoflagellates and microzooplankton was significantly higher inthe PB as compared to the GoM (Anjusha et al., 2013). Themicrobial food web dominated the classical one during the SpringIntermonsoon, which could be reason for the enhanced zooplanktonstock in the PB during this period. In seas around India, the micro-bial loop is most dominant during the Spring Intermonsoon seasonwhen water column is thermally stratified (Madhupratap et al.,1996; Jyothibabu et al., 2008). The same seasonal trend was foundboth in the GoM and the PB but, the enhancement of microbialfood web was many folds higher in the PB as compared to theGoM, which might have supported the high zooplankton stockduring the Spring Intermonsoon (Anjusha et al., 2013).
4.3. Zooplankton composition
The percentage contribution of copepods to the total zooplank-ton abundance in the GoM and the PB showed marked differencesduring different seasons. The copepods generally contributed61–77% of the total zooplankton community which was in agree-ment with earlier records from the GoM and the PB (Prasad, 1954;Kartha, 1959), coastal waters of the AS (Madhupratap et al., 1990,1992) and the BoB (Rakhesh et al., 2006; Rakhesh et al., 2008; Fer-nandes, 2008). Density and contribution of gastropods and bivalveslarvae to the total zooplankton density showed two seasonal peaksin the PB, one during the Spring Intermonsoon and the other duringthe Southwest Monsoon. Prasad (1954) also found bimodal peaks inmollusks larval density in the PB. But uni-model seasonal peak wasnoticed in the GoM, which was during the Spring Intermonsoon per-iod and this was associated with their breeding season (Sirajmeetanand Marichamy, 1986; Natarajan, 1957; Marichamy et al., 1985).
During all the seasons, the abundance of sergistids (lucifers) washigh in the GoM as compared to the PB. They are found throughoutthe year in the GoM but they flourish and form swarms during theNortheast Monsoon and Spring Intermonsoon (Prasad, 1954). Thiswas due to the prevalence of optimal salinity for sergistids in theGoM (32–34) during the Spring Intermonsoon. During all the sea-sons, the abundance of chaetognaths was higher in the GoM as com-pared to the PB. The literature suggests that the abundance ofchaetognaths is mainly controlled by salinity and availability of foodpreferably copepods (Ohman, 1986; Madhupratap, 1987; Gieseckeand González, 2008). The present observation is in general agree-ment with the above understanding and the highest abundance ofchaetognaths in the study area was found during the SouthwestMonsoon period when the salinity was the highest and the copepodswere abundant. Conversely, the density of chaetognaths in the GoMdeclined during low saline conditions of the Northeast Monsoonwhen copepods were still abundant there.
The group diversity of zooplankton community depends on thedensity and proportionate contribution of each group to the totalcommunity abundance. The abundance of major zooplanktongroups showed significant temporal and spatial variations withinand between the GoM and the PB. Irrespective of seasons, zoo-plankton diversity was found to be higher in the GoM than in thePB. The relatively low percentage contribution of copepods and sig-
nificant contribution of Lucifers and meroplankton larvae were themajor reasons for the highest zooplankton community diversityobserved in the GoM during the Spring Intermonsoon period. Theliterature suggest the Spring Intermonsoon period as the breedingseason of mollusks (Sirajmeetan and Marichamy, 1986; Natarajan,1957; Marichamy et al., 1985) and fishes (Marichamy et al., 1985;Prasad, 1954) in the study area, which may be due to high avail-ability of smaller plankton fractions during the period (Anjushaet al., 2013). Furthermore, the stable environmental conditionsthat prevail during the Spring Intermonsoon season are conducivefor diversification of the plankton community.
The biological signatures of upwelling along the southwest coastof India are mostly evident from June to September (Madhupratapet al., 1990, 1992; Banse et al., 1996). During the peak upwelling per-iod (July–August), extensive phytoplankton blooms are evidentalong the southwest coast of India (Nair et al., 1992; Jyothibabuet al., 2008). The physical process of upwelling and enrichment ofnutrients in the surface waters weakens by September, but the re-sponse of biological production remains even up to October(Madhupratap et al., 1992; Jyothibabu et al., 2008; MLR PlanktonAltlas, 2011). This is primarily due to the time lag between nutrientenrichment, phytoplankton proliferation and zooplankton swarms(Madhupratap et al., 1990). Swarms of copepods and high abun-dance of lager carnivores such as chaetognaths, siphonophoresand hydromedusae are common along the southwest coast of Indiaduring the Southwest Monsoon (Madhupratap and Haridas, 1986;Madhupratap et al., 1990). Equator ward flow of WICC during theSouthwest Monsoon carries this upwelled water and feed the east-ward flowing SMC south of Sri Lanka (Shetye and Gouveia, 1998;Vinayachandran et al., 2004, 2005). On the course this circulation,part of the upwelled waters enter into the GoM and flow towardsthe PB through the Ramsethu and Pamban Pass (Fig. 3). During theSouthwest Monsoon period, the typical upwelling zooplanktoncommunity consisting of abundant chaetognaths, siphonophoresand hydromedusae along with swarming of upwelling indicator spe-cies of copepods T. turbinata was found in the GoM. This zooplanktoncommunity structure in the GoM provides biological evidences toconsider that the upwelled Arabian Sea coastal waters have influ-ence on the hydrography of the GoM during the Southwest Monsoonseason. The predominance of copepods and the presences of lessabundant groups such as siphonophores, ctenophores and thalia-ceans were the reasons for the low zooplankton group diversity dur-ing the Southwest Monsoon.
The chaetognaths, hydromedusae, siphonophores and cteno-phores are the major planktonic carnivores in marine environments(Reeve, 1980; Feigenbaum and Maris, 1984; Mills, 1995). Their pre-dations on other plankton groups significantly influence the overallstructure and magnitude of the zooplankton community (Huntleyand Hobson, 1978; Matsakis and Conover, 1991; Hansson et al.,2005). Many of the coastal copepods are capable of rapid increasein their populations when conditions are conducive and thereforea decline of predatory pressure of carnivorous plankton favors in-crease in copepod abundance. During the Northeast Monsoon peri-od, a few species of copepods contributed the majority of thezooplankton in the study area. This situation considerably decreasesthe diversity of zooplankton as reported earlier from the west andeast coast of India (Madhupratap et al., 1990; Rakhesh et al.,2006). During the Northeast Monsoon, the high abundance of cope-pods and low abundance of other zooplankton groups reduced thediversity and evenness of zooplankton in the PB.
4.4. Copepod density and species in the GoM and the PB
Altogether, 81 species of copepods were recorded from the GoMand the PB during the three seasonal observations. The spatial andtemporal difference in copepod density during different seasons
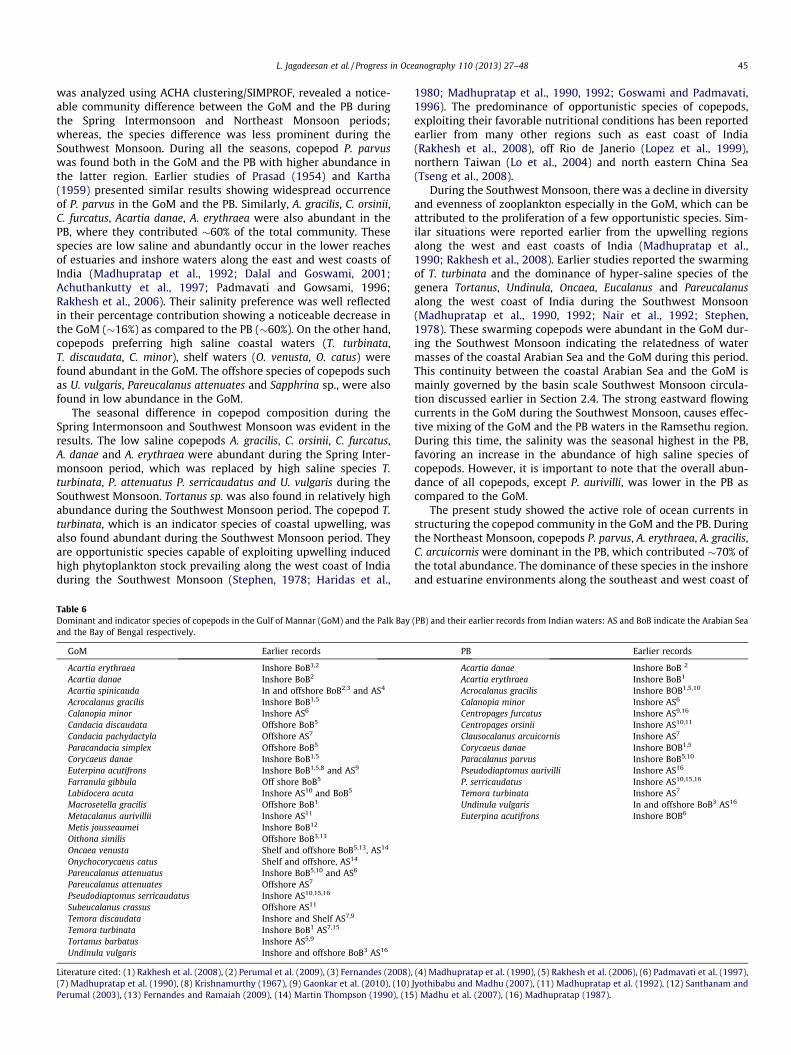
L. Jagadeesan et al. / Progress in Oceanography 110 (2013) 27–48 45
was analyzed using ACHA clustering/SIMPROF, revealed a notice-able community difference between the GoM and the PB duringthe Spring Intermonsoon and Northeast Monsoon periods;whereas, the species difference was less prominent during theSouthwest Monsoon. During all the seasons, copepod P. parvuswas found both in the GoM and the PB with higher abundance inthe latter region. Earlier studies of Prasad (1954) and Kartha(1959) presented similar results showing widespread occurrenceof P. parvus in the GoM and the PB. Similarly, A. gracilis, C. orsinii,C. furcatus, Acartia danae, A. erythraea were also abundant in thePB, where they contributed �60% of the total community. Thesespecies are low saline and abundantly occur in the lower reachesof estuaries and inshore waters along the east and west coasts ofIndia (Madhupratap et al., 1992; Dalal and Goswami, 2001;Achuthankutty et al., 1997; Padmavati and Gowsami, 1996;Rakhesh et al., 2006). Their salinity preference was well reflectedin their percentage contribution showing a noticeable decrease inthe GoM (�16%) as compared to the PB (�60%). On the other hand,copepods preferring high saline coastal waters (T. turbinata,T. discaudata, C. minor), shelf waters (O. venusta, O. catus) werefound abundant in the GoM. The offshore species of copepods suchas U. vulgaris, Pareucalanus attenuates and Sapphrina sp., were alsofound in low abundance in the GoM.
The seasonal difference in copepod composition during theSpring Intermonsoon and Southwest Monsoon was evident in theresults. The low saline copepods A. gracilis, C. orsinii, C. furcatus,A. danae and A. erythraea were abundant during the Spring Inter-monsoon period, which was replaced by high saline species T.turbinata, P. attenuatus P. serricaudatus and U. vulgaris during theSouthwest Monsoon. Tortanus sp. was also found in relatively highabundance during the Southwest Monsoon period. The copepod T.turbinata, which is an indicator species of coastal upwelling, wasalso found abundant during the Southwest Monsoon period. Theyare opportunistic species capable of exploiting upwelling inducedhigh phytoplankton stock prevailing along the west coast of Indiaduring the Southwest Monsoon (Stephen, 1978; Haridas et al.,
Table 6Dominant and indicator species of copepods in the Gulf of Mannar (GoM) and the Palk Bayand the Bay of Bengal respectively.
GoM Earlier records
Acartia erythraea Inshore BoB1,2
Acartia danae Inshore BoB2
Acartia spinicauda In and offshore BoB2,3 and AS4
Acrocalanus gracilis Inshore BoB1,5
Calanopia minor Inshore AS6
Candacia discaudata Offshore BoB5
Candacia pachydactyla Offshore AS7
Paracandacia simplex Offshore BoB5
Corycaeus danae Inshore BoB1,5
Euterpina acutifrons Inshore BoB1,5,8 and AS9
Farranula gibbula Off shore BoB5
Labidocera acuta Inshore AS10 and BoB5
Macrosetella gracilis Offshore BoB1
Metacalanus aurivillii Inshore AS11
Metis jousseaumei Inshore BoB12
Oithona similis Offshore BoB3,13
Oncaea venusta Shelf and offshore BoB5,13, AS14
Onychocorycaeus catus Shelf and offshore, AS14
Pareucalanus attenuatus Inshore BoB5,10 and AS6
Pareucalanus attenuates Offshore AS7
Pseudodiaptomus serricaudatus Inshore AS10,15,16
Subeucalanus crassus Offshore AS11
Temora discaudata Inshore and Shelf AS7,9
Temora turbinata Inshore BoB1 AS7,15
Tortanus barbatus Inshore AS5,9
Undinula vulgaris Inshore and offshore BoB3 AS16
Literature cited: (1) Rakhesh et al. (2008), (2) Perumal et al. (2009), (3) Fernandes (2008),(7) Madhupratap et al. (1990), (8) Krishnamurthy (1967), (9) Gaonkar et al. (2010), (10)Perumal (2003), (13) Fernandes and Ramaiah (2009), (14) Martin Thompson (1990), (15
1980; Madhupratap et al., 1990, 1992; Goswami and Padmavati,1996). The predominance of opportunistic species of copepods,exploiting their favorable nutritional conditions has been reportedearlier from many other regions such as east coast of India(Rakhesh et al., 2008), off Rio de Janerio (Lopez et al., 1999),northern Taiwan (Lo et al., 2004) and north eastern China Sea(Tseng et al., 2008).
During the Southwest Monsoon, there was a decline in diversityand evenness of zooplankton especially in the GoM, which can beattributed to the proliferation of a few opportunistic species. Sim-ilar situations were reported earlier from the upwelling regionsalong the west and east coasts of India (Madhupratap et al.,1990; Rakhesh et al., 2008). Earlier studies reported the swarmingof T. turbinata and the dominance of hyper-saline species of thegenera Tortanus, Undinula, Oncaea, Eucalanus and Pareucalanusalong the west coast of India during the Southwest Monsoon(Madhupratap et al., 1990, 1992; Nair et al., 1992; Stephen,1978). These swarming copepods were abundant in the GoM dur-ing the Southwest Monsoon indicating the relatedness of watermasses of the coastal Arabian Sea and the GoM during this period.This continuity between the coastal Arabian Sea and the GoM ismainly governed by the basin scale Southwest Monsoon circula-tion discussed earlier in Section 2.4. The strong eastward flowingcurrents in the GoM during the Southwest Monsoon, causes effec-tive mixing of the GoM and the PB waters in the Ramsethu region.During this time, the salinity was the seasonal highest in the PB,favoring an increase in the abundance of high saline species ofcopepods. However, it is important to note that the overall abun-dance of all copepods, except P. aurivilli, was lower in the PB ascompared to the GoM.
The present study showed the active role of ocean currents instructuring the copepod community in the GoM and the PB. Duringthe Northeast Monsoon, copepods P. parvus, A. erythraea, A. gracilis,C. arcuicornis were dominant in the PB, which contributed �70% ofthe total abundance. The dominance of these species in the inshoreand estuarine environments along the southeast and west coast of
(PB) and their earlier records from Indian waters: AS and BoB indicate the Arabian Sea
PB Earlier records
Acartia danae Inshore BoB 2
Acartia erythraea Inshore BoB1
Acrocalanus gracilis Inshore BOB1,5,10
Calanopia minor Inshore AS6
Centropages furcatus Inshore AS9,16
Centropages orsinii Inshore AS10,11
Clausocalanus arcuicornis Inshore AS7
Corycaeus danae Inshore BOB1,5
Paracalanus parvus Inshore BoB5,10
Pseudodiaptomus aurivilli Inshore AS16
P. serricaudatus Inshore AS10,15,16
Temora turbinata Inshore AS7
Undinula vulgaris In and offshore BoB3 AS16
Euterpina acutifrons Inshore BOB6
(4) Madhupratap et al. (1990), (5) Rakhesh et al. (2006), (6) Padmavati et al. (1997),Jyothibabu and Madhu (2007), (11) Madhupratap et al. (1992), (12) Santhanam and) Madhu et al. (2007), (16) Madhupratap (1987).
46 L. Jagadeesan et al. / Progress in Oceanography 110 (2013) 27–48
India has been well established (Table 6). Therefore the high abun-dance of low saline species in the PB during the northeast eastmonsoon season can direcly be linked with the ocean currents,which bring low saline BoB waters into the PB. Since the intrudedBoB waters cause less influence on the hydrography of the GoMdue to the obstruction from the Ramsethu, the high saline speciesof copepods (F. gibbula, O. venusta, Candacia sp., Sapphirina, Copiliamirabilis, Pareucalanus attenuatus) occur abundantly in the GoM.Similarly, the absence of shelf and offshore species of copepodsin the PB can be explained by the seasonal salinity levels and theocean current there. As the ocean currents bring low saline BoBwaters into the PB during the northeast and Spring Intermonsoonperiods, the hydrography of the PB behaves like a continuation ofthe coastal BoB. This causes the absence of high saline copepodspecies in the PB except during the Southwest Monsoon periodwhen the high saline GoM water intrudes into the PB. On the otherhand, the GoM is permanently open to the neighboring AS, whichfacilitate the frequent occurrence of high saline species in theregion.
4.5. Biogeography of copepods with respect to the hydrography
The salinity superimposed on biotic assemblage patterns clearlyshowed the influence of salinity on copepods assemblage in theGoM and the PB during the Spring Intermonsoon and NortheastMonsoon, which in turn was governed by the ocean currents(Figs. 4 and 8). The partial RDA showed that salinity alone isresponsible for 15.2%, 6.6% and 32.1% of the total variance ofcopepods during the Spring Intermonsoon, Southwest Monsoonand Northeast Monsoon respectively. Altogether 81 species ofcopepods were recorded from the GoM and the PB during differentseasons. All the 81 species were present in the GoM but, only 63species were present in the PB. 18 species of copepods, whichnormally occurs in the continental shelf and offshore waters(Rhincalanus cornutus, Rhincalanus nasutus, C. discaudata, C. bradyi,C. pachydactyla, P. simplex, Calanopia aurivilli, Pontella spinipes, Pon-tellopsis armata, Pontellina plumata, M. jousseaumei, Oithona simplex,Oncaea conifera, Copilia vitrea, C. mirabilis, Sapphirina ovatolanceola-ta, Sapphirina auronitens, Sapphirina nigromaculata) were foundonly in the GoM. Also the list of dominant and Indicator speciesof copepods revealed noticeable difference in copepod compositionbetween the GoM and the PB (Tables 4 and 5). Earlier records ofthese species from other parts of the Indian seas is presented in Ta-ble 6, which provides clear evidences to infer that the copepodcommunity in the GoM is composed of coastal, shelf and offshorespecies whereas, the copepods in the PB is composed of coastal/in-shore species.
5. Conclusion
The hydrography of the GoM and the PB exhibited clear sea-sonal pattern in response to the seasonally reversing ocean cur-rents in the region. During the Northeast Monsoon, low salineBoB waters intrude into the PB, which eventually decreases thesalinity and supports the low saline coastal species of copepods(P. parvus, Acrocalanus spp. etc.). During the Southwest Monsoon,the intrusion of the upwelled AS waters changes the zooplanktoncommunity structure in the GoM. The swarming proportions ofthe upwelling indicator copepod T. turbinata, and increased abun-dance of high saline copepods points to the region’s biogeographiccontinuity with the southwest coast of India during this season.During the Spring Intermonsoon season, the monsoon currentsweaken and reverse its direction in the GoM and the PB. The stableenvironmental condition during this period favored the diversifica-tion of copepods with the dominance of C. arcuicornis, A. danae,
C. orsinii, P. parvus, A. gracilis and A. erythraea. In summary, thestudy evidenced a noticeable difference in copepod compositionin the GoM and the PB during the Spring Intermonsoon and North-east Monsoon. This was due to the lack of strong mixing of GoMand the PB waters during these periods, which was primarilylinked with relatively weak ocean currents and subsurface barriereffect of Ramsethu. On the other hand, increased mixing of watersduring the Southwest Monsoon resulted in a homogenous copepodcommunity in the study area. The overall results clearly show thatthe copepod community in the GoM was composed of coastal andoffshore species whereas, the community in the PB was consistedmostly of coastal species.
Acknowledgements
The authors thank Dr. S. R. Shetye, Director, CSIR- NationalInstitute of Oceanography (CSIR-NIO), India for facilities andencouragement. We thankfully acknowledge all our colleagues inCSIR- NIO, India who helped in carrying out the seasonal field workin the GoM and the PB. We express our sincere thanks to Prof. P. N.Vinayachandran, IISc, Bangalore, India and Dr. K.K. Balachandran,CSIR-NIO Regional Center, Kochi, India for their valuable sugges-tions on an earlier version of this manuscript. We also thank Dr.Antony Joseph, NIO Goa for providing AWS data. The authors thankthe Ministry of Shipping for the financial support. This is NIO con-tribution XXXX.
Appendix A. Supplementary material
Supplementary data associated with this article can be found, inthe online version, at http://dx.doi.org/10.1016/j.pocean.2012.12.002.
References
Achuthankutty, C.T., Madhupratap, M., Nair, V.R., Nair, S.R.S., Rao, T.S.S., 1980.Zooplankton biomass and composition in the western Bay of Bengal during thelate summer monsoon. Indian Journal of Marine Sciences 9, 201–206.
Achuthankutty, C.T., Ramaiah, N., Padmavati, G., 1997. Zooplankton variability andcopepod assemblage in the coastal and estuarine waters of Goa along thecentral west coast of India. In: Pierrot-Bults, A.C., Vander Spoel, S. (Eds.),Intergovernmental Oceanographic Commission, 1 Workshop Report No. 142,UNESCO, Paris, pp. 1–11.
Anger, K., 2003. Salinity as a key parameter in the larval biology of decapodcrustaceans. Invertebrate Reproduction and Development 43, 29–45.
Anjusha, A., Jyothibabu, R., Jagadeesan, L., Arya, P. Mohan, Sudheesh, K., Kiran,Krishna, Ullas, N., Deepak, M.P., 2013. Trophic Efficiency of the plankton foodwebs, observations from the Gulf of Mannar and the Palk Bay, submitted forpublication.
Ashadevi, C.R., Jyothibabu, R., Sabu, P., Jacob, Josia., Habeebrehman, H., Prabhakaran,P., Jayalakshmi, K.J., Achuthankutty, C.T., 2010. Seasonal variation and trophicecology of microzooplankton (20–200 lm) in the southeastern Arabian Sea.Continental Shelf Research 30 (9), 1070–1084.
Balasubramanian, T., Anantharaman, P., Thangaradjou, T., 2011. Seagrassproductivity and mapping in the Gulf of Mannar Biosphere Reserve. In:Compendium of Research Findings on Biodiversity Conservation andSustainable Use in the Gulf of Mannar Bioshere Reserve, Gulf of MannarBiosphere Reserve Trust, Ramnathapuram, India, Science Outreach Series No. 1,pp. 18–40.
Banse, K., Vijayaraghavan, Sumitra., Madhupratap, M., 1996. On the possible causesof the seasonal phytoplankton blooms along the southwest coast of India.Indian Journal of Marine Sciences 25, 283–289.
Beaugrand, G., 2004. The North Sea regime shift: evidence, causes, mechanisms andconsequences. Progress in Oceanography 60, 245–262.
Berasategui, A.D., Menu Marque, S., Gomez-Erache, M., Ramirez, F.C., Mianzan, H.W.,Acha, E.M., 2006. Copepod assemblages in a highly complex hydrographicregion. Estuarine Coastal Shelf Sciences 66, 483–492.
Birks, H.J.B., 1998. Numerical tools in palaeolimnology – progress, potentialities andproblems. Journal of Paleolimnology 20, 307–332.
Blanco-Bercial, L., Alvarez-Marques, F., Cabal, J.A., 2006. Changes in themesozooplankton community associated with the hydrography off thenorthwestern Iberian Peninsula. ICES Journal of Marine Sciences 63, 799–810.
Bonnet, D., Frid, C.L.J., 2004. Seven copepod species considered as indicators ofwater–mass influence and changes: results from a Northumberland coastalstation. ICES Journal of Marine Sciences 61, 485–491.

L. Jagadeesan et al. / Progress in Oceanography 110 (2013) 27–48 47
Chandramohan, P., Jena, B.K., Sanilkumar, V., 2001. Littoral drift sources and sinksalong the Indian coast. Current Science 81 (3), 292–297.
Chen, H., Qi, Y., Liu, G., 2011. Spatial and temporal variations of macro- andmesozooplankton community in the Huanghai Sea (Yellow Sea) and East ChinaSea in summer and winter. Acta Oceanologica Sinica 30, 84–95.
Clarke, K.R., Gorley, R.N., 2006. PRIMER V6 User Manual/Tutorial, PRIMER-E LTD.,Plymouth Marine Laboratory, United Kingdom, p. 190.
Clarke, K.R., Warwick, R.M., 2001. Changes in Marine Communities: An Approach toStatistical Analysis and Interpredation, second ed. PRIMER-E Ltd., PlymouthMarine Laboratory, United Kingdom.
Conway, D., White, R., Hugues-Dit-Ciles, J., Gallienne, C., Robins, D., 2003. Guide tothe Coastal and Surface Zooplankton of the South Western Indian Ocean.Occasional Publication No. 15, Marine Biological Association of the UnitedKingdom, p. 354.
Dalal, S.G., Goswami, S.C., 2001. Temporal and ephemeral variations in copepodcommunity in the estuaries of Mandovi and Zuari – west coast of India. Journalof Plankton Research 23 (1), 19–26.
Ducklow, H.W., Smith, D.C., Campbell, L., Landry, M.R., Quinby, H.L., Steward, G.F.,Azam, F., 2001. Heterotrophic bacterioplankton in the Arabian Sea: basinwideresponse to year-round high primary productivity. Deep-Sea Research II 48,1303–1324.
Dufrêne, M., Legendre, P., 1997. Species assemblages and indicator species: the needfor a flexible asymmetrical approach. Ecological Monographs 67, 345–366.
Durve, V.S., Alagarswami, K., 1964. An incidence of fish mortality in Athankaraiestuary near Mandapam. Marine Biological Association of India 6, 147–151.
Feigenbaum, J.D.L., Maris, R.C., 1984. Feeding in the Chaetognatha. Annual Review ofOceanography and Marine Biology 22, 343–392.
Fernandes, V., 2008. The effect of semi-permanent eddies on the distribution ofmesozooplankton in the central Bay of Bengal. Journal of Marine Research 66,465–488.
Fernandes, V., Ramaiah, N., 2009. Mesozooplankton community in the Bay of Bengal(India): spatial variability during the summer monsoon. Aquatic Ecology 43,951–963.
Gaonkar, C.A., Krishnamurthy, V., Anil, A.C., 2010. Changes in the abundance andcomposition of zooplankton from the ports of Mumbai, India. EnvironmentalMonitoring and Assessment 168, 179–194.
Garrison, D.L., Gowing, M.M., Hughes, M.P., Campbell, L., Caron, D.A., Dennett, M.R.,et al., 2000. Microbial food web structure in the Arabian Sea: a US JGOFS study.Deep-Sea Research II 47, 1387–1422.
Gaudy, R., Cervetto, G., Pagano, M., 2000. Comparison of the metabolism of Acartiaclausi and A. tonsa: influence of temperature and salinity. Journal ofExperimental Marine Biology and Ecology 247, 51–65.
Giesecke, R., González, H.E., 2008. Reproduction and feeding of Sagitta enflata in theHumboldt Current system off Chile. ICES Journal of Marine Sciences 65, 361–370.
Goswami, S.C., Padmavati, G., 1996. Zooplankton production, composition anddiversity in the coastal waters of Goa. Indian Journal of Marine Sciences 25, 91–97.
Grasshoff, K., Ehrhardt, M., Kremling, K., 1983. In: Grassholf, K., Ehrhardt, M.,Kremling, K. (Eds.), Methods of Seawater Analysis. Verlag Chemie, Weinheim,pp. 89–224.
Hansell, D.A., Peltzer, E.T., 1998. Spatial and temporal variations of total organiccarbon in the Arabian Sea. Deep-Sea Research II 45, 2171–2194.
Hansson, L.J., Moeslund, O., Kiørboe, T., Riisgård, H.U., 2005. Clearance rates ofjellyfish and their potential predation impact on zooplankton and fish larvae ina neritic ecosystem (Limfjorden, Denmark). Marine Ecology Progress Series 304,117–131.
Haridas, P., Menon, P.G., Madhupratap, M., 1980. Annual variations in zooplanktonfrom a polluted coastal environment. Mahasagar – Bulletin of National Instituteof Oceanography, India 13, 239–248.
Heish, C.H., Chiu, T.S., Shih, C.T., 2004. Copepod diversity and composition asindicators of intrusion of the Kuroshio Branch Current into the Northern TaiwanStrait in Spring 2000. Zoological Studies 43, 393–403.
Hsiao, S.H., Kâ, S., Fang, T.H., Hwang, J.S., 2011. Zooplankton assemblages asindicators of seasonal changes in water masses in the boundary waters betweenthe East China Sea and the Taiwan Strait. Hydrobiologia 666, 317–330.
Hunt, B.P.V., Hosie, G.W., 2006. The seasonal succession of zooplankton in theSouthern Ocean south of Australia, Part I: The seasonal ice zone. Deep-SeaResearch I 53, 1182–1202.
Huntley, M.E., Hobson, L.A., 1978. Medusa predation and plankton dynamics in atemperate fjord, British Columbia. Journal of Fisheries Research Board of Canada35, 257–261.
Hwang, J.S., Wong, C.K., 2005. The China Coastal Current as a driving force fortransporting Calanus sinicus (Copepoda Calanoida) from its population centersto waters of Taiwan and Hong Kong during the NE monsoon period in winter.Journal of Plankton Research 27, 205–210.
Hwang, J.S., Souissi, S., Tseng, L.C., Seuront, L., Schmitt, F.G., Fang, L.S., Peng, S.H., Wu,C.H., Hsiao, S.H., Twan, W.H., Wei, T.P., Kumar, R., Fang, T.H., Chen, Q.C., Wong,C.K., 2006. A 5-year study of the influence of the northeast and SouthwestMonsoons on copepod assemblages in the boundary coastal waters between theEast China Sea and the Taiwan Strait. Journal of Plankton Research 28, 943–958.
Jyothibabu, R., Madhu, N.V., 2007. Zooplankton in the Mandovi and Zuari estuary.In: Shyte, S.R., Dileep Kumar, M., Shankar, D. (Eds.), Mandovi and ZuariEstuaries, pp. 83–90.
Jyothibabu, R., Madhu, N.V., Maheswaran, P.A., Jayalakshmy, K.V., Nair, K.K.C.,Achuthankutty, C.T., 2008. Seasonal variation of microzooplankton
(20–200 lm) and its possible implications on the vertical carbon flux in thewestern Bay of Bengal. Continental Shelf Research 28, 737–755.
Jyothibabu, R., Madhu, N.V., Habeebrehman, H., Jayalakshmi, K.V., Nair, K.K.C.,Achuthankutty, C.T., 2010. Re-evaluation of paradox of mesozooplankton in theeastern Arabian Sea based on ship and satellite observations. Journal of MarineSystems 81, 235–251.
Kâ, S., Hwang, J.S., 2011. Mesozooplankton distribution and composition on thenortheastern coast of Taiwan during autumn: effects of the Kuroshio currentand hydrothermal vents. Zoological Studies 50, 155–163.
Kartha, 1959. A study of the copepods op the inshore waters of Palk bay and Gulf ofMannar. Indian Journal of Fisheries 6, 256–267.
Kasturirangan, L.R., 1963. A Key for the Identification of the More CommonPlanktonic Copepoda of the Indian Coastal Waters. Publication No. 2. IndianNational Committee on Oceanic Research, pp. 1–87.
Krishnamurthy, K., 1967. Seasonal variation in the plankton of Porto. Novo Waters(India). Hydrobiologia 29, 226–238.
Kumaraguru, A.K., Edwin Joseph, V., Marimuthu, N., Jerald Wilson, J., 2006. ScientificInformation on Gulf of Mannar – A Bibliography. Centre for Marine and CoastalStudies, Madurai Kamaraj University, Madurai, India, p. 656.
Kumaraguru, A.K., Edwin Joseph, V., Rajee, M., Blasubramanian, T., 2008. Palk Bay –Information and Bibliography, CAS in Marine Biology, Annamalai University,Parangipettai and Centre for Marine and Coastal Studies, Madurai KamarajUniversity, India, p. 227.
Lee, C.Y., Liu, D.C., Su, W.C., 2009. Seasonal and spatial variations in the planktoniccopepod community of Ilan Bay and adjacent Kuroshio waters off NortheasternTaiwan. Zoological Studies 48, 151–161.
Leps, J., Smilauer, P.S., 2003. Multivariate Analysis of Ecological Data using CANOCA.Cambridge University Press, Cambridge, United Kingdom, p. 269.
Lin, D., Li, X.Q., Fang, H.D., Dong, Y.H., Huang, Z.X., Chen, J.H., 2011. Calanoidcopepods assemblages in Pearl River Estuary of China in summer: relationshipsbetween species distribution and environmental variables. Estuarine Coastaland Shelf Science 93, 259–267.
Lo, W.T., Hwang, J.S., Chen, Q.C., 2004. Spatial variations of copepods in the surfacewaters of southeastern Taiwan Strait. Zoological Studies 43, 218–228.
Lopez, R.M., Brandini, F.P., Gaeta, S.A., 1999. Distribution pattern of epipelagiccopepods off Rio de Janeiro (SE Brasil) in summer 1991/1992 and winter 1992.Hydrobiologia 411, 161–174.
Madhu, N.V., Jyothibabu, R., Maheswaran, P.A., Gerson, Vijay John, Gopalakrishnan,T.C., Nair, K.K.C., 2006. Lack of seasonality of phytoplankton standing stock(chlorophyll a) and production in the western Bay of Bengal. Continental ShelfResearch 26, 1868–1883.
Madhu, N.V., Jyothibabu, R., Balachandran, K., Honey, U., Martin, G., Vijay, J., Shiyas,C., Gupta, G., Achuthankutty, C., 2007. Monsoonal impact on planktonicstanding stock and abundance in a tropical estuary (Cochin backwaters –India). Estuarine Coastal and Shelf Science 73, 54–64.
Madhupratap, M., 1987. Status and strategy zooplankton of tropical Indianestuaries: a review. Bulletin of Plankton Society of Japan, 65–81.
Madhupratap, M., Haridas, P., 1986. Epipelagic calanoid copepods of the northernIndian Ocean. Oceanologica Acta 9, 105–117.
Madhupratap, M., Haridas, P., 1990. Zooplankton, especially calanoid copepods, inthe upper 1000 m of the south east Arabian Sea. Journal of Plankton Research12, 305–321.
Madhupratap, M., Nair, S.R.S., Haridas, P., Padmavati, G., 1990. Response ofzooplankton to physical changes in the environment: coastal upwelling alongthe central west coast of India. Journal of Coastal Research 6, 413–426.
Madhupratap, M., Haridas, P., Ramaiah, N., Achuthankutty, C.T., 1992. Zooplanktonof the southwest coast of India: abundance, composition, temporal and spatialvariability in 1987. In: Desai, B.N. (Ed.), Oceanography of the Indian Ocean.Oxford & IBH, New Delhi, pp. 99–112.
Madhupratap, M., Gopalakrishnan, T.C., Haridas, P., Nair, K.K.C., Aravindakshan, P.N.,Padmavati, G., Paul, S., 1996. Lack of seasonal and geographic variation inmesozooplankton biomass in the Arabian Sea and its structure in the mixedlayer. Current Science 71, 863–868.
Madhupratap, M., Gopalakrishnan, T.C., Haridas, P., Nair, K.K.C., 2001.Mesozooplankton biomass, composition and distribution in the Arabian Seaduring the Fall Intermonsoon: implications of oxygen gradients. Deep-SeaResearch II 48, 1345–1368.
Manikandan, S., Ganesapandian, S., Parthipan, K., 2011. Distribution and zonation ofseagrass in the Palk Bay, Southeastern India. Journal of Fisheries and AquaticScience 6 (2), 178–185.
Marichamy, R., Gopinathan, C.P., Siraimeetan, P., 1985. Studies on primary andsecondary production in relation to hydrography in the inshore waters ofTuticorin. Journal of Marine Biology Association of India 27, 129–137.
Martin Thompson, P., 1990. Ecology of the neritic and oceanic cyclopoid copepodsalong the south-west coast of Indian and the Laccadive Sea. Journal of MarineBiological Association of India 32, 38–65.
Matsakis, S., Conover, R.J., 1991. Abundance and feeding of medusae and theirpotential impact as predators on other zooplankton in Bedford Basin (NovaScotia, Canada) during spring. Canadian Journal Fisheries and Aquatic Sciences48, 1419–1430.
Mills, C.E., 1995. Medusae, siphonophores and ctenophores as planktivorouspredators in changing global ecosystems. ICES Journal of Marine Sciences 52,575–581.
MLR Plankton Altlas, 2011. In: Nair, K.K.C. (Ed.), Atlas on Environmental Parametersand Productivity of the Indian EEZ and Adjoining Seas. Centre for Marine LivingResources and Ecology, Ministry of Earth Sciences, New Delhi, p. 294.
48 L. Jagadeesan et al. / Progress in Oceanography 110 (2013) 27–48
Modéran, J., Bouvais, P., David, V., Noc, S.L., Bouhet, B.S., Niquil, N., Miramand, P.,Fichet, D., 2010. Zooplankton community structure in a highly turbidenvironment (Charente estuary, France): spatio-temporal patterns andenvironmental control. Estuarine Coastal and Shelf Science 88, 219–232.
Murty, A.V.S., Varma, U.P., 1964. The hydrographical features of the waters of PalkBay during March, 1963. Journal of Marine Biological Association of India 6,207–216.
Nair, S.R., Nair, V.R., Achuthankutty, C.T., Madhupratap, M., 1981. Zooplanktoncomposition and diversity in the western Bay of Bengal. Journal of PlanktonResearch 3, 493–508.
Nair, S.R.S., Devassy, V.P., Madhupratap, M., 1992. Blooms of phytoplankton alongthe west coast of India associated with nutrient enrichment and the response ofmesozooplankton. Science of the Total Environment (Suppl.), 819–828.
Natarajan, A.V., 1957. Studies on the egg masses and larval development of someprosobranchs from the Gulf of Mannar and the Palk Bay. Proceedings of theIndian Academy of Sciences 46, 170–228.
Nayar, K.N., Mahadevan, S., Rao, K.S., Sivalingam, D., Nayar, K.R., 1988. Exploitationof Molluscan Shell Deposits in Vaigai Estuary at Athankarai, vol. 42. CentralMarine Fisheries Research Institute, India, Bulletin, pp. 35–39.
NIO Report, 2012. Environmental Impact Assessment of the 4A Alignment of theSethusamudram Ship Channel Project. Ministry of Shipping, New Delhi, p. 210.
Ohman, M.D., 1986. Predator-limited population growth of the copepodPseudocalanus sp. Journal of Plankton Research 8, 673–713.
Padmavati, G., Goswami, S.C., 1996. Zooplankton ecology in the Mandovi Zuaryestuarine system of Goa, west coast of India. Indian Journal of Marine Sciences25, 268–273.
Padmavati, G., Goswami, S.C., Vidya, P.S., 1997. Diurnal variation in zooplankton inthe Zuari Estuary, west coast of India. Journal of the Marine BiologicalAssociation of India 39, 166–171.
Panikkar, N.K., 1968. International Indian Ocean Expedition, Plankton Atlas, vol. 1,Fasc.1, Maps on Total MSP Biomass in the Arabian Sea and Bay of Bengal, CSIR,New Delhi, p. 22.
Perumal, N.V., Rajkumar, M., Perumal, P., Rajasekar, K.T., 2009. Seasonal variationsof plankton diversity in the Kaduviyar estuary, Nagapattinam, southeast coastof India. Journal of Environmental Biology 30, 1035–1046.
Pielou, E., 1969. Introduction to Mathematical Ecology. Wiley Interscience, p. 286.Postel, L., Fock, H., Hagen, W., 2000. Biomass and abundance. In: Harris, R.P., Wiebe,
P.H., Leiz, J., Skjoldal, et al. (Eds.), ICES Zooplankton Methodology Manual.Academic Press, pp. 193–213.
Prasad, R.R., 1954. The characteristics of plankton at an inshore station in the Gulf ofMannar near Mandapam. Indian Journal of Fisheries 1, 1–36.
Prasad, R.R., 1956. Further studies on the plankton of the inshore waters offMandapam. Indian Journal of Fisheries 3, 1–42.
Prasad, R.R., 1958. Plankton calendars of the inshore waters at Mandapam with noteon the productivity of the area. Indian Journal of Fisheries 5, 170–188.
Prasad, R.R., Bapat, S.V., Tampi, P.R.S., 1952. Observations on the distribution ofplankton at six inshore stations in the Gulf of Mannar. Journal of ZoologicalSociety of India 4, 141–151.
Queiroga, H., Blanton, J., 2004. Interactions between behaviour and physical forcingin the control of horizontal transport of decapod crustaceans larvae. Advancesin Marine Biology 47, 107–204.
Rakhesh, M., Raman, A.V., Kalavati, C., Subramanian, B.R., Sharma, V.S., SunithaBabu, E., Sateesh, N., 2008. Zooplankton community structure across an eddy-generated upwelling band close to a tropical bay-mangrove ecosystem. MarineBiology 154, 953–972.
Rakhesh, M., Raman, A.V., Sudarsan, D., 2006. Discriminating zooplanktonassemblages in neritic and oceanic waters: a case for the northeast coast ofIndia, Bay of Bengal. Marine Environmental Research 63, 93–109.
Rao, K.S., Sivalingam, D., Nair, P.N.R., Unnithan, K.A., 1987. Oyster resources ofAthankarai estuary, southeast coast of India. Central Marine Fisheries ResearchInsitute, India, Bulletin 38, 17–29.
Rao, S.D.V., Rao, S.K., Iyer, C.S.P., Chittibabu, P., 2008. Possible ecologicalconsequences from the Sethu Samudram Canal Project, India. MarinePollution Bulletin 56, 170–186.
Rao, R.R., Girishkumar, M.S., Ravichandran, M., Gopalakrishna, V.V., Pankajakshan,T., 2011. Do cold, low salinity waters pass through the Indo-Sri Lanka Channelduring winter? International Journal of Remote Sensing 32 (22), 7383–7398.
Reeve, M.R., 1980. The biology of chaetognatha. 1. Quantitative aspects of growthand egg production in Sagitta hispida. In: Steele, J.H. (Ed.), Marine Food Chains.University of California Press, Berkeley, pp. 168–189.
Santhanam, P., Perumal, P., 2003. Diversity of zooplankton in Parangipettai coastalwaters, southeast coast of India. Journal of the Marine Biological Association ofIndia 45, 145–151.
Sewell, R.B.S., 1914. Notes on the surface copepoda of the Gulf of Mannar. SpoliaZeylanica 9, 191–262.
Sewell, R., 1999. The Copepoda of Indian Seas. Biotech Books, Delhi, India, p. 407.
Shankar, D., Vinayachandran, P.N., Unnikrishnan, A.S., 2002. The monsoon currentsin the north Indian Ocean. Progress in Oceanography 52, 63–120.
Shannon, C.E., Wiener, W., 1963. The Mathematical Theory of Communication.University of Illinois Press, Urbana, Illinois, pp. 117.
Shenoi, S.S.C., 2010. Intra-seasonal variability of the coastal currents around India: areview of the evidences from new observations. Indian Journal of Geo-MarineSciences 39, 489–496.
Shetye, S.R., 1999. Dynamics of circulation of the waters around India. In:Somayajulu, B.L.K. (Ed.), Ocean Science: Trends and Future directions. IndianNational Science Academy, New Delhi, pp. 1–21.
Shetye, S.R., Gouveia, A.D., 1998. Coastal circulation in the north Indian Ocean. In:Robinson, A.R., Bring, K.H. (Eds.), The Global Ocean: Regional studies andsyntheses. John Wiley & Sons, Inc., New York, pp. 523–556.
Shetye, S.R., Gouveia, A.D., Shenoi, S.S.C., Sundar, D., Michael, G.S., Nampoothiri, G.,1993. The Western boundary current of the seasonal subtropical gyre in the Bayof Bengal. Journal of Geophysical Research 98 (C1), 945–954.
Silas, E.G., 1968. Tuna fishery of the Tinnevelly coast, Gulf of Mannar. In:Proceedings of the Symposium on Scombroid Fishes, Part 3. Marine BiologyAssociation of India, pp. 1083–1120.
Simpson, E.H., 1949. Measurement of diversity. Nature, London 163, 688.Sirajmeetan, P., Marichamy, R., 1986. Seasonal abundance of bivalve and gastropod
larvae in the plankton off Tuticorin coast. Central Marine Fisheries ResearchInstitute, India, Bulletin 42, 225–231.
Skarðhamar, J., Slagstad, D., Edvardsen, A., 2007. Plankton distributions related tohydrography and circulation dynamics on a narrow continental shelf offNorthern Norway. Estuarine Coastal and Shelf Science 75, 381–392.
Smith, S.L., Madhupradap, M., 2005. Mesozooplankton of the Arabian Sea: patternsinfluenced by seasons, upwelling, and oxygen concentrations. Progress inOceanography 65, 214–239.
Smith, S., Roman, M., Prusova, I., Wishner, K., Gowing, M., Codispoti, L.A., Barber, R.,Marra, J., Flagg, C., 1998. Seasonal response of zooplankton to monsoonalreversal in the Arabian Sea. Deep-Sea Research II 45, 2369–2403.
Southwell, T., Kerkham, 1912. Currents on the Ceylon pearl banks superficial anddeep. Reports of Ceylon Marine Biological Laboratory 1, 232–248.
Sridhar, R., Thangaradjou, T., Kannan, L., 2010. Spatial and temporal variations inphytoplankton in coral reef and seagrass ecosystems of the Palk Bay, southeastcoast of India. Journal of Environmental Biology 31 (5), 765–777.
Stephen, R., 1978. Copepod composition along the southwest coasts of India. In:Desai, B.N. (Ed.), Oceanography of the Indian Ocean. Oxford & IBH, New Delhi.
Sudheesh, K., Babu, M.T., Vethamony, P., 2013. Meandering ‘S-shaped’ Through Flowin Sethu Samudram across the Adams Bridge. Gulf of Mannar and Palk Bay,unpublished.
Tanaka, O., 1956. The pelagic copepods of the Izu region, Middle Japan, Systematicaccount I. Publications of the Seto Marine Biological Laboratory 5, 525.
Tseng, L.C., kumar, R., Dahms, H.U., Chen, C.T., Souissi, S., Chen, Q.C., Hwang, J.S.,2008. Copepod community structure over a marine outfall area in the north-eastern South China Sea. Journal of Marine Biology Association of UnitedKingdom 88, 955–966.
Turner, J.T., 2004. The importance of small planktonic copepods and their roles inpelagic marine food webs. Zoological Studies 43, 255–266.
Ummerkutty, A.N.P., 1967a. Studies on Indian copepods. Observations on thediurnal vertical movements of planktonic copepods in the Gulf of Mannar.Bombay Natural History Society 63, 332–343.
Ummerkutty, 1967b. Observations on the breeding and seasonal abundance of tenspecies of planktonic copepods of the Gulf of Mannar. In: Proceedings of theSymposium on Crustacea, Part 2. Marine Biological Association of India, 12–16January 1965, Ernakulam, pp. 685–697.
UNESCO, 1994. Protocols for the Joint Global Ocean Flux Study (JGOFS). CoreMeasurements, IOC Manuals and Guides, vol. 29, UNESCO, Paris, p. 170.
Vinayachandran, P.N., Masumoto, Y., Mikawa, T., Yamagata, T., 1999. Intrusion ofthe southwest monsoon current into the Bay of Bengal. Journal of GeophysicalResearch 104 (C5), 07711085 (11).
Vinayachandran, P.N., Chauhan, P., Nayak, S.R., 2004. Biological response of the seaaround Sri Lanka to summer monsoon. Geophysical Research Letters 31,L01302. http://dx.doi.org/10.1029/2003GL018533.
Vinayachandran, P.N., Kagimoto, T., Masumoto, Y., Chauhan, P., Nayak, S.R.,Yamagata, T., 2005. Bifurcation of the East India Coastal Current east of SriLanka. Geophysical Research Letters 32, L15606. http://dx.doi.org/10.1029/2005GL022864.
Xu, Z.L., 2010. Determining optimal temperature and salinity of Lucifer(Dendrobranchiata: Sergestoidea: Luciferidae) based on field data from theEast China Sea. Plankton and Benthos Research 5, 136–143.
Yang, G.M., He, D.H., Wang, C.S., Miao, Y.T., Yu, H.H., 1999. Study on thebiological oceanography characteristics of planktonic copepods in the watersnorth of Taiwan. II. Community Characteristics. Acta Oceanologica Sinca 21,72–80.