Why do satellite imageries show exceptionally high chlorophyll in the Gulf of Mannar and the Palk...
12
Why do satellite imageries show exceptionally high chlorophyll in the Gulf of Mannar and the Palk Bay during the Norteast Monsoon? R. Jyothibabu & N. V. Madhu & L. Jagadeesan & A. Anjusha & Arya P. Mohan & N. Ullas & K. Sudheesh & C. Karnan Received: 22 March 2014 /Accepted: 24 July 2014 /Published online: 22 August 2014 # Springer International Publishing Switzerland 2014 Abstract The Gulf of Mannar (GoM) and the Palk Bay (PB) are two least studied marine environments located between India and Sri Lanka. Exceptionally high chloro- phyll a concentration in the GoM and the PB during the Northeast Monsoon (November–February) is a consis- tent feature in satellite imageries, which has been attrib- uted to the intrusion of the Bay of Bengal (BoB) waters. The analyses of the Moderate Resolution Imaging Spectroradiometer (MODIS) and field chlorophyll data collected from 30 locations in the Indian sector of the GoM and the PB in January 2011 showed significant overestimations in the satellite data. This error was much higher in the PB (60–80 %) as compared to the GoM (18–28 %). The multivariate analyses evidenced that the exceptionally high satellite chlorophyll in the PB is con- tributed largely by turbidity, colored dissolved organic matter (CDOM), and bottom reflectance. The paper cau- tions that though MODIS is superior in estimating chlo- rophyll a in optically complex waters, there are still chances of overestimations in regions like the PB. Keywords Chlorophyll . Phytoplankton . Multivariate analysis . Sediments . Turbidity . Satellite imagery . Gulf of Mannar . Bay of Bengal Introduction Satellite remote sensing has significantly improved our understanding of complicated ocean dynamics. One such application is the use of satellite chlorophyll a (hereafter chlorophyll) to identify synoptic oceano- graphic features (Dwivedi et al. 2006; Jyothibabu et al. 2010; Rao et al. 2011). However, it is fundamental that there are chances of misinterpretation of satellite chlo- rophyll in optically complex coastal waters (Sathyendranath et al. 1989). Considering the bio- optical properties, Morel and Prieur (1977) proposed two kinds of waters. In case 1 waters (oceanic), the optical properties are primarily determined by phyto- plankton with an insignificant influence from colored dissolved organic matter (CDOM) and degradation products of detritus. In case 2 waters (coastal), the optical properties are largely determined by other con- stituents such as suspended particles, and CDOM and its concentrations do not co-vary with phytoplankton con- centration. In case 1 waters, the bio-optical properties governed by phytoplankton show a shift in the blue to green ratio of upwelling irradiance with respect to the difference in concentration of chlorophyll (Morel and Prieur 1977; Prieur and Sathyendranath 1981). Howev- er, this color ratio criterion is unreasonable for the de- tection of chlorophyll in case 2 waters due to the Environ Monit Assess (2014) 186:7781–7792 DOI 10.1007/s10661-014-3966-4 Electronic supplementary material The online version of this article (doi:10.1007/s10661-014-3966-4) contains supplementary material, which is available to authorized users. R. Jyothibabu (*) : N. V. Madhu : L. Jagadeesan : A. Anjusha : A. P. Mohan : N. Ullas : C. Karnan Regional Centre, CSIR National Institute of Oceanography, Kochi 682018, India e-mail: [email protected] K. Sudheesh CSIR National Institute of Oceanography, Dona Paula, Goa 403004, India
Transcript of Why do satellite imageries show exceptionally high chlorophyll in the Gulf of Mannar and the Palk...
Why do satellite imageries show exceptionally high chlorophyllin the Gulf of Mannar and the Palk Bay during the NorteastMonsoon?
R. Jyothibabu & N. V. Madhu & L. Jagadeesan & A. Anjusha &
Arya P. Mohan & N. Ullas & K. Sudheesh & C. Karnan
Received: 22 March 2014 /Accepted: 24 July 2014 /Published online: 22 August 2014# Springer International Publishing Switzerland 2014
Abstract The Gulf of Mannar (GoM) and the Palk Bay(PB) are two least studied marine environments locatedbetween India and Sri Lanka. Exceptionally high chloro-phyll a concentration in the GoM and the PB during theNortheast Monsoon (November–February) is a consis-tent feature in satellite imageries, which has been attrib-uted to the intrusion of the Bay of Bengal (BoB) waters.The analyses of the Moderate Resolution ImagingSpectroradiometer (MODIS) and field chlorophyll datacollected from 30 locations in the Indian sector of theGoM and the PB in January 2011 showed significantoverestimations in the satellite data. This error was muchhigher in the PB (60–80 %) as compared to the GoM(18–28 %). The multivariate analyses evidenced that theexceptionally high satellite chlorophyll in the PB is con-tributed largely by turbidity, colored dissolved organicmatter (CDOM), and bottom reflectance. The paper cau-tions that though MODIS is superior in estimating chlo-rophyll a in optically complex waters, there are stillchances of overestimations in regions like the PB.
Keywords Chlorophyll . Phytoplankton .Multivariateanalysis . Sediments . Turbidity . Satellite imagery . GulfofMannar . Bay of Bengal
Introduction
Satellite remote sensing has significantly improved ourunderstanding of complicated ocean dynamics. Onesuch application is the use of satellite chlorophyll a(hereafter chlorophyll) to identify synoptic oceano-graphic features (Dwivedi et al. 2006; Jyothibabu et al.2010; Rao et al. 2011). However, it is fundamental thatthere are chances of misinterpretation of satellite chlo-rophyll in optically complex coastal waters(Sathyendranath et al. 1989). Considering the bio-optical properties, Morel and Prieur (1977) proposedtwo kinds of waters. In case 1 waters (oceanic), theoptical properties are primarily determined by phyto-plankton with an insignificant influence from coloreddissolved organic matter (CDOM) and degradationproducts of detritus. In case 2 waters (coastal), theoptical properties are largely determined by other con-stituents such as suspended particles, and CDOM and itsconcentrations do not co-vary with phytoplankton con-centration. In case 1 waters, the bio-optical propertiesgoverned by phytoplankton show a shift in the blue togreen ratio of upwelling irradiance with respect to thedifference in concentration of chlorophyll (Morel andPrieur 1977; Prieur and Sathyendranath 1981). Howev-er, this color ratio criterion is unreasonable for the de-tection of chlorophyll in case 2 waters due to the
Environ Monit Assess (2014) 186:7781–7792DOI 10.1007/s10661-014-3966-4
Electronic supplementary material The online version of thisarticle (doi:10.1007/s10661-014-3966-4) contains supplementarymaterial, which is available to authorized users.
R. Jyothibabu (*) :N. V. Madhu : L. Jagadeesan :A. Anjusha :A. P. Mohan :N. Ullas : C. KarnanRegional Centre, CSIR National Institute of Oceanography,Kochi 682018, Indiae-mail: [email protected]
K. SudheeshCSIR National Institute of Oceanography,Dona Paula, Goa 403004, India
presence of suspended sediment particles and dissolvedorganic matter that absorb blue light and strongly inter-fere with the upwelling irradiance leading to overesti-mations (Sathyendranath 2000).
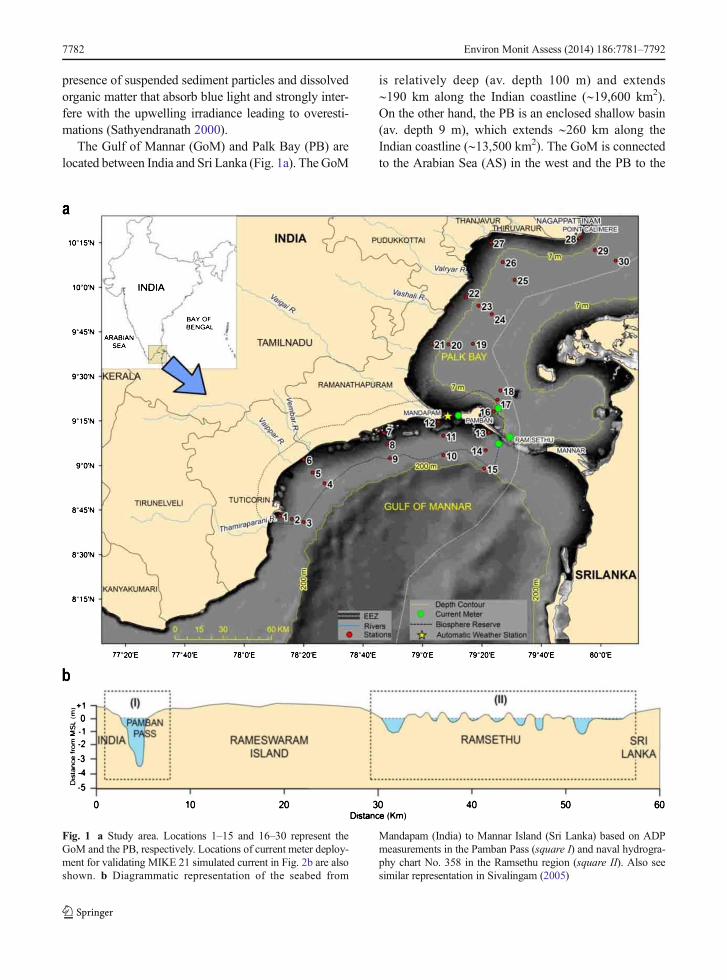
The Gulf of Mannar (GoM) and Palk Bay (PB) arelocated between India and Sri Lanka (Fig. 1a). The GoM
is relatively deep (av. depth 100 m) and extends∼190 km along the Indian coastline (∼19,600 km2).On the other hand, the PB is an enclosed shallow basin(av. depth 9 m), which extends ∼260 km along theIndian coastline (∼13,500 km2). The GoM is connectedto the Arabian Sea (AS) in the west and the PB to the
Fig. 1 a Study area. Locations 1–15 and 16–30 represent theGoM and the PB, respectively. Locations of current meter deploy-ment for validating MIKE 21 simulated current in Fig. 2b are alsoshown. b Diagrammatic representation of the seabed from
Mandapam (India) to Mannar Island (Sri Lanka) based on ADPmeasurements in the Pamban Pass (square I) and naval hydrogra-phy chart No. 358 in the Ramsethu region (square II). Also seesimilar representation in Sivalingam (2005)
7782 Environ Monit Assess (2014) 186:7781–7792
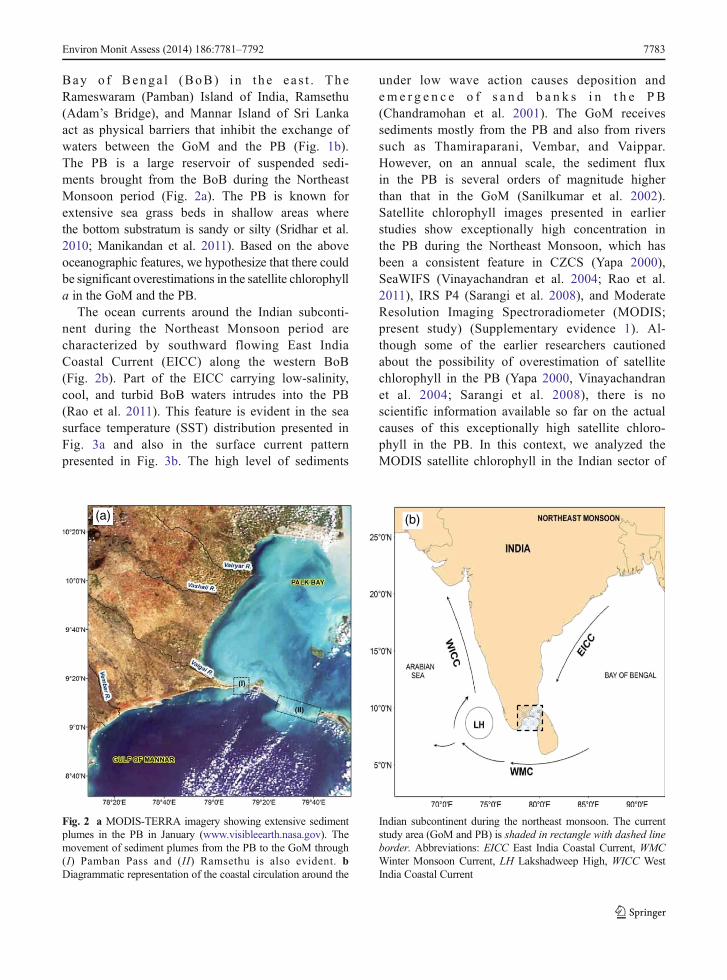
Bay o f Benga l (BoB) in t he e a s t . TheRameswaram (Pamban) Island of India, Ramsethu(Adam’s Bridge), and Mannar Island of Sri Lankaact as physical barriers that inhibit the exchange ofwaters between the GoM and the PB (Fig. 1b).The PB is a large reservoir of suspended sedi-ments brought from the BoB during the NortheastMonsoon period (Fig. 2a). The PB is known forextensive sea grass beds in shallow areas wherethe bottom substratum is sandy or silty (Sridhar et al.2010; Manikandan et al. 2011). Based on the aboveoceanographic features, we hypothesize that there couldbe significant overestimations in the satellite chlorophylla in the GoM and the PB.
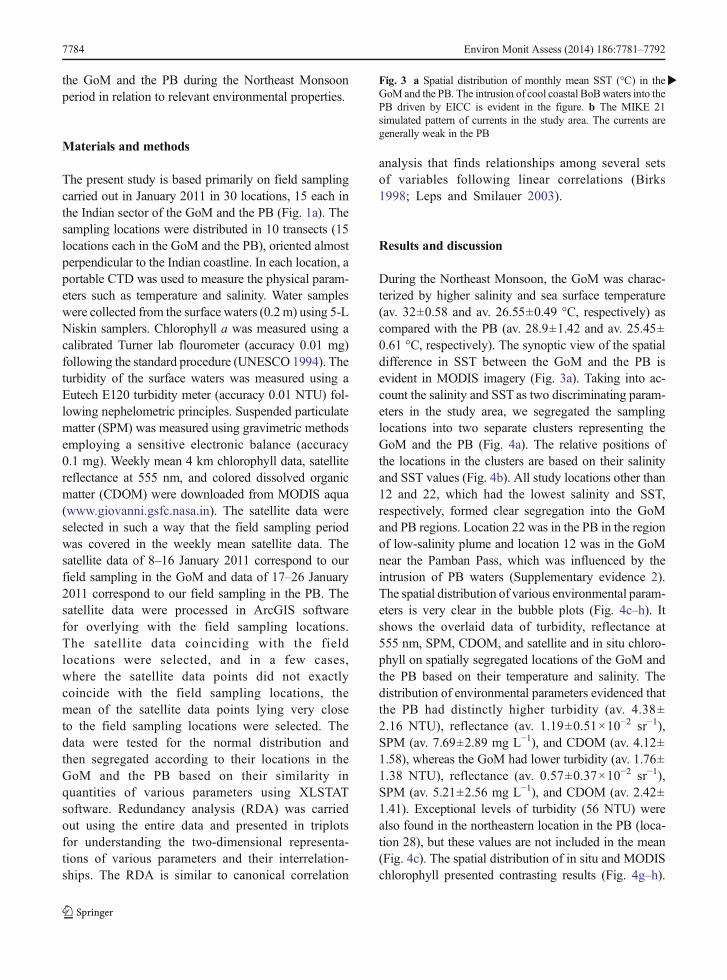
The ocean currents around the Indian subconti-nent during the Northeast Monsoon period arecharacterized by southward flowing East IndiaCoastal Current (EICC) along the western BoB(Fig. 2b). Part of the EICC carrying low-salinity,cool, and turbid BoB waters intrudes into the PB(Rao et al. 2011). This feature is evident in the seasurface temperature (SST) distribution presented inFig. 3a and also in the surface current patternpresented in Fig. 3b. The high level of sediments
under low wave action causes deposition andem e r g e n c e o f s a n d b a n k s i n t h e P B(Chandramohan et al. 2001). The GoM receivessediments mostly from the PB and also from riverssuch as Thamiraparani, Vembar, and Vaippar.However, on an annual scale, the sediment fluxin the PB is several orders of magnitude higherthan that in the GoM (Sanilkumar et al. 2002).Satellite chlorophyll images presented in earlierstudies show exceptionally high concentration inthe PB during the Northeast Monsoon, which hasbeen a consistent feature in CZCS (Yapa 2000),SeaWIFS (Vinayachandran et al. 2004; Rao et al.2011), IRS P4 (Sarangi et al. 2008), and ModerateResolution Imaging Spectroradiometer (MODIS;present study) (Supplementary evidence 1). Al-though some of the earlier researchers cautionedabout the possibility of overestimation of satellitechlorophyll in the PB (Yapa 2000, Vinayachandranet al. 2004; Sarangi et al. 2008), there is noscientific information available so far on the actualcauses of this exceptionally high satellite chloro-phyll in the PB. In this context, we analyzed theMODIS satellite chlorophyll in the Indian sector of
(b) (a)
Fig. 2 a MODIS-TERRA imagery showing extensive sedimentplumes in the PB in January (www.visibleearth.nasa.gov). Themovement of sediment plumes from the PB to the GoM through(I) Pamban Pass and (II) Ramsethu is also evident. bDiagrammatic representation of the coastal circulation around the
Indian subcontinent during the northeast monsoon. The currentstudy area (GoM and PB) is shaded in rectangle with dashed lineborder. Abbreviations: EICC East India Coastal Current, WMCWinter Monsoon Current, LH Lakshadweep High, WICC WestIndia Coastal Current
Environ Monit Assess (2014) 186:7781–7792 7783
the GoM and the PB during the Northeast Monsoonperiod in relation to relevant environmental properties.
Materials and methods
The present study is based primarily on field samplingcarried out in January 2011 in 30 locations, 15 each inthe Indian sector of the GoM and the PB (Fig. 1a). Thesampling locations were distributed in 10 transects (15locations each in the GoM and the PB), oriented almostperpendicular to the Indian coastline. In each location, aportable CTD was used to measure the physical param-eters such as temperature and salinity. Water sampleswere collected from the surface waters (0.2m) using 5-LNiskin samplers. Chlorophyll a was measured using acalibrated Turner lab flourometer (accuracy 0.01 mg)following the standard procedure (UNESCO 1994). Theturbidity of the surface waters was measured using aEutech E120 turbidity meter (accuracy 0.01 NTU) fol-lowing nephelometric principles. Suspended particulatematter (SPM) was measured using gravimetric methodsemploying a sensitive electronic balance (accuracy0.1 mg). Weekly mean 4 km chlorophyll data, satellitereflectance at 555 nm, and colored dissolved organicmatter (CDOM) were downloaded from MODIS aqua(www.giovanni.gsfc.nasa.in). The satellite data wereselected in such a way that the field sampling periodwas covered in the weekly mean satellite data. Thesatellite data of 8–16 January 2011 correspond to ourfield sampling in the GoM and data of 17–26 January2011 correspond to our field sampling in the PB. Thesatellite data were processed in ArcGIS softwarefor overlying with the field sampling locations.The satellite data coinciding with the fieldlocations were selected, and in a few cases,where the satellite data points did not exactlycoincide with the field sampling locations, themean of the satellite data points lying very closeto the field sampling locations were selected. Thedata were tested for the normal distribution andthen segregated according to their locations in theGoM and the PB based on their similarity inquantities of various parameters using XLSTATsoftware. Redundancy analysis (RDA) was carriedout using the entire data and presented in triplotsfor understanding the two-dimensional representa-tions of various parameters and their interrelation-ships. The RDA is similar to canonical correlation
analysis that finds relationships among several setsof variables following linear correlations (Birks1998; Leps and Smilauer 2003).
Results and discussion
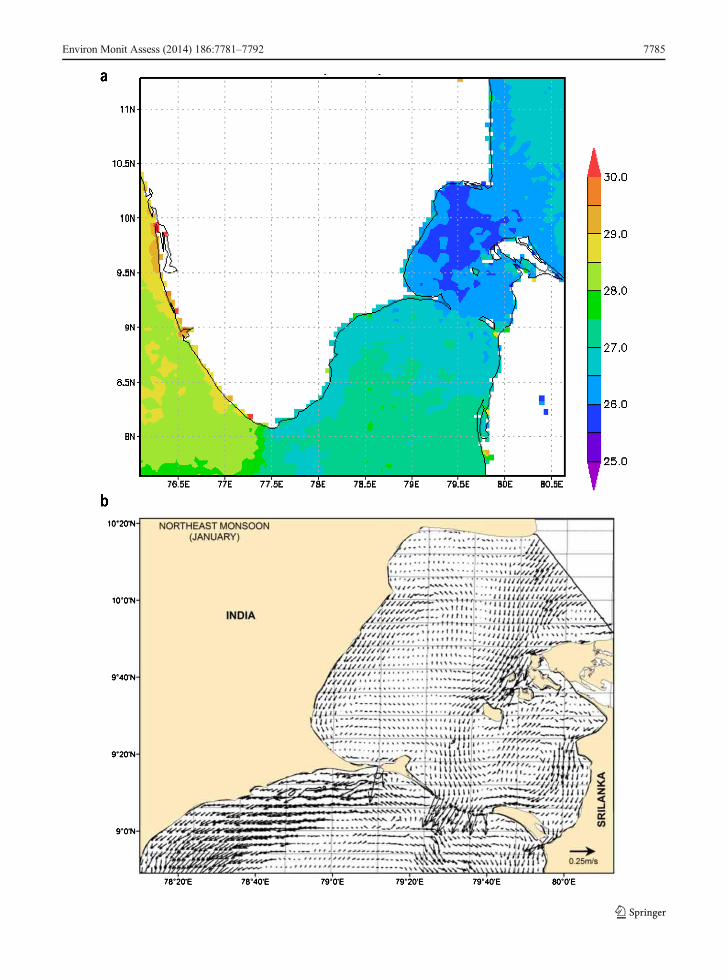
During the Northeast Monsoon, the GoM was charac-terized by higher salinity and sea surface temperature(av. 32±0.58 and av. 26.55±0.49 °C, respectively) ascompared with the PB (av. 28.9±1.42 and av. 25.45±0.61 °C, respectively). The synoptic view of the spatialdifference in SST between the GoM and the PB isevident in MODIS imagery (Fig. 3a). Taking into ac-count the salinity and SST as two discriminating param-eters in the study area, we segregated the samplinglocations into two separate clusters representing theGoM and the PB (Fig. 4a). The relative positions ofthe locations in the clusters are based on their salinityand SST values (Fig. 4b). All study locations other than12 and 22, which had the lowest salinity and SST,respectively, formed clear segregation into the GoMand PB regions. Location 22 was in the PB in the regionof low-salinity plume and location 12 was in the GoMnear the Pamban Pass, which was influenced by theintrusion of PB waters (Supplementary evidence 2).The spatial distribution of various environmental param-eters is very clear in the bubble plots (Fig. 4c–h). Itshows the overlaid data of turbidity, reflectance at555 nm, SPM, CDOM, and satellite and in situ chloro-phyll on spatially segregated locations of the GoM andthe PB based on their temperature and salinity. Thedistribution of environmental parameters evidenced thatthe PB had distinctly higher turbidity (av. 4.38±2.16 NTU), reflectance (av. 1.19±0.51×10⁻² sr−1),SPM (av. 7.69±2.89 mg L−1), and CDOM (av. 4.12±1.58), whereas the GoM had lower turbidity (av. 1.76±1.38 NTU), reflectance (av. 0.57±0.37×10⁻² sr−1),SPM (av. 5.21±2.56 mg L−1), and CDOM (av. 2.42±1.41). Exceptional levels of turbidity (56 NTU) werealso found in the northeastern location in the PB (loca-tion 28), but these values are not included in the mean(Fig. 4c). The spatial distribution of in situ and MODISchlorophyll presented contrasting results (Fig. 4g–h).
�Fig. 3 a Spatial distribution of monthly mean SST (°C) in theGoM and the PB. The intrusion of cool coastal BoBwaters into thePB driven by EICC is evident in the figure. b The MIKE 21simulated pattern of currents in the study area. The currents aregenerally weak in the PB
7784 Environ Monit Assess (2014) 186:7781–7792
Environ Monit Assess (2014) 186:7781–7792 7785
7786 Environ Monit Assess (2014) 186:7781–7792
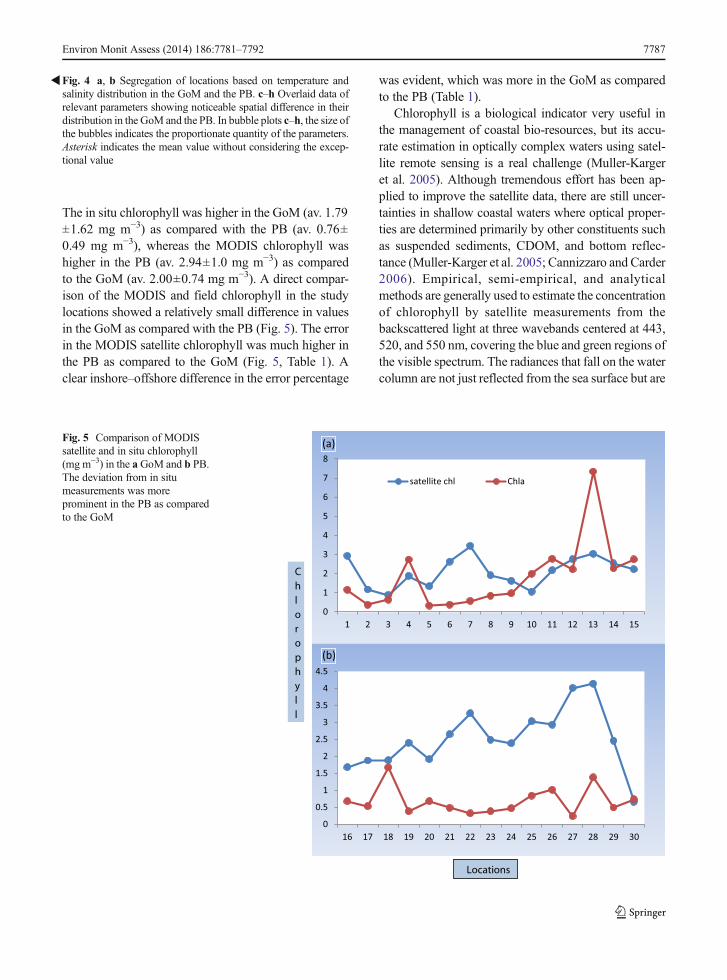
The in situ chlorophyll was higher in the GoM (av. 1.79±1.62 mg m−3) as compared with the PB (av. 0.76±0.49 mg m−3), whereas the MODIS chlorophyll washigher in the PB (av. 2.94±1.0 mg m−3) as comparedto the GoM (av. 2.00±0.74 mg m−3). A direct compar-ison of the MODIS and field chlorophyll in the studylocations showed a relatively small difference in valuesin the GoM as compared with the PB (Fig. 5). The errorin the MODIS satellite chlorophyll was much higher inthe PB as compared to the GoM (Fig. 5, Table 1). Aclear inshore–offshore difference in the error percentage
was evident, which was more in the GoM as comparedto the PB (Table 1).
Chlorophyll is a biological indicator very useful inthe management of coastal bio-resources, but its accu-rate estimation in optically complex waters using satel-lite remote sensing is a real challenge (Muller-Kargeret al. 2005). Although tremendous effort has been ap-plied to improve the satellite data, there are still uncer-tainties in shallow coastal waters where optical proper-ties are determined primarily by other constituents suchas suspended sediments, CDOM, and bottom reflec-tance (Muller-Karger et al. 2005; Cannizzaro and Carder2006). Empirical, semi-empirical, and analyticalmethods are generally used to estimate the concentrationof chlorophyll by satellite measurements from thebackscattered light at three wavebands centered at 443,520, and 550 nm, covering the blue and green regions ofthe visible spectrum. The radiances that fall on the watercolumn are not just reflected from the sea surface but are
0
1
2
3
4
5
6
7
8
1 2 3 4 5 6 7 8 9 10 11 12 13 14 15
0
0.5
1
1.5
2
2.5
3
3.5
4
4.5
16 17 18 19 20 21 22 23 24 25 26 27 28 29 30
(a)
(b)
Chlorophyll
Locations
satellite chl Chla
Fig. 5 Comparison of MODISsatellite and in situ chlorophyll(mg m−3) in the aGoM and b PB.The deviation from in situmeasurements was moreprominent in the PB as comparedto the GoM
�Fig. 4 a, b Segregation of locations based on temperature andsalinity distribution in the GoM and the PB. c–h Overlaid data ofrelevant parameters showing noticeable spatial difference in theirdistribution in the GoM and the PB. In bubble plots c–h, the size ofthe bubbles indicates the proportionate quantity of the parameters.Asterisk indicates the mean value without considering the excep-tional value
Environ Monit Assess (2014) 186:7781–7792 7787

also selectively absorbed, scattered, and reflected by thesuspended particles present in the water column andeventually backscatter to the atmosphere. Thisbackscattered light contains information leading to thequantitative estimates of chlorophyll present in the up-per few tens of meters in oceanic waters and a relativelyshallower layer in inshore waters. In optically shallowwaters, turbidity and shallow bottom can contribute tothe observed reflectance in the red region of the spec-trum (Muller-Karger et al. 2005; Cannizzaro and Carder2006). It has been shown that a small error in CDOMcan significantly affect the blue absorption and causelarge errors in satellite chlorophyll retrievals (Muller-Karger et al. 2005). In optically complex waters, bandratio algorithms often fail (Hu et al. 2003) and in suchcases semi-analytical algorithms provide better results(Carder et al. 1999; Lee et al. 1999). The accuracy ofsatellite chlorophyll data in optically complex coastalwaters can be improved further using regionally fine-tuned algorithms as the properties of case 2 waterssignificantly vary in space and time (Hu et al. 2003).This seems to be very relevant in the case of the presentstudy area, the GoM and the PB, where there are largespatial and seasonal differences in water column char-acteristics due to the peculiar geography and seasonallyreversing ocean currents (Rao et al. 2011; Jagadeesanet al. 2013). Therefore, it is important to derive opticalparameters required in models such as the spectral slopeof the CDOM absorption, particle backscattering, andbottom reflectance considering the local variability inthe GoM and the PB.
The results of multivariate RDA analysis are present-ed in triplots (Fig. 6) in which the relative directions ofthe environmental parameter arrows approximate theirlinear correlation. Arrows pointing in the same direction
correspond to variables having high positive correlation,whereas arrows of variables with a high negative corre-lation are oriented in opposite directions. The samplepoints are projected perpendicular to the arrows of en-vironmental variables, and this enables us to follow theapproximate order of samples in the increasing gradientof environmental variables when proceeding towardsthe arrow tip and beyond it. Before the triplot ordinationmodel is fitted, all parameters are centered and standard-ized, and therefore, the origin of the ordinate system(central point) corresponds to the average value of en-vironmental variables in that sample and the angle be-tween parameter arrows approximates their linear cor-relations. The Monte Carlo test carried out shows thatthe RDA triplot ordinations used in the present study aresignificant (F ratio 4.750; P=0.002). There is a clearsegregation of sampling locations into the GoM (left-hand side) and the PB (right-hand side) in the triplot.The field chlorophyll showed increasing gradients to-wards the left-hand side of the plot (GoM side), whereasthe satellite chlorophyll showed increasing gradientstowards the right-hand side of the plot (PB side). Thefield chlorophyll shows a positive relationship withsalinity and temperature and depth, which clearly indi-cates that the higher values of these parameters werefound in the GoM region. The MODIS chlorophyllshowed a significant positive relationship with severalmutually interlinked parameters such as SPM, turbidity,reflectance, and CDOM, whereas it has a significantinverse relationship with SST, sea surface salinity(SSS), and depth (Fig. 6b). The MODIS reflectanceshows a significant positive relationship with turbidityand CDOM and a significant negative relationship withdepth. These indicate that CDOM, turbidity, and bottomreflectance have a significant influence on the MODIS
Table 1 The distribution of various significant parameters in the study area. The decrease in percentage error in satellite chlorophyll from coastalto offshore is evident in both GoM and PB regions. PB values are shown in italics to show high error percentage of satellite chlorophyll there
Region Depth (m) Turbidity(NTU)
SPM(mg L−1)
CDOM In situ chl.a (mg m−3)
Sat chl.a (mg m−3)
Meanerror (%)
Coastal (GoM) 5.64±2.34 2.02±1.45 7.08±3.0 3.53±2.30 2.33±2.89 2.95±0.31 21
Coastal (PB) 6.148±2.06 14.32±23.60 16.08±24.8 5.75±2.28 0.62±0.46 3.15±1.02 80
Near coastal (GoM) 13.64±2.02 1.22±0.51 3.87±2.29 2.63±1.18 1.31±1.14 1.82±0.57 28
Near coastal (PB) 9.88±2.15 3.68±1.79 8.4±3.15 3.49±0.95 0.62±0.24 2.33±0.44 73
Offshore (GoM) 22.68±6.14 1.27±0.43 4.72±1.30 1.23±0.81 1.81±0.98 1.53±0.56 18
Offshore (PB) 11.28±1.12 5.73±1.82 9.12±2.44 3.39±0.67 0.82±0.51 2.07±0.89 60
7788 Environ Monit Assess (2014) 186:7781–7792

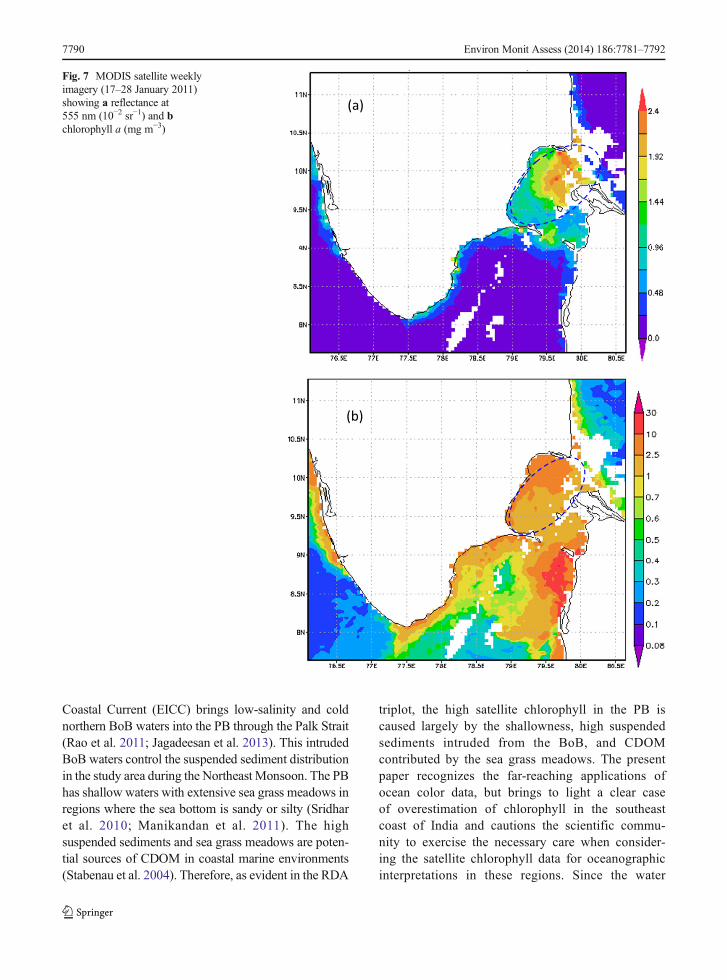
chlorophyll in the PB during the northeast mon-soon period. The spatial image of the MODISreflectance (555 nm) and chlorophyll in the PB matcheach other and thus strongly support the above observa-tion (Fig. 7).
MODIS is equipped with spectral bands specificallydesigned for measuring chlorophyll fluorescence rela-tive to a baseline (chlorophyll fluorescence line heightalgorithm) (Letelier and Abbott 1996). However, thisalgorithm has limitations due to the variation in chloro-phyll fluorescence efficiency in space and time (Muller-Karger et al. 2005). Therefore, fluorescence efficiencydata combined with other bio-optical algorithms derivedfrom regional oceanographic features could be a betteroption to improve MODIS chlorophyll data in the GoM
and the PB. Earlier validation effort for satellite data(IRS P4) in the GoM and the PBwas restrictedmostly tothe fair weather season (May) and/or based on verylimited field samples (Selvavinayagam et al.2003; Dey and Singh 2003). Therefore, earlierapproaches could not account properly for thespatial as well as seasonal hydrographic featuresof the GoM and the PB. This is particularly important inthe light of our recent understanding on the seasonalhydrography of the GoM and the PB (Rao et al. 2011;Jagadeesan et al. 2013).
Even though we have fairly clear understanding ofthe large-scale circulation around India and Sri Lanka,very little is known about the ocean currents in the GoMand the PB. Recent studies evidence that the East India
Fig. 6 a RDA triplot showing the interrelationship of field andsatellite chlorophyll with other hydrographic factors. Samplingstations are displayed by points, and environmental variables areshown by arrows. Abbreviations: SSS sea surface salinity, SST seasurface temperature, SPM suspended particulate matter, Refle
reflectance at 555 nm, CDOM colored dissolved organic matter.bCorrelation coefficient (R2) and significance between parametersprojected in the triplot as arrows. Bold numbers indicate a validsignificance (P<0.05)
Environ Monit Assess (2014) 186:7781–7792 7789
Coastal Current (EICC) brings low-salinity and coldnorthern BoB waters into the PB through the Palk Strait(Rao et al. 2011; Jagadeesan et al. 2013). This intrudedBoB waters control the suspended sediment distributionin the study area during the Northeast Monsoon. The PBhas shallow waters with extensive sea grass meadows inregions where the sea bottom is sandy or silty (Sridharet al. 2010; Manikandan et al. 2011). The highsuspended sediments and sea grass meadows are poten-tial sources of CDOM in coastal marine environments(Stabenau et al. 2004). Therefore, as evident in the RDA
triplot, the high satellite chlorophyll in the PB iscaused largely by the shallowness, high suspendedsediments intruded from the BoB, and CDOMcontributed by the sea grass meadows. The presentpaper recognizes the far-reaching applications ofocean color data, but brings to light a clear caseof overestimation of chlorophyll in the southeastcoast of India and cautions the scientific commu-nity to exercise the necessary care when consider-ing the satellite chlorophyll data for oceanographicinterpretations in these regions. Since the water
(b)
(a)
Fig. 7 MODIS satellite weeklyimagery (17–28 January 2011)showing a reflectance at555 nm (10−2 sr−1) and bchlorophyll a (mg m−3)
7790 Environ Monit Assess (2014) 186:7781–7792
column properties of the GoM and the PB change sig-nificantly during different seasons caused by the revers-ing ocean currents, it is our future interest to analyzehow these oceanographic features influence the satellitechlorophyll estimations during other seasons.
Acknowledgments The authors thank the Director, National In-stitute of Oceanography, India, for the facilities and encouragement.We thankfully acknowledge all our colleges in the National Instituteof Oceanography, India, who helped in carrying out the seasonalfieldwork in the GoM and the PB. The authors thank theMinistry ofShipping for the financial support. This work forms a part of theSupra Institutional Project (SIP) 1302 of the National Institute ofOceanography. This is NIO contribution 5625.
The first author thankfully acknowledge Dr. Trevor Platt andDr. Subha Sathyendranath, who taught him the far reaching appli-cations of satellite remote sensing in oceanography.
References
Birks, H. J. B. (1998). Numerical tools in palaeolimnology—progress, potentialities and problems. Journal ofPaleolimnology, 20, 307–332.
Cannizzaro, J. P., & Carder, K. L. (2006). Estimating chlorophyll aconcentrations from remote-sensing reflectance in opticallyshallow waters. Remote Sensing of Environment, 101, 13–24.
Carder, K. L., Chen, F. R., Lee, Z. P., Hawes, S. K., &Kamykowski, D. (1999). Semi-analytic moderate-resolutionimaging spectrometer algorithms for chlorophyll a and ab-sorption with bio-optical domains based on nitrate-depletiontemperatures. Journal of Geophysical Research, 104, 5403–5421.
Chandramohan, P., Jena, B. K., & Sanilkumar, V. (2001). Littoraldrift sources and sinks along the Indian coast. CurrentScience, 81, 292–297.
Dey, S., & Singh, R. P. (2003). Comparison of chlorophyll distri-butions in the northeastern Arabian Sea and southern Bay ofBengal using IRS-P4 Ocean Color Monitor data. RemoteSensing of Environment, 85, 424–428.
Dwivedi, R. M., Raman, M., Parab, S., Matondkar, S. G. P., &Nayak, S. (2006). Influence of northeasterly trade winds onintensity of winter bloom in the Northern Arabian Sea.Current Science, 90, 1397–1406.
Hu, C., Muller-Karger, F. E., Biggs, D. C., Carder, K. L., Nababan,B., Nadeau, D., & Vanderbloemen, J. (2003). Comparison ofship and satellite bio-optical measurements on the continentalmargin of the NE Gulf of Mexico. International Journal ofRemote Sensing, 24, 2597–2612.
Jagadeesan, L., Jyothibabu, R., Anjusha, A., Mohan, A. P.,Madhu, N. V., Muraleedharan, K. R., & Sudheesh, K.(2013). Ocean currents structuring the mesozooplankton inthe Gulf of Mannar and the Palk Bay, southeast coast ofIndia. Progress in Oceanography, 110, 27–48.
Jyothibabu, R., Madhu, N. V., Habeebrehman, H., Jayalakshmy,K. V., Nair, K. K. C., & Achuthankutty, C. T. (2010). Re-evaluation of paradox of mesozooplankton in the eastern
Arabian Sea based on ship and satellite observations.Journal of Marine Systems, 81, 235–251.
Lee, Z., Carder, K. L., Mobley, C. D., Steward, R. G., & Patch, J.S. (1999). Hyperspectral remote sensing for shallow waters.2. Deriving bottom depths and water properties by optimiza-tion. Applied Optics, 38, 3831–3843.
Leps, J., & Smilauer, P. (2003). Multivariate analysis of ecologicaldata using CANOCO. Cambridge University Press.
Letelier, R. M., & Abbott, M. R. (1996). An analysis of chloro-phyll fluorescence algorithms for the moderate resolutionimaging spectrometer (MODIS). Remote Sensing ofEnvironment, 58, 215–223.
Manikandan, S., Ganesapandian, S., & Parthipan, K. (2011).Distribution and zonation of seagrass in the Palk Bay,Southeastern India. Journal of Fisheries and AquaticScience, 6, 178–185.
Morel, A., & Prieur, L. (1977). Analysis of variations in oceancolor. Limnology and Oceanography, 22, 709–722.
Muller-Karger, F. E., Hu, C., Andrefouet, S., Varela, R., &Thunnel, R. (2005). The colour of the coastal ocean andapplications in the solution of research and managementproblems. In L. R. Miller, C. E. Del Castillo, & B. A.Mckee (Eds.), Remote sensing of coastal aquatic environ-ments: technologies and applications. Netherlands: Springer.
Prieur, L., & Sathyendranath, S. (1981). An optical classificationof coastal and oceanic waters based on the specific spectralabsorption curves of phytoplankton pigments, dissolved or-ganic matter, and other particulate materials. Limnology andOceanography, 26, 671–689.
Rao, R. R., Girishkumar, M. S., Ravichandran, M.,Gopalakrishna, V. V., & Thadathil, P. (2011). Do cold,low salinity waters pass through the Indo-Sri Lanka channelduring winter? International Journal of Remote Sensing,32, 7383–7398.
Sanilkumar, V., Anand, N. M., & Gowthaman, R. (2002).Variations in nearshore processes along the Nagapattinamcoast, India. Current Science, 82, 1381–1389.
Sarangi, R. K., Naik, S., & Panigrahy, R. C. (2008). Monthlyvariability of chlorophyll and associated physical parametersin the southwest Bay of Bengal water using remote sensingdata. Indian Journal of Marine Science, 37, 256–266.
Sathyendranath, S. (2000). Remote sensing of ocean colour incoastal and other optically complex waters. In M. J.Bowman & B. Zeitschel (Eds.), Report of the InternationalOcean Colour Coordinating Group (p. 145). Dartmouth:Mooers Springer Verlag.
Sathyendranath, S., Prieur, L., & Morel, A. (1989). A three com-ponent model of ocean colour and its application of remotesensing of phytoplankton pigments in coastal waters.International Journal of Remote Sensing, 10, 1373–1394.
Selvavinayagam, K., Surendran, A., & Ramachandran, S. (2003).Quantitative study on chlorophyll using IRS-P4 OCMdata ofTuticorin coastal waters. Journal of the Indian Society ofRemote Sensing, 31, 227–235.
Sivalingam, S. (2005). General Pattern of fisheries potential ofPalk Bay, Palk Strait and its environs. Journal of the NationalScience Foundation of Sri Lanka, 33(4):225–234
Sridhar, R., Thangaradjou, T., & Kannan, L. (2010). Spatial andtemporal variations in phytoplankton in coral reef andseagrass ecosystems of the Palk Bay, southeast coast ofIndia. Journal of Environmental Biology, 31, 765–777.
Environ Monit Assess (2014) 186:7781–7792 7791
Stabenau, E. R., Zepp, R. G., Bartels, E., & Zika, R. G. (2004).Role of the seagrass Thalassia testudinum as a source ofchromophoric dissolved organic matter in coastal southFlorida. Marine Ecology Progress Series, 282, 59–72.
UNESCO. (1994). Protocols for the Joint Global Ocean FluxStudy (JGOFS). Core Measurements, IOC Manuals andGuides (p. 170). Paris: UNESCO.
Vinayachandran, P. N., Chauhan, P., Mohan, M., & NAyak, S.(2004). Biological response of the sea around Sri Lanka toSummer Monsoon. Geophysical Research Letters, 311,L01302.
Yapa, K.K.A.S., 2000. Seasonal variability of sea surface chlorophylla of waters around Sri Lanka, Proceedings of Indian Academyof Sciences (Earth Planetery Sciences), 109, 427–432
7792 Environ Monit Assess (2014) 186:7781–7792