Occupational Structure and Level of Economic Development ...
281
CENSUS OF INDIA 1961 MONOGRAPH SERIES MONOGRAPH NO.4 OCCUPATIONAL STRUCTURE AND LEVEL OF ECONOMIC DEVELOPMENT IN INDIA A REGIONAL ANALYSIS by JOSEPH E. SCHWARTZBERG ASSOCIATE PROFESSOR OF GEOGRAPHY UNIVERSITY OF MINNESOTA. U. S. A. OFFICE OF THE REGISTRAR GENERAL, INDIA l'1INISTRY OF HOME AFFAIRS NEW DELHI-II
-
Upload
khangminh22 -
Category
Documents
-
view
0 -
download
0
Transcript of Occupational Structure and Level of Economic Development ...
CENSUS OF INDIA 1961
MONOGRAPH SERIES
MONOGRAPH NO.4
OCCUPATIONAL STRUCTURE AND LEVEL OF ECONOMIC DEVELOPMENT IN INDIA
A REGIONAL ANALYSIS
by
JOSEPH E. SCHWARTZBERG
ASSOCIATE PROFESSOR OF GEOGRAPHY UNIVERSITY OF MINNESOTA. U. S. A.
OFFICE OF THE REGISTRAR GENERAL, INDIA l'1INISTRY OF HOME AFFAIRS
NEW DELHI-II

PREFACE
This study based on a year's field work in India in 1958-59 and on an an·alysis of the occupational data of the Indian Census of 1951, is a slightly abridged and revised version of my doctoral dissertation in Geography, submitted in 1960 under the same title to the Graduate School of the University of Wisconsin. Although I have greatly extended my field work since that date and have, or will soon have available , a considerable additional body of data from the Census of 1961, it is felt both by the Registrar General and myself that presentation of the work now, essentially in its original form, will serve a useful purpose. * To hold off publication until my more recent field work is thoroughly processed and digested and until the voluminous 1961 Census data are made available and similarly treated, would be to delay for several years tbe presentation of the findings of this work to an Indian audience. Where it' felt that the findings would be greatly altered by a delayed and more extensively revised c~ition, it would, of course, be advisable .. But such is not the case.
My debts as an author are many and gladly acknowledged. From·a financial point of vlew, the study would not have been possible without the generous support of the Social Science Research Council, both -during the year of field work and during the subsequent year at the University of Wisconsin. (It will not be amiss here to thank also the American [nstitute of Indian Studies which permitted the continuation of my field work in 1962-63.
The number of individuals to whom I am indebted is legion. Thanks are due to my respondents in some two hundred Tndian villages who answered my questions with patience and dignity; to the government serva'nts in the Community Development
Blocks and other agencies serving rural India, who shared with me their knowledge of the Indian countryside; to all those individuals whose unstintin'g bospitality eased the physical and mental strain of field work; to Asok Mitra, Registrar General and ex-officio Census Commissioner for India, who guided and encouraged me in the preparation of this work in its present form; to the Sraff of the Delhi School of Economics, University of Delhi, and, in particular, to Drs. B. N. qanguli (the Director, and my official advisor) and Ashish Bose (my unofficial advisor); to a host of additional scholars and government workers, both Indian and American, scatter· ed throughout India, who, personally and as representatives of various organizations, rendered a variety of counsel and aid; and, finally, to my two interpreters, Chaman Singh Tonwer and Subramanyam Mahadevan, who shared with me tbe joys and rigors of field work-to Chaman, in particular, who taught me so much about village life and suffered so much, for what he considered "our work", lowe a debt of gratitude.
My gratitude is extended also to the large number of individuals in America, both teachers and assistants, who helped this study on its way to completion in its original form. To Dr. Richard Hartshorne, my major professor and thesis advisor, lowe special thanks, not only for his constant inspiration, his geniality, and his kindly, yet incisive, criticism, but also for never having dissuaded mc from undertaking a tasle which others thought unmanageable.
For whatever errors may remain in the present work, I alone take fun responsi-bility.
Joseph E. Schwartzberg Philadelphia, Pennsylvania October, 1963 .
• Copies of the study as originally presented mlly be ordered from University Microfilms, Jnc., Ann Arbor, Michigan, U.S.A. A microfilm copy is available for $9.15; a xerox cC'py (pllge size 6r x 91") for $32.50
Payment in rupee equivalents is accepted.

PREFACl:
LIST OF TABLES
LIST Of GRAI'llS
LIST OF MAPS
CHAPTERS
1. INTRODUCTION
Nature and Scnpe
Organization .
CONTENTS
v
vi
vii-viii
1-2
'II, REGIONAL VARIATIONS IN THE LEVEL OF ECONOMIC DEVELOPMENT. 3-14
General, 3
The Development Index Appronch 3
The Subjective Integration Approach . 10
Comparison and Evaluation of the two Approaches 14
I II. AN ANALYSIS OF THE OFFICIAL OCCUPATIONAL STATISTICS, ALL-INDIA OVERVIEW 15-27
General . IS
TheOccupational Structure of India in 1951 IS
The Present All-:ndia Occupational Structure:in relation to those of Other Countries and of the Past within India itself. . . . . . . . . ., 21
tv. AN ANALYSIS OF THE OFFICIAL OCCUPATIONAL STATISTICS: REGIONAL ANALYSIS 29->6 General. 29
Reliability and Comparability of the Statistics 29
The Agricultural versus the Non-Agricultural Population 42
Sub-divisions by Tenure Status within the Agricultural Population 48
Occupational Sub-divisions within the Non·Agricultural Population 59
The Three Main Economic Sectors 79
Relationships between Level of Economic Development and Oa;upational Stnlcture 87
V. LOCAL AN,ALYSES OF OCCUPATIONAL STRUCTURES 97-J89 Introduction . 97
Northern Bihar 103
Eastern Chota Nagpur I TO
Central Uttar Pradesh 12 I
Telangana 133
TamilNad 135
Deccan Lava Plateau 145
Ajmer 150
iii
Kerala . Central Saurashtra North Punjab Plain . Environs of Delhi. . Environs of Calcutta.
lV
VI. A COMPARATIVE ANALYSIS OF THE FIELD STUDY AREAS Introduction Factor~ Affecting Occupational Structure, Part One: Organic Factors.
The Ethnic composition of the Population Factors Affecting Occupational Structure, Part Two,: Dynam,ic Factors. Fa1tors Affecting Occupational Structure, Part Three: Summary . Ocaupatiopal Structure and Level of Economic Development A Critical Comparison of the Field Results and the Census Occupational Data
VII. A DYNAMIC, REGIONAL SYNTHESIS General: Factors Mapped and Mapping Method The Regional Pattern of the Map of Occupational Structure and Trends
VIII. CONCLUSIONS
APPENDICES
APPENQIX A: Basic Census Statistics of Population, Dependency Status, and
PAGES
157
165 J71
184 188
191-218
191
192
196 199
207
207
2J5
2 19-225
219 222
Occupationai Structure 23I-240
TABLE: 'Basic Population Data by Zone~, States and Census Natural Divisions . 232-234
2 Dependency Status of the Total Indian Population, Classified by Sex, Rural versus Urban Dis-. tribution and Agricultural versus Non-Agricultural Distribution .
3 Detailed Occupational Structure of the Total, Rural and Urban Populations ofIndia, 1951 4 Employmlmt in Processing and Manufacture in 190I and 1951
APPENDIX B: Standardised Scores of Selected Indices of Economic Development for Eighteen Regions of -India. .
I Structural Indices
II Productivity Indices' III Consumption and Welfare Indices IV Overall Scores
Sources and N~tes .
BIBLIOGRAPHY
U.N., GOVERNMENT AND QUASI-GOVERNMENT SOURCES (PUBLISHED) Census Materials . Periodicals, Yearbooks, Directories and Purely Statistical Works Reports at SpeCial Commissions Other Textual Works Atiases and Maps
OTHER PUBLISHED WORKS, EXCEPT FOR ARTICLES Dealing with Economic Development in General General Background Works on India Primarily Economic Works on India Primarily Cultural and/or Anthropological Works on India Other Works on India Miscellaneous
P LJBLlSHED ARTICLES Not Specifically Relating to India Specifically Relating to India
UNPUBLISHED MATERIALS •
240
242-243 244
245-246 247 248
249-267
250-252 250 250 251 251 252
253-259 253 254 255, 258 259 259
260-265 260 262
265-267
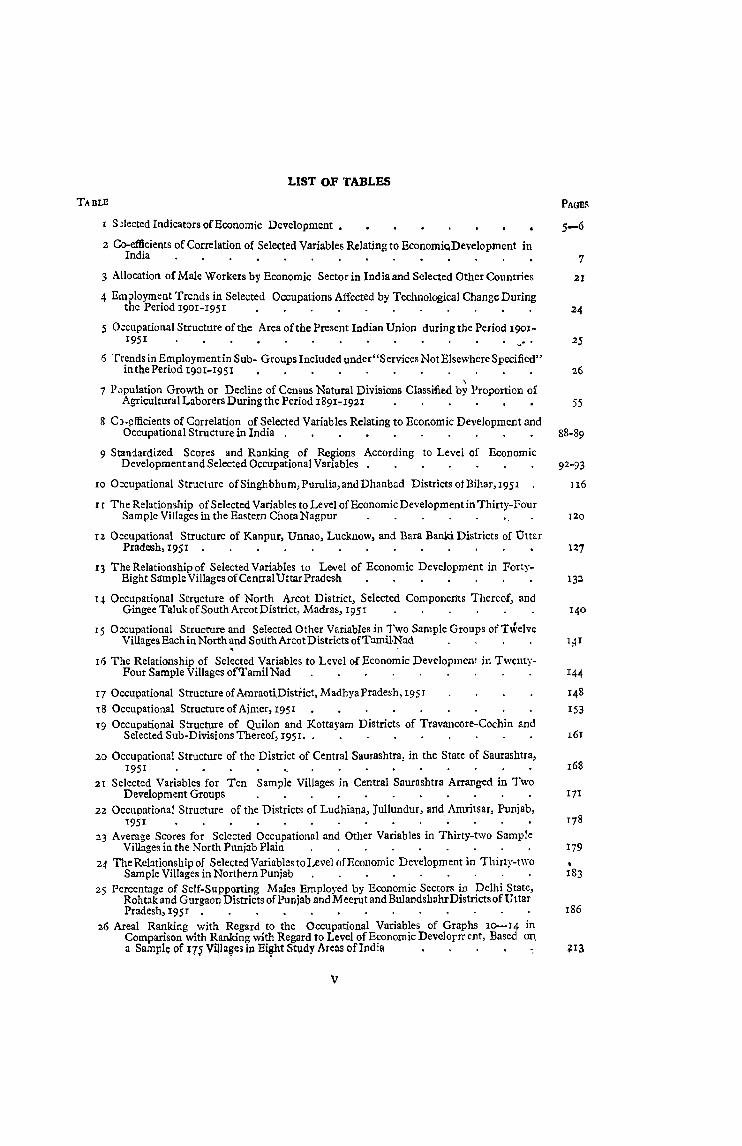
LIST OF TABLES
I S ~lected Indicators oCEconomic Development •
2 Co-efficients of Correlation of Selected Variables Relating to Economi~Developmcnt in India . • . • . . . • . • . . . •
3 Allocation of Male Workers by Economic Sector in India and Selected Other C<>untries
4 Em;>loyme.nt Trends in Selected Occupations Affected by Technological Change During the Penod 1901-1951 . . . . . . . . . • .
5 O;;cupational Structure of the Area of the Present Indian Union during the Period 19o1-1951 _
6 Trends in Employment in Sub- Groups Included under"Services Not Elsewhere Specified" in the Period 190I~I95I • . . . . . . . . . . ,
7 Pvpuiation Growth or Decline of Census Natural Divisions Classine<!. by Proportion of Agricultural Laborers During th e Period 1891 -1 92 I
8 C:>.l,!fficients of Correlation of Selected Variables Relating to Economic Development and Occupational Structure in India. • • • . . . . • •
9 Stan1ardized Scores and Ranking of Regions According to Level of Economic Development and Selected Occupational Variables •
10 Occupational Structure of Singhbhum, Purulia, and Dhanbad Districts of Bihar, 1951
II The Relationship of Selected Variables to Level of Economic Development in Thirty-Four Sample Villages in the Eastern Chota Nagpur "
I2 Occupational Structure of Kanpur, Unnao, Lucknow, and Bara Banki Districts of Dttar Pradesh,1951
13 The Relationship of Selected Variables to LeiVel of Economic Development in FortyEight Sample Villages of Central Uttar Pradesh
q Occupational Structure of North Arcot District, Selected Components Thereof, and Gingee Taluk of South Arcot District, Madras, 195 r
t 5 O::cupational Structure and Selected Other Varjables in Two Sample Groups of Twelve Villages Each in North ~nd South Areot Districts ofTamU·Nad . . . .
16 The Relationship of Selected Variables to Level of Economic DevclopmClll in Twenty-Four Sample Villages ofTamii Nad
I7 Occupational Structure of Amraoti,Distiict, MadhyaPradesh, 195 J
18 Occupational Structure of Ajmer, 1951 19 Occupational Structure of Quilon and Kottayam Districts of Travancore-Cochin and
Selected Sub-Divisions Thereof, 195I. .
20 Occupational Structure of the District of Central Saurashtra, in the State of Saurashtra, 1951
21 Selected Variables for Ten Sample Villages in Central Saurashtra Arranged in Two Development Groups
22 Occupational Structure of the Districts of Ludhiana, Jullundur, and Amritsar, Punjab, 1951
23 Average Scores for Selected Occupational and Other Variables in Thirty-two Sample Villages in the North PUnjab Plain
24 The Relationship of Selected Variables to Level of Economic Deyeiopment in Thirty-two Sample Villages in Northern Punjab
25 Percentage: of Self-Supporting Males Employed by Economic Sectors in Delhi State, Rohtak and Gurgaon Districts of Punjab and Meerut and Bulandsb3hr Districts of Uttar Pradesh,1951 •
26 Areal Ranking with Regard to the Occupational Variables of Graphs 10.-14 in Comparison with Ranking with Regard to Level of Econo!llic Develorrrent, Based ou a Sample of t7$ Villa~es in Ei~t Study Areas ofIndia
v
5-6
7
21
24
2$
26
55
88-89
92-93
JI6
J20
127
132
140
1:-(1
161
168
171
179
• 183
186
+13
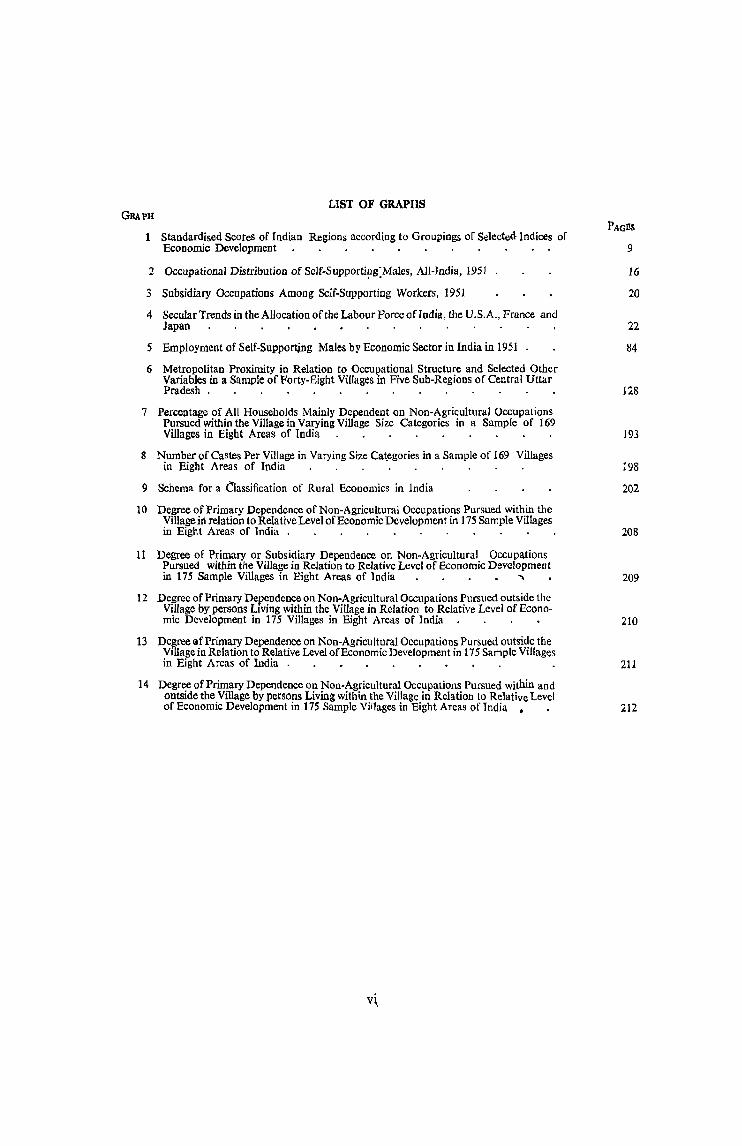
GRAPH LIST OF GRAPHS
Standardised ScoreS of Indian Regions according to Groupings of Selected- Indices of Economic Development
2 Occupational Distribution of Self-Supporti~g:Males, All-India, 1951
3 Subsidiary Occupations Among Self·Supporting Workers, 1951
4 Secular Trends in the Allocation of the Labour Force of India, the U.S.A., France and Japan
5 Employment of Self-Supportjng Males by Economic Sector in India in 1951 .
6 Metropolitan Proximity in Relation to Occupational Structure and Selected Other Variables in a Sample of Forty-Eight Villages in Five Sub-Regions of Central Uttar Pradesh.
7 Percentage of AU Households Mainly Dependent on Non-Agricultural Occupations Pursued within the Village in Varying Village Size Categories in a Sample of 169 Villages in Eight Areas of India
8 Number of Castes Per Village in Varying Size Categories in a Sample of 169 Villages in Eight Areas of India
9 Schema for a Classification of Rural Economics in India
10 Degree of Primary Dependence of Non-Agricultural Occupations Pursued within the ViIlageirl relation to Relative Level of Economic Development in 175 Sample Villages in Eight Areas of lndia .
II Degree of Primary or Subsidiary Dependence on Non-Agricultural Occupations Pursued within the Village in Relation to Relative Level of Economic Development in 175 Sample Villages in Eight Areas of India ~
12 Degree of Primary Dependence on Non-Agricultural Occupations Pursued outside the Village by persons Living within the Village in Relation to Relative Level of Economic Development in 175 Villages in Eight Areas of India
13 Degree@fPrimaryDependence on Non-Agricultural Occupations Pursued outside the Village in Relation to Relative Level of Economic Development in 175 Sample Villages in Eight Areas of India .
14 Degree of Primary Dependence on Non-Agricultural Occupations Pursued within and outside the Village by persons Living within the Village in Relation to Relative Level of Economic Development in 175 Sample Villages in Eight A Teas of India •
9
16
20
22
84
128
J93
1\18
202
208
209
210
211
212
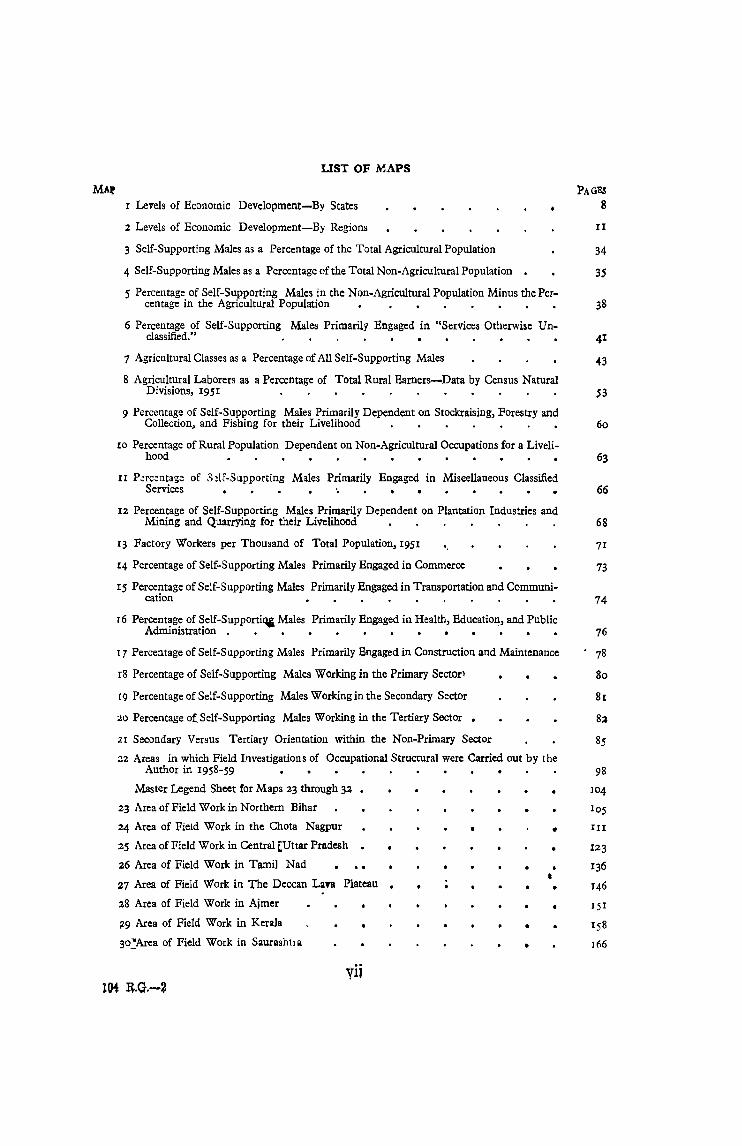
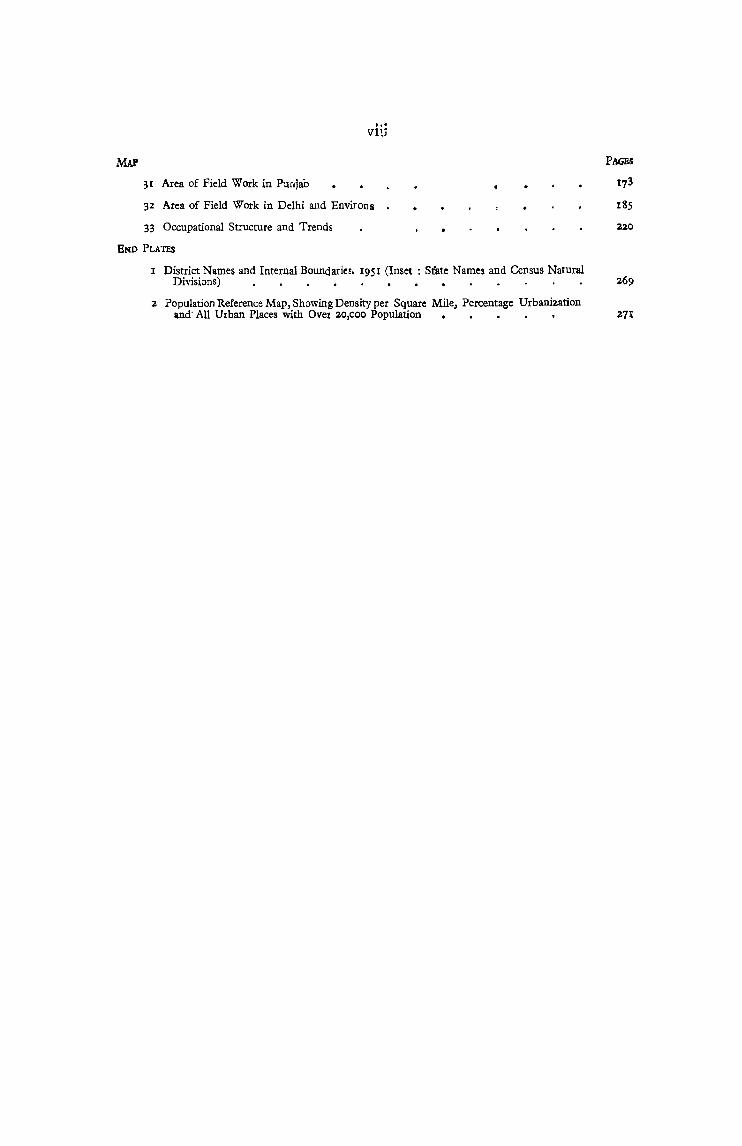
LIST OF M.APS
1 LeV'els of Economic Development-By States
2 Levels of Economic Development-By Regions II
3 Self-Supporting Males as a Percentage of the Total Agricultural Population 34
4 Self-Supporting Males as a Percentage of the Total Non-Agricultural Population , 35
5 Percentage of Self-Supporting Males in the Non-Agricultural Population Minus the Per-centage in the Agricultural Population 38
6 Percentage of Self-Supporting Males Primarily Engaged in "Services Otherwise Un-classified." 41
7 Agricultural Classes as a Percentage of All Self-Supporting Males 43
8 Agricultural Laborers as a Percentage of Total Rural Earners-Data by Census Natural Divisions, 1951 53
9 Percentage of Self-Supporting Males Primarily Dependent Cln Stockraising, Forestry and Collection, and Fishing for their Livelihood 60
10 Percentage of Rural Population Dependent on Non-Agricultural Occupations for a Liveli-hood 63
II P~rcentage of 3!lf-Sllpporting Males Primarily Engaged in Miseellaneous Classified ~~ ~
12 Percentage of Self-Supporting Males Primarily Dependent on Plantation Industries and Mining and Quarrying for their Livelihood 68
13 Factory Workers per Thousand of Total Population,I9S1 '. 71
14 Percentage of Self-Supporting Males Primarily Engaged in Commerce 73
15 Percentage of Self-Supporting Males Primarily Engaged in Transportation and Communi-cation 74
r6 Percentage of Self-SupportiQ£ Males Primarily Engaged in Health, Education, and Public Administration. , , , , , , , • • " •• 76
17 Percentage of Self-Supporting Males Primarily Engaged in Construction and Maintenance • 78
IS Percentage of Self-Supporting Males Working in the Primary Sector l 80
(9 Percentage of Self-Supporting Males Working in the Secondary Sector 8 I
20 Percentage of. Self-Supporting Males Working in the Tertiary Sector • 83
21 Secondary Versus Tertiary Orientation within the Non-Primary Sector 8S
22 Areas in which Field Investigations of Occupational Structural were Carried out by the Author in 1958-59 98
Master Legend Sheet for Maps 23 through 32 • 104
23 Area ofField Work in Northern Bihar lOS
24 Area of Field Work in the Chota Nagpur
25 Area of Field Work in Central ~Uttar Pradesh •
26 Area of Field Work in Tamil Nad
27 Area of Field Work in The Deccan LaTa Plateau
28 Area of Field Work in Ajmer
~9 Area of Field Work in Kerala
3o_:Area of Field Work in Saurashtla
vii lOi R.G.-~
• III
• •
•
.. ' iTW
31 Area of Field Work in Punjab
32 Area of Field Work in Delhi and Environs
33 Occupational Structure and Trends
END PLATES
220
1 District Names and Internal Boundariee. 1951 (Inset: State Names and Census Natural Divisions) 269
2 Population Reference Map, Showing Density per Square Mile, Percentage Urbanization and' All Urban Places with Ovez 20,COO Population • • • ., 27I
CHAPTER I
INTRODUCTION
Nature and Scope
Much has'already been written about the occupational structure of India. Yet our knowledge of that subject remains far from adequate: There are several reasons for this. First, bec'ause the available studies are ?as~d primarily on the Census, which, despIte ltS monumental worth, embodiesat least until 1951-various shortcomings in the economic sphere and because those shortcomings, especially those relating to the regional comparability of the results, are imperfectly apprehended by Census users. Second, because, for reasons of public and social policy, the relationship between caste and occupation, still a fundamental one in modern India, can no longer be a subject for general Census investigation. Third, because the pattern of relationship between occupational structure and level of economic development at both the regional and the village level has not been fully or systematically explored. Fourth. because the basic data of the Census were not supplemented by and checked against a body of detailed, comparative, uniformly executed field studies carried on by competent social scientists in a variety of regions and socia-economic contexts.
It is felt, in light of these remarks, that the present study, based both on a detailed cartographic analysis of the occupational data of the 1951 Census and on the author's field investigations in 1958-59 in 198 ",illages in twelve widely scattered and widely differing regions, makes a fundamental contribution to our knowledge of India's occupational structure. It deals more exhaustively than any other document with the nature and probable magnitude of regional bias in the reporting of occupational data. It treats occupation in the context of cas,te and the Hindu ;a;mani system
of village socia-economic organization, the regional variations in which have still received all too little study. Finally, and most important, it considers occupational structure as a function of economic development at the state level, at the regional level, and at the village level wi,thin a particular region. Incidentally, it throws much empirical light on the theoretical arguments of Colin Clark, Simon Kuzentz and others concerning the relationship of the size of the several occupational sectors to the level of economic development of a particular region and even questions the applicability of the classical primary-secondary-tertiary method of sectoral anal}sis to the Indian economy.
Organization
The organization of the work is briefly as follows:
In Chapter II are discussed the regional variations in the level of economic develop- . ment within India, against the background of which the occupational structure will subsequently be viewed. Two maps showing levels of economic development are provided, one plotted quantitatively by states, the second non-quantitatively, but more realistically, it is felt, on an ad hoc regional basis. Chapters III and IV pro~ vide a deailed analysis of the Indian statistics dealing with occupational structure. Chapter III, rather briefly, considers India as whole, analytically comparing the 1951 occupational structure with those of previous decades and with the patterns found in selected other countries. Chapter IV is regional in approach. It commences with a lengthy discussion of the reliability and suitabil'ity of the 1951 Census for interregional comparisons, particularly for' the population of "self-supporting male workers". Subsequently, various occupational sectors are individually analyze(l and

the ratio between the broad secondary and tertiary sectors is discussed. Finally, the c11ap~er examines such correlations as appear to exist between the occupational data and the data on level of economic development brought out in Chapter II.
The principal findings of the field work are presented in Chapter V. The types of information obtainable only from the field are indicated and the methodology guiding the field work and the ordering' and presentation of the results is outlined. Each of the field areas is then examined, commencing with the regions lowest in general level of development and advancing up the development ladder to the highest. For each area the problem which prompted its selection for Investigation is stated and the salient cultural and physical characteristics are briefly described. The bulk of the discussion relates, of course, to the occupational structure, with due regard to such intra-regional differences as may exist. The concluding paragraphs of each regional discussion deal with the relationships of occupational structure to level of economic development on an intra-regional basis.
Chapter VI offers a comparative analysis of the areas studies in the field' and a series of gene~al conclusions based thereon, discussing first what ate termed llhe organic factors. i.e., the considerations arising from
the relatively stable aspects of the local situation, especially matters of spatial distribution and the composition of the popula tion, and secondly, the dynamic factors, i.e.~ the changes stemming from· and factors making for economic growth. The intraand inter-regional relationships between occupational structure and overall level of economic development are then examined. Finally, the author's field data and those of the Census for the same areas are critically compared.
The main object of Chapter VII is to present and explain a map which provides an original, dynamiC, regional synthesis of the occupatiomil structure and trends of India. A summary description of the regional pattern forms the bulk of the chapter.
Chapter VIII presents a brief resume of the principal conclusions of the study and considers the implications thereof.
Two appendices follow the text· The first of these is a summary, for the nation as a whole and by states and natural census divisions, of some of the more important population and occupational statistics of the 1951 Census. The second is a tabulation of data for thirty-two selected indicators of economic development.
CHAPTER 11
REGIONAL VBRIATIONS IN THE LEVEL OF ECONOMIC DEVELOPMENT
General
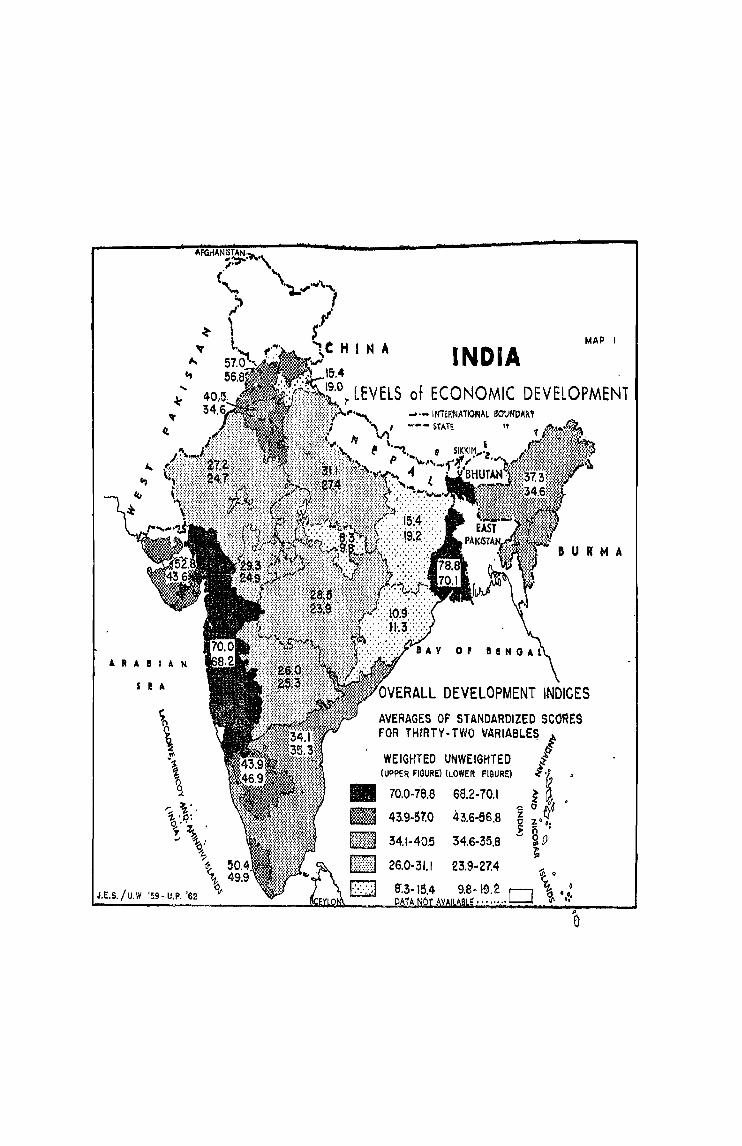
Since economic development is a cumplex phenomenon, it follows that no single yard<,tick can be used to measure it. Some yardsticks, to be sure, may be better than others, per capita income, for example; but it is obvious-to the author at any rate-that, for areas of the world as large as India, any attempt at making meaningful' inter-regional comparisons of levels of economic development calls for an approach which entails consideration of a wide range of relevant variables. In this chapter two maps of levels of economic development in India are presented, each of which is 'a synthesis of any factors. But the methods of synthesis and hence, the results are quite different, though complementary. The first map combines thirty-one indices of economic deVelopment for which state data were available into a series of composite development scores by states. The second, more or less subjectively and non-quantitatively, integrates for a set of regions, divided more finely than at the state level, the most relevant state and district data available. Each map has its advantages and its drawbacks. But both are essential in proviciing a background for the regional analysis of India's occupational structure, which is the principal concern of thIS study.
The Development Index Approach
For purposes of analysis the level of . economic development of a given area may be considered as having two fundamental aspects. On the one hand it entails the way in which a society js organized to produce--in order ultimately to consume--and on the other it involves the efficiency of that
3
organization, as measured by the volume of goods and services produced-and ulti·· mately consumed. Both these aspects of development are, in tum, susceptible of further analysis.
The organization of society refers not only to the accumulated economic inlrastructure: railroad nets, school systemS', stock exchanges, rural credit co-operatives and the like, but also to a set of beliefs and attitudes on the part of its members. Beliefs and attitudes that seem to go with economic development include the notion that one's lot in this world is largely what he makes it rather than the result of one's merit or misdeeds in previous existences (Karma, in the Indian view) or some other form of predetermination, the desire to work beyond the level required for the mere satisfaction of essential physical needs, the willingness to take economic risks or to put money in long-term capital investments rather than engage in speculative commodity transactions, the commitment to an industrial way of life and so. forth. In short, the pattern of socio-economic organization itself has two aspects, one of which we shall call structural and the other of which we shall designate as attitudinal.
With regard to the efficiency of organization we are again confronted with a dichotomy: production forms one half of our concern, consumption or general welfare the other .
For three of the four sub-aspects of development, the structural sub-aspect, the subaspect of production, and the sub-aspect of consumption and general welfare the ~ri· , ter was able to gather state-wise data for a
Wide-ranging group of variables, thirty-one in all, each of which might be considered as a partial indicator or'index of development. These indices .are shown in table 11.
Only.one variable, per capita income, was included under two rubtics, as an indic~tor both .of production and of consumption and general welfare, because of the equality, by definition, of national income and national product. For the ,fourth sub-aspect, the attItudinal, the current state of knowledge is not sufficient t9 permit the formulation of comparable, quantitative state-wise data. Its inclusion in the agove discussion is therefore, purely of academic interest But the fact that it cannot be q~antified . in no way diminishes 'its importance or the need to recognize its logical place in the sche~a outlined. Having amassed the data, the problem which confronted the author was how to combine them to form a -set of over~ all state-wise development scores, i.e., how to combine such diverse statistical series as per capita income, degree of urbanization, density of transport network, etc.
In the solution offered below two operations were required. The,first was that of standardization, i.e., scaling the data according to some common standard, to arrive at comparable sets of scores or index numbers for each variable considered. The second operation was that of combining the scores
4
for each state of India either by simple or by weighted averaging of all the index numbers available {or that state. In standardizing· the data tabulated, a score of zero was assigned to the least favored region with respect to each variable and a score of one :hundred to the most favored.2 Intermediate scores were given to each of the remaining regions according to the arithmetic distance of its non-standardized :".;ore from the two extremes. Assume. for examp~e, that '5tate'5 A and B, with per capita incomes of 500 and 200 rupees respectively, were the most and the least favored in India and that a third ,~tate,
C, had an average per capita income of 275 rupees. Scoring 100 for state A and zero for state B and noting the difference of 300 rupees between the two, one would then assign a 'Score of 25 to state C, the difference of 75 rupees between its income and that of state B being 25 per cent of 300. The mean values were not used in the standardization of the scores. They are inserted in Table 1 for purposes of general information only.3
Although each of the three major headings of Table I was assumed to be of equal importance to the other two, the individual indices were not assumed to be on a par with one another. Accordingly, they were subjectively weighted, as shown in column 6. The assigned weights varied "from 1 to 3 in every case but one-per
1 In practice it was not always easy to d 'ct h . , . . the number of electricity consumers per tho eCI e t e headmg und~r whIch a partIcular variable best fits. Thu~ tion and welfare, while the per caPita consu~S~I_ld of total p.opulatIon was c~nsidered an indicator of consump." of productivity, the reason being that the greaf 10? ~f e}(fctlIcIt~ expressed.In kwh. was considered an indicator gation purposes Similarly the nUmbe f" maJonty 0 e ectnc consumptIon in lndia is for industrial and irri· ind!cator, while' the amount'of corpora(e ~abi~ni ~tock companies per.million people was considered a structural indicatbr of prOductivity. As a final illu t t~ Inilisted per thousand of total population was conaidered an rural population could not be considered ~ ~: ~on . e. av~rage annual food. production per capita of agriculof the existence of inter-state food shipments a ; Wlh~e IndlCa~Or of consumptIOn a~ well as of production because
r s Ipments Into or out of tpe nation as a whole 2 For the complete array of data see A d' B . '
vored and vice versa; but in the case of vari I ppe~, IX •• Nonnally the mrunmum score is the mosi farand III. I 3, "concentration ratio of 'landhold a? es"I.6
h, agnC':ltu_re laborers as percentage of rural population"
mg, t e OPPosIte If true. 3 One drawback of the above metho j of t d d' " .
ginal data. But the original data it must be ~ an ~ lZ~IOn IS trat It marks the ratio properties of the ori-text have little value in themsel~e~ Moreovemern ere are on y a~eaI_ls to an end and in the pres en t COllof ~he original data may be quite mi~leading tnse~t syste~ of sta.nd~rdI.z!ltIOn mai!1taining the. ratio properties varIes so gr~atly from one index to another C ar as } e margl~a utIlIty. of speclfic propornonal increments with one of 2,500 and an annual per capita .om.pare or examp.e. a dally per capita caloric intake of I 500 each case are indenticai, the sio-nificance of the I3~~:ne of $r,500 11th one of $ 2,500. The ratio properti~s in in the case of India, are the vm-iations u I erences ~r~ vast y different. What is important to deal with is »m~t aiw1I.1s closely approached in ~we arm do titrbom ,~he Intd mmum possible base for a variable economy which
sac" war states.
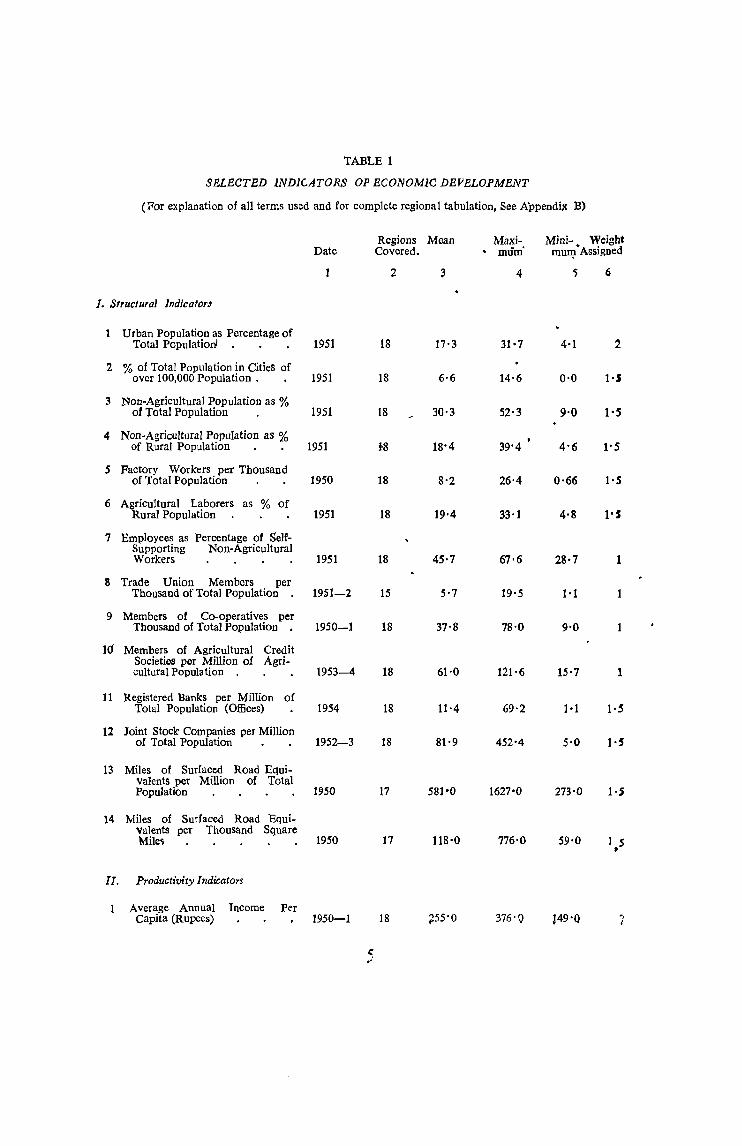
TABLE 1
SELECTED lNDlGATORS OF ECONOM1C DEVELOPMENT
(Por explanation of all terms used and for complete regional tabulation, See Appendix B)
Regions Mean Maxi- Mini- Weight Date Covered. . mum' mUll?' Assigned
2 3 4 '5 6
J. Structural Indicators
Urban Population as Percentage of Total Population' 1951 18 17'3 31·7 4·1 2
2 % of Total Population in Cities of over 100,000 Population. • 1951 18 6·6 14'6 0·0 l'S
3 Non-Agricultural Population as % of Total Population 1951 18 30'3 52'3 9'0 l'S
4 Non-Agricultural Population as % of Rural Population 1951 fo8 18'4 39'4 4'6 l'S
S Factory Workers per Thousand of Total Population 1950 18 8'2 26'4 0·66 1'5
6 Agricultural Laborers as % of Rural Population. . • 1951 18 19·4 33·1 4·8 l'S
7 Employees as Percentage of Self-Supporting Non-Agricultural Workers 1951 18 45·7 67·6 28·7 1
8 Trade Union Members per Thousand of Total Population 1951-2 15 5'7 19'5 1'1 1
9 Members of Co-operatives per Thousand of Total Population . 1950-1 18 37'8 78'0 9'0
1<1 Members of Agricultural Credit Societies per Million of Agri-
121'6 cultural Population 1953-4 18 61'0 15·7 1
11 Registered Banks per Million of Total Population (Offices) 1954 18 11·4 69'2 1-1 1·5
12 Joint Stock Companies per Million of Total Population 1952-3 18 81'9 452'4 5·0 l,S
13 Miles of Surfaced Road Equi-valents per Million of Total Population 1950 17 581'0 1627'0 273'0 I·S
14 Miles of Surfaced Road Equi-valents per Thousand Square Mile~ 1950 17 118'0 776'0 59'0 1 5
p
II. Productivity Indicators
Average Annual Income Per capita (Rupees) 1950-1 18 ~55'O 376'Q 149'0 ";
I
C ,,'

6
TABLE l--contd.
Region. Maxi~ Mini- Weight Date Covered Mean mum mum Assigned
1 2 3 4 5 6
l Average Annual Food Production Per capita of Agricultural Popu-lation (Lbs.) • • . • N.A. 18 415'0 620'0 177'0 2
3 Yield of Major Food Grain as Percentage of National Yield (per Acre) 1954-5 18 100·0 152·0 54'0 2
4 Value Added by Factofy Manufacture Per Capita of Total Population (Rupees) . 1949 12 9'4 31·6 0·22 3
5 Consumption of Electricity per Tbousar.d of Total Population (KWH) 1955 16 19'7 62·1 0·73 3
6 Corporate Capita Per Capita of Total Popu-lation (Rupees) . . . . . 1952-3 18 32·(j 131'2 0·25 3
lfl. Consumption and WelJare 1l1dicators
1 Average Annual Income Pl5r Capita (Rupees). 1950-1 18 255·0 376·0 149·0 5
2 Average Annual Wages per Factory Workers (Rupees)' 1949 13 1052·0 1330·0 344·0 1
3 Average Annual Wage per Agricultural Labor Family (Rupees) 1951 15 447'0 913'0 340·(j
4 Bln~ D"P:Hits Per Capita (Rupees) 1951 18 23'3 78'4 0'7 l' 5
5 State Revenues Per Capita (Rupees) 1950-1 16 11'3 19·2 6·6 2
6 Rural Education Expenditures Per Capita of Rural Population 1948-9 18 1·3 2'8 0·64
7 Male Literates as % of Total Male Population 1951 18 24·9 54·8 10'9 1'5
8 Matriculations or Equivalent Granted per Million of Total Population 1948-9 18 858'0 2088·0 150'0
9 Newspapers 'and Periodicals per Million of Total Population . . . . . 1952-3 18 18·2 46·3 2'5
10 Electric Consumers per thousand of Total Population . . 1956 16 7'0 19·6 0·8
lL Motor Vehicles per Million of Total Population 1953 18 938·0 1861·0 116·0
12 Government Hospital Beds iper Million of Total Population . •• . . . 1951 13 356·0 650'0 174·0 I
19 Cl;lDcentration Ratio of Lan~boldin~ 1951 16 N,A, 0'66 0·37 2

capita income. 4 Indices thought to be. ot weak diagnostic significance in the context of the Indian economy were given low scores, 'as were indices thought to be largely subsumed in other indices. The total weight of each group of indicaton was 20.
For purposes of comparison, both weighted and non-weighted averages for each group of variables and for all three groups taken together were derived. G As shown in column 2 of Table 1, however, for certain variables data were not complete for all regions. Tn order to arrive at average scores, whether weighted or nN, allowance had to be made for missing data. If a region was srored for all thirty-two indicators, the average, or overall, score was obtained by dividing the total of all the scores by thirty-two in the non-weighted case or by sixty in the weighted. If, however, data for a single indicator with a weight of two was lacking-to choose an arbitrary example-the total score was
7
divided by thirty-one in the non-weighted case and fifty-eight in the weighted. Similar averaging procedures were employed for determining weighted and non-weighted scores for each of the major groups of development indices, in addition to the averages for the three groups combined.
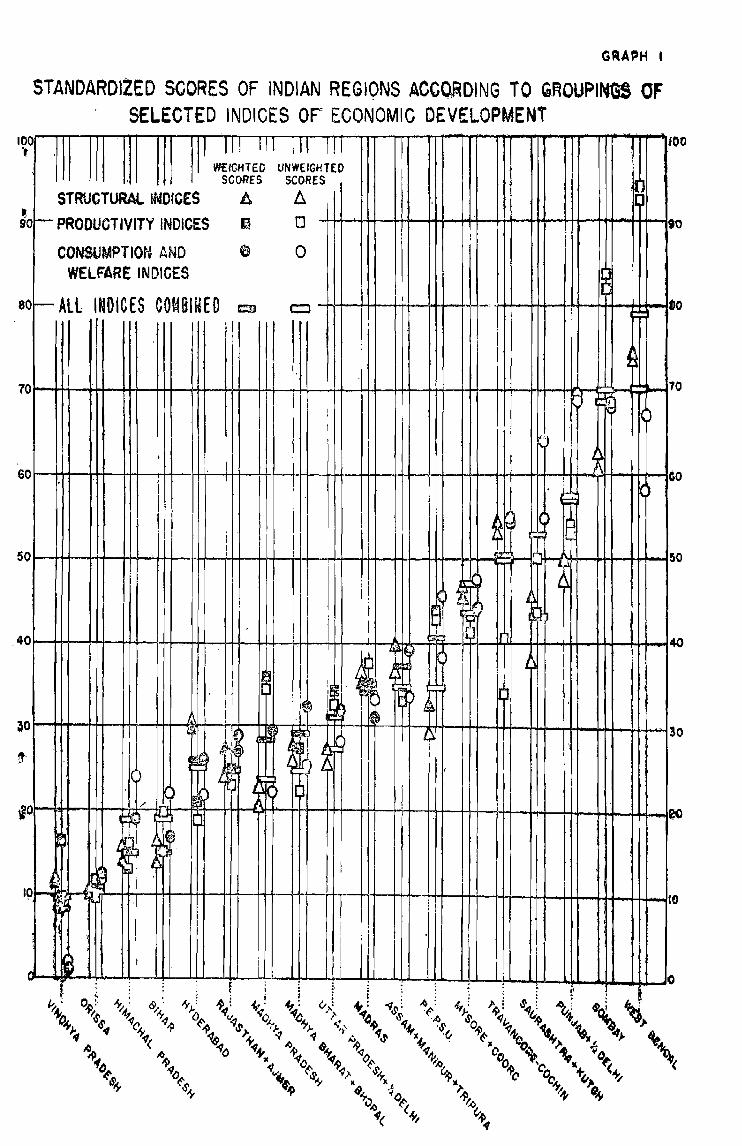
Graph 1 shows the four pairs of weighted and unweighted standardized rl!gionaI score~ derived in the manner just described. The regions thereon are ordered according to the weighted over:l11 score, with the least developed state, Vindhya Pradesh, at the left and the most developed, West Bengal. at the right." The graph shows a remarkably high degree of correlation among the several aspects of development and betwee~ each of those and the overall results, whichever set of figures one employs.
Table 2 shows the actual co-efficients 6f correlation of the ,overall development ratings (both weighted and unweighted), the weighted structural indices, the weighted
TABLE ~ CO-EPP/C1ENTS OP CORRELATlON OF SRLECTPD VARlABIES RELATING TO ECONOMIC DRVF.LOPMEN1 /1\' lNDlA*
Overall Overall Develop- Consump-Develop- ment Producti- tion and Annual ment Rating Structural vity Welfare Income Rating (Un- Indices Indices }nclices Per (Weighted) weighted) (Weighted) (Weighted) (Weighted) Capita
1 2 3 4 5 6 Overall Development Rating (Weighted)
·986 ·975 ·9RI ·974 '890
2 Overall Development Rating (Unweightcd)
'986 ·971 ·959 ·964 '814
3 Structural Indices (Weighted) ·975 ·971 '936 '931 '842 4 Productivity Indices (Weighted) ·981 '959 ·936 ·929 '883 5 Consumption and Welfare Indices ·974 '964 '931 ·92Q ·876
(Weighted) 6 Annual Income Per Capita ·890 '814 '842 ·883 '876
*Deri"ed 'ltilizinl1theformula of Arthur H. Robinsoni n "The Necessity of Weighting Values in Correlation Analysis of Areal nata," in Annals oj the Association of American Geographers, Vol. XLVI, June, 1956, pp.232-236. (Weighting in this instance was by population rather than by area.)
4 Per capita income, it will be noted, has a weigh t of 7 as an index of productivity and a weight of 5 as r n index of consumption. Lest these weights be thought exce~sjve, it should be noted that certain ecrrcrrj~ts consider per capita income as the yardstick of development whereas here, with a total \\<eirl't cf 1::'. it acccunts for but a fifth of the total score.
6 Strictly speaking, it is logically incorrect to speak of a "non-",eighted averPEe," S:l'ce "'ht IS really done in deriving such a figure is to count each component thereof as being of equal weight. e.g., to state that the number of hospital beds per million people is just as important an indicator of development as per capita income a sup' position with which, presumably, no one Would agree.
S Of the twenty-six variables for which data Were available for Vindhya Praclesr it SCC'Tfcl I('\l.t"st of' all olghteen regions (i.e., zero) on thirteen; of the thirty variables for which tiata were available for West Bengal, it scored highcst(/.e., 100) On seven and se4Xlnd on nine others.
104 R.G.--3
• R .. II I A 1'4
S ! A
MAP I
INDIA 15.4
", ... """"",.,/",:",,19.0)' LEVELS of ECONOMIC DEVELOPMENT \.;"
_._ INTERNATIONAL 1!OtIN'D,IIR'I
-- STATE "
AVERAGES OF STANDARDIZED SCORES FOR TH,RTY -TWO VARIABI.E~ t
tJ WE IGHTEO UNWEIGHTED I
(UPPER FIGURE) (LOWER FIGURE) ~ ~ •
• 70.0-78.8 68.2-70.1 ~ ~. ~ 0 tr~
• 43.9-57.0 43.6-56.8 0 2. •••
tm1:m ~ a o· Ifilifu 34.1-40.5 34.6-35.8 ~
Hit}:] 26.0-31.1 23.9-27.4 ~ o
GRAPH I
STANDARD1ZED SCORES OF INDIAN REGIONS ACCORDING TO GflOUP1N"GS OF SELECTED INDICES OF" ECONOMIC DEVELOPMENT
I~O'''''''''''''''''''''~~''''''''''"'TTT'---r1II'''r"'I--'~'T"II~"'T''~-TET'T 10 I""'" IU-N~rr~T'""'I'GH-';"'T"!~r--"-T"TT"--rrT__"'n-""""-"""""""""'-"""'-'~""""~IOO
SCORES SCORES
STRU~TURAl INOfCfS A 6. o ~.
f- PRODUCT IVITY INDICES iii 90
CONSlJMPT ION AND 6 o WELF'AR£ INDICES
80 ~ All INDICES COMBINED r.::::l';1
I I ! I
70
)
productivity indices, the weighted coD.S\1mption and welfare indices, and annual per capita income, taking these six variables two at a time. The "r" values "though open to some question due to the dubious accuracy of many of the data range from a low of .814 to a phenomenal high of .986.
The regions shown in Graph 1 may be \ grouped in five classes, which would be identical regardless of which set of scores, weighted or unweighted, were considered. These five classes form the map categories of Map 1 wbich sbows tbe regionalization of levels of economic development of India, essentially on a state-unit basis. The range of scores within each class is indicated in the map legend; and the individual regional scores are shown on the map proper.
The Subjective Integration Approach
The subjective integration approach to the mapping of levels of economic develop· ment seeks to provide a realistic regionalization of the couptry, irrespective of the boundaries of tte states or other internnl administrative divisions for which data happen to be available. The method makes no pretense of assigning developmental scores to the regions mapped; rather it recognizes in its map categories, as do many economists. several successive stages of economic growth. For India, these stages are definable largely in terms of the degree or commercialization in the predominant rural sector of the economy, though this can hardly be the sole criterion. These successive stages are usually strongly correlated, as the data of the previously discussed
10
development index approach bear out, with mounting levels of consumption and general welfare.
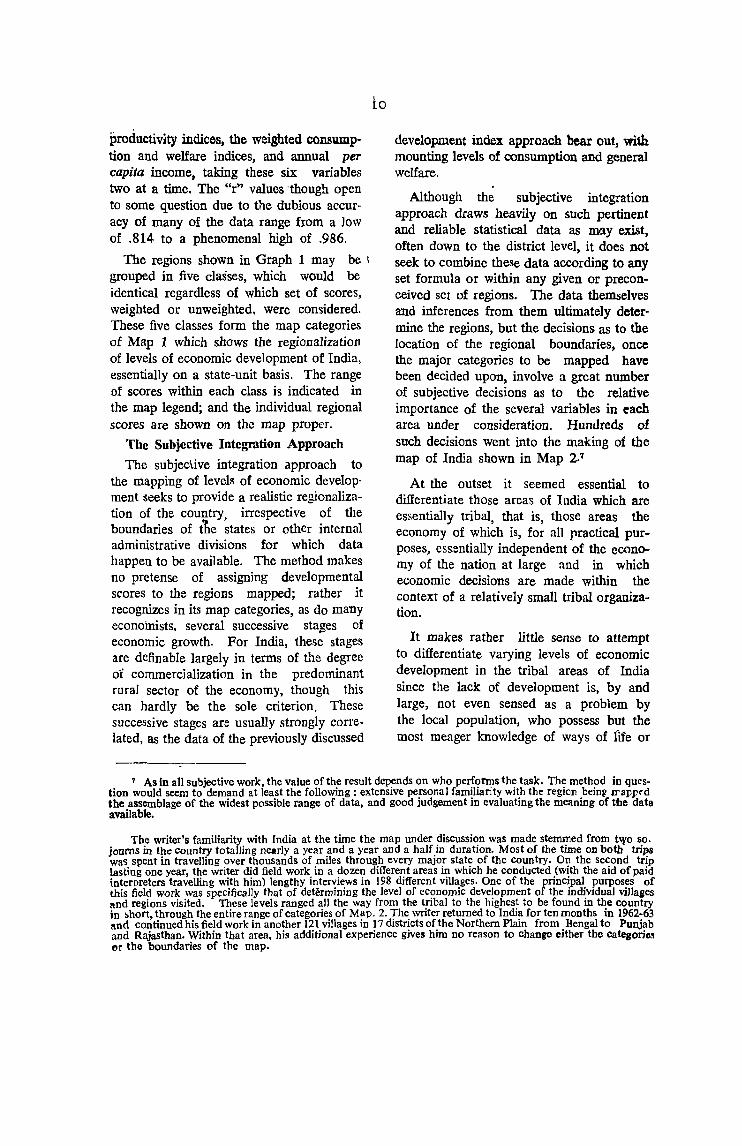
Although the subjective integration approach draws heavily on such pertinent and reliable statistical data as may exist, often down to the district level, it does not seek to combine these data according to any set formula or within any given or preconceived set of regions. The data themlSelves and inferences from them ultimately determine the regions, but the decisions as to the location of the regional boundaries, once the major categories to be mapped have been decided upon, involve a great number of subjective decisions as to the relative importance of the several variables in each area under consideration. Hundreds of such decisions went into the making of the map of India shown in Map 2·7
At the outset it seemed essential to differentiate those areas of India which are essentially tribal, that is, those areas the economy of which is, for all practical purposes, essentially independent of the economy of the nation at large and in which economic decisions are made within the context of a relatively small tribal organization.
It makes rather little sense to attempt to differentiate varying levels of economic development in the tribal areas of India since the lack of development is, by and large, not even sensed as a problem by the local population, who possess but the most meager knowledge of ways of fife or
7 As in all subjective work, the value of the result depends on who performs the task. The method in question would seem to demand at least the following: extensive personal familiarity with the region beiDF rrapped the assemblage of the widest possible range of data, and good judgement in evaluating the meaning of tile data available.
The writer's familiarity with India at the time the map under discussion was made stemmed from t'Yo so. journs in th~ country totalling nearly a year and a year and a half in duration. Most of the time on both trips wa'> spent in travelling over thousands of miles through every major state of the country. On the second trip lasting one year, the writer did field work in a dozen difTerent areas in which he conducted (with the aid of paid interpreters travelling with him) lengthy interviews in 198 different villages. One of the principal purposes of this field work was specifically that of determining the level of economic development of the individual villages and regions visited. These levels ranged all the way from the tribal to the highest to be found in the country in hhort, through the entire range of categories of Map. 2. The writer returned to India for ten months in 1962-63 and continued his field work in another 121 villages in 17 districts of the Northern Plain from Bengal to Punjab and Rajasthan. Within that area, his additional experience gives him no reason to change either the categoric.! or the boundaries of the map.

"
ARABIAH
SEA
AFGHANISTAN_ ., )::S-O'.'" ""-
r . .... ) ............. ..._ .., .IN'" 1
") I .I'
\ ~ i
i., MAP 2
INDIA .,. LEVELS of ECONOMIC DEVELOPMENT
Of BENGAL
of a technology different from their own. It is not suggested, however, that all tribal areas are essentially alike in their economy or even that there exists a "type"
.of economy that can be well understood by the appellation "tribal". What is suggested is that the following analysis is not altogether applicable to the tribal areas of India.
The non-tribal areas of India were differentiated primarily on the basis of their presumed degree of commercialization, though towards the upper extreme of development other factors were considered as well. The principal data used related to: (a) the proportion of land in various types of each crops i.e., non-staplesS (b) the proportion of total cropland under irrigation, the assumption being made that irrigated tracts are more likely to be surplus food-crop areas than those which are not9 ; (c) distance from urban markets and the local degree of urbanization, since urban areas can only exist when there is an accessible agricultural surplus area to feed them;10 (d) the density of population, rural and totalll ; and (c) the distribution of establishments such as oil mills, cotton ginneries, etc., for the initial local processing of agricultural produce.12 ,18.
Using the criteria cited above, it was possible to recopize a number of nontribal areas which clearly could be characterized as regions of subsistence peasant economy, that is, areas in which com
'mercial activity is negligible. To a large c!egree the~e areas border the tril>ll areas, though a few significant pockets are found
12.
surrounded entirely by areas of greater commercialization, as in the Bundelkhand.
It is hardly surpnsmg in comparing Maps 1 and 2, to find so much of the states of Vindhya Pradesh (now merged with Madhya Pradesh), Orissa, Bihar, and Himachal Pradesh classified either as areas of isolated tribal economy or (Jf subsistence peasant economy, since these states are the least developed according to the method of rating employed in the preceding section. It may be seen, however, that considerable areas of other states, most notably· Rajasthan, Madhya Pradesh, and Assam also are classified according to the two lowest categories of Map 2; but, as the population of those areas is relatively small, relative to the total populations of the states in which they fall, they do not depress the overall state scores sufficiently to put them in the lowest category of Map 1. Assam, in fact, is in the middle category.
At a developmental level above the subsistence ec.onomy are rather extenSIve transitional zones of incipient commercialization. These are, for the most part, areas of modest urbanization and slight development of cash cropping, judged by the criteria outlined above. Broadly speaking, the area characterized by incipient commercialization occupies two distinct territorial blocs, one in the northern interior and one stretching across the centre of peninsular India, th~ two being separated by the abutting of the more highly commercialized co.tton-growing areas of the Deccan against the areas
8 Atlas of India, plate 14. Four choropleth maps show, by district, the proportion of cultivated land in all cash crops of any significance. The value of the crop was taken into consideration in estimating the degree of commercialization.
g Ibid., plate 12. • 10 Census of India, Q 1951. • 11 Ibid. 12 Bureau of Commercial Intelligence and Statistics. "Basic Statistical Analysis of India" (Bombay, C,
1955, mimeobrraphed). Data compiled for each district [from the government publication, Large Scale Industrial Establishments (1951), Delhi: Mgr. of Publications, n.d.] inCluded the number of factories and workers in each specifiC industry with a total of fifty or more workers.
11 The state data used in deriving Fig. 2 were of value only as general guides.

at peasant subsistence and tribal economy o[ tile 1l0rtheast peninsula. It is difficult to correlate 1M extent of these areas with that of any of the state areas shown in Map 1; but no special significance need be at·tached to that fact.
The areas of advanced commercialization' can usually be associated with large marketable surpluses of a single major crop, tea in Assam, jute in Bengal, sugaT
in a small part of western Bihar ana northeastern and western Uttar Pradesh, wheat in Punjab and a small, irrigated part of Rajasthan, cotton in the Deccan lava tr~cts, part of Malwa and parts of South India, oilseeds in Telangana, rice in the Kistna-Godavari Delta and part of Tamil Nad, and coffee in the My:;ore Malnad. (Many of these areas, however, are far from having one-crop economies.) Over much of South India, on the other hand, the high degree of urbanization proved to be the main deciding factor for an area's inclusion in this development category; and, generally, a fairly high degree of urbanization is characteristic of the regions under discussion. Although the areas mentioned are not lacking in industry, much of the industry which exists is of the basic processing variety and oriented towards the local commercial crops.
The remaining areas of India are widely scattered, largely peripheral in location, and, for the most part, relatively small in size. They comprise two categories, the first characterized by economic diversification, ·but not especially by large-scale mctustrial and commercial enterprise, and the second in which diversification and large-scale organization go hand in hand. Together, areas in these two categories show a remarkable, but not surprising, correspondence to the areas in the two highest development categories of Map 1, namely West Bengal, Bombay, Punjab, Saurashtra, Travancore-Cochtn, and Mysore. In all of the areas of "economic diversification" a relatively Jarge part of
13
the' total population, often' apptG!lching and accasicrilally"" exceeding half. Is~' ~ngaged in ~on;.agricu1tural pursuits. In the three principal regions so classified, Punjab-Delhiwesternmost Uttar Pradesh, Saurashtra, and the Malabar Coast, commerce and various other services are very important activities; and in the latter two and parts of the former cottage and small-scale industries are also well developed. Surprisingly, however, urbaniz~tio!1 is not especially pronounced in the Malabar area. A noteworthy locational feature of a number of the areas 'Jf economic di.w'rsification is their apparent core, or fecal, positions with respect to surrounding, or merely neighbouring, areas of advanced commercialization.
Only three small regions of India-as opposed to isolated centres, wbich will be discussed shortly-have been recognized as areas of large-scale organization. These centre on Calcutta, Bombay, and Ahmedabad, but extend out from those metropolises to well up the Damodar Valley, to Poona, and to Surat respectively. All three areas are highly urbanized, highly industrialized, and characterized by large factory deve topment and a heavy volume of trade, including the bulk of India's foreign trade, passing through Calcutta and Bombay.
A peculiar feature of Indian economic geography appears to be the existence of scattered, important manufacturing, commercial, or administrative centres whose level of growth does not reflect that of their surroundinl! areas. In some cases, as in the case of the iron-and-steel centres, this is because they depend on raw materials which only a relatively small .. part of the nearby population can take part in supplying and may, additionally, reflect government decision concerning the location of industry, partially on political grounds. In others, as with the manufacturing city of Kanpur, it is because their location is fixed not in terms of nearby raw materials, but because of
transportational advantaiOi, the raw materials actually coming from distant areas. Finally, as with such state capitals as Lucknow or Jaipur, this is because the:, chief services they render are spread over so large an area. In essence, these centres are tiny islands of relatively high development in lesser developed seas; but because of their overall importance in India's economy, they were depicted in Mat 2 in exaggerated scale either in the pattern of economic diversification or in that of large-scale organization. whichever seemed more appropriate.
Comparison and Evaluation of the Two Approaches
Each of the two maps presented in this chapter has its advantages and its drawbacks.
The development index map is certainly the more objective of the two; but it cannot be called completely objective. either in the assigning of weights for the several indices used or in the decisions by which certain indices were used and other rejected. In retrospect, it appears that greater accuracy would have been achieved, and with less effort, had certain indices of dubious accuracy or slight diagnostic significance not been used (e.g., members of agricultural credit societies per million of agricultural population", or "Government hospital beds per million of total population"). While, for generalizations at the state level, its findings are, without doubt. rather trustworthy, it must be remembered that the size and heterogeneity of states in India is normally ~uch that state-~ise
generalizations are commonly not ~ reliable for much of the area concerned. At
14
worst thl)Y may be 'mewttgless averages. A state like Uttar Pradesh, for exauiple, includes within its borders the great central, but isolated, industrial centre of Kanpur, large and relatively prosperous areas in the west with a high degree of commercialization of agriculture, other large areas in the east where cultivation is at the 'barest subsistence level and areas of essentially tribal economy in the high Himalayas of Kumaon.
By contrast with the above, the subjective integration a'p'proach strives towards the greatest approximation of local reality, subject only to the limits imposed by the scale of cartographic gcneralization. While it is admittedly non-quantitative and based largely on inference, it is here suggested that one good inference may be worth many bad statistics. Moreover, the categories of the regions established have meaning in themselves, which index numbers, however they may be derived, do not. And yet, inescapably, the map begs such questions as "How commercial is 'commercial'?" and "How diversified must 'diversified production' be before it is recognized and mapped as such?'"' No simple answer can be given. The de'Cisions reached were invariably ad !zoe with different considerations involved in virtually every case. But they were not arrived at lightly and they were based on the writer's wide field experience, as well as on such statistics as wert' available.
In view of the above discu~sion, it would appear that one ~ould be well advised in using the two maps presented in this chapter jointly in following the exposition and arguments set forth in the remainder of this work.
CHAPTERlIl
AN ANALYSIS OF THE OI"FlCIAL OCCUPATIONAL STATISTICS
AIl-India Overview
General
This chapter :md the next analyse the occupational statistics provided by the Indian Census. Whereas the following chapter focuses on the regionll variations in the occupational structure, the present one is concerned 10 analyse in greater detail the occupational structure of India as a whole and to comprue it with those of other countries and of India at past periods. The general analytical framework empfoyed is that provided by the economic sectoral approach.
The Occupational Structure of India in 1951
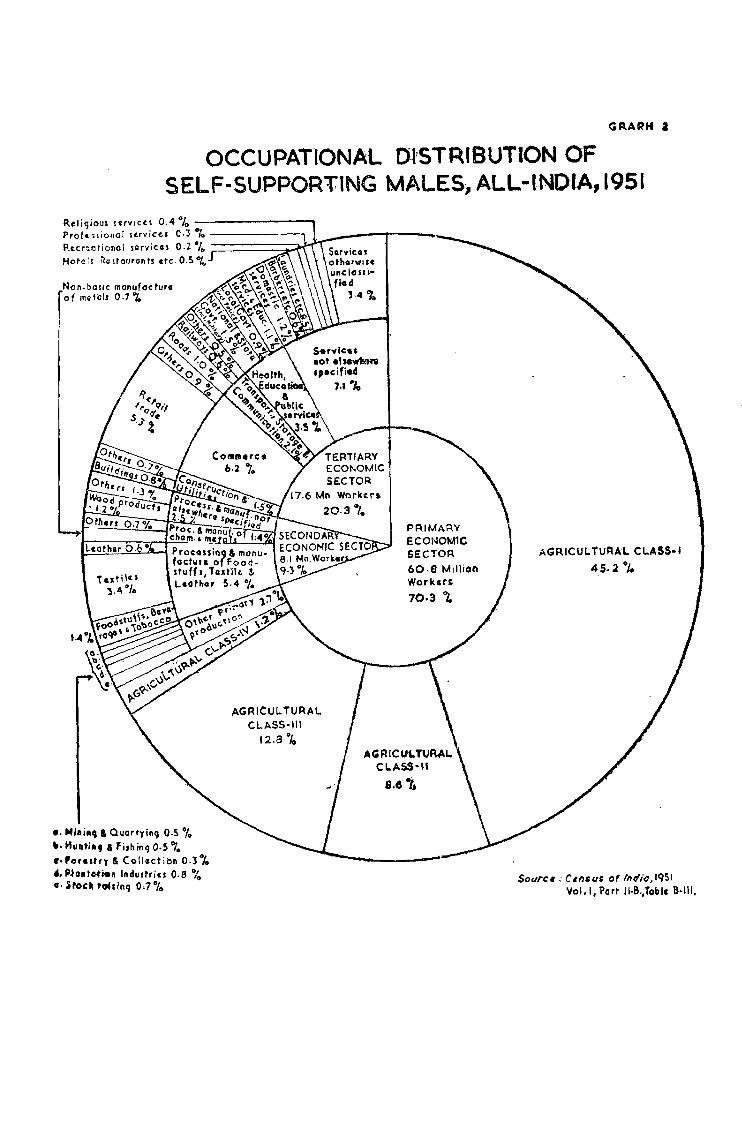
Graph 2, on the following page, depicts the all-India occupational pattern of 1951 based on the Census figures for self-supporting males. The graph is first divided into the three broad economic sectors of Colin Clark, secondarily into land tenure status categories for the agricultural part of the population and major industrial categories for the remainder and finally into significant subheadings for the larD r
categories. l The graph is intentionally limited to "self-supporting males" because of the author's conviction (based On evidence which will be detailed later in this .work) that the enumeration of female workers and male earning dependents is so unpredictably biased that the true extent of their participation in various types of
work cannot be closely gaged from the census. Consequently, analyses of occupational distribution limited to male selfsupporting workers will yield a closer picture of reality than one which alleges to consider an workers of both sexes, or simply all male or all self-supporting workers.2 Just how close a picture graph two represents will be briefly discussed in the following paragraphs.
The most glaring fact revealed by the graph, the overwhelming importance of the primary sector, is, of course, common knowledge. Within this sector agricultural classes I through IV I..!ompdse all but a very small share of the total. These four classes relate to that part of the population deriving its livelihood primarily from cultivation of non-plantation (but not necessarily noncash) crops. Plantation agriculture and stock-raising are listed separately, and, along with forestry and collecting, hunting and fishing, and mining and quarrying, make up the remainder of the sector. Agricultural Class I relates to cultivators of land wholly or mainly owned by themselves; Class II to cultivators of land wholly or mainly owned by others; CklSS III to cultivating laborers; and Class IV to non-cultivating owners of land. These headings are roughly synonymous with owner-cultivators, tenant-cultivators, agricultural-laborers, and landlords respectively.
lA more detailed breakdown is presented in Appendix A Table ~.
8Ideally, the analysis should be of adult male workers (i.e., age 15 and over), but this is not possible for 195}.
1.5 104 R.G.-4
GRAPH a
OCCUPATC10NAL DI'STRI8UT10N OF SELF-SUPPORTING MALES, ALL-INDIA, 1951
Religious Urvicel 0.4 % ---------.,
f'ro(&'1ionol sltrvices 0.3 % --------, Rltcr~otiono! IQrviCC5 0.2 ./~ ;::====::;~f1M Hotnl! KOltaoronts etc.O.S'%,
Non.ballc manufoctura r of mQtals 0·7 ~1.
I
e. Nillillq & Quarryinq O.S °/,. •• HIt.ti •• I fithinq O·S "I • • ,'orutry & Collaction 0.3"k 4. P.toatcti1ln Industries 0.8 "10 o. $tock 'C14s1I\q 0,7%
AGRICUL. TURAI. CLASS-Ill
12.8 °4
PR.IMARY ECONOM1C SECTOR.
60·8 Million Worker' 70.3 "I.
AGRICULTURAL CI.ASS*U
8.6 '\
AGR.ICUL TUAAl. CI.ASS·I
45· 2 oJ.
So"rc~: ClflSU$ of IhD'iO,lqSI Vol. I. Part 11-8.,Toble B-III.
While tbe number of persons classified by the censu8 as mainly employed in agriculture is probably reasonably reliable, one cannot place great faith in the returns by individual agricultural classes. Not only are the returns more inconsistent wjth those 01 previous censuses than the state of land rdonn in 1951 would lead one to suppose; but they are also greatly at variance wHh the findings of the All-India Agricultural Labour ~nquiry conducted in over eight hundered villages jn the same year. Flnally, as Chapter IV will show, tbe dt'gree of internal regional varfation within India is, not infrequently, more than one can credjt as being real (notwithstanding the very great variety of land tenure s}'stems known to exist.)l1
As to the direction of the censos errors, it is safe to assert that agricultural class In is considerably underestimated ('The Agricultural Labor Enquiry sample. if expanded, would yjeld a total of around 35 milJion agricultural lab Drers, counting both sexes, as opposed to under 27 mimon in the Census count), and that clas!>es I and IT, espedally the former, are correspondins]y [Mated.
The errQrs imputed to the Census ate largely attributed to a phenomenon wnicb might be called "category-climbing," i.e.) the reponing of the more desirable of two possible statuses wherever there is aoy doubt about the matter. Hence, if an agricultural laborer also owned and worked a p10t of land, however, negligible, he might incorrectly report himseIf as being in agricultural class 1, despite the fact that fl1e major share of his earnings were derived from work done for others. Another cause of the Qvel'-~tlumeration of owner-cultivators (in this'instance with the con;::omitant under-enumeratl0n of tenants) was the Census ruling that rent-paying tenants with permanent. inheritable ripbts in land were
17
to he counted as owners, Class IV. nonculti~ating owners of l:md, is probabJy consIderably ul1der-cn umera ted. since in view of impending land reforms, landlords would llaturally nave been loath to admit to the fact that they did not personally cultivate their OWn land.
Apart from the four agricultural c1asses several comments are necessary. relative to the re~mainder of the primary sectcr. With respect to plantation industries and, to a lesser degree, mining and quarryjng, jt
should be noted that the restriction in the coverage of graph 2 to. self-supporting males exercises a downward bias in their representation, 'Since the proportion of self-supporting females in those occupations (especially as tea-pickers, and in surface mine-work) is unusually l1igb (See Appendh A). The true importance of the raising and tending of livestock in India is, simUarly. poorly indicate-d by graph 1 as that is almost always a subsidiary, rather than ~ main, occupation and largely conducted by chiJdnn, who, in any C3se, would not be classified as self-supporting Collection. too-of wild grasses and herbs and fo-rest 'Produce (for fuel, human (Dod, fodder. and the making of le-af p1ates and various woven reed objects) is also a widespread and importa.nt subsidiary oecupatjon which is inadequately reflected in the returns on fore~trv and collection. The same sort of :Qener1lizatlon holdB true or hunting and fishiJ]g, whjch, among tribal peop]es, in particular, and certain low-ca._.,te Hindus. are important seasonal occupations of a subsidiary nature.
With regard to b"tn the secondary and tertiary sectors our observations wi)} be restricted tn those of a more (If less general natur.e. Most im.por~:lut is the fRet that it is imoossible to determine from the siatistlcs the allocation of labor according. to the scale of enterprise (household, ~mall scale,
'For some excenent criticisms of the 1951 C-ensus treatment Qf agriculturists ~ee t}->e rollQwing two article!: by 01ln1e1 Thl)mer: "India's A.g-rarian Reform by Census Redefinttion". !ndfan EC{)IlOmic Review, Vol. TIT. Nc. 2 Au~st, t956, pp. 1-21; and ··Agricultural Manpower in Tndia: laborers" Economic Weekly Vol. IX November 9, '19-57, pp. 1443-9. A number of articles in the wide-ranging Volume Rationale of Regional VarialiOlH in tke A(!rarialf Structllff! of rniia, (Bomba.y, n.d., ca. 1956), a s,.mp('l.~jum·pllbli~hed by the Indian Society of Agriculeural Economics, bea.r on tbe same theme.
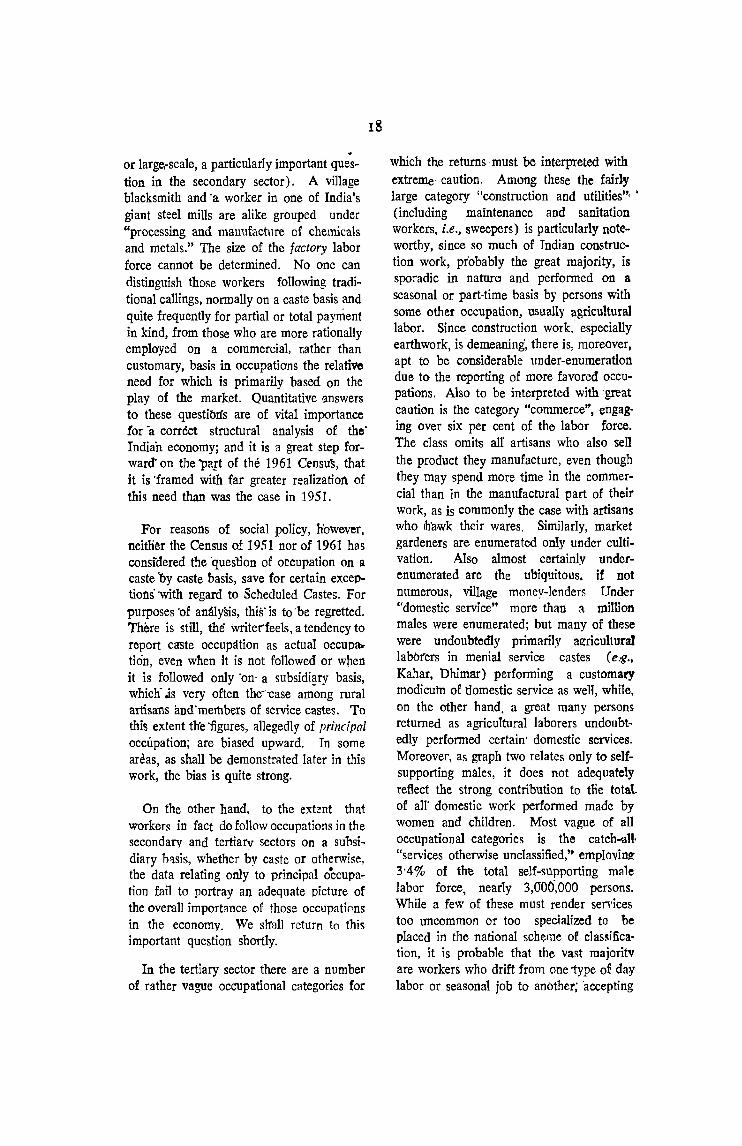
or large,-scale, a particularly important que"s
tion in the secondary sector). A village blacksmith and 'a worker in one of India's giant steel mills are alike grouped under "processing and manufacture of chemicals and metals," The size of the factory labor force cannot be determined. No one can distinguish those workers following traditional callings, normally on a caste basis and quite frequently for partial or total payment in kind, from those who are more rationally employed on a commercial, liather than customary, basis in occupatiO'ns the relative need for which is primarily based on the play of the market. Quantitative rulswers to these questibtfs are of vital importance for 'a correct structural analysis of the' Indiin economy; and it is a great step forwaret on the 'Part of the 1961 Census, that it is 'framed with far greater realization of this need than was the case in 1951.
For reasons of social policy, however, neitHer the Census of 1951 nor of 1961 has considered the 'queslion of occupation on a caste 'by caste basis, save for certain exceptions' with regard to Scheduled Castes. For purposes 'of analysis, thiS'is to 'be regretted. There is still, the writedeels, a tendency to report caste occupation as actual OCCUPlb
tion, even when it is not followed or w~en it is followed only 'on' a subsidiary basis, which'.is very often the--'case am"a~g rural artisans and'members of service castes. To this extent die 'figures, allegedly of principal occtipation; are biased upward. In some areas, as shall be demonstrated later in this work, the bias is quite strong.
On the other hand. to the extent that workers in fact do follow occupations in the secondary and tertiary sectors on a suhsidiary b'lsis, whether by caste or otherwise, the data relating only to principal occupation fail to portray an adequate picture of the overall importance of those occupatic.ns in the economy. We sl'rull return to this important question shortly.
In the tertiary sector there are a number of rather vague occupational categories for
IS
which the returns ·must be interpreted with extreme- caution. Amoog these the fairly large category "construction and utilities'" • (including maintenance and sanitation workers, i.e., sweepers) is particularly noteworthy, since so much of Indian construction work, probably the great majority, is sporadic in nature and performed on a seasonal or part,time basis by persons with some other occupation, usually agricultural labor. Since construction work. especially earthwork, is demeaning, there is, moreover, apt to be considerable under-enumeration due to the reporting of more favored occupations. Also to be interpreted with 'great caution is the category "commerce", engag, ing over six per cent of the labor force. The class omits aU artisans who also sell the product they manufacture, even though they may spend more time in the commercial than in the manufactural part of their work, as is commonly the case with artisans who ,h'awk their wares, Similarly, market gardeners are enumerated only under cultivation. Also almost certainly underenumerated are the ubiquitous. if not numerous, village money-lenders Under "domestic service" more than a million males were enumerated; but many of these were undoubtedly primarily a~ricultural labOl'ers in menial service castes (e,g., Kahar, Dhimar) performing a customary modicum of 'domestic service as well, while, on the other hand. a great many persons returned as agricultural laborers undoubtedly performed certain' domestic services. Moreover, as graph two relatcs only to selfsupporting males, it does not adequately reflect the strong contribution to tne total of all" domestic work performed made by women and children. Most vague of all occupational categories is the catch-alt· "services otherwise unclassified," emplovjn~
3'4% of the total self-supporting male labor force, nearly 3,0"00',000 persons. While a few of these must render services too uncommon or too specialized to be placed in the national scheme of claslIifica· tion, it is probable that the vast majoritv are workers who drift from one "type o~ day labor or seasonal job to another; 'accepting
almost any manner of work that becomes available. Many of these may work as agricultural laborers when they can, while some agricultural laborers and many others, variously classified, would. on the other hand, perhaps have been more accurately reported in this group.
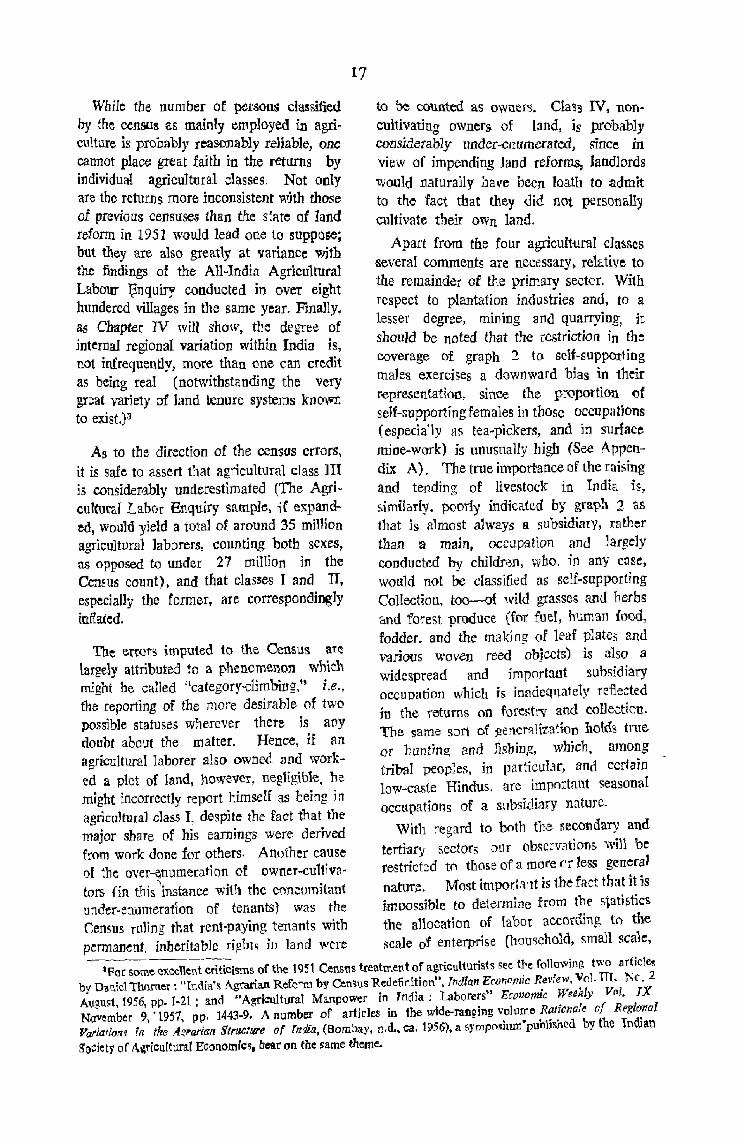
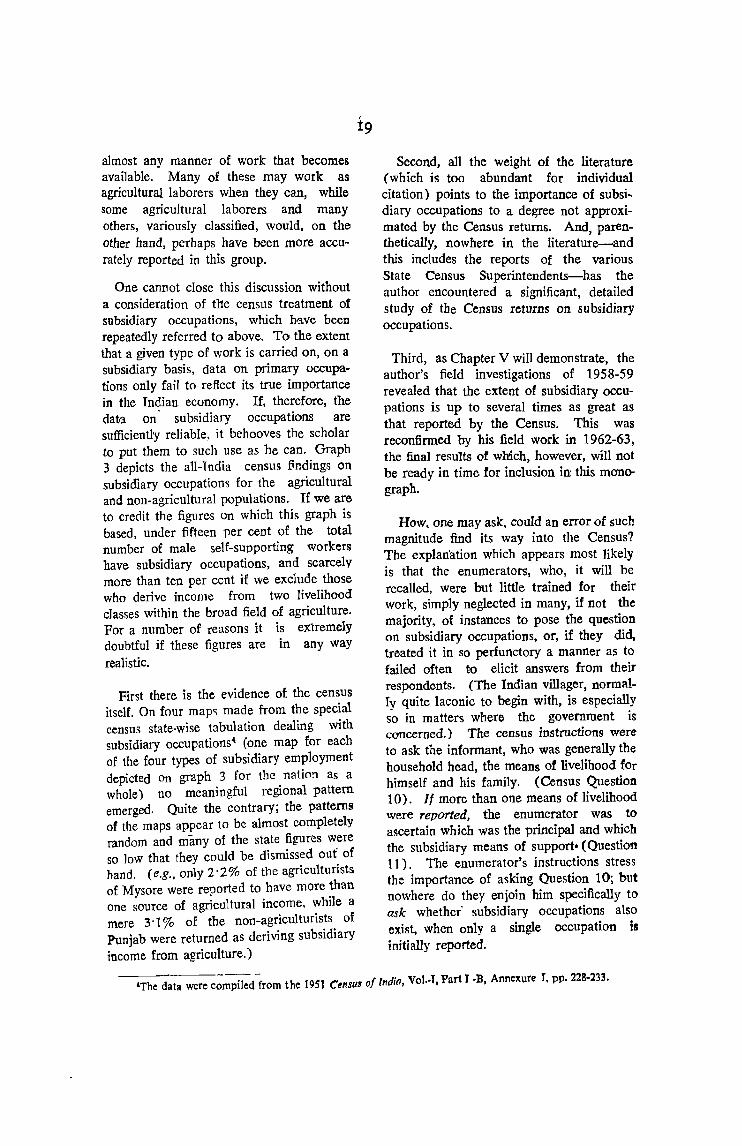
One cannot close this discussion without a consideration of the census treatment of subsidiary occupations, which hf;l.ve been repeatedly referred to above. To the extent that a given type of work is carried on, on a subsidiary basis, data on primary occupations only fail to reflect its true importance in the In~ian economy. If, therefore, the data on subsidiary occupations are sufficiently reliable, it behooves the scholar to put them to such use as he can. Graph 3 depicts the all-India census flndings on subsidiary occupations for the agricultural and non-agricultural populations. If we are to credit the figures on which this graph is based, under fifteen per cent of the total number of male self-supporting workers have subsidiary occupations, and scarcely more than ten per cent if we exclude those who derive income from two livelihood classes within the broad field of agriculture. For a number of reasons it is extremely doubtful if these figures are in any way realistic.
First there is the evidence of the census itself. On four map" made from the special census state-wise tabulation dealing with subsidiary occupations" (one map for each of the four types of subsidiary employment depicted on graph 3 for the nation as a whole) no meaningful regional pattern emerged. Quite the contrary; the patterns of the maps appear to be almost completely random and many of the state figures were so low that they could be dismissed out of hand. (e,g., only 2'2% of the agriculturists of Mysore were reported to have more than one source of agricultural income, while a mere 3'1 % of the non-agriculturists of Punjab were returned as deriving subsidiary income from agriculture,)
Second, all the weight of the literature (which is too abundant for individual citation) points to the importance of subsi, diary occupations to a degree not approximat~ by the Census returns. And, parenthetIcally, nowhere in the literature-and this includes the reports of the various State Census Superintendents-has the author encountered a significant, detailed study 0: the Census returns on subsidiary occupatlOns.
Third, as Chapter V will demonstrate, the author's field investigations of 1958-59 rev~aled . that the extent of subsidiary occupatIOns IS up to several times as great as that reported by the Census. This was reconfirmed by his field work in 1962-63 the final results of which, however, will no~ be ready in time for inclusion in this monograph.
How. one may ask, could an error of such magnitude find its way into the Census? The explan'ation which appears most likely is that the enumerators, who, it will be recalled, were but little trained for their work, simply neglected in many, if not the majority, of instances to pose the question on subsidiary occupations, or, if they did, treated it in so perfunctory a manner as to failed often to elicit answers from their respondents. (The Indian villager, normalfy quite laconic to begin with, is especially so in matters where the government is concerned. ) The census instructions were to ask the informant, who was generally the household head, the means of livelihood for himself and his family. (Census Question 10). 1/ more than one means of livelihood were reported, the enumerator was to ascertain which was the principal and which the subsidiary means of support- (Question 11). The enumerator's instructions stress the importance of asking Question 10; but nowhere do they enjoin him specifically to ask whether' subsidiary occupations also exist, when only a single occupation is initially reported.
-'The data were compiled from the 1951 Census of India, Vol.·T, Part J -B, Annexure T. pp. 228-233.

GRAPH 3
SUBSIDIARY OCCUPATIONS AMONG SELF .. SUPPORTING WORKERS, 1951
Occupation only
. 28.4°/0
On~
Aqric:ultural Occ:upatlon
57.3%
SOUrCt1l Census of Indio,lqSI Vol.I,Port I-B,ApPlndix III Annexure I, pp. ~27~ n~.
Two conclusions to be drawn from the above discussion appear inescapable. First, there is no way to ascertain for the whole of India the true extent of involvement in any fierd of economic endeavour. One may, as a rule, determine fairly accurately the number of people primarily engaged in a particular occupation, but not the total number of people engaged, including those engaged IOn a subsidiary basis. Second, there would 'be no point in attempting 'any regional study of subsidiary occupations using the data of the 1951 Census, however important the information may be for understanding the regional variations in the Indian economy.
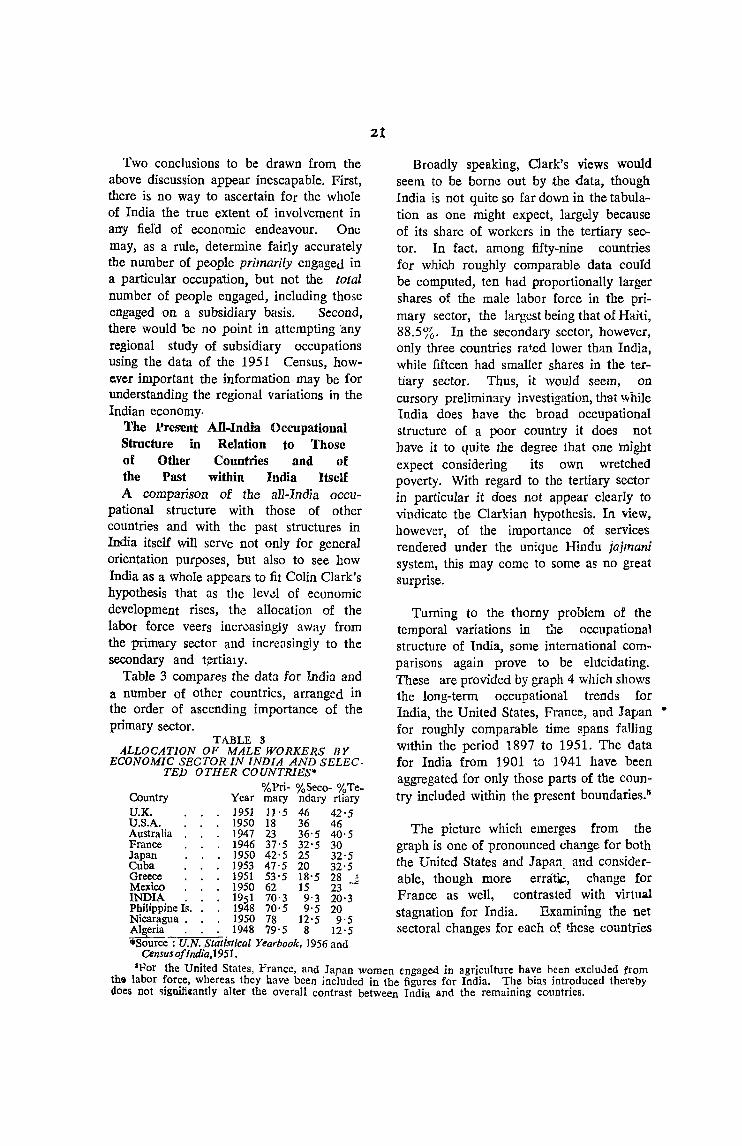
The Present All-India Occupational Structure in Relation to Those of Other Countries and of the Past within India Itself A comparison of the a11-Indi a occu-
pational structure with those of other countries and with the past structures in India itself will serve not only for general orientation purposes, but also to see how India as a whole appears to fit Colin Clark's hypothesis that as the lev~l of economic development rises, the allocation of the labor force veers incroasingIy away from the primary sector and incre;)singiy to the secondary and tyrti31 y.
Table 3 compares the data for India and a number of other countries, arranged in the order of ascending importance of the primary sector.
TABLE 3 ALLOCATION OF MALE WORKERS BY
ECONOMIC SECTOR IN INDIA AND SELECTED OTHER COUNTRIES"
%Pri- %Seco- % Te-Country Y car mary ndary rtiary U.K. 1951 11-5 46 42'5 U.S_A. 1950 18 36 46 Australia 1947 23 36-5 40-5 France 1946 37·5 32'5 30 Japan 1950 42'5 25 32-5 (;Uba 1953 47-5 20 32'5 Greece 1951 53'5 18'5 28 ~ Mexico 1950 62 15 23 ~ INDIA. 1951 70'3 9'3 20'3 Philippine Is. 1948 70' 5 9' 5 20 Nicaragua. 1950 78 12'5 9'5 Algeria . . . 1948 79'5 8 12'5 liSOUrCe : U.N. Statistical Yearbook, 1956 and
Census ofIndia,1951.
21
Broadly speaking, Clark's views would seem to be borne out by the data, though India is not quite so far down in the tabulation as one might expect, largely because of its share of workers in the tertiary sector. In fact, among fifty-nine countries for whioh roughly comparable data could be computed, ten had proportionally larger shares of the male labor force ill the primary sector, the largest being that of Haiti, 88.5%. In the secondary sector, however, only three countries rat.ed lower than India, while fifteen had smaller shares in the tertiary sector. Thus, it would seem, on cursory preliminary investigation, that 'While India does have the broad occupational structure of a poor country it does not have it to quite the degree that one might expect considering its own wretched poverty. With regard to the tertiary sector in particular it does not appear clearly to vindicatc the Clarkian hypothesis. In view, however, of the importance of services rendered under the unique Hindu jajmani system, this may come to some as no great surprise.
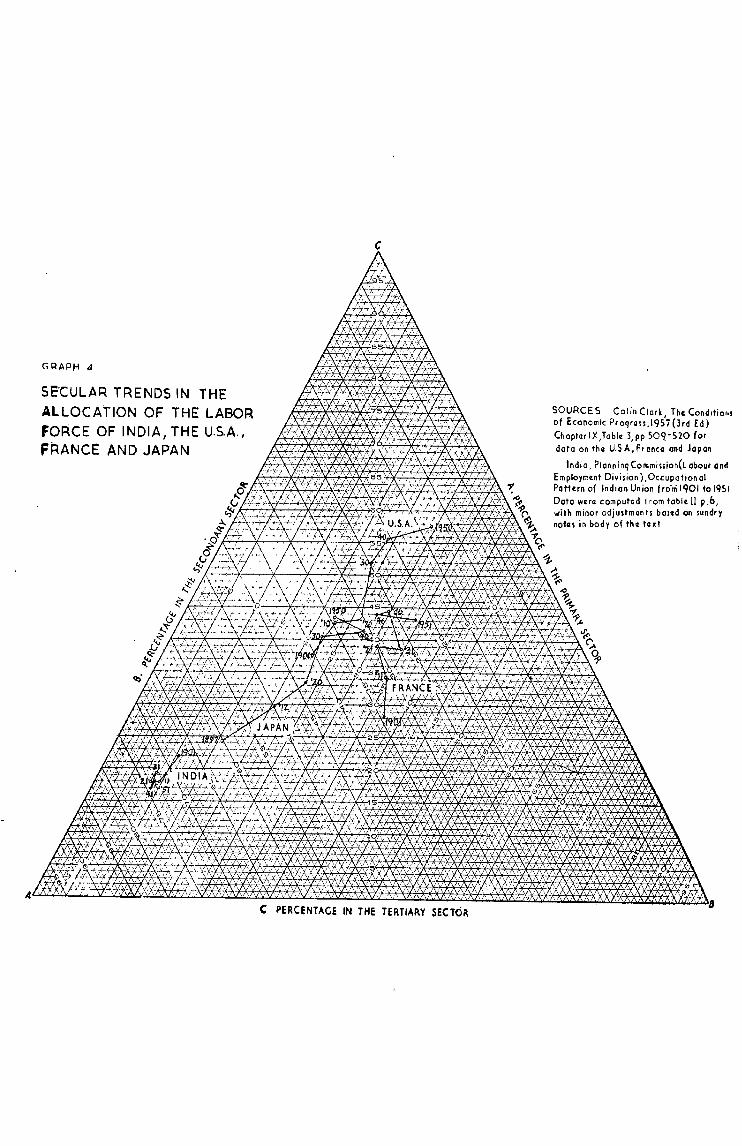
Turning to the thorny problem of the temporal variations in t~1e occupational structure of India, some international comparisons again prove to be ehtcidating. These are provided by graph 4 which shows the long-term occupational trends for India the United States, France, and Japan • , for roughly comparable time spans falling WIthin the period 1897 to 1951. The data for India from 1901 to 1941 have been aggregated for only those parts of the country included within the present boundaries. I!
The picture which emerges from the graph is one of pronounced change for both the United States and Japan. and considerable, though more erratic, change for France as well, contrasted with virtual stagnation for India. Examining the net sectoral changes for each of these countries
IFor the United States, Prance, and Japan women engaged in agriculture have heen excluded from tho labor force, whereas they bave been included in the figures for India. The bias introduced thereby does not signifilantly alter the overall contrast between India and the remaining countries.
GRAPH 4
SE'CULAR TRENDS IN THE ALLOCATION OF THE LABOR FORCE OF INDIA, THE U.S.A., FRANCE: AND JAPAN
c
C PERCENTAGE IN THE TERTIARY SECTOR
SOURCES ColinClo,k, ThcCond,tio", of Economic Proqrall.1957(3rd Ed) Chopta, IX,Toble 3,PP 509-520 for data on th~ U.SA.,F'onc4 and Jdpon
Indio. Plonninq Comminion(L obour and Employment Division),Occupotional Pattern of Indian Union fro'nil901 to 1'151 Doto were computad f 'om table II p .0, with minor adjustments baled on sundry not41 in body of tna tut
8
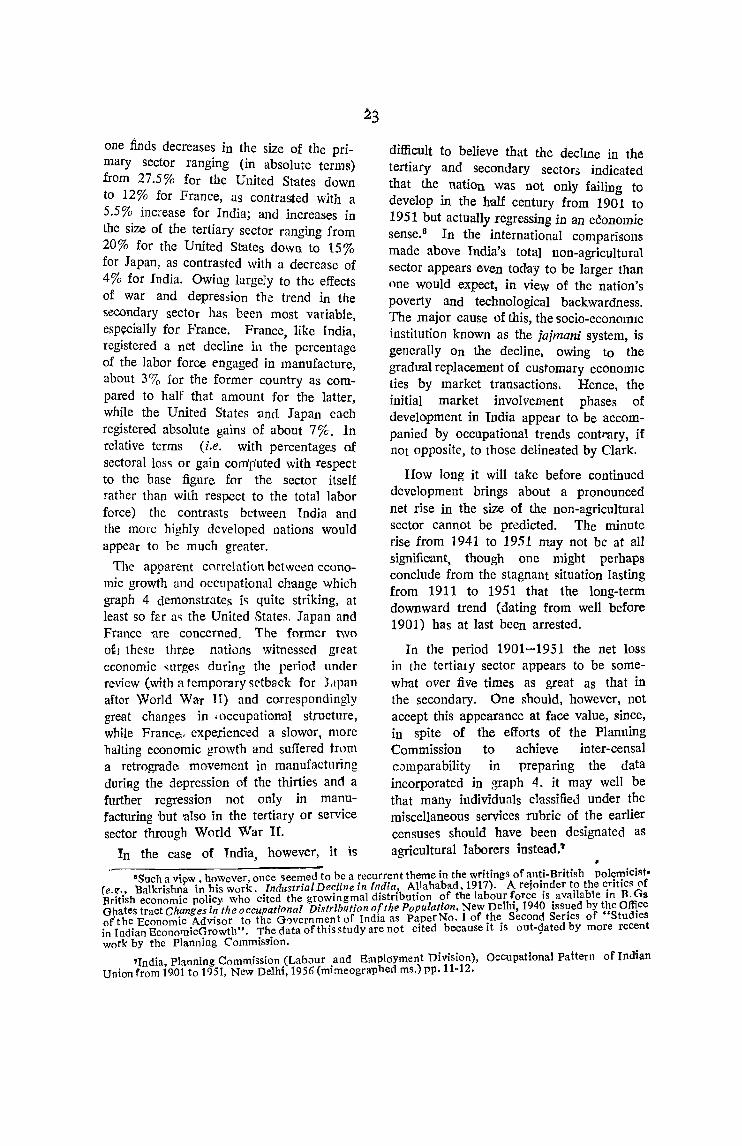
one finds decreases in the size of the primary sector ranging (in absolute terms) from 27.5% for the United States down to 12% for France, as contrasted with a 5.5% increase for India; and increases in the size of the tertiary sector ranging from 20% for the United Seates down to 15% for Japan, as contrasted with a decrease of 4% for India. Owing largely to thc effects of war and depression tb~ trend in the secondary sector has been most variable, esp~cially for France. France, like India, registered a net decline in the percentage of the labor force engaged in manufacture, about 3% for the former country as compared to half that amount for the latter, while the United States ancI Japan each registered absolute gains of about 7%. In relative terms (i.e. with percentages of sectoral los<; or gain com'p'uted with respect to the base figure for the sector itself rather than with respect to the total labor force) the contrasts between Tndia and the more highly developed nations would appear to be much greater.
difficult to believe that the declIne in the tertiary and secondary sectors indicated that the natiOn was not only failing to develop in the half century from 1901 to 1951 but actUally regressing in an economic sense.6 In the international comparisons made above India's total non-agricultural sector appears even today to be larger than one would expect, in view of the nation's poverty and technological backwardness. The major cause of this, the socia-economIc institution known as the jajmani system, is generally on the decline, owing to the gradual replacement of customary economIC ties by market transactions. Hence, the initial market involvement phases of development in India appear to be accompanied by occupational trends contr>ary, if not opposite, to those delineated by Clark.
How long it will take before continued development brings about a pronounced net rise in the size of the non-agricultural sector cannot be predicted. The minute rise from 1941 to 1951 may not be at all significant, though one might perhaps
The apparent correlation between econo- conclude from the stagnant situation lasting mic growth and occupational change which from 1911 to 1951 that the long-term graph 4 demonstrates j" quite striking, at downward trend (dating from well before least so far a<; the United States. Japan and 1901) has at last been arrested. France arc concerned. The former two otJ these thr,ee nations witnessed great In the period 1901-1951 the net loss economic <;urges during the period under in the tertialY sector appears to be some-review ,with n temporary sC'tback for ),tpan what over five times as great as that in after World War II) and correspondingly the secondary. One should, however, not great changes in, occupatiQnal structure, accept this appearance at face value, since, while Francee, experienced a slower, more in spite of the efforts of the Planning halting economic growth and suffered tr?U1 Commission to achieve inter-eensal a retrograde movement in manufactunng cJll1parability in preparing the data during the depression of the thirties and a incorporated in graph 4, it may well be further regression not only in manu- that many individuals c1-assified under t~e facturing but -also in the tertiary or service miscellaneous services rubric of the earher sector through World War H. censuses should have been designated as
In the case of India, however, it is agricultural laborers instead.' •
. b urrent theme in the writings of anti-British polemicist. "Such a vi!)"" , however, onCe ~eemed to ~ a :-ec d' Allahabad 1917) A rejoinder to the critics of
(e.~ .. , Balkrish~a in ~is work . .rn~ust:ial De~~ne r:1 ~s~~ibution of the lab~ur force is .available in B. Gs BritIsh economIC polIcy who cIte t e grc;wI'b glT}- fth P pulation ~ew Delhi 1940 Issued by the Office Ghates tract Changes in the occupational Dlstrrt u¥~n d' ~~ PaperNo' i of the S~cond Series of "Studies or'the Economic .Advisor ,!O thhe Gd')tver1~h'~s~dynarl: not cited be~ause it is out-gated by more recent in Indian Econ0111Icqrowth . T ~ a a 0 I, work by the Plannlllg CommISSIOn.
I t D · ., ) Occupational Pattern of Indian , dia Planning Commission (Labour and Bmp oymen lVISlon, Union 'r~m 19,01 to 1951, New Delhi, 1956 (mimeographed ms.) pp. 11-12.

.But, even if we do assume a much
greater decline in the. tertiary than in the secondary sector dUring the twentie1h century; we would not be justified in an extrapolation of that trend into the century before. Rather, the evidence, some of which was cited in Chapter 1[, points to a much greater decline ifl the secondary sector. The principal calise of this, of course, was the inexorable competition of factory goods ~with those produced by artisans. At around the turn of the century factory manufacture began to spring up in India itself so that some gain In manufacturing labor then b~gan to be registered as a partial offset to the decline in the number of independent artisans. Yet, the spread of improve-d technology to the villages thcmselves continued to result in the displacem~t of numerous workers in the so-called manufacturing industries, and, judging by the trends indicated in Table 4 below, the process is !;till underway.
TABLE 4
RMPLOYMEMT TReNDS IN SELECTED OCCUipAT10NS AFFECTED BY TECHNOLOGIC.AL CHANGE DURING THE PERIOD 1901-1951
(Thousands of workers, both sexeS included)
1901 1911 1921 1931 ].951
Hand pounding of rice, manual dehusking, flour grinding and milling of cereals
and pulses .\ 1,245 1,232 873 685 526
2 Vegetable oil pressing and re-fining 4~3 528 471 503 250
J Leatlfe'r, leather products and footwear . 1,143 1,066 1,002 868 760
4 Cotton textiles 3,243 3,018 2,639 2,718 3,034
Source: India, Planning Commission (Labour and Empluyment Division), Occl/pational Pattern of Indian Union from 1901 to 1951 (mimeographed ms.) p . 9.
The contrast in Table 4 between line 4 and lines 1-3, for the period 1921-1951, shOUld alert us to an ever-present danger
in employing the sectoral approach in ecOnomic analysis, namely that: since the sectors' are not homogeneous, they may contain sub-groups manifesting changes in opposite directions for any given period of study. Thus, a small net change for the sector as a Whole filay mask large but divergent, intra-settoral vatiatiofts. Bauet and, Yarney state the problem, withOl\t equivocation:
'" .• (economic) 'activity becomes no more amenable to analysis by being labelled primary, s.~condary or tertiary; and particularly if called tertiary, the activity merely becomes obscured when it is treated as one of a collection of beterogeneous activities, being united only because they pOf>sess a characteristic (being services) which is of no analytical value to the economist. Moreover, while aggregation may be necessary and useful in some branches of economics, aggregation of economic activities and their division into three broad categories seems to be wholly misplaced in that branch of economics which is concerned with the structure of an economy and changes in the structure."8
Bauer's and Yamey's point is well tak:en. Yet eCClnomists do persist in the sectoral analysis of economies. Their reason for doing so is quite simple: it provides a convenient, if imperfect, means for comparison in arriving at first approximations of reality. Certainly the initial use of aggregation does not in any way preclude further and more detailed examination.
'Table 5, on the following page, is presented as a step toward this more detailed examination. Therein the occupationnl structure of India is given for the six censuses from 1901 to 1951, counting both male and fe.male I'abor. A3 with the data' of graph 4, the ligures tabulated for the period from 1901 to 19H refer only to the area correspoding to the present Indian Union.
8P. T. Bauer and B. S. Yamey, "Further'Notes on Economics Progress and Occupational Distributions" The Economtc Joumal., Vol. 64, MarchI 1954, p. 99.
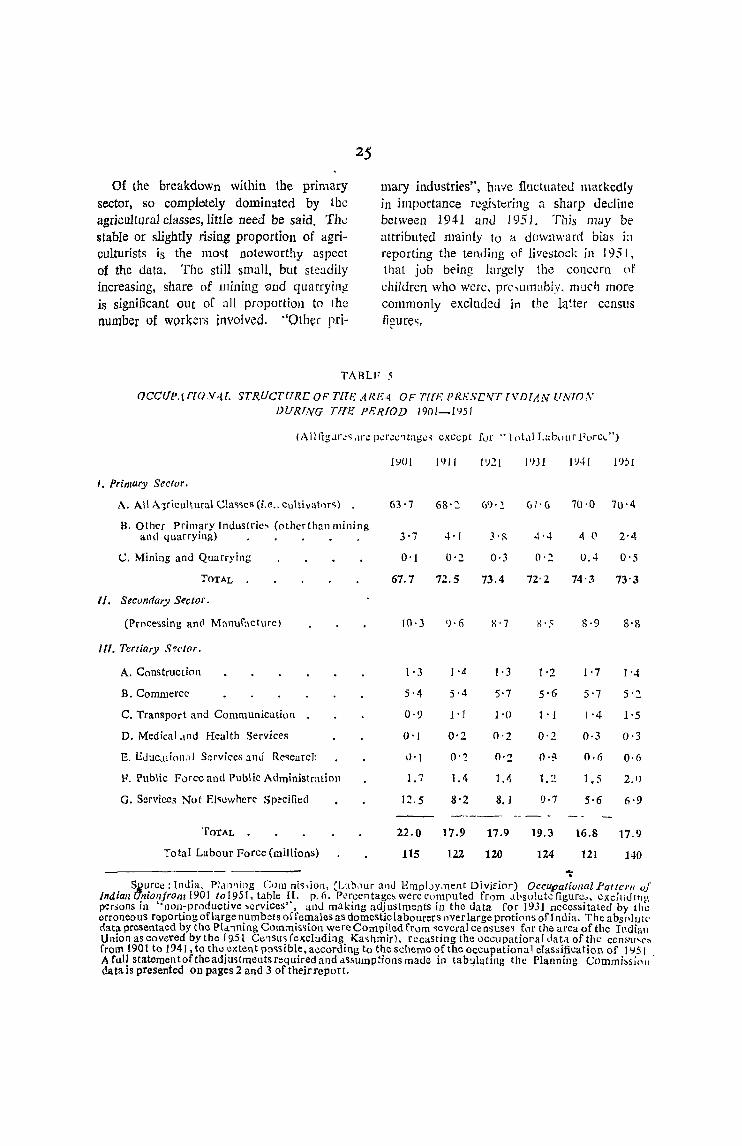
Of the breakdown within the primary sector, so completely dominated by the agricultural classes, little need be said. Th..:: stable or slightly rising proportion of agriculturists is the l11o'>t notoworthy aspect of the data. The still small, but steadily increasing, share of wining '(lnd quarryin~
is significant OUt of all proportion to 1he number of work~rs involved. "Other pri-
mary industries", howe fluctuateu markedly in importance regi~tering a sharp ueclillc between 1941 amI 1951. This may be attributed mainly to a downward bias b reporting the tending of livestock in 195 J, that job being largely the concern llf
children who were, pr(,~uI11Ctbi.v, mucl) more commonly excluded in the la~ter census figure~,
TABU; ;;
OCCUP.lf[QYA.r. STRUCTURE OF TETE ARR4. OF T[{E PRESEVT [VDlAN UNIOX DURING TilE PERIOD 1901-1951
(Allllg..!r.:~ Me p.:r(!e·ltagl)~ except fur" I (ltdl Labullr 1';\,rc,-")
IYOI 1911 1')21 I (IJI 1\141 I 'J) 1
I. Primary Sector.
A. All A~ricu1tura\ Cla~~cs (i.e .. cu\tivatnr~) 63'7 6jV~. (1)'2 6/'6 70·0 7U'4
B. Other Primary Indllstric~ (othcrthunlllining and quarrying) 3'7 4'1 3'f{ 4·4 4 (1 2'4
C. Mining and Quarrying 0'1 0'2 0·3 0'2 0.4 0'5
TOTAL 67.7 72.5 73.4 72'2 74'3 73'3
II. Secundary Sector.
(Procc$sing and Manufacture) 1 (). 3 ')·6 X'7 i{.:;c 8·9 S'X
Ill. Tertiary S'!ctor.
A. Construction 1'3 1'4 1· 3 1 '2 1'7 ht
B. Commerce 5'4 5·4 5'7 5·6 5'7 5'2
C. Transport and Communication 0'9 1 '1 1 . (l 1 . 1 1'4 1'5
D. Medical .lnd Health Services 0'1 0'2 0'2 0'2 0·3 0·3
E. EJUC,ltioll.ll Servicc,~ and Re~earch I) '1 O·'! 0'2 0':1 0·6 0·6
F. Public Force anu Public Administration 1.7 1.4 1.4 1.:t 1.5 2.1)
G. Services ~ot El~ewhere Specified 12.5 8'2 8.1 9·7 5·6 0'9 ---_- -- --
TOTAL 22.0 17.9 17.9 19.3 16.8 17.9
Total Labour Force (millions) 115 122 120 124 121 140 .... .
S.&,>urce : India, Pla1l'1ing Corn ni~,ion, (Lah')Llr :llld Empl0y.nent Dividor) Occllpational Pat/em of Indiall Unioll/rom 1901 101951, table [I. p. 6. Pcrcentagc~ wcre rumputed from dbslliutc flgurc~, cxclllU1t1V per.>ons in "Ilon-pwductive services", and making adjustments in the data for 1931 necessitated by tli~ erroneous reporting oflarge numbcls offemales as domestic labourers nver large protiflns of India. The absnlUl" data presentaed by the Pta '1ning Commis~ion were Compiled from ~evcral censuse~ for the area of the Indian Union as covered by the 19.51 Ce'lSu~ (eXCluding Ka~hmir), recasting the occupatioral data of tIle Cem'lI\C', from 1901 to 1941, to the extent p()"sible, according to the scheme of the occupational classification of 1')51 A full statomentoftheadjustments required and assumptions made in tabulating thl! Planning CommbS!0n' data is presented on pages 2 and 3 of their report.
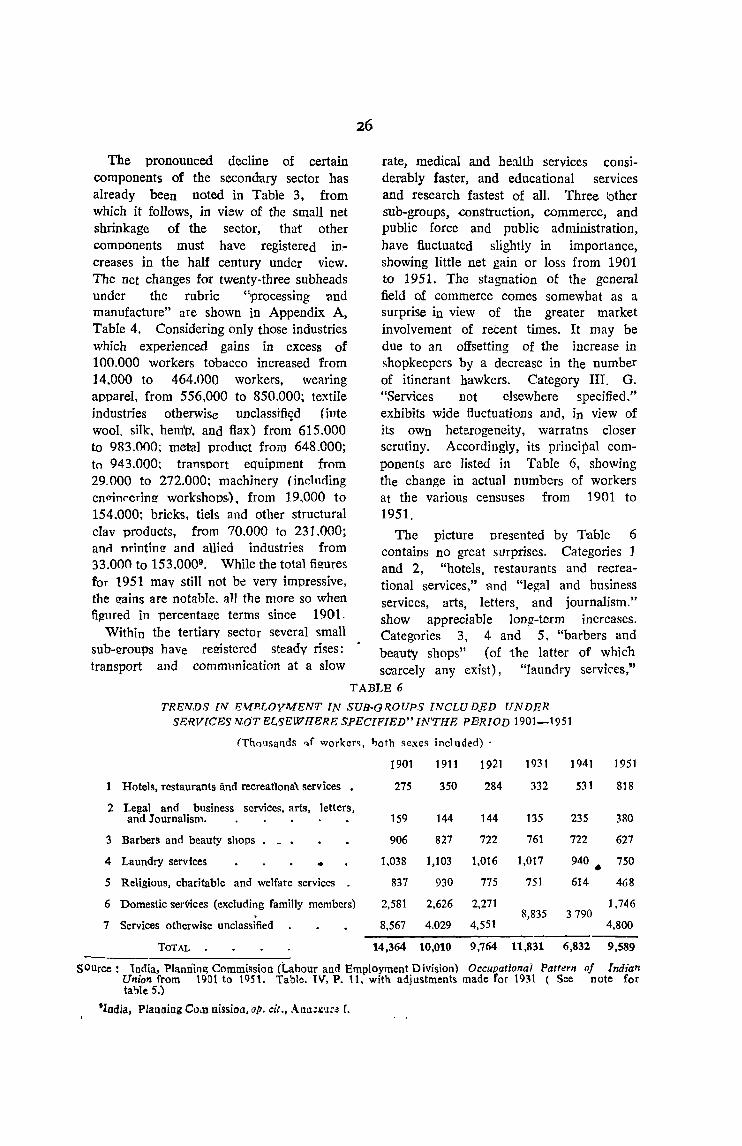
The pronounced decline of certain components of the secondary sector has already been noted in Table 3, from which it follows, in view of the small net shrinkage of the sector, that other components must have registered increases in the half century under view. The net changes for twenty-three subheads under the rubric "processing 'and manufacture" are shown in Appendix A, Table 4. Considering only those industries which experienced gains in excess of 100.000 workers tobacco increased from 14.000 to 464.000 workers, wearing apparel. from 556.000 to 850.000; textile industries otherwise unc]assifi~d (iute wool. silk. hem'l1. and flax) from 615.000 to 983.000; met'al product from 648.000; to 943.000; transport equipment from 29.000 to 272.000; machinery (including en!1inperine workshops,). from 19.000 to 154.000; bricks, tiels and other structural clav products, from 70.000 to 231.000; ann Drintin!! and allied industries from 33.000 to 153.0009 • While the total figures for 1951 may stilI not b~ very impressive, the Q'ains are notable. all the more so when figmed in percentage terms since 1901.
Within the tertiary sector several small sub-I!roups have remstered steady rises: transport and commnnication at a slow
rate, medical and be31th services cOllsiderobly faster, and educational services and research fastest of all. Three lother SUb-groups, construction, commerce, and public force and public administration, have fluctuated slightly in importance, showing little net gain or loss from 1901 to 1951. The stagnation of the generol field of commerce comes somewhat as a surprise in view of the greater market involvement of retent times. It may be due to an offsetting of the increase in shopkeepers by a decrease in the number of itinerant hawkers. Category III. G. "Services not elsewhere specified." exhibits wide fluctuations and, in view of its OWn heterogeneity, warratns closer scrutiny. Accordingly, its principal components are listed in Table 6, showing the change in actual numbers of workers at the various censuses from 1901 to 1951.
The picture presented by Table 6 contains no great surprises. Categories 1 and 2, "hotels, restaurants and recreational services," 'and "legal and business services, arts, letters, and journalism." show appreciable lon.g'-term increases. Categories 3, 4 and 5. "barbers and beauty shops" (of the latter of which scmcely any exist), "laundry services,"
TABLE 6
2
3
4
5
6
7
TReNDS (TIT e~P.LOYMETlTT TN SUB-GROUPS (TITCLU D,ED UNDER SB'RV(CES TlT.OT E[.~EWHERE SPECTFIED"lN\THE PERIOD 1901-1951
(Tho'lSands ~f worker~, I,oth sexes included) .
1901 1911 1921 1931 1941
Hotels, restaurants and recreatlona\ services 275 350 284 332 531
Legal and business services, arts, letters, and Journalism. 159 144 144 135 235
Barbers and beauty shops 906 827 722 761 722
Laundry services • 1.038 1,103 1,016 1,017 940 •
Religious, charitable and welfare services 837 930 775 751 614
Domestic serVices (excluding ramilly members) 2,581 2,626 2,271 8,835 3790
Services otherwise unclassified 8,567 4.029 4,551
TOTAL 14,364 10,010 9,764 11.831 6,832
Source: lndia, Plantiin~ Commission (Labour and Employment Division) Occupational Pattt!rn of
]951
818
380
627
750
468
] ,746
4,800
9,589
Indian Union from 1901 to 1951. Table. IV, P. 11. with adjustments made ror 1931 ( See note for tal:lle 5.)
'India, Planning COl)] nission, op. cit., Atlll~1I:'Jrd r.
and "religious, charitable, and welfare services" respectively, all of which figure prominently in the jajmuni system, have: on the other hand, shown reasonably steady downward trenlis, which, considering the nati'onal population il1cerase from 1901 to 1951, are rather appreciable. One can attach little significance to the pronounced fluctuations of Categories 6 and 7, "dome~tic servicc~" and "['crvi..:es otherwise uncla5sirkd", especially the latter, as these arc exccedingly nebulous headings and apt to vary \vide1y in the statistics due merely to the difTerence 111
their treatment at "u(.'ct'ssivc enumerations.
In view of the many discre'p'ancies among the six censu~es of the period 1901 to 1951, the Planning Commission had to go to extraordinary pains to establish a series of comparable all India data. The Conunission has no illusions ahout the accuracy of these dat.1. It is not as sanguine about their worth 'as some Censu~ officials; but neither is it as dc~
pairing as the "\ational Tncomc Committee. It Jdmits the possibility that certain of its final rc,ults may be "far out", not only distorting the sequential picture for given categories (e.g., domestic services"), but abo· di<;tlll'bing the figure<;
lOItid., p. 2.
for other occupational categories lor a given yearlll. But it evidently feels that it has arrived at a meaningful general picture of the occupational trends Jf the period from 1901 to 1951. The author is in agreement with this view.
On the other hand, it docs not appear possisble to use the data to measure change on a regional basis. Kumcrous assumptions that had to be made for the nation as a whole could not safely be applied to specific areas. The regional analysis in the following chapter, therefore, must be limited Lo the data for 1~51.11
Two conclusions to be drawn from the d!Jove dbcussion a~pear inescapable. First, there is no way to ascertain for the whole of India, the true e'(tcnt of involvement in any field of economic endeavour. One may, as a rule, determine fairly accurately the number of people primarily engageu in a particulm occupation, but net the total number of people engaged, including tho~e engage'd On:J. sub~idiary basis. Second, there would be n\) point in attem'p'ting any regional study of subsidiary occupations llsing the data of the 1951 Census, however important the information may be for understanding the' regional variations in the Indian economy.
11[n spite of Daniel Thorner's personal warning that it c,)U1Jn'[ be done, the aut:lOr did attempt a statewise study of change in the period 1931 to 1951. Though he constructed a series or ten maps purporting to show change for five occupatIOnal groups (agriculture p'us four non-agricultural groups) using the comparatiVe data of CenJllS of /Ildia, Vol. J, Part I. B. Annexure rr, pp. 234-257, he was forced to conclude that the resultant patterns were meaningless. (Hyderabad, for example was shown to register a 40% increase in the share of the agricultural sector in the twenty years t:nder consideration).

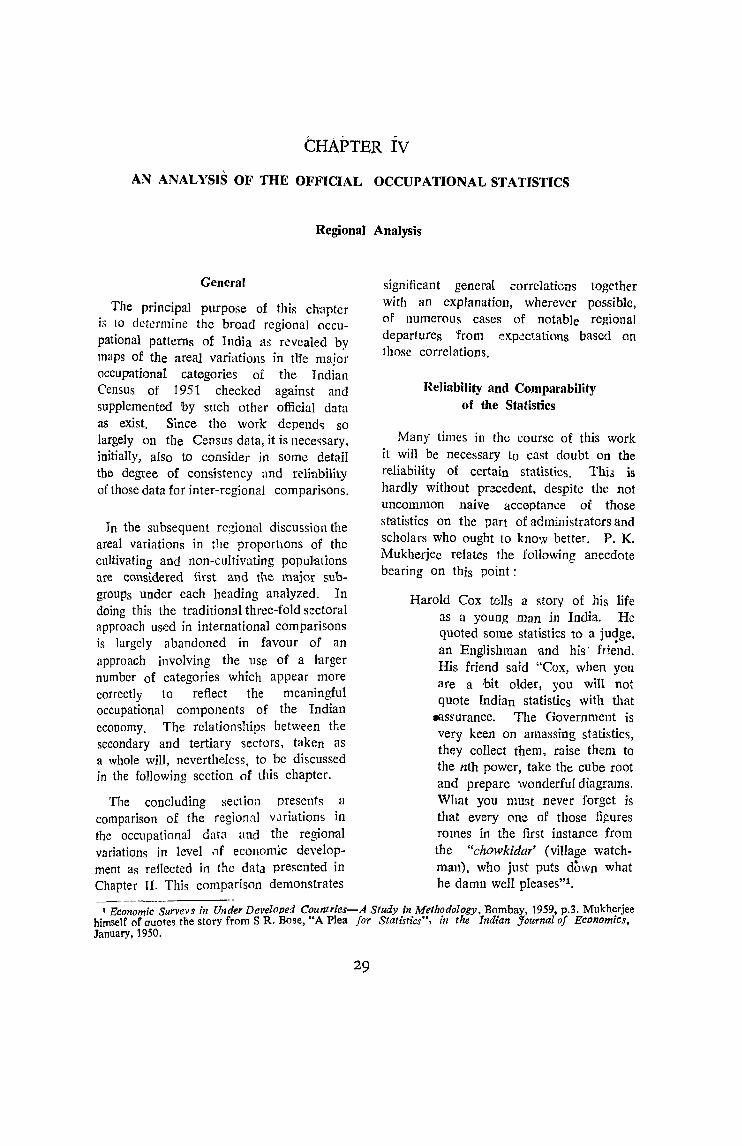
CHApTER iv AN ANALYSIS OF THE OFFICIAL OCCUPATIONAL STATISTICS
Regional Analysis
General
The principal purpose of this choarter is to determine the broad regional occupational patterns of India a~ revealed by maps of the areal variations in tHe maio'r occupational categories of the Indian Census of 1951 checked against and supplemented by such other official data as exist. Since the work depends so largely on the Census data, it is l1ece~sary, initially, also to consider in som0 detail the degree of consistency and reliability of those data for inter-regional comparisons.
In the subsequent regional discussion the areal variations in the proportIOns of the cultivating and non-cultivating popuhl.tions are considered first and the major subgroups under each heading analyzed. In doing this the traditional three-fold sectoral approach used in international comparisons is largely abandoned in favour of an approach involving the use of a larger number of categories which appear more correctly to reflect the meaningful occupational components of the Indian economy. The relation<;hips between the secondary and tertiary sectors, taken as a whole will, nevertheless, to be discussed in the following section of this chapter.
The conduding section presents a comparison of the regional vJriations in the occupational data and the regional variations in level nf economic dc\'elopment as reflected in the data presented in Chapter n. This comparison demonstrates ------------
significant general correlations together with an explanation, wherever possible, of numerous cases of notable regional departures from exp<!c1;ations based on those correlations.
Reliability and Comparability of the Statistics
Many times in the course of this work it will be necessary to cast doubt on the reliability of certain statistics. Thh is hardly without prxedent, despite tht~ not uncommon naive acceptance of those statistics on the part of administrators and scholars who ought to know hetter. P. K. Mukherjee relates the following anecdote bearing on this point:
Harold Cox tells a story of his life as a young man in India. He quoted some statistics to a judge, • an Englishman and his' friend. His friend said "Cox, when you are a bit older, you will not quote fndian statistics with that
.assurance. The Government is very keen on amassing statistics, they collect them, raise them to the nth power, take the cube root and prepare wonderful diagrams. What you must never forget is that every one of those Hgures romes in the first instance from the "chowkidar' (village watchman), who just puts down what he damn well pleases"!,
1 Economic Surveys ill UI~der Developed Countries-A Study in Methodology, Bombay, 1959, p.3. Mukherjee himself of Quotes the story from S R. Bose, "A Plea for Statistics", in the Indian Journalof Economics, January, 1950.
29
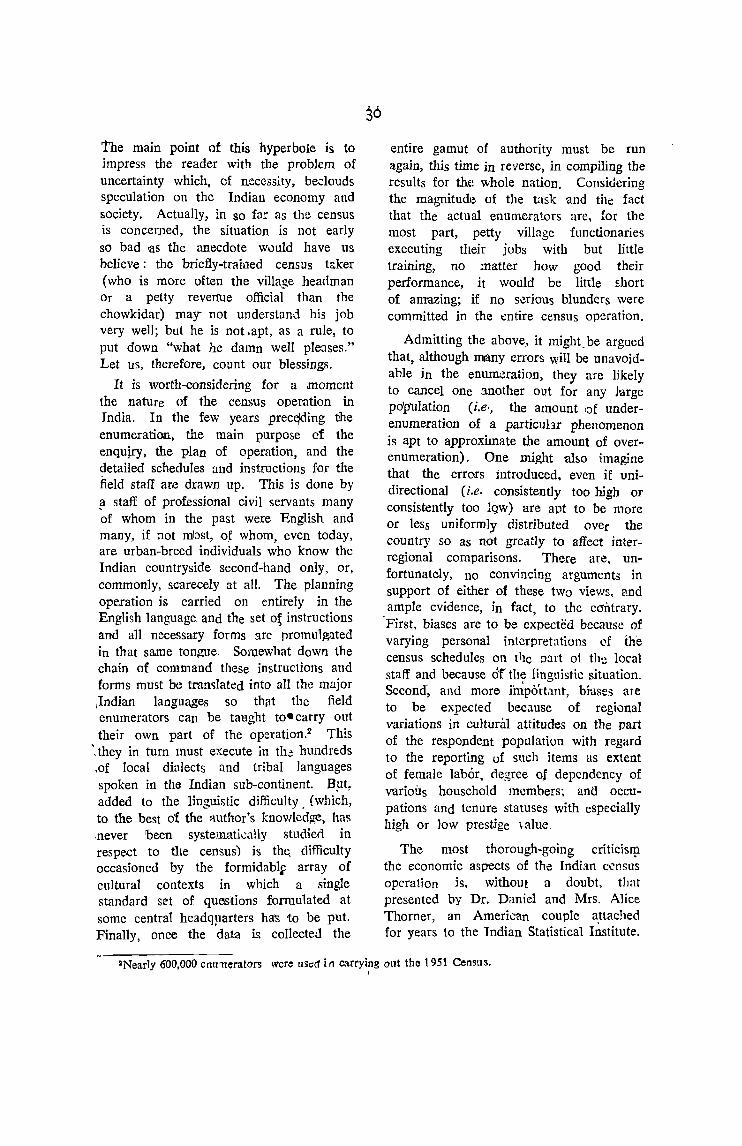
the main point of this hyperbole is to impress the reader with the problem of uncertainty which. of neces3ity, beclouds speculation on the Indian economy and society. Actually, in so far as the census is concerned, the situation is not early so bad as the anecdote w0uld have us believe: the briefly-trained census taker (who is more often the village headman Or a petty revenue official than the chowkidar) may lIot understand his job very well; but he is not .apt, as a rule, to put down "what he damn well plenses." Let us, therefore, count our blessings.
It is worth-considering for a moment the nature of the census operation in India. In the few years prece/ding tilie enumeration, the main purpose of the enquiry, the plan of operation, and the detailed schedules and instructions for the field staff are drawn up. This is done by a staff of professional civil servants many 'af whom in the past were English and many, if not mlost, o~ whom, even today, are urban-breed individuals who know the Indian countryside second-hand only, or, commonly, sc:arecely at all. The planning ope,ration is carried on entirely in the English language. and the set o~ instructions and all necessary forms arc promulgated in that same ton"..,<TUe. SOlvewllat down the chain of command these instructions and forms must b<~ tran,>lated into all the major ,Indian languages so th,lt the field enumerators can be taught to. carry out their own part of the operation.2 This
',they in turn must execute in tIl,! hundreds ,of local dialects and tribal languages spoken in the Indian sub-continent. B~t. added to the linguistic difficulty. (which, to the best of the :Ulthor's knowledge, has ,never been systematically studieo in respect to the census) is the, difficulty occasioned by the formidabtf array of cultural contexts in which a single standard set of quesitions formulated at some central headqparters ha's to be put. Finally, once the data is collected the
entire gamut of authority must be run again, this time in reverse, in compiling the results for th(! whole nation. Considering the magnitudl~ of the task and the fact that the actual enumerators are. for the most part, petty village functionaries executing their jobs with but little trmmng, no ;natter how good their performance, it would be little short of amazing; if no serious blunders were committed in the entire census operation.
Admitting the above, it might. be argued that, although many errors will be unavoidable in the enum~rati()n, they are likely to cancel one :mother Ollt for any l-arge population (i.e·, the amount I:)f underenumeration of a particullr phenomenon is apt to approximate the amount of overenumeration). One might al&o imagine that the errors Introduced. even iE unidirectional (i.e. consistently too high or consistently too lQw) are apt to be more or less uniformly distributed over the country so as not greatly to affect interregional comparisons. There are, unfortunately, no convincing arguments in support of either of these two views, and ample evidence, in fact, to the cdiltrary.
'First, biases are to be expected because of varying personal interpretations cf the census schedules on t!)e part 01 til:! local staff and because cif' th~ linguistic situation. Second', and more iinp6'rt.1J1t, bhlse3 are to be expected bec;mse of regional variations i; cultunll attitudes on the part
of the respondent population with regard to the reporting uf such items as extent of female labor, degree of depcndency of various household members; and occupations and tenure statuses with especially high or low prestige \ alue.
The most thorough-going criticisrp. the economic aspects of the Indian census operation lS, without a doubt, tllat presented by Dr. D;tniel and Mrs. Alice Thorner, an American couple a,Uached for years to the Indian Statistical Institute.
2Nearly 600,000 eml'nerators were lls~cf i n carrYi~g out the t 951 Census.
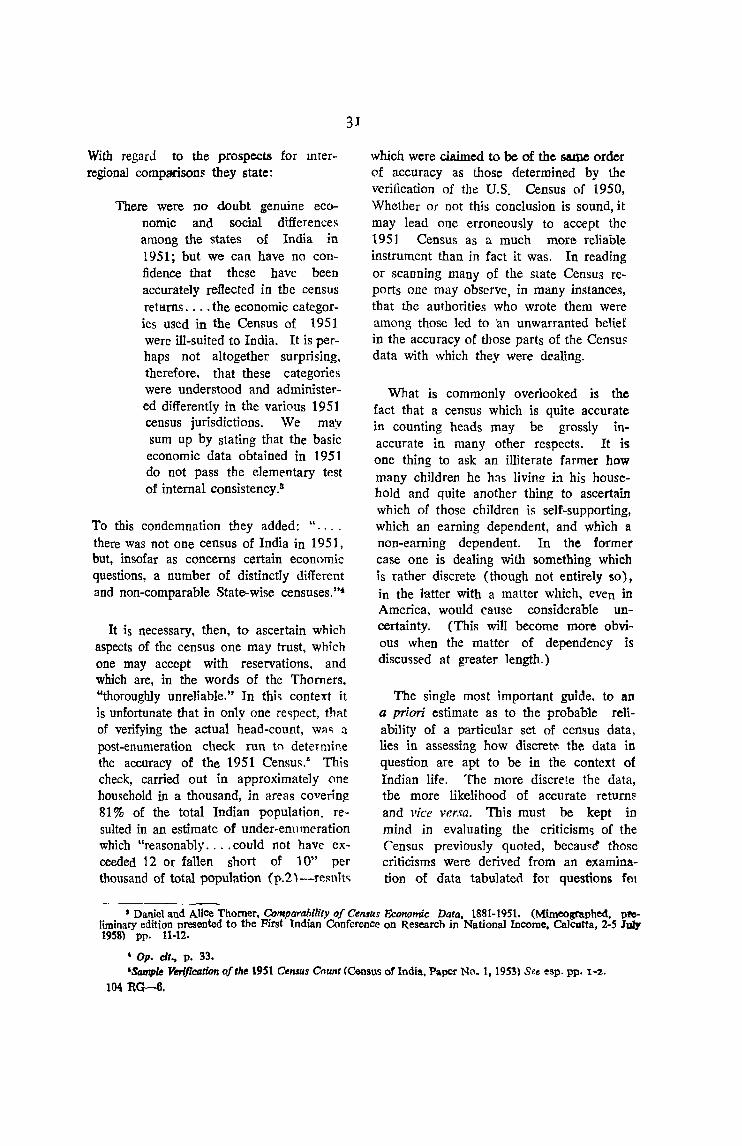
With regarJ to the prospects for mterregional comparisons they state:
There were no doubt genuine economic and social differences among the states of India in 1951; but we can have no confidence that these have been accurately reflected in the census retems .... the economic categories used in the Census of 1951 were ill-suited to India. It is perhaps not altogether surprising, therefore. that these categories were understood and administered differently in the various 1951 census jurisdictions. We ma'v sum up by stating that the basic economic data obtained in 1951 do not pass the elementary test of internal consistency.s
To this condemnation they added: " there was not one census of India in 1951, but, insofar as concerns certain economic questions, a number of distinctly different and non-comparable State-wise censuses."·
31
It is necessary, then, to ascertain which aspects of the census one may trust, which one may accept with reservations. and which are, in the words of the Thomers, "thoroughly unreliable." In this context it is unfortunate that in only one w;pect, that of verifying the actual head-count, wa<; ::t
post-enumeration check run tn determine the accuracy of the 1951 Census." This check, carried out in approximately one household in a thousand, in areas covering 81 % of the total Indian population. resulted in an estimate of under-enumeration which "reasonably .... could not have exceeded 12 or fallen short of 1 0" per thousand of total population (p.2)---reslllt<;
which were claimed to be of the same order (If accuracy as those determined by the verification of the U.S. Census of 1950, Whether or not this conclusion is sound, it may lead one erroneously to accept thc 1951 Census as a much more reliable instrument than in fact it was. In reading or scanning many of the Slate Census reports one may observe, in many instances, that the authorities who wrote them were among those led to 'an unwarranted belief in the accuracy of those parts of the Census data with which they were dealing.
What is commonly overlooked is the fact that a census which is quite accurate in counting heads may be grossly inaccurate in many other respects. It is one thing to ask an illiterate farmer how many children he has livin!! in his household and quite another thing to ascertain which of those children is self-supporting, which an earning dependent, and which a non-earning dependent. In the former case one is dealing with something which is rather discrete (though not entirely so), in the latter with a matter which, even in America, would cause considerable uncertainty. (This will become more obvious when the matter of dependency is discussed at greater length.)
The single most important guide. to an a priori estimate as to the probable reliability of a particular set of census data, lies in assessing how d,scret~ the data in question are apt to be in the context of Indian life. The more discrete the data, the more likelihood of accurate return8 and vice versa. This must be kept in mind in evaluating the criticisms of the Census previously quoted, becauc:e" those criticisms were derived from an examiIllltion of data tabulated for questions; fm
I Daniel and Alice Thorner, COMparability of Cen$US Economic Data, 1881-1951. (Mimeographed, preliminary edition presented to the First Indian Conference on Research in National Income, Calcutta, 2-5 July 1958) pp. 11-12.
, Op. cit., p. 33. ISampIe Yerification of the 1951 CelUUS Cnunt (Census of India. Paper No. I, 1953) See esp. pp. 1-2,.
104 RG-6.
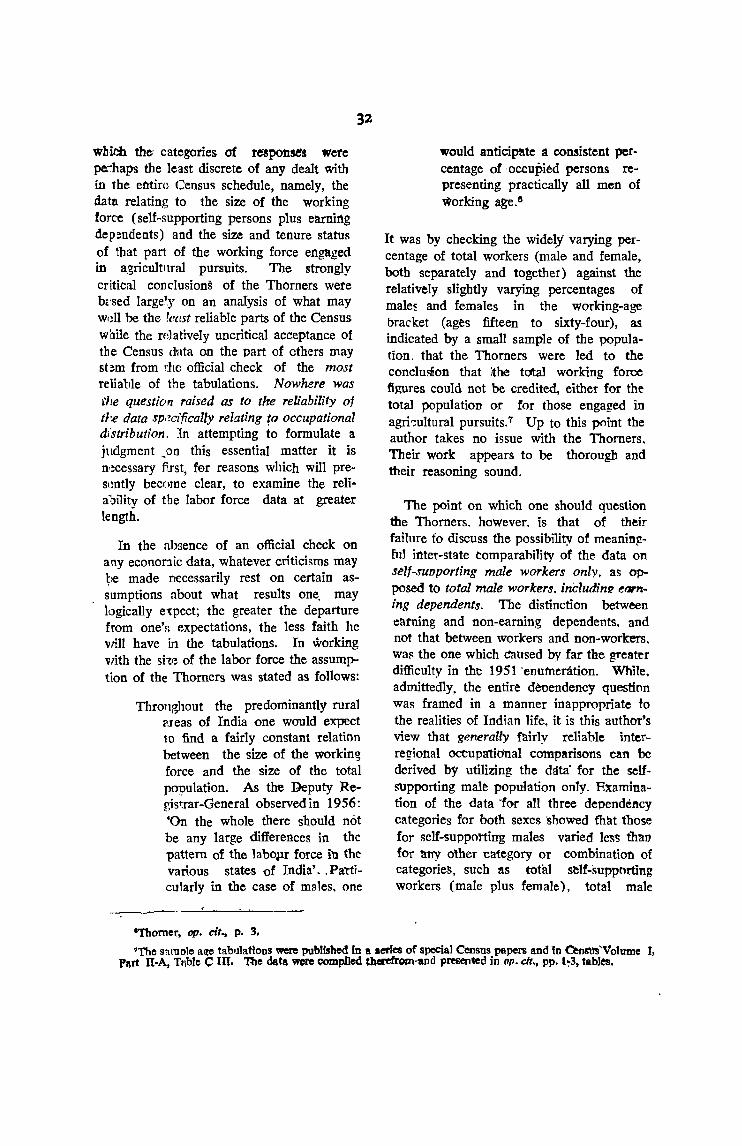
w1:Jieh the' categories of responses ~ete pe;:haps the least discrete of any dealt with in the entire Census schedule, namely, the data relating to the size of the working force (self-supporting persons plus earniI\g dependents) and the size and tenure status of that part of the working force eI\gaged in agricultnral pursuits. The strongly critical conclusions of the Thorners were bfsed largely on an analysis of what may wdl be the remt reliable parts of the Census while the, rdatively uncritical acceptance of the Census data on the part of others may st~m from dle official check of the most reliable of tbe tabulations. Nowhere was l'lre question raised as to the reliability of the data spr?cifically relating ~() occupational distribution, In attempting to formulate a judgment _oOn this essential matter it is fl'!cessary first, fer reasons which will preslmtly become clear, to examine the reli· ability of the labor force data at greater length.
32
In the absence of an official check on any econonic data, whatever criticisms may ~Ie made necessarily rest on certain assumptions about what results one. may logically e~l'ect; the greater the departure from one'~; expectations, the less faith he will have in the tabulations. In working with the she of the labor force the assum]>tlon of the Thorners was stated as fonows:
Throughout the predominantly rural PIeas of India one would expect 10 find a fairly constant relation between the size of the working force and the size of the total population. As the Deputy Registrar-General observed in 1956: 'On the whole there should not be any large differences in the pattern of the labopr force in the various states of India', . Particularly in the case of males, one
-Thorner, op. cit., p. 3.
would anticip~te a consistent percentage of ·occupied persons representing practically all men of working age."
It was by checking the widely varying percentage of total workers (male and female, both separately and together) against the relatively slightly varying percentages of male~ and females in the working-age bracket (ages fifteen to sixty-four), as indicated by a small sample of the population, that the Thomers were led to the conclusion that )the total working force figures could not be credited, either for the total population or for those engaged :in agri-::ultural pursuits.T Up to this pnint the author takes no issue with the Thomers, Their work appears to be thorough and their reasoning sound.
The point on which one should question the Thomers, however, is that of their failure to discuss the possibility of meaningfuJ iI\ter-state tomparabiliry of the data on stlf-sulJporting male workers only, as opposed to total male workers, indudinr? el7T",·
ing dependents. The distinction between ~arning and non-earning dependents, and not that between workers and non-workers. wa~ the one which C'aused by far the greater difficulty in the 1951 ·enumeration. While, admittedly. the entire devendency questinn was framed in a manner inappropriate to the realities of Indian ]ife, it is this author's view that generally fairly reliable interregional occupational comparisons can be derived by utilizing the data' for the setfsupporting male population only. Examination of the data 'for aU three dependency cl\tegories for both sexes showed t'h:tt tbose for self-suppotting males varied less fuau for any other -category or combination of categorie~, such as total self-supporting workers (male plus female), total male
7The sal1lo1e a~ tabJllations were pUblished in a aeries of special Census papers and in Qnsm'Volume y, l'a,rt II-A, T"ble C Ill. The data wtre complIed tberefrom"1lnd presented in op. cit .. pp. 1~3, tables.
workers (self-supporting plus earning dependents), or total workers.8 If we are to use any :set of occupational data at all, it must be with respect to this most reliably-enumerated group.
In order to permit the reader to see just how consistent the computed percentages relating to self-supporting males actually are, so that he may come to his own conclusions about the correctness of the assertions expressed in .the preceding paragraph, maps 3 and 4 are presented, showing those percentages (witnin class intervals framed with respect to the Indian mean) for the agricultural and non-agricultural populations respectively.
On map 3 it may be seen that the great majority of districts---:-207 out of the 302 for which data are available--fall within the modal class interval, varying by only 3.5% from the all-India mean of 23.5%. Virtually all of the area with greater positive-deviatioll from the mean is concentl ated in a bloc in the Northwest of India, especially in the states of Uttar Pradesh, Rajasthan, P.E.P.S.U., and Himachal Pradesh, while the negative deviations are quite scattered, mainly in the South and Northeast, and only rarely are very pronounced (i.e., with percentages below 17 %). One can only speculate as to the degree to which the map represents the real state of affairs in India rather than meaningless biases in the ,census enumerations.
In Western Uttar Pradesh and P.E.P.S.U. in view of the extent of irrigation and the disinclination in this area of strong Moslem cultural influence to let women do field labor, it does seem probable that a genuinely high percentage of self-supporting male labor exists in agriculture. But a disinclination to let women work may be coupled with a disinclination to admit that women do work when that is the case and an 41clination to over-estimate the degree of self-supporting labor among males. This -----
33
might well explain the monolithic bloc of territory in Western Uttar Pradesh where over 30% of the agricultural population are counted as self-supporting males. Significantly, the area of India which shows by far the lowest share of self-supporting females is Western Uttar Pradesh, Punjab, and P.E.P.S.U.
But these arguments do not apply so much to Rajasthan, long a center of re~istance to Muslim influence, and still an area where the attitude toward women doing field work is not nearly so strict as in the areas just discussed. Here, it is suggested, owing to the evenness of the high percentage extending over practically the entire state, that there was somehow an admInistratively induced bias toward over-{:numeration within agriculture. In marked contrast to the area previously discussed, Rajasthan has the highest share of sell-supporting females in agriculture in the whole of lodi a. Yet, the lowest district percenLlge of se:1-supporting males in India; 11:.'%, is alia found in Rajasthan in the District of Churu. This would appear to be one or a number of scattered anomalies in the pUJlished data which can only be explained by a strong local bias in enumeration-in this case a bias counter to that presumably introdu;ed at the state level. (The district, not surprisingly, turns up as unusually low on Dlap 4 also.)
There may well be an administrative, upward statewide bias in the enumerat.on within P.E.P.S.U., as well as in Rajastbu, since every district therein score, high, and two districts out of eleven and Jow in Punjab, by contrast, scores high in only two districts out of eleven and low 1n another two. Alternatively, there may be a downward bias in reporting in Punjab.
The areas of India with percentages of self-supporting male labor betow that of the. modal class fall largely into two categories: areas of high rates of male emigration, primarily in peninsular India; and
8 The a.11-India percentages according to dependency status are given in Appendix A, Table 2, wherein they are broken down by sex, agricultural vs. non-agricultural populatio11l, and rural us. urb!\o populations. The various dependency status types are defined in the footnotes.
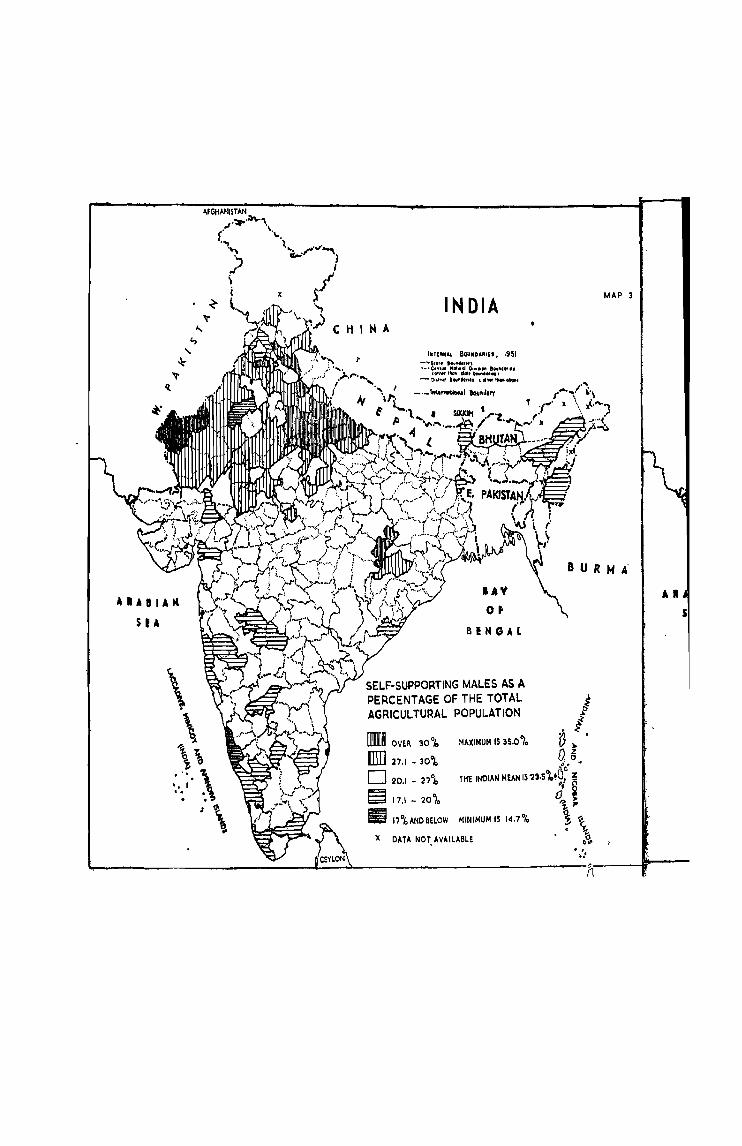
••• B I A It
SEA
\ \ ~ \\
""\ " I , , . . ,
1\ ~
INDIA
lAY O.
BENGAL
SELF-SUPPORTING MALES AS A PERCENTAGE OF THE TOTAL AGRICULTURAL POPULATION
m OVER 30o~ (]]] 27.' _ 30·~ 020., - 27"k
~ 17.1 _ 20·,.
MAXIMUM IS 35.0"1.
• l7obAN08ELOW MINIMUM IS 14.7"10
X DATA NOT, AVAILABLE , . . ,'
MAP 3
" II
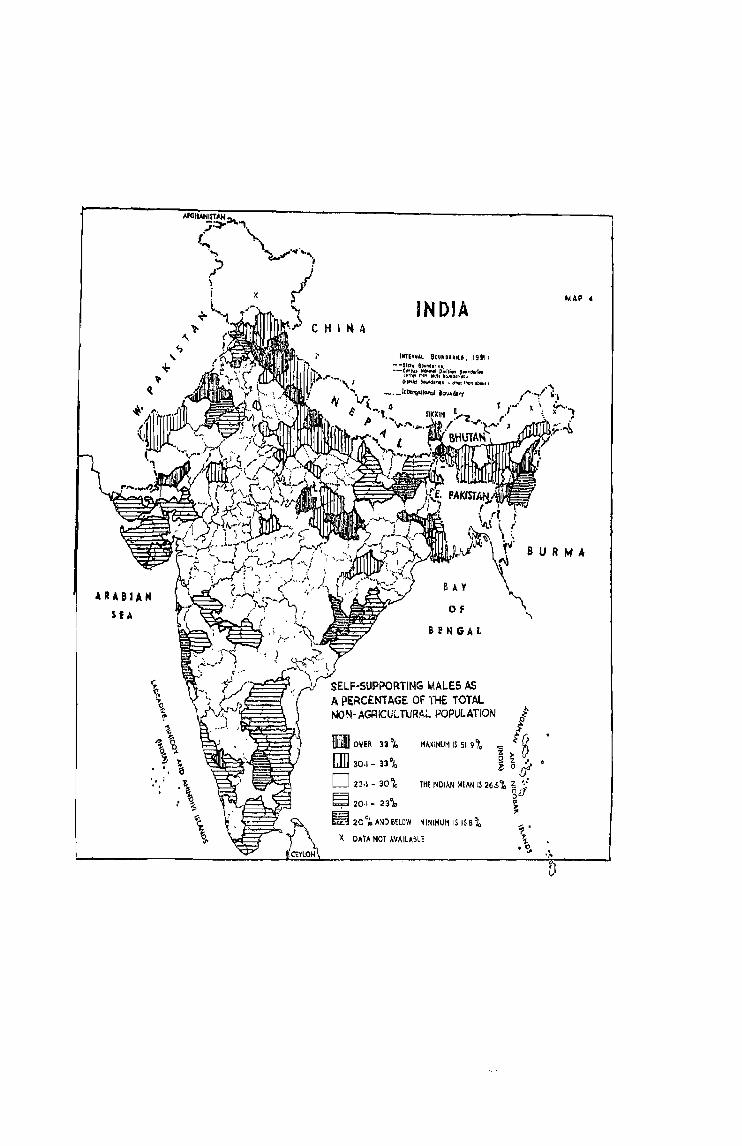
ARABIAN
UO\
IND1A
'NTE'1t1"" 8CUJlDUIU, 19~ I
--!ll,,_ BOllnhrllt
.. -~:;t.: rr,~-:~r:=o!.~td"'r.. Oi.rr.<t ~$IIotIIII."I" ~OIhf! "'III~_'1
_._I' .. I1l.\IooQj .... ~
MAP 4
BURMA
BAY
Of
Sl!NGAL
SELF-SUPPORTING MALES AS A. PERCENTAGE OF YHE TOTAL NON- AGRICULTUR.t.t. POPULATION
.. l
I!liiI om 33 "I.
Dll 30·1 - 33 °10
02".1- 30'k
M~~lMUM IS 51 9 \ '" I () :z:,. D 5! z .,,' " 1: 0 Ii
~ 20·1- 23%
THF. INDIAN :4!~N IS 26.s't ; '·f go "
~ 20 ciO AND &£LOW MINIMUM IS 16.8 "10 ~
l( DATA NOT AVAILA&LE
areas of plantation agriculture in Northeastern India, the Malabar Coast, and higbland Mysore. In the latter case a low percentage of male workers in agriculture proper seems to be correlated with a high percentage of workers in non-agricultural occupations under which employment on plantations is enumerated. Only three districts appear in the -lowest class of all, that with under 17% of male self-supporting workers: Churu, which was previously noted; Madras, where many males may be diverted to non-agricultural occupations; and South Kanara, where there is a limited development of plantation agriculture and possibly also some influence carried over from the matriarchical system prevailing in the not-quite-so-Iow-scoring district of Malabar immediately to the South. But here again we may simply be confronted with a biased enumeration.
Of some interest is the fact that the two class intervals below the modal class are represented by less than half as many districts as the two above. Partly this is due to the fact that they are generally more populous districts. Partly too this may be attributed to the fact that the distribution of scores departs somewhat from that of the normal curve. There is a swelling in the representation of districts in the highest class interval, represented primarily by the already discussed, presumably biased returns for West Central1.Jttar Pradesh, and a compensating de:parture of the mode to a position below the mean yet still within the modal class.
A final and important word about bias. No reference has been made to any biases in regions shown within the modal class, i.e., those left blank on the map, except for the possible case of under-enumeration in Punjab. Such biases may indeed exist in India;, but cannot be recognized"in any systematic way. Their existence is most probable, however, in those areas appearing on the map as islands or peninsulas of "nonnality" (i.e., blankness) in a surrounding sea of departure from same. ltottayam
and Trichur Districts of tke Malabar Coast area; for example, may be over-enumerated districts in which the true percentage of self-supporting male workers is really well below the Indi~ mean.
On map 4 we find a somewhat more erratic distribution of areas, departing significantly from the Indian mean of 26·Sro. Yet, even here 191 out of 302 districts classified fall within the modal class; and the map as a whole contains few great surprises. That the all-India nonagricultural mean is 3 % higher than the agricultural mean may be explained quite simply by the fact that larger numbers of under-employed dependents are maintained in farming households than can be kept in non-agricultural households.
There is a fairly common tendency for the regions. which score high on map 3 to do so also on map 4 and vice versa, though the extent of the areas and the degree of departure from the mean vary. Thus, we see that the area of West Central Uttar Pradesh, which stood out as the highest scoring large region on map 3, is classified on map 4 primarily within the second highest, class interval, while large areas along the West Coast, in the Deccan Lavas and in Tamil Nad score Iowan both maps.
But there are also numerous areas in which maps 3 and 4 are quite different. It has already been noted that areas of plantation agriculture tend to score significantly higher on map 4 than on map 3. So too do certain areas of developed industrialization where there are large numbers of immigrant male laborers, as in the Wes~ Bengal-Bihar industrial region and Bombay. (But wby not also Ahmedabad and other relatively industrialized regions?) A third category of area tending to score noticeably higher on map 4 are the sparsely populated mountain districts along India's northern frontier. This may be explained by the fact that a relatively large proportion of the small tOtal number of non-agricultural workers are
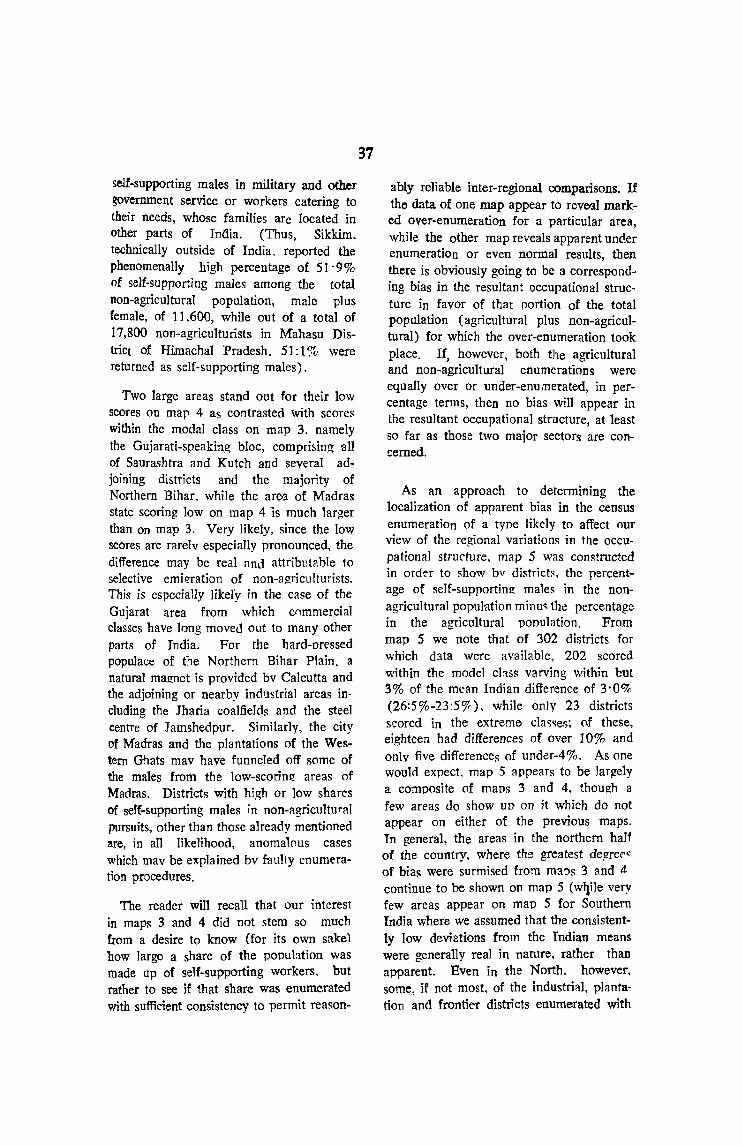
self-supporting males in military and other government service or workers catering to their needs, whose families are located in other parts of India. (Thus, Sikkim. technically outside of India. reported the phenomenally high percentage of 51' 9 % of self-supporting males among the total non-agricultural population, male plus female, of 11 ,600, while out of a total of 17,800 non-agriculturists in Mahasu DistriCt of Himachal Pradesh. 51: 1 % were returned as self-supporting males).
Two large areas stand out for their low scores on map 4 as contrasted with scores within the modal class on map 3. namely the Gujarati-speaking bloc, comprising '311 of Saurashtra and Kutch and several adjoining districts and the majority of Northern Bihar, while the aroo of Madras state scoring low on map 4 "is much larger than on map 3. Very likely, since the low scores are rarelv especially pronounced, the difference may be real and attributable to selective emigration of non-agriculturists. This is especially likel'y in the case of the Gujarat area from which cnmmercial classes have long moved out to many other parts of India. For the hard-pressed populace of the Northern Bihar Plain. a natural magnet is provided bv Calcutta and the adjoining or nearby industrial areas in· cluding the Jharia coalfields and the steel centre of Jamshedpur. Similarly, the city of Madras and the plantations of the Western Ghats mav have funneled off some of the males from the low-scorinl! areas of Madras. Districts with high or low shares of self-supporting males in non-agricultural pursuits, other than those already mentioned are, in all likelihood, anomalous cases which mav be explained bv faulty enumeration procedures.
The reader will recall that our interest in maps 3 and 4 did not stem so much from a desire to know (for its own sake) how large a share of the popubtion was made up of self-supporting workers, but rather to see if that share was enume.rated with sufficient consistency to permit reason-
37
ably reliable inter-regional comparisons. If the data of one map appear to reveru marked over-enumeration for a particular area, while the other map reveals apparent under enumeration or even normal results then , there is obviOUsly going to be a corresponding bias in the resultant occupational structure in favor of that portion of the total population (agricultural plus non-agricultural) for which the over-enumeration took place. If, however, both the agricultural and non-agricultural enumerations were equally over or under-enumerated, in percentage terms, then no bias \vill appear in the resultant occupational structure, at least so far as those two major sectors are concerned.
As an approach to determining the localization of apparent bias in the census enumeration of a type likely to affect our view of the regional variations in the occupational structure, map 5 was constructed in order to show bv districts, the percentage of self-supporting males in the nonagricultural population minuc; the percentage in the agricultural population. From map 5 we note that of 302 districts for which data were available, 202 scored within the model chss varying within but 3% of the mean Indian difference of 3'0% (26:5%-23:5%-), while only 23 districts scored in the extreme c1a~~es; of these, eighteen had differences of over 10% and only five differences of under-4%. As one would expect, map 5 appears to be lar!!ely a composite of maps 3 and 4, though a few areas do show UP on it which do not appear on either of the previous maps. In general, the areas in the northern half of the country, where the greatest degree''' of bias were surmised from mans 3 and 4 continue to be shown on map 5 (w~i1e very few areas appear on map 5 for Southern India where we assumed that the consistently low deviations from the Indian means were generally real in nature, rather than apparent. Even in the North. however. some, if not most, of the industrial, plantation and frontieT districts enumerated with
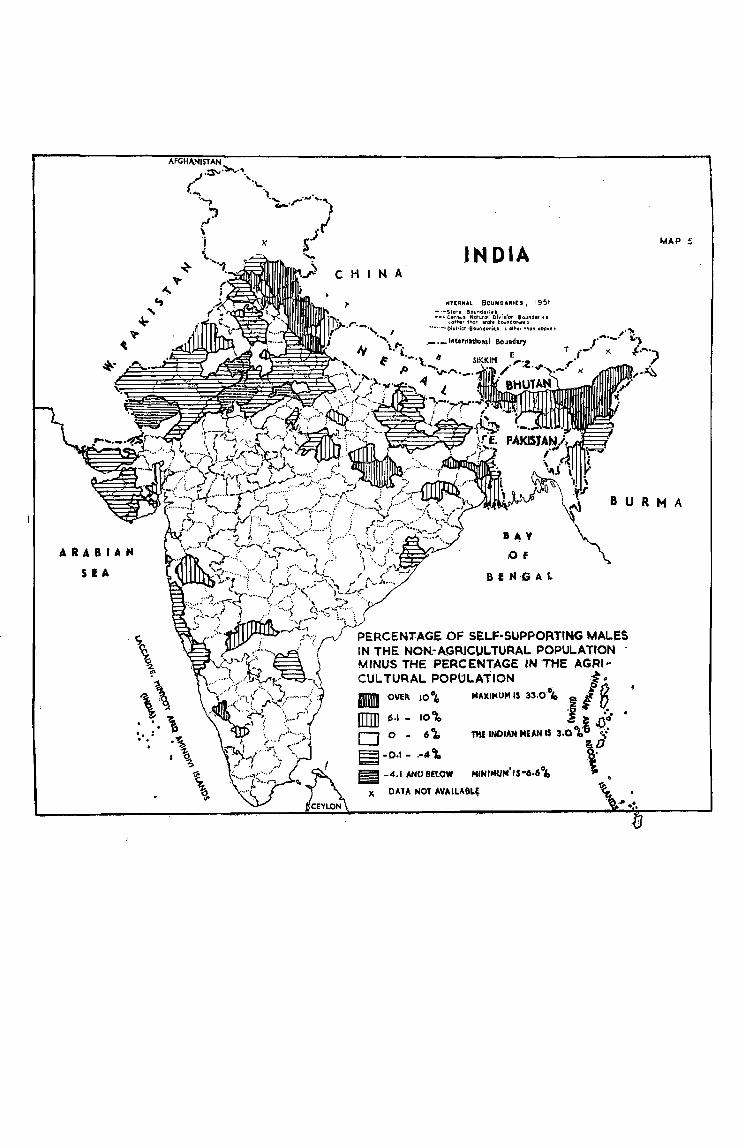
ARABIAN
SEA
'S!
\ oj,
\\ ~ .. \ .. : ..
--.~.~ .I'~- " . ',-
f.... " . . "-) ·~.r·"'''·l\
r-I" J , jf' S '",
CHI N A IN 01A
INfUNAL 90UNt'''IE:!. 195t -· ... 'Slot. BOII~dorjt' ·_"C'!"I'I1I1o Noh"OI Diwil"OtI !Olll'lcl-or't.
~O.""f th(lr. ,'Qt. bCo.l"do,.t'$1 ~ ... ,,- 01",ier 'BttOll"ldo"i-u ~ ""'" t~O" ot>Q~"
._, _lnternatlo .. 1 Boundary
MAP !;
8 U R M A
8~Y
.of BfN-GAL
PERCEN'f.AGE OF SELF-SUPPORTING MAt.ES IN THE NON-AGRJCULTURAL POPULATION MINUS THE PERCENTAGE IN 'THE AGRI-CULTURAL POPULATION .'1.
~. ~(l III OVEP. 10°",
rmn (,.1 - 10%
DO .. 6\ ~-O.I- ... 4%
MAXIMUM IS 33.0 lo t.~ D :i ~ ... 0
... i.o° TtI£ INDIAN MEAN IS 3.0'" ·;f
\D IiI -4.1 NfOSEt.OW MINIMUN"S-6.6°,
X 0"'" NO' "V"ILABL~
especially high proportions of self-supporting males in the non-agricultural popul::!tion arc presumed really to have a distribution of laborers approximating that indicated by the census.
Admitting that biases are bound to affect the regional comparisons, the question remains of determining to ,,,,hat degree are they apt to alter the occupational structure derivable from the statistics. By way of illustration, let us suppo~e that a district i~ enumerated as having 33 '5C;~ of its agricultural population as self-supporting males (equal to the Indian mean) and 37'17r of its non-agricultural population (10, 6 % absolutely, and 40ft relatively, above the Indian mean of 26'5%, which is enough to place it in the extremely high category of map 5). Let us make the additional. but rather unlikely, assumption that the lattcr high enumeration is due wholly 10 bias. Finally. let us suppose that, in our hypothetical district, 65% of those enumerated as self-supporting males are in agriculture and 35% in all other occupations, which is not far from the Indian average. What, then, should the correct percentages be? The figure for non-agriculturist<; is inflated by 40% due to bias and should be reduced to ten-fourteenths (or 5/7) of its enumerated size, that is to 257r. The figure for agriculturists should then be 75'7r instead of 65%. Thus, we see thltt it was deflated due to bias by ten-seventy-fifths or 13' 3 %.
The errors indicated in the preceding paragraph are, of course, not insignificant. On the basis of numerous comparisons. however, it appears cxtremely improhable that errors of such magnitude. due to the causes here discussed, occur in morc than one case out of say fifteen, or possibly even twenty. The conclusion drawn therefore is that, by and large, so far as agricultural versus 1Wn-agriclIlruraJ workers arr> concerned, the local variations in o("('upational structure using the figures for self-support
ing males generally represent approximations to the true state of affairs which arl' close enough for meaningful regional ana-
104 RG-7.
39
lysis. )lcvcrtheless, in the remaining p'arts of thi" chapter occasional references wil1 be made to map 5 when it is felt that the regional comparisons tend to bi:! vitiated by bias.
Going beyond the above analysis, there are a number of ways to te5t for probable bias among thc sub-groups withrn both the agricultural and the non-agricultural populations. For the agricultural population, which is sub-divided by tenure status into four categorie~ (See graph 1 and text relating thereto) one can compare the Census results with those of the rather disparate findings of the presumably more carefully executed Agricultural Labour Enquiry. This will be done in the following section of this. chapter. For the non-agricuItural popUlation one can hypothesize the existence of bias for a particular occupational category when its proportion of the total non-primary sector deviates very markedly from the national average, and when no l'airly obvious reason for ~uch deviation can be found. Such cases are far from rare, a<; shall be seen, though their importance in the total scheme of things is not especially great.
Where an unusual degree of bias within the non-agricultural ~ector is supposed to cxist. a probable explanation is that for the area in question re<;ponscs to the occupational query of the Census were given not in terms of de facto occupation. but rather in terms of caste occllpation, whether or not the latter were actually pursued on a primary basis or at all. There is evidently a very wide~pread tendancy in India for non-agricultural caste members. especially those working within the jajmani system, to rcport thcir caste work as their principal means of livelihood even when most • of their working time is expended in. and most of their income is derived from, agriculf.ure. Landle<;~ agricultural laborers and casual menial laborers outside of 3j.!riculture may be expected to be particularly loath to report those occupation" if there is any other of equal or higher prestige to which they may make some claim.
But why' should a bias operative throughout India emerge in'..tbe statistics as being ~eular1y strong fOT: a given occupation in a giVett area? '!\vo explanations come to mind. The first stems from the fact that the caste occupational gr01lps are th'emselves· very unevenly distributed' throughout India, such" that a, 30% upward bias' in tIie' enumeratiorr. of potters, for 'example, in an area where potters are few to begin with would scarcely be noticed,. while in another area where potters are abundant the increment would be· appreciable on an absolute basis.. The second possibility is that, within a' particular. census jurisdiction, the officials interpreted (Jnadvertently- or by choice) the occupational. question of· the census as being actuallyc a veiled attempt to detennine the caste structure. of the area. It. should. be noteo. in. this context that the 19-51 Census substituted a basic classification of the
\ population. according' to means of livelihood. for the basic caste-wise classification of. all· previous censuses.
The reader wiUrecall the emphasis.placed on discreteness as a. criterion making for accurate enumeration. On this basis alone certain occupations ar~ much. more susc6]?tible of erroneous enum~ration than others, espec~ally in t~e ill-fitte9 adaptation of the International Standard Industrial Oassification used in the 1951 Censl!!;. Some occupations, those of goldsmithing, teaching, plantation labor, or weaving, for example. are much more discrete and apt to be correctly counted' than are certain others, such as agricultuiallabor, "domestic service~", construction work, or "services otherwise unclassified". Similarly, certain aggregations of occupations (e.g., "Processing and Manufacturing [ofl Metals, Chemicals, and Products Thereof') are mucli more likely to be correctly c~unted than certain others (e.g., "Services Not Elsewhere Specified").
Particularly troublesome is- the census occupationa1 sub-gro;11p- 9.0, "Services- otherwise unclassified," the largest C<11npon'ent, by far, of group 9, "Services Not Elsewhere
Specified." Map -6 depicts* thb distribution of w.orkers so classified. The mean' pelcentage of workers in category 9"0 is not esp~cially high, only-3'4%, which is 11 ~'2% of all workers outside the primary sector; and if they were distributed throughout Ipdia in the same proportioml as other non-primary workers they would .not be the cause of much concern. Unfortunately, this is not the case. In -certain areas, most notably northern and western Uttar Pradesh, Orissa, parts of Rajasthan, Kutch, parts of Saurashtra, and Malabar District and some nearby areas, they appear to be particularly numerous relative to the total number in the non-primary sector, often exceeding a fifth and occasionally a third of those so classified. In Malabar District services otherwise. unclassified actually includes nearly one out of every ten self-supporting males! Yet, in· adjacent and economically similar Trava..lJ.core-Cochin only one out of roughly two-hundred is reportedly so engaged! Similar incredibly large differences are encoun.tered on crossing state- boundaries elsewhere, e.g., going from Punjab to P.E.P.S.U. or from Orissa to Madhya Bharat. Clearly then we are dealing with a distribution which has little or no intrinsic geographic significance, but which results rather from widely varying local decisions on how to classify those workers with· the least clearly defined occupationst
To the e~tenf that dcctiiSatibtilll' subgroup 9'0 is swollen, other occupatiorra] groups are under-enumerated and vice versa. But just which groups are they? Probably the group most seriously affected is agricultural class nI, agriculturallaborers though' this surmise may not be botne out in all areas. Duting siack seasons in agriculture many such workers who are 'not attached to a pat'ticular employer or set of jajmans, an'd even some who are theoretically attached, drift about in the towns and cities looking for any work they clm find. If they are enumerated away from their customary employment they are especi'ally likely to be classified in the g·O category, along with the not inconsiderable numbers
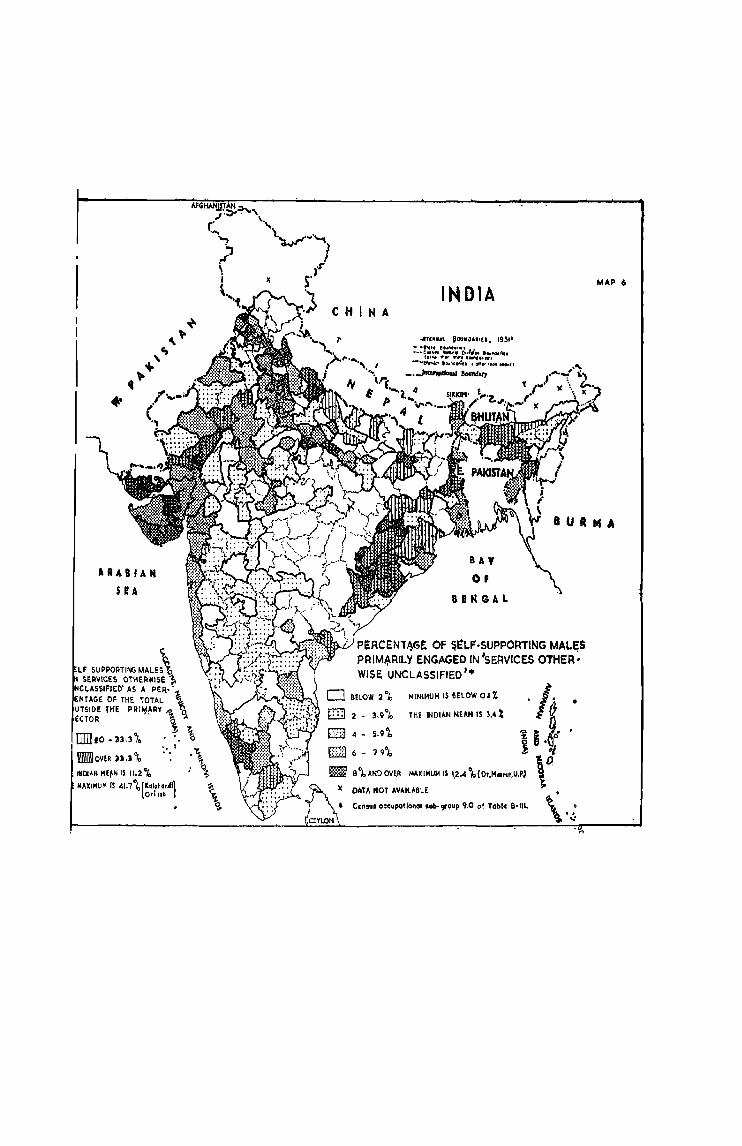
ARABIA"
SI!A
~
LF SUPPORTING MALES\ SERVICES OTHERWISE 1;.
NCLASSIFIEO' AS A PER"." ENTAGE 01' THE TOTAL ~ UTSIOE THE PRlt.J~RY 1. ~ ECTOR <:1 '"
Z; \ .' 0 '. '
lllIlOV1R 31.3 % ItIDiAN JoIe,N 11 11.2 oj,
MAXIJoIUM IS 41.7°I,,[K.I.~.n411 Or1,,0 I
IN DIA
''''tllllln BOUIH'.lItIU. 195t'
:-.. :~:I,tn e::::"o .. li~ I.~""''', CI'''''''',''''GI.I:IDIIII''.,·,U -'atl"ol,t,,,,,,,,,:,, \~ff'''Ofl''''"
BAY Of
81HGAL
~:'fN~~{/ PERCEN1~C;! OF ~~LF·SUPPORTtNG MALES PRIM~RILY ENGAGED IN 'SERVICES OTHER: WISE UNCLASSIFIED '.
MINIMUM IS BELOW OJ t "Iii. 2 _ 3.9°k
4 - 5.9'),
19°j,
THE INDIAN HEm IS l.41 (l
i 5.glf . i ./
t. 0, MAXIMUM 1$ 1.2.4 0/0 (D •• MA"",U,PJ ~
r. )( DATA NOT AVAilABlE
• Cens .. ceeupatlonal ••• group '1.0 01 Table &-111. \' .: .:
MAP 6
of people who have no customary employment at all, but who shift from one type of laBor to the next as odd jobs become available. (It is worth noting in this context that the share of workers in "services otherwise un-classified" is 7' 3 % of the total in urban areas of India as opposed to only 2·5% among the rural population.)
It would po~sibly have been advisable to have altogether excluded the workers in "services otherwise unclassified" from the population prior to determining any percentages of employment in given occupational groups. CertainJiy where the number of workers so classified is inordinately high it would seem to inflate the tertiary and deflate the primary sectors of the 'economy. Yet in a few areas, most notably Travancore-cochin and P.E.P.S.U., the number of such workers seems inordinately low, 'and other categories may be slightly overenumerated, introducing small bias in the opposite direction. In fact, however, it must be admitted that census sub-group 9' 0 was included in this study primarily because its abberant distribution was discovered only after the rest of the occupational calculations had been completed.
In general, to summarize, there is no sure or systematic method tor recognizing bias in the Census data and, where bias is recognized, there is no objective way of determining its magnitude. If one is. unfamiliar with an area, it is even possible that ,he will accept at face value figures containing appreciable bias. This does not mean that a regional analysis of the census occupational statistics will serve no good purpose; rather it does point upJhe importance of field work as a supplement to whatever statistical analysis is undertaken.
The Agricultural Versus the Non-agricuUurar popula.tion
The term "agriculturaI population" as used in this study accords with the usage of ll,able B-1 of the 1951 Census of India. Actually it is somewhat of a misnomer
insofar as it relates to cultiva:tors of field crops only and excludes persons dependent on stock-raising, the rearing of small animals and insects, and plantation work~ all normally considered agricultural pursuits. These are excluded from the "agricultural population" of Table B-1 and included instead, along with hunting, fishing, fOIesttty and collecting, mining and quarrying, construction and all types of lllanufacturing and processing industries from handicrafts to factory production, under "production other than cultivation," a virtually meaningless rubric. Fortunately, each of these items can be singled out from Table B-III, which deals with the selfsupporting workers in "all industries and services" (i.e., other than "agriculturists", as designated by the Census); and it would be possible to add to the cultivators the other occupational categories necessary to arrive at a true picture of the total agricultural population of India. For relatively few districts, however, does the difference between the number of cultivators and the total number of agriculturists exceed two per cent, SO that a map of the former reasonably well reflects the latter, which has not been separately mapped. Maps of the highly localized distributions of plantation workers and stock-raisers (in significant numbers) and the distribution of the total primary sector have, however, been included in subsequent sections of this chapter. For reasons of simplicity and convenience this section is devoted solely to the discussion of the agricultural population, as defined by the census, versus its complement, the population deriving its livelihood from "all industries and services," -or, more precisely, to the self-supporting males in each group.
The regional variations in the percentage of cultivators among self-supporting males is shown on a district basis by map 7. On this map several areas and a number of scattered districts stand out as being wen below the Indian mean of 67'8%, while several other areas stand out as being well
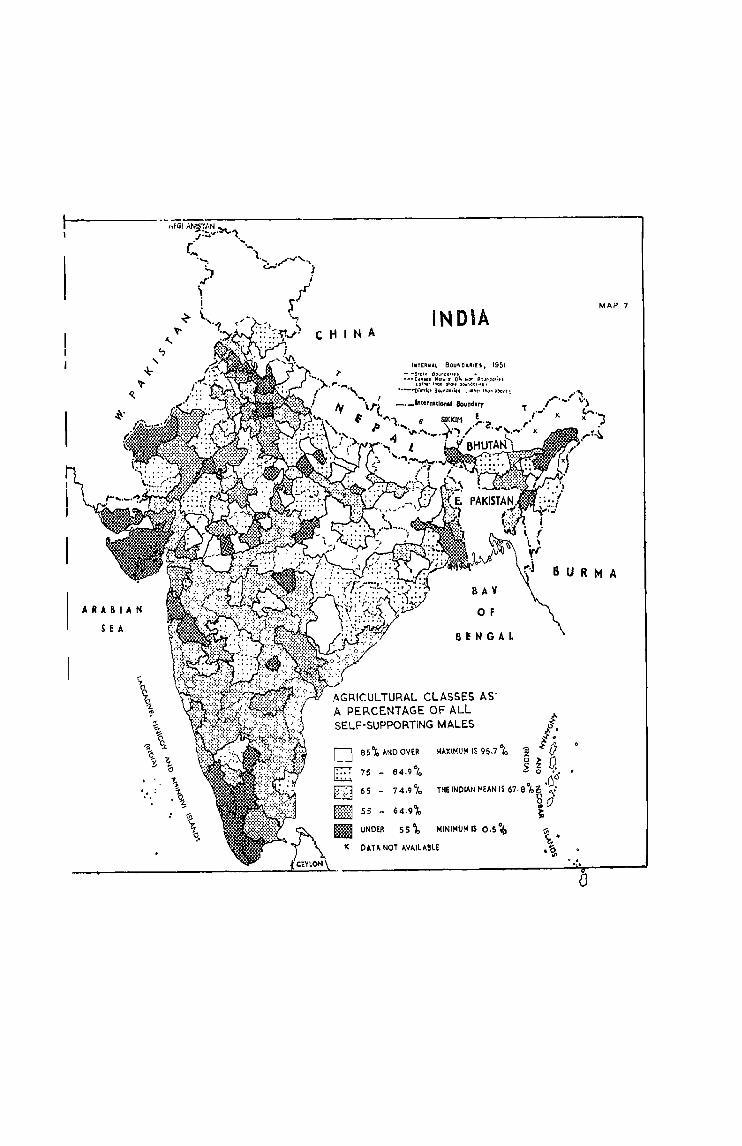
ARABIAN
SEA
IN CIA
/"TVIN,lL BOUNCUI[S. 1951 - -S'l)lf eo~~da"" .. - ... - C.nllli NCltw'''' Ol~ .. O~ I'! '<111.311';"
utll'flilon ,1(11, bOo.rn~o.,n'
•• ... -'1) •• 1,1,,, 8ov~llc,lfI • CIII'I" I~OIl !lbowt ~
SAY
o F
SENGAL
AGRICULTURAL CLASSES AS' A PERCENTAGE OF ALL SELF-SUPPORTING MALES
o o CJ Ern
8S°k, MID OVER
75 84.9°'0
65 74.9°'0
55 64.9\
UNDER 55\ m MINIMUM IS 0.5 ~
" 011.1,0. NOl AVAlueLE
MAP 7
BUR M A
~ ____________________________________ .~ .. ~.~-------J []
above the mean. The majority of the countr1y, however, varies relauvely little from the mean, positive deviations being considerably more num.erous than negative. (The median proportion of cultivators is not quite 70% ). The following regional analysis begins with the areas in which the greatest proportions of agriculturists are found and proceeds to those which are progressively more diversified. In following the discussion the reader is advised to utilize map -2, showing the regional variations in level of economic development, as well as map 7.
The principal areas in which more than 85% of the self-supporting males are engaged primarily in aiI'iculture are: ( 1 )
much of the mountainous frontier areas of Himachal Pradesb, Uttar Pradesh, Assam and Manipur; (2) much of the northeastern part of the "plateau" region south of the east-central' Gangetic Plain; (3) the large former native state of Bastar in southernmost Madhya Pradesh; (4) a block of three mountainous districts of southern Rajast4an and Madhya Bbarat; and (5) a large part of the Gangetic Plain in Bihar and eastern Uttar Pradesh, especially in the area between the Ganges and its tributary, the Gogra, and the Nepali frontier.
The first four of the above-mentioned areas can be considered as a group since they are all parts of backward regions with an unusually high concentration of essentially tribal population. Here occupational specialization, as found \lllder the Hindu jajmani system, is relatively rare, each cultivating family supplying many if not most of its own non-agricultural needs. Wbile bunting, fishing, and gathering are common subsidiary occupations among tribal peoples, the individuals or tribes who subsist mainly from such endeavours·is now numerically insignificant. Trade is often on an individual barter basis. In northeastern peninsull:U' India, much of eastern Madhya Pradesh lies barely outside ,this most strong-
ly as¢cultural category, while much of
44
adjacent Orissa would presumably be SO classified were it not for the fact that SO
many workers there were classified under "services otherwise unclassified", rather than under agriculture.
The Gangetic Plains area is quite another case. It occupies a region of highly intensive, peasant agriculture with very little salable surplus food and virtually no non-agricultural natural resources. It is, in fact, probably the most impoverisbed region of non-tribal North India and, except for the Ganges Delta, has the densest population livi~g on the land. Flanked on the one hand by tbe modern manufacturing centres of West Bengal and on the other by the. old established craft centres of Western Uttar Pradesh and accessible, lor purposes of marketing, from each of those areas, the region offers few locational advantages to would-be manufacturers. The retarded development of the area on. the north bank of the Ganges-Gogra may also be explained in part by its surprisingly bigh degree of physical isolation. The area is served only by an inadequate narrowgauge rail system, linked by few bridges and poor ferry service to the mam broad gauge lines to the south; and the considerable river traffic of the pre-railroad and early railroad eras is now greatly diminished. Cash crops are consequently at a competitive disadvantage on Indian markets, though in some areas commercial sugar cultivation has attained some importance. In~igo once was an important crop, but competition from chemic'al dyes has brought its cultivation to an end.
Such local artisans and workers in service occupations as exist, outside of those few working in commerce and for the Government, are presumably largely kamins still managing to work within the jajmani system for patrons sufficiently well off to maintain them. Probably, 'when the population pressure was less keenly felt than it is today, their number was much greater; and ewn
DOW, if those subsidiarily dependent on the callings of village artisans and servants were properly taken into accou~t, the number of part or full time non-agriculturists might, in some districts, be several times that reported by the Census.
A few iso]ated districts, one each in southern P.E.P.S.U., northern Madhya Bharat, and Western Uttm Pradesh, with Over gS % agriculturists need not detain us .. In at least two and possibly all three of these cases over-enumeration of agriculturists (see maps 3-5) would have been sufficient to place these districts in the highest agricultural category.
The areas in the next class interval on map 7, i.e., that with 75-84'9% agriculturists, are widely scattered, but for tbc most part are situated in close proximity to the areas cUscussed above, especial1y those with over 80%, in eastern Madhya Pradesh. Vindhya Pradesh, Orissa anJ Himalayan Punjab. A fair number of areas with substantial tribal minorities in the culturally very heterogeneou'S zone bounded by the Satpuras, the Aravallis. and the western part of the Gangetic Plain also fall into this class interval, as does the small isolated. tribal district of Dangs ln the Western Ghats.
The high proportion of agriculturists in a block of districts in Western Uttar Pradesh may well be the result of bias in enumeration (see maps 3-5). To ::. lesser degree this may also be true of parts of the desert are'a of Rajasthan, in which region there is remarkably little consistency af pattern on map 7.
In the Deccan proper more than half a dozen districts, including One l"ilrge group of four. register in the second highest c1as<; inferval; but they are all barely within that range and can in no special way be regarded as essentially different from the surrounding areas in the modal class. Futher south, in the Mysore PIOateau, are found thre~
45
more districts, each with around 80% agriculturists, an unusually high figure for South India. A similar proportion is found in South Areot District, on the east coast south of Madras. No single reason can be advanced to account for these cases, though a combination of factors: removal from main transport arteries~ lack of a large urban center and a. low degree of commercialization in agricultUie, may provide all adequate ex.planation (If the district boundaries were drawn slightly differently rather different results might have bee n obtained).
The modal class of districts, those with between 65% and 74'9% agriculturists, occupy over a fourth of India and are much more widely and evenly distributed thrQugh the peninsular part of the country, than in the North. It is not certain whether much significance can be attached to this fact. Leaving aside the areas of unusuaJIy high proportions of agriculturists, the fairly common juxtaposition in the North of areas of high and low proportions of agriculturists would, in many instances, become a pattern more like that of the South if districts in the former area were as large on the average as those in the latter and vice versa. Hence, the real difference between the two broad zones is almost certainly less great than the apparent differences indicated by map 7. In general the areas within the modal class, along mth the d:istricts in the ]ower half of the class abo've them (i.e., those with from 75~80% agriculturists), constitute what might be considered the "normal" group of districts in non-tribal India.
Districts with below 65% agriculturists (the two lowest classes on map 7) form just over a fourth of the Indiaa total. Such dis.tricts are widely scattered, though largely peripheral in location, and may occur either in moderately laTge continuous blocks or as isolated districts, The latter are, as a rule, fairly easily accounted for. In a few instances the proportion of agriculturists therein lies just below the class boundary

of 65 %, and, for all practical purposes, they may be considered as essentially similar to the districts of the modal class. Otherwise, they almost invariably contain large urban centers serving, as a rule, not only the distric.ts in question but much broader hinterlands, or even, as in the cases of such specialized centers as Kanpur and Banaras, the whoie of India. TO' this extent the percentage ef nen-agriculturists therein need not be a particularly significant regional fact and hinges on the size of the population of the local key city relative to that of the district in which it happens to' fall. Obviously, this, in turn, depends on how far out from the city the district administrative boundaries are situated. ~ Kanpur, Lucknow, Banaras (Varanasi), Gird (containing the city of Gwalior), Indere, Jabatpur (Jubbulpur), Nagpur, Hyderabad and Madras are all examples of such isolated districts with a small propertien ef agriculturists.
Of much greater concern are those regions in which there is a censistently low prepertion of agriculturists. Seven such regions stand eut on the map: (1) Western Uttar Pradesh, Delhi and the contiguous northern Punjab--P.E.P.S.U. plain;. (2) the desert portion of Rajasthan and certain adjacent districts ef Ajmer and nen-desert Rajasthan; (3) Saurashtra, Kutch and part of northern Gularat as then constituted; ( 4) a bi-pronged area extending north and J50utheast from Bombay; (5) the area extending from around Calcutta up the Hooihly 'and alsO' northwest to the Jharia coalfields; (6) a large part of Assam; and (7) a large area of seuthwestern India including all of Travancore-Cochin and the mountain state of Coorg, much of contiguous Madras and one distric.t each in the states of Mysore and Bombay. These regions wijl be taken up belew in the order named.
1. Western Uttar Pradesh, Delhi state, and the contiguous tracts of the plains ef northern Punjab and P.E.P.S.V., together
form one of fhe best irrigated, most fertile agricultural regions ef India. Relativelly speaking the pepulatien pressure is not excessive; and there is. normally abundant surplus grain and other cash crops fer sale, both to nearby urban lparkets, most notably Delhi, and to grain-deficit areas considerable distance.s away. This alone weuld suffice to give rise to a substantial amount of non-agricultural employment in commerce and related activities and to' village non-agriculturists serving the wants and needs of the more prosperous land-owning and commercial classes. But the share of agriculturists in the total working ferce is further diminished by the existence of a not inconsiderable amount of small scale and cottage-industry (which shall be referred to later at greater length) along with a variety of other non-agricultural pursuits.
2. The case of Rajasthan is somewhat different. A low proportion of agriculturists in the working popUlation here need not betoken relative regional prosperity or the existence of agricultural surpluses, but may simply be due to inability to' carry on much cultivation in the drier and/or more mountainous terrain under consideration. The ecenomy may be based instead on steckralSlng, mmmg and quarrying (which, however, is itself numerically an mSlgl'llficant source of employment), cottage industries (the fine craft work of Rajasth~n is fameus throughout India), and the crossdesert transit trade (now greatly reduced due to' the political partition of the subcontinent) . The rendering of a variet!y ef services and wares to the households of the large landlerds and petty nobility (jagirdars) so numerous in the until recently feudalistic native. states of Rajasthan must also have provided considerable, non-agri· cultural employment. It' should be n'oted too that several districts ef the Rajasthan desert area are highry urbanized by Indian standards, notably Bikaner and Jodhpur with one fair-sized city each, ;lnd Churu with numereus towns.
Adjacent to the desert, astride the semiarid Aravalli ranges, the two districts of Jaipur and Ajmer also stand out ~or their low proportions of agriculturists. Both are highly urbanized areas, the latter in particular, though Jaipur, is a considerably larger city than Ajmer. The size of both cities depends not so much on the productivity of their immediate trading hinterl'ands but on the services they render to a much broader area: Jaip).lr, as capital, to the entire &tate of Raja&than; and Nmer, ?to,
administrative and cruef maintenance center for the Northwestern Railroad, to an even larger area.
3. Saurashtra, Kutch and northern Gujarat proper form a region in many ways like the northern plains region first discussed. Generally, much more sparsely populated than that region, what it lacks in irrigation it makes up for by its favourable ratio of cultivated land per cultivator, the best in the whole of India, and its extremely good farm practices. Th~ result is a considerable agricultural surplus, especialry in such cash crops as cottOIl and ground nuts, brisk trade, and an effective demand for a wide variety of goods and services. Though the local artisanry was never especially reknowned, it appears to have managed to hold its own when, for reasons which arc discussed elsewhere, there was a general retrenchment elsewhere in India. The same holds true of the serving castes. And while the rural nonagriculturists held on, the cities and towns, most of them capitals of the numerous petty states of the area (Saurashtra alone had over two hundred), grew as trade emporia and, since the turn of the country, as cellters for newly developing industry. The great cotton mill industry, concentrated largely in Ahmedabad, a city of close to a million inhabitl!nts in 1951, was the first to develop; but a number of other widely dispersed large and SI11all-scale and cott-age industries have since sprung up in responsenot only to local demand, but also to serve
104 R.G.I.-8
47
a variety of needs throughout India· Evidently the entrepreneurial skills for wruch th(e Gujaratis are famous in other parts of India ,have been effectively applied to their native area as well.
4. Further south along India's West Coast from Surat to Bombay and inland across the Ghats to Poona and Sholapur is another apparent belt of districts with a low proportion of agricultural workers. This area is not, however, particularly known for its agricultural surpluses. Largely manufacturing oriented, especially with respect to cotton textiles, it depends c11iefly on raw materials shipped in from the more extensive cotton growing areas further east on the Deccan Lava Plateau. For power it taps the vast hydro-electric resources of the precipitous Western Ghats. (The seemingly isolated manufacturing districts of Baroda and Ahmedabad, which were classified along with Saurashtra and Kutch, might, incidentally, be conceived of as an extension of this region). Ancillary to its industrial development, the region has naturally expanded the scope of such service occupations as trade and transport; but the only district in which service occupations are especially noteworthy is Poona, the seat of the Indian defence academy and a major university and a principal center of the not inconsequential film industry.
5. Crossing the sub-continent to West Bengal and the Dhanbad District of Bihar, we come to another major industrial zone of India, in which workers in manufacturing (jute, chemical and metallurgical industries), service industries (essentially similar in function and development to those of the Bombay area) and coal mining • (in Dhanbad and Burdwan Districts) J are sufficiently numerous to depress to below 5070 the proportion of agriculturists in the, total population. Yet, over much of this area, the absolute agricultural densities remain among the world's highest.
6. Continuing northeastward to Assam we encounter an area where the low proportion of a~ricu1turists (by the definition of the Census) is very easily explained. This is the chief tea-growing area of India, in which over a third of the self-supporting males may be found working on the tea plantations. Outliers of the largest teagrowing tract include the districts of Cachar to the south and Darjeeling and Jalpaiguri to the west· The relatively sparsely settled, largely tribal district of United Khasi and Jaintia Hills, is, however, not especially known for tea plantations. Its low proporti<;lD in agriculture is due rather to the high degree of urbanization occasioned by the creation there of Shillong 'as a hill station and summer capital of Assam.
7. The last of the seven regions to be discussed, that in southwest India is far from homogeneous, and consequently, can be considered a region primarily in terms of areal contiguity. Two of the component districts, the Nilgiris and Coorg are highland plantation areas occupationally similar to that just discussed in Assam. Ootacamund, in the Nilgiris, also serves as a hill station, much like Shillong. Parts of otller districts, most notably Kottayam, are also important plantation areas.
The West Coastal districts especially those of Travancore-Cochin and Malabar, like the delta areas of West Bengal. have low proportions of agriculturists in the labor force. despite phenomenally high absolute agricultural densities. Unlike West Bengal, however, this area is generally deficient in farge-scale industry. The nonagriculturists are supported largely on the local development of cottage and smallscale industries. The most important of these by far are based on the. coconut palm especially the manufacture of I1rticles made from coir, the fibre derived from the husk of the nut itself. Although an overall food deficit area, a brisk trade is carried on in cash crops, the plantation crops of the highlands and hills, spices, tapioca, and coconuts, as weB as rice; and the normal
48
auxiliary services are highly developed. All along the west Coast fishing is an activitY sufficiently important to have a signliicant effect in lowering the proportion of agriculturists. In North Kanara District, in fact, it is the importance of fishing, rather than cottage industries, which just manages to put the area outside the modal class interval.
East of the Ghats from Bangalore southward are a group of five highly urbanized districts wherein the low proportion of agriculturists is based largely on the importance of the modem industry which is located there because of the region's cheap hydroelectric power. Cotton manufacturitlg predominates; but the large city of Bangfllore (population 800,000), fl1vored by the bracing climate of the Mysore Plateau, is developing into a major center of varied large and small-scale manufacturing. Throughout the area the normal increment in service occupations necessitated by the development of manufacturing suffices to explain the unusually low proportion of agriculturists.
Sub-divisions by Tenure Status within the Agricultural Population
The Census, as has already 'been stated, lub-divides the agricultural population into four classes, on the basis of their status with regard to land tenure, namely, "cultivators of land mainly owned", "cultivators of land mainly unowned" (tenants), "cultivating laborers", and "non-cultivating owners of land [and] agricultural rent receivers" (landlords). Although the author has tabulated the data which would permit mapping each of these categories on a district-wise basis, it is not felt that doing so would be worth the effort entailed. In the author's view and that of presumably competent critics, the data are simply not sufficiently reliable.
It is worth-remembering that a number of Indian states were, in 1951, in the throes of agitation for, or legis1ation or
implementation of, measures for fal'reaching land reforms. (Others, sadly. were then still dragging their feet). In the political milieu of that time it would have been most surprising if a very high degree of accuracy in the enumeration of tenure status were attained. This would have been true even if the census categories were clear and equally applicable throughout the subcontinent; but such was hardly the case. It is, therefore, not too surprising that the discrepancies between the data of the Census and the Agricultural Labor Enquiry conducted in the same year were as great as they were.
1. Non-cultivating owners of land: Landlords, the numerically smallest agricultural class, comprise, according to the Census, only 1'2% of the nation's self-supporting males. Since a common feature of land reform legislation was that one had to cl~tivate the land personally in order to be entitled to keep it, many of those who properly belonged in the landlord cloass could have been expected to report themselves as cultivators., This assertion cannot be proved; but it is yet to be refuted. Even if the data on landlords were reliable, they would tell us little. What really matters is the concentration of land-holding and the tenus on which land is rented out, rather tban the number of landlords, which, even at its greatest, accounts for but a very small share of the total population. (One of the great deficiencies of the 1951 Census is that it contained no question relating to the size of agricultural holdings or operations.)
2. Cultivators of land mainly unowned: The next smallest agricultural class, that of tenants (8.6% of the total and 12.7% of the agricultural popUlation) is not much more amenable to detailed regional analysis than that of landlords. This is $0 partially because there is a bewildering variety of conditions under which land may be rented and partially because of the peculiar Census instructions on who was, or was not, to be counted as a tenant. Rents in India
49'
may be paid in cash or in kind, may be in fixed amounts or shares, may be customarily or contractually determined, may be paid to an oveyseer or directly to the landowner, mayor may not entail the right to make decisions and mayor may not cover the use of seed, irrigation water, and draught animals. Tenures, furthermore, may be both permanent and inheritable or, at the opposite extreme, terminable at will.
The Indian share cropper an:! certain other types of tenants are often scarcely distinguishable from attached agricultural labourers. According to the Census instructions doubtful cases of tenancy were to be decided on the basis of who made the decisions in the farm operation. Ii the person in question made tbe decisions he was to be called a tenant; if not then an agricultural laborer. But the answers to this question are obviously highly subjective; and the responses might place many persons in the category of tenants who do not really warrant such status. At the other end of the tenancy spectrum, the Census -instructions were that any rentpaying farmer with a permanent, deedable tenure was to be classified as an owner cultivator. But, in the common absence of properly executed contracts and deeds, and the prevalence of the farmer's inability to read such documents as exist, the question of permanency of tenure is frequently open to dispute. To cite but one more difficulty, there is the not uncommon practice in India of sub-letting agricultural land. The sublessor is simultaneously landlord and tenant. The printed Census instructions do not state how such cases shall be treated. It may' thus be seen that, even barriIlg the numerous cases of mixed tenures (e.g., tenants who also farm. a bit of land of their own or tenants who do outside agricultural labor), the tenant in India is apt to be confused with any of the three remaining agricultural classes.
Nevertheless, viewing the data by natural census divisions, some interesung broad regional patterns do emerge. For
the great majority of divisions of India the perce~tage of tenants within the agricultural population falls within the narrow range of 7% to 15%. Only eight divisions have lower percentages; and of those eight divisions six are largely tribal areas. Rates of tenancy in largely tribal and mountalll areas range from a mere 3% in Chota Nagpur, the lowest rate in aIr of India, to 11 % in Himalayan Punjab.
Fourteen divisions score above 15%, the maximum being in the Rajasthan Dry Area where tenants comprise 59% of tt.e agricultural population. The seven contiguous divisions, of the Rajasthan plains (31%), Punjab Plains (27%), Madhya Bharat Plains (23%), Kutch (23%), Saurashtra (18%), Gujarat (16%), and P.E.P.S.t;. (16%) form, with the desert area, a great block of territory in which a high rate of tenancy persisted through to ).951. Of the areas named, those of R~jasthan, Madhya Bharat, Saurashtra, Kutch and P.E.P.S.U. were native states prior to independence and maintained a largely feudal system of land tenure, with numerous petty lorus and complex arr:angements o'f sub-infeudation. In the highly commercialized areas of Punjab and Gujarat much of the tenancy was presumably on the lands of absentee landlords and village money-lenders.
50
Of the ateas of high tenancy outside of Northwest India two west coast divisions, Bombay Konkan (46%) and West Madras ( 43 %), immediately to the south, are said to have "peculiar" tenancy systems unlike those of other aroo.s of India.· Adjacent Coorg (17%) may share certain aspects of their tenure pattern. The three remaining divisions of high tenancy lie in the Northeast of the countr1y. Highest of
• these is Himalayan West Bengal (a mis-nomer which ought to read Sub-Himalayan
West Bengal) (39%), the West Bengal Plain (2070) and the Assam Plain (2070). Of the first of these, very little is known; the area is, in any event, of little importance. The causes of high tenancy' in the latter two areas are probably much like those, at work in Gujarat and Punjab.
Thus, whether or not one pbces much faith in the Census figures on t~nancy, a fairly clear and probably generally COIrect regional pattern emerges therefrom. There appeared to be in 1951, most important of all, a large area of Northwest India characterized by high to very high tenancy rates; one. other area of rather high rates, the West Coastal strip; and a Northeastern area of only moderately high tenancy. The tribal areas of India exhibit very low tenancy rates. And' the rest of tbe country varies but little from a median rate of about 11%.
3. Agricultural Laborers: Workers deriving the largest part of their livelihood from work on land which they neither own nor rent constitute 12'8% of the total and 18' 9 % of the agricultural population of India according to the Census. For this
~ group there is no more, and very likely even less, reason for faith in the Census statistics than in the case of tenants. Nevertheless, there are several reasons why this group deserves to be studied in greater detail tban any other class of agriculturists. In the first place, while all the others have some hold on and stake in the land, something which they are not likely to relinquish without considerable cause, the agricultural laborers, by contrast, are less rooted and more apt to take up new C?mplo'Yment given the opportunity. Hence, they form a vast and ready reservoir of labor for large scale development projects and new industrial undertakings.' 0 Second, in the absen.ce of
g Cem'us of India, 1951, Vol. I, Part I-B., pp. 199-200. The peculiarity alluded to by the Census is not explained.
10Th is point is elaborated at great length by V.M. Dandekar in his work, Use of Food Surpluses for Economic Deve/'Jpmel1t, in which the A.L.B. findings are extensively used on a regional basis. See especially Chapter V " Employment Potential of~Development SChemes," pp. 58-71 ; VII, "Labour Employed on Development Project ,pp. 89-110; and VIII, "Relief Works," pp. 110-117.
adequate work they exercise a depressant effect on the economy, driving down wages and occasionally consuming in the form of relief, expenditures which might otherwise be spent by the state on productive overhead investments. Third, as potential recruits to a united, militant, proletariat political bloc they warrant attention for reasons which are all too obvious, even though they may lie outside the scope of this study.
Thanks to the Agricultural Labor Enquiry, we have available a body of information against which to check the Census results. Where the regional patterns of the two investigations tend to coincide we may feel greater confidence in accepting the findings than where they appear to bear relatively little relationship to one another. On the other hand in cases where there is a wide disparity between the two we may, with reason, incline towards a belief in neither. It is impracticable, if not impossible, however, to compare the Census and the AL.E. on a district-wise. basis. In the stratified random sample of only 814 villages in the sevcntytwo regions of the Enquiry, many districts were entirely unrepresented, while the average number of villages investigated per district was only 2· 7 (The entire sample covered only about one out of every 6SU villages in the whole of India).
A comparison of the Census and the A.L.E. at the level of the Census "natural division" is, then, the most detailed one which can be regarded as feasible. Omitting the entircly urban division of Greater Bombay and the divisions of Himalayan Punjab and Sikkim, to
which the sample did not extend, there waS an average of 17 AL.E. villages per division. Of course, for certain small districts the number was considerably lower than seventeen; and in such cases the prob:ibility of the sample's yielding reliable results is greatly reduced. Generally speaking, the more populous the division (or, more precisely, the greater the population of villages therein), the greater the likelihood that the A.L.E. results are valid.
One is, thus, confronted with a dilemma. On the one hand, for India as a whole, the 1951 A.L.E. shows a proportion of agricultural laborers in the working population which is far greater than that indicated by the Census, and no writer on the subject, to the best of the author's knowledge, appears to question the greater reliability of the A.L.E. findings relative to the country as a whole or even to a broad six-fold zonal breakdown thereofll. But, as one begins to work with smaller and smaller regions, he becomes increasingly kss confident that the AL.E. findings are closer to the true state of affairs than is the Census. And nowhere has the author se.en an Official indication of the statistical confidence limits of the AL.E. data far a given area or even for the entire nation.
In attempting to depict cartographic ally what appears to be the general patt0m of regional variations in the proportion of agricultural laborers in the work force it was possible to lean very heavily on the laborious spadework of Daniel and Alice Thorner, who aggregated the A.L.E. village data so that they would fit within the regional framework of the Census "natural divisions", and thereby arrived at two sets of figures for a single sct of areas,12 •
11 For broad, general comparisons India was divided into the following zones: North, East, Sot;th, West, Central, and North-West, each an aggregation of several states. No use is made of zonal data in this thesis as t is felt that in a country as large as India such a coarse breakdown does not yield very meaningful results.
12 D. and A. Thorner, "Agricultural Manpower in India: Labourer~," F..collondc Weekly, Vol. IX. Nov. 9, 1957, pp.I443-9, esp. Table T, pp.I446-7. A slightly different (and less satisfactory) compariscD, alsC' by Daniel Thorner, is afforded in "Demarcation of Agrarian Regions oc' India; Some Preliminary Notes," in Seminar on Rationale 0/ Regional Variatiolls in Agrarian Structure O/Illdf.l, Table 2, p. 57. In the same volume, P. K. Mukherjee offers a state-wise comparison in "Some Comments on the Concepts and Definitions Ufed in the Recent Surveys," Table 3, p. 33.
'.the Census figures' tiefaic' noi soI'eiy to. self-supporting males, but to all earners, (self-supporting persons plus earning dependents) of both sexes as a proportion of the total population. The proportion of agricultural laborers so computed for the whole of India came to 20'5%. (Since women and children are probably more commonly classified as earners among agricultural laborers than among any other occupational group, it is not surprising that the proportion cited so greatly exceeds the 12'8% obtained when only self-supporting males are considered.)
The A.L.E. figures also relate to aU earners (not including non-wage earning "helpers"), but as a proportion of the rural population only, the sample having been drawn entirely from villages. In the Thorner study the Census figures were not computed in terms of the rural popUlation because the Census did not provide "separate rural and urban figures for earning dependents according to their own means of livelihood.13
That is, they were classified solely by the means of livelihood on which they were classified as mainly dependent, which, by Census fiat, was said to be that of the person on whom they were dependent. A further distinction is that, whereas the Census classification of a self-~upporting worker is based (theoretically) on the occupation which provided him with the largest sh::tre of his income, the A.L.E. classification of all earning members of a family generally followed that of the head of the household (a method not as unrealistic as one might suppose), who was himself classified as an agricultural worker if that was his occupation more than one-half of the total number of days on which he actually performed work during the year.l4 The all-India percentage of agricultural laborers in the rural population so {}btained by the A.L.E. was 38:2%.
tt sing the data of the Census and the A.L.E. the Thorners were able to establish three broad groups of natural census d\vi-
11 Thorner, op. cit., p. 1444.
sions, high, medium and low, the limi~iirg values of which differed with the investigation in question. This they were able to do because, in spite of the great regional discrepancies between the two sets of figures, they found a general tendency for the divisions scoring high in one set to score high also in the other, abd vice versa. Relatively few divisions were misfits in the classification they devised.
It would have been possible to map the tabulations of the Thorners directly; but because, in working out the Census data, they made no allowance for the regional variations in the degree of urbanization, it Was decided first to adjust for this deficiency for each of the natural divisions and thereby to arrive at a set of figures more comparable to those of the purely rural sample of the A.L.E. The formula used is as follows:
Lr=TjRx Lt
in which L r is the desired adjusted rural percentage of agricultural laborers according to the Census. L t the percentage given by the Thorner for the total population, T the total population and R the rural popUlation. (This formula yields only a close approximation of the figure sought, since the agricultural laborers counted by the Census did include a small percentage actually resident in urb:m areas, which the formula treats as being wholly non-agricultural.) The allIndia percentage of agricultural laborers in the rural population, as determined by the method indicated is 25' 8 %, still well below the A.L.E. figure of 38:2%.
Map 8 indicates for each Census natural division the proportions of agricultural laborers which were computed by the author from the CensUls-based data of the Thorners
and those computed by the Thorners them~ selves from the A.L.E. After plotting the two sets of figures the author likewise established high, medium, and low groups with limits differing considerably for the two distributions. Also established was a small indeterminate group of divisions not clearly fitting any of the previous three. In
U A. L. E., Rural Man-Power and Occupational Structure, pp. 4-6.
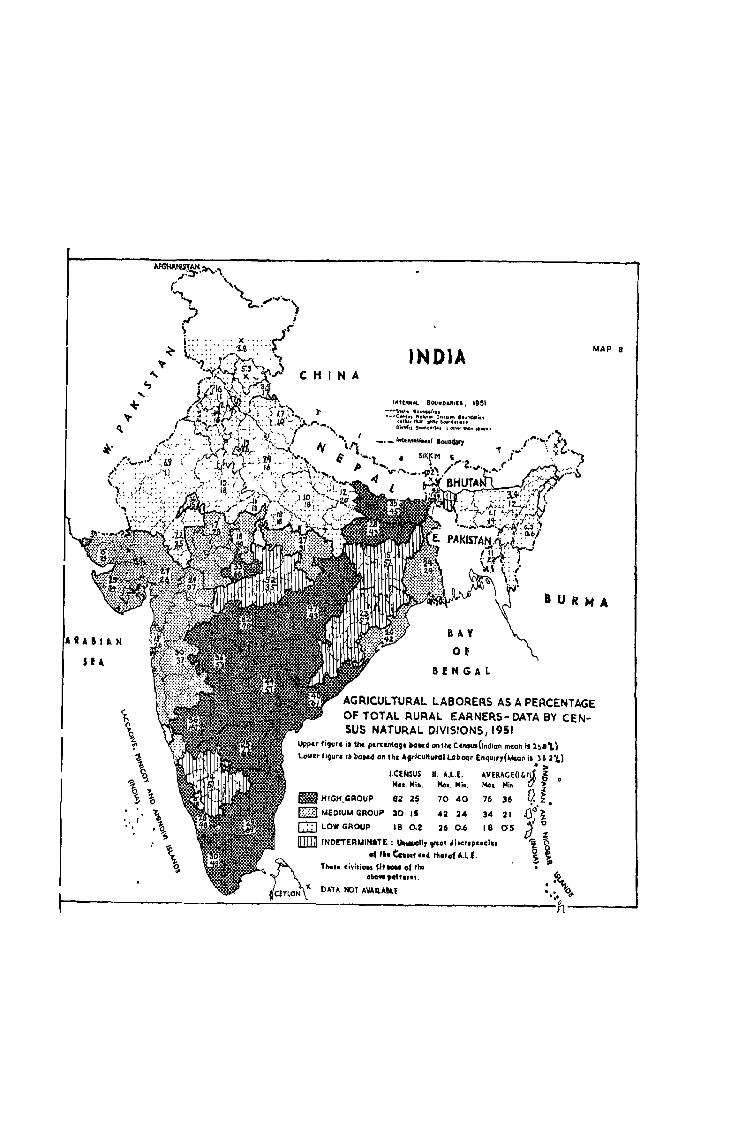
INDIA
IIfTEJlUIAL BOUNOA'UU, 19~1
-.""'" I!I~,,;"";I'. ·_ ... e"" .. , Hllturt.tl 0,,,,,0" •• ~"daritt (It"", '''''" 1I'It, ~ound,,, .. , m.rrltt 911c1I1do<'! .. latn~'Mlng.b"".,
BAY
OF
BEHGAL
MAP 8
AG~ICULTURAL LABORERS AS A PERCENTAGE OF TOTAL RURAL. EARNEA.S- DATA BY CENSUS NATURAL DIVISIONS/19SI
Upper figure i,1IIc p"",wag' boled onlhcCcn""(lndian mean is 2~"'L) 1,.0,.0. figure i, bOMd en the Allrlcult_l Lab"". £nqulry(Mcan i. 3! 2\) . ,.
l.CUoiSUS II .• U.E. AVERAGE(I(,llf ~ 0
MG •. Min. Mol. Min. No, Min (/ 3 fBiI HIGH,GROUP 82 2~ 70 40 76 36
I[] MEDIUM GROUP 30 15 42 24 34 21
c:J I,.OW GROUP 18 ().J 26 0.6 I B 0:5
[[!]lIND!TERUIItATE: Il0l_11, YOOI ~i.cr.p ... i .. aC tho e ..... , •• 4 thIef A.Lt.
Tb. •• divi.iol. {.it_ of th.
Q ~. i:l~ .. I 0
~~ o ~
~ " GWwi ,etten1. • t,
1( DATA NOT AVAlLAeu •• ;. ~oI'
r--------------------------------~--~-------------------------~----------n--------~
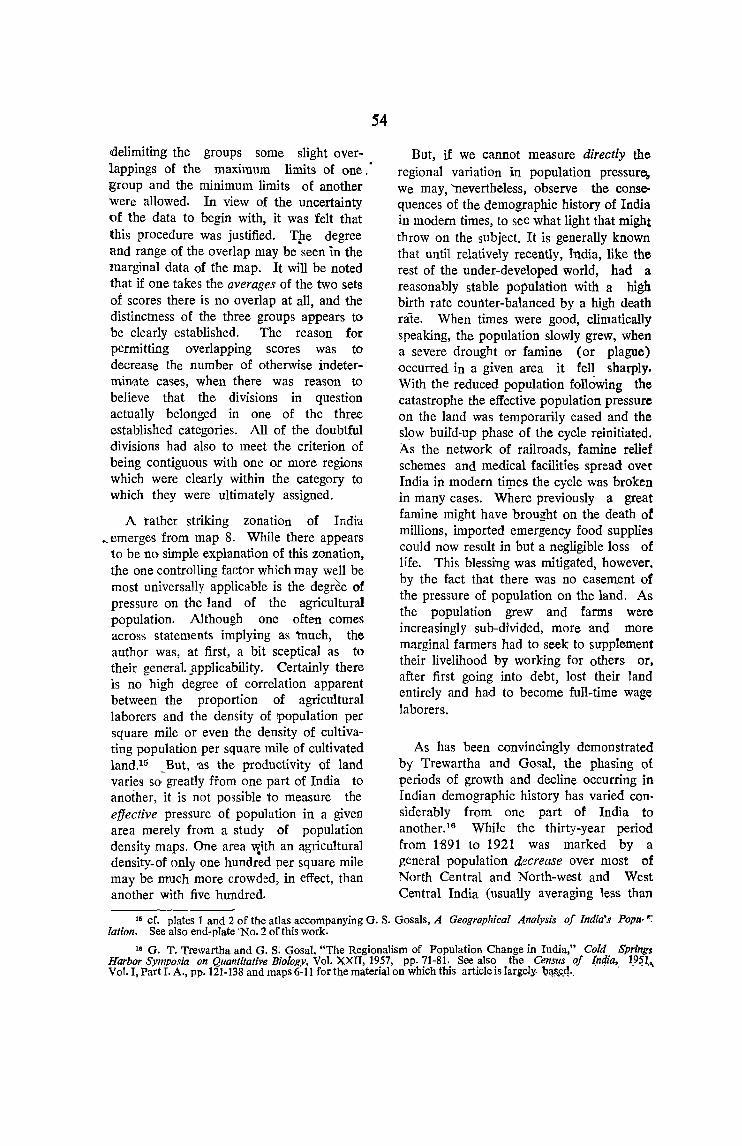
54
delimiting the groups some slight overlappings of the maximum limits of one.' group and the minimum limits of another were allowed. In view of the uncertainty of the data to begin with, it was felt that this procedure was justified. Tpe degree and range of the overlap may be seen "in the marginal data of the map. It will be noted that if one takes the averages of the two sets of scores there is no overlap at all, and the distinctness of the three groups appears to be clearly established. The reason for permitting overlapping scores was to decrease the number of otherwise indetermimite cases, when there was reason to believe that the divisions in question actually belonged in one of the three established categories. All of the doubtful divisions had also to meet the criterion of being contiguous with one or more regions which were clearly within the category to which they were ultimately assigned.
A tather striking zonation of India ... emerges from map 8. While there appears
to be no simple explanation of this zonation, the one controlling fact!)r which may well be most universally applicable is the degr~e of pressure on the land of the agricultural population. Although one often comes across statements implying as much, the author was, at first, a bit sceptical as to their general_applicability. Certainly there is no high degree of correlation apparent between the proportion of agricultural laborers and the density of population per square mile or even the density of cultivating population per square mile of cultivated land.15 _But, as the productivity of land varies so greatly from one part of India to another, it is not possible to measure the effective pressure of popUlation in a given area merely from a study of popUlation density maps. One area ~ith an agricultural density. of only one hundred per square mile may be much more crowd~d, in effect, than another with five hundred.
But, if we cannot measure directly the regional variation in population pressurCi, We may, 'nevertheless, observe the consequences of the demographic history of India in modern times, to see what light that might throw on the subject. It is generally known that until relatively recently, India, like the rest of the under-developed world, had a reasonably stable population with a high birth rate counter-balanced by a high death rate. When times were good, climatically speaking, the population slowly grew, when a severe drought or famine (or plague) occurred in a given area it fell sharply. With the reduced popUlation following the catastrophe the effective population pressure on the land was temporarily eased and the sl9w buitd-up phase of the cycle reinitiated. As the network of railroads, famine relief schemes and medical facilities spread over India in modem tirpes the cycle was broken in many cases. Where previously a great famine might have brought on the death of millions, imported emergency food supplies could now result in but a negligible loss of life. This blessing was mitigated, however, by the fact that there was no easement of the pressure of popUlation on the land. As the population grew and farms were increasingly sub-divided, more and more marginal farmers had to seek to supplement their livelihood by working for others or, after first going into debt, lost their land entirely and had to become full-time wage laborers.
As has been convincingly demonstrated by Trewartha and Gosal, the phasing of periods of growth and decline occurring in Indian demographic history has varied considerably from one part of India to another.16 While the thirty-year period from 1891 to 1921 was marked by a general population decrease over most of North Central and North-west and West Central India (usually averaging less than
15 cf. plates I and 2 of the atlas accompanying G. S. Gosals, A Geographical Analysis of India's Popu· r lation. See also end-plate ·No. 2 of this work.
16 G. T. Trewartha and G. S; Gosal, "The Regionalism of Population Change in India," Cold. Springs Harbor Symposia on Quantitative Biology Vol. XXII, 1957, pp.71-81. See also the Census of l.n4ra, 1.9~1 ... Vol. I, Part I. A., pp.121·138 and maps 6-i 1 for the material on which this article is largely, l7!!lI.~q·. .

1 % 1Jer yea1'~, the same perioo was marked by a general increase over t:he r-est ·of the 'Country, (usuaUy averaging under 1'5% per 'yearj. From :In1 to 1951, however, thanks partly to the, h::lUnty of nature and partly to ,tihe controls exercised by man, lhere was a general ,population increase .throughout India (usually from 0.5 % to 1 . 5 % per year).. If we compare Trewartha's and Gosal's map of population change .from 1891 to 1921 with map 8 we discover a remarkable correlation of areas of population decline with regions with
5:5
a low 'and medium .propor-tion of agrioultuml laborers and area's of population increase with region with a high.prCJportion of agrkmltural Jaborers. This correlation is especially marked if we excludehom.consideration the largely tribal areas of India and the obviously exceptional areas 01: the Assam Plain and Tri'p'Ura whlch wer-e -then and still are, "pioneer" areas to which the population gFowth and decline cycle does no.t apply. The foHowing table shows the extent of this correlation, not taking. into consideration the exceptional areas cited.
TABLE 7
POPULATION 'GROWTH OR DECLINE OF CENSUS NATURAL DIVISIONS CLASSIFIED lJ .PRQflORTION OF AGRiCULTURAL LABORERS
(Data are for the Period 1891-1921)
,-.
No. of Divisions by <:hange in Population
Proportion of Agricultural Laborers Total No. of gecrease 0% to 0·5% 0·5 % to l'S % in '1951 (as per map 8) Divisions Con- Increase Increase
sidered
Low 11
Medium 11
High 13
Why"one may ask, does the 1951 distri.bution .of agricultural laborers reflect the .population changes of the period 1891 to 1.921, .rather .than the relatively uniform increases :of the succeeding thirty years? The answer does not appear to be too ·difficult. rhe,pattern of 1951 was probably fairly weIr established well in advance of that year and simply persisted in the absence of any 'countervailing demographic events. -Since .the areas of population .decline must have experienced a very considerable easing tof population .pressure during the first ;generation under review, they had 'a c(}nsi.de:ra'ble -margin for population increase in the following generation without undergoing much increase in the proportion of AgricuIturallaborers. This ma.rgin did not exist in the regions of earlier population growth. Just when the general pattern of the present was established would require considerable additional research. Since the age structure of 'tire area of population growth in the
)04- RG-9,
11 0 0
8 2 1
346
period 1891-1921 was probably one with a nigher proportion of juveniles -than that -df the areas of population decline, the relative swelling in the actual labor force on the land in the former areas might not have been fully feh until we11 after 1921.
In addition to popUlation pressure many other local factors have played a role in determining the proportion of agricultural laborers in the several1'egions 'of India. 'In the paragraphs which follow these Torces are discussed in respect to the regional pattern exhibited by m'ap 8, beginnmg with the areas of low proportion and proceeding to the medium, the high, and 'finally 'the indeterminate groups.
The principal area in Which agriculturat labor.ers comprise but a small share of the rural population blankets most of North Central and Northwest India covering the entirety of the states of Uttar PratleSh,
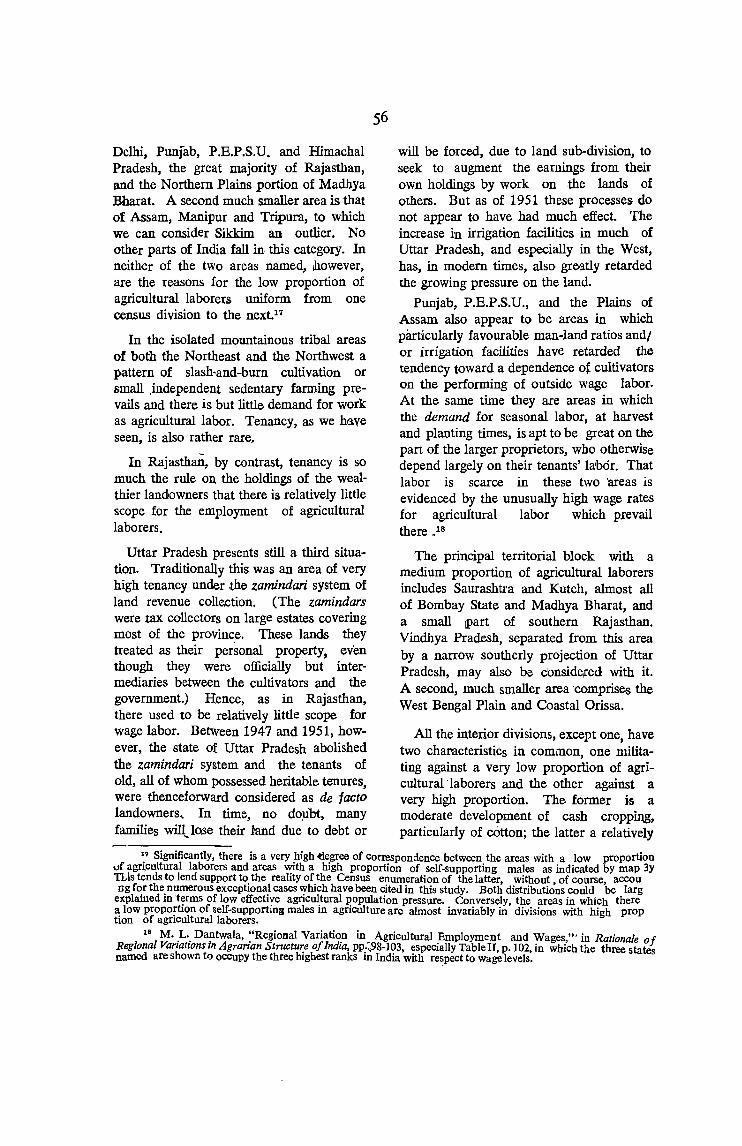
Delhi, Punfab, P.E.P.S.U. and Himachal Pradesh, the great majority of Rajasthan, and the Northern Plains portion of Madhya Bharat. A second much smaller area is that of Assam, Manipur and Tripum, to which we can consider Sikkim. an outlier. No other parts of India fall in this category. In neither of the two areas named, however, are the reasons for the low proportion of agricultural laborers uniform from one census division to the next,17
In the isolated mountainous tribal areas of both the Northeast and the Northwest a pattern of slash-and-bum cultivation or small ,independent sedentary farming prevails and there is but little demand for work as agricultural labor. Tenancy, as we have seen, is also rather rare,
In Rajasthaii, by contrast, tenancy is so much the rule on the holdings of the wealthier landowners that there is relatively little scope for the employment of agricultural laborers.
Uttar Pradesh presents still a third situation. Traditionally this was an area of very high tenancy under the zamindari system of land revenue collection. (The zamindars were ,tax collectors on large estates covering most of the province. These lands they treated as their personal property, even though they were officially but intermediaries between the cultivators and the government.) Hence, as in Rajasthan, there used to be relatively little scope for wage labor. Between 1947 and 1951, however, the state of Uttar Pradesh abolished the zamindari system and the tenants of old, all of whom possessed heritable tenures, were thenceforward considered as de facto landowners, In time, no dO,uM, many families wilt lose their land due to debt or
will be forced, due to land sub-division, to seek to augment the earnings from their own holdings by work on the lands of others. But as of 1951 these processes do not appear to have had much effect. The increase in irrigation facilities in much of Uttar Pradesh, and especially in the West, has, in modern times, also greatly retarded the growing pressure on the land.
Punjab, P.E.P.S.U., and the Plains of Assam also appear to be areas in which particularly favourable man-land ratios andj or irrigation facilities have retarded the tendency toward a dependence at cultivators on the performing of outside wage labor. At the same time they are areas in which the demand for seasonal labor, at harvest and planting times, is apt to be great on the pan of the larger proprietors, who otherwise depend largely on their tenants' labOr. That labor is scarce in these two 'areas is evidenced by the unusually high wage rates for agricultural labor which prevail there .18
The principal territorial block with a medium proportion of agricultural laborers includes Saurashtra and Kutch, almost all of Bombay State and Madhya Bharat, and a small !part of southern Rajasthan. Vindhya Pradesh, separated from this area by a narrow southerly projection of Uttar Pradesh, may also be donside,red with it. A second, much smaller area ·comprises the West Bengal Plain and Coastal Orissa.
All the interior divisions, except one, have two chamcteristics in common, one militating against a very low proportion of agricultural'laborers and the other against a very high proportion. The former is a moderate development of cash cropping, particularly of cOtton; the latter a relatively
17 Significantly, there is a very high -degree of correspondence between the areas with a low proportion \Jf agr\cultural laborers and areas with a high proportion of self-supporting males as indicated by map 3y TLis tends to lend support to the reality of the Census enumeration of the latter, without, of course, accou fig for the numerous exceptional cases which have been cited in this study. Both distributions could be larg
explained in terms of low effective agricultural popUlation pressure. Conversely, the areas in whiCh there a low proportion of self-supporting males in agriculture are almost invariably in divisions with high prop tion of agricultural laborers.
18 M. L. Dantwala, "Regional Variation in Agricultural Employment and Wages,'" in Rationale oj Regional Variations in Agrarian Structure 0/ India, pp.~98-103, especially TableIJ, p.l02, in which the three ~tates named are shown to occupy the three highest ranks in India with respect to wage levels.
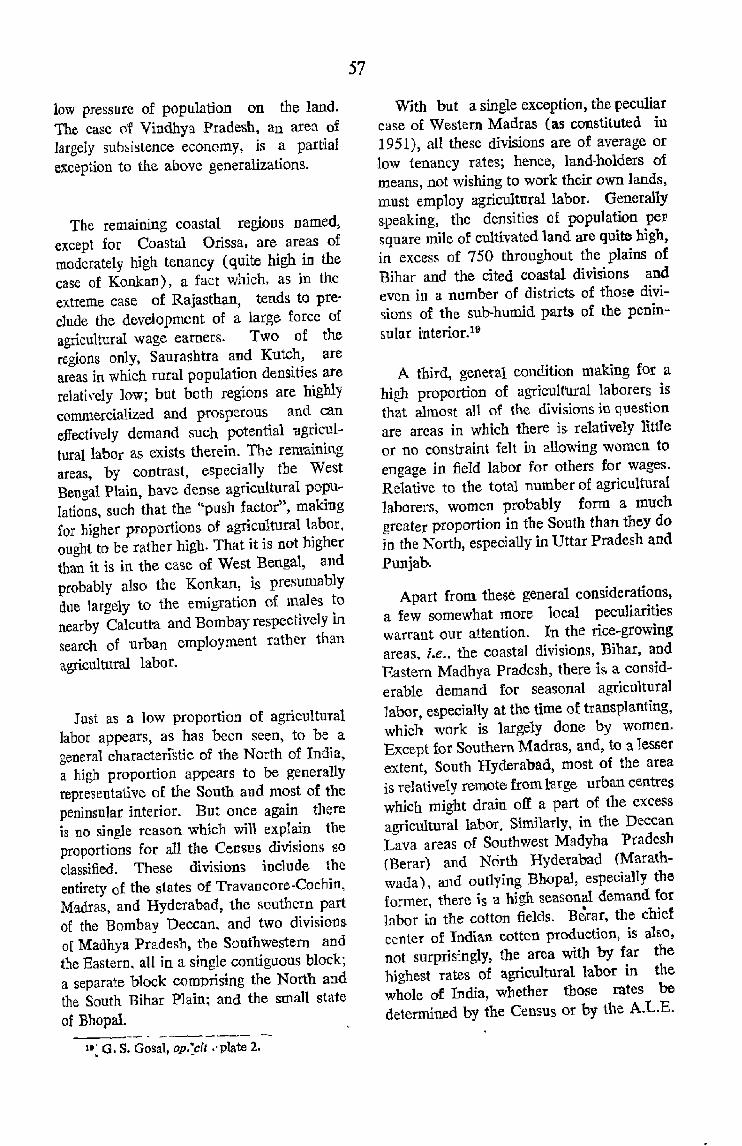
low pressure of population on the land. The case 01 Vindhya Pradesh, an area of largely subl:>istence economy, is a partial exception to the above generalizations.
The remamrng coastal regions named, except for Coastal Orissa, are areas of moderately high tenancy (quite high in the case of Konkan), a fact which, as in the extreme case of Rajasthan, tends to preclude the development of a large force of agricultural wage earners. Two of the regions only, Saurashtra and Kutch, are areas in which rural population densities are relath'ely low; but both regions are highly commercialized and pro&perous and can effectively demand such potential 'agriculturallabor as exists therein. Th..! remaining areas, by contrast, especially the West Bengal Plain, have dense agricultural populations, suoh that the "push factor", making for higher proportions. of agricultural labor, ought to be rather high. That it is nat higher than it is in the case of West Bengal, and probably also the Konkan, is presumably due largely to the emigration of males to nearby Calcutta and Bombay respectively in search of urban employment rather than
agricultural labor.
Just as a low proportion of agricultural labor appears, as has been seen, to be a general characteristic of the North of India, a high proportion appears to be generally representative of the South and most of the perunsular interior. But .once again there is no single reason which will explain the proportions for all the Census divisions so classified. 'These divisions include the entirety .of the states of Travancore-Cochin, Madras, and Hyderabad, the southern part of the Bombay Deccan. and two divisions or Madhya Pradesh, the Southwestern and the Eastern, all in a single contiguous block~ a separate b10ck comprising the North and the South Bihar Plain~ and the small state
of Bhopal. --~- - ------ ~-
1'~ G. S. Gosal, op.~clt "plate 2.
57
With but a single exception, the peculiar case of Western Madras (as constituted in 1951), all these dhisions are of average or low tenancy rates; hence, land-holders of means, not wishing to work their own lands, must employ agricultnral labor. Generally speaking, the densities of population peJ.1 square mile of cultivated land are quite high, in excess of 750 throughout the plains of Bihar and the cited coastal divisions and even in a number of districts of those divisions of the sub-humid parts of the peninsular interior.1D
A third, general condition making for a high proportion of agricultural laborers is that almost an of the divisions in question are areas in which there is relatively little or no constraint felt in allowing women to engage in field labor for others for wages. Relative to the total number of agricultural laborers, women probably form a much greater proportion in the South than they do in the North, especially in Uttar Pradesh and Punjab.
Apart from these general considerations, a few somewhat more local peculiarities warrant our attention. In the rice-growing areas, i.e .. the coastal divisions, Bihar, and Eastern Madhya Pradesh, there is a considerable demand for seasonal agricultural 1abor, especially at the time of transplanting, which work is largely done by women. Except for Southern Madras, and, to 3 lesser extent, South Hyderabad, most of the area is relatively remote from l'arge urban centres which might drain off a part of the excess agricultural labor. Similarly, in the Deccan Lava areas of Southwest Madyba Pradesh (Berar) and North Hyderabad (Marathwada) , and outlying Bhopa1, especially tbe former, there is a high seasonal demand for labor in the cotton fields. Bexar, the chief center of Indian cotton production} is also, not surprisingly, the area with by far the highest rates of agricultural labor in the whole of India, whether those rates be determined by the Census or by t11e A.LB.
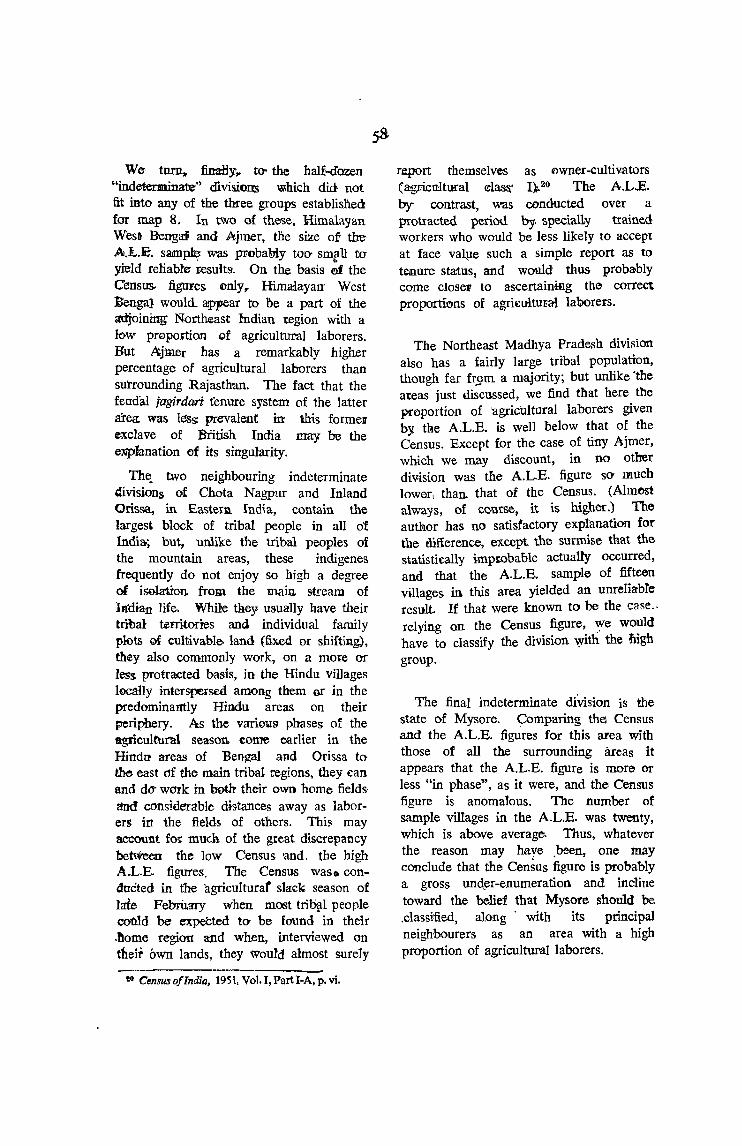
We- turn,. finaHy" to· the half-crazen "indeterminate" divi&ioo:s w.hich did not fit into any of the thi'ee groups established for map 8. In two of these, Himalayan West! Benga:J.i and Ai mer, the size of the AL.E. SaJll1~ was pnobatJiy toO' smell to yield reliable- Fesult~. On the basis !!l1 the Census.. figures cn.ly,. Hima:layarr West l>engal would. appear to be a part of the ~oinirr.g NorthQ:ast Indian region with a low pr0p<:JrtiOin of agricultural laborers. But Ajmer has a remarkably higher percentage of agricultural laborers than surrounding Rajasthan. The fact that the feud'al jagirdari tenure system of the latter area was le:ss prevalent in this formelf exclave of British India may be the e:lWpfanation of its singularity.
The_ two neighbouring indeterminate divisions of Chota Nagpnr and Inland Orissa, in Easteru India, contain the largest block of tribal people in all of Indi~; but, unlike the tribal peoples of the mountain areas, these indigenes frequently do not enjoy so high a degree of iso.lmron from the main stream of Intlian life. While they usually have their tribal territories and. individual family plots of cultivable- land (fixed or shifting), th~y also commonly work, on a more or less protracted basis, in the Hindu villages locally interspersed among them or in the predominantly Hiadu areas on their periphery. As the various phases of the agticultuntl season. come earlier in the Hindu areas of Bengal and Orissa to tho east df the main tribal regions, they can and dO' work in both their own home fields aoo considerable distances away as laborers itt the fields of others. Thi:; may account fOJ: much of the great discrepancy betWeen: the low Census 'and, the high AL.E. figures. The Census was. conduded in the "agriculturat slack season of late FebrUary when most trib~l people cotlld be expeCted t~ be found in their .home region: and when, intervieWed on their bwn lands, they would almost surely
!O Census of India. 19'51, Vol. I, Part I-A, p. vi.
report themselves as t>wner-cultiv.ators (agnicuitural elas&' 1).20 The AL.E. by contrast, was conducted over a protracted period by specially trained workers who would be less likely to accept at face va4Je such a simple report as to tMure status, and wmlid thus probably come close1T to ascertainmg the correct propartWns of agrkultUl:ai laborers.
The Northeast Madhya Pradesh division also has a fairly large trihal population, though far fr_gm a majority; but unlike 'the areas just discussed, we find that here the proportion of agridultural laborers given b)( the A.L.E. is well below that of the Census. Except for the case of tiny Ajmer, which we may discount, in no otIrer division was the A.L.E. figure SO' I11J.uch lower, than that of the Census. (Alm~t always, of course} it is higher.) The author has no satisfactory explanation for the difference, except the surmise that the statistically impmbable actually occurred, and that the AL.E. sample of fifteen villages in this area yielded an unreliab!e result. If that were known to be the case.relying on the Census figure, yje would have to classify the division with the mgh group.
The final indeterminate diVision is the state of Mysore. Comparing thCl Census and the A.L.E. fig~res for this area with those of all the surrounding areas it appears that the A.L.E. figure is more or less "in phase", as it were, and the Census figure is anomalous. The number of sample villages in the A.L.E. was twenty, which is above average. Thus, whatever the reason may have .been, one may conclude that the Census figure is probably a gross und_er-enumeration and incline toward the belief that Mysore should be .classified, along' with its principal neighbourers as an area with a high proportion of agricultural laborers.
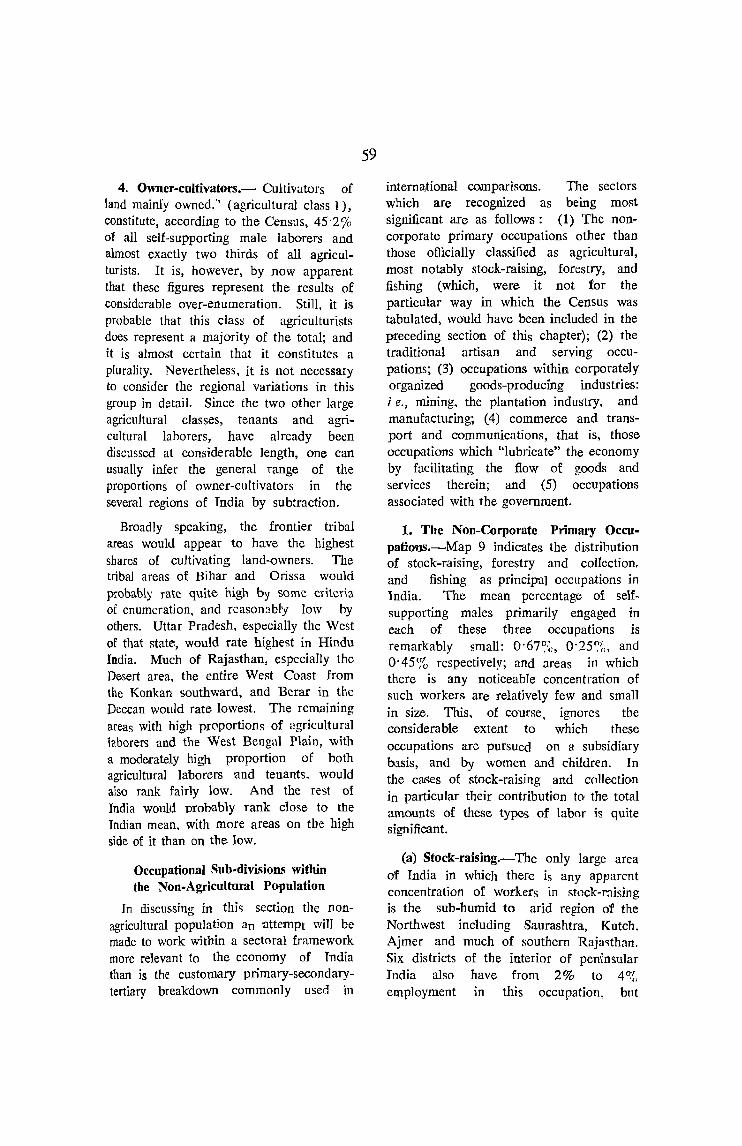
4. Owner-cultivators.~ Cultivators of land mainly owned:' (agricultural class 1), constitute, according to the Census, 45'2 % of all self-supporting male laborers and almost exactly two thirds of all agriculturists. It is, however, by now apparent that these figures represent the results of considerable over-enumeration. Still, it is probable that this class of agriculturists does represent a majority of the total; and it is almost certain that it constitutes a plurality. Nevertheless, it is not necessary to consider the regional variations in this group in detail. Since the two other large agricultural classes, tenants and agricultural laborers, have already been discussed at considerable length, one can usually infer the general range of the proportions of owner-cultivators in the several regions of India by subtraction.
Broadly speaking, the frontier tribal areas would appear to have the highest shares of cultivating land-owners. The tribal areas of Bihar and Orissa would probably rate quite high by some criteria of enumeration, and rcason:lbly low by others. Uttar Pradesh, especially the West of that state:, would rate highest in Hindu India. Much of Rajasthan, especially the Desert area, the entire West Coast from the Konkan southward, and Berar in the Deccan would rate lowest. The remaining areas with high proportions of agricultural 'aboTers and the West Bengal Plain, with a moderately high proportion of both agricultural laborers and tenants, would also rank fairly low. And the rest of India would probably rank close to the Indian mean, with more areas on the high side of it than on the low.
Occupational Sub-divisions within the Non-Agricultural Population
In discussing in thi<; section the nonagricultural population an atte:mPt will be made to work within a sectoral framework more relevant to the economy of India than is the customary primary-secondarytertiary breakdown commonly used in
59
intern3jtional comparisons. The sectors which are recognized as being most significant are as follows·: (1) The noncorporate primary occupations other than those officially classified as agricultural, most notably stock-raising, forestry, and fishing (which, were it not for the particular way in which the Census was tabulated, would have been included in the preceding section of this chapter); (2) the traditional artisan and serving occupations; (3) occupations within corporately organized goods-producing industries: i e., mining, the plantation industry, and manufacturing; (4) commerce and transport and communications, that is, those occupations which "lubricate" the economy by facilitating the flow of goods and services therein; and (5) occupations associated with the government.
1. The Non-Corporate Primary Occupatio'us.-Map 9 indicates the distribution of stock-raising, forestry and collection. and fishing as principal occupations in India. The mean percentage of self-supporting males primarily engaged in each of these three occupations is remarkably small: 0'67~), 0'25%, and 0'45% respectively; and areas in which there is any noticeable concentration of such workers are relatively few and small in size. This, of course, ignores the considerable extent to which these occupations are pursued on a subsidiary basis, and by women and children. In the cruses of stock-raising and collection in particular their contribution to' the total amounts of these types of labor is quite significant.
(a) Stock-raising.-The only large area of India in which there is any appmcnt concentration of workers in stock-raising is the sub-humid to arid region of the Northwest including Saurashtra, Kutch. Ajmer and much of southern Raja<;than. Six districts of the interior of peninsular India also have from 2% to 4% employment in this occupation, but
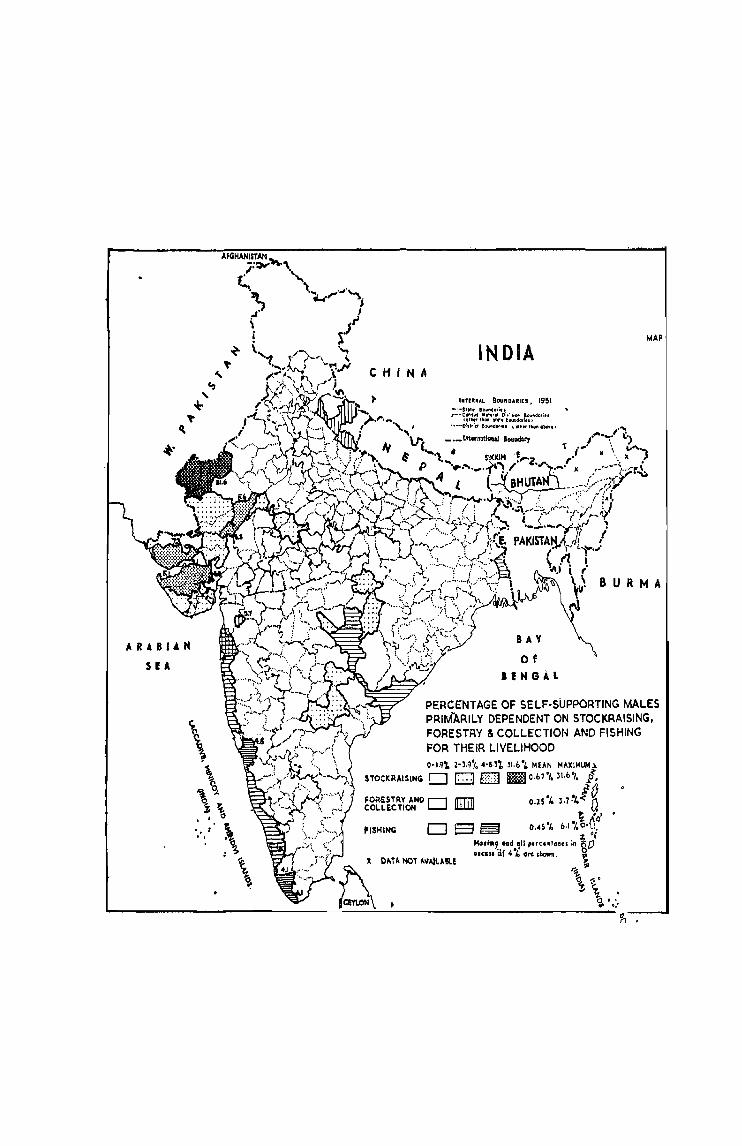
~.
ARABU"
SEA
CHI N A IN OIA
INTr~N"'L BOU"OARIU. 1951 -·-Sfat. 80 .. "'40';" ".-·C"'h. Nat""01 Dj~i"OfI IOYrl6o,;n
., ..... ~~tl~~ ';:II:f:.::7;~f:~!OIl obW.,
BAY
Of BENGAL
MAP
BUR M A
PERCENTAGE OF SELF·SUPPORTING MALES PRIMARILY DEPENDENT ON STOCKRAISING, FORE STAY & COLLECTION AND FISHING FOR THEiR LIVELIHOOD O·I.q'l. 2·l.q',. 4·6.l'j, ]I.b·, MEAN MAXIMUM",
STOCK RAISING D CJ EEl iii! Q.b7·,. ll.b% /.
FORUTRY AND D IT1Tl11 O.H·" l.7~1.!~ COLLECTION lW.IJj <h
~ " o a 11.§ O.4S'1. b.1 ',. o.~: % "
Malia, aDd.,1I pcrcCrt'acCl in SO ',.CI. 'o.f 4 ~ arc ,how.. ~
.. D~TA NOT AVA!USLE " ~ ~ ~' ~ ~ . " .. ... . :
they are hardly insignificant. What is most puzzling in looking at map 9, is the distribution of stock-raising in the desert area of Rajasthan. In Jaisalmer District 31:6% of the population is enumerated as deriving its livelihood from stock raising, (The next highest percentage is but 8'3% in Sirohi). Yet the neighbouring districts of Bikoaner to the northeast, Jodhpur to the east, and Barmer to the south are said to have but 0'3%, 0'5% and 2'3% in stock-raising respectively. Can one really believe that Bikaner which is no less of a desert area than Jaisalmer has relatively, less than one hundredth as much primarily pastoral employment? Almost surely not. A Teasonable supposition is that in much of Rajasthan, and, for all we know, in other parts of the country as well, there was a tendency on the part of enumerators to classify pastoralists as cultivators. Probably the bias was even greater where the pastoralists had a claim to land either as owners or tenants. Of course many pastoralists do engage in a bit of seasonal cultivation; but it is dubious, in the case of Rajasthan, whether that bit is sufficient to warrant their being placed in the Census category of agriculturists. One may, therefore, conclude that the Census data relating to stock-raising must be used with the greatest caution.
(b) Forestry and Collection.-These occupations, particularly the latter, are carried On, on a non-commercial basis, all over India and especially in tribal areas, to gather fuel, fodder, medicinal herbs, and foodstuffs-sometimes even staples, such as the mahua fruit, in Chota Nagpur -for the household. Collection is thus an adjunct of small-scale primary production which is of some significance. But even as a commercia~ activity, as in the case of collecting lac, it commonly tends to be conducted on a subsidiary basis. In only five districts of India does the Census indicate that more than 2% of all selfsupporting males are primarily employed in forestry and collection, the tribal
61
district of Dangs, with 3·7 % having the highest relative share. Of the four remaining districts, three are in wellforested Himalayan Uttar Pradesh, easily connected by river to the adjacent Gangetic Plain, and the fourth, Thana District, reaches to the crest of the also well-wooded Western Ghats in the immediate hinterland of Bombay. All these situations are ideal for logging operations, to which activity the locally relatively high percentages may be attributed. To what degree this is carried on, on a small-scale basis, rather than through the agency of organized capitalistic (or government) enterprise the author is unable to say. If primarily the latter, it might have been better to have treated forestry along with plantation industries in sub-section 3.
(c) Fishing.-As an important activity fishing is confined primarily to the West Coast of India from Thana all the way south to Cape Comorin. (The apparent break on the map is formerly Portuguese Goa). In three districts it engages over 4% of the population the highest proportion, 0'1 %, being found in southernmost Trivandrum. By contrast, only. two East Coast districts, both in Northern Madras (now Andhra) register over 2 %. Also exceeding 2 % are two districts of East Madhya Pradesh (which awear to be dubious cases) and Nadia District of West Bengal where river and pond fishing are of some importance.
2. The Traditional Artisan and Serving Occupations.-Readers familiar with the Hindu jajmani system will recall that there are a variety of occupations diffused throughout non-tribal India, which traditionally were carried out for custoniary payments on the basis of a set of inheritable ties between the serving households (the kamins) and the households served (the jajmans). This system has long been tending to break down Or decline in importance, especially when the pressure on the lalld became so great that the jajmans could no
10bger 'lifford ttl maintain 'their kamins. Thsse who abandoned their occupations
-eften turned to -agricultural '{)r other forms 'Of casual labor. Others who -lost 1lll or a paTt -af 'taeir -customary elient((le -attempted • £0 cart.y on their proiession on a tash basis, -either IQn 'a primary ()r a subsidiary basis. -But -relatively few traditional household "(}9cUpations died .Qut, nv ma1ter hGW 'changed the conditions under which they were flracticed.
Much as -ol1e tnight like ItO do so, it is impossible at this stage to map the pre'Sent quantitative distribution of work ca:rried out within the framework of the 1ajmani system. And as tfor the, traditional 'occupations, those of priest, blacksmith, carpe,nter, pGtter, oil-presser, barber, washerman, sweeper and leatherworker, to name some 101{ the .most illlportant ones, one. -can only get an approximate idea of their distribution -by the use of the 1951 Census. ;r'.Jre simplest map to construct, affording such an approximate idea, is one showing .all non-agriculturalists as a proportion of the ,tbtal rural population. This distribution is presented on map 10, copied, with slight modifications, from a published map by G. S. Gosal.:u
The reason it. was decided initially to .deal 'only with the rural population (which . is, ,in any event, over five-sixth of the -total) .is'that in the urban areas the traditional household occupations are lumped together with all sorts of other, generally .more organized, types.of work within particular census occupational categories to a much greater degree than is the case in the Indian countryside. While certain rural areas where an unusually high degree of non-traditional, non-agricultural work is
.carried on (e.g.) plant~tion areas) limit the value of map 10, for the present purpose, those areas are ,generally well known and may be mentally compensated for. Less easy to .account for quantitatively is the
amOunt :by which work in ,cott-age.-and small-scale industries {which are not here
.oCounted as -traditional ~ccuplitions~ .and -C0mmuting to jobs in urban oareas swells .the proportion lof Ifural non-agt:icwturists . Thus, map 10 must be used with consider:.able discretion. iAccQrdingly") ,the tdiscussion of the re_gional variations .of .map 10 will be supplemented by consideration -of ~eral·other maps '!Which .ar.e .also SDme~ whaL indicative.of Jthe degree of employment in traditional household .artisan .and serving occupations.
Approximately nineteen per .cent of the ,popUlation of rural India, accOTding 10 ,the 'Oensus, derive their livelihood ftom ,nonagricultural ;pursuits. 'l'he great majority
'D.f India, as shown by map 10, .falls in the two class intervals from 8 % 10 .24.%; and within this range-indeed, to a fairly lar;ge extent over the whole of India-mllP 1,0 tends to reflect the pattern of .m~ 7 show.ing the distribution of non-ctgriculturists in the total population, (i.e.) by subtracting the percentage -of agriculturists, from 100 % ) . One of the chief differences between tM two maps -is that the -isolated, highly utban districts which stood out ,on map 7 for their unusually low degree of agricultural employment here stand oot llluch less Or not at all. But those -regions
tas opposed to single districts) which stood out on map 7 tend also to stand out here . There appear to be four general situations ,in which this is the case:
( 1) In regions where the genenil ieve'l at rural prosperity tends to make not amy for a high degree of urbanization but -also 'for a greater demand to maintain the traditional village services. 'the West Uttar
'Pradesh-Punjab and the Saurashtra..!KutChNorth Gujarat Regions are examples .
(2) Where urbanization was initially based largely 'On pTDCessing raw materially produced outside the r~on and-the consc>quent growth of the local market 'for
~I G. S. Gosal, "The Occupational Structure of India's Rural Population-a Regional Analysis," The National Geographical Journal of India, Vol. IV, Part), Sept. 1958, mapon·p. 140.
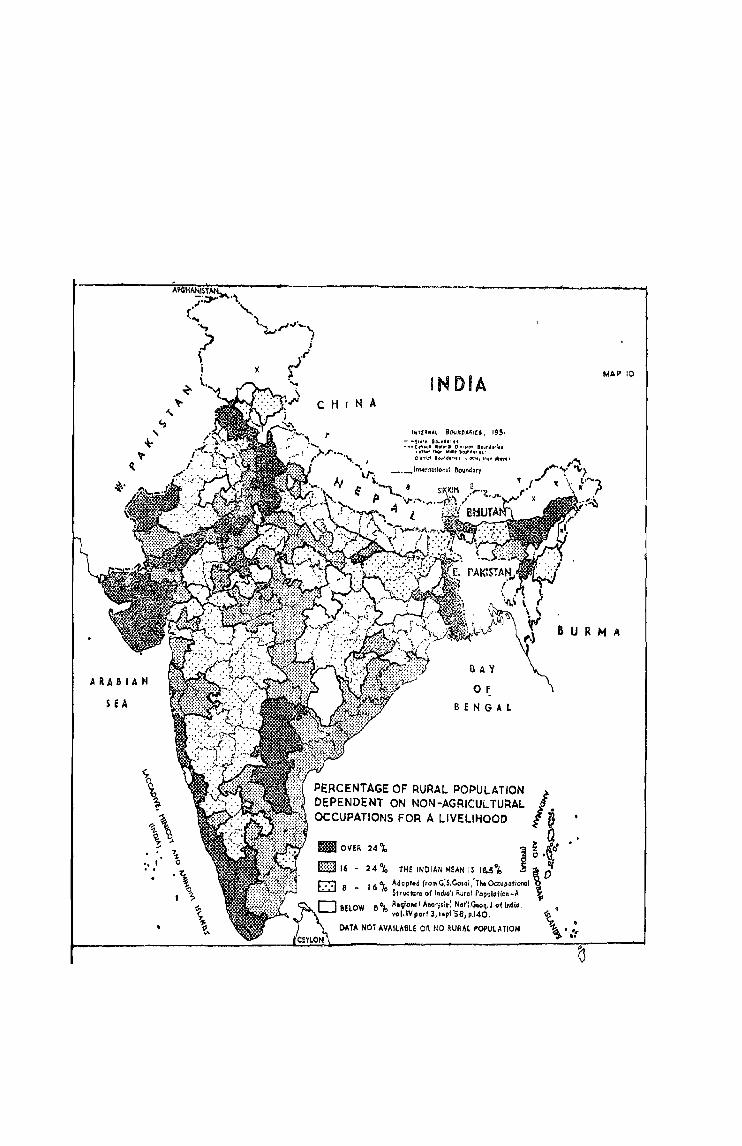
ARABIAH
SEA
..
INDIA MAP 10
CHI N A
]IrIYCIIINAI. 91)1.11:0AI1J", 19!. - -Stt't IO~l\e,,, ... , • - .. _ C .... III t,j01111";I D,~,.,OI! !I~u!ldlJ1"fl
1I~'t.tf 'WI "att bClUflll!lr·tll O:"Ii:' D~lId'f'tl \ CiI'''fl t~,n 0"",)
8 U R M A
BAY
o ~ BENGAL
PERCENTAGE OF RURAL POPULATION DEPENDENT ON NON-AGRICUL rURAL OCCUPATIONS FOR A LIVELIHOOD
III OVER 24\
(]]16
I~ 3 ~ ,~tf
24 °'0 THE INDIAN MEAN is 111.5°" ~ ~ 16 0t Adaptod ItOrnG:S,Go.al:Tt .. o,.-.:upatiOnGll_
0 o Structure of Indio's Rural Pop'Jlotion ... A 'J:I
D &E~OW 1)"10 Rlqlona l Ilnal,.it: .Nat'tGoo~. J.of Indi •. vol.IV part 3, I.pi sa, p.l40.
OAT" NOT AVAlLA8LE OR NO RURAL POPU~A TlON
CJ 8 - . ~ ~ . \':r
food-stuffs injected into the countryside a measure of prosperity which would otherwise have been lacking and which in turn helped sustain the traditional rural services. Parts of West Bengal, and southwest India (exclusive of the Malabar Coast and the plantation areas), and to a lesser degree, the hinterland of BO,mbay seem to be cases in point. Commuting, in the case',of West Bengal in particular, may also explain much of the rural non-agricultural employment.
(3) In little urbanized regions, where cottage and small-scale industries are especially well-developed in the. rural areas themselves, this alone may suffice to create a high degree of both rural and total nonagricultural employment; and here too the traditional occupations are apt to benefit
by such prosperity as those industries create. The Malabar Coast is by far the best example of this situation; but some of the areas named above also have not inco~siderable cottage and small-scale i~dustrial development.
( 4) In regions in which a high level of non-agricultural employment is attributable to such primary industries as stock-raising, as in parts of Rajasthan, and plantation industries, in Assam and part of Southwest India, one should probably not expect to find a high degree of traditional occupations. Stock-raising is not very apt to provide a markedly greater degree of local prosperity than would cultivation, and in the areas of plantations the newly implanted, more or lelss artificiaLsocieties have presumably carried over relatively. few characteristics of the old v lllage-based order.
There is one rather large regi'Jn of peninsular India in wJ:tich the percentage of rural non-agriculttlral workers is over 24%, namely most of the Telangana area of the ,South Hyderabad Division (where one district, Karimnagar, 1S shown to be
oDo-third non-agricultural) alld tW(J) distriots immediately to the south in the Madras Deccan. On the basis of two visits to Telangana, the author is highly sceptical of the correctness of the Census enumeration in this area. There is no apparent reason why it should have the high proportion of rural non-agriculturists attributed to it. This scepticism with respect to Telangana carries over to the figures for the area to the south of which the author ha~ no tint-hand knowledge. It seems probable that in these areas a systematic bias was introduced by the common mistaken enumeration of caste professions rather than the professions actually pursued as a main source of livelihood. (This sort of bias, which has already been discussed, is, it should the noted, much more likely to occur in rural than in urban communities, where the concern with caste, at least so far Q.S occupations are concerned, has greatly diminished).
To cite the most extreme evidence in support of this contention it may be noted that whereas North Hyderabad returned about '750 rural male workers under the industrial category "processing and manu- . facture of beverages," South Hyderabad, with somewhat over twice the populatien returned over 51,000 such workers, which is 40% of the total for the whole o'f Indi-a22
It is obvious that many, if not all, of the locally important caste of toddy tappers (who should be properly considered under the category of forestry and collection in those instances when they still follow their caste calling) were classified in the category named in ~he latter area.
If, as appears to be certain, we are confronted with a flagrant error in the areas just discussed 'one would probably be safe in assuming that similar, less flagrant, and hence less easily detectable, errors have entered into the statistics for other areas. It is the author's guess, in accordance with this line of reasoning, that the whole
U C."SllS of Indja, 1951, Vol. I, Part II. C., Table B-I1I, pp.96-97.
of Telangana, the whole of the Madras Deccan Division, much of Central Madhya Pradesh and much of the Interior Oris~a Division are enumerated by the Census as having a greater proportion of rural nonagriculturists than is actually the case; and that, as a consequence, one may make, in these regions in particular, no reliable inferences from map 10 as to the extent of employment in the traditional artisan and serving occupations.
If consideration is limited to the principal traditional service· occupations (i.e., excluding arti,san activities and commerce), the resulting map (map 11) may be presumed to be much more reliable for several reasons. First, since a much larger proportion of workers in service castes are actually pursuing their caste callings than is the case with artisan castes, biases introduced by the reporting of caste occupation rather than actual occupation will be of lesser magnitude. Second, since most of the work in serving occupations (domestic service, barberin)!, and the washing of clothes, accounts for two-thirds of the three million people so classified) is menial in nature, whife that in artisan occupations usually is not, whatever psychological bias might exist would be against reporting caste occupation when) it is not the occupation actually pursued. Third, with the exception of domestic services, the occupations under consideration tend to be rather discrete in the context of Indian life. A final note: Ma~ 11, unlike map 10, takes into consideration the urban as well as the rural population. This is perfectly proper in this case, since the occupations treated are universally and overwhelmingly carried on in India as individual household pursuits rather than on a corporate basis.
If the reader compares map 11 with map 2 showing the regional variations in the level of economic develDpment. he will find a rather high degree of correlation between the two. Areas on map 1 t with loss than 2% employment in misceUanoous
classified services almost always show up on map 2 as being areas of tribal or subsistence peasant economy. At the opposite extreme, areas with over 4% employment in these services almost always show up as areas of advanced commercialization, economic diversification. or large-scale organization. In between, areas in the 2% to 4% range of map 11 are usually shown as areas of incipient commercialization on map 2.
There are, however, several noteworthy exceptions to the above generalizations. First. we note that two districts in Orissa and one in Rajasthan score over 6% on map 11. These are probably attributable to errors in enumeration, the Orissa case being especially hard to credit. Second, we note severa] fairly large areas of advanced commercialization on map 2 where there is less than 4% employment in miscellaneous services. most notably in the cotton growing areas of the Deccan and the plantation areas of Assam. In the former areas, and certain others of lesser importance commercialization has not gone hand-in-hand with prosperity fDr a large segment of the population; and the demand for services is, consequently, about as low, -as a rule, as in areas of incipient commercialization. In Assam. however, one can explain the low proportion of workers in traditional services as being natural to an area comprising such a large population of immigrant workers. The population brought to the area. largely at the expense of the tea planters, was made up mainly of agricultural labourers and there was no incentive for the plantation owners to pay the way also of barbers and washermen to serve them. Two final areas standing out on map 2. but not especially on map .11. are West Bengal and East Puniab-West Uttar Pradesh. The probable, explanation of the latter case is that many workers 'in the Muslim castes who normallv performe-d the work of barbering and c1othe<;wa~hino: in th!lt region fled at the time of partition to areas in West PakistflD,

ARADIAN
Sf A
INDIA
INT'''NAL 8oUflOIi'IEi. 1951 _o-'tl·,IOIjIl'o,r .. .... - C'lllft """"01 oM.,.,., 10l.I"''''.'
•• tbtr'W"oJI.llowf'llllt,'u ~ltlfrct ._ •• ~'u ~ ctI'I" 1hlll .... n
l( DATA MOt AVA-ILAtU
lAY
OF B tM G A I.
• CCnIU. Clltagc>rlca 9·1 tllrDvgh 9.11 ()f Tobie B-III, I.e. Occupational group 0 'Ilrylc .. not cl.cwhcI"I ~p&cI1Ied' minus .u~;r.1Ip 9:0. ' Scrvices 01",",1 .. unelcsslflcd. •
MAP
8 U R M A
thus leaving a void which Hindus, owing to the low status of the work in question, were reluctant to fill.
Barring the exceptions noted in the preceding paragraph, it appears that the pattern of map 11 is a rather good guide to the general level of prosperity and economic development in India. If we assume, as seems logical, that the local demand for the traditional services of a personal nature is, in general, proportional to the effective demand for traditional services as a whole (including the work performed by artisans), then we probably can arrive at no better cartographic guide (without a great deal of statistical juggling) to the latter demand than that afforded by the map of the former, i.e., map 11. It would be possible at this point to take up the question of artisan occupations in greater detail; but it will be more convenient to discuss that question in the general context of the distribution of manufacturing activity of all sorts in India.
3. Corporately Organized Industries.The industries with which this section is primarily concerned are those which are capitalistically organized on some sort of corporate basis, rather than on the basis of the small-scale family enterprise, and which produce goods either for a foreign market or domestically in competition with the artisan- groups characteristic of the traditional Indian economy. The plantation industry, the mining industry, and factory manufacturing are the principal ~ub
headings of this group.
(a) Plantation Industries.-PhmtatioD workers form a significant portion oj all self-supporting males in but two regions of India (map 12): Northeastern India. from Darjecling east to Lakhlmpur and Cachar in Assam (with some interruptions). and the less important Ghats area of Southwest India. In the latter area many small-scale cultivators of plantation crops and spices were probably ellumerated as
agriculturists, due to th~ fact, or assumption. that the greater part of their income came from the cultivation of non-plantation crops.
(b) Mining and Quarrying.-These occupations are also of considerable importance in only a few parts of India (map 12). Two coalfields, the Jharia field in Dhanbad, Bihar. and the Raniganj field in Burdwan, West Bengal, account for the great majority of an workers. Most of the remainder are located in a few other districts of the highly mineralized northeast peninsular portion of India. The only other district with a large concentration of mine workers is Kolar, Mysore, in which the famous Kolar Goldfields are located. Two other rather minor concentrations are in the lignite fields of what was Hyderabad.
(c) Factory Manufacturing.-The distribution of employment in manufacturing presents a much more difficult problem. According to the Census 8·1 million selfsupporting males are primarily employed in processing and manufacturing of all sorts. This figure, which is probably somewhat of an over-enumeration, due mainly to the confusion of caste occupation with actual occupation, comprises, as has already been stated, both petty artisans and workers in clearly recognizable manufacturing establishments. Among the former are included all sorts of repairmen, who themselves are not engaged in original manufacture. and all hawkers of products which they themselves make, even those who spend much more time in the hawking than in the making. In the previous section it was stated that the proportion of artisans caterin~ to purely local needs of a traditional nature was proba~Jy reasonably weIl reflected by map 11.
Our present concern. however. is with workers in factories and cottage workshops producing goods not ",olely for the village or immediate neighboU'fhood (urban or rural) in which they reside. but rather to be sold through middlemen and for cooperatives to a much broader market.
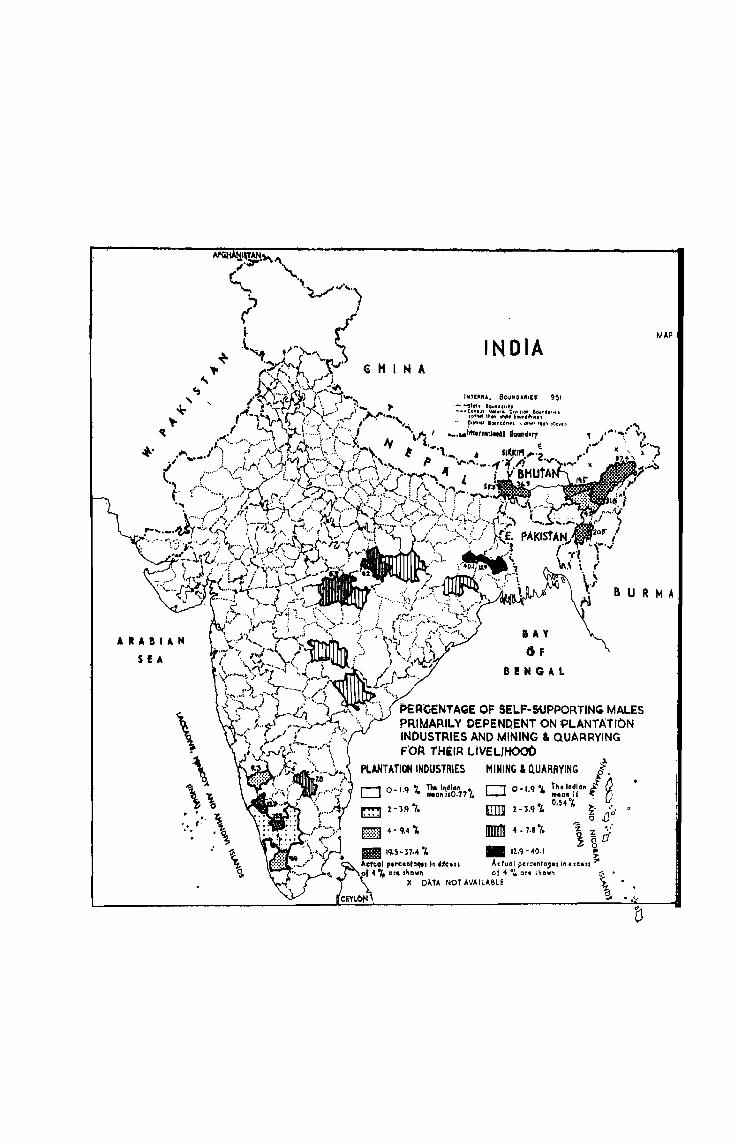
ARABIAN
Sf A
\ \ ~ ;;I.
\\ '~" ;~. \
'\
GHINA INDIA
INTEIitNAI. BOIJHD'''"ES' 19~1 ,_ "st,,, 811111I<'Ot,h --·Ce".~t NIIII~'" DrV'II(tII SOllnda'",
cotlWtfhon .tGt.tloulld,,",tu .- ~,.ftICI 8011I1Ur, •• ,0111"'110" CbO¥fl
, _, .. llIIornltlaftll IIound,,,
E
MAP
8 U R M A
lAY C)F
B!NGAl
PER(€t.iTAGE OF SELF-SUPPORTING. MALES PRIMARILY DEPEND.ENT ON :PLANTATION INOUSTRIES AND MINING & QUARRYING FOA THarR LlVELlHOOO
PLANTATION INDUSTRIES MINING & QUARRYING I D 0-1,'1" Th.ln~l.n if ()
iii IItlon., .t' D ITTT1I " 0.54 at. ~ • UllI Z -3,'1 10 Z- '0'
o .0 • 4-7.8·'. \ ~ ~:' •
""0 1M - ~O.I ~
"'duo ( perc.ntases in e xeeu '7'
4.,. <Ire SlaDw" of 4 0/,. ora showl'l U;
X DATA NOT AVAILABLE '\ • • .. .
Unfoortunaooly, th. author has fO\Uld no reliable all-India regional data bearing on the quantitative distribution of employment in either small-scale or cottage industries.~:l Even official estimates of total national employment in these two types of establishments appear to be lacking. Only for the so-called large-scale industries, thanks to the annual Census of Manufacturers, initiated in 1949, are there publisbed data on the extent of factory employment. The factories covered are those falling within the purview of the Factory Act of 1948, and which were duly registered under the provisions thereof. Three types of establishments are included: (a) Those utilizing power and employing at least ten workers; (b) Those not utilizing power and employing at least twenty workers: and (c) Any other factories "specially notified by the State Governments provided that the manufacturing process is not being carried on by the owner only with the aid of this famiIy".24 In all', an average daily employment of about 2,900,000 workers was registered in reporting factories of these three types. Of this number over 90% were in factories of type (a), and less than 2% in factories of type (C).25
Adult men accounted for 88 % of the total employment, adult women for 11 %. and adolescents and children (if we are to believe the official statistics) but 1·2%26 Since factory wages are relatively good by Indian standards virtually all men regularly employed in factories could reasonably be
69
considated 1$ 5&lf~upporting. Th* number of such persons would, it should be noted, be appreciably in excess of 88% of 2,900,000, since that figure represents average daily employment which is, of course, below total employment due to the generally high rates oC·absenteeism and labor turnover. Moreover, casual laborers, hired in considerable numbers by many factories on day-wages, are not entered on the factory rolls and hence are not: counted in the official statistics. On the other hand, the volume of employment to which the statistics refer is slightly inflated by the inclusion of clerical and other factory workers not personally involved in the manufacturing processes. These the 1951 Census of India would not, in theory, class as factory workers.
In the author's oplmon some figure between 3,000,000 and 3,250,000 would represent the correct number of adult males primarily dependent on "large scale" factory work in India in 1951, as compared to a Census total of 8·1 million self-supporting males dep~ndent on aU forms of processing and manufacturing. The number dependent on the traditional artisan occupations pursued as individual family enterprises is probably. according to some very rough calculations which the author has made. between 3.750,000 and 4.000.000.27 Thus, in all likelihood, the number of selfsupporting male-workers in all non-traditional (though not necessarily non-household) cottage and small-scale industries
28 The All India Directory of Cottage Industries, published by the Ministry of Commerce and Indu.~try in 1953, does supply state-wise data on employment in a large number of cottage industries. There are, however, numerous gaps in coverage due to faulty compliance by the several states with instructicns for the con~pilation of the desired information issued by the Central Government. There appears, moreover, to l::c no standardization as to just what is to be included under the term "cottage industry" as opposed to small-scale manufacture on one hand and household enterprise on the other.
24 Manager of Publications, Statistics of Factories, 1951, pp. 25, 26 and 29. Several generally minor regional biases are introduced into the officialfactory statistics duein part to the regional variati( ns in the degree of nOnreporting, especially among type (c) factories and in part to the variations in state rulings as. to what constitutes a factory under the heading of type (c) (p. 2).
95 Ibid.
2' Ibid., p. 5. '" In these calculations traditional industries were taken to be limited to those presumably producing
• almost exclu~ively for a local market, i.e., within the direct reach of the artisan producer. Handloom weaving for sale to non-local markets. for example, waS considered as a cottage industry rather than a traditional industry. The distinction is admittedly arbitrary. Too many assumptions eutered the calculations to warrant th~lr detailed explioation.
combined would be' oaly a bit more than one million. Unfortunately, it is not possible at present to map the ~stribution of such workers.
Map 19, which will be discussed in the subsequent section of this chapter, shows the distribution of employment in all components of the secondary sector combined. Map 13, to be discussed below, deals exclusively with factory workers as enumerated by the 1951 Census of Manufactures. In commenting on map 13, some parenthetical references will also be made with regard to the distribution of cottage and small-scale industry where they are known to be particularly important.
In constructing map 13 use was made of the district-data assembled in the Basic Statistical Analysis of India. This wurk reorganizes that of the volume Targe Manufacturing Establishments in India in which the original data are arranged according to a very detailed industrial rather than a district breakdown. In both works employment data are for all non-casual workers, regardless of sex and age, and for se~sonal as well as perennial factorie~. But, in the district data of the former, industries in which the total number of workers was les~ than fifty were omitted. Thus, district
tota.i§, in many instances, are slight underenumerations on this account as well as on account of non-registration of factories. 28
Although there have already appeared several maps of the distribution of factory manufacturing in India on the basis of district data, map 13, to the best of the author's knowledge, is the first attempt to show the proportion of workers in relation to the district population.29 It may, however, be somewhat misleading in those places where commuting across district lines is at all significant, since workers are counted at the place of work rather than at the place of residence. Thus, the difference between 7'2 factory workers per thousand population in Calcutta as against 118 in Bombay is partly explained by net commuting out of the former district (which is coincident with i the city proper) to the factories roundabout -in- the district of Howrah, Hooghly and 24-Parganas, whereas, in the case of the Bombay area, the factories lie almost entirely within the city and the net commuting is inward.
It will be noted from map 13 that there are no broad industrial regions in India or even very clearly restricted industrial belts.30 Instead factory manufacture is
2 •• The author cannot vouch for the accuracy with which the data of the Basic Statistical Analysis of India were compiled. The steel mill at Bhadravati, Mysore, for example, with nearly 5,000 workers, was found to be enumerated both under Shimoga District, where it belonged, and Mysore District, where it did not. Probably, however, few other, if any, mistakes of comparable magnitude were made.
2 •• G. T. Trewartha and J. L. Verber, "Regionalism in Factory Industry in India-Pakistan," Economic Geography, 1951, pp. 283-286, map on p. 284. P. P. Karan, "The Areal Distribution of Manufacturing in India," Journal of Geography, 1958, pp. 294-300, map on p. 296. R. C. Kingsbury. "India's Industrial Growth" Focus, Vol. VI, No.9, May, 1956, map on p. 3. Mr. Kingsbury makes no mention of how his map (drawn by Vincent Kotscher) "Percentage of Total Population in Manufacturing", was compiled. Presumably district data were used; but iust how is not certain. To this author, his results appear to be little more than a rather wildfiight offancy. The inaccuracies are too numerous to mention; but quite commonly, the number of workers indicated in manufacturing appear to have been swollen to several times the correct amounts.
ao:Trewartha and Verber, though stating in their article that "India-Pakistan has no industrial belt or belts as exist in some highly industrialized countries", discern, nevertheless, "a recognizable pattern in the distribution of factory industry" and delineate "three general regions in which factory industry is more concentrated than in others". To this author, the "regions" may be recognized only on the map presented, due largely to the weight of the symbolization employed; it is not felt that they have any existence in reality. The so-called "Northern Region" for example, stretching from the Bay of Bengal (0 West Punjab, contains numerous districts in which not a single industry employs as many as fifty workers. Karan, working only with districts in which there' are at least 1,500 factory workers and employing the graduated circle technique, also has little trouble in recognizing "manufacturing areas", of which he described five, and cites nine others. But he too appears to be the victim of his symbolization, which makes "manufacturing arra~" appear where none roallyexist. The circles (colored solid black) for Calcutta and Bombay are each about 350 miles in dia· meter, or not quite 100,000 square miles in area.
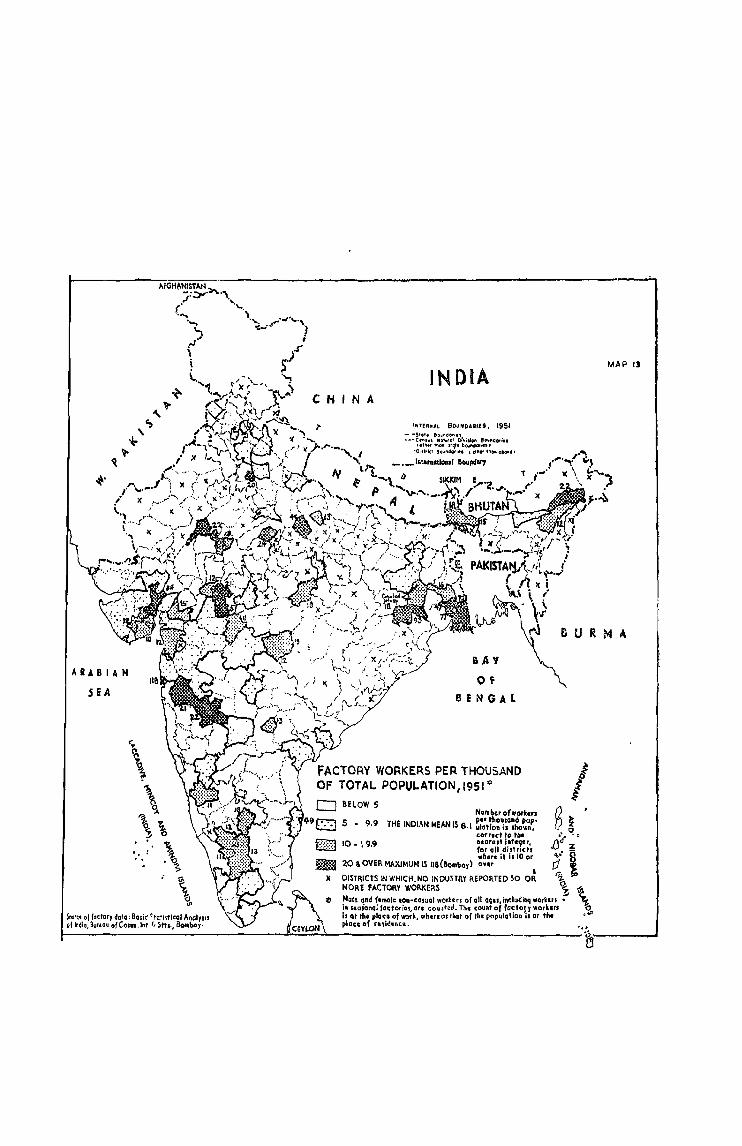
AIIABIAH
SiA
\ \ 'i
~ ~~
?< 0 . ' \ ',', : 'i
''?; -;;.
\ oJ>
~rt. 01 facfory data: Basic 0: tothtlcal Analysfs of Indio, Bureau o{Comm.lnf fj Stts., Bombay.
IN OIA
SAy
Of
BENGAL
FACTORY WORKERS PER THOUSAND OF TOTAL POPULATION, 1951 * o SElOW 5
05- 9.9
E]J 10-19.9
NUftlb.r of workers
THE INDIAN MEAN IS 8.1 ~io'l!~:~~o::ot~~·
Em
corr,ct to the DtQralt iat.,..r • for all district. wh,rc it is 10 or
20 &. OVER MAX1~IUM IS lle(SoIDbayl 0." , x DISTRICTS IN WHICH.NO INDUSTRY REPORTED 50 OR
MORE FACTORY WOP.KERS
I f
B ~ . •• c!"
.r/' z
~"l ~ ~ " ?< <I!\ Ma.e. and f.male: lIon"casual workers of all QQcs, inciudihCi wortc:.n ..
in soo;onal fQctoriQ~. ar, cout:c4. The count of fac:ton work-cn is at 1M plac. of _k, who .... thot of Ih populolio. is or the .4P P'Q~C- of n,ic;!.fit:t.
MAP 13
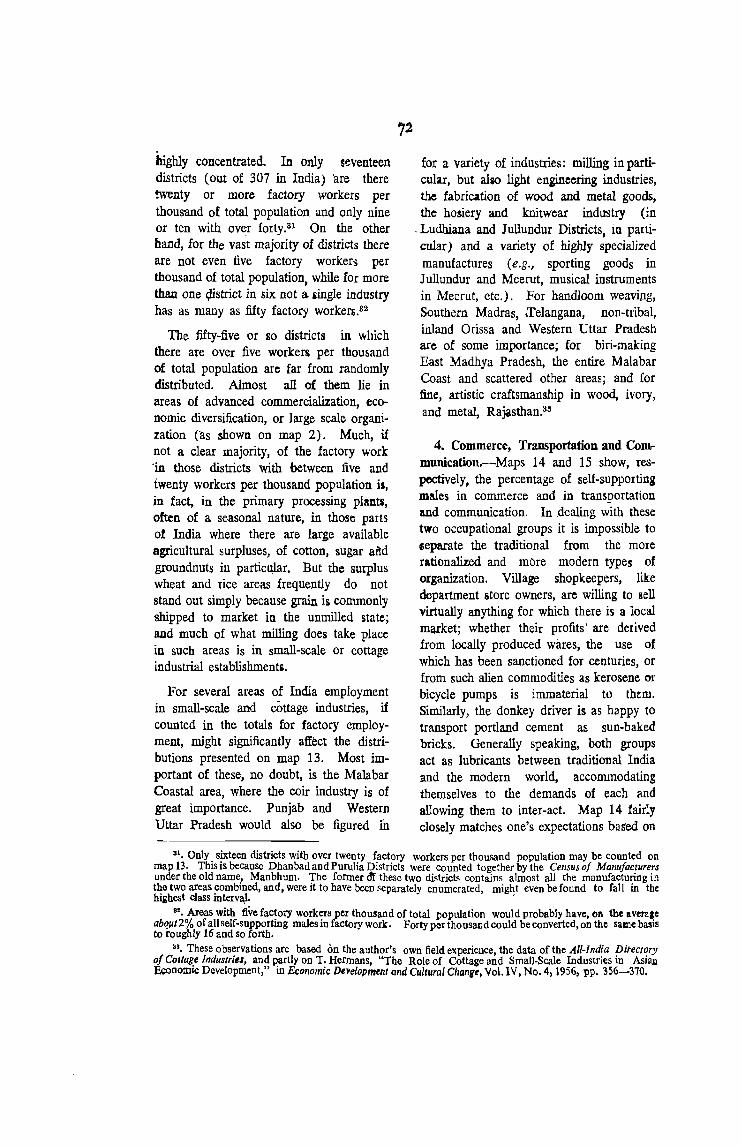
highly concentrated. In only seventeen districts (out of 307 in India) 'are there twenty or more factory workers per thousand of total population and only nine or ten with ov~r forty. 51 On the other band, for the vast majority of districts there are not even five factory workers per thousand of total population, while for more than one Qistrict in six not a ,ingle industry has as many as fifty factory workers.52
The fifty-five or so districts in which there are over five workers per thousand of total population are far from randomly distributed. Almost all of them lie in areas of advanced commercialization, economic diversification, or large scale organization ('as &hown on map 2). Much, if not a clear majority, of the factory work ·in those districts with between five and twenty workers per thousand population is, in fact, in the primary processing planti, often of a seasonal nature, in those parts of India where there are large available agricultural surpluses, of cotton, sugar aM groundnuts in partic~ar. But the surplus wheat and rice areas frequently do not stand out simply because grain is commonly 'Shipped to market in the unmilled state; and much of what milling does take place in such areas is in small-scale or cottage industrial establishments.
For several areas of India employment in small-scale and cOttage industries, if counted in the totals for factory employment, might significantly affect the distributions presented on map 13. Most important of these, no doubt, is the Malabar Coastal area, where the coir industry is of great importance. Punjab and Western Uttar Pradesh would also be figured In
for a variety of industries: milling in particular, but alio light engineering industries, the fabrication of wood and metal goods, the hosiery and knitwear industry (in
,Ludhiana and J ullundur Districts, in particular) and a variety of highly specialized manufactures (e.g., sporting goods in Jullundur and Meerut, musical instruments in Meerut, etc.). For handloom weavi11g, Southern Madras, ,Telangana, non-tribal, inland Orissa and Western Uttar Pradesh are of some importance; for biri-making Bast Madb:ya Pradesh, the entire Malabar Coast and scattered other areas; and for fine, artistic craftsmanship in wood, ivory, and metal, Ra.iisthan.3~
4. Commerce, Transportation and Communication.-Maps 14 and 15 show, respectively, the percentage of self-supporting m&les in commerce and in transportation and communication. In ,dealing with these two occupational groups it is impossible to 6eparate the traditional from the more rationalized and mOre modern types of organization. Village shopkeepers, like department store owners, are willing to sell virtually anything for which there is a local market; whether their profits' are derived from locally produced wares, the use of which has been sanctioned for centuries, or from such alien commodities as kerosene 01'
bicycle pumps is immaterial to them. Similarly, the donkey driver is as happy to transport portland cement as sun-baked bricks. Generally speaking, both groups act as lubricants between traditional India and the modern world, accommodating themselves to the demands of each and allowing them to inter-act. Map 14 fairly closely matches one's expectations based on
31. Only sixteen districts with over twenty factory workers per thousand population may be counted on map 13. This is because Dhanbad and Purulia Districts were counted together by the Census of Manufacturers under the old name, Manbhum. The fonner df these two districts contains almost all the manufacturing in the two areas combined, and, were it to have been ~eDarately enumerated, might even be found to fall in the highest class intervaJ. '
". Areas with five factory workels pel thousand of total population would probablY have, on the IlVeral! abQllt 2 % of all self-supporting males in factory work. Forty per thousand could be converted, on the same basis to roughly 16 and so forth.
8S. These observations are based on the author's own field e'ltperience, the data of the All-India Ditectory of Cottage Industries, and partly on T. Hermans, "The Role of Cottage and Small-Scale Industries in Asian Economic Development," in Economic Dt1e{opment and Cultural Change, Vol. IV ) No.4, 1956, pp. 356-370.
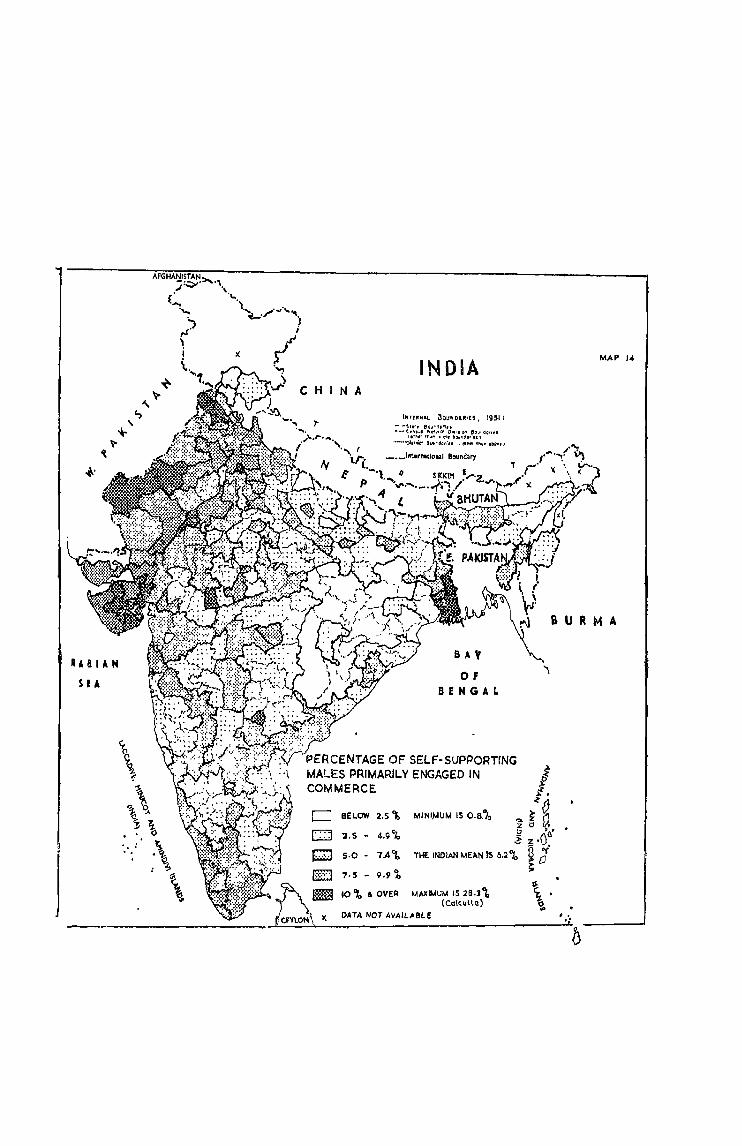
RASIAN
S fA
AFGHANISTAN,.", ;:.::;,-' .\
(' '''. "\... \, ............ " . c-;".
,.1' ! , js'
~ IN DIA CHI N A
(fI!U#.ftlL 30t.HtOI.RIU. 1951: - -~III'r BOllru"l,.
-_ .. ~~~:~~ l~gO:~',o~~'b~:;C'~t~'I; dQ"" ...... 0:.'.;(" BItII~"~~I'" • Cfflf' tl'lg" ablhl I
BAV
OF BEHGAL
ERCENTAGE OF SELF-SUPPORTING MALES PRIMARILY ENGAGED IN COMMERCE
BELOW 2.5~
2.5 - 4.9 ".b
5·0 - 7A't 7·$ - 9.9'1,
10 't a OVER
)( DATA NOT 4YAlL .. 8LE
MAP 14
a U R M A
.. .:
A ...... 'tAH
SEA
INDIA CHI N A
IIiITEIII""L BClUHOAltf£l't 19S,!: - · ... $Iot.. 8ou",-do.d ... -"_-C'"S-ul NOlwrOI Otwl .. iCl'! eOlUldorl ..
cot~r'l'Io," ,to',ccu"Clo, ... ,
IENGAL
PERCENTAGE OF SELF~SUPPORTING MALES PRIMARILY ENGAGED IN TRANSPORTAT10N & COMMUNICATION
BELOW 2<>10
2 - 3.9°'0
4 - 5.9%
MINIMJM 15 0.1 )W 0.1 ok
THE INDiAN MEAN IS 2.1 %
6°" ,. OVER MAXIMUM IS 15.80/o(CQ\t~IIQ}
DATA N:)T AVAIt.AElLE
MAP 15
BUR M A
D
the analysis of previous maps. In general, areas of pronounced prosperity, especially Punjab and Saurashtra, are seen to have over 7'5% employment in commerce, as do numerous isolated highly urbanized districts. Much of the Rajasthan Desert area has an unusually high proportion of people engaged in commerce. This is largely, of course, a function of its small percentage of cultivators; but the distant spacing of settlement in this area probably requires more specialization in commercial activiti('s than in areas of denser population, where the producers of primary and secondary goods may themselves find it convenient to market their produce. The fairly even spacing of major centers of commercial activity in Western Uttar Pradesh and the adjacent plains portion of Madhya Bharat is arso noteworthy and' suggestive of the theoretical equally-spaced primary service centers of the German economic geographer Christ'aller.
Generally, the data of map 14 appear to be reasonably reliable. Certain areas in the Deccan with between 5 and 7'4% employment in commerce may, however, represent sligflt overenumerations. especially the Madras Deccan area. whi1e in a few instances districts shown in this category fall barely within its limits and are not essentially different from the adjoining districts in the lower class interval.
With regard to the population employed in Iransportation and communication (map 15), few areas stand out as being above the national mean, a fact which betokens a rather high degree of local concentration within this occupational group. A large proportion of the twenty districts with over 4% employment contain important rail junctions or ports. Sikkim stands out. no doubt, because of its large number of mountain porters; in 'SihBer 'tnn J odhpur employment in the caravan trade may, similarly, be of some significant. Ge'nerally, however, one might expect that many of those indviduals in ~ajasthan involved in tradillg by caravan have been olassified
75
(probably correctly) as being primarily engaged in commerce.
In several districts of P.E.P.S.U. the degree of employment in transport work appears inordinately high, i.e., on the order of several times as high as in the surrounding districts of Punjab which ought, if anything, to have slightly more, rather than much less, employment in transport than P .E.P.S.U. The explanation appears again to be mere bias. It will be recalled that, compared to Punjab, P.E.P.S.U. had extremely few workers classified under "services otherwise unclassified." Quite likely many day-laborers, occasionally working in towns as porters in the market, and who WOUld, in Punjab, have been classified under the heading "services otherwise unclassified," of ma'p 6 were, in P.E.P.S.U. erroneously classified as transport workers.
5. Government and Associated Services Map 16 indicates the percentage of selfsupporting males primarily engaged in all forms of public administration (i.e., all government workers not elsewhere classified), education (which is mainly government-supported) and health services (a large part of which, if not a majority, are operated by the government). Tt provides, therefore, a tolerably good guide to the regional variations in the degree of "welfarism" in the Indian welfare state.
The most striking feature of map 16 in contrast to many of the other maps dealt with in this chapter, is the remarkable tendency for given states, rather than regions straddling state lines, to have homogeneous distributions, especiaUy if one excludes districts pcontaining state capitals and such special cases as hilJ stations where government offices are apt to be concentrated. This indicates the degree to which government direction, rather than the free play of the market, has regulated the supnly of the services under consideration. Generally speaking, the wealthier stuteg have large.r empl'oyment in
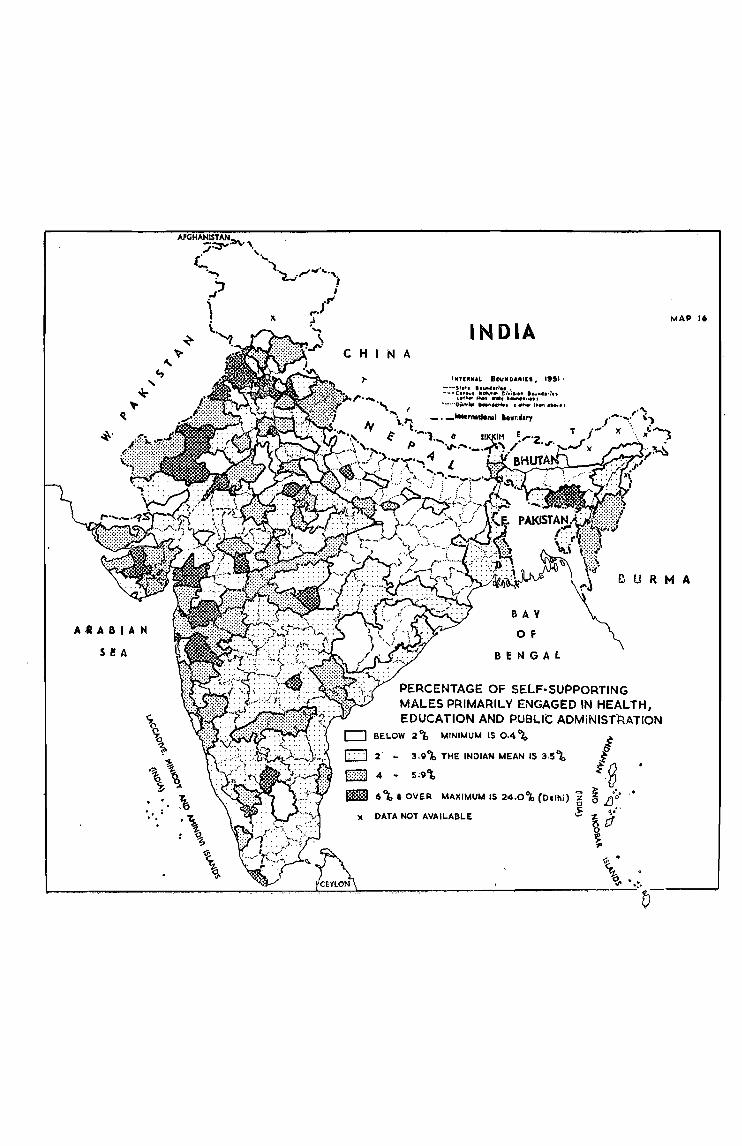
~.
A.IABIAH
seA
~
\\ ~ ;<-
• • li~ '.: ,6 . . . \,
't. :%
MAli' 16
INDIA CHI N A
BUR M A
BAY
OF
BENGAL
PERCENTAGE OF SELF-SUPPORTING MALES PRIMARILY ENGAGED IN HEALTH, EDUCATION AND PUBLIC ADMINISTRATION
BELOW 2't MINIMUM IS 0.4't /
~ 2' - 3.9"A, THE INDIAN MEAN IS 3.5% ;-..
~ 4 _ 5:9\ 19 ~o, C) ~~" ••• ~ 6 to I OilER MAXIMUM IS 24.0 ~ (Delhi) ~ 0 L)P
~ 8;r o
)( DATA NOT AVAILABLE
i.
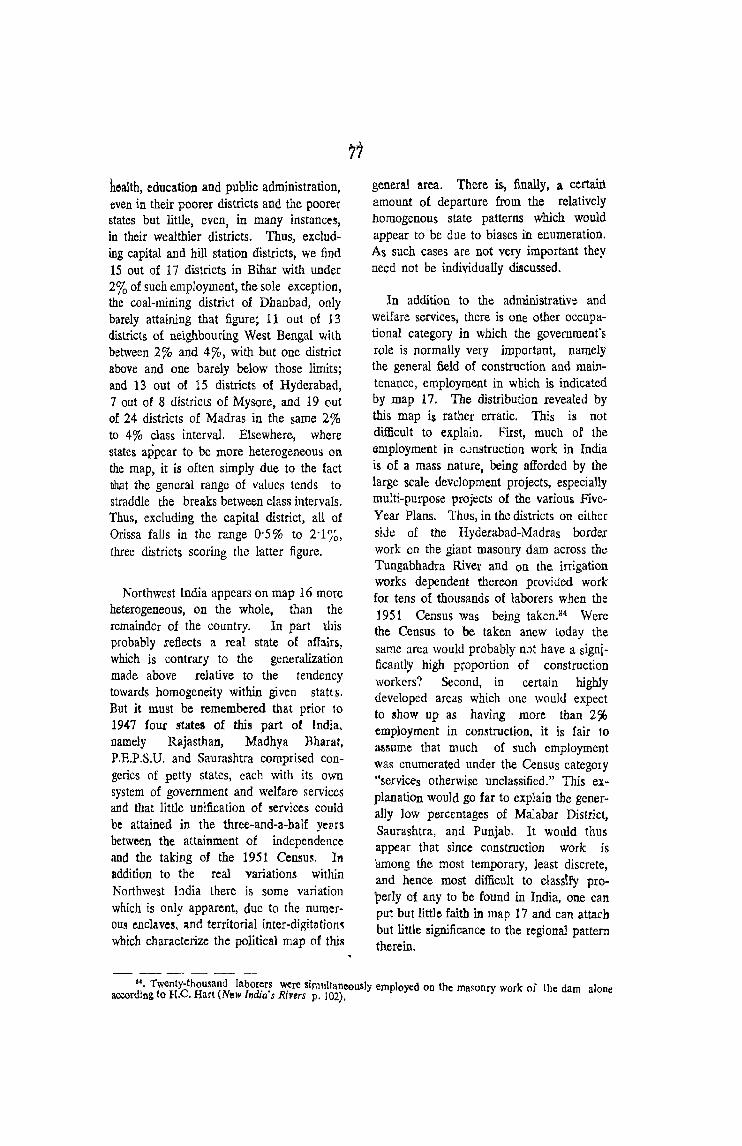
hoalth, education and public administration, even in their poorer districts and the poorer states but little, even, in many instances, in their wealthier districts. Thus, excluding capital and hill station districts, we find 15 out of 17 districts in Bihar with under 2% of such employment, the sole exception, the coal-mining district of Dhanbad, only barely attaining that figure; 11 out of 13 districts of neighbouring West Bengal with between 2% and 4%, with but one district above and one barely below those limits; and 13 out of 15 districts of Hyderabad, 7 out of 8 districts of Mysore, and 19 out of 24 districts of Madras in the same 2 % to 4% class interval. Elsewhere, where states appear to be more heterogeneous on the map, it is often simply due to the fact that the general range of values tends to straddle the breaks between class intervals. Thus, excluding the capital district, all of Orissa falls in the range 0'5% to 2'1%, three districts scoring the latter figure.
Northwest India appears on map 16 more heterogeneous, on the whole, than the remainder of the country. In part this probably reflects a real state of afIairs, which is contrary to the generalization made above relative to the tendency towards homogeneity within given statts. But it must be remembered that prior to 1947 four states of this part ot rndia. namely Rajasthan, Madhya Bharat, P.E.P.S.U. and Saurashtra comprised congeries of petty states, each with its own system of government and welfare services and that little unification of services could be attained in the thrce-and-a-balf yeprs between the attainment of independence and the taking of the 1951 Censm. In addition to the real variations within Northwest India there is some variation which is only apparent, due to the numeraUg enclaves. and territorial inter-digitation~ which characterize the political map of trus
general area. There is, finally, a certain amount of departure from the relatively homogenous state patterns which would appear to be due to biases in enumeration. As such cases are not very important they need not be individually discussed.
In addition to the administrative and wel£are services, there is one other occupational category in which the government's role is normally very important, namely the general field of construction and maintenance, employment in which is indicated by map 17. The distribution revealed by this map is rather erratic. This is not difficult to explain. First, much of the employment in CJnstruction work in India is of a mass nature, being afforded by the large scale development projects, especially multi-purpose projects of the various FiveYear Plans. Thus, in the districts on either side of the Hyderabad-Madras borde,r work on the giant masonry dam across the Tungabhadra River and on the. irrigation works dependent thereon provided work for tens of thousands of laborers when tbe ]951 Census was being taken.H4 Were the Census to be taken anew today the same area would probably fiJt have a significantll,y high prop<.lrtion of construction workers? Second, in certain highly developed areas which one would expect to show up as having more than 2% employment in comtruction. it is fair 10
as~ume that much of such employment was enumerated under the Census category "services otherwise unclassified." This explanation would go far to explain the generally Jow percentages of Malabar District, Saurashtra, and Punjab. It would thus appear that since construction work is among the most temporary, least discrete, and hence most difficult to classify properly of any to be found in India, one can put but little faith in map 17 and can attach but little ~ignificance to the regional pattern therein.
s~. Twenty-thousand labor~rs w~re simultaneously employed on the masonry work of the da alone accordIng to H.C. Hart (New IndIa's RIvers p. 102). m
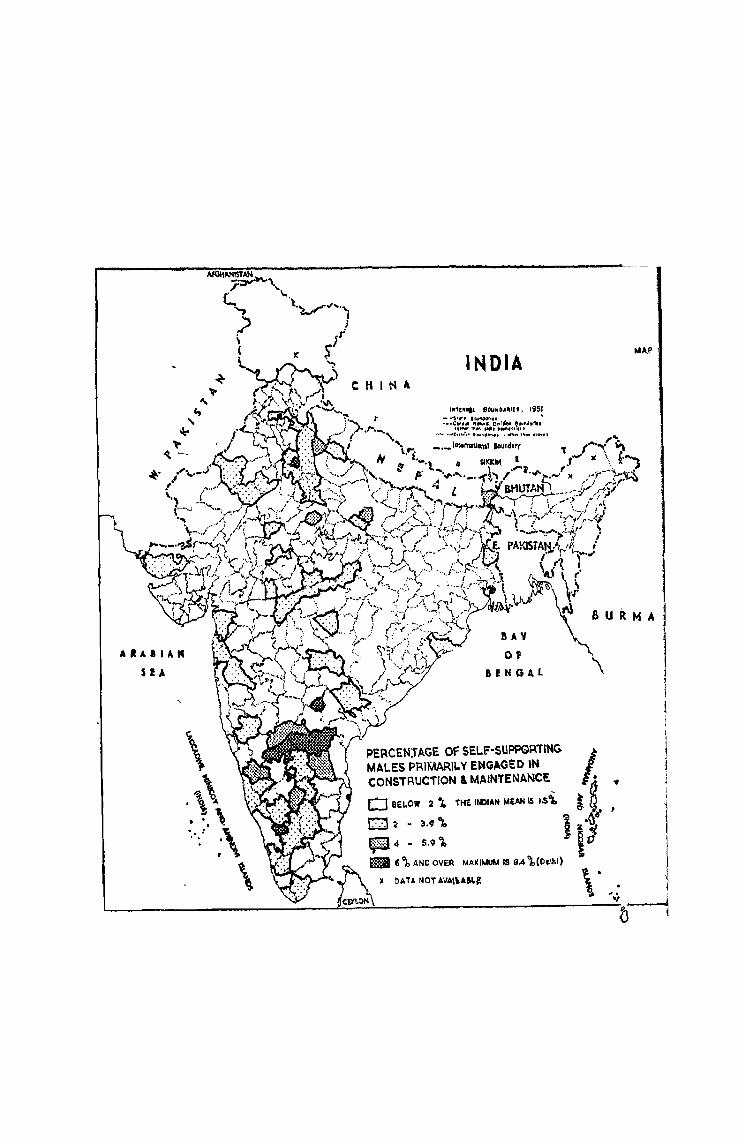
INDIA
,.'t..... eo."ou,n. '951 _· ... ,'tt. 10lIII00'1.' .. .... -~:~!: ::II'.~~I~~Of"c:,I'f4Ir1'~ •• '"" • ... Q'II'~ct .0..0"64 ...... ""' ..... "0" .~G'Wt'
6 U R M A
BAY 0, BfNGAl
PE~CEN:rAGE OF SEl.F-SUPPQRTING. MAL.ES PRIMARILY ENGAGED 1N I CONSTRUCTION & MAINTENANCE 1ft CJ BEI.OW 2 '4 1HE INDI~H MEAN IS lsi 1 g 11
1":"':"1 J.a" L:.:.::J~-M'\ t·\I r;D4 - 5.9\ 13 j _ fj OJ, AND OVER MA~lhAU'" IS S.4 \(Oclhl) I
\. 1 "y -___""1
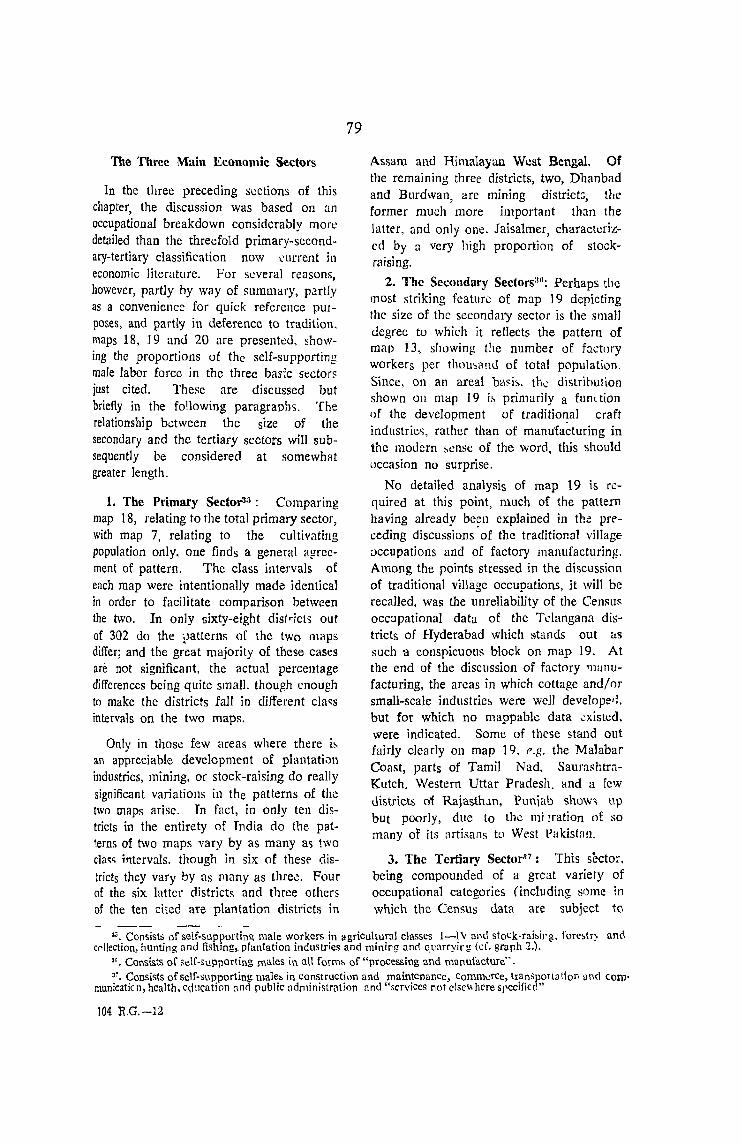
The Three Main Economic Sectors
In the three preceding sections of this chapter, the discussion was based on an occupational breakdown considerably more detailed than the threefold primary-secondary-tertiary classification now I:urrent in economic literature. For several reasons, however, partly by way of summary, partly as a convenience for quick reference PUlposes, and partly in deference to tradition, maps 18, 19 and 20 are presented, showing the proportions of the self-supporting male labor force in the three bas;c sector~ just cited. These are discussed but briefly in the following paragraphs. The relationship between the size of the secondary and the tertiary sectors will subsequently be considered at somewhat greater Jength.
1. The Primary Sector33: Comparing map 18, relating to the total primary sector, with map 7, relating to the cultivating popUlation only, one finds a general agreement of pattern. The class intervals of each map were intentionally made identical in order to facilitate comparison between the two. In only sixty-eight districts out of 302 do the patterns of the two maps differ; and the great majority of these cases are not significant, the actual percentage differences being quite smalL though enough to make the districts fall in different cIa~s intervals on the two maps.
Only in those few areas where there il. an appreciable development of plantativn industries, mining, or stock-raising do rcally
significant variations in the patterns of the two maps arise. In fact, in only ten districts in the entirety of India do the pat(erns of two maps vary by as many a" two cla~~ intervals. though in six of thest' dis
tricts they vary by "as l1lany as three. Four of the six lattcr districts and three others of the ten citcd are plantation districts in
79
Assam and Himalayan West Bengal. Of the remaining three districts, two, Dhanbad and Burdwan, are mining district3, the former much more important than the latter, and only one. Jaisalmer, characterized by a very high proportion of stockraising.
2. The Secondary Sectors3G: Perhaps the most striking feature of map 19 depicting the size of the secondary sector is the smal1 degree to which it reflects the pattern of map 13, showing t11C number of factory workers per thou~a nd of total population.
Since, on an areal basi". tll.: distribution shown on map 19 il. primarily a fum tion of the development of traditional craft industric<;, rather than of manufacturing in thc modern l.ense of the word, this should occasion no surprise.
No detailed analysis of map 19 is rcquired at this point, much of the pattern having already been explained in the pr('ceding discussions' of the traditional village occupations and of factory manufacturing. Among the points stressed in the discussion of traditional village occupations, it will be recalled, was the unreliability of the Census occupational data of the Telangana districts of Hyderabad which stands out as such a conspicuous block on map 19. At the end of the discussion of factory 'l1unufacturing, the areas in which cottage and/or small-scale industrie5 were welI develope/i. but for which no mappable data ,::xistt:d, were indicated. Some of these stand out fairly clearly 011 map 19, P.g. the Malabar Coast, parts of Tamil Nad, SaurashtrnKutch. Western Uttar Pradesh. and a few districts of Rajasth.m, Pun,ab show~ up but poorly, due to th~ mi !ration of so many of its artisans to West Pakistan.
3. The Tertiary SectorS?: This sector, being compounded of a great variety of occupational categories (including some in which the Census data are subject to
3,. Consists ofself-supportiM male workers in agricultural classes 1-1\1 [1I,d stock-rabirg, forestr) and cl'lIection, hunting and fishing,. plantation industries and mining and quarryirg (d. graph 2.).
"'. Consists of self-supporting males in an forml' of "processing and manufacture". 37. Consists ofsclf-supporting maie" in construction and maintcnanCe, Comm\!fCe, tran';poIlatlon ~nd com
municaticn, health. education and public administration anu"scrvices not elsc\\here specified"
104 RG. -12
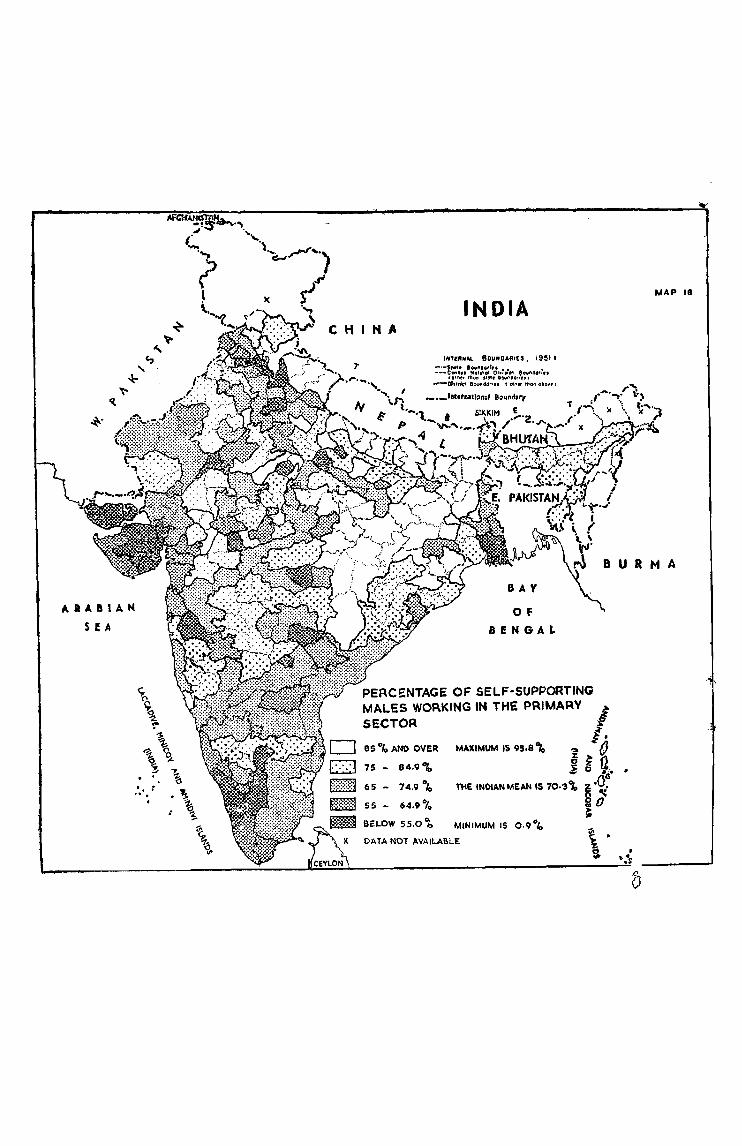
ARABIAN
SEA
. . '. : " . .
MAP 18
INDIA
8 U R M A
BAV
OF
BENGAL
PERCENTAGE OF SELF-SUPPORTING MALES WORKING IN THE PRIMARY ~ SECTOR I
/. 1~~ MAXIMUM IS 95.8 %
75 - 84.9 "t 65 - 74.9"4
j g •..•
THE INOI!l.N MEAN IS 70.'" ~ .O? o 'It ",0 55 - 64.9"/0
BELOW 55.0"b MINIMUM IS 0.9 "4 DATA NOT AVAIL.ABLE
~
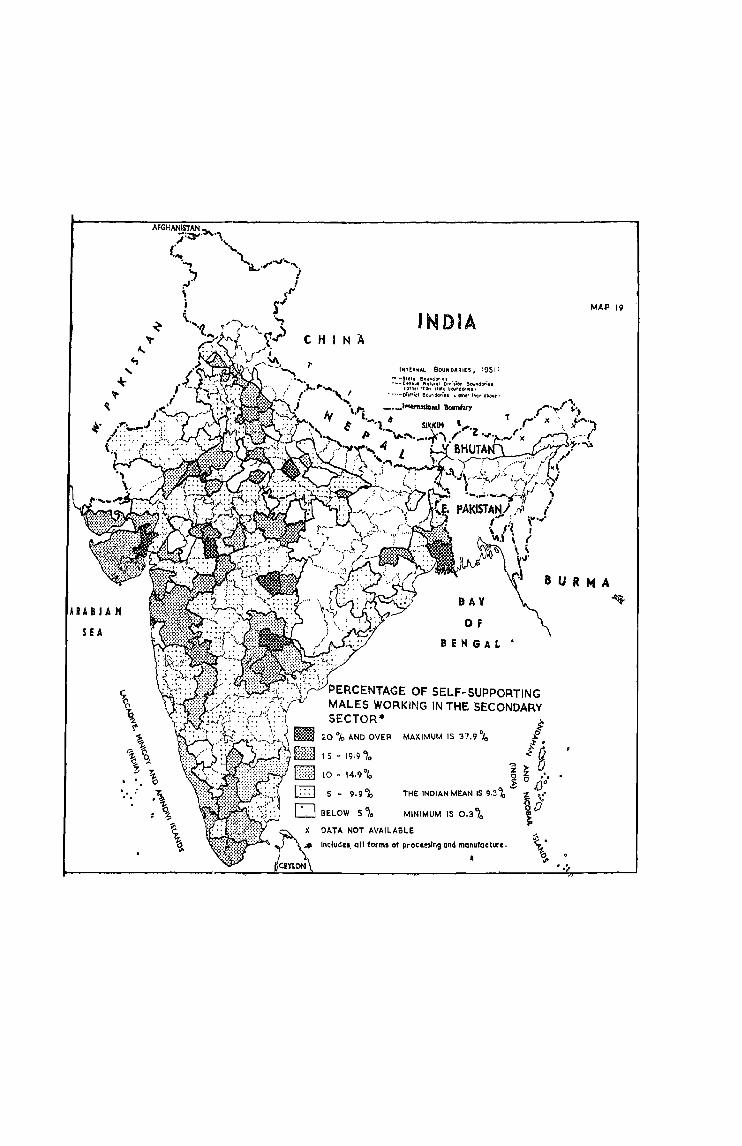
ARABIAN
seA
CHI N A INDIA
INH:r:lNAL BOUNDUIES, 19511
:-~:~~~.:~. e~:~~"f~~I'~tv;';(I" 8ounde.; .. (Or~r' tt,en ,talr bOo,j~darin)
• 'H.,., or''';ct BOII~ dori,. ~ ",II" th(l~ obO~t !
_._I"',oadoo.1 Bound1ry
MAP 19
BAV 8URMA
~
Of
BENGAL'
AGE OF SELF-SUPPORTING MALES WORKING IN THE SECONDARY SECTOR· ~
20 % AND OVER MAXIMUM IS 37.9 °/0 I ~ .
I 5 - 19.9 0/0 ~fl
'i > V 10 - 14.9°/0 oZ,
$. 0 .0° THE INDIIIN MElIN IS 9.3% - Z ...
1\ '.
MINIMUM IS 0.3 ~o to X DATA NOT IIVAILABLE
Includea, all forms of proccf:ling and manufacture.
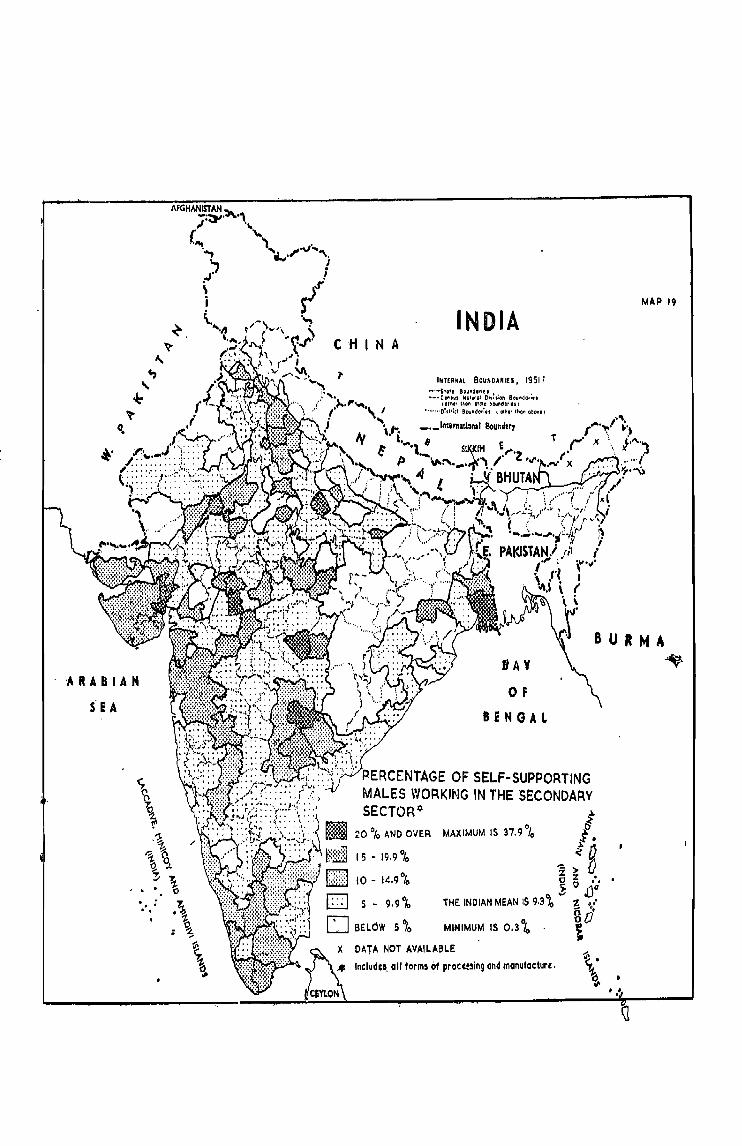
CHI N A INDIA
INTERNAL BOUNDAR IE' , 19511 _··Sto', BOII"ClOflft ..... etA.II' ~ot.tQI 01.:,1(," BOII~dO';tt
lotPlfrlt,on 11C1rbOilnclcr,UI •· .. ····Oi.":ct &Quftdor~u ~ ",lIff 'h(lrt ObO¥f)
_, _llI!4l'ftltbnai Ilounihl'}
MA·P 19
'BAY
OF
BENGAL
BURMA ...
RCENTAGE OF SELF~SUPPORTING MALES WORKING IN THE 'SECONDARY SECTOR* t
l: 20 % AND OVER MAXIMUM IS 37.90/0
I 5 - 19.9 °/0
10 - 14.9°/0
5 - 9.9%
l· ~O
~.,. D 6 z ... ,: 0 .00
THE INDIAN MEAN IS 9.3 % ..... t ."
30 ~ MINIMUM IS 0.3 ~o .
DATA NOT AVAILABLE
Includ~ •. all forms of proccesing ond manufacture.

considerable doubt) cannot be expected to yield a distributional pattern which reflects very closely that of any of its components which have already been examined in tms report. On thc whole, though, its distribution, as shown by map 20, fairly well resembles that of its largest subJjvj::.ion, commerce, as shown by map l4. .l:wen closer, however, is its resemblance to the pattern of map 18, on which the areas with the highest percentage of non-primary workers arc shown in the darkest to];.:!. ThIS
IS, of course, to be expcctcd, sin..:e th;:o tertiary sector forms over two-tilirds of tbe total non-primary. The only large area in which the patterns of maps 18 und 20 ditter markedly is Telangana, which has already becn characterized as a region lur which the data are unreliable.
4. Ratio of the Secondary to the Tertiary Sectur :-Graph 5, on the following page, depicts the employment of self-supporting males by economIC sector in India in 1951. Each dot thereon stands for a single one of the 302 districts of India for which the Census of 1951 provides complete occupational data. [t is immedhtely a.l?parent from the graph that a strong correlation exists between the size of the secondary and the size of the tertiary sectors; and that, since the relationship between the two is apparently linear, as one increases the other tends to increase at the same 1 ate. The author has visually plotted on graph 5, the regression line which seems to him best to fit the given distribution. The formula for this line, S=.42T, indicates that, regardless of the size of the primary sector, ior any given percentage in the tertiary sector, the secondary sector will be '42 times as large. This line, then, expresses what might be termed the "normal" relationship between the secondary and the tertiary sectors.
Also apparent from graph 5 is the fact that the great majority of districts of Indi::! fall within a rather narrow range with respect to the regression line. What is tcrmcJ the "normal" range has been arbitrarily
established as that in which the size of the secondary sector varies from three-fourths to fouHhirds that indicated by the formula given above (i.e. where S varies from '~15T to :56T). Districts with occupational distributions falling outside this range have partiCUlar secondary or tertiary orientations within their economy, at least where the Census statistics arc essentially correct. The boundary between a "moderate" and a "strong" secondary orientation was arbitrarily set along a line where the secondary sector was twice that considered normal (i.e., S:....:·S4T), while that between the "moderate" and "strong" tertiary orientatjon is set where t1Ie secondary sector was only half of normal (i.e.) S=·2IT).
On map 21, are plotted the districts falling within each of the five ranges indicated on graph 5 and discussed in the preceding paragraph. A fairly clear-cut zonatIOn emerges therefrom, part of it credible, part of it undoubtedly spurious.
The areas of strong or even moderate secondary orientation generally are not, as one might expect on an a priori basis, those characterized by a high degree of development of factory manufacture, although a number of such districts do appear in these twu classes (e.g., Ahmedabad, Kanpur. Bombay, J amshedpur and the three districts surrounding Calcutta, among others of lesser importance. But by contrast, the large territorial block extending through much of Eastern Madhya Prade~h and Telangana is not especially known, for manufacturing even of the smail-scale or cottage industrial variety. Since the Census data for this area and some of the adjacent districts with moderate secondary orientations have several times been questioned in this thesis, the reader should attach little or no ~ignificauce to this part of the total regional pattern. Elsewhere only two other districts exhibit a strong secondary orientation, Sholapur, in Bombay and Salem, in Madras. The fonner of these is a very important centre for the handloom cotton industry
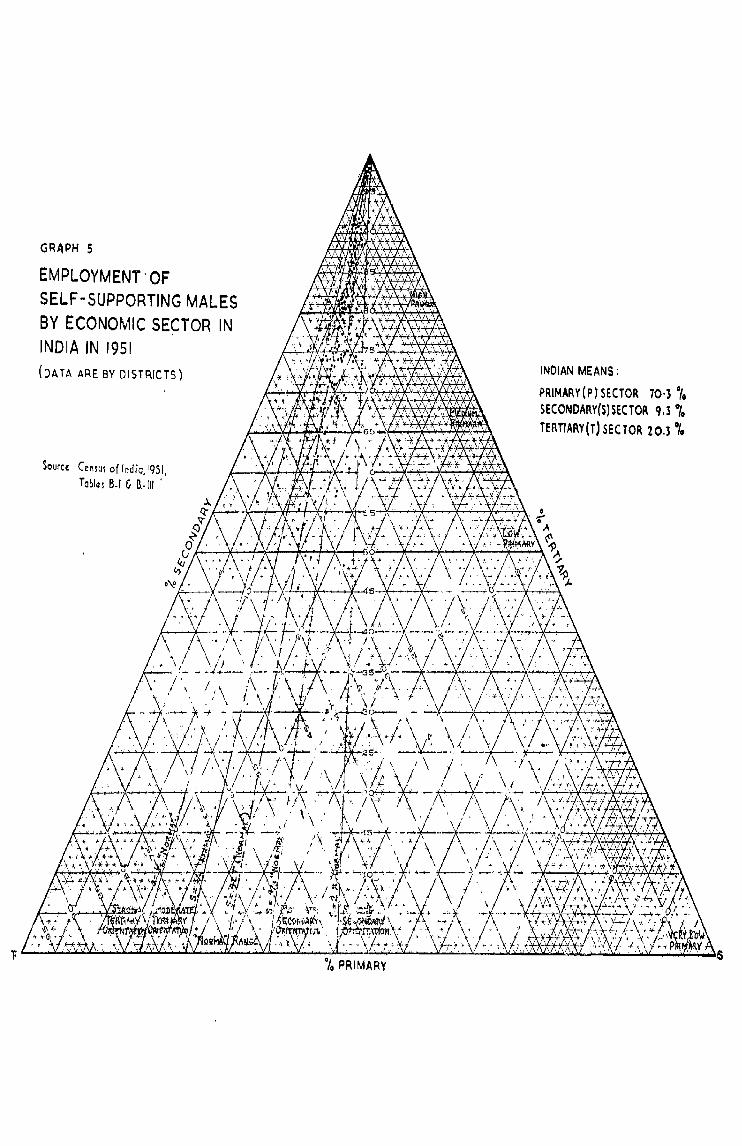
GRAPH 5
EMPLOYMENT' OF SELF ~ SUPPORTING MALES BY ECONOMIC SE~TOR IN INDIA IN 1951 (DATA ARE BY DISTRICTS)
Source Censul of Indio, 1951, Tablql B-1 & a-III'
INDIAN MEANS:
PRIMARY(P) SECTOR 70·3 °'0 SE(ONDARY(S)SECTOR q.3 % TERTIARY(Tl SECTOR 20.3 %
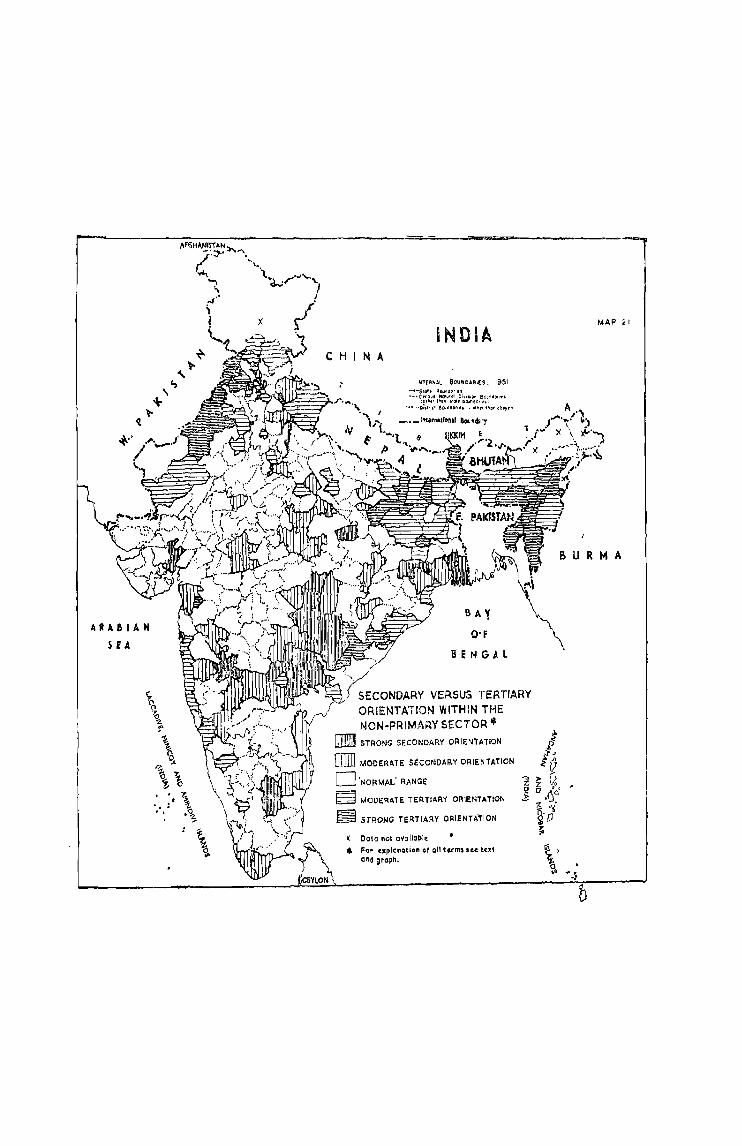
HASlAM
SEA
CHI N A
INOlA
1~l[~~AL SOUIIC"",:[S, 1951 --Slof, afJu"'~(''I'' ~-·rf1'1ht NC!· .... I~I o"~,s;~~ eC·'Jnd~r"l
(Ol~" I~on "IJIr DllUriUt. Ul
'''-''~SI!I'' B:>on-r:lor"1 ,Ollie' '1'I0~ o~~~t'
SECONDARY VERSUS TERTIARY
ORIENTATION WITHIN THE NON-PRIMARY SECTOR·
[i]Il STRONG SECONDARY ORIENTATION
[ill] MODERATE SECONDAj;l.Y ORIENTATION
o 'NORMAL' RANGE
~ MODERATE TERTIARY ORIENTATION
~ STRONG TERTIARY ORIENTATION
~ Dala nct a.allable * For tlCplenalion of all terms see text
an4 groph.
MAP II
BUR M A
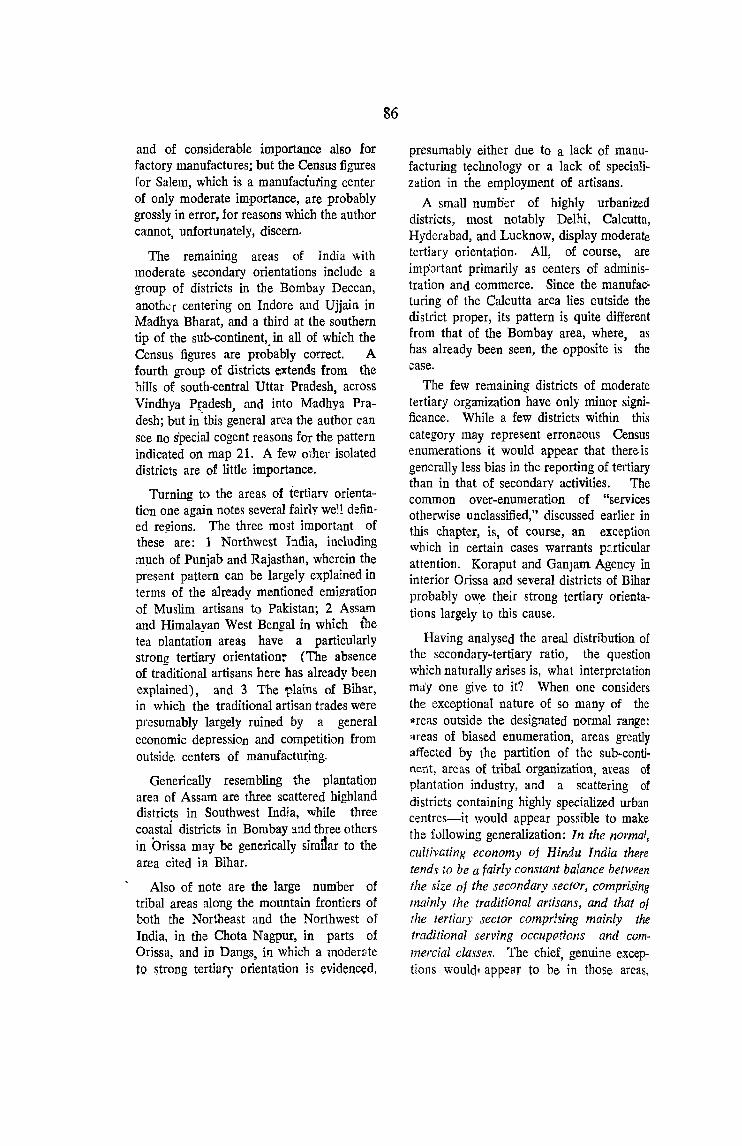
and of considerable importance also for factory manufactures; but the Census figures for Salem, which is a manufactuting center of only moderate importance, are probably gros'sly in error, for reasons which the author cannot, unfortunately, discern.
The remaining areas of India with moderate secondary orientations include a group of districts in the Bombay Deccan, anoth.::r centering on Indore and Ujjain in Madhya Bharat, and a third at the southern tip of the sub-continent" in all of which the Census figures are probably correct. A fourth group of districts extends from the hills of south-central Uttar Pradesh, across Vindhya Pr.adesh, and into Madhya Pradesh; but in this general area the author can see no s'pecial cogent reasons for the pattern indicated on map 21. A few other isolated districts are of little importance.
Turning to the areas of tertiary orientation one again notes several fairly well defined re!!ions. The three most important of these are: 1 Northwest India, induding m:uch of Punjab and Rajasthan, wherein the present pattern can be largely explained in terms of the already mentioned emi1rration of Muslim artisans to Pakistan; 2 Assam and Himalayan West Bengal in which the tea plantation areas have a particularly strong tertiary orientation~ (The absence of traditional artisans here has already been explained) , and 3 The 'Plains of Bihar, in which the traditional artisan trades were presumably largely ruined by a general economic depressiOn and competition from outside, centers of manufacturing.
Generically resembling the plantation area of Assam are three scattered highland districts in Southwest India, while three coastai districts in Bombay and three others in Orissa may be generically simrtar to the area cited in Bihar.
Also of note are the large number of tribal areas along the mountain frontiers of both the Northeast and the Northwest of India, in tne Chota Nagpur, in parts of Orissa, and in Dangs, in which a moderllte to strong tertill1'y orientation is evidenced.
86
presumably either due to a lack of manufacturing t~chnology or a lack of specialization in the employment of artisans.
A small number of highly urbanized districts, most notably Delhi, Calcutta, Hyderabad, and Lucknow, display moderate tertiary orientation. All, of course, are imp:Jrtant primarily as centers of administration and commerce. Since the manufac~ turing of the Calcutta area lies outside the district proper, its pattern is quite different from that of the Bombay area, where, as has already been seen, the opposite is the case.
The few remaining districts of moderate tertiary organization have only minor significance. While a few districts within this category may represent erroneous Census enumerations it would appear that there is generally less bias in the reporting of tertiary than in that of secondary activities. The common over-enumeration of "services otherwise unclassified," discussed earlier in this chapter, is, of course, an exception which in certain cases warrants particular attention. Koraput and GanJam Agency in interior Orissa and several districts of Bihar probably owe their strong tertiary orientations largely to this cause.
Having analysed the areal distribution of the secondary-tertiary ratio, the question which naturally arises is, what interpretation ma'y one give to it? When one considers the exceptional nature of so many of the "rcas outside the desig!1ated normal range: >lreas of biased enumeration, areas greatly affected by the partition of the sub-continent, areas of tribal organization, areas of plantfltion industry, and a scattering of districts containing highly specialized urban centres-it would appear possible to make the f0110wing generalization: In the normal, cultivating economy of Hindu India there tends to be a fairly constant balance between the size of the secondary sector, comprising mainly the traditional artisans, and that of the tertiary sector comprising mainly the traditional serving occupl1tiolls and commercial classes. The chief, genuine e.xceptions would. appear to be in those areas,
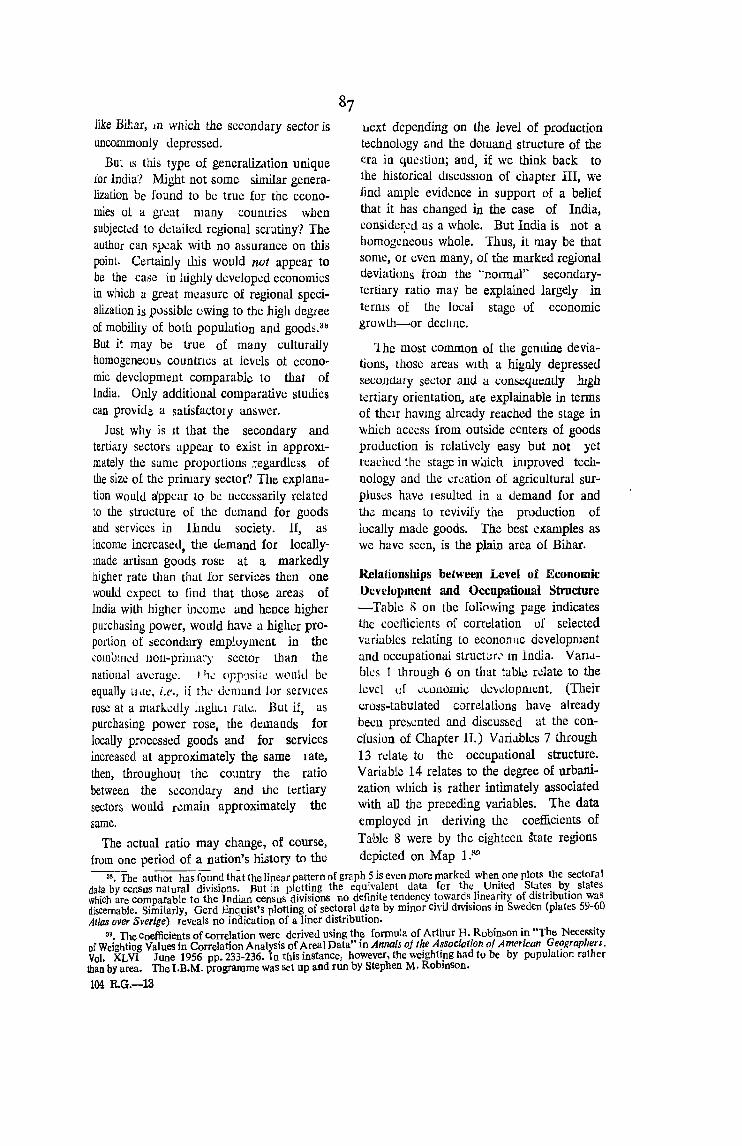
like Bihar, III which the secondary sector is uDcommonly depressed.
But IS this type of generaliZdtion unique ior India? Might not some similar generalization be found to be true for the economies at a great many countries when subjected to detailed regional scrutiny? The author can speak with no a~surance on this point. Certainly this would not appear to be the case in highly developed econoll1i()s in which a great measurc of regional specialization is possible uwing to the high degree of mobility of both population and goods. 3~ But it may be true of many culturally homogeneou~ countrIes at levels at economic development comparable to that of India. Only additional comparative studies can provide a satisfactory answer.
Just why is It that the secondary and tertiary sectors appear to exist in approXlmately the same proportions :.egardless of the size of the primary sector? Tile explanation would appear to be m.:cessarily related to the structure of the demand for goods and services in lImdu society. 1£, as income incrcased, the demand for locallymade artisan goods rose at a markedly higher rate than that for services then one would expect to find that those areas of India with higher income and hence higher purchasing power, would have a higher pro~ portion of secondary employment in the cOillo:ned non-prima;')' sector than the national average. (11\.' oppclsill;! w('ultl be equally lluC, i.e., if thl" demand lor serVlces rose at a markedly 111g!l"l rak,. But if, as purchasing power rose, the demands for locally processed goods and for services increased at approximately the same rate, then, throughout thc country the ratio between the &ccondary and the tertiary sectors would remain approximately the same.
The actual ratio may change, of course, from one period of a nation's history to the
l..tcxt depending on the level of production technology and the domand structure of the era in question; and, if we think back to the historical dISCUSSIOn of chapter III, we jind ample evidence in support of a belief that it has changed in the case of India, eonside~ed as a whole. But India is not a homogeneous whole. Thus, it may be that some, or even many, of the marked regional deviations from the ··norm.:!l" secondarytertiary ratio may be explained largely in terms of the local stage of economic growth-or decJlIle.
1 he most common of the genuine deviations, those areas WIth a higoly depressed sl::condary sector and a consequently lugh tertiary orientation, are explainable in terns of their havmg already reached the stage in which access from outside centers of goods prouuction is relatively easy but not yet reached the stage in which improved technology and the creation of agricultural surplus\:s haVe Iesulted in a demand for and the means to revivify the production of locally made goods. The best elCamples as we have seen, is the plain area of Bihar.
Relaliooshlps between Level of Economic Development and Occupational Structure -Table 8 on the fol1(1wing page indicates the coefficients of corrdation of selected variables relating to economic development and occupational struct;;r.' In India. Vanc:lbles 1 through 6 on that table relate to the level of "':l.Ollomk dew[opment. (Their l:ross-tabulated corrdations have already 'been pre&ented and discus~ed at the concrusion of Chapter n.) Vari.lbles 7 through 13 rdate to the occupational structure. Variable 14 relates to the degree of urbanization which is rather intimately associated with all the preceding variables. The data employed in deriving the coefficients of Table 8 were by the eighteen state regions depicted on Map l.:ln
~he author has found th;t the linear pattern of graph 5 is even more marked when one plots the sectoral data by cenSUS natural divisions. Rut in plotting the equivalent data for the United States by states which are comparable to the Indian census divisions no definite tendency towards linearity of distribution was discernable. Similarly, Gerd Enquist's plotting of sectoral data by minor civil dlvisions in Sweden (plates 59-60 AI/as over Sverige) reveals nO indication of a liner distribution.
39. The coefficients of correlation were derived using the formula of Arthur JI. Robin!.on in "The Necessity of Weighting Values in Correlation AnalySis of Areal Data" in Annals oj the Association of American Geographers. Vol. XLVI June 1956 pp.233-236. Tn this instance, however, the weighting had to be by population rather than by urea. The I.B.M. programme waS set up and run by Stephen M. Robinson.
104 E.G.-IS
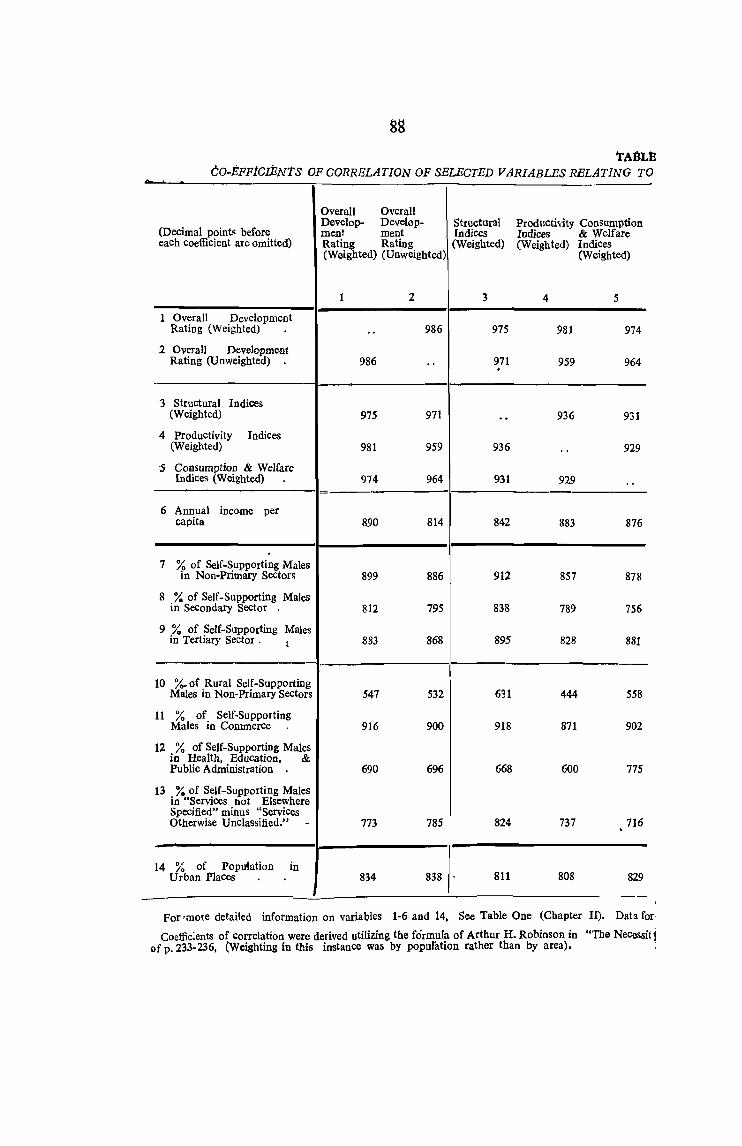
88
'rA:9Lt! to-EFFICIENtS OF CORRELATION OF SELECTED VARIABLES RELATING TO
Overall Overall Develop- Develop- Structural Productivity Consumption
(Decimal points before ment ment rndices Indices & Welfare each coefficient are omitted) Rating Rating (Weighted) (Weighted) Indices
(Weighted) (Unweighted) (Weighted)
1 2 3 4 5
1 Overall Development Rating (Weighted) .. 986 975 98J 974
2 Overall Development Rating (Unweighted) 986 .. 971 959 964 .
f-.
3 Structural Indices (Weighted) 975 971 .. 936 931
4 Productivity Indices (Weighted) 981 959 936 .. 929
5 Consumption & Welfare Indices (Weighted) 974 964 931 929 ..
6 Annual income per capita 890 814 842 883 876
. 7 % of Self-Supporting Males
in Non-Primary Sectors 899 886 912 857 878
Il % of Self-Supporting Males in Secondary Sector . 812 795 838 789 756
9 % of Self-Supporting Males in Tertiary Sector . t 883 868 895 828 881
10 ro-of Rural Self-Supporting Males in Non-Primary Sectors 547 532 631 444 558
11 % of Self-Supporting Males in Commerce 916 900 918 871 902
12 % of Self-Supporting Males in Health, Education, & Public Administration 690 696 668 600 775
13 % of Self-Supporting Males in "Services not Elsewhere Specified" minus "Services Otherwise UnClassified." - 773 785 824 737 716 ,
14 I'~ of Popufation in Urban Places 834 838 811 808 829
FOf'more detailed information on variables 1-6 and 14, See Table One (Chapter II). Data for·
Coefficients of correlation were derived utilizing the formula of Arthur H. Robinson in "The Necessit j of p. 233-236, (Weighting in this instance was by population rather than by area).
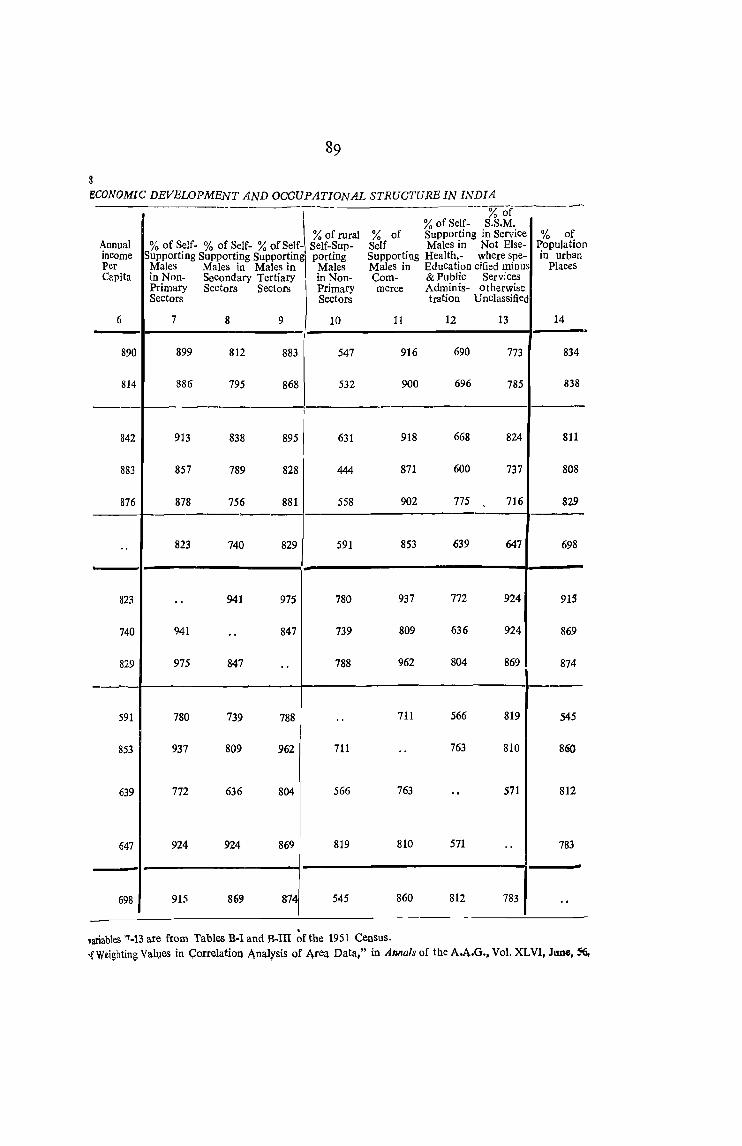
ECONOMIC DEVELOPMENT AND OCCUPATIONAL STRUCTURE IN INDIA .~-o----
% of % of Self- S.S.M.
% of rural % of Supporting in Service % of Annual % of Self- % of Self- % of Self- Self-Sup- Self Males in Not Else- Population income Supporting Supporting supportingl porting Supporting Health.- where spe- in urban Per Males Males in Males in Males Males in Education cified minu Places Capita in Non- Secondary Tertiary I in Non- Com- & Public Services
Primary Sectors Sectors Primary merce Admin is- otherwise Sectors Sectors tration Unclassified
6 7 8 9 10 11 12 13 14 ,
890 899 812 883 547 916 690 773 834
814 886 795 868 532 900 696 785 838
----t---~ I
842 913 838 895/ 631 918 668 824 811
883 857 789 828 444 871 600 737 808
876 878 756 881 558 902 775 716 829
.. 823 740 829 591 853 639 647 698
823 .. 941 975 780 937 772 924 915
740 941 .. 847 739 809 636 924 869
829 975 847 .. 788 962 804 869 874
-591 780 739 788 .. 711 566 819 545
853 937 809 962 711 .. 763 810 860
639 772 636 804 566 763 .. 571 812
647 924 924 869 819 810 571 .. 783
698 915 86Cj) 874 545 860 812 783 .. ---- -
variables ·'7-13 are from Tables B-1 and B-Ill ~fthe 1951 Census. If Weighting Values in Correlation Analysis of Area Data," in AMals of tbe A.A.G., Vol. XLVI, June, 5<i.
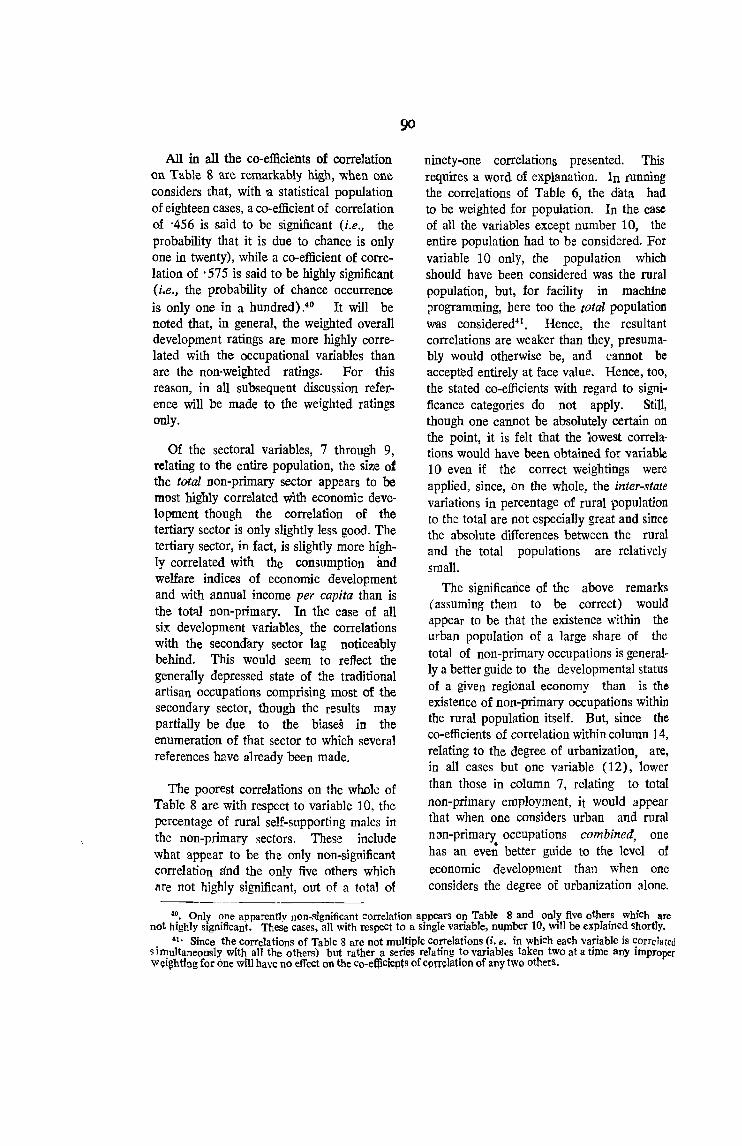
All in all the co-efficie'nts of correlation on Table 8 are remarkably high, when one considelfs that, with a statistical population of eighteen cases, a co-efficient of correlation of '456 is said to be significant (i.e., the probability that it is due to chance is only one in twenty), while a co-efficient of correlation of . 575 is said to be highly significant (i.e., the probability of chance occurrence is only one in a hundred) .40 It will be noted that, in general, the weighted overall development ratings are more highly correlated with the occupational variables than are the non-weighted ratings. For this reason, in all subsequent discussion reference will be made to the weighted ratings only.
Of the sectoral variables, 7 through 9, relating to the entire population, the size of the total non-primary sector appears to be most highly correlated with economic development though the correlation of the tertiary sector is only slightly less good. The tertiary sector, in fact, is slightly more highly correlated with the consumption and welfare indices of economic development and with annual income per capita than is the tot::}l non-primary. In the case of all six development variables, the correlations with the secondary sector lag noticeably behind. This would seem to reflect the generally depressed state of the traditional artisan occupations composing most of the seeondary sector, though the results may partially be due to the biases in the enumeration of that sector to which several references have already been made.
The poorest correlations on the who1c of Table 8 are with respect to variable 10, the percentage of rural self-supporting males in the non-primary sectors. These include what appear to be the only non-significant correlation gnd the only five others which are not highly significant, out of a total of
ninety-one correlations presented. This requires a word of explanation. In running the correlations of Table 6, the data had to be weighted for population. In the case of all the variables except number 10, the entire population had to be considered. For variable 10 only, the population which should have been considered was the rural population, but, for facility in machine ?rogramming, here too the total population was considered41 • Hence, the resultant correlations are weaker than they, presumably would otherwise be, and cannot be accepted entirely at face value. Hence, too, the stated co-efficients with regard to significance categories do not apply. Still, though one cannot be absolutely certain on the point, it is felt that the lowest correlations would have been obtained for variable 10 even if the correct weightings were applied, since, on the whole, the inter-state variations in percentage of rural population to the total are not especially great and since the absolute differences between the rural and the total populations are reLatively small.
The significarice of the above remarks (assuming them to be correct) would appear to be that the existence within the urban population of a large share of the total of non-primary occupations is generally a better guide to the developmental status of a given regional economy than is the existence of non-primary occupations within the rural population itself. But, since the co-efficients of correlation within column 14, relating to the degree of urbani.zation, are, in all cases but one variable (12), lower than those in column 7, relating to total non-primary employment, it would appear that when one considers urban and rural non-primary occupations combined, one has an eve~ better guide to the level of economic development than when one considers the degree of urbanization alone.
40. Only one apparently non-significant correlation appears on Table 8 and only five others whiCh are not highly significant. These cases, all with respect to a single variable, nUJIlber 10, will be explained shortly.
&1. Since the correlations of Table 8 are not multiple correlations (i. e. in which each variable is correlated simultaneously with all the others) but rather a series relating to variables taken two at a time any improper Wei~httng for one will have no dfect on the co-efficiepts of C9ITelation of any t\Vo others.
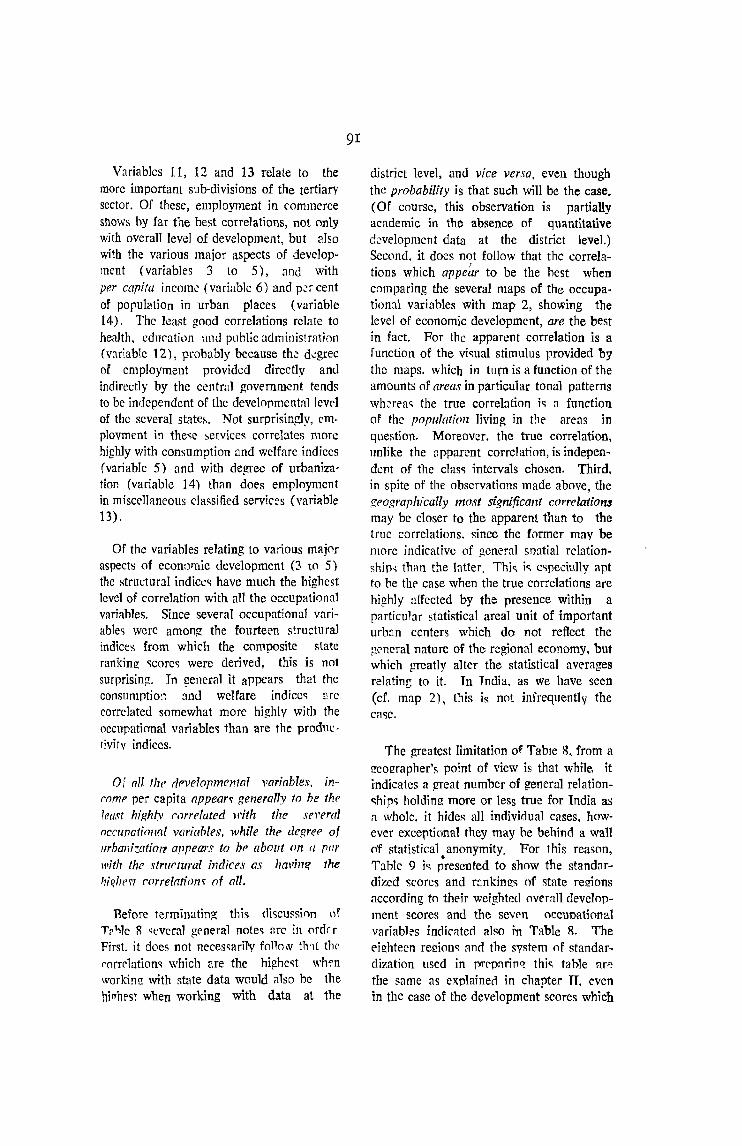
Variables 11, 12 and 13 relate to the more important sub-divisions of the tertiary sector. Of these, employment in commerce shows by far the best correlations, not only with overall level of development, but also with the various major aspects of development (variables 3 to 5), and with per carita income (variable 6) and p~rcent of population in urban places (variable 14). The least good correlations relate to health, cduratil)i1 ·<tHd puhlic udministr8tion (variable 12), probably because the d~grec oE employment provided directly amI indirectly by the central government tends to be independent of the develonmental levf'] of the several statc&_ Not surprisingly, employment in the",c :-erviceR correlates morc highly with consumption and welfare indices (variable 5) and with degree of urbanization (variable 14) than does employment in miscelJaneous classified services (variable 13).
Of the variables relating to various major aspects of econoJT1ic development (3 to 5) the structural indice'l have much the highest level of correlation with all the occupational variables. Since several occupational variable~ were among the fourteen structural indices from which the composite state ranking ~cores were derived, this is not surprising. In general it appears that the consumption and welfare indicc<\ nre correlated somewhat more highly with the occupational variable~ than are the productivitv indices.
Of (Ill the rff'Velopmental variables. inromf' per capita nppear~ generally to he thf' least highly rorrelated with the se1'errrl occunatimlal variables, whife the degree of urhalli7.atiOJ'~ appears to be about on a [lor with the struftural indices as hal'in!? the hi~!w~t carrelatiollV nf all.
Refore terminating this di'lCllSsi()n of Ta ""le 8 ~everal gf'neral note" nrc in Nd. r First. it does not neces<\aril'V follow tl111 th" C'orrr1ution<; which are the highe<;t wh~n
workin!! with state data would also be the \1i(Jhrst when working with data at the
91
district level, and vice versa. eV~ll though the probability is that such will be the case. (Of course, this observation is partially academic in the absence of quantitative development data at the district level.) Second, it docs not follow that the correlations which appe:lr to be the hest when comparing the several maps of the occupational variables with map 2, showing the level of economic development, are the best in fact. For the apparent correlation is a function of the vi<;ual stimulus provided by the maps. whiCh in tllrn is a fUllction of the amounts of areas in particular tonal patterns wkrea<; the true correlation i<; a function of the porulatio/l Hving in the areas in question. Moreover. the true correlation, unlike the npparent correlation, is independent of the clasc; intervals chosen. Third, in spite of the observations made above, the geographically most significant correlatio1l3 may be closer to the apparent than to the true correlations, since the former may be more indicative of gcnernl slxltial relation~hip~ than the latter. Thi" j<; cspeci'al1y apt to be the case when the true correlations are highly affected by the presence within a rarticular statistical areal unit of "important urban centers which do not reflect the gC'neral nature of the regional economy, but which greatly alter the statistical averages relating to it. In India, as we have seen (cf. map 2), this is not infrequently the cac;c.
The greatest limitation of Table 8, from a geographer's point of view is that while it indicates a great number of general relation"hips holding more or less true for India as n whole, it hides a1l individual cases, :however exceptional they may he behind a wall of statistical anonymity. For this reason,
• Table 9 it; presented to snow the stand:u-dized scores and rankings of state regions according to their weighted overall devc]opment scores and the sewn occuDational variables indiC'iltcd also in Table 8. The eighteen region.:; ~nd the svstem (1f standardization used in 11'Trpnrino: thi<: table ar'! the same as explained in chapter IT, even in the case of the development scores whicn
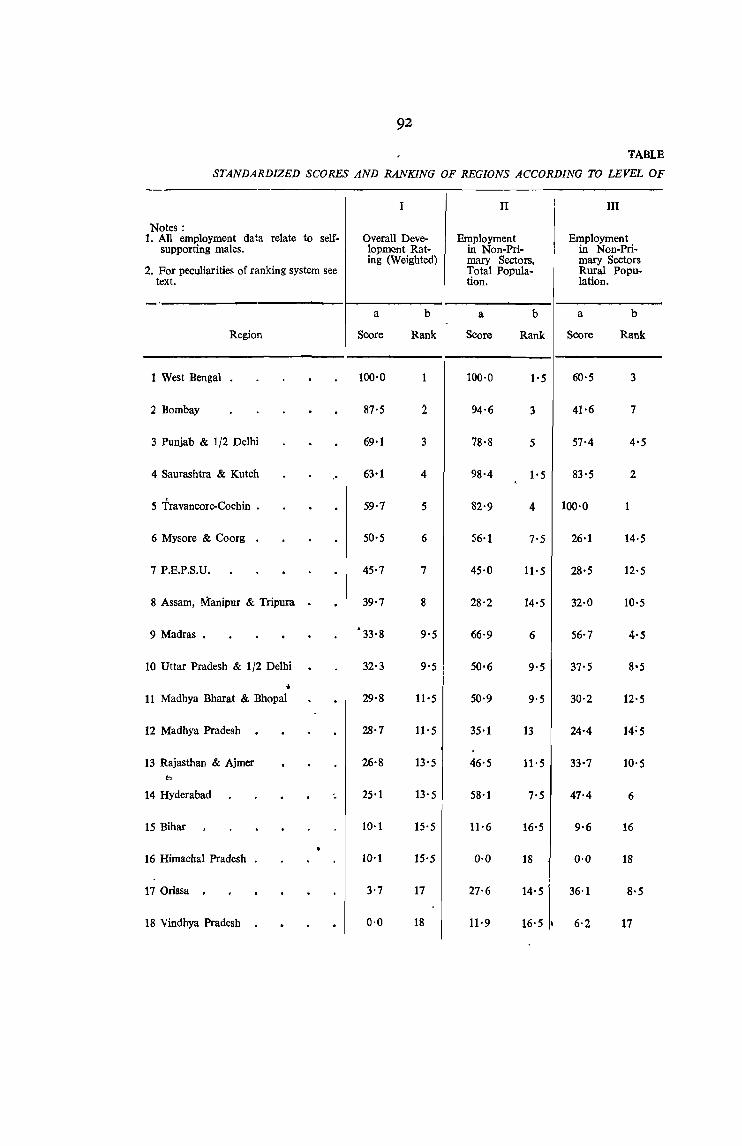
92
TABLE
STANDARDIZED SCORES AND RANKING OF REGIONS ACCORDING TO LEVEL OF
-I II I III
Notes: 1. All employment data relate to self- Overall Deve- Employment Employment
supporting males. lopment Rat- in Non-Pri- in Non-Pri-ing (Weighted) mary Sectors, mary Sectors
2. For peculiarities of ranking system see Total Popula- Rural Popu-text. tion. lation. _.
a b a b a b
Region Score Rank Score Rank Score Rank
1 West Bengal · 100·0 1 100·0 1'5 60·5 3
2 Bombay · 87'5 2 94·6 3 41·6 7
3 Punjab & 1/2 Delhi · · 69·1 3 78'8 5 57·4 4'5
4 Saurashtra & Kutch · 63'1 4 98'4 1'5 83'5 2 . 5 Travancore-Cochin . · · 59·7 5 82·9 4 100·0 1
6 Mysore & Coorg · · 50'5 6 56'1 7'5 26·1 14·5
7 P.E.P.S.U. . · · 45'7 7 45'0 11'5 28·5 12'5
8 Assam, Manipur & Tripura · · 39·7 8 28'2 14'5 32·0 10'5
9 Madras. · · • 33'8 9'5 66'9 6 56'7 4'5
10 Uttar Pradesh & 1/2 Delhi · 32·3 9'5 ! 50'6 9'5 37·5 8'5 i
i I
11 Madhya Bharat & Bhopal · 29'8 11'5 50'9 9'5 30'2 12'5
12 Madhya Pradesh · · · · 28'7 11'5 35'1 13 24·4 14;5
13 Rajasthan & Ajmer · 26'8 13'5 46'5 11'5 33·7 10'5 l».
14 Hyderabad · -. 25·1 13'5 58'1 7'5 47·4 6
15 Bihar · 10·1 15'5 11'6 16'5 9·6 16
• 16 Himachal Pradesh 10·1 15'5 0·0 18 0·0 18
17 Orissa . · · · 3'7 17 27·6 14'5 36·1 8·5
18 Vindhya Pradesh · · 0'0 18 11'9 16'5 I 6'2 17
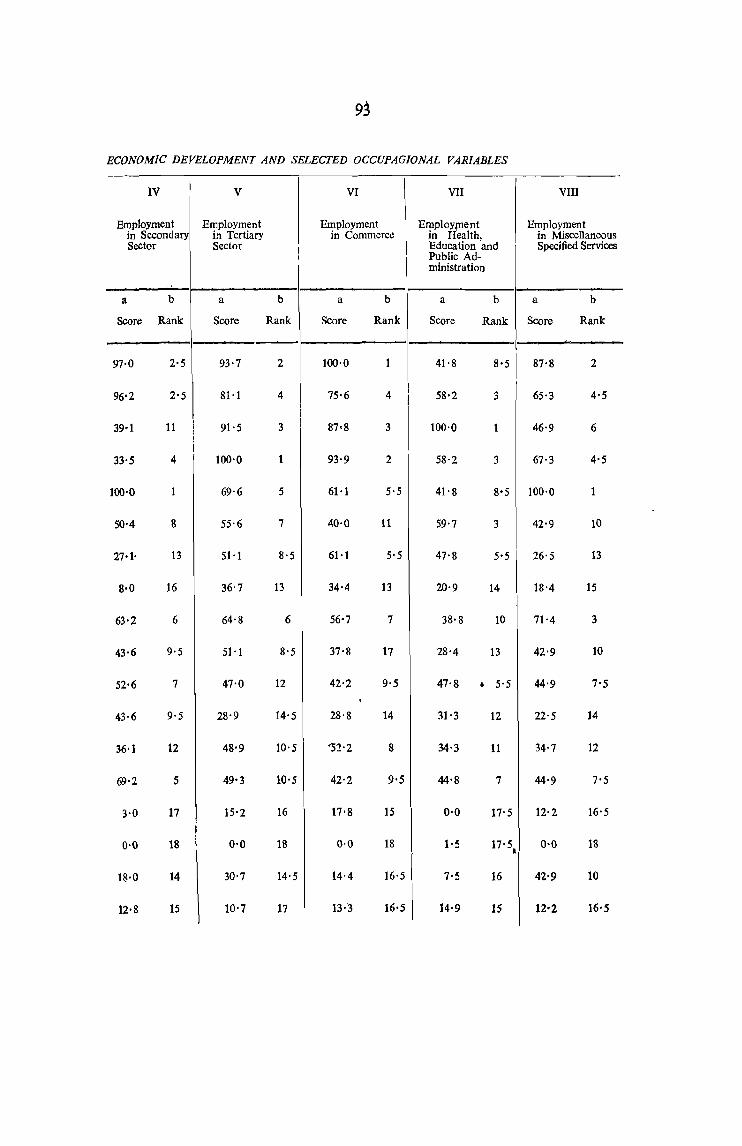
93
ECONOMIC DEVELOPMENT AND SELECTED OCCUPAGIONAL VARIABLES -
IV i V VI VII VIII
Employment Employment Employment Emp!oYplent Employment in Secondary in Tertiary in Commerce in Health, in Miscellaneous Sector Sector I Education and Specified Services
I Public Ad-ministration
a b a b a b a b a b
Score Rank Score Rank Score Rank Score Rank Score Rank
97·0 2'5 93'7 2 100·0 1 41·8 8'5 87'8 2
96'2 2'5 81'1 4 75·6 4 ! 58'2 3 65'3 4'5
i 39-1 11 91'5 3 87'8 3 100'0 1 46'9 6
33'5 4 100'0 1 93'9 2 58'2 3 67'3 4'5
100'0 1 69'6 5 61·1 5'5 41'8 8-5 100'0 1
50'4 8 55'6 7 40'0 11 59'7 3 42'9 10
27·1' 13 51'1 8'5 61'1 5·5 47'8 5'5 26'5 13
8·0 16 36'7 13 34'4 13 20'9 14 18'4 15
63'2 6 64'8 6 56-7 7 38'8 10 71'4 3
43·6 9'5 51'1 8'5 37'8 17 28'4 13 42'9 10
52·6 7 47'0 12 42'2 9·5 47'8 • 5'5 44'9 7'5 ,
43·6 9·5 28'9 14'5 28'8 14 31'3 12 22'5 14
36·1 12 48'9 10'5 '52'2 8 34'3 11 34'7 12
69'2 5 49'3 10'5 42'2 9'5 44'8 7 44'9 7'5
3·0 17 15'2 16 17'8 15 0'0 17'5 12'2 16'5
! 0·0 18 I 0'0 18 0'0 18 1-5 17'5 0-0 18 •
18·0 14 30'7 14'5 14'4 16·5 7'5 16 42'9 10
12·8 15 10'7 17 13;3 16'5 14'9 15 12'2 16'5
wen~ themselves derived, in the first instance, from a series of standardized development indices. The chief purpose of Table 9 is to provide a means of showing deviations of the various occupational scores of individual states from the "expectations" .one would have if there were a perfect correlation between the occupational variables in question and level of economic -tievelopment.
Before proceeding to the analysis of Table 9, however, an explanation of the ranking system employed is in order. First, the chief reason for using ranks is because of the simplicity of working with them, i.e., the facility of making inter"/ariable comparisons. But the effect of working with ranks is that of making scores equally spaced along a continuum from the highest to the lowest, when, in fact, as a glance at the scores themselves will indicate, this is harclly the case. Occasionally, there is a considerable bunching of scores within a rather narrow range, and in such cases the extremes of this range would appear from a strict system of rankings to be much further apart than they really are. Accordingly, a compromise ranking system was adopted, which, in view of the not very high reliability of the scores to begin with, seemed in order. Whenever two or more standardized scor~s differed within a total range a! two or less, they.were considered as tied (e.g., 86:4 would be consider~d as equal to any other single .figure from 84'4 to 88'4 and accorded the same rank).42 Two or more scores which were considered ties would
94
each be entered in Table 9 with the rank representing the average of the ranks they would have had were they not so considered. (e.g., under variable II, West Bengal, with a score of 100, and Saurashtra & Kutch, with a score of 98'4, were each ranked as 1'5, the average of 1'0 and 2'0).
If one were to add, region by region, on 'Iable 9 all the deviations in rank for variables II through VIII from the ranks ·indicated for the overall development scores (variable I), he would find an average deviation of 2' 8.43 Yet in only forty-five cases out of 126 do individual .deviations exceed this amount (i.e., equal three or more) a fact which indicates that the deviations in excess of the average tend to be quite large. Perhaps even }TIore striking is the fact that two regions alone, Assam, Manipur and Tripura ··(region . 8) and' Hyderabad (J;egion 14), account for thirteen of the above average cases, leaving only thirty-two ca&es among the remaining sixteen regions.44 These thirty-two' cases were distributed as follows: four each for Travancore-Cochin, Mysore & Coorg, P.E.P.S.U., and Masras; three each for Madhya Bharat and Bhopal, Rajasthan and Ajmer, and Orissa; two for Punjab and t Delhi; and one each for West Bengal, Bombay, Saurashtra and Kutch, Uttar Pradesh and t Delhi, Madhya Pradesh, ~nd
Vindhya Pradesh. Bihar and Himachal Pradesh had 1110t a single above-a~erage deviation.
42 But :vhen three or more figures each differing ~rom one ~nother in the group by two or less exhibited a total range In excess of two they would not all be consIdered as tied but would be split on an (/d hoc basis into ~eparately ranked gr~ups, pairs, or single cases, suCh that the average scores, of each would differ by more than two. For example, lU the group 84'4, 85'2, 86-6 and 88'4, the first two figures would be COnsidered as tied at the average score of 84'8 and the last two at 87'5,.
43 To illustrate a single deviatfon ; West Bengal ranks third (3) in'~ariable III, but first, (1) in overall development rating ; its deviation from expectation then with respect to variable III is 2 (3 minus 1). The total deviation for the state would be the.sum of its deviations for variables II-VIII.
44 These same two regions accoun~ for eleven of the twenty-five de~iations e.qual to or exceeding fiVe.
If we examine the patterns of deviation from "expectation" within individual regions, we find that Hyderahad is the most deviant, of all eighteen regions. It shows a tetal rank deviation of 41,0, as ,)pposed to only 7·0 in the case of the least deviant region, Bihar. In not a single variable does it ha"e a below average deviation, and an its deviations are positive with respect to its development score. Its greatest rank .deviation is with respect to the secondary sector, and its second greatest, not unexpectedly, with respect to rural nonprimary employment of which the secondary .sector formed so large a part. These devia· tion~ can be explained largely by the .already discussed caste-induced biases felt tQ be. ;nherent in the Hydetabad statistics.
Assam, which has above average deviations for every occupational variable except one, and scores below the development rank in al1 seven, has a total deviation only slightly below that of Hyderabad. Its greatest deviation, that In respect to secondary employment, has been touch'!d on previously, particularly in reference to the analysis of the relationshjp of the secondary to the tertiary seeter in the preceding motion of this chapter. Only in regard to rural non-primary employment does it have a slightly less than average rank deviatlon. The reason for its reIativeIv ~ood showing in this respect is that, in view of its unusually low degree of urbanization (a characteristic, no doubt, of its frontier status), such non-primary employment as is necessarv must be generated from within the rural popnlation.
After the two regions jUM discussed, five others. with three or four above-average deViations each. showed moderately high total deviations, i.e., from 17' 0 t.1 26'5 These are cons1dered in t~ejr order of economic deve1oDm~nt· f\t~rtin g 'with the" hi~hest.
95
Travancore-Cochill, the state ranking fifth in overall aevelopment. stands out as the first ranking in three of the seven occupational variables of Table 9: rural non-primary employment (in which it leaves it:~"runner-up far behind), employ. ment in the secondary sector, and emplo)lment in the minor category of miscellaneous specified services. The first two scores are easily understOOd in tenus of the low level of urbanization and high degree of develop~ ment of rural cottage industries typifying this area.
Mysore and Ccorg which are n~xt in development"allevel are, unlike TravancoreCochin, characterized by an occupational structure somewhat less non-primary tban Qne might expect. Its negative deviatioll from expectation is most striking among the rural population, but also of note with respect to commerce in the population as a whole. No very convincing explanations of these facts occur to the author, who bas done no field work in this state.
P.E.P.S.U. also has Jess non-primary employment than its developmental level might seem to warrant. The deficiencies most noticeable are with respect to the ~econdary sector, miscellaneous specified services and rural non~primary employ~ ment, an of which can be explained largely in terlUB of the emigration of specializ.ed Muslim castes to West Pakistan.
Madras, though several notches down ;n the deveJopment scale from Travancore~ Cochin, is remarkably like that state in the pattern of its rank deviations on Table 7, scoring generally above expectation, especial1y in re~aTd to miscellaneous c:;ervices and !'nra' non-primary ~mptovment. Perhap~ there is some sugi!estion ef a Southern repJonal occupational 'Pattern different from that of t'lie nat100 at 13 rpe in this' simnarity, though fhe data for Mvsore certainly e"'(cJ1Kle it from heln~ included within snch ::\ p(ltt{'m,
Orissa, the region ranking next to lowest in development, is included in the group of regions under discussion largely because of its unusually high score for rural employment in non-primary production and, to a somewhat lesser extent, for its good showing with respect to miscellaneous services, which are, of course, largely rural. The explanation for this pattern would appear to stem from the region's general isolation, which has allowed it to keep the traditional rural order intact. Moreover, in the absence of many towns, non-primary production must come largely from the rural population, as in Assam. Finally, strong biases in the reporting of ,tservices otherwise unclassified" have greatly swelled the rural naoprimary sector.
The eleven remaining regions conform, on the whole, quite well to the expectations based on the established correlation between level of economic development and the seven occupational variables of Table 9. the total regional rank' deviations within the group varying in the narrow range from 7'0 to 18'5. Starting again with the most developed region and working down to the least, the following paragraphs poiut out only the most significant deviations.
West Bengal, the most developed region of India scores remarkably low in employment, in health, education 'and public administration; but just why is not clear. Bombay, scores quite. low in rural nonprimary employment, probably because the high degree of commercialization, without attondant prosperity, as in Punjab or Saurashtra, has cau-sed a marked retrenchn tent of the traditional n.lral. occupations. In Punjab and ~. Delhi, the particularly poor showing in the secondary sectors probably stems from the post-partition exodus of Muslim artisans, Saurashtra is Iloteworthy
for its overall good showing, its first place rank in the tertiary sector and its tie for first place (under the ranking rules outlined above) in total non-primary employment.
Skipping six places, the tenth-ranking region ot Uttar Pradesh and t Delhi is an almost perfect "fit" to the expected pattern. Madhya Bharat and Bhopal is noteworthy only for its high showing in heallll, educat1On, and public admimStIcltion. Madhya Pradesh too is an almost perfect fit. Rajasthan and Ajmer merits attention be· cause its rank in every occupational variable exceeds its rank in regard to development. Its highest rank of all is in commerce, a situation which, it has been suggested, may be attributable largely to the need for occupational specialization in this field because of the relatively great distances between settlements and between producers and markets. Bihar, ranking fifteenth in a field of eighteen, is the best fit of au eighteen regions to the occupational pattern one would expect of it. Himachal Pradesh and Vindhya Pradesh, ranking sixteenth and last respectively, are also cases of very &1ight, overall deviation.
No detailed analysis of Table 9 need be made on a variable-by-variable basis, but two short comments are in order. rirst, the deviations in ranking, summated tor each occupational variable reflect strongly though not perfectly, their co-etbcienllli 01.
correlation with the overall development mting as presented on Table S. Seconal' with specific respect to rural employment in the non-primary sector, for which the; correlations of Table 8 were lowest and open to some doubt, the total deviations of Table 9 were higher than for any other' variable. Hence, the relative standing of the co-efficients of COrrelation for that variable tend to be confumed despite the somewhat improper weighting procedure involved in dr.riving them.
CHAPTER V
weAL ANALYSES OF OCCUPAHONAL STRUCTURES
Introduction
roo purposes of the liicld Work.-lherc are a great many things about the occupational structure of an area that the Census does not-indeed cannot-tell us. Even if Lhere were no biases in the enumeration. there are three basic reasons why the Census of 1951 can only afford a very rough approximation of a small part of reality: first, because it dealt with areal units set up on a primarily administrative basis which often had little meaning in economic terms; second, because it dealt with discretely defined occupational categories which corresponded very poorly to the real-life situation in India; and third, because it had necessarily to deal with just a few major aspects of the situation, l.e. primary and secondary sources of livelihood and dependency status.! In order to find out what the Census could not tell about the occupational structure of lndia the author spent eight months in extensive field investigations in the academic year 1958-59.
The sorts of questions to which the author sought answers in the field included the following: How is the region internally organized with regard to occupational distribution? Which occupations tend to be more or less evenly diffused over the countryside and which highly concentrated, either in urban centers or specialized villages? By what market mechanisms do goods and services reach the ultimate consumer, especially in cases when those persons who provide them are highly con-
centra ted ? Which occupations tend to be practised by specialists therein rather than a~ mere subsidiary undertakings? What, within the village, were the determinants of the demand for non-agricultural employment? What were the socio-economi(.; determining factors behind individual-or household-decisions with regard to occupational choice? In particular, to what degree does choice conform to the ethos o( the caste·based jajmani system and the traditional village order? What job alter~ natives are normally present when a break with the old order is, or is not, made? What work do p'eople engage in outside the village, while continuing to maintain a household within the village and where do they find outside work? What are the chief agencies of occupational change and just how is ~angc brought about?
Wherever possible answers to the~e ques· tions were sought in quantitative terms, uot with any presumption that the re:-,ponses would be highly accurate, but with the idea that they would reflect the general order of magnitude of the variables much more closely than if reliance were placed on non-quantitative responl:.es. The representativeness and accuracy of the intormation gathered in the field is discussed in the following paragraphs.
Method of .Field Investjgation and Reliability and value of the Information Gathered.-The twelve field areas in whicb work was carried out (Map 22) are not sufficiently numerous to afford one a complete typology of regional Y~riations in the Indian occupational structure, though it is
1.The 1951 Census also classified an self-supporting non-agriculturists according to e1l1ployment statu,,; as emplayers, employees, and non-earning dependents' but this question is not taken up in this monograph.
97

HA
INDIA
Of
8eNGAl
MAP 22
\
~ \ ..
iI' ••
felt that as a whole they are more or less representative of conditions existing over the greater part of the sub-continent. The areas in which work was carried out were not chosen at random; nor were they selected, as a matter of convenience. ~ Rather they were selected primarily all the basis of one of two criteria: (a) because they exemplified or posed a particularly interesting problem (e.g., in working in Central Uttar Pradesh the problem was to find out in what differing way~ did the two large, but greatly contrasting cities, the industrial center of Kanpur and the not very distant capital, Lucknow, influence the surrounding countryside); or (b) because it was felt that the region would be more or less typical of or epitomize a much larger area. In introducing each region in the following sections of this chapter the reason for its selection will be made clear to the reader.
Within each study region information was gathered in several ways, not the least important of which was personal observation as the author cycled through the Indian countryside or walked the streets, alleys and lanes of the towns and villages he visited. The great bulk of information was, however, derived from interviews, The interviews were Of several types;
(1) Interviews with Government officials.especially those in the Community Development Administration, who were engaged in prolonged, and often intimate, contact with a large number of villagers. from a reasonably compact area within that in which. the author was working.3 These interviews were usually conducted in English; and, while some' were quite illuminating, others were very disappointing. The information sought was general background information of a more local and up-to-date nature than could be obtained
99
from the ·appropnate district gazetteer Gr
the imperlai Gazetteer wnere there was none for the dlstrict. Among the caUSet
01 poor interviews were the desire of the petty !UllCtlonary to make a favourable lmpression on the visiting foreigner (for any 01 a number of reasons, personal and oUlel"Wlse); tbe interviewee's lack of familiarity with the social and economic conditIOns 01 the area to which he was assignedsometimes, but not always, because h~ was new in his postj the non-availability ot the types of statisucs normally collected within the community development Olocks; and the author's occasional failure to establish proper rapport.
(2) Random, spot interviews.-.From tlme to time, when the opportunity arose, random interviews were made, according to no fixed pClttem, with sucb individuals as factory owners and personnel managers, village artisans, shopkeepers, and itinerant workers of various kinds, simply to round out the author's knowledge of bis subject. These followed no pre-conceived format and were in no way systematically planned or subjected to quantitative analysis. They varied in length from a few minutes to over an hour in length. Notes were often rccorded only after the interview was complete. The information obtained is assumed to be fairly accurate.
(3) Interviews at the village leveL-In each of the nearly two hundred villages which the author visited an interview was conducted with some person or group of persons presumably familiar with the entire village and qualified and trusted to give reasonably reliable responses. Wherever possible it was sought to deal directly with the Village Headman (the Sarpanch or the Pradhan) . These individuals al1110st inevitably cooperated. with us if they could be reached; but, if for some reason they
liThe single exception is the Delhi area in which field work was conducted primarily on an experimental basis in order to develop a standardized questionnaire, to improve the technique of interviewing, and to become aware of some of the problems apt to be encountered tn other areas in order to discuss them beforehand with variou> staff members of the Delhi SCbool of EConomics.
8 A conununity development block normally contaim in the neighbourhood of one hundred viHages with IIll average total population of about 75,000.
could not be found. or pleaded more pressing business or inability to answer correctly, som~ obher member of the village ~uncU (Panchayat) , or the revenue cle~k (Patwari or Karnegar), village school master, village postmaster, or village. watchman (Chowkidar) , Or simply some respected elder could usually be relied upon. Generally, group interviews were encouraged. even though they tended to be much more drawn-out affairs. In such cases one person usually did most of the answering, while the others present chimed in or were queried themselves by that person on matters on which tjley were more authoritative, Not infrequently representatives of each major caste or caste bloc were represented.
too
The interviews covered a rather wide range, of subjects and lasted anywhere from half an hour at the minimllIl! to seven hours at the maximum depending largely on the size and complexity of the village. The aveIiage length was perhaps two-anda-quarter or two 'and a balf hours, a time which may seem inordinately long to busy Americans, though not so to most Indians. (Interviews were often interrupted for meals, tea, sweets, baths and even naps; but this time is not rackoned in the estimates given above).
Many of the questions concerned the village as a whole (e.g., which goods 'and services were supplied to other villages or to towns and cities and which bad to be obtained outside the village? Which crops were grown? How much land was under cultivation or irrigation? What types of implements were used in cultivation? What ainenities were focally 'available l' What oCcupational changes occurred in the last decade or so? etc.); but in point of time most of the questioning was' directed at learning about a single caste at a time. There were several reasons for adopting this approach. First, it is a type Df question-
ing which conforms to. the Indian village mentality, which tends to conceive.of issue!! in terms of their caste dimensio~s, Secon~ it provided a way Df breaking down a large b19ck of poople into meaningful components, each small enough as a rule to be viewed 'as a whole. Third, in asking caste by caste how many hDuseholds wer~ engaged in the caste occupation (whatever it may have 'been), primarily, subsidiarUy, or not at all, one avoided the possibility of haying the caste occupation reported as the actual occupation since the two. names are. commonly identical. Thus, were one to ask how many households of barbers (Nais) there were in a given village he would almost surely be told the number belonging to the Nai caste, whereas if one were first to 'ascertain the number in that caste, he cDuld then ask how many of that number were actually doing their caste
wDrk.'"
Virtually all the interviews were conducted through interpreters, though Dn a few occasions villagers with a very good command of the English language were encountered. (One even had a master's degree in sociology). But even thOUgh the 'author worked through interpreters, one tiuent in Hindi, Urdu and Punjabi, the oliher tiuent in Tamil and Malayhlam, a number of areas were visited in which the local language was different from any o~ those in which. the interpreters were proficient. In some cases, as in Northern Bihar or Rajasthan, the difference amounted to. little more than a change in dialect· from standard Hindi, which was easily mastered, especially in regard to. the key words, But, in Gujarati-speaking Saurashtra the Matathi-speaking area of the Deccan Lava Plateau! the tribal areas of the Chota Nagpur and West Bengal, English or Hinc!ispeaking informants or intermediaries had to be fDund. Fortunately, schoolmasters, ex-soldiers, ex-factory workers, merchants,
~The purpose was no tmerely to find out the degree to which caste-work was be~g pursued. Onc;e havin,g ascertained that some non-ca§te work was being pursued, whether.,on a. subsidiary, ,Prunary .~r exclUSIve baSIS the lnfomant was questioned as to the number of households ot mdiVlduals purswng eacb kind of I!U~~ work the 0Iu0 III whicb they ~ged in tba' work, etc.
and the like could always be found to serve in the required capacity. It is not felt that the language 'barrier greatly affected the accuracy of th~ field findings, though it protracted the interviews considerably in some instances. Posed with a difficulty. we ~enerally wrestled with it until mutu'any convinced that we understood one another.
The questionnaire which was used in eight of the twelve study areas was developed only after initial experimental interviews on a non-standardized basis in nine villages in Delhi State and its environs. As 'a result of that trial experience the major lineaments of the interview procedure were firmly established and only minor details were altered as the field work proceeded. Apart fl'Om the Delhi area, non-standardized interview techniques had to be resorted to in the vicinity of Calcutta, where only a bastly reconnaissance was intended; in Telangana, where the author was temporarily without an interpreter and in Travancore-Cochin, where the general absence of nucleated villages made the established interview form unworkable.
Each of the village interviews was assigned a subjective reliability rating by the author, in consultation with his interpreter, immediately after its termination: excellent, very good, good, fair, or poor,
lOt
Of the 175 villages is the eight areas in which standardized interviewing procedure Was employed, 40 yielded excellent resufts, 66 very good, 43 good, 17 fair, and only 9 poor. A rating of "excellent" indicated that in our view the results of the interview could be, relied upon to yield a picture of the village occupational structure which was correct in an qualitative essentials and, in all proba'bi1i.ty, only slightly inaccurate quantitatively (i.e., with errors generally within 15% of correct values). A rati~g of "poor", by contrast, indicated that the results of the interview could be trust~d only in the broad, general outnne, but that many details were probably higJtly inaccurate.
By and large the areas did not differ
greatly from one 'another in the reliability
scores of the villages studied therein. The
areas in which the best scores were obtain
ed were the Deccan Lava Plateau, fonowed
closely by Punjab, while in Tamil Nad the
scores were, slightly worSe than in the other
regions. The latter c'ase is partly attribut
able to the size and complexity of viJI'ages
in Tamil Nad-small vilJages general1y re
ceived better scores than large throughout
the sub-continent-and partly to the factor
that the author was working here with a
new 'and inexperienced interpreter.1I
IA word about the author's two interpreters is In order. The first, with whom the author worked in nIne stuay areaS (160 villages in all) 'was himself. a low caste Hindu vil1a~er a holder of a B.A .. and the veteran of three years of experience in village survey work in connection with the investigations of the Delhi School of Economics through whose aid his services were obtained. A person or simple habits, boundless good cheer, enerzy, and obvious sincerity. he had extremely little difficulty in establishin!! raoport wherever we went. Where douhts arose a" to the motive of our investigation he was Quick to sense and dispel them~ and in those occasional instances when evasive answers were given, that fact was always reported to the author so that by a orocess of cross questioning the closest possible approximation to the tmth could be ascertained. Tn relatively little time we were able to work efficiently together as a team with a minimum of wasted words and motion. As an illustration of 'the spirit of the first interpretor it may be noted that after being bed ridden for several. days with an improperly diagnosed case of typhoid. he tried to insist on I!etting up in order that we might jointly get on with the job so great was his concern for the success of the undertaking.
The second interpreter, a Brahmin son or a teacher of high school literl}ture. was no less well·intentioned than the first, but had far less aptitude for field work. Althougl,he received hiS B.A. with Honours from a Catholic Mission College, of very good standing, he had very little knowledge of vt1lage life or insight into village problems Fortunately, the author's experience with the first interpreter enabled him to a great degree to make up for many of the de6clencies of the second, even allowing or the language barrier and the strangeness of certain aspects of the South Indian Socio-economic settIng. When an interview was not going welt the author somehow senSCd_ the faet and often the cause as w~lI and Wl\S ;tbW to su~~est (he n~ssary coITeCtive measures., ' .
The method of selecting villages to be visited warrants some attention. No attempt was made at choosing villages in a completely random manner or at deriving a sample of a predetermined size of which the statistical meaningfulness could he determined with some pretensions..... of accuracy. Such a procedure would haVe been quite impracticable,. since choosing a meaningful random ,sample of villages within the selected study areas would have imposed logistical difficulties of such a magnitude as greatly to slow down the work and greatly reduce the total coverage of villages.6 The conscious choice made was to sacrifice depth and precision in favour of breadth, variety and a search for generality.
In practice the villages were selected in 'Such a m~nner as to seek to ensure the following: (l) That all parts of the study area were reasonably well represented; thus the network of viUages covered was such that very few villages covered lay fyrther than ten miles from another village covered, while the average spaCing of villages was well below ten miles. (2) That all types of villages normally found in the study area. were represented at least once. wh:ile the more common types were mOrt' frequently visited. This required continual on-the-st10t checking on the types of villages found Toungabout th~ one~. We were in. Thus were studied villages in all size
---------- ------
r02
categories; of all sorts of caste (and/or tribal) structures; with and without irrigation; close to, moderately removed from, and remote from to~ns and cities or main mads; with and without markets or local artisan specialties; etc. The choice of the exact village to go to next was normally made <)DIy just prior to actually going there; and often only a general locality was decided on and the particular village chosen as a matter of "pot luck".
Organization and Scope of the Chapter.The remainder of this chapter is devoted to an individual study of each of the field areas visited, beginning with the areas which are considered, on the whole, the least developed and concluding with those which are considered the most developed. In Chapter VI the findings relating to the several areas will be compared, with respect to a varietly of factors relating to occupational structure and economic development and some important summary generalizations will be offered.
The reason fpr the selection of each area is explained at the outset of ,each of thr. following discussions and a brief back!!round description of the most important characteristics of the recion or regions of which it is a part is given.'!' (A map hi
,oroyided. jo most cases. to facilitate follow-ing this discus.sion.) Any recent. events of, particular significance to the area's
'Th'e presumably "scientific" ~amT'le of 812 villages selected for the Agricultural Labour Enquiry of 1951 was sufficient to engage a field staff of 474 individual~, not cOl1nti:T'll' pen:onS who worked for less than three 1T'onths. Counting the author and his two interpreters the field work for this thesis consv1T'ed only sixtt't'n IT'I'P-1T'ont}>s for 198 villages. concentrated in twelve small areaS covering not more than twenty thousand sa11Dre miles in all, Of 1ess than two per cent of the entire country. V.M. Dandekar argnes vigorously and convincinlllv in favour of sUrVevs based on studies ofselt'cted "organic clusters" ofviJIages in relatively small arens. "The study of regional variations is greatly facilitated," he states. "when the investigation is conC'entrated in a few rel!ions. . ..... . fratherJ than when it is ~cattererl all over the ?ountry." ("Rationale for Remonal Variation." in Ratio,.,al~ of Regional Variations In Agrarian Structure ofTndlft, pp. 102-108, quott' from p. 108). Thorner als6 arllues 31lalnst the l'seudo-scientific manner in which the A.l.a was conducted. "The ruination of the Enquiry may," in his opinion, ...... "be s'lid to be an obses~ion with the theoretical virtues of- random sampling coupled with an indifference to the formidable problem involved in its flnnlicatlon_" He c<!nclude~ by st:ltinll that "At this st~~e of our knowledge it would appear that one of the research methods most dlf'ficult to applv to the study of IndIa s Inv:olved landlord-oeasant-labourer relationShips is the n~tion-wiCle sample survey. . . A dmcen or two research officers possessed ofcbmmon sense?training, and some insillht in the rural scene would nerhaps haVe" bet'''' enouP'h" "The Agri~ultural Labonr Enquiry: Reflections on Concepts and Methods, "Economic Weekly. Bombay" Vol.VTlJ, 23 June, 1956, pp. 759-776, quote On pp. 765~6.)
. 'Unless otherwise specified all the background data presented in the regional descriptions are derive:<! from the various District Census Handbook~. the District Gazetteers, the lmperial Gazetters, or informatlon gather~d 'ir;t·hlnJ if! th: IbId.
economic ,history are cited, Following ·this introduction, the occupational features common to most of the villages in the area are discussed, and then thos(! unique features by which individual villages or village groups may be distinguished. The conclusion of each regional discussion summarizes the significant relationships of occupational characteristics to the level of
economic development on a village-wise basis, utilizing the author's subjective rating of each viJJage on the basis of its level of progre% and prosperity. (Four ratings only were used: "A" for far above the regional average, "B" for noticeably above, "C" for about average, and "D" for noticeably below), For a few regions, which were not studied in the standard manner, a most abbreviated treatment is resorted to,
The overwhelmingly rural orientation of the following discussions is in part a matter of necc3<;ity, in part a matter of choice: of necessity, because it is exceedingly difficult using the interview techniques employed in the villages, or any other short-cut techniques known to the author, to get a very trustworthy picture of the occupational structure of a town of over 5,000 people: of choice, because India is 83% rural to begin with and because, while the towns and cities tend to be quite similar from one area to another, the really significant regional differences stem it is felt, from the varying modes of organization of rural society,S
Northern Bihar (Map 23)
General Background.-As was seen in Chapter IV, there is a tier of dif,tricts Rtretching across the entirety of the Tirhut PlaIn of N orthem Bihar and 'westward along -.~ .. -- - - - -_
r03
the Nepali border to Central Uttar Pradesh in which there is an unusually high proportion of agriculturisb. always in excess of 85 % and in a few districts in excess of 90;c. In no other part of non·tribal India are comparably high figures attained, The reasons for the unusual depression of nonagricultural activities in this regIon, taken as a whole, have already been outline.d and need not be repeated here. Rather, it is the author's intention to scrutinize within this general region one small and particularly depressed area presumably epitoizing the larger region of which it is a part. The area in questIon is in the district oE Saharsa, which was separated from Bhagal. pur District (now restricted almost entirely to the area south of the Ganges) just prior to the taking of the 1951 Census.
One cannot think of Saharsa District without thinking also of the Kosi, the river which at one time or another in the last century or two has swept over and ravished almo~t all of that ill-fated area. Draining the entirety of the Everest Massif and the adjacent area of the Himalayas as well, it pours more water (and undoubtedly more sediment) over the ~orth Indian Plain than any other 1 iver between the Brahmaputra and the Tndus ll , Its floods are the mo~t devastating in the whole of North India, and the swaths of infertile <;and and gravel which bear testim.)flY to their occurrence have spelIed the ruination of many once highly productive agricultural tracts and di.,aster for their inhabitants. The river has heen migrating steadily westward, since 1934 at an average rate of a half mile per year. Whereas it used to lie along the eastern boundary of what is now Saharsa it now flow<; close tf) the opposite border or the district. In between is a striated land· scare of intertwining <;ea~onal water •
'The occupational structure of .India's cities (accollT'ting for 26 millions of India's 62 million urbanitrs) is moreover, already a~equatelr treated. In a doctora I di~s~rt:l1 ion by Amrit Lal, some Characteristics of Indian Cities of OFer 100,00.0 Inha,blfants !"lth SpeCial Reference to Their ()ccupational Structure and Functional Organizatirl1l,
Ph, ? Thesl~, (nOlana Umv" May )958) S.ee als.o. hi~ article "Some Aspects of Functional Classification of Cities and a Proposed Scheme for Classlfymg Indian CitIes m The National G('O!rraphical."!ournal of India, Vol. TV, Part I, March~ 1959, pp. 12-~4, \-fany. of i;al's o!'ser_vations with regard to citie~ will also apply to large tr,wm, while munv \ f the observations made In thIS theSIS With regard to villages should be vnlid also for small t0wns.
9Henry Hart, New India's Rivers, p. 263. The Kosi River lind plans to control it flTr disCl"fCd on pp 263-7

MASTER LEGEND SHEET FOR MAPS 23 THROUGH 32
BASE MAP INFORMATION BOUNDARIES (as of 1-951)
NATIONAL
TRANSPORT RAILROADS
STATE IMPORTANT ROADS
SECONDARY ROADS
• I • •
- --OISTRICT
SETTLEMENT DRAINAGE'& ASSOCIATED FEATURES TOWNS (, CITIES OF OVER 20.000 POPULATION (1951 pop.is indicated to ncaorcut '.hoG,sond bcalow the name.)
TOWNS OF UNDER 20,000 (and selected viH'Oqes with town functions)
HILLS 8. M.OUNTAINS (Mountains only in Kerola,where hill-lands oro left In white)
o
IMPORTANT RIVERS SECONDARY RIVERS CANALS EMBANKMENTS DAMS RIVERINE SANDS ANNUALLY FLOODED BACKWATER AREA(Kerala only) OC EAN (Kuala oll'ly'>
SAMPLE VILLAGE DATA
E X AMP L E: • 2 I _2 B 0
INTERPRETATION:
4 470 III 120 30 8
{2 2 5 J AT' I 5 2 5 I.
• 110 CHAMAR"(IO}(IS)"
I. 21 is the key numbQr of the villaqe,
2. B is the developmont ratinq. (A: very much aDOVQ ovora<jctj B:conspicuously obov~
CJVQroCJe; C = about avo rogo and O=consp icuous Iy be Iowa vIHaqlL)
--• , • , '. t
3. The circle indicates the location qnd size ranqc of tllll villaqe, i.e. no.of hOlls.holds.
~o CW' H lOP ,s,O 20,0 3 0 10 $OIOOVUO b~IQW t" 100 to 1,:)0 to .tIlO t., 300 to Soo t.750 750
4. 470 is tho approximate number of hOU1Cholds in tho villaqcL . 5, 14 is the number of castos in the village.
6. 225 Jot and 110 Chamar are thCl approximotCl numbers of households in the major
castes of the villoqe. All castes with over 20e/.of the villaCJe population oreshowD,
and in most coses all castes with ovu 10°1. as well. (M):: Muslim (C )=Christion(T)=Tribc.
7-12. These figures relate to percentaCJes of all households in some wa'y ~endent~~ ..
~gricultural occu(lations. ( Huntin9,fishing and collecting and marketinCJ of the primory
production of one's own household are counted alonq with agriculture.) Percentoqcs
are normally rounded off to the nearest 5 percent. > means qreater than, < meaDS
less. than, N meqns neqligible. Items II and 12 shown only when equal to or qreoter tbooIO',.
7. 201 relotes to p'rimory df,pendence and to wor-k pursued within the villaqe.
8. l!2 relates to Rrimory,~ lubsidiary dependence and to work pucsued ~ the villoCJe.
9. ~rrdotu to primary dependence and to work pursued outside the villoqe.
10. ~ relates to Rrimary 2! subsidiary dependence and to work pursue~ ~ the villo'ic,
~ I. (10)1 relotczs to' (lrimary dctpendcflce and to work pursued outside the viU09c by ~crson,
ruidin9 outsidlZ the villoqe.
,12. HIS) relates to (lrimory or subsidiary dependence ohd to wo.rk p'ursucd outside f\c vil101t
by pusons ruidinCl outside the villaCJc.
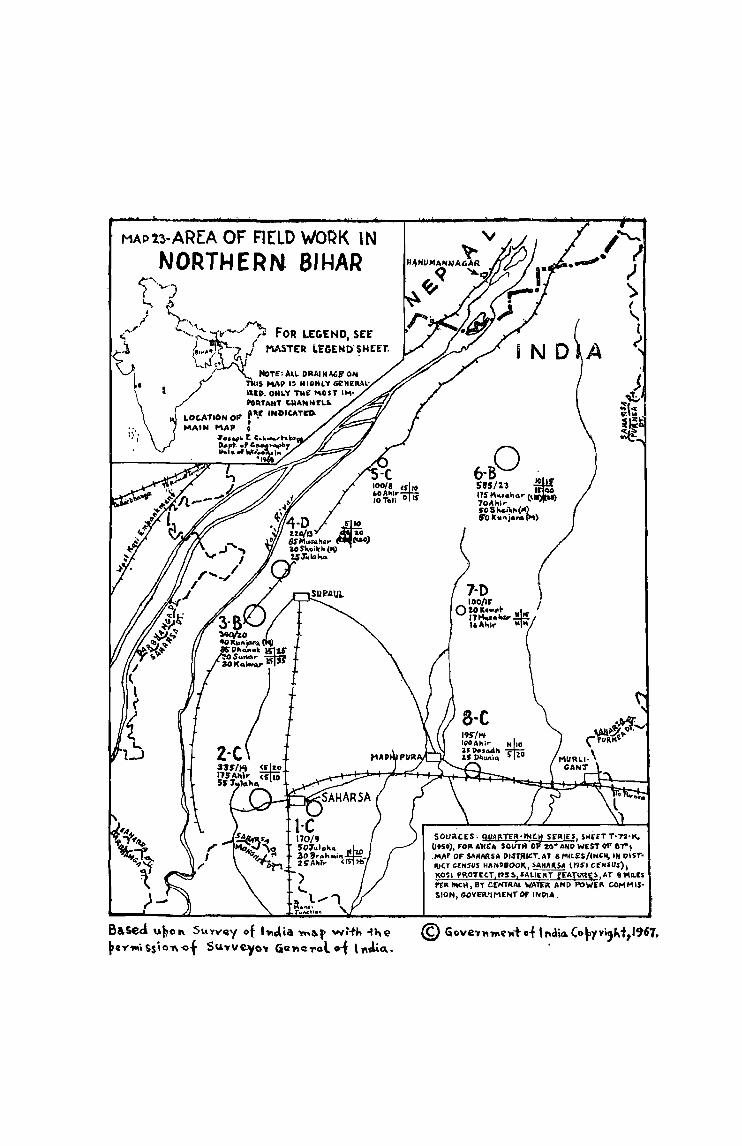
MAP2.3-AREA OF FIELD WORK IN NORTHERN. BIHAR
("" ........
)'~, ~ ........ '. .....,: ..... ·If·...,,....- ~ FOR LEGEND, SEE' . 1 ( .l t;(t' MASTER ~EGEND·~HE:£T.
HOT[: AlL DRA'N~6' ON 1$ ""I' IS HIGHLY GeIU!RAl'
Il.ltO. ONLY TN~ KOST IMPORTAltT tll"'Nltr~
LOC.ATION OF ''\1" INDltATCO . • MAIN MAP •
.3'0."," E. C ... .....,h .. o..pt. .'O~_"1 .,.._h ... \!K'.... 1"
'1
100/8 *S 10 I>OAhl~ 10Teli 0 If
B&sec:1 u~o" S\l.,,,q,y of I,,~ia ~lI.f> Y'(i-th -f~~ ~eY'lni SSlO'1\ -ot Su.'Yv~o'V Civ'ric 1'ol o-f ,,,etc..
(
" l I
SOURCES' QUABTEI3-INCP SE"RI£S, SHEET "·n-"(J95"O). ,0,," AlIU SCHlrlil 0 ~. ANO WEST OF II"'~ .JoI.'" OF SANM5A DISlJIIlT.AT O/'l'Lf:S/'NCW, IN OIST"JeT CCHSVS HAN9DOO~, ~ ll'JSI crllslI.I); KO~I I'R07£C.T.I9$!o,$A~I£HT f£ATIII'IE5,AT 6MII.[$ I'£R IttClI, BY CENTRAL \{All"R AND Pow£,I' COMMISSION, GOVElVIM£NTOF INDIA.
Cdurses dhars, sometimes miles across, barren sandy tracts, barely negotiable by ox-cart and frustrating in the extreme to the highway engineer. (At the time of the author's visit' Saharsa still had more elephants than automobiles). Malarial swamps abound in some parts of the dhars; yet, _paradoxically drinking water is in many areas hard to find in the dry season.
166
Despite repeated disaster, Saharsa District supported in 1951, a rather dense, unevenly distributed, entirely rural population. Though the district average was 610 persons per square mile, one thana (a minor civil division) had a density of only 121 while another had 880. The lowest densities are in the areas of the northwest most recently affected by floods. Owing to a combination of floods, disease (malaria, epidemic cholera, and endemic typhoid and dysentery) and emigration, population growth over the last two generations has been relatively slow. The population depends almost entirely on a subsistence-type agriculture for its livelihood. Rice is by far the largest crop, though relatively few households manage to grow salable surpluses. Formerly, however, much of the! produce was appropriated as "taxe:;" by the zamindars, who were said to have been especially oppressive in this area. Without a surplus to sell or barter, it is little wonder then that the local demand for traditional artisans' goods and services sank SO low. Prior_ to the turn of tne century indigo was a rather important crop and 'the dye was locally manufactured prior to transport to Calcutta. But. as elsewhere in India. the industry died out in the face of competition from the burgeonin& German chemical dye industry., Jute has replaced indigo as a cash crop to only a small degree and owing to the high cost of tramport, can compete on the market with the crop grown in the Gangetic Delta only by being sold at a price scarcely worth the effort of growing it. A little sugarcane is grown for the local market.
Until a few years ago there was not a single metalled road connecting Saharsa District,to the rest of India and even today only a few tens of miles at most have been firmly surfaced, with interruptions at the dhars. Bus service in the district is also but '8 few years old and is still both expensive and very limited in extent. The single-track, narrow gauge loop of the Northeastern Railroad traversing the district provides an outlet for goods, but the stretch of track between Saharsa and Murligaoj is frequently out, of commission due to floods.
The pattern of settlement in the area is one characterized by central villages having, more often than not, one or more outlying hamlets, or tholas, which may be occasionally made up of a single caste. The central villages are almost always multi-caste in make-up. Much of the housing in many of the tholas is of bamboo with thatched roofs, rather than of mud, suggesting its probable recent constru.ction and the fact that the population has recently shifted due to floods. The size'distribution of villages appears tJ be almost utterly random and lacking in a central place orientation, which a more commercialized economy might develop. A scatterIng of isolated farmsteads are operated by the Anglo-Indian descendents of the former indigo-planters, many of whom still own large tracts of land. Several towns have been created since 1951, of which Saharsa, the capital, and Madhipura, the chief trading center, are the largest.
By far the largest caste in the area as well as in Bihar in general, arc the Yadavas also called Goalas (the same as the AJ;lirs of Uttar Pradesh), traditionally cowherds, and fairly low in the caste hierarchy. They may originally have come to this area to graze their herds on the grasslands flanking the dhars, but the great majority have long since become primarily cultivators. This caste was the only one found iIi all eight of the villages visited in the field, and was the leading caste in three villages, second in one other, and third in two others. It is
doubtful, however, if they form as much as a fifth of the total dist-rict population.
Significantly, there is no single dominant traditionally cultivating caste as is the case in so many parts of India. Other than the Yadavas, eight castes of cultivators and agricultural laborers were encountered (out of a total of thirty-eight) the largest of which, the Musahars, an agricultural laborer caste, are said to be semi-Hinduized aborigines, as are many of the Yadavas and a number of other local castes which the Censuses up to 1931 returned as Hindus. (A few tens of thousands of truly tribal Santals are found in the district mainly to the east of the area in which field work was carried out). The Musahars were the largest group in two villages, second in another, and third in still another. One Moslem cultivating caste, the Kunjara, perhaps better designated as a gardening caste, was feund in every village but one, and was the leading caste in one case. Several castes who are traditionally known in thi~ area as independent cultivators are, significantly, associated with the role of agricultural laborers in areas further to the west where they are held in very low esteem (e.g., Pasi, Dhanuk and Rai).
The number of high-caste Hindus (Brahmins, Kayasths, Rajputs and Banias, as well as a few others) and Muslims (Sheikhs and Moglfuls) is relatively small, probably not over a tenth of the total; and these groups tend to bc quite concentrated, though not necessarily mutually exclusive, even across religious lines. Thus, four out of the sample of eight villages had each from 30 to 130 high caste households, while the other four had a total of eleven.
Of the artisan and serving castes encountered, the goldsmiths and Moslem butchers were highly concentrated, the potters moderately so, and the carpenters, blacksmiths, weavers (by far the most numerous group) cotton-carders, oil pressers, sweetmakers, barbers 'and leather-workers r:lther diffuse. For some unknown reason there were
extremely few washermen. In all, this entire group of castes probably made up not quite a third of the total population.
The locus of economic power is always an interesting problem in rural India. Here it does not a'ppear to be entrenched among . any special group. But much of the land, it appears, has fallen into the hands of Marwari traders and moneylenders who live mainly in the towns, especially Madhipura. The indigenous Banias (the merchant caste) being rather few in the area, the Marwaris, who came shortly after the establishment of East India Company Rule in the 1770's, soon gained a leading position in commerce. Possessed of capital, they were able to buy up much land in times of flood when it was quite cheap or to gain possessioB through the extension of loans at the customary usurious rates of interest. Most of the original and remaining zamindars, however, were Rajputs and Brahmins.
This district, it may be noted, appears slated for a better future due to the joint creation by the Indian and Nepalese governments of the Kosi flood-control and irrigation project, work on which began in 1954. The river is flOW contained within two enormous embankments up to forty feet high and more than fifty miles in length. These lead south from the Hanumannagar Barrage, just inside Nepal. (There were, incidentally, at the time of the author's visit, no border formalities in the Kosi Project area). From that point much of the surplus flow will soon be diverted through a system of canals which will eventually irrigate thousands of square miles of Saharsa, Purnea and Monghyr. (Further north in Nepal another diversion system is also under construction to irrigate a smaller section of that country's tarai or preHimalayan foreland). But no large scheme of power development is included in the Project; and it will be a long tIme before there is any real market for power in this area. (Only two towns and no villages had electricity in 1959. The first electricity was generated in the district, by diesel power, only in 1955). A higher
priority task is the establishment of an effective system of communications so that such LocaL agricuLtural surpluses as can eventually be grown may be sent to outside markets.
Analysis of the Occupational Structure.Saharsa District, according to the Census is 94' 0% agricultural. Of this figure, nearly 4.1 % are said to be owner-cultivators and landlords, while over 52 % are tenants (29%) and agricultural Jaborers (23%). Of the 6% non-cultivating workers 0'7% are in miscellaneous primary industries, mainly stock-raising (a rather low figure considering that Yadavas are the largest caste), 0'7% in all forms of manufacturing (Le., artisanry). 1'1 % in construction and maintenance, 2'7% in commerce, 0.2% in transport and communications, 0'4% in health, education and public administration, and 0'7% in other services, including O· 3 % in "services otherwise unclassified." Only one of the five census sub-divisions of the district had under 94% of the working force in agricultural pursuits, namely that containing the rapidly growing new district capital. Here 81'4% were in agriculture, 7'5% in construction, 5'5% in commerce, and 0'4% in health, education.. and public administration. In the author's opinion, the Census figures are probably essentially correct, as of the year 1951.
The more important occupational data for the eight villages in the field sample are shown on Map 23. In three of these it will be noticed that a negligible proportion (i.e., below 1'5%) of the households are mainly dependent on non-agricultural pursuits, whereas in thre.e others the percentage is below 5% (actually fmm 1'3% to 3'5% according to the author's reckoning). But two villages (Nos. 3 and 6 on the ma'p') have nearly 15% and 10% respectively of non-agriculturists. Of these, only the former had any genuine non-agricultural development of note; long a marketing center for villages roundabout, it had by far the greatest village concentration of mer· chant caste families encountered in the area. The latter village, much the largest of the
eight visited, and a center of marty re1atively wealthy Brahmin households and several other fairly weI1-off castes, does not reaIly have a proportion of non-agriculturists much in excess of what one might expect. Still, one local artisan activity, basketry, is developed to a moderate extent.
It is clear that for the area as a whole, which is probably around 40% non-agricultural in its caste composition, the ability for one to pursue his caste calling is greatly limited. Moribund though it may be, however, the jajmani system is far from dead, as is evidenced by the figures on nonagricultural pursuits pursued on a subsidiary -basis. These range from 10% to 25%. (As We shall SOOn see also many non-agriculturists also pursue their callings outside the,ir villages). It should be noted, furthermore, that one-fourth of the non-agriculturi"sts (by caste) in the sampled villages were weavers, much of whose work traditionally lay outside. the system; and over an eighth were Brahmins, only a small fraction of whom normally performed priestly duties. Thus, the showing is not as low as it seems at first sight. (Of the more than 150 households of J ulahas [weavers] encountered, not one was still engaged in its caste work in the village though about a fifth had taken to basketry as a subsidiary source of income.)
The figures for non-agriculturists working outside the village, show some surprisingly high totals, especially in regard to the totals for main plus subsidiary dependence. While four villages have 5 % or fewer of their households dependent on outside labor, the remaining four villages (1, 3, 4 and 6) have from 15% to 20% in that category. These merit closer examination.
Village number one, on the outskirts of Saharsa, has benefitted greatly from its location next to a rapidly expanding job market. Almost all of its outside workers are petty clerks and other minor gov.ernment functionaries, and, not surprisingly, well over half come from the village's thirty Brahmin households.
In villages 4 and 6 the great majority of those primarily dependent on outside work were Musahars doing earthwork on the Kosi Project (which had not yet begun in 1951). From villages 3 and 5, by contrast, very few workers left to work on the Kosi Project even though they were just as well located with regard to the work as villages 4 and 6. This reflects a characteristic feature of Indian employment policy whenever large numbers of labor are needed, namely, the mass recruiting by a labor contractor (working on a commission) from specific villages and usually from specific caste groups therein, including very commonlv the caste to which he himself belongs. In the case of earth-movi"ng, which is· a menial task which not even cultivating castes (as opposed to agricultural laborers) would take to willingly, very low castes are usually engaged. The Kunjara. we have seen, are not far beyond the tribal state and a natural choice for the work in question. Villages 4 and 6 are. incidentally, the two in which they were the largest single caste.
Village 3, as previonsly noted, is a commercial centre. It is not surprising to note then that of the households depending on outside workers, 27 were those of itinerant goldsmiths (all the Sunar caste). and 15 of itinerant grain-dealers (12 Kalwars. to whom trading is a caste occupation, and 3 Te1is. traditionally oiIpressers. but often taking to grain-dealing when forced to leave their caste work). Also working outside. but on a subsidiary basis, were itinerant cotton-carders from some 20 households (a11 of the Dhunia caste) and itinerant vegetable-hawkers from around 25 households (all Kunjaras, the Muslim gardening caste). A phenomenon not uncommon in Indian viII ages , that of economic imitativeness, without or with little respect to caste differences, appears here to be at work.
109
Some final random incidental notes.-The subsidiary outside work not yet accounted for in~ludes a great deal of carting/for hire (especially in villages 5, 6 and 8) a type of work which virtually any caste, includjng Brahmin, feels free to do; some casual work
in brick kilns; and very little else., Most of the outside workers from village 2 are in the Tharia Coalfields, though none have gone there from any other village. Extremely few outside workers from any caste or village have found work in cities. An important subsidiary source of income for several low castes in villages 4 and 5 is the selling for fuel of a woody reed that is gathered along the Kosi. (This engaged over 30% of the households in each of these two villages; but the occupation was not counted in the statistics given on Map 23).
Counting all the above (including reedgatllering and selling) the percentage of households with more than lone occupation varied from 30% to 65% in seven of the eight villages and was but 15 % in the eighth (village 7). That this was so is primarily a function of the fact that the great majority of households mainly dependent on non-agricultural work were also subsidiarily engaged in agriculture in one or another tenure capacity. In two viUage (1 and 8) not a single household was reported to have no stake at all in agriculture. while in three others (2, 5 and 7) the number was negligible. Village 3 reported the maximum of 10% of all families with no direct agricultural ties whatso· ever.
Occupational Structure and Economic Development.-While no village of the study llrea would be considered as highly developed, even by Indian standards, two villages numbers 3 and 6 (marked B on the map), do appear to stand out as being noticeably better off than the rest in terms of wealth, amenities, available agricultural equipment, etc., while two others, 4 and 7. (indicated by a rating of D) are probably somewhat worse off t1tan average. (ViUage 6, incidentally, possessed the only source of inanimate energy in the entire eight vlt1ages, a diesel-powered rice-mill).
Occupationally, the level of development C)r prosperIty would appear to be best reflected by the percentage of caste non-
110
agriculturists stili following their traditional work on a primary basis: averaging over 30% for the two B-villages, 7'z5% for the C-villages and only 5 % for 'the villages rated DlO. The B~villages had 11 % of their hOl.1seholds primarily dependent on non-agricultural work within the village, while the other two groups averaged only about 2% each, Counting both primary and subsidiary forms of non-agricultural actfvity within the village, the averag~s were 20.% for the B-vilIages, 15% for the Cvillages, and about 12'5% for the DvnIages, With regard to non-agricultural work outside, the village, a.verages are not very significant because of the large amount of temporary construction work on the Kosi Project; yet even in this regard. the two most advanced villages exhibits far higher percentage than the average of the remaining six. The percentages of each village group in high castes is also of note, though not entirely in line with expectations, averaging 25% for the B-villages, 6% for the C-villages, and 9--5% for the D-viUages.
.. In all the above occupational com
parisons the difference~ between. the Bvillages and the. C-,villages is much greater than that between the C and the b villtlges. 11he same is tru~ with regard to apparent development. The explanation is that the villages of the area as a whole are so depressed and so minimally supplied with non-agriculturists that it is not physically possible ;to get much below the' local average and still survive, 'Vhether the degree of development more c10sely l.'efiects the occupational :;tructnre of the several villages sampled or .the caste structure, with which it js intimately rdated, is, in the author's mind, a moot question. His sample was riol 1arge enougll to perm~t him to anive 'at: a defihltive an~wet,
'.
Eastern Chota Nagpur
(Map 24)
General Background.-It seems paradoxical, perhaps, to place an area of India containing the nation's largest iron and steel complex, its. most productive coalfield, and its largest center for the production of heavy chemicals close to the bottom of the developmental ladder. Nevertheless, most of the area, when measured in terms of population or territorial extent, is, in fact, "quite underdeveloped. Such modern development as exists has been superimposed only, in relatively recent times on an economic base of tribal and subsistence peasant economy.. which, for the most part, (except around the coalfields), has not yet been radically altered. Moreover, the part of the population with which we are here most concerned is the rural popufatiot1 toward which the author's field work was primarily directed.
What the author was most interested in finding out in the study area was: (a) What sort Qf impact did the location of the iron and steel works at J amshedpur have on the occupational structure of the largely tribal area roundabout? (b) What sort bf impact did the growth of the mining industry in the Jharia Coalfields ulld fhe chemical industry at nearby Siodri have on the surrounding primarjly peasant subsistence economy? and (c) What was happening in the meantiIrtt! to the fairly extensive and still overwhelmingly agricultural area jn between?
In providing in the following p'aragraphs a background description of the study area, an of which forms a part of the eastern Chota Nagpur Plateau (a misnomer since there is little in the terrain there to suggest
l(lThe averages ~f village daia jn this chapter, miles5- otherwise stated, are no~ weighted for the lloI!ulation of the several villages concerned. Using the map data the reader may ~he,?k the dIfferences. betwce~ weIghted and nnweighted averages if he chooSes. to do. so, o,:e rea~on for not w~]ghtmg the data by villap:es Size, apar.t from the obvious reason of economy of effort, 1S that In reality there are a great ma!1Y more s~all than large villa,grs. whereas the .author's sampie is biased to include a somew~at larger proportlOn of re_lahvely. iarge vl1~a~es, Smce large l'iUages aTe \lsually mOle varied than small vill,!ges, In ord{:T to get represe~tatlOn of a11 the major types of villages llormally found in an area, a larger proT?ortwn of ~he fOfl!ler h::d to ~e mcluded In the sample-. "But to a,.crage aU the sampled vi..llages on ~ wetghted ba.'l1S would glYe a mu;leadtng pIcture for the area as a whole.
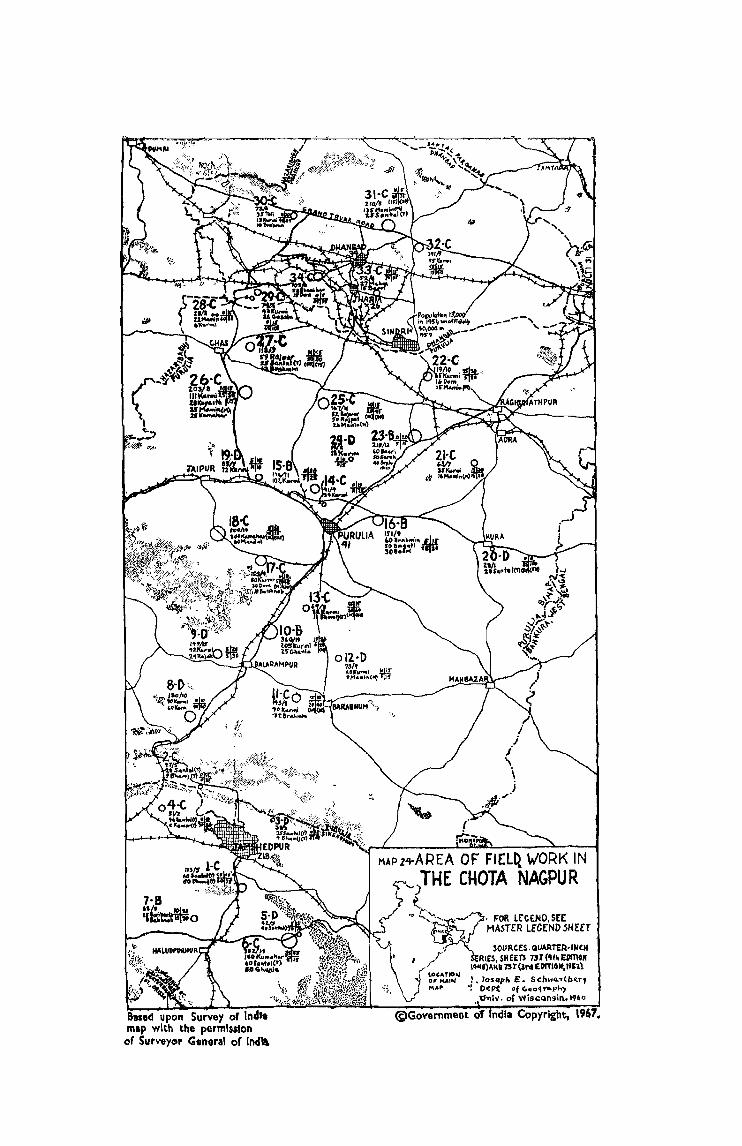
upon Survey of map with the permls;to~ of Surveyor General of 1114\\
FOR LEGEND. SEE MASTER lE"CE"ND SHEET

thls type of landform), it will be best to consider a three-fold regional sul>-division. The three sub-regions are the predominantly tribal area around Jamshedpur ill the eastern Part of Singhbhum district and the southern fringe of Purulia, the predomina,ntIy Hindu peasant agricultural area comprising most 9f Purulia, and the coal-mining area of Dhanbad overlapping slightly into northern Purulia.
112
a. The Area Around Jamshedpur.-The steel city of Jamshedpur is located at the contluence of the Subarnarekha and its tributary the Kharkai at the northern ,fringe of a basin rimmed by classical examples of low folded mountains, verdantly wooded in deciduous forest, and with a local relief varyfug from about a thousand to nearly two-and-a-half thousand feet. Through the mountains tJhe Subarnarekha flows via a series of water gaps which also provide some of the chief points of egress and ingress for rail and motor traffic. But until recently the area maintained a high degree of isolation, and the infusions of Hindu settlers into the region were negligible. It was never conquered by any of the Moghul or Maratha generals and escaped pacification by the British until the !-830's.
The dominant group of the overwhelmingly tribal population are the Santals (often called Manjhi) who practice a sedentary form of agriculture, devoted a1most exclusively to the production of rice and carried on during the rainy seaSOn only, without the aid of irrigation. t1 Hunting, fishing and the gatlJering of wild fruits such as the flower of the ubiquitous mahua tree supplement The native diet. The only other tribal .group found locally in appreciab1e numbers is tM Bhumij, said to be more Hinduized than the S~llltals, though not differing noticeably from them so far as the author could discern. Both groups live amicably side by side, often in the same village. In addition to the tribals, however,
there is now a moderately large rural Hindu minority concentrated in a relatively small number of villages, generally much larger in size than those of the indigenes. No single caste appears to be very large. Contact between the cultures has resulted 1D
many of the tribal men's learning to speak the local dialect of Bihari, though women usually remain unilingual.-
With the creation and steady expansion of Jamshedpur, beginning in 19U~, many of the tribals found seasonal work in vari-0\ls construction jOQ_s to which they take quite readily, especially in the dry season. Many also took to seasonal work in nearby mines. But relatively few have sought or acce}?ted permanent employment in the mills, though they respond readily to calls for day labor.1:.l The vast majority of the population of J amshedpur consists of outsiders from all parts of India. They consider themselves, moreover, permanently tied to their new ,home, where industrial 'working and living conditions are among tht: best in the country. This is in sharp contrast to the situation in many other industrial cities in which the umbilical ties of the worker with his maternal village are rarely completel y severed.
b. The Purulia Area.-North of the mountains, most of Purulia is an undulating plain, incised by a system of streams 01
moderate width flowing generally eastward to the Damodar or onto the flat delta lands of West Bengal, and irregularly punctuated with low, isolated hilly outliers of the more rugged parts of the Chota N agpur Jying (0
the west. There are no physical barriers to communication with the delta; but to the west are encountered a number of escarpments marking the edge of the tableland (':f Ranchi District.
While the vast majority of the area is topographically suited for cultivation, a minority of the land is actually under crops, owing largely to the fact that over much of
11 Slash and burn agriculture (locally called tangia) was practiced until.quite recent times. It is now however, banned by law.
1: Based on an interview with the Public Relations Officer of the Tata Iron and Steel Company.
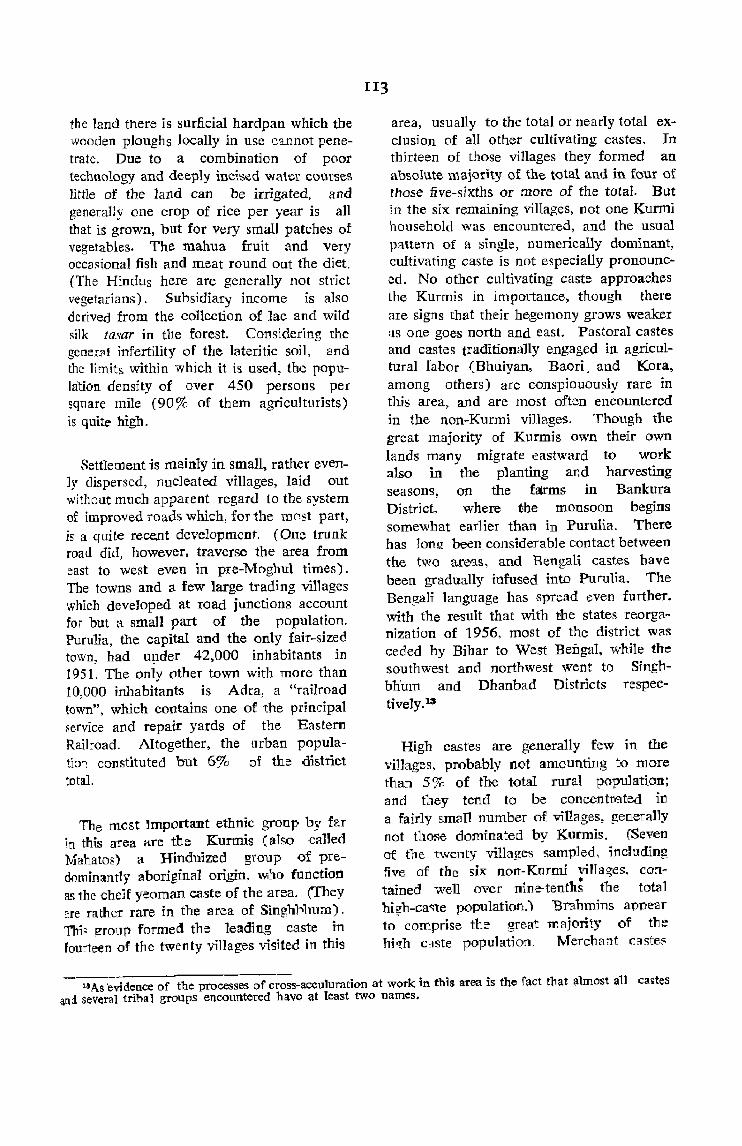
the land there is surficial hardpan which the wooden ploughs locally in use c-a.llnot penetrate. Due to a combination of poor technology and deeply incised watt::r courses little of the lana can be irrigated, and generally one crop of rice per year is all that is grown, but for very small patches of vegetables. The mahua fruit and very occasional fish and meat round out the diet. (The Hindus here are generally not strict vegetarians) . Subsidiary income is also derived from the collection of lac and witd silk tasar in the forest. Considering the gcnerfll infertility of tlle lateritic soil, and the limits within which it is used, the popu(alion density of over 450 persons per square mile (90% of them agriculturists) is: quite high.
Settlement is mainly in small, rather evenly dispersed, nucleated villages, laid out without much apparent regard to tbe system of improved roads which, for the most part, is a quite receJ1t development. (One trunk road did, however, traverse the area from east to west even in pre-Moghul times). The towns and il few large trading villages which developed at road junctions account for but a smal1 part of the population. Purulia, the capital and the only fair-sized town, had u~der 42,000 inhabitants in 1951. The only other town with more than 10,000 inhabitants is Adra, a "railroad town", which contains one of the principal ~ervice and repair yards of the Eastern Railroad. Altogether, the (Jrban populatio,,: constituted but 60/0 of the district total.
The most lmportant ethnic group by far in this area are the Kurmis (also -caUed Mahatos) a Hinduized group of predominantly aboriginal origin, "\",!lo function as the chelf yeoman caste of the area. (They are rather rare in the area of Slngh~hum). This e-rou-p formed the leading caste in fourteen of the twenty villages visited in this
U3
area, usually to the total or nearly total exclusion of all other cultivating castes. In thirteen of those villages they formed an absolute majority of the total and in four of those five-sixths or more of the total. But in the six remaining villages, not one Kurmi household was encountered, and the usual pattern of a single, numerically dominant, cultivating caste is not especially pronounced. No other cultivating caste approaches the Kurmis in importance, though there are signs that their h~gcmony grJWS weaker ;lS one goes north and east. Pastoral castes and castes traditionally engaged in agricultural fabor (Bhuiyan, Baori. and Kora, among others) are conspiououslv rare in this area, and are most often en~Olmtered in the non-Kurmi villages. Though the great majority of Kurmis own their own lands many migrate eastward to work also in the planting and harvesting seasons, on the falrms in Bankura District, where the monsoon begins somewhat earlier than in Purulia. There has 10n,!! been_considerable contact between the two areF:lS, and Bengali castes have been gradually infused into Purulia. The Bengali language has spread even further. with the result that with the states re.organization of 1956, most of the district was ceded by Bihar to West Benga1, while the southwest and northwest went to Singhbhum and Dhanbad Districts respectively.I3
High castes are generally few in tile vmages. probably not amounting to more than 5% of the total rural population; and they tend to be concentrated ill a fairly small number of villages, ~enerally not thcr.:;e dominated by Kurmis. (Seven of the twenty 'iril1age~ sampled, including th'e of the six non-Kurmi villa~es. con-• tained well over nine-tenths the total hisrh-cal'ite population.) Brnhmins apPe<lr
to comprise the great majority of the hi~h caste populatjon. Mercllant c.aste~
lSAs evidence of the processes of cross-acculuration at work in this area is the fact that almost aU castes an:! several tribal groups encountered have at least two names.
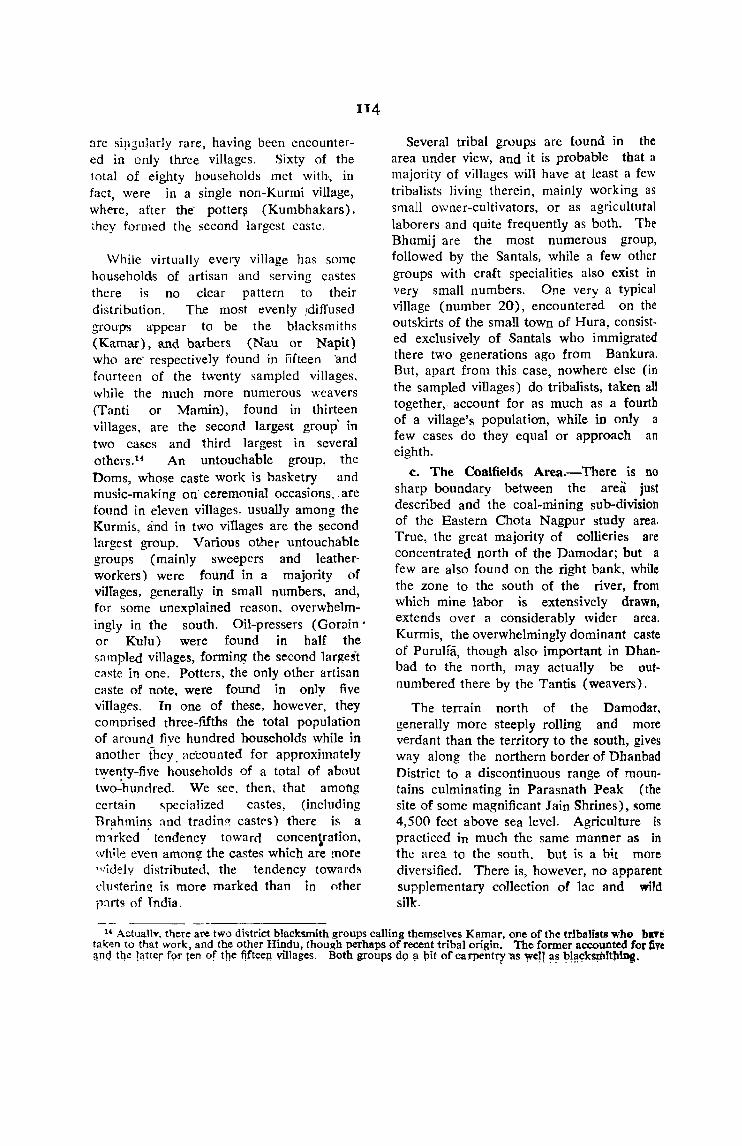
are sipgularly rare, having been encountered in only three villages. Sixty of the total of eighty households met with, in fact, were in a single non-Kurmi village, where, after the- potter~ (Kumbhakars) . they formed the second largest caste.
IT4
While virtually every village has som~ households of artisan and serving castes there is no clear pattern to their distribution. The most evenly !ditrused _groups appear to be the blacksmiths (Kamar), and barbers (Nau or Napit) who are- respectively found in fifteen 'and fourteen of the twenty sampled villages. while the much more numerous weavers (Tanti or Mamin) , found in thirteen villages, are the second largest group' in two cases and third largest in several others.H An untouchable group, the Dams, whose caste work is hasketry and music-making on' ceremonial occasions, . are found in eleven villages. usually among the Kurmis, and in two villages are the second largest group. Various other untouchable groups (mainly sweepers and leather· workers) were found in a majority of vilIages. generally in small numbers, and, for some unexplained reason, overwhelmingly in the south. Oil-pressers (Gor::tin' or KuIu) were found in ha1f the sampled villages, formin~ the second larges"t caste in one. Potters, the only other artisan caste of note, were found in only five villages. In one of these. however, they comprised three-fifths the total population of around fiye hundred households while in another they. accounted for approximately t'Yenty-five households of a total of about tw~hundred. We see, then, that amofig certain specialized castes, (including Br!Jhmin? and tradin~ castf's) there is a m'lrked tendency towarrl concen~ration, whik even among: the castes which are more ":idelv distributed, the tendency toward~ du"tering is more marked than in other P:1rts of T ndia .
Several tribal groups arc found in the area under view, and it is probable that a majority of villages will have at least a few tribalists living therein, mainly working as small o\vner-cultivators, or as agricultural laborers and quite frequently as both. The Bhumij are the most numerous group, followed by the Santals, while a few other groups with craft specialities also exist in very small numbers. One very a typical village (number 20), encountered on the outskirts of the small town of Hura, consisted exclusively of Santals who immigrated there two generations ago from Bankura. But, apart from this case, nowhere else (in the sampled villages) do tribalists, taken a1J together,. account for as much as a fourth of a village's population, while in only a few cases do they equal or approach an eighth.
.c. The Coalfields Area.-There is no sharp boundary between the area just described and the coal-mining sub-division of the Eastern Chota Nagpur study area. True, the great majority of collieries are concentrated north of the Damodar; but a few are also found on the right bank, while the zone to the south of the river, from which mine labor is extensively drawn, extends over a considerably wider area. Kurmis, the overwhelmingly dominant caste of Purulfii, though also important in Dhanbad to the north, may actua!ly be outnumbered there by the Tantis (weavers).
The terrain north of the Damodar. generally more steeply rolling and more verdant than the territory to the south, gives way along the northern border of Dllanbad District to a discontinuous range of mountains culminating in Parasnath Peak (the site of some magnificant Jain Shrines), some 4,500 feet above sea level. Agriculture Is practiced in much the same manner as In the area to the south. but is a bit more diversified. There is, however, no apparent supplementary conection of lac and wild silk.
U Aztuallv. there are two di .. trict blacksmith groups calling themselves Kamar, one of the tribalists who bITe taken to that work, and the other Hindu. thou~h perhaps of recent tribal origin. The former accounted for five anG tqe !~tter f<;>t" ten of the fjfteep villages. Both groupS (19 1\ pit of carpentry' 'Us Wen as b!flck~ItbiDS.

The great difference in the economy of the two areas is. of course, that stemming from coal mining and the coke and chemical industries based thereon. Coal-mining is carried out in two rich and separate fields, the larger and more productive of which, the Jharia Field, occupies much of southwest Dhanbad and overlaps slightly into PuruIia and, on the west, Hazaribagh. The Raniganj Field extending into <;outh
east Dhanhad and Pllrulia from the Burd· wan District of Bcn~a] lies just outside the study area.
ll5
The area of coal workings can be inferred fairly accurately, on Map 24, from the location of the dense rail network. Mining was unimportant prior to 1894 when the first rail link to the area was completed. Thc industry has grown steadily ever since and today hundreds of collieries support well over 100,000 workers, more than a third of all the coal miners in India. These miners. a large number of them women (who may, by law. only work above ground). are mainly from the district of Dhanbad itself. Many commute from villages some distance from the coalfield,>, often in pickUp trucks and buses provided by their employers. while others live in barracks-like company bustees among the collieries proper. their villages having been engulfed by the spreading mine complex. The number of immigrant workers, largely tribalists, living at the mines is also considerable.
Four coking plants have been opened up in the Jharia Field. These plants also produce a variety of chemical hy-products. 11'>
Tn addition, shortly after independence India's largest chemical complex wa<; begun at Sindri on the Damodar. Production ~gan in 1951. and today it i<; the lar!!est fertilizer plant in all of A~ia. as wen a~ a large producer of cement and a wide vnrietv of other chemical products. Expansion j<;
---_-_- - -- --
going on apace. Virtually all skilled and semi-~kiIled labour is brought in from other area'! of India, as is the case at lamshcd!"lor. The local job-seeking popUlation has had to content itself largely with menial jobs and sundry day labor, and formed only about a fifth of the more than 10,000 per.,ons regularly employed at the time of the author's visit.
Sti11 another of the rapidly growing exportable goods of the study area is electric power, the production of which is largely in the hands of the Damodar VaHey Corporation (D.V.C.), often referred to as rndia's T.v.A. This corporation W'IS
chartered in 1948 as an autonomous body to 'p'rovide for flood-control. irrigation, navigation, and power development in the Damodar River Basin, and, so far as power is concerned, in adjoining areas as well. Ito; integrated transmission grid has already reached north to Patna, capital of Bihar, south to Jamshedpur, and southeast to Calcutta. One of the principal generating plants (thermal) is at Sindri itself. while two others. at Maithon and Panchet Dams, also shown on Map 24, are already or are soon to he put into operation. For the most part. the benefits to be reaped from the D.V.C.. including all the irrigation. wi11 be downstream from the study arell. How cheap power wi1I eventually alter the economy within the <;tudy area is uncertain; but a" of the time of the author'" visit the visible effects were negligibleyJ.
With regard to the ethnic composition of the area it has already been noted that the weaver c!l-ste (Tanti) appears to rival the Kurmi for numerical superiority. Though encountered in only three of the seven villages. they formed a large majority in two: and local enquiry convinced the author that these were not mere chance case<;. Kurmis. who were found in live
11 There are no iron and c;teel industriall1nit~ in the area of the Jharia Field, but in the Raniganj area of Pl~tern nhanbad are a re-rolling mill and fahrication plant. while even larger unit~ are found further east in Kulti. RllrOW'l.n. A large ir '" and steel comrIe" is located also :It Durgapur. Hurclw:ln amI another mill ic; projected ror Habra.
" The n.v.c. ic; dic;cl1ssed at length in Hart's Nt'\!' rl/rli{l'~ RiH'rs, There nrc tQ\' TTlany c\t(ltions to list fn-1ividu:llly; hut the book is well-lnde'Ced.
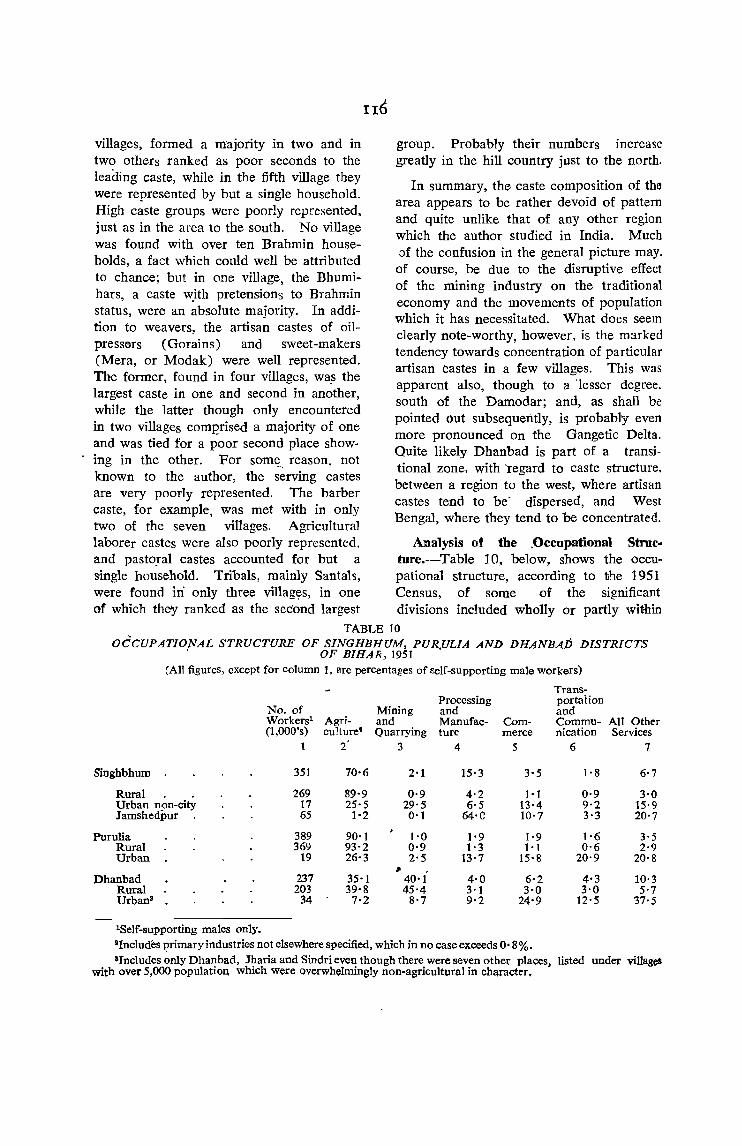
villages, formed a m:ajority in two and in two others ranked as poor seconds to the leading caste, while in the fifth village they were represented by but a single household. High caste groups were poorly represented, just as in the area to the south. No village was found with over ten Brahmin households, a fact which could well be attributed to chance; but in one village, the Bhumihars, a caste w_ith pretensions to Brahmin status, were an absolute majority. In addition to weavers, the artisan castes of oilpresst'>rs (Gorains) and sweet-makers (Mera, or Modak) were well represented. The former, found in four villages, wa.s the largest caste in one and second in another, while the latter though only encountered in two villages comp'rised a majority of one and was tied for a poor second place showing in the other. For somf?_ reason, not known to the author, the serving castes are very poorly represented. The barber caste, for example, was met with in only two of the seven villages. Agricultural
group. Probably their numbers increase greatly in the hill country just to the north.
In summary, the caste composition of tho area appears to be rather devoid of pattern and quite unlike that of any other region which the author studied in India. Much of the confusion in the general picture may.
of course, be due to the disruptive effect of the mining industry on the tradition al economy and the movements of population which it has necessitated. What does seem clearly note-worthy, however, is the marked tendency towards concentration of particular artisan castes in a few villages. This was apparent also, though to a 'lesser degree. south of the Damodar; and, as shall be pointed out subsequeIitly, is probably even more pronounced on the Gangetic Delta. Quite likely Dhanbad is part of a transitional zone, with 'regard to caste structure. between a region to the west, where artisan castes tend to be' dispersed, and West Bengal, where they tend to be concentrated.
laborer castes were also poorly represented, Analysis ot the .Occupational Struc~
and pastoral castes accounted for but a ture.--Table 10, below, shows the occu-single household. Tribals, mainly Santals, pational structure, according to the 1951 were found in· only three villagys, in one Census, of some of the significant of which they ranked as the second largest divisions included wholly or partly wit-hin
TABLE 10 OCCUPATIONAL STRUCTURE OF SINGHBHUM, PUR,ULIA AND DHANBAD DISTRICTS
. OF BIHAR, 1951 (All figures, except for column 1, are percentages of self-supporting male workers)
Trans-
No. of Processing portaHon
Mining and and Workers1 Agri- and Manufac- Com- Commu- All Other (I,OOO's) culture' Quarrying ture merce nication Services
1 2' 3 4 5 6 7
Singhbhum 351 70·6 2'1 15'3 3'5 l' 8 6'7
Rural 269 89'9 0'9 4'2 1'1 0·9 3'0 Urban non-city 17 25'5 29'5 6'5 13'4 9'2 15'9 JamshedilUr . 65 1'2 0'1 64·e 10'7 3·3 20·7
Purulia 389 90'1 1'0 1'9 1'9 1'6 3'5 Rural 369 93'2 0'9 1·3 1'1 0·6 2'9 Urban 19 26'3 2'5 13'7 15'8 20'9 20·8
~
Dhanbad 237 35'1 40'1 4'0 6'2 4'3 10·3 Rural 203 39·8 45'4 3'1 3'0 3'0 5'7 Urban' 34 7'2 8'7 9'2 24'9 12'5 37'5
lSelf-supporting males only. lInd udes primary industries not elsewhere specified, which in no case exceeds O' 8 %. 'Includes only Dhanbad, Jharia and Sindri even though there were seven other places, listed under villages
with over 5,000 population which were overwhelmingly non-agricultural in character.
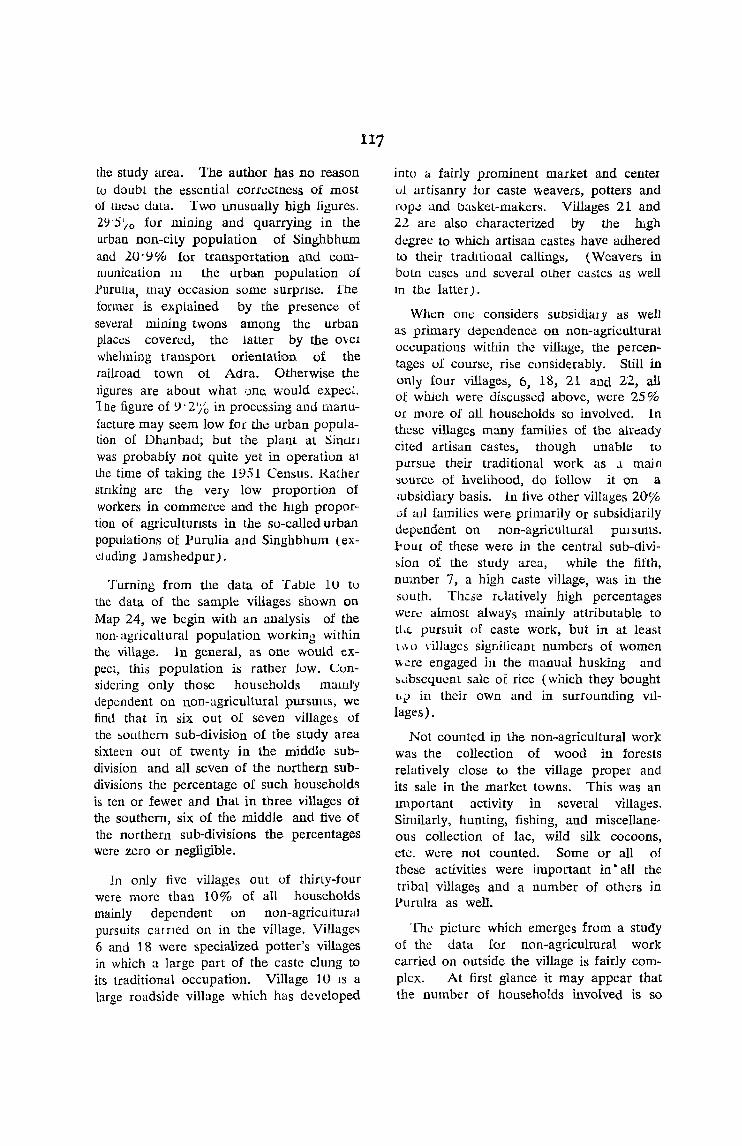
the study area. The author has no reason to doubt the essential correctness of most of tnc~c uata. Two unusually high figures. 2Y'5'/0 for mining and quarrying in the urban non-city population of Singhbhurn and 20' ~ % for transportation and communication III the urban population of .PurulIa, may occasion some surprIse. rhe former is explained by the presence of several mining twons among the urban places covered, the latter by the over whelming transport orientat~on of the railroad town 01 Adra. Otherwise tbe ligures are about what ,:me, would expecl. 1 he figure of 9' 2'i~ in processing and man ufacture may seem low for the urban population of Dhunbad; but the plant at Sinon was probably not quite yet in operation at the time of taking the 1951 Census. Rather strIking are the very low proportion of workers in commerce and the hIgh propor'· tion of agriculturIsts in the so-called urban populations of Purulia and SinghbhuJn (exduding J amshedpur) .
Turning from the data of T dble 1 U tu the data of the sample villages shown on Map 24, we begin with an analysis ·of the non· agricultural population working within the village. In general, as one would expect, this population is rather low. Cunsidering only those househulds maml)' Jependent on non-agricultural pmsUlls, we find that in six out of seven villages of the ~oulhcrn sub-division of the study area sixteen out of twenty in the middle subdivision and all seven of the northern subdivisions the percentage of such householdc; is ten or fewer and that in three villages oi the southern, six of the middle and five of the northern sub-divisions the percentages were zero or negligible.
In only five villages out of thirty-tour were more than 10% of all households mainly dependent on non-agricultural pursuits earned on in the village. Village" 6 and 18 were specialized potter's villages in which a large part of the castc clung to its traditional occupation. Village 1 U IS a large roadside village which has developed
117
into u fairly prominent market and center CJI artisanry ior caste weavers, potters and fOp": and ba~kel-makers. Villages 21 and 22 are also characterized lYy the lugh de.gree to w meh artisan castes have adhered to their traditional callings, (Weavers in botn case~ and several other castes as well In the latter) .
When one considers SUbsidiary as well as primary dependence on non-agricultural occupations within th(! village, the percentages of course, rise considerably. Still in only four villages, 6, 18, 21 and 22, all of which were discussed above, were 25 % or more of ail households so involved. In these villages many families of the already cited artisan castes, tbough unable to
pursue tbeir traditional work as .1 main source of llvelihood, do follow it on a mbsidiary basis. In live other villages 20% of all families were primarily Or subsidiarily dependent on non-agricultural pursUlts. l'OUI of these were in the central sub-divi~ion of the study area, while the fifth, number 7, a high caste village, was in the south. Th.::se rdatively high percentages wert: almost always mainly attributable to tl.c pursuit of caste work, but in at least 1" 0 villages signilicant numbers of women '" .:!rc engaged in the manual husking and ~dbscquent sale of rice (wi1ieh they bought t.._tl ill their own and in surrounding VIllages).
Not counted in the non-agricultural work was the collection of wood in forests relatively close to the village proper and its sale in the market towns. This was an Important activity in several villages. Similarly, hunting, fishing, and miscellaneous collection of lac, wild silk cocoons, etc. were not counted. Some or all of these activities were important in' all the tribal villages and a number of others in PurulJa as well.
The picture which emerges from a study of the data for non-agricultural work carried on outside the village is fairly complex. At first glance it may appear that the number of households involved is so
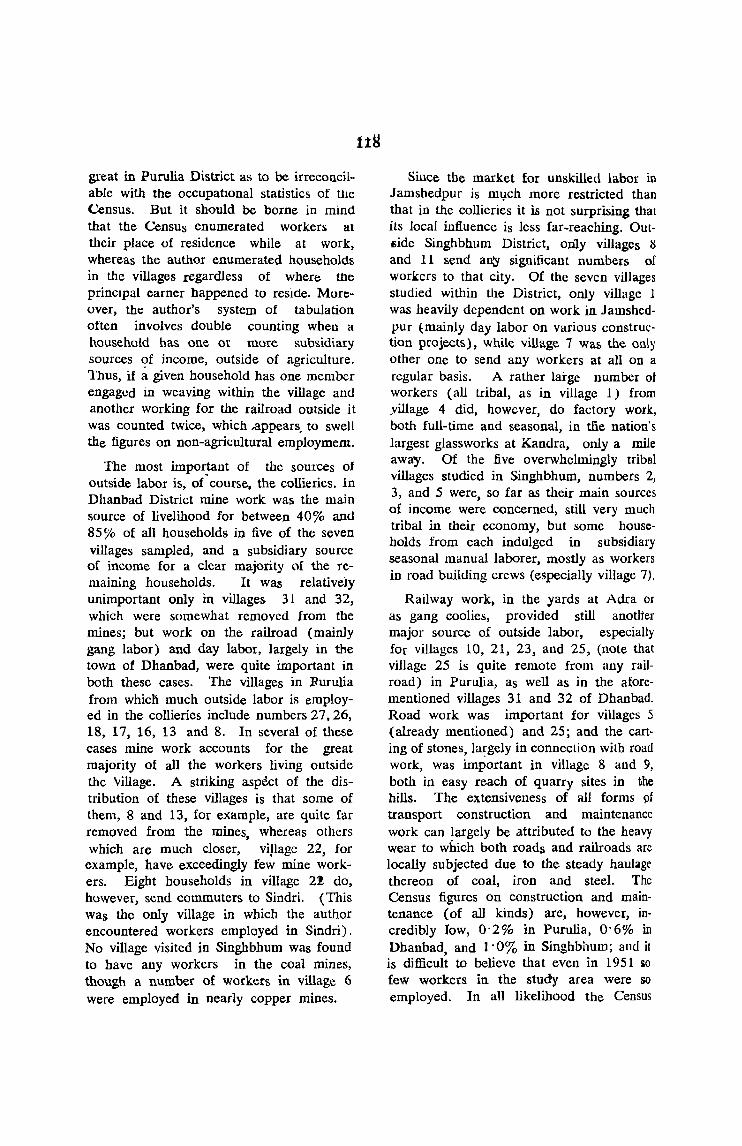
great in Purulia District as to be irreconcilable with the occupatIOnal statistics of tHe Census. But it should be borne in mind that the Census enumerated worker~ at their place of residence while at work, whereas the author enumerated households in the villages regardless of where the princIpal earner happened to reside. Moreover, the author's system of tabulation otten involves double counting when a household has one or more subsidiary sources C?f income, outside of agriculture. Thus, if a given household has one member engaged in weaving within the village and another working for the railroad outside it was counted twice, which ..appears, to swell the figures on non-agricultural employmem.
The most important of the sources of outside labor is, of-course. the collieries. in Dhanbad District mine work was the main source of livelihood for between 40% and 85 ro of all households in five of the seven villages sampled, and a subsidiary source of income for a clear majority of the remaining households. It was relativeiy unimportant only in villages 31 and 32, which were somewhat removed from the mines; but work on the railroad (mainly gang labor) and day labor, largely in the town of Dhanbad, were quite important in both these cases. The villages in Rurulia from which much outside labor is employed in the collieries include numbers 27. 26, 18, 17, 16, 13 and 8. In several of these cases mine work accounts for the great majority of all the workers living outside the 'village. A striking aspect of the distribution of these villages is that some of them, 8 and 13, for example, are quite far removed from the mines, whereas others which are much closer, village 22, for
example, have exceedingly few mine work-ers. Eight households in village 2! do, however, send commuters to Sindri. (This was the only village in which the author encountered workers employed in Sindri). No village visited in Singhbhum was found to have any workers in the coal mines, though a number of workers in village 6 were employed in nearly copper mines.
UH
Since the market for unskilled labor in J amshedpur is ml,lch more restricted than that in the collieries it is not surprising that its local influence is less far-reaching. Out-6ide Singhbhum District, only villages 8 and 11 send an;y significant numbers of workcrs to that city. Of the sevcn villages studied within the District, only village 1 was heavily dependent on work in Jamshcdpur ~mainly day labor on various construction projects), while village 7 was the only other one to send any workers at all on a regular basis. A rather large number ot workers (all tribal, as in village 1) from yillage 4 did, however, do factory work, both full-time and seasonal, in tlie nation's largest glassworks at Kandra, only a mile away. Of the five overwhelmingly tribal villages studied in Singhbhum, numbers 2, 3, and 5 were, so far as their main sources of income were concerned, still very much tribal in their economy, but some households from each indulged in subsidiary seasonal manual laborer, mostly as workers in road building crews (especially village 7).
Railway work, in the yards at Adra or as gang coolies, provided still anotlter major source of outside labor, especially for villages 10, 21, 23, and 25, (note that village 25 is quite remote from any railroad) in Purulia, as well as in the aforementioned villages 31 and 32 of Dhanbad. Road work was important for villages 5 (already mentioned) and 25; and the carting of stones, l~gely in connection with road work, was important in village 8 and 9, both in easy reach of quarry sites in the hills. The extensiveness of all forms pf transport construction and maintenance work can largely be attributed to the heavy wear to which both roads and railroads are locally subjected due to the steady haulage thereon of coal, iron and steel. The Census figures on construction and maintenance (of all kinds) are, however, incredibly low, 0'2% in Purulia, 0'6% in Dhanbad, and 1'0% in Singhbhum; and it is difficult to believe that even in 1951 so few workers in the study area were so employed. In all likelihood the Census
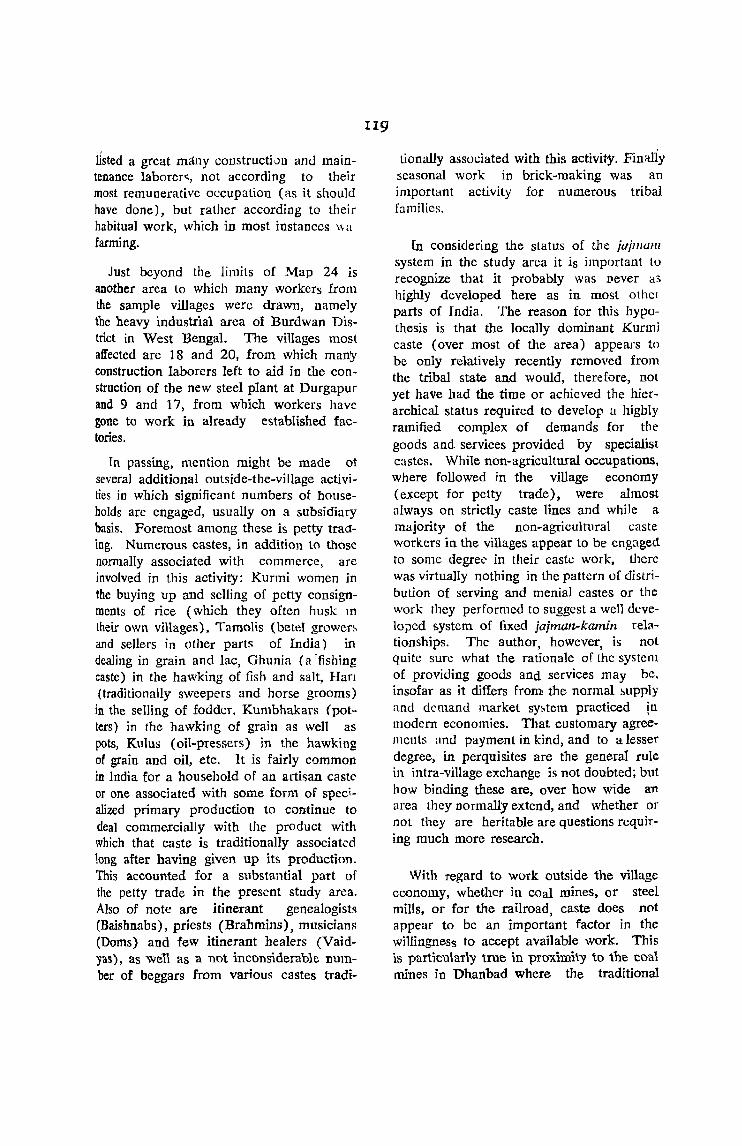
listed a great many constructiun and maintenance laborer .. , not according to their most remunerative occupation (as it should have done), but rather according to their habitual work, which in most instanccs \\ a farming.
Just beyond the limits of Map 24 is another area to which many workers from the sample villages were drawn, namely tbe heavy industrial area of Burdwan District in West Bengal. The villages most affected are 18 and 20, from which many construction laborers left to aid in the construction of the new steel plant at Durgapur and 9 and 17, from which workers have gone to work in already established factories.
Tn passing, mcntion might be made ot several additional outside-the-village activities in which significant numbers of households are engaged, usually on a subsidiary basis. Foremost among these is petty tracting. Numerous castes, in addition to those normally associated with commcrce, are involved in this activity: Kurmi women in the buying up and selling of petty consignments of rice (which they often husk: m their own villages). Tamolis (betd grower~ and sellers in other parts of India) in dealing in grain and lac, Ghunia (a "fishing caste) in the hawking of fish and salt, Han (traditionally sweepers and horse grooms)
in the selling of fodder, Kumbhakars (potters) in the hawking of grain as well as pots, Kulus (oil-pressers) in the hawking of grain and oil, etc. It is fairly common in India for a household of an artisan caste or one associated with some form of specialized primary production to continue to deal comme.rcially with the product with which that caste is traditionally associated long after baving given up its production. This accounted for a substantial part of the petty trade in the present study area. Also of note are itinerant genealogists (Baishnabs), priests (Brahmins), musicians (Doms) and few itinerant healers (Vaidyas) , as we" as a not inconsiderable number of beggars from various castes tradi-
II9
tlonally associated with this activity. Finally seasonal work in brick-making was an important activity for numerous tribal families.
In considering the status of tIle jlljlllum system in the study area it is important tu recognize that it probably was Dever as highly developed here as in most othel parts of India. The reason for this hypothesis is that the locally dominant Kurmi caste (over most of the area) appears to be only relatively recently removed from the tribal state and would, therefore, not yet have had the time or achieved the hierarchical status required to develop u highly ramified complex of demands for the goods and services provided by specialist castes. While non-agricultural occupations, where followed in the village economy (except for petty trade), were almost always on strictly caste lines and while a majority of the non-agricultural caste workers in the villages appear to be engaged to some degree in their caste work. there was virtually nothing in the pattern of distribution of serving and menial castes or the work they performed to suggest a well developed system of fixed jajman-kamin re13-tionships. The author, however, is not quite sure what the rationale of the system of providing goods and services may be, insofar as it differs from the normal !Iupply and demand market sy~tem practiced in modern economies. That customary agreeI11cnts and payment in kind, and to a lesser degree, in perquisites are the genera! rule in intra-village exchange is not doubted; but how binding these are, over how wide an area they normally extend, and whether or not they are heritable are questions requiring much more research.
With regard to work outside the village economy, whether in cOal mines, or steel mills, or for the railroad, caste does not appear to be an important factor in the willingness to accept available work. This is particularly true in proximity to the eoa1 mines in Dhanbad where the traditional
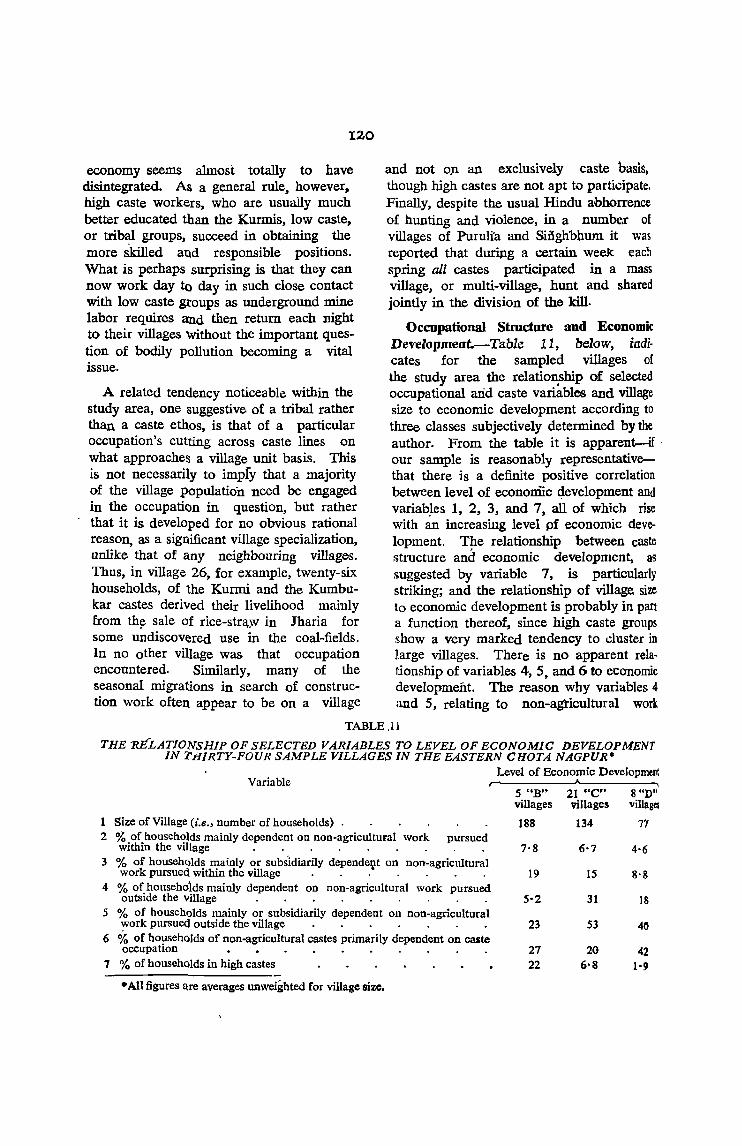
120
economy seems almost totally to have disintegrated. As a general rule, however, high caste workers, who are usually much better educated than the Kurmis, low caste, or tribal groups, succeed in obtaining the more skilled and responsible positions. What is perhaps surprising is that they can now work day to day in such close contact with low caste Stoups as underground mine labor requires and then return each night to their villages without the important question of bodily pollution becoming a vital issue.
and not O.D an exclusively caste basis, though high castes are not apt to participate. Finally, despite the usual Hindu abhorrence of hunting and violence, in a numbe.r of villages of Purulla and Siiigh'bhum it was reported that duri,Jlg a certain week each spring all castes participated in a mass village, or multi-village, hunt and shared jointly in the division of the kill.
Occupational Structure and Economic Developmeut.-TabZe 11, below, iudi· cates for the sampled villages of the study area the relation,ship of selected
A related tendency noticeable within the occupational arid caste variables and village study area, one suggestive of a tribal rather size to economic development according to than a caste ethos, is that of a particular three classes subjectively determined by the occupation's cutting across caste lines on author. From the table it is apparent-if what approaches a village unit basis. This our sample is reasonably representative-is not necessarily to impfy that a majority that there is a definite positive correlation of the village population need be engaged between level of econoniic Qevelopment and in the occupation in question, but rather variab~es 1, 2, 3, and 7, all of which rise that it is developed for no obvious rational with an increasing level pf economic deve-reason, as a significant village specialization, lopment. The relationship between caste unlike that of any neighbouring villages. :otructure and economic development, as Thus, in village 26, for example, twenty-six suggested by variable 7, is particularly households, of the Kurmi and the Kumbu- striking; and the relationship of village size kar castes derived their livelihood mainly to economic development is probably in part from th~ sale of rice-str~~ in Jharia for a function thereof, since high caste groups some undiscovered use in the coal-fields. show a very marked tendency to duster in In no other village was that occupation large villages. There is no apparent rela-encountered- Similarly, many of the fiouship of variables 4, 5, and 6 to economic seasonal migrations in search of construc- development. The reason wby variables 4 tion work often appear to be on a vi11age and 5, relating to non-agricultural work
TABLE .11
THE "RELATIONSHIP OF SELECTED VARIABLES TO LEVEL OF ECONOMIC DEVELOPMENT IN 'l'flIRTY-FOUR SAMPLE VILLAGES IN THE EASTERN CflOTA NAGPUR*
Variable
1 Size of Village (i.e., number of households) 2 % of households mainly dependent on non-agricultural work pursued
within the village _. _ . . . _ . 3 % of househOlds mainly or subsidiarily dependent on non-agricultural
work pursued within the village . . .' . . . . 4 % of households mainly dependent on non-agricultural work pursued
outside the Village . . . . _ . . . . 5 % of households mainly or subsidiarily dependent on non-agricultural
work pursued outside the village . . _ . . . . 6 % of hO!lseholds of non-agricultural castes primarily dependent on caste
occupatIon 7 % of househOlds in high castes
• All figures a.re averages unweighted for village size.
Level of Economic Development
S "B" 21 "COO 8 "D" villages villages village!
188 134 77
7'8 6·7 4·6
19 IS 8-S
S·2 31 18
23 S3 40
27 20 42 22 6·8 1·9
outside tlhe village, score so high among the "C" type villages is because all the villages in the coal-mining area happen to fall within that category. The "D" type villages score higher than the "B" type because of their relatively much higher dependence on outside construction labor, often on a seasonal basis, or sundry day labor, Variable 6, at first glance, is rather pUzzling. Although the figures for the "B" and ccC' villages seem to ooar the proper relationship to {lne another, the figure of 42% for the "D" villages seems much too hi~h. There would appear to be two reasons for this: first, the number of households in non-agricultural castes in these generally overwhelmingly tribal and Kurmi villages was very low to begin with, so that a high percentage of such families in their traditional caste work would still be a small number in absolute terms; and second, a fairly large proportion of the non-agricultural castes in the villages concerned possessed such traditional, poorly remunerated occupations as basketry and weaving, the demand for which does not reflect prosperity and high demand within the village proper, since the products of both are hawked about the countryside.
Central Uttar Pradesh
(Map 25)
General Background.-This study area contained much the largest sample of villages of any visited by the author in India, 48 out of the total of 198. The particular problem which was of interest here was that of determining the effects the two large and greatly varying cities of Kanpur and Lucknow had on the villages of the surrounding relatively homogeneous terrain of the middle reaches of the Gangetic Plain and of explaining any contrasts found. Kanpur (1951 population 705,000), the major industrial center of all North Central India, dominates the southwestern half of the study area, while Lucknow (popttlation 497,000), the capital of India's most popuIQUs State, Uttar Pradesh, is the focal point
of the northeast. Each city owes its existence, not to the productivity of its immediate hinterland, but rather to the fact that it serves a vastly greater area. No other large town (i.e .. with over 50,000 population) or city lay within the study area or even sufficiently close to exert a strong independent urban influence. The only other towns of any note were the district headquarters of Unnao (25.000) and Bara Banki (or Nawabganj) (23,000). located approximately ten and fifteen miles resoectively from Kanpur and Lucknow. All four places are strung along a major road transverse to the general trend of the drainage (Ganges, Gagra, Jumna and Gumti Rivers). the Grand Trunk Road, and the Main Line of the Northern Railroad.
Apart from the obvious factors of degree of urban proximity and ethnic composition, which wi11 be discussed shortly, the most important differentiating characteristics of the area relate to drainage (including irrigation) and soil. Tn general, areas bordering the maior streams are susceptible to annual flooding, sometimes of serious proportions, during the rainy season but are not susceptible to canal irrigation, while the opposite holds true in each case for most of the remaining terrain. For much of its length in the study area the predominantly sandv riverain along the Ganges is separated from the older alluvium Hv a steep bluff, as much as a hundred feet high. Elsewhere and along other rivers, the transitions are less abrupt. Severe gullving back of the riverain edQ"e has in many area'S !liven a badlands aspect to the terrain. (The lamest rtrea of highly dissected terrain lies near the Jumna at the southwestern ex~ trerne of the study area.) On the broad. flat to gentlv llr,...lulating d()ab~ cornnrisin!! the greater part of the studv area. !<oils'VaTV from sflncl on the swells. throu!!h loams (m
thf' l('v~l stretche<;. to clav in the swale<:. Fairlv 1arge tracts of relativelv barren "oile; (usar). on which a snarSe srruhbv brest (dhnk) i<: ~110wecl tn grow arf' mi'Ced :)rnonl"! the !!enerallv fertile loarns. These arc cornmonl"!r and somewhat greater in extent in the lcs~ humid southwest than in the north-
122
east, where stately village groves of fine__, mangoes and other deciduous' trees ar~ a more charactet:istic and appealing feature of the landscape.
Rural popUlation densities in ite study area increase gradually with rainfall from southwest to northeast: 520 per square miles in Kanpur, 564 in Unnao, 641 in Lucknow, and 686 in Bara Banki, all wen below the phenomenally high figures attained in mo~t of the North Bihar Plain ilnd the Gangetic Delta. There is still, fortun~ately, some room for expansion, most notably by the extension of irrigation (canal irrigation probably has approached its limits, but well irrigation still holds considerable promise), increased double cropping and cash cropping, and reclamation of 'U~aT and once irrigated jands which have ~me excessively saline. Happily, to'o, the area is one with a high degree of independent ownership of lan~, especially since the enactment of the Zamindiiri Abolition Act of 1952. .;;.
The area is "thus, not one of great land hunger; -nor is '-it one in which agriculture
.. is highly commercialized. The amount of surplus grain produced is lfar short of that required to supply the needs of the urban pqpulation. Although "the area has among the ~.q.st diversifi~d cropping patterns in India .. carlI Crops are fairly limited. Sugarcane,-the most impo.rtant of these, is grown l}l sufficient amounts to~ support two fairsized trims ill" Bara Banki District (there were no others in the study area at the time .... of the. author's visit); oil seeds are grown in modest amounts -for- sale; market gardef1-inl? has some <importance near the citi~: and several small, rather :!;neciaUzed areas of high quaIitv mango and ,!!llava cultivation exist not far west of L1.1Cknow .' .
Agricultural technology is on the upgrade. Iron ploughs and chaff cutte:-s a~d motorized flour mills, canecrushers, ane! oi1-expellers are increasingly 1n use. Cooperative Ilocieties for the extension of
rural credit, the purchase of improve.d seed, and marketing (of dairy products, among others) are being ~ctively and successfully fostered by the. tommunity Development Administration.
Villages with important non-agricultural specialities are rather rare. In a few, somt" old artisan trade such as weaving or brassmaking has persisted or been resuscitated through government aid; but at no time in the recent history of ihis area do 'mch specialized villages appear to have been very numerous. Form~rly, however, specialized embroidery of luxury c10th for the court of Lucknow and for the more aflluent lancfowners provided an important subsidiary source of income for numerous villages east and southeast of that city.
. The pattern of settlement is one of wen,. spaced, highly nucleated. predominantly
adobe villages. The average. vniage popu. lation is only around 600; and well over
~
half the total have fewer. than 500 inhabi-tants. Villages with over. .2.000 inhabitants a'tcount for only about six or seven per cent of the total number and about a seventh of the niral popUlation. the proportion oeing lea'St (about a tenth) in leanpur District. Larger: villages offen have moderately important commercia] functions especially those in which a weeklv or biweekly open-air market (mandi) is held. Smaller villages, too, howeV'et, occasionaDv .contain large numbers Qf trading households. The town population, 011tside of the four district capitals 1S virtnallv ne~li-.,gible. ' --
In terms of religion the study area is overwhelminglv Hindu. The Muslim pcipU
lation varies from about a tenth of the total in Kanpur District to about a fifth in Lucknow and Unnao. In nara Banki they comprise about a sixth.. The prooort;t")ns are much hicrryer. however. in the cities anrl towns than for the entire districts: 30 per cent in ~"e citv of Lucknow and 22 per cent in tho city of Kanpur. Relatively few Muslims emigrat~d .to west
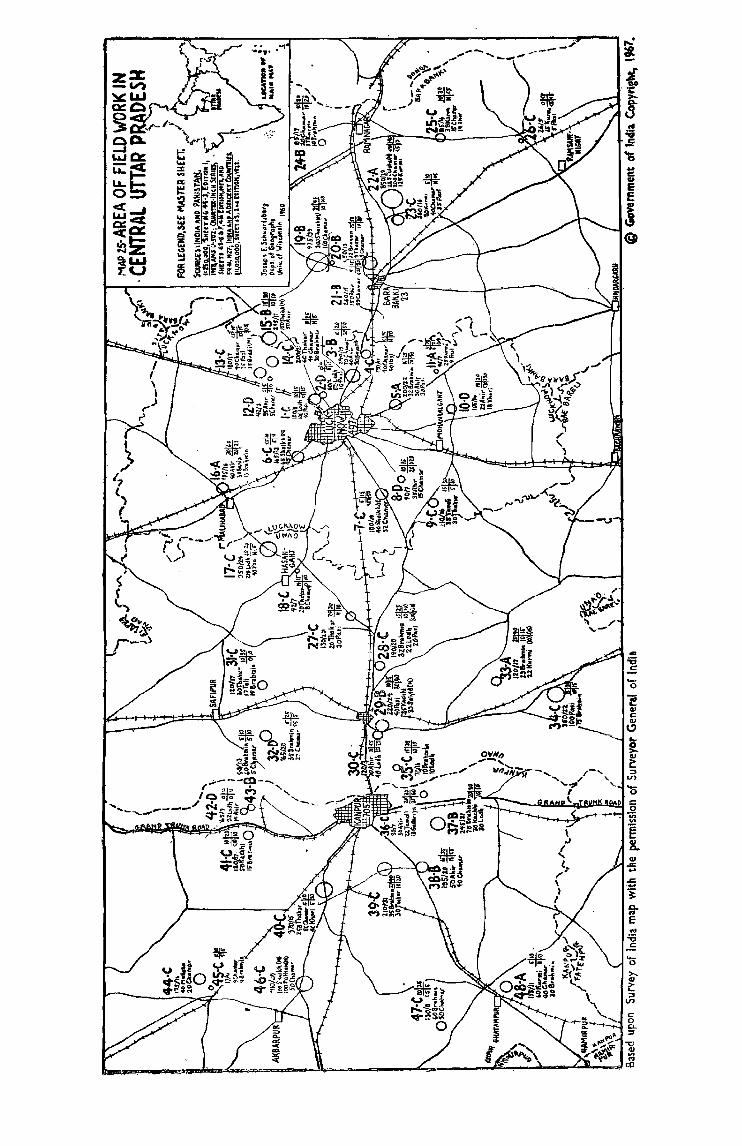
...... __ -.,iI-
Ccv E .. ;:; c:
._ o
"'0
~BQ~~~~a.~Qa~~~~~~~~~-a~~~~~ __ ~ ______ ~~ ________ ~~~~~~--aM~~L:~~~

Pakistan since partition; but over 75,000 displaced persons entered the area in the same period, nearly two-third~ settling in the city of Kanpur and the great majority of the remainder in the city of Lucknow. Among these are a significant minority of Sikhc;. The entrepreneurial element among the displaced persons is quite important.
The caste composition of the area is exceedingly articulated and there is no single pattern common to the entire region. Nor was the author able to discern any clearly defined subregional patterns. It is possible. nevertheless, to state a number of generalization relating to the study 'area as a whole:
First, and probably most important, is the tact that over no extensive zone within the area does there appear to be any clearly dominating group(s) in terms either of absolute numberc; or of concentration of economIc power. Out of a'total of sixtyeight castes encountered in the area, no fewer than fourteen were the largest group present in at least one of the forty-eight sample .. mages. These included castes In the high, middle and low ranges of the caste hierarchy. and castes of both Hindu and Muslim persuasion.
Second. the average number of caste~
per village, relative to village size, was usually quite high. definitely higher than in any other study area. The average for the entire sample was eighteen.
Third, the great majority of households of the principal high castes, BrahmIns. Kayasths. Thakurs. and. less importantly. Banias. and. among the Moslems, Sheikhs. Pathans and lese; importantly, Saiyyids. tended to he clustered in a relatively small number ·i)f villages. Still wme Brahmins were found in thirty-c;cven of the sampled villages forming the largec;t group in ten.
Thakurs (Raj puts, traditionally warriors and landlords) were found in twenty-four villages, of which they were the largest group in five. High caste Muslims were the dominant caste in five villages, of which two (19 and 46) are quite large.
Fourth, the most-important castes of menials and agricultural laborers, namely the Chamars and the Pas is tended to be ubiquitous. These were found in fortyseven and thirty-eight villages respectively. The Chamars are much the most numerouo; group in the study area. forming about an eighth of the entire population. One of the most numerous castes in the whole of India. they occupy a somewhat ambivalent position in the caste structure, though their degraded hierarchical status ie; not in doubt. Traditionally leather workers. removers of carrion and flayers and tanners of hides, they are much too numerous in most of the areas in which they are found to derive much of their livelihood from such occupations. Hence. in practice they are mainly agricultural laborers and have been so for so long that one is now tempted to state that, that is their true customary occupation. Chamars were the most numerous caste in four villages and the s(>rolld most numerous in twenty-one others.1'T Pasis were the largest group in three village" and second largest in seven.
Fifth. CUltivating castes (as opposed to arncultural laborer castes), taken a!> a whole. were ubiquitous. though no single caste was found in more than half the sample villages. The largest and most widely distributed of these castes. the Lodhs, and the second ranking. more concentrated, and. incidentallv. much more prosperous group, the Kurmis, tend to be mutually exclusive. Where one is fonnd in large numbers the other is mually ahsent or represented by only a few households.18
" The ~eCO'1J ra'lk in the villa~ i~ 1 oosition which the Chamars (or their local eauivalent under a different region'll '1am~) tends to occupy in all are3~ of Tndia in which the writer has met with them although they are not infrequently first. • .
\iut'la) e"clusivenes~ of yeoman ca~tes i~ also ch'\racteri~tic of other 311'En of India. apparently incrcssing to the Northwest The wnter has, however. never come across ~ntion of thi~ phenomenon in the literature.
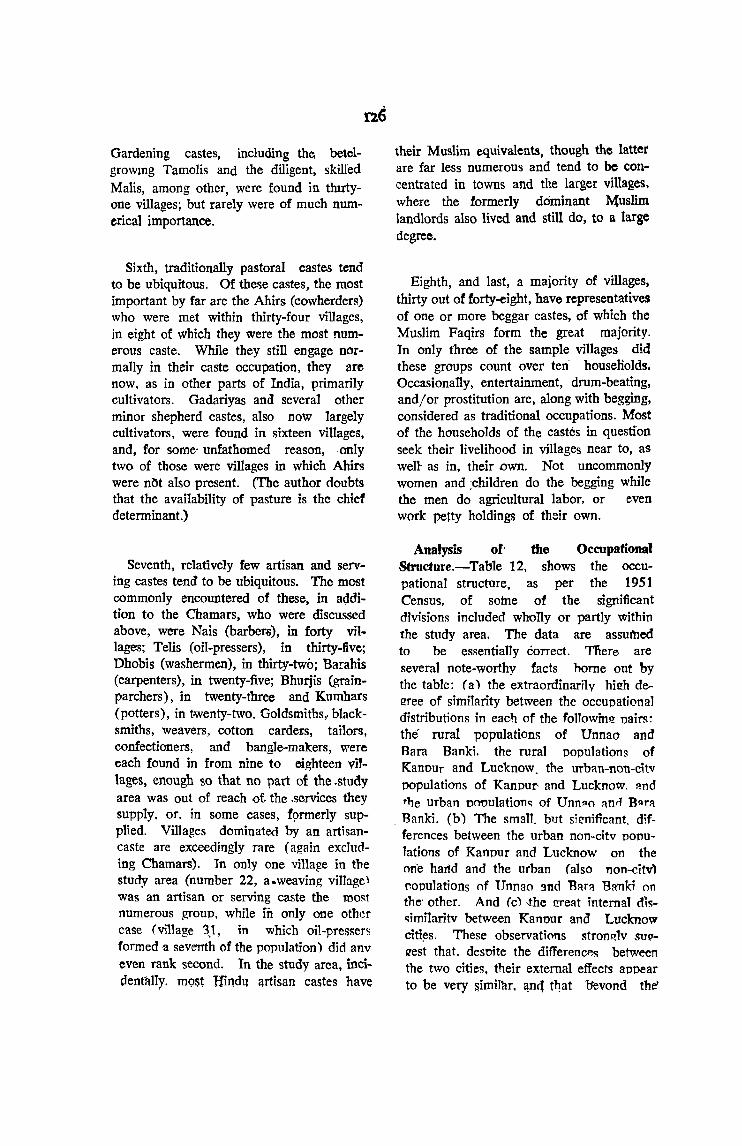
Gardening castes, including the betelgrOWIng Tamolis and the diligent, skilled Malis, among other, were found in tlurtyone villages; but rarely were of much numerical importance.
Sixth, traditionally pastoral castes tend to be ubiquitous. Of these castes, the most important by far are the Ahirs (cowherders) who were met within thirty-four villages, in eight of which they were the most numerous caste. While they still engage normally in their caste occupation, they are now, as in other parts of India, primarily cultivators. Gadariyas and several other minor shepherd castes, also now largely cultivators, were found in sixteen villages, and, for some' unfathomed reason, .only two of thos,e were villages in which Ahirs were not also present. (The author doubts that the availability of pasture is the chief determinant.)
Seventh, relatively few artisan and serving castes tend to be ubiquitous. The most commonly encountered of these, in addition to the Chamars, who were discussed above, were Nais (barber6), in forty villages; Telis (oil-pressers), in thirty-five; Dhobis (washermen), in thirty-two; Barahis (carpenters), in twenty-five; Bhurjis (grainparchers), in twenty-three and Kumhars (potters), in twenty-two. Goldsmitbs~ blacksmiths, weavers, cotton cardets, tailors, confectioners, and bangle-makers, were each found in from nine to eighteen villages, enough so that no ?3.rt of the .study area was out of reach of. the .services they supply, or. in some cases, f9rmer1y supplied. Villages dominated by an artisancaste are exceedingly rare (agalD excluding Chamars). In only one village in the study area (number 22, a.weaving village' was an artisan or serving caste the mo!\t numerous group, while in only one other case (village 3.1, ;n which oil-pressers formed 'cl seventh of the population) did anv even rank second. In the study area, inclcIent~l1y, m9st Hindll &rtisan castes have
their Muslim equivalents, though the latter are far less numerous and tend to be concentrated in towns and the larger villages, where the formerly dOminant Muslim landlords also lived and still do, to a large degree.
Eighth, and last, a majority of villages, thirty out of forty-eight, have represent::ttives of one or more beggar castes, of which the Muslim Paqirs form the great majority. In only three of the sample villages did these groups count over ten" houseliolds. Occasionally, entertainment, drum-beating, and/or prostitution are, along with begging, considered as traditional occupations. Most of the households of the castes in question seek their livelihood in villages near to, as well as in, their own. Not uncommonly women and :children do the begging while the men do agricultural labor, or even work petty holdings of their own.
Analysis of' the Occopational Structure.-Table 12, shows the occupational structure, as per the 1951 Census, of some of the significant divisions included wholly or partly within the study area. The data are assumed to be essentially correct. TIlere are several note-worthy facts borne out by the table: (a) the extraordinarily high de!!Tee of similarity between the occupational distributions in eaoh of the folJowin!! pairs: the rural populations of Unnao and Rara Banki. the rural populations of Kanpur and Lucknow. the UTban-non-dtv populations of KanpuI" and Lucknow. :lnd the urban uo'Oulationc; of Unn::1o anrl B<ll'lt
Banki. (b) The small. but silmiflcant. differences between the urban non-citv DOPU
Tations of Kanpur and Lucknow on the on'e harld and the urban (also non-city) oooulations nf Unnan 3nd Bara Banki nn the' other. And (c) -the great internal d~!!
c;imitaritv between Kanour and Lucknow citi~s. These observations stronl!lv su(J!Zest that. despite the differenc~s between the two cities, their elttemal effects appear to be very Ijimil'br, l\1lq tl!at l1evond the'
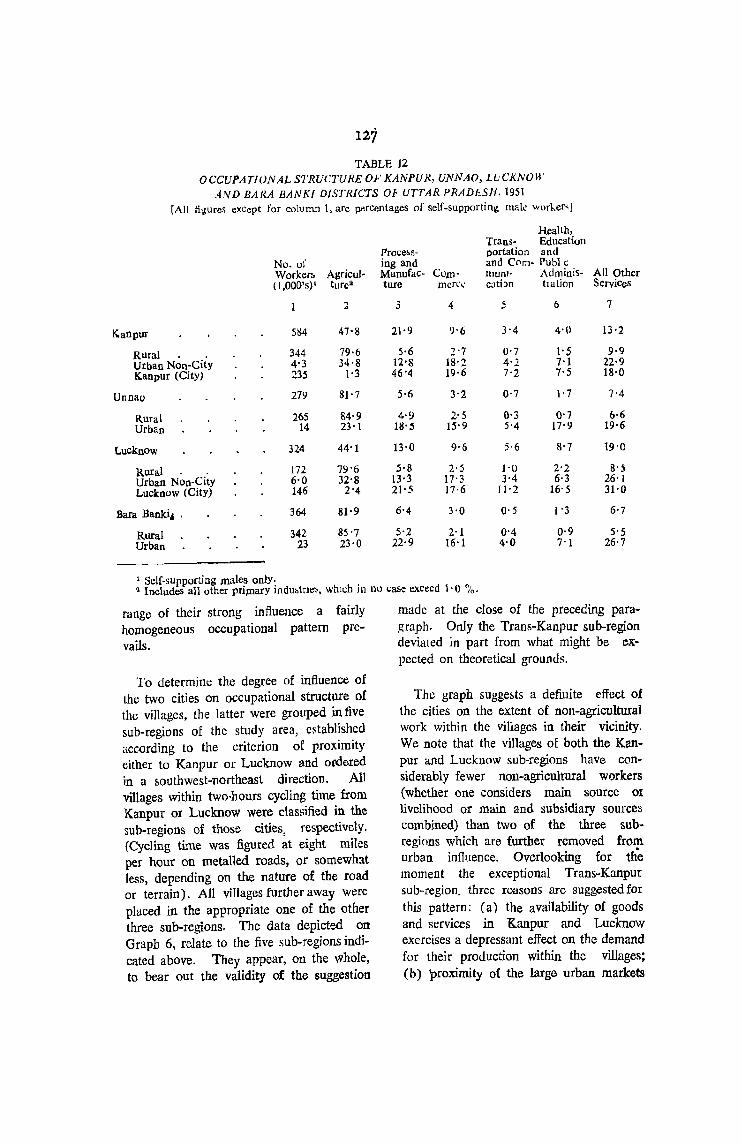
lz1 TABLE 12
OCCUPATWNAL STRUCTURE OF KANPUR, UNNAO, LL'CKNVW AND BARA BANKl DISTRICTS Of UTTAR PRADESH, 1951
[All figures except for column 1, arc percentages of self-supporting rna!.: worker~l
Health, Trans- Education
ProcC!>s- portation and No. 01 ing and and Com- Publ c Workerf> Agricul- Manurac- Com- mUnJ- Adminis- All Other (I,OOO's)' ture2 ture mcn:c cati:m traUon Services
J 3 4 5 () 7
Kanpur 584 47'8 21'9 9-6 3-4 4'0 13'2
Rural 344 79·6 5·6 2-7 0'7 l' 5 9-9 Urban Non-City 4-3 34'8 12'8 18'2 4'2 7'1 22-9 Kanpur (City) 235 1-3 46'4 19·6 7-2 7-5 18-0
Unnao 279 81-7 5-6 3-2 0-7 1- 7 7-4
Rural 265 84-9 4-9 2-5 0-3 0-7 6,6 Urban 14 23'1 18'5 15-9 5-4 17'9 19-6
Lucknow 324 44-1 13'0 9-6 5-6 g'7 19-0
Rural 172 79'6 5'8 2'5 }-o 2-2 8'5 Urban Non-City 6'0 32'8 13'3 17-3 3-4 6'3 26' J Lucknow (City) 146 2'4 21'5 17·6 11-2 16-5 31'0
Bara BanIci" . 364 81'9 6'4 3-0 0'5 1 '3 6'7
Rural 342 85-7 5-2 2'1 0'4 0-9 5'S Urban 23 23'0 22·9 16'1 4'0 7-1 26'7
1 Self-supporting males onlY· ~ IncludeS all other primary indmirIe~, Whll:h in no case exceed 1· 0 %.
range of their strong influence a fairly homogeneous occupational pattern prevails.
To determint: the degree of influence of the two cities on occupational structure of the villages, the latter were grouped in five sub-regions of the study area, established according to the criterion oj' proximity either to Kanpur or Lucknow and ordered in a southwest-northeast direction. All villages within two·hours cycling time from Kanpur or Lueknow were classified in the sub-regions of those cities, respectively. (Cycling time was figured at eight miles per hour on metalled roads, or somewhat less, depending on the nature of the road or terrain). All villages further away were placed in the appropriate one of the other three sub-regions. The data depicted on Graph 6, relate to the five sub-regions indicated above. They appear, on the whole, to bear out the validity of the suggestion
made at the close of the preceding paragraph. Only the Trans-Kanpur sub-region deviated in part from what might be expected on theoretical grounds.
The graph sugge1>ts a definite effect of the cities on the extent of non-agricultural work within the villages in their vicinityWe note that the villages of both the Kanpur and Lucknow sub-regions have considerably fewer non-agricultural workers (whether one considers main source 01 livelihood or main and subsidiary sources combined) than two of the three subregions which are further removed from urban influence. Overlooking for the moment the exceptional TranswKanpur sub-region, three reasons are suggested for this pattern: (a) the availability of goods and services in Kanpur and Lucknow exercises a depressant effect on the demand for their production within the villages; (b) 'proximity of the large urban markets
MCfROP<M.ITAN PAOJUM~TY IN R6.L.ATlON TO OCC.UPATIONAL &TRUcrUA.E ANO SE.L£CT£.D OTHER VARIABL.ES IN A SAMPLE OF FORTY EIGHT VtI.LAG£$I'N FIvE SUB"'REGIONS OF CENTRAt. UTTAA PAAO!$M.·
II \ So W. N. E.
L / \ /
;" \ /1
I.e. , .~ ,
,..~ ~ \
\ / ~ ,
~,... ),. ''7-' I Be ,
" ... , , '\ -', .' . . .... .~ I 'It~ .,,' //
" t.A ;X ~'/< K #~
In.s .. /' " . " ", III I "
, .. " V ' ........ '" I.A. ,_... .... -. j'ot,- " lA.
.,...- -_ 10-' tI.A ,.._ .... -_ ,..
I I
0 TRANS- KANPUR INTER- LVCICNOW TRANS' KANP~ . METRO- CI(N loU OW ttAME 0 F SU8REG ION
• POl.lTAM
NO. OF SAMPLEO "'1~LAdES S .. to .. uu.A.GE 01$ TANce ~OM
~l
CItY CO~:E (eyclt Hr •• ) a.. t..I
lvt~"GE VU.LAG! Slt& ~. of ttovs*hh) I" 119 170 lSI HI
°4 H·t~H C.AS t E (HOttI.· "ol~.) ~2 21 3Q ., AVERAGe DEVELOPMENT UTINCi (Sec Tell') 1.4 I., I., t,'
* Alt. f' ....... ar.' tI" •• ithttCl .for W'iU ... ·'iu.
of Kanpur and Lucknow and the higher purchasing power of city dwellers lures many artisans, hawkers, and other nonagriculturists away from the villages; and (c) the diffusion of urban modes of thought into the villages roundabout has somewhat weakened the traditional system of ties therein between jajmans and non-agricultural kamins, thereby forcing many of the latter to seek supplementary outside urban work.
The author is not sure why the five villages of t11C trans-kanpur sub-region did not show a rise in non-agricultural workers over that of the Kanpur sub-region. It is reasonably certain from the data given below the graph that it cannot be explained by reference to the caste structure or to the average degree of development prevailing within the villages proper, or to the average village size. What is most likely is that the smaIl, strung-out sample of villages (numberf> 44 to 48) was simply not representative of the region as a whole. (Of course, one cannot 'be sure that the larger samples for the other areas were representative, though the conformity of results to expectations leads on· to conclude that such is the case).
The data for households dependent on non-agricultural work outside the village are remarkably in accord with what one might expect on an a priori basis. In the Kanpur and Lucknow sub-regions the percentages rise above those of the remaining three sub·regions. What may, however, occasion some surprise is the lact that the rise for the Lucknow sub-region, especially with regard to the main source of livelihood, is considerably greater than that for the Kanpur sub-region, even though the metropolitan foeus of the latter area is the greater of the two. Several reasons for this may be cited: first, the sampled villages in the former area were appreciably closer to the city on the average than in the latter ( 1'1 versus l' 5 hours away). Second, a much larger share of the factory
workers of Kanpur are outsiders (i.e., from distant locales) now permanently resident in housing provided by the millowners than if> the case among government employees who form the backbone of the labour force in Lucknow. Third, Kanpur's double factory shift, one beginning quite early in th.! morning and the other ending late in the evening, renders commuting extremely difiicult, whereas the short government work day beginning at 10 A.M.
facilitates commuting.
A final word on the comparison of. villages in the several sub-regions: from all considerable variety for reasons other than the graph seem to be clearly related to village size, percentage of households in high castes, or average development rating, tor which the figures are also given. This is not to say that those variables are irrelevant, but [[ltber that their effects, when measured against the effect of urban proximity, tend to be obscuTed.
Considenng the area as a whole, the occupational structures of the villages show considerable vruiety for reasons other than that of proximity to Kanpur or LuckJlow. We may conveniently begin with nonagricultural work performed mainly Within the village as a principal means of livelihood. Households deriving their prindpal income from such work numbered between five and fifteen per cent in two-thirds of all villages sampled. In eight the per-' centage was higher and in the eight remaining the percentage was lower. The unweighted average for the entire sample was around eleven per cent.
In seven of the eight villages with low percentages this was simply due to the shortage tht.:t"ein of the artisan and serving castes whose services are most universaHy in demand. In the eighth case (village 2S), the low proportion of households mainly dependent on non-agricultural pursuits was more than made up for by the high percentage subsidiarily dependent.
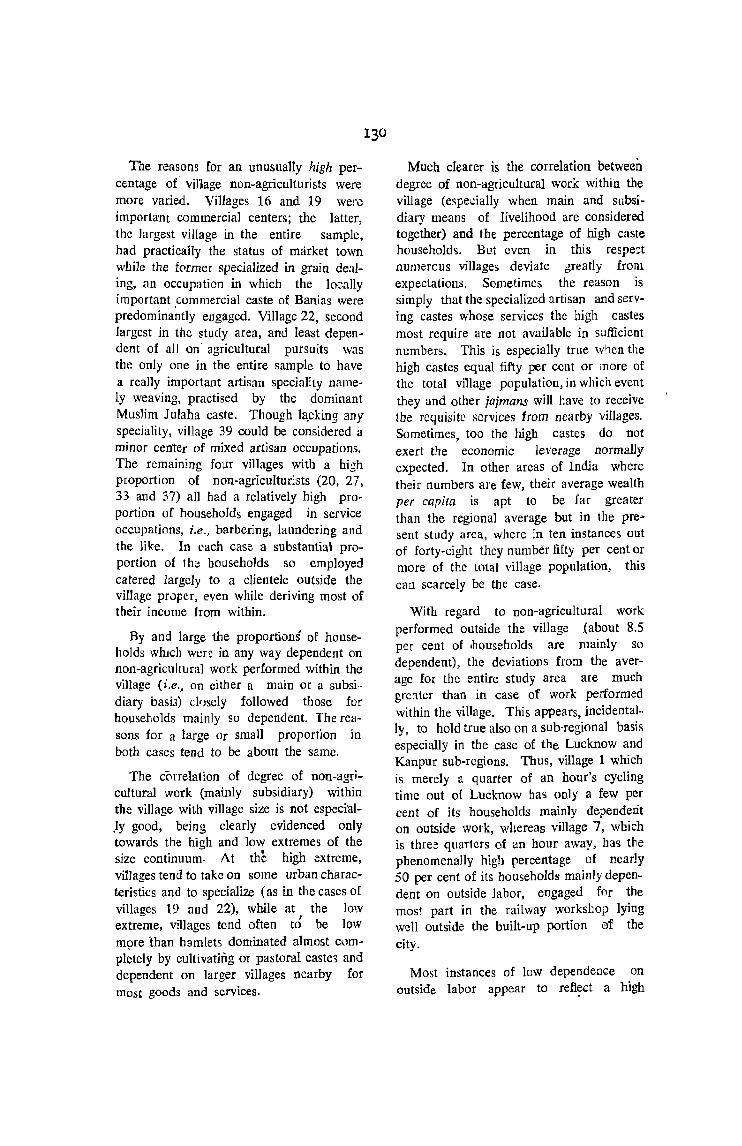
The reasons for an unusually high percentage of village non-agriculturists were more varied. Villages 16 and 19 were important commercial centers; the latter, the largest village in the entire sample, had practically the status of market town while the f(lrmer specialized in grain dealing, an occupation in which the locally important .commercial caste of Banias were predominantly engaged. Village 22, second largest in the study area, and least dependent of all on' agricultural pursuits \vas the only one in the entire sample to have a really important artisan speciality namely weaving, practised by the dominant Muslim Julaha caste. Though l~cking any speciality, village 39 could be considered a minor center of mixed artisan occupations. The remaining four villages witb a bigh proportion of non-agriculturists (20, 27, 33 and 37) all had a relatively high proportion of households engaged in service occupations, i.e., barbering, laundering and the like. In l"ach case a substantial proportion of the households so employed catered largely to a clientele outside the village pruper, even while deriving most of their income [rom within.
By and large the proportions of households which were in any way dependent on non-agricultural work performed within the village (i.e., on either a main or a subsidiary basi3) cl0sely followed those for households mainly so dependent. The reasons for a large or small proportion in both cases tend to be about the same.
The correlation of degree of non-agricultural work (mainly subsidiary) within the village with village size is not especi'al,ly good, being clearly evidenced only towards the high and low extremes of the size continuum. At the high extreme, villages tend to take on some urban characteristics and to specialize (as in the cases of villages 19 :llld 22), while at the low extreme, villages tend often t6 be low more lhan hamlets dominated almost Cl.lmpl~tely by cultivating or pastoral caste, and dependent on larger villages nearby for most goods and services.
Much dearer is the correlation between degree of non-agricultural work within the village (espedally when main and subsidiary means of livelihood are considered togetber) and tbe percentage of high caste household,>. But even in this respe::t numerous villages deviate greatly from expectations. Sometimes the reason is simply that the specialized artisan and serving castes whose services the high castes most require are not available in sufficient numbers.. This is especially true whcn the high castes equal fifty per cent or more of the total village population, in which event they and other jajmans will have to rcceive the requisite services from nearby villages. Sometimes, too tbe high castes do not exert the economic leverage normally expected. In other areas of India where their numbers are few, their average wealth per capita is apt to be far greater than the regional average but in the pre~ sent study area, where in ten instances out of forty-eight they number fifty per cent or more of the total village population, tbis can scarcely be the case.
With regard to non-agricultural work performed outside the village .(about 8.5 per cent of Ihouseholds are mainly so dependent), the deviations from the averag~ for the entire study area are much grc:tter than in case of work performed within the village. This appears, incidental .. 1)" to hold true also on a sub'regional basis especially in the case of the Lucknow and Kanpur sub-regions. Thus, village 1 which is merely a quarter of an bour's cycling time out of Lucknow has only a few per cent of its households mainly dependent on outside work, whereas village 7, which is three quarters of an bour away, has the phenomenally high pereentage of nearly 50 per cent of its households mainly dependent on outside Jabor, engaged for the most part in the railway workshop lying well outside the built-up portion ef tbe
city.
Most instances of low dependence on outside labor appear to reft~ct a high
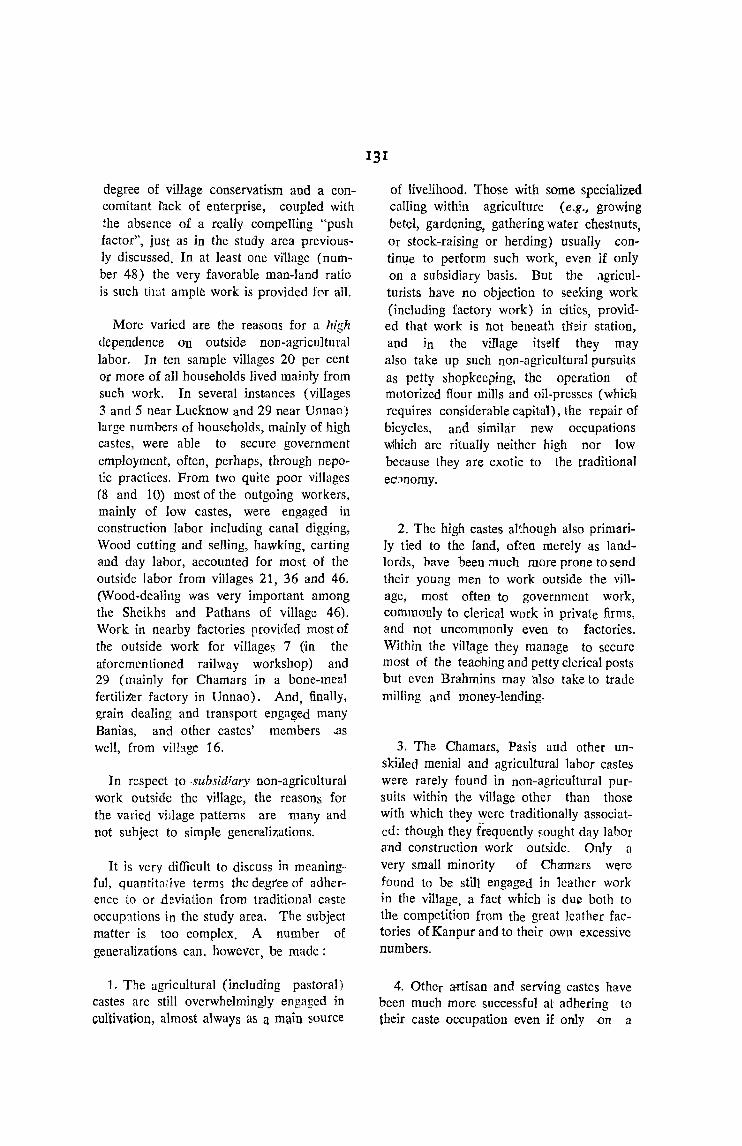
degree of village conservatism and a concomitant lack of enterprise, coupled with the absence of a really compelling "push factor", just as in the study area previously discussed. In at least one village (number 48) the very favorable man-land ratio is such that ample work is provided for all.
More varied are the reasons for a high dependence ori outside non-agricultural labor. In ten sample villages 20 per cent or more of all households lived mainly from such work. In several instances (villages 3 and 5 near Lucknow and 29 near Unnao) large numbers of households, mainly of high castes, were able to secure government employment, often, perhaps, through nepotic practices. From two quite poor villages (8 and 10) most of the outgoing workers, mainly of low castes, were engaged in construction labor including canal digging, Wood cutting and selling, hawking, carting and day labor, accounted for most of the outside labor from villages 21, 36 and 46. (Wood-dealing was very important among the Sheikhs and Pathans of village 46). Work in nearby factories provided most of the outside work for villages 7 (in the aforementioned railway workshop) and 29 (mainly for Chamars in a bone-meal fertilizer factory in Unnao). And, finally, grain dealing and transport enga~ed many Banias, and other castes' members .as well, from village 16.
In respect to .subsidiary non-agricultural work outside the village, the reasons for the varied village patterns are many and not subject to simple genemlizations.
It is very difficult to discuss in meaningful, quantitative terms the de.gree of adherence to or .deviation fmm traditional caste Occup:1tions in the study area. The subject matter is too complex. A number of generalizations can. however, he made:
]. The agricultural (including pastoral) castes are still overwhelmingly engaged in cultivation, almost always as a main source
131
of livelihood. Those with some specialized calling within agriculture (e.g., growing betel, gardening, gathering water chestnuts, Or stock-raising or herding) usually contin~e to perform such work, even if only on a subsidiary basis. But the agriculturists have no objection to seeking work (including factory work) in cities, provided that work is 110t beneath ttleir station, and in the village itself they may also take up such non-agricultural pursuits as petty shopkeeping, the operation of motorized flour mills and oil-presses (which requires considerable capital), the repair of bicycles, and similar new occupations wihich are ritually neither high nor low because they are exotic to the traditional eCJnomy.
2. The high castes although also primarily tied to the land, often merely as landlords, Pelve been much more prone to send their young men to work outside the village, most often to government work, commonly to clerical work in private firms, and not uncommonly even to factories. Within the village they manage to secure most of the teaohing and petty clerical posts but even Brahmins may 'also take to trade milling and money-lending.
3. The Chamars, Pasis and other unskilled menial and agricultural labor castes were rarely found in non-agricultural pursuits within the village other than those with which they were traditionally associatcd: though they frequently !'ought day labor and construction work outside. Only a very small minority of Chmnars were found to be. still engaged in leather work in the village, a fact whieh is due both to the competition from the great leather factories of Kanpur and to their own excessive numbers.
4. Other artisan and serving castes have been much more successful at adhering to their caste occupation even if onJy .on a
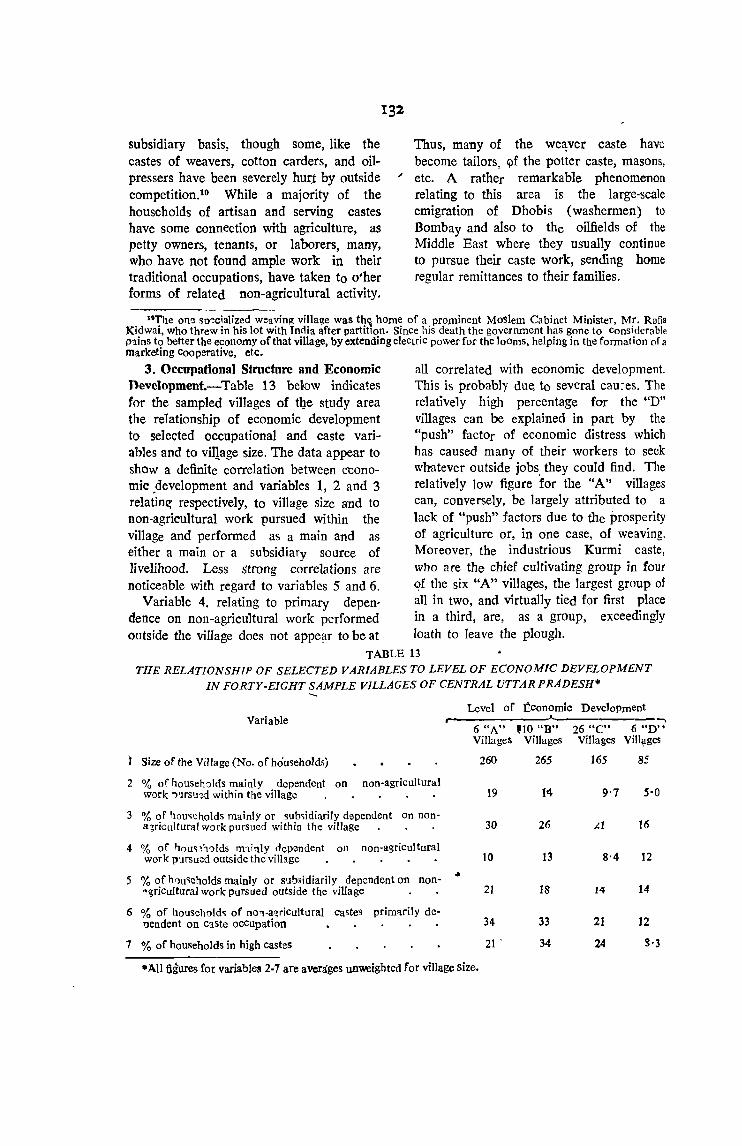
132
subsidiary basis, though some, like the castes of weavers, cotton carders, and oilpressers have been severely hur.t by outside competition.19 While a majority of the households of artisan and serving castes have some connection with agriculture, as petty owners, tenants, or laborers, many, who have not found ample work in their traditional occupations, have taken to o'her forms of related non-agricultural activity.
Thus, many of the we~ver caste have become tailors, 4)f the potter caste, masons,
'" etc. A rather remarkable phenomenon relating to this area is the large-scale emigration of Dhobis (washermen) to Bombay and also to the oiIfields of the Middle East where they usually continue to pursue their caste work, sending home regular remittances to their families.
liThe one so~cialized weaving village was th, home of a prominent Moslem Cabinet Minister, Mr. Rafia Kidwai, who threw in his lot with Tnnia after partition. Since his death the government has gone to Considerable p3.ins to better the economy of that village, by extending electric power for the looms, helping in the formation of a marketing cooperative, etc.
3. Occupational Structure and Economic all correlated with economic development. Jlevclopment.-Table 13 below indicates This is probably due to several cau~es. The for the sampled viI1ages of t]Je study area relatively high percentage for the "D" the relationship of economic development villages can be explained in part by the to selected occupational and caste vari- "push" factOr of economic distress which abIes and to village size. The data appear to has caused many of their workers to seek show a definite correlation between econo- whatever outside jobs they could find. The mic .development and variables 1, 2 and 3 relatively low figure for the "A" villages relating- respectively, to village size and to can, conversely, be largely attributed to a non-agricultural work pursued within the lack of "push" factors due to the prosperity village and performed as a main and as of agriculture or, in one case, of weaving. either a main or a subsidiary source of Moreover, the industrious Kurmi caste, livelihood. Less strong correlations are who are the chief cultivating group in four noticeable with regard to variables 5 and 6. qf the six "A" villages, the largest group of
Variable 4. relating to primary depen- all in two, and virtually tied for first place dence on non-agricultural work performed in a third, are, as a group, exceedingly outside the village does not appear to be at loath to leave the plough.
2
3
4
5
6
7
TABLE 13 THE RELATIONSHIP OF SELECTED VARIABLES TO LEVEL OF ECONOMIC DEVELOPMENT
IN FORTY-EIGHT SAMPLE VILLAGES OF CENTRAL UTTAR PRADESH·
Level of ~conomic Development Variable -,
6 "A" nO "B" 26 "C" 6 "D" Villages Villages Villages ViIlliges
Size of the Village (No. of households) 260 265 165 8':
% of households mainly dependent on non-agricultural work ')'lrsu~d within the village 19 14 9·7 5'0
% of hou~eholds mainlY or sub,idiarily dependent on non-a~ricultural work pursued within the village 30 26 ..:1 16
% of hom!holds m'lillly nependent 011 non-agricul tural work I'ursued outside the village 10 13 8·4 12
% of hou~eholds mainly or subsidiarilY dependent on non-..
"gricultural work pursued outside the village .. 21 18 14 14
% of household~ of nO'1·a~ricultural castes primarily de-lJendent on caste occupation 34 33 21 12
% of households in high castes 21 . 34 24 !H
.Ml figures for variables 2·7 are averages unweighted for village size.
Variable 7, relating to the percentage of households in hIgh castes, also seems not to be well correlated with economic development. In part this is due to the importance of the prosperous, but not high caste, Kurmis in the "A" villages. [n part too it stems from the fact that Brahmins and Thakurs, the two leading high castes, are averse to many of the jobs connected with cultivation. Ploughing, for example, is beneath their dignity. Hence, where these castes are mo~t numerous there is either insufficient labor to go around or the wages to labor (often supplied from nearby villages) are bid up to the poiilt where rela· tively little profit remains for the landowner. Hence, such villages are often not as prosperous as one would expect. Apart from the low proportion of high caste households in the "A" villages, however, variable 7 also seems to correlate well with the level of economic development.
133
Telangana20
In January, 1956, the author spent several days walking with Vinoba Bhave through the land-hungry villages of Telangana in Nalgonda District east of 'the city of Hyderabad. The impression he formed at that time was one of an area of rather dire poverty. Hence, when he later viewed the Census occupational statistics for that and surrounding districts he was quite surprised to learn that a large proportion of non-agriculturists were to be found in the region. The number of rural workers in processing and manufacture in particular was exceedingly high, a fact which Gosal stated was attributable to the development of "such activitv as handloom industry. bidi industry (indigenous cigarette industry), forestry, processing industries based on cotton, oil seeds, and leather, etc."21 When the author first
read· this explanation (as it was put forward
in Gosal'~ doctoral dissertation of 1956) he did not doubt it. And, when he later began to think of the Clarkian thesis relative to the correlation between economic development and occupational structure, it occurred to him that jf any area of India were to provide evidence contrary to that thesis it would surely be Telangana. This •. then, provided the impetus for going there. The aim was to examine the occupational structure and the mechanisms whereby so many workers could be maintained in non-agricultural work in So poor a region.
Of all the di~tricts in Telangana the one in which the aforementioned occupational characteristics were most pronounced wn8 Karimnagar; and it was prcsumed that this was the core area of the singular region in question. The author, therefore, decidcd to focus his attention there in the limited time and with the limited means at his di~posal (he was temporarily without an interpreter) .
The Census percentages pi self-supporting males under various occupational cateflories in Karimllagar District are as follows: :-lgriclllture-5R% (close to half of whom were agricultural laborers and tenants), other prim'arv industries-5' 8 %, processing and manufacturing-22%, commerce-3'4%, and all other services-l0%. Since the district was 910/,) rural. the Census fi~ures for the rural population onlv were hut little different from those cited above for the total population. Suspiciously odd asoects of the data were the low proportion of workers in commerce to workers in the secondarv sectGY and the facts that the reported percentage of urban workers in the secondary sect",r was but a fraction of a per cent higher than for the rur!!l population. while 23 % of aU urban workers were
classified as agriculturists .
.. For rea~')I1~ which will presently beCome clear the usual tripartite breakdown of the regional se('ticl1~ C'f tbis chapter will not be followed here.
~, G. S. Gosal. "The occunational Structure of Tn.dia's Rur~1 POl1ubtion-A Fegiol'f11 ,ANI.ly'js," Th~ National GeographicalJournal of India, Vol. IV, Part 3, Sept. 1958, pp. 137-14F, quote frOU' p. 141.
Tihe area of I{arimnagar is one of moderately fertile, sandy soils, on most of which it is possible to grow two i,;rops annually. There is a modest and expanding development of tank and well irrigation. In addition to the food crops (notably rice and jowar) , in wbich the Karimnagar area has a considerable salable surplus, there is sufficient aoreage in cash crops (mainly _ground nuts and castor~ to warrant classi~ fying much of the area as one of advanced commercialization (i.e., by Indian standards) . Natural resources of a non-agricultural nature are, however, exceedingly meagre. Transportation facilities are only moderately well developed; and there is no important city and exceedingly little factory moderately well developed, and there is no some slight development of primary processing industries and the normal rural l:Offi
-plement of artisans doing work ancillary to agriculture and providing household goods, one would not expect other forms of manufacturing to be strongly developed. Furthermore, without going into the details of the well ramified caste structure of Karimnagar, the main elements of which are indicated in the district gazetteer (1940), it sel:ms safe .to assert that it is in no way particularly a typical or of such a nature as would lead onc to expect a high proportion of non~agricllitural workers.
The author's field experience in Karimnagar 'Y-as limited to interviews with the District Magistrate, one Block Development Officer of the Community Development Administration and several members of his staff, several officers of cooperative societies, and a handful of artisans, all in t.he district headquarters, and a visit to one Very large village (1,100 households) six mile~ away which was said to have an unusually high degree of development of artisan activitie<;. During most of his time in the area, as well as On his sil1g1e village excur~ion, he Wl, accompanied by an English speaking Cottage Industries Development Officer from the Community Development Block. This person himself ~ carried out an industrial survey of thirty-seven village and one town in the l310ck over a four-month
134
period in 1958, and so was able to speak' with considerab~ authority on his area.' Much of what follows is based on 'discus-' sions with him.
The author's principal conclusions concerning the area are: (1 ) The Census returns cited for Karimnagar are grossly inaccurate, owing presumably to the reporting of ca~tt! occupation instead of actual occupatiJn. (Some of the evidence for this, deduced from the Census itself, has already been presented in Chapter IV.) (2) l1he study area is, nevertheless, one with a ~
moderately high and currently increasing degre(; of development of non-agricultural . and especially artisan activities. (3) This increase is largely due to an increase in a11-around productivity and consequent. prosperity (above the average le,vels for Telangana as a whole), and partly also to the development of effective co-operative marketing agencies for locally made cloth and sundry other products (Karimnagar's cloth, excellent silver filigree work, tanned hides and skin~, and some brasswork are marketed in Hyderabad, whence they ~rc
reshipped to many parts of India.) (4) Within the villages of Karimnagar the jajmani system is generally adhered ~o. (5) Karimnagar prjbably is not as the Census makes it appear to be, the core area of a Telangana region of unique occupatioJlal structure. Warangal, to the cast, and Nizamaba<), to the West, were thought to be at least as prosperous, and the former of those two districts was thought to have an even higher proportion of workers in the secondary sector. ;-
The author's guesses as to the approximately correct proportions of workers in the three principal economic sector~ are as follows: primary 70-75%, secondary 10-12% a'nd tertiary 15-18%. Weaving probably accounts for the largest single sub-head under the secondary sector and tanning the second largest. The making of shoes and other leather goods, pottery. carpentry. blacksmithing, oil-pressing and metal craft work are also of some importa.nce, -
,
Tamil Nad
(Map 26)
General Backgl'ound.-In choosing the study area portrayed on Map 26, the author had two special aims in mind: First, to study an area of predominantly Tamil culture since Tamil Nad is generally rcgarded as the. culture-hearth, as wcll as the most important region, of South or Dravidian, India, as opposed to the so-called -\ryan North. Second, within Tamil Nad an area was sought with a fairly broad range of non-extreme conditions the findings for which would probab1y have their analogues over many parts of Southern India. (That they really do is a sUPP0sition which, of ~urse, cannot be proved). Thus, the study area is one in which the degree of
urban influence varies from moderately strong to rather weak; in which the level of manufactural and artisan activity varies from moderately high to quite low; in which the degree of commercialization in agriculture varies from appreciable to slight; in which the rainfall is only moderately high; in which the population density. though high, is not extreme; and, finally in which are found both open coastal plain and plains intercalated among the interior hill-lands.
The northern and more-developed end of this north-south trending study area lies barely athwart the main rail and road artery ::onnecting Madras with interior Bangalore and with Cochin on the West Coast. This route parallels the Palar River as it makes its way through the depression between the Eastern Ghats and the outlying lavadi Hiils, whence it flows close to another hundred miles across the coastal plain to the Bay of Bengal.
The chief and only real city of the study area, Vellur (Vellore), with a 19~ population of 106,000, lies in a strategically situated break among the Hills close to the point where the river meets the open plain, and to the Katpadi -intersection of the minor narrow-gauge north-south line of the soutlli
Indian Railway and the Madras-Bangalore trunk line noted above. The site of a famous Dravidian temple and fort, an important seat of Christian missionary activity centering largely on the reknowncd Christian Medical College and Hospital, the (luministraHve headquarters of North Arcot District and an important center of trade, Vellur has very little in the way of m'auufactures apart from the numerous Muslimmanaged biri "factories" employing up to One hundred workers each.
To the east, on the plain proper, straddlin! the Palar, is a cluster of towns, Arcot, RaTl~pet, Wa.lajapet, and Visharam, none very prominent in itself, but together forming a center of industry of some importance. The tanning industry, centered at Visharam, is numerically the most important source of employment, but the Parry's & Co. fertilizer, chemicals, and ceramics plant at Ranipet is much the largest single industrial concern in the study area employ ing an average of about 1,300 workers. Silk and wool weaving is of note ill Walajapet, and biri.,making in Ranipet. Arcot is primarily a grain-market rath~r (han an industrial center (and, incidentally, the site of Clive's brilliant victory over his French
. besiegers during the Carnatic Wars of the mid-eighteenth century).
As one proceeds south from the Palar, industry diminishes markedly, the degree of commercialization in agriculture falls off, and the overall level of development appears to decline. An important exception is provided by the town of Ami and the surrounding villages, within a radius of seven or eight miles. in which cotton and silk and handloom weaving is highly developed. The industry was begun in Ami, in the seventeenth or eighteenth century whe'n the then ruling Marathi dymlsty planted communities of Saurashtra weavers in a number of South Indian towns. Today, thanks to governmental assistance and the formation of purchasing and marketing cooperatives, the industry is flourishing and
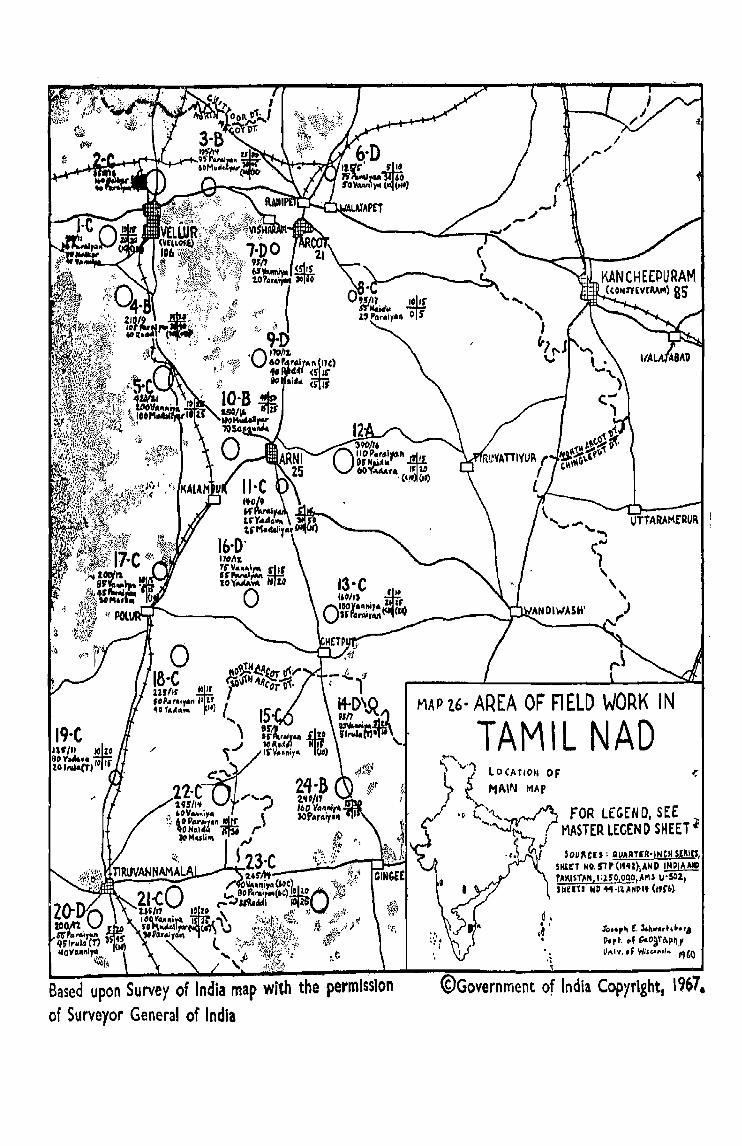
Based upon Survey of India map with the permlsslon of Surveyor General of India
MAP t6· AREA OF FIELD WORK IN
TAM'L NAD LOCATION OF
MAIN MAP
FOR LEGEN 0, SEE MASTER LECEN 0 SHEET l
'OuI\CU ; :;mi~~:!;!...2::':::"'1 slltr:r NO. 511' AMP INPI" AIIP r"II.ISr"".1:1S0,OQO,"PlS U·S011 SHfilS liD +1-IUIiPIt (lfr'~
10 •• ,11 t, """ .... h~.ra Po pt .• f Gc"~f a.p~, u"lv .• F Wi,,,,,",,. 19'Q
@Government of India Copyright. 1967,
expanding; and ih the last few years several small power-loom mills for the production of rayon have also been started. Polur, still further south, also has a moderate development of cotton hand-Ioc'm we-aving. But Tiruvannamalai, near the southwest corner of the study area and the second largest town therein (population 41,000), has virtually no industry at all other than the essential artisan crafts and such simple food processing as milling and the making of articles for immediate consumption.
Agriculture is rather intensive and highly dependent on the services of agricultural labor in the busy seasons. The rural population density, despite the relative infertility of the soil, averages slightly over five hundred per square mile; but, were one to consider the plains areas only, the average would be well over 600 and in the taluk of Ami it exceeds 800, a situation made possible only by the prevalence of weaving in the villages. Because of the high pressure of population on the land, the area has, for several generations, experienced a considerable emigration of laborers to Madras, the Kolar Gold Fields, Bangalore, and the plantations of the Western Ghats.
137
Thanks primarily to the development of irrigation, double cropping is very extensive and a wide variety of crops can be grown, of which rice is the most important. Trrigation is of several kinds: tank irrigation from the hundreds of shallow, embanked (and now largely silted) depressions with which the plains are studied; well-irrigation, which is rapidly increasing, especially with the spread of die'lel and electric powered pumping sets; and, near the Palar and Cheyyar Rivers, anicllt irrigation, bascd on the diversion of river water during periods of spate. Cash cropping is not especially important. Groundnuts are the chief cash crop, while tobacco, sugar, chillies and a little sesame are also raised. A number of small oil-mills in the towns process most of the groundnut crops; but f()r lack of a sugar-mill in or near the study
area, the cane must 'be processed into crude brown jaggery in the local country presses.
For an analysis of the rural settlement pattern, the Census figures for this area are of little value, since they relate to administrative villages, as constituted for the purpOse of levying land revenue and do not accord with the realities of actual settlement. On the whole the settlement pattern, is rather complex, being compol1nded of central villages in which most of the shops and services are found; outlying hamlets, designated as palayams, composed as a rule of just a few castes, usually agricultural, or perhaps only one, which more often than not are found also in the central villages; and other outlying hamlets, designated as clzerris, in which live virtually all the untouchable castes. and usually they alone. Scarcely any village is without its cherr; or cherris, though many have no palayams. And a given cherri sometimes serves more than one central village and/or palayams. The tota1 complex is generally rather large averaging well over two hundred households and not very discrete, so that it is sometimes difficult to tell to which central village a particular palayam or cherri is linked (economically it may be linked mainly to one while administrativeJIy it is tied to another), or whether a given settIeme"t ought to be classified as a palayam or a village center in its own right. The various elements of the total complex, though usually in sight of one another, may be separated from other elements by distances sometimes exceeding a mile.
In deciding in the field what was or was not to be considered a part of the village under study all decisions were made on an ad hoc basis, giving priority to the economic functional inter-connections and considerations of distance. In retrospect, the ·author is not sure that he always chose correctly; particularly since he has noted that in three cases out of twenty-four (numbers 10, 14 and 19) he had completely excluded cherri.1 from the coverage because of their distance from the parent village.
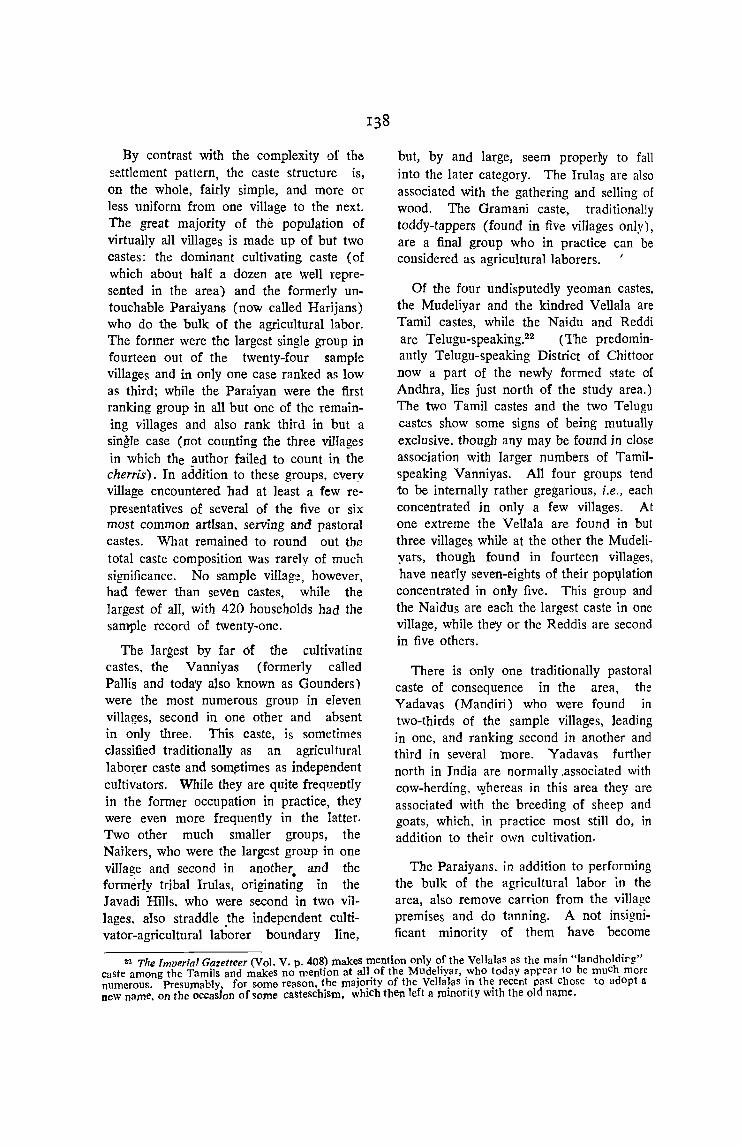
By contrast with the complexity of the settlement pattern, the caste structure is, on the whole, fairly simple, and more or less uniform from one village to the next. The great majority of the population of virtually all villages is made up of but two castes: the dominant cultivating caste (of which about half a dozen are well represented in the area) and the formerly un· touchable Paraiyans (now called Harijans) who do the bulk of the agricultural labor. The former were the largest single group in fourteen out of the twenty-four· sample villages and in only one case ranked as low as third; while the Paraiyan were the first ranking group in all but one of the remaining villages and also rank third in but a single case (not counting the three viIIages in which the author failed to count in the cherris). In addition to these groups, every village encountered bad at least a few representatives of several of the five or six most common artIsan, serving and pastoral castes. What remained to round out the total caste composition was rarely of much significance. No s'ample village, however, had fewer than seven castes, while the largest of all, with 420 households had the sample record of twenty-one.
The largest by far of the cultivatin!! castes, the Vanniyas (formerly called Pallis and today also known as Gounders) were the most numerous group in eleven villages, second in one other and absent in only three. This caste, is sometimes classified traditionally as an agricultural laboJ;:er caste and som~times as independent cultivators. While they are quite frequently in the former occupation in practice, they were even more frequently in the latter. Two other much smaller groups, the N aikers, who were the largest group in one vi11age and second in another. and the formerly tribal Trulas, originating in the Javadi Hills. who were second in two villages. also straddle ,the independent cultivator-agricultural laborer boundary line,
but, by and large, seem propedy to fall into the later category. The Trulas are also associated with the gathering and selling of wood. The Gramani caste, traditionally toddy-tappers (found in five villages only), are a final group who in practice can be considered as agricultural laborers.
Of the four undisputedly yeoman castes, the Mudeliyar and the kindred Vellala are Tamil castes, while the Naidu and Reddi are Telugu-speaking.22 (The predominantly Telugu-speaking District of Chittoor now a part of the newly formed state of Andhra, lies just north of the study area.) The two Tamil castes and the two Telugu castes show some signs of being mutually exclusive. though any may be found in close association with larger numbers of Tamilspeaking Vanniyas. All four groups tend to be internally rather gregarious, i.e., each concentrated in only a few villages. At one extreme the Vellala are found in but three villages while at the other the Mudeliyars, though found in fourteen villages, have nearly seven-eights of their popvlation concentrated in ontr five. This group and the Naidus are each the largest caste in one village, while they or the Reddis are second in five others.
There is only one traditionally pastoral caste of consequence in the area, the Yadavas (Mandiri) who were found in two-thirds of the sample villages, leading in one, and ranking second in another and third in several more. Yadavas further north in India are normally.associated with cow-herding, 'Yhereas in this area they are associated with the breeding of sheep and goats, which, in practice most stitt do, in addition to their own cultivation.
The Paraiyans. in addition to performing the bulk of the agricultural labor in the area, also remove carrion from the village premises and do tanning. A not insignificant minority of them have become
22 The lmverial Gazetteer (Vol. V. p. 408) makes mention only of the Vellalas as the main "Iandholclirg" caste among the Tamils and makes no mention at all of the Mudeliyar, who today appe~r 10 be much more numerouS. Presumably, for some reason, t.he majo!ity of the Vella~as i;t th~ recent past chose to adopt n new name, on the occasion of~ome casteschlsm, whICh then left a mInOnty WIth the old name.
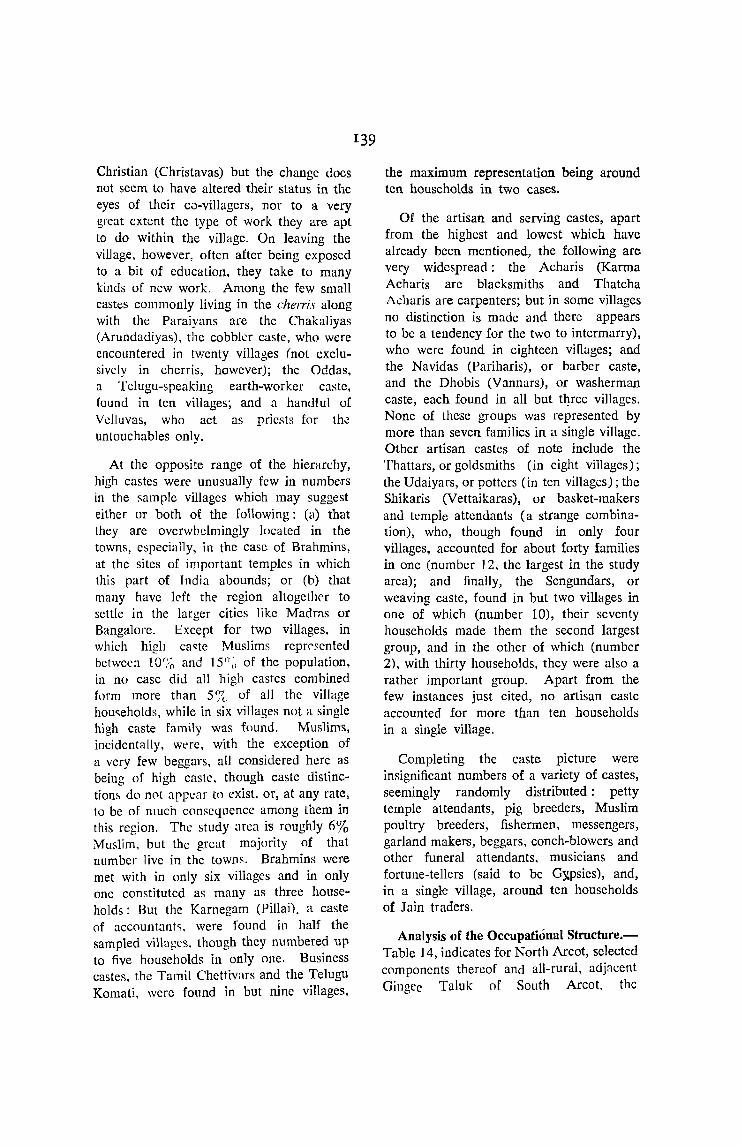
Christian (Christavas) but the change does not seem to have altered their status in the eyes of their co-villagers, nor to a very great extent the type of work they are apt to do within the village. On leaving the village, however, often after being exposed to a bit of education, they take to many kinds of new work. Among the few small castes commonly living in the cherr;s along with the Paraiyans are the Chakaliyas (Arundadiyas), the cobbler caste, who were encountered in twenty villages (not exclusively in cherris, however); the Oddas, a Telugu-speaking earth-worker caste, found in ten villages; and a handful of Velluvas, who act as pric.sts fOf the untouchables only.
At the opposite range of the hierarchy, high castes were unusually few in numbers in the sample villages which may suggest either or both of the following: (Cl) that they are overwhelmingly located in the towns, especially, in the case of Brahmins, at the sites of important temples in which this part of India abounds; or (b) that many have leit the' region altogether to settle in the larger cities like Madras or Bangalore. Except for two villages, in which high ca~te Muslims repn"sented between 10(/~ and 15";) of the population, in no case did all high castcs comhined form more than 5% of all the village hou<;eholds, while in six villages not a single high caste fami1y was found. Muslims, incidentally, Wl'fe, with the exception of a very few beggars, all considered here as being of high caste, though caste distinction:;, do n0t appear to exist, or, at any rate, to be of much con~cquence among them in this region. The study area is roughly 6% Muslim, but the great majority of that number live in the towns. Brahmins were met with in only six villages and in only one constituted as many as three households: But the Karnegam (Pillai), a caste of accountant~, were found in half the sampled villallcs, though they numbered up to five households in only one. Business castes. the Tamil Chettivars and the Telugu Komati. were found in but nine villages,
139
the maximum representation being around ten households in two cases.
Of the artisan and serving castes, apart from the highest and lowest which have already been mentioned, the following are very widespread: the Acharis (Karma Acharis are blacksmiths and Thatcha Acharis are carpenters; but in some villages no distinction is made and there appears to be a tendency for the two to intermarry), who were found in eighteen villages; and the Navidas (Pariharis), or barber caste, and the Dhobis (Vannars), or washerman caste, each found in all but tl}ree villages. None of these groups was represented by more than seven families in a single village. Other artisan castes of note include the Thattars, or goldsmiths (in eight villages); the Udaiyars, or potters (in ten villages); the Shikaris (Vettaikaras), or basket-makers and temple attendants (a strange combination), who, though found in only four villages, accounted for about forty families in one (number 12, the largest in the study area); and finally, the Sengundars, or weaving caste, found in but two villages in one of which (number 10), their seventy households made them the second largest group, and in the other of which (number 2), with thirty households. they were also a rather important group. Apart from the few instances just cited, no artisan caste accounted for more than ten households in a single village.
Completing the caste picture were insignificant numbers of a variety of castes, seemingly randomly distributed: petty temple attendants, pig breeders, Muslim poultry breeders, fishermen, messengers, garland makers, beggars, conch-blowers and other funeral attendants, musicians and fortune-tellers (said to be G~psies), and, in a single village, around ten households of Jain traders.
Analysis of the Occupational Structure.Table 14, indicates for North Arcot, selected components thereof and all-rural, adjacent Gingee Taluk of South Areot, the
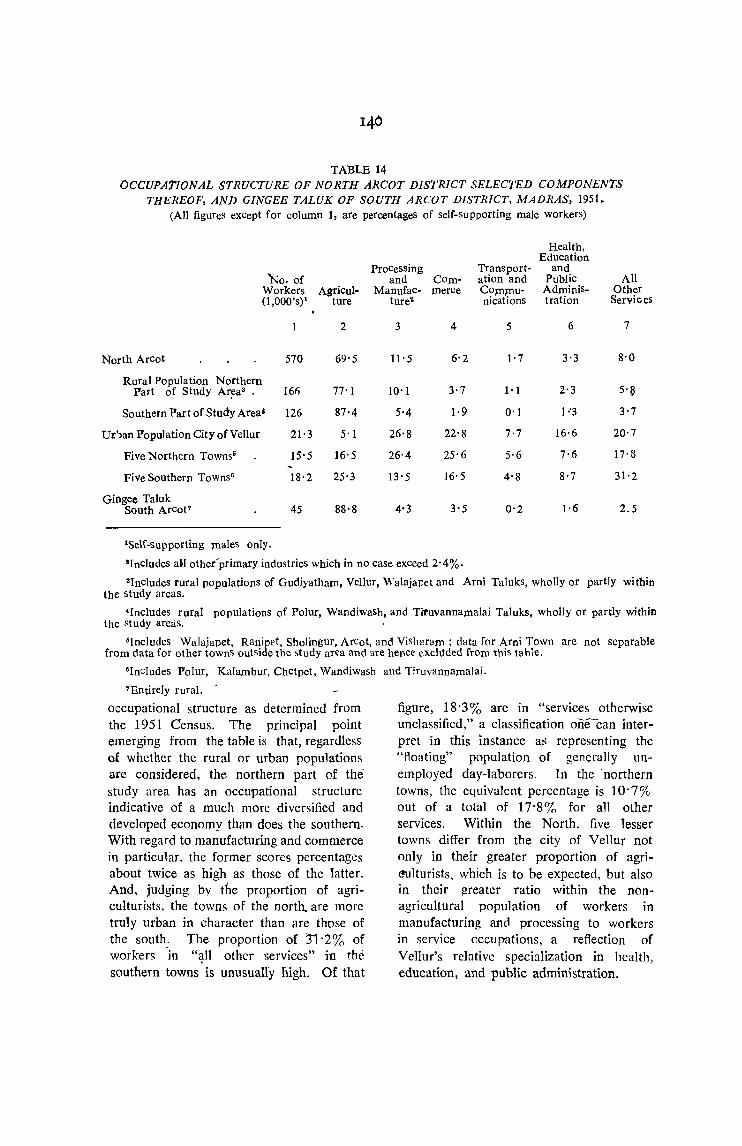
TABLE 14 OCCUPATIONAL STRUCTURE OF NORTH ARCOT DISTRICT SELECTED COMPONENTS
THEREOF, AND GINGEE TALUK OF SOUTH ARCOT DISTRICT, MADRAS, 1951~ (All figures except for column 1, are percentages of self-supporting male workers)
Health, Education
Processing Transport- and No. of and COm- ation and Public All
Workers Agricul- Manufac- rnerce Commu- Adminis- Other (1,Ooo'S)l ture ture2 nications tration Services
2 3 4 5 6 7
North Arcot 570 69'5 11'5 6'2 1'7 3'3 8'0
Rural Population Northem Part of Study Ar!!a3 . 161i 77-1 10'1 3·7 1· 1 2'3 5'~
Southern Part of Study Area' 126 87-4 5'4 1·9 0'1 1 :3 3'7
Ur')an Population CitYofVellur 21·3 5'1 26'8 22'8 7·7 16·6 20·7
Five Northern Towns' 15'5 16'5 26'4 25'6 5·6 7'0 17'8
Five Southern Towns· 18'2 25'3 13-5 16'5 4'8 8-7 31'2
Gingee Taluk South Arcot7 45 88'8 4-3 3-5 0'2 1·6 2.5
1Self-supporting males only.
2Includes aH other-primary industries which in no case exceed 2'4%.
3Includes fural populations of Gudiyathalll, VelluT, Walajaret and Arni Taluks, wholly Of partly within the study areas.
'Includes rural popUlations of POIUf, Wandiwash, and Tiruvannamalai Taluks, wholly or partly within the study areaS.
'Includes Walajapet, Ranipet, Sholingur, Arcot, and VishaTaj11 ; data for Arni Town are not separable from data for other townS outside the study area and are hence exch1ded from this table.
"Includes Polur, KalambuT, ChCtpet, Wandiwash and TiruvannamaIai.
7 Entirely rural. .
occupational structure as determined from the 1951 Census. The principal point emerging from the table is that, regardless of whether the rural or urban populations are considered, the northern part of the study area has an occupational structure indicative of a much more diversified and developed economy than does the southern. With regard to manufacturing and commerce in particular. the former scores percentages about twice as high as those of the latter. And. jUdging bv the proportion of agriculturists. the towns of the north. are more truly urban in character than are those of the south. The proportion of 31'2% of workers -in "~11 other 'Services" in the southern towns is unusualfy high. Of that
figure, 18'3% are in "services otherwise unclassified," a classification one-can interpret in this instance as representing the "floating" population of generally unemployed day-laborers. In the 'northern towns, the equivalent percentage is 10'7% out of a total of 17'8% for all other services. Within the North. five lesser towns differ from the city of Vellur not only in their greater proportion of agri~lturists, which is to be expe.cted, but also in their greater ratio within the nbnagricultural population of workers in manufacturing and processing to workers in service occupations, a reflection of V clIur's relative specialization in hcalth, education, and public administration.
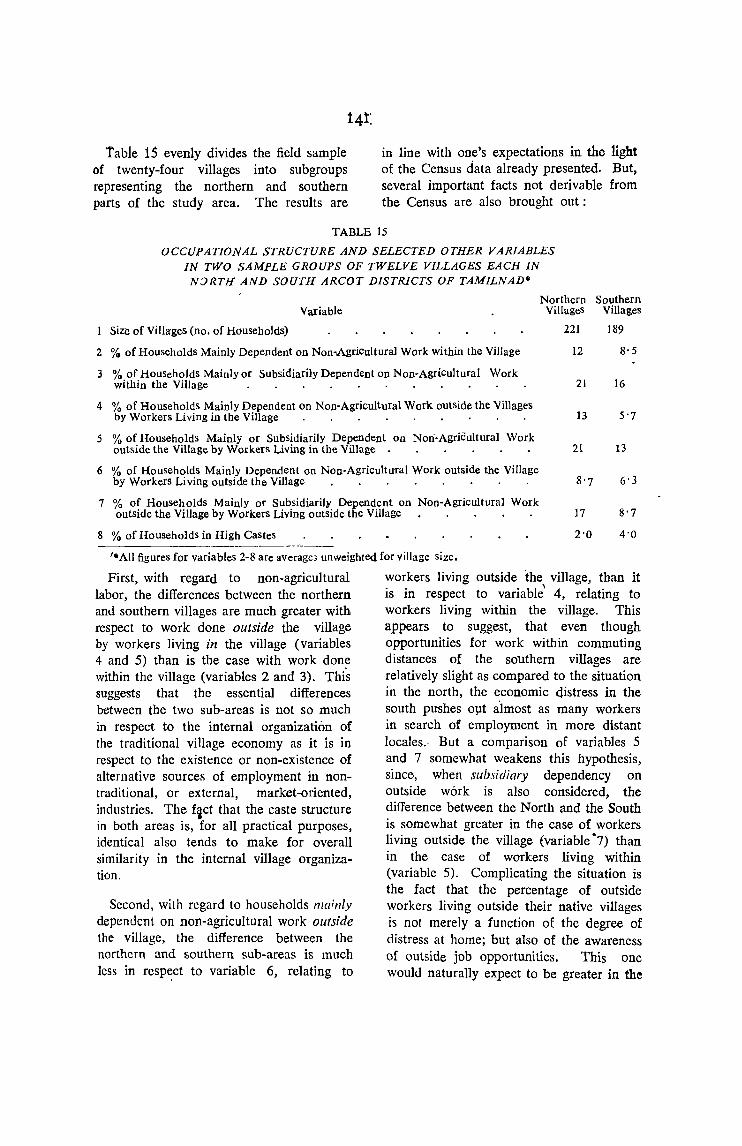
Table 15 evenly divides the field sample of twenty-four villages into subgroups representing the northern and southern parts of the study area. The results are
in line with one's expectations in the light of the Census data already presented. But, several important facts not derivable from the Census are also brought out:
TABLE 15
OCCUPATIONAL STRUCTURE AND SELECTED OTHER VARIABLES IN TWO SAMPLE GROUPS OF TWELVE VILLAGES EACH IN N:JRTH AND SOUTH ARCOT DISTRICTS OF TAMILNAD'"
Northern Southern Variable VillageS Villages
Size of Villa'ges (no. of Households) 221 189
2 % of Households Mainly Dependent on Non-Agricultural Work within the Village 12 8'5
3 % of HouseholdS Mainlyor Subsidiarily Dependent on Non-Agricultural Work 21 16 within the Village .........
4 % of HouseholdS MainlY Dependent on Non-Agricultural Work outside the Villages 13 5'7 by Workers Living in the Village
5 % of Households Mainly or Subsidiarily Dependent on Nori-Agricultural Work 13 outside the Village by Workers Living in the Village ....• 21
6 % of Households Mainly Dependent on Non-Agricultural Work outside the Village 8'7 6'3 by Workers Living outside the Village
7 % of Households Mainly or Subsidiarilf Dependent on Non-Agricultural Work outside the Village by Workers Living outside the Village. , . , • 17 8'7
8 % of Households in High Castes 2'0 4'0 --,--------
''''AII figures for variables 2-8 are average, ullweighted for village size.
First, with regard to non-agricultural labor, the differences between the northern and southern villages are much greater with respect to work done outside the village by workers living in the village (variables 4 and 5) than is the case with work done within the village (variables 2 and 3). This suggests that the essential differences between the two sub-areas is not so much in respect to the internal organization of the traditional village economy as it is in respect to the existt:nce or non-existence of alternative sources of employment in nontraditional, or external, market-oriented, industries. The f~ct that the caste structure in both areas is, for all practical purposes, identical also tends to make for overall similarity in the internal village organization.
Second, with regard to households mainly
dependent on non-agricultural work outsMe the village, the difference between the northern and southern sub-areas is much iess in resp~ct to variable 6, relating to
workers living outside the village, than it is in respect to variable' 4, relating to workers living within the village, This appears to suggest, that even though opportunities for work within commuting distances of the southern villages are relatively slight as compared to the situation in the north, the economic qistress in the south pushes o11t almost as many workers in search of employment in more distant locales.- But a comparison of variables 5 and 7 somewhat weakens this hypothesis, since, when subsidiary dependency on outside work is also considered, the difIerence between the North and the South is somewhat greater in the case of workers living outside the village (variable "7) than in the case of workers living within (variable 5). Complicating the situation is the fact that the percentage of outside workers living outside their native villages is not merely a function of the degree of distress at home; but also of the awareness of outside job opportunities. This one would naturally expect to be greater in the
north than in the south, since the former area is under much greater local urban influence J under much greater Christian mission influence, much closer to main transport routes, and much closer to the metropolitan centers of Madras and Bangalore.
Third, neither village size (variable 1), nor the percentage of high caste hou~eholds (variable 8) appear to be important factors in explaining the North-South differences, since the northern villages are 110t significantly larger on the average than those to the south and since the South, which in all other respects lags behind the North, actually has a somewhat larger proportio~ of high castes. (But neither sub-area has' a significant number of suoh families; and most of those in the South are, incidentally, Muslim, rather than Hindu).
Examining now, in greater detail, nonagricultural work done mainly in the village, we note that in only four cases (three of them in the North) out of twentyfour (villages 2, 3, 10 and 24) does the proportion of households so dependent exceed 10% and in only one of these (village 10) does it exceed 25%. Villages 10 and 2 are weaving villages. These are the only two villages in the area in which the weaving caste of Sengundars were encountered. But the population actually engaged in weaving included not only the great majority of Sengundars in the former village, and all in the latter, but also representatives of four and five other castes respectively. Even more surprising is the fact that the non-Sengundars were overwhelmingly from cultivating castes, including 'Such yeoman groups as Naidus, Reddis, and most important, l'vludeliyars. Most. of the weavers in village 2 came th<;re within the past decade or so, attracted largely from villages further south, in order to capitalize on its location near Vellur
and the Katpadi rail junction. In village 3, the majority of non-agricultural work was performed by Paraiyan, Muslim, and Arundadiya (cobbler caste) tannery workers in a tannery owned by an absentee Madrasi Muslim. About seventy people in all worked in the tannery, including women and children, and a number of workers from nearby Villages. Stone quarrying, practiced exclusively by a group of immigrant Naikers, also accounted for a significant part of the non-agricultural work. Village 24 had no particular non-agricultural speciality, but was remarkably self-sufficient in terms of essential goods and services, some of which it supplied also tQ nearby villages. The considerable wealth of its ten Jain households (all primarily cultivators) probably explains the unusually large numbers in the traditional artisah and serving occupations. The only other village with a-noteworthy nonagricultural speciality pursued as a primary occupation was village 1, in which thirteen Paraiyan households lived mainly from the quarrying and sale of lime.
When subsidiary sources of income from non-agricultural labor are also considered, we note that all but four northern villages
• (2, 3, 5 and 10) have proportions of dependency ranging frQ1l1 10% to 20%. Villages 2, 3 and 10 have already been discussed and require no additional explanations. Village 5, the largest in the entire sample, has no particular specialization, but does serve as a varied market and' service center for several other villages roundabout;!!:!
An occasionally important main or subsidiary occupation which was not included in the figures of non-agricultural workers was the casual gathering and selling of wood for fuel, which was of significance in at least six Villages.
23 Among the services it offers (subsidiary occupations included) 'are those of 11 stone-masson~, 9 tailors, 3 brick-.m'lkers 2 tea-stall operators, 2 cycle-repaIrmen 2 specialized cloth shopkeepers, 2 nee-millers, biri whole~aler; 2 .medical practitioners (1 homeopath' and 1 hakim),1 oil-press renter, 1 garland 'maker, and a good nU1~ber of the more Common traditional occupations like carpentry, blacksmithying, potting, barbering and clothes-<washmg.

The proportions ot households mainly dependent on non-agricultural work performed outside the village, varied from a minimum of none to a maximum of 40%. In seven out of twenty-four cases (including only one case in the south) the proportion equalled or exceeded 30%, and in only two others was as high as 20%.
When subsidiary sources of dependence were also considered, the proportions of dependency on outside non-agricultural work varied all the way from 5% to 80% equalling or exceeding 50';; in four cases (all northern) and 30% in five others (three northern). Of course, a very hrge share of the outside work was done by workers who nO longer live in the villages, but send regular or casual remittances to their families. The proportion of households so affected approached half of all those with a dependence on outside labor.
The outside work performed was quite varied and the places in which it was done very far-flung. In terms of absolute numbers of workers, day labor and seasonal construction work were probably the most important sources of employment, e,pecially in the South, though the remuneration for this type of ca.sual work was usually rather slight. Carting and itinerant hawkin~ were also of some importance, the former only in several southern villages. (That carting was not of importance in any northern village may be due to the better development of trucking services there, as is suggested by the data of Table 14). Among the sources of regular employment, work in tanneries was most important, especially in villages 6 and 7, biri making second, especially in village 2; and weaving third, especially in village 11. Employment at Parry's Fertilizer Plant provided considerable work also for the untouchable castes of village 6, while the Paraiyans of village 16 found
143
considerable work in a nearby brick-works. Villages 10 and 22 each had two uncommon specialities in outside work. In the former, numerous families of the Sengundar (weaver) caste took to dealing in yarn and cloth, while all twenty or so households of the Sambadavar (fishing) caste were mainly itinerant fish-mongers, selling fish shipped in from Madras. (This caste. all of whom do subsidiary seasonal fresh-water fishing, wa~ encountered only in this villag~). In village 22, around thirty Muslim families divided their efforts mainly between the managing of rented mango groves from which they were tlien allowed to sen the produce (a practice also encountered in Central Uttar Pradesh), and seasonal work as itinerant nickel platers over an area of several thousand square miles, an odd combination, even for India.
The chief sources of employment for workers living outside the village was undoubtedly the army, especially among Paraiyans, including very often those who had become Christian or received some educalion. Villages 1, 4, 5, and 9, were those most affected. Mining in the nearby Kolar Gold Fields of Madras was also quite important. especially in viUages 3, 13, and 17, and plantation labor in upland Mysore or West Madras was the chief source of outside employment in villa!!e 16, and a minor "ource in several others. Work in various clerical and government jobs in Madras, factory work in Bangalore, and work in South India's only steel mill at Bhadravati, Mysore were among the other more distant sources of outside labor.
It is difficult to discuss in concise, meaningful, quantitative terms the adherence to or departure from caste occupation in this area because of'the ambivalent ~tatu~ of the Paraiyans who· form the largest cr second largest caste groUp.24 A few qualitative
O4On a number-of occasions. when asking how many of the Paraiyan househdds still removed carrion from the village, the author waS told that all did. In other caseS it was stated that one or two household~ were appointed by the village council each year tn organi7e that work with their co-caste members whenever l t be-. came necessary. 1 n still other cases so.me number suCh as five or six waS given. In practiCe, when the first anSwer was given, it would have been unrealistic to list all the Parai),an houfcholds as beinp sub8idiarily enFllred in non-agricultural production, and a ccmrromi~e expedient W?~ <'dcpted. e.g., te' count Paraiyan households a~ so engaged at the rate of five for every hundred families .mainly engaged in culthaticn.

observations may, however, be ventured: (a) Within the villages the traditional artisan and serving occupations not orientated towards a large outside market have greatly declined, but, to the extent that they persist, they are almost entirely carried out by memb::rs of the appropriate specialist castes. (b) Except for the Paraiyan, a majority of the househoIOs in non-agricultural castes still depend to some degree on their caste occupation, even though they may also be subsidiarily or mainly in cultivation. The jajmani system of ties would still appear to hora to some degree for most of this group. e c) For such degrading occupations as tannery work, or work in a fertilizer factory, or earth-:work on construction projects, the great mass of labor still comes from among the low-caste- Hindus and the Muslims. (d) Weaving, where flourishing, is apt to attract a variety of castes, including cultivating castes. (e) A variety of village occupations of a non-traditional sort or for which the , appropriate caste exists in insufficient numbers, are apt to be taken up by almost anyone with the necessary initiative, education or capital. These include- teaching (many
144
educated Paraiyans have become teachers), shopkeeping, tailoring, milling, bicyclerepaIrIng, etc. Occupations involving handling of food, however, would almost surely not be undertaken by untouchables. A summary evaluation of the present situ· ation is that there are many and important departures in the study area from any strict, cas~e-regulated allocation of labor.
Occupational Structure and Economic Developmenf.-Table 16 shows the relationship of a variety of occupational and selected other variables to level of economic development on a village-wise basis within the study area. From the table economic development would appear to be positively correlated to variables 1, relating to village size, 2 and 3 relating to non-agricultural work within the villages, and 8, the per· centage bf households in high castes. The latter correlation, however, is not regarded by the author as significant because of the small number of households involved. The other three correlations are virtually universal in India.
TABLE 16 THE RELATIONSHIP OF SELECTED VARIABLES TO LEVEL OF ECONOMlC DEVELOPMENT
IN TWENTY-FOUl? SAMPLE VILLAGES OF TAM1LNAD*
Level of Economic Development
Variable r- ..A.-
t "A" & 13 "C" 6 uD" "B"
4 Vil1age~ Villages Villages
1. SiZe of Village 258 213 143
2. % of Households Mainly Dependent on Non-AgricultUral Work within the Village . . . • • . . • • • • 19 9·6 4'5
3. % of Households Mainly or Subsidiarily Dependent on Non-Agricultural Work within the Village ••••••. 27 18 16
4. % of Households Mainly Dependent on Non-Agricultural Work outside the Village by Workers living in the Village . . . . • 6'4 8'5 13
5. % of Households Mainly or subsidiarily Dependent on Non-Agricultural Work outside the Village by Workers Living in the Village. . . 10 17 31
6. % of ~ouseholds Mainly Dependent on Non-Agricultural Work outside the Village by Workers Living outside the ,Village . . . . 12 6'5 7'8
7. % of Housebolds Mainly or Subsidiarily Dependent on Non-Agricultural Work outside the Village l?y Workers Living outside the Village . 19 9'1 9'5
8. % of Households in High Castes 4'0 3'8 0'5
-------------*AlI figures are llv~nges unweighted for village size.
There appears to be a negative correl:ltion between variables 4 and 5, relating to non-agricultural work pursued outside the village by workers :living in the village, and economic development. This is prelmmably because: (a) the poorer villages are those in which internal unemployment or, more precisely, underemployment is high, thus forcing many workers to forage in the towns for such casual day labor as may come along or to take seasonal work as gang-labor on the roads, in brick-kilns, etc.; and (b) the poorer villages are those from which larger proportions of easily-exploitable, low caste households go to other villages a:nd towns to work in such occupations as biri-making and tanning, which other castes do not readily take to.
With respect to variables 6 and 7, relating to non-agricultural work outside the village by workers living outside, no clear pattern emerges; but the "A" and "B" type village do score significantly higher than the remainder. The probable explanation for this fact is that those villages wlth a larger proportion of more prosperous and better educated households (i.e., the more developed villages) are able to send out more of their sons to cities or to the army for relatively remunerative work and that the remittances sent home augment in turn the prosperity of the villages. Those who leave the poorer villages owing to economic distress, often do so only after they have lost all their land and find it impossible to live on what little agricultural labor is locally available for them to do. In such cases they are apt to take their families with them to the goldfield at Kolar or to the plantations and virtually sever their village ties; or, if they do leave their families behind, these unskilled, uneducated peasants are not likely to be able to find jobs which will permit them to send home sufficient remittances to increase materially the wealth of the village.
A final word is in order on the difference in prosperity between the northern twelve
145
villages and the 50uthern twelve. Counting a village development rating of "D" as equal to zero, "C" as equal to one, "B" as equal to two, and "A" as equal to three, the ,average development score in the North works out to 1'17 as opposed to 0:83 in the South. The difference is, no doubt, significant, but not sufficient in itself, the author feels, to account for all of the considerable differences between the occupational structures of the two areas which are indicated in Table 15. One must also. remember that the greater proximity to urban areas and major transpon routes which resulted in a higher degree of mobility and non-agricultural employment in the North, did not in all cases make for a higher level of prosperity. Thus, villages 6 and 7 which have among the highest rates of non-agricultural employment outside the village, are among the six poorest in the study area, because the outside employment obtaincd was so poorly rewarded.
Deccan Lava Plateau (Map 27)
General Background.-In order to examine the effect of commercialized, but non-plantation, agriculture on occupational structure and economic development, an area within the cotton-growing tract of Berar on the Deccan Lava Plateau was selectcd for study. Few other, if any, nonplantation areas are so highly geared to the production of crops for sale. The exact locale selected was in the district of Amraoti (Amravati), the only district in India in which more than 40% of the net sown area was given over to the cultivation of cotton.25
The study area forms a small part of a large and remarkab1y homogefleous region between the Gawilgarh Hills on the north and the Nirnial Range alMg the Hyderabad border, well to the south. The personality of this region is compounded of three main elements: the physical imprint of tbe
25It was originally intended to ~x~end tbe investigation eastward into Wardha and Nag ur Districts also b.ut, due to !he fact th~t the autholi s mterpreter became seriously ill sbortly after the work began nly five .vIllages, all m Aroraoh, could be covered. ' 0
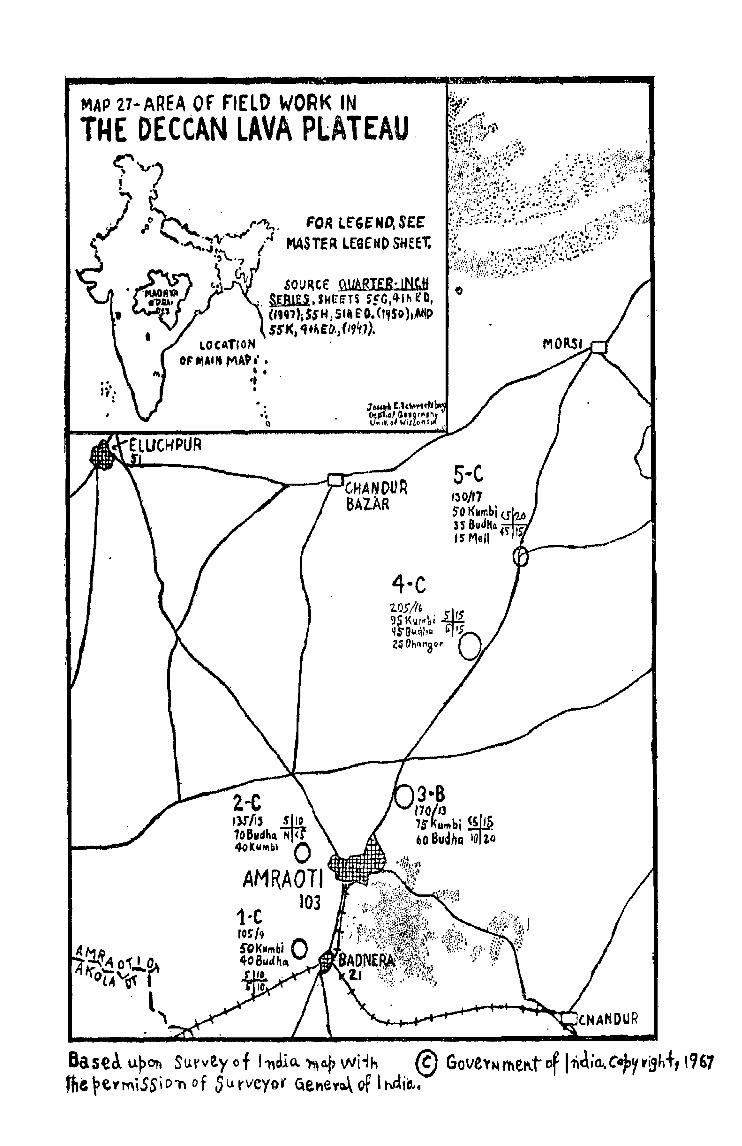
MAP 27 .. AREA Of F'tElD WORK IN THE DECCAN LAVA PLATEAU,
2~C I)J" {I, 1l!t loBudh~ -NFf 40 KuM.bl 0 AMRAOTI
103
3-8 170/13 7sklllllbi ~ 60 8udhG ToJ1o
Bas~J. UPOh SUl'vty of l1ldla.. 'ma.p Wi,h @ GoveYtHnel\ttlf 11l~ia..C.pyr\9h+, \967 tf;& peY'miSSi D1') of S It rveyor Cie.neva.\ of I tvli{l.~
Deccan Lava flows which have resulted in the formation of an expansive plain of fertile black soil, sporadically broken by broad, lpw mesa-like eminences; the econo· mic imprint of a producHon system based on cotton (with jowar as the chief grain); and the imprint of Marathi culture.
The amount of farm land per capita of rural population in Amraoti is moderately high by Indian standards, 'lince much the greater part of the area is under cultivation, while the rural population density on the plains (the northern. third of the district is mountainous) is only about 225 per square mile. Unfortunately, however, the area is prone to crop failure and occasional famine due to the erratic nature of the monsoon. Unfortunately, too, the available land is very inequitably distributed and the proportion of the population wholly or partially dependent on agricultural labor is exceedingly high. This is in part a function of climate and in part a function of the dominance of cotton, since in bad years more and more marginal cultivators have to sell out or forfeit their land to their creditors. A corollary of the above is that much of the land in the area, including a majority of many villages, is in the hands of absentee landlords, resident in Amra6ti and other townS.26
The villages of the area are compact, well-spaced, and relatively sman in size, with an average of slightly over SOO inlhabitants. The degree of urb'anization, 27'5%, is fairly high. The city of Amraoti, with its outIyir1~ cantonment area, just clears 100,000 in population, as of the. J 951 Census. while a well-spaced network of subsidiary towns, up to 50,000 in population (ElHchpur and its cantonment), afford urban services t9 alt parts of the area. Bus and truck ,transport is well-developed between the towns; but the area is deficient in regard
I47
to rail service, while the network of backroads over which ox-carts transport the !harvests 10 market leaves much to "be desired. Manufacturing is confined largely to the seasonal ginning and pressing of cotton and cotton seed and groundnuts in small scattered, power-driven mills, though several larger, year-round cotton textile mills are also in operation.
Ethnically, the region is relatively simple. Kunbis (Marathas), the dominant yeoman caste, comprise over a quarter of the total population, and form the dominant group in the great majority of villages,,27 The second largest group, formerly tbe Mahars and now caUed Naobudhs (literally neoBuddhists), accepted Buddhism virtually en masse following the conversion of their late leading figure, Dr. Ambedkar, one of the chief architects of the Indian Constitution. An agricultural laborer caste, traditionally associated with tanning and the removal of carrion, they are now completely disassociated from the latter two types of work in consequence of their religious conversion. Nearly a fifth of the total population, they are occasionally the largest caste in a village and almost always ,the second Inrgest caste. In th~ five villages of the study area, the two groups named abov~ comprised an even larger proportion of the totnl population than in the district averages: the Kunbis fotmed nearly twofifths of the total sampled population and the Naobudhs, close to a third.
All other groups are relatively unimportant. Brahmins and other high caste Hindus probably account for less than 5% of the district population and aU Muslim castes. hig:~ and low, only around 10%. Among the artisan and serving castes, those who appear to be ubiquitous, or at any rate, very widespread include the, metalworkers, carpenters, barbers, washermen,
B bId L w Wl1S passed putting ceilings on the size of holdings 26Tn Dece~ber, 1.9?8, the . Om ay an . ~ f cultivation and establishing other supposed legal
subject to certam condlhon~ relatmgto the supedTVlsl?n If ral labourers. At t he time of the author's visit in guarantees for the protectIon of tenants an agncu ,? May 195'9, there had not yet bee.n time to put the law mto effect. "
;7[ r t' s Kunbis and Marathas ~Te listed as separate groups. In the au~hor~" e~penen~, how-ever thesf:oet~~~gwere used synonymously and, thoug.h ~light social oleavage may eXfSl Wlthm thl< a~lp"e¥at~ for all practical purposes, economically, it fonns a sm~le ~af>te 1
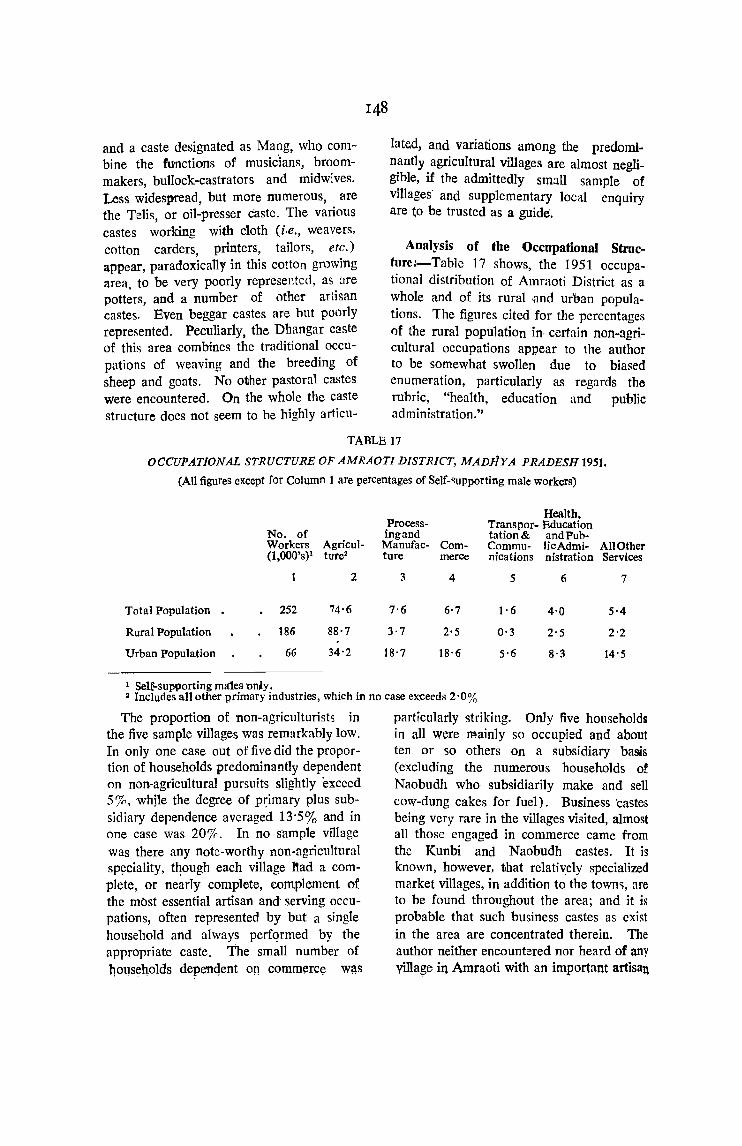
and a caste designated as Mang, who combine the functions of musicians, broommakers, bullock-castrators and midwives. Less widespread, but more numerous, are the Telis, or oil-presser castc. The various castes working with cloth (i.e., weavers, cotton carders, printers, tailors, etc.) appear, paradoxically in this cottOn growing area, to be very poorly represented, as [Ire potters, and a number of other artisan castes. Even beggar castes are hut poorly represented. Peculiarly, the Dhangar caste of this area combines the traditional occupations of weaving and the breeding of sheep and goats. No other pastoral castes were encountered. On the whole the caste structure does not seem to he highly articu-
lated, and variations among the predominantly agricultural villages are almost negligible, if the admittedly small sample of villages' and supplementary local enquiry are to be trusted as a guide.
Analysis of the Occupational Structure;-Table 17 shows, the 1951 occupational distribution of Amraoti District as a whole and of its rural ,and ur'iJan populations. The figures cited for the percentages of the rural population in· certain non-agricultural occupations appear to the author to be somewhat swollen due to biased enumeration, particularly as regards the rubric, "health, education and public administration."
TABLE 17
OCCUPATIONAL STRUCTURE OF AMRAOTI DISTRICT, MADHYA PRADESH 1951.
(AU figures except for Column 1 are percentages of Self-supporting male workers)
Process-Health,
Transpor- Education No. of ingand tation& and Pub-Workers Agricul- Manufac- Com- Commu- licAdmi- All Other (l,OOO's)1 ture2 ture merCe nications nistration Services
2 3 4 5 6 7
Total Population 252 74·6 7·6 6·7 1· 6 4·0 5·4
Rural Population 186 88·7 3·7 2·5 0·3 2·5 2·2
Urban Population 66 34·2 18·7 18·6 5·6 8'3 14·5
1 Self-Supporting ma1es only. 2 Includes all other primary industries, which in no case ex~eeds 2 ·0%
The proportion of non-agriculturists in the five sample villages was remarkably low. In only one case out of five did the proportion of households predominantly dependent on non-agricultural pursuits slightly exceed 5%, whjle the degree of p~imary plus subsidiary dependence averaged 13·5% and in one case was 20%. In no s'ample village was there any note-worthy non-agricultural spyciality, t~ough each village ~ad a complete, or nearly complete, complement of the mbst essential artisan and' serving occupations, often represented by but a single household and always perfqrmed by the appropriate ca~te. The small number of households depentlent on commerc~ was
particularly striking. On1y five households in all were mainly so occupied and about ten or so others On a subsidiary basis (excluding the numerous households of Naobudh who subsidiarity make and sell cow-dung cakes for fuel). Busine·ss ·castes being very rare in the villages vi,;ited, almost all those engaged in commerce came from the Kunbi and Naobudh castes. It is known, however, that relath:ely specialized market villages, in addition to the townc:;, are to be found throughout the area; and it is probable that such business castes as exist in the area are concentrated therein. The author neither encountered nor heard of any village in Amraoti with an important artisan
spiciality, Even the city itself wa.;; consnicuously lacking in artisans. Tn all probability specialized artisan villages arc either non-existent in the area or exceedingly few.
On the whole relatively few families engaged in work outside the villages. Only abollt 5% of all households, on the average, were dependent mainly an outside labor and somewhat over twice that figure were mainly or partially dependent. The type of work engaged in varied. From the villages ncar Amraoti and Badnera a fairly 1::trgc proportion of the outside worker,>, especially among the Nnobudh, had such job" as casual day labor, driving cycle rickshaws, and the like. A few were also eng-aged in factory work or in petty .£!overnment jobs_ especially as peons (messengeT<l), Further away (in villages 4 and 5), the OCCllf1:11ion
of driving buUock cart<; is an important subsidiarv occupation, especially among the Kun'bis. Outside Jabor on rond constmclion nnd nl::tintcnancc is apt 10 he of moderate importance in any area. especially among the landless labourers. Dependenceon workers living permanently outside the vi11nge is very slight.
With regard to the caste determination of occupation, jt has already been said !h!'lt the most es"ential artisan and serving occupations arc always performed by the apprnpriate caste members; and, it may be add~d, by them only, But, it c;hould he noted that th\.' services rendered today are "aid to he almost woolly on a commercial b3~is, rather than customarily determined, ano that lIlt traditional Ja;mani system is all but dead. This may be the underlying reason fot' the paucity of non-agricultural caste households in the "ample villages. For. 1f a kamil1 household were to 10se its inherited clientele due 10 the breakdown of the system, and to have to depend on the free play of the market. there would he little point in its remaini'ng in the village if there were ~ufficient competition from other household" of the same Caste, The author a.,<;umc", therefore, that at some past period there W~~ n considerable emi{!ration of nonac;ricu1turists from this area, TI! th? past
149
decade or so, however, the period about which field enquiries were made, no pronounced emigration seems to have taken place. Yet in this same period a number of households of artisans and washermen reportedly chanl?;ed from a primary to a subsidiary dependence on their caste occupations while some others ab:mdoned them altogether t,) become full-time agricultural1aborerl;,
But while ccrtain profe!'.sions were being 'abandoned, others, for which there was a riqing demand, were being newly taken up. Tailoring, for example, was taken up by one or more households in n:J fewer than five different ca~tes, induding one Br:lhmin anel several Kunbi hou<;eholds. Milling (by dieljel-power) has been introduced by Kunhis to several villages. A number of Kunbis and members of sundry other castes ltave become school-teachers and petty clerks. job.; usually taken by Brahmins, who ,however, are relatively scarce in this area.
Another set of occupational changes has resulted from the conversion of the Mahars to Buddhism around 1955. Some of them have since taken up the marketing of milk, an occupation which would have been unthinkable for them in an earlier decade; and all have completely abandoned their former subsidiary caste work of removing dead cattle and flaying and sel1ing the hides. With no-one else in the village willing to remove carrion, each household owning livestock had to mnnage that odious task for itself when the need arose; and, in 1956 four or five Kunbi hour,eholds in one vi]1a~e actual1y began to take up the occupLltion, as well as the sale of hides, on a commercial basis:
J)ccupational Structure and Economic Developmenf.!-Since the sample of villages in the study area was so small and inc1uded but a single village (number 3) noticeably better off than average and none noticeably worse off, it is impossibJe for tbe author to state any meaningful generalizations re1ative to tJhe micro-rdationships of
economic development and occupational structure as seen at the village leve1. If the one "B" tYPe village differs, from the others sampled in any significant respect, it is in the fact that its population had managed to obtain a greater number and variety of outside jobs. Internally the villages were very much alike.
But one major generalization may be made relative to the area as a whole, namely that a very high degree of commercializa}ion, unattended by a high degree of prosperity (and, in fact, occasioned by periodic severe economic distress) has undermined the jojmani system of Jabor aUocation and reduced the number of village non-agric91-turists to a number which probably approaches that which would result from the workings of thelaws of supply and demand in a free market economy situation.
Ajmer
(Map 28)
General Background.-Of all the districts in India only sixteen were reported by (he Census of 1951 as having lower proportions of workers in the prfmary sector th,an the 50'5% so classified for Ajmer. In all of these cases but one, the districts contained cities of over 248,000 inhabitants or formed a part of the Calcutta Metropolitan Area. (The lone exception, Dehra Dun; is a relatively thinly populated mountainous dist~ict dominated by urban hill stations.) While Ajmer is itself 43% urban and contains one city of 197,000 in addition to six towns, it remains to be explained: (a) why the district is so highly urbanized in the first place; (b) why, in view of the high degree of urbanization, as many as 19% of the rural population is to be found in non-agricultural activities, and (c) what the rural pursuits are and how they are organized.
An analysis of the site, situation, and recent political and economic history of the area wiTI throw considerable light on the first question. The city of Ajmcr occupies
ISO
a highly defensible niche virtually surrounddd' by steep, fortress-cappt!d hills at the southernmost of the major eas(-west gaps through the Aravalli Range. It i~, thus, the natural point of transit for goods emanating from sou,thern Rajasthan, Gujarat, and formerly also southern Sind (now in Pakistan) and destined for the Western Gangetic Plain.
Probably because of .its strategic location the British established themilelves in Ajmer relatively early (1818); and the are:l has remained an exclave of British India ever sinee (as opposed to the natIve states of which pre-partition 'Rajputana was mainly comprised) until becoming a scp'lrate state of the Indian Union jn 194728• Except for the brief flare-up during the Mutiny of 1857, the turbulence in the pol,itical history of Ajmer ended with its cession to the British, while that in the surrounding princely domains continued. In cons,equence of its relative security and advantageous location, the city, which was already a place of pilgrimage as the shrine of a saint revered' by Hindus and Muslims alike, developed as a major entrepot. This development was greatly furthered bv the completion of the Bombay-Delhi rail link through Ajmer in 1879,. The city has since become the headquarters of the Western Railway and the site of an important railway workshop,. which today. provides employment for over, seven thousand workers.'
Despite the semi-aridity of the area, the development of irrigation, works und~r the aegis of the British has resulted in a prqnounced extension of cultivation and the growing of rabi (dry season) as well as kharif (monsoon season) crops. In addition to cotton' and oi1~seeds (mainly mustard), f9dder crops have become an important source of cash incOme in this largely pastoral area. Due to transhumance from the Thar Desert to the west, the ,livestock popUlation rises greatly in the dry season, and provides an excelJent market for the sellers of fodder.
28lQ 195q it W~ Iller!led with tb~ now qnjtell lItate Qf Raja~thal'l.
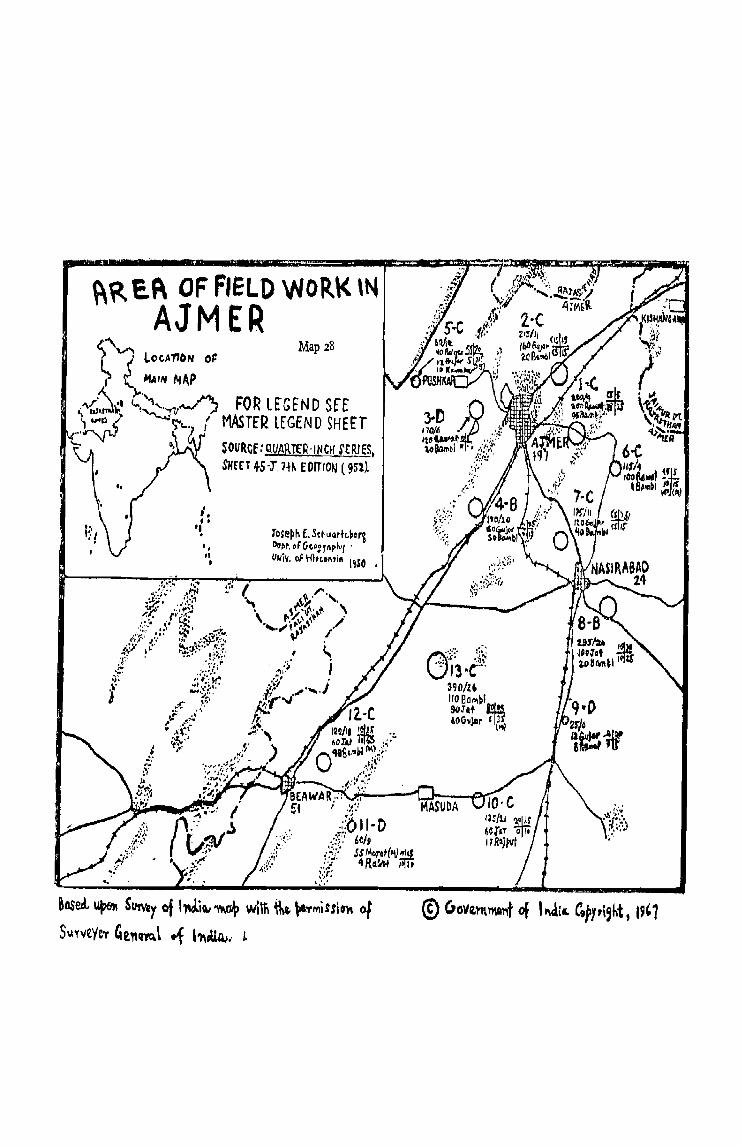
~R e.~ OF FIELD WORK \N AJMER
" .. t
Map 28
1ose~'" E.Sch'llrtLbe'l Ilo~~, or G(.O:T~ph'l ' Cllliv. cF HIH6I\J'ft I,SO
&osed.. ~ 5uw.y of l?\1li"~ ~th fu. ~H1i~siGl\ 01 S~'f"tYe., GtYlq-ml ..f 1')\cUA,., L
:Beawar, the second city of the "district, is India's most important market for wool and one of its chief wool manufacturing centres. Cotton 'textile manufacturing is, however, an even larger source of factory employment, and there are at least twenty additional seasonal ginning establishments in the state. llhe manufacture of bitis and snuff is also of note. Artisan specialities, however, have not, on the whole, developed to a very high degree, with the exceptions of lace embroidery, and cloth-printing. Weaving has declined in the villages; but the industry is far from dead. The mining of mica and the quarrying of marble and slate in the hills is of some importance.
Under British rule Ajmer developed not only 'as a center of rail transport and trade. but also, thanks to the location thcre of important military and social establishments, as a center of health and educational services. The cantonment at Nasirabad provided the basis of the economy of the state's 'third largest town, while the Mayo Hospital and College at Ajmer became impOl"tant institutions.
The villages of Ajmer, consisting of houses of adobe and stone construction, are generally highJy nucleated, and widely and unevenly spaced. Not infrequently they are situated on or at the base of rocky eminences, for purposes of defence, or, alternatively, at the site of natural or manmade tanks Or springs. The average village population is about 575, though nearly two thirds of all villages ihave fewer than 500 inhabitants. Rural population densities are about 170 per square mile.
Of the seven urban places in the state, mention has already been made of three. A fourth, Pushkar, with but 6,000 permanent residents is an important place of pilgrimage, since the small lake on which it is located is said to be the holiest in northern India. The remaining three towns lie outside the study area. cSeveral additional places within the study area, Masuda, for example, though officially classified as
villages, fQnctiOD as market towns. Such places are often walled and dominated by a fortified castle of the forqJ.er local jagirdar, all in the best of feudal tradition.
Ethnically, the area is fairly complex. There is no single dominant caste at the yeoman level. Rawats· are probably the largest single group, l:rut Jats, Gujars, and, to a lesser degree, Merats, who may be either Muslim or Hindus, are also important. All of these yeoman groups tend to be mutually exclusive. Thus, in a given village where one is dominant the others are apt to be totally absent or represented by but a few families. An interesting aspect of the caste composition of the area is that the villages in which Rawats or Merats are the chief yeoman castes tend to have very few other castes while those dominated by Gujars or Jats te'nd to have a great many. Thus .. the four villages visited by the author in which one of the former two castes dominated had an average of but 4'25 castes (the average village size was 159 households), while the nine Jat or Gujar villages averaged 17'9 castes (and 189 households), the four Jat villages alone laveraging 21.3 lcastes (and 273 households). How this situation came to pass is an interesting matter on which to speculate. But it appears to the author that a highly ralnitied caste system was introduced into the area only with the advent of the J ats and Gujars (just when is not certain) and that the indigenous Rawats and Merats have, to this date, adopted the system to a very limit~d degree at best. There was, significantly, not a single Brahmin or other high caste family encountered in any of the four sample Rawat or Merat villages, and very few artisan and serving castes. The three Rawat villages, however, all had very small minorities of Bambis, who form, in this area, the chief group at the bottom range of the caste hierarchy. Purely pastoral castes are very poorly represented, unless one accepts the verdict of some scholars who classify the Gujars as a pastoral people, which undoubtedly they originally were·

High castes, as already noted, are numerically unimportant in the study area; and they do not appear to be as clustered as in ot!ler areas studied. Four groups only are noteworthy: the Brahmins (encountered in six of the fourteen villages), the Sadhus, or temple assistants (in seven villages), the Rajput-Thakur group (in seven villages), and the Mahajans ~often of the Jain religion), the chief co~mercial caste (in tive villages).
Of the artisan castes, only ,the Khati, or carpenters (in eleven villages) and possibly the Kumahars, or potters, (in eight villages) approach ubiquity, while among the servant castes, above the lowest levels: the same can be said, only of the Nais or barbers (in nine villages). None of the groups named ever forms more than a few per cent of all the households in a village. The castes of goldsmiths, blacksmiths, oil pressers, cloth printers,. tailors, and a few other artisan groups were all very poorly represented, none being found in over six villages. Of the washermen's caste, but a single household was encountered.
There are at least three separate castes associated with drum-beating, though one of these, the Jachak (or Bhat), are also genealogists and casual beggars. Begging is the main occupation of several additional castes as well.
Three groups of former untouchables, traditionally associated with some artisan occupations, but ill practice mainly agricultural laborers, are significantly represented in the study area. The Bambis, who are weavers, leatherworkers, and removers of carrion by caste, are, as already stated, much the most important of these. They are the most numerous caste in the largest sample village of the study area, the second most numerous in eight others, and are absent from only two. Raigars, also traditionally associated with leather work (but not weaving), are the largest group in one village and are also found in seven others. Bbangis (Mehetars), sweepers by caste, are found in seven viUages, but in none account for more than :six households.
Analysis of the Occupational Structure.Table 18 indicates the Census' occupational
Castes associated with traditional cere- distrihution of Ajmer as a whole and also monial functions were very widespread, of the rural and urban popUlations. While, though not very numerous, being found in on the whol~, the Census figures seem small numbers in every sampled village. crediJ.Jle, certain figures for minor categories
TABLEts
OCCUPATIONAL STRUCTURE OF AJMER, 1951
(All figures except for column 1 are percentages of self-supporting male workers)
Health, Process- Transpor- Education
No.of ing and tation and & Public Workers Agricul- Manufae- Commu- Adminis- All Otber (1,000'8)1 tural! ture Commerce nications tTation Services
1 2 3 4 S 6 7
Total Population 189 49'5 16'7 11'1 3'4 7'1 12'1
Rural 109 81'0 7'8 3'7 0'8 1'6 5'4
Urban Non-Citya 30 7'5 31'6 22'7 3'3 15'3 19'7
Ajmer City 49 6'4 27'2 20'5 9'2 14'5 22'S
1 Self-supporting males only. ! Includes all other primary industries :3'5% in the total populatiop.; 3'6% in tne rural; 1'5% in
the urban Non-city; and 4'8% in Ajmer City. , Includes Ijeveral towns outside the study area.
154
not listed separately in the Table seem most improbable: that the population of Ajmer city included 276 self-supporting males who lived primarily from hunting, while not a single individual in the rural population. was so classified and that the number of fishermen in the city was 2'2 % of all workers· as against only 0'1 % in the rural population. Since the author did not encounter or hear of any hunting or fishing castes in the area, this does not appear to be a case explainable by the enumeration of caste rather than actual occupation, Perhaps it is simply due to some accounting error in the Census compilation.
Comparison of the villages in the study area reveals considerable internal variety. Thus, in respect to the proportion of all households mainly dependent on nonagricultural work withil)l the village, the sample villages range from zero per cent in two cases (9 and 1"f) up to 55%, jn village 5, though only two other villages (10 and 13) score a:s high as 20%. The unweighted average for the entire sample was 12 % . If one considers subsidiary as well as primary dependence on non-agricultural sources, of income within the viIlage, the average rises to 26.% and even greater variety is apparent. The range is from a minimum of 5% in village 3 to a maximum of 70% in village 5, bgth in the vicinity of the city of Ajmer.
Of the thirteen sampled villages, no fewer than seven had some significant nonagricultural speciality which was provided not only for the village popUlation itself, but also for the villages roundabout, or for marketing further afield. Thus, village 2 had ten families subsisting mainly from their work as drum-beaters; village 5 had nn important specialization in twinemanufacture (semi-mechanized) and a lesser specialization in leatherworking; village 8 was a center for the manufacture of such diversified articles as twine, needles,
soap, hair oil, and combs (all by the twelve households of the Ganwaria caste, who, for eight months of the year, are farranging itinerant hawkers); village 10 had a minor specialization in weaving (seven households only); village 11 had around twenty households engaged in the subsidiary quarrying and marketing of building stone; village 12 had a moderately important l>pecialization in the making and repairing of shoes; and village 13, despite its relative inaccessibility, was an important general market (thirty households of the Mahajan, or trading, caste lived there) as well as an important producer of pottery and handloom cloth. Yet, with the probable exception of village 5, none of the above could be considered predominantly non-agricultural villages. Even· in village 5 only 15 % of all households had absolutely no stake in agriculture, while in no other village did much more than 5% of all households have no connection with cultivation.
Several usually subsidiary occupations have not been counted in the above figures on non-agricultural employment. Among these is the marketing, by the producers, of milk and other dairy produce or of wool, activities considered merely as ancillary to agriculture.29 Villages 2, 3 and 12 were important in this respect. Also excluded was the gathering of wood in forests near the villages for sale in urban markets. This means of livelihood was particularly important in village 3, in which Qver 40% of all households were said to depend mainly thereon (though they were engaged also in cultivating or raising livestock) and over 60% mainly or subsidiarily; and it was fairly important also in villages 10 and 12.
The majority of the traditional nonagricultural work within the villages follows along strict caste lines. But shop keeping; the marketing of milk, wool; and wood; flour milling; the operation of tea stalls; tailoring and twine-making are commonty pursued by a variety of castes, though the
29 But. dealing in milk, wool: etc. (i.e., buying up the produce from "a~ous produc()rs in orper to s~ll at II profit) WhlCP. was alsl;> of some l1:rtportance, waS co-pnted, .
latter, which is considered a demefuling type of work, is not practiced by any yeoman group. While in the great majority of non-agricultural castes, most households continue to practice their traditional work, on either a main or subsidiary basis, a noteworthy exception are the Bambis, whose position in society, as has already been implied, is ambivalent. A great many households of this caste,) perhaps a majority now own land of their own, even though continuing in many instances to do agricultural labor; and the group, owing partly to it~ present dynamic leadership, is trying hard to improve its station in life. It has virtually, if not completely, abandoned all work connected with carrion or leather, and taken, albeit in small numbers, to a variety of new occupations, particularly twine-making and milk dealing, but also tailoring, masonry, and several odlers. Although' weaving has greatly declined among the Bambis (the only caste to engage in that work in the study area) the reasons for that particular trend appear to be economic rather than social. Unlike the Bambis, the Raigars and Bhangis exhibit no social-climbing proclivities, and even those owning land tend to stick to their caste work to the full extent of the demnad for their services.
The supply of goods and services within the village is still governed largely by customary jajman-kamin obligations, while that between villages is much more along commercial lines. An unusual instance of a compromised form of preservation of the jajmani system stems from village 5, in which, out of ten Kumahar (potter) households. eight have abandoned, or never properly learned, their craft speciality, and have taken instead to the weaving of twine and rope. All eight of these households, however, engage other potters to keep their jajmans supplied in return for the customary perquisites which were their due. Among these perquisites, it appeared, was tIre right to cultivate the land on which to grow the ban reeds needed for the making of twine.
In the introduction to the discussion of this study area, mention was made of the differences in the caste structure- of the Rawat and Merat villagels, on the one hand, and Jat and Gujar villages, on the other. This difference shows up very strikingly in the occupational structure. Thus, the average proportion of households 'primarily dependent on non-agricultural work within the village is but 1, 8 % among the former as opposed to 15% among the latter. Including subsidiary dependence raises the proportions to 12' 5 % and 31 % respectively.
With regard to the nature of nonagricultural work mainly performed outside the village, the differences among the villages were, on the whole, less great than with regard to the work done within. The proportion of households mainly so dependent varied from none, in two cases, to only 15% in three others, while, with subsidiary sources of dependence also counted, the range extended from 5 % to 50% the two extremes being each represented by a single village. The respective means were 7% and 21 %.
An unusually large proporttion of the outside workers were in some way connected with transportation. From villages 1, 3 and 6, work in the railway workshops at Ajmer forms the chief source of outside employment (the workers from village 6 live in Ajmer itself), while some workers from several other villages also find employment there. Oarting and/or donkey driving, the latter a subsidiary speciality of the Kumhar caste, are important for villages 2, 5 and 6. Gang labor on the roads or railroads is significant for villages 2 and 13. Casual, unskliled labour in Ajmer, Nasirabad, and Beawar is an important source of outside work in villages 3, 7 and 12 respectively. Many better paid jobs in Nasirabad, largely for the army, have been obtained by a variety of castes from village 8, which is located close to that town. From this village too go forth numerous hawkers, of the a1bre-mentioned singular Ganwaria caste
156
and from the potter caste as well. Permanent and seasonal work in the cotton textile and wool cleaning and pressing mills of Beawar provide the bulk of the outside employment for vil!ages 11and 12. (All twenty Raigar households in village 12 do seasonal work in the woollen mills, which, for some undiscovered reason, dr~w labor largely from the caste.) Despite the special cases cited above, outside work, especially factory and railroad work, tends to be governecl far less by consideration of caste than work inside the villages. Also of note is the fact that the Rawat and Merat vill~ges send out somewhat more outside labor than those dominated by J ats and Gujars, a situation contrasting with that found within the villages proper with respect to non=agricultural work.
Occupational Structure and Economic Development.-Two villages in the study area, numbers 4 and 8, were noticeably more prosperous and/ or had noticeably better amenities than the average, while three others, 3, 9 and 11 were noticeably worse off. The former, or "B"-type village,s averaged 238 households in size. the iatter. or "D"-type only 85, and, in between, the nine "C"-type villages averaged just 200 households. With regard to the proportion of high caste households within the villages, "B" villages averaged 13% and· the "C" villages 6.9%, while the "D" village contained none at ·all. It would appear then that village prosperity, village size, and the propOl;tion of high castes all co-vary to a pronounced extent. This is a general tendency which has already been noted for several other study aroos. The reason would appear to be quite simply, that families of means tend to congregate at places large enough to supply a good part of their wants, and that where such mmilies settle other fainilies of specialized castes will in time be attracted, or ~duced, to cOme in orde~ to satisfy still other wants. The high castes, naturally, tend to be 'among those with a larger vatiet~ of wants.
More important as a casual factor linked with prosperity in the study area is, the
constitution of the dominant yeoman caste, Of the ~ree "D" type villages, two were from among the four Rawat or Merat villages, and only one, from among the nine J at or Gujar villages, while the latter also included the only two villages of the "B" level of prosperity.
On the other hand, this area diflers from other areas in that there is no pronounced correlation (at least among the admittedly small sample of villages) between any of the occupational variables diSCUSsed above and the level of economic development. Thus, hOlliseholds mainly dependent on non-agricultural occupations pursued within the village averaged 13% for the "B" viJlages, 14% for ·the "C" villages, and wer~ negligible for the "D" villages. The corresponding figures when SUbsidiary occupations are figured in are 2~ro, 24ro and 20% respectively? somewhat more in line with expectations, though not pronouncedly so. With regard to non-agncultural work pursued outside the village, there are no appreciable differences from one class of villages to the next, regardless of whether main or subsidiary dependence is considered. Several reasons may be advanced for tlie general absence of intraregional correlations between development and non-agricultural occupations in the .study area: (a) many of the non-agricultural occupations within the villages are not primarily intended for the immediate village market, are not very remunerative, 'illld bring little wealth into the villages; (b) much of the outside employment, as in the Saharsa and Chota Nagpur areas, is attributable to economic distress at home; and (c) external trade is well developed so that goods not locally available can be obtained- from nearby markets or iti,nerant hawkers.
A. correlation which appears more consistent, although the author has been unable to devise a satisfactory method of measuring it quantitatively,.i~ that between the number of different goods and ,iervices
produced within given villages and the level of development of those villages, even though the population supplyin~ tbem may vary independently.
Kerala
(Map 29)
General Background.-Of all the major cultural r~gions of India, none rends itself to superlatives quite so readily as Kcrala, the most literate, the most Christian (save [or a few small tribal areas), the most Communistic, the most female-dominated at the family level, the most verdant, and, econOmically, and, hence, occupationally, th'e most diversified part of the entire nation. With regard to its level of economic development, Kerala is difficult to classify. Structurally and with regard to numerous criteria of general welfare. the region ranks very high, as is evidenced by the data presented in Chapter II for the state of Travancore-Cochin, which comprised most of the Kerala cultural region, which is, in turn, roughly coterminous with the Malay'alam linguistic area30• But, because of the unusually high pressure of population on resources, the per capita production of material goods is not among the highest in India, and consequently the region ranks lower in its overall development rating than it otherwise would.
In view of the bigh rural population densities, over 2,000 per square mile in much of the coastal areas an~ more than 1,000 in many hilly tracts, it is a tribute to the ingenuity of the people that they have been able to maintain their relatively advanced living standard. The economic diversification of the region has been accomplished by the nearly full utilization of virtually all aspects of the natural resource base, the creation" of a variety of small-scale and cottage industries, and the
IS7
promotion of favorable commercial ties, not only with the rest of India, but with a large overseas market as well. Because Kerala affords an example of some of the things which other hard-pressed regions of India can accomplish, even with their limited resources, it would appear to be among the areas of India most worthy of study from the developmental point of view and may point the way which other regions in time will follow, once they emerge from their current economic stagnation.
Unfortunately, for purposes of the present study, the settlement pattern of lFerala is such as to render virtually impossible the execution of the type of field work which the author carried out in other parts of India, in which the discrete village was the s.ampling unit. In Kerala a nucleated village clearly separated from its neighbours is scarcely to be found, and what are called villages, for administrative and census purposes, are nothing but more or less arbitrarily blocked-out tracts of land within which local governmental, fis~, legal, and administrative jurisdictions are established. Often these so-called villages exceed 5,000 in population (32'4% of the rural population of Travancore-Cochin was enumerated in such villages) and even. an occasional village of over 20,000 can be founds1•
Under such conditions it was impossible to carey out interviews with but one or a few informants which would cover the entire village with the detail and reliability achiev~ ed elsewhere. Nevertheless, interviews were attempted in quantitative terms in hopes of getting at least the major lineaments of the village social and economic structure.
The area of study was intentionally selected sO as to cut across the zonal division of Kerala into three contrasting regions extending roughly north-south; the Coastal Plain, the Central Hill-Lands and the
SOWith the redrawing of State boundaries under the 1956 States Reorganisation. Travancore~ochin was expanded to become the new linguistically-uniform State of Kerala.
uPor a discussion of what constitutes the "village" in Tra vancore-Cochin. see the 1951 Census, Vol. ~ Part I-A. p. 29. .
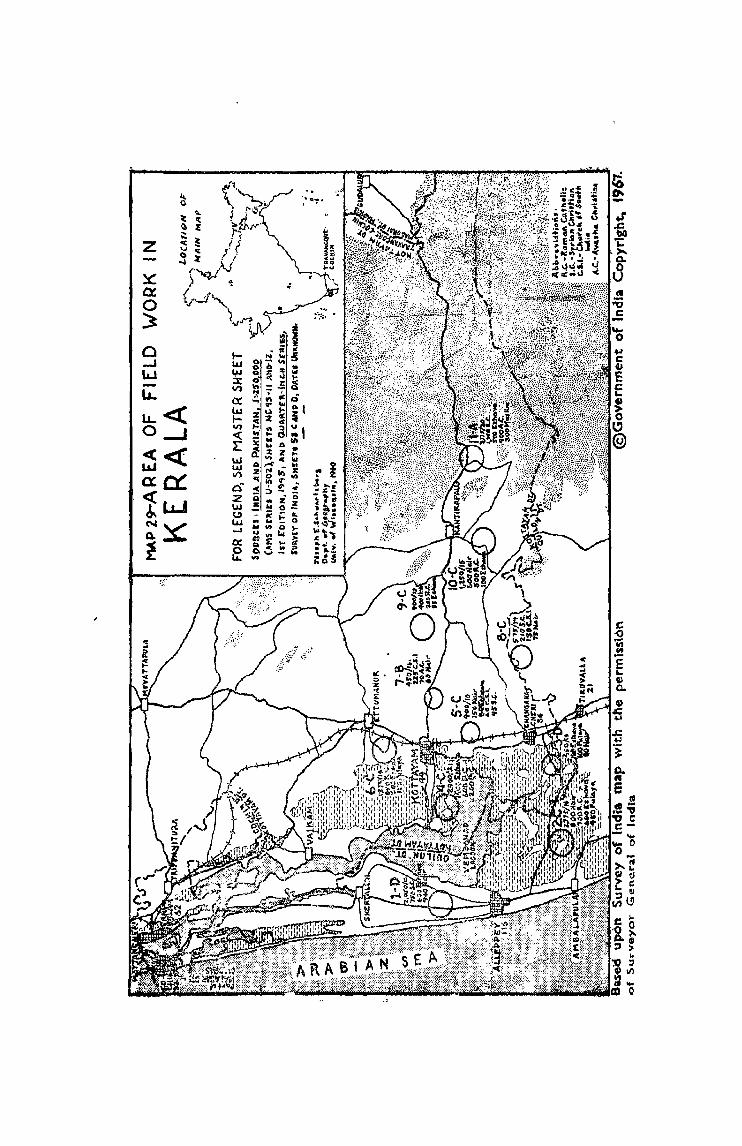
mountaInous Western Ghats (the latter known in the north-east as the Cardamon HillS'). The area centering on Kottayam was selected because, to the West the characteristic coastal topography of sandbars, backwaters and lagoons was especially well expressed, while to the east could be found on~ of the best developed plantation tracts of the region. Furthermore the area includes an interesting diversity of um'an areas: the important coir-manufacturing center of Alleppey, which is also a port of some note, though minor in comparison to Cochin further north; the district capital of Kottayam, which is also an important religious center of the Syrian Christian church: and such important market towns as Changanacheri and Kanjirapalli, the latter a center for the collection of the plantation produce of the highlands.
'The economy of the coastal area revolves about the coconut, which, in one form or another, accounts for the great majority of its exports, and, directly or indirectly, affords employment for a very large share of the popUlace. The manufacture of coir products (rope, mats, etc.), both in factories and as a cottage handicraft, is by far the chief industfital specialization; but the making of coconut oil, soap, copra, products of palm-leaf matting, and other related items are also important. Rice is the chief crop in all those areas which are submerged for too much of the year or are otherwise unsuitable for the growing of cpconut, and a variety of fruits, including the cashewnut, and vegetables are grown. Fishing too, is quite important. The 'area is, nevertheless, chronically deficient in foodstuffs and dependent on imports to survive Famine, however, never occurs.
The hilly l1liddle-belt of Kerala begins, rather abruptly as a rule, where the annually flooded portions of the coastal plain teqninate. LoeaI relief in this area rarely exceeds a few hundred feet, but the fairly fine texture of the terrain gives it a some
what rugged aspect. A surprisingly large
I59
proportion of the area IS m cultivation, Rice is grown in the valley bottoms while the slopes may be terraced for tapioca, interplanted with coconuts or planted in plantains, bananas, jack-fruit, and any of a number of cash crops such as rubber. which is rapidly expanding, pepper (for which the area has long been famous), areca-nut, ginger, or turmeric. Cultivation is carried on both by thousands of sm81!holders, as on the coast, and by mediumsized to large estates, some of which are corporately owned. A number of small factories have recently been opened for the manufacture of crepe from latex- and the processing of tea brought in from "the highlands. Among the other industries are tile and brickworks, flour-mills, furnituremaking establishments, small engineering workshops, and a large cement plant, in addition to those of a more traditional nature.
Tn the mountainous highland area of the Western Ghats the\ economy is almost exclusively based on the cultivation of plantation crops, predominantly on large estates, and on occupations ancillary to such production. The plantation industry in this area was fonnerly predominantly in British hands, but is coming more and more under Indian management. The larger plantations operate factories for the processing of their own produce, and in some cases that of adjacent estates as well; but most of the smllIler establishments ship their produce to the hill zone for initial processing. Tea is the major crop, especially in the wetter areas above 3,000 feet in altitude, while rubber is more important on the lower slopes and spreads westward into the' hill-lands. Cardamom, sup dry other spices, and lurry,cr are also produced. In terms of total area. however, most of the highlands are still unexploited. since the estatec; are limited to areas which can be reached bv the tortuous, and sometimes treacherous, access-roads fingering out from th~
prindpal highways.
Ethnically, the study area is rather complex. Although a great majority of the population are included in a few main Christian and Hindu ,groups, among the remainder the caste system is fairly highly ramified, and, as in most parts of India, there <are a number of small, but ubiquitous, specialized castes, including .several without counterparts in any other study area. The author found no clear ethnic zonation among the sample villages, though it is said that, within Kerala as a whole, distinct regional ethnic patterns are to be found.
160
Christians cQmprised close to 40% of the population in the eleven sample villag~, and might exceed hatf in the tltudy area, considering their preponderance in such urban places as Kottayam and Alleppey. They formed an 'absolute majority in four of the villages visited, the largest single group in another and the second largest in five others, and in none comprised less than 15% of the total number of households. Because of their Control over such a large part of the educational system (a Derennial bone of contention in Kerala politics), their primacy in business, and their large land-holdings, their influence goes considerably beyond what their numbers alone would lead one to expect. Yet the Christians are far from united. The Roman Catho1ics form the largest (and most prosperous) sub-division with over half the tota1: followed bv the Syrian Christians, who claim descent from the original converts of the Apostle Thomas: the Avasha Christians, who are recently converted. former untouchables and are still not fully accepted by any other Christian group (not to mention Hindus): the united (protestant) Church' of ,South India. largely Anglican in its origin: a, variety of very small Protestant IZroups: Aind even a few interesting, though numeri~lly insignificant, occupationally-specialized (sub-castes, such as one of stone-workers. claiming connection to the Catholic
church,
In terms of influence, the matrilineal Nairs (Nayars) are unquestionably the leading Hindu caste in the area. In three of the sampled villages they formed the largest ethnic group, were second in one other, and were well represented in all (never below 5%). Traditionally warriors the N-airs are, in practice, largely cultivators; and they have now taken up a ' great variety of other work, especially government service. In the sample villages the Nairs comprised close to a fifth of the total population.
The only Hindu group more numerous than the Nairs, are the untouchable Ezhavas (also called TIuvans or Tiyans), the dominant agricul'tural-labor caste of the area. Forming about 25% of the total population of the sample villages, roughly the same proportion as the Roman Catholics, they formed the largest group in one village, and the second largest in five others. They too, never formed less than 5% of the population of a Village. One other untouchable caste of note, even lower in the social hierarchy than the Ezhavas, are the Pulayas. Of tribal origin, .having orightated in Jthe jungles of the Western Ghats, they are now found mainly in the Lowland zpne. This caste, though numbering over 5 % of the total population, was encountered in only six of the sampled villages. It was not clear to the author whether or not the group had any caste occupation Other than agricultural labor.
AU the remaining groups combined ·numbered less than 10% of the population of the sample villages. Brahmins were encountered in only' four villages and were significant in none. Muslims, except for a few insignificant groups, were not divided in this area on caste lines. They were met with in five villages and in only CIne were significant (they comprised nearly 10% of village 11). Occupationally they are mainly traders. The ubiquitous specialized caste groups inclqdc<~ the carpenters, th~ b]l\c~,
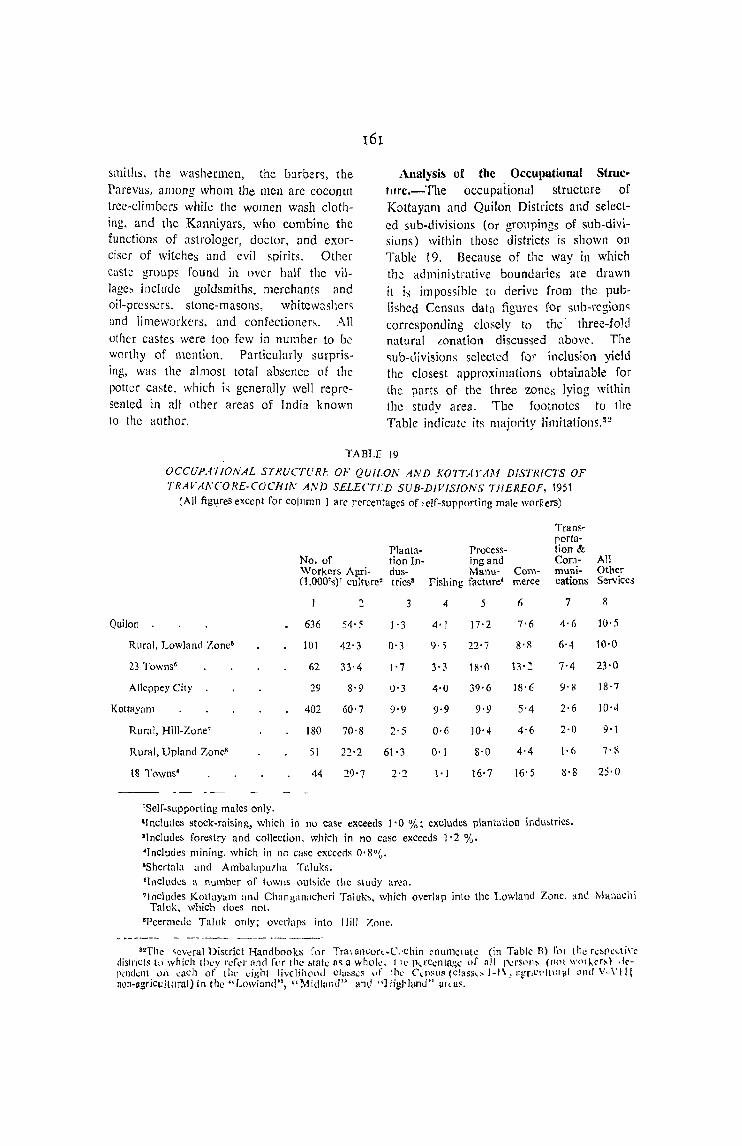
smiths, the washermen, the barber'), the Parevas, among whom the men are coconut tree-climbers whik the women wash clothing, and the Kanniyars, who combine the functions of astrologer, doctor, and exorciser of witches and evil spirits. Other caste groups found in over half the village~ include goldsmiths, merchants and oil-pressers, stone-masons, whitcwasher, and limeworkers, and confectioner~. All other castes were too few in number to be worthy of mention. Particularly surprising, was the almost total absence of the potter caste. which i~ generally well represented in all other areas of India known to the author.
16r
Analysis of the OCCUllational Struetllrc.-The occupational structure of Kottayam and Quilon Districts and selected sub-divisions (or groupings of sub-divisions) within those districts is shown on Table 19. Because of the way in which the ad1l1ini~trative boundaries are drawn it is impossible to derive from the published Census data figure:;; for sllb-rc.gion~
corresponding clo~cly to the' three-fold natural lonation discussed above. The ~ub-divigions selected for inclusion yield the closest approximations obtainable for lhe parts of the three Z011Cs lying within the study area. Tbe footnotes to the Table indicate its majority limitations. n~
TABLE 19
OCCUPATIONAL STRUCTURe OF QUILON AND KOTTArAM DlSTR'C7~S OF TRAVAf.:CORE-COCHIN AND SELECTF.D SUB-J)/f//SIONS THEREOF, 1951
(All figures exccrt for column 1 arc rCfcentages of ,elf-supporting male workers)
Traos-porta-
Plaota- Process- lion &. No. of tion In- ingaod Corn-Workers Agri- dus- Manu- Com- muni-(1,OOO'S)l culture' tries· Fishing facture' meree cations
~ 3 4 5 6 7
QuiJon 636 54-.' 1'3 4' J 17'2 7'6 4'6
Rural. Lowland Zone& 101 42'3 0'3 9·5 22'7 8·g 6'4
23 Towns· 62 33'4 1'7 3·3 18'0 13'~ 7·4
AlIcppey City 29 8'9 0'3 4'0 39'6 18'6 9·g
Kottayam 402 60'7 9·9 9·9 9'9 5'4 2·6
Rural, HiII-Zone7 180 70'S 2'5 0·6 10'4 4'6 2·0
Rural, Upland Zone" 51 22'2 61·3 0·1 8-0 4'4 '·6
18 Towns' 44 29'7 2'2 1·1 16·7 16' 5 ~·S
'Self-supporting males only.
l[ncluLlcs stOCk-raising, which in no case exceeds 1'0 %; excludes plantation indu:;trics.
'Includes forestry and collection, which in no case exceeds 1'2 %. 'Includes mining, which in no caSe exceeds 0·8°~.
'Shertala and Ambalapllrha TaJuks.
'Incllldl:s a number of tuwns oubide the study area.
All Other Scrviee3
8
10·5
10-0
23·0
18'7
10'4
9'1
7'';'.
25'0
'Illcludes J(oltayam anLl Chnnganacht:ri Tnlub, which overlap into the Lowland Zone, and l'vIanuchi Talllk, which does not.
'Peermcc1e Taluk only; overlaps into lIill Zone.
32The <;ewral District Handbooks for Tra\ancorl~(_'t·cbin enumerate (in Table TI) for tIle r~~t'CLtj\'c ctistric(s ttl which they I'cr~r nnd fOf the ,Iak as a wl1l1k, t he p\.rcCl1la.~l· of ~11 1\:rSI'fl, (nI'l w"I]..,n,) drp,ndcnt on each of the eight livciiilQod CI;I;S~S "I' ilk' (\-11StIS {elllS$l' 1-1\, nl'p~lll!t:r;t1 (lilel V-\'j II non-Bgricultural) ill the "Lowlnnd", "Midl:lIl(I" lind <'}ligJl]{mLl" ;lllUS.
162
Th.e most important things to be seen in the table are the following: (a) the strikingly high 'p'roportion of non-agriculturists and the unusually high ratio of processing and manufacturing to all service industries (columns 6-8) in rural, lowland Quilon, reflecting the importance of cottage industries; (b) the unusually high percentage in processing and manufacturillg in the city of Alleppey; (c) the importance of transport in rural, lowland Quilon, which follows in part from the fact that the maze of backwaters in that area necessitates a large number of professional boatmen; (d) the importance of fishing throughout Quilon; (e) the high proportion of agriculturists in the town populations of both Quilon and Kottayam, which indicates how far they are from being truly urban in character;:13 (0 the great difference in development oE nonprimary occupations between the rural, hill zone of Kottayam and the rural, lowland zone of Quilon; (g) the phenomenally high proportion of workers in plantatipn industries in rural, upland Kottayam.54
In general, these characteristics indicated by the Census statistics cited were confirmed by the 'author's field stuaies. The percentage of non-agriculturists encountered was, if anything, even higher than that indicated by the Census, probably because of the proximity of most of the sample villages to Alleppey 'and Kottavam or to main highways, in or along which mills and commerci'al establishments are most commonly situated. Since bus and ferry service in the area lS very frequent and eftkknt. 'and distances small, commuting to work
in extremely common. Certain backwater villages, however, can be reached only b)' boat for up to ha1f the year, and are much more isolated than those which are high and, for tnis land of torrential downpours, relatively dry.
While the sample villages in the study area did have important specializations, these were invariably the specializations one would expect as a result of their locations and crop patterns, r'ather than specializations attributable to their ethnic makeup. (Indeed, the latter is not to be expected since none of the major groups encounter:ed in the area had a specialized, non-agricultural calling.) Thus, village '1, which was located on the coast and in an area overwhelmingly devoted to the planting of coconuts had the dual specializations of fishing and the preparation of coir products, while vmage 11, which was the last village of the hill-zone (and, incidentally, the most prosperous village in the entire sample), was a center for the collection of all sorts of plantation products and for factory processing of tea and the production of rubber crepe. It would, however, be too much to assert that there are no villages to be found which are specialized along caste lines. The author was told, for example, that there were approximately three hundred weavers in two villages near Ettumanur, north of Kottayam; but, he was not told, unfortunately, which caste(s) were doing the weaving, nor how large the villages weres".
With regard to retail commerce and services no village could be called specialized since all were auite wen provided with a variety of shops, small milling establishments, restaurants (of a
-;-:rh~ i~, however, in part a fun~tion of how far out from the urban core the administrative boundaries 01 the town are drawn.
, 94 Counting in processing and manufflcturing, which is mainly done on plantations, the figure approaches 70nr and were the proportion known of the workers in commerce, transnortation, and other services who were als~o empioyed by, or on, plantations, the total might come close to 75%.
That as many as 22°/" of all workers in the so-called Upland Zone were in agriculture. is simplv due to the fact that the region overlaos into the hill-Zone. The figure of 2' 5% of workers emoloyed in plantation industries in the so-called hill-Zone is o'tttially explained by the fact that the p'lrt or the true hill-Zone in which plantation crops are most important is the part included within Peermede Taluk which was oesignated as the Upland Zone (See footnote 8 to table 19). Moreover many of the small, independent farmers growing plantation crops outside this area do so merely as an adjunct to the growing of food crops.
8& The author knows of no other weavers in the study area, and no caste therein with weaving as its !radio oinal occunation. though both may exist.

sorl) , etc. Most, in fact, also had banks. onc or more government offices~ small engineering establishments; etc., and several even had a cinema.
Yet, as has already been mentioned. some specializations along traditional caste lines do occur, as in the case of the dozen or so small castes mentioned in the introductory discussion, which are ubiquitou:>. or at least very widespread, in the study area. While most members of these castes :>till stick to their caning, they are not uncommonly found also in agriculture, as laborers or as petty independent cultivators, and they are not averse to taking On new kinds of work. For example. one washerrnan's son, it was learned, had become a mahout, or elephant tender. But when they stick to their traditional occupations, the specialized artisan and serving castes seem to do so today on an almost wholly commercial basis, with transaction mainly in cash rather than in terms of customary, jajmani-type obligations. Where possible, barbers and washermen, as well as many other groups, open shops (preferably in towns, otherwise on a well-travelled road) and let their clientele come to them rather than maJrJ.ng periodic visits to the clientele in scarch of work. It is quite common also for the traditional artisan and serving castes to broaden the range of their activities to include those for which there is a new or expanding demand. Thus, carpenters (Mara Achari) now increasingly make furniture or do saw-milling (they had long been boat builders also in the back-water villages, because of the scarcity of the Ullada, or boat-building caste); black~miths (Kolla) have taken to a variety of mechanical work; washermen (Valuthedan) may become dry-cleaners, etc.
There are several types of work done which tend to be restricted to just one or a few low castes, even though nO claim is made that such work is traditionally associated with tbose castes. Ezhavas. for
163
example, are often mainly or subsidiarily dependent on tapping the toddy-palm for the juice which can then be made into palm-sugar or distilled as a beverage. Often, too, they themselves do the distilling, legally or otherwise. Pu]ayas and Avasha Christians (often ex-Pulayas), quite commonly, and Ezhavas, less frequently, arc engaged in basketry or the making of woven objects such as mats, from the leaves of the screw-pine, a wild pineapple-like plant which thrives on the \:oastal sandbars. Sometimes the restrictions of a particular type of work to but a single caste occurs on a single village basis only. For example, in village number one, roughly four hundred Syrian Christian households were mainJy dependent on fishing and many other families were subsidiarily so dependent; but this was not true of a single household of any other caste. Just why such cases exist is not known"
In general, the low castes, Pulayas, Avasha Christians, and Ezhavas tend to be much less mobile than the higher castes, and to stick to what work they can find in their native villages, primarily agricultural labor. Very few of them own land of their own; and when they do it is apt to be insufficient to provide them an adequate livelihood. Still, some of them have managed to open shops and tea stalls or to get mill jobs in town, or to find work with the government. Literacy is now quite widespread among the low caste groups; but, partly for social reasons and partly because so many of the upper castes are not only literate but holders of high school and college diplomas, they. ~re still in an unfavourable competItlve position in a search for outside _jobs in an area like Kerala where there IS much open unemployment and where nepotic hiring practices are rife. 'Their be"t hope for employment beyond the village probably lies in the highland plantations, which also 'hire many immigrant laborers from Tamil Nad.
The high~r castes, Hindu, Christian or Muslim, seem to take to a surprisingly great variety of work. Members of any of these groups may be owners of l.lrge estates, on the one ha'6d, Or totally dependent on agricultural 1aoor, 011 the other. Shopkeeping is widely practiced by all three groups; and what Muslims there are tend to specialize somewhat in wholesale trade, even though the consignments be petty. Government service is sought by all; though the Hindu Nairs and the few Brahmins have probably . fared best in obtaining it, followed by the Catholics. The Christians (exclusive ot the Avashas) have been particularly successful in getting jobs as estate managers, overseers, or staff workers· of various lcinds-a carry-over, perhaps, from the days when the estates were mainly British managed, Many also are
tappers of rubber trees. Nairs -appeal', for some reason, much less prone to perform factory labor than Christians, while neitJler group"} is apt to take to those low-status occupations for which specialized castes exist.3tJ
Occupational Structure and Economic Development.-Of the cleven sample villages in the study area, only one (number 11) was assigned a rating "A", one other (number 7) a rating of "B", two numbers (1 and 3) the, lowest rating of D", and the remaining seven "e". So far as the author can judge, there is in the sample no clearly demonstrable internal correlation between economic development and any of the gross aspects of occupational
structure which have been statistically dealt with ,elsewhere in this chapter. Village 1, for example, which is, after vil1age 3, the poorest in the entire sample has one of the highest proportions of non-agriculturists both in and out of the village. The causes of prosperity or poverty in a given village in the study area generally are most closely associated with: (a) the man-land ratio; (b) the state of fhe market for tbe cr:ops or other produce in which it specializes; (c) the accessibility of wellpaying outside employme.nt; and (d) the ability of the village population to compete successfully for outside jobs, which is
largely a function of the linked variables of caste and education.
The poverty of village 1 stems largely from its poor land-man ratio and the excessive competition in' the depressed market for coconuts and coir. The poverty of village '3 stems from its relative isolation, its poor man-land ratio, and the relatively low educational attainments of its predominantly low caste population. ViIIage 4 makes up in accessibility to good jobs in Kottayam for what-it lacks in land per capita. Village 7 is prosperous because of its sufficiency of land and its proximity to Kottayam. Village 11, the most prosperous of the entire sample, is an entrepot for plantation produce, an important center for the factory processing of rubbet' and tea, for which the market is currently both good and expanding, a service center for the plantations themselves, and the seat of management of a large number of prosperous hill-land farms and estates.
36 One would nat~lraJly expect that a population as literate and enterprising as that of Kerala, would show an unusually high rate of emigration from their own crowded land to other parts of India. Yet, that is not the case. The Census of 1951 shows that emigrants from Kerala in other parts of India, were almost exactly equal in numbers to immigrants.to Kerala, the latter being largely Tamil plantation laborers. Both figures lVer~ about 205.000. (Census oflndia, 1951, Vol. xur, Part I-A, Report, P.15) The author found that though job and place mobility within Kerala were unusually high, a small minority of those workers living outside their villages went to other parts of Jndia. Among the reasons for this, the following are surmised: (a) That competitively the Keralan emigrant is at a disadvantage in other states because his language, Malayalam, is rarely understood outside'of his native area. (But, if he himself has any second language, it is almost sure to be English, which is, of course, still in great demand.) (b) That poor as his area is, he prefers the amenities of life at home to the drabness, unfamiliarity, wretchedness and climatic rigours of so mueh of the rest of India. (c) That without capital, he would fin,d it hard to make a start elsewhere doing work congenial to his temperament. (With capital, on the other hand, there would be Little reason for him to leave.)
Central Saurashtra
(Map 30)
General background.-Saurashtra was selected for field study because it appeared to present the paradox of a high proportion of workers in non-primary occupations cO,upled with a relatively low level of economic development. The judgment as to the developmental level of the nrea was based not only on general knowledge of its character; but also on the consensus of opinion of Indian geographers and economistsY The field study. however, demonstrated that this was an error; in fact, no other area of India proved on inspection to differ so greatly from the author's prior expectations as this one. Despite its paucity of nonagricultural natural resources and its meager development of large-scale industry, Saurashtra has achieved a level of material prosperity and social progress equalled in few other areas of India· The basic ingredients of this success include: (a) one of the most favourable man-land ratios and patterns of land distribution in tbe Indian Union; "(b) the widespread appliC<\tion of advanced agricultural techniques; (c) the emphasis on commercial cropping and the prevailing favourable markets in recent years; and (d) the enterprise of the population.
Since the Census data revealed no marked regional variations in occupational structure within Saurashtra, the author arbitrarily selected for field study a centraJJy located area as most likely to be representative of the whole state.38 The study area chosen lay around the city of Rajkot and extended for some distance to the south and southeast. This area IS -
characterized by the same type of rich, black soils as are found in the Deccan Lava area to which much of Saurashtra. is geologically and topographically similar. A broad, undulating plain with scattered, low hills, most of the area IS fit for cultivation. Rainfall at Rajkot averages thirty inches per year; and, though the monsoon is by no means reliable, tlte area has been relatively free from crop failure in recent times. Quite the contrary, it has enjoyed several bumper harvests in recent years when harvests in other parts of the country were poor and market prices commensurately high. This may be due in part to the considerable strides being made in the extension of well-irrigation. The chief cash crop is groundnuts; but cotton is also important. So too, locally, are chillies, melons and vegetables. Wheat, jowar, bajra, and even rice, from the irrigated areas, are all marketable surpl~s crops. The area is probably the chIef dairying region of the whole of India, and certainly leads in per capita milk production and consumption. Wool is also an important specialization. The differences from the virtual one-crop economy of the physically similar Deccan area are striking indeed.
Settlement is in rather widely spaced villages which are well above the Indian average in size. The rural population density is not quite 150 per square mile. The average village in Central Saurashtra has a population of about 825, even though over three-fifths of all villages have fewer than 500 souls. Although vill~ge nucleation is highly developed, isolated, well constructed, and, in some cases, fenced-in farmsteads, of quite recent
. origin, haVe also become a oharactpristic
31 In under estimating Saurashtra the writer appeared to be suffering from a rather common misconception. The consensus of opinion of fifty-three Indian geographers and economists in a survey conducted by the writer ranked the region of Saurashtra-Kutch thirteenth in a field of twenty regions covering the entire nation. Yet, the wdghted development index score for the same region, as shown in Chapter n, was the fourth highest in a field of eighteen.
38 Saurashtra existed as a separate state for only a few years after India's attainment of independence. Previously it had been a congeries of literally hundreds of petty princely domains. In 1956 it was merged into Bombay State, and in 1960, former Saurashtra and Kutch and the remainder of theGujarati-speaking portions of BombRY. were split off to become the new, unilingual state of Gujarat.
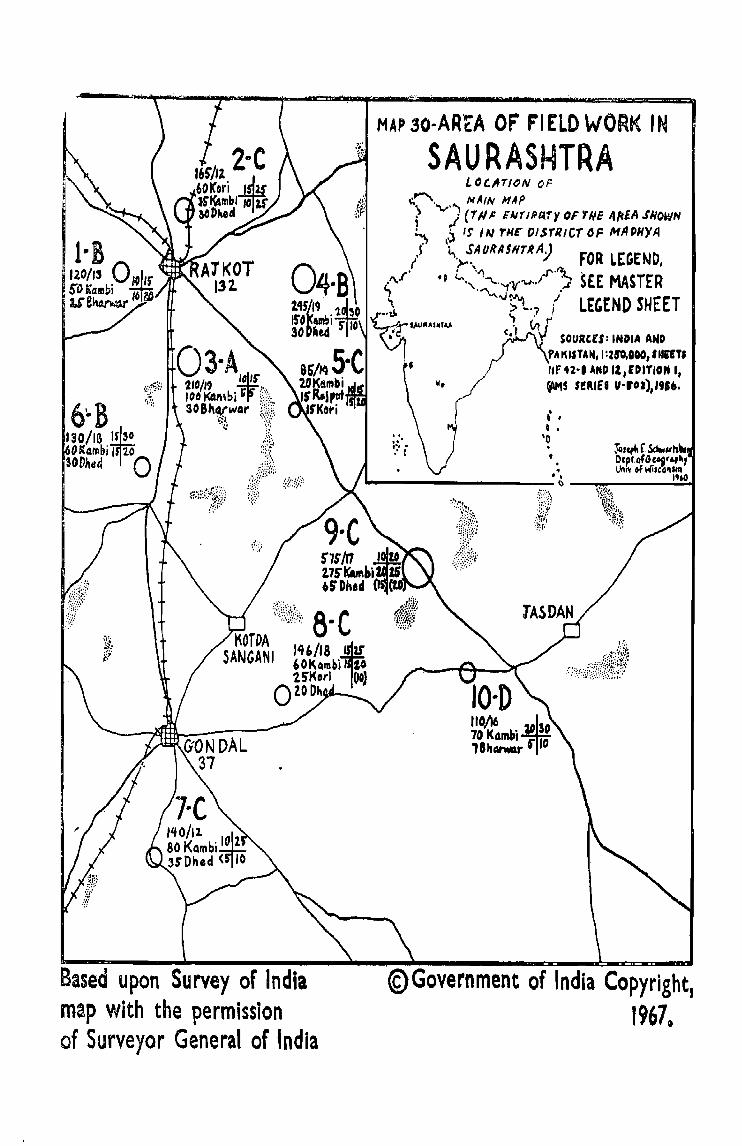
MAP 3o·AREA OF FI ElO WORK IN
SAURASHTRA L()(.A'T'()N OF
<.""', MAIN MAP i~ ....... ) (TN' GAir/PAry ()F 'fNE /j~EA JHOl'JN
~ ,.J IS IAI THE DISTRICT OF MADHYA
/ 't..'>,,~~lJRA$HTAA;) FOR LEGEND, ,,.,_.(' °D L-<"l-"_''1'\I'-v..lI'') SEE MASTER " ' "".", '\) t"'l i E E "~ ~ ~'? j LECEND SH T
c', V?Y SOURcn: INDIA AND
'AKIITAN,':Zro,ooo, .,,"" rtF no' AN" 11,(DITI0" I,
W, (AI15 SERIES uorol),I91"
• , , o •
'0 . , . •
----------------.~--~------~ \,~
:[<%\., 8-C KOrDA J,+'/18"1
SANGANJ UK4mbi ,0 1. 5'Korl ool
OZODh
Based upon Survey of India map with the permission of Surveyor General of India
©Government of India Copyright, 1967~
feature of the local landscape, distinguishing this area from any oth.'!r the author has seen in India. Building in the villages are still largely of mud; but much new construction is underway, utilizing a great deal of brick, milled timber posts and rafters, building-stone, factory-made roofing tiles, and even glass windows. (In many villages elsewhere in India a window of any kind at all is a rarity.)
The area is rather highly urbanized. (The District of Central Saurashtra is 39% urban). ~ajkot, the regional and district capital, with 132,000 inhabitants in 1951, in the second city of Saurashtra, and the local point of the study area. A seat of retail trade and an important entrepot; as well as an administrative center, it has little factory industry. Save for one large textile mill and a number of small groundnut oil mills, non-traditional industry is limited to the rapidly increasing number of small-scale engineering establishments and a variety of light manufactures in a newly created industrial district in which some 2,000 workers are employed. To the south, Gondal, a sumptuously-built town of 36,000 is also an important market and entrepot and a much more important center than Rajkot for groundnut oil-milling. It also is the site of a medium-sized railway workshop. The remaining towns are mainly commercial in character.
In terms of rural caste structure the homogeneity of the study 'area, as judged from the field sample of ten villages, ic; rather striking.
Only two cultivating castes of significance were encountered. Largest by far were the Kambis (Khemts) who were the largcst caste in every village but one, in which they ranked second, and an absolute maiority of the total population in four. This group dominates not only the rural society, but, because of its control of most of the land, the economy CIS well. Second were the Koris, or Kolis, a much poorer groUp, ~ gr~at many of whom 'NQre
agricultural laborers in practice. They were the largest caste in the one nonKambi village, second largest in two others, and entirely absent only in one· The_ Vagheri caste, river-bed gardeners specializing in growing melons and vegetables and in making baskets, are 'a minor cultivating group found in a few villages only. The relatively few high-caste Rajputs-many of whom are big landlords and members of the formerly ruling families of much of the area-were found in' but half the sample villages.
A ubiquitous caste at the bottom of the social hierarchy are the Dheds (Dhers, Chamars, Meghwals) who, like their Bambi counterparts in Ajmer, are traditionally associated with weaving, leatherwork, and the handling of carrion. The Dheds are the second largest group in the sampled villages taken as a whole and in 'four of the ten individual villages. In practice, a minority keep to their various traditional occupations, while almost all are mainly or subsidiariIy agricultural laborers. Very few own land. Another weaving caste, the Wanats, were found in but a single vi1lage.
While pastoral castes were encountered by the author in almost every part of Indi-a he went to, only in Saurashtra did he find the great majority of such households primarily ertgaged in their caste work,. while scarcely any were not at least subsidiarily so engaged. The principal pastoral caste, the Bharwars (Maldari), are primarily sheep and goat-herds: but also ra~se cows and buffaloes. Their animals graze on lands owned bv the vi1lage in common. Almost all the Bharwars market both milk and wool. Numerically on a par with t-he Koris, the Bharwars were found in all the sample Villages, and in three fotmed the second largest group. The Ayers (Ayurs. Ahirs), the only other pastoral caste met with, was found in only half the villages and in significant numbers in only two. The grout> is traditionally associated with cow-herdin~, though most own land today (lncl do some cultivation.
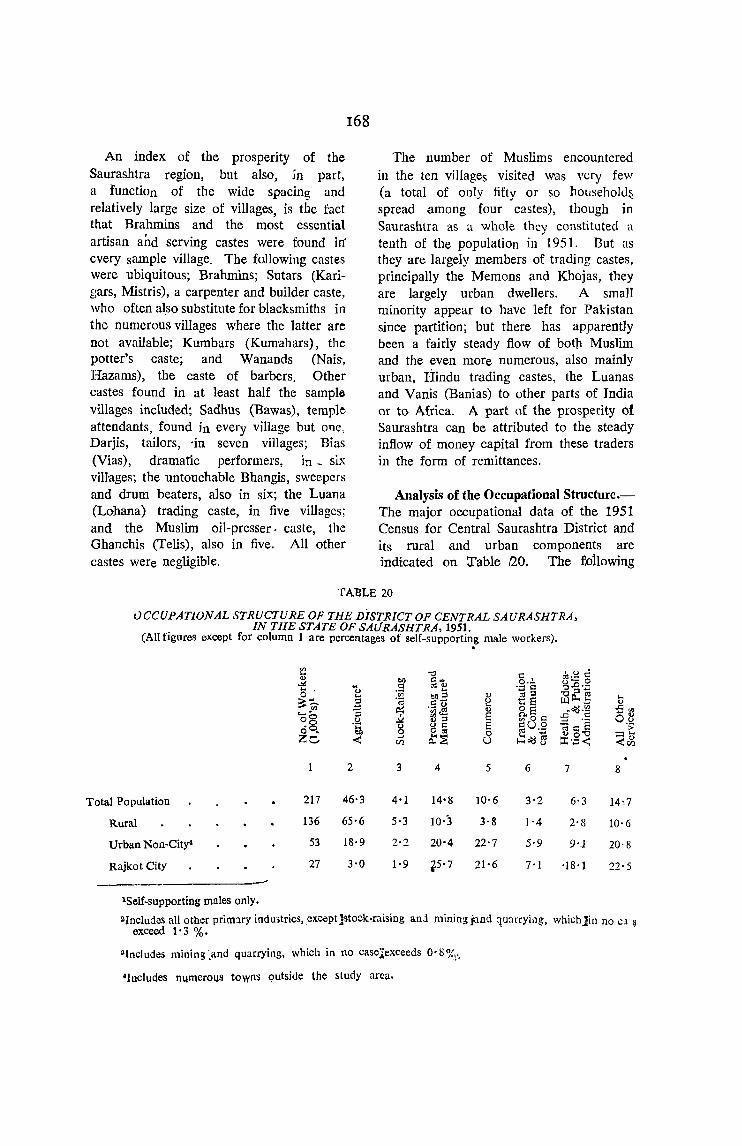
An index of the prosperity of the Saurashtra region, but also, in part, a function of the wide spacing and relatively large size of villages, is the fact that Brahmins and the most essential artisan and serving castes were found inevery sample village. The following castes were ubiquitous; Brahmins; Sutars (Karigars, Mistris), a carpenter and builder caste, who often also substitute for blacksmiths in the numerous villages where the latter are not available; Kumbars (Kum-ahars), the potter's caste; and Wanands (Nais, Hazams), the caste of barbers. Other castes found in at least half the sample villages included; Sadhus (Bawas), temple attendants, found in every village but one, Darjis, tailors, -in seven villages; Bias (Vias), dramatic performers, b. _ six villages; the untouchable Bhangis, sweepers and drum beaters, also in six; the Luana (Lohana) trading caste, in five villages; and the Muslim oil-presser - caste, the Ghanchis (Telis), also in five. All other castes were negligible.
168
The number of Muslims encountered in the ten villages visited was wry few (a total of only fifty or so household~ spread among four castes), though in Saurashtra as a whole they constituted a tenth of the population in 1951. But as they are largely members of trading castes, principally the Memons and Khojas, they are largely urban dwellers. Asman minority appear to have left for Pakistan since partition; but there has apparently been a fairly steady flow of both Muslim and the even more numerous, also mainly urban, Hindu trading castes, the Luanas and Vanis (Banias) to other parts of India or to Africa. A part of the prosperity of Saurashtra can be attributed to the steady inflow of money capital from these traders in the form of remittances.
Analysis of the Occupational Structure.The major occupational data of the 1951 Census for Central Saurashtra District and its rural and urban components are indicated on Table 120. The following
TABLE 20
uCCUPATIONAL STRUCTURE OF THE DisTRICT OF CENTRAL SAURASHTRA, IN THE STATE OF SAURASHTRA, 1951.
(All figures except for column 1 are percentages of self-supporting male workers) . . '" "0 ~.~ c:: ... c, 0) OJ) Cl .. ..Io! 0·_ g:O.2 ...
~ .9 o:l~ ~.::: g
"0::1-;;; 0 .:!l !lJl::l 0) {gs >wCl.b ::~ c<! .9g u
t ~ ... oS £cId·a 0)
~§ .l4 ~'E3 § Sl'oc g g; ;U . .8 ~ c:·s o ~ 0 ~o"O Z:::::.. < ..... ~~ u ~cId[j ~.'::< <Ii
2 3 4 5 6 7
Total Population 217 46-3 4'1 14'lj 10·6 3-2 6·3
Rural 136 65'6 5-3 10·3 3-8 1·4 2·8
Urban Non-City' 53 18-9 2·2 20'4 22·7 5·9 9·1
Rajkot City 27 3·0 1-9 tS-7 21-6 7-1 -IS· 1 _-lSelf-supporting males only_
.... 0)
..c::", o.~
> - ... -." <!Zl
8
14,7
10·6
20·S
22-S
2Includes all other primlry industries, .cxcept_lstock-raising anj miningjand qu:myillg, whichjin no C1 ~ exceed 1-3 %.
~{ncludes mining·,and quarrying, which in no casO:iexceeds Q.ljo/.\<.
'Includes numerous town~ Qutside the study area.
important characteristics are brought out by the Table: (a) the high percentage, even. among the rural population, of workers outside the prim:1ry sector;39 (b) the unusually large disparity in the percentages in commerce in the rural as compared with the urban population. This results not only from the fact that the trading castes are overwhelmingly urban, but also because non-trading castes in the villages. find enough of their traditional work to keep them productively occupied without turning to petty trade as their counterparts might in other areas; and also because "going to town" for one purpose Of another is quite a common occurrence in this prosperous, highly urbanized area, where roads and bus service are quite well developed.40
The figure given in the table for the percentage of rural workers in stockraising appears to the author somewImt lower than it should be. Such underemllneration is apt to occur where many pastoralists own land of their own so that they are likely to be returned as cultivator~ rather than stock-raisers even though their principal means of support comes from their pastoral activity.
Among the sample villages the percentage of households primarily dependent on nonagricultural work within the village varied within the relatively narrow range, from about 10% to about 20%, in nine out of ten cases; the tenth, village 3, had 30%, because of its large number of quarryworkers. Considering also subsidiary occupations, the range was from 15% to 30%, except again for village 3. While almost all vil1ages contained the variety of traditional artisan and serving occupations which their caste i;tructure would lead one to expect, only a few had any noteworthy non-agricultunil speciality. Apart from the quarry
169
working of village 3, village 2 had a minor specialization in weaving, on which some twenty-five Dhed households were mainly or subsidiarity dependent. The only other active weavers encountered were eight Dhed households, all pursuing that work as a main source of livelihood in village 8, and all fifteen Wanat households in village 9, who were similarly engaged.- Subsidiarily the Wanats were cotton-carders. Village 4, though pot on any main road, was engaged in providing certain artisan and other services for several nearby smaller villages. In general, however, the regional pattern is one of remarkably self-contained and selfsufficient villages, excepting for a few services obtainable only in larger towns.
By and large the jajniani system of intravillage work allocation and reciprocal obligations appears to be more intact in Saurashtra than in any other study area, so far as the supply of traditional goods and .services is concerned. But the range of non-traditional goods available within the village is rapidly expanding; and these are supplied almost entirely on a commercial basis. Thus, most households of the potter caste today are more dependent on providing bricks and roofing tiles, both now much in demand, than they are on supplying pots to their jajmans. Similarly, carpenters and blacksmiths now depend largely on the provision of- building materials and skilled labor and on milling services. A few other occupations for which the appropriate specialized castes are insufficient in numbers or entirely lacking, e.g., shopkeeping, tailoring, bicycle renting and. repair, and the preparation of sweets, have attracted members of a variety of castes, including a few Kambis, who continue also to farm, and the numerically-not-very-important. Brahmins, almost all of whom are still engaged also in priestly duties. The castes of temple attf!ndants, dramatic performers, and drumbeaters also cling, at least subsidiarily, to
S9The figures, however, probably entail some degree of bias due to enumeration of caste occupation instead of actual occupation.
4°Among the many aspects of Saurashtra for which the author was totally unprepared was the sight (f)f groups of farmers lounging about at any hour of the day in garishly decorated, mirrored, flourescent-lighted ice-cream parlors in Rajkot and Gonda), presumab1y having just completed whatever marketing, shopping, or other business brought them to town •
their caste work. Only the Dheds have largely -abandoned their traditional occupations. Yet, even among them, one or a few families in every village continue as kamin~ to remove.. carrion from the village, to repair, and sometimes make, shoes, and to make and repair the leather buckets locally used in well-irrigation.
170
In nine of the ten sample villages the percentage of families mainly dependent on work dtme outside the village varied only froIP a little below 5 % to 15 %; in the tenth case (village 9) it was 20%. Considering also subsidiary dependence, the range was somewhat greatet, from 5% in a single case (village'3) to 25% (in villages 2 and 9), witJi the remaining seven cases in the range fForn 10% to 20%. Except for villages 9 and 8, none of the sample villages have as many as 5% of their households even subsidiarily dependent on outside work done by.individuals no longer residing in the Jlilhige. I 1-;-1-,
The comparatively high figures for village 9, reflect the fact that this village, much the largest in the sample, had far too many people for the land available to it; and .ettligrafion appears long to have been a fair-1y pressing need. (Why the village grew ro la~e to begin with was not determined.) Reportedly, this '\tilfage (in which the inter'?iew was given a reliability rating of "poor") had approximately fifty families of the carpenter caste, of which only eight pursued their caste work mainly in the village. All the household heads from the rcmnitting families were said to 'be doing 'their caste work or masonry or casual labor in Rajkot, Ahmedabad, Bombay, and other cities. All twenty-five or so Kori household
'1teads from the same village were reported "to 'be masons in Rajkot, and several other ta'Stes, including Dheds, also had substan~ fial numbers 'Of outside laborers. Village 8. though smaller than average in size, was also hard-pressed for la:nd. But, a great m~ny of its outside workers were low.-caste. casual, short-term road and constmction laborers, still maintaining their residence in
the village. Similarly, the great mass 'Of ~utside labor from village 2 was perf{)rmed on a casual basis by Dhed earthw.orkers and Kori railway gang-labor.
Other means of outside support were quite varied: sundry day labor in nearby towns Was of importance in villages 1 and 5, almost always as a subsidiary source ()f income. Also engaging relatively small numbers 'Of workers were factory labor, teaching, itinerant hawking, hiring out .as skilled artisans, clerical work, work for the railroad, donkey driving and carting, priestly duties, dramatic performing, etc., In most cases on prediotable caste lines.
Occupational -stmcture and Economic Development.-Table 21 shows for each of two groups of villages, four that were judged more developed and six that were judged less developed. the average scores with respe~ to selected occupational and other variabJes. In considering this table it would be well to-remember that the sample is fairty small, and hence, perhaps not 'Sufficiently 'representative. Variable 1, 'for example. indicates that the less developed vinages are larger on the average than the more developed. which is opposite from what was observed in most parts of India; but. if one village (number 9) with 575 households had not been included .in' the less developed group, its aver~ge size would then .have
~ been onlv 129 households. .. Or well below that of the more devel011.ed !!touP. With regard to variable..", 6 a"1d 7, the villal!es in the more developed groun score slh!htlv higher th"lTl 'Ilhose which are less .developed: but the differences ~re too -sti'gllt for {me fo
postulate anv definite relationships with
development.
With respect to the occupatiGnal variables 2 through 5. however, the ma'gBitude of the differences between the two groups is considerably greater; and. here. the author is much more inclined to believe that the .scores are in fact correlated with development, positively in the case of variables 2

1'X
TABLE 21
~lttEtTEb VARIABLES FOR TEN SAMPLE VILLAGES IN CENTRAL SAURASiitRA ARIUNGED IN TWO DEVELOPMENT GROUPS·
MoreDe- LessDe-veloped veloped Group Group. 1 "A" 5 "e"
Variable
and 3 "B" and 1 "D" Villages Villages
1 Size of Village (i.e., No. of households) . 175 204
2 % Qf Households Mainly Dependent on Non-Agricultural Work Pursued within the Village. . . . . . . . . ... . 19 13
1 % of Households Mainly or Subsidiarily Dependent on Non-Agricultural Work Pur-sued'within the Village. . . . . . . . . • • 39 23
4 % of Households Mainly Dependent on Non-Agricultural Work Pursued outside the ViUag~. . . . • . . • • . • • • . • 8'8 11
5 % of Households Mainly or Subsidiarily Dependent on Non-Agricultural Work Pur-sued outside the Village. . . . . . . . . . • 11 18
6 % of Households of Non-Agri<;ultural Castes Mainly Dependent on Caste Occupa-ti~ 51 ~
1 % of Households in High Castes 9'3 9'2
*All figures are averages unweighted for village size.
_ and 3, and negatively in the case of variables 4 and 5. 1ihe reasons for the correlations are already familiar: There is a greater demand for goods and services within the more prosperous villages; and thel1e is a greater need to seek one's fortune elsewhere within those which are less prosperous. Si&nifi.cantly, it is felt, village 3, the most prosperous in the study area, had the fewest outside workers41 •
North Punjab Plain
(Map 31)
General Background.-Culturally, eCO
nomical1y and historically, the Punjab has long been one of the most interesting areas of India. It is of particular interest in contemporary India because of' the severe stresses 'and c;lislocations it underwent as a result of the 1947 partition. That East Punjab appears to have recovered so remarkably from that shock is a tribute to the government and the people, but also reflects in part the inherent productive potential of the land itself.
The area of East Punjab selected for study lies astride the Grand Trunk Road, rrom around rsu to 250 miles northwest of Delhi. Prior to partitiQn this was one of th~ great funnels of traffic between the highly productive areas of present West Punjab and Hindustan; but today trade across the border is greatly reduced. Extending from the Pakistani border southeastward to the general vicinity of Ludhiana, [he study area includes the PlOst solidly Sikh portions of the sub-continent, including Amritsar, their most sacred city and the largest city in tne whole of East Punjab. Prior to the partition, ffinou, Sikh, and Muslim lived side by side in the area in a complelC amalgam and bad evolved a symbiotic set of relationship in both the commercial sphere outside the village and the traditional sphere within. Today, the Moslems are almost entirely gone; new Hinou and Sikh elements ~ave partially raken their place; and the old system of relationships, if ~t entirely shattered, has been dealt a blow so serious that it will never again be the same. What effects
41.The second correlation, unlike the first, does not tend to be universal in India. But, where the village consists overwhelmingly of agricultural castes, and where there is a favorable man-land ratio, it would appear to apply as a general rule.
these events have had on the occupational structure of the area was the principal question which prompted the field enquiry.
The study area included the four districts of Ludhiana, Jullundur, the bifurcated t9rmer princely state of Kapurthala (in P.E.P.S.U.), and Amritsar.42 It is crossed by three of Punjab's five great rivers, the f.{avi, the Beas, and the Sutlej,- all.draining ultimately into the Indus. Where the Ravi nnd SiItIej leave the Siwalik Hills to flow on to the plains (at Ma:dhopur and Rupar respectively) are located headworks for the flystem of enormous canals which branch out to irrigate half the total sown area of A.mritsar and somewhat less of Ludhiana, 3.S well as large areas beyond. Jullundur and Kapurthala are much less favored.43
But, in all four districts, well-irrigation is quite important. The arilling of deep tubewells, with motorized pumps is being rapidly expanded at present. (The low lying swampy area of Kapurthala between ... the Black Bein and the Beas Rivers is somewhat exceptional).
The great extent of irrigation in the area has permitted the development of a highly intensive and commercialized farming system which is among the most productive tn India. Among the chief crops grown are wheat, maize, gram (a pulse, often sown with wheat), cotton (greatly expanding since the introduction of a longer-stapled American variety in the last decade) , groundnuts (on the sandier, nOll-irrigable tracts), and sugarcane. The localization of parti'cular crop specialities need not COllcern us.
Rural popUlation densities are only ,moderately high: 372 per ~quare mile in Kapurthala, 473 in Ludhhma, 500 in Amritsar, and 584 in the most crowded district of Jullundur. Settlement is, for the most part; i9- massively built, highly nucle~-
ed villages, some of which are willed. Villages are relatively large" averaging aDout 750 in population, beingJargest in Amritsar and smallest in Kapurthala. Two storeyed brick houses are quite common, especially in Ludhiana District~ and a few:residences nave even .four storeys.. (The use of iron I-beams in house construction is by no means rare in this part of Punjab.) Houses tace directly on narrow streets, w.tuch, in some Qf the more prosperous villages, are paved in brick and guttered on either side. Heillce, the villages Oiften have a highly urbanized appearance.
The number of places actually classified as urban, however, is not great; the official rate of urbanization, ranging from 22 % in Kapurthala to 30% in Amritsar, is well below the averages noted iq Saurashtra. In the southeastern part of the .study area the cities of Ludhiana (154,000) and Jullundur (169,000) and' many nearl)y towns and villages as well are known for a variety of small-scale industries, of which the knitted goods industry is most ,impQrtant. in and around Ludhiana and the sporting goods, agricultural implements, and" other light engineering industries in and around lullundur. In the northeast, the great emporium of Amritsar (326,000) is much
• better known as a commercial and service center although textile manufactures are increasingly important.44 All other settlements are, relatively speaking, of slight importance. These include Kapurthala (27,000) capital of the relatively backward district of the same name, Phagwara. (22,000) a sugar milling center, Jagraon (25,000), an imp€Jrtant mariceting and processing oenter for cotton and groundnuts, and a score or more of centers for the collection of agricultural produce of smaIlscale manufacturipg, and of ~dministration. or of combil1'J.tions thereof.
4ZAs work in the study area progressed more slowly than the author h:1.d anticipated, it was decided, after several weeks in Ludhiana and southern lullundur, to skip northern lullundur and Kapurthala entirely and opend the remainder of the time he had allotted in Amritsar. There is, tlm~, a gap of about thirty-five miles in t~e coverage of the area, b,etween eighteen sample villages centering on Ludhiana and fifte<;n centering on Amntsar.
43See Figures 85 and 87 on pages 467 and 489 of Spate's India and Pakistan. "Relative to the nation as a whole, however the entire study area is oriented towards the territory or ser
vice sector, as is shown on map 21. Jullundur somewhat less so than the other district~ named. _
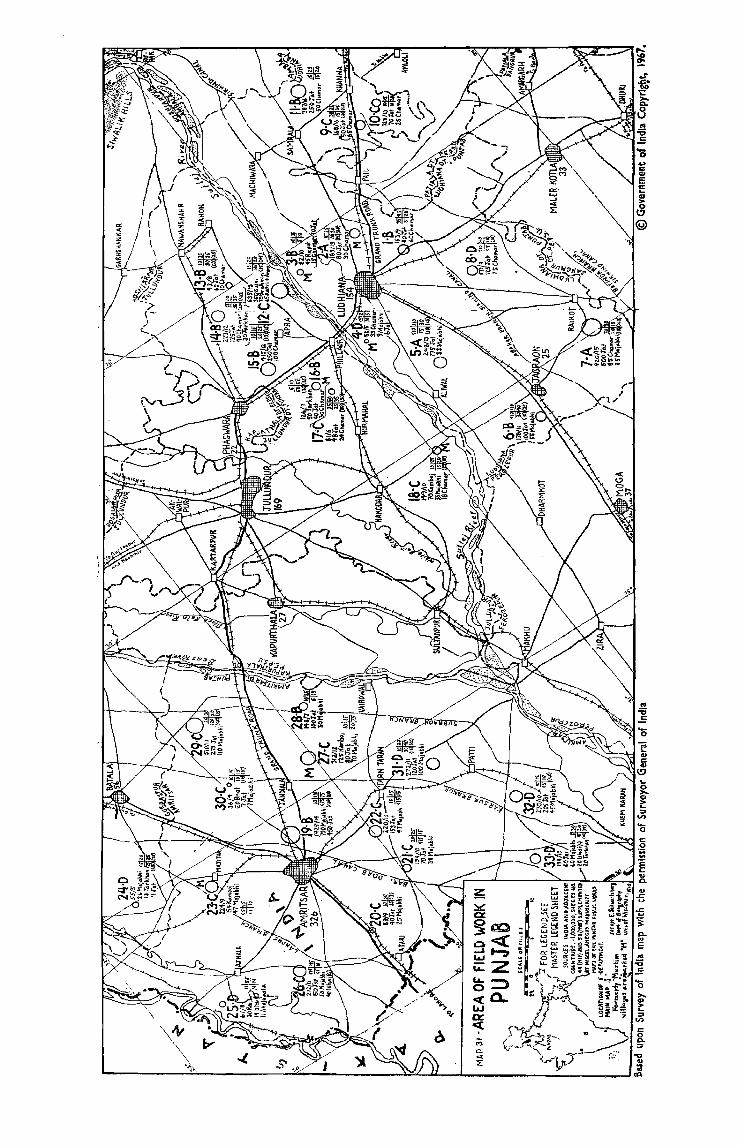


Prior to partition, the Muslim population compri~ed over a third of the total in Ludhiana, somewhat under half in both J ullundur and Amritsar and over half in Kapurthala. The Muslims were a largely rural folk, engaged both in agriculture and in a variety of artisan and serving professions, in some of which, ,such as weaving, clothes washing, black-smithing, oil-pressing, etc., they enjoyed near monopolies. The caste names borne by the Muslims were veI'y commonly the same as those of their Hindu and Sikh occupational counterparts. But, while Hindu and Sikh members of a given caste sometimes inteIiIllarried. Hindu-Muslim or Sikh-MuSlim marriages were almost unthinkable. For most economic considerations there is little point in distinguishing between Hindu and Sikh in this area. It is, in fact, not always possible to distinguish the two groups, particularly among certain lower castes.4r, Occupationally, ca;ste, not religion, is the significant variable.
The chief caste of the stUdy area are the jats, a cultivating group who formed an absolute majority of all households in sixteen of the thirty-three sample villages, the leading caste in four others, and the second largest caste in six others, in four of which cases they were the leading cultivating caste. Of the remaining seven villages they were the third largest caste in one (but still the leading cultivating caste, small minorities in four others, and completely absent in only two. In all six villages in which J ats were present, but not the leading cultivating caste, they were all of recent origin, refugees from West Pakistan occupying lands granted by the
175
government and vacated by Muslims (who, in many cases, had also been Jats). Other cultivating castes include: the Kamboj, who were the dominant group in three. villages (18, 23 and 27) and found in significant numbers in only one other; the Sainis, the Raj puts, and the Bhats, each of whom comprised the majority of the population in the single village in which they were encoun~ered (villages 12, 2 and 30 respectively); and the Ahaluwalia caste, found also in but a single village (number 25), in which it was the leading cultivating caste, though only third among all the cast~s of the village. There was also a handful of Muslim Jat and Gujar families W!"10 did not flee to West Pakistan.46
After the cultivating castes, the groups which are numerically of greatest importance for the area as a whole are the two large untouchable groups, the Hindu Chamars (Raidas, Mochis) and the Sikh Majabhis (Bhangis, .Chuhras). The former, are traditionally leather workers and removers of carrion; the latter sweepers (of village streets, of the latrines oj their jajmans, and of the bedding areas of the livestock of their jajmans). But in practice both groups haVe, long been predominantly agricultural laborers, where their numbers exceeded what was req~site for their customary functions.
The Chamar;s were found in all bul: fiVE: villages, the Majabhis in all but two; bUt the areas in whieh they were concentrated were altogether different. Only 15 Chamars families were found in the fifteen villages visited in Amritsar, whereas about 700 households were found in the eighteen
----;;-M~ny people, including Sikhs, regard Sikhism as nothing more than a reform Jl}ovement within Hinroluism. No statistics are given in this study on the proportion of Sikhs in the total populatIOn of the study area the author doubts that reliable statistics are available. It seems certain however, that the movement is gaining rapidly both by conversion and due to the influx of Sikh displaced persons from West Pakistan. In tenns of numbers, power,and control over land they are cert~in~y t~e dominant grO?P in the area, comprising almost the entirety of the cultiva.ing castes and an abSolute majonty In all but a few villages.
4&The distribution of cultivating castes brings out a most important cultural aspect of the settlement pattern in the study area, namely that cultivator castes (lncluding ~ajputs, who are not here c~nsidere4 as a ~ig~ caste group) tend to be mutually exclusive g"(\"n;, Lt'., where one IS found all the others are el!hcr entIrely mIssIng !lr found only in negligible numbers. Thi cha:acteristi~ has been obs~rved by t~~ author In .other parts of. IndIa, but nowhere as strikingly as here. Also C!f Interest IS the fact that In pre-part~tl!ln d!lYs SIkh and Ml}slIm Jat cultivators often lived side by side, shOWIng that the caste bond cut across religIOUS lmes, though not m respect to mixed marriages involving Muslims.
sample village$ of Ludhiana and Jullunduf. In two of these villages (4 and 9) they were the largest caste, in ten others the second largest, in ODe tied for second, and m three of the (emaining five tied for third. The Majabbh numbered almost 1,400 households in Amritsar (half in village 19 alone), where they were the largest group in three villages (19, 24 and 33): second or tied for second in ten others, and third in one of thet two remaining cases. (In the last village, the Ishais, or Chris.tianized Majaibhis, were the third ranking caste.) Although numbering only .about 275 families in the Ludhiana-JuUundur portion of the sample, they were quite concentrated therein, ranking as the second largest caste in f?ua: villages, and tied with the Chamars for second in a fifth. - The remaining thirteen villages accounted for but 70 households.47
Only five castes, in addition to those already mentioned, were ubiquitous in the study aera or nearly so. Among these were the Brahmins, found in twenty-four villages, but in -significant numbers in only a few. (In village 12 they were. the third most numerous group.) Somewhat lower in the caste hiemrchy the commercial groups of Khatries and Aroras (who not infreq~ently intermarry and can, for all practical purposes, ~ considered a single group) are found in twenty-three villages, being of 'importance in only two. (In village 12, where they were best represented, they ranked fourth.) Still lower in the scale are the Sikh Tarkhans, th~ carpenter caste, who now also do the work of blacksmithing, since virtually all the Muslim Lohars, who used to do this work, fled to Pakistan. Tarlchans were the only caste encountered in every one of the sample villages (in six cases with but a single household) and were the largest group in one, second
~
loargest in another, and 'numbered mote than a twentieth of all households in seven other cases. The next most ubiquitous group, were the Mehras (Jhirs, JlunwaIs, Chuhurs, or Kahars) a menial caste of water-carriers, who were found in all but three sample villages in none of which they equalled as much as ten per cent of the population. (The maximum number found in a village was twenty-two households.) The last ffild lowest of the very common castes were the Nais, or barber~, found in all but seven villages, always as a very small group.
Of all the castes not yet mentioned, numbering only about fifteen, none was found in more than hall of all the villages. Together these groups accounted for only about 6% or 7% of the nearly 8,000 households in the sample. 'Among the groups which were of some importance were, in order of numerical strength, the Sonar;s (goldSlIlliths), with about 100 households, Kumahars (pott~rs), Chimbas (tailors) Julahas (Hindu weavers, many of them immigrants, almost all of the Muslim weavers having fled to West Pakistan), and Sahansi (shephelrds), with but thirty-five households. One other caste of note, the Rais, found in a single village (number 25), where they comprised nearly half the population, is associated with the occupation of twine-making and hence almost always live near the swampy banks of rivers where they can gather 1l1e reeds needed for their trade.
As has already been intimated, almost all the castes existing among the Hindus and/or SHms existed also among the Muslims, though the names was not always the same across religious lines. In the artisan and serving castes, Majabhis and ClTamars excepted, Moslems predominated and in pre-partition days a great many
4'10 only five cases out of thirty-three does whichever of the two groups is a minority form over a fifth as many lmu!!eholds as the majority group. T~e mutual exclusiveness wh!ch exists among the cul~ivat9r caste~ evidently carries over in this area to the agnculturat laborer castes. Of the ty.'o groups, t~e ~aJabI:ls pred~minate overwhelmingly in the northwest of the study a~ea, an~ the <;hamars . In a large. ~aJonty of VIllages m the southeast. It is unfortunate that no study was carn7d out tn the intermediate transitional zone. That- the mutual exclusiveness was not more comple~ ca~ be attrlb~ted to the fact that a~ !east one .or a few households of each of the two castes is generally deSired In every vJ11age so that the traditional service done by each and
shunned hy the other will be available.

177
more groups (ignoring religion) would have been found to be ubiquitous or nearly so. Of the thirty-three sample villages, an bur
one lost Muslims to West Pakistan. (That one had none to lose). On the other hand all but three gained new :oettlers from West Pakistan, and though the immigrants were far less numerous than the emigrants, they included a few members at least of most of the same castes, somewhat lessening the shock of change. But, as close to half the new comers settled in urban areas (wen over half in Ludhiana District) the degree of restoration of the old order was mucb less than might appear; and the dependency of the villages on commercial transactions in towns was greatly heightened.
With regard to cultivating castes, the Muslims had been the dominant groups in seven of the thirty-three sample villages, all of which could be characterized prior to partition 'as Muslim villages. {These are all specially shown on Map 29.)4t1 The lands vacated by the Muslims were apportioned among the incoming displaced persons, according to the amount of land, if any, they had abandoned (and could show title to) in West Pakistan. Since many of the new settlers were very large land-owners in the "canal colonies" of West Punjab and Sind, they were granted quite large tracts of land. But the Muslim cultivators whom they had replaced were, for the most part, very petty farmers. The result was that where forr.1erly there were, let us say, 200 households of Muslim cultivators in a village, there are now only forty or fifty Sikhs. Thus, even if the newcomers were to try to re-establish the jajmani system with the rest of the population of remaining ~utisan and menial classes, there would often be far
too many of the latter to be accommodated, and they would have to fall back on one or more of the following alternatives: Producing some goods commercially marketable outside the village, turning more toward agricultural labor, taking on day labor and .>easonal construction labor as jobs became available, or emigrating in search of work elsewhere
Emigration. however, is by no means restricted to the castes who found them~elves short of work as a result of the changes consequent on partition. Rather, going out into the world in search of fortune-if not also fame-has been 11
characteristic of the Punjabi popUlation for generations. The army has traditionally formed the chief magnet, but, as shall be seen shortly, many other fields are 'als!) of prominence.
Analysis of the Occupational Structure.The occupational structure of tbe districts of Ludhiana, Jullundur and Amritsar, according to the 1951 Census, is shown on Table 22. Unfortunately, one cannot place a great deal of faith in tbe accuracy of these statistics. Columns 7 and 8 in particular appear to make very little sense, and inter-district comparisons based thereon would have very little meaning.49 What column 8 does seem to indicate, however, is that there were an unusually large number of workers in the study area who had no definite occupation in 1951. but were doing whatever odd jobs they could find. Presumably these were largely urban displaced persons. How the individuals were classified (as opposed to what they actually did) would appear to differ greatly from one district to another.50 Among the other data which appear to be questionable, the
. &9T~ree 1>f. these .villag~. nurytbers 3, 4 and 18 are located in what is called the "bet", i.e., often swampy rlVeram terral~ SU?Ject to floodmg. (Only (.me of the four bet villages in the sample, number 25, was not formerly a MU'Ihm Village.) A very large portIOn of the Muslim cultivating population was forced off the higher safer, I?referred doab terrain during the inter-religious strife of the late eighteenth and early nineteenth centunes.
(lIt is particularly hard to credit Some of the data for "construction and maintenance" one of the maior ~ubheads !lnder "Other Specified Services." In J ullundur District, for example, 1'1 % of 'the rural population I~ so clasSIfied and none of the urban population; whereas, in Ludhiana District, 7' 3% of the city, 2'3 % of the urban non-city, and none of the rural population is so classified.
5~Manv of I.he typ~s o.f workers cla~~ified under agriculture ([.e., as agricultural laborers) in the rural populatIOn of Amntsar Dlstnct, would apparently have been classified in Jullundur and to an eveo greater d'egree in Ludhiana, uoder "services otherwise unClassified." , ,

178
TABLE 22
OacUPATIONAL STRUCTURE OF THE DISTRICTS OF LUDHIANA, JULLUNDUR AND AMRITSAR, PUNJAB 1951.
(All figures except for CoLumn 1, are percentages of Selj-s'U:;.Jportina Male Workers)
Health, Trans- Educa-
Process- porta- tion & Other Services ing and tion & Public Speci- Other-
No. of Agri- Manu- Com- Admi- tied wise Workers cul- factur- Com- muni- nistra- Servi- Unclas-(1,000'S)1 tureD ing merce cations tion ces sified3
1 2 3 4 5 6 7 8
Ludhiana 165 50·2 8·2 15·6 1·6 7·2 5·6 11·7
Rural 112 71·0 8·0 6·7 0·2 1·5 1·6 10·7
Urban Non-City 13 18·6 9·3 38·7 ,0·4 8·0 22·0 3·0
Ludhiana City 41 2·9 7·8 32·7 5·7 22·6 U·2 16·9
Jullundur 246 55·3 to·O 10·0 2·3 10·2 4·7 7·7
Rural 188 ,68·1 9·1 5·0 0·9 4·8 4·8 7·3
Urban Non-City 18 34·1 11·9 21·7 3·5 13·3 7·2 7·7
lullundur City . 41 5·6 13·3 27·8 8·0 33·1 2·8 9·3
Amritsar 343 57·7 6·5 12·9 3·3 7·9 6·0 4·1
Rural 237 79·7 2·0 5·2 1·7 6·2 4·2 1·1
Urban Non-City 19 31·6 22·3 23·3 3·7 7·5 10·5 1·0
Amritsar City 87 3·4 15·3 31·4 7·5 12·6 17·2 12·4
lSelf-supporting males only. IIncludes all other primary activities, which in no case exceed 1·1 %. 8Census occupational category 9· O.
following may be cited: the unusually low percentage in processing and manufacturing in the rural population of Amritsar; the unusually low percentages in transport and communicaotions in the rural and urban 11oncity populations of Ludhiana; and the unusually high proportion of workers in bealth, education, and pub1ic administration in the rural Ropulation o'f Amritsar. It would appear, in ~ummary, that the Census operation for P.unjab was among the most poorly executed in the whole of India, and that the results are among the least trustworthy~l.
Table 23, on the following page, shows the unweighted average scores for a variety of occupational and other data for the sample villages of the study area grouped in two subregions, Southeastern and Northwestern, and according to whether the most numerous cultivator group are displaced persons from West Pakistan or indigenOUS52•
The sample data generally appear to bear out the averages of the Census showing a higher level of non-agricultural activity in the Southeastern subregion than in the
51The iistiugs of errata, moreover, to the several districts census handbooks were, by far, the mo~t tengthy. The writer recalls, literally, hundreds of errata listed for a single volume.
&lOuly thirty-two villages were included. Village 19 was excluded, because of its atypicality, not only in size, but also in being OVerwhelmingly a dormitory village from which a majority of workers went out to work in Amritsar.

179
TABLE 23
.. 4.VERAGE SCORES FOR SELECTED OCCUPATIONAL AND OTHER VARIABLES IN THIRTY-TWO SAMPLE VILLAGES IN THE NORTH PUNJAB PLAIN*
Sub Region Major Cultivating S.E.: N.W. Group
Variable Ludhiana- Amritsar Displaced Indige-Jullundur Persons nous 18 villages 14 villages 6 villages 26 villages
Size of Village (i.e., No. of Households) 245 200 157 241
2 % of Households Mainly Dependent on Non-Agricultural 15 11 6'8 14 Work Pursued within the Village .
3 ~ of Households Mainly or Subsidiarily Dependent on on-Agricultural Work Pursued within the Village . . 22 23 15 24
4 % of Households Mainly Dependent on Non-Agricultural Work Pursued outside the Village by Individuals Resident in the Village 7'3 6'5 11 6'0
5 % of Households Mainly or Subsidiarily Dependent on Non-Agricultural Work Pursued outside the Village by Individuals Resident in the Village 11 8·6 18 9·6
6 % of Households Mainly Dependent on Non_Agricultural Work Pursued outside the Village by Individuals Resident out-side the Village 11 IH 7'3 10
7 % of Households Mainly or Subsidiarily Dependent on Non-Agricultural Work Pursued outside the Village by Individuals Resident outside the Village 16 10 11 14
Development Rating 1·6 0'7 1'0 1'3
* All figures are averages unweighted for village size.
Northwestern. Variable 3, however, ap' pears out of line, possibly because fewer individuals in the. Northwest are primarily engaged in non-agricultural pursuits within the village (variable 2) SO that more are needed on a subsidiary basis, or the result may be one of pure chance. The Southeast appears to have a greater percentage of outside non-agricultural workers whether one considers workers resident in the village (variables 4 and 5) or those resident outside (variables 6 and 7).
The causes of these differences are not altogether clear to the writer. The Ludhiana-lullundur subregion does have the seemingly well-founded reputation of being a particularly enterprising area. By mntrast, Amritsar District has the reputation of being among the least secure and lawless areas in India, one in which inter-------- ------
necine clan feuds still prevail"a. Just why is not certain in either case. There is nothing about the caste structure which significantly distinguishes the two areas at present, or, so far as the author could ,determine, which distinguished them greatly in the prepartition period. Nor are the two areas very significantly different in terms of fertility of soil, pattern of land use, etc. Yet, the differences in the development ratings of the two areas (variable 8) is rather strMdng and, in the writer's opinion, one of the causes, as well as one of the effects, of the occupationa:J differences: a cause because prosperity results both in a greater demand for non-agricultural goods and services and a higher level of entrepreneurship; and an effect, because prosperity is largely the result of a steady stream of remittances from outside workers (including many in foreign countries) with relativelv lucrative jobs.
. ,sA Sikh lawyer in Delhi assured the author that Amritsar District had the htghe~t homicide rates in IndIa. No attempt was made, however, to confirm this allegation.
It should be noted that the sample villages of the Southeastern subregion of the study area are, on the average, over twenty per cent larger than those of the Northwestern part, whereas, according to the Census, the average size village in the latter area is actually slightly larger than in· the former. Hence, in at least one respect, the author's sample is not as representative as it might have been. But the differences between the t~o areas in respect to variable 1 do not appear sufficiently large to account for much of the differences in the occupational variables.
180
;ajmans, to Pakistan, while the p.reat mass of Hindus were Chamars and Majabhis, who, in practice, were overwhelmingly agricultural laborers. Second, the relatively small number of newcomers often failed to re-establish the old :jlorms of customary patronage of the few remaining households of specialized artisan and serving castes. Third, the newcomers, among whom were many well-to-do individuals who kept both village and town homes, commonly preferred to obtain the majority of their needs outside the villages, where they simply concerned themselves with tending to or overseeing the management of their lands.
That the villages with the displaced cultivators have relatively larger percentages of outside laborers still resident in the village (variables 4 and 5) is explainable from the above analysis. Both the agricultural laborer groups and the other non-agricultural castes, for lack of an adequate clientele in the village, often have to seek whatever casual labor they can find outside. The .~ason why work for the agricultural laborers has been reduce.:) is because of the much greater efficiency of iarge holdings, many of which are now mechanized. (The author actually came across several
The comparison of six villages in which the major cultivating group consists of displaced persons with the twenty-six remain-1ng villages shows differences which are generally of greater magnitude than those between the two subregions of the study area. Quite striking, at the outset, is the difference in village size. The reason for this stems from the fact that, compared to the non-Muslim (mainly Jat) cuitivators. the Muslim farmers (mainly Arains [Rahinsl. a caste specializing in gardening) of pre-partition times were ovenvhelmingly very petty landholders. As· mentioned previously, a few families of displaced persons, who were 1arl!e landholders in what became West Pakistan, were often, allotted land formerly occupied by a much larger number of Muslim households.
• two-tractor farms in the study area.)
More difficult to explain is the relatively low percenta!!es of households in nonagricultural work within the vi1lul!es 11'1 which the displaced persons settled as the dominant cultivating group. One would imagine that with the greatlv reduced number of cultivators in such viHu!!es the share of non-agricultural workers in the nopulation would go up, not down. That this was not the case would appear to be attributable to a combination of causes. First, in villages which were formerlv Muslim dominated. the great maio.rit'v of specialized artisan and servin,g castes were also Muslims, who fled, along with their
With regard to variables 6 and 7, the villages with displaced persons again score lower than the average; and again the explanation appears to hinge on the question of caste. The most venturesome caste in the study area, apart, perhqps, from the Tarkhans, to be discussed later, and the numerically unimportant business castes, is unquestionably the Jats, who form such :'I
large proportion of the population of the villages which are not dominated by displaced persons. While the Jats also aTe usually the chief (or only) cultivating caste in the villages in which the land i~ mainly owned by displaced persons, they form there a much smaller share of the total. The greater share is formed by the much less adventurous, formerly untouchable castes. While these latter do not
hesitate to seek work outside the village, they are less prone, as well as less financially able, to leave their native hearth entirely to seek their fortunes elsewhere.
, The differences in average development score (variable 8) between the two sets of villages under discussion are not great. On the one hand the villages with the populaoons of displaced cultivators contain a higher proportion of distinctly wealthy individuals; but or the other hand they contain a higher proportion of the lowest economic and social strata of the local • soclety. In the aggregate they appeared to the author to average out to a wmewhat less favourable position than did the rcmaining villages.
Viewing now the entire sample of thirtythree villages, it may be noted that with respect to no~-agricultural work pursued within the village as a main source of income, the percentages of households so dependent varied quite widely, from a negligible number in village 25 to up to 35% in villages 1 and 1754. In all, only four villages, all in the Southeast, scored as high as 25 % and two others, both in the Northwest, 20%. The village specializations which contributed to these high standings included the making of shoes by the Chamar caste, in village 1; woollen carpet manufacture, also largely by thc Chamars in village 17, where they were taught the trade by immigrants from West Pakistan after the Muslim traditional caste weavers fled; brickmaking, again by Chamars, in a kiln operated by an outsider. in village 9; weaving and tailoring, in addition to a wide variety of other occupations,. in village 7, where an unusualy large number of Hindu and Sikh artisans were encountered; and grain-dealing, largely by the potter caste in village 2955• Most villages had a few different types of artisans
1St
still at work, often within the ja/mant system; but in most of the non-specialized villages the service occupations were somewhat more important.
A rather interesting feature of the study area is that, on add~ng the households with subsidiary sources of livelihood outside agriculture to those primarily so dependent, the total proportion is not increased to neafly the same degree as in most other parts of India; and few new village specialities appear. This indicates two things: first, a fairly high effective demand for the goods and services of the remaining and newly arrived artisan and service castes (the villages of displaced cultivators and the Chamar and Majabbi castes excepted) permitting a fairly high degree of household specialization; ruld second, a fairly exclusive control of land by the cultivating castes, which prevents many households from pursuing their traditional occupation on a subsidiary basis only, while relying mainly on agriculture 'ior a living. One of the few important subsidiary nonagricultural specialities which one might cite is twme-making among 'the Rai caste of village 25.
With respect to households mainly dependent on work done outside the villages by individuals residing within, the proportion of the total exceeds 15 % in only four instances. It is highest in villages 19 and 20, with 55% and 30% respectively. From these villages a great number of factory workers, porters, rickshaw pullers, and sundry day laborer,S go out to Amritsar. Villages 4 and 16, with 20% each, also are characterized by large numbers of unskilled 'outside day laborers, a situation caused by the departure of th.e old Muslim cultivators, and the failure of the new Jat
\ immigrants to provide the depressed castes with work. When subsidiary dependences
D4Village 19 which was excluded from consideration in the foregoing discussion is included in the discussion which follo\\1s'.
55The potter caste normally owns donkeys w!th which they transport their clays as well as their finish,ed wares. In order to exploit their four-legged capital to the fullest, the caste has, 10 several parts of India, taken to doing transport work on hire and independent petty grain-dealing.

ate atso C6nsidered, villages, 1, 27 and 31 also score 20% or more. The bulk of the outside work is of a casual nature in Ludhiana and Amritsar; but village 1 also has a fairly large number of regularly commuting skilled and un-skilled factory workers.
The households dependent mainly \ on outside labor done by family members resident outside of the village normally comprise 15 % or less of the vinage total, being 20% or more in only six Villages. The two most striking examples of this sort ot dependence are, oddly enough, not furnished by J at villages, but rather by village 16, in which Tarkhans, the carpenter caste, are the dominant group, a~d village 24, III
which they rank second. Out of fifty-five individuals reported to be working and living outside of village 16, forty were in Africa alone, generally still foll(hving their caste occupatIon or some related field of work. The Tarkhans, even more than the J ats, on a per capita basis, have been an emigrating group, and generally become skilled laborers ~herever they go. The J ats and, to a lesser degree, other agricultur<li castes, especially among the SUms, go largely into the army often staying in until able to retire, yet all the While investing their savings in land in their home village.. Many also become truck, bus and taxi drivers, policemen, and watchmen or e,nter such other professions in which brawn and a look of ferocity are considered desiderata. All over the Indian Ocean area and even further east in Hong Kong and the Philippines they are encountered in these roles. Punjab is also an important recruiting area for factory workers for India's modern industrial cities, like J amshedpur and Sindri whence mapy have gone from the sample villages.
Considering subsidiary as well as primary dependence on outside work done by nonresidents, the proportion of households reaches 35% in two instances, vil1age 16, which has already been discussed, and village 6, where soldiering and transport
work are the chief sources -of income. Also prominent are villages 17 (30%),5.(25%) and the already discussed '24 (25 % ) . Village 5 is essentially like 6, whereas village 17 has a rather large number of its sons in various jobs in England and Canada, about twenty households being affected in all.
Occupational Structure and Economic Development.-Table 24 shows for thirtytwo sample villages of the study area (again excluding village 19) the relationship of selected occupational and caste variables and VIllage size to economic development according to three subjectively determined development groups. With respect to variables 1, relating to village size, and 8 and 9, relating wholly or partly to caste, the positive correlations which one would expect in other parts of India appear to exist here also, even though it is not strong with respect to variable 9. But the picture presented by the occupational variables 2 through 7 is hardly clear. Not one of them shows a consistent, Significant trend which would warrant the suggestion that either a positive or negative correlation with development exists.
Variable 2 does show that the poorest, or "D", villages are, as one would expect. less well served by non-agricultural occupations than are the others; but why do the "A" and "B" villages appear to be no better served than the '~C" villages? The most probable explanation is that the level of services required in the villages to serve the non-agricultural population in this prosperous area can be attained by all but the poorest villages; so that increased prosperity beyond a certain point need not make for increased non-agricultural work, unless the village happens to have a significant non-agricultural specialization. The vagaries of the dispersion of caste groups following on partition may also be a contributing factor. Finally, it is likely that the wealthier "A" and "B" villages rely more heavily on the towns to supply certain goods and serVices, particularly
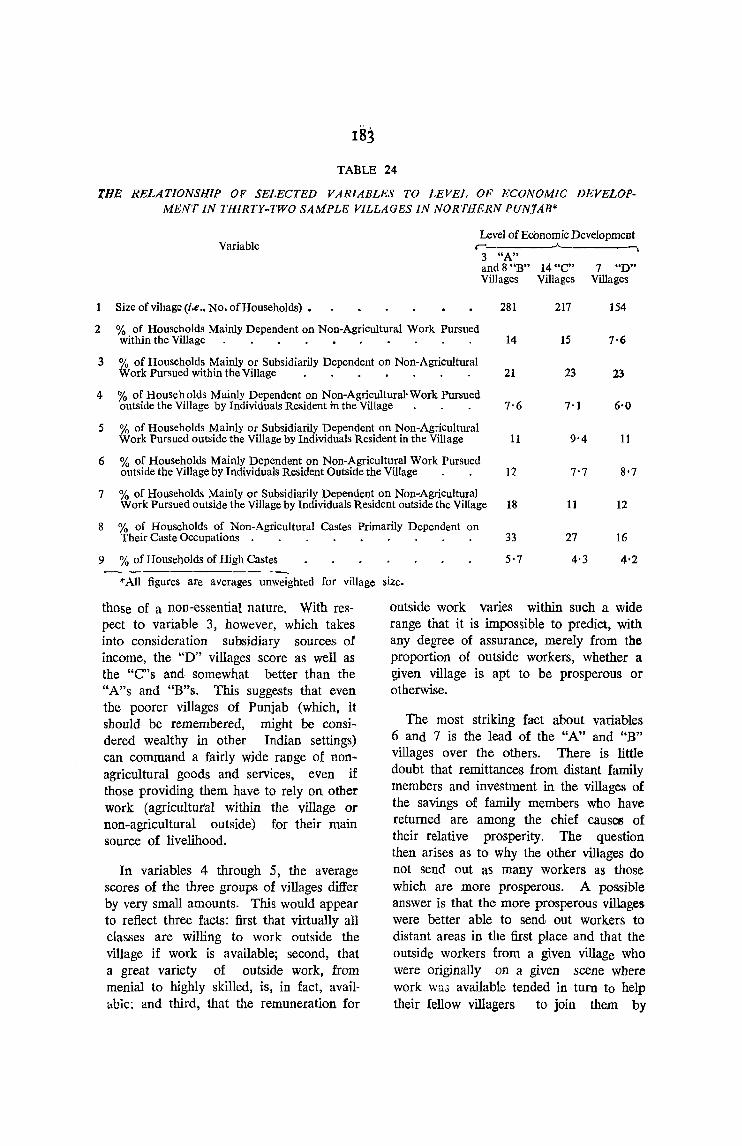
TABLE 24
't:HE RELATIONSHIP Of SELECTED VARIABLES TO LEVEL OF ECONOMIC DEVELOPMENT IN THlRTYMTWO SAMPLE VILLAGES IN NORTHERN PUNJAB*
Level of Economic Development Variable ~'---------~---------3 "A"
and 8 "B" 14 "C" 7 "D" Vill ages Villages Villages
1 Size of viii age (i.e •• No. of Households) • 281 217 154
2 % of Households Mainly Dependent on Non-Agricultural Work Pursued within the Village . . • • • • . . . . 14 15 7'6
3 % of Households Mainly or Subsidiarily Dependent on Non-Agricultural Work Pursued within the Village . . . • . . . 21 23 23
4 % of Househ olds Mainly Dependent on Non-Agricultural-Work Pursued outside the Village by Individuals Resident in the Village . . . 7'6 6'0 7·1
5 % of Households Mainly or Subsidiarily Dependent on Non-Agricultural Work Pursued outside the Village by Individuals Resident in the Village 11 9'4 11
6 % of Households Mainly Dependent on Non-Agricultural Work Pursued outside the Village by Individuals Resident Outside the Village . . 12 7'7 8'7
7 % of Households Mainly or Subsidiarity Dependent on Non~Agricultural Work Pursued outside the Village by Individuals Resident outside the Village 18 11 12
8 % of Households of Non-Agricultural Castes Primarily Dependent on Their Caste Occupations. . . . • . . . . 16
9 % of Households of High Castes
.,. All figures are averages unweighted for village
thOse of a non-essential nature. With respect to variable 3, however, which takes into consideration subsidiary sources of income, the "D" villages score as well as the "C"s and somewhat better than the "A"s and "B"s. This suggests that even the poorer villages of Punjab (which, it should be remembered, might be considered wealthy in other Indian settings) can command a fairly wide range of non~ agricultural goods and services, even if those providing them have to rely on other work (agricultural within the village or non-agricultural outside) for their main source of livelihood.
In variables 4 through 5, the average scores of the three groups of villages differ by very small amounts. This would appear to reflect three facts: first that virtually all classes are willing to work outside the village if work is available; second, that a great variety of outside work, from menial to highly skilled, is, in fact, availabie: and third, that the remuneration for
33 27
5'7 4'3 4'2
size.
outside work varies within such a wide range that it is impossible to predict, with any degree of assurance, merely from the proportion of outside workers, whether a given village is apt to be prosperous or otherwise.
The most striking fact about variables 6 and 7 is the lead of the "A" and "B" villages over the others. There is little doubt that remittances from distant family members and investment in the villages of the savings of family members who have returned are among the chief caUSe6 of their relative prosperity. The question then arises as to why the other villages do not send out as many workers as those which are more prosperous. A possible answer is that the more prosperous villages were better able to send out workers to distant areas in the fir,st place and that the outside workers from a given village who were originally on a given scene where work WD." available tended in turn to help their fellow villagers to join them by
providing loans to cover the cost of transport and shelter for those newly arrived. This sort of help would tend to heighten the lead of the village in question over the other villages which were initially slower to respond to the opportunities for lucrative outside employment.
Environs of Delhi
(Map 32)
The area around Delhi is far from homogeneous and poses an interesting variety of problems bearing on occupational structure and economic development. Among those questions are the following: What degree of urban influence is felt at varying distances and in varying directions from the built-up city area? What accounts for the rather large occupational variations among given areas of comparable urban proximityt What are the chan~s consequent on panttion and the large immigration of displaced persons from West Pakistan? What are the consequences of the fact that the region is administered by three separate state jurisdictions, those of the centrally-administered state of Delhi, of Punjab, and of Uttar Pradesh? Unfortunately, however, the author cannot provide detailed answers to any of these questions, as the field work he did in the environs of Delhi was aimed primarily at developing apd testing his method of field, investigation prior to his going to other areas of India. Moreover, the sample of nine villages is much too small for the region in question; and, even for those nine villages, the data obtained are not comparable, since several changes in ·concepts and interview techniques were made as it became evident that improvements were necessary. Consequently it is possible only to present tentative suggestions, in qualitative terms.
Table 25 shows the considerable range of variation in occupational structure in the greater Delhi region, aggregating the Census data by the major economic sectors for Delhi State ana the four adjoining districts.
,Among the most striking features borde out by these statistics are the following: (1) the overwhelmingly tertiary orientation of Delhi State and its several components, resulting of course from the'fact that New Delhi is the capital of the Indian Union; (2) the profound influence of the Delhi Metropolitan Area on the rural areas of Delhi State, where over half the labor force is engaged in non-primary activities; and (3) the wide range in the extent of non-primary employment in the four distncts surrounding Delhi, with Gurgaon at the low extreme and Meerut at the high, for both the secondary and the tertiary sectors, and for both the rural and the total district populations. .
With regard to the second of the above features it must be observed that nearly a tenth of the so-called rural population of Delhi State in 1951 were landless dis~ placed persons from Pakistan, generally living in government-provided, rurallysituated housing colonies, from which most commuted to work in the city. Still, this leaves an unusually high share of genuine rural dwellers in non-primary occupations. The number of commuters to the Delhi Metropolitan Area is not known, but the practical range for commuting takes in almost the whole of Delhi State, and extends well into Meerut and over into the border areas of Bulandshahr and Gurgaon as well. Although there are undoubtedly many villages. in the commuting range which are very highly dependent on work in the city, other villages quite :nearby showed surprisingly little response to the job opportunities in the city. In some cases this is due to the nature of the locally dominant caste. Villages 2 and 8, for example, both of which are Gujar villages. send very few workers to Delhi becaus·e the pastoral Gujars tend to shun'~ban employment, whereas village 1, only a mile away from village 2, and further removed from Delhi has a great many of its Jat households partly dependent on work in the city. (Jats, incidentally, are the dominant cultivating group of this region.
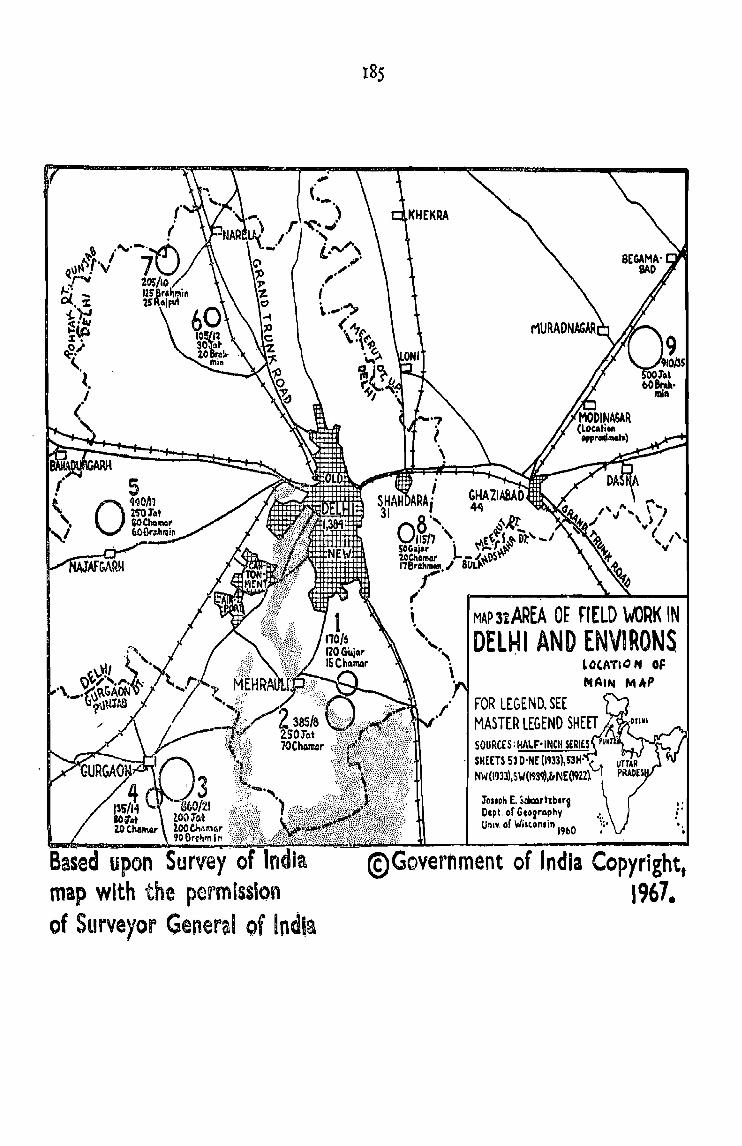
" ""
upon Survey of ndia map with the permission of Surveyor General of India
MAP 31AREA Of rrELD WORK IN DEl~1 AND ENVIRONS
LO'ATIQ N of MAIN MAP
FOR LEGEND, SEE MASTER LEGEND SHEET SOUR(ES:~~~~ SHEETS 53 D'NE' (1'33), NW(llJ33),S W(,,~,ltNE(I9221
J'OSlph E. S_rhblrt Dept. of Gtosraphy Unl~" of Wi"on.in I9bO
@Government of India Copyright, 1967.
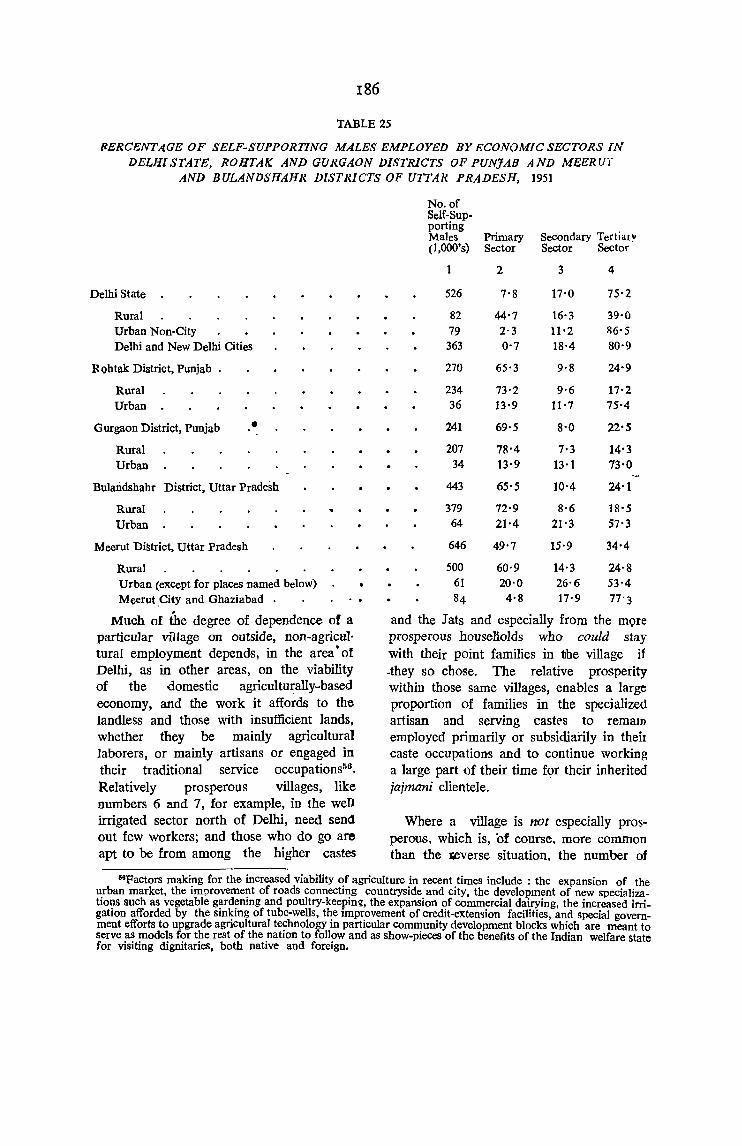
186
TABLE 25
llERCENTAGE OF SELF-SUPPORTING MALES EMPLOYED BY ECONOMIC SECTORS IN DELH! STATE, ROHTAK AND GURGAON D!STR!CTS OF PUNJAB AND MEERUT
AND BULANDSHAHR DISTRICTS OF UTTAR PRADESH, 1951
Delhi State
Rural Urban Non-City Delhi and New Delhi Cities
R ohtak District, Punjab .
Rural Urban
G urgaon District, Punjab
Rural Urban
•
Bularidshahr District, Uttar Pradesh
Rural Urban
Meerut District, Uttar Pradesh
Rural Urban (except for places named below) Meerut _City and Ghaziabad .
Much of the degree of dependence of a particular village on outside, non-agricwtural employment depends, in the area' of Delhi, as in other areas, on the viability of the domestic agriculturally-based economy, and the work it affords to the landless and those with insufficient lands, whether they be mainly agricultural laborers, or mainly artisans or engaged in their traditional service occupations56 •
Relatively prosperous villages, like 'numbers 6 and 7, for example, in the weD irrigated sector north of Delhi, need send out few workers; and those who do go are apt to be from among the higher castes
No. of Self-Sup-porting
Secondary Tertia!!, Males Primary (l,ooO's) Sector Sector Sector
1 2 3 4
526 7'8 17'0 75'2
82 44'7 16'3 39,0 79 2·3 11'2 R6'5 363 0'7 18'4 80'9
270 65'3 9·8 24'9
234 73'2 9·6 17'2 36 13'9 11'7 75'4
241 69'5 8'0 22'S
207 78'4 7'3 14'3 34 13·9 13·1 73'0
443 65'5 10'4 24'1
379 72'9 8·6 18'S 64 21'4 21'3 57'3
646 49'7 15'9 34'4
500 60'9 14'3 24'8 61 20'0 26'6 53'4 84 4'8 17'9 77-3
and the J ats and especially from the mQre prosperous houseHolds who could stay with their point families in the village if -they so chose. The relative prosperity within those same villages, enables a large proportion of families in the specialized artisan and serving castrs to remalJ> employed primarily or subsidiaiily in their caste occupations and to continue working a large part of their time f<?r their inherited jajmani clientele.
Where a village is not especially prosperous, which is, 'of course, more common than the lieverse situation, the 'number of
68Factors making for the increased viability of agriculture in recent times include : the expansion of the urban market, the improvement of roads connecting countryside and city. the development of new specializations such as vegetable gardening and poultry-keeping, the expansion of commercial dairying, the increased irrigation afforded by the sinking of tube-wells, the improvement of credit-extension faCilities, and special government efforts to upgrade agricultural technology in particular community development blocks which are meant to serve as models for the rest of the nation to foJIow and as show-pieces of the benefits of the Indian welfare state for visiting dignitaries, both native and foreign.
househOlds seeking outside employment in the usual types of casual, unskilled labor is apt to be quite large. This is particularly true among the untouchable Chamars, who are probably the second most numerous caste in the area, after the J ats, and the also untouchable and numerous caste of sweepers, the Bhangis, who find it fairly easy to get relatively well-paid government employment as sanitation workers in the municipalities. But, even in the less prosperous villages, it would appear that, a fairly iarge proportion of the specialized artisan and servant castes are still engaged Ill, or have recently returned to, their caste occupations, at least on a subsidiary basis.
In large measure the adherence or return to caste artisan occupations in the study area can be attributed to the inducements offered by the Community Development Administration and such private organizations as the Indillu Cooperative Union which is most active in the Delhi area, especially in the vicinity of Mehrauli. When new artisan's cooperatives are formed they not infrequently deal thrQugh government purchasing agencies, and thus have all assured inarket for their wares, which, if sufficiently stylish, may reach the shelves of the plush Cottage Industries Emporium in New Delhi.
A final cause of a high degree of rural non-agricultuml employment in the environs of Delhi is the extension of both large and small industries om into the ~ountryside, often i-n specially desjgnated industrial z('nes. Several {>actors have motivated this extension, including the flvailability of cheap rural labor and lowrent land and the government's desire to avoid urban congestion. Among the most· important plants are two large government ordnance factories which date from well back in pre-partition era. One of these, near Najafgarh, is an important source of
[~7
work for village 5, while the other,· at Muradnagar, is important for village 9. Most enterprises however, are relatively new. Village 8, near Gurgaon, affords a striking example of the extension of industry beyond Delhi. Electrified in 1955 (the power coming from the giant Bhakra Dam in the Siwalik Hills two hundred miles away), the village witnessed the opening, by 1958, of one small cotton textile mill, a tanuery, a rubber factory making bicycle inner tube.s six flour mills, an oil expelling mill, and a soap works. The great majority of the capital for these ventures was furnished by displaced persons resident outside the village.
Superficial investigation with regard to the four districts surrounding Delhi suggests the following tentative explanation of the marked contrasts shown in Table 25 in the extent of non-primary employment:
Meerut, which ranks highest in this respect, shows the following advantages: (1) It has particularly good road and rail links with Delhi, largely via the· important rail aud highway junction at Ghaziabad. {2) It· is 22 % urban as compared with from 14% to 16% in the other three district.57 (3) It has a much greater development of large-scale factory industry, including seven large sugar mills, twenty-one plants in the industrial complex at Modinagar, the . musical instruments industry at Meerut City, the aforementioned, ordnance factory at Muradnagar, and a great variety of new industries begun by displaced persons at Ghaziabad58• (4) Good canal irrigation and a highly successful specialization in the growing of sugarcane has resulted in an unusually high degree of agricultural prosperity.
At the opposite extreme, Gurgaon is characterized by relatively poor road and rail links with DeIhl, a relatively low
5, Meerut City, with 233,000 inhabitants (1951), is the only city in the four districts.
6sThe Modinagar complex is a part of the industrial empire of the Modi family, one of the richest families in India. It includes factories manufacturing sugar, hydrogenated vegetable oil (vanaspati), soaps, cosmetics hurricane lanterns, etc. The industries represented at Ghaziabad include ilass, rubber, light engineering work (lorting goods etc.
188
degree of urbanization (14%) relatively little large-scale industry, a paucity of canal irrigation, and a generally poorly developed state of agriculture. The area was said, moreover, to have long been purposely neglected by the British as a punishment for the .prominent role it took in the Mutiny of 1857; but this allegation would be very difficult to prove.
Rohtak and Bulandshahr rank but little higher than Gurgaon with respect to nonagricultural occupations, though the difference may well be significant. Better irrigated than Gurgaon, especially Bulandshahr, they presumably have a much more commercialized and prosperous. agricultural economy. They also enjoy better rail and road connections with Delhi. Industrially, however, they are about as retarded as Gurgaon; .and their degree of urbanization is almost identical.
Environs of Calcutta
The author spent only a few days visiting the rural environs of Calcutta, and conducted informal interviews in five villages only, in a potpourri of English. Hindi, and Bengali, of the last of which bis' interpreter had rather scant knowledge. Hence, his field work in that area must be considered as an impression-gathering reconnaissance only, rather than as a systematic investigation aimed at answering a certain set of pre-established questions. At each interview, enquiries were also made, as usual, about the villages, in the surrounding locality in order to ascertain the general nature of the area and the typicality or atyPicality of the village being
visited. The villages visited included one to the northeast of Calcutta, two to the west, and two to the south. None was further than twelve miles from the solidly built-up portion of the Metropolitan Area (including Howrah). The following statements, therefore, are only very general impressions:i9
The urban influence of Calcutta extends quite far out from the metropolitan limits~ and appears to have altered the surrounding countryside much more racli_cally than in the case of Delhi. This influence pervades virtnally all aspects of life, economic, social, and political, and has greatly affected the traditional caste determination of occupation. Political parties of all hues, now actively vie with caste for the primary allegiance of the individual, often witlt considerable success. The traditional taboos with regard to the salaried employment of upper caste females are also being relaxed in the rural environs of the city; and it is no longer rare for women to commute to office jobs. The volume of commuting in general vastly exceeds that in the Delhi area.
Nevertheless, there are still innumerable cases in which employment is strongly influenced, if not determined, by caste considerations; almO$t surely this is still the general rule with most castes other than Brahmins, Kayasths, and upper caste Moslems, all of whom seem to take to a great variety of work. There is also a tendency for the acceptance of a particular type of non-caste employment by a particular caste to be made more or less en bloc.I1O
59For some excellent observations relative to Bengal as a whole, N.K. Bose's article, "Modern Bengal (Man in India,Vol. 38, No.4, Oct-Dec., 1958, pp.229-295), is highly recommended. See especially Section lI, "Mutual Aid: Economic and Social Interdependence in Villages," pp. 237-241, and the Tables correlating caste and occupation on pp. 246-249.
6°Particularly worth noting is the example of the Barojibi caste, who comprised roughly four hundred families in a village of about 1,200 households, nine tenths of Whom were displaced persons. The Barojibis immigrated as a group from a very small area of East Pakistan where they had pursued their caste occupation of growing betel vines, a higbly remunerative. cash crop. Many of tbem began to grow betel also on tiny plots of land in their newly adopted village, where it had never been grown before; and many others became wholesale dealers in betel lea ves, which they imported from the old' areas of cultivation to the east. But a very large number of the caste were recruited to work on the railroad by a single caste member from the home village who, prior to' partition, had taken to that work and become a high railway official. Compared to these three occupations, all others, in the city and in the village, were relatively unimportant, though fairly varied in nature. Similar examples could be cited for several other castes, both among the population of displaced persons and among the remaining original inhabitants.
There is a strong tendency in the area toward pronounced occupational specialization, both within given villages and among clusters of villages in relatively restricted areas. These specializations arj largely caste-determined and are often of very long standing. Particularly noticeable among the artisan trades, such as weaving, potting, and various types of metal-work, specializatio~s also exist within the primary sector, with regard to the growing of particular crop specialties, or to the occupation of fishing. Whereas elsewhere in India the more specialized castes are
[89
generally diffused fairly evenly throughout predominantly agricultural villages in which each household would serve its cultivating jajmans, in this area one not infrequently encounters large clusters of particular groups in a single village, depending on market transactions over a fairly wide area for the disposal of their wares.61 Whether or not the jajmaJ'li system is, or over was, firmly established in this area, the author did not determine; but the general impression he formed is that, in the present era at any rate, it is nat.
81The area around Bengal appeared to the author to be peI'haps the most heterogenous he encountered in India from an ethic point of view. This would seem to be largely a consequence of the facts here described. No two of tile five villages he visited resembled one another to any great degree; and the dominant agricultural caste was different in all fiV'e villages. One village was overwhelmingly populated by displaced persons; another entirely by a single caste of Mus)im cultivators who chose to caste their lot with India; in :: thirci Muslim were a large minority; and in tJhe two remaining Muslims were entirely absent. Also interesting is the fact that for any given vill~e caste structure was but slightly articulated in comparison with the villages of comparable size in other parts ofIndia.
For some dot maps of the distribution of given castes in Bengal (pre-partition), see S. P. Chatterjee's Bengal in Maps (1948). For dot maps of the distribution of particular occupations (the dusterings of which stand out quite clearly), see the later publication of the State Statistical BUl7eau of the Government of West Bengal, Statistical Atlas, West Bengal, (1953.)


CHAPTER VI
A COMPARATIVE ANALYSIS OF THE FIELD STUDY AREAS
Introduction
Individual analyses of the several field study areas demonstrated repeatedly a significant degree of influence on occupational structure exercised by a number of factors varying both inter-regionally and among the sample villages of each area. Comparative examination of these relationships, generally restricted to eight of the twelve study areas, leads to .:ertain summary conclusions as to what determines the occupation'al structure of Indian villages in general. 1 Similar comparative analysis permits certain tentative conclusions as to the correlation between occupational structure and level of economic development in rural India and leads to a major general conclusion namely that there is a coherent, peculiarly Indian socio-economic system within· which most areas of the sub-continent may be graphically placed.
The factors found to be generally important in effecting variations in occupational structure are of two kinds: on the one hand, relatively stable, or organic, factors, in part inherent in the nature of the area, and cQnsequently, relatively enduring in effect, and, on the other hand, more dynamic factors subject to relatively rapid change, and consequelltly, producing more rapid change in the areas concerned. Of the former, the following are considered
as particularly worthy of comparative study: the size and spacing of settlement, proximity to major towns or cities, and, most important in the Indian context, the composition of the population according to religion and caste. The dynamic factors include not only those which make for and are consequent upon economic development, such as commercialization, changing social outlook, land reform, and community development, but also such independent and semi-dependent variables as the impact of partition and popUlation growth.
Since none of the individual factors mentioned above was -singled out for special study in all or eveR most of t~ study areas, and since there was normally no way of controlling the factor or of measuring the exact extent of its influence, the regional comparisons made in relation to them, are generaIl'y non-quantitative and largely impressionistic.
An important by-product of the investigations of this chapter stems from a check of the author's field observations against certain data of the Census which should theoretically have yielded similar regional results. An analysis of the discrepancies between 'the two is made which appears to demonstrate the correctness of several of the major criticisms of the Census repeatedly raised by the author in previous chapters. ~~
IThe graphs presented in this chapter include data for these eight study areas only. The Calcutta, Delhi, Kerala and Telangana areas are omitted because the field work was, as indicated in the introductory remarks to -the discussions ()f those areas in Chapter V, too limited, too general, or in some other way non-compl\· rable with that of the remaining study areas.
191
Factors Affecting Occupational Strqcture
Part One: Organic Factors
Size and Spacing of Settlement.-One Qf the factors most consistently related to occupational structure, as shown by Graph 7, is that the larger the village the greater is the proportion of non-agriculturists. In view of the small number of cases in many of the size-categories one cannot expect smooth or consistent curves. Since the range of occupational variation within any category is quite large and since highly specialized non-agricultural vlliages can oc~ur anywhere along.the.size spe~trum, irregularity in the slope and trend of the curves are oI?-Iy to be expected, particularly where the size of sample is smaIJ.2 The rather marked irregularity for the category of "large ¥iIIages" in the P-unjab may also reflect the dis~ptiv.e .effect of partition.
The average slope qf the curves for the various regions 40 n<?t differ supi.ciently. to demonstrate significant differences among them; neither it is possible to determine at what size villages tend to take on urb~n chara~teristics. . .
.
1920
No attempt was made to measure objectively the average spacing of settlement in the several study areas. indeed! in areas o~ dispersed ~ ~{t1ementJ like Kerala, the concept mal.es little sense. whi~e' elsewhere, .in Tamil N ad, for examp'le, wpere the so-called '1llage is normafly a complex of several scattered' an~ differentiated elements, or in North Bihar, where haml~ts are very common, it would be difficult to know between just which settlements di~tance was to be. measured.
By and large, however, there are several reasons for believing that over most of India
the average distance between villages varies within a range in which the differences in the spacing would not greatly afiec! the overall regional occupational structure (not counting for the moment the pattern of dispersion of urban areas, which will be considered under a separate heading): First, the network of villages is normally sufficiently dense so that a particular servicce n~t available in one· village is normally available in another not excessively far away. (A two-hour walk Or a half-day's ride in a bullockcart are not considered by most Indians as unduly irksome inconveniences when ~ome special good or service not locally proc\lrable is desire.d.) Second, there is a large number of itineran,ts 'going from village to village to provide special services, such as repairing of utensils, goldsmithing, priestly, medical, land astrological services, entertainment, cattle trading, and a variety of otJ;lers. (Often these itiperants op'er~te succ~ssively 'for reh~lvely, short periods ouf of a few vilrages in the area in which they work. Occ!lsional~y, they are true nomads originating ip a~e~s hundreds of miles distant). Thi~d, a signifi~ant proportion of non~agricultural services, are of an essential persona! natu:re for w_hich tne demand is virtmilly ubiquito~s, so that a majority of eyen the. yery s~all villages can 'afford to maintain households in their OWn midst to provide them, rather than depending on households in neighbouring villages.
But when villages ,are very ,closely ~paced: i.e., when the pophlation 'ce~sitv is particularly high, specialized aI1isan yfl}ages are apt to develop. These nor1l1ally provide goods of little bulk, lor, w~ich the demand is expressed ol!ly ,at infreq?~nt int~rvals (e.g., textile~l. me.talware, . an~ pottery). Generally, the distatices involved in getting to these villages are sufficiently
lIn the case of Ajmer the steep ~op from the sm I to' the medium-sized village categ6ry js exnlained by the. fact- that of the thrct;i small villages . e is a village sp~ializing in twine-making ancj 57'.% non-agnculturaI, as opposed to zero per _cent (fo nain dependenCe) for the two remaining villages.. f'M. averaec for the three is, thus, 19 %. The slight dip the middle range in the Curve for Chota Nagpur IS probably not significant. With respect to the Deccan La\ ~ Plateap area there w~re tpo few villa$es to s~ow a trepd Oil" way or another.
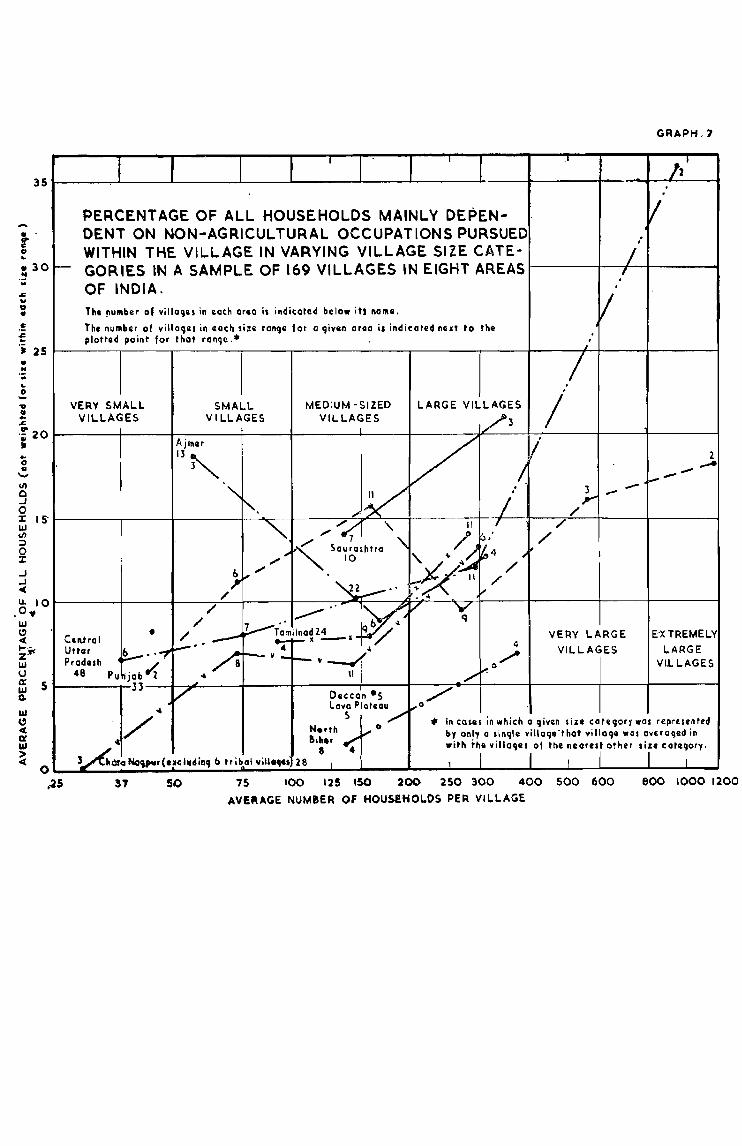
t o ..
35
I
PERCENTAGE OF ALL HOUSEHOLDS MAINLY DEPEN-DENT ON NON-AGRICULTURAL OCCUPATIONS PURSUED WITHIN THE VILLAGE IN VARYING VILLAGE SIZE CATE-
GRAPH.?
.r ,,1 -
If
• 30 .. I-- GORIES IN A SAMPLE OF 169 VILLAGES IN EIGHT AREAS /
! ..
.f f '; 25
" N .. .. o -" QI .. .&.
';20 • .. o c
"" 1/1 o .J o l: 15 L&J III :::l o :z: .J .J « u. 10 0 .. L&J C) <C(
I-~ Z L&J U
ffi 5 Q.
1&1 C) <C( cr 1&1 > <C(
o ~5
OF INDIA. I
The !lumber of villo911S in II.Clch area il indicated below its nOllle. V The nUlllbar of villoqal in 80ch liu ronCje for 0 Cjive" oroo i, indicated n~lt to the plottad point for that ron~e.. . /
7 . VERY SMALL SMALL MEDIUM -SIZED LARGE VILLAGES / VILLAGES VIL.LAGES VILLAGES ,/3
A j mar V V' Il~ 2
I. _... -" - 1--
JV .
~ . -'. .1- /'
" ,,~ " II /'
'\ / ~,. / ,," ~ SaurashtrCl " '\- ~/ ~4 ... ~
10
;. .... / ~~ /
~ ~ / / V" , .. ~
/' ,..,.- ,"
I~ /' Y / ;!..--T~'milnod 24
Central I ~ •• _.-A ~/ VERY LARGE E-X TREMEL.Y
~I--l _l 4
Uttar ~ .. .., 4 "" VILLAGES LARGE Pradllh /a -- If - t-- \' ---.' /'" Vll LAGES
48 Punjab ..: .. 11 /' ~o
33 ~
V Daccan IS / .. Lava Plateau ~o
/ !i """ .. In cOlas in which a !Jiven lize cateqory WOI reprcluted
N.,th V 0 by Ofl!Y 0 siMile Yillage'that villoql '1'01 avuoged in .. &1"' ~ :ith tht villages tf the ~earu; other Sir cote~ory. ~~<I~r(u<llIfinCi b tribal yill ....
e 4 28 I
37 50 75 100 125 ISO 200 250 300 400 500 600 800 1000 1200
.A"E~AGE NUMBER OF HOUSEHOLDS PER VIL.LAGE
194
,small for all the surrounding area to be well served. Thus, the households of the specialized artisan castes may have the satisfaction of living with a large block of their caste fellows. In the description of the environs of Calcutta it was suggested that the pattern of specialized artisan villages was particularly well-developed in Bengal. It is believed, admittedly on the basis of rather slight personal observation, that Bengal is a core area of a pattern of intraregional economic organization deviating from that of the classical jajmani system still prevailing, at least in some degree, over most of the rest of the country. The few fairly specialized artisan villages in the eastern part of the Chota Nagpur area (in which the villages are not especially closely spaced but in which B~ngali is widely spoken) suggest the cultural affinity of that area with the plains area of Bengal immediately to the east.
When villages are particularly widely spaced, as in much of the desert and steppe area of Rajasthan, it may be essential to have a greater complement of specialized artisan and serving occupations within each village than is necessary where what is lacking in one can be easily obtained in another nearby. This may result in a substantial increase in, the overall percentage of nonagriculturists working within the village. This .factor may have been of significance in the ca.ses of Saurashtra and Ajmer, and perhaps. also Punjab, which, in the order named, had the most widely spaced villages of all the study areas. The proportions of in-the-village non-agriculturists in these three areas were highest, third highest, and second highest, respectively, of the eight areas depicted on Graph 10 (discussed in detail in a subsequent section). But so many other factors are also at work that thj~ suggestion cannot be advanced with certainty.
Urban Proximity.-Among the locational factors operative within a region, the degree of proximity to major towns and cities is probably the one which is most important
with respect to the occupationai structut~ of Indian villages. Proximity to . mines
iand plantations (which exert very strong influence in a few rather limited areas of the sub-continent) generally has somewhat analagous effects. Proximity to· major transport arteries is not important in itself, but only in SO far as it contributes to proximity to something else, usually urban areas.
The only systematic attempt to study the effects of proximity to urban centres was made in the Central Uttar Pradesh study area where an unusually large sample of villages (forty-eight in all) and the presence of two particularly large and influential cities facilitated the task and yielded fairly conclusive results. It was found that the cities in question: (1) inhibited the development and/or fostered the deterioration of non-agricultural activities in the nearby areas, from which people preferred to travel to the cities to shop and to obtain specialized services; (2) were responsible for a greater rate of dependence on outside work due largely, but not exclusively, to commuting, in the nearby villages than in those further removed; and (3) often caused an actual shift of small, household or personal enterprises from villages to urban sites.
But, what may have been conclusively demonstrated for the area around Lucknow and Kanpur does not necessarily hold true for all, or even most other, areas of considerable urban influence. The key to understanding or predicting the occupational effects of a given city on its Umland lies in appreciating the basic economic tie which exists between the two. If the city is in the area, but not oj it, i.e., if the location of the city depends not on the produce of the immediate area for its existence, but rather on some peculiar advantage with regard to transport, centrality, or perhaps the caprice of some long-clead potentate, it is apt to contribute little to the wealth of its surroundings, but rather to drain off skills which otherwise might be employed in the villages.
If, on the other hand, a city depends for its wealth lar.$ely on the agricultural bounty of the surrounding area, as in the case of Rajkot, in Central Saurashtra, or the various cities in the Punjab, its merchants will have to pay for that bounty, normally raising rural purchasing power and hence, the effective demand for goods and services. The more common of these will almost surely continue to be supplied within the village, while certain others (e·g., bicycle-repairing, tailoring, flour milling, etc.) may be newly introduced. Moreover, some of the small-scale and cottage industries of the major uroan centres may be-· come diffused through the nearby villages and towns, as in the case of knitted goods and agricultural implements industries near Ludhiana and Junundur in the Puniab, the coir industry near Alleppey in Kerala, and the tanning. weaving and biri industries near'Vellur and the towns of the northern part of the Tamil Nad area. Of course, commuting to regular jobs or foraging in the cities Rnd towns in search of casual labor mcreases with increasing urban proximity in any case; but the necessity for the latter is less impelling in the more prosperous areas.
Prohably a minority of areas conform well to the two proto-types of urbanUmland relationships described above. There are, for example, a number of towns lind cities. the economy of which is integrated with that of their surrounding areas, which, nevertheless, appear to contribute relatively little to the wealth of the villages therein, because the productive resources of the countryside are largely owned by absentee capitalists who reap the lion's
I95
share of the dividends to spend or re-invest in the city.3 This is the situation in the cotton-growing Deccan Lava Plateau area, where the rate of absentee landlordism is unusually high, and in the coal-mining area of the Chota Nagpur.4
The area of A jmer affords a hybrid example of cities which both contribute to the wealth of the countryside in their role as markets for agricultural surpluses, and drain off non-agricultural workers tv the railroad workshops, the cantonments, and the textile mills. The net effect, in tbis case, however, has probably bem to strengthen the non-agricultural sector within the rural areas.
The environs of Delhi, the nation's capital, and ~a]cutta, its largest metropolis and capital of its most economically advanced state, pose special problems. While both cities, and particularly the fatter, probably acted in tfie latter part of the pre-independence era to depress the traditional sector of the village economy of the surrounding areas, in the new era of independence both have been centres from which waves of official concern for blighted rural Iildia have emanated into the adjacent countryside. The result has been an unusual concentration there of government effort to foster cottage industries and otherwise to raise the standard of living. Whether or not the effects will be lasting j<; debatable. But there can be little doubt that the non-governmentally-induced growth of dairying. market gardening, and poultry-keeping and the rise of comI~1Uting attendant on urban development will have lasting effects and raise the effective rural demand for ~oods and services.
aBert Hoselltz ha~ aptly described this type of city as "parasitic." as opposed to the type described in the )revious paragraph which he calls "Renerativl'." ("Generative and Parasitic Cities." in economic Deve[op'IIent aHd Cultural Change, Vol. III, No.3, April, 1955, pp. 278-194.)
IEven tl,ough the ~ovemment-control1ed waRes in the coal mines are good by Indian ~t~ndards, the area s greatly deficit In foodstuffs: and prices for staples are sufficIently high so that real tllJrchasim power remains :00 limited to (',ause much increase In th~ demand for vil1age-produ~d ROOds and ~erv!ces. Moreover. the ,rientatlon of shopplnll is rwerwhelmingly to urbanlzec1 areas around theTmines~themselves. Similar wage and )rice conditions obtain in plantation areas; but here there are few if any urban centres of much importance.
The case of. Saharsa Dist.rict in Nortb Bihar is distinctive in that, until recently, that study area was entirely lacking in towns. Such as now exist al'e not of much Influence except insofar as they provide employment for casual laborers, especially In the construction field.
A final and most important observation Is required. Whatever may be the [!eneral
effects of urban proximity, in any re!!ion of IndIa, it is necessary to remember that numerous individual villages, because of their peculiar caste structure or other noneconomic causes, may ~epart very markedly from the local trends. Numerous villages. even on the very fringes or-some large city, may appear to be virtually oblivious to any urban influence, at least insofar as their occupational structure is concerned, whereas other villages much further' removed may 'be profoundly altered.
The Ethnic Composition of the Population
196
(a) The Role of Religion.-By and large, religion plays, in the non-tribal parts of India, a minor rore, relative to caste, in determininp; the occuoational structure of ! given area. We have already seen how the institution of caste tends to pervade all the maior estaolisl'ied reli!!ions of the countrv, how castes associated with o:uticular occupations tend to arise redundantly in more than one religion in a given area, I'lri3 how, when there is no redundancv. dther Hindu or Muslim castes norman" 'lta,rve the remainder of ilie Dopu1ation in~oflir M a demand exists fOf the type of services they traditionally render!!. Still, there are certain occupations which scarceIv. if ever, occur in a given religion. while others tend to be much more common in one re1i!!ion than in another. The occupati09 of butchering_ for example, is unthinkable in Hinduism. but normanv
required in any l~rge Muslim community, white pig-breeding, which i~ anathema to Muslims, is widely practiced, usually on a subsidiary basis, among variqus low Hindu castes.6 Similarly, upon conversion to .Buddhism, the important Mahar caste of the Deccan· Lava Plateau, completely gave up the caste practlce' of removing carrion from the village and flaying tho hides. While all religions may engage In business, certain ones tend to speciaUze In such pursuits, in general or in particular areas. Wherever Jains are found, they tend to be in the general commercial field, while over much of' eastern and southern India (e.g., in the North Bihar, Tamil Nad and Kerala study areas) a large part of the Muslim minority tends to 'be associated with hawking and other forms of petty trading, just as the Hindu minority tended to dominate commerce in what is today West Pakistan. But in the ag~egate, in none of the study areas arC! -these special instances of the effects' of religion per se (i.e., as opposed to caste) of sufficient importance to alter greatly the overall occupational structure of the region:
II} tribai India a rather- different situation obtains, since such areas are normallv characterized by a lack of intra-vi1t~Q"e
household or- caste specialization. Thu~.
each IiouseHo1<:1 is nonmilIv denendent orimarily on cultivation and subsidiarilvon up to half a dozen other activities, i'nc1ndin{! hunting, fishing, gatherin'!, perham! a hit of oettv trade, and, if contact with. the Ollt
"ine economy is well established_ as in th~
southern part of the Chota N a 'mnr studv area, in a variety of casual or seasonal outside work, as agricultural laborers. construcTIon workers, brickmakers. etc. But where tribal peoples are scattered amon!! a Hindu majority, as in th~ central and northern parts of the Chota Naqpur studv
'Hinduism here subsumes Sikhism and Jainism. (,hri~tianity in Kerala, thou!!;h hierarcHcflllv divided hy caste as well as by sect, does nnt h:we, a~ ;'l Tnle, Clf'flT!V r1('fined .{)ccupatinnaJ roles as~ociateil with e:lch socII! stratum, despite a general tendency to associate the low caste Avasha Christians with agricultuTallabor lind menIal duties.
lIn Central Uttar Pradesh there arl1 ,in fact, two snecialized castes of Muslim butchers, the KMais ~nd the Itulhakasa, the former associated with the sla lle;hteTing of cattle and buffaloes and the latter with sheep and 1000!s. Each also sells the meat of its respective victims.
area, Tamil Nad, and Kerala, they are normally considered as just another element of the caste complex, almost always with a low-status ranking, and associated with agricultural labor or a few other semispecialized, subsidiary occupations like wood-cutting or toddy-tapping.
(b) The Role of Caste.-In all of the study areas for which comparable data were obtained the average number of castes per village, as shown on Graph 8, increases steadily with village size.7 But the curVl:S for the several regions differ.in two major respects: first, in regard to their height above the x-axis in any given size range; and second, in regard to their average slope, or rate of increase with increasing village size. These differences have important implicatIOns in the analysis of occupational structure.
The height of each curve in Graph 8 and the total number of castes involved (shown at the right end of each curve) arc indicative of the degree of ramification of the caste structure of the area to which they refer.8 By either criterion, Central Uttar Pradesh leads all other areas. A historical factor contributing to this situation wou1d appear to be the prolonged contact between Hindu and Muslim in this area and the occasional breaking off of groups of low caste Hindus to join the Muslim fold, sometimes forming new and independent castes and sometimes joining pre-existing, low Muslim castes. Whatever the explanation may be the presence of a highly ramified castc structurc means that a great variety of traditional goods and services ate locally available. That this can be maintained presumes a highly ramified demand structure.
t97
We are here dealing primarily with the variety of goods and services demanded, not with the total quantity. But since a greater variety happens to make for an increased quantity, it seems reasonable to suppose that a significant portion of the moderately high percentage of rural households in Central Uttar Pradesh who are mainly or subsidiarily dependent on nonagricultural pursuits may be accounted for simply by the presence in the area of specialized castes furnishing non-essl?ntial services which elsewhere are altogether lacking. Conversely, one of the contrj.., buting causes, though not the chief cause, of the generally small number of nonagricultural occupations within the villages in the Chota Nagpur study area (which has the lowest set of average numbers of castes per village on Graph 8) would appear to be the low degree of ramification of the caste structure.9
North Bihar and the Deccan Lava Plateau have castc structures which appear to lie between the two extremes cited above; 'Yet, with regard to the degree of primary dependence on non-agricultural occupations pursued within the village, both areas are comparable to the Chota Nagpur. In )l"orth Bihar, dire poverty would appear to be the chief cause of this; but the influence of caste shows through, nevertheless, in the much greater sub~'idiary dependence on artisan and serving occupations. In the Deccan Lava Plateau caste appears to playa very small role even at the level of subsidiary dependence. This would appear to be related to the pronounced decline thero of the jajmani system, which will be discussed in the following section of this chapter.
7[n the case of the Deccan Lava Plateau area, for whieh only a single point could be plotted, the generalization undoubtedly holds, even though not substantiated by the graph.
BBut one should not attach too much importance to the figures for the total number of castes encountered by the author in given region, since the number is, obviously, partially contingent on the number of villages in a given areal sample.
DOf all the study areas the Chota Nagpur was, it will be recalled, the last to be subjected to strong Hindu influence. This may be one of the reasons wby its villages are generally so little fractionized relatively speaking, with regard to caste. That there were as many as forty-six castes encountered in the entire area can be attributed to the recent influx of various Bengali groups, WJ:lO, however, are quantitatively unimportant.
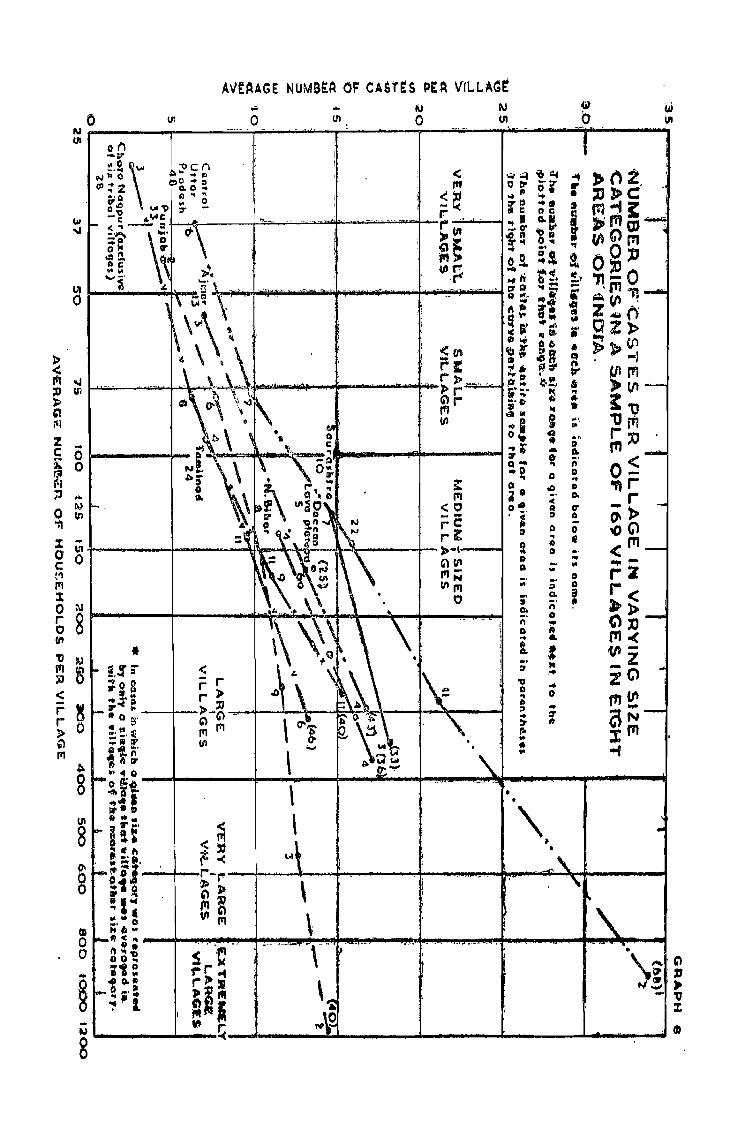
AV£AAGE NUMa~A OF CAsr~S PEA VILLAGE
\ ... t
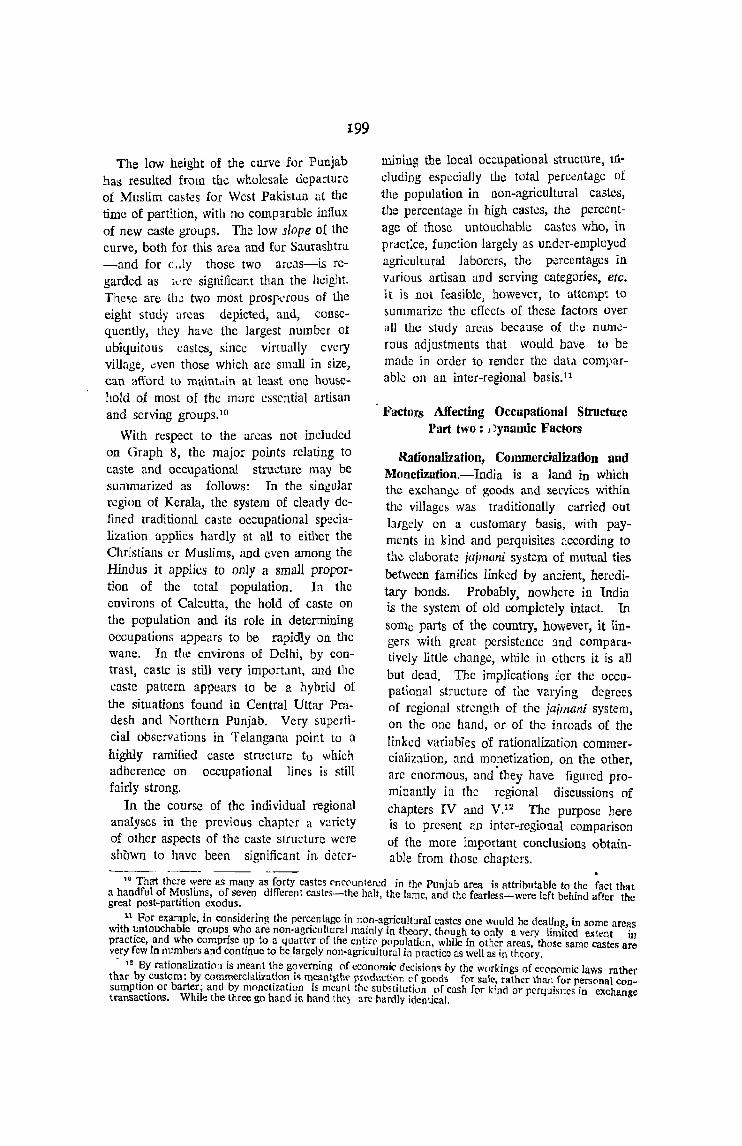
199
The low height of the curve for Punjab has resulted from the wholesale deparLur0 of Muslim castes for West PakistJ.ll at the time of partition, with no comp:lrablc influx of new caste groups. The low slope of the curve, both for this area and for Saurashtra -and for c . .ly those two nIcols-is regarded as ~l'r(' significant than the height. These are th~ two most prosp~rous of the eight study areas depicted, and, consequently, they have the largest number 01
ubiquitous castes, since virtually every Vl'llu'le ,wen those which are small in size,
0'
can afford to maintdin at least one hom,c-hold of most of the mure essential artisan and serving groupS.lO
With respect to tbe areas not included on Graph 8, the major points relating to caste and occupational strueturc may be summari7£d as follows: In the singular region of Kerala, the system of clearly defined traditional caste occupational specialization applies hardly at all to either the Christians or Muslims, and even among the Hindus it applies to only a small proportion of the total population. In the cnvirons of Calcutta, the hold of caste on the population and its role in detcrmining occupations appears to be rapidly on the wane. In the environs of Delhi, by contra<;t, caste is still very important. and the caste pattern appears to be a hybrid of the situations found in Central Uttar Pradesh and ]';"orlhcrn Punjab. Very superficial obse;vations in Telangana point to a
highly ramified caste structure to which adherencc on occupational lines is still fairly strong,
In the course of thc individual regional analyses in the previous chapt"r a variety of other aspects of the caste s1rueturc were shown to have been significant in detcr-
mining the local occupational structure, 111·
eluding especially the total percentage of the popUlation in non-agricultural castes, the percentage in high castes, the percentage of those untouchable castes who, in pract:ce, function largely as undi?r-employed agrkultural laborers, the p.orcentages in vdrious artisan and serving categories, etc. it is not feasible, however, to attempt to &ummarizc the efIccb of these factors over all the: study areas because of the numerous adjustments that would have to be made in order to render the data comparable on an inter-regional basis.ll
Factors Affecting Occupational Structure Part two: .)ynamic Factors
Rationalization, Commercialization and Monetization,-India is a land in which the exchange of goods and services within the villages was traditionally carried out largely on a customary basis, with payments in kind and pcrquisites :lccording to the elaborate jajmani system of mutual ties between families linked by ancient, hereditary bonds. Probably, nowhere in India is the system of old completely intact. In
some parts of the country, however, it lingers with gn::at persistence :llld comparatiVely little ch~mgc, while in others it is all but dead, The implications for the occupational structure of the varying degrees of regional strength of the jajmani system, on the one hand, or of the inroads of the
linked variables of rationalization commercialization, and monetization, on the other, arc enormous, and· they have figured prominantly in the regional discussions of
chapters IV and V.12 The purpose here is to present an inter-regional comparison
of the more important conclusions obtainable from those chapters,
10 That there were as many as forty castes eoc0untered in the Punjab area is attributable to the fact that a handful of Muslims, of seven different castes-the halt, the lame. and the fearlC8s-were left behind after the great post-partition exodus,
11 For example. in considering the percen tage in non·agricultural castes one would be dealing, in some areas with untouchable groups who are non·agricullural mainly in theory. th('lugh to only a very limited extent in practice, and who comprise up to a quarter of the entire population, while in other areas. those same castes are very few In numbers and continue to be largely non-agricultural in practice as well as in theory .
• 11 Ey rationalization is meant the governing ('If economic dl!cision~ by the workings of ecooC'lmic laws rather than by custom: by commercialization io; meant~the prt'ductior. of goods for sale. rather than for personal consumption or barter; and by mnnetization Is meant the substitution of cash for kind or perquiSItes in exchange transactions. While the three go hand in hand the) afC hardly identical.
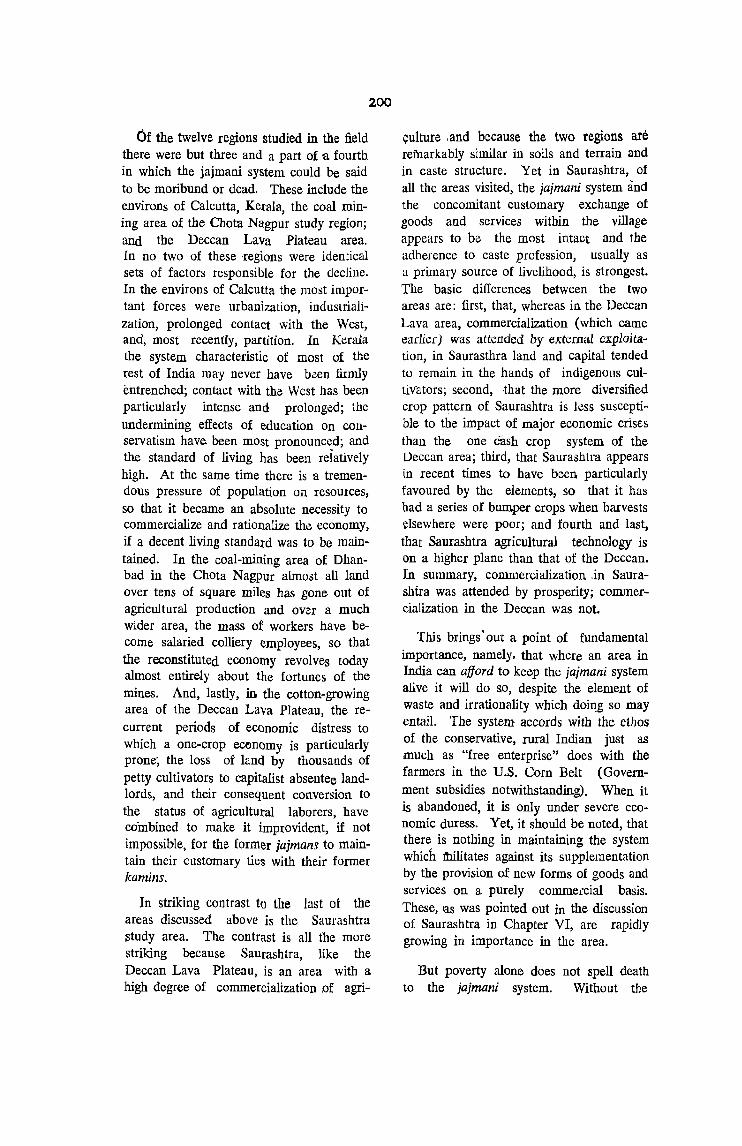
200
Of the twelve regions studied in the field there were but three and a part of a fourth in which the jajmani system could be said to be moribund or dead. These include the environs of Calcutta, Kerala, the coal mining area of the Chota Nagpur study region; and the Deccan Lava Plateau area. In no two of these 'regions were identical sets of factors responsible for the decline. In the environs of Calcutta the most important forces were urbanization, industrialization, prolonged contact with the West, and, most recently, partition. In K~rala
the system characteristic of most of the rest of India ma:y never have b.!en firmly entrenched; contact with the West has been particularly intense and prolong~d; the undermining effects of education on conservatism have.. been most pronounced; and the standard of living has been relatively high. At the same time there is a tremendous pressure of population on resources, so that it became an absolute necessity to commercialize and rationalize the economy, if a decent living standard was to be maintained. In the coal-mining area of Dhanbad in the Chota Nagpur almost aU land over tens of square miles has gone out of agricultural production and oVer a much wider area, the mass of workers have become salaried colliery employees, so that the reconstituted economy revolves today almost entirely about the fortunes of the mines. And, lastly, in the cotton-growing area of the Deccan Lava Plateau, the recurrent periods of economic distress to which a one-crop economy is particu}arly prone; the loss of land by thousands of petty cultivators to capitalist absentee landlords, and their consequent conversion to the status of agricultural laborers, have combined to make it improvident, if not impossible, for the former jajmans to maintain their customary ties with their former kamins.
In striking contrast to the last at the areas discussed above is the Saurashtra study area. The contrast is all the more striking because Saurashtra, like the Deccan Lava Plateau, is an area with a high degree of commercialization of agri-
culture ,and because the two regions are reinarkably similar in soils and terrain and in caste structure. Yet in Saurashtra, of all the areas visited, the jajmani system and the concomitant customary exchange of goods and services within the vjllage appears to be the most intact and the adherence to caste profession, usually as a primary source of livelihood, is strongest. The basic differences between the two areas are: first, that, whereas in the Deccan Lava area, commercialization (which came earlier) was attended by external exploitation, in Saurasthra land and capital tended to remain in the hands of indigenous cultivators; second, that the more diversified crop pattern of Saurashtra is less susceptible to the impact of major economic crises than the one cash crop system of the [)eccan area; third, that Saurashtra appears in recent times to have been particularly favoured by the elements, so that it has bad a series of bumper crops when harvests elsewhere were poor; and fourth and last, that Saurashtra agricultural technology is on a higher plane than that of the Deccan. In summary, commercialization.in Saurashtra was attended by prosperity; commerdalization in the Deccan was not.
This brings' out a point of fundamental importance, namely, that where an area in India can afford to keep the jajmani system alive it will do so, despite the element of waste and irrationality which doin_g so may entail. The system accords with the ethos of the conservative, rural Indian just as much as "free enterprise" does with the farmers in the U.S. Corn Belt (Government subsidies notwithstanding). When it is abandoned, it is only under severe economic duress. Yet, it should be noted, that there is nothing in maintaining the system which dlilitates against its supplementation by the provision of new forms of goods and services on a purely commercial basis. These, las was pointed out in the discussion of Saurashtra in Chapter VI, are rapidly growing in importance in the area.
But poverty alone does not spell death to the jajmani system. Without the
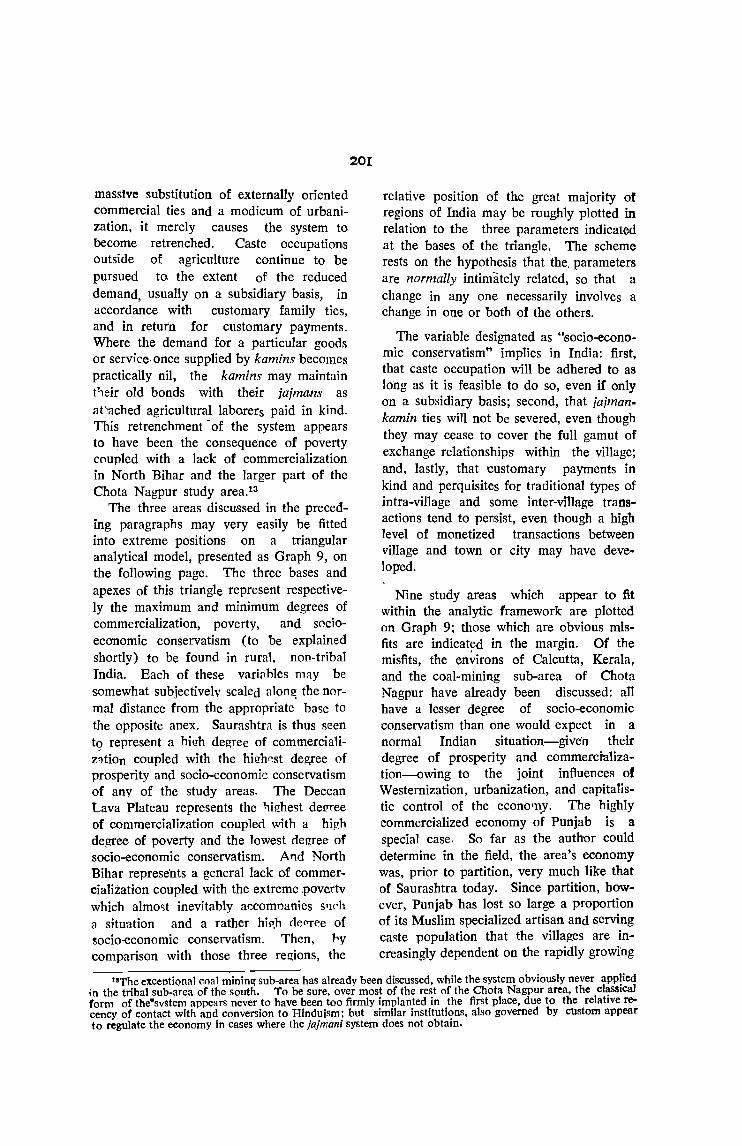
massIve substitution of externally oriented commercial ties and a modicum of urbanization, it merely causes the system to become retrenched. Caste occupations outside of agriculture continue to be pursued to the extent of the reduced demand, usually on a subsidiary basis, in accordance with customary family ties, and in return for customary payments. Where the demand for a particular goods or service once supplied by kamins becomes practically nil, the kamins may maintain tieir old bonds with their jajmans as at'ached agricultural laborers paid in kind. This retrenchment -of the system appears to have been the conseque'nce of poverty coupled with a lack of commercialization in North Bihar and the larger part of the Chota Nagpur study area.13
The three areas discussed in the preceding paragraphs may very easily be fitted into extreme positions on a triangular analytical model, presented as Graph 9, on the following page. The three bases and apexes of this triangle represent respectively the maximum and minimum degrees of commercialization, poverty, and socioeconomic conservatism (to be explained shortly) to be found in rural, non-tribal India. Each of these variables may be somewhat subjectively scaled alon~ the normal distance from the appropriate ba'lc to the opposite apex. Saurashtra is thus seen to represent a hi!!h degree of commercialiZ;;tion coupled with the hi!!h~st dejifee of prosperity an~ socio-economic conservatism of any of the study areas. The Deccan Lava Plateau represents the l1ighest del!t'ee of commercialization coupled with a hi!!" degree of poverty and the lowest degree of socio-economic cons'ervatism. And North Bihar represents a general lack of commercialization coupled with the extreme .povertv which almo'lt inevitably accomnanies s'1('h a situ':'ltion and a rather hiIY.h de"ree of wcio-economic conservatism. Then, 1"-y comparison with those three regions, the
20I
relative position of the great majority of regions of India may be roughly plotted in relation to the three parameters indicated at the bases of the triangle. The scheme rests on the hypothesis that the, parameters are normally intimately related, so that a change in anyone necessarily involves a change in one or both of the others.
The variable designated as "socio-economic conservatism" implies in India: first, that caste occupation will be adhered to as long as it is feasible to do so, even if only on a subsidiary basis; second, that jajmankamin ties will not be severed, even though they may cease to cover the fu]] gamut of exchange relationships within the vil1age; and, lastly, that customary payments in kind and perquisites for traditional types of intra-viIlage and some inter-vil1age transactions tend to persist, even though a high level of monetized transactions between vi11age and town or city may have developed.
Nine study areas which appear to fit within the analytic framework are plotted on Graph 9; those which are obvious misfits are indicat~d in the margin. Of the misfits, the environs of Calcutta, Kerala, and the coal-mining sub-area of Chota Nagpur have already been discussed: all have a lesser degree of socio-economic conservatism than one would expect in a normal Indian situation-give'n their degree of prosperity and commercialization-owing to the joint influences of Westernization, urbanization, and capitalistic control of the econorny. The highly commercialized economy of Punjab is a special case. So far as the author could determine in the field, the area's economy was, prior to partition, very much like that of Saurashtra today. Since partition, however, Punjab has lost so large a proportion of its Muslim specialized artisan and serving caste population that the villages are increasingly dependent on the rapidly growing
lIThe exceptional coal mining sub-area has already been discussed, while the system obviously never applied in the tribal sub-area of the south. To be sure. over most of the rest of the Chota Nagpur area, the classical form of the'svstem appears never to have been too firmly implanted in the first place, due to the relative recency of contact with and conversion to Hinduism: but similar institutions, also governed by custom appear to regulate the economy in cases where the jajmani system does not obtain.
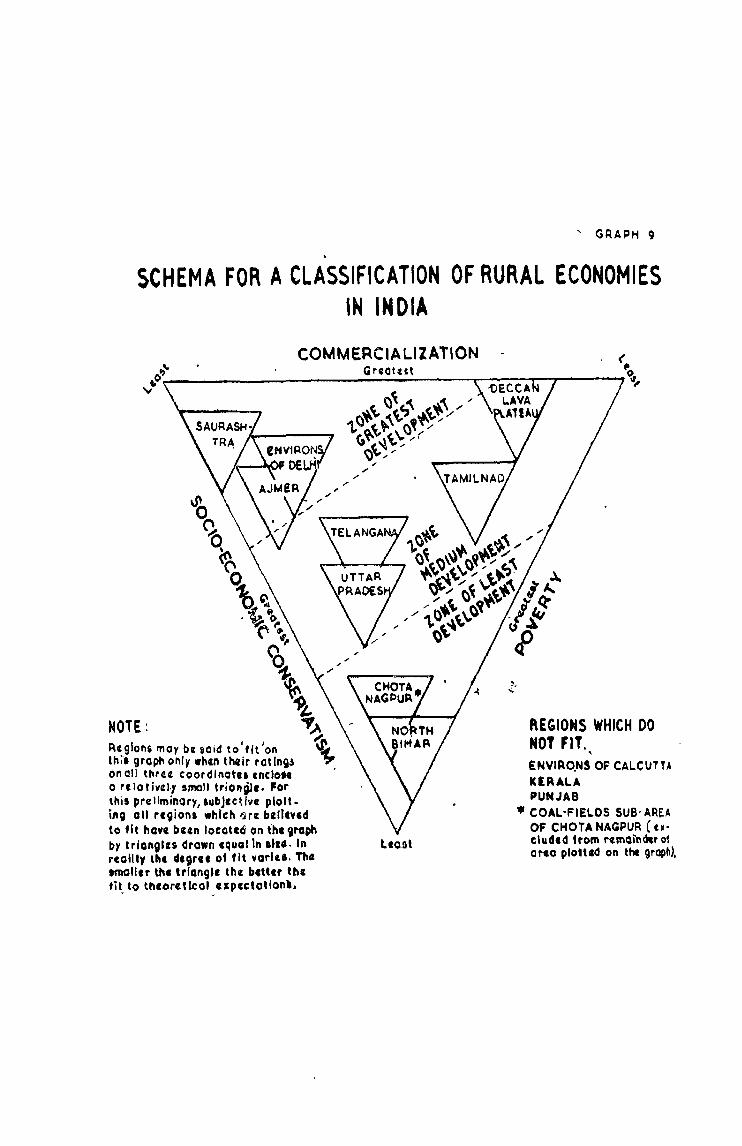
, GRAPH g
SCHEMA FOR A CLASSIFICATION OF RURAL ECONOMIES IN INDIA
NOTE: Rc glons moy be aafd to' fit Jon Ihi', graph only wh", their rotingl on all tllru coordlnotu enclOH o rc 10 t ;vII,y small triangle. For thiS prellminary,lubJectlve ploll. ill9 all regionl which I)Irl believed to fit hoye been locoteo on the 9roph by t, long I CI drown equo lin '~III. I" reolily lht deiru 0' 1(t vorlel. 11111 trAOlier the trlangl. thl bette, the fit, to t"'corcU~QI expectation'_
Leost
f\EGIONS WHICH DO NOT FIT. , ENV1RO.NS OF CALCUTTA KIA ALA PUNJAB
• COAL-FIELDS SUB' AREA OF CHOTA NAGPUR (u· eluded 'rom rcmoindlr 01 a rca ploU.<I on the graph),
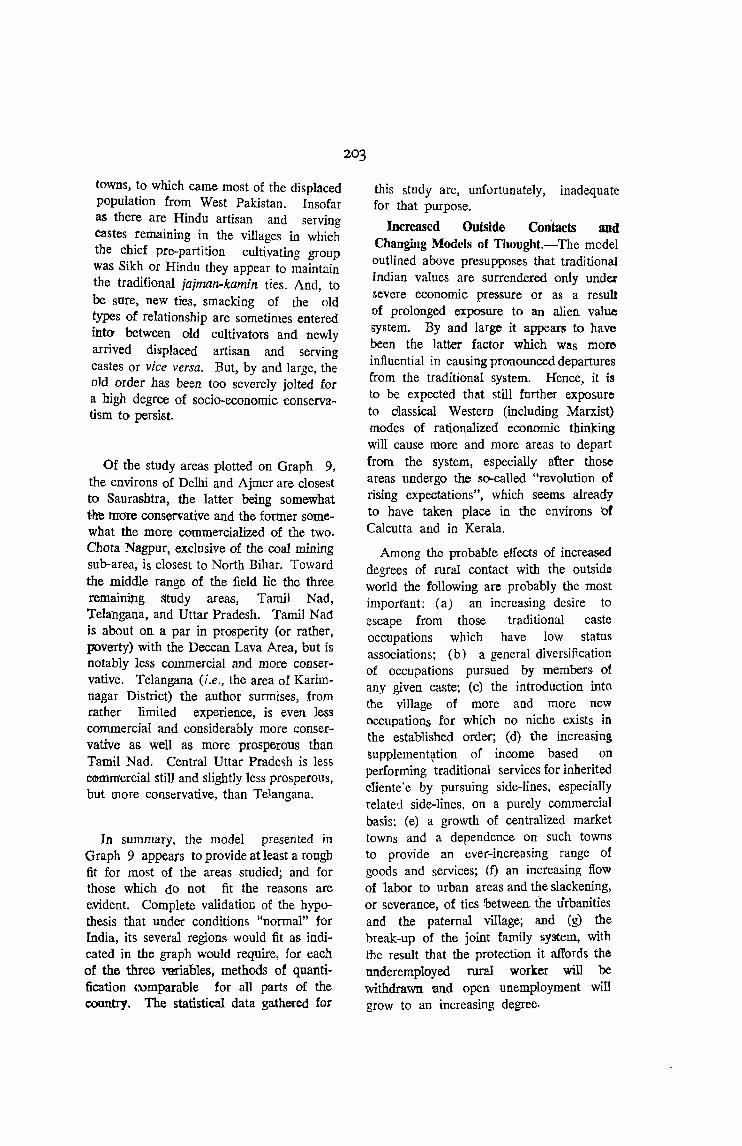
towns, to which came most of the displaced population from West Pakistan. Insofar as there are Hindu artisan and serving castes remaining in the villages in which the chief pre-partition cultivating group was Sikh or Hindu they appear to maintain the traditional jajman-kamin ties. And, to be sure, new tres, smacking of the old types of relationship are sometimes entered int() between old cultivators and newly arrived displaced artisan and serving castes or vice versa. But, by and large, the old order has been too severely jolted for a high degree of socia-economic conservatism to persist.
Of the study areas plotted on Graph 9, the environs of Delhi and Ajmer are closest to Saurashtra, the latter being somewhat t-he more conservative and the former somewhat the more commercialized of the two. Chota Nagpur, exclusive of the coal mining sub-area, is closest to North Bihar. Toward the middle range of the field lie the three remaining study areas, Tamil Nad, Telangana, and Uttar Pradesh. Tamil Nad is about on a par in prosperity (or rather, poverty) with the Deccan Lava Area, but is notably less commercial and more conservative. Telangana (i.e., the area of Karimnagar District) the author surmises, from rather limited experience, is even less commercial and considerably more conservative as well as more prosperous than Tamil Nad. Central Uttar Prade~h is less c<MIlmercial still and slightly less prosperous, but more conservative, than Te)angana.
In summary, the model presented in Graph 9 appears to provide at least a rough fit for most of the areas studied; and for those which do not fit the reasons are e.vident. Complete validation of the hypothesis that under conditions "normal" for India, its several regions would fit as indicated in the graph would require, for each of the three variables, methods of quantification (\)mparable for all parts of the country. The statistical data gathered far
203
this study are, unfortunately, inadequate for that purpose.
Increased Outside Contacts and Changing Models of Thought.-The model outlined above presupposes that traditional Indian values are surrendered ooly under severe economic pressure or as a result of prolonged exposure to an alien value system. By and large it appears to have been the latter factor which WitS more influential in causing pronounced departures from the traditional system. Hence, it is to be expected that still further exposure to classical Western (including Marxist) modes of rationalized economic thinking will cause more and more areas to depart from the system, especially after those areas undergo the so-called "revolution of rising expectations", which seems already to have taken place in the environs 'of Calcutta and in Kerala.
Among the probable effects of increased degrees of rural contact with the outside world the following are probably the most important: (a) an increasing desire to escape from those traditional caste occupations which have low status associations; (b) a general diversification of occupations pursued by members of any given caste; (c) the introduction into the village of more and more new occupations for which no niche exists in the established order; (d) the increasing supplement~tion of income based on performing traditional services for inherited cliente' e by pursuing side-lines, especially relatd side-lines. on a purely commercial basis; (e) a growth of centralized market towns and a dependence on such towns to provide an ever-increasing range of goods and services; (f) an increasing flow of labor to urban areas and the slackening, or severance, of ties between the urbanities and the paternal village; and (g) the break-up of the joint family system, with the result that the protection it affords the tmderemployed rural worker will be withdrawn and open unemployment will grow to an increasing degree.

204
Generally speaking, the extent of outside contact increases directly with increasing economic development, while the impact of such contact on the thinking of the .inhabitants of a given area is proportional to their 'dissatisfaction with the status quo, i.e., either with their poverty viewed in absolute terms, or, more commonly, with the degree to which their present economic status falls short of their expectations as to what it ought to be.
Land Reform and Community Development Programs.14-Government intervention to improve the rural economy of Iadia has, sipce the attainment of independence been largely channelled in two major fields: land reform and community development.
The aspect of land reform which, to date, has been mpst completely effected, has been the abolition of rent-collecting intermediaries Czamindars, jagirdars, etc.) between the cultivators and the government in which ultimate rights were vested and to which a portion of the rents were formerly turned 'over as taxes. Also widely enacted have been such tenancy reform& as reduction of ronts, guarantees on security of tenure, and provisions for the acquisition of direct title by the cultivators. Most states have imposed ceilings on the amount of land that can be acquired in the future and about half the states have imposed ceilings on current Iholdings. In Puniab, in particular, and in several other states as well, the consolidation of scattered holdings has made great headway. The establishment of cooperative farming (not merely cooperative purchasing of seed and fertilizer and cooperative marketing) is hotly debated, but as yet nowhere implemented on a significant scale. Also vigorously discussed. but little implemented, are programs of government redistribution of land to the
landless. Inaction in this regard is largely due to the fact that the law on existing ceilings has either not yet been enforced or has been legally circumvent~d by a subdivision 'of large holdings on paper only.
In the realm of community development, the government's efforts have been devoted mainly to up-grading agricultural technology increasing the attention given to animal husbandry, improving rural communications, encouraging the growth of c0-
operatives (including cottage-industrial cooperatives), spreading idea~ of better health and sanitation practices, and bringing a variety of social amenities to the villages. Patterned after the American model of agricultural extension, and financed largely. through American aid, the program begun late in 1952, already covers areas containing most of the nation's rural population. Complete coverage is anticipated in the very near future.
While in the field of land reform some states have proceeded much more rapidly than others, the progress of the centrally administered community development programs shows much less regional variation. But in both fields it is much too early to assess the probable lasting impact on the rural economy. So far as occupational structure is concerned, the author found no appreciable effects in the areas in which he has worked. Though many tenants have been converted, for all practical purposes, to the status of independent cultiwtors, little or nothing has as yet been done for the vast majority of agricultural laborers, who must still shift for what work they can get in the village 0:;: outside in towns and on construction projects.. Temporary labor, in· the paving laf village, streets (esJiecially in Punjab), the building of panchayat ghars (community halls) and the construction or improvement of approach roads, wells,
URather aood summary discussions of these topiCS may be found in the government's year book India 19W. prepared by the Ministry ofInformation and Broadcasting. Chapter XXI, "Land Reform" (pp. 268-278)' covers the chief legislation and results of reform to date on a statewise basis. Chapter XVIII, "Community I)¢velopment" (pp. 214-217). is more general and contains no statewise figures. (The above note is left as orl· gilmlly written although it is obvious that more up to date information is now available.)
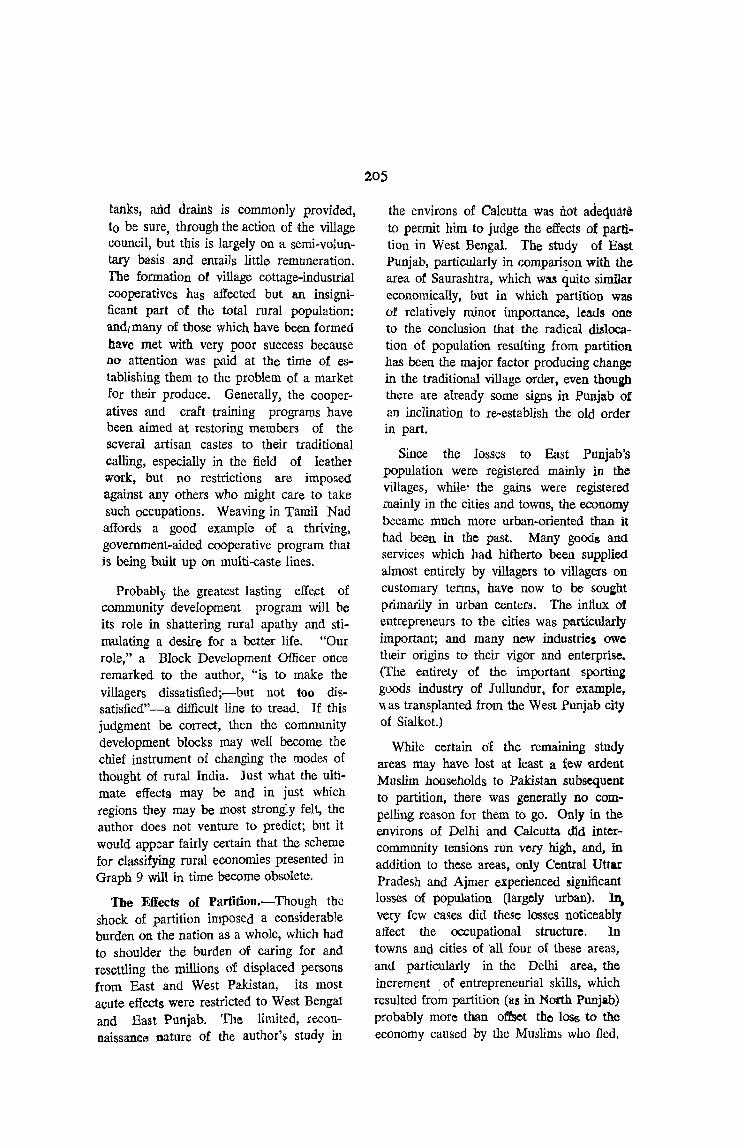
tanks, arid drains is commonly provided, to be sure, through the action of the village council, but this is largely on a semi-voluntary basis and entails little remuneration. The formation of village cottage-industrial cooperatives has affected but an insignificant part of the total rural population: and/many of those which have been formed have met with very poor success because no attention was paid at the time of es .. tablishing them to the problem of a market for their produce. Generally, the cooperatives and craft training programs have been aimed at restoring members of the several artisan castes to their traditional calling, especially in the field of leather work, but no restrictions are imposed against any others who might care to take such occupations. Weaving in Tamil Nad affords a good example of a thriving, government-aided cooperative program that is being built up on multi-caste lines.
Probably the greatest lasting effect of community development program will be its role in shattering rural apathy and stimulating a desire for a better life. "Our role," a Block Development Officer once remarked to the author, "is to make the villagers dissatisfied;-but not too dissatisfied"-a difficult line to tread. If this judgment be correct, then the community development blocks may well become the chief instrument of changing the modes of thought of rural India. Just what the ultimate effects may be and in just whiCh legions they may be most strongly felt, the author does not venture to predict; but it would appear fairly certain that the scheme for classifying rural economies presented in Graph 9 will in time become obsolete.
The Effects of Partition.-Though the shock of partition imposed a considerable burden on the nation as a whole, which had to shoulder the burden of caring for and resettling the millions of displaced persons from East and West Pakistan, its most acute effects were restricted to West Bengal and East Punjab. The limited, reconnaissance nature of the author's study in
~05
the environs of Calcutta was tiot adeql1:lt() to permit him to judge the effects of parti. tion in West Bengal. The study of East Punjab, particularly in comparison with the area of Saurashtra, which was quite similar economically, but in which partition was of relatively minor importance, leads one to the conclusion that the radical <fulocation of population resulting from partition has been the major factor producing change in the traditional village order, even though there are already some signs in PUnjab of an inclination to re-establish the old order in part.
Since the losses to East Punjab's population were registered mainly in the villages, while· the gains were registered mainly in the cities and towns, the economy became much more urban-oriented than it had been in the past. Many goods and services which had hitherto been supplied almost entirely by villagers to villagers on customary terms, have now to be sou~t primarily in urban centers. The influx of entrepreneurs to the cities was particularly important; and many new industries owe their origins to their vigor and enterprise. (The entirety of the important sporting goods industry of Jullundur, for example, \\ as transplanted from the West Punjab city of Sialkot.)
While certain of the remaining study areas may have lost at least a few ardent Muslim households to Pakistan subsequent to partition, there was generally no compelling reason for them to go. Only in the environs of Delhi and Calcutta did intercommunity tensions run very high, and, in addition to these areas, only Central Uttar Pradesh and Ajmer experienced significant losses of population (largely urban). In, very few cases did these losses noticeably affect the occupational structure. In towns and cities of 'all four of these areas, and particularly in the Delhi area, the increment . of entrepreneurial skills, which resulted from partition (as in North PWljab) probably more than offset the 10% to the economy caused by the Muslims who fled.
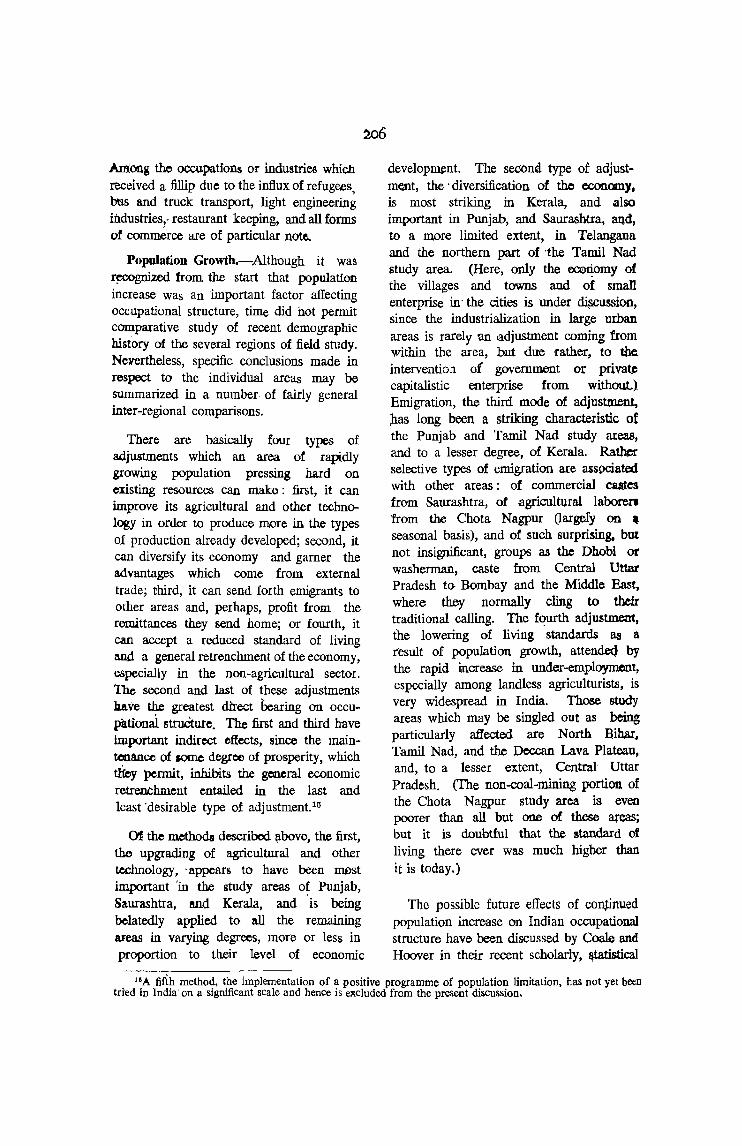
Am:oog the occupations or industries which received a fillip due to the influx of refugees bus and truck transport, light engineering i:b.dustriesf restaurant keeping, and all forms of commerce are of particular note..
Population Growth.-Although it was r~gnized hom the start that population increase was an 'important factor affecting occupational structure, time did not permit comparative study of recent demographic history of the several regions of field study. Nevertheless, specific conclusions made in respect to the individual areas may be summarized in a number of fairly general inter-regional comparisons.
There are basically four types of adjustments which an area of rapidly growing population pressing hard on existing resources can make: first, it can improve its agricultural and other technology in order to produce more in the types 01 production already developed; second, it can diversify its economy and gamer the advantages which come from external trade; third, it can send forth emigrants to other areas and, perhaps, profit from the remittances they send home; or fourth, it can accept a reduced standard of living and a general retrenchment of the economy, especially in the non-agricultural sector. 1be second and last of these adjustments b.ave ~ greatest dtrect bearing on occupational struCture. The first and third have tmportant indirect effects, since the main~Ance of IOOl.e degree of prosperity, which t1:Cey permit, inhibits the goneral economic retrenchment entailed in the last and least . desirable type of ad justment.15
2.06
at the methods described !ibove, the first, tho upgrading of agricultural and other teclmology, 'appears to have been most important 'in the study areas of Punjab, Saurashtra, and Kerala, and . is being belatedly applied to all the remaining areas in varying degrees, more or less in proportion to their level of economic
---------
developmtnt. The seoona type of adjust:me.nt, the' diversification of the economy. is most striking in Kerala, and also important in Punjab, and Saurashtra, and, to a more limited extent, in Te1angana and the northern part of -the Tamil Nad study area. (Here, only the eco~om.y of the villages and towns and of sman enterprise in-the cities is under ~ussion, since the industrialization in large urban areas is rarely an adjustment coming from within the area, but due ,rather, to the. intervention of government or priva~ capitalistic enterprise from without} Emigration, the third mode of adjustment, pas long been a striking characteristic of the Punjab and Tamil Nad study areas, and to a lesser degree, of Kerala. Rather selective types of emigration are associated with other areas: of commercial cQAtes from Saurashtra, of agricultural laboren from the Chota Nagpur (largefy on , seasonal basis), and of such surprising. but not insignificant, groups as the Dhobi or washerman, caste from Central Uttar Pradesh to- Bombay and the Middle East, where they normally cling to their traditional calling. The f<?Urth adjustment, the lowering of living standards as a r'esult of population growth, attende4 by the rapid increase in under-employment, especially among landless agriculturists, is very widespread in India. Those study areas which may be singled out as being particularly affected are North Biha.r~
Tamil Nad, and the Deccan Lava Plateau, and, to a lesser extent, Central Uttar Pradesh. (The non-coal~mining portion of the Chota Nagpur study area is even poorer than all but one of these areas; but it is doubtful that the standard of living there ever was much higher than it is today.)
The possible future effects of continued population increase on Indian occupational structure have been discussed by Coale and Hoover in their recent scholarly, ~atistical
, '~A fifth method, the implementation of a positive programme of population limitation, has not yet been tned In India on a significant scale and hence is excluded from the present discussion.
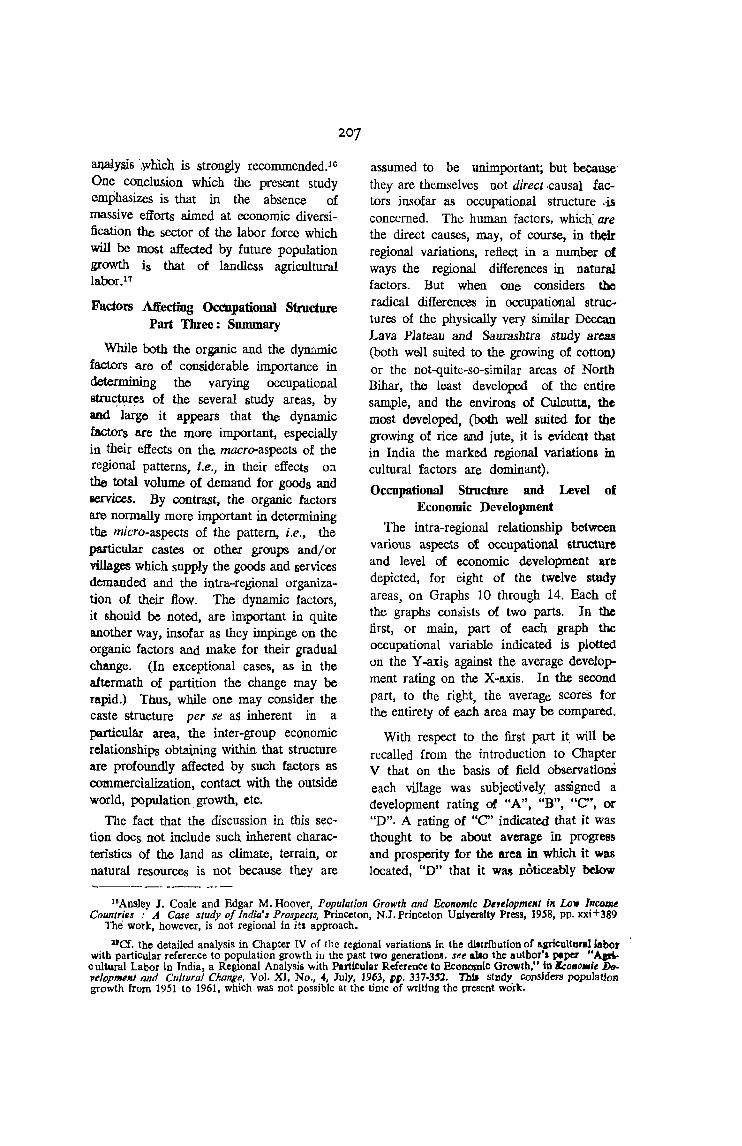
allaly£is ',which is strongly recommended. Hl
One conclusion which the present study emphasizes is that in the absence of massive efforts aimed at economic diversification the sector of the labor force which will be most affected by future population growth is that of landless agricultural labor.n
Factors Meeting Occ$J.pational Structure Part Three: Summary
While both tho organic and the dynamic factors are of considerable importance in det.erm.ini.ng the varying occupational struc,tures of the several study areas, by and large it appears that the dynamic factors are the more important, especially in their effects on the. macro-aspects of the regional patterns, i.e., in their effects on the total volume of demand for goods and services. By contrast, the organic factors are nonnally ,more important in determining the micro-aspects of the pattern, i.e., the particular castes or other groups andlor villages which supply the goods and services demanded and the intra-regional organization of their flow. The dynamic factors, it should be noted, are important in quite another way, insofar as they impinge on the organic factors and make for their gradual change. (In exceptional cases, as in the aftermath of partition the change may be rapid.) Thus, while one may consider the caste structure per se as inherent in a particular area, the inter-group economic rolationships obtaining within that structure are profoundly affected by such factors 8S
commercialization, contact with the outside world, population growth, etc.
The fact that the discussion in this section does not include such inherent characteristics of the land as climate, terrain, or natural resources is not because they are
207
assumed to be unimportant; but because' they are themselves not direct ,causal factors insofar as occupational structure.is concerned. The human factors, which~ are the direct causes, may, of course, in their regional variations, reflect in a number of ways the regional differences in natural factors. But when one considers the radical differences in occupational structures of the physically very similar Deccan Lava Plateau and Saurashtra study areas (both well suited to the growing of cotton) or the not-quite-so-similar areas of North Bihar, the least developed of the entire sample, and the environs of Cul.cutta, the most dtWeloped, (both well suited for the growing of rice and jute, it is evident that in India the marked regional variations in cultural factors are dominant).
Occupational Structure and Level of Economic Development
The intra-regional relationship between various aspects of occupational structure and level of economic development are depicted, for eight of the twelve study areas, on Graphs 10 through 14. Each of the graphs consists of two parts. In the first, or main, part of each graph the occupational variable indicated is plotted un the Y-axis against the average development rating on the X-axis. In the second part, to the right, the average score's for the entirety of each area may be compared.
With respect to the first part it will be recalled from the introduction to Chapter V that on the basis of field observations each village was subjeotively; assigned a development rating of "A", "B", "C', or "D". A rating of ICC' indicated that it was thought to be about average in progress and prosperity for the area in which it was located, "D" that it was noticeably below
lOAns]ey J. Coale and Edgar M. Hoover, Population Growth and Economic Dcytlopmtlft ill Lolli l~cODlt Countries : A Case study of India's Prospects, Princeton, N.J. Princeton Univel'lilty Press, 1958, pp. xXl+389
The' work, however, is not regional in its approach.
1'Cf. the detailed analysis in Chapter IV of the regional variations in tbe diatribution of ar¢cultura11abor with particular reference to population growth ill the past two generationa. see silo the author's ~pel "Aerie ultural Labor in India, a Regional Analysis with Particular Reference to Economic Growth," In 6.co.o.ie »e'f'e/opmelll and CU/Illral Change, Vol. Xl, No., "', July, 1963, 1'1'. 337-3~1. Th.IJ stlldy consJders populat.!oll growth from 1951 to 1961, which was not possible at the time of writing the present work.
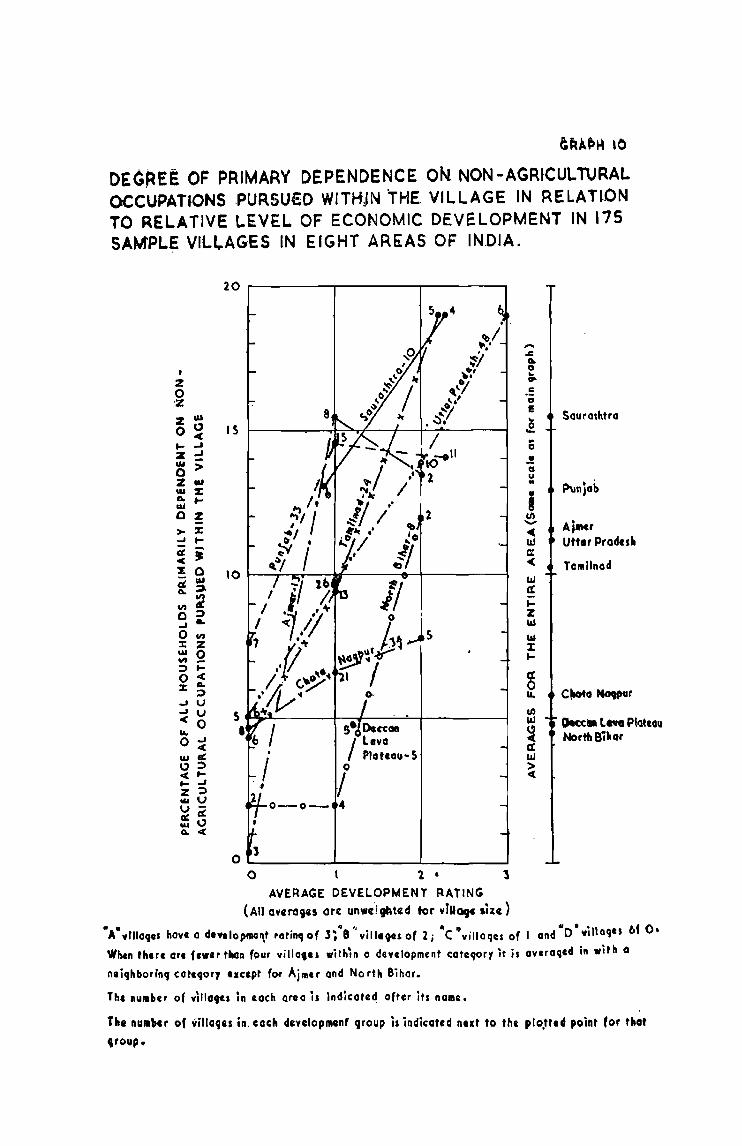
&RA.~~ '0
DEG~EE OF PRIMARY DEPENDENCE oN. NON-AGRJCULTURAL OCCUPATIONS .PURSUED WITHJN THE. VILLAGE IN RELATkON TO RELATIVE t.EVEL OF ECONOMIC DEVELOPMENT IN 175 SAMPL~ VILI.AG·ES IN EIGHT AR6:AS OF INDIA.
I
Z 0 ·z Z 1&1
0 " .( ... ...J
Z ...J -W > 0 z w w :z: Go ... ILl 0 ! >- X -J .... 2 i .(
~ 0 d. ~ Go
~ ~
0 :::> -J a. 0 ~ l: Z w Q ~
:> ... 0 -< :r: Go
:::> -J u -J U .(
0 '" o -J -< W " u:::> -< .... t- ...J Z :> wu v -a: " wO a. -<
20 r-------~--------~--------~
o·
5- DaceOll
/ leva Platcau-S
o
I
O...._ _____ __..I'--___ --I.. ____ ....J
o \ 1 • 1 AVERAGE DEVELOPMENT RATING
(All Qycrogu Ott un"cighted tot ylllage .izc)
,... .c .. o .. .. c:: '0 I!
.. ., .! o u ..
Sourodttro
P\Jnjob
AiMr Utt.r Pradesh
TaIII lInad
cfloto ~r
Oe«.l ... P{Qt,ou North Bihor
·A·~rnoqes havca do .. lopmon.t 'IIti'"lof li"8~ville90sof 2; -C"villo9U of I an/'O·villaqlS bf O.
When there art f •• i' thon four villa,,, within 0 devclopment cateqory it is aVlraqed ill with Q
nliqhborin'l cotlqor., .. cept for Ajmu and North Bihar.
Th, number of Y~IIC19ts in each aroo is Indicated after its name.
The IIUII"., of oiillaqu ill. each develop ... nf CJroup is indicated nut to the plo!tcd poillt for th~t .roup.
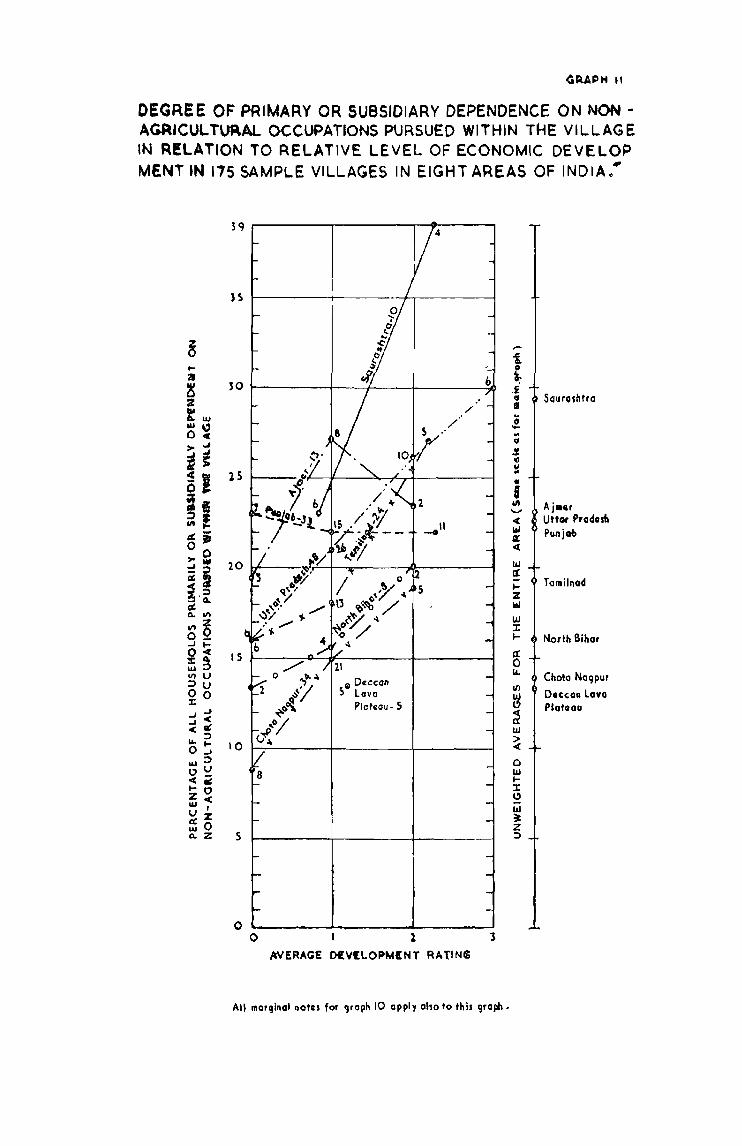
~RAPH "
OEGRE E OF PRIMARY OR SUBSIDIARY DEPENDENCE ON NON -AGRICULTURAL OCCUPATIONS PURSUED WITHIN THE VILLAGE IN R!LATION TO RELATIVE LEVEL OF ECONOMIC DEVELOP MENT tN 175 SAMPLE VILLAGES IN EIGHT AREAS OF INDIA ....
JS
~ ,... i
l- t 3
~ 30 .i :2 G Souro~htra
~w / 18
;; ILl\;) -o c .. > ..A
., ~$
.!!
" \I
S! lS .. •
h i '" Aj,"' ....... « Uttat P,odo,"
cr:- ~ Punjab 0· " >0 "' ,j"" 20 IIJ
" i " , 0 I- Tamilnod
~.~ /7 ~ z cr: \3 ~~ / III CIotf) ~O/ ~ w V)~ !/ :t 0_ I- North Bihar ..J t- ~
~'" 15 " w~ 0 V'lU II. Chota Na9Pur ::>U • DG:ccall
Ul 00 5 lava W DIC(OIl Lava l: Plateau· S ~ Plotoau ..Jj
~ ..J< <11& IIJ
"" :> 10 > O~ "' w:> 0 O~ W
'" .: "'" "'"0 ::t z< ~ w, W U z ~ ~O Z Q, Z S ::>
o ~ ______ ~ ________ ~ ______ -..J
o III
oWERAGE ~V[LOPM'NT RATIN$
All mar9inal notal for Ijraph 10 apply aho to thi' CJraph.
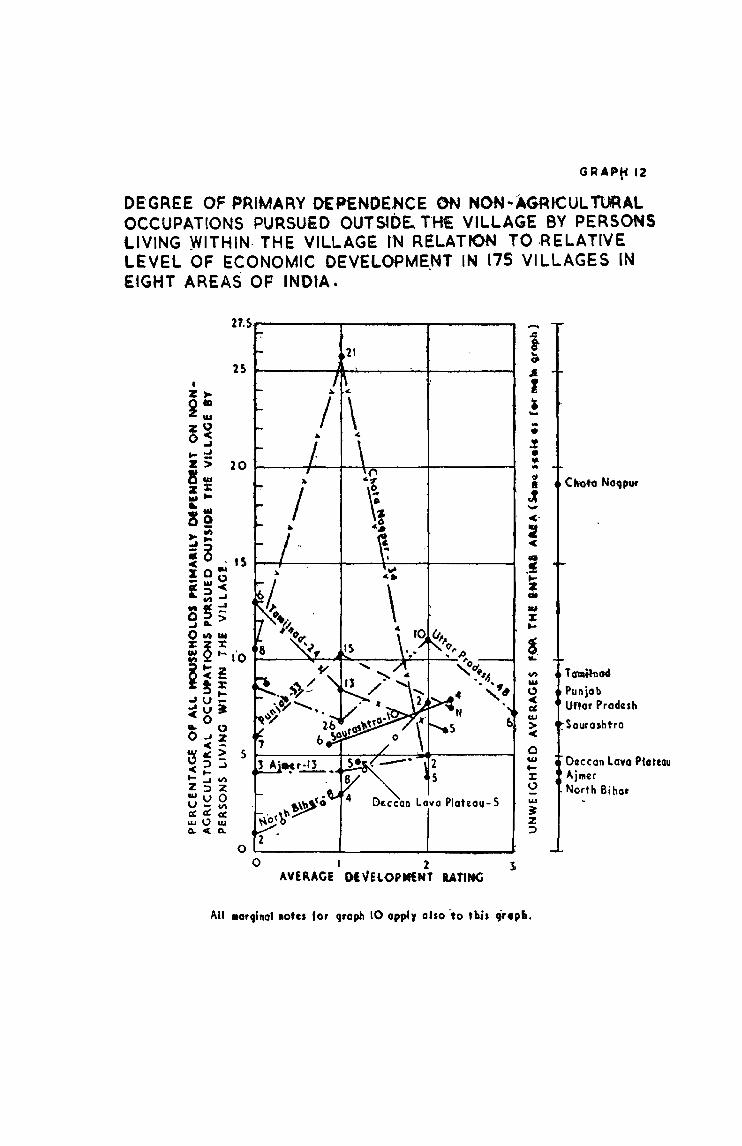
GRAPt'12
oe'GREE OF PRIMARY OEPENDEHCE ON NON-AG4=tICUl ruRAL OCCUPATIONS PURSUED OUTStOE- THE VILLAGE BY PERSONS l.IVING WITHIN· THE VILLAGE IN RELATION TO .RELATIVE LEVEL OF ECONOMIC DEVELOPMENT IN 175 VILLAGES IN . . E·IGHT AREAS OF INDIA.
21 t ~
2S )-----Rt-_,_ ......... -....._-1-----I ~
I i ... .. • .! • ¥-.. ~ • J -~-
:2 ~
,! ....
\ z .. ., X
10 (J~,. ... ~. '.- f),. . ~ ..
~tI. .~.,,, .,. . '., loY .. ,,~ ~
" '" I;LI
5 > ~
a w '.-:r: 0 -w ~ z :>
o ~-----~ _______ ~ ______ -S.
o I 2 1. AVERAGE Ol'lElOPN£NT lATING
All .orqlnol lotts for 9~Oph 10 oppfr also -to tbis cjrepfi.
''' ... to Naqptlf
TOlIh~od
Punjab unOf Pradesh
, SouroJhtro
Dlccon LavQ Plateau . Ajmer North Biho'
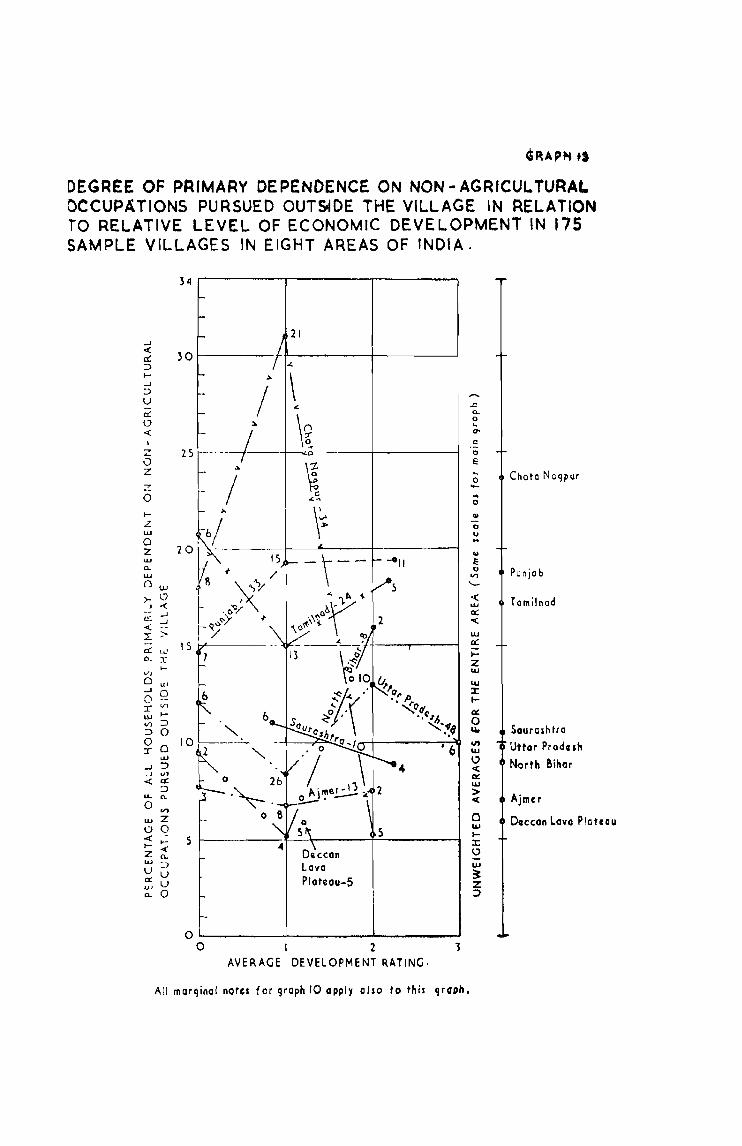
DEGREE OF PRIMARY DEPENDENCE ON NON - AGRICULTURAL DCCUPATIONS PURSUED OUTSrlDE THE VILLAGE IN RELATION TO RELATIVE LEVEL OF ECONOMIC DEVELOPMENT IN 175 SAMPLE VILLAGES IN EIGHT AREAS OF INDIA.
_.J
« a:: :J I..J :J V a:: o «
(5 z z o ,..... z. w a z w 0.. w Ow >- \)
J ~
~ ~ ~ .. _-L > a:: Le'
0- x-I
Vi
o UJ o ~~ r Vl
UJ lV) :J :J 0
~ a ..... _l ::> _J v')
-« tt: :J
u. 0-
o VI
w Z o 0 -« -,..... .... z~ UJ ::J V V 0:: V ~ 0
J4 r---------~--------T-------~
-
-
-o ~--------~--------._------~ o I 2 3
AVERAGE DEVELOPMENT RATING-
c: o E .. o .... .. o ~
o v .. .. E .,
VI ..__
w a: IZ w
All marqinal not" for qraph 10 apply also to this 'lrOl'h.
Chota Naqpur
Punjab
Tamilnod
Saura!htra
Uttar Praduh
North Bihar
Ajmer
Dllccan Lava Plateau
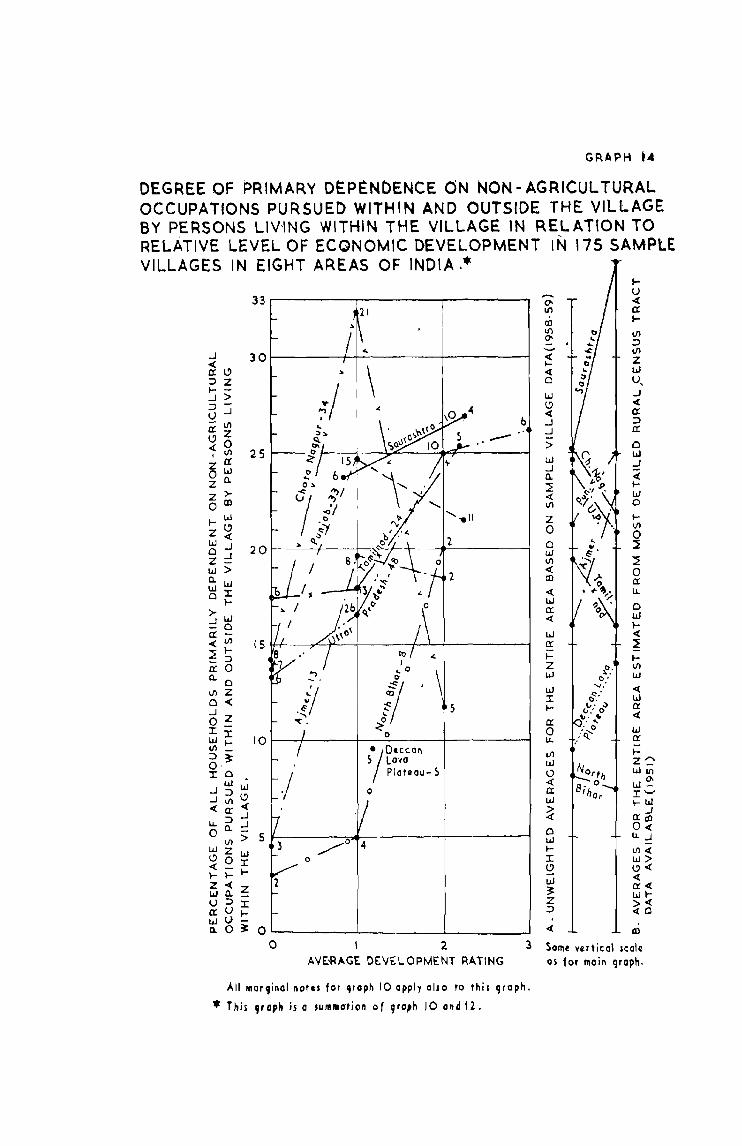
GRAPH t4
DEGREE OF PRIMARY DtPENDENCE ON NON - AGRICUL rURAL OCCUPATIONS PURSUED WITHIN AND OUTSIDE THE VILLAGE BY PERSONS LlV-ING WITHIN THE VILLAGE IN RELATION TO RELATIVE LEVEL OF ECONOMIC DEVELOPMENT IN 175 SAMPLE VILLAGES IN EIGHT AREAS OF INDIA ,*
33r-------~--------_r--------~ 21
b
5
o
All mor9inol notll for 4roph 10 apply also to this qraph .
• This ,f'oph ;s a SUllllllation of qra,h 10 ond 12.
-'" If)
00 If)
'" . .« ..... .« o w I.:) .« _) _J
> w _) 0.. ~ .« VI
z o o w VI .« CD
.« w 0: .« w 0:
IZ W
W I I-
0: o LL
LIl W IJ .« IX w > .« o w lI ~ W ~ Z :J
.«
lI.) .« C! I-
VI :J VI Z IJJ IJ" _)
.« C! :::> C!
o IJJ _)
.« Iw o ..... VI o :l L o ex: lL.
o W I.« ~ IVI W
.« w a .« w 0:
Iz-:::Will
W~ I'-' \-w IX~ 0< LL.J
1Il< w> 1.:)< .« 0:< wI>< <0
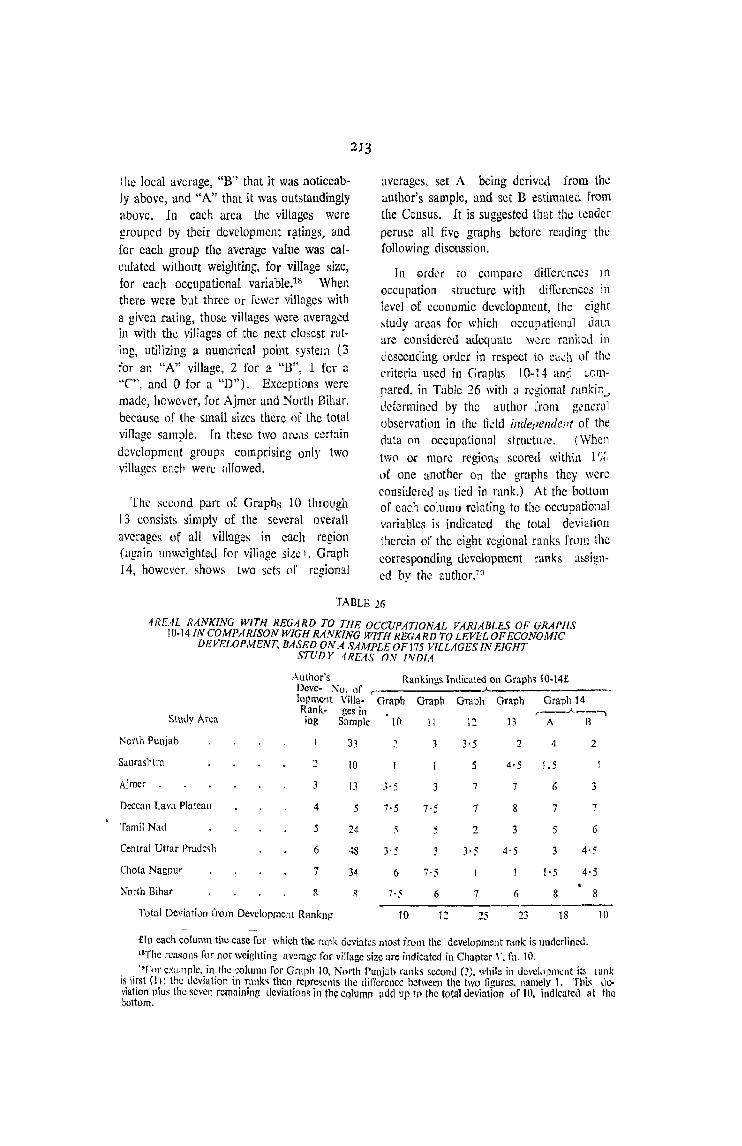
Ihe local average, "B" that it was noticeably above, and "A" that it was outstandingly above. In each area the villages were grouped by their development r~tings, and for each group the average value was calculated without weighting, for village size, for each occupational variable.18 When there were but three Or [ewer villages with a givcn rating, those villages were averaged in with the villages of the next closest rating, utilizing a numerical point system (3 for an "A" village, 2 for a "B", 1 for a "e", and 0 for a "D"). Exc;;ptions were made, however, for Ajmer and North Bihar, because of the small sizes there of the tOlal village sample. Tn these two arC,lS certain development groups comprising only two villages eac" were allowed.
The sel:ond part of Graphs 10 through 13 consists simply of the several overall averages of all vill"clge~ in each region (again unwdghted for village SilX \. Graph J 4, however. shows two sets or regional
213
averages, set A being derived from the author's sample, and set B estimated from the Census. It is suggested that the reader peru~e all five graphs before reading thl.: following disoussion.
Tn (;micr to compare difierences In
occupation structure with differences in level of economic development, the eight ~tudy areas for which OccLl]J:ltional data arc considered adequate welC ranked in descending order in respect to eu..;h of the criteria used in Graphs I 0-14 an~: L.OI11-
pared. in Table 16 with a regional rankin_, dcfermincd by the author [rol11 gl'llcral observation in the Held illrief}enriC!lt of the data on occupational struetnie. (When two or morc r('gions scored within 1 % of one another On the graphs they were considered as tied in rank.) At the bottom of each column relating to the occupational variables is indicated the total deviali(1!1 therein of the eight regional ranks from the corresponding development ranks D.l>signed by the author.ln
TABLE 26
4REAL RANKING WiTH REGARD TO THE OCCUPATIONAL VARIABLES OF GRAPHS lO-14INCOMPARlSONWIGH RANKTNG WfTH REGARD TOLEVELOFECONOMIC
DEVF.LOP/vIENT, BASED ON A SAMPLE OF 175 V1LLAGES IN EIGHT STUDY 4REAS ON IVDlA
Author'S Rankings Indicated on Graph~ 10-14£ I)cvc- ~o. or ..;.._----------. lopment ViIla- Graph Graph Graph Graph Graph 14 Rank- ges in r--..A.--..
Study Area iog Sample It) 11 12 13 A B
Korth Punjab 33 , 3 3'5 2 4 2
Sauras11tra ~ 10 5 4·5 1.5
Ajmer J 13 ]'5 3 7 7 6 3
Deccan lava Pla:cau 4 5 7'5 7·5 7 8 7 7
Tamil Nad 5 24 5 S 2 3 5 6
Central Uttar Pradc~h 6 48 3'5 3';; 4'5 3 4'5
Chota Nagpur 7 34 6 7'5 1'5 4'5
North Bihar 8 R 7'5 6 7 6 8 8 -------Totul Deviation from Dcvelopment Rankn~ 10 12 25 23 18 10
-£Tn each column the casc for which the mnk deviaks most irOJl1 the development rank is underlined. l8The r~asons for not weighting average for village size are indicated in Cha\ltet' ", fn. 10. "rlll' example, in th.: ·;o!uml1 for Graph 10, NOI·th Punjah ranks scconJ (.:'). while in Jcvch,pmcnt it~ JUnk
is lirsl (I): the deviation in rallk~ then represents the t1i1Yercncc between the two figures. namely I. TIllS Lh.:viation plus the seven remaining c.lcviations in th~ CQltlmn add up to the total deviation of 10, indicated at the bottom.
214
It is evideI1t from the deviation scores of the table that, with reference to economic development (as judged by the author), the variables concerned with extent of nonagricultural occupations witihin the village (Grap'hs 10 and 11) are particufarly significant, w4ile those concerned with nonagricultural occupations outsicJe the village (Graphs 12 ~and 13) are not· Graph 14-A, which summates Graphs 10 and 12, has, as one would expect, a total deviation roughly midw'ay between the two. The rather close rank correspondence in the case of the variables of Graphs 10 and 11 with the rankings of economic development is consistent with the detailed conclusions stated repeatedfy in the individual area 'Studies: as the wealth of a village community increases, its demand for a greater variety and volume of non-agricultural goods ,and services increases thereby pe{mitting a greater number of non-agricultural workers to be ,emp'loyed within the vill'ages. The graph simply confirms the general validity of ths common-sense assertion. Only two study areas, the Deccan Lava Plateau, and Central Uttar Pradesh deviate appreciably in rank from their development rankings; and in each case the explanation has been provided in the detailed regional analyses: The Deccan Lava Plateau, it was stated_, is 'an ,area in which the economy, though advanced, in the sense of being highly commercialized, is depressed in terms of the living standard of the m'ass of the rural workers. Hence,
develop.ment and wealth did not there go hand in hand, and the villages are, as 'a rule, able to support onlY,a relatively small number . of non-agricultural households, while an ever-increasing share of goods and services must be obtained in the more prosperous towns' 'and cities. In Central Uttar Pradesh, on the other hand, the relatively high rating with regard to dependence on non-agricultural occupations within the village, especially when subsidiary occupations are also counted, may be attributed to the high degree of ramification of the local caste structure. the consefYative clinging to the old order, and the ability of jajman's to continue to support their kamins. due to the reasonably good state of the agricultural economy. Rather similar is the case of North Bihar, except that, because of the greater impoverishment of the agricultural sector, most kamins can maintain their traditional status on a subsi· diary basis only.
If the variation in the degree of nOll'agricultural empfoyment within the village is considered in its intra-regional aspectas shown in the main parts of Graphs 10 and II-the tendency for a high degree of correlation with economic development is even more pronounced than in the case of its inter-regional aspect-as discussed above.20 The only curves contradicting this trend, those of Ajmer and Punjab, may be explained in whole in the former case, in part at least in the latter, by the presence of one or a few highly specialized villages
lOWe are, it must be remembered. dealing here with averalfes of villages with particular development ratings. Within each rating category. however, the average deviations from average in a given area would pro· ba~ly ~e ~uch greater than with respect to the same measure applied to a comparably large set of regions grouped In ~lmllarly rated development categories.
In determining the development rating each village was judged primarily on the basis of such non-occupational variables as amount of land per capita within the village, percentage of land irrigated, extent of use of agricultural machinery, number of families witlf bicycles, percentage of literacy, presence of amenities shared by the entire village (e.f!., street lamps, paved drains etc.), but such factors as the number of shops, sewing machines, and mechanize!a mills, which relate directly to occupational structure, were also considered. (A sewing machine in rur~ India which is not owned by a professional tailor is a rarity.) It is quite possible that in mmy cases, especially border-line cases, the author may have been subconsciously influenced in his rating by what he already knew about the occupational structure of a given village, inclining to rate it higher when he knew it had a large number of non-agriculturists and lower when the opposite held true. Since the rating system was purely subjective, therejs'no way to test for the extent or this. bias. It is felt, however, that such bias as may have existed was nat sufficient to alter radically the overall picture presented by Graphs 10 and II, and that at m~s~ it wOQld ~imp!y t~nd to reguee th~ ~t~pness of slope 9f §pme pf the curves, But this too is 11 SUbjective PPlnton.
in each sample group.21 It must be remembered, with particular respect to Punjab, that, in this prosperous farmi:J.g area, villages specializing in particular non-agricultural pursuits are apt to Ibe less prosperous than those specializing ill agriculture; bU,t, among the latter. those which are more ·prosperous will, as in all other parts of India, have larger numbers of households engaged in sundry villageserving 'artisan and serving occupations than those which are not.
215
The rank ordering of study areas on Graphs 12 and 13, dealing with non-agricultural work outside the village, shows, as has been noted, a 'rather poor degrct! of correspondence with the rank ordering with respect to development (see Table 24). Several reasons account for this: First, in deciding on .the areal development ranks, the author was concerned mainly with the internal conditions of the sets of villages themselves and not with the cities, steelmills, coal-fields, etc. which happened to be nearby, and which consequently, drew off much village labor.22 Second, "push" factors (i.e., poverty and its concomitants, shortage of land and work) are apt to be just as important as "pull" factors (i.e., the availability of outside jobs), if not even more important, in c'ausing workers to seek outside employment. And, third, there 'appears to be a culturally determined dimension to the propensity to emigrat~
whioh' is more or less independent of a region's stage of economic development.
The fact that the Chota Nagpur '!Iudy area, ranking first in dependence on outside work and only seventh in terms of development, is the most deviant case on Table 26 is explained by the first of the above reasons.2S So too is the less strikingly hig.lot
rating of Central Uttar Pradesh. The ~econd reason is operative to some degree in virtually all 'areas, Ibut is particularly important in Tamil Nad. Th:: third reason, the propensity to emigrate, helps to explain, in part, the high ranking of Punjab on Graph 13, while the lack of such prop~nsity helps to explain several of the relatively low ratings on the same graph.
In summary, the level of non-agricultural employment outside the village is the resultant of a much more complex set of factors than that within the village, which when added together do not necessarily yield a meaningful regional picture.
Graph 14 is best understood by referring to tlle preceding disyussions of Graphs 10 and 12 of which it represents a summation. The right hand part of Graph 14, which is of greater interest than the intra-regional findings, is discussed below.
A Critical C~mpariso'D of the Field Results and the Census Occupational Data
A by product of the comparative -analysis in this chapter is the comparison of the two sets of regional averages shown in Graph 14 one derived from the author's fieJd , studies, the other cstimated from the Census. While in theory both sets of scores should have been approximately the same even though the author's sample village data relate to h9useholds and the period 1958-59, while those of the Census relate to self-supporting male workers and the year 1951), in, fact several significant discrepancies may be noted. An under"tanoing of the causes of these discrepancies should be of value in appraising the reliability both of the findIngs of the Census and of those derived from the field s,udies of the present work.
21These include a twine-making in Ajmer (rated 1) which was 55 % mainlv and 70 % subsidiariTy nonagricul!ural: and. in. Puniab, one carpet-we~v!ng and .on~ brick-making village' (rated 1) and one viIIage (rate zero) highly speCIalIzed, but only .on a subSidiary baSIS, tn the making of twine.
22The rationale of this approach is explained more fuIIy in the introducti0n to the discussion of the lowrated Chota Nagpur study area in Chapter V, The remark~ therein also help to explain the relatively low. rating of Central Uttar Prdesh, despite the inclusion in the area of the cities of Kanpur' and Lucknow.
23The steep rise in the middle of the-curve for the Chota Nagpur area on the main part of both graphs is explained by the fact that the six villages especially dependent on coal mining (with from 40 to 85 per cent of all households maiply dependent thereon) all happen 10 be among the twen1y.one \\;tll II deve]oPITIenf rating (If 1.
The most important differences between the two set of figures are as follows: ( 1 ) The range of variation between ~he two ~cts of scores is from a minimum of 0'7% in the case of North Bihar, the least deveioped area, to a maximum of 10'2% in the casc of Saurashtra, the second mast develaped, and average of 4:4% for the eight regions, (2) AIl faur regions ranked as most developed by the author scared higher in the Census figures than in those derived py the author, while for the four regions ranked lowest, the reverse held true. (3) The amount of deviation between the two sets of scores was lawer for the faur less developed than for any of the four more developed regions, averaging but 2' 6% for the former as against 6'3% for the latter. Tt mar also be observed that, in striking contrast to the discrepancies between the two sets af rankings in Table 26, then~ is unusually good agreement between the author's region'al ranking in Graph 10 and the ranking according to the data estim,ated from the Census. The latter two sets of ranking deviate from one another bv a total value of only 5; and each set de\~jates from the author's development ranking by a total of only 10.
It is, of course, possible that the above observations are somehow indicative af some sort of systematic errar in the author's field observations causing him to underenumerate the number of non-agricultural workers in the more developed areas and to over-enumerate them in the less developed areas. It is 'also possible, that the :apparent orderedness of the deviations between the two sets af figures is a mere freak of chance and hence without ~igni
ficance. A third possibility is that occupational shifts from 1951 to 1958-59 ,account for much of the differences. Fourth, there may 'be some sart or sorts af systematic error in the Census, itself. Finally, some cambination of these four passibilities would seem to be extremely likely. The follawing ·discussian revalves 'abaut the question. Which af these possibilities is the
216
most likely and apt to be the most impartant?
Beginning with the secand passibility, that the differences between the author's findings and those of the Census are mainly the
,result of chance, i.e., in the author's selection af villages, it shauld be pointed out that the likelihood that chance might be an important factor is inversely proportional to the size af the sample. It may well be significant that the three largest discrepancies in the two sets figures on Group 24 occurred in areas where the sample size was rather small, i.e., Saurashtra, with ten villages, Ajmer with thirteen villages and the Deccan Lava Plateau area with five villages. (The fourth area with a small sample Narth Bihar with eight villagt.:s, yielded the best 'agreement with the Census of all eight areas.) The remaining four areas (Punjab, the most developed 'area, plus three others in the less developed half of the'sample areas) all had presumably adequat~ sample sizes, ranging from twenty faur to forty-eight villages each, in which chance seloctian should not have resulted in great overall atypicality. What appears to be even more impressive than the admitted possibility of chance selection of an untypical village sample is the fact 01' the orderedness of the deviations, bath in terms of directian and magnitude. It is, moreover, very hard ta see how chance could result in the unusually high degree of ranI< correlation between the ratings of Graphs 10 'and 14B as indicated in Table 26.
The possibility that occupational shifts which may have occurred between the Census year, 1951, and the period of the author's field investigations, 1958-59, wen; sufficient to account for the ditfe-rences between the two sets of figures an Graph 14 daes not appear to be tenable in view af the conflicting directions and the magnitude of the shifts which would be neceS'iary for this explanation. Saurashtra and Punjab, for example, almast surely increased ta same
degree in their percentages of non-agriculturists during the period cited, wnereas the estimated 1951 figures are considerably higher than those for 1958-59.
With respect to the Census, we have repeatedly noted in previous discussions independent of the present question, evidence of two opposing tendencies: (1) over-enumeration of the proportion of non-agricultural workers working within the village, due to (a) the counting'of caste occupation as actual occupation, whether or not it is practiced, and (b) the counting of subsidiary occupations as main occupations; and (2) un dec-enumeration of those workers Jiving in the village, who are primarily dependent on casual and seasonal labor outside. The relative dependence on such outside labor was found to be much greater in the less developed areas studied in the field than in those which are better off. Consequently a bias to . under-enumerate outside work would tend to produce greater relative under-enumeration in the less developed areas while the opposite bias with respect to non-agricultural work within the village would be relatively more important in the more developed areas producing greater over-enumeration in them. In sum, these two assumptions of opposing biases in the Census returns, taken together could account both for the orderedness and magnitude of the discrepancies noted. It is necessary, therefore, to examine the validity of each of these assumptions.
The evidence in support of the first, relative to Census over-enumeration, may be summarized from previous discussions: (a) Over most of India the villager tends to think of himself and to be thOUght of in terms of his caste role. (b) There are in the Census (cf, Chapter IV) a considerable
217
number of cases of patent and flagrant overenumerations within the rural non-agricultural sector often attributable to the caste bias; and it seems reasonable, therefore, to suppose that a much larger percentage of smaller and hence, less obvious overenumerations also exist. (C) If one compares the author's figures for primary plus subsidiary dependence on non-agricultural labor performed within the village as presented in Graph 11, with the Census figures on primary source of livelihood alone, the two sets, arc closer to one another for five out of eight areas than are the two sets of figures on Graph 14 and equally close in one other.24 (This fact would have little meaning, however, if the second suggestion, that the Census greatly tended to under-entlmerate casual workers, was incorrect. )
In support of ·the second suggestion, that the Census under-enumerated the number of casual outside workers living in the village, the following points are of note: (a) Virtually no one in India likes to admit that he is a mere mazdoor, or common laborer, especially among the cultivating castes. who take particular pride in the ownership and management of land.?5 '(b) Casual outside labor, even though it may provide the bulk of a family'S income, normally engages the working members a small percentage of the time, with the result that, at the moment of census enumeration, most of those workers are apt not to be engaged in outside work and not to report a dependence thereon. (c) The least internally consistent set of figures in the Census are those relating to "services otherwise unclassified" (accounting for' only 2'4% of all rural self-supporting males) under which heading workers primarily dependent on casual outside labor should
"The two exceptional Cases are the Chota Nagpur area and Northern Bihar. The fonner is quite simply explained by the fact that coal-mining is nonnally carried on outside the village and is hence not counted on graph 11 while it is counted in the Consus figures. The second Case is attributed to the chance selection of three villages out of a total sample of eight which were considerably more non-agricultural than usual.
:sThs is well illustrated in Premchand's novel Godan by the shame of Hori in having to sell his land and become a contract construction worker and by the similar feeling of the hero in Lal Behari Day's work Govinda Samanta.

218
have been classified, but, presumably, usually were not. (See Map 6 and the discussion pertaining thereto in Chapter III.). (d) The .discrep'ancjes between the data of the Agricultural Labor Enquiry and the Census suggest the under-enumeration by the latter of both agricultl!ral laborers and no:n-agrjcultur~l cac;ual laborers.26
The possibility that the author's data may embody biases opposite to those imputed above to the Census, namely an underenumeration of non~agriculturists in the village and an over-enumeration of casual non-agriculturists working outside the village would, to be sure, also explain the . , discrepancies of Graph 14. But, the author is unable to find any evident reasons why his data should entail the specific systematic biases under discussion.27
A possible source of systematic bias 01 another sort may be introduced by the fact that the author did not weight the data for
the sample villages according to village size. (The reasons for this have already been explained. Graph 7 spows the relationship of village size to the percentage of households dependent on non-agricultural occupations within the village.) But, if this bias were significant in changing the regional averages from what they ought to have been the changes would almost sur~ly have had to be unidirectional, since in all of the sample areas the average size of the sample villages was greater than that indicated by the Census. It will be recalled, however, that the less developed half of the author's sample areas had higher scores than indicated by the Census, while the more developed areas had lower scores. If one were to account for the differences between the t\yo sets of scores on the basis of a bias introduced by non-weighting, one would have also to postulate a countervailing bias applying with particular strength either to the more developed Or to the less developed half of the study areas.
26Thc A. L. E. shows a total of 20.2% (of households) a~ rural non-agriculturists as against 18·5% of individuals) for the Census admittedly not a very big difference, while the difference in the percentage of agricultural laborers was exceedingly great. (For a discussion of the differences the reader is referred to the appropriate section of Chapter IV). In the A.L.E. households were classified, irrespective of income, according to the occupation in which a majority of working days were spent whereas both the author and the Census employed the basic criterion of Chief source of income. What seems most significant in the present context are the facts that (1) 85% of all agricultural labor faP1ilies were classified as "casual" rather than "attached" and therefore free also to do any sorts of more remunerative non-agricultural work that came their way; and (2) 21 % of all agricultural laboring "earners" reported "subsidiary" sources of income (as opposed to 8· 4% of all workers male and female, self-supporting persons and earning dependents-reported by the Census to have secondary nonagricultural occupations). Were an income rather than a time-at work criterion adopted in classifying these families, it seems logical to suppose that a significant percentage of them would have had to be classified instead as primarily casual non-agriculturallitborers. (Ministry of Labour, Agricultural Labor Enquiry, Rural ManPower and Occupational StrUCTure "Introduction" pp. 1-5 and "All-India Summary" esp. pp. 9-10 aJ:ld_Ll920.)
27Critical discussion of the reliability of the Census on occupations must be judged against the background of the enormous complexity and regional diversity of society and economy in India. Tndian authorities responsible for the Census are aware of the difficulties and concerned.to improve the reponing. For this reason on 25 September, 1959, the author forwarded to Asok Mitra, Registrar General ofIndia and ex-officio Census Commissioner a thirty-seven page, typed memorandum of "Recommendations for the Improvement of the 1961 Census of India •• embodying the major critiCisms contained in this thesis. In Sri Mitra's letter of thanks dated 23 October, ]959 he stated that" ....•. these recommendations ate by far the most detailed, practicable and important that 1 have ever received. AIl.of them bear the imprint of a sense of reality."
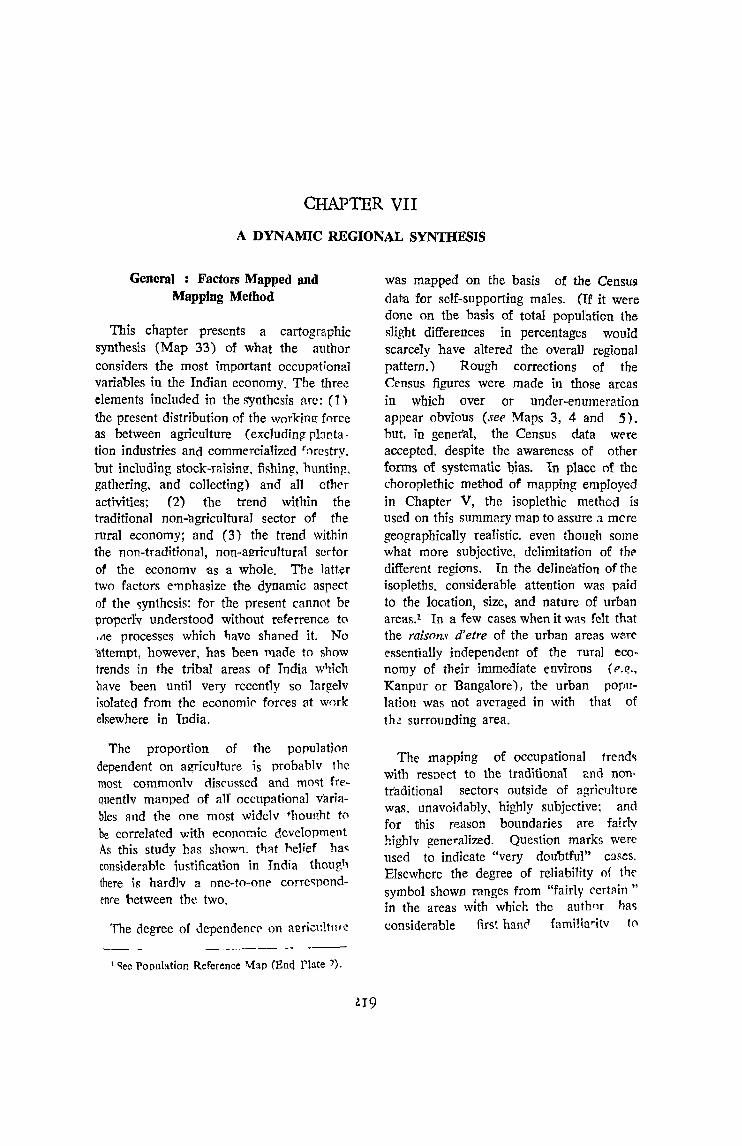
CHAPTER VII
A DYNAMIC REGIONAL SYNTHESIS
General : Factors Mapped and Mapping Method
This chapter presents a cartographic synthesis (Map 33) of what the author considers the most important occupationaJ variables in the Indian economy. The three elements included in the synthesis are: (1) the present distribution of the working force as between agriculture (exc1udin!! pbnta· tion industries and commercialized J'mestry. but including stock-raising, fishing, hunting, gathering, and collecting) and aU other activities; (2) the trend within the traditional non-'agricultural sector of the rural economy; and (3) the trend within the non-traditional, non-agricultural sedor of the economv 'as a whole. The latter two factors e'l1phasize the· dynamic aspect of the ~ynthesis; for the present cannot be properTy understood without referrence to ,lie processes which lIave shaned it. No 'attempt, however, has been made to show trends in the tribal areas of Tndia w'1ich have been until very recently so largelv isolated from the economic forces at w0rk elsewhere in India.
The proportion of the population dependent on agriculture is probablv the most commonlv discussed and moc;t frequentlv manped of all' occupational variables and the one most widelv thoup.ht to be correlated with econor.1ic development As this study has show'1. th::tt hellef hac: considerable ;ustification in India though there is hardlv a one-to-one corre'lpcndenre 'between the two.
The degree of dependenc(" on al!ricl!ltllfe
1 <;ec Population Reference \fap (En<l Plate ').
was mapped on the basis of the Censujl dam for self-supporting males. (If it were done on the basis of total population the sJight differences in percentages wouid scarcely have altered the overall regional pattern.) Rough corrections of the Census figures were made in those areas in which over or under-enumeration appear obvious (see Maps 3, 4 and 5). but, in general, the Census data were accepted, despite the awareness of other forms of systematic Qias. In place of the choroplethic method of mapping employed in Chapter V, the isoplethic method is used on this summary map to assure J. mere geographicaUy realistic. even though some what more subjective, delimitation of th~ different regions. In the deline'ation of the isopleths. considerable attention was paid to the location, size, and nature of urban areas.1 In a few cases when it WU'l felt that the raisons d' etre of the urban areas w~re essentially independent of the rural economy of their immediate environs (('.~ .. Kanpur or Bangalore), the urban pOfmlation was not averaged in with that of th.'! surrounding area.
The mapping of occupational 1rend'l with reSDC'ct to the traditional ~nd non· traditional sector'l outside of agric1JJture was, unavoidably, highly subjective; and for this r~ason boundaries are fairly highlv generalized. Question marks were used to indicate "very doubtful" cases. Elsewhere the degree of reliability of the symbol shown mnges from "fairly certflin " in the areas with whicr. the authnr hac; considerable first hancl familia"itv to
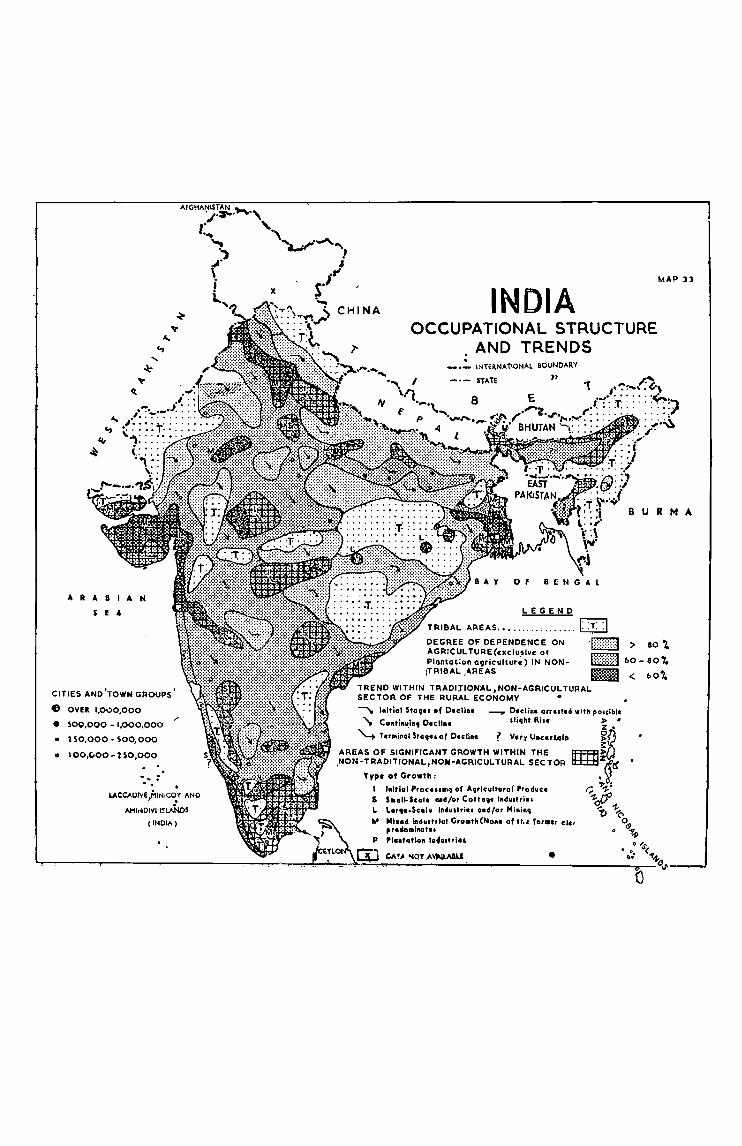
ARABIAN
E "
CITIES AND 'TOWN GROUPS'
e OVE'" 1,0\)0,000
• SOO,OOO - 1,000,000
150,000 - SOO, 000
o IOO,"Oo~no,ooo
-. . I.ACCADIVE,MINICO.Y AND
AMh~DIVI I~LANo$ (INDIA)
MAP 3l
INDIA OCCUPATIONAL STRUCTURE
AND TRENDS . _ • .:. INTERNATIONAL BOUNDARY
_.- STATE
8
o f
LEGEND
TRIBAL AREAS ................. I: :T: :1 DEGREE OF DEPENDENCE ON "I:=>::::::::t AGRICULTURE(cxcluslvc of r::::mm Plantation QgrlcultU1"~) IN NON- IElli
> 80 "4 1.0 - 80'7.
ITRIBAL ,"REAS _ < 00',.
•
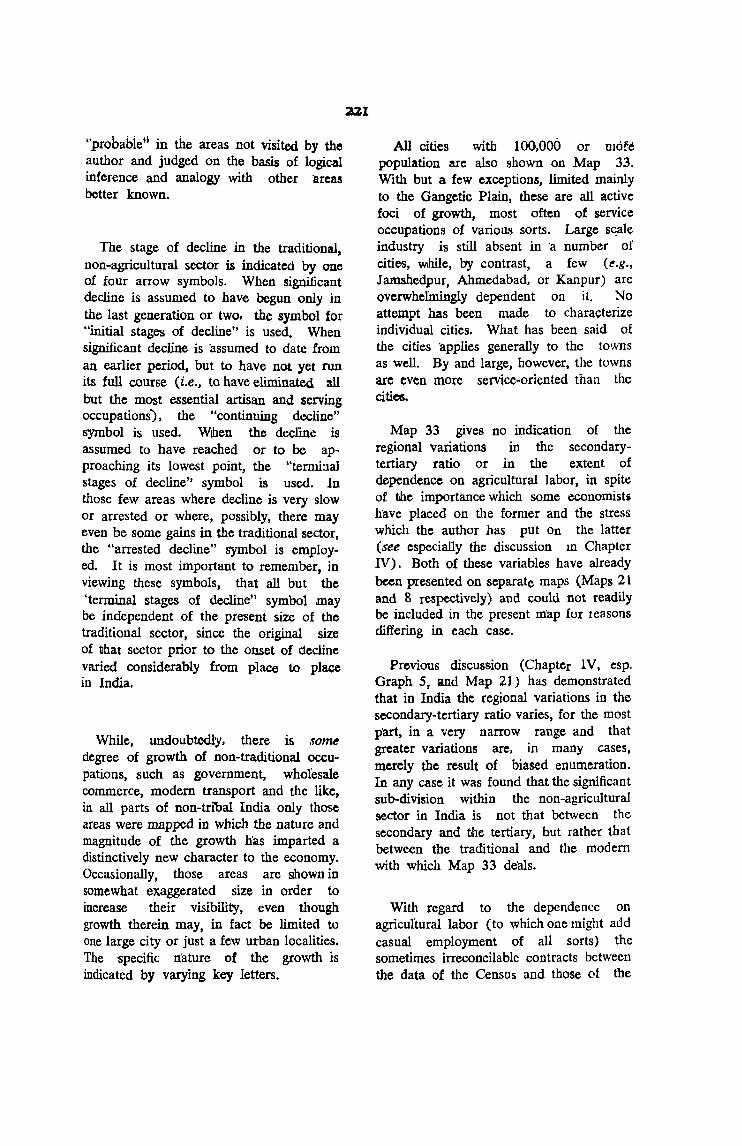
"probabie" in the areas not visited by the author and judged on the basis of logical inference and analogy with other 'areas better known.
The stage of decline in the traditional, non-agricultural sector is indicated by one of four arrow symbols. When significant decline is assumed to have begun only in the last generation or two, the symbol for "initial stages of decline" is used. When significant decline is 'assumed to date from an earlier period, but to have not yet run its full course (i.e., to have eliminated 311 but the most essential artisan and serving occupations), the "continuing decline" symbol is used. Willen the decline is assumed to have reached or to be approaching its lowest point, the "termi:laJ stages of decline" symbol is used. In those few areas where decline is very slow or arrested or where, possibly, there may even be some gains in the traditional sector, the "arrested decline" symbol is employed. It is most important to remember, in viewing these symbols, that all but the 'terminal stages of decline" symbol may be independent of the present size of the traditional sector, since the original size of that sector prior to the onset of decline varied considerably from place to place in India.
While, undoubtedly, there is so~
degree of growth of non-traditional occupations, such as government, wholesale commerce, modem transport and the like, in all parts of non-tribal India only those areas were mapped in which the nature and magnitude of the growth has imparted a distinctively new character to the economy. Occasionally, those areas are shown in somewhat exaggerated size in order to increase their visibility, even though growth therein may, in fact be limited to one large city or just a few urban localities. The specific nature of the growth is indicated by varying key letters.
All cities with 100,000 or mote population are also shown on Map 33. With but a few exceptions, limited mainly to the Gangetic Plain, these are all active foci of growth, most often of service occupations of various sorts. Large s~ale industry is still absent in 'a number of cities, Wlhile, 11y contrast, a few (~.g.,
Jamshedpur, Ahmedabad, or Kanpur) are overwhelmingly dependent on it. No attempt has been made to characterize individual cities. What has been said of the cities applies generally to the towns as well. By and large, however, the towns are even more service-oriented than the cities.
Map 33 gives no indication of the regional variations in the secondarytertiary ratio or in the extent of dependence on agricultural labor, in spite of the importance which some economists h'ave placed on the former and the stress which the author has put On the latter (see especially the discussion ill Chapter IV). Both of these variables have already been presented on separate maps (Maps 21 and 8 respectively) and could not readily be included in the present map for reasons differing in each case.
Provious discussion (Chapter IV, esp. Graph 5, and Map 21) has demonstrated that in India the regional variations in the secondary-tertiary ratio varies, for the most p'art, in a very narrow range and that greater variations are, in many cases, merely the result of biased enumeration. In any case it was found that the significant sub-division within the non-agricultural sector in India is not that between the secondary and the tertiary, but rather that between the traditional and the modem with which Map 33 deals.
With regard to the dependence on agricultural labor (to which one might add casual employment of all sorts) the sometimes irreconcilable contracts between the data of the Census and those ot the
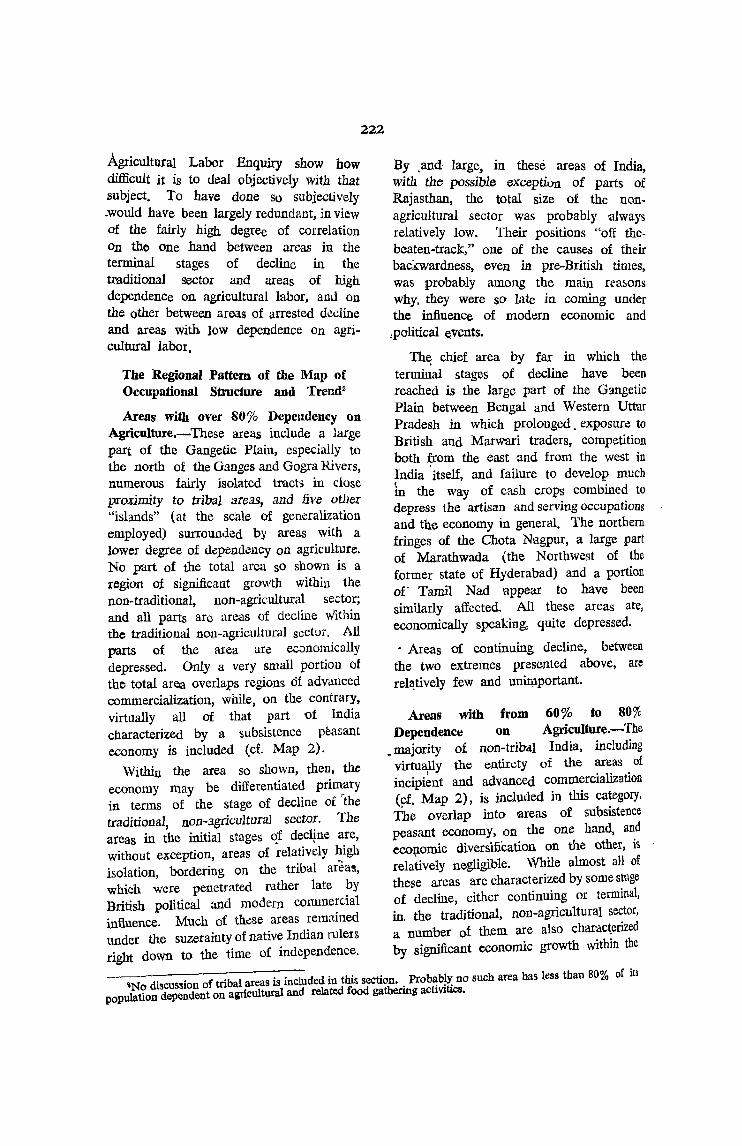
~gricultural Labor Enquiry show bow diifi_cu1t it is to deal objectively with that subject. To have done so subjectively .would have been largely redundant, in view of. the fairly high degree of correlation on the one hand between areas in the terminal stages of decline in the maditional sector and areas of bigh dependence on agricultural labor, and on the other between areas of arrested decline and areas with loW dependence on agricultural labor,
The Regional Pattern of the Map of Occupational Structure and TrendS
222
Areas with over SO % Dependency on Agriculture.-These areas include a large part of the Gangetic Plain, especiaUy to the north of the Ganges and Gogra Rivers, numerous fairly isolated tracts in dose proximity to tribal areas, and five ot1ler "islands" (at the scale of generalization employed) surrounded by areas with a lower degree of dependency on agriculture. No part of the total area sa shown is a region of significant growth within the non-traditional, non-agricultural sector; and all parts are areas of decline Within the traditional non-agricultural sector. All parts of the area are economically depressed. Only a very small portion of the total area overlaps regions of advanced commercialization, while, on the contrary, virtually all of that part of India characterized by a subsistence peasant economy is included (cf. Map 2).
Within the area so shown, then. the economy may be differentiated primary in terms of the stage of decline of 'the traditional, non-3gricultural sector. The areas in the initial stages ~f declfne are, without exception, areas of relatively high isolation, bordering on the tribal areas, which were penetrated rather late by British political and modern commercial influence. Much of these areas remained under the suzerainty of native Indian rulers right down to the time of independence.
By ,and- large, in these areas of India wi~ the possible exception of parts of R.aJasthan, the total size of the nonagric.ultural sector was probably always relatIvely low. Their positions "off thebeaten-track," one of the causes of their backwardness, even in pre-British times, was probably among the main rea50ns why. they were SO late in cominO' under the influence of modern econo:ic and
.:political ~vents.
Th~ chief area by far in which the terminal stages of decline have been reached is the large part of the Gangetic Plain between Bengal and Western Utrar Pradesh in which prolonged. exposure to British and Marwari traders, competition both ~om the east and from the west in India itself, and failure to develop much { -ill the way of cash crops combined to depress the artisan and serving occupations and the economy in general. The northern fringes of the Chota Nagpur, a large part of Marathwada (the Northwest of the former state of Hyderabad) and a portion of' Tamil Nad ~ppear to have been similarly affected. All these areas are, economically speaking, quite depressed.
• Areas of continuing decline, between the two extremes presented above, are rel~tively few and uniroportant.
Areas with from 60% to 80% Dependence on Agriculture.-The
• majority of non-tribal India. including virtually the entirc;ty of the areas of
I
incipient and advanced commercialization (9f . Map 2), is included in this category. The overlap into areas of subsistence peasant economy) on the one hand, and eco\1omic diversification on the other, is relatively negligible. While almost all of these areas are characterized by some stage of decline, either continuing or terminal, in. the traditional, non-agricultural sector, a number of them are also charact_crized by significant economic growth within the
'No discussion of tribal areas is included in this section. Probably no such area has less than 80% of its population dependent on a!J1'icultural and related food gathering activities.
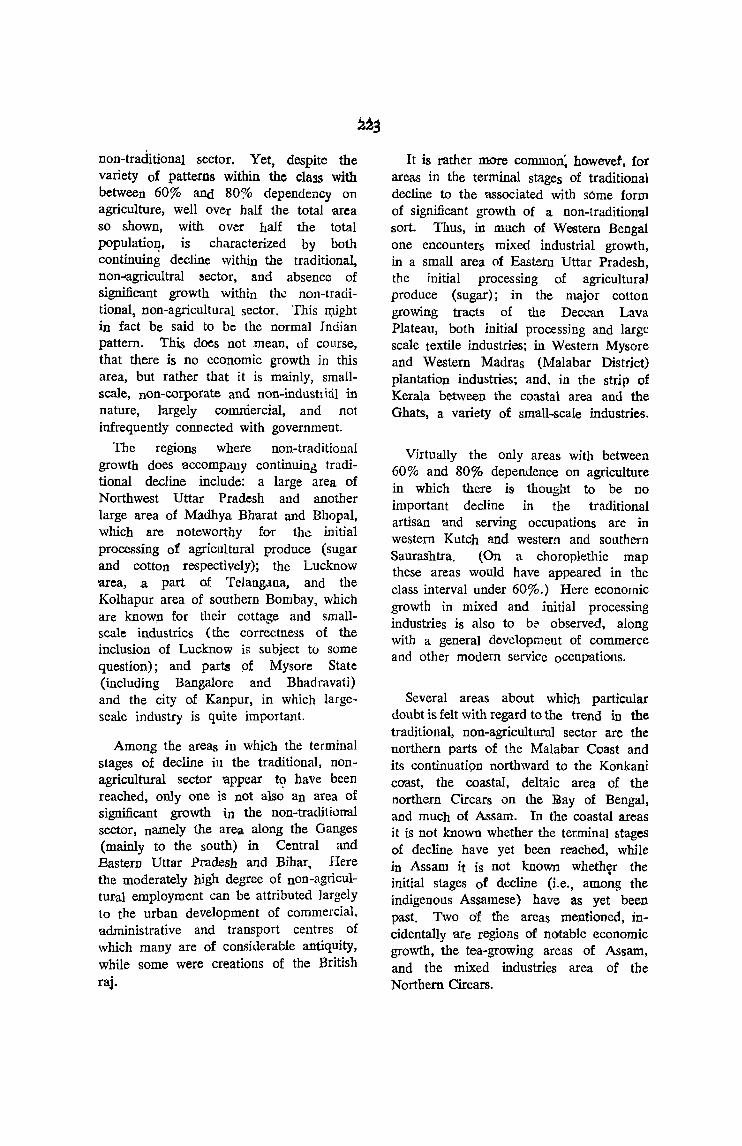
non-traditional sector. Yet, despite the variety of patterns within the class with between 60% and 80% dependency on agriculture, well over half the total area so shown, with over half the total population, is characterized by both continuing decline within the traditional, non-'agricu1traI sector, and absence of significant growth within th\! non-traditional, non-agricultural sector. This n;tight in fact be said to be the normal J ndian pattern. This does not mean, of course, that there is no economic growth in this area, but rather that it is mainly, smallscale, non-corporate and non-industrial in nature, largely comniercial, and not infrequently connected with government.
The regions where non-traditional growth does accompillly continuing traditional decline include: a large area of Northwest Uttar Pradesh and another large area of Madhya Eharat and Bhopal, which are noteworthy for the. initial processing of agricultural produce (sugar and cotton respectively); the Lucknow 'area, a part of Telangana, and the Kolhapur area of southern Bombay, which are known for their cottage and smallscale industries (the correctness of the inclusion of Lucknow is subject to some question); and parts pf Mysore State (including Bangalore and Bhadravati) and the city of Kanpur, in which largescale industry is quite important.
Among the areas in whiCh the terminal stages of decline in the traditional, nonagricultural sector 'appear t~ have been reached, only one is not also an area of significant growth ill the non-traditional sector, namely the are'a along the Ganges (mainly to the south) in Central and Eastern Uttar Pradesh and Bihar. Here the moderately high degree of non-agricultUl'al employment can be attributed largely to the urban development of commercial, administrative and transport centres of which many are of considerable antiquity, while some were creations of the British raj.
It is rather more common~ howevet, for areas in the terminal stages of traditional decline to the associated with sOme form of significant growth of a non-traditional sort. Thus, in much of Western Bengal one encounters mixed industrial growth, in a small area of Eastern Uttar Pradesh, the initial processing of agricultural produce (sugar); in the major cotton growing tracts of the Decc-an Lava Plateau, both initial processing and large scale textile industries; in Western Mysore and Western Madras (Malabar District) plantation industries; and, in the strip of Kerala between the coastal area and the Ghats, a variety of small-scale industries.
Virtually the only areas with between 60% and 80% dependence on agriculture in which there is thought to be DO
important decline in the traditional artisan and serving occupations are in western Kutch and western and southern Saurashtra. (On a choroplethic map these areas would have appeared in the class interval under 60%.) Here economic growth in mixed and initial processing industries is also to be observed, along with a general developmeut of commerce and other modem service occupations.
Several areas about whiCh particular doubt is felt with regard to the trend in the traditional, non-agricultural sector are the northern parts of the Malabar Coast and its continuati9n northward to the Konkani coast, the coastal, deltaic area of the northern Circars on the ~ay of Bengal, and much of Assam. In the coastal areas it is not known whether the terminal stages of decline have yet been reached, willIe in Assam it is not known wheth~r the initial stages of decline (Le., among the indigenous Assamese) have as yet been past. Two of the areas mentioned, Incidentally are regions of notable economic growth, the tea-growing areas of Assam, and the mixed industries area of the Northern Circars.
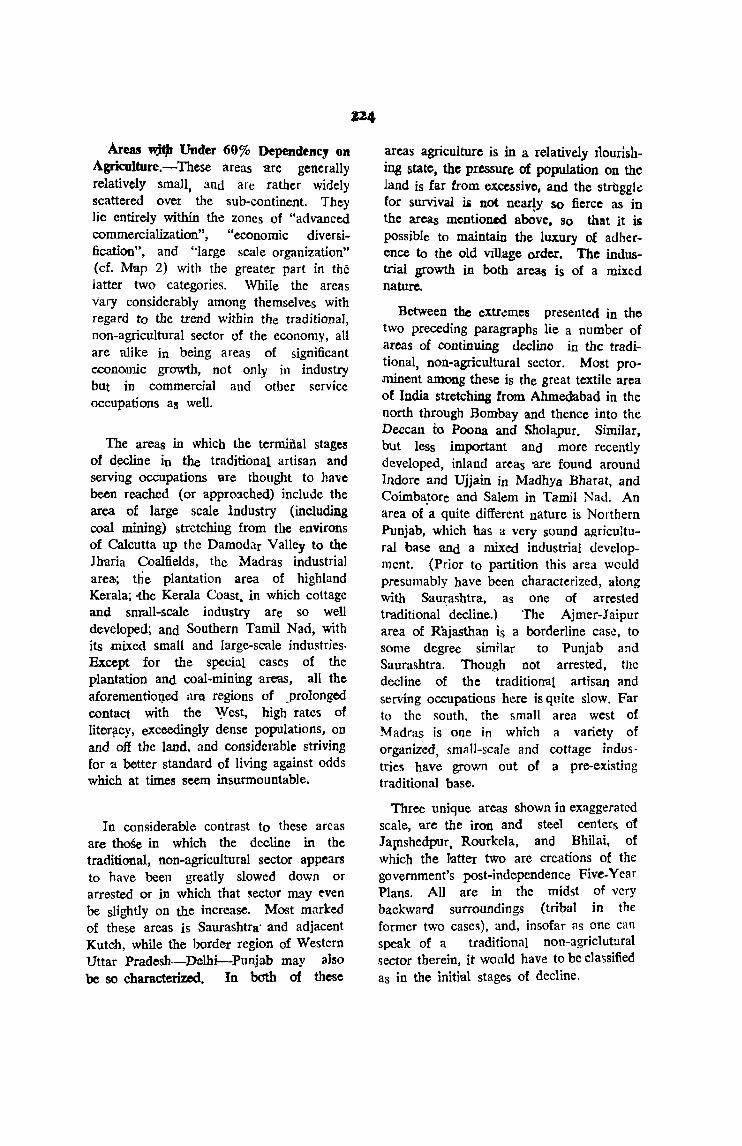
Areas w.hJt Under 60% Dependency on Agriculfure.-These areas are generally relatively small, and are rather widely scattered over the sub-continent. They lie entirely within the zones of "advanced commercialization", "economic diversification", and "large scale organization" (d. Map 2) with the greater part in the latter two categories. While the areas v'ary considerably among themselves with regard to the trend within the traditional, non-agricultural sector of the economy, all are alike in being areas of significant economic growth, not only in industry but in commercial and other service occupations as well.
The areas in which the terminal stages of d~line in the traditional artisan and serving occupations are thought to have been reached (or approached) include the area of large scale industry (including coal mining) stretching from the environs of Calcutta up the Damodar Valley to the Jharia Coalfields, the Madras industrial area; the plantation area of highland Kerala; -the Kerala Coast, in which cottage and small-scale industry are so well developed; and Southern Tamil N ad, with its mixed small and large-scale industries· Except for the special cases of the plantation and coal-mining areoas, all the aforementioQed ilre regions of .prolonged contact with the 'Yest, high rates of Iiterilcy, eXceedingly dense populations, on and off the land. and considerable striving for a better standard of living against odds which at times seem insurmountable,
In considerable contrast to these arcas are thoSe in which the decline in tbe traditional, non-agricultural sector appears to have been greatly slowed down or arrested or in which that sector may even be slightly on the increase. Most marked of these areas is Saurashtra" and adjacent Kutch, while the border region of Western Uttar Pradesh-Delhi-Punjab may also be so characterized. In both of these
P4
areas agriculture is in a relativdy rlourisbiug state, the pressure of population on the land is far from excessive, and the strilggll! for survival ii not near!y so fierce as in the areas mentioned above, so that it is possible to maintain the luxury of adherence to the old village order. The inuustrial growth in both areas is of a mixed nature.
Between the eXtr¢mes presented in tho two preceding paragraphs lie a number of areas of continuing uedine in the traditional, non-agricultural sector. Most prominent among these is the great textile area of India stretching from Ahmedabad in the north through Bombay 'and thence into the Deccan to Poona and Sholapur. Similar, but less important and more recently developed, inland areas are found around Indore and Ujjain in MadhYa Bharat, and Coimba~ore and Salem in Tamil Nad. An area of a quite different nature is Northern Punjab, which has a very sound agricultural base and a mixed industrial development. (Prior to partition this area would presumably have been characterized, along with Sau~ashtra, as one of arrested traditional decline.) The Ajrner-Jaipur area of Rajasthan is a borderline cas~, to some degree similar to Punjab and Saurashtra. Though not arrested, the decline of the traditiorral artisan and serving occupations here is quite slow. Far to the south. the small area west of Madras is one in which a variety of organized, small-scale and cottage indus" tries have grown out of a pre-existing traditional base.
Three unique areas shown in exaggerated scale, are the iron and steel centers of JaIllshedpur, Rourkcla, and Bhilai, of which the loatter two are creations of the government's post-independence Five-Year Plans. All are in the midst of very backward surroundings (tribal in the former two cases), and, insofar as one can speak of a traditional non-agriclutural sector therein, it would have to be classified as in the initial stages of decline.

For several areas, the author is very
uncertain about the trend within the
traditional, non-agricultural sector: in the
plantation areas of Assam and West
Bengal, it may be in either the initial or
continuing phase of decline; and in the
225
part of' the Malabar Coast north of Kera)a
which is characterized by the development
ot tho same cottago and small-scale
industries found further south, the decline
may be in either the continUing or the
terminal phases.

I
CHAPTER VIII
CONCLUSIONS
The regional variations in the OCCll
pational structure and level of economic development of India have been examined 011 the basis of both the CenSLIS of 1951 and other ofticial documents, and extensive field work in nearly two hundr-::c1 villages in twelve areas of India. The attempt was made to maintain a historic:ll as well as a geographical approach, and to view all findings in the con tnt of a peculiarly Indian. socio-economic ~vstel11.
The principal . conclusions which have
emerged from the study arc stated below.
I. With Respect to the Need fol' a Geograpbic Approach to an Empirical Study of the Indian Econom~';-To spca.k of the occupational structure of I ndia as a
whole is to deal with averages which m(l,k the great inter-regional occupational divcrc;ity encountered within that sub-continent obscuring, the often conflicting occupatiol1-<11 trends which are found in c1ilTcrent regions and which operate -\"itil different acgrees of strength from one pm! of the country to the next. To speak of the level of economic development of India as ;1
whole also has severe limitations. especially when question') of internal economic policy-making an~1 regional plannin)! arc under consideration. It i.., not implied that na(ional averages arc meaningk..,s. be:t
rather that a proper understanding of the 'national picture must take into c()n~ider:l
tion its regional diversity. Such an undersUtnding can best be obtained Ihrou(!,h " properly executed economic geographic study. which employs bOlh Censut; data and field research", utilize insol:ar ns is possible. a cOI1<;istent methodolo~ical approach from one region to anoth~r ~'lld is dcsi!.!ned wIth particular refen:n.:c to
227
the Indian socio-economic and ilistorieal conrext.
2. With Respect to the Utility oj' the Ccnsus.-The 1951 Census of India, though providing a \\ealth of det~lil on till: occupational structure of Tndia. down to the sub-distrIct level, has several majOi Jimitation5.. Among these, the most important appear to be the f()llowin~: (<1) the OCCllP:ltiOLWI. dcpendency. and cPlployment statu~ categories, all borrowed from Western cconomic thinking, arc ill-adapted to tile realitie" 01' Indian life; (b) the occupational stati~tics incorpol'ate strong regional biases rcsulting fro111 the misinterpretation oT Census deflnltiOm and
instructions. e~pecially in the recording of traditional caste occupations rather than those actually pursued; (e) the degree of dependence on agricultural lahar, casual labor ("service<; not elsewhere <pecified") and all form') of ~\lb:;.idiary sources ot livelihood are all incorrectly enumerated and generally appear to be greatly undercounted~ and (d) tbe data are not readily compnrable with those of Cen~m..:<; of prcvj pus decades.
3. Wilh Respcct to thc Utility of Vicld Work in General and the Author's Fiehl Wor], in Particular.-Most of the above Jeliciencies can. be parti;dly countered by the type of field work suggested in paraf!rnph I. But field work too has certain seriOl!;; limilations. are: (a) thc unavoidable
Amonl! these po'SSibilitv that
the. ~all1p1c vill:tgcs stuclieu may not be rea~onablv representative· of the re!!iol1~ in which they arc 1ocated; (b) the prob<\hilitv tll;,t l1l'lny of the region" of India will h;lVe
228
no analogues among the areas which the
field worker has had time to study; and ~c) the possibility that false analogies will De assumed between the areas studied and other areas. Recognizing all the above, the author believes that his field work has been generally reliable (i.e., of an order of accuracy comparable, on a -regional basis, to that of the Census) and throws light on a number of problems with which the Census completely fails to deal, or with which it deal inadequately. Among these problems are the regional variations in the extent of: (a) adherence to caste occupations and the traditional ]a]mani system of allocation of labor; (b) dependence on subsidiary occupations; (c) dependence on 'both casual and regular employment outside the village by persons living in the village; (d) dependence on remittances from family members both living ahd working outside the village; (e) intra-regional specialization within the non-acrricultural sector; (f) correlation o between village size and development of nOll-agricultural activity; (g) effect of proximity to urban areas; and (h) interand intra-regional correlations between various aspects of occupational structure and various levels and types of economic development. Most of these findings are summarized in Chapter VI on a comparative intra-regional basis.
4. With Respect to the Us~ of Subjective Techniques in Mapping.-Pending the development of more detailed and more rediable statistics for areal subdivisions at the district level and smaller, and the establishment of comparable time series, the student is forced to rely heavily on subjective evaluations of particular cases in devising realistic maps relating to complex aspects of the Indian economy. Particular reference is made here to maps 2 and 33, relating respectively to the level of economic development and the occupational structure and trends in India. Each map IS based first, on the establishment, by inductive reasoning. of a typology
of regional variations with respect to a complex or limited number of significant variables, and second, the classification, by deductive reasoning, of all areas of the country within the system devised. It is felt that the resultant maps have greater utility in conveying a generally correct regional picture of the variaJble considered than any that could be made by the use only of published data within the framework of administrative unit boundaries.
5. With Respect to the Clarkian Hypothesis and the Sectoral Approach to the Indian Economy.-While India as a whole has a higher level of non-primary
I employment than its poverty would seem to suggest (ct. Table 3), within the country all indications point to a generally high correlation betwe,en level of economic develop,ment and the degree of dependence on the non-primary sector of the economy, both inter-regionally and intra-region any. (c/. Map 33 vis-a-vis Map 2, the coefficients of correlation of Table 6, and Graphs 10 through 14). This is in accordance with Colin Clark's hypothesis relative to the growth of the nonprimflry sector as a concomitant of economic development. Moreover, there appears also to be, as Clark hypotl1esi7.ed, a slightly greater correlation between level of development and the size of the tertiary sector than between level of development and the size of the secondary sector (c/. Table 6). Thus, a cursory inspection of the princIpal summary findings of this study might lead one to the conclusion that Clark's views were vindicated and to the belief "that the question could be brought to a close.
But) examined in greater detail, matters are not quite so simple. Thus, while it is true that the relationship of the size of the secondary and tertiary sectors to economic development for India as 'a .whole inclines, statistically speaking, slightly in the direction that Clark suggested, .in the areas of greatest economic growth it
is more often th~ seconJary not the . ' t~rllary, sector which .tppea);i to llavt: rCgJhler.:d parlicul'lll I.:xp~msjon. Th~s I un::. c(lunter to Chu K'S tnc&)~, oasl.'li I'urgel), on ~tlldics of tim~ sen.:s for particular (usually advanad) countrie" and i~, !at H:r, more in Jine with ~Ul,net3' lindings ba.,.::d on an internatlOll.ll andly~is rel<itillg to a single penod of t:me. Over most l)f tlle rest of the country. however, the ::,ccondary and tertiary hectors appear to exi!>t in a fmrl)' consistent ratio to one anl)thcr , irre<;pective or the local levd of econOU\lC
development (ct. Graph 5 antl Mup 21). it evidently doe" !lut hold, then, that the ~izc or the tertiary economic s.:ctor, iii, in India, a bette! guiJe h) the lev.:l of ('conomie deveJop,nent than the ~iL.e of the secondary.
Moreover. the statistical evidence in support of Clark's hypothesi.s rdcttivc to
the total non-pri mary sector is in part illusory, stemming from the failure of the Census to enumerate ndequJt~ly
dependence, either primary or subsidiary on casual labOi uutside the village, which is largely tertiary in nature, and which in 'iomc of the mOfe implWeris!1cd ,If .:as of India, swdls the total (If non-primary workers weU beyond thost' which the Cen<:us indicates (cf. fable L 2 anJ t 3, and the right-hand siJc of Tabk 14. and the accompanying di~cussil)n in Chapter VJ.)
The inevitability of occupational shifts in the dire.ction~ :ndicatcd by Cl-ark as ?
concomitant of cCl)nnmk l1eveopn~e:~L
may also be qllc<;tiul1Cd, in view of the numerous l'vidcll':~;. of ->cconda.ry ;:,:11.1, to a lesser degree, :ertiJry dcdine brought to. light by tlle Ilj,stOl·:cal dl"cus"iol1 in Chapter T11. One ic; tempted to :ny that a lraditiond: econ11my must firsl "dewlop" (i.e., shake loose the old order's hold of
custom in rcgulalin)! econnmic :dTairc;) xfore it can "re-develop" in l\ rationalized manner. But tlle field data for ~t.:ch relatively pr()l~perolls areas as Snuf<lshtra, Delhi, and Ajmer <;eClll to indicJte that
229
the old ordl.'f and the new cali be blended hUrl11l1JL(ou::.i) in the context 0t IndLln hk. (sec () following).
t wally, wbile it C,.lOuot be d.mied lh:..l
much or avmlable U'Jtd lends gell..:tal
~u~polt to Clark s hypo1l1C~~s, 1.1C use at thu threefold, ptillhU Y -!>l;(;Ol1liar) -Ie. tidr),
~t·.;tOl~l bf~'akuown o[ tjl~ l'dbor lorct: l~
ioun!.i to be somewhd.t llnreaJi:;tlc when
applied to the lnJidI1 .:.:onomj. Mudl
llll)re :,ignillcant l:lan ihl; I,.htrercncl.' between secondary and tertiary ~..:ct()r~
~e.g., h.:twecn lHC ';lUage blacksmith ltsteu by l:1e Census under ' processing and manufacture", ur the s~condd[y ~l..ctur,
and the. village bdrber who lal1~ \\ i\h:n tne '·s\.!rvice··, or tCLtiary ~\.!ct0r) is that
presented in Chapter I V between the traditional and the J1Iudcrn, Of reorgJnized
sectors of t;l~ eoonomy (c.g., between the vill:-dge bla~~smJth and the !aDorer In a great iron and steel miJ, whO are similarly dassiiied by the Census). rhe failure 0[
the CCIl~US to rccogniz\.! the. importan.::e of t11is distinction i~, p..:rhaps, its grc;llcbt weakness; and the slvwness of students o( the macro-aspects of the indian economy to develop quantitative ~tudie:, ba<.:.w on thi~ distinctIOn "criousiy r..:tard~ ..,ur aLl1:iLy to cumprehend the true nature of that economy. Map 33 repre&Cnth a pn:ii:llinury attempt to present albeit non-Lluao.~itativcly, ~ome of maj\)( regional vdriations with respect to the traditional and the modern ~eCll'rs of tlh~ Indian eCClnomy.
6 With Respect to the Indian RUI'al
Economy as a Coherent Systcm.-A chara..:teristic ffature of the Inqian rural economy is the irnportalll role which custom continues to exert in most parts of the country, especially with regard to th~ intra-village exchangE' of goods nnd services. Since the goods 'and services exchanged are often well in excess of w!lat would be demanded in a cash market type situathm, the size of th.: non-agricultural sectl);' :nay consid.:rably exceed Clarkia)1 expectations based ~o1cly on the 1cvel of economic development. In the face of
dite poverty, howcvet, or the sensed threat of dire poverty, combined with Ci<posure to Western-type, market-oriented economic thinking, the indigenous jajmani system begins to break down and customary ties with one's fellow villagers tcnd more and morc to be severed when market value for services is not realized. But this is a matter of necessity, not of choice.
~
Given the economic means to maintain the old order, in most parts of J ndi a the average villager-or at any mte. the average independent ellltiv_HOJ'-:lpparently' unhesitatingly chooses to do so. On this hypothesis, indllc~d 'from the field studies, a scheme was devised (Graph 9) within which the great majority of regions of India could probably be ordered according to the nature of their -rural economy, taking into consider Ilion three key variables: degree of commercializ'ation, degree of poverty, and degrce of adherence to the old order in intra-village tnm,,-actions, or "socio-eeonomic ~onservatism". The scheme indicates that an area of a high degree of commercialization attended by prosperity (e.g., Sallra~htr:1) adheres closely to the old order, while an 'an~a of a high degree of commercialization attended by poverty (e.g., the Deccan Lava Plateau) departs most radically from the old order. Finally, an area which i<; neither commercialized nor prosperom (e.g., North Bihar) adheres to the old order insofar as it is r1 bIe to do so, often
hy maintaining hotise11Olds in their caste occupations on a subsidiary basis. Within the extremes set by these three case~ most other areas may be fairly well located, while those which cannot appeal' to be cases of marked intervention of external forces such as: (a) massive intrusion of corporate capital into the economy (e.g., in the plantation or coalfield areas); (b) prolonged exposure to Wc'Stern thinking leading to the abandonment of the Hindu economic ethos (e.g., the environs of Calcutta and Kerala), or (c) the disruptive: effect of partition (e.g., E.m Punjab).
7. With Respect to the need ,for Additional Research.-This study hoas raised a number of questions to which only partial and tentative answers have been given; it relies heavily on subjective, non-quantitative evaluations o'f various phenomena, particularly, with respect to economic development; it utilizes field dat'a from only twelve widely-scattered areas o'f India, only eight of which have been studied on a comparable basis; and it suggests certain hypotheses which require additional substantiation. All of these facts point to the final conclusion that there is a great need for continuing research on various a<;pccts of the question of r ndia's occupational structure and thc nature of its relationship to the evt!n more important question of the regional varia· tions in the nation's level of economic development.
APPENDIX A.
HASIC CE~SUS STATISTICS OF POPULATION, DEPEl'iD"ENCY STATUS A],;D OCCUPATIONAL STRUCTURE
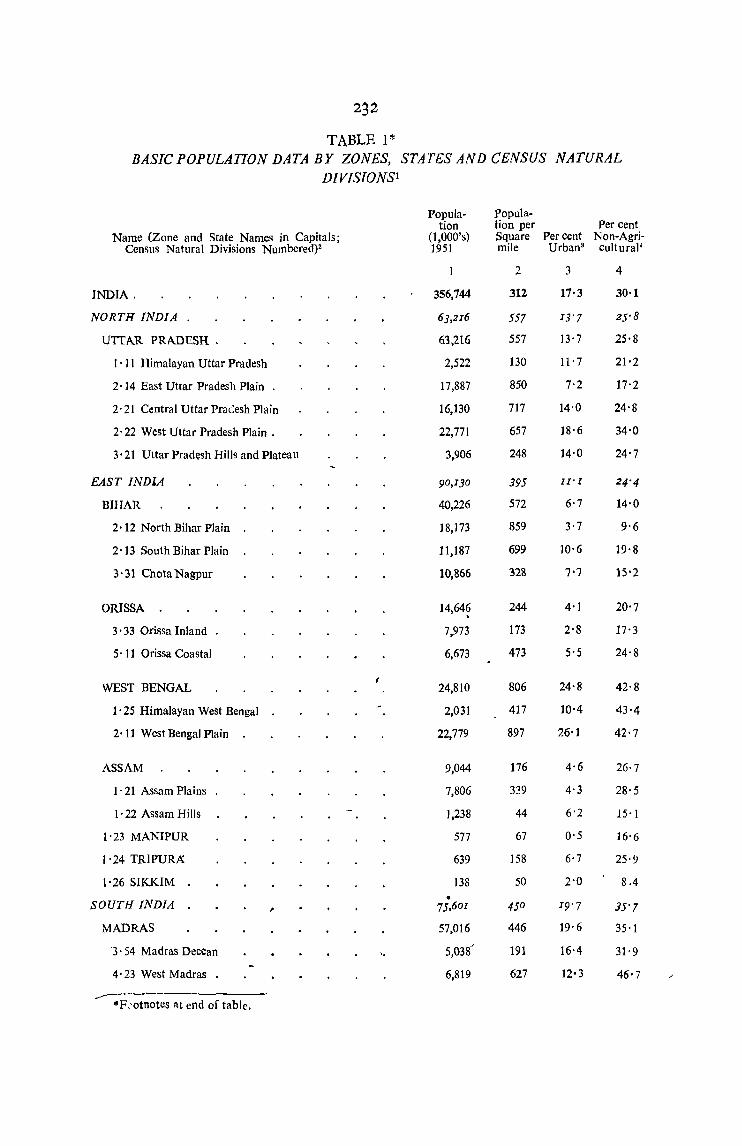
232
TABLE 1* BASIC POPULATION DATA BY ZONES, STATES AND CENSUS NATURAL
DIVIS10NSl
Popula- popula-tion tion per Per cent
Name (Zone and State Names in Capitals; (l,OOO's) Square Percent Non-Agri-Census Natural Divisions NUlnbered)2 1951 mile Urban9 culturaP
2 3 4
INDIA, 356,744 312 17'3 30·1
NORTH INDIA 63,216 557 13'7 25'8
UTTAR PRADESH. 63,216 557 13'7 25'8
1 . 11 Himalayan Uttar Pradesh 2,522 130 11'7 21'2
2'14 East Uttar Pradesh Plain . 17,887 850 7'2 17'2
2· 21 Central Uttar Pradesh Plain 16,130 717 14·0 24'8
2· 22 West Utta r Pradesh Plain . 22,771 657 18'6 34'0
3' 21 Uttar Pradesh Hills and Plateau 3,906 248 14'0 24'7
EAST INDlA 90,130 395 II'1 24'4
BIHAR 40,226 572 6'7 14'0
2·12 North Bihar Plain 18,173 859 3'7 9'6
2' 13 South Bihar Plain 11,187 699 10'6 19'8
3'31 ChotaNagpur 10,866 328 7'"] 15'2
ORISSA 14,64? 244 4'1 20'7
3' 33 Orissa Inland 7,973 173 2'8 17'3
5· 11 Orissa Coastal 6,673 473 5'5 24'8
WEST BENGAL 24,810 806 24'8 42'8
1'25 Himalayan West Bengal 2,031 417 10'4 43'4
2'11 West Bengal Plain 22,779 897 26'1 42'7
ASSAM 9,044 176 4·6 26· 7
l' 21 Assam Plains 7,806 3:9 4'3 28'5
l' 22 Assam Hills 1,238 44 6'2 15'1
1 . 23 MANIPUR 577 67 0'5 J6'6
I . 24 TRIPURA: 639 158 6'7 25'9
1'26 SIKKIM 138 50 2'0 8.4
SOUTH INDIA I'
• 75,601 450 19'7 35'7
MADRAS 57,016 446 19·6 35'1
3' 54 Madras DeCCan '. 5,038 191 16'4 31'9
4' 23 West Madras . 6,819 627 12'3 46'7
----.~--
"'F.'otnotes at cnd of table.
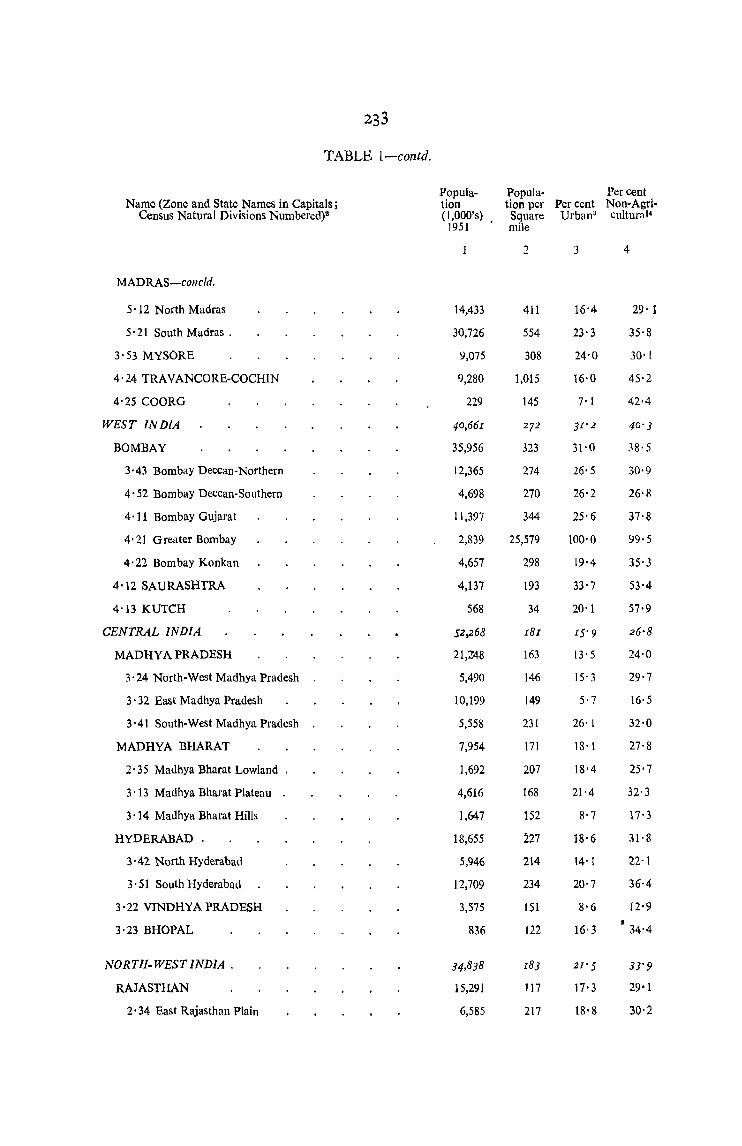
233
TABLE l-contd.
Popula- Popula- Percent Name (Zone and State Names in Capitals; tion tion per Per cent Non-Agri·
Census Natural Divisions Numbered)2 (I,OOO's) Square Urban3 CUitUfflJ' 1951 mile
2 3 4
MADRAS-collcld.
5· 12 North Madras 14,433 411 16'4 29· 1
5 . 21 South Madrus . 30,726 554 23'3 35'8
3'53 MYSORE 9,075 308 24'0 30·1
4·24 TRAVANCORE-COCHIN 9,280 1,015 16·0 45·2
4'25 COORG 229 145 7'1 42·4
WEST INDIA 4°,66r 272 3r ' 2 4°'3
BOMBAY 35,956 323 31·0 38·5
3'43 Bombay Deccan-Northern 12,365 274 26'5 30'9
4' 52 Bombay Deccan-Southern 4,698 270 26'2 26·8
4·11 Bombay Gujarat 11,397 344 25'6 37'8
4,21 Greater Bombay 2,839 25,579 WO'O 99·5
4·22 Born bay Konkan 4,657 298 19'4 35'3
4'12 SAURASHTRA 4,137 193 33'7 53'4
4'13 KUTCH 568 34 20'1 57·9
CENTRAL INDIA 52,268 r8I IS'9 26'8
MADHYA PRADESH 21,2'48 163 13' 5 24'0
3·24 North-West Madhya Pradesh 5,490 146 15'3 29·7
3' 32 East Madhya Pradesh 10,199 149 5'7 16'5
3'41 South-West Madhya Pradesh 5,558 231 26'1 32,0
MADHYA BBARAT 7,954 171 18'1 27·8
2·35 Madhya Bharat Lowland 1,692 207 18'4 25'7
3'13 Madhya Bharat Plateau 4,616 168 21'4 32'3
3 . 14 Madhya Bharat Hills 1,647 152 8'7 17'3
HYDERABAD . 18,655 227 18'6 31' 8
3' 42 North Hyderabad 5,946 214 14'1 22·1
3·51 South Hyderabad 12,709 234 20'7 36'4
3' 22 VINDHYA PRADESH 3,575 151 8,6 12·9
3'23 BHOPAL 836 122 16· 3 • 34,4
NORTH- WEST INDIA, 34,838 183 u'S 33'9
RAJASTHAN 15,291 tJ7 17,3 29'1
2' 34 East Rajasthan Plain 6,585 217 18'8 30,2
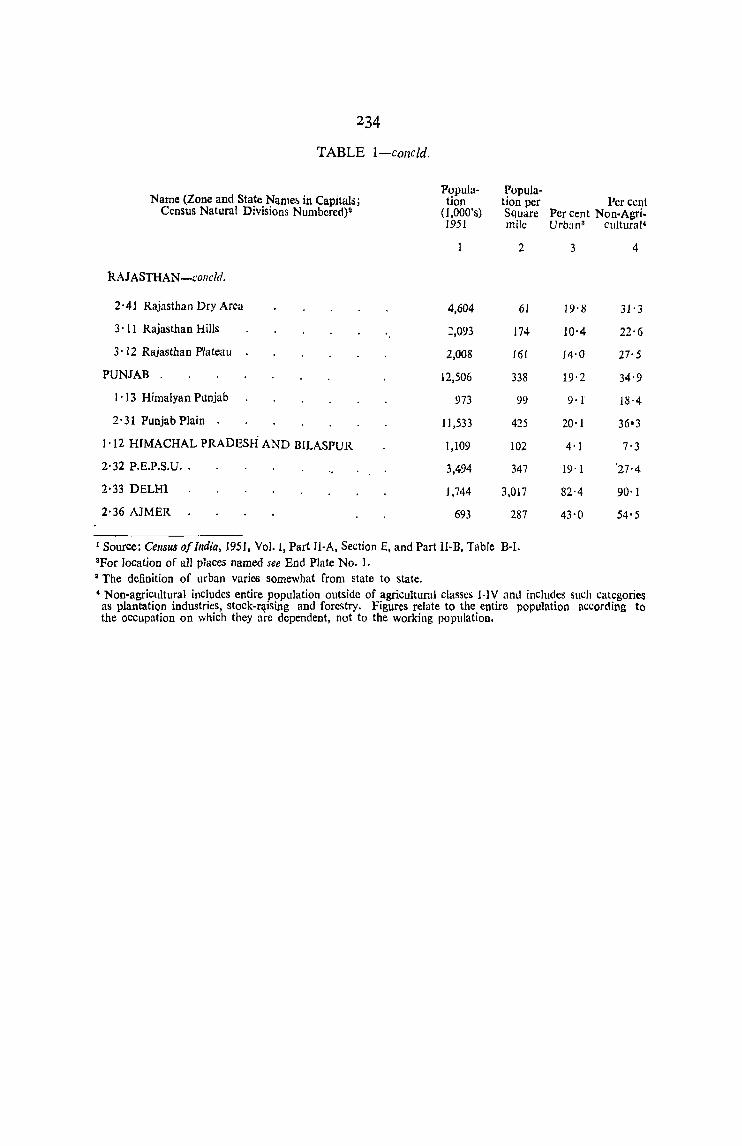
234
TABLE I-concld.
Name (Zone and State Name!> in Capitals; Popula- Popula-tion tion per
Census Natural Divisions Numbcred)2 O,OOO's) Square 1951 mile
2
RAJASTHAN-concld.
2'41 Rajasthan Dry Area 4,604 61
3 . 11 Rajasthan Hills 2,093 174
3 ·12 Rajasthan Plateau 2,008 16[
PUNJAB 12,506 338
1'13 Himalyan Punjab 973 99
2· 31 Punjab Plain 11,533 415
1'12 HIMACHAL PRADESH AND BILASPUR 1,109 102
2'32 P.E.P.S.U .. 3,494 347
2·33 DELHI 1,744 3,017
2'36 AJMER 693 287
I Source: Census of Illdia, 1951, Vol. I, Part U-A, Section E, and Part II-B, Table B-I. 3For location of all places named see End Plate No.1. 3 The dcfinition of urban varies somewhat from state to state.
Pcr ccnt Pcr cent Non-Agri-Urban3 cultural'
3 4
19'8 31'3
10'4 22'6
14·0 27'5
19'2 34·9
9'[ HH
20'1 36'3
4' I 7·3
19 '1 '27'4
82'4 90·1
43'0 54'5
, Non-agricultural includes entire population outside of agricultural classes I-IV anu includes sUl.:h categories as plantation industries, stock-r~ising and forestry. Figures relate to the entire population according to the occupation 00 which they are dependent, not to the working population.

235
tABLE 2
DEPENDENCY STATUS OF THE TOTAL INDIAN POPULATIOlv, CLASSIFIED BY SEX RURAL VERSUS VRBAN DISTRIBUTION AND AGRICULTURAL VERSUS N_ON-AGRICULT'!RAL' DISTRIBUTION
(Figures in column 1 represent millions of people. All other figures represent percentages of totals in column 1)*
Self-supporting Earning Non-earning All Categories Persons Dependents Dependents
r-__A. ,--__ ..A._ ~""-I r-__,A. ,--__.A.
Total Male Female Total Male Female Total Male Female rotal Male Female
2 3 4 5 6 7 8 9 10 11 12
Total Population 357 51'4 48·6 29'1 24'4 4'8 10'6 3'8 6'9 59·9 23'. 37'0
Agricultural 249 5(Y'6 49'4 28'5 23'5 5'0' 12'5 4'1 8'3 59'0' 23'0' 36'1
Non-Agricultural 108 53'0 47·0 31'0 26'7 4'4 6'4 2'7 3'7 62·5 23'6 39'9
Rural Population 295 50"8 49·2 33'1 23'9 5'1 1l'9 4'0' 7'9 59'0' 22'9 36'0'
Agricultural 240 50'5 49'5 28'6 23'5 5'0 12'6 4·2 8'4 58·7 22'9 35'9
Non-Agricultural 54.4 5t'8 48·2 31'2 25'7 5'5 8'9 3'2 5'7 "59'9 23'0 36'9
Urban Population 61. 8 53'7 46'3 30'3 26·9 3'4 4'5 2'5 2'1 65·2 24'4 40·8
Agricultural 8'7 Sl'} 48·9 26·6 21'8 4'8 8'7 3'6 5'1 64·6 25'7 38'9
Non-Agricultural 53'2 54'2 45'7 30'8 27'6 3'2 3'8 2'3 1·6 65'2 24'2 41'0
*Source : Census of India, 1951, Vol. I, Parts II-B and II-C, Table B-I. Definitions: A "self-supporting 1Jerson" is (jne "ih receipt of an income .. sufficient at least for his (her] 'own maintenance .... Such income may be in cash or kind." An "earning dependent .. secure, a regular [sic] income .. which .. is not sufficieht to' support him [her) .... " A "non-earning dependent" is "a person who does not secure any [sic] income in cash or in kind .. " Note: the inclusion of the word "rClgular" in the second definition and its omission in the third, where "any" is used instead, meanS that the definitions de> not logically cove~ all Cases. (Census of India, Vol. I, Part I-B, p. 168).
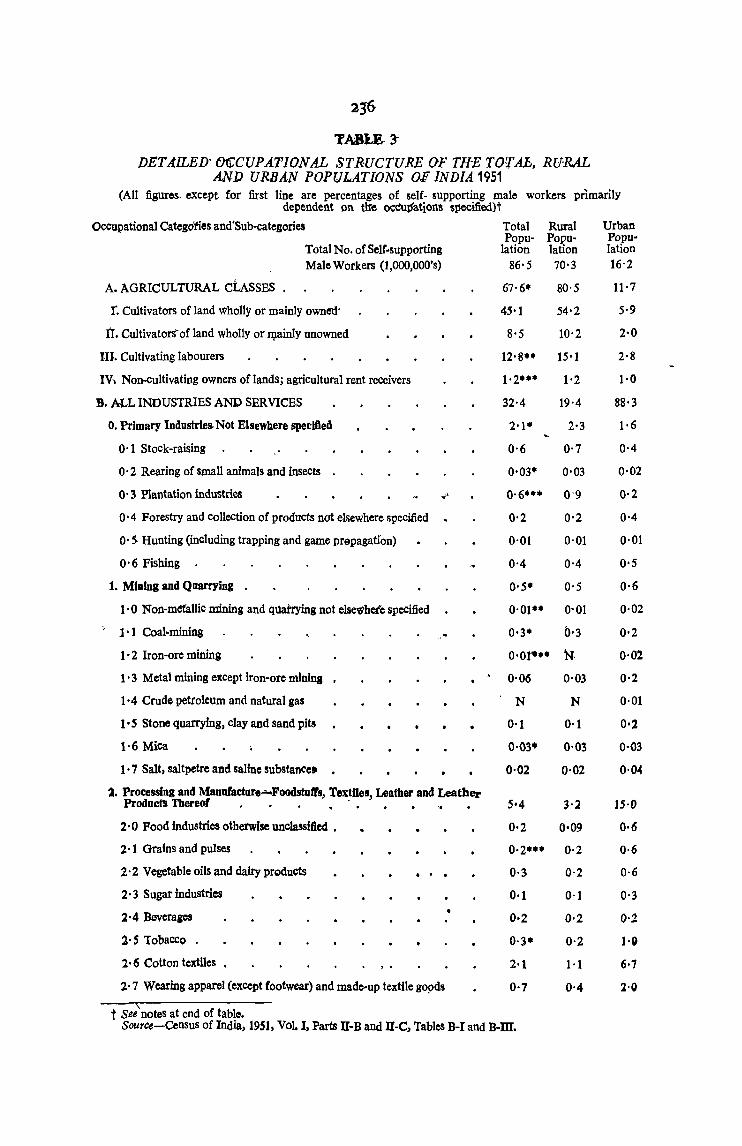
2;6-
TABl.E· 3-
DETAILED' Of£CUPATIONAL STRUCTURE OF THE TOTAb. RURAL AND URBAN POPULATIONS OF INDIA 1951
(All figures. except for first line are percentages of self- supporting malo workers primarily dependent on the ~dation'& sI'OCifioo)t
Occupational Categoties and'Sub-categories
Total No. of Self-supporting Male Workers (I,Ooo,OOO's)
A. AGRICULTURAL CLASSES
r. Cultivators of land Wholly or mainly owned:
iI. Cultivators'" of land wholly or n;tainly unowned
In. Cultivating labourers
IV ... Non-cultivating owners of lands; agricultural rent receivers
B. ALL INDUSTRIES AND SERVICES
O. Primary Industries.Not Elsewhere speclfted
0'1 Stock-raising
O' 2 Rearing of small animals and insects
O' 3 Plantation industries
O' 4 Forestry and collection of products not elsewhere specified ~
O' S Hunting (inCluding trapping and game prepagatfon)
O· 6 Fishing .
1. Mining and Quarrying
l' 0 Non-metallic mining and q1lai'tying not else'Nheic specified
1,1 Coal-mining
1 • 2 Iron-ore mining
1 • 3 Metal mining except iron-ore mining
1·4 Crude petroleum and natural gas
l' 5 Stone quarrying, clay and sand pits
1-6 Mica
l' 7 Salt, saltpetre and saline substance. •
,-
1. Processing and Manufacture-Foodstotrs, TextOe!l, Leather and Leather Pl'oducB Thereof . • • .' • • • • •
2·0 Food industries otherwise unclassified •
2·1 Grains and pulses
2' 2 Vegetable oils and dairy prQducts
2' 3 Sugar industries
2' 4 Beverages
2· 5 Tobacco •
2·6 Cotton textiles •
. . .
2' 7 Wearing apparel (except footwear) and made-up textile gopds
Total Rural Popu- Popu-
lation lation 86'5 70'3
67'6* 80'5
45'1 54'2
8'5 10'2
12'8" 15'1
1'2··· 1'2
32'4 19'4
2'1· 2'3
0·6 0·7
0'03· 0-03
0·6··· 0'9
0'2 0'2
0'01 0'01
0'4 0·4
0'5* 0'5
0'01·· 0-01
0'3* 0'3
0'0r-" N
0'06 0'03
N N
0'1 0·1
0·03· 0·03
0·02 0·02
5'4 3'2
0·2 0'09
0·2*·· 0·2
0·3 0'2
0·1 0'1
0·2 0·2
0·3· 0·2
2·1 1·1
0·7 0·4
t See notes at end of table. Source-Census of India, 1951, Vol. I, Parts U-B and H-C, Tables B-1 and B-m.
Urban Popu-lation 16'2
11'7
5·9
2·0
2·8
1·0
88·3
1·6
0·4
0·02
0·2
0'4
0·01
0'5
0·6
0·02
0,2
0'02
0·2
0·01
0'2
0·03
0·04
15·0
0·6
0,6
0·6
0·3
0·2
1·1)
6·7
1·0
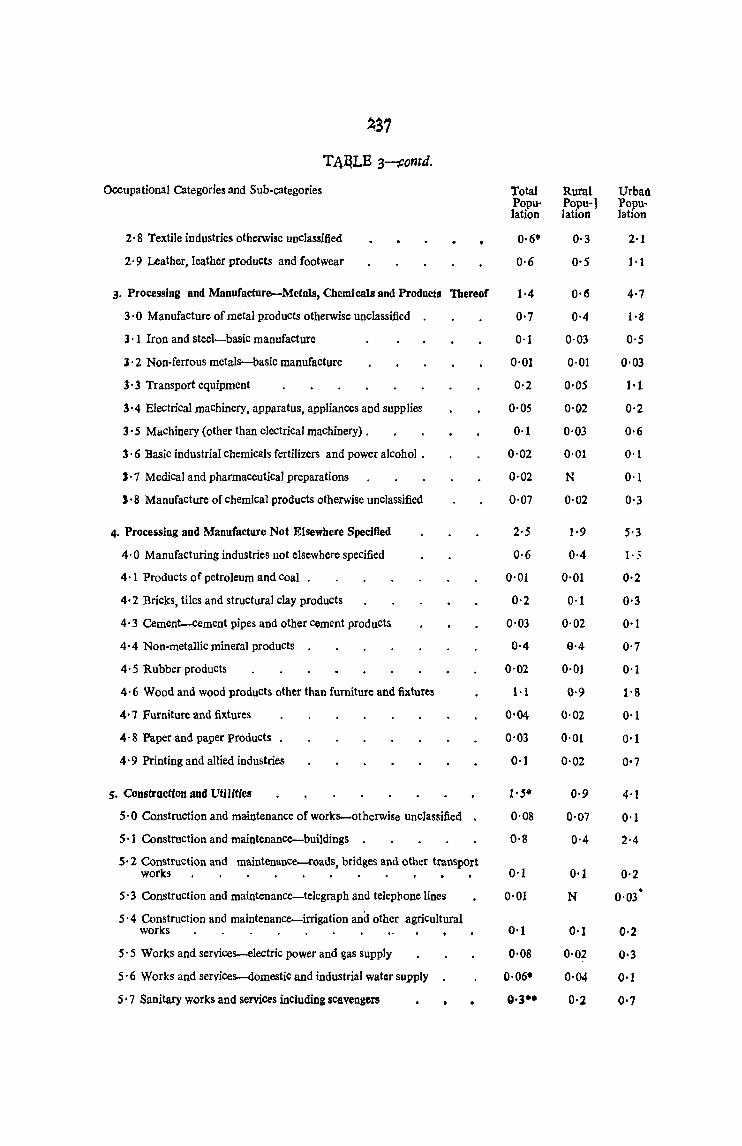
~S7
T i\:QLE 3-.cOntd.
Occupational Categories and Sub-categories Total Rural Urban Popu- Popu-j Popu-lation latioo lation
2 -8 Textile industries otherwise unclassified 0·6* 0-3 2-1
2 -9 Leather, leather products and footwear 0-6 0-5 I-I
3- Processing and Manufacture-Metals, Chemicals and Product. Thereof 1-4 0-6 4-1
3 -0 Manufacture of metal products otherwise unclassified 0-7 0-4 1-8
J -1 Iron and steel-basic manufacture 0-1 0-03 0-5
l' 2 Non-ferrous metals-basic manufacture 0-01 0-01 0'03
3 -3 Transport equipment 0'2 0-05 1·1
3 -4 Electrical machinery, apparatus, appliances and supplieIJ 0-05 0-02 0-2
3· 5 Machinery (other than electrical machinery) _ 0-1 0-03 0-6
3 -6 Basic industrial chemicals fertilizers and power alcohol _ 0-02 0-01 0-1
J -1 Medical and pharmaceutical preparations 0-02 N 0-1
J -8 Manufacture of chemica] products otherwise unclassified 0'07 0-02 0-3
4- Processing and Manufacture Not Elsewhere Specified 2·5 1·9 5-3
4-0 Manufacturing industries not elsewhere specified 0-6 0-4 1-5
4-1 Products of petroleum and coal _ 0-01 0-01 0·2
4·2 Bricks, tiles and structural clay products 0-2 0-1 0·3
4- 3 Cemen1-cement pipes and other cement products 0-03 0-02 0-1
4-4 Non-metallic mineral products 0-4 9-4 0-7
4- 5 Rubber products 0-02 0·01 0-1
4-6 Wood and wood products other than furniture and fixtures I-I 0-9 1-g
4- 7 Furniture and fixtures 0'04 0-02 0'1
4 -8 Paper and paper products 0-03 0'01 0'1
4-9 Printing and allied industries 0-1 0-02 0'7
5. Construction and Utmties 1'5* 0-9 4-1
5 -0 Construction and maintenance of works-otherwise unclassified 0-08 0-07 0-1
5 -1 Construction and maintenance-buildings 0-8 0-4 2-4
5· 2 Construction and maintenance-roads, bridges and other transport works 0-1 0-1 0-2
5 -3 Construction and maintenance-telegraph and telephone lines 0'01 N 0-03 •
5 -4 Construction and maintenance-irrigation and other agricultural works 0'1 0-1 0-2
5 -5 Works and services-electric power and gas supply 0-08 0-02 0·3
5 -6 Works and services-domestic and industrial water supply 0-06- 0-04 0·1
5' 7 Sanitary works and services including scavengers g·l" 0'2 0·7
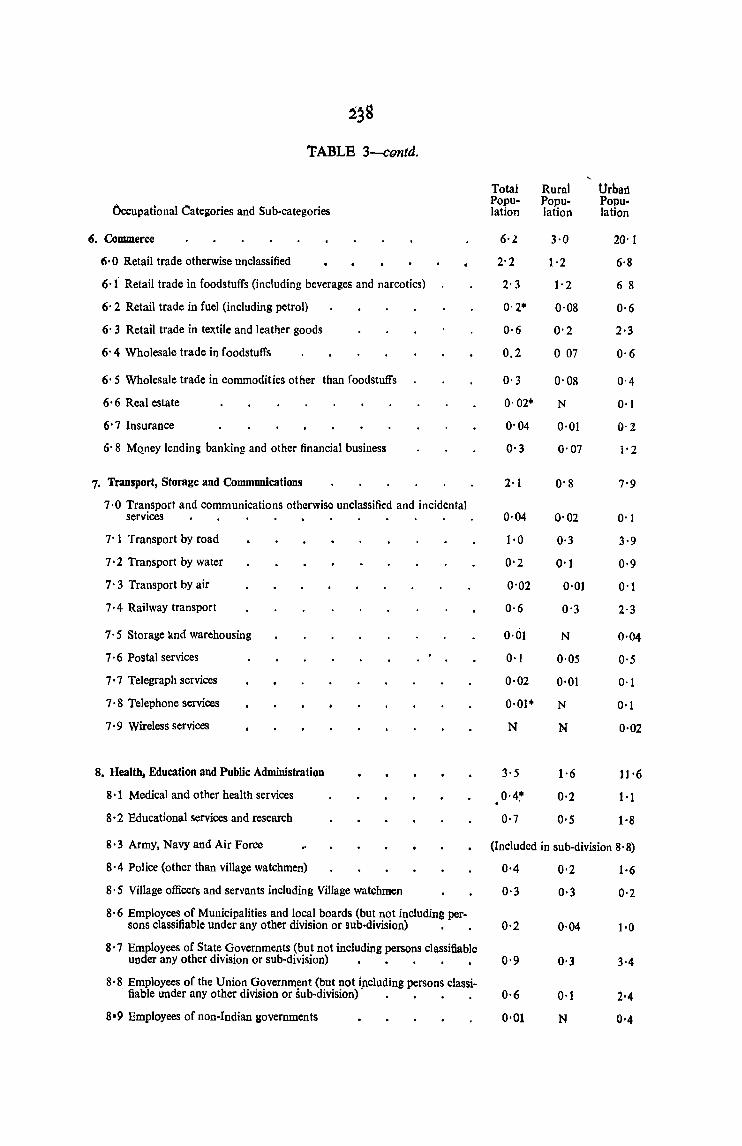
TABLE 3-contd.
Totai Rural UrbaI1
Occupatlonal Categories and Sub-categories Popu- Popu- Popu-lation lation lation
,. Commerce 6'2 3·0 20'1
6· 0 Retail trade otherwise unclassified 2'2 1·2 6·8
6· i Retail trade in foodstuffs (including beverages and narcotics) 2'3 t '2 6 8
6' 2 Retail trade in fuel (including petrol) 0'2· 0·08 0·6
6· 3 Retail trade in textile and leather goods 0·6 0'2 2·3
6' 4 Wholesale trade in foodstuffs 0.2 o 07 0·6
6' 5 Wholesale trade in commodities other than foodstuffs 0'3 0'08 0'4
6· 6 Real estate 0·02· N 0·1
6' 7 Insurance 0'04 0·01 0'1
6' 8 MQney lending banking and other financial business 0'3 0'07 l' 2
7. Transport, Storage and Communications 2·1 0'8 7'9
7·0 Transport and communications otherwise unclassified and incidental services 0·04 0,02 0,1
7'1 Transport by road 1·0 0·3 3·9
7·2 Transport by water 0'2 0'1 0·9
7' 3 Transport by air 0'02 0·01 0'1
7' 4 Railway transport 0·6 0'3 2·3
7· 5 Storage and warehousing 0·01 N 0'04
7· 6 Postal services 0·1 0·05 0'5
7·7 Telegraph services 0·02 0·01 0·1
7·8 Telephone services 0·01'" N 0·1
7' 9 Wireless services N N 0·02
8. Health, Education and Public Administration 3·5 1·6 11'6
8·1 Medical and other health services 0·4· 0'2 1·1
8·2 Educational services and research 0'7 0'5 1'8
8' 3 Army, Navy and Air Force (Included in sub-division 8·8)
8·4 Police (other than village watchmen) 0'4 0,2 1·6
8· 5 Village officers and servants including Village watchmen 0·3 0·3 0,2
8·6 Employees of Municipalities and local boards (but not including per-sons classifiable under any other division or sub-division) . 0·2 0·04 1·0
8· 7 Employees of State Governments (but not including persons classifiable under any other division or sub-division) 0'9 0·3 3·4
8' 8 Employees of the Union Government (but not i_ncluding persons classi-. fiable under any other division or sub-division) . • • . 0·6 0·1 2·4
8·9 Employees of non-Indian governments 0'01 N 0'4
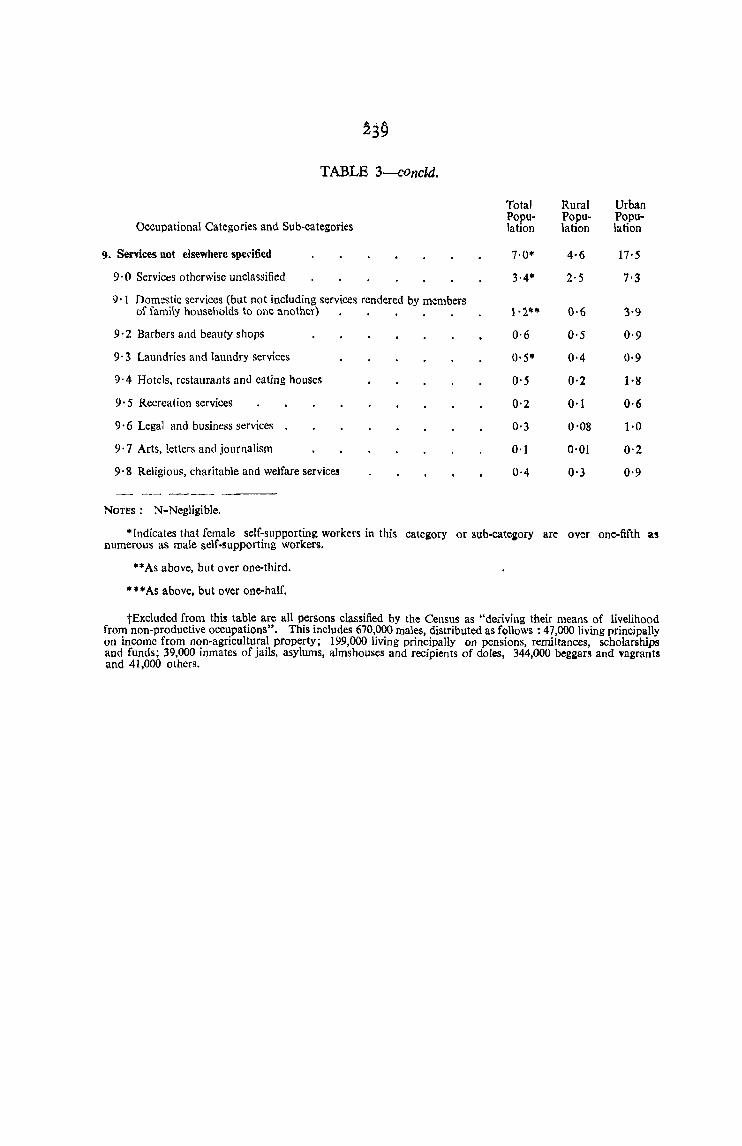
TABLE 3---condd.
Total Rural Urban Popu- Popu- Popu-
Occupational Categories and Sub-categories lation labon l;.ttion
9. Services not elsewhere spedfied 7'0* 4·6 17·5
9·0 Services otherwise unclassified 3'4* 2·5 7'3
9· 1 Domestic services (but not including services rendered by members of family households to one another) }'1** ()'6 3'9
9'2 Barbers and beauty shops 0·6 0'5 0'9
9·3 Laundries and laundry services 0'5* 0'4 0·9
9·4 Hotels, restaurants and eating houses 0'5 0·2 1·1:j
9' 5 Recreation services 0'2 0·1 0·6
9' 6 Legal and business services 0'3 0'08 1·0
9· 7 Arts, letters and journalism 0·1 0'01 0'2
9' 8 Religious, charitable and welfare services 0·4 0'3 0'9
- _.- ---- ----NOTES: ~-Negligible.
*Indicates that female self-supporting workers in this category or sub-category are over one-fifth as numerous as male self-supporting workers.
"'*As above, but over one-third.
* ** As above, but over one-half.
tExcluded from this table are all persons classified by the Census as "dedving their means of livelihood from non-productive occupations". This includes 670,000 males, distributed as follows: 47,000 living principally on income from non-agricultural property; 199,000 living principally on pensions, remittances, scholarships and funds; 39,000 inmates of jails, asylums, almshouses and reCipients of doles, 344,000 beggars and l'agrants and 41,000 others.
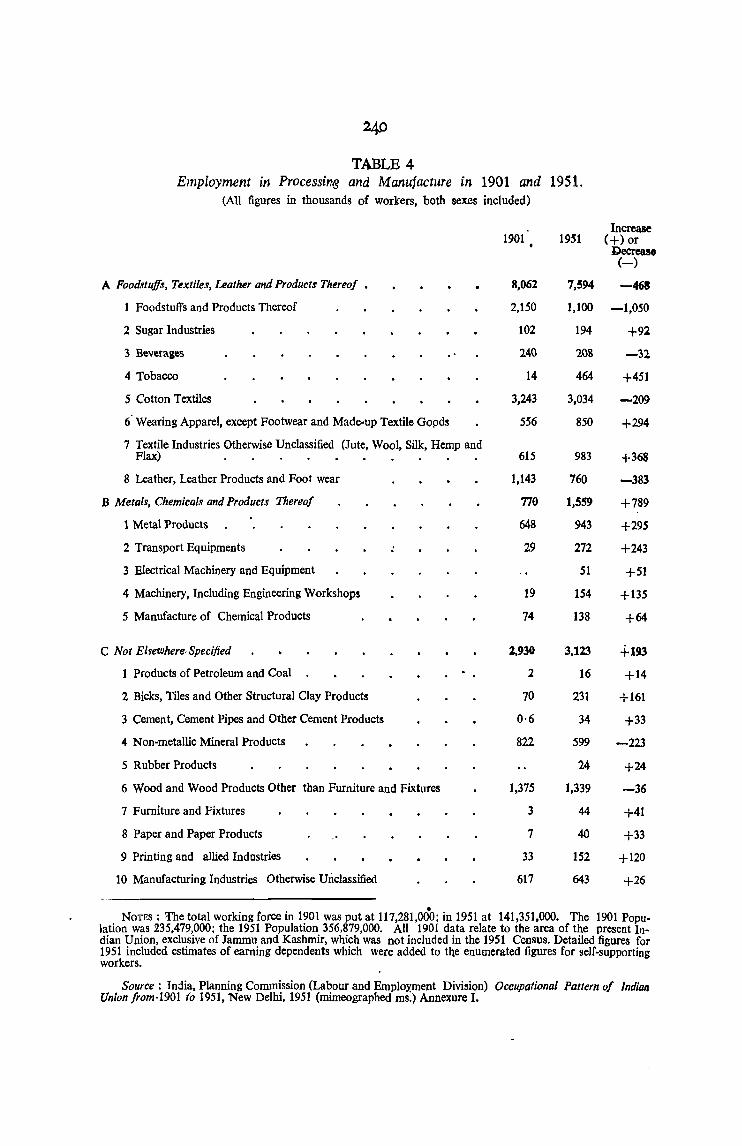
TABLE 4 Employment in Processing and Manufacture in 1901 and 1951.
(All figures in thousands of workers, both sexes included)
1901 1951
A Foodstuffs, Textiles, Leather and Products Thereof • 8,062 7,594
1 Foodstuffs and Products Thereof 2,150 1,100
2 Sugar Industries 102 194
'3 Beverages l40 lOS
4 Tobacco 14 464
5 Cotton Textiles 3,243 3,034
6' Wearing Apparel, except Footwear and Made-up Textile Gopds 556 850
7 Textile Industries Otherwise Unclassified (Jute, Wool, Silk, Hemp and Flax) 615 983
8 Leather, Leather Products and fuot wear 1,143 760
B Metals, Chemicals and Product.r Thereof 770 1,559
1 Metal Products 648 943
2 Transport Equipments 29 272
3 Electrical Machinery and Equipment 51
4 Machinery, Including Engineering Workshops 19 154
5 Manufacture of Chemical Products 74 138
C Not ElseWhere.Specified 2,930 3,123
1 Products of Petroleum and Coal 2 16
2 Bicks, Tiles and Other Structural Clay Products 70 231
3 Cement, Cement Pipes and Other Cement Products 0·6 34
4 Non-metallic Mineral Products 822 599
5 Rubber Products 24
6 Wood and Wood Products Other than Furniture and Fixtures 1,375 1,339
7 Furniture and Fixtures 3 44
8 Paper and Paper Products 7 40
9 Printing and allied Industries 33 152
10 Manufacturing Industries Otherwise Unclassified 617 643
•
Increase (+) or
Decrease (-)
-463
-1,050
+92
-32
+451
-209
+294
+368
-383
+789
+295
+243
+51
+135
+64
+193
+14
+161
+33
-223
+24
-36
+41
+33
+120
+26
NOTES: '1'he total working force in 1901 was put at 117,281,000; in 1951 at 141,351,000. The 1901 Popu-lation was 235,479,000; the 1951 Population 356,879,000. All 1901 data relate to the area of the present Indian Union, exclusive of Jammu and Kashmir, which was not included in the 1951 Census. Detailed figures for 1951 included estimates of earning dependents which were added to tne enumerated figures for self-supporting workers.
Source : India, Planning Commission (Labour and Employment Division) Occupational Pattern of Indian Union !rom·1901 (0 1951, New Delhi, 1951 (mimeograpbed ms:) Annexure I.
APPENDIX B
STANDARDIZBD SCORBS OF SBLBCTBD INDICES OF BCO_NOMIC DEVELOPMBNT FOR EIGHTEEN RE,GIONS OF INDIA
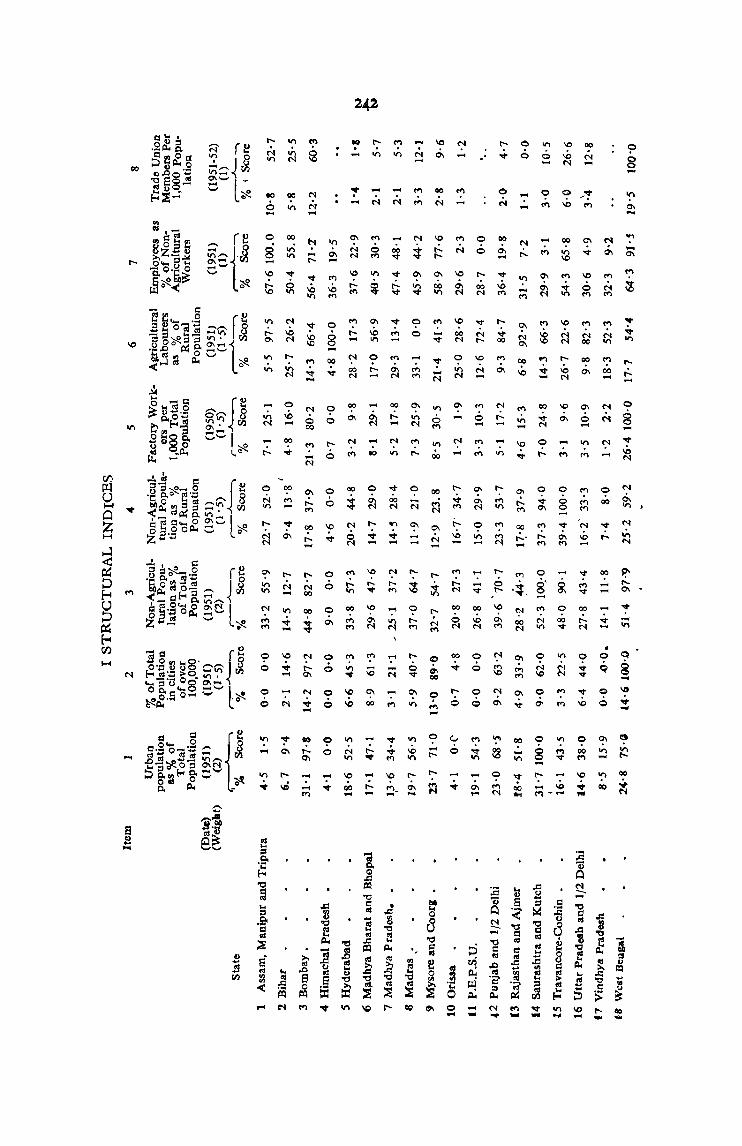
,...,
10
o .....
00
t=- "'"
o N .,.,
o o
o Q
" N ..... .,., -=t ,...,
o
8 ,...,
C? o
r--- 6 N
<?' 0
" 0 .....
o 6
o ~
N 0> ..". 6 ,...,
10 . ....
"'" . ....
.., " ....
10
00 ....
..... N
..... o ..,
... N
...
CI\ -=t 10 <"l .,., .....
r-....
N -
C? o ....
-=t
.,., o ..... .,., 00
'0 0 10 ..... '0 r--
r-<"l M
00
..;,.
I
o
.'
o o
roo N
o .;..
..... -=t
o 6
<? o
.....
o N
00
CI\ ,...,
<? ..... N
o 6
,..., ,...,
CI\
o ..... .,., ..,
t=-..... .....
<? 00
• o c:;>
0>
o
o
8
N
CI\ ..... N
.... N
-'0
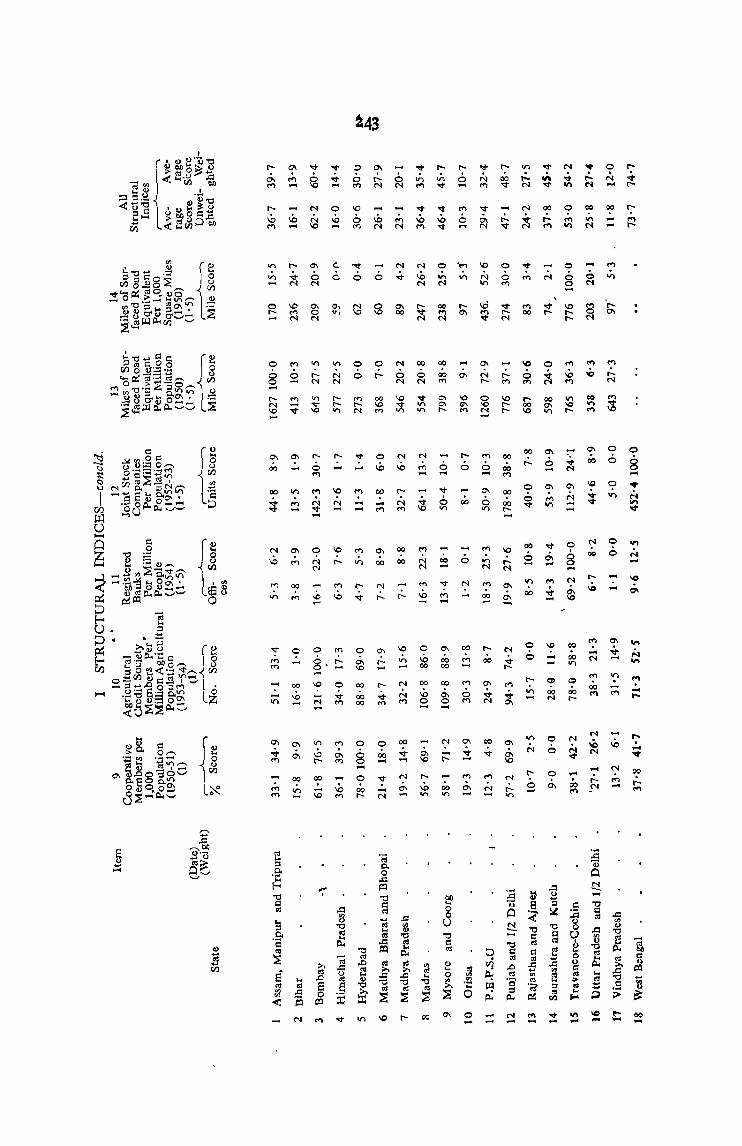
g ......
o o o ....
...... IF)
<"l
o ,....,
o
00
..0
00
IF) ....
N
o
'It
'It ... o 1,0 ...
Co
6.
0, V.
1,0
N ...
1,0
r:..
<"l
\0
g.r:.. .... 1,0 0 .-. 'It N ....
00
..... 1,0
.... \0 <"l
o 6
00
00 00
o
8 .... o 00 r-
00 1,0 ....
o ..0
00
.... <"l
.... N
....
0'1 00
N
o N
1,0 'It IF)
N 1,0
1,0
IF) .-.
00
'It ,...,
N
0'1 ....
'It
10 <"l
N 1,0 N
N
<"l ....
o 1,0 00
00
1,0 o ....
o .,., N
00 .... N
o .... 'It
o I{)
0'1
00 00
00
0\ o ....
N
00 Irl
~ o 8
ro ....
<"l
o ....
N
00 ..., .... <"l
o <"l
0\
'It .... M
0\ .-.
o
<"l
o .... 0'1
o IF)
<"l
N ....
00
00 .... 00
00 r-
<"l 00
10
o <"l
roo 10
00
r.:..
o o
t
o ......
00 0'\ I(')
0'\
o -
~ ... .-.
c:> 00 N
o 6
o 0'\
0\
N .... ...
o
8 ....
N
00
~ Q N -....
o N ...
o 6
o o
....
N
<"l ....
o
8 ...
on M ...
'" N
'" .., ... ....
.... . .... ..,
00
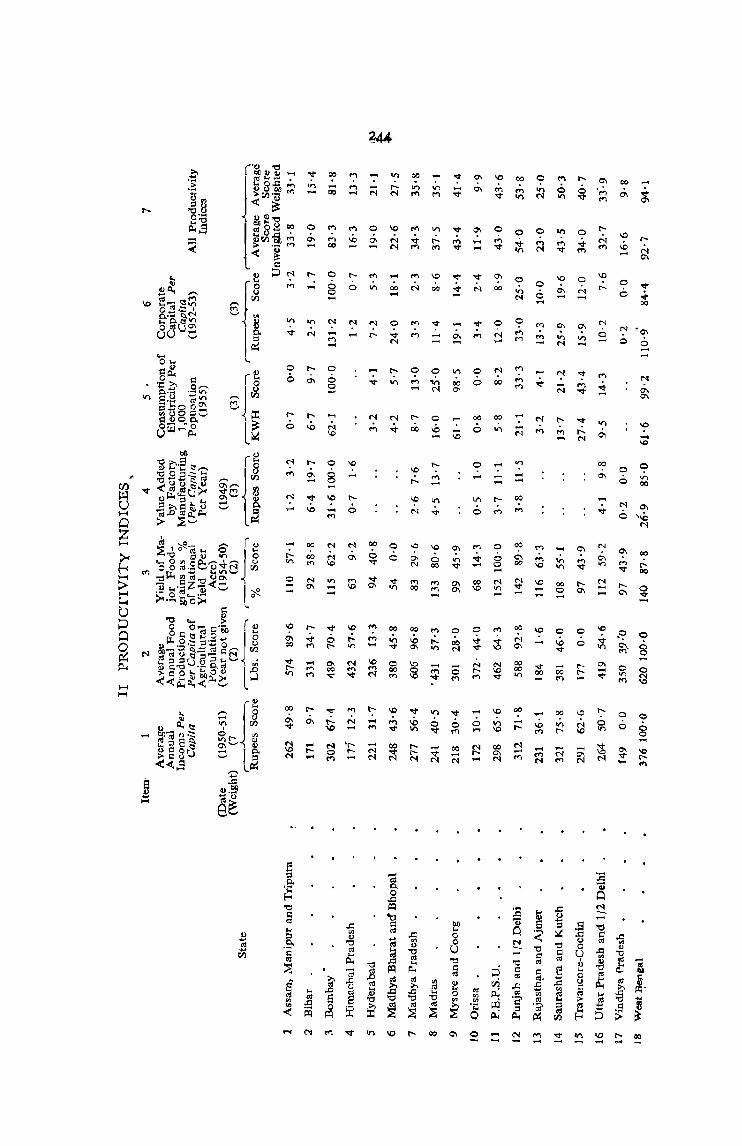
r:J) ~ U H
o Z H
H H
O? .... 00
o
8 ....
~ .... ... -o o o .... ,....
....
r- 0 \0
0\ ..... 8 -
.... N
o 0\ ....
.... 00 ....
o V N
00 0
Sf C
o 0 M "...
N
'? 00 N
.... o '"
00 .... N
0\
0\
o o
00
6
o
o ....
~ ....
o It) N
o
'" M
.... -00
'"
00
N
'" 00 00 It)
o It) N
o ... N
Ie ..... ....
10
....
.... o It)
....
00 o ....
o \0 V
..... 00 .....
.... N M
o o
N
o
N ....
o 6
N "", o 0 ..... -
o 6
10 .0
~ o
~. 8
o o
.....
o 8 ....

H H H
? r-. - '?
r-....
If">
o N
0\
0\
c 8 ....
o c o -
N o .....
00
N
'" N
I()
00 II)
0\ 0 o cO -
10
N -I/)
o ...
It') It')
v
.... N N
N
0\ -
00 N
N
o .....
....
0\ 10
II) .0 N
00 N _ r-. N
<I:l 10
o
o N N
10 o .:..
o o o
N
0\ ....
o
8 ....
o r-.,., o 0\
.:..
,M ~
- .... M N N ,...,
.... N
10
o "<t"
<'l --
o o
o II)
o 6
? o
$ o
o 6
o 6
o .... 00
10
00 It')
00
o r-
o
_ N <'l V I() 10 r-- 00 0\ 0 .... N ..... ~ I() 10 r- ~ 'II"""i. ,..... ~ ..,...., ""'"' """"" ,.... ......
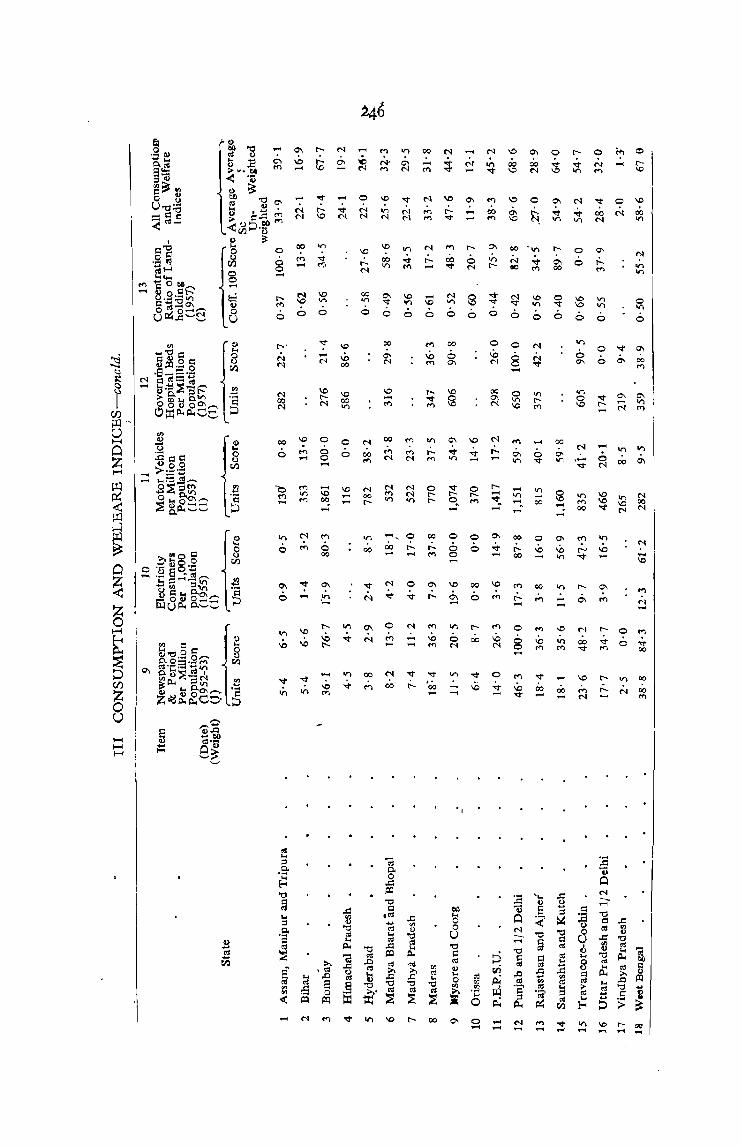
N 00 N
00
6
0'1
\D ......
M ......
o o o .... .... \0 00 ....
.... o 00
M
01 -.....
00 VI
6
00
00 M
0'1 \0 N .....
-, 0 00
r-M
00
o
8
\0
0'1 ....
......
......
...... -r-o N
o 6
00
6
r--00
""" \D
0'1 0 ......
00 'I/)
r-- ...... ...... on '<l;. ...... ......
0\ 00
""" r--...... 00
..... 0
\D 0 N 0
o M
""" \D ...... """
...... ......
I/) ...... 00
o -0
r--0'1 00
o v 6
? o
\D \D
6
11\ ......
-o N
\0
00 III
o 11\
o
N 00 N
\D r-- 00 ....

IY OVERALL SCORES
All Indices Combined 1
!hite Average Average
Score Score Unweighted Weighted
Assam, Manipur and Tripura 34'6 37'3
2 Bihar 19'2 15'4
3 Bombay 68'2 70·0
4 Himachal Pradesl. 19'0 15'4
5 Hyderabad 25'3 26·0
6 Madhya Bharat and Bhopal 24'7 29·3
7 Madhya Pradesh 23'9 28'5
8 Madras 35,,3 34'1
9 Mysore nd Coorg 46·9 43·9
10 Orissa 11'3 10·9
11 P.E.P.S.U. 34.6 40'5
12 Punjab and 1/2 Delhi . 56.8 57'0
13 Rajasthan and Ajmer . 24'7 27'2
14 Saurashtra and Kutch 43.6 52 '8
1-5 Tra vancore-Cochln 49.9 50'4
16 Uttar Pradesh and 1/2 Delhi 27.4 31'1
17 Vindhya Pradesh 9.8 8'3
IS West Bengal 70.1 78'~
247
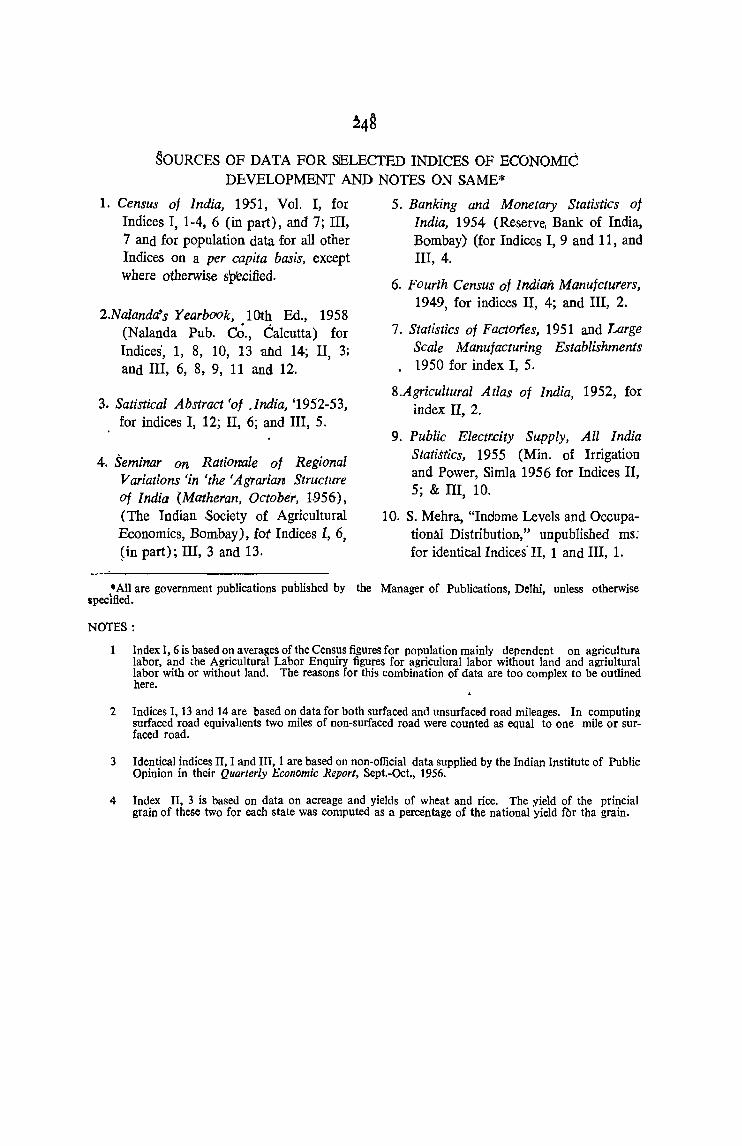
§OURCES OF DATA FOR SELECTED INDICES OF ECONOMIC DEVELOPMENT AND NOTES ON SAME*
1. Census of India, 1951, Vol. I, for Indices I, 1-4, 6 (in part), and 7; Ill, 7 and for population data for all other Indices on a per capita basis, except where otherwise s'plecified.
2.Naland«s Yearbook, 10th Ed., 1958 (Nalanda Pub. U;., Calcutta) for Indices', 1, 8, 10, 13 'aild 14; II, 3; and III, 6, 8, 9, 11 and 12.
3. Satistical Abstract (of .India, '1952-53, for indices I, 12; II, 6; and III, 5.
4. Seminar on Rationde of Regional Variations (in (the (Agrarian Structure Of India {Matheran, October, 1-956), (The Indian Society of Agricultural Economics, Bombay), fot Indices I, 6, pn part); ill, 3 and 13 .
5. Banking and Monetary Statistics of India, 1954 (Reserve, Bank of India, Bombay) (for Indices I, 9 and 11, and III, 4.
6. Fourth Census of Indian Manufcturers, 1949, for indices II, 4; and III, 2.
7. Statistics of Factones, 1951 and Large Scale Manufacturing Establishments
. 1950 for index I, 5.
8.Agricultural Atlas of India, 1952, for index II, 2.
9. Public Electrcity Supply, All India Statistics, 1955 (Min. of Irrigation and Power, Simla 1956 for Indices II, 5; & III, 10.
10. S. Mehra, "Indome Levels and Occupational Distribution," unpublished ms: for identical Indices'II, 1 and III, 1.
• All are government publications published by the Manager of Publications, Delhi, unless otherwise specified.
NOTES:
Index T, 6 is based on averages of the Census figures for population mainly dependent on agricultura labor, and the Agricultural Labor Enquiry figures for agriculural labor without land and agriultural labor with or without land. The reasons for this combination of dat-a are too complex to be outlined here.
2 Indices I, 13 and 14 are based on data for both surfaced and unsurfaced road mileages. In computing surfaced road equivalJents two miles of non-surfaced road were counted as equal to one mile or surfaced road.
3 Identical indices II, I and III, 1 are based on non-official data supplied by the Indian Institute of Public Opinion in their Quarterly Economic Report, Sept.-Oct., 1956.
4 Index II, 3 is based on data on acreage and yields of wheat and rice. The yield of the princial grain of these two for each state was computed as a percentage of the national yield for tha grain.

-,
BIBLIOGRAPHY
==_ -- -_ ~- ---==
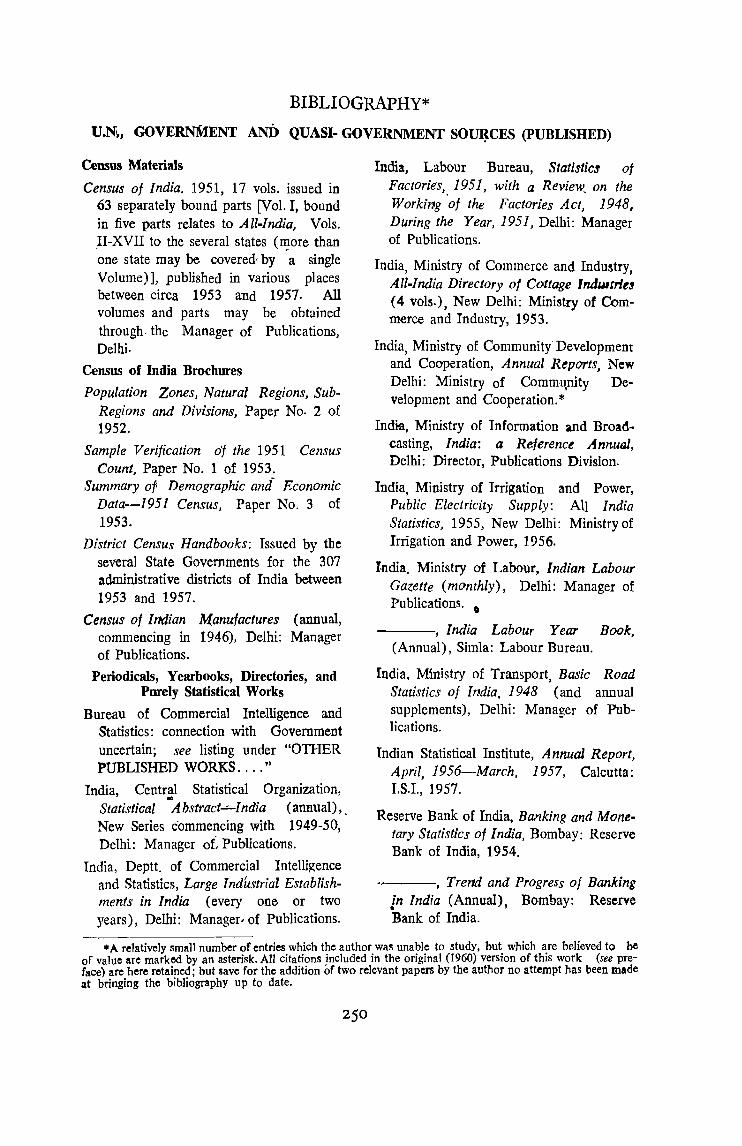
BIBLIOGRAPHY*
U.N~, GOVERNMENT AND QUASI· GOVERNMENT SOU~CES (pUBLISHED)
Census Materials
Census of India. 1951, 17 vols. issued in 63 separately bound parts [Vol. I, bound in five parts relates to All.India, Vols. H-XVII to the several states (lI!0re than one state may be covered- by a single Volume)], published in various places between circa 1953 and 1957. All volumes and parts may be obtained through. the Manager of Publications, Delhi.
Census of India Brochures
Population Zones, Natural Regions, SubRegions and Divisions, Paper No. 2 of 1952.
Sample Verification of the 1951 Census Count, Paper No.1 of 1953.
Summary of Demographic ani Economic Data-1951 Census, Paper No.3 of 1953.
District Census Handbooks: Issued by the several State Governments for the 307 administrative districts of India between 1953 and 1957.
Census of I11dian Manufactures (annual, commencing in 1946), Delhi: Manager of Publications.
Periodicals, Yearbooks, Directories, and Purely Statistical Works
Bureau of Commercial Intelligence and Statistics: connection with Government uncertain; see listing under "OrnER PUBLISHED WORKS .... "
India, Central Statistical Organization, Statistical "'Abstract-=-India (annual),. New Series commencing with 1949-50, Delhi: Manager of~ Publications.
India, Deptt. of Commercial Intelligence and Statistics, Large lndustrial Establishments in India (every one or two years), Delhi: Manager. of Publications .
India, Labour Bureau, Statistics of Factories,. 1951, with a Review, on the Working of the Factories Act, 1948, During the Year, 1951, Delhi: Manager of Publications.
India, Ministry of Commerce and Industry, All·India Directory of Cottage Indwtrit" (4 vols.) , New Delhi: Ministry of Commerce and Industry, 1953.
India, Ministry of Community" Development and Cooperation, Annual Reports, New Delhi: Ministry of Commu.nity Development and Cooperation. *
Indi-a, Ministry of Information and Broad· casting, India: a Reference Annual, Delhi: Director, Publications Division.
India, Ministry of Irrigation and Power, Public Electricity Supply: All India Statistics, 1955, New Delhi: Ministry of Irrigation and Power, 1956.
f.ndia, Ministry of Labour, Indian Labour Gazette (monthly), Delhi: Manager of Publications. 0
----, India Labour Year Book, (Annual), Simla: Labour Bureau.
India, Ministry of Transport, Basic Road Statistics of lndia, 1948 (and annual supplements), Delhi: Manager of Pub· Iications.
Indian Statistical Institute, Annual Report, April, 1956--March, 1957, Calcutta: I.S.I., 1957.
Reserve Bank of India, Banking and Monetary Statistics of India, Bombay: Reserve Bank of India, 1954.
~--. Trend and Progress of Banking in India (Annual), Bombay: Reserve Bank of India.
• A relatively small number of entries which the author was unable to study, but which are believed to be of value are marked by an asterisk. All citations included in the original (1960) version of this work (see preface) are here retained; but save for the addition of two relevant papers by the author no attempt has been made at bringing the bibliography up to date.
U.N. Stallstlcal Yearbook (Annual), Ne.w York: United Nations.
Reports of Special Commissions
India, Ministry of Commerce and Industry, Report of the Textile Enquiry Committee, New Delhi: Ministry of Commerce and Industry, 1958.'"
india, Ministry of Labour, Agriculture Labour Enquiry, Report on Intensive Survey of Agricultural Labour, Employ~ ment, Unemployment, Wages and Levels of Living, 7 vols., Delhi: Manager of Publications, 1955.
----, Rural Man~Power and Occupa~ tional StrJ,lcture, . Delhi: Manager of Publications, 1954.
India, National Income Committee, Final Report of the National Income Commit· tee, February, 1954, Delhi: Ma~ager of PUblications, 1954.
----, First Report of tke National Income Committee, April, 1951, Calcutta: Eka Press, 1951.
India, National Planning Committee, Land Policy, Agricultural Labour and Insurance (Report of the Sub-Committee), Bombay: Vora & Co., 1948.
----., Rural and Cottage Industries (Report of the Sub.Committee), Bombay: Vora & Co., 1948.
India, Planning Commission, The First FiveYear Plan Delhi: Manager of Publications, 1952.
----, The Second Five-Year Plan, Delhi: Manager of Publications, 1958.
----, Report of the Village and SmallScale Industries (Second Five· Year Plan) Committee (Karve Committee), Delhi: Manager of Publications, 1956.
Indian Statistical Institute, Annual Report, April, 1956-March 1957, Calcutta: . ' Indian Statistical Institute, n.d., c. 1957.
Reserve Bank of India, All-India Rural Credit Survey: Report of the Committee of Direction, Vol. I, The Survey Report (bound in two separate parts and vol. II, The General ReporO, Bombay: Reserve Bank of India, 1956 and 1954 respectively.
Other Government Textual Works, Published
District Gazetteers: issued under various titles, at various places (in the appropriate states or provinces of India), and at different dates, in many cases with several editions per district. (Most districts of India are covered. Early editions date from the late 19th century.)
The Imperial Gazetteer of India, 26 Vols., (Published under the authority of His Majesty's Secretary of State for India in Council) Oxford: The Clarendon Press, 1909 (New Edition); Vol. XXVI, Atlas, revised in 1931.
India, Labour Bureau and Labour and Employment Division, Planning Commission, Women in Employment {190I~'
1956) New Delhi: Planning Commis~ sion, 1958 (mimeographed).
India, Ministry of Labour, Economic and Social Status of Women Workers in India, Simla: Labour Bureau, 1953:*
India, Office of the Economic Adviser, Statistical Summary of the 'Social o/ld Economic Trends in India (in the InterWar Period) (S. Subramaniam, ed.) Delhi: Goverwnent of India Pr~s, 1945.
Indian Statistical Institute, History and Activities, 1931~1957, Calcutta: I.S.I., 1958.
International Labour Office, Labour Force Tabulations in Recent Population Censuses, Geneva: I.L.O., 1949.
---, The World's Working Population: I. Some Demographic Aspects, II. Its Industrial Distribution, III. Its Distribution by Status and Occupation
(AcpriIited from The International Labour Review, Vol. 73, Nos. 2 & 5, February & May, 1956, Vol. 74, No.2, August 1956), Geneva: I.L.O., 1956.
---, Preparatory Asiatic Regional Conference, The Economic Background l)f Social Policy Including Problems of Industrialisation, New Delhi: I.L.O., 1947.
National Council of Applied Economic Research, Techno-Economic Szuvey oj Bihar, Vol. I, Bombay: Asia Publishing House, 1959.
U:N., COmmittee of Experts Convened by the Secretary General, Report On International Definitions and Measurements 0/ Standards and Levels of Living, New York: United Nation.s, 1954.
U.N. Department of Economic Affairs, Land Reform-Defects in Agrarian Structure as Obstacles to Economic Development, New York: United Nations, 1951.
U.N.E.S.C.O., Traditional Cultures In
South-East Asia, Madras: Orient Longmans, 1958.
U.N. Statistical Office, National Income and its Distribution in Underdeveloped Countries, New York: United Nations, 1951:*
Atlases and Maps
Bombay .state, Secretariar,- Bureau of Economics and Statistics, Statistical Atlas of Bombay State (Provincial Part), Bombay: Government of Bombay, 1950 (Rev. Ed.)
District Road Maps, various dates and • scales, Public Works Departments of the several Indian States.
llal/-Inch Series (2 miles per inch) Survey of -India, various dates.
Indil1 and Adjacent Countries, 1: 1,000;000, Survey of ' India, various dates.
India -and Pakistan, 1 !250,000, (Series u-502), U.S. Army· Map Service, various dates.
India, Ministry of Food, and Agriculture, Indian Agricultural Atlas, Dehra Dun: Survey of' India, 1952~
I
India, Ministry of Information. and Broadcasting, India in Maps, New Delhi: Ministry of Information and Broadcasting, 1950.
Iudia, Ministry of Irrigation and. Power, Central Water and Power Commission, Power Atlas of India, New Delhi: Ministry of Irrigation and Power, 1956.
India, National Atlas Organization, National Atlas of India (S. P. Chatterjee-Ed.) Calcutta: National Atla~ Organization, 1957.
India, Showing Forests, lrrigation, and Water Power, 70 miles p~r inch, Survey of India for the Regisirar General, 1955.
Madras State, Directorate of Information and Publicity. Madras in Maps ana Pictures. Madras: Government of Madras, 1955 (2nd Ed.)
Map of India Showing Community, Development and National Extension Service Blocks, scale not indicated, Ministry of Information' and Broadcasting, circa.: 1957.
Quarter-Inch Series, 4 miles per inch~ Survey of India" various. dates.
Railway Map of -India, 67 miles per inch, Survey of India~ 1957.
Road Map of India, 40 miles per inch, Survey of India, 1958 (2nd Ed.)
Tribal Map of .India, 80 miles per inch, Department of AnthfQPo~ogy, Government of India, 1956.
West Bengal, State Statistical Bureau, StatistiGal Atlas, West Bengal, Calcutta: • Government of West Bengal,. 1953.
253
OTHER PUBLISHED WORKS, EXCEPT FOR ARTICLES
Dealing with Economic Development in "General
Adler, John H. The Underdeveloped Areas: Their Industrialization. New Haven, Conn: Yale Institute of International Studies (Memorandum No. 31), 1949.*
Agarwala, 'A.N. and Singh, ,S.P. (eds.). The Economics of Underdevelopment. London: Oxford. University Press, 1958.
Aitken, Hugh, G:J.' (eel.). The State and Economic Growth: Pap!~rs of a Confer
'ence-Held on October 11·13-1:956, under the Auspices of 'the Committee on Economic Growth. New York: Social Science
, Reseatch Council, 1959.
Bauer.' P.T. Economic .A.nalysis and Policy in Underdeveloped Countries. Durham, N.C. : Duke University Press, 1957.*
----,.and Yamey, B.S. The Economics of Underdevelpped Countries. London: James Nisbit.& Co., Ltd., 1957.
Bonne, Afred. Studies in Economic D£!velopment, with Special Reference to conditions in the Underdevelope_d Are~ of Western Asia and India. London: Routledge & Kegan Paul, Ltd., 1957.
Buchanan, Norman S. and Ellis, Howard S., Approaches to Economic Development, New York: The Twentieth Century Fund, 1955.
Chipman, J.S. The. Theory of Inter-Sectoral Money Flows and Income Formation (The Johqs Hopkins University Studies in Historical and Political Science-Series 68. No.2, 1950) Baltimore: The Johns Hopkins Press, 1951.*
Clark, Sir Colin. The Conditions of Economic Prof/ress. London: Macmillan & Co., Ltd., lSMO (lst Ed.) and 1957 (3rd Ed.).
Fisher, A.G.B, Economic Progress and Social Securijy. London: Macmillan & Co, Ltd., 1945.
Galenson, Walter (ed.). Labor and Economic Development. New York: Longmans Green & Co., 1959.
Ginsburg, Norton (ed.). Geography and Economic Development. Chicago: The University of Chicago Press (Dept. of Geography Research Paper No. 62), 1960.
Hazlewood, Arthur. The Economics of "Under-developed" Areas: An AnnotaDed Reading List of Books, Articles, and Official Publications. London: Oxford University Press, 1959 (2nd Ed.).* ,
Higgins, Benjamin H. Economic Develop- • ment: Principles, Problems, and Policies. New York: W.W. Norton & Co.,. Inc., 1959.
HoseIitz, Bert F. (ed.). The Progress of Under-developed Areas. Chicago: University of Chicago Press"1952.
Kiildleberger, Charles. P. Economic Development. New York: McGraw-Hill Book Co., 1958.
K uznets, Simon S. Quantitative Aspects of the Economic Growth of Nations, four individually bound supplements to' Ec momic Development and Cultural Change: I. "Levels and Variability of Rates of GroWth", Vol. V, No, 1 .. Oct., 1956; II. ~'Industrial Distribution of National Product and Labor Force," Vol. V, No, 4, July, 1957: III. "Industrial Distribution of Income and Labor Force bv States; United States. 1919-1921 to 1955"; Vol. VI, No.4, July, 195.8; and IV, "Distribution of National Income by Factor Shares," Vol. vn, No.3, April, ~S9.
Lebret, Louis-Ioseph. Guide Prdtique de l' Enquete'Sociaie, 4, vols. Paris; Presses UniversitaIre de France, 1951-58.
--- et ala Economie et Civilizatitm; Tome I, Niveaux de Vie, Besoins et Civilization, Tome II, Science Ecollomique et Development Paris: Les Editions Ouvrieres, Economic et _Huma~ nisme, 19~6 and 1958.
Leibenstein, Harvey. Economic Backwardness and Economic Growth: Studies in the Theory ·of Economic Development. New York: John Wiley &: Sons, Inc., 1957.
---, A ,Theory of ECOlWmic and Demographic Developme1lt. Princeton: Princeton University Press, 1954.
Lewis, W. Arthur. ,!he Theory of Economic Growth. Homewooa, Ill; Richard D. ·Irwin, Inc;, 1955 ..
Meier, Gerald M. and Baldwin, Robert E. Economic Development: Theory, History, Policy. New. York: John Wiley & Sons, 1957.*
MYrdal, Gunnar. Economic Theory and Underdeveloped Regions. London: .G. Duckwqrth, 1957.
Niirkse, Ragnar. Some Aspects of Capital Formation in Underdeveloped Countries. Cai~o: National Bank of Egypt Printing Pr~ss, 195~.
. Office of Population Research, Princeton UniverSity. A 'Theory of Economic Demogra/)hic Development. Princeton: Princeton University Press, 1954.'"
Pigou, A.C. The Economics of Welfare. London: MacMillan & Co" Ltd., 1952.
'Shannon, Lyle W. (ed.). Underdeveloped Areas: a'B'ook of Readings and Research. New York: Harpers, 1'957.
I
Singh, Baljit. Federal Finance and {Jnder~ dey-eloped Economy. Boml?ay; Hina Kitabs. 1952.
"Tiliard, Henry H. Economic Development, New York: Rinehart & Co., ~nc.,.. 1959.*
Williamson, Harold Francis ana Buttrick, John A. (eds.). Economic Development: Pr;nciples· and Patterns. New York: Prentice-Hall, 195,4. *
Woytinsky, W.S. and Woytinsky, E.S. World Population and Production. New York: Twentieth Century Fund, 1953-
General Background Works on India
Alsdorf, Ludwig. VortJei-indien: Bha;at, ·Pakistan, Ceylon, ..eine Landes-und Kulturkunde. Braunschweig, Germany: Georg Westermann Verlag, 1955. "
Binani, G.D. and Rama Rio, T.V. (eds.), India at a Glance: A Comprehensive Reference Book on India. Calcutta: Orient Longmans, Ltd., 195'4 (Rev'-Ed.).
"Davies, C. Collin. An Historical Atlas of the Indian Peninsula. Madras: Ge~ffrey CumberIege, Oxfprd University, 'Press, 1954 (rev. ed.). .
Davis, Kingsley. The Population.of India a'ld Pakistan Princet€ln: Princeton University Press, 1951.
Ghosh, K.C. Economic Resources of India a~d Pakisfan. Calcutta: K.P. Basu Publishing Co., 1956.·
Lothian, Sir AC. (ed,). A Handbook for TrlJvellers in India, Pakist(ln, Burma .and qeylon. London: John Murray, 1955 (17tn Ed.).
Majumdar, RC. (ed.). :I'he History antl Culture of the indian People,. 5 yols. Bombay: Bharatiya Vidya Bhawan, 1957.*
---, Raychaudhurl, H.C. and Datta, Kalikinkar. An Advanced History of India. London; MiwMillan & Co., Ltd" J9'~,
Nalanda Yearbook-and Who's Who in India and Pakistan (Tarapada Das GuptaEditor): (annual). Calcutta: Nalanda Press.
Nanavati, Sir Manilal B. (Ed.). lndia Speaking, 'Vol. 233 of TI?e Annals of the American Academy of Political and Social Science, May, 1944.
Oxford Pamphlets On Indian Affajrs, 19 Vol. London: Oxford University Press, 1943-45.
Sovani, N.V. The Population Problem in India: A Regional Approach. Poona: Gokhale Institute of Politics and Economics (Pilb!. No.8), 1942.
Spate, O.H.K. India and Pakistan: A General and Regional Geography. London: Methuen & Co. Ltd., 1954.
Stamp, L. Dudley. India, Pakistan, Ceylon 'tJ1'Kf Burma. London: Methuen & Co., Ltd., 1957.
The Times of India Directory and Year Book, Including Who's Who (N.J. Nanporia-Editor) (annual). Bombay: The Times of India. *
University of Chicago, The College. Introduction to the Civilization of India: Emergence of India and Pakistan into the Modern World. Chicago: Syllabus Division, University of Chicago Press, 1957.
Woytinsky, W.S. India: The Awakening Giant. New York, fIarper & Bros.,
.1 957.
Primarily Economic Works OD hulia'
Akbil Bharat Sarva Seva Sangh Prakashan. Planhing for Sarvodaya. Wardha: Sarya Seva Sangh, 1958 (2nd Ed.).
A.nstey, Vera. The Economic Development l>f bidia. 'New York: Longm&bs, Or~n " Co" 1'952 (4th Bd,),
255
Baden-Powell, Baden Henry. A Short Account of the Land Revenue and Its Administration in Rritish India, Oxford: The Clarendon Press, 1913 (2nd Ed.).
Balakrishna, Ramachandra. Measurement of Prrductivity in Indian Industry. Madras: University of Madras (Economics Series No.8), 1953.
---. Regional Pla1J1ling ill India Bangalore: Bangalore Printing and Publishing Co., 1948.
Balkrishna Kelkar, Vasudev. Industriai Decline in India. Allahabad: The Star Press, 1917.
Banerjee, Pramathanath. A Study of Indian Economics. Calcutta: University of Calcutta, 1951 (6th Ed.).
Brush, John. Aboriginal Tribes (Including Tribal Hindus and Trlbal Christians) 1947. (Map on file at the Library of Congress).
Buclianan, Daniel H. Development of Capitalistic Enterprise in India. New York: MacMillan & Co., 1934.*
Bureau of Commercial Intelligence and Statistics. Basic Statistical A~lysis of India. Bombay: Bureau of Commercial Intelligence and Statistics, circa: 1955, (4 folios of unbound mimeographed sheets).
Coale. Ansley and "Hoover, Edgar M. Population Growth aw Economic Deve' lopment in Low-Income Countries: A Case Study of India's Prospects. Princeton: Princeton University Press, 1958 .
Crane, Robert I. Aspects of Economic Development in S(Juth Asia. New York: Institute of Pacific Relations, 1954.
Dandekar, Vishnu Mahadeo. Use of Food Surplu~es for Economic D'evelopment (Gokhale Institute of P"olitics' and EconomIcs Pube. No, ~3), Po6nil: D.R, Qadgil, 1956.
Das, Nabagopal. Unemployment, ,Pull Employment and India. Bombay: Hind Kitabs, 1946.
--. Studies in I~dian Economic Problems. Calcutta: A. Mukherjee, 1954.*
Desai, M.P. (ed.). Planning for Basic National Recovery. Ahmedabad: Navajivan Publishing House. 1957.
Desai, R.C. Standard of Living in India and Pakista~, 1931-32 to 1940-41, Bombay: Popular Book Depot, 1953.
Dutt, R. Economic History of India, 2 Vols. London: RoutlecTge_ & Paul, 1950 (7th Ed.)*
Ford Foundation, Intern~ational Planning Team. Report 011' Small Industries in India. New Delhi: Government of India, Ministry of commerCe and Industry,
11955.
Gadgil, D.R. Economic Policy and Development: a Colle:ction of Writings [all by the author] (Gokhale In'Stitute of Politics and Economics, No. 30). New York: Institute of Pacific Relations, 1955.
--. The'Industrfal Evolution of' India in Recent Times. Bombay: Oxford' University' Press, 1948.
--. Origins ~f the Modern Indian Business Class. New York: Institute of Pacific Relations, 1959, 46 pp.*
Gandhi, M.K. Cent' per Ce.1)t Swadeshi; OT
'the Economies of Village Industries· Ahmedabad: Navajivan Press, 1948 (3rd Ed.).
'Ganguli, Birentlra Nath. Trends of ,If~"
culture and 'Population in the Ganges Valley. London: Methuen & Co., 1938.
Ghate, B.O. Changes iir·the" Occupational Distribution of the Popuit,ltion. (Studies in Indiarl Economics issued by the Office of the Economic Adviser 'to the' Gpvern·
ment of, India, Second Series: Aspects 01 Indian Social Economics, No.1). New Delhi; Government of India Press, 1940.
Ghosh, D. Pressure of Population and Economic Efficiency in India. New Delhi: Indian Council of World Affairs, 1946.
Indian Industries. Large Industrial and Commercial Establishments. Bombay: Kailash Chandra Agarwal, 1956.
Indian Society of Agricultural Economics. Land Tenures in India (Reprinted from the Indian Famine Commission's Report, Vol. II, Pt. IV). Bombay: Vora & Co., 1946.
--. Seminar on Rationale. of Regional Variations in Agrarian Structure of India (Matheran, October, 1956). Bombay: Indian Society of Agricultural Economics, it.d., c. 1957.
Indian Textile Engineers, Ltd. Map of India Showing Every Town in 'Which Cotton Mnls are Situated with the Number of Spindles and Looms Installed on 1st January, 1946. Bombay: Indian Textile Engineers, Ltd., circa 1946 (map).
Jathar, G.B. and Beri, S.G. Indian Economics. London: Oxford University Press, 1952 (9th Ed.).
Kuchhal, S.C. The Industrial, Economy of India. Allahabad: Chaitanya Publishing House, 1959.*
Kuznets. Sinton; Moore, Wilbert E., and Spengler, Joseph J. Economic Growth: Brazil, India and Japan. Durham, N.C.: Duke University Press, 1955.
Lorenzo, A.M. Agricultural Labour Conditions in Northern India, Bombay, New Book Co., Ltd., 1947.
--. Indian Labour in Primary I1tdustries, Lucknow: Universal' Publishers,' 1948.
tuthra, KL. Impact of Partition on Industries in Border Districts of East Punjab. N.p., East Punjab: The Board of Economic Enquiry (Pub. No.1), 1949.
Mehta, M.M. Structure of Indian Industries: A Statistical StuPy in the Size Location and Integration of Industrial Units in the Seven Selected Industries of India, viz., Cottpn, Jute, Sugar, Iron and Steel"Coal, Paper, and Cement. Bombay: Popular Book Depot, 1955.
Mukherjee, Radha Kamal. Fields and Farmers in Oudh. Calcutta: Longmans Green & Co., Ltd., 1929.*
--. The Indian Working Class. Bombay: Hind Kitabs, 1951. (3rd Ed.).
Mukherjee, Ramkrishna. Dynamics of a R>ural Society; a Study 9f the Economic Structure in Bengal Villages. Berlin: Akademie Verlag, 1957.*
Myers, Charles Andrew. Labor Problems in the Industrialization of India. Cambridge, Mass.: Harvard University Press, 1958.
Namjoshi, M.V. Planes of Living: Two Papers (Part 1. "Economic Development and Planes of Living", 'Part II. "Some Indicators of the Plane' of Living in India") New York: Institute of Pacific Relations (I.ndian Paper No.5), 1954. (Mimeograpbed) .
Nanavathi, B. Manilal and Anjaria, J.J. The Indian Rural Problem. Bombay: The Indian Soviety of Agricultural Economics, 1947 (3rd Ed.).*
Narain, Brij. Indian Economic Life, Past and Present Lahore: Uttar Chand Kapur & Sons, 1929.
Omati, Oscar A. Jobs and Workers in Incfi.a Ithaca, N.Y.: The Institute of International Industrial and Labor ReLl.tions, Cornell University, 1955.
Owen, Rowland. India: Eeonomic' ana· Commercial Conditions in India (in series of Overseas Economic Surveys issued by the [U.K.] Board of Trade, Commercial Relations and Exports Department). London: H.M.S.O., 1953.
Plantations in India's Economy. Madras: United Planters' Association of Soutbern India, 1955.
Rao, B.S. Surveys of Indian Industries, 2 vols. Bombay: Oxford University.Press, 1957-58.*
Rosen, George. Industrial Change in·lndia: Industrial Growth, Capital Requirements, and Technological Change, 1937-1955. Glencoe, Illinois: Tlle Free Press, 1958 (for the Center for International Studies, Mass. Institute of Technology).
Sharma, Tulsi Ram. Location of Im!ustries in India. Bombay: Hind Kitabs. 1954 (3rd Ed.)
Singh, Baljit. Economic Planning in India. Bombay: Hind 'Kitabs, 1953.
Singh, Tarlok. Poverty and Social Change: A Study in thte Economic Reorganization of Indian Rural Society. London: Longmans, 1945.
Savani, N.V. Pltmning ot Post-War Ecommic Development in India. Poona: Gokhale Institute of Politics and Economics, 1951.*
--. Poona: A Resurvey; -The Changing ~
Pattern of Employment and Earnings, Poona: D.R. Gadgil, 1956.
Thakurdas, Sir Purshatamdas et al. A Plan of' Economic Development for India, 2_ Parts. London: Penguin, 1945.
Thorner, Daniel. Agrarian Prospect in India. Delhi: University of Delhi, 1956.*
Vakil, C.N. Economic Consequences of Divided 'India: A Study of :the Economy of India and Pakistan. Bomb~y: Vora & COo, 1950.
Venkatasubbiah, H. Indian Economy Since Independence. Bombay: Asia Publishing House, 1958.'"
Wadia, P.A. and Merchant, K.T. Our Economic Problem. Bombay: New Book Co., 1957 (5th Ed.).
Primarily Cultural and/or Anthropological Works OD India.
Bailey, F.G. Caste and the Economic Frontier: a Village in Highland Orissa. Manchester: Manchester University Press, 1957.
Beidelman, Thomas. A Comparative Analysis of the Jajrnani System. (Monographs of the Association of Asian Studies, 8) Locust Valley, N.Y.: Association of Asian Studies (Monograph 8), 1959.
Dube, S.c. Indian Village. London: Routledge & Kegan Paul, 1955.
--. India's Changing Villages. London: Routledge & Paul, 1958.'"
Ohurye, G.S. Caste am Class in India. Bombay: Popular Book Depot, 1957.
Hutton, J.H. Caste in India. Cambridge, England: University Press, 1946.'"
Karve, Irawati. Kinship Organization in India. Poona: Deccan College' Research Institute, 1953.
Kitts, Eustace J. A Compendiwn of the Castes and Tribes Foultd in India. Bombay: The Education Society'S Press, BycUlla, 1885.
Lewis, Oscar. Village Life in Northern India. Urbana, ill.: University of Illinois Press, 1958.
.Majumdar~ D.N. Races and Cultures of India. Bombay: Asia Publishing House.
_ (ed.), Rural Profiles. Lucknow: Ethnographic and Folk Culture Society,
I
1955.
Marriott, McKim (ed.). Village Indlla: Studies in the Little Community. Chicago: University of Chicago Press, 195.5.
Pittman, G.P. Village India. London: Marshall, Morgan and Scott. 1951.*
Prabhu, Pandhari-Nath. Hindu Social O~ganization: A Study in Social-Psychological and Ideological Foundations. Bombay: Popular Book Depot, 1954.
-Risley, Sir Herbert H. The People of India,
London: W. Thacker & Co., 1915 (2nd Ed.).
Senart, Emile. Caste in India: The Facts a.nd the System (Translation by Sir E. Denison Ross). LQndon:· Methuen & Co., Ltd., 1930.
Singer, Milton (ed.). Traditional India: Structure and Change. Special No. of lournal of American Folklore. Vol. 71, July-Sept., 1958, No. 281.
Singh, Mohinder. Tf4e Depressed Classes: Their Economic and Social Conditioris. Bombay: Hind Kitfl,bs, 1947.
Srinivas, M.N.· (ed.). India's Villages: A Collection of Articles Originally Published in the Economic Weekly of Bombay. Calcutta: West Bengal Government Press, 1955.
Subbarao, Bendapudi. The Personality of India: Pre- and Proto-Historic Foundatian of India and Pakistan. (M.S. University Archaeology Series No.3) Baroda: Faculty of Arts, Maharaja Sayajirao University of Baroda, 1958.
Thomas, P. Hindu Religion, Customs and Man';ers Bombay: D. B. Taraporevala Sons & Co., 1956 .
Thomas, PJ. and Ramakrishnan, K.C. .. Some South Indian Villages: A Resur
vey. Madras: University of Madras,
1940.
Wiser, William H. the Hindu lajmani System. Lucknow: Lucknow Publishing House, 1936.
--, and Wiser, Charlotte V. Behind Mud Walls. New York: R. R. Smith, Inc., 1930.
Other works on India
Chatterjee, S.P. Bengal in Maps. Calcutta: Orient Longmans, 1948.
Damodar Valley Corporation. D·V.C. Projects at a Glance. Calcutta: Ama! Home, Chief Information Officer, D.V.C 1956, with subsequent addenda.
Dayal, P. Bilzar ill Maps, with Explanatory Text. Patna: Kusum Prakashan, 1953.
Day, LaI Behari. Govinda Sanumta, Or
Bengal Peasant Life London:. MacMillan, 1906.
Hart, Henry C. Ne~ Indids Rivers. Calcutta: Orient Longmans, 1956.
india's Crafts Today. Special Number oI. Craft Horizons. Vol. XIX, No.4, JulyAugust, 1959.
Joseph, S.c. Kerala, the Communist State. Madras: The Madras Premier Co.
Premchand. Godan: a Novel of Peasant India, translation by Jai Ratan and P. LaI. Bombay: Jaico Publishing House, 1958.
Swarup, Shanti. The Arts and Crafts of India and Pakistan. Bombay: Taraporevala's Treasure House of Books, 1957.
Taylor, Carl C. A Critical Analysis oj Indids Community Development Programme. Delhi: Community Projects Administration, 1956.·
Miscellaneous
Arras over Sverige. Stockholm: Svenska
.259
Siillskapet for Antropologi oeh Ge,ografi, 1957.
DucoiI, Louis Joseph and Hagood, Margaret J. Labor Force Definition and Measurement: Recent Experience in the U.S. New York: Social Science Research Council, Committee on Labor Market Research (S.S.R.C. Bulletin No. 56), 1947.
Fiach, Vernor C. Montfort-A Study ot, Landscape Types in Southwestern Wiscon~in. Chicago: Geographic Sodety of Chicago (Bulletin No.9), 1933.
H<l;rlshorne, Richard. Tile Nature of Geography: A Cmical Survey of Current Thought in the Light of the Past. Lancaster, Pa.: AssociatiOn of American Geographers, 1939.
--. Perspective OIL the Nature of Geography, Chicago: Rand McNally & Co., 1959.
James, Preston E. and Jones, Clarence F. (eds.). American Geography: Inventory and Prospect. Syracuse, N.Y.: Syracuse University Press, 1954.
Mukherjee, P .K. Economic Surveys in Under-developed Countries: A Study in Methudology. Bombay: Asia publishing House, 1959.
PIaU, Robert S. Latin America;.. Countrysides and United Regions. New York: Whittlesey House, McGraw-Hill Book Co., Inc., 1943.
Schwartzberg, Joseph E. Levels 0/ Econo. mic Development (World map). Madison, Wisconsin: privately published,. 1957.
Warriner, Doreen. The Economics of Peasant Farming. London: Oxford University Press, 1939.

260
PUBLISHED ARTICLES
Not Speyifical1y Relating to India
Bauer, P. T. '.lnd Yamey, B.S. "Economic Pro,&ress and Occupational Distribution," The Economic Journal, Vol. LXI, 1951, 'p'p. 740-755.
--. "Further Notes 'On Progress and Occupational Distd'Jution," The Econo
mic Journal, Vol. LXIV, 1954, p. 106.
Bennet, M.K. "International Disparities in Consumption Levels," American Economic Review, Vol. 41, Sept., 1951, pp. 632-649.
--. "On Measurement of Relative N ationa! Standards of Living~' Quarterly Journal of Economics, Vol LI, February, 1957, 'PP. 317-35.*
Celestine, G. "Dynamique des Niveaux de Production et de Pioductivite." Econo
mie et Humanlsme, July-August, 1952, pp. 60-67.*
"Changes in Employment Structure in Latin A merica, 1945-1955 .. " Economic Bulletin for Latin. An:zerica, Vol, II, No.], FcbrJlary 1957, pp. 15-42.
Davis, S.J. "Standards and Content of Living," America11;. Econnmic Review,' XXX-V, March, 1945, l?P. 1-15.
Faulhaber, Robert. "Notes sur Ie Secteur Priml1ire en Economie. Rumaine," Econom:ie et Humanisme, Vol. XII, No. 80, July-August, 1953, pp. 18-10.
Fisher, AG.B. "A Note on Tertiary Production," Economic Journal, Vol. 62, 1952, ptp. 820-834.
--. "Production, Primary, Secondary, and Tertiary," Economic Record, June, 1939, pp. 24-32. *
Ginsburg, ~orton. "Editorial", Economic Development and Cultural Change, Vol. VII, No.2, June, 1959, p. 97.
--. "Natural Resources and Economic Development." Annals of the A.A.G., Vol. 47, No.3, September, 1957, p'p'. 197-212.
Hazari, R.K. "Plurality as Underdevelopment", I'he Indian ECOlwlnic iuu/'nal, Vol. VI, No. I, July 1958, pp. 73-96.
Herman, Theodore. "The Role of Cottage and Small-Scale Industries in Asian Economic Development," Economic Development and Culfural Change, Vol. 4, No.4, July, 1956, pp. 356-370.
Hoselitz Bert. "Generative and Parasitic Cities," Economic Development and Cultural Change, Vol. III, No.3, April, 1955, pp. 278-294.
--. "Non-cconomic Factors in Economic Development," American Economic Review, No!. 47, May, 1957, pp. 28-41.
-- "Patterns of Economic Growth", Canadian Jo~rnal of Economics and Political Science, Vol. 21, pp. 416-431. (Nov., 1955) *
HO~ll Elizab.cth E. "Want Development in Ulldet:dcveloped Areas", Journal oj Political Economy, I.IX, Jnne 1951, pp. 194-202.
Lebret L. J. and Delprat, R. "Niveaux de Consonullation et de Production dans les Dix Zones du Monde. Economiie et HUlllanisme, Vol. XI, No. 74, JulyAugust, 1952, pp. 22-53.
Millikan, Max F. "Economic Thought and Its Application and Methodology in India," American Economic Review XLVl Nc.<· 2, May, 1956, pp. 399-407.
.Mooe, Wilbert E. "The exportability of the 'Labor Force' Concept," American
Sociological Review, Vol. 18, No.1, February, 1953, pp. 68-72.
"--. "Persistent Problems of LlIbor Force Analysi~," Pppu/ation Index, Vol. 17, April, 1951, pp. 78-96.
.KiXOI1, James, W. "Census Statistics of t111.: Population Dependent on Various Types of Economic Activities," U.N. Population Bulletin, No.3, Octoher, 1953, pp. 17-29.
Ramakrishna, M. "Census Economic Classification," The Economic Weekly, Vol. XI, Nos. 1 (pp. 21-23) and :2 (pp. 48-50), January 3 and 10, 1959.
,Robinson, Arthur H. "T'he Necessity of Weighting Values in Correlation Analysis of Areal Data," A nnals of the A ssocialion of A meriran Geographers, Vol. 46, June, 1956, No.2, pp. 233-236.
"The Role of Cities in Economic Development," for a series of papers on this subject see Economic Developme.nt and Cultural Change. Vol. 3, Nos. 1-3, OctoJ
ber, 19.54 and January and April, 1955:
Rostow, Walt Whitman. "Rostow on Gr.Jwth-a Non-Communist Manifesto," The Economist, Vol. 192, Nos. 6051 and 6052, 15 Aug., 1959, pp. 409-10, and 22 August 1959, pp. 524-31.
Rottenberg, Simon. "Note on 'Economic Progress and Occupational Distribu-t · '" R' f E . ..J (' • Ion , eVlew 0 canomlcs an.·l "tatls-tics, May, 1953, pp. 168-170.
Salz, Arthur. "Occupation," Encyclopaedia of the Social Sciences, Vo1. 11, pp. 424-435. New York: The MacMillan Co., 1933.
Sauvy, Alf.red. "Introduction a I'Etudo des Pays Sous-Deve10t1P'es," Population (Paris), Vol. 6, 1951, No.4, pp. 601-608.
"Progres Technlque et Repartition Professionel1e de la Population," POPlIlation (Paris), Vo1. IV, 1949, 't\Jo. I, pp. 5.7-67.
Schatz Sayre P. "A Dual-Economy Model of an Under-developcc1 Country," Sodal Re<:earch. Vol. 3. 1956, pr. 419-43';
Sengupta, Jati Kumar. "On the Relevance of the Sectoml Concept in the Theory of Economic Development," The Indian Economic Journal, Viol. vr, No.1, July. 1958, pp. 50-01.
Singer, H. W. "Economic Progre3s in Under-Developed Countries," Social Research, Vol. 16, March, 1949. p. 2 ff.
Spengler. Joseph J. "Economic Factors in Economic Deve1o'p'ment," American Enmomic Review, Vol. 47, May, 1957, pr. 42-56.
_- . "Economic Factors in the Development of Densely Poplllate,d Areas," Proceedings of the A mer.ican Philosophical SOciety, Viol. 95, No.1, Fehmarv 13. 1951, pp. 21-24. .
Srinivas, M.N. 'Village Studies and Their Significance," The Eastern A nthropo[ogist. Vol. VIII. Nos· 3 and 4, MarchAngu"t 195R, P'ft 215-2,}R.
Triantis. S.O. "Economic Progres~. Occnpational Redistribution and the Terms of Trade," The Eronomir JOllrnal, Vol. 63, 1953, pp. 627-637.
White, C. Langdon. "fndustrioalization: A Panacea for Underdeveloped Nations?" Yearhook of tire A ssoriaf;o}} of Pacifi(' Coast Geof{raphers, Vol. 17. 1955. pp. 3-20·
"The World's Underdeveloped Lands." Poms, Vol. X. No.1, September, 1959.
Wolfe. Martin. "Conce'p't of Economic Sectors." Quarterly Journal of Eronnmirs. Vol. 69, 1955, pr. 402-420.
Yatsushiro Toshio. "Economic Development and Culture Dynamics-Some Observations from Anthropology Relative to the Economic Development of Under· developed Areas." The Eastern Anthropologist, Vol. 7 1'\0. 1. Septcll)ber-Nov, ember. 1953,
Spedfically Relating to India
Bidval, B.K. "The Variation in Population in Amravati District," Geographical Review of India, Vol. 13, No.1, March, 1951, pp. 9-14.*
Brimmer, Andrew F. "The Setting of Entrepreneurship in India," TILe Quarterly Journal of Economics, Vol. LXIX, November, 1955, pp. 553-576.
Bose, N·.K. "Modern Bengat," Man in India, Vol. 38, No.4, Och)ber-Deccmher, 195R, pp. 229-295.
Bose, S:C. "Density and Pattern of Population in the Lower Damodar Basin," Calcutta Geographical Review, Vol. 8, Nos. 1 and 2, March-Jone, 1946, pp. 43-52.*
--. "Sequence of Occupance in the Damodar Valley Coalfields," GeographiCal Review of India, Vol. 13 No. 3 September, 1951, pp. 34-39.*
Brush, John. "The' Iron and Steel Industry of India," Geographical Review, Vol. 42, 1952, pp. 37-55.
Buschmann, KH. "Settlements and Habitations in India," Geographical Review of India, Vol. 16, No.3. September, 1954, pp. ] 9-39, and No.4, December, 1954, pn. ]3-37.*
Chaudhri, N.K. Syam. "The Enumeration and Treatment of Tribes in the Indian Census: a Study in Retrospect," Man in India, Vol .. 32, No.3: July-September, 1952, PD. 160-6.*
Davis, Kingsley, "Demographic Fact ane. Policy in India," in Demographic Studies of SelecTed A reas of Rapid Populationn Growth. Milbank Memorial Fund, 1954.
D'Souza, Victor S. "An Opcrationa\
Definition of Backward Groups ill India:'
The India Journal of Agl'icltltul'ai Economics, Vol. 13, No.2, April-June,
1958.
Ganguli, B.N. "Rethinking on Indian Economics," Indian Economic ]ournol, Vol. TTl, No.3, January, 1956, pp. 235-255.
Geddes, Arthur. "Half a Century of Population Trends in India." Geo«rophi('(ll Journal, XCVIII, November-December, 1941, pp. 228-253.
~. "The Population of India; Variability of Change as a Regional Demographic Index," The Geographical Review, VoL 32, No.4, October, 1942, pp. 562-573.
Gopal, M.H. "The Social Survey-Its Role and Development with Specilll Reference to India," The Tndian Economic Journal, Vol. VI. No.2, October, 1958, pp. 195-216.*
Gosal, Gurdev Singh. "The Occupational Structure of India's Rural Population-A Regional Analysis," National. Geographical J01lrnal of India, Vol. IV, Part 3, September 1958, pp. 137-148.
Harris, Britton. "Urbanization Policy in India," Papers and Proceedings (If th(' Regional Science Association, Vol. 5, 1959, P!l. 181-203.
Hoselitz, Bert F. "The Cities of India and Their Pmblems," Annals of the As«ociatio11 of A merican Geographers, Vol. :1.9,
No.2, June, 1959, pp. 223-231.
Jakhade, V.M. "Effects of Technical C'hangcs in Employment in A):!Ticnlturc in India," Reserve Bank of Indif! RulZetin. November, 1955, pp. J 191-1197.
James, H.E. "Urban Geographv of Indi~l," BlIlletin of flip Geographical Society (If Philadplphin. Vol. 28, 1930, pn. J02-122.
Karan, P.P. "Economic Regions of Chota Nagpur, Bihar," Economic Geography, Vol. 29, 1953, pp. 216-250,
-- and Jenkins, Wm. M., Jr. "Geography of Manufacturing in India," Economic Geography, Vol. 35, No.3, July, 1959, pp. 269-278.
--. "Locational Pattern of New Centres of the lndian Iron and Steel Industry," The Journal of Geography, Vol. 56, No. 8, Novemb,er, 1957, pP. 366-373.
Kingsbury, Robert C. "India's Industrial Growth," ForllS, Vol. 6, No.9, M:1Y. 1956.
Kirk, Wm. "The Cotton and Jute Industries of India," Scottish Geographical Magazine, Vol. 72, No.1, April, 1956, pp. 38-52.
Kuriyan, George. "Industrial Development in India Since rndependence," Indian Geographical Journal, Vol. 33, Nos. :3 and 4. pp. 1-8.
--. "Population and its Distribution in Kcra]a," The JOllrnal of the Madras Geographical AssOCiation, Vol. 13, No. 2" June, 1938, pp. 125-146.*
Lal, Amr'it. "Some Aspects of Functional Classification of Cities and a Proposed Scheme for Classifying Indian Cities," The National Geographical Journal of India, Vol. 5, Part 1, Match, 1959,' pp. 12-24.
Lamb, Helen B. "The Indian Business Communities and the Evolution of an Industrialist Class," Pacific Affairs, Vol. n, No.2, June, 1955, 17 pp.*
Lawrence, Sir Willter. 'The Jndian Village," Geographical Magazine, 6, No. 6, April, 1939, pp. 373-386.
Laxmi Narayan, H. "The Indian Labour Market and Its Impact on the Pattern of Region:1l Wage DiITercntii11s," The Indian Economic Review, Vol. 4. No. 1, f,ebruary, 1958, pr. 35-58.
Learmonth, A.T.A. and A.M. "Aspects of Village Life in IndQ-Pakistan," Geography, Vol. 40, No. 189, July. 1955, Ipp. 145-160.
Mac1agen, Gorrie, R. "The Re.1ationship between Density of PopUlation and the Method of Land UtilizaHon in British India," Comptes Rendus du Congress International de Geographie (Amsterdam. 1938 (, pp. 405-420.*
Majumdar, Asthutosh Ghosh. "A Study of the Regional Distribution of Population According to Economic Status," PrOceedings of the 46th Session of the Indian Srience Congress AssociatiOn, Del/ri, ] 959, Part 7, abstracts.
- Majumdar, D. N. "Rural Analysis, Problems, and Prospects." Eastern A nt11ropologist, Vol. 9, 1956.
Marriott, McKim. "International and Attributional Theories of Caste Rankin!!." Man in India, "June" 1959, pp'. 92-107.
Mathur, K.S. "Caste and Occupation in a Malwa Villa~e," The Eastern Anthropologist, Vol. 12, Ne>. 1. SeptemberNovember. 1959, Pp. 47-61. India. Vol. 39, No.1, January-March.
--. "Vi11age Studies in India'," Man in 1959, pp. 45-52.
Mukerji, A.B. "The Bi-Weekly Market at Modinagar," The Indian Geographer, Vol. 2, No.2, December, 1957, p'p'. 271-293.
Mukeriee, Radha KamaL "Caste and Social Change in India," The American JOllrnal of Sociology, Vol. 43, No.3, November, 1937, pp. 377-390.
Mukherjee, Ramkrishna, "Ec:onomic Structure of Rural Bengal: a Survey of Six Villages," A merican Sociological Review, Vol. 13, December, 1948, pp. 660-672. '"
Mukherji, A.B. "Modinagar, a Study in Urhan Geography," Geographical Review

of India, .vol. 15, No.4, December, 1953, pp. 8-20.
Neale, Walter A. "Limitations of Indian Village Survey Data," ]ollrnal of Asian Studies, Vol'. 17, No.3, May, 1958, pp. 383-402.*
Opler, M.E. "The Extensions of an Indian Village," ,Journal of Asian Studies, Vo~. 16, No.1, 1956, pp. 5-10.
--. and Rudra Dutt Singh. "The Division, of LabQr in an Indian Village." A Reader in General Anthropology, c.s. Coon. (ed.) New York. Henry Holt, ~ 948, pp. 464-496.
Ornati, Oscar. "W'ages in India," Economic Development and Cultural Change, VoL 3,No. 3, ApriI"1955, pp. 241-259.
Parthasarathi, G. "Size of Farm Holding and the 'Year-Round Worker,''' Artha Vijnana-fournal of the Gokhale Institllte of Politics ari'd EcoilOmics, Poona, (India), Vol. 1, No. 1, March, 1959, pp. 70-81.
P1Itnaik, Nit}"ananda, ·"Oaste and Occupation in Rural Orissa," Man in, India, 34: 257-270. Ranchi, Bihar.~:
Pras'ad. Ayodhya. "Population Di$tribution and the Dynamics of Labour Supply in Bihar," Geographical Olltlook, Vol. T, No.2. July, 1956, Ranchi, Bihar, pp. 30-35.
Puri. Bai.i Natll. "Some Aspects of ViITage Economy in Ancient India," The Eastern Anthropologi~t, Vol. 8. Nos. 3 and 4, March-August, 1955, p'P-. 246-252:.
Raghav'an, V. "Variety and Integration in the Pattern of Indian Culture," Far Eastern Quarterly, Vol. 15, No.4, August, 1956, pp. 497-506.*
Raj, K. N. "Employment and Unemployment in the 'Indian Economy: Problems of Classification, Measurement. and Policy," Ec011IJmic .Development and Cultural Change, Vol. 7, Part 1, April, 1959, pp. 258-278.
Rao, C. Radhakrishna. "Quantitative Studies in Sociology: Need for Increased Use in India," The Eastern Anthropo~ lORist, Vol. 12, No.3, March-May, 1959. pp. 143-170.
Richards, F. J. "Cultural Regions of rndia," Geography, Vol. 15, No. 83, March, 1929, pp. 20~29.
Sarma, Jyotirmoyee. "The Secular Status of Castes," The Eastern AnthropologiH, Vol. 12. No.2, December, 1958-February, 1959, pp. 87-106.
Schwartzberg, Joseph E. "Agricultural Labor in India: a Rc¢onal AnaI'ysis with Particular Reference to Population Growth." Economic D~velopment and ClIltural Chan~e, Vol. XI, No.4, July, 1963, pp. 337-352.
--. "Three Approaches to the Mapping of Economic Develop'ment in India, Annals of the Association of American GeoRraphers, Vol. 52. No.4. Dec., 1962, pp. 455-468.
Sir(ger, Milton. "The Cultural Pattern of Tndian CiviIization." The For Eastern Quarterly, Vol. 15, 1955, pp. 23-36.*
-'-. "Cultural Values in India's Economic Decelopment," Annals of the American Academ,v of Political alld
'Social Science, May, 1956.'"
Singh, Kashi Nath. "Functions and Functional Classification of Towne; in Uttar Pradesh." The Nation.al Geographical Journal of India. Vo1. S. Part 3, Septem'ber, 1959. pp. 121-148.
Singh, S. P. "Demographic. Features of Lucknow," The National Geographical Journal of India. Vol. 5. Part 3, Septem." her. 1959, pp. 157-175 . •
Singh, Ujagir. "The Origin and Growth of Kanpur," 'The National Geographical JOllrnal of India, Vol. 5, Part 1, MarcIl. 1959, pp. 1-11.
Sinha, Surajit. "Trib'al Cultures df Peninsular lnqia as a Dimension of Little
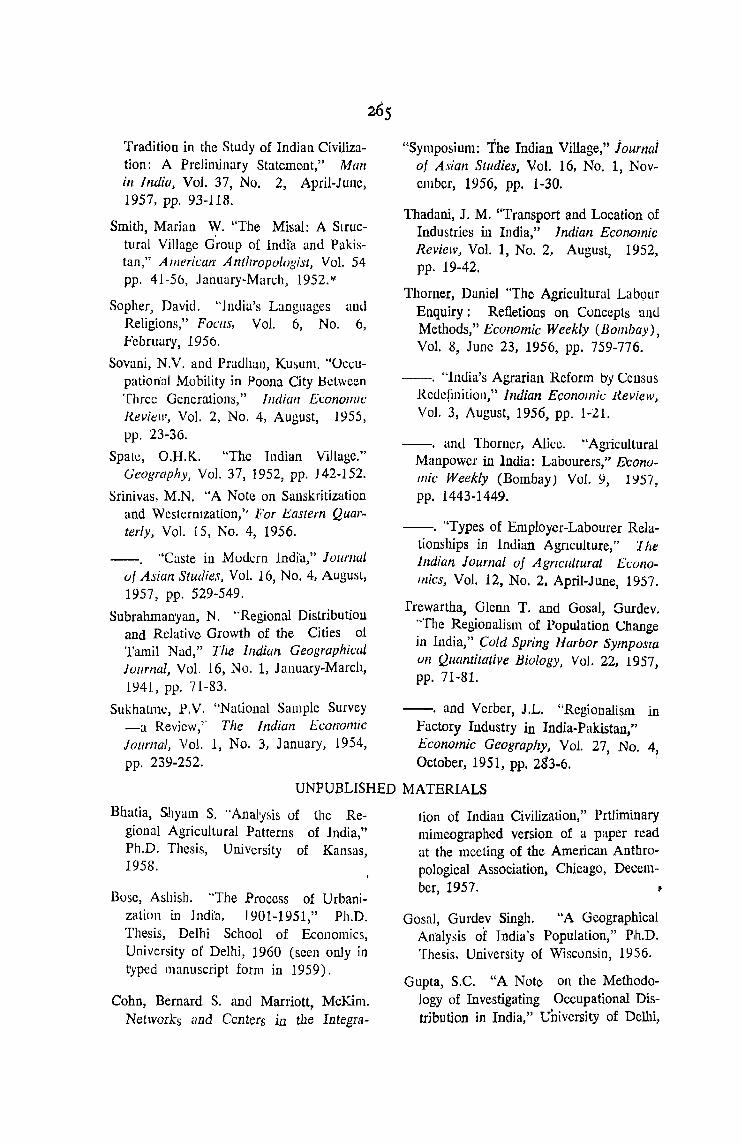
Tradition in the Study of Indian Civilization: A Preliminary Statement," Mart in India} Vol'. 37, No.2, April-Junc, 1957, pp. 93-118.
Smith, Marian W. ''The Misal: A Structural Village G'roup of India and Pakistan," American Anthropologist, Vol. 54 pp. 41-56, January-March, 1952.¥
Sopher, David. "India's Languages ami Religions," Foclls, Vol. 6, No.6, February, 1956.
Sovani, N.V. and Pradhan, Kusum. "Occupation'al Mobility in Poona City Between Thrce Generations," Indian EconolJllc Review, Vol. 2, No.4, August, 1955, pp. 23-36.
SpaLe, O.H.K. "The Indian Village." (jeography, Vol. 37, 1952, pp. 142-152.
Srinivas, M.N. "A Note on Sanskritization and Wcstermzation," For }!_'astern Quarterly, Vol. 15, No.4, 1956.
"Caste in Modern India," JOllrJIl1l
of Asian Studies, Vol. 16, No. 4, Augu~t, 1957, pp. 529-549.
Subrahmanyan, N. "Regional Distribution and Relative Growth of the Cities 01 Tamil Nad," The Indian Geographical luurnal, Vol. 16, No. 1, January-March, 1941, pp. 71-83.
Sukhatmc, r.v. "National Sample Survey -a Review," The Indian t;conomic Journal, Vol. 1, No.3, January, 1954, pp. 239-252.
"Symposium: The Indian Village," journai of Asian Studies, Vol. 16, No. I, November, 1956, pp. 1-30.
Thadani, J. M. ''Transport and Location of Industries in India," Indian Econ.omic Review, Vol. 1, No.2, August, 1952, pp. 19-42.
Thorner, Daniel "The Agricultural Labour Enquiry: Refletions on Concepts 'ami Methods," Economic Weekly (Bombay), Vol. 8, June 23, 1956, pp. 759-776.
--. '"India's Agrarian Reform by Ccnsus Rcdcfl11ition," Indian Economic l~eview, Vol. 3, August, 1956, pp. 1-21.
--. and Thorner, Alice. "Agricultural Manpower in India: Labourers," EconolIIic Weekly (Bombay) Vol. 9, 1~57,
pp. 1443-1449.
--. "Types of Employer-Labourer Relationships in Indian Agnculture," 1 he indian Journal of Agricultural E(;Onowics, Vol. 12, No.2. April-June, 1957.
frewartha, Glenn T. and Gosal, Gurdev. '"The Regionalism of Population Change in India," Cold Spring Harbor SympOSIa un Quantitative Biulogy, Vol. 22, 1957, pp. 71-81.
--. and Verbcr, J.L. "Regionalism in Factory Industry in India-Pakistan," Economic Geography, Vol. 27, No. 41 October, 1951, pp. 28'3-6.
UNPUBLISHED MATERIALS
Bhatia, Shyam S. "Analy~is of thc Regional Agricultural Patterns of India," Ph.D. Thesis, UniVersity of Kansas, 1958.
Bose, Ashish. '"The Process of Urbanization in lndia, J 901-1951," Ph.D. Thesis, Delhi School of Economics, University of Delhi, 1960 (seen only in typed manuscript form in 1959).
Cohn, Bernard S. and Marriott, McKim. Networks and Centers in the Integra-
tion of Indian Civilization," Prtliminary mimeographed version of a paper read at the meeting of the American Anthropological Association, Chicago, Decembe~ 1957. f
Gosal, Gurde_v Singh. "A Geographical An'alysis of India's Population," Plh.D. Thesis, University of Wisconsin, 1956.
Gupta, S.C. "A Notc on the Methodology of Investigating Occupational Distrjbution jn Indja," University of Delhi,

Delhi School of Economics, Agricultural Research Section, 1959 (typed preliminary draft). .
Hoffman, Lawrence A. "Population and Economic Development in India and Pakist!ftl," Ph.D. Thesis Johns Hopkins University, 1950.
India, Ministry of Food and Agriculture, Directorate of Economics and Statistics. "VilJage Surveys of Agro·Economk Research Centres: Objectives, Methodology, Definitions and Concepts" (Proceedings of a Workshop meeting at Santiniketan, July 6:-10, 1958),
(mimeographed) .
Indian Statistical Institute. "Classillca-tion of Industry and Occupation," CaJcutta; Indian Statistical Institute, 1958 (mimeographed) .
India, Planning Commission, Labour and Employment Division "Occupational Pattern of Indian Union from 1901 to
1951," New Delhi, 1956 (mimeographed).
Kuriyan, George. "A Pilot Project Regional Survey of Kerala," Madras, University of Madras, Department of Geography, 1959 (typed).
Lal, Alllrit. "Some Characteristics of Indian Cities of Over 100,000 Inhabitants with Special -Reference to Their Occupational Structure and Functional Specialization," Ph.D Thesis, University of Indiana, 1958.
Marriott, McKim. "Caste Ranking and Community Structure in Five Regions of India and Pakistan," Ph.D. Thesis, University of Chicago. 1955.
Mehra, Mrs. S. '1ncome LeVels and Occupational Distribution," Delhi: University of Delhi, Ind'raprastha College for
266
Women (mimeographed papel' presented at ecnomics seminar, March 13, 1959).
Mitra, Asok (Registrar General of India). Letter thanking the author for his "recommendations for the improvement of the 1961 Census of India," New , . Delhi: October 23, 1959 (typed).
Parthasarathi, Gogulu. "Under-employment and the Indian Agriculturist." Ph.D. Thesis, University of Wisconsin, 1958.
Schwartzberg, Jo~epp IE. "On the Banking of Regions of India According to Level of Economic Development," Delhi, Uniwr~ity of Delhi, Delhi School of Economics, 1959 (typed-to be published III lhe indjan Economic Review).
--. "Recommendations for the Improvement of the 1961 Census of India," Madison, Wisconsin, University of Wisconsin Department of Geography, 1959 (typed-CQpy forwarded to the Registrar General of India, Asok Mitra, under cover letter dated 20 September, 1959).
--. "Regional Variations in the Characteristics of the Indian Labor Force," Ma'dison, Wisconsin, University of Wisconsin, Department of Geography, 1958 (typed seminar paper).
-. "Three Methods of Mapping Levels of Economic Development, with Specific Reference to tl'l.e Case of India," paper to be read before Section 7, of the XIXth International Geographical Congress, Stockholm, 1960 (typed).
Social Science Research Council (sponsor). "Conference on Commitment of the Industrial Labor Force in Newly Developing Areas, March 28-30, 1958, Chicago, nlinois," Miscellaneous papers (mimeographed) .
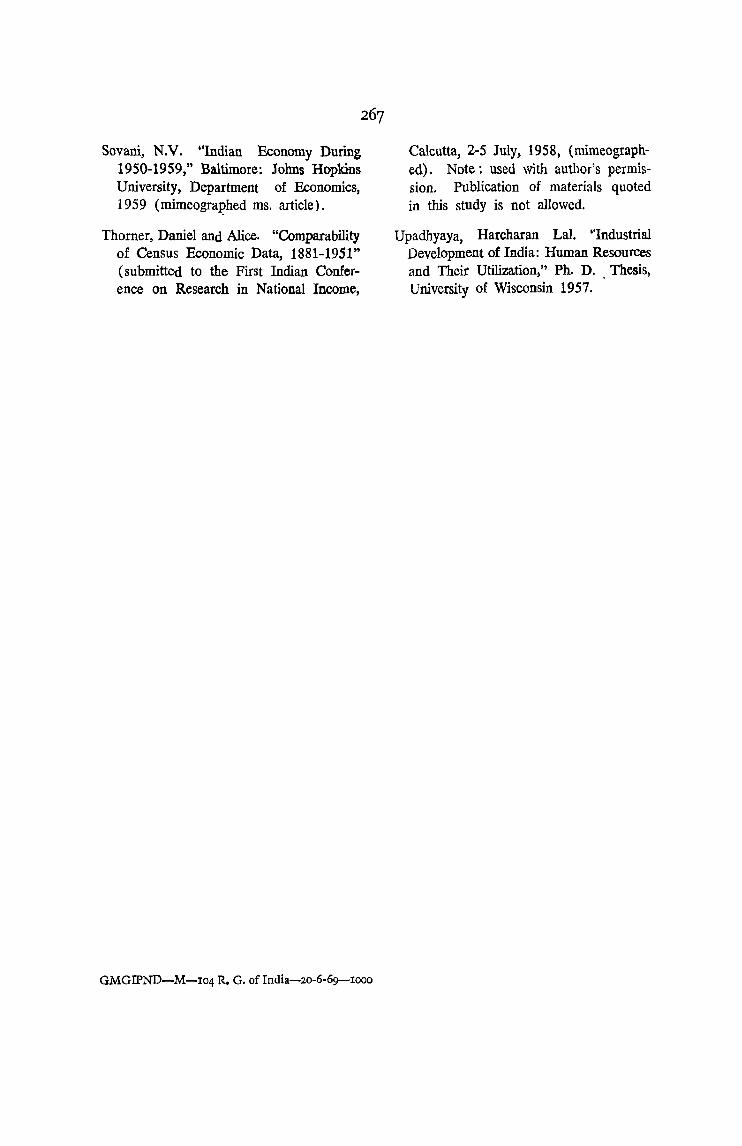
Sovani, N.V. "Indian Economy During 1950-1959," Baltimore: Johns Hopkins University, Department of Economics, 1959 (mimeograI?hed ms. article).
Thorner, Daniel and Alice. "Comparability of Census Economic Data, 1881-1951" (submitted to the First Indian Conference on Research in National Income,
GMGlPND--M-I04 R. G. of India-2o-6-69-I OOO
Calcutta, 2-5 July, 1958, (mimeographed). Note: used with author's permission. Publication of materials quoted in this study is not allowed.
Upadhyaya, Harcharan Lal. "Industrial Development of India: Human Resources and Their Utilization," Ph. D. . Thesis, University of Wisconsin 1957.

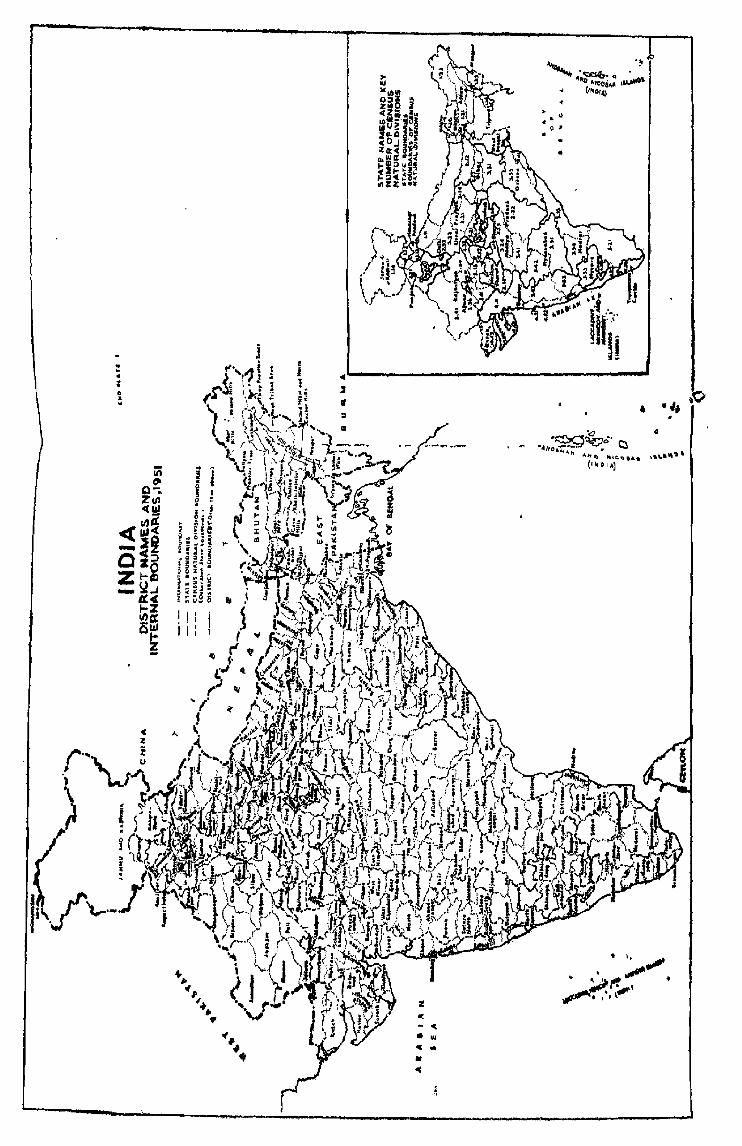
:: c .. • D S ..
.. .. ",. ',. ..
"
.. & " .. o ~
"
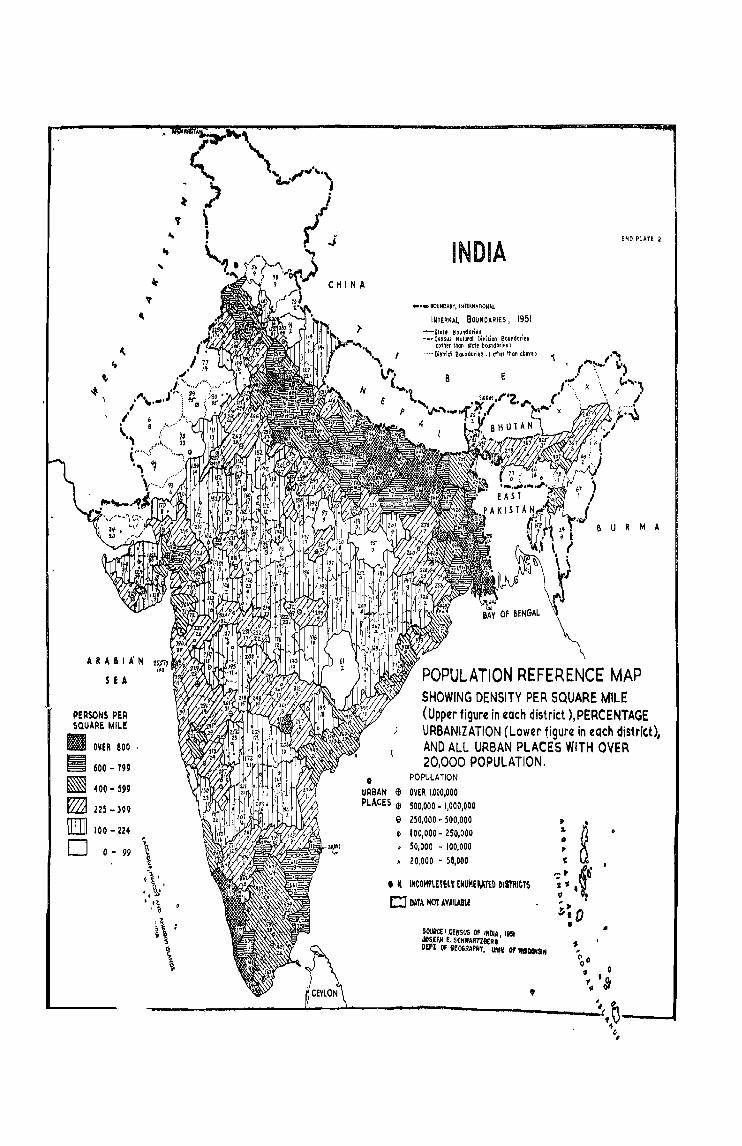
ARABIA'N
SH
PERSONS PER SQUARE MILE
II OVER 800
~ 600 - .199
~ 400- 599
~ 225-309
am 100 - 224
o 0- 99
, CHI N A
INDIA END PLATE 2
_,_ BOUNDARY. INTEkNATION.lJ.
INTERNAL BOUNOARIES, 1951 --SIatt Boundaries • -_ .. Census Natural Division eoundafles
cather than $1ateboundQrieSl . '·'''Distrlct BOIIn~Qries ,t oIhrr than abov!)
B E
a U R M A
POPULATION REFERENCE MAP SHOWING DENSITY PER SQUARE MILE (Upper figure in each district ),PERCENTAGE URBANIZATION (Lower tigure in each district), AND ALL URBAN PLACES WITH OVER 20,000 POPULATION.
• POPULATION
URBAN (j) OVER 1,000,000 PLACES (j) 500,000 _ 1,000,000
e 250,000 - 500,000 e 100,000 - 2S0,000 • 50,000 - 100,000 • 20,000 - 50,000
• II IMtOHPlEfHYEHUHEI!ATED DISTllleTS
CI DATA HOT AVAILABLf
SOlIl1CE I .CE~SUS OF INOlA 1951 "'S~PH E. SCHWARTZBERG' DEPt Of GEOGRAPHY. UNI~ Of' WIICflNSIN
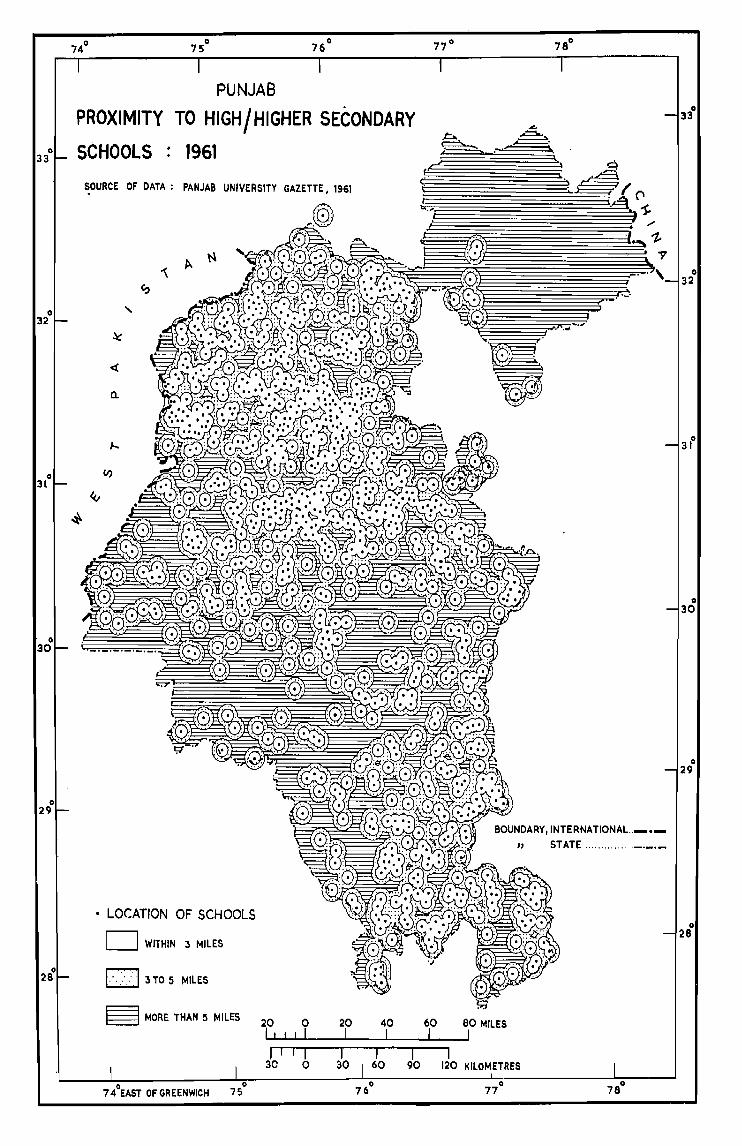
PUNJAB
PROXIMITY TO HIGH / HIGHER SECONDARY o
33 SCHOOLS : 1961
~OURCE OF DATA: PANJAB UNIVERSITY GAZETTE, 1961
o 32
o 31
o 30
o 29
,
« a.
• LOCATION OF SCHOOLS
D WITHIN :5 MilES
280 0 3 TO 5 MilES
8 MORE THAN 5 MilES
740EAST OF GREENWICH 75
o
20 0 I, " I I I I I
30 0
20 I
I 30
40 I
I I 60 90
760
's;'
60 80 MilES I I
I 120 kilOMETRES
0 77
'''' , , ..
o 33
o 31
o 30
o 29
o 28