
connaissance et gestion durable des dunes de la côte atlantique
Observations of the northern seasonal polar cap on Mars II: HiRISEphotometric analysis of evolution of northern polar dunes in spring
Ganna Portyankina a,⇑, Antoine Pommerol a, Klaus-Michael Aye a, Candice J. Hansen b, Nicolas Thomas a
a Physikalisches Institut, Bern University, Sidlerstrasse 5, CH-3012 Bern, Switzerlandb Planetary Science Institute, 389 N. Industrial Rd., Suite 5, St. George, UT 84770, USA
a r t i c l e i n f o
Article history:Available online xxxx
Keywords:MarsPolar capsIcesSurfacesPolar geology
a b s t r a c t
We present an overview of our analyses of HiRISE observations of spring evolution of selected dune areasof the north polar erg. The north polar erg is covered annually by seasonal volatile ice layer, a mixture ofCO2 and H2O with mineral dust contamination. In spring, this layer sublimes creating visually enigmaticphenomena, e.g. dark and bright fan-shaped deposits, dark–bright–dark bandings, dark down-slopestreaks, and seasonal polygonal cracks. Similar phenomena in southern polar areas are believed to berelated to the specific process of solid-state greenhouse effect. In the north, it is currently unclear ifthe solid-state greenhouse effect is able to explain all the observed phenomena especially because theincreased influence of H2O on the time scales of this process has not yet been quantified. HiRISE obser-vations of our selected locations show that the ground exhibits a temporal behaviour similar to the oneobserved in the southern polar areas: a brightening phase starting close to the spring equinox with a sub-sequent darkening towards summer solstice. The resolution of HiRISE enabled us to study dunes and sub-strate individually and even distinguish between different developments on windward and slip face sidesof single dunes. Differences in the seasonal evolution between steep slip faces and flatter substrate andwindward sides of dunes have been identified and compared to CRISM data of CO2 and H2O distributionson dunes. We also observe small scale dark blotches that appear in early observations and tend to sustaina low reflectivity throughout the spring. These blotches can be regarded as the analogue of dark fandeposits in southern polar areas, leading us to the conclusion that both martian polar areas follow similarspring evolutions.
! 2012 Elsevier Inc. All rights reserved.
1. Introduction and background
An extensive dark erg surrounds the permanent north polar capof Mars. In summer it stands out as a prevailing dark feature of thenorthern polar areas. In the winter a seasonal layer of condensatescovers the dunes and makes it less distinctive from other terrains.The seasonal layer consists mainly of CO2 ice mixed with H2O andairborne dust in unknown and most probably varying proportions.Spring sublimation of these volatiles at times happens dynamicallyand violently and was imaged in detail by the Mars ReconnaissanceOrbiter (MRO) instruments: the High Resolution Imaging ScienceExperiment (HiRISE) and Compact Reconnaissance Imaging Spec-trometer for Mars (CRISM). HiRISE has exceptional capabilities forimaging the martian surface with high spatial resolution and underlow insolation conditions typical for polar areas. High signal/noiseratio HiRISE images can reveal features as small as 0.5 m. This al-lows HiRISE to conduct special observation campaigns to monitorthe spring evolution of martian polar regions. At the time of writing
(April 2012), HiRISE has finished observations of its third north po-lar spring. Many of the targets of this campaign are dune fields to-gether with steep scarps of the permanent polar cap that aremonitored for avalanche activity, permanent cap surface monitor-ing, etc. Dune fields attracted our special attention because they ex-hibit most dynamic processes associated with sublimation ofseasonal volatiles: dark and bright fan-shaped deposits, dark–bright–dark bandings, dark down-slope streaks, and seasonalpolygonal cracks. The activity observed in northern dune fields issimilar to the spring activity in the southern polar regions whichwas the subject of multiple previous publications (Kieffer, 2007;Hansen et al., 2010; Portyankina et al., 2010; Pommerol et al.,2011a; Pilorget et al., 2011, and references therein). In the southernhemisphere spring sublimation produces dark and bright fans thatare believed to originate from cold jets of CO2 driven by a solid stategreenhouse effect (Kieffer, 2007). According to this model the activ-ity is governed by solar radiation. In early spring it penetratesthrough a translucent CO2 ice layer that covers polar areas to reachand warm up the underlying substrate. If the temperature on theinterface between the ice and substrate reaches sublimation tem-perature of the ice, pockets of pressurised gas start to form. The
0019-1035/$ - see front matter ! 2012 Elsevier Inc. All rights reserved.http://dx.doi.org/10.1016/j.icarus.2012.10.017
⇑ Corresponding author. Fax: +41 631 44 05.E-mail address: [email protected] (G. Portyankina).
Icarus xxx (2012) xxx–xxx
Contents lists available at SciVerse ScienceDirect
Icarus
journal homepage: www.elsevier .com/locate / icarus
Please cite this article in press as: Portyankina, G., et al. Observations of the northern seasonal polar cap on Mars II: HiRISE photometric analysis of evo-lution of northern polar dunes in spring. Icarus (2012), http://dx.doi.org/10.1016/j.icarus.2012.10.017
ice slab cracks or breaks when gas pressure underneath it becomestoo high compared to the ice yield strength. The captured gas is re-leased through the created fractures forming CO2 geysers. Hereafterwe will refer to them as cold jets. Escaping gas entrains some of theloose material of the substrate and brings it up to the atmospherewhere it is deposited on the upper surface of the seasonal ice. Theresults of this process can be observed as dark fans, blotches andelongated cracks. After the first phase of activity that places darkmaterial onto the top ice surface there is a second phase when icelayer interacts with the dark material on it. This phase results inbright halos around the dark fans and blotches and influences gen-eral surface reflectivity. The amount of dark material on the top sur-face of the ice gradually reduces in a way that the percentage of thesurface of ice exposed to the atmosphere is increasing. This can hap-pen by either dust and sand grains sinking down into the ice layer orbeing detached from the ice and suspended by the wind into theatmosphere. It is unlikely to be caused by redistribution of the sandon the surface because we see all types of surfaces increasing theirbrightness. The cleaning happens most efficiently in the areas onthe borders of dark fans and blotches. These create bright halos.In some areas cold jets erupt several times during spring eitherrepeatedly at the same positions or from new sources. The de-scribed phases are not bound to happen strictly after each other, in-stead they may overlap and shift, so that their repeated occurrencescreate complex surface features.
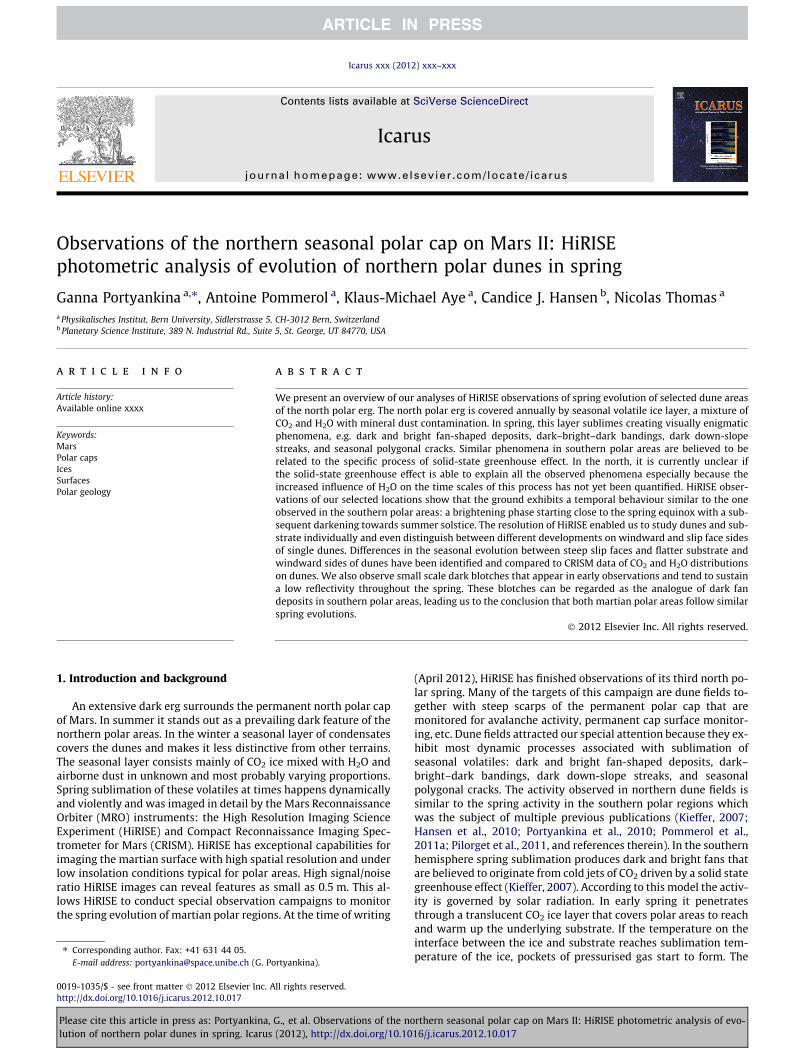
Kieffer’s model was first developed for the southern hemi-sphere. It is arguable if it can be directly applied to the northernhemisphere because the conditions during northern winter andspring are very different from those during southern one. Thenorthern hemisphere is known to be more humid than the south-ern one (Smith, 2004). Hence more inclusions of water ice are ex-pected in the seasonal CO2 layer that can highly influence itstranslucency. Most of volatile deposition happens during dark win-ter season which makes it extremely hard to observe with passiveremote sensing instruments. Some estimations of bulk proportionsof H2O to CO2 ices come from the earliest spring observations byspectrometers and are within 0.1 wt.% (Cull et al., 2010; Appereet al., 2011). This number however is expected to vary dependingon the location inside the cap. Inclusions of water might changeboth optical and mechanical properties of CO2 slab. Water crystalsact as light scatterers inside the slab making it less transparent.They also compromise the integrity of CO2 crystal structure inhardly predictable ways. Topographically north polar areas arelower than southern by up to 7 km which leads to pressure differ-ences during local spring of up to 400 Pa. This is a very differentthermodynamical environment for CO2 and H2O phase transitions.However, Mars Orbiter Camera detected some unusual springactivity in the form of dark spots in the northern polar erg (Edgettand Malin, 2000). We also observe that both, northern and south-ern, polar areas exhibit signs of the described activity. One of theaims of the present paper is to demonstrate that the activity inthe north is similar to the one in the south and can be describedin the frame of Kieffer’s model. Fig. 1 shows one typical exampleof dark and bluish fans observed in the southern seasonal polarcap during its spring retreat. In summary, the observational factsfrom southern spring observations are:
(1) The very early spring observations of several locations byHiRISE and CRISM show low surface reflectivity: at somelocations as low as 0.2 and in most locations60.4 (Pommerolet al., 2011a). This is lower than one would expect for fine-grained ice surface.
(2) Surfaces gradually brighten from the beginning of spring, i.e.Ls = 180", until Ls = 240 ± 10", therefore reaching their maxi-mum of reflectivity within 120 sols. Subsequently surfaces dar-ken while the seasonal ice layer disappears from the surface.
(3) Large numbers of dark and bright fan deposits wereobserved in multiple locations around the seasonal polarcap. They appear very early in spring, in some locationsbefore the equinox. In several locations their apparent orien-tations and sizes change during the course of spring (Thomaset al., 2010).
(4) These fan deposits are often associated with araneiform pat-terns that are believed to be result of multiple repetition ofunder-ice erosion processes (Hansen et al., 2010; Portyankinaet al., 2010; Piqueux et al., 2003).
(5) Small scale inhomogeneity of the surface (like troughs, pitsand boulders) accelerates the development of fans andcracks in spring (Pommerol et al., 2011a; Portyankinaet al., 2010).
In the south dynamic spring activity has not yet been proven tobe related to any specific surface type. In the north it is observedalmost exclusively in the dunes of polar erg. There are a few excep-tions of fans observed outside any dune fields, however they arevery rare. This might be due to following observational bias: themajority of observations in polar areas were done at Ls P 10",while Hansen et al. (this issue) showed that activity on the sub-strate happens earlier than on the dunes, i.e. around vernal equi-nox (Ls = 0").
In the present paper we will concentrate on the data from thenorthern hemisphere during three consecutive northern springsfor four different locations in the polar erg. We will discuss in de-tails the photometric behaviour of the surfaces and concentrate onthe description of evolution of small scale features. The first com-panion paper by Hansen et al. (this issue) describes in more generalterms the evolution of a larger set of areas, including the ones stud-ied here.
Near-infrared spectral data acquired by CRISM over the sameplaces and at the same times as the HiRISE images are analysedin the second companion paper by Pommerol et al. (this issue).Important findings of this paper relevant for the present workare: (1) The presence of CO2 ice at the surface during the entirespring for all locations. The spectral signature of CO2 is the
Fig. 1. Subframe of HiRISE image PSP_002718_0950 showing an example ofsouthern seasonal cap surface in spring. The location is 84.8"S, 81.9"E. Dark andbluish fans together with araneinforms are identifiable.
2 G. Portyankina et al. / Icarus xxx (2012) xxx–xxx
Please cite this article in press as: Portyankina, G., et al. Observations of the northern seasonal polar cap on Mars II: HiRISE photometric analysis of evo-lution of northern polar dunes in spring. Icarus (2012), http://dx.doi.org/10.1016/j.icarus.2012.10.017
strongest at the beginning of spring season. Throughout spring, itgradually decreases but remains detectable until summer. (2)The H2O ice spectral signature exhibits a maximum aroundLs = 50". This maximum can either be explained by additional con-densation of H2O from atmospheric water vapour on top of the CO2
ice layer or by water ice particles initially present as inclusions inthe CO2 ice and left behind from its sublimation. (3) At small spa-tial scale, the activity observed over the dunes is correlated with anincrease in the spectral signature of CO2 ice.
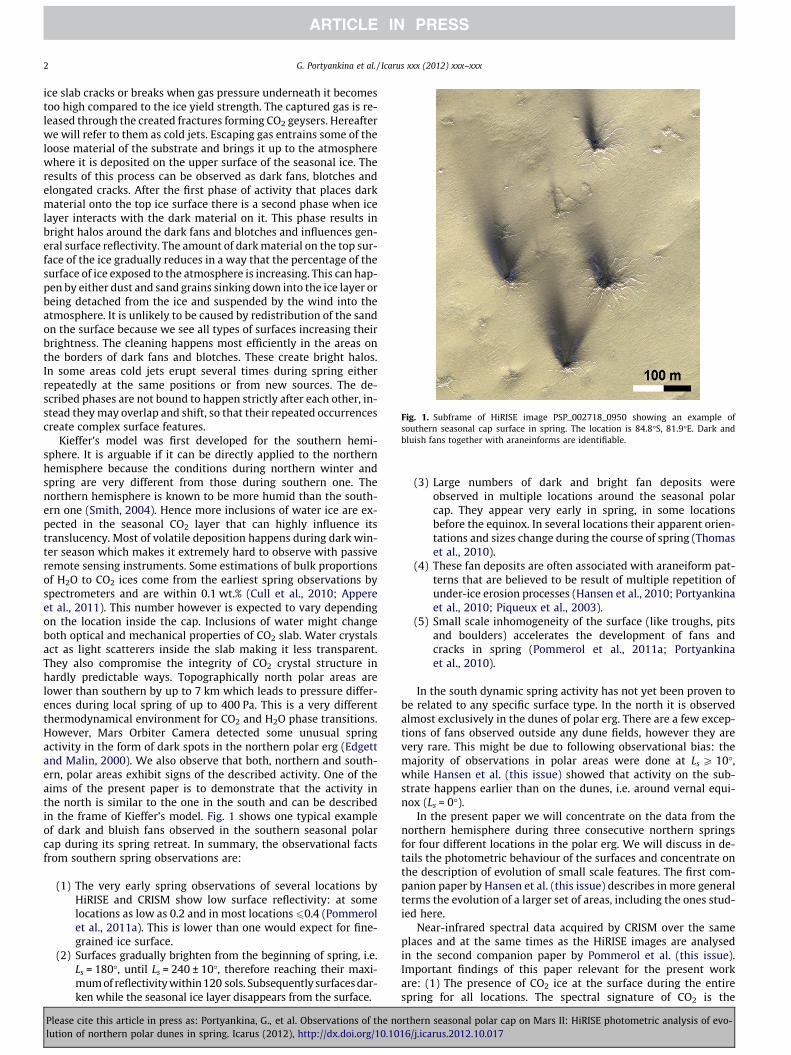
An example of isolated north polar dunes is shown in Fig. 2. Theimage is taken during local summer and illustrates differences be-tween the dune and underlying substrate. The dune is crescentshaped (also referred to as a barchan or transverse dune), has awell-defined sharp crest, pronounced slip face and windward side.Similar to the terrestrial analogs, most martian dunes are longer onthe windward side where the sand is pushed up the dune and havea shorter ‘‘slip face’’ in the lee of the prevailing wind. Not all themartian polar dunes are crescent dunes, examples of other types,
such as linear, star-shaped, t-shaped, and oval or circular moundsare observed by HiRISE.
The dune on Fig. 2 is composed of very dark material contrast-ing with the brighter substrate. Summer ice-free reflectivity valuesof polar dunes in the wide ‘‘red’’ wavelength band (570–830 nm)are very low, in this particular example equal to 0.15 (values forother locations can be found in the Table 1). Usual HiRISE dunereflectivity is 0.1 ± 0.05, substrate – 0.2 ± 0.05 with only slight vari-ations from location to location. The material composing polardunes is believed to be sand-sized particles of glacial origin con-taining gypsum (Massé et al., 2012). The particles originate fromthe permanent polar cap body by ablation of its sides and after thatare distributed around permanent polar cap by katabatic winds.The dark material brought up by cold jets in north polar erg thusis a mixture of sand- and dust-sized particles. For the sake of sim-plicity we will call it sand.
Apart from the slight albedo differences, dune and substratealso show different surface structures: the dune surface looks
Fig. 2. Top panel: an example of a crescent dune from north polar erg at the location Kolhar imaged by HiRISE during local summer of MY30 at Ls = 140". HiRISE imageESP_017974_2650, north direction is upright. Bottom panel: dune geometry as referred to in this paper.
G. Portyankina et al. / Icarus xxx (2012) xxx–xxx 3
Please cite this article in press as: Portyankina, G., et al. Observations of the northern seasonal polar cap on Mars II: HiRISE photometric analysis of evo-lution of northern polar dunes in spring. Icarus (2012), http://dx.doi.org/10.1016/j.icarus.2012.10.017
smooth and uniform in colour. It only shows very small ripplesof 1–2 m scale. The substrate is rough and bumpy and is covered
by polygons of, in this particular case, approximately 4 m size.The roughness of the substrate and reflectivity of dune/substratematerials vary slightly depending on location inside thepolar erg.
In the present paper we will pay special attention to the differ-ences in spring evolution of dune’s slip face, windward side andsubstrate surrounding the dune. Our premise is that differencesin the composition and surface structure of the dune and substrateand/or different insolation profiles of inclined and flat surfaces re-sult in the different sublimation patterns of the seasonal ice layercovering these surfaces, which is the reason for the differences inspring evolution observed here.
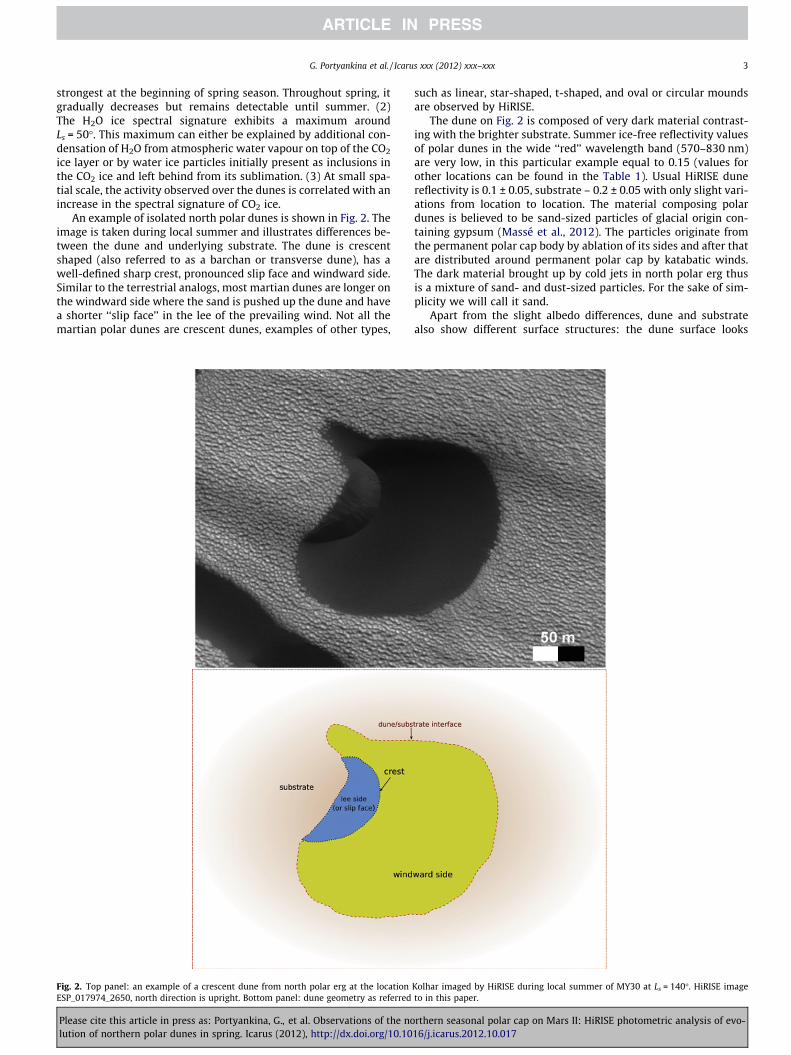
Table 1Locations of interest in north polar erg.
Name Latitude("N)
Longitude("E)
HiRISE referenceobs. id
Summerdunereflectivity
Arrakis 80.3 122 ESP_024247_2600 0.16Buzzel 83.7 235.7 ESP_016014_2640 0.13Kolhar 84.7 0.8 ESP_016062_2650 0.16Kaitain 76.6 89.5 ESP_024433_2570 0.13
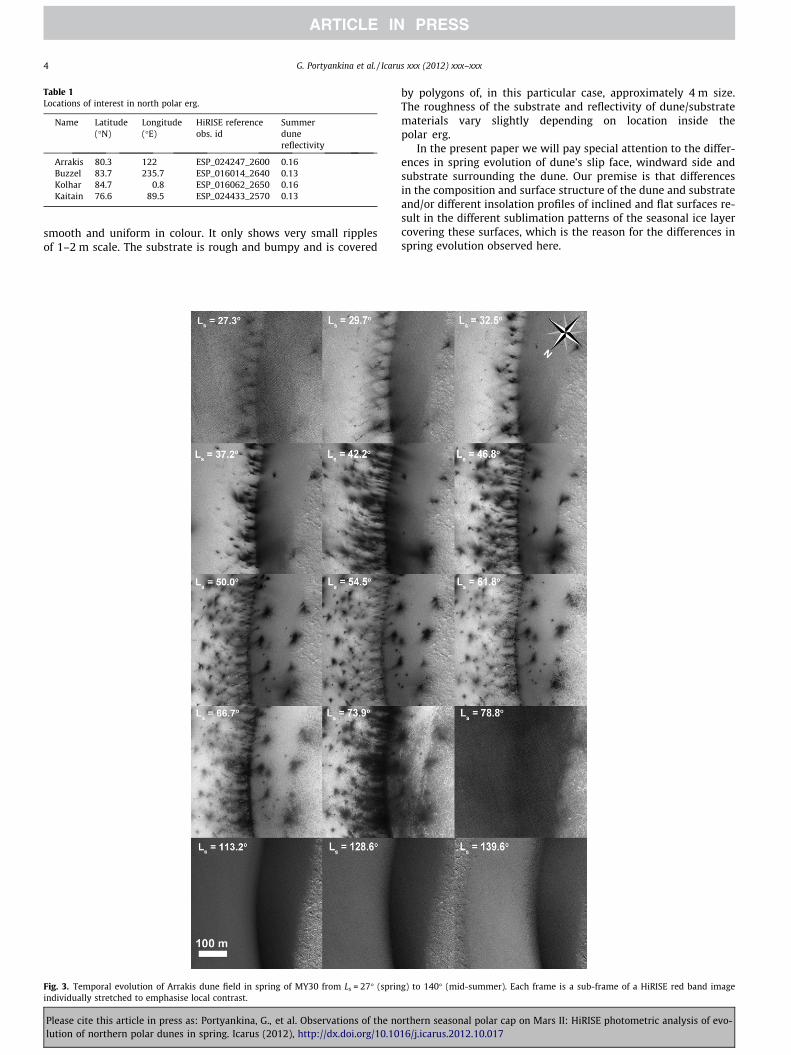
Fig. 3. Temporal evolution of Arrakis dune field in spring of MY30 from Ls = 27" (spring) to 140" (mid-summer). Each frame is a sub-frame of a HiRISE red band imageindividually stretched to emphasise local contrast.
4 G. Portyankina et al. / Icarus xxx (2012) xxx–xxx
Please cite this article in press as: Portyankina, G., et al. Observations of the northern seasonal polar cap on Mars II: HiRISE photometric analysis of evo-lution of northern polar dunes in spring. Icarus (2012), http://dx.doi.org/10.1016/j.icarus.2012.10.017
2. Observations
HiRISE monitors spring evolution of many locations in the northpolar erg with varying frequency of observations at each spot. Weanalysed twelve of them and will concentrate in this paper on thedescription of four particular areas among those. Our targets havebeen selected mainly by availability of most uniform temporal cov-erage during last three northern springs. The four selected areas lieat different longitudes around the pole: at 1"E, 89"E, 122"E, 236"E.Two of them are close to the permanent polar cap and two are fur-ther away from it. The summary of the areas of interest used in thispaper can be found in Table 1 together with informal names givento the areas for simplicity of reference.
2.1. Method
Most of the plots in this paper are time curves of surface reflec-tance in calibrated units (I/F) corrected for the corresponding inci-dence solar angle for each observation, i.e. R = I/(Fcos(i)).Reflectivity is averaged over the red band of HiRISE centred at
694 nm with a width of approximately 300 nm. Time is expressedin degrees of areocentric solar longitude Ls that ranges from 0 to360 with northern spring equinox being at Ls = 0" and summer sol-stice at Ls = 90". Martian years (MY) are counted as proposed byClancy et al. (2000). If not mentioned otherwise, we plot R valuesfor four different surfaces:substrate, dark blotch, the dune’s slipface and its windward slope. To generate each data point we selectseveral examples of each of these surface types in each HiRISE im-age and average their reflectivity. By doing this we attempted toattenuate the effects of illumination on slopes with different aspectangles.
To evaluate sample similarity for each HiRISE image we calcu-lated the standard deviation of several values of the same surfacetype at different but close locations. The standard deviation de-pends on the image quality. For example haze is known to reducevariability of pixel values within one image. However, the majorityof the images used in the present analysis is of high quality andthus the remaining standard deviation reflects similarity betweenthe chosen samples for each surface type. The annual means ofthe standard deviations for all used data points lie within the range
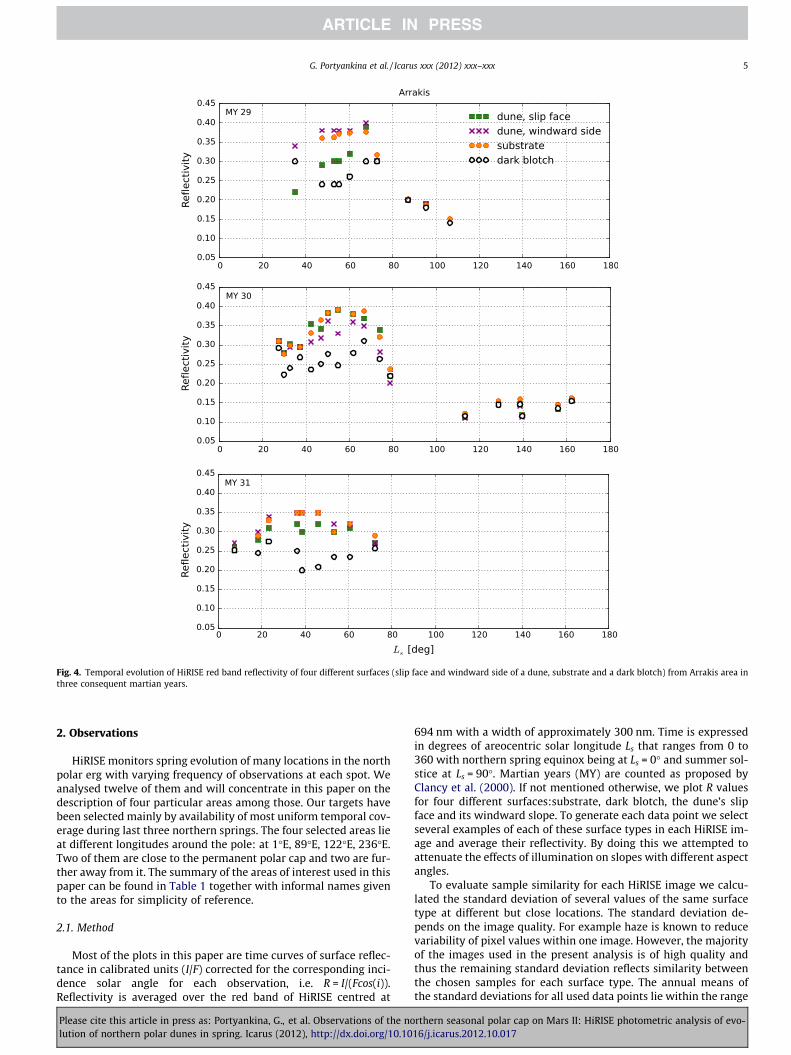
Fig. 4. Temporal evolution of HiRISE red band reflectivity of four different surfaces (slip face and windward side of a dune, substrate and a dark blotch) from Arrakis area inthree consequent martian years.
G. Portyankina et al. / Icarus xxx (2012) xxx–xxx 5
Please cite this article in press as: Portyankina, G., et al. Observations of the northern seasonal polar cap on Mars II: HiRISE photometric analysis of evo-lution of northern polar dunes in spring. Icarus (2012), http://dx.doi.org/10.1016/j.icarus.2012.10.017
of 2–5% with several singular observations showing values up to amaximum of 12%. For comparison, the HiRISE camera relative pre-cision for successive images is accepted to be around 5%.
It is important to note that slip faces of dunes pose a complica-tion in estimating their reflectivity because of their relatively steepslopes. During most of our observation period the Sun is at a lowelevation above the horizon and makes slopes appear highly reflec-tive. It is especially important for the dune fields with slip facespointing towards the Sun at the time when HiRISE is taking images.When possible we avoided such cases in our analysis.
Dunes and substrate are permanent features and their locationsare easy to track until the end of summer. Dark blotches howeverappear and vanish, sometimes on the time scale of weeks. There-fore, to determine the locations for tracking the evolution of darkblotches we identify the coordinates of blotches that stay isolatedover the time series and take into account the evolution of thesecoordinates even before the blotches appear. When studying theother three types of surfaces (windward and slip face sides ofdunes and substrate), we avoid blotches to separate the effects ofsignificant sand contamination from effects of inclination or under-lying material properties on the appearance of the surface.
2.2. Arrakis
The area location is 80.3"N, 122"E (see map in the companionpaper Hansen et al. (this issue)). It is a vast dune field positionedrelatively remotely from any of the scarps of the permanent polarcap. The Arrakis dune field is not directly influenced by the kata-batic winds, strong volatile sublimation fluxes from the permanentcap or any avalanche activity related to the steep scarps. HiRISErepeatedly imaged this area in the spring of MY29, 30 and 31,and the resulting temporal coverage permits comparability exam-inations of the development of its spring activity. The dunes heredo not completely cover the underlying substrate. The comparisonof the temporal development of dunes to that of the substrate ishence possible. Arrakis is a typical example of dunes with lowreflectivity; the average summer reflectance value is 0.16 ± 0.01.The dunes in this field are irregularly shaped, elongated and haverounded scarps, there is no particular dominant orientation ofthe dunes. Fig. 3 shows an example of a series of observations ofspring activity in Arrakis from MY30. This is a typical spring evolu-tion of a dune terrain. It starts from the upper left frame taken atLs = 27.3". The solar incidence angle at the time of this observation
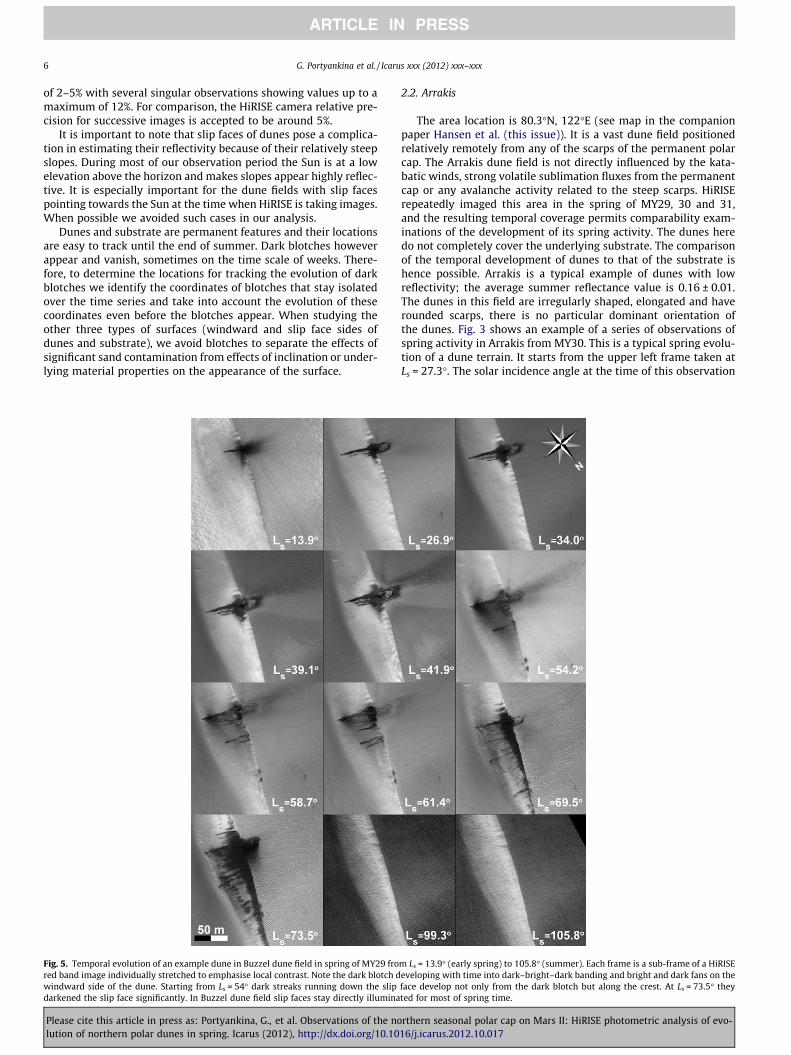
Fig. 5. Temporal evolution of an example dune in Buzzel dune field in spring of MY29 from Ls = 13.9" (early spring) to 105.8" (summer). Each frame is a sub-frame of a HiRISEred band image individually stretched to emphasise local contrast. Note the dark blotch developing with time into dark–bright–dark banding and bright and dark fans on thewindward side of the dune. Starting from Ls = 54" dark streaks running down the slip face develop not only from the dark blotch but along the crest. At Ls = 73.5" theydarkened the slip face significantly. In Buzzel dune field slip faces stay directly illuminated for most of spring time.
6 G. Portyankina et al. / Icarus xxx (2012) xxx–xxx
Please cite this article in press as: Portyankina, G., et al. Observations of the northern seasonal polar cap on Mars II: HiRISE photometric analysis of evo-lution of northern polar dunes in spring. Icarus (2012), http://dx.doi.org/10.1016/j.icarus.2012.10.017
was 70" and the atmospheric conditions are not favourable (dustyor cloudy atmospheric conditions). However the first dark featureson the otherwise brighter surface are recognisable. In the centre ofthe second frame taken at Ls = 29.7" is a dune crest with dark fansoriginating in the line along the crest. One can see a portion of sub-strate in the right side of the frame. Reflectivity of the substrate isnot different from the reflectivity of the dune. No spectral datafrom CRISM is available at this location and this early Ls. CRISMdata from locations at similar latitudes show that at this Ls the sur-face is covered by CO2 ice (Pommerol et al., this issue) with signif-icant H2O ice contamination. CRISM also indicates that dunes, incomparison to the substrate, are usually depleted on water ice atthis time. While spring progresses (from left to right and fromtop to bottom) dark fans and blotches become more abundant;their apparent contrast to the background varies. Notice two jumpsin the number and density of fans: from Ls = 37.2" to Ls = 42.2" andfrom Ls = 66.7" to Ls = 73.9". CRISM shows that the CO2 signatureslowly decreases over the complete Arrakis dune field and disap-pears at around Ls = 80". During all this time the substrate surfaceshows a stronger water ice signature than the dunes. The last three
frames (Ls = 113.2–139.6") show the ice-free dune. Its contrast tothe brighter substrate is now detectable.
Fig. 4 shows reflectivity of different surface types versus Ls forthree martian years. Temporal coverage varies between the ob-served years. In the overlapping time periods three observed yearsdo not show complete repeatability. There is a common trend how-ever, it is better visualised in MY30: reflectivity of all surfaces in-creases from the beginning of observations till approximatelyLs = 55" and then decreases. This is similar to the behaviour ob-served for southern spring surface reflectivity (Pommerol et al.,2011a). In the southern hemisphere this brightening is associatedwith increase of CO2 ice signature, while here, in the northernhemisphere, it is rather correlated with the water ice signature(Pommerol et al., this issue). The trend is also observed in MY31with maximum peak being wider and the maximum of reflectivityappearing earlier, approximately at Ls = 40". In MY29 because ofthe lack of observations before Ls = 47.5" we did not observe the in-crease of reflectivity with the possible exception of dark blotchbrightening. The dune’s slip face, windward side and substratehave very similar behaviour in all three years with the slip face
Fig. 6. Temporal evolution of HiRISE red band reflectivity of four surface types in Buzzel area during three consequent martian years.
G. Portyankina et al. / Icarus xxx (2012) xxx–xxx 7
Please cite this article in press as: Portyankina, G., et al. Observations of the northern seasonal polar cap on Mars II: HiRISE photometric analysis of evo-lution of northern polar dunes in spring. Icarus (2012), http://dx.doi.org/10.1016/j.icarus.2012.10.017
being only slightly darker in MY29 and partially MY31. This is amanifestation of the activity on dunes’ crests that made more darkmaterial available for avalanching down the steep slip faces.
The windward side of the dunes in this field has a very gentleslope and its evolution is mostly similar to that of the flat sub-strate. The dark blotches however display a different trend: theirreflectivity increases with a slower pace than those of other sur-faces and it does so longer, almost till Ls = 70". It also experiencesabrupt darkening at around Ls = 40" (MR30 and 31), 53" and 74"(MY30). Darkening events coincide with new eruptions and newdark streaks appearing on the slip faces of the dunes. In MY30those are also the times of an increase in the number of dark fans.This means that new dark material is brought from below the iceand it is not yet affected by either cleaning or condensation thatprogressively happens when the sand is on top of the ice surface.If the brightening is created by sand sinking into the ice then it
requires more solar energy to get a thicker sand layer movingdown. Another interpretation of slower brightening of darkblotches is that their dark surface on average stays warmer thanthe surrounding icy surface. If the brightening is connected tocondensation of H2O or CO2 that may happen during night thenit will preferably happen on the colder surface.
The earliest spring image in Arrakis was acquired at Ls = 7.5" in(see Hansen et al. (this issue)). The observed reflectivity values atthis time are low, R = 0.26, i.e. much lower than the one expectedfor granular CO2 or water ice but still higher than ice-free dunereflectivity. It is the only image of the area where dunes lookbrighter than substrate, though the differences between reflectiv-ity of dunes, substrate and dark blotches are very small. The darkappearance of the substrate is caused by the extremely early activ-ity creating dark fans exclusively on the substrate. This early image
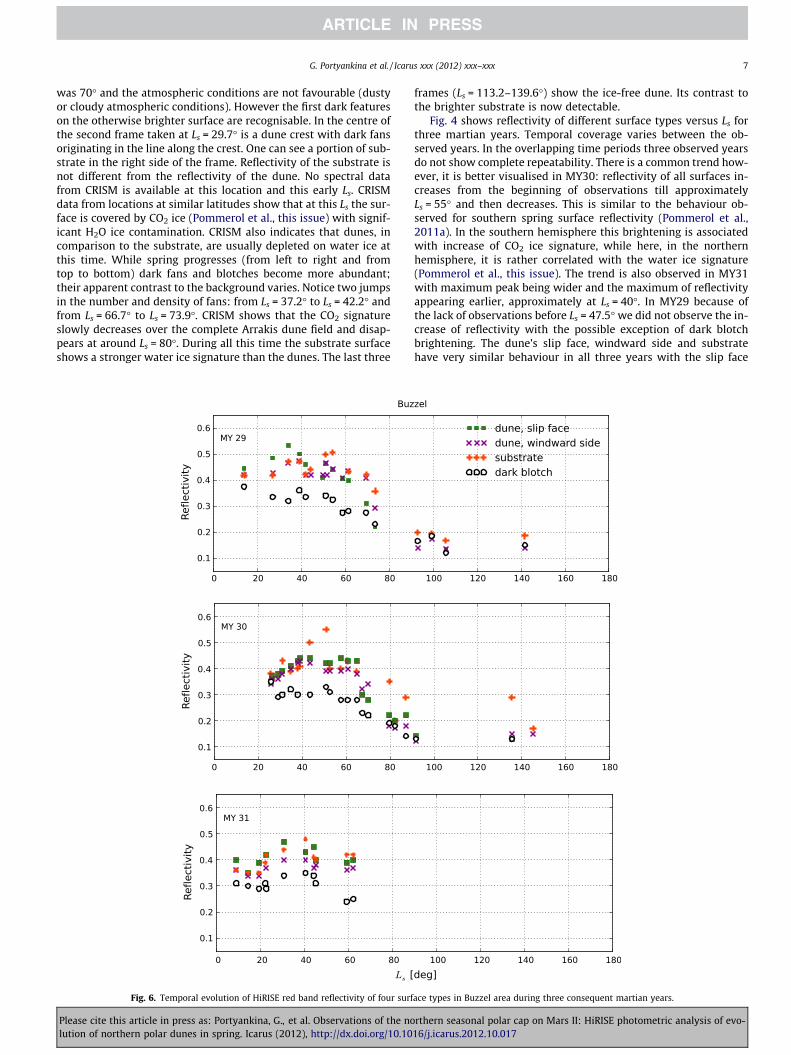
Fig. 7. Temporal evolution of surface reflectivity measured by HiRISE in the widered visible channel compared to surface reflectivity measured by CRISM at 1.08 lmin the region of Buzzel in MY29.
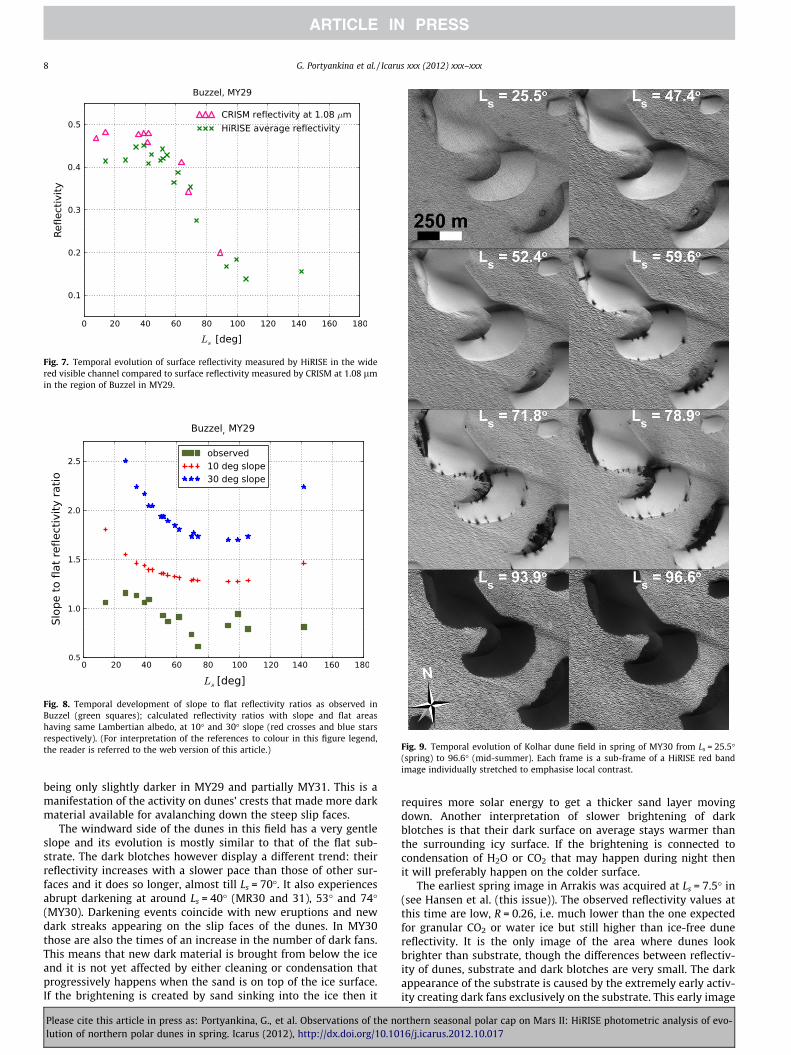
Fig. 8. Temporal development of slope to flat reflectivity ratios as observed inBuzzel (green squares); calculated reflectivity ratios with slope and flat areashaving same Lambertian albedo, at 10" and 30" slope (red crosses and blue starsrespectively). (For interpretation of the references to colour in this figure legend,the reader is referred to the web version of this article.) Fig. 9. Temporal evolution of Kolhar dune field in spring of MY30 from Ls = 25.5"
(spring) to 96.6" (mid-summer). Each frame is a sub-frame of a HiRISE red bandimage individually stretched to emphasise local contrast.
8 G. Portyankina et al. / Icarus xxx (2012) xxx–xxx
Please cite this article in press as: Portyankina, G., et al. Observations of the northern seasonal polar cap on Mars II: HiRISE photometric analysis of evo-lution of northern polar dunes in spring. Icarus (2012), http://dx.doi.org/10.1016/j.icarus.2012.10.017
for the first time revealed that the fan activity may happen on thesubstrate earlier than on the dunes.
2.3. Buzzel
Buzzel is the location extensively monitored by HiRISE for thedetection of avalanches that in spring regularly happen on thesteep slopes of the permanent cap (Russell et al., 2011). The placeis located at 83.7"N, 235.7"E inside the polar cap trough. Next tothe steep scarp there is an extensive dune field where HiRISE ob-serves typical spring dune behaviour. The behaviour observed byCRISM however is different from standard, more on this inPommerol et al. (this issue). In this field dune density is high andgaps showing substrate between them are almost absent. Summerimages show that substrate material in Buzzel is slightly brighterthan the sand that forms the dunes.
Buzzel dunes are oriented in such a way that most slip faces arefacing south. Fig. 5 shows that the slip face is always illuminated atthe time of HiRISE images (i.e. approximately at 3PM local time). InArrakis we were able to avoid the possibility that interpretations
are influenced by a fluke illumination geometry by taking into ac-count dunes with different aspect angles. Here, it is hard to avoidinstantaneous effects of insolation playing a role in our reflectanceplots. This insolation dichotomy between slip faces and windwardslopes may influence the evolution of the surface of the steep slipface. From the reflectivity evolution plot (Fig. 6) we are able to ob-serve some of this influence. The general appearance of the curvesin Buzzel is similar to the ones in Arrakis. Note the higher maxi-mum, reflectivity above 0.5 in Buzzel compared to the maximum0.4 in Arrakis. This might be because of Buzzel’s position closerto the cold permanent cap.
In the beginning of spring MY29 (Ls = 20–40") slip faces arebrighter than windward sides due to the instantaneous geometryof insolation. This is also observed in MY30 and 31 however to asmaller extent. The general trend of increasing surface reflectivityfrom Ls = 10" to Ls = 40" is observed in all 3 years. At approximatelyLs = 70" of MY29 and 30 the contrast between slip faces and wind-ward dune side inverted because the slip faces got covered by darkstreaks. The phenomena however is short and already at Ls = 80"surface gets mostly ice-free and complete dunes including the slip
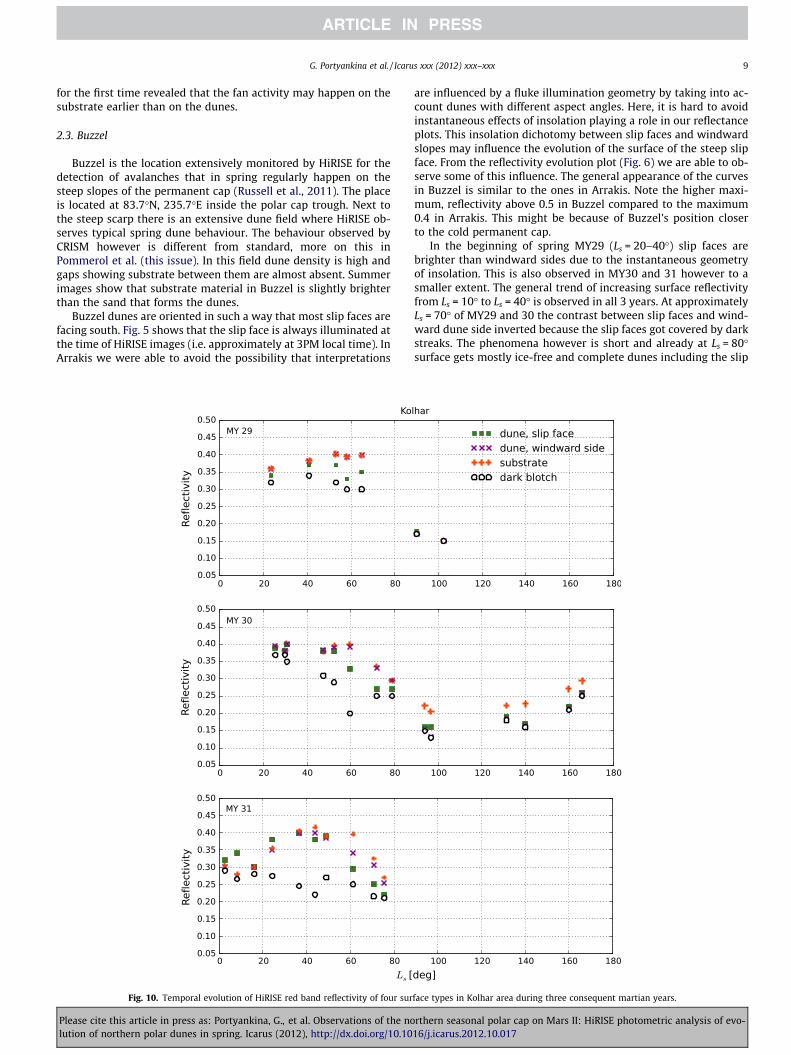
Fig. 10. Temporal evolution of HiRISE red band reflectivity of four surface types in Kolhar area during three consequent martian years.
G. Portyankina et al. / Icarus xxx (2012) xxx–xxx 9
Please cite this article in press as: Portyankina, G., et al. Observations of the northern seasonal polar cap on Mars II: HiRISE photometric analysis of evo-lution of northern polar dunes in spring. Icarus (2012), http://dx.doi.org/10.1016/j.icarus.2012.10.017

faces return to their ice-free reflectivity. For most of MY29 and 30the rare spots of substrate visible between the dunes remainbrighter than dunes themselves with the exception of early spring.
The brightening of dark blotches has a much smaller amplitudethan other surfaces. Their reflectivity stays at an almost even level(R = 0.33 in MY29, 0.30 in MY30) until Ls = 65" when it startsdeclining. This reflectivity value is low, but still higher than thereflectivity of the dune material in summer hinting at ice presentat this time even inside the dark blotches. CRISM confirms thatboth CO2 and H2O ices are in general still present on the surface be-fore Ls = 65".
In a time series from MY29 of one typical dune (Fig. 5) one cansee the development of a dark spot into dark–bright–dark bandingand evolution of the slip face and windward dune sides. Dark–bright–dark banding is typical for several locations in the seasonalpolar cap. Here we observe that it develops on the windward sideof the dune at the same location where earlier in spring (Ls = 13.9")a dark fan was observed. The fan spreads towards the windwardside of the dune, meaning the direction of wind at the time offan creation was opposite to the wind that shaped the dune itself.Already by Ls = 26.9" the dark rim around the bright central areahas developed. By Ls = 41.9" two dark rings are visible. There is alsoa bright and dark extended fan behind the banding. By Ls = 58.7",though very weakly, 3 to 4 rings have appeared. We observe thebanding in many locations appearing on the positions of dark fans.This points to the surface nature of this phenomena, namely inter-action of surface ice with sand deposited by the cold jet eruptiononto the surface. Different sizes of sand grains are deposited at dif-ferent distances from the source (Thomas et al., 2011) and theyeither attract water ice condensation or sink through the ice layerwith a different pace. Simulation of these processes should beundertaken for further evaluation of the time scale of this processand to test if it agrees with the observations.
In order to cross-check our reflectivity values we combinedCRISM and HiRISE data in one plot (Fig. 7). We averaged all foursurface types from the plot in Fig. 6 for MY29 to simulate averaginginside one CRISM pixel. CRISM values are reflectivity at 1.08 lmthat serve as a proxy for the reflectivity in the range of the red bandof HiRISE. The general trends are similar. The differences in abso-lute values are small, they can be attributed to difference of spec-tral range and to the absolute calibration precision of bothinstruments.
A further confirmation of different development of the sub-strate and the dune slopes is shown in Fig. 8. There we have calcu-lated how the reflectivity ratio of dune slope to flat substratedevelop over Ls under the assumption that the Lambertian albedosof both dune and substrate are the same at each point in time. Thisis shown in the figure with the blue and red points for a 10" and30" slope respectively. Because the albedos in the reflectivity ratioscancel out at each Ls, the shape of the curve follows how the ratioof the cosines of the different local incidence angles develop. Bycomparing the shapes of these curves with the green points forthe observation it becomes clear that the dune slope and flat sub-strate undergo different development over time.
Taking into account strongly non-Lambertian behaviour of thesurfaces does not strongly affect the shape of the curves in Fig. 8because of the small emission angles during the observations.Using the data from measurements of the bidirectional reflectancedistribution function for clean ice (Pommerol et al., 2011b) we esti-mate that the errors should stay within 10%.
2.4. Kolhar
Kolhar is situated inside the trough of the permanent cap at84.7"N, 0.8"E. Fig. 9 shows its temporal evolution through springof MY30 and Fig. 10 reflectivity evolution of sub-terrains in 3 years.
Fig. 11. Temporal evolution of Kaitain dune field in spring of MY30 from Ls = 25.5" (spring) to 120.4" (mid-summer). Each frame is a sub-frame of a HiRISE red band imageindividually stretched to emphasise local contrast.
10 G. Portyankina et al. / Icarus xxx (2012) xxx–xxx
Please cite this article in press as: Portyankina, G., et al. Observations of the northern seasonal polar cap on Mars II: HiRISE photometric analysis of evo-lution of northern polar dunes in spring. Icarus (2012), http://dx.doi.org/10.1016/j.icarus.2012.10.017
In the spring the substrate and dunes have very similar reflectivityand for most of spring it stays similar. Until Ls = 59" only a few fanson dune crests and some remnants of fans on the substrate are vis-ible indicating few cold jet activity. In MY29 and MY31 the reflec-tivity follows the general trend of brightening with the subsequentdarkening. The maximum of reflectivity is at approximatelyLs = 60" and this is the same time when the only differentiation be-tween slip slope and the rest of dunes happens: slip slopes get cov-ered by dark streaks right after the eruption of multiple cold jetsvisible at subframe Ls = 59.6" of Fig. 9. In MY30 no brighteningwas observed in times between Ls = 20" and Ls = 60". In the endof summer of MY30 we note an interesting brightening over thecourse of four late observations. Unfortunately no other locationshave time series at these late Ls. Also noteworthy is a very earlydarkening dark blotches starting already at Ls = 30" compared toan approximate constant reflectivity of the dark blotches untilLs = 60" in MY29 and MY31.
2.5. Kaitain
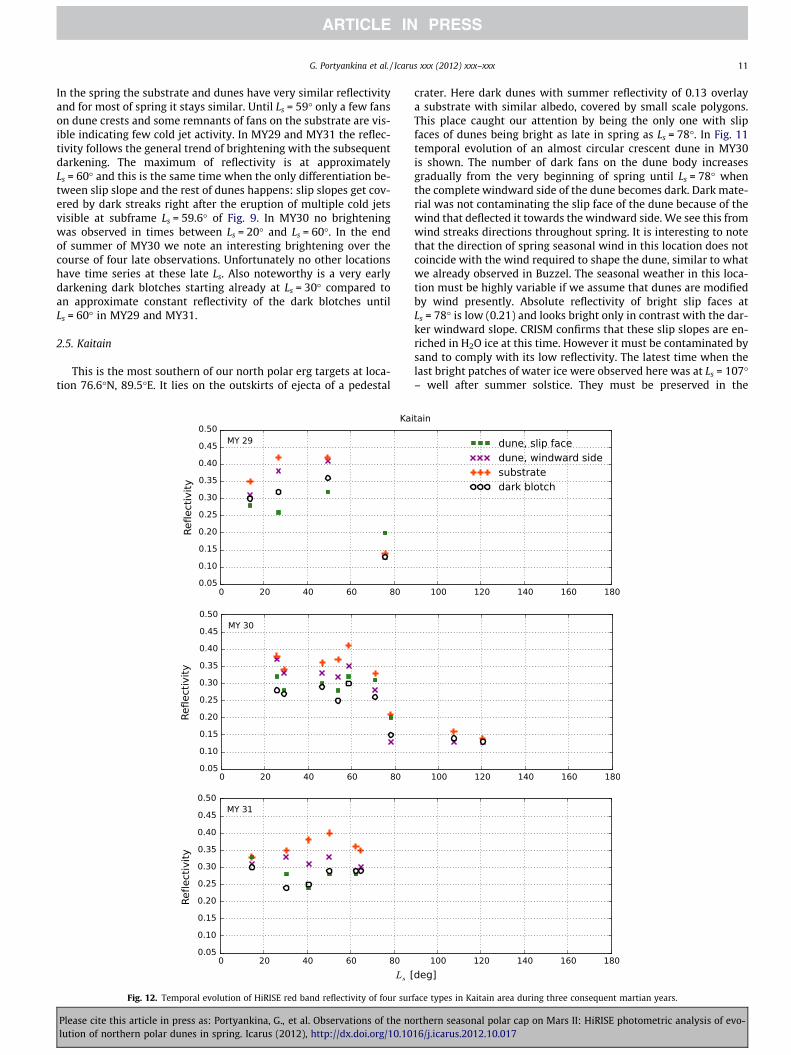
This is the most southern of our north polar erg targets at loca-tion 76.6"N, 89.5"E. It lies on the outskirts of ejecta of a pedestal
crater. Here dark dunes with summer reflectivity of 0.13 overlaya substrate with similar albedo, covered by small scale polygons.This place caught our attention by being the only one with slipfaces of dunes being bright as late in spring as Ls = 78". In Fig. 11temporal evolution of an almost circular crescent dune in MY30is shown. The number of dark fans on the dune body increasesgradually from the very beginning of spring until Ls = 78" whenthe complete windward side of the dune becomes dark. Dark mate-rial was not contaminating the slip face of the dune because of thewind that deflected it towards the windward side. We see this fromwind streaks directions throughout spring. It is interesting to notethat the direction of spring seasonal wind in this location does notcoincide with the wind required to shape the dune, similar to whatwe already observed in Buzzel. The seasonal weather in this loca-tion must be highly variable if we assume that dunes are modifiedby wind presently. Absolute reflectivity of bright slip faces atLs = 78" is low (0.21) and looks bright only in contrast with the dar-ker windward slope. CRISM confirms that these slip slopes are en-riched in H2O ice at this time. However it must be contaminated bysand to comply with its low reflectivity. The latest time when thelast bright patches of water ice were observed here was at Ls = 107"– well after summer solstice. They must be preserved in the
Fig. 12. Temporal evolution of HiRISE red band reflectivity of four surface types in Kaitain area during three consequent martian years.
G. Portyankina et al. / Icarus xxx (2012) xxx–xxx 11
Please cite this article in press as: Portyankina, G., et al. Observations of the northern seasonal polar cap on Mars II: HiRISE photometric analysis of evo-lution of northern polar dunes in spring. Icarus (2012), http://dx.doi.org/10.1016/j.icarus.2012.10.017

semi-permanent shadows between dunes and only disappear latein summer. In the other aspects of spring evolution Kaitain is sur-prisingly similar to the other described locations despite its mostsouthern location. The maximum of surface brightness appear tobe only slightly earlier, around Ls = 50" (see Fig. 12).
2.6. Inter-annual variability
We observe minor differences between evolution of our tar-geted locations in 3 years of observations. In all the locations max-imum brightness in MY30 was reached later than in MY31. InBuzzel, the only shown location where reliable data for early springexist in MY29, the brightening maximum of MY 30 was at a later Ls
than in MY29. Generally in MY30 the brightening happened laterand faster, i.e. more confined in time than in MY29 and 31.
3. Conclusions
This study was inspired by the set of papers discussing sublima-tion phenomena in the southern seasonal polar cap and their con-nection to the solid state greenhouse effect (Pommerol et al.,2011a; Hansen et al., 2010; Thomas et al., 2010; Portyankinaet al., 2010). With an aim to evaluate the level of similarity of phe-nomena observed in both hemispheres we provided a descriptionof spring seasonal activity in four places inside the north polarerg: Arrakis, Buzzel, Kolhar, and Kaitain. For all locations we notethat in the early observations all surfaces have a reflectivity lowerthan 0.4 which is comparable to what we saw in the south (com-pare to point 1 in the list of southern polar observation facts fromthe Introduction section). While this value is higher than the reflec-tivity of ice-free dune material, it is significantly lower than thereflectivity of pure fine-grained CO2 and H2O frost. Currently con-sidered reasons for this low reflectivity are either a translucentice layer that renders the dark surface underneath the ice visibleor dark dust contamination on the ice surface as in the case ofthe so called ‘‘cryptic region’’ in the southern hemisphere.
The appearance of the dunes in spring may be influenced bymany factors, such as local weather and wind direction, volatiledeposition history during fall, and proximity to the permanentcap. However, all the monitored dune areas follow similar trends:the phase of brightening with a maximum at Ls = 55 ± 10" (appr.110 sols) and subsequent darkening with complete CO2 sublima-tion by Ls = 80". This result is consistent with previous OMEGAobservations (Appere et al., 2011) and with simultaneously per-formed CRISM observations (Pommerol et al., this issue). Smallwater ice patches are observed by HiRISE as late as Ls = 107" buthave no strong influence on the overall dune area reflectivity. Ana-logue surface brightening with similar timing is observed in springin the south (point (2) of the southern polar observation facts list).
We observe differences in the sublimation behaviour of the dif-ferent dune sides at small scale: while the windward side of thedunes and the inter-dune substrate often have similar sublimationhistory slip faces behave differently: they either get covered bydark streaks avalanching down or sustain cleaner ice coverdepending on the wind. Differences in CO2–H2O coverage of differ-ent dune sides are observed by CRISM as well (Pommerol et al., thisissue). The orientation of dunes relative to the direction to the polecannot explain the observed differences because in the selectedfields it had a rather wide range: from almost south-facing slipfaces of Buzzel dunes to almost north-facing Kolhar. We did notobserve obvious relation between this direction and activity onthe slip faces. Therefore, we favour the idea that differences inthe sublimation behaviour of the different dune sides are causedby steepness of the slopes. Modeling work will be required in thefuture to prove or disprove this hypothesis. Dark blotches are
another surface type with different spring behaviour: if createdearly (around Ls = 0) they mostly do not follow the general trendof brightening. They can be considered as an north polar analogueto south polar dark fan-shaped deposits (point (3) of the southernpolar observation facts list).
Timing of the appearance of dark fans (and hence cold jets tim-ing) differs on dunes and substrate. Observations show that un-even substrate shows evidence of jet activity earlier than thesmooth dune surface. This is very similar to observations madein the southern hemisphere (Pommerol et al., 2011a; Portyankinaet al., 2012, and point (5) from the list for the southern cap). Al-ready at an early Ls = 2" many developed fans have been observedon the substrate at one location. This observation also explains theabundance of fans and dark blotches around dunes borders re-ported by Hansen et al. (2012b). In the framework of Kieffer’s mod-el: cracks appear first in the ice layer over bumpy substratebecause (a) the ice created here is less stable and (b) small topo-graphical variations provide possibility to absorb more sunlightin the conditions of low spring insolation. The activity over thesubstrate exhausts rapidly after pathways for gas are createdthrough the ice. The ice layer formed over smooth dune surfacesis more stable. In the beginning of spring CO2 gas created under-neath this layer is unable to penetrate it until the ice thins or weak-ens. However, it may escape towards the closest openings in theice that are already created in the substrate next to the dune bor-ders. By transporting dune material and re-depositing it on top ofthe ice it also creates furrows reported by Bourke (2012). Furrowsare erased in summer by movement of sand and do not developinto araneiform shapes. However, they look much alike a singlearm of an araneiform (analogy to point (4) of the list for the south-ern cap).
By examining polar features at high spatial resolution and mon-itoring their changes during spring we build the basis for under-standing the processes that create them. All our observations sofar support the idea that seasonal activities in the northern andsouthern hemispheres are the manifestations of the same pro-cesses. Existing arguments for solid-state greenhouse effect beingthe driving force of all these small-scale phenomena in the southmust as well apply to the north.
Acknowledgment
This work was supported by Swiss National Foundation.
References
Appere, T. et al., 2011. Winter and spring evolution of northern seasonal deposits onMars from OMEGA on Mars Express. J. Geophys. Res. (Planets) 116 (E15),E05001. http://dx.doi.org/10.1029/2010JE003762.
Bourke. M.C., 2012. Seasonal change in polar dune morphology. Lunar Planet. Sci.Conf. 43, 2885 (abstracts).
Clancy, R.T. et al., 2000. An intercomparison of ground-based millimeter, MGS TES,and Viking atmospheric temperature measurements: Seasonal and interannualvariability of temperatures and dust loading in the global Mars atmosphere. J.Geophys. Res. 105, 9553–9572. http://dx.doi.org/10.1029/1999JE001089.
Cull, S. et al., 2010. Seasonal H2O and CO2 ice cycles at the Mars Phoenix landingsite: 1. Prelanding CRISM and HiRISE observations. J. Geophys. Res. (Planets)115 (E14), E00D16. http://dx.doi.org/10.1029/2009JE003340.
Edgett, K.S., Malin, M.C., 2000. New views of Mars eolian activity, materials, andsurface properties: Three vignettes from the Mars Global Surveyor Mars OrbiterCamera. J. Geophys. Res. 105, 1623–1650. http://dx.doi.org/10.1029/1999JE001152.
Hansen, C., Pommerol, A., Portyankina, G., Aye, K.-M., Thomas, N., this issue. Springsublimation of Mars northern seasonal cap observed by CRISM and HiRISE.Icarus.
Hansen, C.J., Thomas, N., Portyankina, G., McEwen, A., Becker, T., Byrne, S.,Herkenhoff, K., Kieffer, H., Mellon, M., 2010. HiRISE observations of gassublimation-driven activity in Mars southern polar regions: I. Erosion of thesurface. Icarus 205, 283–295. http://dx.doi.org/10.1016/j.icarus.2009.07.021.
Hansen, C.J. et al., 2012b. Year 3 HiRISE observations of sublimation of the northernseasonal polar cap on Mars. Lunar Planet. Sci. Conf. 43, 2386 (abstracts).
12 G. Portyankina et al. / Icarus xxx (2012) xxx–xxx
Please cite this article in press as: Portyankina, G., et al. Observations of the northern seasonal polar cap on Mars II: HiRISE photometric analysis of evo-lution of northern polar dunes in spring. Icarus (2012), http://dx.doi.org/10.1016/j.icarus.2012.10.017

Kieffer, H.H., 2007. Cold jets in the martian polar caps. J. Geophys. Res. (Planets) 112(E11), 8005. http://dx.doi.org/10.1029/2006JE002816.
Massé, M., Bourgeois, O., Le Mouélic, S., Verpoorter, C., Spiga, A., Le Deit, L., 2012.Wide distribution and glacial origin of polar gypsum on Mars. Earth Planet. Sci.Lett. 317, 44–55. http://dx.doi.org/10.1016/j.epsl.2011.11.035.
Pilorget, C., Forget, F., Millour, E., Vincendon, M., Madeleine, J.B., 2011. Dark spotsand cold jets in the polar regions of Mars: New clues from a thermal model ofsurface CO2 ice. Icarus 213, 131–149. http://dx.doi.org/10.1016/j.icarus.2011.01.031.
Piqueux, S., Byrne, S., Richardson, M.I., 2003. Sublimation of Mars’ southern seasonalCO2 ice cap and the formation of spiders. J. Geophys. Res. (Planets) 108, 5084.http://dx.doi.org/10.1029/2002JE002007.
Pommerol, A. et al., 2011a. Evolution of south seasonal cap during martian spring:Insights from high-resolution observations by HiRISE and CRISM/MRO. J.Geophys. Res. 116 (E8), E08007. http://dx.doi.org/10.1029/2010JE003790.
Pommerol, A., Thomas, N., Affolter, M., Portyankina, G., Jost, B., Seiferlin, K., Aye, K.-M., 2011b. Photometry and bulk physical properties of Solar System surfaces icyanalogs: The Planetary Ice Laboratory at University of Bern. Planetary and SpaceSciences 59, 1601–1612. http://dx.doi.org/10.1016/j.pss.2011.07.009.
Pommerol, A., Portyankina, G., Hansen, S., Aye, K.-M., Thomas, N., this issue. Springsublimation of Mars northern seasonal cap observed by CRISM and HiRISE.Icarus.
Portyankina, G., Markiewicz, W.J., Thomas, N., Hansen, C.J., Milazzo, M., 2010.HiRISE observations of gas sublimation-driven activity in Mars southern polarregions: III. Models of processes involving translucent ice. Icarus 205, 311–320.http://dx.doi.org/10.1016/j.icarus.2009.08.029.
Portyankina, G., Pommerol, A., Aye, K.-M., Hansen, C.J., Thomas, N., 2012. Polygonalcracks in the seasonal semi-translucent CO2 ice layer in martian polar areas. J.Geophys. Res. (Planets) 117 (E16), E02006. http://dx.doi.org/10.1029/2011JE003917.
Russell, P.S., Byrne, S., Pathare, A., Herkenhoff, K.E., 2011. Mass wasting of ices in theMars north polar region: An active process in the erosion and evolution of polarscarps. LPI Contrib. 1323, 6034–6035.
Smith, M.D., 2004. Interannual variability in TES atmospheric observations of Marsduring 1999–2003. Icarus 167, 148–165. http://dx.doi.org/10.1016/S0019-1035(03)00287-2.
Thomas, N., Hansen, C.J., Portyankina, G., Russell, P.S., 2010. HiRISE observations ofgas sublimation-driven activity in Mars southern polar regions: II. Surficialdeposits and their origins. Icarus 205, 296–310. http://dx.doi.org/10.1016/j.icarus.2009.05.030.
Thomas, N., Portyankina, G., Hansen, C.J., Pommerol, A., 2011. Sub-surface CO2 gasflow in Mars’ polar regions: Gas transport under constant production rateconditions. Geophys. Res. Lett. 38, L08203. http://dx.doi.org/10.1029/2011GL046797.
G. Portyankina et al. / Icarus xxx (2012) xxx–xxx 13
Please cite this article in press as: Portyankina, G., et al. Observations of the northern seasonal polar cap on Mars II: HiRISE photometric analysis of evo-lution of northern polar dunes in spring. Icarus (2012), http://dx.doi.org/10.1016/j.icarus.2012.10.017
Copyright © 2022 FDOKUMEN