Objectives of fisheries management: case studies from the UK, France, Spain and Denmark
14
Marine Policy 26 (2002) 415–428 Objectives of fisheries management: case studies from the UK, France, Spain and Denmark Simon Mardle a, *, Sean Pascoe a , Jean Boncoeur b , Bertrand Le Gallic b , Juan J. Garc ! ıa-Hoyo c , In ! es Herrero c , Ramon Jimenez-Toribio c , Concepci ! on Cortes c , Nuria Padilla c , Jesper Raakjaer Nielsen d , Christoph Mathiesen d a Centre for the Economics and Management of Aquatic Resources (CEMARE), University of Portsmouth, Locksway Road, Portsmouth, Hants PO4 8JF, UK b Centre de Droit et Economie de la Mer (CEDEM), Universite de Bretagne Occidentale, BP 816, 12 Rue de Kergoat, Brest 29285, France c Modelizacion Economica y Matematica de Pesquerias (MEMPES), Departmento de Economia Aplicada, University of Huelva, Plaza de la Merced s/n, Huelva 21071, Spain d Institute for Fisheries Management and Coastal Community Development (IFM), PO Box 104, Willemoesvei 2, Hirtshals 9850, Denmark Received 15 April 2002; accepted 15 May 2002 Abstract The main objectives of fisheries management are generally similar throughout the world. These are often stated in policy documents such as the Common Fisheries Policy and the Magnuson–Stevens Fishery Conservation and Management Act. However, at the local level often the key objectives of management are more detailed, characterised by both the overriding management structure and the status and type of fishery concerned. In this paper, we consider case study fisheries from the UK, France, Spain and Denmark to compare some of the various types of fisheries and fisheries management systems that exist in the European Union. From this, we define the key objectives for each management system. r 2002 Elsevier Science Ltd. All rights reserved. Keywords: Objectives; Fisheries management; Common fisheries policy 1. Introduction In accordance with overall management policy for resource conservation and management, the general objectives of EU fisheries management are clearly stated in the CFP (Article 2 of Council Regulation (EC) 3760/ 92): As concerns the exploitation activities the general objectives of the common fisheries policy shall be to protect and conserve available and accessible living marine aquatic resources, and to provide for rational exploitation on a sustainable basis, in appropriate economic and social conditions for the sector, taking into account of its implications for the marine ecosystem, and in particular taking into account of the needs of both producers and consumers. In fact, most fisheries management policies around the world have almost identical aims, e.g. the FAO Code of Conduct for Responsible Fisheries (1995; Article 2(a)) and the US Magnuson–Stevens Fishery Conservation and Management Act (1996; TITLE III SEC. 301. 104– 297). Fisheries management is therefore clearly char- acterised by multiple objectives, some of which may be conflicting [1]. The most obvious of these is the conflict between jobs and catch, especially where overcapacity is an issue. Some of the most commonly declared objectives of fisheries management are: (i) resource conservation; (ii) food production; (iii) generation of economic wealth; (iv) generation of reasonable income for fishers; (v) maintaining employment for fishers; and (vi) maintaining the viability of fishing communities [2]. Many studies have considered the multiple objectives of fisheries management, and the potential incompat- ibilities and inconsistencies associated (e.g. [1–4]). One of the first authors to formally discuss the economic and political objective components to fisheries management *Corresponding author. Tel.: +44-23-9284-4277; fax: +44-23-9284- 4037. E-mail address: [email protected] (S. Mardle). 0308-597X/02/$ - see front matterr 2002 Elsevier Science Ltd. All rights reserved. PII:S0308-597X(02)00022-2
Transcript of Objectives of fisheries management: case studies from the UK, France, Spain and Denmark
Marine Policy 26 (2002) 415–428
Objectives of fisheries management: case studies from the UK,France, Spain and Denmark
Simon Mardlea,*, Sean Pascoea, Jean Boncoeurb, Bertrand Le Gallicb,Juan J. Garc!ıa-Hoyoc, In!es Herreroc, Ramon Jimenez-Toribioc, Concepci !on Cortesc,
Nuria Padillac, Jesper Raakjaer Nielsend, Christoph Mathiesend
aCentre for the Economics and Management of Aquatic Resources (CEMARE), University of Portsmouth, Locksway Road, Portsmouth,
Hants PO4 8JF, UKbCentre de Droit et Economie de la Mer (CEDEM), Universite de Bretagne Occidentale, BP 816, 12 Rue de Kergoat, Brest 29285, France
cModelizacion Economica y Matematica de Pesquerias (MEMPES), Departmento de Economia Aplicada, University of Huelva,
Plaza de la Merced s/n, Huelva 21071, Spaind Institute for Fisheries Management and Coastal Community Development (IFM), PO Box 104, Willemoesvei 2, Hirtshals 9850, Denmark
Received 15 April 2002; accepted 15 May 2002
Abstract
The main objectives of fisheries management are generally similar throughout the world. These are often stated in policy
documents such as the Common Fisheries Policy and the Magnuson–Stevens Fishery Conservation and Management Act.
However, at the local level often the key objectives of management are more detailed, characterised by both the overriding
management structure and the status and type of fishery concerned. In this paper, we consider case study fisheries from the UK,
France, Spain and Denmark to compare some of the various types of fisheries and fisheries management systems that exist in the
European Union. From this, we define the key objectives for each management system.
r 2002 Elsevier Science Ltd. All rights reserved.
Keywords: Objectives; Fisheries management; Common fisheries policy
1. Introduction
In accordance with overall management policy forresource conservation and management, the generalobjectives of EU fisheries management are clearly statedin the CFP (Article 2 of Council Regulation (EC) 3760/92):
As concerns the exploitation activities the generalobjectives of the common fisheries policy shall be toprotect and conserve available and accessible livingmarine aquatic resources, and to provide for rationalexploitation on a sustainable basis, in appropriateeconomic and social conditions for the sector, takinginto account of its implications for the marineecosystem, and in particular taking into account ofthe needs of both producers and consumers.
In fact, most fisheries management policies aroundthe world have almost identical aims, e.g. the FAO Codeof Conduct for Responsible Fisheries (1995; Article 2(a))and the US Magnuson–Stevens Fishery Conservationand Management Act (1996; TITLE III SEC. 301. 104–297). Fisheries management is therefore clearly char-acterised by multiple objectives, some of which may beconflicting [1]. The most obvious of these is the conflictbetween jobs and catch, especially where overcapacity isan issue. Some of the most commonly declaredobjectives of fisheries management are: (i) resourceconservation; (ii) food production; (iii) generation ofeconomic wealth; (iv) generation of reasonable incomefor fishers; (v) maintaining employment for fishers; and(vi) maintaining the viability of fishing communities [2].
Many studies have considered the multiple objectivesof fisheries management, and the potential incompat-ibilities and inconsistencies associated (e.g. [1–4]). Oneof the first authors to formally discuss the economic andpolitical objective components to fisheries management
*Corresponding author. Tel.: +44-23-9284-4277; fax: +44-23-9284-
4037.
E-mail address: [email protected] (S. Mardle).
0308-597X/02/$ - see front matterr 2002 Elsevier Science Ltd. All rights reserved.
PII: S 0 3 0 8 - 5 9 7 X ( 0 2 ) 0 0 0 2 2 - 2
in the literature was Crutchfield [1]. Until this time, theoverriding objective concentrated on in fisheries man-agement studies was the concept of maximum sustain-able yield (MSY). This is not surprising as at theInternational Law Commission Conference on Sea Lawin 1958, MSY was recognised as the basic objective infisheries management. Cunningham [5] makes thedistinction between MSY and optimum sustainableyield (OSY), the level used by ICES1 in providingscientific recommendations. OSY is a level of fishingbelow MSY, with the aims of reducing risk of stockdepletion and reducing fluctuations of yearly catch [5].Even though there is now the recognition of multipleobjectives, MSY still appears as a prominent objective.For example, in the FAO2 Code of Conduct forResponsible Fisheries (1995), Article 7.2 on FisheriesManagement states that measures should be adoptedthat are ‘‘capable of producing MSY, as qualified byrelevant environmental and economic factors’’.
Pope [4] notes that it is well documented thatgenerally the multiple objectives of fisheries manage-ment cannot be simultaneously optimised. As such thereis a natural conflict between objectives. According toPope [4], a key deficiency in policy statements is thatthey do ‘‘not set priorities or trade-offs between thevarious objectives nor do they set measurable targets forindividual objectives’’. This makes it difficult todetermine whether the objectives have been achievedor not. Barber and Taylor [6] further recognise that notunderstanding the concepts of objectives, and accom-panying goals and values, leads to broadly defined goalswithout substantial justification. They also note that this‘‘is a major factor’’ in conflicts caused between groups infisheries management. Hanna and Smith [7] concur thatdifferent goal orientations are a major source of conflictin fisheries management, as well as structural effective-ness, biological changes and cultural (i.e. interest groupstandpoint) characteristics. Lane [8] further categorisesthe conflicts between objectives in fisheries managementas long-term biological or conservation objectives versus
short-term economic objectives. As such, he defines themain management issues in a tree.
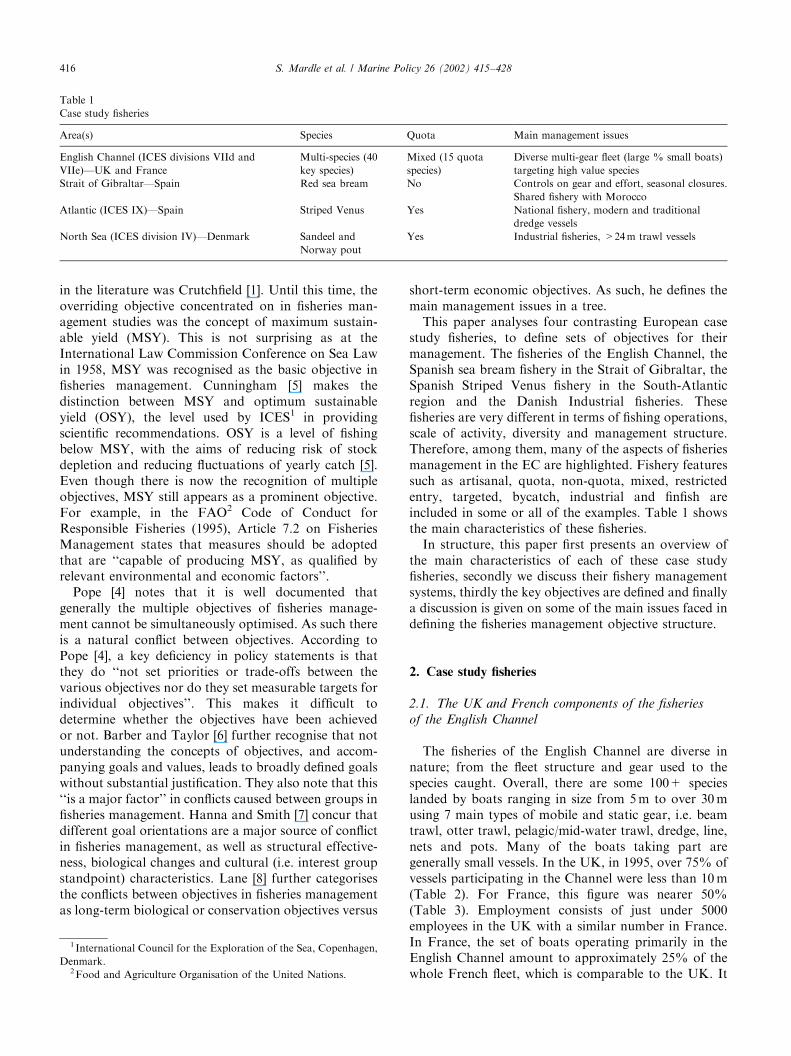
This paper analyses four contrasting European casestudy fisheries, to define sets of objectives for theirmanagement. The fisheries of the English Channel, theSpanish sea bream fishery in the Strait of Gibraltar, theSpanish Striped Venus fishery in the South-Atlanticregion and the Danish Industrial fisheries. Thesefisheries are very different in terms of fishing operations,scale of activity, diversity and management structure.Therefore, among them, many of the aspects of fisheriesmanagement in the EC are highlighted. Fishery featuressuch as artisanal, quota, non-quota, mixed, restrictedentry, targeted, bycatch, industrial and finfish areincluded in some or all of the examples. Table 1 showsthe main characteristics of these fisheries.
In structure, this paper first presents an overview ofthe main characteristics of each of these case studyfisheries, secondly we discuss their fishery managementsystems, thirdly the key objectives are defined and finallya discussion is given on some of the main issues faced indefining the fisheries management objective structure.
2. Case study fisheries
2.1. The UK and French components of the fisheries
of the English Channel
The fisheries of the English Channel are diverse innature; from the fleet structure and gear used to thespecies caught. Overall, there are some 100+ specieslanded by boats ranging in size from 5m to over 30musing 7 main types of mobile and static gear, i.e. beamtrawl, otter trawl, pelagic/mid-water trawl, dredge, line,nets and pots. Many of the boats taking part aregenerally small vessels. In the UK, in 1995, over 75% ofvessels participating in the Channel were less than 10m(Table 2). For France, this figure was nearer 50%(Table 3). Employment consists of just under 5000employees in the UK with a similar number in France.In France, the set of boats operating primarily in theEnglish Channel amount to approximately 25% of thewhole French fleet, which is comparable to the UK. It
Table 1
Case study fisheries
Area(s) Species Quota Main management issues
English Channel (ICES divisions VIId and
VIIe)—UK and France
Multi-species (40
key species)
Mixed (15 quota
species)
Diverse multi-gear fleet (large % small boats)
targeting high value species
Strait of Gibraltar—Spain Red sea bream No Controls on gear and effort, seasonal closures.
Shared fishery with Morocco
Atlantic (ICES IX)—Spain Striped Venus Yes National fishery, modern and traditional
dredge vessels
North Sea (ICES division IV)—Denmark Sandeel and
Norway pout
Yes Industrial fisheries, >24m trawl vessels
1 International Council for the Exploration of the Sea, Copenhagen,
Denmark.2Food and Agriculture Organisation of the United Nations.
S. Mardle et al. / Marine Policy 26 (2002) 415–428416
can therefore be classified as a multi-species, multi-gear(almost-artisanal) fishery. The location of the EnglishChannel fisheries are defined by ICES sub-divisionsVIId and VIIe.
Due to its complexity [9] and the important roleplayed by stakeholders it is a particularly interestingexample for this study. The English Channel is exploitedcommercially by some 4000 fishing boats, the majorityEnglish and French, and coming from the harbours ofthe Channel. Tables 2 and 3 summarise these fleetsrespectively by region, i.e. western Channel (VIIe) andeastern Channel (VIId), and main port districts. It isnoticeable that the fleets of the east and west are similarwhen compared by boat numbers and employment,however the value of the landings is generally consider-ably higher in the west. The geographical distribution ofthe fleets is heterogeneous. A number of different typesof gear are used, catching a wide range of species(mainly non-quota species), resulting in a substantialnumber of technical interactions between fleets [9]. Inaddition, many fishers switch gear during the year inresponse to environmental and economic conditions. Asa result, the Channel may be considered as one largemulti-species multi-gear fishery rather than a number ofseparate fisheries geographically co-located [10].
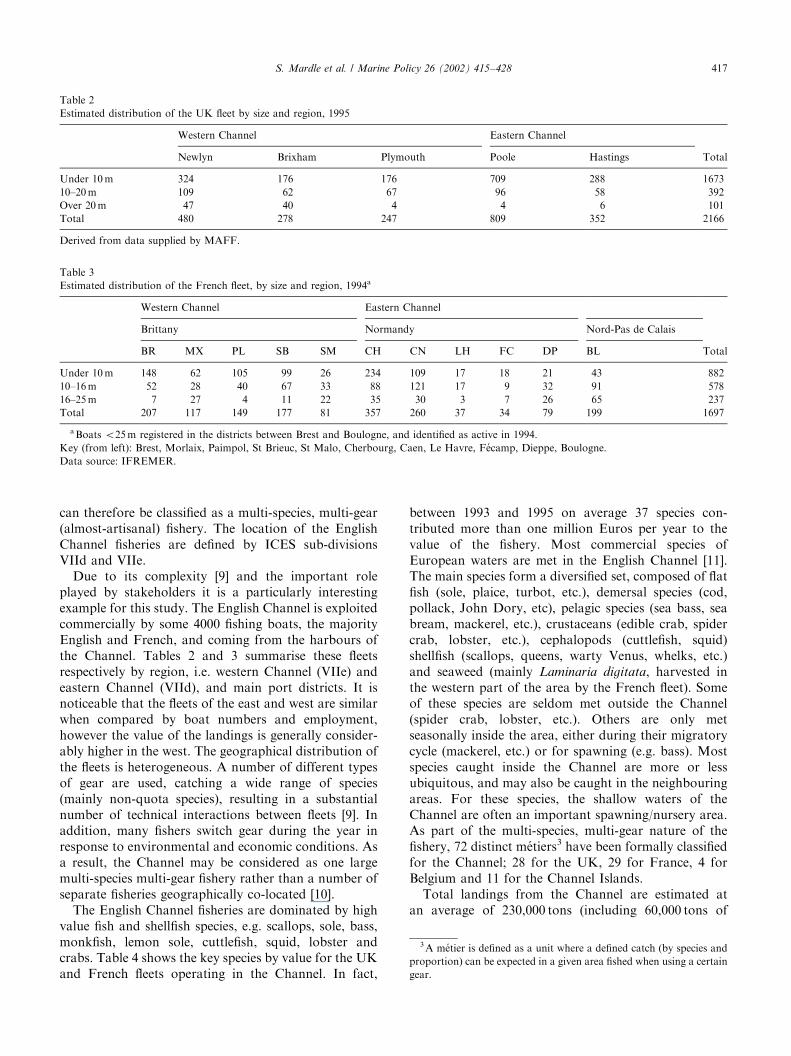
The English Channel fisheries are dominated by highvalue fish and shellfish species, e.g. scallops, sole, bass,monkfish, lemon sole, cuttlefish, squid, lobster andcrabs. Table 4 shows the key species by value for the UKand French fleets operating in the Channel. In fact,
between 1993 and 1995 on average 37 species con-tributed more than one million Euros per year to thevalue of the fishery. Most commercial species ofEuropean waters are met in the English Channel [11].The main species form a diversified set, composed of flatfish (sole, plaice, turbot, etc.), demersal species (cod,pollack, John Dory, etc), pelagic species (sea bass, seabream, mackerel, etc.), crustaceans (edible crab, spidercrab, lobster, etc.), cephalopods (cuttlefish, squid)shellfish (scallops, queens, warty Venus, whelks, etc.)and seaweed (mainly Laminaria digitata, harvested inthe western part of the area by the French fleet). Someof these species are seldom met outside the Channel(spider crab, lobster, etc.). Others are only metseasonally inside the area, either during their migratorycycle (mackerel, etc.) or for spawning (e.g. bass). Mostspecies caught inside the Channel are more or lessubiquitous, and may also be caught in the neighbouringareas. For these species, the shallow waters of theChannel are often an important spawning/nursery area.As part of the multi-species, multi-gear nature of thefishery, 72 distinct m!etiers3 have been formally classifiedfor the Channel; 28 for the UK, 29 for France, 4 forBelgium and 11 for the Channel Islands.
Total landings from the Channel are estimated atan average of 230,000 tons (including 60,000 tons of
Table 2
Estimated distribution of the UK fleet by size and region, 1995
Western Channel Eastern Channel
Newlyn Brixham Plymouth Poole Hastings Total
Under 10m 324 176 176 709 288 1673
10–20m 109 62 67 96 58 392
Over 20m 47 40 4 4 6 101
Total 480 278 247 809 352 2166
Derived from data supplied by MAFF.
Table 3
Estimated distribution of the French fleet, by size and region, 1994a
Western Channel Eastern Channel
Brittany Normandy Nord-Pas de Calais
BR MX PL SB SM CH CN LH FC DP BL Total
Under 10m 148 62 105 99 26 234 109 17 18 21 43 882
10–16m 52 28 40 67 33 88 121 17 9 32 91 578
16–25m 7 27 4 11 22 35 30 3 7 26 65 237
Total 207 117 149 177 81 357 260 37 34 79 199 1697
aBoats o25m registered in the districts between Brest and Boulogne, and identified as active in 1994.
Key (from left): Brest, Morlaix, Paimpol, St Brieuc, St Malo, Cherbourg, Caen, Le Havre, F!ecamp, Dieppe, Boulogne.
Data source: IFREMER.
3A m!etier is defined as a unit where a defined catch (by species and
proportion) can be expected in a given area fished when using a certain
gear.
S. Mardle et al. / Marine Policy 26 (2002) 415–428 417
seaweed), representing a value of around 500 millionEuros [12]. As shown in Table 4, much of this valuederives from species that are out of the range of the EUsystem of TACs and quotas.
2.2. The Strait of Gibraltar red bream (Pagellus
bogaraveo) fishery of Spain
The fishing of red bream in the Gibraltar Strait area isa very recent activity. It is one of the few prosperouscoastal fisheries in the South of Spain, and has an auto-management system to regulate the fishery. Pagellusbogaraveo has long been highly appreciated, especiallycaptures from the North of Spain in the Cantabric Sea.However, these northern fishing grounds are nowexhausted. Originally some Ceuta vessels started oper-ating in the Strait of Gibraltar fishery in the 1970s but itwas not until 1983 that many of the Tarifa vessels sawthe fishing potential. The proportion of red bream incaptures in Tarifa increased from 10% of total landingsin 1980 to 50% in 1990, reaching nearly 93% of the totallandings in 1994. Since then hardly any other fishery hasbeen developed in the area except for some line fisheriescapturing tuna. The fleet size has increased at the samepace as the level of captures [13] the fishery showed aslight decline that could be observed in a decrease incaptures per fishing day CPFD; It seems that for certainyears the huge abundance of angelfish (Brama brama)led to a decrease in the captures of red bream. In 1998,the sharp decrease in the CPFD brought about theestablishment of further regulations on this fishery by
the authorities. The red bream fleet uses long-line andmost of the vessels are based in the port of Tarifaalthough there are some in Algeciras, Barbate, La L!ınea,Ceuta and M!alaga.
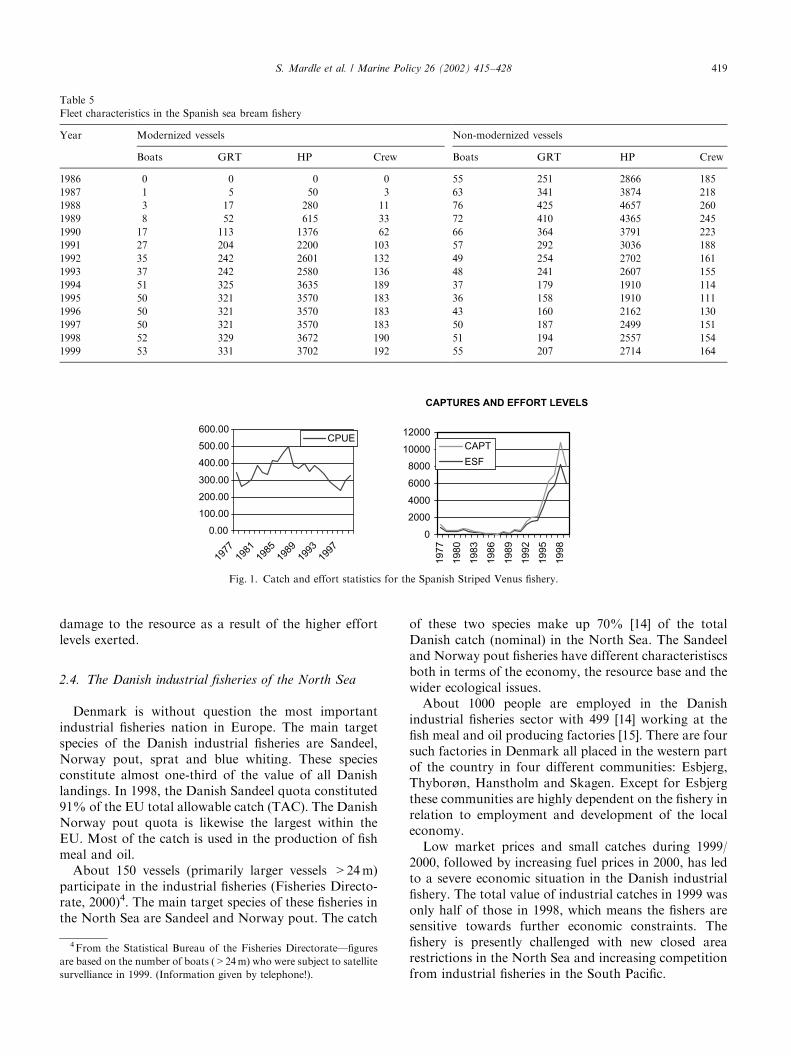
Two types of vessels operate in the fishery; those withmechanical gears to raise the line and those raising itmanually. Effort in this fishery has been reduced inrecent years leading to reduced catches which seems tohave improved stock conservation. Throughout theanalysed period the Tarifa fleet has rapidly increased.In 1986 the fleet was made up of around 55 vessels witha total of 251 GRT and 185 crew members whereastoday there are 108 vessels with a total of 538 GRT anda crew of 356 (see Table 5). These figures imply anincrease of 96.4% in the number of vessels, 114.3% inthe capacity and a 92.4% increase in the number of crewmembers. It could be the only coastal fishery inAndalusia that has experienced such an increase in thelast few years. Moreover, the increase is even higher ifthe evolution of the fleet is analysed in terms of fishingcapacity. From Table 5, it seems clear that a rapidmodernisation of the Tarifa fleet occurred between 1987and 1994. Since then a loss of profitability in the fisheryhas led to a less rapid, but steady continuation of theprocess.
2.3. The Striped Venus (Chamelea gallina) fishery in
the South-Atlantic Spanish region
Since the late 1950s the Striped Venus fishery has beenthe most important in the shellfish sector in the provinceof Huelva. As a consequence, the Striped Venus fisheryhas become of great economic importance. Like the redbream fishery, this fishery is a prosperous coastal fisherywith an auto-management system to regulate the fishery.Traditionally, the towed rake has been the most usedgear to capture Striped Venus. Striped Venus captureshave to be landed and auctioned only in certain ports.There are special characteristics in the production andtrade process, and a special system of industrial relationswhere there still exists the so-called ‘‘share system’’.
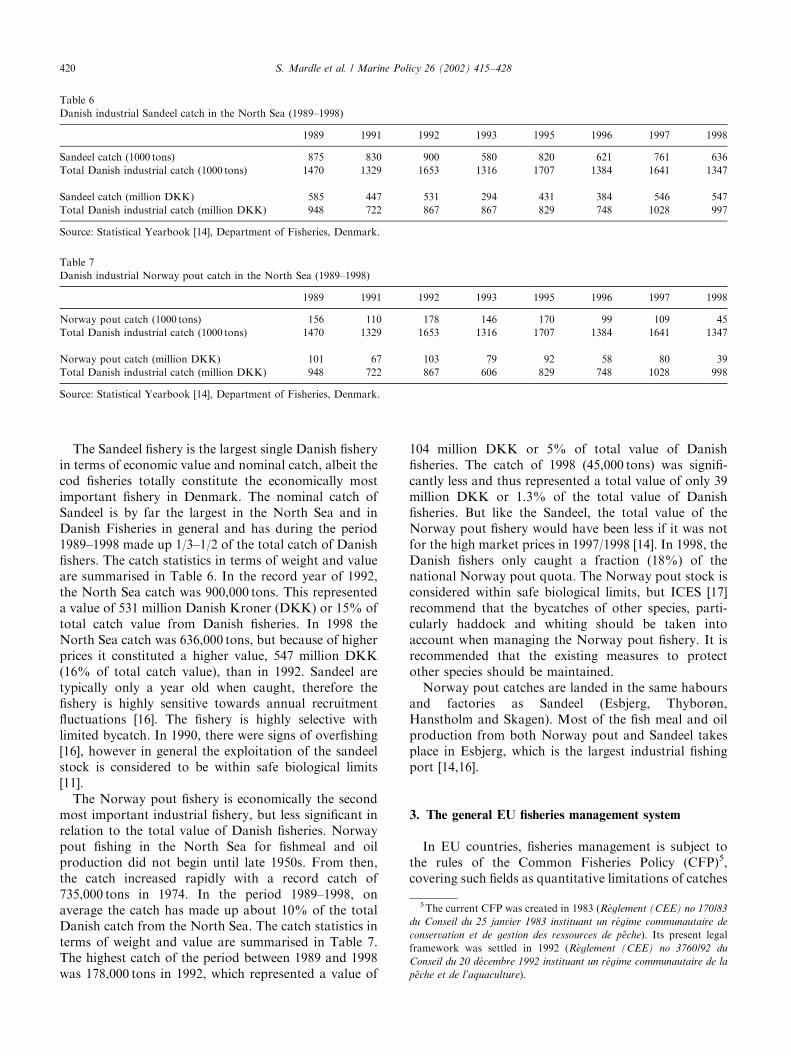
In the last 10 years, there has been an enormoustransformation in the Striped Venus fishery caused bythe increased specialisation of the vessels. Most of thevessels were multipurpose in the past, however now thesituation is just the opposite. In fact, the majority ofvessels are monovalent. The reason for this change hasbeen due to the introduction of the hydraulic dredge.This has increased the fishing power greatly, raising theprofitability of the fishery and enabling this catch tocompete in the national market. Consequently, the stockof the resource has been drastically reduced and itssustainable exploitation is in danger. As shown in Fig. 1,since 1991 the fishing effort has continued to increase. In1996, the fishing effort grew 76% even though CPUEdecreased more than 20%. This shows the enormous
Table 4
Top 20 species landed from the English Channel by UK and French
fleets
Landings Estimated value UK (%) France (%)
1. Scallop 26544 59122.66 55.2 44.8
2. Sole 5331 45702.66 61.5 38.5
3. Cuttlefish 10560 17962.56 22.6 77.4
4. Mackerel 26260 16740.75 74.6 25.4
5. Squid 4060 14737.80 19.7 80.3
6. Edible crab 8516 14481.20 82.6 17.4
7. Spider crab 6375 12676.01 79.5 20.5
8. Plaice 6818 10659.94 60.3 39.7
9. Bass 1097 9804.44 50.5 49.5
10. Scad 11400 8994.60 92.4 7.6
11. Cod 3771 8313.17 34.9 65.1
12. Monkfish 2028 8125.18 41.1 58.9
13. Lobster 451 7189.21 80.7 19.3
14. Whelk 10000 6825.00 80.3 19.7
15. Whiting 7563 6806.70 19.3 80.7
16. Lemon sole 1486 5949.94 61.4 38.6
17. Skates, rays 3127 5820.91 19.7 80.3
18. Red mullet 1007 4835.11 8.5 91.5
19. Black bream 2220 4754.13 13.4 86.6
20. Gurnards 5243 4731.48 7.0 93.0
Source: Pascoe [12] and Bahamas database.
S. Mardle et al. / Marine Policy 26 (2002) 415–428418
damage to the resource as a result of the higher effortlevels exerted.
2.4. The Danish industrial fisheries of the North Sea
Denmark is without question the most importantindustrial fisheries nation in Europe. The main targetspecies of the Danish industrial fisheries are Sandeel,Norway pout, sprat and blue whiting. These speciesconstitute almost one-third of the value of all Danishlandings. In 1998, the Danish Sandeel quota constituted91% of the EU total allowable catch (TAC). The DanishNorway pout quota is likewise the largest within theEU. Most of the catch is used in the production of fishmeal and oil.
About 150 vessels (primarily larger vessels >24m)participate in the industrial fisheries (Fisheries Directo-rate, 2000)4. The main target species of these fisheries inthe North Sea are Sandeel and Norway pout. The catch
of these two species make up 70% [14] of the totalDanish catch (nominal) in the North Sea. The Sandeeland Norway pout fisheries have different characteristiscsboth in terms of the economy, the resource base and thewider ecological issues.
About 1000 people are employed in the Danishindustrial fisheries sector with 499 [14] working at thefish meal and oil producing factories [15]. There are foursuch factories in Denmark all placed in the western partof the country in four different communities: Esbjerg,Thybor�n, Hanstholm and Skagen. Except for Esbjergthese communities are highly dependent on the fishery inrelation to employment and development of the localeconomy.
Low market prices and small catches during 1999/2000, followed by increasing fuel prices in 2000, has ledto a severe economic situation in the Danish industrialfishery. The total value of industrial catches in 1999 wasonly half of those in 1998, which means the fishers aresensitive towards further economic constraints. Thefishery is presently challenged with new closed arearestrictions in the North Sea and increasing competitionfrom industrial fisheries in the South Pacific.
Table 5
Fleet characteristics in the Spanish sea bream fishery
Year Modernized vessels Non-modernized vessels
Boats GRT HP Crew Boats GRT HP Crew
1986 0 0 0 0 55 251 2866 185
1987 1 5 50 3 63 341 3874 218
1988 3 17 280 11 76 425 4657 260
1989 8 52 615 33 72 410 4365 245
1990 17 113 1376 62 66 364 3791 223
1991 27 204 2200 103 57 292 3036 188
1992 35 242 2601 132 49 254 2702 161
1993 37 242 2580 136 48 241 2607 155
1994 51 325 3635 189 37 179 1910 114
1995 50 321 3570 183 36 158 1910 111
1996 50 321 3570 183 43 160 2162 130
1997 50 321 3570 183 50 187 2499 151
1998 52 329 3672 190 51 194 2557 154
1999 53 331 3702 192 55 207 2714 164
0.00
100.00
200.00
300.00
400.00
500.00
600.00
1977
1981
1985
1989
1993
1997
CPUE
CAPTURES AND EFFORT LEVELS
0
2000
4000
6000
8000
10000
120001977
1980
1983
1986
1989
1992
1995
1998
CAPT
ESF
Fig. 1. Catch and effort statistics for the Spanish Striped Venus fishery.
4From the Statistical Bureau of the Fisheries Directorate—figures
are based on the number of boats (>24m) who were subject to satellite
survelliance in 1999. (Information given by telephone!).
S. Mardle et al. / Marine Policy 26 (2002) 415–428 419
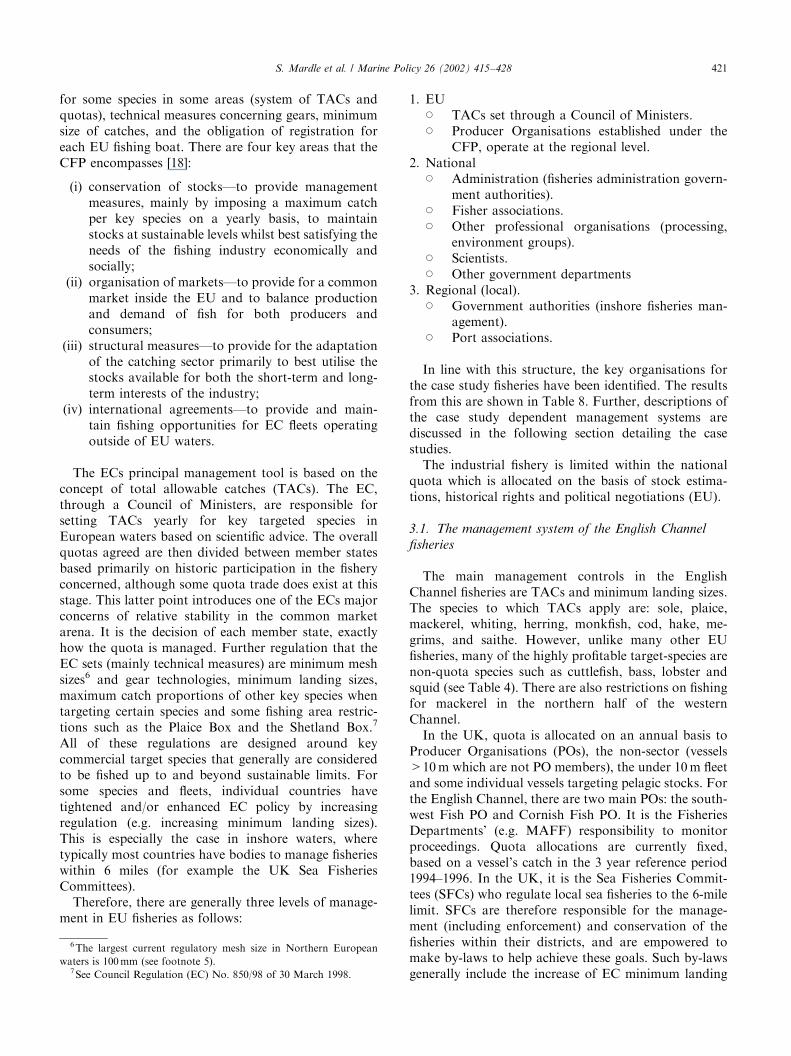
The Sandeel fishery is the largest single Danish fisheryin terms of economic value and nominal catch, albeit thecod fisheries totally constitute the economically mostimportant fishery in Denmark. The nominal catch ofSandeel is by far the largest in the North Sea and inDanish Fisheries in general and has during the period1989–1998 made up 1/3–1/2 of the total catch of Danishfishers. The catch statistics in terms of weight and valueare summarised in Table 6. In the record year of 1992,the North Sea catch was 900,000 tons. This representeda value of 531 million Danish Kroner (DKK) or 15% oftotal catch value from Danish fisheries. In 1998 theNorth Sea catch was 636,000 tons, but because of higherprices it constituted a higher value, 547 million DKK(16% of total catch value), than in 1992. Sandeel aretypically only a year old when caught, therefore thefishery is highly sensitive towards annual recruitmentfluctuations [16]. The fishery is highly selective withlimited bycatch. In 1990, there were signs of overfishing[16], however in general the exploitation of the sandeelstock is considered to be within safe biological limits[11].
The Norway pout fishery is economically the secondmost important industrial fishery, but less significant inrelation to the total value of Danish fisheries. Norwaypout fishing in the North Sea for fishmeal and oilproduction did not begin until late 1950s. From then,the catch increased rapidly with a record catch of735,000 tons in 1974. In the period 1989–1998, onaverage the catch has made up about 10% of the totalDanish catch from the North Sea. The catch statistics interms of weight and value are summarised in Table 7.The highest catch of the period between 1989 and 1998was 178,000 tons in 1992, which represented a value of
104 million DKK or 5% of total value of Danishfisheries. The catch of 1998 (45,000 tons) was signifi-cantly less and thus represented a total value of only 39million DKK or 1.3% of the total value of Danishfisheries. But like the Sandeel, the total value of theNorway pout fishery would have been less if it was notfor the high market prices in 1997/1998 [14]. In 1998, theDanish fishers only caught a fraction (18%) of thenational Norway pout quota. The Norway pout stock isconsidered within safe biological limits, but ICES [17]recommend that the bycatches of other species, parti-cularly haddock and whiting should be taken intoaccount when managing the Norway pout fishery. It isrecommended that the existing measures to protectother species should be maintained.
Norway pout catches are landed in the same haboursand factories as Sandeel (Esbjerg, Thybor�n,Hanstholm and Skagen). Most of the fish meal and oilproduction from both Norway pout and Sandeel takesplace in Esbjerg, which is the largest industrial fishingport [14,16].
3. The general EU fisheries management system
In EU countries, fisheries management is subject tothe rules of the Common Fisheries Policy (CFP)5,covering such fields as quantitative limitations of catches
Table 6
Danish industrial Sandeel catch in the North Sea (1989–1998)
1989 1991 1992 1993 1995 1996 1997 1998
Sandeel catch (1000 tons) 875 830 900 580 820 621 761 636
Total Danish industrial catch (1000 tons) 1470 1329 1653 1316 1707 1384 1641 1347
Sandeel catch (million DKK) 585 447 531 294 431 384 546 547
Total Danish industrial catch (million DKK) 948 722 867 867 829 748 1028 997
Source: Statistical Yearbook [14], Department of Fisheries, Denmark.
Table 7
Danish industrial Norway pout catch in the North Sea (1989–1998)
1989 1991 1992 1993 1995 1996 1997 1998
Norway pout catch (1000 tons) 156 110 178 146 170 99 109 45
Total Danish industrial catch (1000 tons) 1470 1329 1653 1316 1707 1384 1641 1347
Norway pout catch (million DKK) 101 67 103 79 92 58 80 39
Total Danish industrial catch (million DKK) 948 722 867 606 829 748 1028 998
Source: Statistical Yearbook [14], Department of Fisheries, Denmark.
5The current CFP was created in 1983 (R "eglement (CEE) no 170/83
du Conseil du 25 janvier 1983 instituant un r!egime communautaire de
conservation et de gestion des ressources de p#eche). Its present legal
framework was settled in 1992 (R"eglement (CEE) no 3760/92 du
Conseil du 20 d!ecembre 1992 instituant un r!egime communautaire de la
p#eche et de l’aquaculture).
S. Mardle et al. / Marine Policy 26 (2002) 415–428420
for some species in some areas (system of TACs andquotas), technical measures concerning gears, minimumsize of catches, and the obligation of registration foreach EU fishing boat. There are four key areas that theCFP encompasses [18]:
(i) conservation of stocks—to provide managementmeasures, mainly by imposing a maximum catchper key species on a yearly basis, to maintainstocks at sustainable levels whilst best satisfying theneeds of the fishing industry economically andsocially;
(ii) organisation of markets—to provide for a commonmarket inside the EU and to balance productionand demand of fish for both producers andconsumers;
(iii) structural measures—to provide for the adaptationof the catching sector primarily to best utilise thestocks available for both the short-term and long-term interests of the industry;
(iv) international agreements—to provide and main-tain fishing opportunities for EC fleets operatingoutside of EU waters.
The ECs principal management tool is based on theconcept of total allowable catches (TACs). The EC,through a Council of Ministers, are responsible forsetting TACs yearly for key targeted species inEuropean waters based on scientific advice. The overallquotas agreed are then divided between member statesbased primarily on historic participation in the fisheryconcerned, although some quota trade does exist at thisstage. This latter point introduces one of the ECs majorconcerns of relative stability in the common marketarena. It is the decision of each member state, exactlyhow the quota is managed. Further regulation that theEC sets (mainly technical measures) are minimum meshsizes6 and gear technologies, minimum landing sizes,maximum catch proportions of other key species whentargeting certain species and some fishing area restric-tions such as the Plaice Box and the Shetland Box.7
All of these regulations are designed around keycommercial target species that generally are consideredto be fished up to and beyond sustainable limits. Forsome species and fleets, individual countries havetightened and/or enhanced EC policy by increasingregulation (e.g. increasing minimum landing sizes).This is especially the case in inshore waters, wheretypically most countries have bodies to manage fisherieswithin 6 miles (for example the UK Sea FisheriesCommittees).
Therefore, there are generally three levels of manage-ment in EU fisheries as follows:
1. EU* TACs set through a Council of Ministers.* Producer Organisations established under the
CFP, operate at the regional level.2. National
* Administration (fisheries administration govern-ment authorities).
* Fisher associations.* Other professional organisations (processing,
environment groups).* Scientists.* Other government departments
3. Regional (local).* Government authorities (inshore fisheries man-
agement).* Port associations.
In line with this structure, the key organisations forthe case study fisheries have been identified. The resultsfrom this are shown in Table 8. Further, descriptions ofthe case study dependent management systems arediscussed in the following section detailing the casestudies.
The industrial fishery is limited within the nationalquota which is allocated on the basis of stock estima-tions, historical rights and political negotiations (EU).
3.1. The management system of the English Channel
fisheries
The main management controls in the EnglishChannel fisheries are TACs and minimum landing sizes.The species to which TACs apply are: sole, plaice,mackerel, whiting, herring, monkfish, cod, hake, me-grims, and saithe. However, unlike many other EUfisheries, many of the highly profitable target-species arenon-quota species such as cuttlefish, bass, lobster andsquid (see Table 4). There are also restrictions on fishingfor mackerel in the northern half of the westernChannel.
In the UK, quota is allocated on an annual basis toProducer Organisations (POs), the non-sector (vessels>10m which are not PO members), the under 10m fleetand some individual vessels targeting pelagic stocks. Forthe English Channel, there are two main POs: the south-west Fish PO and Cornish Fish PO. It is the FisheriesDepartments’ (e.g. MAFF) responsibility to monitorproceedings. Quota allocations are currently fixed,based on a vessel’s catch in the 3 year reference period1994–1996. In the UK, it is the Sea Fisheries Commit-tees (SFCs) who regulate local sea fisheries to the 6-milelimit. SFCs are therefore responsible for the manage-ment (including enforcement) and conservation of thefisheries within their districts, and are empowered tomake by-laws to help achieve these goals. Such by-lawsgenerally include the increase of EC minimum landing
6The largest current regulatory mesh size in Northern European
waters is 100mm (see footnote 5).7See Council Regulation (EC) No. 850/98 of 30 March 1998.
S. Mardle et al. / Marine Policy 26 (2002) 415–428 421
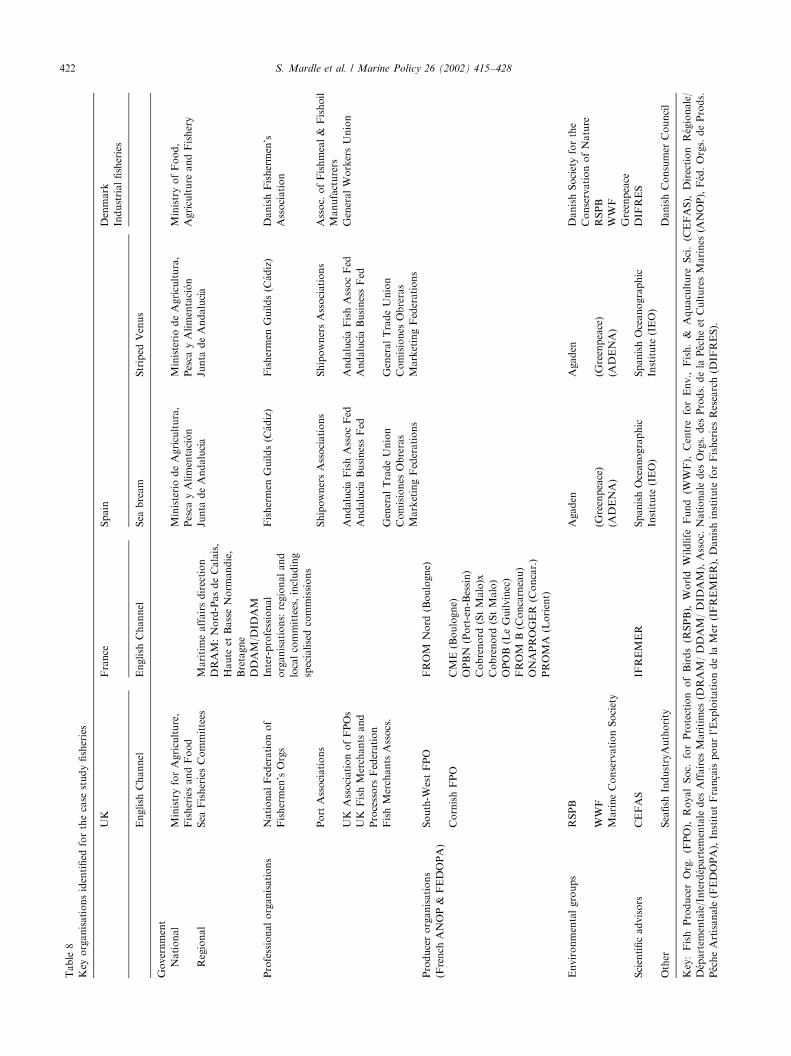
Table
8
Key
organisationsidentified
forthecase
studyfisheries
UK
France
Spain
Denmark
Industrialfisheries
English
Channel
English
Channel
Sea
bream
Striped
Venus
Government
National
MinistryforAgriculture,
FisheriesandFood
MinisteriodeAgricultura,
Pesca
yAlimentaci! on
MinisteriodeAgricultura,
Pesca
yAlimentaci! on
MinistryofFood,
Agriculture
andFishery
Regional
Sea
FisheriesCommittees
Maritimeaffairsdirection
Junta
deAndaluc! ıa
Junta
deAndaluc! ıa
DRAM:Nord-PasdeCalais,
Haute
etBasseNorm
andie,
Bretagne
DDAM/D
IDAM
Professionalorganisations
NationalFederationof
Fishermen’sOrgs
Inter-professional
organisations:regionaland
localcommittees,including
specialisedcommissions
Fishermen
Guilds(C
! adiz)
Fishermen
Guilds(C
! adiz)
DanishFishermen’s
Association
Port
Associations
ShipownersAssociations
ShipownersAssociations
Assoc.
ofFishmeal&
Fishoil
Manufacturers
UK
AssociationofFPOs
Andaluc! ıaFishAssocFed
Andaluc! ıaFishAssocFed
GeneralWorkersUnion
UK
FishMerchants
and
Processors
Federation
Andaluc! ıaBusinessFed
Andaluc! ıaBusinessFed
FishMerchants
Assocs.
GeneralTradeUnion
GeneralTradeUnion
Comisiones
Obreras
Comisiones
Obreras
MarketingFederations
MarketingFederations
Producerorganisations
(French
ANOP&
FEDOPA)
South-W
estFPO
FROM
Nord
(Boulogne)
CornishFPO
CME(Boulogne)
OPBN
(Port-en-Bessin)
Cobrenord
(StMalo)x
Cobrenord
(StMalo)
OPOB(LeGuilvinec)
FROM
B(C
oncarneau)
ONAPROGER
(Concar.)
PROMA
(Lorient)
Environmentalgroups
RSPB
Agaden
Agaden
DanishSocietyforthe
ConservationofNature
WWF
(Greenpeace)
(Greenpeace)
RSPB
MarineConservationSociety
(ADENA)
(ADENA)
WWF
Greenpeace
Scientificadvisors
CEFAS
IFREMER
SpanishOceanographic
Institute
(IEO)
SpanishOceanographic
Institute
(IEO)
DIF
RES
Other
Seafish
IndustryAuthority
DanishConsumer
Council
Key:Fish
ProducerOrg.(FPO),
RoyalSoc.
forProtection
ofBirds(R
SPB),
World
Wildlife
Fund
(WWF),
CentreforEnv.,
Fish.&
Aquaculture
Sci.(C
EFAS),
Direction
R! egionale/
D! epartem
entale/Interd! epartem
entale
des
Affaires
Maritimes
(DRAM/DDAM/DID
AM),Assoc.
Nationale
des
Orgs.des
Prods.dela
P# echeet
CulturesMarines
(ANOP),F! ed.Orgs.deProds.
P# echeArtisanale
(FEDOPA),InstitutFran-caispourl’Exploitationdela
Mer
(IFREMER),Danishinstitute
forFisheriesResearch(D
IFRES).
S. Mardle et al. / Marine Policy 26 (2002) 415–428422
sizes for given species, limits on boat sizes in the district,net and other gear restrictions, and temporary fisheryclosures. For the English Channel, the SFCs are:Cornwall, Devon, Isles of Scilly, Southern, Sussex, Kentand Essex, Jersey and Guernsey.In France, as regardsinternal (national) rules, the principal texts are:
* The decree of 9 January 1852 regulating maritimefisheries8; this XIXth century decree has beenmodified several times since its first publication, thelast revision being carried by a 1997 law9. Thepractical result of this provision is that the scope forautonomous national regulating mainly concerns the12 NM zone10. The main controls are:* creation of limited entry licences11 systems for
some fisheries;* distribution-of-catch quotas among producers’
organisations (Pos), or among fishing boats orgroups of fishing boats;
* technical measures concerning fishing gears,determination of minimal sizes or weights ofindividual catches, admitted percentage of by-catches for some species and some gears (subjectto the constraints already imposed by the CFP);and
* creation of fishing exclusion or restricted zones(permanent or temporary).
* The law of 2 May 1991 concerning the inter-professional organisation of maritime fisheries andmarine farming, and the organisation of shellfishfarming12.
3.2. The management system of the Spanish sea
bream fishery
In spite of the socio-economic importance of the redbream fishery, authorities have not regulated this fisheryuntil recently. The Ministry of Agriculture, Fishing andFood (MAPA) established the first regulation specifi-cally designed for the red bream fishery through a
legislation that came into effect on the 17th of June1998. A specific ‘Fishing Plan’ was established in 1999that included some non-fishing periods and subsidies forsome of the vessels. These measures are furtherdescribed below:
* Measures to control the individual fishing power—restrictions on the number and size of fishing gearsallowed on board and restrictions on boats’ lengthand capacity.
* Measures to control the individual fishing effort—thenumber of fishing days per week is limited to five,and the number of fishing days per year is limited to160.
* Measures to control the total effort—today thereexists a closed census for this fishery with a minimumsize of 25 cm established for the red bream.
* Seasonal closures—different seasonal closures havebeen established for the different ports over thedifferent years.
* Economic measures—some subsidies have beenestablished per GRT per vessel per non-fishing day,and landing restrictions are also in place (i.e. landingsare only allowed in the ports of Algeciras and Tarifa).
It is noticeable that the limit of 160 fishing days peryear is higher than the average observed effort appliedto the fishery in recent years (about 107), which ismainly due to the weather conditions. Hence thisrestriction is not a constraint and in time could lead tothe overexploitation of the resource. It is also surprisingthat the closed season coincides with periods in whichthe fishing effort exerted by most of the vessels has beentraditionally the lowest in recent years, generallycharacterised by the worst weather conditions and worstdemand during the year. From this, it can be concludedthat current fishing effort regulations are not constrain-ing the fishing activity, and so the fishery may be almostconsidered to be a non-regulated fishery.
In the red bream ‘Fishing Plan’, a MonitoringCommission was established to regulate the fishery.This Commission is made up of the following institu-tions: Junta de Andaluc!ıa (Andalusian local govern-ment); some of the most relevant Trade Unions; theConfederaci !on de Empresarios (Association of Busi-nessmen); Cofrad!ıas (Regional Fishermen Guild Orga-nisations); the Federaci !on Andaluza de AsociacionesPesqueras (Andalusian Fishing Association Federation);and specific fishermen guilds involved in the fishery.
3.3. The management system of the Spanish Striped
Venus fishery
In addition to some technical measures related to thefeatures of the towed rake and the hydraulic dredge,current fishery regulation is based on the following
8D!ecret du 9 janvier 1952 sur l’exercice de la p#eche maritime.9Loi no 97-1051 du 18 novembre 1997 d’orientation sur la p#eche
maritime et les cultures marines.10Territorial and interior waters. Autonomous regulations also
apply to the part of French overseas EEZ which is beyond the scope of
the CFP.11These licences are not to be confused with the general fishing
licence system that is imposed by EU rules. In order to avoid this
confusion, French law uses the word autorisation to point up specific
licences (d!ecret du 9 janvier 1852, article 3), and the expression permis de
mise en exploitation to point up general fishing licences (Ibid., art. 3-1).12Loi no 91–411 du 2 mai 1991 relative "a l’organisation interpro-
fessionnelle des p#eches maritimes et des !elevages marins et "a l’organisa-
tion de la conchyliculture. Shellfish farming (conchyliculture), which
represents the bulk of marine aquaculture in France, has its own
professional organisation while the rest of marine aquaculture (called
!elevages marins by the law) is administratively tied to the fishing
industry.
S. Mardle et al. / Marine Policy 26 (2002) 415–428 423
aspects:
* the number of authorised vessels allowed to catchStriped Venus using both the hydraulic dredge andthe towed rake has been limited;
* a minimum size of the Striped Venus has beenestablished, for the hydraulic dredge it is between 24and 26mm;
* the captures per vessel must be less than 300 kg/day;* a yearly closed season has been established from 16
May to 15 June inclusively;* it is not allowed to fish on grounds that are not at
least 5m in depth, and it is similarly forbidden to fishin the rivers and estuaries;
* towed rake vessels may also catch other bivalvemolluscs, however, the hydraulic dredge vessels areonly allowed to catch Striped Venus (due toconsumer preferences for Striped Venus caught byhydraulic dredge, towed rake vessels only sporadi-cally catch any amount of Striped Venus); and
* other landings, trade and self-control measures havebeen established by Consorcio de la Chirla.
3.4. The management system of the Danish industrial
fisheries
The basic principles of the industrial fisheries regula-tion are TAC, area restrictions and technical measuressuch as mesh size. The national quotas of Sandeel andNorway pout are not divided into individual vessel quotasor rations. Fishing is free within the limits of the nationalquota to all fishers who have an industrial fishery license.The legislation13 does not specify who can or cannotapply for a license, but still the industrial fishery ispractised by a limited group of boats (about 150). It israre that fishers who have a license to participate in theSandeel or Norway pout fisheries are imposed to catchregulations (pers. comm. Palisgaard, Department ofFisheries, 2000). If and when 75% of the national Sandeelor Norway pout quota has been fished out it is decidedwhether there shall be a regulation or the respectivefishery should be kept unregulated until the total catchreaches a higher percentage of the quota. This decision ismade by the Board for Commercial Fishing which meetsonce a month and is comprised of representatives fromthe Fisheries Directorate, the industry, fishers and work-ers unions. There is no representation of environmental-ists or consumer groups like in the EU Fishery Board.Although the Board for Commercial Fishing is formallyconsultative, decisions are most often made without directinvolvement of the minister.
A breaking point in the recent regulation of theindustrial fisheries has been the increasing influence of
environmentalist groups. The implementation of arearegulations in the North Sea (Wee Bankie) in January2000 indicate that arguments concerning the protectionof marine birds and other marine predators are gaininginfluence with decision makers. The economy of thefishing industry is no longer the only primary concernfor politicians. Recent changes in legislation indicate,that ecological issues are clearly being considered.
Generally, the industrial fishery has been underpressure from primarily environmental groups whoconsider the industrial fisheries as ecologically wrongand unsustainable. They argue that industrial speciesbeing caught for fish meal and oil production shouldremain in the sea as food for other species. On the otherhand, industrial fishers argue that these species, insteadof being eaten by fish in the sea, should be used as feedfor animal production or in the aquaculture industry,which is just as legitimate in terms of utilisation of theresource. In addition, fishers take heed that Sandeel andNorway pout stocks are considered to be within safebiological limits [17].
4. Key management objectives
In order to define the key objectives in the manage-ment of a fishery a tentative hierarchic tree of objectivescan be defined based on the known structure of thefishery under analysis and knowledge of any similarprevious studies. For instance, Lane [8] defines the mainmanagement features of fisheries in a tree. In using this,an initial hierarchic tree of objectives can be developed.Leung [19] constructed such a tree for the Hawaiianpelagic fisheries, consisting of 4 main groups ofobjectives: biological, economic, social and political.This is a typical structure in the natural resourcemanagement. For practical reasons, the number oflevels in the structure, as well as the number of itemsat each level, should not be too large. Methodologyapplied to attach importance or preference amongstobjectives typically restricts the number of lowest levelobjectives (or attributes) to between 6 and 8. As usual,this results in a compromise between the necessity totake into account real world complexity and thenecessity to build a manageable representation of reality.
4.1. Validation process in developing the objectives
Generally, there is little theoretical guidance to thedefinition of objective hierarchies. However, there are anumber of factors that must be taken into account whenconstructing them. The five key properties that thehierarchy should exhibit once described are [20]:
1. completeness—ensure that the whole problem isrepresented;
13BEK no. 906. Law of Fishery. Lov no. 281 af 12/05/1999. (in
Danish).
S. Mardle et al. / Marine Policy 26 (2002) 415–428424
2. operationality—it is effective to the situation underinvestigation;
3. decomposability—the component parts describe thedetail of the problem;
4. non-redundancy—no objective is included (or in-ferred) elsewhere; and
5. minimality—ensure the hierarchy is as small andmanageable as possible.
The main tools for developing the informationrequired are literature review, ongoing model develop-ment, system observation, and surveys. In the develop-ment of the case study hierarchies presented here, all ofthese processes were incorporated directly. For eachcase study, key interest group representatives wereincluded in the validation procedure. Not only did thisassist the structure of the hierarchy, but guided thedefinition of terminology used for objectives and thesubsequent meaning of each.
4.2. Management objectives in the case study fisheries
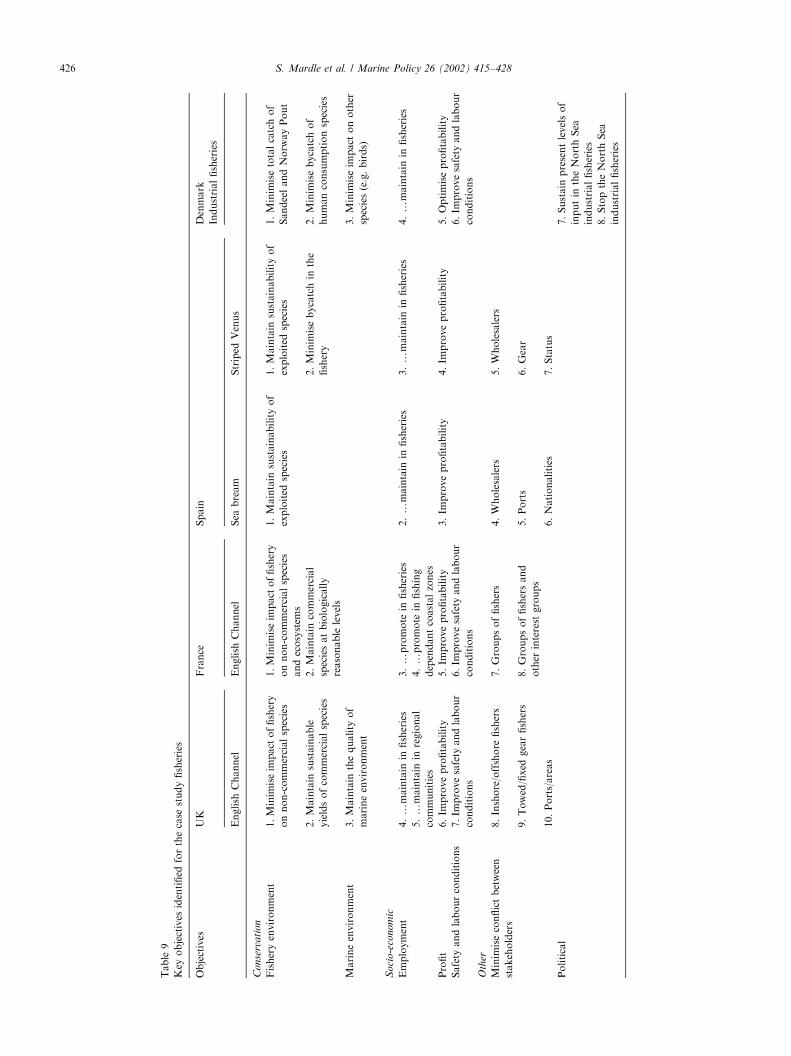
At the most general level, the main objective is toensure sustainable management of the fishery in ques-tion, i.e. its viability in the long run. This very generalobjective covers various fields: biological, economic andsocial. Table 9 shows the key objectives identified for thecase study fisheries. The first condition of sustainabilityis biological. It is necessary that to satisfy this, fisheriesmanagement should help achieve proper conservation ofthe living resources exploited by fishers. This conditionhas itself two sides, the relative importance of whichmay vary according to the type of stock: conservation ofcommercially targeted species and non-commercialspecies. Fishing is increasingly regarded as an activityinteracting with ecosystems, which means that conserva-tion of non-commercial species and, more generally, ofthe natural environment, is nowadays regarded as animportant condition for the viability of a fishery.Achieving an ‘‘ecologically responsible’’ fishing activitymay therefore be regarded as an objective for fisheriesmanagement.
Sustainability of a fishery also implies efficiency, sincefishers and other people concerned by the fishingindustry have to earn their living from this activity, ina context of growing economic competition. Efficiency isused here in its general economic sense, which undermany realistic circumstances cannot be reduced to themere maximisation of profit14. It seems that in the caseunder review, three main types of consideration may beclassified under the label of ‘‘efficiency’’ (or socio-economic objectives): maximising money incomes gen-erated by the fishery in the long run, maximising
employment generated by the fishery, improving safetyand labour conditions of fishers. In the case of em-ployment generated by the fishery, in the case ofthe English Channel fisheries, for example, employmentin the fishery itself and employment in local commu-nities more or less dependent on the fishery aredistinguished. In the Spanish cases considered, ingeneral there does not seem to be any significant labourcondition problems as being a coastal fishery, fishermendo not spend many hours fishing per day, nor nights onboard.
Even if it is biologically sustainable and efficient, amanagement system may be regarded as sociallyunsustainable if it does not convey a minimal feelingof fairness (equity) among the stakeholders. In Table 9,this category has been termed ‘‘allocation and awarenessissues’’. This problem is particularly sensitive in the caseof fisheries management, due to the common-poolcharacter of fish resources, and the many interactionsbetween fishers that are caused by their activity.Therefore, minimising conflicts between user groups(or interest groups) may be considered an importantobjective of fisheries management. The conflicts to beminimised are in the majority of cases internal to thegroup of professional fishers: for example in the EnglishChannel fisheries, conflicts between inshore and offshoreboats (which in many cases have the possibility tooperate inside inshore waters), conflicts between users oftowed and fixed gears, or between groups of fishers fromdifferent geographical origins. But some conflicts mayalso arise between commercial fishers and other groups,such as recreational fishers, shellfish farmers, industrialoperators, environmentalist groups, etc.
In the Spanish sea bream fishery, there are three maincategories of groups: ports, nationalities and whole-salers. Vessels that started operating in this fishery weresolely from Tarifa but as it was a profitable activityseveral vessels from nearby ports joined the fisherywhich has set up different groups. There have also beenparticular differences with Moroccan-based vessels, dueto the fact that part of the sea bream fishing ground islocated in Moroccan waters. As most of the capturesfrom Moroccan vessels are sold on the Spanish market,there is competition between exporters and wholesalerswhich is considered to be an important issue. Similarlywith the Spanish Striped Venus fishery considered, thereis direct competition from the Italian fisheries. ItalianStriped Venus tend to be cheaper, but find a place insome markets in the South of Spain. Interactions alsoexist between gear groups in this fishery, i.e. those usingthe hydraulic dredge (which is a powerful gear for thecapture of Striped Venus and other clams, but raisesdistinct bycatch issues) and those using the towed rake.Lastly, the ‘status’ qualifier refers to those fishersaffiliated to the Striped Venus Association and thoseare not.
14 In economics, efficiency is another word for Pareto-optimality. It
is well known that maximisation of profit leads to a Pareto-optimal
situation only if rather strict conditions are met.
S. Mardle et al. / Marine Policy 26 (2002) 415–428 425
Table
9
Key
objectives
identified
forthecase
studyfisheries
Objectives
UK
France
Spain
Denmark
Industrialfisheries
English
Channel
English
Channel
Sea
bream
Striped
Venus
Co
nse
rvati
on
Fisheryenvironment
1.Minim
iseim
pact
offishery
onnon-commercialspecies
1.Minim
iseim
pact
offishery
onnon-commercialspecies
andecosystem
s
1.Maintain
sustainabilityof
exploited
species
1.Maintain
sustainabilityof
exploited
species
1.Minim
isetotalcatchof
SandeelandNorw
ayPout
2.Maintain
sustainable
yieldsofcommercialspecies
2.Maintain
commercial
speciesatbiologically
reasonable
levels
2.Minim
isebycatchin
the
fishery
2.Minim
isebycatchof
humanconsumptionspecies
Marineenvironment
3.Maintain
thequality
of
marineenvironment
3.Minim
iseim
pact
onother
species(e.g.birds)
Soci
o-e
conom
ic
Employment
4.y
maintain
infisheries
3.y
promote
infisheries
2.y
maintain
infisheries
3.y
maintain
infisheries
4.y
maintain
infisheries
5.y
maintain
inregional
communities
4.y
promote
infishing
dependantcoastalzones
Profit
6.Im
proveprofitability
5.Im
proveprofitability
3.Im
proveprofitability
4.Im
proveprofitability
5.Optimiseprofitability
Safety
andlabourconditions
7.Im
provesafety
andlabour
conditions
6.Im
provesafety
andlabour
conditions
6.Im
provesafety
andlabour
conditions
Oth
er
Minim
iseconflictbetween
stakeholders
8.Inshore/offshore
fishers
7.Groupsoffishers
4.Wholesalers
5.Wholesalers
9.Towed/fixed
gearfishers
8.Groupsoffishersand
other
interest
groups
5.Ports
6.Gear
10.Ports/areas
6.Nationalities
7.Status
Political
7.Sustain
presentlevelsof
inputin
theNorthSea
industrialfisheries
8.StoptheNorthSea
industrialfisheries
S. Mardle et al. / Marine Policy 26 (2002) 415–428426
In the Danish Industrial fisheries case study, insteadof a simple conflict between industrial and non-industrial fishers, two politically objective alternativeswere modelled. That is to maintain the present level ofinputs (particularly activity and capacity) in theindustrial fishery in the North Sea and to stop theindustrial fishery in the North Sea. Specifically, the wishto maintain the industrial fishery can be looked at as aneconomic objective (profit, employment, taxation) and/or a wish to conserve a traditional occupation andcultural heritage, which is considered important for thenation and its position against other fishery nations. Theessence of this objective concerns the rights to fish(activity and capacity). The issue of stopping theindustrial fishery generally falls to two major reasons:the use of Sandeel and Norway pout in industrialproduction is considered unethical, and/or to limit thecatch of Sandeel and Norway pout should avoid impacton other commercial and non-commercial species.
In order to make sure that the objectives describedadequately represent the whole system under investiga-tion an initial referral procedure was instigated with keyrepresentatives in the management system. A prelimin-ary test was performed, where the provisional hierarchictree based on the objectives listed in Table 9 wascommunicated to a limited number of key persons foreach case study fishery in order to receive their opinionconcerning the relevance and legibility of the objectivestructure it represents.
5. Conclusion
To develop fisheries management policy, objectivesmust be defined and targets for achievement must be set.In policy documents like the CFP, these aspirations areoften all-encompassing and therefore imprecise. For thediversity of fisheries that are covered by such policy, thisglobal view is unavoidable. However, this is one of themain criticisms of management policy where no indica-tion of aspiration levels is given from which futuremeasurement can be made [4]. Individual fisheries orfishery areas often exhibit more distinct objectives thatpredominate, than those expressed in the CFP. The casestudies discussed in this paper have been chosen toattempt to highlight some of the similarities anddifferences that exist in the objectives of managementfor several European fisheries.
There is surprisingly little theory to assist with thedevelopment of key objectives. The four approachesimplemented have been literature (documentation) re-view, ongoing model development, system observation(including contact with key stakeholders), and surveys.The last of these has formed the main step of thevalidation process to ensure that the objectives, de-scribed in hierarchies (see Table 9), succinctly represent
the fisheries under investigation. It was particularlyinteresting to note the good response from individualstaking part on this validation survey in terms ofusefulness of the approach. The definition of descriptionand underlying meaning of the objectives is animportant feature of this process, to ensure complete-ness of the hierarchy. The hierarchical trees developedtherefore exhibit the main objective characteristics of thefisheries at the level described.
In defining key objectives for fisheries, a measure ofthe importance that each interest group attaches to eachcan be determined through survey. Not only does thisenable fisheries managers to prioritise key areas ofconcern, but also view the positions of key interestgroups relative to the management objectives. This is anespecially important step in the determination of targetsto be set on management goals, however it is a separatestep to the definition of the objectives themselves.Hanna and Smith [7] note that different goal orienta-tions are a major source of conflict in fisheries manage-ment. Therefore, defining a degree of importance toobjectives makes trade-offs between such conflicts morevisible.
This paper has developed a structured approach forthe definition of key objectives in fisheries that assiststhe management process by providing information forthe justification for advice produced. Often, groups (orindividuals) may feel that their opinion in the fisheriesmanagement process is being overlooked. However withsuch a development of the objectives of groups towardsmanagement some of the conflict between groups maybe minimised as awareness of other groups increases. Afeature of the approach introduced is that bothquantitative and qualitative criteria can be modelledinto the framework of analysis. In fisheries, thisadditional information may help to overcome some ofthe problems created by the pluralistic structure, asobjectives become more explicitly defined.
Acknowledgements
An earlier version of this paper was presented at theXIIIth Annual Conference of the European Associationof Fisheries Economists (EAFE), Salerno, Italy, 18–20April 2001. The research in this paper has beendeveloped under the EC 5th framework project ‘‘Multi-ple Objectives in the Management of EU Fisheries’’(QLK5-1999-01273).
References
[1] Crutchfield JA. Economic and political objectives of fishery
management. Transactions of the American Fisheries Society
1973:481–91.
S. Mardle et al. / Marine Policy 26 (2002) 415–428 427
[2] Charles AT. Bio-socio-economic fishery models: labour dynamics
and multi-objective management. Canadian Journal of Fisheries
and Aquatic Science 1989;46(8):1313–22.
[3] Gulland JA.Goals, objectives of fishery management. FAO
Fisheries Technical Paper 166, 1977. p. 14.
[4] Pope JG. Integrating and presenting scientific fisheries manage-
ment advice for complex fisheries subject to multiple objectives.
In: Montero CC, editor. Multiple objectives and fisheries
management: strategies for the future, Vilamoura International
Meeting on Fisheries, Portugal, 3–4 November 1997.
[5] Cunningham S. EEC fisheries management: a critique of common
fisheries policy objectives. Marine Policy 1980;4:229–35.
[6] Barber WE, Taylor JN. The importance of goals, objectives, and
values in the fisheries management process and organization: a
review. North American Journal of Fisheries Management
1990;10(4):365–73.
[7] Hanna SS, Smith CL. Resolving allocation conflicts in
fishery management. Society and Natural Resources 1993;6(1):
55–69.
[8] Lane DE. Operational research and fisheries management.
European Journal of Operational Research 1989;42:229–42.
[9] Dintheer C. et al. Les grands m!etiers de la Manche. R!eflexions
et propositions pour la conservation de la ressource et la gestion
des p#echeries. La p#eche maritime; septembre–octobre 1995.
p. 181–95.
[10] Boncoeur J, Coglan L, Le Gallic B, Pascoe S. On the (ir)relevance
of rates of return measures of economic performance to small
boats. Fisheries Research 2000;49:105–15.
[11] Ulrich C. Mod!elisation multi-flottilles et multi-m!etiers des
p#echeries artisanales de la Manche. Evaluation plurisp!ecifique
des stocks, !etude des interactions techniques et int!egration dans la
mod!elisation bio!economique. Th"ese pour l’obtention du dipl #ome
de Doctorat de l’ENSAR, mention Halieutique, pr!esent!ee et
soutenue publiquement le 17 mars 2000. ENSAR, 2000. p. 349.
[12] Pascoe S, editor. Bioeconomic modelling of the fisheries of the
English Channel. FAIR CT 96–1993, Final Report. CEMARE
Research Report no. 53, 2000. p. 142.
[13] T!etard A, Boon M. Catalogue international des activit!es des
flottilles de la Manche. Approche des interactions techniques.
Editions Ifremer, Plouzan!e, 1995. p. 337.
[14] Statistical Yearbook 1998. Ministry of Food, Agriculture and
Fishery. Dept of Fishery, 1999.
[15] Guldberg, Mette, editors. Fishing for Sandeels. Fiskeri-og
S�fartsmuseet og Jens Chr. Top, 2000.
[16] Krog, Carsten. Fishery and ocean environment. Gads forlag, 1993
(In Danish!).
[17] ICES. ICES Coop. Res. Report No. 236, part 1, 2000 [Chapter
3.5.12–3.5.13].
[18] Hatcher A. Producers’ organisations and devolved fisheries
management in the United Kingdom: collective and individual
quota systems. Marine Policy 1997;21(6):519–33.
[19] Leung P, Muraoka J, Nakamoto ST, Pooley S. Evaluating
fisheries management options in Hawaii using analytic hierarchy
process. Fisheries Research 1998;36(2,3):171–83.
[20] Keeney RL, Raiffa H. Decisions with multiple objectives:
preferences and value tradeoffs. New York: Wiley, 1976.
S. Mardle et al. / Marine Policy 26 (2002) 415–428428