Objective measurement of fluency in natural language production: A dynamic systems approach
15
University of Notre Dame Australia ResearchOnline@ND Medical Papers and Journal Articles School of Medicine 1-1-2010 Objective measurement of fluency in natural language production: A dynamic systems approach Kathryn Hird University of Notre Dame Australia, [email protected] Kim Kirsner COMMONWEALTH OF AUSTRALIA Copyright Regulations 1969 WARNING This material has been copied and communicated to you by or on behalf of the University of Notre Dame Australia pursuant to part VB of the Copyright Act 1969 (the Act). The material in this communication may be subject to copyright under the Act. Any further copying or communication of this material by you may be the subject of copyright protection under the Act. Do not remove this notice. This Article is brought to you by the School of Medicine at ResearchOnline@ND. It has been accepted for inclusion in Medical Papers and Journal Articles by an authorized administrator of ResearchOnline@ND. For more information, please contact [email protected]. Recommended Citation Kathryn Hird and Kim Kirsner, 'Objective measurement of fluency in natural language production: A dynamic systems approach', Journal of Neurolinguistics, Vol. 23 (5), 2010, p. 518-530.
-
Upload
independent -
Category
Documents
-
view
3 -
download
0
Transcript of Objective measurement of fluency in natural language production: A dynamic systems approach
University of Notre Dame AustraliaResearchOnline@ND
Medical Papers and Journal Articles School of Medicine
1-1-2010
Objective measurement of fluency in natural language production: A dynamicsystems approach
Kathryn HirdUniversity of Notre Dame Australia, [email protected]
Kim Kirsner
COMMONWEALTH OF AUSTRALIACopyright Regulations 1969
WARNING
This material has been copied and communicated to you by or on behalf of the University of Notre Dame Australia pursuant to partVB of the Copyright Act 1969 (the Act).
The material in this communication may be subject to copyright under the Act. Any further copying or communication of thismaterial by you may be the subject of copyright protection under the Act.
Do not remove this notice.
This Article is brought to you by the School of Medicine atResearchOnline@ND. It has been accepted for inclusion in Medical Papersand Journal Articles by an authorized administrator ofResearchOnline@ND. For more information, please [email protected].
Recommended CitationKathryn Hird and Kim Kirsner, 'Objective measurement of fluency in natural language production: A dynamic systemsapproach', Journal of Neurolinguistics, Vol. 23 (5), 2010, p. 518-530.

Our reference: NEL 441 P-authorquery-v7
AUTHOR QUERY FORM
Journal: NEL
Article Number: 441
Please e-mail or fax your responses and any corrections to:
E-mail: [email protected]
Fax: +31 2048 52789
Dear Author,
Any queries or remarks that have arisen during the processing of your manuscript are listed below and highlighted by flags in
the proof. Please check your proof carefully and mark all corrections at the appropriate place in the proof (e.g., by using
on-screen annotation in the PDF file) or compile them in a separate list.
For correction or revision of any artwork, please consult http://www.elsevier.com/artworkinstructions.
Articles in Special Issues: Please ensure that the words ‘this issue’ are added (in the list and text) to any references to
other articles in this Special Issue.
Uncited references: References that occur in the reference list but not in the text – please position each reference in the text
or delete it from the list.
Missing references: References listed below were noted in the text but are missing from the reference list – please make
the list complete or remove the references from the text.
Location in
articleQuery / remark
Please insert your reply or correction at the corresponding line in the proof
Q1 The following reference citations modified to match the reference list: Steyn–Ross et al. (2009) to Steyn-
Ross et al. (2009); Niemi (1998) to Niemi (1988); Van Horn (2002) to Van Horn (2003). Please check.
Q2 References McLachlan & Peel, 2000; Crawford, Howell, & Garthwaite, 1998; Ciccone, Hird, and Kirsner
(2004) were cited in text but not provided. Please provide these references or delete the citations.
Q3 Please check the Dochead
Electronic file usage
Sometimes we are unable to process the electronic file of your article and/or artwork. If this is the case, we have
proceeded by:
, Scanning (parts of) your article , Rekeying (parts of) your article , Scanning the artwork
Thank you for your assistance.

UNCORRECTEDPROOFQ3 Theoretical article
Objective measurement of fluency in natural languageproduction: A dynamic systems approach
Kathryn Hird a,b,*, Kim Kirsner c
a School of Medicine (Fremantle), University of Notre Dame Australia, 35 Henry Street, Fremantle 6959, Western Australiab Department of Pediatrics, School of Medicine, University of Western Australia, Crawley 6009, Western Australiac Centre of Experimental and Regenerative Neuroscience, School of Animal Biology, University of Western Australia, Crawley 6009,Western Australia
a r t i c l e i n f o
Article history:Received 21 December 2009Received in revised form 1 March 2010Accepted 1 March 2010
Keywords:FluencyLanguageAphasiaObjectiveMeasurement
a b s t r a c t
Language research is dominated by the concept of modularity. Thebasic assumptions involve neural localization of function, andadoption of tasks that tap into specialized functions, involvingwords or phonemes for example. The tasks that emerge to supportthis research are generally de-contextualized. Recent work inneuroscience has identified large-scale self organizing neuralnetworks. It is our contention that the advanced neuro-imagingprocedures demand an equivalent refinement in the languagesampling domain. The collection of natural speaking samples, andan objective approach to fluency, are critical to the understandingof language production. This paper describes a measurementsystem designed to quantify fluency in natural spoken language.The system classifies environmental and breathing noise, andestimates means and standard deviations for the three lognormaldistributions associated with spontaneous speaking: short pauses,long pauses and speech segment duration. The analysis of naturalsamples produced by three diverse aphasic speakers demonstratesthe sensitivity of the fluency measure as well as the profile ofindependent or correlated changes across the parameters. Thesystem yields objective and sensitive measures of communicativeefficiency for individuals across a variety of speaking contexts.
� 2010 Published by Elsevier Ltd.
* Corresponding author. School of Medicine (Fremantle), University of Notre Dame Australia, 35 Henry Street, Fremantle6959, Western Australia.
E-mail addresses: [email protected] (K. Hird), [email protected] (K. Kirsner).
Contents lists available at ScienceDirect
Journal of Neurolinguisticsjournal homepage: www.elsevier .com/locate/
jneurol ing
ARTICLE IN PRESS
1
2
3
4
5
6
7
8
9
10
11
12
13
14
15
16
17
18
19
20
21
22
23
24
25
26
27
28
29
30
31
32
33
34
35
36
37
38
39
40
41
42
43
44 0911-6044/$ – see front matter � 2010 Published by Elsevier Ltd.doi:10.1016/j.jneuroling.2010.03.001
Journal of Neurolinguistics xxx (2010) 1–13
NEL441_proof � 12 March 2010 � 1/13
Please cite this article in press as: Hird, K., Kirsner, K., Objective measurement of fluency in naturallanguage production: A dynamic systems approach, Journal of Neurolinguistics (2010), doi:10.1016/j.jneuroling.2010.03.001
UNCORRECTEDPROOF
1. Introduction
Recent advances in neuro-imaging have provided biological confirmation of the presence of large-scale networks underpinning language processing (Thompson & den Ouden, 2008). These dynamicassemblies span both cerebral hemispheres in the normal speaker. Compensatory or alternativepatterns of language processing networks have also been observed in speakers with aphasia before andin response to, rehabilitation (Thompson & Small, 2000; Thompson & den Ouden, 2008).
Neuro-imaging evidence is generally derived from studies of normal and brain damaged participantsdisplaying both functional and incidental neuro-plasticity as an adaptive response to novel contexts.These contexts cover opportunities for new learning in healthy brains as well as in response torehabilitation in damaged brains (Weiller, 2000). Studies targeting motor skills have shown that learningis a significant motivator for actively produced neural reorganisation. This level of neuro-plasticity isdynamically responsive to the continuously variable neurochemical and neurophysiological environmentof the brain. Learning is described as a refinement or strengthening of connections between assemblieswithin a network or the establishment of new connections with other networks (Weiller, 2000).
According to Weiller, efficiencies in neural activity can also be thought of in terms of synergisticchanges in the excitability and inhibition of relevant brain regions. The strength of these connections issensitive to the stage of learning. In the case of brain damage for example, the establishment of newconnections is reflected as increased excitability as the remaining connections are sought and maxi-mised. As these connections are rehearsed and become more established, normalisation of brainactivity returns as fewer neurons are required.
The relationship between neuronal efficiency and speaking fluency is difficult to specify but it isoften assumed. Speaking fluency is used as an index of language processing in a variety of contexts suchas; developmental language acquisition, second language learning and recovery from brain damageand carries with it the implication that there is a positive correlation between speaking fluency and theefficiency of neural activity supporting language processing. As networks are re-established, speechbecomes more fluent and less effortful. The significance of this proposition concerning diagnosis andrehabilitation of acquired neurogenic communication disorders has received little attention to datedespite the surge in studies correlating FMRI images with classification of communication impairment.
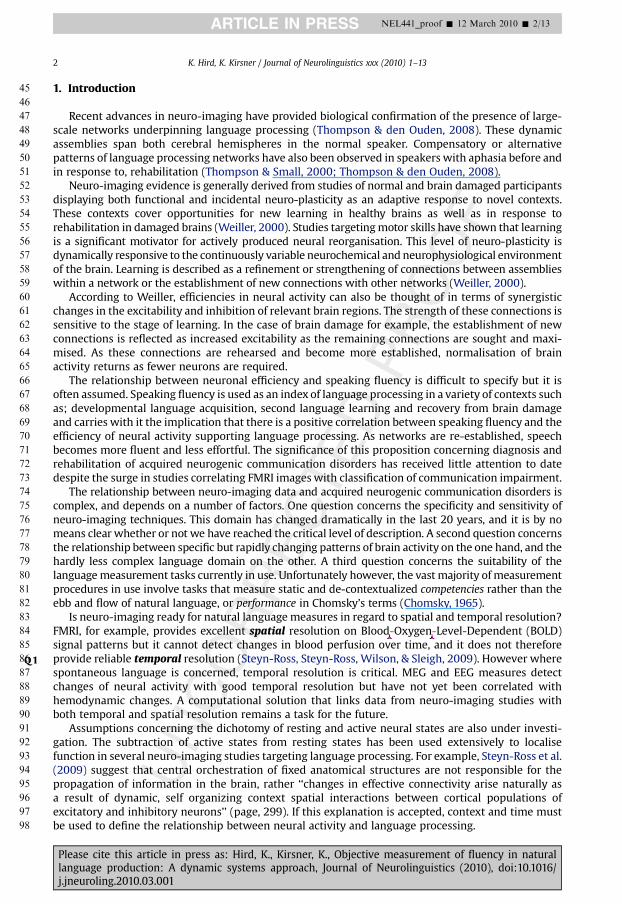
The relationship between neuro-imaging data and acquired neurogenic communication disorders iscomplex, and depends on a number of factors. One question concerns the specificity and sensitivity ofneuro-imaging techniques. This domain has changed dramatically in the last 20 years, and it is by nomeans clear whether or not we have reached the critical level of description. A second question concernsthe relationship between specific but rapidly changing patterns of brain activity on the one hand, and thehardly less complex language domain on the other. A third question concerns the suitability of thelanguage measurement tasks currently in use. Unfortunately however, the vast majority of measurementprocedures in use involve tasks that measure static and de-contextualized competencies rather than theebb and flow of natural language, or performance in Chomsky’s terms (Chomsky, 1965).
Is neuro-imaging ready for natural language measures in regard to spatial and temporal resolution?FMRI, for example, provides excellent spatial resolution on Blood-Oxygen-Level-Dependent (BOLD)signal patterns but it cannot detect changes in blood perfusion over time, and it does not thereforeprovide reliable temporal resolutionQ1 (Steyn-Ross, Steyn-Ross, Wilson, & Sleigh, 2009). However wherespontaneous language is concerned, temporal resolution is critical. MEG and EEG measures detectchanges of neural activity with good temporal resolution but have not yet been correlated withhemodynamic changes. A computational solution that links data from neuro-imaging studies withboth temporal and spatial resolution remains a task for the future.
Assumptions concerning the dichotomy of resting and active neural states are also under investi-gation. The subtraction of active states from resting states has been used extensively to localisefunction in several neuro-imaging studies targeting language processing. For example, Steyn-Ross et al.(2009) suggest that central orchestration of fixed anatomical structures are not responsible for thepropagation of information in the brain, rather ‘‘changes in effective connectivity arise naturally asa result of dynamic, self organizing context spatial interactions between cortical populations ofexcitatory and inhibitory neurons’’ (page, 299). If this explanation is accepted, context and time mustbe used to define the relationship between neural activity and language processing.
K. Hird, K. Kirsner / Journal of Neurolinguistics xxx (2010) 1–132
ARTICLE IN PRESS
45
46
47
48
49
50
51
52
53
54
55
56
57
58
59
60
61
62
63
64
65
66
67
68
69
70
71
72
73
74
75
76
77
78
79
80
81
82
83
84
85
86
87
88
89
90
91
92
93
94
95
96
97
98
NEL441_proof � 12 March 2010 � 2/13
Please cite this article in press as: Hird, K., Kirsner, K., Objective measurement of fluency in naturallanguage production: A dynamic systems approach, Journal of Neurolinguistics (2010), doi:10.1016/j.jneuroling.2010.03.001
Original text:
Inserted Text
-
Original text:
Inserted Text
-
UNCORRECTEDPROOF
Thompson and den Ouden (2008, p 479) have provided a comprehensive review of treatmentinduced changes in brain activity captured using fMRI. They report significant heterogeneity in neuralactivation patterns associated with the presence, type and treatment dose for acquired communicationimpairments. Of particular interest is that the language tasks employed across all of the studiesdescribed by them depend on modular assumptions. The tasks were designed on the assumption thatlanguage can be comprehensively characterized by paradigms that pre-suppose specialization offunction, neural localization of those functions, and the further assumption that context is not critical.They typically measure for example sentence, word and phoneme performance as if languagecomprehension and production are the sum of these and possibly other component processes.
According to Coltheart (1999, p 115) ‘‘a cognitive system is modular when and only when it is domain-specific’’. That is, a module only responds to stimuli of a particular class. In addition, processing efficiencyof a module is not influenced by a person’s beliefs, presumptions or desires. Jackson and Coltheart (2002)describe modules as pertaining to proximal functions that are not influenced by distal factors such as age,education, or other environmental characteristics. Whether or not a cognitive module has neurologicalrepresentation is, according to Coltheart (1999), relatively unimportant for the definition of modularity.
There are two issues that arise in the application of the theory of modularity to the assessment ofaphasia. The first concerns the validity of the experimental methodology typically used to produceevidence which supports the identification of domain-specific function. Dunn and Kirsner (1988)discuss limitations in the use of double dissociation to isolate domain-specific functions. Issuesraised concern task purity, magnitude of detectable differences in function, the definition of functionaldifferences as opposed to tasks performance.
There is therefore a mismatch between the underlying assumptions associated with each measure:dynamic neural networks and modularised linguistic processing respectively. fMRI studies reflect thedynamic and distributed function of cell assemblies across the brain whereas the language tasks targetspecific linguistic functions that, presumably, reflect the function of isolable cognitive modules.Assessment of specific linguistic categories prohibit the inspection of the mechanisms supportingnatural language processing and, as Hird and Kirsner (2004) assert, there is no real justification togeneralise the results of studies employing these tasks to an understanding of language processing orto the characteristics aphasia.
It is our contention that neuro-imaging procedures demand an equivalent refinement in thesampling domain, and that the collection and analysis of natural language samples is essential. The aimof this paper is to introduce a language paradigm that provides a better fit between the methods andmodels of language production research on the one hand, and the complex systems assumed by fMRIresearch on the other. We will use results from a clinical trial involving a small sample of aphasics toassess the viability of the new paradigm.
1.1. Fluency
Perhaps the most important contrast in the language sciences is that between competence andperformance (Chomsky, 1965). According to Chomsky, competence involves our internalised and tacitknowledge of language, whereas performance, the external evidence of competence, is sensitive tomemory and other limitations that compromise the extent to which it reflects intrinsic competence.Chomsky argued for example that corpus evidence could never be a useful tool for linguists, and thatlinguists should therefore model competence rather than performance.
Port and Leary (2005, p. 956) provided a compelling analysis of the limitations of the competence-driven approach, however. Thus,
‘‘In a linguistics committed to the physical world (....), language needs to be naturalized soas to fit it into a human body. That implies, first of all, casting it into the realm of space and time[talics supplied]. It requires changing our focus of attention from our preconceived views of theform of linguistic knowledge toward the study of linguistic behavior and performance.’’
With consideration restricted to performance, and the focus on fluency, one further contrast meritsconsideration. Spontaneous speech and therefore language disorders involve two potential datastreams. These streams involve information and the temporal distribution of acoustic energy respectively.
K. Hird, K. Kirsner / Journal of Neurolinguistics xxx (2010) 1–13 3
ARTICLE IN PRESS
99
100
101
102
103
104
105
106
107
108
109
110
111
112
113
114
115
116
117
118
119
120
121
122
123
124
125
126
127
128
129
130
131
132
133
134
135
136
137
138
139
140
141
142
143
144
145
146
147
148
149
150
151
152
NEL441_proof � 12 March 2010 � 3/13
Please cite this article in press as: Hird, K., Kirsner, K., Objective measurement of fluency in naturallanguage production: A dynamic systems approach, Journal of Neurolinguistics (2010), doi:10.1016/j.jneuroling.2010.03.001
UNCORRECTEDPROOF
1.1.1. The informational streamThe first or informational stream involves the amount and the quality of information conveyed by
a speaker per unit of time. This type of knowledge is usually subject to psycho-linguistic assay, andindexed by specialized lexical, syntactic and semantic tests. In our approach however, with theemphasis on spontaneous speech, we have adopted an established procedure to measure the rate atwhich information is being transmitted. Following Ciccone, Hird, and Kirsner (2004), we have adoptedseconds per Correct Information Unit (s/CIU) to meet this requirement. Our analysis of CIU follows that ofNicholas and Brookshire (1993), and the temporal designation (s/CIU) was introduced to make itcomparable to lexical decision. It is of course inter-changeable with minutes per CIU as used by Hula,McNeil, Doyle, Rubinsky, and Fossett (2003).
1.1.2. The temporal distribution of acoustic energyThe second stream concerns the way in which acoustic energy is distributed over time. In broad
terms this stream is concerned with the frequency and duration of pauses and speech segments. TheBoston Diagnostic Aphasia Examination (BDAE) includes provision for analysis of this type of data inspeakers with acquired aphasia. It includes provision for an objective count of phrase length, andsubjective rating scales for melodic line, articulatory agility and paraphasia in running speech. Thislevel of description, the poor inter-judge reliability employing subjective criteria has been described byGordon (1998), Hird, Silvestri, Dunn, and Kirsner (2005).
The proposition that the temporal distribution of acoustic energy, or, more specifically, the pauseand speech duration distributions, offer an important source of information for the science ofcommunication disorders is not new. It is inherent in regular use descriptions of language and explicitin reports by Butterworth (1979) and Niemi (1988).
The purpose of this paper is to critically review the assumptions underlying work on pause andspeech duration, and to describe the utility of an objective approach to analysis as a better fit to theassumptions underlying neural processing.
1.2. Measurement of the temporal distribution of acoustic energy: pause and speech duration distributionsin natural language
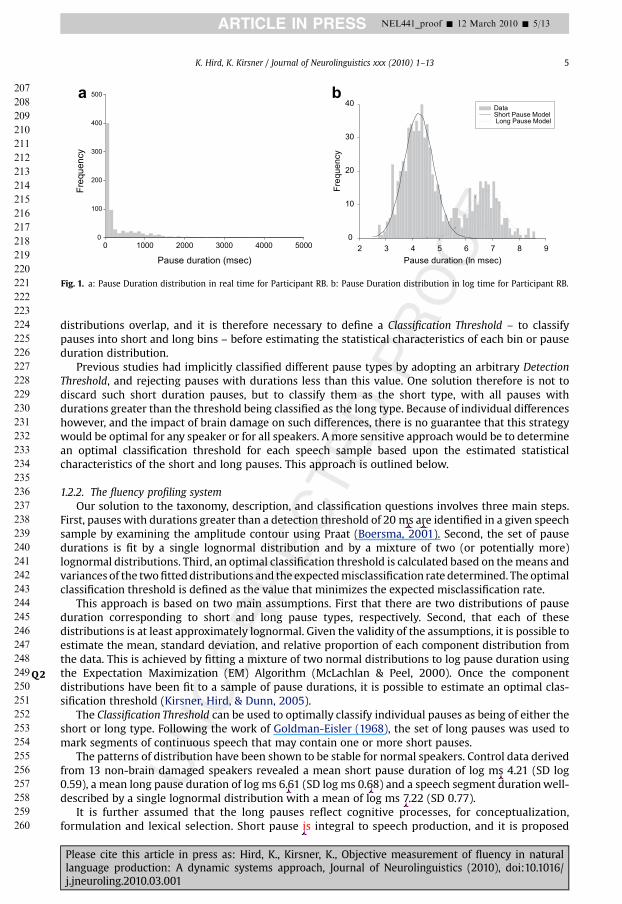
The procedure described below involves an objective approach to segmentation and pause analysis.Three problems merit consideration; first, the extent of intra- and inter-speaker variability; second, thepresence of lognormal distributions in both pause and speech segment duration samples; and, third,the possible presence of two lognormal distributions in natural language.
Fig. 1 depicts a pause duration distribution for a single participant from the study reported in thisarticle. The speech samples were obtained from picture descriptions and procedural narratives fora pilot study. The data was accumulated over eight speech samples of approximately 2 min each. Thetest sessions were implemented during a single two week period. The speech samples were segmentedby hand, using P
The Detection Threshold – the lowest admissible pause duration value – was 20 ms. The figure showsthe number of pauses at each of 100 consecutive 25 ms bands. The distribution is based on more than700 pause duration observations. Fig. 1a and b depicts the distribution in milliseconds and log unitsrespectively.
The dominant feature is that the distribution is massively skewed. The vast majority of the pausesfall below 100 ms. One implication of this figure is that the arithmetic mean does not providea defensible measure of the central tendency of the distribution. Fig. 1b involves the same set ofobservations depicted in Fig. 1a. The difference is that each and every observation has been subject toa natural log transformation prior to creation of the figure. The bin size is 0.1 log units. The realcharacter of the pause duration distribution is now revealed (see also Kirsner, Dunn, Hird, Parkin, &Clark, 2002). It is now apparent that there are two pause duration distributions rather than one.
1.2.1. The classification questionCalculation of the natural log means and standard deviations for these distributions depends on
a classification decision about the boundary between the two distributions. As depicted in Fig. 1b, the
K. Hird, K. Kirsner / Journal of Neurolinguistics xxx (2010) 1–134
ARTICLE IN PRESS
153
154
155
156
157
158
159
160
161
162
163
164
165
166
167
168
169
170
171
172
173
174
175
176
177
178
179
180
181
182
183
184
185
186
187
188
189
190
191
192
193
194
195
196
197
198
199
200
201
202
203
204
205
206
NEL441_proof � 12 March 2010 � 4/13
Please cite this article in press as: Hird, K., Kirsner, K., Objective measurement of fluency in naturallanguage production: A dynamic systems approach, Journal of Neurolinguistics (2010), doi:10.1016/j.jneuroling.2010.03.001
Original text:
Inserted Text
ec
Original text:
Inserted Text
ec
Original text:
Inserted Text
;
Original text:
Inserted Text
two
Original text:
Inserted Text
utes
Original text:
Inserted Text
.
Original text:
Inserted Text
Original text:
Inserted Text
ec
Original text:
Inserted Text
twenty-five
Original text:
Inserted Text
Original text:
Inserted Text
ec
Original text:
Inserted Text
Original text:
Inserted Text
ec
UNCORRECTEDPROOF
distributions overlap, and it is therefore necessary to define a Classification Threshold – to classifypauses into short and long bins – before estimating the statistical characteristics of each bin or pauseduration distribution.
Previous studies had implicitly classified different pause types by adopting an arbitrary DetectionThreshold, and rejecting pauses with durations less than this value. One solution therefore is not todiscard such short duration pauses, but to classify them as the short type, with all pauses withdurations greater than the threshold being classified as the long type. Because of individual differenceshowever, and the impact of brain damage on such differences, there is no guarantee that this strategywould be optimal for any speaker or for all speakers. A more sensitive approach would be to determinean optimal classification threshold for each speech sample based upon the estimated statisticalcharacteristics of the short and long pauses. This approach is outlined below.
1.2.2. The fluency profiling systemOur solution to the taxonomy, description, and classification questions involves three main steps.
First, pauses with durations greater than a detection threshold of 20 ms are identified in a given speechsample by examining the amplitude contour using Praat (Boersma, 2001). Second, the set of pausedurations is fit by a single lognormal distribution and by a mixture of two (or potentially more)lognormal distributions. Third, an optimal classification threshold is calculated based on the means andvariances of the two fitted distributions and the expected misclassification rate determined. The optimalclassification threshold is defined as the value that minimizes the expected misclassification rate.
This approach is based on two main assumptions. First that there are two distributions of pauseduration corresponding to short and long pause types, respectively. Second, that each of thesedistributions is at least approximately lognormal. Given the validity of the assumptions, it is possible toestimate the mean, standard deviation, and relative proportion of each component distribution fromthe data. This is achieved by fitting a mixture of two normal distributions to log pause duration usingthe Expectation Maximization (EM) AlgorithmQ2 (McLachlan & Peel, 2000). Once the componentdistributions have been fit to a sample of pause durations, it is possible to estimate an optimal clas-sification threshold (Kirsner, Hird, & Dunn, 2005).
The Classification Threshold can be used to optimally classify individual pauses as being of either theshort or long type. Following the work of Goldman-Eisler (1968), the set of long pauses was used tomark segments of continuous speech that may contain one or more short pauses.
The patterns of distribution have been shown to be stable for normal speakers. Control data derivedfrom 13 non-brain damaged speakers revealed a mean short pause duration of log ms 4.21 (SD log0.59), a mean long pause duration of log ms 6.61 (SD log ms 0.68) and a speech segment duration well-described by a single lognormal distribution with a mean of log ms 7.22 (SD 0.77).
It is further assumed that the long pauses reflect cognitive processes, for conceptualization,formulation and lexical selection. Short pause is integral to speech production, and it is proposed
Pause duration (msec)0 1000 2000 3000 4000 5000
ycneuqerF
0
100
200
300
400
500
Pause duration (ln msec)2 3 4 5 6 7 8 9
ycneuqerF
0
10
20
30
40 DataShort Pause Model Long Pause Model
a b
Fig. 1. a: Pause Duration distribution in real time for Participant RB. b: Pause Duration distribution in log time for Participant RB.
K. Hird, K. Kirsner / Journal of Neurolinguistics xxx (2010) 1–13 5
ARTICLE IN PRESS
207
208
209
210
211
212
213
214
215
216
217
218
219
220
221
222
223
224
225
226
227
228
229
230
231
232
233
234
235
236
237
238
239
240
241
242
243
244
245
246
247
248
249
250
251
252
253
254
255
256
257
258
259
260
NEL441_proof � 12 March 2010 � 5/13
Please cite this article in press as: Hird, K., Kirsner, K., Objective measurement of fluency in naturallanguage production: A dynamic systems approach, Journal of Neurolinguistics (2010), doi:10.1016/j.jneuroling.2010.03.001
Original text:
Inserted Text
Original text:
Inserted Text
ec
Original text:
Inserted Text
ec
Original text:
Inserted Text
ec
Original text:
Inserted Text
ec
Original text:
Inserted Text
ec
Original text:
Inserted Text
are

UNCORRECTEDPROOF
that they differentiate the articulatory gestures into recognizable combinatorial units. But howdoes brain damage impact on these distributions and the relationships between the underlyingcontrol mechanisms?
If the assumption that language processing and production is supported by distributed dynamicnetworks that have been linked via their duality of patterning in response to context requirements isgiven, then damage impacting the control mechanisms required for speech production will also impacton those required for language production and vice versa. Hird and Kirsner (2008) reported prelimi-nary fluency analysis data involving a small number of participants with aphasia that supports thisproposition. In this study two participants experienced selective impairment to speech production andnot language production; three participants showed impairment to both speech production andlanguage production, and two participants without impairment to either system. Hird and Kirsnersuggested that these results could be consistent with either of two hypotheses. Firstly that the controlprocesses for language production and speech production are independent, and that double orreversed associations are therefore possible (Dunn & Kirsner, 1988). Secondly that the underlyingdistribution reflects a positive association where impairment of speech production is invariablyaccompanied by an impairment involving language production, but that the data analysis is notsufficiently sensitive to detect the relevant change. Scrutiny of the individual pause duration distri-butions suggested that this might be the case. The results could be explained by disturbance of diffusedistributed cortical representation. An alternative explanation however involves the disruption ofa symbiotic link between the processes required for speech and language production. The notion isderived from the concept of duality of patterning because both speech and language are critical forcommunication and it is possible that the timing mechanisms for these functions cannot operateindependently.
If language processing is considered in these terms then significant changes to models of bothnormal and disordered speech and language processing are required.
2. Method
2.1. Participants
To illustrate the utility of the chronometric analysis technique and as objective measurement offluency, three speakers with acquired aphasia following stroke were selected from participantsinvolved in a larger study (Ciccone, Hird, & Kirsner, 2000) as they exhibited diverse fluency patterns asclassified by the Boston Diagnostic Aphasia examination.
Participant GJ was judged as non-fluent and classified with Broca’s aphasia with a severity of 5(mild). GJ was a 74 year old female with a Hemorrhagic Left Middle Cerebral Artery. The test sessionwas conducted 11 months post-onset and she had had eight years of education. GJ had had eight yearsof education, and the test session was conducted 11 months post-onset.
Participant GN was judged as fluent and classified with Wernicke’s Aphasia with a severity of 1(severe). GN was a 75-year old female with Ischaemic stroke to the Left Middle Cerebral Artery. GN hadhad nine years of education, and the test session was conducted 24 months post-onset.
Participant JB was judged as non-fluent and classified with Trans0cortical Motor Aphasia withseverity of 3. JB was a 72-year old male with a fronto-parietal Haemorrhagic stroke. JB had had sevenyears of education, and the test session was conducted 44 months post-onset.
An experienced speech pathologist judged each participant as highly intelligible speech withoutevidence of motor speech disorder.
2.2. Speech sampling
In the larger study natural discourse was sampled across three speaking contexts from 8 partici-pants. Speech samples were collected as described in Ciccone et al. (2000) and involved proceduralnarratives, picture descriptions and natural responses to questions such as ‘‘what did you doyesterday?’’ Each participant produced eight samples across the four speaking conditions within a twoweek period. Each participant was required to respond to the same elicitation stimuli and the time
K. Hird, K. Kirsner / Journal of Neurolinguistics xxx (2010) 1–136
ARTICLE IN PRESS
261
262
263
264
265
266
267
268
269
270
271
272
273
274
275
276
277
278
279
280
281
282
283
284
285
286
287
288
289
290
291
292
293
294
295
296
297
298
299
300
301
302
303
304
305
306
307
308
309
310
311
312
313
314
NEL441_proof � 12 March 2010 � 6/13
Please cite this article in press as: Hird, K., Kirsner, K., Objective measurement of fluency in naturallanguage production: A dynamic systems approach, Journal of Neurolinguistics (2010), doi:10.1016/j.jneuroling.2010.03.001
Original text:
Inserted Text
-
UNCORRECTEDPROOF
taken to complete these tasks was also recorded. These samples were then collated and pauses wereidentified according to the procedure described in Kirsner et al. (2002). The EM algorithm describedpreviously was implemented and short and long pauses distributions for each speaker were defined.Long pauses were then used to identify the boundaries for resulting speech segments. Correct Infor-mation Units (Nicholas & Brookshire, 1993) were calculated on the language segments and the scoreswere converted to measures of second per correct information unit to obtain a measure of commu-nicative efficiency. All parameter scores were converted to Crawford’s t (for small samples) (Crawford,Howell, & Garthwaite, 1998) and were individually compared to the summary reference distributionderived from speaking samples produced by a group of 13 non-brain damaged normal controlsparticipants between 40 and 70 years of age.
Speaking samples for control participants were collected and analysed using the same proceduresdescribed for the participants with aphasia. Each parameter was described statistically and the meanand 95% confidence intervals were calculated for comparative purposes. Both the long and short pauseswere described in terms of proportion, rate (per minute), mean (log ms) and standard deviation. Otherparameters include duration of the speech sample (minutes), pause classification threshold (log ms),proportion of pause misclassification and seconds per CIU. Speech segment duration is described interms of mean (log ms) and standard deviation.
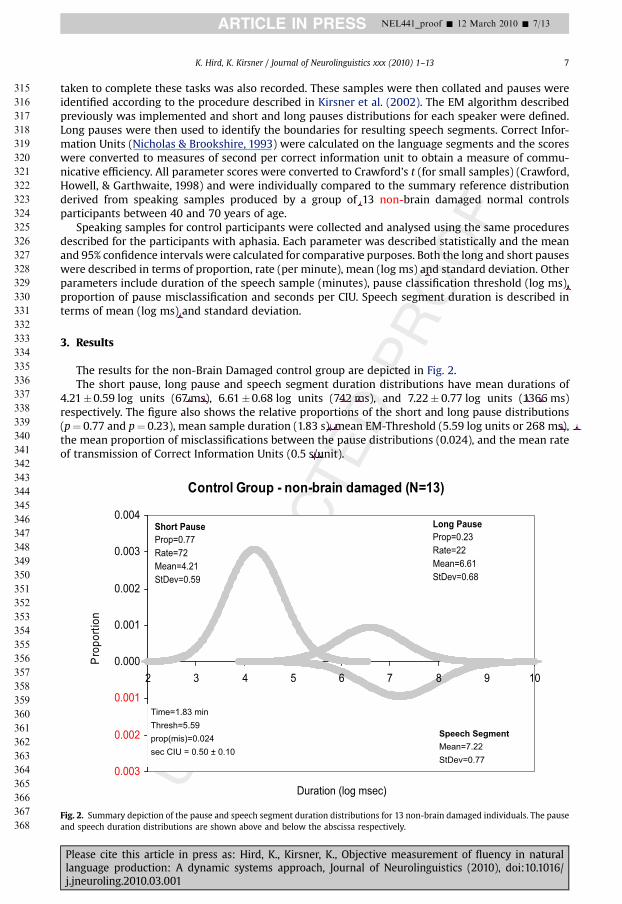
3. Results
The results for the non-Brain Damaged control group are depicted in Fig. 2.The short pause, long pause and speech segment duration distributions have mean durations of
4.21�0.59 log units (67 ms), 6.61�0.68 log units (742 ms), and 7.22� 0.77 log units (1366 ms)respectively. The figure also shows the relative proportions of the short and long pause distributions(p¼ 0.77 and p¼ 0.23), mean sample duration (1.83 s), mean EM-Threshold (5.59 log units or 268 ms),the mean proportion of misclassifications between the pause distributions (0.024), and the mean rateof transmission of Correct Information Units (0.5 s/unit).
Control Group - non-brain damaged (N=13)
0.003
0.002
0.001
0.000
0.001
0.002
0.003
0.004
2 3 4 5 6 7 8 9 10
Duration (log msec)
noitroporP
Short Pause
Prop=0.77Rate=72Mean=4.21StDev=0.59
Long Pause
Prop=0.23Rate=22Mean=6.61StDev=0.68
Speech Segment
Mean=7.22StDev=0.77
Time=1.83 minThresh=5.59prop(mis)=0.024sec CIU = 0.50 ± 0.10
Fig. 2. Summary depiction of the pause and speech segment duration distributions for 13 non-brain damaged individuals. The pauseand speech duration distributions are shown above and below the abscissa respectively.
K. Hird, K. Kirsner / Journal of Neurolinguistics xxx (2010) 1–13 7
ARTICLE IN PRESS
315
316
317
318
319
320
321
322
323
324
325
326
327
328
329
330
331
332
333
334
335
336
337
338
339
340
341
342
343
344
345
346
347
348
349
350
351
352
353
354
355
356
357
358
359
360
361
362
363
364
365
366
367
368
NEL441_proof � 12 March 2010 � 7/13
Please cite this article in press as: Hird, K., Kirsner, K., Objective measurement of fluency in naturallanguage production: A dynamic systems approach, Journal of Neurolinguistics (2010), doi:10.1016/j.jneuroling.2010.03.001
Original text:
Inserted Text
non
Original text:
Inserted Text
ec
Original text:
Inserted Text
ec
Original text:
Inserted Text
ec
Original text:
Inserted Text
Original text:
Inserted Text
ec
Original text:
Inserted Text
Original text:
Inserted Text
ec
Original text:
Inserted Text
Original text:
Inserted Text
ec
Original text:
Inserted Text
Original text:
Inserted Text
ec
Original text:
Inserted Text
Original text:
Inserted Text
ec
Original text:
Inserted Text
Original text:
Inserted Text
ec
UNCORRECTEDPROOF
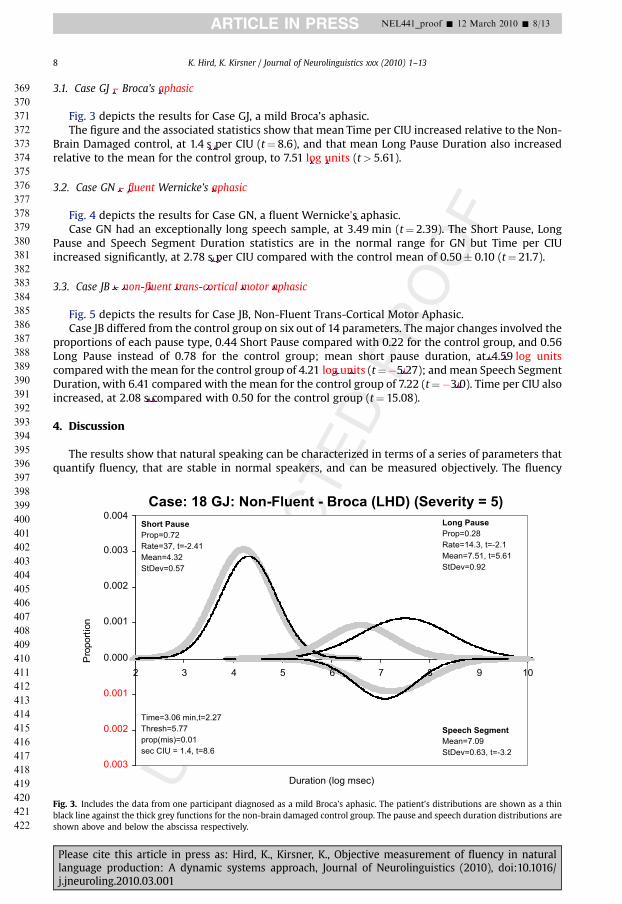
3.1. Case GJ – Broca’s aphasic
Fig. 3 depicts the results for Case GJ, a mild Broca’s aphasic.The figure and the associated statistics show that mean Time per CIU increased relative to the Non-
Brain Damaged control, at 1.4 s per CIU (t¼ 8.6), and that mean Long Pause Duration also increasedrelative to the mean for the control group, to 7.51 log units (t> 5.61).
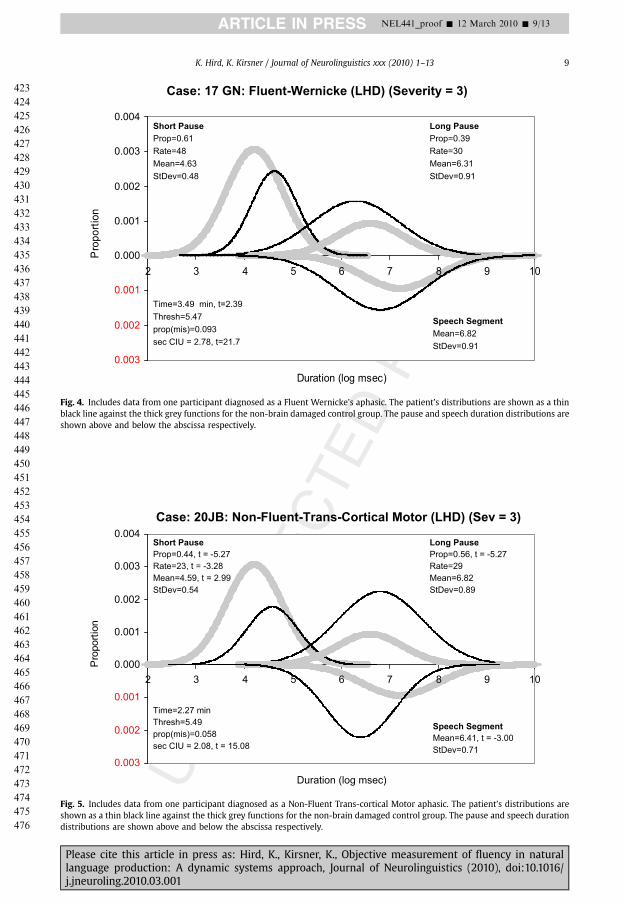
3.2. Case GN – fluent Wernicke’s aphasic
Fig. 4 depicts the results for Case GN, a fluent Wernicke’s aphasic.Case GN had an exceptionally long speech sample, at 3.49 min (t¼ 2.39). The Short Pause, Long
Pause and Speech Segment Duration statistics are in the normal range for GN but Time per CIUincreased significantly, at 2.78 s per CIU compared with the control mean of 0.50� 0.10 (t¼ 21.7).
3.3. Case JB – non-fluent trans-cortical motor aphasic
Fig. 5 depicts the results for Case JB, Non-Fluent Trans-Cortical Motor Aphasic.Case JB differed from the control group on six out of 14 parameters. The major changes involved the
proportions of each pause type, 0.44 Short Pause compared with 0.22 for the control group, and 0.56Long Pause instead of 0.78 for the control group; mean short pause duration, at 4.59 log unitscompared with the mean for the control group of 4.21 log units (t¼�5.27); and mean Speech SegmentDuration, with 6.41 compared with the mean for the control group of 7.22 (t¼�3.0). Time per CIU alsoincreased, at 2.08 s compared with 0.50 for the control group (t¼ 15.08).
4. Discussion
The results show that natural speaking can be characterized in terms of a series of parameters thatquantify fluency, that are stable in normal speakers, and can be measured objectively. The fluency
Case: 18 GJ: Non-Fluent - Broca (LHD) (Severity = 5)
0.003
0.002
0.001
0.000
0.001
0.002
0.003
0.004
2 3 4 5 6 7 8 9 10
Duration (log msec)
noitroporP
Short Pause
Prop=0.72Rate=37, t=-2.41Mean=4.32StDev=0.57
Long Pause
Prop=0.28Rate=14.3, t=-2.1Mean=7.51, t=5.61StDev=0.92
Speech Segment
Mean=7.09StDev=0.63, t=-3.2
Time=3.06 min,t=2.27Thresh=5.77prop(mis)=0.01sec CIU = 1.4, t=8.6
Fig. 3. Includes the data from one participant diagnosed as a mild Broca’s aphasic. The patient’s distributions are shown as a thinblack line against the thick grey functions for the non-brain damaged control group. The pause and speech duration distributions areshown above and below the abscissa respectively.
K. Hird, K. Kirsner / Journal of Neurolinguistics xxx (2010) 1–138
ARTICLE IN PRESS
369
370
371
372
373
374
375
376
377
378
379
380
381
382
383
384
385
386
387
388
389
390
391
392
393
394
395
396
397
398
399
400
401
402
403
404
405
406
407
408
409
410
411
412
413
414
415
416
417
418
419
420
421
422
NEL441_proof � 12 March 2010 � 8/13
Please cite this article in press as: Hird, K., Kirsner, K., Objective measurement of fluency in naturallanguage production: A dynamic systems approach, Journal of Neurolinguistics (2010), doi:10.1016/j.jneuroling.2010.03.001
Original text:
Inserted Text
-
Original text:
Inserted Text
Aphasic
Original text:
Inserted Text
Original text:
Inserted Text
ec
Original text:
Inserted Text
Log
Original text:
Inserted Text
Units
Original text:
Inserted Text
-
Original text:
Inserted Text
Fluent
Original text:
Inserted Text
Aphasic
Original text:
Inserted Text
.
Original text:
Inserted Text
Original text:
Inserted Text
ec
Original text:
Inserted Text
-
Original text:
Inserted Text
Non
Original text:
Inserted Text
Fluent
Original text:
Inserted Text
Trans
Original text:
Inserted Text
Cortical
Original text:
Inserted Text
Motor
Original text:
Inserted Text
Aphasic
Original text:
Inserted Text
Log
Original text:
Inserted Text
Units
Original text:
Inserted Text
Log
Original text:
Inserted Text
Units
Original text:
Inserted Text
-
Original text:
Inserted Text
-
Original text:
Inserted Text
Original text:
Inserted Text
ec
UNCORRECTEDPROOF
Case: 17 GN: Fluent-Wernicke (LHD) (Severity = 3)
0.003
0.002
0.001
0.000
0.001
0.002
0.003
0.004
2 3 4 5 6 7 8 9 10
Duration (log msec)
noitroporP
Short Pause
Prop=0.61Rate=48Mean=4.63StDev=0.48
Long Pause
Prop=0.39Rate=30Mean=6.31StDev=0.91
Speech Segment
Mean=6.82StDev=0.91
Time=3.49 min, t=2.39Thresh=5.47prop(mis)=0.093sec CIU = 2.78, t=21.7
Fig. 4. Includes data from one participant diagnosed as a Fluent Wernicke’s aphasic. The patient’s distributions are shown as a thinblack line against the thick grey functions for the non-brain damaged control group. The pause and speech duration distributions areshown above and below the abscissa respectively.
Case: 20JB: Non-Fluent-Trans-Cortical Motor (LHD) (Sev = 3)
0.003
0.002
0.001
0.000
0.001
0.002
0.003
0.004
2 3 4 5 6 7 8 9 10
Duration (log msec)
noitroporP
Short Pause
Prop=0.44, t = -5.27Rate=23, t = -3.28Mean=4.59, t = 2.99StDev=0.54
Long Pause
Prop=0.56, t = -5.27Rate=29Mean=6.82StDev=0.89
Speech Segment
Mean=6.41, t = -3.00StDev=0.71
Time=2.27 minThresh=5.49prop(mis)=0.058sec CIU = 2.08, t = 15.08
Fig. 5. Includes data from one participant diagnosed as a Non-Fluent Trans-cortical Motor aphasic. The patient’s distributions areshown as a thin black line against the thick grey functions for the non-brain damaged control group. The pause and speech durationdistributions are shown above and below the abscissa respectively.
K. Hird, K. Kirsner / Journal of Neurolinguistics xxx (2010) 1–13 9
ARTICLE IN PRESS
423
424
425
426
427
428
429
430
431
432
433
434
435
436
437
438
439
440
441
442
443
444
445
446
447
448
449
450
451
452
453
454
455
456
457
458
459
460
461
462
463
464
465
466
467
468
469
470
471
472
473
474
475
476
NEL441_proof � 12 March 2010 � 9/13
Please cite this article in press as: Hird, K., Kirsner, K., Objective measurement of fluency in naturallanguage production: A dynamic systems approach, Journal of Neurolinguistics (2010), doi:10.1016/j.jneuroling.2010.03.001
UNCORRECTEDPROOF
patterns for the three aphasic speakers are in keeping with the Boston Diagnostic Aphasia classifica-tions but in addition provide a quantitative description of the factors that contribute to fluencydisruption. In this sense the Fluency Profiling System provides data that reflect language processingefficiency, and can be used to test hypotheses about dynamic cognitive and language processes. Inaddition, the level of detail provided by the Fluency Profiling System is sensitive, and it is thereforecapable of detecting change over time during rehabilitation, or between contexts.
4.1. Segmentation
There are several additional benefits of the Fluency Profiling System. The pause analysis provides anobjective method of segmenting continuous speech samples without reference to linguistic rules. Thisis important when speech has been disrupted and the use of linguistic rules is not conventional or, inthe case of second language users, when their second language grammar is not as proficient as theirnative grammar. An additional application involves developmental language, where communicativeintention is emphatic but language acquisition is incomplete.
It is probable that the speech segments defined by the long pause boundaries reflect cognitiveprocessing chunks that emerge in a step-wise linear sequence. Questions about segmentation posea challenge to psycho-linguistics. Which source of segmentation information is used during languagecomprehension? Is it situation-or individual-specific for example, or does it involve a neural raceamong alternative sources of information? With few exceptions, the established segmentation modelsdepend on competence rather than performance, even to the extent that training can be used tofacilitate segmentation by professionals. But what if the entire process in natural language productionand reception is based on a performance model?
One obvious alternative involves pause duration. In this and other studies we have demonstratedthat pause duration involves two lognormal distributions, distributions that vary substantially fromindividual to individual and context to context. For example, in brain damaged people the range ofobserved thresholds – the value that provides the optimal separation between short pause and longpause distributions – can vary from approximately 100 ms to 450 ms. But even in the non-braindamaged population, the observed thresholds vary from 150 ms to 400 ms, with a mean across indi-viduals of approximately 250 ms, the value nominated by Goldman-Eisler (1968). For group purposesher value is valid but when the same value is used for all of the participants in a study it will yieldsubstantial pause misclassification, of short as long, and vice versa. However, with the proceduredeveloped by us, the EM algorithm selects a value for each individual that minimizes misclassification.
We propose therefore that the performance approach based on the mathematical separation ofspeech into segments or chunks may be particularly appropriate. Furthermore, given automatic clas-sification of the speech stream into ‘silence’ and ‘speech’ (in preparation), the system can be refined tooffer a solution that is both objective and automatic, and independent of human classification based oncompetence models. The System can be refined to offer solutions that are both objective and automatic,and independent of human classification based on competence models.
The Fluency Profiling system offers other advantages. Using the technique described here it ispossible to determine how speech errors relate to speech segments and hence the speech analyst hasa better notion of speaker intention as the sample emerges. Alternative systems rely on assumptionsassociated with sophisticated computational linguistic rules involving both syntax and semantics. Inaddition, once the speech segments have been defined, by further analysis involving lexical, syntacticor phonological information can be implemented.
4.2. Objective measurement of complex dynamic systems
A long-term goal for research into the neurobiology of language should be to develop parallelinstruments for the measurement of neural activity and language. The Fluency Profiling Systemdescribed in this article provides statistics that characterize the overall performance of the languageproduction system for sample periods of two or more minutes.
The Fluency Profiling System is in some respect comparable to the Electrocardiogram. The Elec-trocardiogram or ECG involves a single or typical cycle, and it is possible to depict a sample cycle for
K. Hird, K. Kirsner / Journal of Neurolinguistics xxx (2010) 1–1310
ARTICLE IN PRESS
477
478
479
480
481
482
483
484
485
486
487
488
489
490
491
492
493
494
495
496
497
498
499
500
501
502
503
504
505
506
507
508
509
510
511
512
513
514
515
516
517
518
519
520
521
522
523
524
525
526
527
528
529
530
NEL441_proof � 12 March 2010 � 10/13
Please cite this article in press as: Hird, K., Kirsner, K., Objective measurement of fluency in naturallanguage production: A dynamic systems approach, Journal of Neurolinguistics (2010), doi:10.1016/j.jneuroling.2010.03.001
Original text:
Inserted Text
Original text:
Inserted Text
ec
Original text:
Inserted Text
Original text:
Inserted Text
ec
Original text:
Inserted Text
Original text:
Inserted Text
ec
Original text:
Inserted Text
Original text:
Inserted Text
ec
Original text:
Inserted Text
Original text:
Inserted Text
ec

UNCORRECTEDPROOF
language production as well. The Fluency Profiling System as described here involves average valuesfor dozens or even hundreds of cycles, and provides estimates of cycle components that correspondloosely to the ECG components. The point of this comparison is to underline the similarities betweenthe steps on the road to quantification in biological and medical science on the one hand, and languageon the other.
The next step in this comparison is to provide a provisional estimate of the clinical value ofcomponent measures in the Fluency Profiling System. For the ECG, shortening or prolongation of theQT interval implicates Hypercalcaemia and Hypocalcaemia respectively while inverted T wavesgenerally indicate Coronary Ischemia.
Fig. 3 depicts a patient classified with Broca’s Aphasia, and the anticipated changes in the LongPause Distribution are evident; the mean and standard deviation are increased relative to the non-Brain Damaged control group. The information transmission measure shows too, that less informa-tion is being transmitted per unit of time.
Fig. 4 depicts a patient classified with Wernicke’s aphasia. The patient’s mean Long Pause andSpeech Segment Durations are actually shorter than the equivalent means for the non-Brain Damagedcontrol group, although not significantly so. However, despite the fact that the patient’s language isclearly ‘fluent’ in acoustic terms, the extent of the decline in the rate of information transmission is inline with traditional characterizations of Wernicke’s aphasia.
Fig. 5 depicts a patient classified with non-Fluent trans-cortical motor aphasia. In such a patient wewould usually expect short, halting and effortful utterances. The most striking change in the FluencyProfiling parameters involved Speech Segment duration, reduced significantly compared to theequivalent mean for the non-brain damaged control. It should also be noted that although both theBroca and Trans-cortical motor aphasics show increases in their Pause-to-Speech Ratios, this is ach-ieved by increased mean Long Pause Duration in the patient classified with Broca’s aphasia while itreflects a reduction in mean Speech Segment Duration in the patient classified with Trans-corticalmotor aphasia.
Fig. 6. Sketch depicting potential mapping between the spatial and temporal parameters associated with a sample of the tools formapping brain areas (see Van Horn, 2003) on the one hand, and the measurement of speech segment duration in the fluencydomain, on the other.
K. Hird, K. Kirsner / Journal of Neurolinguistics xxx (2010) 1–13 11
ARTICLE IN PRESS
531
532
533
534
535
536
537
538
539
540
541
542
543
544
545
546
547
548
549
550
551
552
553
554
555
556
557
558
559
560
561
562
563
564
565
566
567
568
569
570
571
572
573
574
575
576
577
578
579
580
581
582
583
584
NEL441_proof � 12 March 2010 � 11/13
Please cite this article in press as: Hird, K., Kirsner, K., Objective measurement of fluency in naturallanguage production: A dynamic systems approach, Journal of Neurolinguistics (2010), doi:10.1016/j.jneuroling.2010.03.001

UNCORRECTEDPROOF
4.3. Mapping between neuroscience and behavioural science parameters
To identify the potential relationship between the neuroscience and behavioural domains, it isnecessary to return to the quotation from Port and Leary (2005). Space and Time are critical. ConsiderFig. 6. The figure is a sketch based on Van Horn (2003). The original figure depicted the spatio-temporalregions associated with 11 tools for mapping brain areas. The axes involve log base 10. The fluencyparameters originally calculated for Natural Log have been modified to fit base 10. The spatio-temporalareas depicted for fMRI and MEG are from Van Horn. A provisional area is also shown for speechsegment duration based on our own work. The area shows only the range; the values for specificsegments fall between these extremes. The spatial limits are of course unknown.
Speech segment duration has been used as an example in this figure. It is also possible to map theshort and long pause durations into the spatio-temporal region defined by Van Horn (2003). The figurehas been designed to illustrate the potential mappings that could be achieved for objective andsensitive measures of continuous and contextualized language tasks on the one hand, and brainmapping on the other.
5. Conclusion
The Fluency Profiling System supports objective and sensitive measurement of fluency for naturalspeech samples. Fluency in this sense can be thought of as an index of integrated neural function forspeech production. In addition, it provides a clear algorithm for segmentation of continuous speechbased on the acoustic signal. This is important as speaking fluency requires integrated brain functionand could be an important reflection of neural processing efficiency. The system permits the analysis ofefficiency, and the identification of factors that could interfere with efficiency. Future studies couldfocus on the correlation between the measures provided by the Fluency Profiling System and dynamicmeasures of brain function. Currently the Fluency Profiling System provides a useful baseline measureto capture the efficiency of speaking performance at stages of development, second language acqui-sition, and recovery from brain damage.
References
Boersma, P. (2001). Praat, a system for doing phonetics by computer. Glot International, 5(9/10), 341–345.Butterworth, B. (1979). Hesitation and the production of verbal paraphasias and neologisms in Jargon aphasia. Brain and
Language, 8, 133–161.Chomsky, N. (1965). Aspects of the theory of syntax. MIT Press.Ciccone, N., Hird, K., & Kirsner, K. (2000). Treatment efficacy: an explanation of new learning in patients with aphasia. Asia
Pacific Journal of Speech, Language and Hearing, 5, 79–84.Coltheart, M. (1999). Modularity and cognition. Trends in Cognitive Science, 3(3), 115–120.Dunn, J. C., & Kirsner, K. (1988). Discovering functionally independent mental processes: the principle of reversed association.
Psychological Review, 95(1), 91–101.Goldman-Eisler, F. (1968). Psycholinguistics: Experiments in spontaneous speech. New York: Academic Press.Gordon, J. K. (1998). The fluency dimension in aphasia. Aphasiology, 12(7/8), 673–688.Hird, K., & Kirsner, K. (2004). The cost of clinical assessment: aphasia testing undressed. Australian Communication Quarterly,
6(2), 63–66.Hird, K., & Kirsner, K. (2008). Compromised speech processing in language disorders. International seminar speech processing
proceedings, Strasbourg.Hird, K., Silvestri, J., Dunn, J. C, & Kirsner, K. (2005). Aphasia classification: the relationship between objective measures of
spontaneous speaking samples and naı̈ve listener judgements of similarity and fluency. In 35th clinical aphasiologyconference procedings. Sanibel Island, Fl. Published Abstract.
Hula, W., McNeil, M., Doyle, P., Rubinsky, H., & Fossett, T. (2003). The inter-rater reliability of the story retell procedure.Aphasiology, 17(5), 523–528.
Jackson, N. E., & Coltheart, M. (2002). Distinguishing proximal from distal cues is useful and compatible with accounts ofcompensatory processing developmental disorders of cognition. Behavioural and Brain Sciences, 25(6), 758.
Kirsner, K., Dunn, J., Hird, K., Parkin, T., & Clark, C. (2002). Time for a pause. SST-2002. Proceedings of the 9th Australian internationalconference on speech science. Melbourne: Australian Speech Science and Technology Association Inc., ISBN 0 9581946 0 2. (CD).
Kirsner, K., HIrd, K., & Dunn, J. C. (2005). Communication disorders following stroke: first step towards a new fluency protocol.Brain and Language, 95(1), 165–166.
Nicholas, L. E., & Brookshire, R. H. (1993). A system for quantifying the informativeness and efficiency of the connected speech ofadults with aphasia. Journal of Speech and Hearing Research, 36, 338–345.
Niemi, J. (1988). Modularity of prosody: autonomy of phonological quantity and intonation in aphasia. Brain and Language, 61,45–53.
K. Hird, K. Kirsner / Journal of Neurolinguistics xxx (2010) 1–1312
ARTICLE IN PRESS
585
586
587
588
589
590
591
592
593
594
595
596
597
598
599
600
601
602
603
604
605
606
607
608
609
610
611
612
613
614
615
616
617
618
619
620
621
622
623
624
625
626
627
628
629
630
631
632
633
634
635
636
637
638
NEL441_proof � 12 March 2010 � 12/13
Please cite this article in press as: Hird, K., Kirsner, K., Objective measurement of fluency in naturallanguage production: A dynamic systems approach, Journal of Neurolinguistics (2010), doi:10.1016/j.jneuroling.2010.03.001
UNCORRECTEDPROOF
Port, R. F., & Leary, A. P. (2005). Against formal phonology. Language, 81, 927–964.Steyn-Ross, M. L., Steyn-Ross, D. A., Wilson, M. T., & Sleigh, J. W. (2009). Modeling brain activation patterns for the default and
cognitive states. Neuroimage, 45(2), 298–311.Thompson, C. K., & den Ouden, D. B. (2008). Neuroimaging and recovery of language in aphasia. Current Neurology and
Neuroscience, 8(6), 475–483.Thompson, C., & Small, S. (2000). Symposium 2: neural correlates of language recovery in aphasia. Brain and Language, 74, 383–394.Van Horn, J. D. (2003, winter). Historical overview of brain function localization. Public Broadcasting Service.Weiller, C. (2000). Brain imaging in recovery from aphasia. Brain and Language, 74(3), 385–387.
K. Hird, K. Kirsner / Journal of Neurolinguistics xxx (2010) 1–13 13
ARTICLE IN PRESS
639
640
641
642
643
644
NEL441_proof � 12 March 2010 � 13/13
Please cite this article in press as: Hird, K., Kirsner, K., Objective measurement of fluency in naturallanguage production: A dynamic systems approach, Journal of Neurolinguistics (2010), doi:10.1016/j.jneuroling.2010.03.001