Measurement of Speech Effort During Fluency-Inducing Conditions in Adults Who Do and Do Not Stutter
20
Measurement of Speech Effort During Fluency-Inducing Conditions in Adults who Do and Do Not Stutter Roger J. Ingham 1,2,3 , Anne K. Bothe 4 , Erin Jang 1 , Lauren Yates 4 , John Cotton 1 , and Irene Seybold 1 1 University of California, Santa Barbara 2 University of Texas Health Science Center, San Antonio 3 University of Texas San Antonio 4 University of Georgia Abstract Purpose—To investigate the effects of four fluency-inducing (FI) conditions on self-rated speech effort and other variables in adults who stutter and in normally fluent controls. Method—Twelve adults with persistent stuttering and 12 adults who had never stuttered each completed 4 ABA-format experiments. During A phases participants read aloud normally. During each B phase they read aloud in one of four FI conditions: auditory masking, chorus reading, whispering, and rhythmic speech. Dependent variables included self-judged speech effort and observer-judged stuttering frequency, speech rate, and speech naturalness. Results—For the persons who stuttered, FI conditions reduced stuttering and speech effort, but only for chorus reading were these improvements obtained without diminishing speech naturalness or speaking rate. By contrast, speech effort increased during all FI conditions for adults who did not stutter. Conclusions—Self-rated speech effort differentiated the effects of four FI conditions on speech performance for adults who stuttered, with chorus reading best approximating normally fluent speech. More generally, self-ratings of speech effort appeared to constitute an independent, reliable, and validly interpretable dimension of fluency that may be useful in the measurement and treatment of stuttering. Normally fluent speech is not easily defined (Finn & Ingham, 1989), but there appears to be some consensus that, as compared with stuttered speech, it is typified by (1) relatively little disfluency, (2) normal utterance rate, (3) natural sounding speech quality, and (4) relatively little effort (Starkweather, 1987). The first three of these characteristics have been studied extensively (see Young, 1984). They lend themselves to objective or observer-judged measurement, and they have also been of some benefit in prescribing some goals for stuttering treatment, describing the outcomes of treatment, and even developing methods for shaping normally fluent speech during some treatments (e.g., Onslow & Ingham, 1987). “Speech effort,” in contrast, remains an elusive concept (see Ingham & Cordes, 1997). According to Starkweather (1987), fluent speech can be conceptualized as being “effortless” in two ways: (a) it requires little cognitive preparation, and (b) it requires only a small amount of muscular exertion. Correlates of the latter might be measurable in terms of Address for all correspondence: Roger J. Ingham, Dept. of Speech and Hearing Sciences, University of California Santa Barbara, Santa Barbara, CA, 93106; [email protected]. NIH Public Access Author Manuscript J Speech Lang Hear Res. Author manuscript; available in PMC 2010 October 1. Published in final edited form as: J Speech Lang Hear Res. 2009 October ; 52(5): 1286–1301. doi:10.1044/1092-4388(2009/08-0181). NIH-PA Author Manuscript NIH-PA Author Manuscript NIH-PA Author Manuscript
Transcript of Measurement of Speech Effort During Fluency-Inducing Conditions in Adults Who Do and Do Not Stutter
Measurement of Speech Effort During Fluency-InducingConditions in Adults who Do and Do Not Stutter
Roger J. Ingham1,2,3, Anne K. Bothe4, Erin Jang1, Lauren Yates4, John Cotton1, and IreneSeybold11University of California, Santa Barbara2University of Texas Health Science Center, San Antonio3University of Texas San Antonio4University of Georgia
AbstractPurpose—To investigate the effects of four fluency-inducing (FI) conditions on self-rated speecheffort and other variables in adults who stutter and in normally fluent controls.
Method—Twelve adults with persistent stuttering and 12 adults who had never stuttered eachcompleted 4 ABA-format experiments. During A phases participants read aloud normally. Duringeach B phase they read aloud in one of four FI conditions: auditory masking, chorus reading,whispering, and rhythmic speech. Dependent variables included self-judged speech effort andobserver-judged stuttering frequency, speech rate, and speech naturalness.
Results—For the persons who stuttered, FI conditions reduced stuttering and speech effort, butonly for chorus reading were these improvements obtained without diminishing speech naturalnessor speaking rate. By contrast, speech effort increased during all FI conditions for adults who did notstutter.
Conclusions—Self-rated speech effort differentiated the effects of four FI conditions on speechperformance for adults who stuttered, with chorus reading best approximating normally fluentspeech. More generally, self-ratings of speech effort appeared to constitute an independent, reliable,and validly interpretable dimension of fluency that may be useful in the measurement and treatmentof stuttering.
Normally fluent speech is not easily defined (Finn & Ingham, 1989), but there appears to besome consensus that, as compared with stuttered speech, it is typified by (1) relatively littledisfluency, (2) normal utterance rate, (3) natural sounding speech quality, and (4) relativelylittle effort (Starkweather, 1987). The first three of these characteristics have been studiedextensively (see Young, 1984). They lend themselves to objective or observer-judgedmeasurement, and they have also been of some benefit in prescribing some goals for stutteringtreatment, describing the outcomes of treatment, and even developing methods for shapingnormally fluent speech during some treatments (e.g., Onslow & Ingham, 1987).
“Speech effort,” in contrast, remains an elusive concept (see Ingham & Cordes, 1997).According to Starkweather (1987), fluent speech can be conceptualized as being “effortless”in two ways: (a) it requires little cognitive preparation, and (b) it requires only a small amountof muscular exertion. Correlates of the latter might be measurable in terms of
Address for all correspondence: Roger J. Ingham, Dept. of Speech and Hearing Sciences, University of California Santa Barbara, SantaBarbara, CA, 93106; [email protected].
NIH Public AccessAuthor ManuscriptJ Speech Lang Hear Res. Author manuscript; available in PMC 2010 October 1.
Published in final edited form as:J Speech Lang Hear Res. 2009 October ; 52(5): 1286–1301. doi:10.1044/1092-4388(2009/08-0181).
NIH
-PA Author Manuscript
NIH
-PA Author Manuscript
NIH
-PA Author Manuscript

electromyographic activity, but this final characteristic of fluent speech differs importantlyfrom the first three in that it is primarily a self-judgment of a perception, rather than an objectivemeasurement. Both observer judgments and self judgments have long histories in stutteringresearch and treatment, and both are affected by similar problems of definition, reliability, andvalidity (see Cordes & Ingham, 1994; Franic & Bothe, 2008). With respect to both definitionand interpretation, for example, previous research has demonstrated speakers’ ability todifferentiate between how natural their speech felt and how natural it sounded (Finn & Ingham,1994); the same participants also used descriptors that referred to either “cognitive effort” or“attention to speech” when asked to identify the features they had employed to rate how naturaltheir speech felt. The usefulness of self-ratings of speech effort, therefore, may depend on theextent to which speakers can differentiate between cognitive and physical effort andnaturalness. Similarly, Boberg and Kully (1994), in a treatment study with adults andadolescents who stuttered, used Perkins’ (1981) Speech Performance Questionnaire (SPQ) tomeasure self-reported perceptions and performance after treatment. They reported that 29 outof 30 participants felt, 12-24 months after therapy, that they could “almost always” or“sometimes” “speak normally without thinking about controlling speech” (p. 1056). Whether“thinking about controlling speech” is a self-rating of cognitive effort or a self-judgment ofphysical activity, however, is difficult to determine, despite the acknowledged importance ofthese constructs to the perceived success or failure of stuttering treatment.
Speech Effort and Fluency-Inducing ConditionsIngham, Warner, Byrd and Cotton (2006) attempted to address directly some of these questionsabout speech effort ratings by investigating the effect of chorus reading on self-rated speecheffort. Twelve persons who stuttered (10 males, all adult) and a gender- and age-matched groupof normally fluent controls used a variation of Martin, Haroldson, and Triden’s (1984) 9-pointspeech naturalness scale to measure speech effort, both while they read alone and while theyread along with a prerecorded accompanist (chorus reading, a condition known to reducestuttering). On the 9-point Speech Effort Self Rating Scale employed by Ingham et al., “1”equaled “very effortless speech” and “9” equaled “very effortful speech,” with repeatedinstructions to the participants that they should focus on “physical effort” or the “amount ofphysical effort needed to speak, whether or not you were stuttering” (p. 663). Ingham et al.(2006) reported that the group of persons who stuttered averaged approximately 2.5 on thespeech effort scale during chorus reading, which was significantly better than their ratingsduring nonchorus reading (approximately 5.7) but significantly higher than ratings providedby the controls during nonchorus reading conditions (approximately 1.5). One additionalfinding of interest in the Ingham et al. (2006) study was that chorus reading required asignificant increase in speech effort by the normally fluent control group. In fact, their level ofspeech effort during chorus reading was not significantly different from that reported by thegroup of persons who stuttered during chorus reading. This finding could be interpreted tomean that while a fluency-inducing (FI) condition might produce reduced speech effort inpersons who stutter, that only occurs because of reduced stuttering and not because thesespeakers now also produce more normally fluent speech.
One shortcoming of Ingham et al.’s (2006) study, however, is that it used only chorus reading,rather than testing whether the obtained speech effort levels were characteristic of other FIconditions. The present study was intended, therefore, to expand current knowledge about self-judgments of speech effort by investigating four different FI conditions: auditory masking,chorus reading, whispering, and rhythmic stimulation. All four have been demonstrated toreduce stuttering frequency in adult persons who stuttered (Bloodstein, 1995). They wereselected for use in this study because they are suitable for use with oral reading, are amenableto controlled presentation, can be adjusted for individual participants, and also differ from eachother in some relevant characteristics, as discussed immediately below.
Ingham et al. Page 2
J Speech Lang Hear Res. Author manuscript; available in PMC 2010 October 1.
NIH
-PA Author Manuscript
NIH
-PA Author Manuscript
NIH
-PA Author Manuscript
MaskingPartial or complete auditory masking of the speaker’s voice signal is a well documentedprocedure for producing a temporary reduction in the frequency of stuttering (Ingham, 1984).Initial demonstrations showed that 90 dB SPL white noise is sufficient to mask the speaker’svoice, at least partially, and reduce stuttering immediately (Maraist & Hutton, 1957). Laterresearch showed that the stimulus need not be so loud, and also that continued exposure maydiminish the fluency-inducing effects of masking (Garber & Martin, 1974). When comparedwith other stuttering reduction techniques (time-out, rhythmic stimulation, DAF), masking’seffects may also be relatively less powerful and consistent (see Bothe et al., 2006; Martin &Haroldson, 1979). It was selected for the present study, therefore, because it could be predictedto provide an intermediate level of fluency with no deterioration in speech naturalness, ascompared with some other FI conditions.
Chorus ReadingOne of most intriguing features of developmental stuttering is the immediacy with whichstuttering ceases when a person who stutters and an accompanist read aloud identical material(see Ingham, 1984). This has come to be known as the “chorus-reading effect”; it has now beendemonstrated to occur with a recorded accompanist (Ingham & Packman, 1979) and even whena person who stutters merely observes an accompanist speaking silently (Kalinowski, Stuart,Rastatter, Snyder & Dayalu, 2000; Taylor, Bothe, & Everett, 2003). There is some evidencethat chorus reading is the most powerful and reliable of the FI procedures (Johnson & Rosen,1937); it can result in speech that may not always be distinguished from that produced by anormally fluent speaker (Ingham & Packman, 1979) and may not be significantly differentfrom normally fluent speech according to observer-judged speech naturalness ratings (Ingham,Ingham, Finn & Fox, 2003). It was important to the present study as a condition that could bepredicted to result in fluent and relatively natural sounding speech.
WhisperingWhispering may be defined as “non-vocal sound with no carrying power produced by thearrangement of the glottis during exhalation” (Nicolosi, Harryman, & Kresheck, 1996, p. 305),or speech characterized by the almost complete absence of phonation. Bloodstein (1950), inhis survey of conditions that reduce stuttering, found that about 52% of persons who stutterwho responded (n = 46) reported they had very little or no stuttering when whispering. Johnsonand Rosen (1937) originally reported about an 84% reduction in words stuttered duringwhispered oral reading. This finding was essentially replicated in a more recent study by Rami,Kalinowski, Rastatter, Holbert and Allen (2005), although there are also reports of lesserreductions (Bruce & Adams, 1978; Perkins, Rudas, Johnson & Bell, 1976). Whispering hasalso been described as requiring an increase in the speaker’s level of vocal effort (Monoson &Zemlin, 1984), as compared with normal speech, presumably because of the unusualcircumstance of producing articulatory movements but without phonation. Whispering wasselected for this study, therefore, because it reduces stuttering but at the distinct expense ofnaturalness and with the possibility of increased physical effort.
RhythmThe effect of a rhythmic stimulus on stuttering is one of the best documented methods fortemporarily reducing or removing stuttering (see Ingham, 1984). The “rhythm effect” onstuttering occurs when the speaker is instructed to speak so that one syllable, one word, or eveneach phrase accompanies an external stimulus or is simply timed to an internal rhythmic beatby the speaker. Reduced stuttering is reliably produced across a wide range of speech rates,and, unlike masking, the rhythm effect does not appear to be constrained by duration ofexposure (see Ingham, 1984). However, there is ample evidence that the reductions in stuttering
Ingham et al. Page 3
J Speech Lang Hear Res. Author manuscript; available in PMC 2010 October 1.
NIH
-PA Author Manuscript
NIH
-PA Author Manuscript
NIH
-PA Author Manuscript
are usually accompanied by unnatural sounding speech (see Bloodstein, 1995). Increasedphysical effort associated with an attempt to produce speech with a particular rhythm mightalso be hypothesized; hence the importance of rhythm as the fourth condition in the presentstudy.
The Present StudyIn summary, this study was designed to test whether four well established FI conditions, eachof which could be expected to produce a different combination of stuttering, naturalness, andphysical effort, produced differential effects on self-judged speech effort for speakers who doand do not stutter. These data were of interest in themselves, as an investigation of FI conditions,and also of interest in light of attempts to develop meaningful, reliable, and validly interpretablemeasures of speech effort. Thus, the study was also designed to compare the effects of FIconditions on experimenter-judged stuttering, speech rate, and speech naturalness. Based onprevious research and the characteristics of each FI condition, two specific hypotheses weregenerated: (a) that chorus reading would produce significantly greater improvements in speechfluency, speech naturalness, and self-rated speech effort in persons who stutter, as comparedwith the other three conditions; and (b) that all FI conditions would result in increased speecheffort and relatively more unnatural sounding speech in normally fluent speakers, as comparedwith normal reading.
MethodParticipants
Twelve adults with persistent stuttering (PS Group; 20-67 years; 8 males) served as participantsin the stuttering group. All were volunteers selected from a clinic waiting list or from thepretreatment data collection phase of another study; they viewed themselves, and they had beenpreviously diagnosed using standard clinical criteria, as persons with persistent chronicdevelopmental stuttering. Prior to participating in this study each member of the PS groupcompleted a 3-min oral reading and a 3-min monologue to assess frequency of stuttering andeligibility for inclusion; all displayed at least 3.0 % syllables stuttered (%SS) on both speakingtasks.
Twelve normally fluent speakers, matched pairwise by age (20-65 years) and gender (8 males)with the members of the PS group, served as controls. Controls reported no history of stutteringand showed no stuttering throughout this study. All participants in both groups reported anegative history of reading and hearing problems, and all denied any motor, sensory, orcognitive deficits that could interfere with the sensation or the self-measurement of physicaleffort associated with speech production. All participants passed a hearing screening in bothears at 25 dB HL at 500, 1000, 2000, 4000, 6000 and 8000 Hz. This study was preapprovedby the Institutional Review Boards at the University of California, Santa Barbara, and at theUniversity of Georgia, and participants completed approved informed consent proceduresbefore any data were collected.
ApparatusAll data were gathered using two computers and with participants sitting in a quiet or soundtreated room either in the presence of one experimenter or monitored by the experimenter froman adjacent control room. In all cases, two computers were used to manage presentation ofstimuli, data recording, and audiovisual recording of the sessions. The primary computer wasused to obtain measures of speech performance. These included measures of phonation,collected by means of an accelerometer placed over the prominence of the thyroid cartilageand held in place with an elastic and Velcro collar attached around the participant’s neck (for
Ingham et al. Page 4
J Speech Lang Hear Res. Author manuscript; available in PMC 2010 October 1.
NIH
-PA Author Manuscript
NIH
-PA Author Manuscript
NIH
-PA Author Manuscript
details see Ingham, Kilgo, Ingham, Moglia, Belknap & Sanchez, 2001). Phonation data werestored automatically to the primary computer by the Modifying Phonation Intervals (MPI)software (Ingham, Moglia, Kilgo, & Felino, 1997) and served primarily to establishexperimental fidelity for the whispering condition, as described in greater detail below.Measures of the three observer-judged dependent variables (stuttering frequency, speech rate,and speech naturalness) for this study were also gathered using the primary computer, throughStuttering Measurement System software (SMS; Ingham, Bakker, Ingham, Kilgo & Moglia,1999). A second computer was used to deliver the experimental stimuli necessary for themasking, chorus recording, and rhythmic stimulus conditions and to store audiovisual digitalrecordings of all sessions using Windows Movie Maker files generated through a Canon Z70digital video camera. A shotgun microphone attached to the camera (approximately 24 inchesfrom the subject’s mouth) was focused on the participant’s mouth to provide high-quality audiorecordings.
ProcedureOverall design—Each participant completed four sequences of ABA-format (Kazdin,1998) reading trials, one sequence for each of the four FI conditions. During the A phases theparticipants read aloud with no accompanying or altered stimulus condition; during the Bphases the reading tasks were accompanied by one of the four experimental stimulus conditions(masking, chorus reading, whispering, or rhythmic stimulation). Each A or B phase includedfive 1-min speaking trials, with each trial followed by approximately 1 min of rest and datastorage; thus, the ABA triad for each condition required a total of 15 min of speaking time.The entire experiment required approximately 3 hours, including all breaks and instructions,for each participant. The rhythmic stimulation triad occurred last in each session, to reduce theknown possibility of carryover from this condition. The other three experimental triads werepresented in random order across participants.
At the beginning of the experiment, each participant read initial instructions that described thegeneral format of the study (see Appendix A). The experimenter then asked the participant toexplain what was required, and when both were satisfied that the participant understood thegeneral format then specific instructions for the first ABA triad were introduced. When thoseinstructions were understood, the first A-phase trial of the first condition was completed. Atthe end of this 1-min trial, and at the end of all subsequent trials throughout the experiment,the participant was prompted by the software to enter a rating of speech effort for that minute.Physical effort was rated on a 9-point scale, using only whole numbers, with “1” defined ashighly effortless speech and “9” defined as highly effortful speech. During all conditions exceptchorus reading, participants read aloud from their choice of three books (Kagan, 1998; Linnea,1995; Ridley, 1999). All trials during the chorus reading triads used the same prepared text,from a fourth source, because of the need for a prerecorded accompanist.
Masking—During the B phase of the masking condition, the participant read accompaniedby white noise presented bilaterally through fitted foam ear tips at a self-selected maximaltolerable loudness level. Post-experiment evaluations verified that intensity of the signal variedacross participants from 93 to 100 dB SPL.
Chorus reading—At the beginning of the chorus reading condition, the participantcompleted multiple 5- to 10-s practice readings, attempting to read in chorus with audiorecordings of an adult female accompanist at different recording speeds. A total of 14 differentrates were available; they ranged from 70% to 130% of the recorded reader’s original 249 SPMrate. The participant selected a most comfortable chorus reading rate and volume level. Theexperimenter verified that participants were reading with the accompanist by verifying that theaudio signal was being provided, that the participant read continuously throughout the trial,
Ingham et al. Page 5
J Speech Lang Hear Res. Author manuscript; available in PMC 2010 October 1.
NIH
-PA Author Manuscript
NIH
-PA Author Manuscript
NIH
-PA Author Manuscript
and that the participant stopped at the same point in the reading material that the recording wasknown to stop.
Whispering—During the B phase of the whispering condition, the participant orally read ina whisper during each 1-min trial. The absence of phonation was verified in two ways: by aperceptual check from the experimenter that the reading sounded overwhelmingly whispered,and by checking the number of phonated intervals produced during each reading via the MPIsystem. Whispering was defined as a 90% reduction in 30-1000 ms PIs when compared withthe participant’s data from the immediately preceding A condition (see Nicolosi, Harryman,& Kresheck, 1996).
Rhythm—During the B-phase trials of the rhythm triad, the participant read aloud whileattempting to match one spoken syllable to each audible “beat” (a 0.3 s tone) of anaccompanying rhythmic stimulus. As in the chorus reading condition, each participant wasallowed to select a comfortable rate (from among ten available rates: 90, 100, 110, 120, 130,140, 150, 160, 170 or 180 bpm) and signal volume level during repeated brief practice trials.Verification that participants were producing rhythmic speech was obtained by having researchassistants listen to all recordings from the rhythmic speech ABA triads and rate each 1-mintrial on a scale from “1,” defined as “definitely producing rhythmic speech correctly” to “7,”defined as “definitely not producing rhythmic speech” (Davidow, Bothe, Andreatta & Ye, inpress).
Data AnalysisTwo research assistants shared data collection responsibilities approximately equally. Bothhad completed the Stuttering Measurement and Assessment Training (SMAAT; Ingham,Cordes, Kilgo & Moglia, 1998) program and had also completed the training programassociated with the SMS software (Ingham et al., 1999). They used the SMS program to countsyllables spoken and syllables stuttered, with stuttering judgments made in accordance withthe consensus judgments that serve as the training exemplars in the SMAAT and SMS trainingprograms. They also rated speech naturalness, using Martin et al.’s (1984) scale (“1 = highlynatural sounding speech”; “9 = highly unnatural sounding speech”) and again in accordancewith consensus standards incorporated into the SMS training program. The SMS softwareconverts the judges’ counts of syllables spoken and syllables stuttered into percent syllablesstuttered (%SS) and syllables per minute. In addition, because the SMS program also recordsdata in terms of time intervals that either do or do not contain a stuttering judgment, it is possibleto derive a measure of speech rate during stutterfree intervals only (stutterfree syllables spokenper minute, SFSPM, calculated for this study from 5-s intervals). SFSPM was used inpreference to global SPM for data analyses, because it more accurately captures the rate ofspeech without the influence of stuttering. Thus, the observer-judged dependent variables forthis study included %SS, SFSPM, and speech naturalness. These data, and the self-ratings ofspeech effort, were analyzed using a repeated measures multi-factor analysis of variance(Winer, Brown, & Michels, 1991), with protected post hoc comparisons, in order to elucidatethe experimental effects.
ReliabilityThe recordings of 6 PS group and 6 control group participants (50% of the data) were selectedat random after the completion of the study for rescoring by two additional judges trained onthe SMS and SMAAT programs but unfamiliar with this study. Trials from each participantwere presented to the reliability judges in a randomized order. They rescored the trial recordingsfrom a computer monitor using concurrently the Windows Media Player and the SMS program.Reliability was assessed by visual comparison between the experimenter’s and reliability
Ingham et al. Page 6
J Speech Lang Hear Res. Author manuscript; available in PMC 2010 October 1.
NIH
-PA Author Manuscript
NIH
-PA Author Manuscript
NIH
-PA Author Manuscript

judges’ scores, in order to establish the validity of the experimental effects achieved duringthe experiment.
ResultsExperimental Fidelity
Fidelity was obtained for the masking and chorus reading conditions on the basis of thepresentation of the auditory stimuli and the experimenter’s online judgment that the conditionswere performed correctly. The use of whispering by participants was verified by measuringthe total number of phonation interval counts in the 30-1000 ms range in the A and B phasesof the Whispering triad. For the PS group the PI totals for A1, B, and A2 phases were 510, 57and 512 and for the control group the totals were 652, 10, and 675. Hence, there was clearevidence that the B phase involved dramatically reduced phonation For the rhythm condition,across all participants, mean ratings on the 7-point scale used to assess judges’ perception ofrhythmic speech were 6.67 for A1 (pre-experimental baseline) trials, 1.76 for B-phase (rhythm)trials, and 6.77 for A2 (post-rhythm return to normal speech) trials; that is, A-phase speechwas perceived by the judges as not rhythmic and B-phase speech was perceived by the judgesas consistently rhythmic.
Within-Group ComparisonsPersistent stuttering (PS) group—The solid squares in the left column of Figure 1 (%SSdata), the condition means in Table 1, and the associated post hoc comparisons in AppendixB all show that the four FI conditions produced significant reductions in stuttering for theparticipants who stuttered, ranging from a 22% reduction during masking to a 99.5% reductionduring rhythm. The minimal changes in speech rate shown in Figure 1 and Table 1 weresignificant for masking, rhythm, and whispering (Appendix B), but with Cohen’s d scores ofonly 0.22 to 0.51. Speech naturalness showed significant deterioration in three of the four FIconditions; the exception was chorus reading, during which speech naturalness did not changesignificantly for this group. Self-rated speech effort, however, improved in all four conditions,with the changes ranging from approximately 1 scale point (0.7) in masking to almost 3 scalepoints in rhythm (2.6) and with d scores between 0.98 and 1.28 for chorus reading, whispering,and rhythm (Appendix B). Table 2 and Appendix C also show that the only significantdifference between the first A condition (A1) and the second A condition (A2) in any triad forthe PS group was for effort ratings before and after the B phase of the rhythm condition; thisresult is consistent with the known tendency for temporary carryover effects from rhythmicstimulation (Ingham, 1984).
Control group—Control group participants showed minimal but significant decreases inspeech rate during chorus reading and whispering, and a substantial, significant decrease inspeech rate during rhythmic speech, as compared with the relevant A-phase trials (right columnin Figure 1, and Appendix B). The last of these results suggests that control participants allselected rates for the rhythmic condition that were significantly slower than their naturalspeech, a result that complicates interpretation of the naturalness and effort ratings for thatcondition (and that is also apparent in the PI data in Figure 1). Nevertheless, for the controlgroup, speech naturalness was worse and speech effort was higher in all four B conditions, ascompared to the A-phase ratings (Figure 1, Table 1, and Appendix B).
Between-Groups ComparisonsComparisons across groups show that the participants who stuttered, as a group, spoke moreslowly, less naturally, and with more self-reported effort than controls during baseline (A-phase) trials (Figure 1; see also Table 1). During the FI or B-phase trials, however, there wasa consistent pattern of decreased effort by the PS group and increased effort by the control
Ingham et al. Page 7
J Speech Lang Hear Res. Author manuscript; available in PMC 2010 October 1.
NIH
-PA Author Manuscript
NIH
-PA Author Manuscript
NIH
-PA Author Manuscript
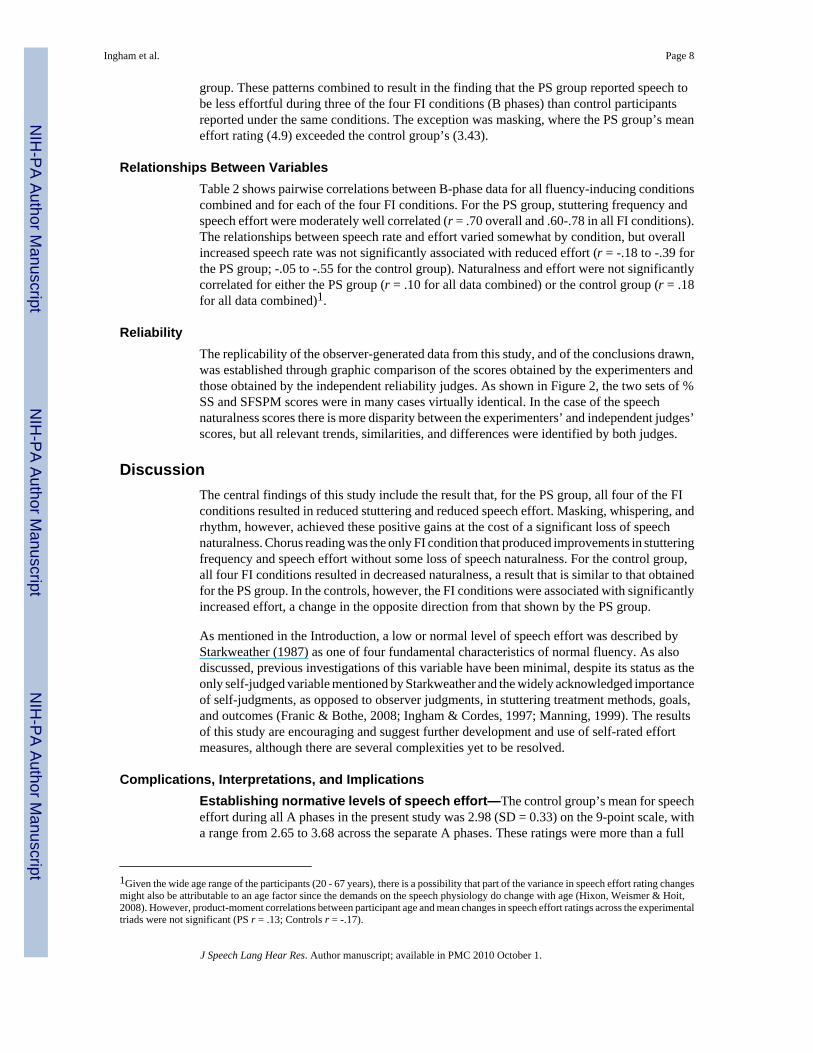
group. These patterns combined to result in the finding that the PS group reported speech tobe less effortful during three of the four FI conditions (B phases) than control participantsreported under the same conditions. The exception was masking, where the PS group’s meaneffort rating (4.9) exceeded the control group’s (3.43).
Relationships Between VariablesTable 2 shows pairwise correlations between B-phase data for all fluency-inducing conditionscombined and for each of the four FI conditions. For the PS group, stuttering frequency andspeech effort were moderately well correlated (r = .70 overall and .60-.78 in all FI conditions).The relationships between speech rate and effort varied somewhat by condition, but overallincreased speech rate was not significantly associated with reduced effort (r = -.18 to -.39 forthe PS group; -.05 to -.55 for the control group). Naturalness and effort were not significantlycorrelated for either the PS group (r = .10 for all data combined) or the control group (r = .18for all data combined)1.
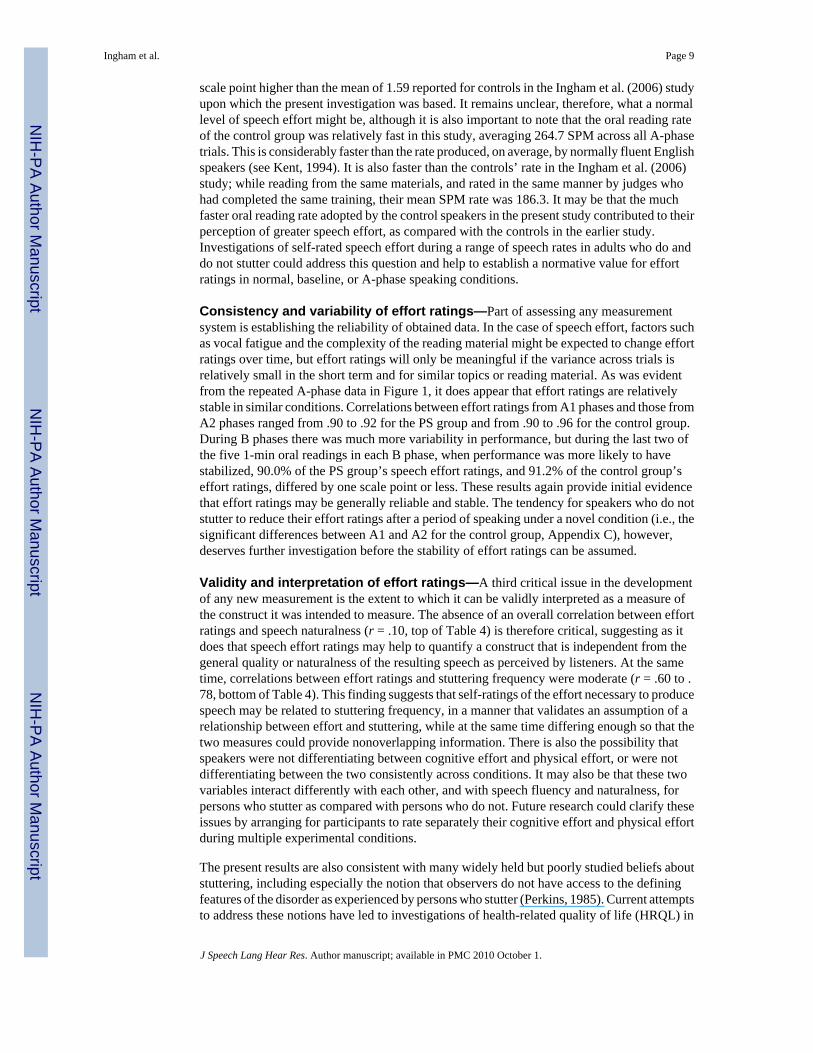
ReliabilityThe replicability of the observer-generated data from this study, and of the conclusions drawn,was established through graphic comparison of the scores obtained by the experimenters andthose obtained by the independent reliability judges. As shown in Figure 2, the two sets of %SS and SFSPM scores were in many cases virtually identical. In the case of the speechnaturalness scores there is more disparity between the experimenters’ and independent judges’scores, but all relevant trends, similarities, and differences were identified by both judges.
DiscussionThe central findings of this study include the result that, for the PS group, all four of the FIconditions resulted in reduced stuttering and reduced speech effort. Masking, whispering, andrhythm, however, achieved these positive gains at the cost of a significant loss of speechnaturalness. Chorus reading was the only FI condition that produced improvements in stutteringfrequency and speech effort without some loss of speech naturalness. For the control group,all four FI conditions resulted in decreased naturalness, a result that is similar to that obtainedfor the PS group. In the controls, however, the FI conditions were associated with significantlyincreased effort, a change in the opposite direction from that shown by the PS group.
As mentioned in the Introduction, a low or normal level of speech effort was described byStarkweather (1987) as one of four fundamental characteristics of normal fluency. As alsodiscussed, previous investigations of this variable have been minimal, despite its status as theonly self-judged variable mentioned by Starkweather and the widely acknowledged importanceof self-judgments, as opposed to observer judgments, in stuttering treatment methods, goals,and outcomes (Franic & Bothe, 2008; Ingham & Cordes, 1997; Manning, 1999). The resultsof this study are encouraging and suggest further development and use of self-rated effortmeasures, although there are several complexities yet to be resolved.
Complications, Interpretations, and ImplicationsEstablishing normative levels of speech effort—The control group’s mean for speecheffort during all A phases in the present study was 2.98 (SD = 0.33) on the 9-point scale, witha range from 2.65 to 3.68 across the separate A phases. These ratings were more than a full
1Given the wide age range of the participants (20 - 67 years), there is a possibility that part of the variance in speech effort rating changesmight also be attributable to an age factor since the demands on the speech physiology do change with age (Hixon, Weismer & Hoit,2008). However, product-moment correlations between participant age and mean changes in speech effort ratings across the experimentaltriads were not significant (PS r = .13; Controls r = -.17).
Ingham et al. Page 8
J Speech Lang Hear Res. Author manuscript; available in PMC 2010 October 1.
NIH
-PA Author Manuscript
NIH
-PA Author Manuscript
NIH
-PA Author Manuscript
scale point higher than the mean of 1.59 reported for controls in the Ingham et al. (2006) studyupon which the present investigation was based. It remains unclear, therefore, what a normallevel of speech effort might be, although it is also important to note that the oral reading rateof the control group was relatively fast in this study, averaging 264.7 SPM across all A-phasetrials. This is considerably faster than the rate produced, on average, by normally fluent Englishspeakers (see Kent, 1994). It is also faster than the controls’ rate in the Ingham et al. (2006)study; while reading from the same materials, and rated in the same manner by judges whohad completed the same training, their mean SPM rate was 186.3. It may be that the muchfaster oral reading rate adopted by the control speakers in the present study contributed to theirperception of greater speech effort, as compared with the controls in the earlier study.Investigations of self-rated speech effort during a range of speech rates in adults who do anddo not stutter could address this question and help to establish a normative value for effortratings in normal, baseline, or A-phase speaking conditions.
Consistency and variability of effort ratings—Part of assessing any measurementsystem is establishing the reliability of obtained data. In the case of speech effort, factors suchas vocal fatigue and the complexity of the reading material might be expected to change effortratings over time, but effort ratings will only be meaningful if the variance across trials isrelatively small in the short term and for similar topics or reading material. As was evidentfrom the repeated A-phase data in Figure 1, it does appear that effort ratings are relativelystable in similar conditions. Correlations between effort ratings from A1 phases and those fromA2 phases ranged from .90 to .92 for the PS group and from .90 to .96 for the control group.During B phases there was much more variability in performance, but during the last two ofthe five 1-min oral readings in each B phase, when performance was more likely to havestabilized, 90.0% of the PS group’s speech effort ratings, and 91.2% of the control group’seffort ratings, differed by one scale point or less. These results again provide initial evidencethat effort ratings may be generally reliable and stable. The tendency for speakers who do notstutter to reduce their effort ratings after a period of speaking under a novel condition (i.e., thesignificant differences between A1 and A2 for the control group, Appendix C), however,deserves further investigation before the stability of effort ratings can be assumed.
Validity and interpretation of effort ratings—A third critical issue in the developmentof any new measurement is the extent to which it can be validly interpreted as a measure ofthe construct it was intended to measure. The absence of an overall correlation between effortratings and speech naturalness (r = .10, top of Table 4) is therefore critical, suggesting as itdoes that speech effort ratings may help to quantify a construct that is independent from thegeneral quality or naturalness of the resulting speech as perceived by listeners. At the sametime, correlations between effort ratings and stuttering frequency were moderate (r = .60 to .78, bottom of Table 4). This finding suggests that self-ratings of the effort necessary to producespeech may be related to stuttering frequency, in a manner that validates an assumption of arelationship between effort and stuttering, while at the same time differing enough so that thetwo measures could provide nonoverlapping information. There is also the possibility thatspeakers were not differentiating between cognitive effort and physical effort, or were notdifferentiating between the two consistently across conditions. It may also be that these twovariables interact differently with each other, and with speech fluency and naturalness, forpersons who stutter as compared with persons who do not. Future research could clarify theseissues by arranging for participants to rate separately their cognitive effort and physical effortduring multiple experimental conditions.
The present results are also consistent with many widely held but poorly studied beliefs aboutstuttering, including especially the notion that observers do not have access to the definingfeatures of the disorder as experienced by persons who stutter (Perkins, 1985). Current attemptsto address these notions have led to investigations of health-related quality of life (HRQL) in
Ingham et al. Page 9
J Speech Lang Hear Res. Author manuscript; available in PMC 2010 October 1.
NIH
-PA Author Manuscript
NIH
-PA Author Manuscript
NIH
-PA Author Manuscript

stuttering, which is by definition self-rated (Bramlett, Bothe, & Franic, 2006; Franic & Bothe,2008; MacKeigen & Pathak, 1992). One standard description of HRQL defines it in terms ofself-perceived physical, social, and role functioning and mental health (Bergner, 1989;McHorney & Tarlov, 1995), and the present results suggest the possibility that self-rated speecheffort might be an important element of self-rated physical functioning in stuttering. Futurestudies of multiple self-rated physical variables, evaluated in the context of observer judgmentsand during stuttering as well as during fluency-inducing conditions or treatment, could furtherthe development of scales for the measurement of speech effort or other components of self-rated physical functioning or complete HRQL.
Clinical implications—Finally, any consideration of the clinical value of speech effortratings assumes that there is not only a normative level of speech effort but also a desirablelevel that speakers would seek as a component of speech that they find fluent, normal, oracceptable (Baer, 1988; Ingham & Cordes, 1997). However, that presumption may involve anumber of complex issues. It seems likely, for example, that a desirable or satisfactory levelof speech effort may vary across settings (e.g., during a relaxed conversation with a friend vs.during a contentious telephone conversation at work). It has been reported that levels of speecheffort are functionally related to vocal frequency, intensity and subglottic pressure duringphonation (Colton & Brown, 1972; Prosek & Montgomery, 1969; Wright & Colton, 1972),features likely to vary with demands of speaking situations (Hixon, Weismer, & Hoit, 2008).The present study shows that self-perceived effort also varied in ways that might have beenpredicted on the basis of the speaking situation. Normative values might emerge from studiessuch as that by Brown, Morris and Murry (1996). They determined variability values forspeaking fundamental frequency (SFF) and vocal intensity for repeated vowel, oral reading,and spontaneous speech utterances repeated three times a day over a 3-day period.Approximately “+/-1 semitone of variability for SFF and approximately 2 db sound pressurelevel (SPL) variation in vocal intensity from any one experimental session to the next couldbe expected; individual variations within any group may reach two semitones and 6 dbSPL” (Brown et al., 1996, p. 299). Future studies of effort ratings might usefully combinephysical measures, such as those used by Brown et al., with self ratings; it may be, for example,that modulating vocal intensity could result in a comfortable level of effort along with fluency.At the same time, it may be that speakers can report experiencing satisfactory or acceptablelevels of speech effort under a wide range of physical parameters.
Another approach for extending research in this area might parallel the approach takenpreviously with observer-judged and self-judged speech naturalness. If the goal is to reducethe physical effort associated with speaking, to reduce the client’s concern or complaint aboutthe physical effort associated with speaking, or both, then speech parameters that functionallycontrol stuttering and that may also interact with perceived speech effort can be investigated.One possibility, for instance, might be reducing speech rate. This change often reducesstuttering in itself (Johnson & Rosen, 1937; Ingham, Martin & Kuhl, 1974), and it also appearedin the present data to be associated with reduced speech effort. Other physical changes couldalso be investigated, including fluency-inducing strategies that reduce the frequency of shortPIs (Davidow et al., in press), treatment strategies that are described as using “easy” or “gentle”articulation or phonation, or even procedures that simply require the direct manipulation ofphonatory behavior given biofeedback (Ingham et al., 2001). If such changes do reduce self-perceived effort, then they introduce the intriguing possibility that feedback about speech effortmight be functional in reducing stuttering, just as speech naturalness ratings were first used asdescriptors, or dependent variables (Martin et al., 1984; Schiavetti & Metz, 1997), and werethen converted into a functional variable that can be fed back to the speaker with a resultingimprovement in speech quality (Ingham & Onslow, 1985; Ingham, Sato, Finn & Belknap,2001).
Ingham et al. Page 10
J Speech Lang Hear Res. Author manuscript; available in PMC 2010 October 1.
NIH
-PA Author Manuscript
NIH
-PA Author Manuscript
NIH
-PA Author Manuscript
Overall, the search for ways to exert functional control over the abnormal levels of self-ratedphysical effort reported by persons who stutter is an exciting challenge. More importantly, ithas the potential to make important contributions to ongoing efforts to obtain complete andaccurate measures of observer-judged and self-rated aspects of stuttering and of fluency,objectives that must be achieved as a prerequisite to the best possible management andtreatment of stuttering.
AcknowledgmentsParts of this study were completed with the support of an RO1 grant (DC007893) from the National Institute onDeafness and Other Communication Disorders (NIDCD) and a UCSB Senate Research Grant, both awarded to thefirst author. Special thanks are offered to Denise Davis, Keziah Morrison, Chisa Onaniwu, and Lauren Robins fortheir assistance during this study.
Appendix
Appendix A
Instructions to ParticipantsGeneral Instructions
This study is designed to measure the amount of physical effort that you use to speak. We willask you to rate the amount of physical effort on a 9-point scale where 1 = highly effortlessspeech and 9 = highly effortful speech. We will ask you to make that rating after completing1-min reading aloud tasks. These reading tasks will be organized so that you will read 5 withoutany accompanying condition occurring, 5 with one of four different accompanying conditions,and then 5 more without any accompanying condition. The accompanying conditions are oftendescribed as “fluency inducing” procedures because many who stutter find that they help themspeak with much less or no stuttering. For descriptive purposes we describe the precedingformat as an ABA triad.
Instructions for MaskingIn this study we will assess that effect by having you listen in both ears to what is known as“white noise.” This can be uncomfortable, but we want you to adjust the white noise volumeto a level where you are almost unable hear yourself reading aloud. You will always hear someof your speech because it is transmitted back to you through muscle tissue, but most of yourspeech is air conducted and that is what we want to stop you from hearing. And so for thisstudy we want you to adjust the noise level in your ears so that most of your speech cannot beheard.
Now we want you to practice briefly reading aloud with noise. We’ll change the volume untilyou find a reasonably comfortable level that allows you to read aloud without hearing yourvoice. As soon as you hear the noise please start reading aloud until the noise stops. Do youhave any questions?
Instructions for Chorus ReadingThe research assistant will play recordings of a person reading the passage in front of you atdifferent speeds. We want you to practice briefly reading the passage in front of you to theaccompaniment of the recording until you find the speed that best fits your natural reading rate.As soon as you hear the recording we want you to try to read the same words AND then tellus if you want the volume adjusted. We will increase or decrease the volume until you find alevel that allows you to hear the recorded words as you read them aloud and that you find thelevel to be comfortable.
Ingham et al. Page 11
J Speech Lang Hear Res. Author manuscript; available in PMC 2010 October 1.
NIH
-PA Author Manuscript
NIH
-PA Author Manuscript
NIH
-PA Author Manuscript
Now we want you to select one of the recording speeds that you feel most comfortable inreading along with. Take your time and feel free to ask us to replay different recording ratesuntil you find one that is most suitable for you.
When the experimental trials begin don’t worry if you fall behind the accompanist. Just moveon in the text and try to keep up. Do the best you can. Do you have any questions?
Instructions for WhisperingIn this part of the study we want you to try to read aloud, but in a whisper or without movingyour vocal cords. Try to do that now so that we can make sure you understand what’s required.
Some people find this task difficult to do for very long because their throat gets dry fast. Havea sip of water between each 1 minute trial if you need to. When the whispering trials begindon’t worry if you briefly slip out of whispering. Just stop and we will restart the trial. Do youhave any questions?
Instructions for Rhythmic ReadingDuring this experimental phase, we want you to try to read aloud while you hear a rhythmicstimulus - a beep - through your earpiece insert. Actually, we want you to read so that eachword or syllable accompanies each rhythmic beat. I will now demonstrate what your speechmight sound like (research assistant demonstrates).
The research assistant will play for you 10 different rhythmic beeps and we want you to try toread aloud with each of them. Try to read so that you accompany each word or syllable to eachbeat. To begin with we want you to try to do this while hearing short amounts of 90, 100, 110,120, 130, 140, 150, 160, 170 and 180 beats per minute. We will now give you a short amountof practice with each of these rates. Please ask to have the sound volume of the beat increasedor decreased at any time until it is at a level that is sufficient for you to be able to read aloudwhile hearing the beat.
Now we want you to select one of the 10 beat rates that you feel most comfortable in readingalong with. Take your time and feel free to ask the research assistant to replay different beatrates until you find which of the 10 is most suitable for you.
When the rhythmic speaking trials begin don’t worry if you fall behind the beat. Just try tokeep up. Do the best you can. Do you have any questions?
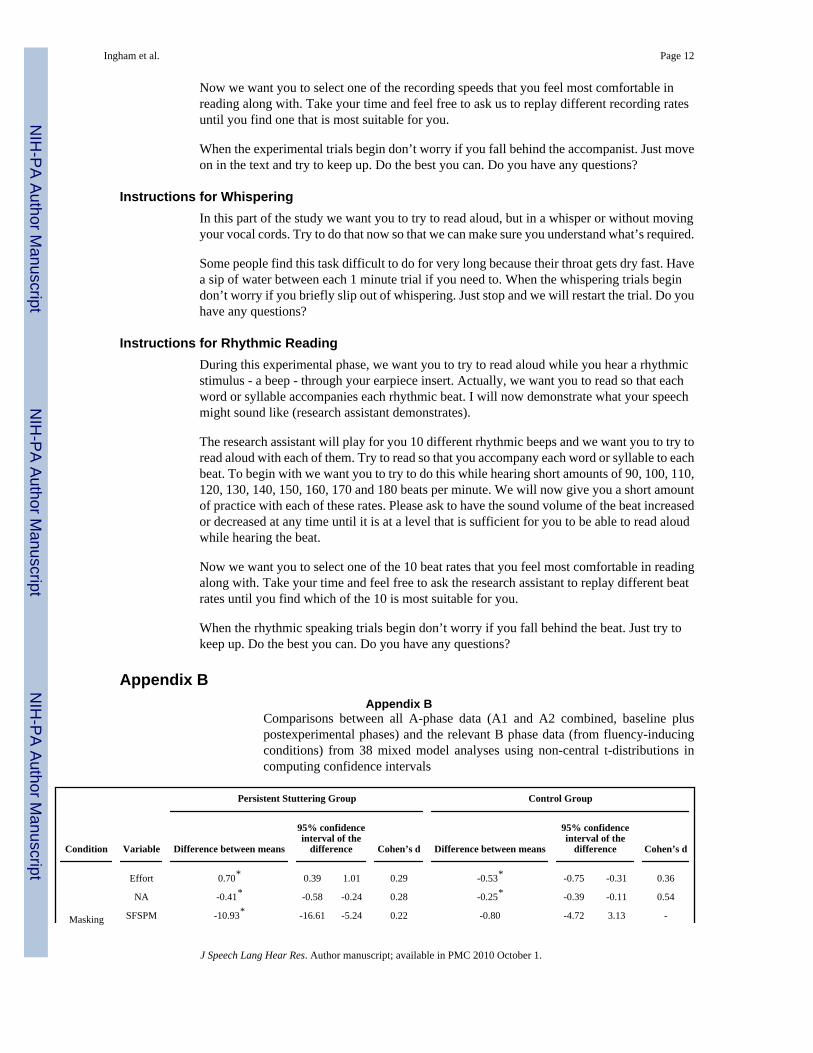
Appendix BAppendix B
Comparisons between all A-phase data (A1 and A2 combined, baseline pluspostexperimental phases) and the relevant B phase data (from fluency-inducingconditions) from 38 mixed model analyses using non-central t-distributions incomputing confidence intervals
Persistent Stuttering Group Control Group
Condition Variable Difference between means
95% confidenceinterval of the
difference Cohen’s d Difference between means
95% confidenceinterval of the
difference Cohen’s d
Masking
Effort 0.70* 0.39 1.01 0.29 -0.53* -0.75 -0.31 0.36
NA -0.41* -0.58 -0.24 0.28 -0.25* -0.39 -0.11 0.54
SFSPM -10.93* -16.61 -5.24 0.22 -0.80 -4.72 3.13 -
Ingham et al. Page 12
J Speech Lang Hear Res. Author manuscript; available in PMC 2010 October 1.
NIH
-PA Author Manuscript
NIH
-PA Author Manuscript
NIH
-PA Author Manuscript
Persistent Stuttering Group Control Group
Condition Variable Difference between means
95% confidenceinterval of the
difference Cohen’s d Difference between means
95% confidenceinterval of the
difference Cohen’s d
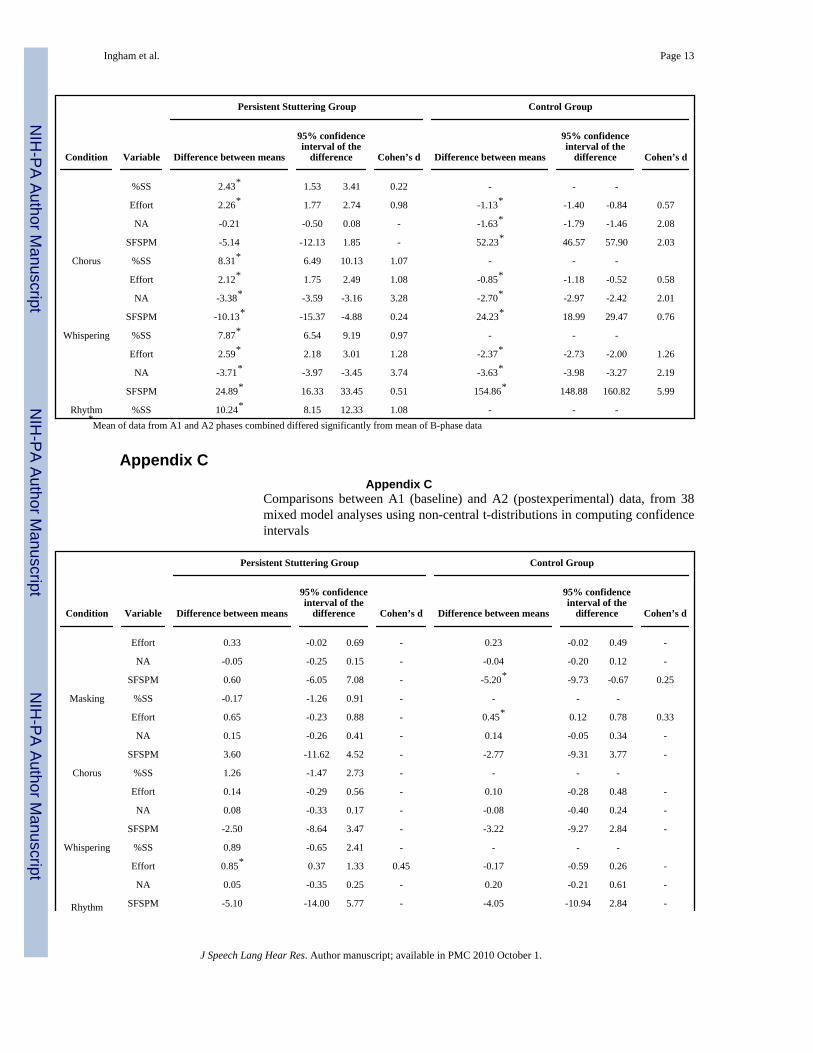
%SS 2.43* 1.53 3.41 0.22 - - -
Chorus
Effort 2.26* 1.77 2.74 0.98 -1.13* -1.40 -0.84 0.57
NA -0.21 -0.50 0.08 - -1.63* -1.79 -1.46 2.08
SFSPM -5.14 -12.13 1.85 - 52.23* 46.57 57.90 2.03
%SS 8.31* 6.49 10.13 1.07 - - -
Whispering
Effort 2.12* 1.75 2.49 1.08 -0.85* -1.18 -0.52 0.58
NA -3.38* -3.59 -3.16 3.28 -2.70* -2.97 -2.42 2.01
SFSPM -10.13* -15.37 -4.88 0.24 24.23* 18.99 29.47 0.76
%SS 7.87* 6.54 9.19 0.97 - - -
Rhythm
Effort 2.59* 2.18 3.01 1.28 -2.37* -2.73 -2.00 1.26
NA -3.71* -3.97 -3.45 3.74 -3.63* -3.98 -3.27 2.19
SFSPM 24.89* 16.33 33.45 0.51 154.86* 148.88 160.82 5.99
%SS 10.24* 8.15 12.33 1.08 - - -*Mean of data from A1 and A2 phases combined differed significantly from mean of B-phase data
Appendix CAppendix C
Comparisons between A1 (baseline) and A2 (postexperimental) data, from 38mixed model analyses using non-central t-distributions in computing confidenceintervals
Persistent Stuttering Group Control Group
Condition Variable Difference between means
95% confidenceinterval of the
difference Cohen’s d Difference between means
95% confidenceinterval of the
difference Cohen’s d
Masking
Effort 0.33 -0.02 0.69 - 0.23 -0.02 0.49 -
NA -0.05 -0.25 0.15 - -0.04 -0.20 0.12 -
SFSPM 0.60 -6.05 7.08 - -5.20* -9.73 -0.67 0.25
%SS -0.17 -1.26 0.91 - - - -
Chorus
Effort 0.65 -0.23 0.88 - 0.45* 0.12 0.78 0.33
NA 0.15 -0.26 0.41 - 0.14 -0.05 0.34 -
SFSPM 3.60 -11.62 4.52 - -2.77 -9.31 3.77 -
%SS 1.26 -1.47 2.73 - - - -
Whispering
Effort 0.14 -0.29 0.56 - 0.10 -0.28 0.48 -
NA 0.08 -0.33 0.17 - -0.08 -0.40 0.24 -
SFSPM -2.50 -8.64 3.47 - -3.22 -9.27 2.84 -
%SS 0.89 -0.65 2.41 - - - -
Rhythm
Effort 0.85* 0.37 1.33 0.45 -0.17 -0.59 0.26 -
NA 0.05 -0.35 0.25 - 0.20 -0.21 0.61 -
SFSPM -5.10 -14.00 5.77 - -4.05 -10.94 2.84 -
Ingham et al. Page 13
J Speech Lang Hear Res. Author manuscript; available in PMC 2010 October 1.
NIH
-PA Author Manuscript
NIH
-PA Author Manuscript
NIH
-PA Author Manuscript

Persistent Stuttering Group Control Group
Condition Variable Difference between means
95% confidenceinterval of the
difference Cohen’s d Difference between means
95% confidenceinterval of the
difference Cohen’s d
%SS 1.27 -1.13 3.69 - - - -*Mean of A1 data differed significantly from mean of A2 data
ReferencesBaer DM. If you know why you’re changing a behavior, you’ll know when you’ve changed it enough.
Behavioral Assessment 1988;10:219–223.Bergner M. Measurement of health status. Medical Care 1995;23(5):696–704. [PubMed: 4010356]Bloodstein, O. A handbook on stuttering. Vol. 5th ed. Singular; San Diego, CA: 1995.Bloodstein O. A rating scale study of conditions under which stuttering is reduced or absent. Journal of
Speech and Hearing Disorders 1950;15:29–36.Boberg E, Kully D. Long-term results of an intensive treatment program for adults and adolescents who
stutter. Journal of Speech and Hearing Research 1994;37:1050–1059. [PubMed: 7823551]Bramlett RE, Bothe AK, Franic DF. Using preference based measures to assess quality of life in stuttering.
Journal of Speech, Language, and Hearing Research 2006;49:381–394.Brown WS, Morris RJ, Murry T. Comfortable effort level revisited. Journal of Voice 1996;10:299–305.
[PubMed: 8865101]Bruce MC, Adams MR. Effects of two types of motor practice on stuttering adaptation. Journal of Speech
and Hearing Research 1978;21:421–428. [PubMed: 713513]Colton, RH.; Brown, WS. Some relationships between vocal effort and intra-oral air pressure; Paper
presented at the 84th meeting of the Acoustical Society of America; Miami, FL. 1972, November;Davidow JH, Bothe AK, Andreatta RD, Ye J. Measurement of phonated intervals during four fluency-
inducing conditions. Journal of Speech, Language, and Hearing Research. in pressFinn P, Ingham RJ. The selection of “fluent” samples in research on stuttering: Conceptual and
methodological considerations. Journal of Speech and Hearing Research 1989;32:401–408.[PubMed: 2661918]
Finn P, Ingham RJ. Stutterers’ self-ratings of how natural speech sounds and feels. Journal of Speechand Hearing Research 1994;37:326–340. [PubMed: 8028313]
Franic DM, Bothe AK. Psychometric evaluation of condition-specific instruments used to assess health-related quality of life, attitudes, and related constructs in stuttering. American Journal of Speech-Language Pathology 2008;17:60–80. [PubMed: 18230814]
Garber SF, Martin RR. The effects of white noise on the frequency of stuttering. Journal of Speech andHearing Research 1974;17:73–79. [PubMed: 4828364]
Hixon, TJ.; Weismer, GG.; Hoit, JD. Preclinical speech science: anatomy, physiology, acoustics, andperception. Plural; San Diego, CA: 2008.
Ingham, RJ. Stuttering and behavior therapy: Current status and empirical foundations. College-Hill; SanDiego, CA: 1984.
Ingham, RJ.; Bakker, K.; Ingham, JC.; Kilgo, M.; Moglia, R. Stuttering Measurement System (SMS).University of California, Santa Barbara; Santa Barbara: 1999. software, manual, and trainingmaterialsAvailable at http://sms.id.ucsb.edu/index.html
Ingham, RJ.; Cordes, AK. Self measurement and evaluating treatment efficacy. In: Curlee, RF.; Siegel,GM., editors. Nature and treatment of stuttering. New directions. Vol. 2nd ed.. Allyn and Bacon;Boston: 1997. p. 413-438.
Ingham, RJ.; Cordes, AK.; Kilgo, M.; Moglia, R. Stuttering Measurement Assessment and Training(SMAAT). University of California, Santa Barbara; Santa Barbara, CA: 1998. software and videodisk
Ingham RJ, Ingham JC, Finn P, Fox PT. Towards a functional neural systems model of developmentalstuttering. Journal of Fluency Disorders 2003;28:297–318. [PubMed: 14643067]
Ingham et al. Page 14
J Speech Lang Hear Res. Author manuscript; available in PMC 2010 October 1.
NIH
-PA Author Manuscript
NIH
-PA Author Manuscript
NIH
-PA Author Manuscript

Ingham RJ, Kilgo M, Ingham JC, Moglia R, Belknap H, Sanchez T. Evaluation of a stuttering treatmentbased on reduction of short phonation intervals. Journal of Speech, Language, and Hearing Research2001;44:1229–1244.
Ingham RJ, Martin RR, Kuhl PK. Modification and control of rate of speaking by stutterers. Journal ofSpeech and Hearing Research 1974;17:489–496. [PubMed: 4420465]
Ingham, RJ.; Moglia, R.; Kilgo, M.; Felino, A. Modifying Phonation Interval (MPI) Stuttering TreatmentSchedule. University of California, Santa Barbara; Santa Barbara: 1997. manual and software
Ingham RJ, Onslow M. Measurement and modification of speech naturalness during stuttering therapy.Journal of Speech and Hearing Disorders 1985;50:261–268. [PubMed: 4021454]
Ingham RJ, Packman A. A further evaluation of the speech of stutterers during chorus- and non-chorus-reading conditions. Journal of Speech and Hearing Research 1979;22:579–587.
Ingham RJ, Sato W, Finn P, Belknap H. The modification of speech naturalness during rhythmicstimulation treatment of stuttering. Journal of Speech, Language, and Hearing Research2001;44:841–852.
Ingham RJ, Warner A, Byrd A, Cotton J. Speech effort measurement and stuttering: Investigating theChorus Reading Effect. Journal of Speech, Language, and Hearing Research 2006;49:660–670.
Johnson W, Rosen L. Studies in the psychology of stuttering: VII. Effect of certain changes in speechpattern upon frequency of stuttering. Journal of Speech Disorders 1937;2:105–109.
Kagan, J. Three seductive ideas. Harvard University Press; Cambridge MA: 1998.Kazdin, AE. Research design in clinical psychology. Vol. 3rd ed.. Allyn and Bacon; Boston: 1998.Kent, RD. Reference manual for communicative sciences and disorders. Pro-Ed; Austin, TX: 1994.Kalinowski J, Stuart A, Rastatter MP, Snyder G, Dayalu V. Inducement of fluent speech in persons who
stutter via visual choral speech. Neuroscience Letters 2000;281:198–200. [PubMed: 10704777]Linnea, A. Deep water passage. Little Brown and Company; Boston: 1995.MacKeigan LD, Pathak DS. Overview of health related quality of life measures. American Journal of
Hospital Pharmacy 1992;49:2236–2245. [PubMed: 1524070]Manning, WH. Progress under the surface and over time. In: Ratner, NB.; Healey, EC., editors. Stuttering
research and practice: Bridging the gap. Lawrence Erlbaum; Mahwah, NJ: 1999. p. 123-130.Maraist JA, Hutton C. Effect of auditory masking upon the speech of stutterers. Journal of Speech and
Hearing Disorders 1957;22:385–389. [PubMed: 13463921]Martin RR, Haroldson SK. Effects of five experimental treatments on stuttering. Journal of Speech and
Hearing Research 1979;22:132–146. [PubMed: 502494]Martin RR, Haroldson SK, Triden KA. Stuttering and speech naturalness. Journal of Speech and Hearing
Disorders 1984;49:53–58. [PubMed: 6700202]McHorney CA, Tarlov AR. Individual-patient monitoring in clinical practice: are available health status
surveys adequate? Quality of Life Research 1995;4:293–307. [PubMed: 7550178]Monoson P, Zemlin W. Quantitative study of whisper. Folia Phoniatrica 1984;36:53–65. [PubMed:
6724455]Nicolosi, L.; Harryman, E.; Kresheck, J. Terminology of communication disorders. Vol. 4th ed.. Williams
& Wilkins; Baltimore: 1996.Onslow M, Ingham RJ. Speech quality measurement and the management of stuttering. Journal of Speech
and Hearing Research 1987;52:2–17.Perkins, W. Measurement and maintenance of fluency. In: Boberg, E., editor. Maintenance of fluency.
Elsevier; New York: 1981. p. 147-178.Perkins WH. Horizons and beyond. Confessions of a carpenter. Seminars in Speech and Language
1985;6:233–244.Perkins WH, Rudas J, Johnson L, Bell J. Stuttering: Discoordination of phonation with articulation and
respiration. Journal of Speech and Hearing Research 1976;19:509–522. [PubMed: 979213]Prosek, RA.; Montgomery, AA. Some physical correlates of vocal effort and loudness; Paper presented
at the annual convention of the American Speech and Hearing Association; Chicago. 1969,November;
Rami MK, Kalinowski J, Rastatter MP, Holbert D, Allen M. Choral reading with filtered speech: effecton stuttering. Perceptual and Motor Skills 2005;100:421–31. [PubMed: 15974353]
Ingham et al. Page 15
J Speech Lang Hear Res. Author manuscript; available in PMC 2010 October 1.
NIH
-PA Author Manuscript
NIH
-PA Author Manuscript
NIH
-PA Author Manuscript
Ridley, M. Genome. The autobiography of a species in 23 chapters. Harper Collins; New York: 1999.Schiavetti, N.; Metz, DE. Stuttering and the measurement of speech naturalness. In: Curlee, RF.; Siegel,
GM., editors. Nature and treatment of stuttering. New directions. Vol. 2nd ed.. Allyn and Bacon;Boston: 1997. p. 398-412.
Starkweather, CW. Fluency and stuttering. Prentice Hall; Englewood Cliffs, NJ: 1987.Taylor, HS.; Bothe, AK.; Everett, J. Effects of visual choral speech on stuttering frequency; Poster
presented at the Annual Convention of the American Speech-Language-Hearing Association;Chicago, IL. 2003, November;
Winer, BJ.; Brown, DR.; Michels, KM. Statistical principles in experimental design. Vol. 3rd ed..McGraw-Hill; New York: 1991.
Wright, HN.; Colton, RH. Some parameters of autophonic level; Paper presented at the AnnualConvention of the American Speech and Hearing Association; San Francisco. 1972, November;
Young MA. Evaluating differences between stuttering and nonstuttering speakers: the group differencedesign. Journal of Speech and Hearing Research 1994;37:522–534. [PubMed: 8084184]
Ingham et al. Page 16
J Speech Lang Hear Res. Author manuscript; available in PMC 2010 October 1.
NIH
-PA Author Manuscript
NIH
-PA Author Manuscript
NIH
-PA Author Manuscript

Figure 1.Mean speech effort (EFF), speech naturalness (NA), and stutterfree syllables per minute(SFSPM) for the persistent stuttering (PS) group (left) and the control group (right), withpercent syllables stuttered (%SS) for the PS group only, for the five 1-min oral reading trialsin each phase (A1-B-A2), for each of four fluency-inducing conditions. Note that on the NAand EFF ordinate axis “1 = highly natural sounding speech”(NA) and “1 = highly effortlessspeech”.
Ingham et al. Page 17
J Speech Lang Hear Res. Author manuscript; available in PMC 2010 October 1.
NIH
-PA Author Manuscript
NIH
-PA Author Manuscript
NIH
-PA Author Manuscript
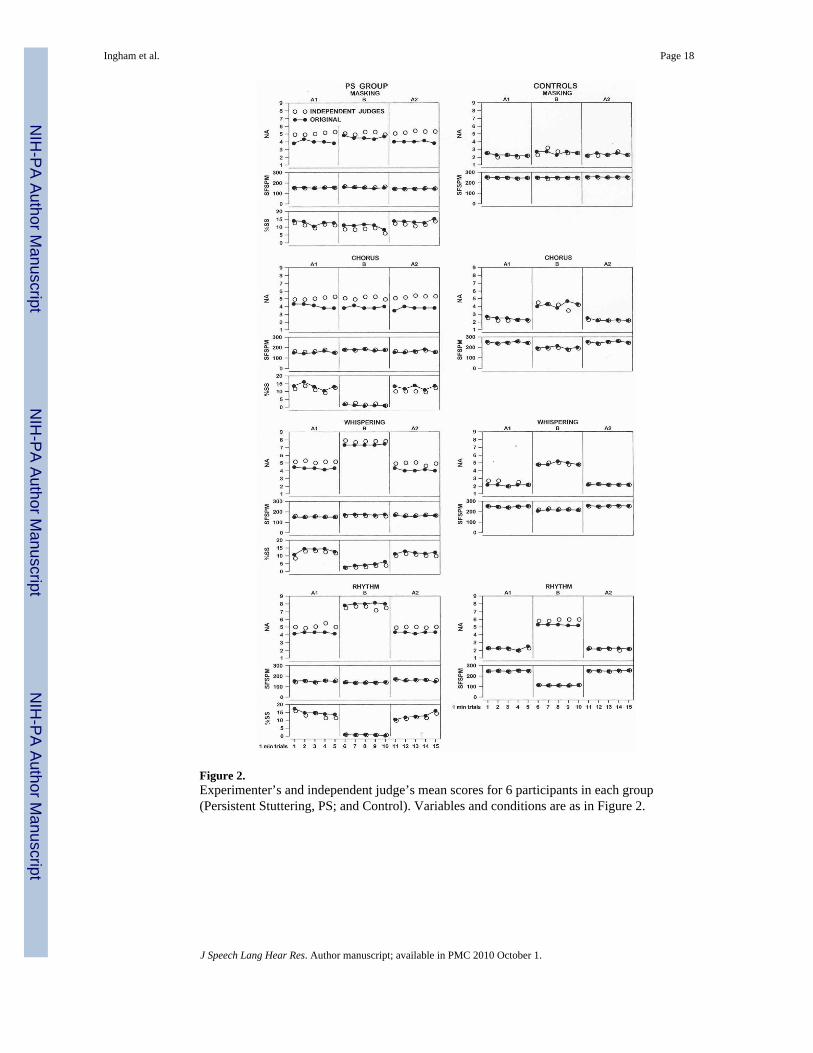
Figure 2.Experimenter’s and independent judge’s mean scores for 6 participants in each group(Persistent Stuttering, PS; and Control). Variables and conditions are as in Figure 2.
Ingham et al. Page 18
J Speech Lang Hear Res. Author manuscript; available in PMC 2010 October 1.
NIH
-PA Author Manuscript
NIH
-PA Author Manuscript
NIH
-PA Author Manuscript

NIH
-PA Author Manuscript
NIH
-PA Author Manuscript
NIH
-PA Author Manuscript
Ingham et al. Page 19Ta
ble
1M
ean
(with
sta
ndar
d de
viat
ions
bel
ow a
nd in
ital
ics)
spe
ech
effo
rt, s
peec
h na
tura
lnes
s (N
A),
stut
terf
ree
sylla
bles
per
min
ute
(SFS
PM),
and
perc
ent s
ylla
bles
stut
tere
d (%
SS) f
orad
ults
with
per
sist
ent s
tutte
ring
(PS)
and
con
trol
s (C
) in
norm
al sp
eech
(A1
and
A2)
and
und
er fo
ur fl
uenc
y-in
duci
ng c
ondi
tions
(B)
Mas
king
Cho
rus
Whi
sper
ing
Rhy
thm
Var
iabl
eG
roup
A1
BA
2A
1B
A2
A1
BA
2A
1B
A2
EFFO
RT
PS5.
734.
875.
404.
872.
284.
224.
872.
684.
735.
032.
024.
18
(2.1
4)(2
.52)
(2.5
4)(2
.20)
(2.2
8)(2
.50)
(2.0
8)(1
.86)
(2.0
4)(2
.74)
(0.9
6)(2
.66)
C3.
023.
432.
783.
684.
583.
232.
903.
702.
802.
655.
102.
82
(1.6
3)(1
.49)
(1.2
6)(2
.00)
(2.0
2)(1
.85)
(1.2
6)(1
.60)
(1.3
6)(1
.37)
(2.3
1)(1
.30)
NA
PS3.
784.
223.
833.
823.
953.
673.
937.
273.
854.
027.
753.
97
(1.5
5)(1
.48)
(1.3
8)(1
.25)
(0.8
2)(1
.17)
(1.2
7)(0
.79)
(1.1
8)(1
.29)
(0.7
8)(1
.04)
C2.
232.
502.
272.
333.
892.
192.
184.
922.
272.
385.
912.
18
(0.4
8)(0
.56)
(0.5
4)(0
.74)
(0.9
2)(0
.50)
(0.4
8)(1
.82)
(0.6
2)(0
.64)
(2.2
8)(0
.46)
SFSP
MPS
163.
617
4.2
163.
016
7.8
174.
717
1.4
168.
517
9.9
171.
016
8.0
144.
217
3.1
(40.
8)(5
2.0)
(51.
1)(4
1.2)
(20.
2)(3
9.8)
(43.
7)(3
7.9)
(46.
7)(5
0.6)
(47.
8)(4
8.6)
C25
8.8
262.
226
4.0
260.
620
9.7
263.
426
4.5
241.
826
7.7
267.
411
4.6
271.
5
(27.
3)(2
9.1)
(31.
4)(2
5.9)
(26.
8)(2
3.4)
(29.
7)(3
2.3)
(32.
8)(2
8.3)
(21.
0)(3
1.6)
%SS
PS10
.61
8.27
10.7
810
.20
1.26
8.94
10.7
62.
459.
8711
.40
0.52
10.1
3
(11.
18)
(9.7
9)(1
3.21
)(1
0.22
)(1
.70)
(11.
56)
(10.
38)
(4.6
4)(1
0.66
)(1
3.97
)(1
.00)
(12.
79)
C0.
00.
00.
00.
00.
00.
00.
00.
00.
00.
00.
00.
0
--
--
--
--
--
--
J Speech Lang Hear Res. Author manuscript; available in PMC 2010 October 1.

NIH
-PA Author Manuscript
NIH
-PA Author Manuscript
NIH
-PA Author Manuscript
Ingham et al. Page 20Ta
ble
2C
orre
latio
ns b
etw
een
pair
s of
the
fou
r de
pend
ent
vari
able
s [s
peec
h ef
fort
, spe
ech
natu
raln
ess
(NA
), st
utte
rfre
e sy
llabl
es p
erm
inut
e (S
FSPM
), an
d pe
rcen
t syl
labl
es st
utte
red
(%SS
)] fo
radu
lts w
ith p
ersi
sten
t stu
tteri
ng a
nd th
e th
ree
depe
nden
t var
iabl
esfo
r th
e co
ntro
l gro
up, s
how
n fo
r al
l exp
erim
enta
l (B
) pha
ses c
ombi
ned
and
for
each
flue
ncy-
indu
cing
con
ditio
n se
para
tely
Pers
iste
nt S
tutte
ring
Con
trol
s
Com
bine
dN
ASF
SPM
%SS
NA
SFSP
M
EFFO
RT
0.10
-0.3
20.
70**
EFFO
RT
0.18
-0.3
3
NA
-0.3
60.
21N
AT
-0.5
5*
SFSP
M-0
.58*
Mas
king
NA
SFSP
M%
SSN
ASF
SPM
EFFO
RT
0.65
*-0
.39
0.60
*EF
FOR
T0.
30-0
.05
NA
-0.3
60.
71**
NA
T0.
20
SFSP
M-0
.67*
Cho
rus
NA
SFSP
M%
SSN
ASF
SPM
EFFO
RT
0.46
-0.3
40.
71**
EFFO
RT
0.04
-0.2
1
NA
-0.4
00.
49N
AT
-0.5
5*
SFSP
M-0
.64*
Whi
sper
ing
NA
SFSP
M%
SSN
ASF
SPM
EFFO
RT
-0.1
3-0
.57*
0.71
**EF
FOR
T0.
24-0
.18
NA
-0.1
50.
01N
AT
-0.2
8
SFSP
M-0
.66*
Rhy
thm
NA
SFSP
M%
SSN
ASF
SPM
EFFO
RT
-0.0
8-0
.18
0.78
**EF
FOR
T0.
24-0
.55*
NA
-0.5
40.
00N
AT
-0.7
7**
SFSP
M-0
.44
* = p<
0.0
5
**=
p <
0.01
J Speech Lang Hear Res. Author manuscript; available in PMC 2010 October 1.