Object-Oriented Program Comprehension: Effect of Expertise ...
Upload
khangminh22Category
view
4download
0
OBJECT ORIENTED ANALYSIS AND DESIGNUNIT- 3
Activity & Sequence Model
2
Prepared By: Prof. Vipin K. Wani Unit No. 2:Advanced Classes & State Model

Activity diagram is basically a flowchart to represent the flow from one
activity to another activity which describe the dynamic aspects of the system.
The activity can be described as an operation of the system.
Is a behavioral diagram i.e. it depicts the behavior of a system.
The control flow is drawn from one operation to another. This flow can be
sequential, branched, or concurrent.
Activity diagrams deal with all type of flow control by using different
elements such as fork, join, etc An activity diagram portrays the control flow
from a start point to a finish point showing the various decision paths that
exist while the activity is being executed.
Activity Diagram
Prepared By: Prof. Vipin K. Wani Unit No. 2:Advanced Classes & State Model
2

Thepurposeofanactivitydiagramcanbedescribedas−
Draw the activity flow of a system.
Describe the sequence from one activity to another.
Describe the parallel, branched and concurrent flow of the system.
it depicts the behavior of a system
it depicts the various conditions and constraints associated with system.
Need of Activity Diagram
Prepared By: Prof. Vipin K. Wani Unit No. 2:Advanced Classes & State Model
3

Difference between an Activity diagram and a Flowchart – Flowcharts were typically invented earlier than activity diagrams. Non-
programmers use Flow charts to model workflows.
For example: A manufacturer uses a flow chart to explain and illustrate how a
particular product is manufactured. We can call a flowchart a primitive
version of an activity diagram. A business process where decision making is
involved is expressed using a flow chart. So, programmers use activity
diagrams (advanced version of a flowchart) to depict workflows.
An activity diagram is used by developers to understand the flow of
programs on a high level. It also enables them to figure out constraints and
conditions that cause particular events.
Activity Diagram Vs Flow Chart
Prepared By: Prof. Vipin K. Wani Unit No. 2:Advanced Classes & State Model
4

Following are the steps to draw State diagrams −
1. Identify the initial state and the final terminating activities.
2. Identify the possible activities in which the object can exist (boundary values
corresponding to different attributes guide us in identifying different activities).
3. Label the activity which trigger these transitions.
4. Identify the conditions need to apply with activities.
.
Steps to Draw a Activity Diagram
Prepared By: Prof. Vipin K. Wani Unit No. 2:Advanced Classes & State Model
42

Following are the ComponentstodrawStatediagrams−
1. Initial state
2. Final State
3. Activity
4. Transition
5. Fork
6. Join
7. Self transition
8. Sub Activity
9. Decision
10. Swim lanes
Component of Activity Diagram
Prepared By: Prof. Vipin K. Wani Unit No. 2:Advanced Classes & State Model
43

1. Initial state:
We use a black filled circle represent the initial state of a System or a class.
It represent system or machine has initiated .
Figure – initial state notation
Component of Activity Diagram
Prepared By: Prof. Vipin K. Wani Unit No. 2:Advanced Classes & State Model
44

2. Final state:
We use a filled circle within a circle notation to represent the final state in a
state machine diagram.
It represent system or machine has terminated.
Figure – Final state notation
Component of Activity Diagram
Prepared By: Prof. Vipin K. Wani Unit No. 2:Advanced Classes & State Model
45

3 . Activity:
An activity represents execution of an action on objects or by objects.
We represent an activity using a rectangle with rounded corners.
Basically any action or event that takes place is represented using an
activity.
Figure – Activity notation
Component of Activity Diagram
Prepared By: Prof. Vipin K. Wani Unit No. 2:Advanced Classes & State Model
46

4 . Sub Activity:
We use a rounded rectangle to represent a composite activity also.
composite activity is defined as activity that has sub states (nested
activity ). Sub activity could be sequential or concurrent.
Sub activity may have another initial and final activity
Figure – Composite State notation
Component of Activity Diagram
Prepared By: Prof. Vipin K. Wani Unit No. 2:Advanced Classes & State Model
47
SubactivityState1

5. Activity Transition:
We use a solid arrow to represent the transition or change of control from
one state to another.
The arrow is labeled with the event which causes the change in state.
Figure – Activity Transition notation
Component of Activity Diagram
Prepared By: Prof. Vipin K. Wani Unit No. 2:Advanced Classes & State Model
Activity-1 Activity-2Event
49

6. Self Transition:
We use a solid arrow pointing back to the state itself to represent a self
transition.
There might be scenarios when the state of the object does not change
upon the occurrence of an event.
We use self transitions to represent such cases.
Figure – Self Transition notation
Component of Activity Diagram
Prepared By: Prof. Vipin K. Wani Unit No. 2:Advanced Classes & State Model
Activity-1
50

7. Fork :
We use a rounded solid rectangular bar to represent a Fork notation with
incoming arrow from the parent state and outgoing arrows towards the
newly created states.
We use the fork notation to represent a state splitting into two or more
concurrent states.
Component of Activity Diagram
Prepared By: Prof. Vipin K. Wani Unit No. 2:Advanced Classes & State Model
Activity -1
Activity -2 Activity -3
51

8. Join :
We use a rounded solid rectangular bar to represent a Join notation with
incoming arrows from the joining states and outgoing arrow towards the
common goal state.
We use the join notation when two or more states concurrently converge
into one on the occurrence of an event or events.
Component of Activity Diagram
Prepared By: Prof. Vipin K. Wani Unit No. 2:Advanced Classes & State Model
Activity-1 Activity-2
Activity-3
52

9. Swimlanes –
We use swimlanes for grouping related activities in one column.
Swimlanes group related activities into one column or one row.
Swimlanes can be vertical and horizontal.
Swimlanes are used to add modularity to the activity diagram.
It is not mandatory to use swimlanes.
They usually give more clarity to the activity diagram.
It’s not mandatory to do so, but, it is a recommended practice.
Component of Activity Diagram
Prepared By: Prof. Vipin K. Wani Unit No. 2:Advanced Classes & State Model
52

Component of Activity Diagram
Prepared By: Prof. Vipin K. Wani Unit No. 2:Advanced Classes & State Model
52

10. Decision:
When we need to make a decision before deciding the flow of control, we
use the decision node.
The outgoing arrows from the decision node can be labelled with conditions
or guard expressions. It always includes two or more output arrows.
Component of Activity Diagram
Prepared By: Prof. Vipin K. Wani Unit No. 2:Advanced Classes & State Model
52

Guard:
A Guard refers to a statement written next to a decision node on an arrow
sometimes within square brackets.
The statement must be true for the control to shift along a particular
direction. Guards help us know the constraints and conditions which
determine the flow of a process.
Component of Activity Diagram
Prepared By: Prof. Vipin K. Wani Unit No. 2:Advanced Classes & State Model
52

10. Sent and Received Signals–
Signals represent how activities can be modified from outside the system.
They usually appear in pairs of sent and received signals, because the state
can't change until a response is received, much like synchronous messages
in a sequence diagram.
For example, an authorization of payment is needed before an order can be
completed.
Component of Activity Diagram
Prepared By: Prof. Vipin K. Wani Unit No. 2:Advanced Classes & State Model
52

Activity Diagram Example
Prepared By: Prof. Vipin K. Wani Unit No. 2:Advanced Classes & State Model
53

An interaction diagram is used to show the interactive behavior of a system.
Since visualizing the interactions in a system can be a cumbersome task, we
use different types of interaction diagrams to capture various features and
aspects of interaction in a system.
Interaction diagram
Prepared By: Prof. Vipin K. Wani Unit No. 2:Advanced Classes & State Model
39

A sequence diagram simply depicts interaction between objects in a
sequential order.
We can also use the terms event diagrams or event scenarios to refer to a
sequence diagram.
Sequence diagrams describe how and in what order the objects in a system
function.
Sequence diagrams describe interactions among classes in terms of an
exchange of messages over time.
A sequence diagram is a good way to visualize and validate various runtime
scenarios.
Sequence Diagram
Prepared By: Prof. Vipin K. Wani Unit No. 2:Advanced Classes & State Model
39

1. Used to model and visualize the logic behind a sophisticated function,
operation or procedure.
2. They are also used to show details of UML use case diagrams.
3. Used to understand the detailed functionality of current or future systems.
4. Visualize how messages and tasks move between objects or components in
a system.
5. It describes the sequences of interaction between various objects of the
system.
6. It Describe Dynamic Behavior of system.
Need of sequence diagrams
Prepared By: Prof. Vipin K. Wani Unit No. 2:Advanced Classes & State Model
39

A sequence diagram represents the scenario or flow of events in one single
use case.
The message flow of the sequence diagram is based on the narrative of the
particular use case.
Then, before you start drawing the sequence diagram or decide what
interactions should be included in it, you need to draw the use case diagram
and ready a comprehensive description of what the particular use case does.
How to Draw a Sequence Diagram?
Prepared By: Prof. Vipin K. Wani Unit No. 2:Advanced Classes & State Model
39

Followings are the components of Sequence diagram.
1. Actors
2. Lifelines
3. Messages
4. Guards
5. Note
Component of Sequence Diagram
Prepared By: Prof. Vipin K. Wani Unit No. 2:Advanced Classes & State Model
39

1. Actors:
An actor in a UML diagram represents a type of role where it interacts with
the system and its objects.
It is important to note here that an actor is always outside the scope of the
system we aim to model using the UML diagram.
We use actors to depict various roles including human users and other
external subjects.
Component of Sequence Diagram
Prepared By: Prof. Vipin K. Wani Unit No. 2:Advanced Classes & State Model
39
2. Lifelines :
A lifeline is a named element which depicts an individual participant in a
sequence diagram.
So basically each instance in a sequence diagram is represented by a lifeline.
Lifeline elements are located at the top in a sequence diagram.
The standard in UML for naming a lifeline follows the following format –
Instance Name : Class Name
Component of Sequence Diagram
Prepared By: Prof. Vipin K. Wani Unit No. 2:Advanced Classes & State Model
39

2. Lifelines :
Component of Sequence Diagram
Prepared By: Prof. Vipin K. Wani Unit No. 2:Advanced Classes & State Model
39

Messages : Communication between objects is depicted using messages.
The messages appear in a sequential order on the lifeline.
We represent messages using arrows. Lifelines and messages form the core
of a sequence diagram.
Messages can be broadly classified into the following categories:
1. Synchronous & Asynchronous messages
2. Create & Delete Message
3. Self-Message
4. Reply Message
5. Found & Lost Message
Component of Sequence Diagram
Prepared By: Prof. Vipin K. Wani Unit No. 2:Advanced Classes & State Model
39

a. Synchronous messages –
A synchronous message waits for a reply before the interaction can move
forward.
The sender waits until the receiver has completed the processing of the
message. The caller continues only when it knows that the receiver has
processed the previous message i.e. it receives a reply message.
A large number of calls in object oriented programming are synchronous.
We use a solid arrow head to represent a synchronous message.
Component of Sequence Diagram
Prepared By: Prof. Vipin K. Wani Unit No. 2:Advanced Classes & State Model
39

b. Asynchronous messages –
An asynchronous message does not wait for a reply from the receiver.
The interaction moves forward irrespective of the receiver processing the
previous message or not.
We use a lined arrow head to represent an asynchronous message.
Component of Sequence Diagram
Prepared By: Prof. Vipin K. Wani Unit No. 2:Advanced Classes & State Model
39

c. Create messages –
We use a Create message to instantiate a new object in the sequence
diagram.
There are situations when a particular message call requires the creation of
an object.
It is represented with a dotted arrow and create word labeled on it to
specify that it is the create Message symbol.
Ex– The creation of a new order on a e-commerce website would require a
new object of Order class to be created.
Component of Sequence Diagram
Prepared By: Prof. Vipin K. Wani Unit No. 2:Advanced Classes & State Model
39
<<Create>>

d. Delete Message –
We use a Delete Message to delete an object. When an object is de-allocated
memory or is destroyed within the system we use the Delete Message
symbol.
It destroys the occurrence of the object in the system.
It is represented by an arrow terminating with a x.
For example – In the scenario below when the order is received by the user,
the object of order class can be destroyed.
Component of Sequence Diagram
Prepared By: Prof. Vipin K. Wani Unit No. 2:Advanced Classes & State Model
39

d. Delete Message –
Component of Sequence Diagram
Prepared By: Prof. Vipin K. Wani Unit No. 2:Advanced Classes & State Model
39

e. Self-Message
Certain scenarios might arise where the object needs to send a message to
itself. Such messages are called Self Messages and are represented with a U
shaped arrow.
is represented using a self-message.
Component of Sequence Diagram
Prepared By: Prof. Vipin K. Wani Unit No. 2:Advanced Classes & State Model
39

f. Reply Message – Reply messages are used to show the message being sent from the receiver
to the sender.
We represent a return/reply message using an open arrowhead with a
dotted line.
The interaction moves forward only when a reply message is sent by the
receiver.
Component of Sequence Diagram
Prepared By: Prof. Vipin K. Wani Unit No. 2:Advanced Classes & State Model
39
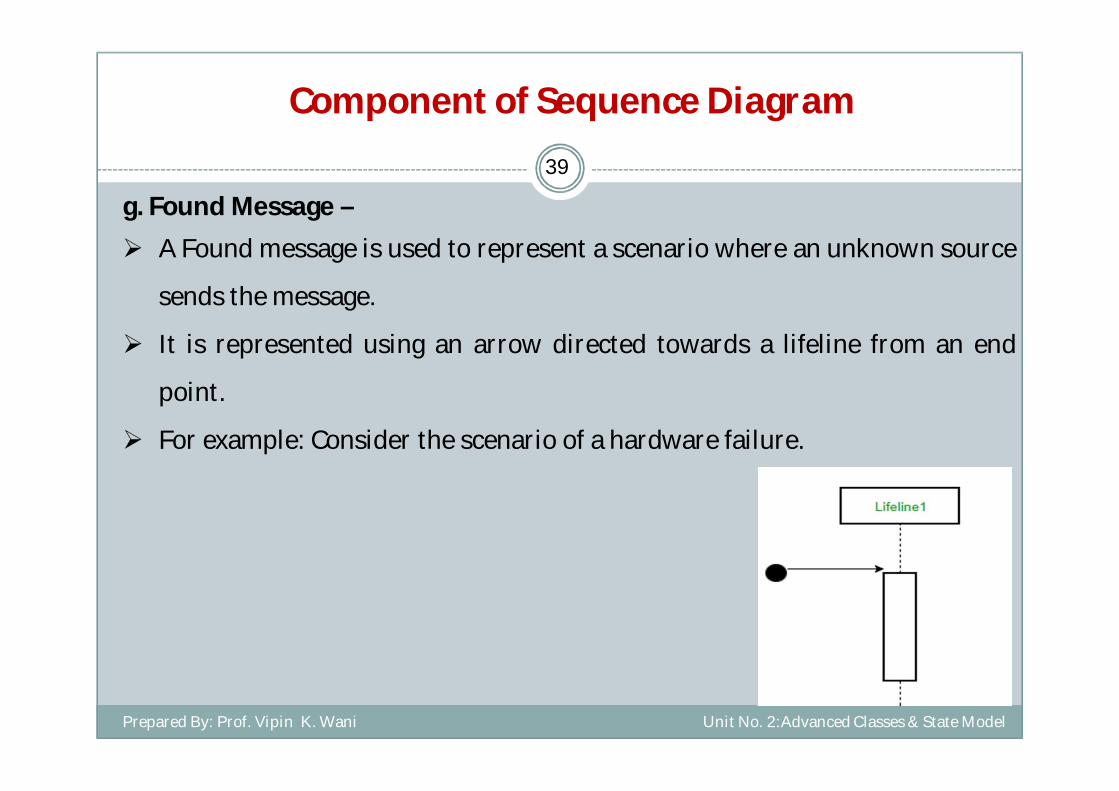
g. Found Message – A Found message is used to represent a scenario where an unknown source
sends the message.
It is represented using an arrow directed towards a lifeline from an end
point.
For example: Consider the scenario of a hardware failure.
Component of Sequence Diagram
Prepared By: Prof. Vipin K. Wani Unit No. 2:Advanced Classes & State Model
39

g. Found Message –
Component of Sequence Diagram
Prepared By: Prof. Vipin K. Wani Unit No. 2:Advanced Classes & State Model
39

h. Lost Message –
A Lost message is used to represent a scenario where the recipient is not
known to the system.
It is represented using an arrow directed towards an end point from a lifeline.
For example: Consider a scenario where a warning is generated.
Component of Sequence Diagram
Prepared By: Prof. Vipin K. Wani Unit No. 2:Advanced Classes & State Model
39
Figure – lost message

h. Lost Message –
Component of Sequence Diagram
Prepared By: Prof. Vipin K. Wani Unit No. 2:Advanced Classes & State Model
39

4. Guards :
To model conditions we use guards in UML.
They are used when we need to restrict the flow of messages on the pretext
of a condition being met.
Guards play an important role in letting software developers know the
constraints attached to a system or a particular process.
For example: In order to be able to withdraw cash, having a balance greater
than zero is a condition that must be met as shown below.
Component of Sequence Diagram
Prepared By: Prof. Vipin K. Wani Unit No. 2:Advanced Classes & State Model
39

5. Note:
A note (comment) gives the ability to attach various remarks to elements.
A comment carries no semantic force, but may contain information that is
useful to a modeler.
Component of Sequence Diagram
Prepared By: Prof. Vipin K. Wani Unit No. 2:Advanced Classes & State Model
39

Example on Sequence Diagram
Prepared By: Prof. Vipin K. Wani Unit No. 2:Advanced Classes & State Model
39

Draw Sequence Diagram for ATM Machine.
Draw Sequence Diagram for Library Management system
Draw Sequence Diagram for Coffee Vending Machine.
Draw Sequence Diagram for Online Order Delivery System.
Exercise
Prepared By: Prof. Vipin K. Wani Unit No. 2:Advanced Classes & State Model
55

Collaboration Diagram represents the interaction of the objects to perform
the behavior of a particular use case or a part of use case.
The designers use the Sequence diagram and Collaboration Diagrams to
define and clarify the roles of the objects that perform a particular flow of
events of a use case.
A Collaboration is a collection of named objects and actors with links
connecting them. They collaborate in performing some task.
A Collaboration defines a set of participants and relationships that are
meaningful for a given set of purposes
Collaboration Diagram
Prepared By: Prof. Vipin K. Wani Unit No. 2:Advanced Classes & State Model
56

It describes the responsibilities of each object.
It describes the sequences of interaction between various objects of the
system.
It Describe Dynamic Behavior of system.
Unlike a sequence diagram, a collaboration diagram shows the relationships
among the objects.
Sequence diagrams and collaboration diagrams express similar information,
but show it in different ways.
Because of the format of the collaboration diagram, they tend to better
suited for analysis activities.
Need of Collaboration Diagram
Prepared By: Prof. Vipin K. Wani Unit No. 2:Advanced Classes & State Model
57
Followings are the Steps for Creating Collaboration Diagrams
1. Identify behavior whose realization and implementation is specified
2. Identify the structural elements (class roles, objects, subsystems)
necessary to carry out the functionality of the collaboration
3. Model structural relationships between those elements to produce a
diagram showing the context of the interaction
4. Consider the alternative scenarios that may be required.
How to draw Collaboration Diagrams?
Prepared By: Prof. Vipin K. Wani Unit No. 2:Advanced Classes & State Model
58
Followings are the Components of Collaboration Diagrams:
1. Objects
2. Actors
3. Links
4. Messages
Components of Collaboration Diagrams
Prepared By: Prof. Vipin K. Wani Unit No. 2:Advanced Classes & State Model
59

1. Objects: An object is represented by an object symbol showing the name of the
object and its class underlined, separated by a colon: Object_name :
class_name.
Components of Collaboration Diagrams
Prepared By: Prof. Vipin K. Wani Unit No. 2:Advanced Classes & State Model
59

2. Actors:
Normally an actor instance occurs in the collaboration diagram,
as the invoker of the interaction.
If you have several actor instances in the same diagram, try
keeping them in the periphery of the diagram.
Each Actor is named and has a role
One actor will be the initiator of the use case
Components of Collaboration Diagrams
Prepared By: Prof. Vipin K. Wani Unit No. 2:Advanced Classes & State Model
59

3. Links:
Links connect objects and actors and are instances of
associations and each link corresponds to an association in the
class diagram.
Components of Collaboration Diagrams
Prepared By: Prof. Vipin K. Wani Unit No. 2:Advanced Classes & State Model
59

4. Messages:
A message is a communication between objects that conveys
information with the expectation that activity will ensue.
In collaboration diagrams, a message is shown as a labeled
arrow placed near a link.
Components of Collaboration Diagrams
Prepared By: Prof. Vipin K. Wani Unit No. 2:Advanced Classes & State Model
59
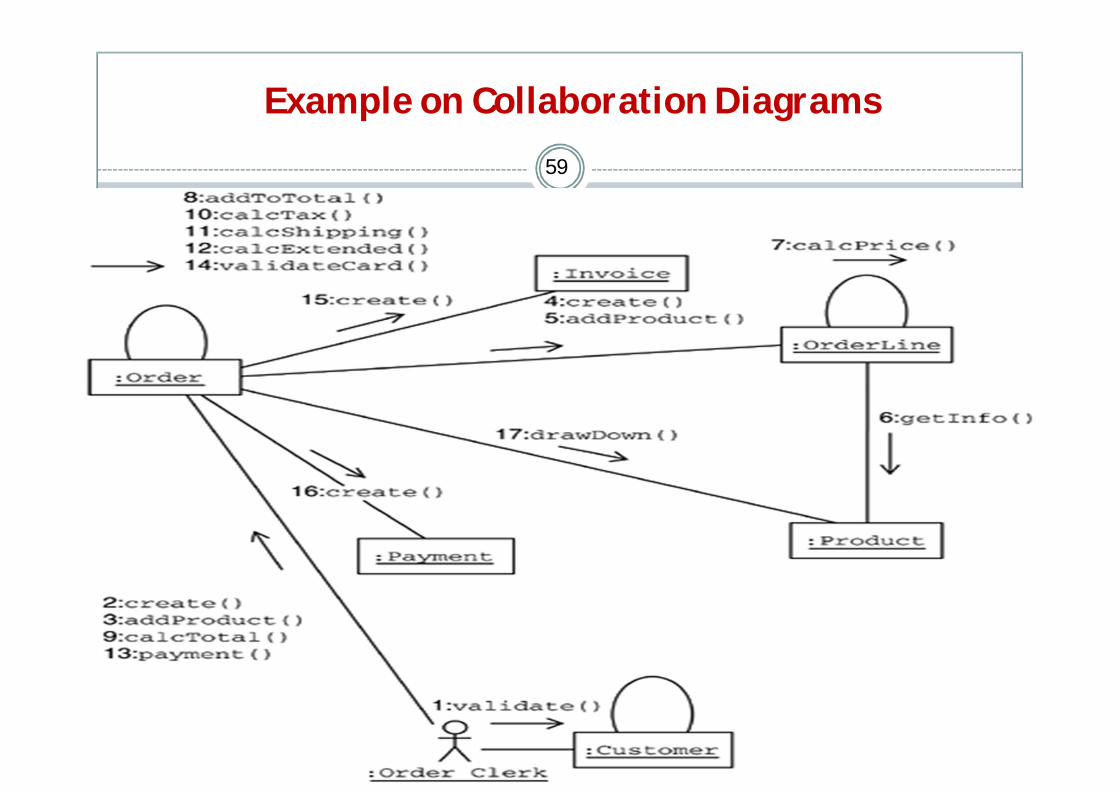
Example on Collaboration Diagrams
Prepared By: Prof. Vipin K. Wani Unit No. 2:Advanced Classes & State Model
59
Draw the Collaboration Diagrams for
1. Restaurant management System
2. Railway ticket booking System
3. Hospital Management System
4. Two Wheeler Showroom management System.
Exercise
Prepared By: Prof. Vipin K. Wani Unit No. 2:Advanced Classes & State Model
39

Thank You64
Prepared By: Prof. Vipin K. Wani Unit No. 2:Advanced Classes & State Model
Copyright © 2022 FDOKUMEN