
Nutritional and economic impact of 5 alternative front-of-pack ...
42
HAL Id: hal-01805431 https://hal.archives-ouvertes.fr/hal-01805431 Preprint submitted on 1 Jun 2018 HAL is a multi-disciplinary open access archive for the deposit and dissemination of sci- entific research documents, whether they are pub- lished or not. The documents may come from teaching and research institutions in France or abroad, or from public or private research centers. L’archive ouverte pluridisciplinaire HAL, est destinée au dépôt et à la diffusion de documents scientifiques de niveau recherche, publiés ou non, émanant des établissements d’enseignement et de recherche français ou étrangers, des laboratoires publics ou privés. Nutritional and economic impact of 5 alternative front-of-pack nutritional labels: experimental evidence Paolo Crosetto, Anne Lacroix, Laurent Muller, Bernard Ruffeux To cite this version: Paolo Crosetto, Anne Lacroix, Laurent Muller, Bernard Ruffeux. Nutritional and economic impact of 5 alternative front-of-pack nutritional labels: experimental evidence. 2018. hal-01805431
-
Upload
khangminh22 -
Category
Documents
-
view
0 -
download
0
Transcript of Nutritional and economic impact of 5 alternative front-of-pack ...

HAL Id: hal-01805431https://hal.archives-ouvertes.fr/hal-01805431
Preprint submitted on 1 Jun 2018
HAL is a multi-disciplinary open accessarchive for the deposit and dissemination of sci-entific research documents, whether they are pub-lished or not. The documents may come fromteaching and research institutions in France orabroad, or from public or private research centers.
L’archive ouverte pluridisciplinaire HAL, estdestinée au dépôt et à la diffusion de documentsscientifiques de niveau recherche, publiés ou non,émanant des établissements d’enseignement et derecherche français ou étrangers, des laboratoirespublics ou privés.
Nutritional and economic impact of 5 alternativefront-of-pack nutritional labels: experimental evidence
Paolo Crosetto, Anne Lacroix, Laurent Muller, Bernard Ruffieux
To cite this version:Paolo Crosetto, Anne Lacroix, Laurent Muller, Bernard Ruffieux. Nutritional and economic impactof 5 alternative front-of-pack nutritional labels: experimental evidence. 2018. �hal-01805431�

Nutritional and economic impact of 5 alternative front-of-pack nutritional labels: experimental evidence Crosetto, Paolo Lacroix, Anne Muller, Laurent Ruffieux, Bernard May 24, 2018
Wor
king
pap
er G
AE
L n°
11/
2018
GAEL Grenoble Applied Economic Laboratory Consumption – Energy - Innovation
https://gael.univ-grenoble-alpes.fr/accueil-gael contact : [email protected]

Nutritional and economic impact of 5 alternative front-of-packnutritional labels: experimental evidence
Paolo Crosettoa, Anne Lacroixa, Laurent Mullera, Bernard Ruffieuxa
aUniv. Grenoble Alpes, INRA, CNRS, Grenoble INP, GAEL, 38000 Grenoble, France
Abstract
We study in a laboratory framed field experiment the impact of five Front of Pack labels (FOPL) on thenutritional quality and cost of a daily consumption basket. We employ a difference in difference exper-imental design, between subjects, to cleanly identify the impact of FOPL. 691 subjects issued from thegeneral population shop twice within a catalog of 290 products: a first time without and a second unan-nounced time with labels. Purchases are real. We test five different labels and compare result against abenchmark treatment in which subjects shop twice with no labels. Labels include the existing MultipleTraffic Lights, Reference Intakes and Health Star Rating, and two newly proposed designs: NutriScore,a 5-color synthetic label, and SENS, a frequency-based recommendation label. We measure nutritionalquality using the FSA score. All labels but Reference Intakes significantly improve nutritional quality.NutriScore is significantly more effective than all other labels, followed by the Australian Health Starand Multiple Traffic Lights. The nutritional improvements due to the labeling come at an economiccost, as the average cost of 2000Kcal increases for all labels. Nonetheless, we show that the extra costfor a unit nutritional improvement is borne mainly by richer households. Behaviorally, change is con-centrated in the extremal categories of each label. Easier to understand labels have a higher impact andcrowd out more successfully other information cues like ingredients lists and nutritional tables.
Keywords:Nutritional labels, Experiment, Front of PackJEL: C93, Q18
1. Introduction
Consumers make hundreds of food choices every day. For each product consumers can access avariety of information: price, size, ingredients, nutritional facts, origin of the products, environmen-tal quality, organic and fair-trade certifications. This enormous amount of information competes forthe limited time, attention and cognitive resources of consumers, giving rise to choice overload effects(Iyengar and Lepper, 2000, Kivetz and Simonson, 2000, Malhotra, 1982, Schwarz, 2004).
Confronted with these large search costs, consumers often rely on appearance (Imram, 1999), habitand simpler heuristics (Schulte-Mecklenbeck et al., 2013, Scheibehenne et al., 2007). Yet, everyday foodchoices have potentially large impacts on long-term well-being, public health and treatment costs (With-row and Alter, 2011).
Front-of-Pack nutritional labels (FOPL) are a public policy tool conceived for a context of choiceoverload. They give less information than nutritional tables and ingredient lists, choosing focal, sum-marised and aggregated messages instead. FOPL are designed to be simple and to stand out amongthe mass of competing signals, and are more likely to be understood and used by consumers (Becker etal., 2015, Bialkova and van Trijp, 2010). Different FOPL formats have been shown to require differentcognitive skills (Crosetto et al., 2016a, Helfer and Shultz, 2014) and result in differentiated impacts onfood choices (Vlaeminck et al., 2014, Ducrot et al., 2016, Hersey et al., 2013, Neal et al., 2017).
Several governments (Australia, 2013a, FSA, 2013, Norden, 2010) and the EU (Council of the Euro-pean Union, 2011) have endorsed FOPL as a policy tool. Recently, France entered the debate. Article 14of the French Law of 26 January 2016 on the modernization of the health system recommends food pro-ducers to adopt, on a voluntary basis, a uniform front-of-pack nutritional label design. Under the aegisof the health authorities, representatives of manufacturers, retailers, consumers and scientists were con-sulted and four candidate systems were selected: NutriCouleurs (a French version of the UK’s Traffic
May 24, 2018

Lights), NutriRepere (an updated version of the UK’s Reference Intakes), and the newly-developed Nu-triScore – a 5-color mono-dimensional synthetic label – and SENS – a frequency-based recommendationlabel. These candidate labels were tested in a large-scale randomized controlled trial in French super-markets (Ministere des Affaires Sociales et de la Sante, Fonds Francais pour l’ Alimentation et la Sante,2017).
From a public policy perspective, the best FOPL is the one generating the healthiest diet changesat the lowest adjustment cost (see Rao et al., 2013, for robust evidence that healthy food tends to becostlier). In this paper we assess in a controlled laboratory experiment the nutritional and economicimpact of five different FOPL: UK’s Traffic Lights (known in France and in this experiment as Nu-triCouleur), Australia and New Zealand’s Health Star Ratings (NutriMark), EU’s Reference Intakes(NutriRepere) and the two new French designs – NutriScore and SENS. 691 subjects perform a realshopping task on a selected catalog of 290 food products. We use a difference-in-difference design,whereby subjects shop twice, once without and a second time, unannounced, with FOPL. By varyingthe label between subjects we can cleanly identify, for each subject, its effect on nutritional quality andeconomic cost when compared to the reference (no label) shopping basket.
We measure the nutritional quality of the shopping basket using the Nutrient Profiling Model de-veloped by the UK Food and Standard Agency (Rayner et al., 2009, henceforth FSA score). The scoreis computed for each product by assigning negative points for salt, saturated fatty acids, calories, andsugar, and positive points for fiber, fruit & vegetable content and proteins. Since the score is a scalar,it can be easily aggregated over baskets, and compared across label treatments. We measure the costof the basket with two different indicators: the cost per 2000Kcal, and the cost per 2000Kcal per unitnutritional improvement. The first indicator allows us to clean the effects of frugality – simply buy-ing less – from our results. The second allows us to compare the efficiency of each label in generatingnutritional change at low economic cost. The control provided by a laboratory experiment allows usto collect detailed behavioral, social and economic information on each subject, and to expose themto a label-specific qualitative questionnaire, asking subjects to rate label according to trustworthiness,appeal, ease of use and understanding.
We find that all labels but Reference Intake have a significant positive impact on the nutritional qual-ity of the shopping. On average, labels improve the FSA score by 1.56 points, with respect to the baselineshopping basket with no labels. Color-coded labels providing aggregate nutritional information gen-erate nutritionally healthier choices than analytical labels using numbers. In particular, the NutriScorelabel (aggregate, color) outperforms all others, followed by NutriMark (aggregate and analytic, blackand white). We further find that the alternative approach of giving the consumer information about thesuggested frequency of consumption (SENS label, aggregate, color) performs worse than more directlabels giving nutritional information.
Nutritional improvements come at an economic cost, though, as the average cost of 2000Kcal in-creases for all labels but NutriMark. On average, when exposed to a label shopping costs increase by19 euro cents (+3.6%) for each 2000Kcal. Nonetheless, once normalized by the nutritional gain, onlySENS and, to a lesser extent, Traffic Lights show significant higher cost. Looking at the breakdownof the results by income, for all labels but SENS middle- and high-income subjects pay higher cost ofadjustment than low-income ones. This is in stark contrast with policies based on taxes and subsidies,that have been shown to disproportionately benefit higher income households and to have regressiveeffects (Muller et al., 2017, Drewnowski and Specter, 2004).
Behaviorally, results show that subjects further simplify the already simple messages conveyed bythe label. For the three aggregate labels subjects tend to focus on the extreme values, treating informa-tion on nuanced 5- or 10-level scales as a binary (good-bad) or ternary (good-average-bad) information.These tendencies result in baskets that contain more products that are labeled ’green’ or ’five star’ andless products that are labeled ’red’ or ’zero stars’ but do not differ much for all the in-between cat-egories. For analytic labels subjects disproportionately focus on fat. Moreover, labels differ in theirability to crowd out other information, as proxied by the number of times subjects consulted the nu-tritional table and ingredient lists while shopping. NutriScore and Traffic Lights act as nearly perfectsubstitutes of detailed information tables. SENS, on the other hand, acts as a rather imperfect substi-tute, not being different from the benchmark with no label. The ability of labels to crowd out otherinformation correlates with its overall nutritional performance, and with the results of the qualitativequestionnaire.
Subjects seem to comply more with labels that give clear, discrete, aggregate, color-coded nutri-tional information. Labels that stand out and are cognitively easy to parse are trusted more and havea stronger nutritional impact than analytical labels that give plenty of information but no focal, clear
2

nutritional judgment. The cost of the adjustment, while positive, is small, label-speficic, and dispropor-tionately borne by richer subjects. While the external validity of our laboratory experiment needs tobe carefully assessed, our data suggest that FOPL are an efficient, progressive policy tool, allowing allconsumers, and low-income households in particular, to achieve considerable nutritional improvementat little cost.
2. Related literature
Several other studies have measured the relative performance of different FOPL (see the reviewpapers of Hersey et al., 2013, Vyth et al., 2012, Cecchini and Warin, 2016, Grunert and Wills, 2007,Volkova and Mhurchu, 2015). Most studies rely on experimental designs rather than observation onreal world data. This is because shopping data are usually very noisy, suffer from severe selectionbiases and identification is usually hard to obtain. Still, some studies did use supermarket scanner data(Variyam, 2008, Mørk et al., 2017, Boztug et al., 2015). Studies follow by and large one of four methods:surveys, randomized controlled trials, choice experiments, and willingness-to-pay studies.
Surveys set up hypothetical choice scenarios, and systematically vary the use of labels to identifyeffects. Subjects’ task is usually to identify the healthier product among a set of two or three (Kellyet al., 2009, Borgmeier and Westenhoefer, 2009, Synovate, 2005). These studies allow researchers toassess the understanding and parsing of FOPLs. On the other hand, they do not allow to see howthis understanding interacts with preferences; moreover, by relying on scenario choices they sufferfrom hypothetical bias and do not generally take into account the role of price in the choice. Morerecent surveys (Aschemann-Witzel et al., 2013) addressed the interaction of preferences and labels, andextended the choice set up to 20 choices, but still retained an hypothetical nature, did not considerprices, and focused on single product categories.
Willingness-to-pay studies use incentivized elicitation methods (mainly experimental auctions Luskand Shogren, 2007) to assess the perceived value of different food items, with and without labels. Theyindirectly assess, through the value that a subject assigns to a labeled product, the importance the sub-ject attributes to the label’s message. Usually run in the lab, they feature strong control on confoundingfactor but forfeit most of the external validity. In addition, these experiments usually involve a smallnumber of products. Examples are in the context of GMO content Noussair et al. (2004)
A multivariate and multi-attribute version of WTP studies is embodied by choice experiments.Choice experiments improve on surveys by giving the subjects dozens of choices, systematically vary-ing the attributes of the products – price, quality, label – and analyzing the data in a structural randomutility model. They allow the researcher to estimate the marginal role of each attribute in a context inwhich prices are taken into account. On the other hand, choice experiment usually rely on hypotheticalchoices and on strong behavioral assumptions. Applications of the chocie experiment method to differ-ent types of labeling are Balcombe et al. (2010), who focus on Traffic Lights, Marchi et al. (2016), focusingon time preferences, and Aprile et al. (2012), dealing with quality labels, Loo et al. (2011), focusing onorganic labels, and Gracia et al. (2009) focusing on the value of nutritional tables.
Natural field experiments apply FOPL in grocery stores following a randomized procedure. Sub-jects might or might not be informed that they are part of an experiment, and their response to FOPLsis observed in a real setting and according to real preferences and budget constraints. These studieshave a high degree of external validity. On the other hand, data are extremely noisy and the exper-imenters do not have tight control on all possible confounds (promotions, shops opening hours, . . . ).As a result effects are usually small, as is the case of the recent French field experiment (Ministere desAffaires Sociales et de la Sante, Fonds Francais pour l’ Alimentation et la Sante, 2017). Examples of fieldexperiment include Berning et al. (2011), applying label to pop corn in five stores in Californa, Neal etal. (2017), who use a smartphone application to track consumer choices in an Australian supermarket,and Vyth et al. (2010) studying choices in a Dutch supermarket.
In this paper, we use a randomized controlled trial that allows us to observe real purchasing choicesfrom a representative sample over a large set of products, as in natural field experiments, but in acontrolled laboratory setting in which we minimize noise, as in choice experiment or willingness-to-pay studies. Other studies have taken this route (among others, Cecchini and Warin, 2016, Ducrot etal., 2016). The studies that are closest in design to our experiment are the (non-incentivized) virtualsupermarket studies developed at the University of Auckland (Waterlander et al., 2012, 2013, 2014,2015). Nonetheless, to the best of our knowledge we are the only study providing clean, incentivizedlaboratory evidence on the effect of FOPLs. Our design allows us to both assess the nutritional quality of
3

the whole shopping with and without competing labels, and to observe in detail the behavioral sourcesof this nutritional change.
3. Method
Subjects were asked to shop for two days for their household, following their usual shopping habits.A paper catalog of 290 products, divided in 39 categories, was distributed to each subject. The catalogdisplayed for each product a full color picture, price, weight (g) or volume (l), price per kg or per literand a bar code. Prices corresponded to those recorded before the experimental campaign in a localsupermarket. Using a bar-code reader, subjects could display on their screen the product of their choicein a custom on-line e-shopping environment. They could thereby access, for each product, a list ofingredients (with outlined allergens) and a nutritional table.
Subjects were asked to shop twice; once with a benchmark catalog without nutritional labels and asecond, previously unannounced, time with a new catalog, strictly identical to the previous one, but inwhich nutrition labels were added. In the second catalog, all products that are legally subject to labelingwere labeled, i.e. all products except fresh fruits and vegetables, fresh packaged meat, and eggs.
We ran 6 between-subjects treatments: one for each of 5 nutritional labels and a benchmark neutraltreatment in which no label was added and subjects shopped twice with the same catalog.
The experiment was incentive compatible. Subjects were informed that they would have to buya subset of one of their two shopping baskets. The payoff-relevant basket would be randomly andpublicly drawn at the end of the experiment. The subset of products actually put up for sale wasunknown ex-ante. In a separate room, we had stored about a quarter of all the catalog products. Theintersection of the items selected by the subjects and what we had in store was then sold, at catalogprices, to the subjects at the end of the session.
4. Measures
Our experimental design (already put to use in tis general form in Muller et al., 2017, Muller andRuffieux, 2012) allows us to measure behavior twice. The first, unlabeled basket allows us to set abenchmark for the shopping behavior of each subject. The second basket allows us to assess, withinsubjects, changes with respect to the baseline basket. The comparison of individual changes acrosstreatments allows us to cleanly assess, by exploiting differences in differences, the effect of labels bycontrolling for heterogeneity of individual preferences.
The main measure of interest is the aggregation per treatment of the individual change in the nutri-tional score between basket 2 (labeled) and basket 1 (unlabeled). We adopt as our nutritional measurethe Nutrient Profiling Model developed by the UK Food and Standard Agency (Rayner et al., 2009, ,henceforth FSA score). This score is computed for each product by assigning negative points for salt,saturated fatty acids, calories, and sugar, and positive points for fiber, fruit & vegetable content andproteins. The score ranges from -15 to 35, with lower numbers indicating better overall nutritionalquality.
We compute the aggregate nutritional score for each shopping basket, by adding the FSA score ofeach item and normalizing by 100 Kilocalories. That is, for each subject i, for each basket j ∈ [1, 2], wecompute
FSAij =∑p Kcalpij · FSApij
∑p Kcalpij,
in which the index pij denotes each product p in caddy j for subject i.This measure gives us a single, continuous variable to assess the nutritional quality of the whole
shopping basket. Nonetheless, it relies on two assumptions: that the FSA score correctly assess thenutritional value of a shopping basket, and that a normalization by calories is not distortive. The FSAis widely used in epidemiological studies (Julia et al., 2015a, Ducrot et al., 2015, Julia et al., 2014), andits value as a nutritional score is well documented. Normalization by energy content has the advantageof delivering results that are easily interpretable as one day of consumption for an average adult, andto anchor the results to the basic measure of human energetic needs. Nonetheless, studies vary asper the normalization used. For robustness we ran our analysis also using SAIN/LIM, an alternativenutritional system (Tharrey et al., 2017) and normalizing by weight.
4
We estimate treatment effects using a difference-in-difference regression analysis. We let the treat-ment and basket variables interact, and add a series of subject-specific variables to control for the socio-demographics of the sample. Our main estimation uses data from both caddies and all six treatments,and takes the following form:
FSAit = β0 + β1Cart2 + δTreatment× Cart + γControls,
in which the benchmark treatment with no labels serves as reference category, β0 identifies the av-erage nutritional value of the first basket, β1 the impact of the benchmark treatment, δ is a vector of5× 2 coefficients identifying the difference with respect to the first benchmark basket of the first andsecond basket for each of the five labels (NS, NR, NC, NM, SENS), and γ is a vector of subject-specificcoefficients.
We supplement the analysis of nutritional impact with economic considerations. First, in line withpublic policy concerns for lower income households, we separately run regressions for three differentincome groups, declaring low (< 2000e/month family disposable income), average (between 2000eand 3000e) and high (> 3000e). Second, we run an extensive analysis of results normalized by price. Aprice normalization allows us to directly assess the impact on overall spending of the adoption of eachlabel, and to see whether the nutritional improvement comes at the cost of a higher price.
In addition to these analytical measures based on the FSA score, we computed a number of behav-ioral measures and used data from questionnaires. In particular, we recorded the number of items ineach basket, the number of product entries and exits from basket 1 to 2, the number of clicks on theingredient lists and nutritional tables. We have use label-specific behavioral variables keeping track ofthe qualitative change between baskets. Finally, we asked subjects to fill in two questionnaires, oneaimed at assessing their understanding of the labels, and the other including socio-demographic char-acteristics.
5. Experimental details
5.1. ProductsSubjects could shop in a printed color catalog of 290 food items grouped into 39 categories1 While
not being perfectly representative of shopping in a real supermarket, where the number of availableproducts numbers in the thousands, the catalog covered all the needs of an average household, andincluded fresh, canned, packaged and frozen food, fruits and vegetables, snacks and mixed prepareddishes. The overall coherence and representativeness of the catalog was respectively verified by nutri-tionists and using actual consumption data from Kantar World Panel. All products were currently onsale in local supermarkets at the time of the experiment. The prices used in the catalog were collectedin a specific supermarket the week before the start of the experimental campaign, in October 2016. Thecatalog displayed a picture of the front-of-pack of the product, its name, price, weight or volume, andthe price per kilogram (or liter).
5.2. SubjectsThe study involved 691 subjects over 42 sessions (7 per treatment). Subjects were recruited among
the general population of the Grenoble metropolitan area by a professional recruitment agency. Greno-ble and its suburbs, located in the Alps in south-eastern France, have about four hundred thousandinhabitants. Recruited subjects were in charge of the grocery shopping for their household and regu-lar supermarket customers. The sample was stratified by household disposable income: one third ofsubjects with less than two thousand Euros per month, one third between two and three thousand, andanother third with more than three thousand. Following standard procedures of randomized controlledtrials, individuals from each income group were randomly allocated to either one of the 5 label treat-ments or the benchmark treatment. Summary statistics for our sample are provided in Table A.11 inAppendix A. Overall, one in five subject is a man, the age and income structure loosely reflects those ofthe Grenoble Metro Area. Randomization checks do not reveal significant differences across treatments,except for the distribution of professional status.
1For screenshots of the catalog, see Appendix D. The full catalog for the benchmark treatment is available here
5
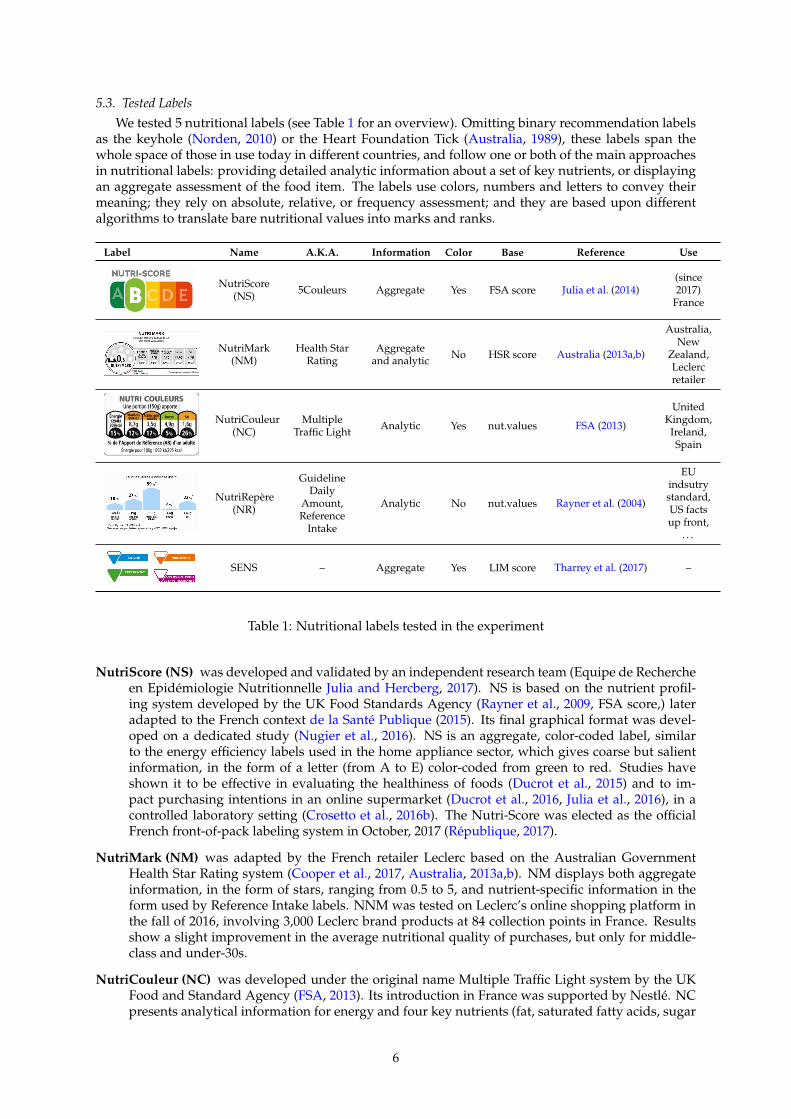
5.3. Tested LabelsWe tested 5 nutritional labels (see Table 1 for an overview). Omitting binary recommendation labels
as the keyhole (Norden, 2010) or the Heart Foundation Tick (Australia, 1989), these labels span thewhole space of those in use today in different countries, and follow one or both of the main approachesin nutritional labels: providing detailed analytic information about a set of key nutrients, or displayingan aggregate assessment of the food item. The labels use colors, numbers and letters to convey theirmeaning; they rely on absolute, relative, or frequency assessment; and they are based upon differentalgorithms to translate bare nutritional values into marks and ranks.
Label Name A.K.A. Information Color Base Reference Use
NutriScore(NS) 5Couleurs Aggregate Yes FSA score Julia et al. (2014)
(since2017)
France
NutriMark(NM)
Health StarRating
Aggregateand analytic No HSR score Australia (2013a,b)
Australia,New
Zealand,Leclercretailer
NutriCouleur(NC)
MultipleTraffic Light Analytic Yes nut.values FSA (2013)
UnitedKingdom,
Ireland,Spain
NutriRepere(NR)
GuidelineDaily
Amount,Reference
Intake
Analytic No nut.values Rayner et al. (2004)
EUindsutrystandard,US factsup front,
. . .
SENS – Aggregate Yes LIM score Tharrey et al. (2017) –
Table 1: Nutritional labels tested in the experiment
NutriScore (NS) was developed and validated by an independent research team (Equipe de Rechercheen Epidemiologie Nutritionnelle Julia and Hercberg, 2017). NS is based on the nutrient profil-ing system developed by the UK Food Standards Agency (Rayner et al., 2009, FSA score,) lateradapted to the French context de la Sante Publique (2015). Its final graphical format was devel-oped on a dedicated study (Nugier et al., 2016). NS is an aggregate, color-coded label, similarto the energy efficiency labels used in the home appliance sector, which gives coarse but salientinformation, in the form of a letter (from A to E) color-coded from green to red. Studies haveshown it to be effective in evaluating the healthiness of foods (Ducrot et al., 2015) and to im-pact purchasing intentions in an online supermarket (Ducrot et al., 2016, Julia et al., 2016), in acontrolled laboratory setting (Crosetto et al., 2016b). The Nutri-Score was elected as the officialFrench front-of-pack labeling system in October, 2017 (Republique, 2017).
NutriMark (NM) was adapted by the French retailer Leclerc based on the Australian GovernmentHealth Star Rating system (Cooper et al., 2017, Australia, 2013a,b). NM displays both aggregateinformation, in the form of stars, ranging from 0.5 to 5, and nutrient-specific information in theform used by Reference Intake labels. NNM was tested on Leclerc’s online shopping platform inthe fall of 2016, involving 3,000 Leclerc brand products at 84 collection points in France. Resultsshow a slight improvement in the average nutritional quality of purchases, but only for middle-class and under-30s.
NutriCouleur (NC) was developed under the original name Multiple Traffic Light system by the UKFood and Standard Agency (FSA, 2013). Its introduction in France was supported by Nestle. NCpresents analytical information for energy and four key nutrients (fat, saturated fatty acids, sugar
6

and salt) in three different ways: as a percentage contribution to the daily reference intake, inabsolute amount per serving (in grams) and in color on three levels (red, amber, green). Severalstudies have investigated the impact of Multiple Traffic Lights on choices (Aschemann-Witzel etal., 2013, Crosetto et al., 2016a, Julia et al., 2016, Bialkova and van Trijp, 2010, Kelly et al., 2009),showing overall greater effectiveness with respect to labels that do not use colors.
NutriRepere (NR) was proposed by over 500 food companies in France. It is based on the ReferenceIntake label (RI).2 RI has been adopted by the Australian food and beverage industry in 2006(as Daily Intake Guide), by the European Union in 2009 as an industry standard and has beenintroduced in the US following Michelle Obama’s initiative in 2012 (Facts Up Front). NR presentsanalytical nutritional information for energy and four key nutrients (fat, saturated fatty acids,sugar and salt). This information is displayed in three different ways: in percentage, absolutevalue, and by means of light blue histograms.
SENS was developed by nutritionist Nicole Darmon and her group (Tharrey et al., 2017) based onthe previously established SAIN/LIM nutritional profiling (Darmon et al., 2009). SENS is backedby the organisation of French distributors, grouping 50 supermarket chains. SENS presents nutri-tional information as a color-coded recommendation of eating frequency, using a red-blue-orange-purple palette. That is, after assessing the food nutritional quality, SENS translates this index intoa frequency, and tells the consumer if a food item might be eaten anytime, often, from time totime, or rarely.
Overall, the labels vary across three dimensions that have been shown to be crucial by previousresearch (Muller and Ruffieux, 2012, Crosetto et al., 2016a, Muller and Prevost, 2016, Drichoutis et al.,2008, Shogren, 2011): (i) whether the information is aggregated (NS, SENS, in part NM) or analytical(NR, NC, in part NL); (ii) whether the logo uses color (NR, NC, SENS) or not (NM, NR); and ()whetherthe recommendation focuses on nutritional content (NS, NM, NC, NR) or on consumption frequency(SENS). More generally, labels trade off saliency with detail, with NS and SENS choosing to deliver asalient but coarse message with no readily available reference to nutritional values, and NR and NCchoosing to give more detailed information in a less salient package. NM includes both approaches ina combined design, but forfeits the use of color.
5.4. Laboratory proceduresSubjects were invited for sessions lasting approximately 1.5 hours and received 32eas show-up fee.
Their task was to shop to cater to the needs of their family for two days, but were otherwise not directedin their choices. This frame was given to reach some uniformity in the task that the subjects faced, but itwas not enforced. If subjects asked what ”two days’s of consumption” meant, they were told that eachmust decide according to their household’s taste and needs. Subjects were allowed to shop more, orless, or not at all.
Instructions were then showed on each subject’s screen, as well as projected overhead, and readaloud by the experimenter3. Questions were asked and answered publicly all along the reading of theinstructions. The English translation of the original French instructions is available in Appendix C.
After all instructions had been given, including a screenshot-based demonstration of the softwareinterface4, subjects were asked to do their shopping. Subjects were not given a time limit, and eachcould shop at his or her own rhythm. When all subjects had finished their shopping, they were askedto shop again in an unannounced second shopping exercise.
For all treatments but the Benchmark, after the first shopping and before the second subjects weregiven a one-page explanation of the nutritional label that they would face in the second shopping (seeAppendix C). These explanation were based on the flyers distributed in the 60 supermarkets of a nat-ural field experiment comparing the same labels performed in December 2016 (Ministere des AffairesSociales et de la Sante, Fonds Francais pour l’ Alimentation et la Sante, 2017). Subjects received a paper
2Reference Intake have been previously known as Guideline Daily Amount (Rayner et al., 2004). Although the principlesbehind GDA and RI are the same, the major difference is that GDA existed for men, women and children; there is only one set ofReference Intakes for an average adult.
3Due to the size of the experimental campaign, four different experimenters were involved. Results are robust to controllingfor the identity of the experimenter.
4The source code for the interface, written in PHP, is available upon request.
7
copy of these one-page explanatory sheets; the same was projected on a screen and its contents readaloud. Any question was replied before proceeding with the second shopping period.
After each subject submitted his or her choices for the second shopping period, one of the twowas randomly selected as binding using a physical urn for increased transparency. Then subjects wereexposed to a socio-demographic questionnaire and, for all treatments but the Baseline, to a qualitativesurvey asking them to rate over several dimensions the nutritional label they had been exposed to.Subjects left then the room individually, and bought the items they had chosen in the binding basket ina separate room.
6. Results
6.1. Nutritional resultsThe benchmark treatment
In the benchmark treatment, subjects shopped twice under the same conditions. This treatmentallows us to assess the degree of variability of diets across repetitions. Indeed, a repetition ceteris paribusdoes not necessarily have to generate the same choices. First, as basket 1 was not recalled to the screenwhen basket 2 was created, subjects had to reconstruct it from memory. Second, subjects might wish tochange some items because of a taste for variety. Third, a basket does not reflect all eating habits, butrepresents only a limited sample so it is natural to expect a second sample to differ. Finally, subjectscould find repetition boring and make changes to escape boredom. Although we expect variability inall treatments, we do not expect any systematic nutritional effect in the benchmark treatment.
This is indeed what we observe. The average FSA score for basket 1 is 5.22 (s.d. 3.01), and 5.34 (2.94)for basket 2. The difference is not significant (Wilcoxon Sgned Rank test, p-value 0.77). Figure 2 reportsthe cumulative distribution function of changes in the FSA score between basket 2 and 1 (negativechanges mean healthier diets), for all treatments. The distribution for the Benchmark treatment (lightgrey) is roughly symmetric around its center. Despite a large variability in nutritional quality betweenbaskets 1 and 2 within the benchmark treatment, there is no net effect on overall nutritional quality, asindividual deteriorations and improvements cancel each other out.
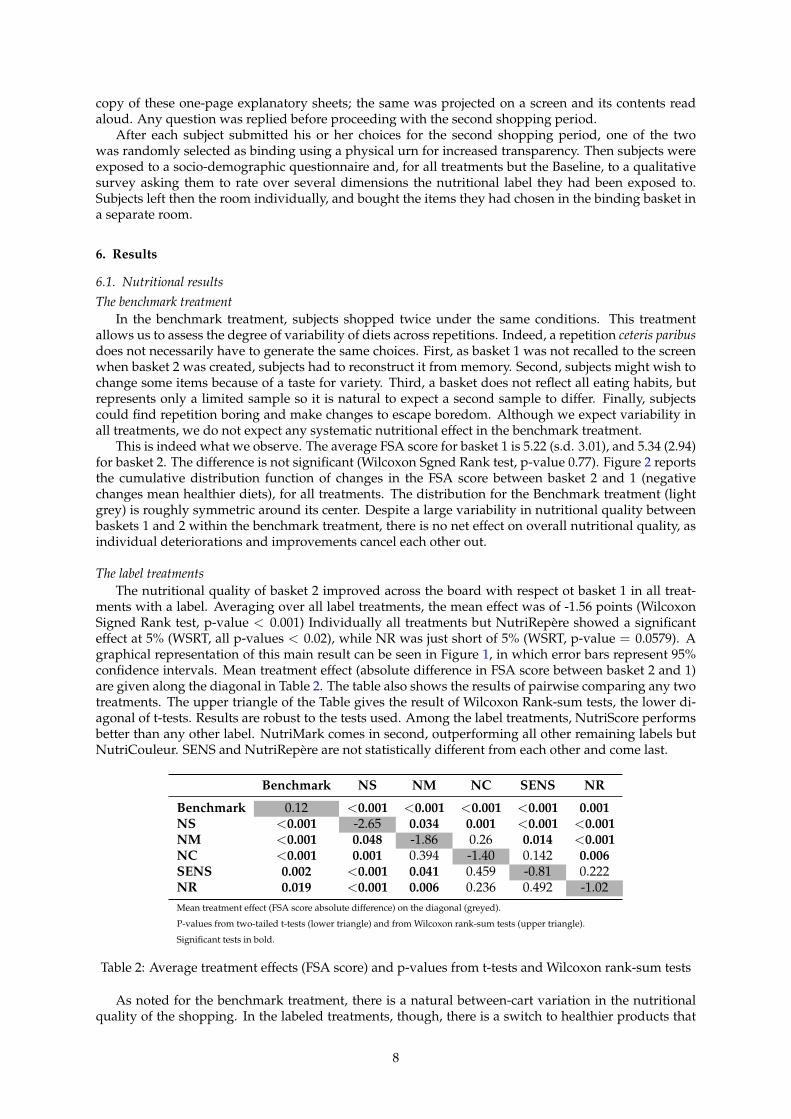
The label treatmentsThe nutritional quality of basket 2 improved across the board with respect ot basket 1 in all treat-
ments with a label. Averaging over all label treatments, the mean effect was of -1.56 points (WilcoxonSigned Rank test, p-value < 0.001) Individually all treatments but NutriRepere showed a significanteffect at 5% (WSRT, all p-values < 0.02), while NR was just short of 5% (WSRT, p-value = 0.0579). Agraphical representation of this main result can be seen in Figure 1, in which error bars represent 95%confidence intervals. Mean treatment effect (absolute difference in FSA score between basket 2 and 1)are given along the diagonal in Table 2. The table also shows the results of pairwise comparing any twotreatments. The upper triangle of the Table gives the result of Wilcoxon Rank-sum tests, the lower di-agonal of t-tests. Results are robust to the tests used. Among the label treatments, NutriScore performsbetter than any other label. NutriMark comes in second, outperforming all other remaining labels butNutriCouleur. SENS and NutriRepere are not statistically different from each other and come last.
Benchmark NS NM NC SENS NR
Benchmark 0.12 <0.001 <0.001 <0.001 <0.001 0.001NS <0.001 -2.65 0.034 0.001 <0.001 <0.001NM <0.001 0.048 -1.86 0.26 0.014 <0.001NC <0.001 0.001 0.394 -1.40 0.142 0.006SENS 0.002 <0.001 0.041 0.459 -0.81 0.222NR 0.019 <0.001 0.006 0.236 0.492 -1.02Mean treatment effect (FSA score absolute difference) on the diagonal (greyed).
P-values from two-tailed t-tests (lower triangle) and from Wilcoxon rank-sum tests (upper triangle).
Significant tests in bold.
Table 2: Average treatment effects (FSA score) and p-values from t-tests and Wilcoxon rank-sum tests
As noted for the benchmark treatment, there is a natural between-cart variation in the nutritionalquality of the shopping. In the labeled treatments, though, there is a switch to healthier products that
8
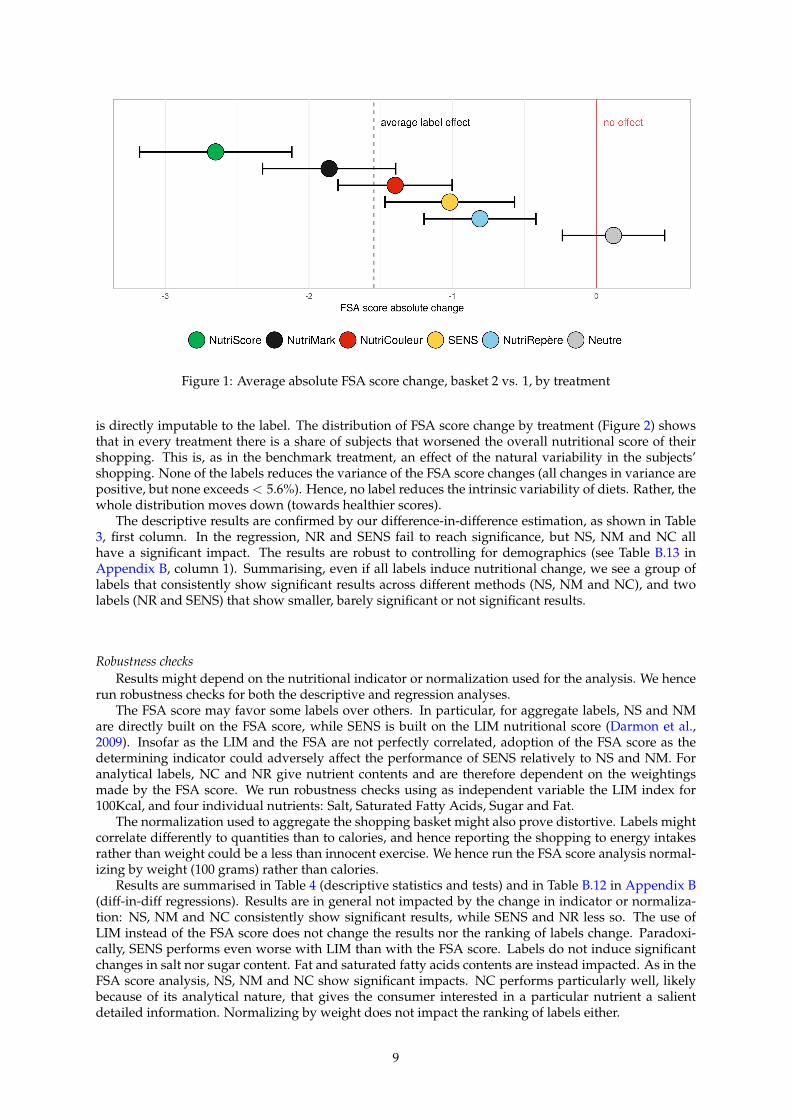
Figure 1: Average absolute FSA score change, basket 2 vs. 1, by treatment
is directly imputable to the label. The distribution of FSA score change by treatment (Figure 2) showsthat in every treatment there is a share of subjects that worsened the overall nutritional score of theirshopping. This is, as in the benchmark treatment, an effect of the natural variability in the subjects’shopping. None of the labels reduces the variance of the FSA score changes (all changes in variance arepositive, but none exceeds < 5.6%). Hence, no label reduces the intrinsic variability of diets. Rather, thewhole distribution moves down (towards healthier scores).
The descriptive results are confirmed by our difference-in-difference estimation, as shown in Table3, first column. In the regression, NR and SENS fail to reach significance, but NS, NM and NC allhave a significant impact. The results are robust to controlling for demographics (see Table B.13 inAppendix B, column 1). Summarising, even if all labels induce nutritional change, we see a group oflabels that consistently show significant results across different methods (NS, NM and NC), and twolabels (NR and SENS) that show smaller, barely significant or not significant results.
Robustness checksResults might depend on the nutritional indicator or normalization used for the analysis. We hence
run robustness checks for both the descriptive and regression analyses.The FSA score may favor some labels over others. In particular, for aggregate labels, NS and NM
are directly built on the FSA score, while SENS is built on the LIM nutritional score (Darmon et al.,2009). Insofar as the LIM and the FSA are not perfectly correlated, adoption of the FSA score as thedetermining indicator could adversely affect the performance of SENS relatively to NS and NM. Foranalytical labels, NC and NR give nutrient contents and are therefore dependent on the weightingsmade by the FSA score. We run robustness checks using as independent variable the LIM index for100Kcal, and four individual nutrients: Salt, Saturated Fatty Acids, Sugar and Fat.
The normalization used to aggregate the shopping basket might also prove distortive. Labels mightcorrelate differently to quantities than to calories, and hence reporting the shopping to energy intakesrather than weight could be a less than innocent exercise. We hence run the FSA score analysis normal-izing by weight (100 grams) rather than calories.
Results are summarised in Table 4 (descriptive statistics and tests) and in Table B.12 in Appendix B(diff-in-diff regressions). Results are in general not impacted by the change in indicator or normaliza-tion: NS, NM and NC consistently show significant results, while SENS and NR less so. The use ofLIM instead of the FSA score does not change the results nor the ranking of labels change. Paradoxi-cally, SENS performs even worse with LIM than with the FSA score. Labels do not induce significantchanges in salt nor sugar content. Fat and saturated fatty acids contents are instead impacted. As in theFSA score analysis, NS, NM and NC show significant impacts. NC performs particularly well, likelybecause of its analytical nature, that gives the consumer interested in a particular nutrient a salientdetailed information. Normalizing by weight does not impact the ranking of labels either.
9

Figure 2: distribution of FSA score change, basket 2 vs. 1, all treatments
All Low income Middle income High incomeIntercept 5.225 *** 5.372 *** 5.323 *** 4.945 ***
(0.305) (0.514) (0.547) (0.508)Basket 2 0.115 0.064 0.440 -0.117
(0.431) (0.728) (0.774) (0.719)NutriScore -0.487 -0.627 -0.074 -0.725
(0.437) (0.752) (0.769) (0.729)NutriMark -0.054 -0.194 0.662 -0.781
(0.434) (0.724) (0.759) (0.758)NutriCouleur -0.846 -0.836 -0.820 -0.907
(0.437) (0.739) (0.774) (0.740)NutriRepere -0.430 -1.487 0.636 -0.279
(0.444) (0.767) (0.774) (0.740)SENS -0.656 -1.763 * 0.367 -0.340
(0.441) (0.767) (0.786) (0.719)NutriScore × Basket 2 -2.766 *** -2.584 * -3.294 ** -2.487 *
(0.619) (1.064) (1.087) (1.031)NutriMark × Basket 2 -1.974 ** -1.916 -3.049 ** -0.832
(0.613) (1.024) (1.073) (1.072)NutriCouleur × Basket 2 -1.513 * -1.104 -2.274 * -1.316
(0.619) (1.046) (1.095) (1.046)NutriRepere × Basket 2 -0.924 -0.705 -1.485 -0.645
(0.627) (1.085) (1.095) (1.046)SENS × Basket 2 -1.140 -0.639 -1.812 -1.079
(0.624) (1.085) (1.111) (1.016)N 1382 536 424 422R 2 0.078 0.073 0.126 0.088logLik -3632.179 -1441.235 -1093.776 -1074.627AIC 7290.357 2908.469 2213.553 2175.255
Significance thresholds: *** p < 0.001; ** p < 0.01; * p < 0.05.
Table 3: Difference in difference treatment effect estimations, overall and by income class
10

Benchmark NS NM NC SENS NR
LIM 0.15 (3.34) -3.94∗∗∗ (4.91) -2.57∗∗∗ (4.22) -2.31∗∗ (3.9) -1.39† (4.29) -1.44† (3.68)Fat 0.37 (12.83) -6.85∗∗ (11.57) -6.49∗∗ (12.69) -7.25∗∗ (12.46) -2.74† (15.13) -3.65 (12.75)Saturated Fatty Acids -0.01 (9.33) -5.96∗∗∗ (9.92) -5.17∗∗∗ (10.66) -5.3∗∗∗ (8.81) -0.64 (12.43) -3.11∗ (10.52)Sugar 0.23 (23.49) -3.13 (18.97) -1.75 (19.97) -0.9 (22.02) -2.84 (14.06) -3.72 (18.03)Salt 0.02 (0.67) 0.03 (0.71) -0.15 (0.59) -0.14 (0.61) -0.01 (0.61) -0.03 (0.71)Normalized by weight 0.02 (1.04) -1.21∗∗∗ (1.45) -0.85∗∗∗ (1.24) -0.52∗ (1.09) -0.46∗ (0.98) -0.54∗ (1.2)
Wilcoxon Signed Rank tests, significance thresholds: p-values < 0.10 :† < 0.05 :∗; < 0.01 :∗∗; < 0.001 :∗∗∗
Table 4: Robustness checks. Mean (st.dev.) absolute change in indicator, by treatment.
6.2. Economic resultsShopping cost
Nutritional gains might come at an economic cost, which could undermine the long-term impact oflabels, as households would face a trade off between nutritional and economic value of their shopping.We start by testing the difference in the total cost of a basket, across shopping baskets, by treatment(Table 5, first two columns). We can exploit the within-subject variation across baskets, and run aWilcoxon Signed-Rank test (WSRT). The total cost of a basket stayed the same for the Banchmark, NS,NR and SENS treatments, and decreased for NM and NC. Overall spending is not a good indicator,though, since households vary in size and products vary in caloric and nutritional content. To takethis into account, we look at the total amount spent for 2000 Kcal, the recommended daily intake ofan average adult (Table 5, last two columns). Again we can exploit within-subject variation and run aWSRT.
Overall cost Cost of 2000KcalDifference p-value Difference p-value
Benchmark 0.05 0.65 0.09 0.06NutriScore -0.73 0.46 0.39∗∗∗ 0.00NutriMark -0.96∗ 0.03 0.13 0.06NutriCouleur -1.11∗∗∗ 0.00 0.21∗∗ 0.01SENS 0.21 0.90 0.16∗ 0.03NutriRepere 0.54 0.86 0.23∗∗ 0.01
Table 5: Average cost difference and Wilcoxon Signed-Rank test, by treatment.
All labels but NutriMark show a significant increase in the price of a daily calorie intake. The nu-tritional gain comes indeed at an economic cost – with the exception of NutriMark. This increasedcost has an ambiguous effect on the long term impact of labels. If households consume more caloriesthan recommended, a calorie cut would not do harm. If on the other hand the caloric constraint bindsthen households would face a calorie/cost trade off. Our sample households are well above the rec-ommended number of calories. The average number of calories per household member is 2310 Kcal inthe first basket and 2214 in the second (statistically different, Wilcoxon Signed-Rank p-value < 0.001).This is above the 2200 and 2000 Kcal threshold per adult male and female respectively per day. Wecan conclude that the negative impact of labeling on the amount of calories per euro spent should notimpact negatively the long term effect of labels. This should be taken with caution as buying behaviorsare probably not a homothetic projection of eating behaviors.
Besides the bare cost of the shopping basket, our data allow us to directly analyze the relationshipbetween the nutritional gain and the economic cost, across treatments. We can cleanly compare treat-ments using a difference in difference approach as described above. Table 6 reports the results of theestimation
∆costi = β0 + γ(−∆FSAi)× treatment,
in which the between-baskets change in cost, ∆cost, is regressed on the interaction of treatment andthe between-baskets change in FSA score, ∆FSA. The Benchmark treatment acts as baseline, and, toease interpretation, we inverted the sign of ∆FSA so that higher values imply better nutritional content.The coefficients can be directly interpreted as extra Euro spent for each 2000Kcal to obtain a one-point
11

improvement in the score FSA. Only NutriCouleur (12 Euro cents) and more markedly SENS (22 Eurocents) show a significantly higher cost of the nutritional adjustment with respect to the Benchmark.
∆costCoeff. Std. Err. p-value
Intercept 0.10 0.07 0.19∆FSA 0.04 0.04 0.32NutriScore 0.14 0.13 0.28NutriCouleur -0.12 0.12 0.31NutriRepere 0.02 0.11 0.85NutriMark -0.11 0.12 0.36SENS -0.21 0.11 0.07∆FSA × NutriScore 0.02 0.05 0.67∆FSA × NutriCouleur 0.12∗ 0.05 0.02∆FSA × NutriRepere 0.10 0.05 0.06∆FSA × NutriMark 0.04 0.05 0.45∆FSA × SENS 0.22∗∗∗ 0.05 0.00For clarity, the FSA score sign has been inverted
Table 6: Difference in difference estimation of the cost of FSA improvement
Summarising, the cost of 2000Kcal significantly increased in all treatments but NutriMark. Thisprice increase financed differentiated nutritional gains. When interacting the two dimensions mosttreatments do not differ from the Benchmark, with the exception of NutriCouleur and in particular ofSENS, that displays a much higher cost of adjustment – a sign that SENS generated changes towardsmore expensive goods for little nutritional gain.
Income groupsThe impact of nutritional policies on low income households is usually the key to their success,
since nutrition-related problems are often correlated with low income (Drewnowski and Darmon, 2005,Drewnowski and Eichelsdoerfer, 2010, Drewnowski and Specter, 2004). Our recruitment was stratifiedby income. Our subjects can hence be divided into three income groups (< 2000, 2000− 3000, > 3000euro/month disposable income) of roughly equal size (see Table A.11 in Appendix Appendix A for thebreakdown by treatment).
The nutritional impact of the labels is summarized in Table 3 above, right panels, where our differ-ence in difference specification is run separately by income group. The ranking of the point estimates oflabel effects stays constant, but for low and high income groups only NutriScore stays significant. Thisloss of significance is partly due to the lower number of subjects, but since the middle income groupshows significant impacts for NS, NM and NC, it also reflects real differences in the subsamples.
Different behavior by income group could also be reflected in the total cost paid for a basket, andthe cost associated with nutritional gains. We have reason to expect this, since, as noted elsewhere inthe literature (Drewnowski and Eichelsdoerfer, 2010, Kozlova, 2016) low income households buy morecaloric food on average. The average cost over all treatments of 2000Kcal in the first basket is of 4.99 eurofor lower, 5.13 for medium, and 5.57 for higher income subjects (statistically different, Kruskal-Wallistest, p-value< 0.001).
We now replicate the analysis carried out above, broken down by income group. Analogously toTable 5 above, Table 7 shows the between-basket difference in overall cost and in cost by 2000Kcal byincome group. The stars indicate the result of Wilcoxon Signed-Rank Tests (p-values are not reportedfor readability).
The application of labels results, as in the merged sample, of a decrease in overall cost (significantonly for the middle income group) but an increase of the cost for 200OKcal for all groups and treatments,but significant only for NS, across all groups, for NC, medium income, and SENS high income groups.A differential effect by income group is therefore not present: labels induce a smaller or bigger increasein cost irrespective of the income group. Formally testing by means of a Mann-Whitney test over allpairwise combinations of income groups within each treatment never yields significant results (all p-values > 0.13), but for a significant difference between medium and high income for NR (p-value 0.02)
The amount of nutritional adjustment bought by the increased cost is estimated using difference in
12

Overall cost Cost of 2000Kcal< 2000 2000-3000 > 3000 < 2000 2000-3000 > 3000
Benchmark 0.39 0.70 -0.98 -0.133 0.209 0.28*NutriScore -0.72 0.09 -1.57 0.374∗∗ 0.478∗∗∗ 0.316∗
NutriMark -0.44 -2.49∗∗∗ 0.10 0.055 0.121 0.245NutriCouleur -1.68 -1.11∗∗∗ -0.33 0.129 0.358∗ 0.151SENS 0.09 -1.14∗ 1.50 0.227 0.027 0.201∗∗
NutriRepere 2.35 -1.20 0.20 0.306 0.006 0.378Wilcoxon Signed-Rank Test, p-values: ***=0.001, **=0.01, *=0.05
Table 7: Change in cost for 2000Kcal, Basket 2 vs Basket 1, by treatment and income group
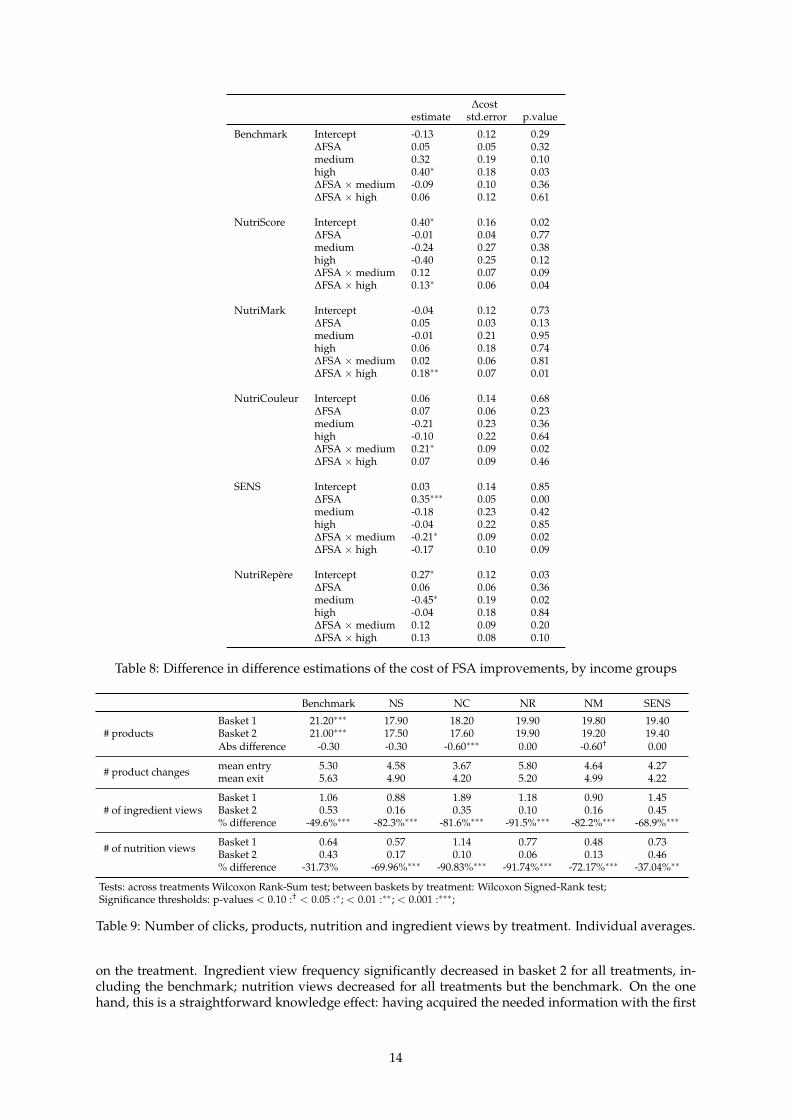
difference in Table 8. Given the complexity of interpreting coefficients from a three-interaction differ-ence in difference regression, we estimate separately for each treatment j:
∆costij = β0 + γ(−∆FSAi)× income,
in which, as above, we inverted the sign of the FSA score so that nutritional improvements have apositive sign. Low income subjects act as reference. As above, the coefficient of the interaction between∆FSA and income group can be directly interpreted as extra Euro for 2000Kcal spent with respect to thelow income group to obtain a one-point FSA score improvement.
While there are no consistent effects of income across the board, there are notable exceptions. WithNutriScore, high income subjects pay an extra 13 euro cents per 2000Kcal for a one-point improvementin FSA score with respect to the low income category. The same is true for NutriMark (18 cents), andfor the medium income group for NutriCouleurs (21 cents). On the other hand, nutritional adjustmentis cheaper for higher income groups with SENS (-21 and -17 cents).
Summarising, while a nutritional adjustment is costly, and lower income groups start with highercaloric intensity, the adjustment induced by the label is by and large not income-specific. For thebest performing labels, NutriScore and NutriMark, the adjustment is indeed cheaper for lower incomegroups. This is in stark contrast with subsidies and tax approaches, for which it has been shown thatlower income groups pay a higher cost as a result of the policy (see Muller et al., 2017).
6.3. Behavioral resultsThe laboratory context and the computerized shopping platform allow us to shed some light on the
behavioral changes that underlie the nutritional and economic results.
Number of productsOver all treatments, the size of neither basket did significantly change across label treatments, with
the exception of the benchmark, that is statistically different from all others. (Table 9, first two rows).This confirms that subjects complied with the instructions. We can exclude boredom as a source ofbias for the second basket. The number of items across baskets was not significantly different for anytreatment but NC and NM (at 10%). Despite the absolute number of items in each basket being mostlyconstant, subjects did perform quite some substitutions. On average, a quarter of the products of eachbasket was substituted between basket 1 and 2 (Table 9, second row). Again, this is an indication thatsubjects did take into account the information displayed by the labels. The fact that even in the baselinetreatment, with no labels, subjects substituted roughly a quarter of all products is a sign that subjectsvaried their choices between the two baskets, by choosing in absence of any change a different menuout of their habits for the second basket.5
Use of back-of-pack informationWe recorded each time subjects visualized the ingredients list or the nutritional table (Table 9, third
and fourth rows). Usually available on the back of packages in grocery shops, subjects could accesssuch information by clicking on a button on the product screens. For basket 1, subjects looked on aver-age between 1 and 2 times at the ingredient lists, and between 0.5 and 1 at nutritional tables, depending
5Note that the number of product changes is not directly comparable to the difference in the average number of products. Thisis because the numbers reported are averages of individual values.
13
∆costestimate std.error p.value
Benchmark Intercept -0.13 0.12 0.29∆FSA 0.05 0.05 0.32medium 0.32 0.19 0.10high 0.40∗ 0.18 0.03∆FSA ×medium -0.09 0.10 0.36∆FSA × high 0.06 0.12 0.61
NutriScore Intercept 0.40∗ 0.16 0.02∆FSA -0.01 0.04 0.77medium -0.24 0.27 0.38high -0.40 0.25 0.12∆FSA ×medium 0.12 0.07 0.09∆FSA × high 0.13∗ 0.06 0.04
NutriMark Intercept -0.04 0.12 0.73∆FSA 0.05 0.03 0.13medium -0.01 0.21 0.95high 0.06 0.18 0.74∆FSA ×medium 0.02 0.06 0.81∆FSA × high 0.18∗∗ 0.07 0.01
NutriCouleur Intercept 0.06 0.14 0.68∆FSA 0.07 0.06 0.23medium -0.21 0.23 0.36high -0.10 0.22 0.64∆FSA ×medium 0.21∗ 0.09 0.02∆FSA × high 0.07 0.09 0.46
SENS Intercept 0.03 0.14 0.85∆FSA 0.35∗∗∗ 0.05 0.00medium -0.18 0.23 0.42high -0.04 0.22 0.85∆FSA ×medium -0.21∗ 0.09 0.02∆FSA × high -0.17 0.10 0.09
NutriRepere Intercept 0.27∗ 0.12 0.03∆FSA 0.06 0.06 0.36medium -0.45∗ 0.19 0.02high -0.04 0.18 0.84∆FSA ×medium 0.12 0.09 0.20∆FSA × high 0.13 0.08 0.10
Table 8: Difference in difference estimations of the cost of FSA improvements, by income groups
Benchmark NS NC NR NM SENS
# productsBasket 1 21.20∗∗∗ 17.90 18.20 19.90 19.80 19.40Basket 2 21.00∗∗∗ 17.50 17.60 19.90 19.20 19.40Abs difference -0.30 -0.30 -0.60∗∗∗ 0.00 -0.60† 0.00
# product changes mean entry 5.30 4.58 3.67 5.80 4.64 4.27mean exit 5.63 4.90 4.20 5.20 4.99 4.22
# of ingredient viewsBasket 1 1.06 0.88 1.89 1.18 0.90 1.45Basket 2 0.53 0.16 0.35 0.10 0.16 0.45% difference -49.6%∗∗∗ -82.3%∗∗∗ -81.6%∗∗∗ -91.5%∗∗∗ -82.2%∗∗∗ -68.9%∗∗∗
# of nutrition views Basket 1 0.64 0.57 1.14 0.77 0.48 0.73Basket 2 0.43 0.17 0.10 0.06 0.13 0.46% difference -31.73% -69.96%∗∗∗ -90.83%∗∗∗ -91.74%∗∗∗ -72.17%∗∗∗ -37.04%∗∗
Tests: across treatments Wilcoxon Rank-Sum test; between baskets by treatment: Wilcoxon Signed-Rank test;Significance thresholds: p-values < 0.10 :† < 0.05 :∗; < 0.01 :∗∗; < 0.001 :∗∗∗;
Table 9: Number of clicks, products, nutrition and ingredient views by treatment. Individual averages.
on the treatment. Ingredient view frequency significantly decreased in basket 2 for all treatments, in-cluding the benchmark; nutrition views decreased for all treatments but the benchmark. On the onehand, this is a straightforward knowledge effect: having acquired the needed information with the first
14
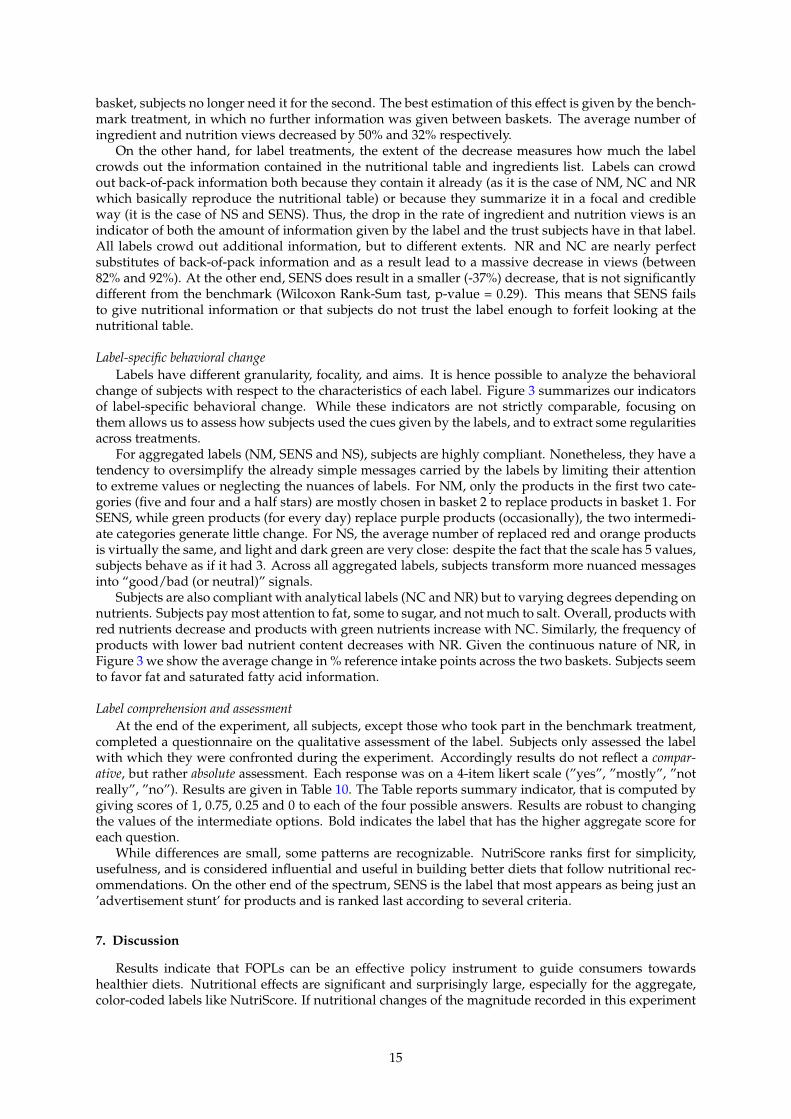
basket, subjects no longer need it for the second. The best estimation of this effect is given by the bench-mark treatment, in which no further information was given between baskets. The average number ofingredient and nutrition views decreased by 50% and 32% respectively.
On the other hand, for label treatments, the extent of the decrease measures how much the labelcrowds out the information contained in the nutritional table and ingredients list. Labels can crowdout back-of-pack information both because they contain it already (as it is the case of NM, NC and NRwhich basically reproduce the nutritional table) or because they summarize it in a focal and credibleway (it is the case of NS and SENS). Thus, the drop in the rate of ingredient and nutrition views is anindicator of both the amount of information given by the label and the trust subjects have in that label.All labels crowd out additional information, but to different extents. NR and NC are nearly perfectsubstitutes of back-of-pack information and as a result lead to a massive decrease in views (between82% and 92%). At the other end, SENS does result in a smaller (-37%) decrease, that is not significantlydifferent from the benchmark (Wilcoxon Rank-Sum tast, p-value = 0.29). This means that SENS failsto give nutritional information or that subjects do not trust the label enough to forfeit looking at thenutritional table.
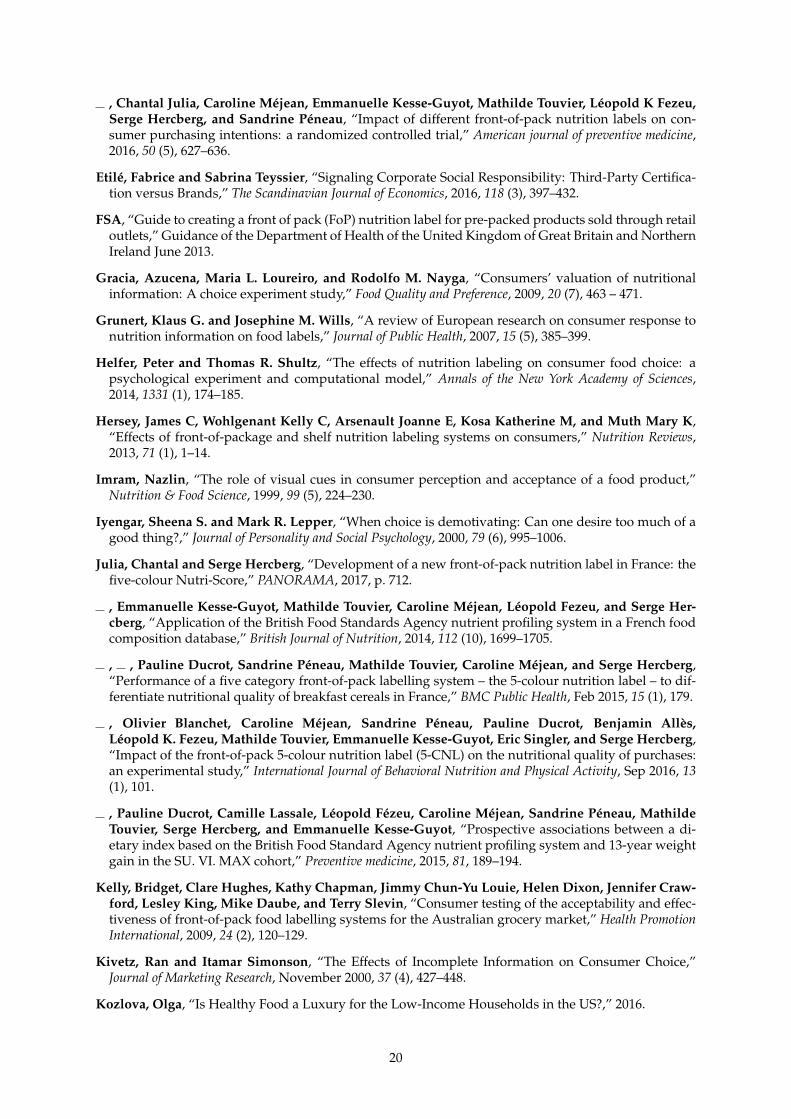
Label-specific behavioral changeLabels have different granularity, focality, and aims. It is hence possible to analyze the behavioral
change of subjects with respect to the characteristics of each label. Figure 3 summarizes our indicatorsof label-specific behavioral change. While these indicators are not strictly comparable, focusing onthem allows us to assess how subjects used the cues given by the labels, and to extract some regularitiesacross treatments.
For aggregated labels (NM, SENS and NS), subjects are highly compliant. Nonetheless, they have atendency to oversimplify the already simple messages carried by the labels by limiting their attentionto extreme values or neglecting the nuances of labels. For NM, only the products in the first two cate-gories (five and four and a half stars) are mostly chosen in basket 2 to replace products in basket 1. ForSENS, while green products (for every day) replace purple products (occasionally), the two intermedi-ate categories generate little change. For NS, the average number of replaced red and orange productsis virtually the same, and light and dark green are very close: despite the fact that the scale has 5 values,subjects behave as if it had 3. Across all aggregated labels, subjects transform more nuanced messagesinto “good/bad (or neutral)” signals.
Subjects are also compliant with analytical labels (NC and NR) but to varying degrees depending onnutrients. Subjects pay most attention to fat, some to sugar, and not much to salt. Overall, products withred nutrients decrease and products with green nutrients increase with NC. Similarly, the frequency ofproducts with lower bad nutrient content decreases with NR. Given the continuous nature of NR, inFigure 3 we show the average change in % reference intake points across the two baskets. Subjects seemto favor fat and saturated fatty acid information.
Label comprehension and assessmentAt the end of the experiment, all subjects, except those who took part in the benchmark treatment,
completed a questionnaire on the qualitative assessment of the label. Subjects only assessed the labelwith which they were confronted during the experiment. Accordingly results do not reflect a compar-ative, but rather absolute assessment. Each response was on a 4-item likert scale (”yes”, ”mostly”, ”notreally”, ”no”). Results are given in Table 10. The Table reports summary indicator, that is computed bygiving scores of 1, 0.75, 0.25 and 0 to each of the four possible answers. Results are robust to changingthe values of the intermediate options. Bold indicates the label that has the higher aggregate score foreach question.
While differences are small, some patterns are recognizable. NutriScore ranks first for simplicity,usefulness, and is considered influential and useful in building better diets that follow nutritional rec-ommendations. On the other end of the spectrum, SENS is the label that most appears as being just an’advertisement stunt’ for products and is ranked last according to several criteria.
7. Discussion
Results indicate that FOPLs can be an effective policy instrument to guide consumers towardshealthier diets. Nutritional effects are significant and surprisingly large, especially for the aggregate,color-coded labels like NutriScore. If nutritional changes of the magnitude recorded in this experiment
15

Figure 3: Label-specific behavioral change16

NS NC NR NM SENS
The nutritional label is...easy to understand 0.94 0.89 0.86 0.91 0.91useful 0.94 0.91 0.88 0.89 0.85precise 0.71 0.76 0.74 0.79 0.57reassuring 0.75 0.70 0.69 0.74 0.67a tip for good choices 0.73 0.65 0.61 0.74 0.65just advertisement 0.30 0.36 0.34 0.34 0.41
The nutritional label does...give information about food items to limit 0.79 0.72 0.74 0.81 0.77give information on the nutritional composition 0.60 0.75 0.68 0.71 0.46show me the nutritional quality 0.79 0.79 0.79 0.79 0.69
The nutritional label will...influence my shopping 0.71 0.65 0.67 0.71 0.63help build a better diet 0.81 0.72 0.73 0.76 0.62help in following health recommendations 0.81 0.76 0.78 0.78 0.71
Table 10: Qualitative label assessment, aggregate score by treatment
were to occur out of the laboratory and survive in the long run, the incidence of nutrition-related dis-eases would be substantially reduced (see epidemiological evidence as detailed in Adriouch et al., 2016,Julia et al., 2015b, Donnenfeld et al., 2015). Moreover, our data show that labels do not have the regres-sive effects that characterize other policies, as taxes and subsidies (as indicated in a similar exercise byMuller et al., 2017). Lower income subjects faced, especially for NutriScore and NutriMark, lower costof nutritional adjustment than medium and high-income subjects. Thus clear, focal, aggregated labelsprove able to generate shopping changes that lead to nutritionally improved choices at low economiccost, especially so for poorer households.
Nonetheless, the external validity of these results needs to be taken with caution. Although wehave endeavored to create a context as close as possible to real purchasing situations (sample of regularshoppers; sale at market prices of a wide range of real products; computer interface very close to on-line or drive-through shopping websites, etc.), a crucial difference with real shopping remains: in oursetting, labels are highly focal. Baskets 1 and 2 only differ in the presence of labels. As a result, the sub-jects’ attention is automatically captured by the labels. While this feature reinforces the internal validityof our experiment, it may exaggerate the absolute impact of labels compared to real-world situationswhere consumer attention is limited. It is therefore possible that we identify here an upper bound ofthe potential effect of the labels.
On the other hand, it is possible to argue otherwise. Labels might in the long run interact with theprocesses of habit formation (Zhen et al., 2011, Daunfeldt et al., 2012, Verplanken and Wood, 2006), andtheir effect might be hence in the long run – that we cannot measure in the lab – larger than in the shortrun. Moreover, choices are usually made in a social context, and the willingness to signal complianceor superior eating habits could be a further force inflating the effects of the label that we do not capturein our laboratory, in which full privacy is granted (Etile and Teyssier, 2016, Teyssier et al., 2014).
A second potential problem with laboratory experiments lies in experimenter demand effect. Theaim of our experiment – testing nutritional label – was transparent to subjects by the time they had tocompose the second basket. Moreover, subjects knew that our study had been financed by the Ministryfor Health, and a heated political debate about labels was running in France roughly in parallel withour experimental campaign. It is possible that subjects could show appreciation to the experimenters’work by complying with the labels. Moreover, politically motivated subjects could have inflated theirreaction to labels to support their political agenda.
Nonetheless, we believe these effect on the one hand to be minor, and on the other hand to be con-trolled by our design. Recent evidence shows that experimental demand effects are likely low (Mum-molo and Peterson, 2017, De Quidt et al., 2017) and crowded out by incentives. In our experiment,subjects faced real purchasing decisions, and they had to leave with the products themselves; the cost ofsending a political message was hence relatively high. Moreover, to the extent that demand effects andself serving bias are not label-specific, their impact is fully controlled for in our difference in differenceestimations.
17

While remaining cautious about the absolute magnitude of the labels’ impact, the experiment’s mag-nifying glasses allow us to emphasize their relative effects. Hence, the key result of our study is thatcolor-coded, aggregate, easy to understand label have stronger nutritional impacts than analytic, de-tailed, numeric labels; the cost of the adjustment is low and does not entail the regressive effects shownto appear with taxes and subsidies. This core result is strong and likely to survive intact outside of thelaboratory.
The best policy tool from a public health perspective appears to be a label that gives synthetic,relevant and focal information, and that can win the trust of consumers. It should be able to stand outamong competing stimuli, to be simple to understand and easy to include in each consumers’ choicefunction; it need not necessarily give accurate nutritional information, as long as it is trusted by theconsumers to do so. If simple and direct labels work best in a laboratory setting in which subjects hadthe time and incentive to ponder their choices, we expect them to a fortiori work in the real world, whereattention, time and cognitive resources are limited.
Disclaimer
Part of the data presented here have already been object of a short publication with strict nutritionalfocus, in French, as Crosetto et al. (2017). This paper, besides being in English, contains an updated andenlarged nutritional analysis, while the economic and behavioral analyses are entirely new.
Acknowledgements
The study was financed by the French Ministry of Health and Social Affairs. The authors would liketo thank Marie Cronfalt-Godet, Mariane Damois, Anne Lacroix, Jean-Loup Dupuis and Sabine Piquefor invaluable technical and logistic support before and during the experiments, as well as participantsto seminars in Parma, Paris, Gottingen, for valuable comments. All errors are the authors’.
References
References
Adriouch, Solia, Chantal Julia, Emmanuelle Kesse-Guyot, Caroline Mejean, Pauline Ducrot, San-drine Peneau, Mathilde Donnenfeld, Melanie Deschasaux, Mehdi Menai, Serge Hercberg et al.,“Prospective association between a dietary quality index based on a nutrient profiling system andcardiovascular disease risk,” European journal of preventive cardiology, 2016, 23 (15), 1669–1676.
Aprile, Maria Carmela, Vincenzina Caputo, and Jr Rodolfo M. Nayga, “Consumers’ valuation of foodquality labels: the case of the European geographic indication and organic farming labels,” Interna-tional Journal of Consumer Studies, 2012, 36 (2), 158–165.
Aschemann-Witzel, Jessica, Klaus G Grunert, Hans CM van Trijp, Svetlana Bialkova, Monique MRaats, Charo Hodgkins, Grazyna Wasowicz-Kirylo, and Joerg Koenigstorfer, “Effects of nutritionlabel format and product assortment on the healthfulness of food choice,” Appetite, 2013, 71, 63–74.
Balcombe, Kelvin, Iain Fraser, and Salvatore Di Falco, “Traffic lights and food choice: A choice exper-iment examining the relationship between nutritional food labels and price,” Food Policy, 2010, 35 (3),211 – 220.
Becker, Mark W., Nora M. Bello, Raghav P. Sundar, Chad Peltier, and Laura Bix, “Front of pack labelsenhance attention to nutrition information in novel and commercial brands,” Food Policy, 2015, 56(Supplement C), 76 – 86.
Berning, Joshua P., Hayley H. Chouinard, and Jill J. McCluskey, “Do Positive Nutrition Shelf LabelsAffect Consumer Behavior? Findings from a Field Experiment with Scanner Data,” American Journalof Agricultural Economics, 2011, 93 (2), 364–369.
Bialkova, Svetlana and Hans van Trijp, “What determines consumer attention to nutrition labels?,”Food Quality and Preference, 2010, 21 (8), 1042 – 1051. Eighth Pangborn Sensory Science Symposium.
18

Borgmeier, Ingrid and Joachim Westenhoefer, “Impact of different food label formats on healthinessevaluation and food choice of consumers: a randomized-controlled study,” BMC public health, 2009, 9(1), 184.
Boztug, Yasemin, Hans Jørn Juhl, Ossama Elshiewy, and Morten Berg Jensen, “Consumer responseto monochrome Guideline Daily Amount nutrition labels,” Food Policy, 2015, 53 (Supplement C), 1 –8.
Cecchini, M and L Warin, “Impact of food labelling systems on food choices and eating behaviours: asystematic review and meta-analysis of randomized studies,” Obesity reviews, 2016, 17 (3), 201–210.
Cooper, SL, FE Pelly, and JB Lowe, “Assessment of the construct validity of the Australian Health StarRating: a nutrient profiling diagnostic accuracy study,” European Journal of Clinical Nutrition, 2017.
Council of the European Union, “Regulation (EU) No 1169/2011,” 2011. http://data.europa.eu/
eli/reg/2011/1169/oj.
Crosetto, Paolo, Anne Lacroix, Laurent Muller, and Bernard Ruffieux, “Modification des achats ali-mentaires en reponse a cinq logos nutritionnels,” Cahiers de Nutrition et de Dietetique, 2017, 5262 (3),107–159.
, Laurent Muller, and Bernard Ruffieux, “Helping consumers with a front-of-pack label: Numbersor colors?: Experimental comparison between Guideline Daily Amount and Traffic Light in a diet-building exercise,” Journal of Economic Psychology, 2016, 55, 30 – 50. Special issue on Food consumptionbehavior: Economic and psychological perspectives.
, , and , “Reponses des consommateurs a trois systemes d’etiquetage nutritionnel face avant,”Cahiers de Nutrition et de Dietetique, 2016, 5011 (3), 111–160.
Darmon, Nicole, Florent Vieux, Matthieu Maillot, Jean-Luc Volatier, and Ambroise Martin, “Nutrientprofiles discriminate between foods according to their contribution to nutritionally adequate diets:a validation study using linear programming and the SAIN, LIM system,” The American journal ofclinical nutrition, 2009, 89 (4), 1227–1236.
Daunfeldt, Sven-Olov, Jonas Nordstrom, and Linda Thunstrom, “Habit formation in food consump-tion,” 2012.
de la Sante Publique, Haut Conseil, “Avis relatif a l’information sur la qualite nutritionnelle des pro-duits alimentaires,” Technical Report, HCSP November 2015.
Donnenfeld, Mathilde, Chantal Julia, Emmanuelle Kesse-Guyot, Caroline Mejean, Pauline Ducrot,Sandrine Peneau, Melanie Deschasaux, Paule Latino-Martel, Leopold Fezeu, Serge Hercberg et al.,“Prospective association between cancer risk and an individual dietary index based on the BritishFood Standards Agency Nutrient Profiling System,” British Journal of Nutrition, 2015, 114 (10), 1702–1710.
Drewnowski, Adam and Nicole Darmon, “The economics of obesity: dietary energy density and en-ergy cost,” The American Journal of Clinical Nutrition, 2005, 82 (1), 265S–273S.
and Petra Eichelsdoerfer, “Can low-income Americans afford a healthy diet?,” Nutrition today, 2010,44 (6), 246.
and SE Specter, “Poverty and obesity: the role of energy density and energy costs,” The AmericanJournal of Clinical Nutrition, 2004, 79 (1), 6–16.
Drichoutis, Andreas C, Panagiotis Lazaridis, Rodolfo M Nayga, Maria Kapsokefalou, and GeorgeChryssochoidis, “A theoretical and empirical investigation of nutritional label use,” The EuropeanJournal of Health Economics, 2008, 9 (3), 293–304.
Ducrot, Pauline, Caroline Mejean, Chantal Julia, Emmanuelle Kesse-Guyot, Mathilde Touvier,Leopold K Fezeu, Serge Hercberg, and Sandrine Peneau, “Objective understanding of front-of-package nutrition labels among nutritionally at-risk individuals,” Nutrients, 2015, 7 (8), 7106–7125.
19
, Chantal Julia, Caroline Mejean, Emmanuelle Kesse-Guyot, Mathilde Touvier, Leopold K Fezeu,Serge Hercberg, and Sandrine Peneau, “Impact of different front-of-pack nutrition labels on con-sumer purchasing intentions: a randomized controlled trial,” American journal of preventive medicine,2016, 50 (5), 627–636.
Etile, Fabrice and Sabrina Teyssier, “Signaling Corporate Social Responsibility: Third-Party Certifica-tion versus Brands,” The Scandinavian Journal of Economics, 2016, 118 (3), 397–432.
FSA, “Guide to creating a front of pack (FoP) nutrition label for pre-packed products sold through retailoutlets,” Guidance of the Department of Health of the United Kingdom of Great Britain and NorthernIreland June 2013.
Gracia, Azucena, Maria L. Loureiro, and Rodolfo M. Nayga, “Consumers’ valuation of nutritionalinformation: A choice experiment study,” Food Quality and Preference, 2009, 20 (7), 463 – 471.
Grunert, Klaus G. and Josephine M. Wills, “A review of European research on consumer response tonutrition information on food labels,” Journal of Public Health, 2007, 15 (5), 385–399.
Helfer, Peter and Thomas R. Shultz, “The effects of nutrition labeling on consumer food choice: apsychological experiment and computational model,” Annals of the New York Academy of Sciences,2014, 1331 (1), 174–185.
Hersey, James C, Wohlgenant Kelly C, Arsenault Joanne E, Kosa Katherine M, and Muth Mary K,“Effects of front-of-package and shelf nutrition labeling systems on consumers,” Nutrition Reviews,2013, 71 (1), 1–14.
Imram, Nazlin, “The role of visual cues in consumer perception and acceptance of a food product,”Nutrition & Food Science, 1999, 99 (5), 224–230.
Iyengar, Sheena S. and Mark R. Lepper, “When choice is demotivating: Can one desire too much of agood thing?,” Journal of Personality and Social Psychology, 2000, 79 (6), 995–1006.
Julia, Chantal and Serge Hercberg, “Development of a new front-of-pack nutrition label in France: thefive-colour Nutri-Score,” PANORAMA, 2017, p. 712.
, Emmanuelle Kesse-Guyot, Mathilde Touvier, Caroline Mejean, Leopold Fezeu, and Serge Her-cberg, “Application of the British Food Standards Agency nutrient profiling system in a French foodcomposition database,” British Journal of Nutrition, 2014, 112 (10), 1699–1705.
, , Pauline Ducrot, Sandrine Peneau, Mathilde Touvier, Caroline Mejean, and Serge Hercberg,“Performance of a five category front-of-pack labelling system – the 5-colour nutrition label – to dif-ferentiate nutritional quality of breakfast cereals in France,” BMC Public Health, Feb 2015, 15 (1), 179.
, Olivier Blanchet, Caroline Mejean, Sandrine Peneau, Pauline Ducrot, Benjamin Alles,Leopold K. Fezeu, Mathilde Touvier, Emmanuelle Kesse-Guyot, Eric Singler, and Serge Hercberg,“Impact of the front-of-pack 5-colour nutrition label (5-CNL) on the nutritional quality of purchases:an experimental study,” International Journal of Behavioral Nutrition and Physical Activity, Sep 2016, 13(1), 101.
, Pauline Ducrot, Camille Lassale, Leopold Fezeu, Caroline Mejean, Sandrine Peneau, MathildeTouvier, Serge Hercberg, and Emmanuelle Kesse-Guyot, “Prospective associations between a di-etary index based on the British Food Standard Agency nutrient profiling system and 13-year weightgain in the SU. VI. MAX cohort,” Preventive medicine, 2015, 81, 189–194.
Kelly, Bridget, Clare Hughes, Kathy Chapman, Jimmy Chun-Yu Louie, Helen Dixon, Jennifer Craw-ford, Lesley King, Mike Daube, and Terry Slevin, “Consumer testing of the acceptability and effec-tiveness of front-of-pack food labelling systems for the Australian grocery market,” Health PromotionInternational, 2009, 24 (2), 120–129.
Kivetz, Ran and Itamar Simonson, “The Effects of Incomplete Information on Consumer Choice,”Journal of Marketing Research, November 2000, 37 (4), 427–448.
Kozlova, Olga, “Is Healthy Food a Luxury for the Low-Income Households in the US?,” 2016.
20

Loo, Ellen J. Van, Vincenzina Caputo, Rodolfo M. Nayga, Jean-Francois Meullenet, and Steven C.Ricke, “Consumers’ willingness to pay for organic chicken breast: Evidence from choice experiment,”Food Quality and Preference, 2011, 22 (7), 603 – 613.
Lusk, Jayson L and Jason F Shogren, Experimental auctions: Methods and applications in economic andmarketing research, Cambridge University Press, 2007.
Malhotra, Naresh K., “Information Load and Consumer Decision Making,” Journal of Consumer Re-search, March 1982, 8 (4), 419–430. 00581.
Marchi, Elisa De, Vincenzina Caputo, Rodolfo M. Nayga, and Alessandro Banterle, “Time prefer-ences and food choices: Evidence from a choice experiment,” Food Policy, 2016, 62 (Supplement C), 99– 109.
Ministere des Affaires Sociales et de la Sante, Fonds Francais pour l’ Alimentation et la Sante, “Eval-uation ex ante, en conditions reeelles d’achat, de divers systemes graphiques d’eetiquetage nutrition-nel – Rapport final du comite scientifique,” March 2017.
Mørk, Trine, Klaus G Grunert, Morten Fenger, Hans Jørn Juhl, and George Tsalis, “An analysis ofthe effects of a campaign supporting use of a health symbol on food sales and shopping behaviour ofconsumers,” BMC public health, 2017, 17 (1), 239.
Muller, L. and M. Prevost, “What cognitive sciences have to say about the impacts of nutritional la-belling formats,” Journal of Economic Psychology, 2016, 55, 17 – 29. Special issue on Food consumptionbehavior: Economic and psychological perspectives.
Muller, Laurent and Bernard Ruffieux, “Modification des achats en reponse a l’apposition de differentslogos d’evaluation nutritionnelle sur la face avant des emballages,” Cahiers de Nutrition et de Dietetique,2012, 47 (4), 171 – 182.
, Anne Lacroix, Jayson L. Lusk, and Bernard Ruffieux, “Distributional Impacts of Fat Taxes and ThinSubsidies,” The Economic Journal, feb 2017, 127 (604), 2066–2092.
Mummolo, Jonathan and Erik Peterson, “Demand Effects in Survey Experiments: An Empirical As-sessment,” 2017.
Neal, Bruce, Michelle Crino, Elizabeth Dunford, Annie Gao, Rohan Greenland, Nicole Li, JudithNgai, Cliona Ni Mhurchu, Simone Pettigrew, Gary Sacks et al., “Effects of Different Types of Front-of-Pack Labelling Information on the Healthiness of Food Purchases—A Randomised ControlledTrial,” Nutrients, 2017, 9 (12), 1284.
Norden, “The Keyhole: Healthy choices made easy,” Technical Report, Nordic Cooperation – NordicCouncil of Ministries 2010.
Noussair, Charles, Stephane Robin, and Bernard Ruffieux, “Do Consumers Really Refuse to Buy Ge-netically Modified Food?,” The Economic Journal, 2004, 114 (492), 102–120.
Nugier, A, AJ Serry, and VN Thanh, “Systeme d’information nutritionnelle a cinq couleurs sur la faceavant des emballages alimentaires: comparaison de trois formats de logo,” Bulletin EpidemiologiqueHebdomadaire, 2016, 34, 598–607.
of Australia, Commonwealth, “Proposed Front-of-pack food labeling designs: qualitative research otu-comes,” Technical Report, Hall & Partners Open Mind 2013.
, “Proposed Front-of-pack food labeling designs: quatitative research otucomes,” Technical Report,Hall & Partners Open Mind 2013.
of Australia, National Heart Foundation, “The Hearth Foundation Tick,” Technical Report, NationalHeart Foundation of Australia 1989.
on behalf of the Central Office of Information, Food Standards Agency Synovate, “QuantitativeEvaluation of Alternative Food Signposting Concepts: Report of Findings.,” Technical Report, WestMalling, UK: Synovate 2005.
21

Quidt, Jonathan De, Johannes Haushofer, and Christopher Roth, “Measuring and Bounding Experi-menter Demand,” Technical Report, National Bureau of Economic Research 2017.
Rao, Mayuree, Ashkan Afshin, Gitanjali Singh, and Dariush Mozaffarian, “Do healthier foods anddiet patterns cost more than less healthy options? A systematic review and meta-analysis,” BMJ Open,2013, 3 (12).
Rayner, M, Peter Scarborough, and Tim Lobstein, “The UK Ofcom Nutrient Profiling Model: Defining‘healthy’and ‘unhealthy’foods and drinks for TV advertising to children,” London: OfCom, 2009.
Rayner, Mike, Peter Scarborough, and Carol Williams, “The origin of Guideline Daily Amounts andthe Food Standards Agency’s guidance on what counts as ‘a lot’and ‘a little’,” Public Health Nutrition,2004, 7 (4), 549–556.
Republique, Francaise, “Arrete du 31 octobre 2017 fixant la forme de presentation complementaire ala declaration nutritionnelle recommandee par l’Etat en application des articles L. 3232-8 et R. 3232-7du code de la sante publique.,” Journal Officiel de la Republique Francaise., 3 November 2017, 0257 (16).
Scheibehenne, Benjamin, Linda Miesler, and Peter M Todd, “Fast and frugal food choices: Uncover-ing individual decision heuristics,” Appetite, 2007, 49 (3), 578–589.
Schulte-Mecklenbeck, Michael, Matthias Sohn, Emanuel de Bellis, Nathalie Martin, and Ralph Her-twig, “A lack of appetite for information and computation. Simple heuristics in food choice,” Appetite,2013, 71, 242 – 251.
Schwarz, Barry, “The paradox of choice: why more is less: how the culture of abundance robs us ofsatisfaction,” 2004.
Shogren, Jason F, The Oxford handbook of the economics of food consumption and policy, Oxford UniversityPress, 2011.
Teyssier, Sabrina, Fabrice Etile, and Pierre Combris, “Social-and self-image concerns in fair-trade con-sumption,” European Review of Agricultural Economics, 2014, 42 (4), 579–606.
Tharrey, Marion, Matthieu Maillot, Veronique Azaıs-Braesco, and Nicole Darmon, “From theSAIN,LIM system to the SENS algorithm: a review of a French approach of nutrient profiling,” TheProceedings of the Nutrition Society, 2017, pp. 1–10 (First view). Proceedings of The Nutrition SocietySummer Meeting 2016 held at University College, Dublin on 11–14 July 2016 Conference on ‘Newtechnology in nutrition research and practice’ Nutrient profiling as a tool to respond to public healthneeds Uses of nutrient profiling to address public health needs: from regulation to reformulation.
Variyam, Jayachandran N., “Do nutrition labels improve dietary outcomes?,” Health Economics, 2008,17 (6), 695–708.
Verplanken, Bas and Wendy Wood, “Interventions to Break and Create Consumer Habits,” Journal ofPublic Policy & Marketing, 2006, 25 (1), 90–103.
Vlaeminck, Pieter, Ting Jiang, and Liesbet Vranken, “Food labeling and eco-friendly consumption:Experimental evidence from a Belgian supermarket,” Ecological Economics, 2014, 108, 180–190.
Volkova, Ekaterina and Cliona Ni Mhurchu, “The influence of nutrition labeling and point-of-purchase information on food behaviours,” Current obesity reports, 2015, 4 (1), 19–29.
Vyth, Ellis L, Ingrid H M Steenhuis, Hella E Brandt, Annet J C Roodenburg, Johannes Brug, and Ja-cob C Seidell, “Methodological quality of front-of-pack labeling studies: a review plus identificationof research challenges,” Nutrition reviews, 2012, 70, 709–20.
, Ingrid HM Steenhuis, Jessica A Vlot, Anouk Wulp, Meefa G Hogenes, Danielle H Looije, Jo-hannes Brug, and Jacob C Seidell, “Actual use of a front-of-pack nutrition logo in the supermarket:consumers’ motives in food choice,” Public Health Nutrition, 11 2010, 13, 1882–1889.
Waterlander, Wilma E, Ingrid HM Steenhuis, Michiel R de Boer, Albertine J Schuit, and Jacob CSeidell, “Introducing taxes, subsidies or both: the effects of various food pricing strategies in a web-based supermarket randomized trial,” Preventive medicine, 2012, 54 (5), 323–330.
22

, , , , and , “Effects of different discount levels on healthy products coupled with a healthychoice label, special offer label or both: results from a web-based supermarket experiment,” Interna-tional Journal of Behavioral Nutrition and Physical Activity, 2013, 10 (1), 59.
Waterlander, Wilma Elzeline, Cliona Ni Mhurchu, and Ingrid HM Steenhuis, “Effects of a price in-crease on purchases of sugar sweetened beverages. Results from a randomized controlled trial,” Ap-petite, 2014, 78, 32–39.
, Yannan Jiang, Ingrid Hendrika Margaretha Steenhuis, and Cliona Ni Mhurchu, “Using a 3Dvirtual supermarket to measure food purchase behavior: a validation study,” Journal of medical Internetresearch, 2015, 17 (4).
Withrow, D. and D. A. Alter, “The economic burden of obesity worldwide: a systematic review of thedirect costs of obesity,” Obesity Reviews, 2011, 12 (2), 131–141.
Zhen, Chen, Michael K. Wohlgenant, Shawn Karns, and Phillip Kaufman, “Habit Formation andDemand for Sugar-Sweetened Beverages,” American Journal of Agricultural Economics, 2011, 93 (1),175–193.
23

Appendix A. Subject sample properties and randomization checks
N % NS NC NR NM SENS Base χ2
Total number of subjects 691 0 115 115 109 119 111 122
gender male 140 20.2 22.4 19.0 20.9 20.2 16.2 22.1 0.87female 554 79.8 77.6 81.0 79.1 79.8 83.8 77.9
age
<30 141 20.3 24.1 20.7 18.2 18.5 19.8 20.5
0.4930-44 352 50.7 44.0 45.7 55.5 52.1 52.3 54.945-59 187 27.0 29.3 28.5 25.5 29.4 26.1 23.0>60 14 2.0 2.6 5.2 0.9 0 1.8 1.6
incomelow 270 38.9 37.1 40.5 37.3 42.0 36.0 40.2
0.99middle 212 30.6 31.0 30.2 31.8 31.9 29.7 28.7high 212 30.6 31.9 29.3 30.9 26.1 34.2 31.2
education<high school 198 28.5 22.4 28.5 33.6 24.4 29.7 32.8
0.35high school 94 13.5 17.2 15.5 14.6 16.0 8.1 9.8university or > 402 57.9 60.3 56.0 51.8 59.7 62.2 57.4
profession
handicraft 14 2.0 2.6 0 0.9 1.7 4.5 2.5
0.01
managers 98 14.1 13.8 11.2 20.0 8.4 12.6 18.9white collar 436 62.8 65.5 67.2 56.4 74.0 59.5 54.1blue collar 21 3.0 0.9 0 7.3 1.7 4.5 4.1professionals 83 12.0 12.1 12.9 12.7 7.6 15.3 11.5no 42 6.1 5.2 8.6 2.7 6.7 3.6 9.0
occupation
unemployed 72 10.4 12.1 10.3 10.9 10.9 10.8 7.4
0.81
student 28 4.0 3.5 5.2 3.6 5.9 2.7 3.3housewife 65 9.4 5.2 11.2 9.1 13.5 4.5 12.3looking for 5 0.7 0.9 0.9 0.9 0.8 0 0.8retired 7 1.0 1.7 1.7 0 0 0.9 1.6working 517 74.5 76.7 70.7 75.5 68.9 81.1 74.6
family
couple with children 437 63.0 63.8 51.7 65.5 63.9 65.8 67.2
0.47couple without children 59 8.5 9.5 14.7 7.3 6.7 8.1 4.9alone with children 143 20.6 20.7 21.6 20.0 22.7 18.9 19.7alone without children 55 7.9 6.0 12.1 7.3 6.7 7.2 8.2
Table A.11: Demographics of the sample and distribution across treatments
24

Appendix B. Robustness checks
LIM Salt Sugar Fat SFA WeightIntercept 17.964 *** 2.114 *** 71.331 *** 41.489 *** 19.724 *** 1.609 ***
(0.517) (0.084) (2.915) (1.690) (1.157) (0.438)Caddy 2 0.146 0.023 0.233 0.368 -0.014 0.022
(0.731) (0.119) (4.122) (2.390) (1.636) (0.249)NutriScore -0.732 -0.097 -9.391 * -4.772 * -1.857 -0.257
(0.742) (0.121) (4.184) (2.427) (1.661) (0.254)NutriMark -0.258 0.050 -8.501 * 0.953 1.584 0.070
(0.735) (0.120) (4.148) (2.406) (1.647) (0.252)NutriCouleur -1.002 -0.236 -7.879 -3.746 0.176 -0.314
(0.742) (0.121) (4.184) (2.427) (1.661) (0.255)NutriRepere -0.853 0.186 -4.276 -1.186 -0.842 -0.203
(0.752) (0.123) (4.243) (2.461) (1.684) (0.257)SENS -1.048 0.110 -11.976 ** -2.249 -0.744 -0.372
(0.748) (0.122) (4.223) (2.449) (1.676) (0.257)NutriScore × Basket 2 -4.086 *** 0.010 -3.366 -7.220 * -5.949 * -1.231 ***
(1.049) (0.171) (5.917) (3.432) (2.349) (0.357)NutriMark × Basket 2 -2.719 ** -0.172 -1.982 -6.858 * -5.159 * -0.868 *
(1.040) (0.169) (5.866) (3.402) (2.329) (0.354)NutriCouleur × Basket 2 -2.457 * -0.165 -1.137 -7.616 * -5.291 * -0.542
(1.049) (0.171) (5.917) (3.432) (2.349) (0.358)NutriRepere × Basket 2 -1.584 -0.057 -3.955 -4.023 -3.095 -0.560
(1.063) (0.173) (6.001) (3.480) (2.382) (0.362)SENS × Basket 2 -1.534 -0.029 -3.071 -3.111 -0.630 -0.478
(1.058) (0.173) (5.972) (3.463) (2.371) (0.360)N 1382 1380 1382 1382 1382 1380R 2 0.060 0.028 0.019 0.043 0.039 0.133logLik -4361.625 -1849.324 -6752.937 -5999.972 -5476.186 -2860.267AIC 8749.249 3724.649 13531.875 12025.944 10978.373 5778.534
*** p < 0.001; ** p < 0.01; * p < 0.05.
Table B.12: Difference in difference robustness regression: all alternative indicators and normalizations
25

Score FSAAll Low income Middle income High income
Intercept 5.445 *** 5.713 *** 5.909 *** 0.207(0.736) (1.103) (1.379) (1.899)
Basket 2 0.115 0.064 0.440 -0.117(0.418) (0.710) (0.742) (0.688)
NutriScore -0.259 -0.372 0.400 -0.598(0.427) (0.749) (0.750) (0.707)
NutriMark 0.091 0.188 0.782 -0.249(0.423) (0.714) (0.739) (0.739)
NutriCouleur -0.480 -0.299 -0.430 -0.660(0.429) (0.736) (0.755) (0.730)
NutriRepere -0.384 -1.051 0.488 -0.280(0.432) (0.757) (0.757) (0.713)
SENS -0.478 -1.556 * 0.502 -0.081(0.431) (0.762) (0.761) (0.695)
NutriScore × Basket 2 -2.766 *** -2.584 * -3.294 ** -2.487 *(0.600) (1.038) (1.041) (0.986)
NutriMark × Basket 2 -1.974 *** -1.916 -3.049 ** -0.832(0.595) (0.999) (1.028) (1.026)
NutriCouleur × Basket 2 -1.513 * -1.104 -2.274 * -1.316(0.600) (1.020) (1.049) (1.000)
NutriRepere × Basket 2 -0.924 -0.705 -1.485 -0.645(0.609) (1.059) (1.049) (1.000)
SENS × Basket 2 -1.140 -0.639 -1.812 -1.079(0.606) (1.059) (1.065) (0.972)
Middle income 0.222(0.253)
High income -0.612 *(0.278)
Age 30 -44 0.159 0.562 0.233 -0.782(0.257) (0.403) (0.450) (0.588)
Age 45 -59 -0.777 ** -0.650 -0.887 -1.294 *(0.281) (0.449) (0.513) (0.618)
Age > 60 -2.555 ** -2.646 -4.625 ** -1.101(0.917) (1.497) (1.677) (1.633)
Family size 0.171 * 0.108 -0.022 1.002 ***(0.082) (0.113) (0.194) (0.202)
# of children 0.070 -0.001 0.526 * -0.594 **(0.116) (0.196) (0.218) (0.213)
Body Mass Index -0.010 0.014 -0.054 0.007(0.018) (0.029) (0.033) (0.037)
Worker 0.236 -0.464 0.687 2.874 *(0.334) (0.494) (0.556) (1.124)
Unemployed 0.934 * -0.035 1.252 4.050 **(0.412) (0.653) (0.665) (1.334)
Student -1.371 * -2.278 ** 1.896 6.420 **(0.565) (0.737) (1.395) (2.393)
Retired 1.631 2.317 2.894 2.233(1.273) (2.335) (2.768) (2.240)
High school degree -0.366 -0.383 -1.202 * 0.411(0.295) (0.475) (0.525) (0.606)
University degree -0.384 -0.641 -0.748 0.045(0.221) (0.364) (0.398) (0.440)
N 1382 536 424 422R 2 0.142 0.141 0.225 0.194logLik -3582.712 -1420.807 -1068.250 -1048.540AIC 7223.424 2895.613 2190.500 2151.080
*** p < 0.001; ** p < 0.01; * p < 0.05.
Table B.13: Difference in difference FSA score estimation, overall and by income class, with controls
26

Appendix C. Experimental instructions
The original instructions were made up of a Power Point slideshow, using several visual cues as tomake them appealing and easy to understand for the varied and heterogeneous population of subjectswe faced. The French version of the slideshow is available here. Here we provide a translation of all thewords, plus the most relevant pictures.
General instructions
Welcome. This experiment is run by the Grenoble Applied Economics Laboratory (GAEL), part of theUniversity Grenoble-Alpes (UGA). This study is financed by the Ministry for Social Affairs, Health andWomens’ Rights.The study is about individual food consumption behavior. Instructions will be given to you as we goalong. During the whole session, you will have to take some simple decisions. Nonetheless, should youhave any difficulty or misunderstandings, do not hesitate to ask.In order to protect your privacy during the session and in data analysis, you have been assigned acode. No data allowing us to identify you will be collected. Thus, it will be impossible for us to linkyour replies and decisions to your name. Data will be kept for statistical analysis and publication, butalways in their anonymous format.Communication between participants is not allowed, nor are comments about what should or shouldnot be done during the experiment. Keep concentrated on your own computer screen and keep silencefor the whole session. If you have a question, feel free to raise your hands and ask anytime.You will see on your desk an envelop containing 32ein cash, rewarding you for your participation. Thissum is yours to keep. During the experiment, you will have the opportunity to buy some products. Itis important that you understand why and how you will be able to shop.We ask you to shop because we want to observe your actual shopping behavior and not just your shop-ping intentions. As behavioral scientists, we know that intentions can differ from actual purchasingdecisions. Our guiding principle is simple: put you in a real shopping situation. You will have to buysome products, that you will have chosen yourself. In no circumstance our research group makes profitsout of the eventual sales. The products will be sold at supermarket prices, as recorded by us on October5th, 2016. You will discover these prices later in the experiment.This study is composed of several phases. After the start of each phase, instructions for the followingphase will be given. A new phase will start only after all participants have completed the previousphase. This session will not exceed one hour and thirty minutes.
Phase 1: food shopping
During this first phase, you will be shopping for food. You will have to compose your basket in thesame way you would do in a supermarket. In order to observe your real shopping behavior, yourdecisions will have real implications (namely, the purchase of some products).Imagine you are in the only shop open today. Please do not take into account the shop you usually goto. You will have to shop for the coming 2 days (no week-end) for your household, choosing along theproducts available in our shop. Please think that your cupboards at home are empty. Think that theycontain only some basic products: butter, flour, oil, spices, coffee, tea, seasoning, water, alcohol, wine,sugar, vinegar, sauces. These products will not be on sale here.In order to fill your shopping basket, you will be able to choose among 290 food products, presentedto you in the paper catalogue that was just handed over to you6. Each page of the catalog containsproducts of a specific category. Each category is composed of 3 to 9 products. A table of contents isavailable at the beginning of the catalog.On the screen, you will see this page:
6[see Appendix D for a sample page of the catalog in each treatment]
27

In order to select a product and display it on the screen, you can use the barcode scanner available onthe desk in front of you. Pass the scanner over the barcode of the product and press the button. Shouldyou meet any difficulty with the scanner, you can manually type the 4-digit product code in the searchbar and click on ’search’.Once you selected the product, it will be shown on screen as seen in a supermarket shelf, showing itsfront of pack.
You will see price, price per kilogram or liter, and its weigh or volume. The prices shown have beenrecorded in a Grenoble area supermarket on October 5th, 2016. You can click on the buttons ”Ingredi-ents” and ”Nutritional values” to access the information that you normally find on the back of pack.If you click on ”Ingredients” you will access the substances or food additives used in the production ofthat food item. These ingredients are present in the final product in a more or less transformed state.On your screen (as on backs of pack), ingredients are ranked according to their relative importance inthe product recipe. As the lax dictates, the ingredients potentially resulting in intolerances or allergiesmust be highlighted. Here, they will be written in ALL CAPS.If you click on ”Nutritional values” on your screen (as on backs of pack) you will find the nutritionalvalues, expressed for 100 grams of product. These values will not be available for some products (fruits,vegetables...), as for these products the law does not impose their display.Once you have selected the product you are free to choose a quantity, as you would do in normalshopping. Once you have chosen its quantity, you can add it to the basket by clicking on ”add tobasket”. Even after you have added the product to your basket you can change its quantity using thebuttons ”+” and ”-” and then confirming with the button ”Change quantity”. You can remove theproduct from the basket clicking on ”Remove from basket”. Once you have finished to fill your basket,you can click on ”I finished my basket”.Your decisions will have real implications. In order to observe your actual shopping behavior, yourdecisions will have real implication (namely, the purchase of some products). This will be done in thefollowing way:
• in another room we store about one quarter of the 290 products displayed in the catalog. In ordernot to influence your choices, you will not know which products we store or not.
• at the end of the experiment we will identify the products of your basket that we stock; in alllikelihood, a quarter of the products you chose.
28

• you will have to buy these products. For example, if your basket contains 20 products, you willlikely buy 4 or 5 of them, for a cost of some Euro. You will leave the room with these products.Please note that the products are sold at the prices shown on the catalog.
Any questions?[During the shopping task, the overhead projectors showed a reminder of the main features of the task. This is itstext:] Reminder: you shop for the next 2 days for your household. YOu are free to choose the productsand quantity you prefer; to spend the amount you prefer. You can retrieve the informations that youwould find on the backs of packs, namely ingredients and nutritional information, on screen.
Phase 2: food shopping, a second basket
Your task. We ask you now to compose a second shopping basket. We remind you that you have accessto the nutritional values and ingredients of the products by clicking on the corresponding buttons belowthe product image.[all treatments but Baseline: we distribute now a new catalog. It contains the same products. Each of theproducts now features a nutritional label. We will explain the label next.]Monetary implications. Just one of the two baskets will be taken into account for the product purchasesat the end of the experiment. The binding basket will be randomly drawn.Why a second basket? In order to help you in making better health choices when shopping for food, theHealth Ministry is planning to introduce a graphical representation aimed at simplifying the display ofnutritional values. Within this plan, our study has the aim of testing the impact of different graphicalrepresentation systems. The principle of our test consists in adding (or not) on the products’ front ofpack a graphical representation that might be understood with a quick look.[Baseline:] We test with you the impact of repetition absent any graphical representation. You belong tothe benchmark group.[All other treatments:] We test with you the impact of the [name of the label] system.[For all treatments but baseline, at this point we distributed to the subjects one-page description of the labelingscheme applied in their respective treatment. We projected the content of this leaflet overhead on two slides,and read aloud its content. Any questions were answered before moving on to the second shopping basket. Theone-page descriptions are displayed next ]Any questions?[During the shopping task, the overhead projectors showed a reminder of the main features of the task. This is itstext:] Reminder: you shop for the next 2 days for your household. You are free to choose the productsand quantity you prefer; to spend the amount you prefer. You can retrieve the informations that youwould find on the backs of packs, namely ingredients and nutritional information, on screen.
Ending
Phase 3: questionnaire and end of the experiment.You will first be given two short questionnaires to fill in. Once the questionnaire filled, you will be askedto fill in the receipt for payment. Once everyone will be finished, an experimenter will call your code,and you will proceed to another room to purchase the food products of the randomly chosen basket.Thank you for your participation.
29

Q
u’es
tce
que
leN
utri
Coul
eurs
?Ce
tét
ique
tage
est
une
repr
ésen
tatio
ngr
aphi
que
mise
aupo
int
par
des
expe
rtse
nnu
triti
onqu
iper
met
deco
nnaî
tre
:-l
’app
ort
ennu
trim
ents
àlim
iter
dans
notr
eal
imen
tatio
n,en
gram
mes
(g)
parp
ortio
n,-
laco
ntrib
utio
nde
ces
mêm
esnu
trim
ents
aux
appo
rts
quot
idie
nsde
réfé
renc
e(e
n%
).U
neco
uleu
res
tas
soci
éeà
chac
unde
ces
nutr
imen
tsen
fonc
tion
dele
urs
appo
rts
par
port
ion
(sil
apo
rtio
nes
tin
férie
ure
à10
0g,l
esco
uleu
rsso
ntdo
nnée
spou
r100
gde
prod
uit)
:
Une
indi
catio
n de
por
tion
Une
por
tion
du
prod
uit 1
con
tient
2,
3 g
de se
l.
Sila
tene
ur e
st é
levé
eSi
la te
neur
est
moy
enne
Sila
tene
ur e
st fa
ible
L’én
ergi
e es
t ind
iqué
e en
bla
nc
Ce
qu’il
faut
com
pren
dre
Nut
riCo
uleu
rspe
rmet
deco
mpa
rerl
esap
port
snut
ritio
nnel
sdes
prod
uits
parp
ortio
n.
Une
por
tion
du p
rodu
it 1
appo
rte
345
Kcal
.
Les c
oule
urs i
ndiq
uent
par
ex
empl
e qu
e po
ur u
ne
port
ion
du p
rodu
it 2,
la
tene
ur e
n se
l est
moy
enne
et
la te
neur
en
sucr
es e
st
faib
le.
Les c
oule
urs i
ndiq
uent
aus
si qu
e le
s ten
eurs
en
acid
es g
ras s
atur
és
et e
n se
l du
prod
uit 2
sont
infé
rieur
es à
cel
les d
u pr
odui
t 1 (o
rang
e po
ur le
pro
duit
2 co
ntre
roug
e po
ur le
pro
duit
1).
Prod
uit 1
Prod
uit 2
Une
por
tion
du
prod
uit 1
re
prés
ente
38%
des
ap
port
s de
réfé
renc
e en
sel s
ur
1 jo
urné
e.
Figu
reC
.4:O
nepa
gela
bele
xpla
nati
on:N
utri
Cou
leur
30

Q
u’es
tce
que
leN
utri-
Scor
e?
Cet
étiq
ueta
gevo
usin
form
esu
rla
qual
iténu
triti
onne
lled’
unpr
odui
tgr
âce
àun
ele
ttre
asso
ciée
àun
eco
uleu
r.Po
urch
aque
prod
uit,
les
cher
cheu
rsen
sant
épu
bliq
ueon
tmis
aupo
intu
nsc
ore
nutr
ition
nelq
uipr
end
enco
mpt
ela
tene
uren
élém
ents
àfa
voris
er(fi
bres
,pro
téin
es,f
ruits
etlé
gum
es)e
ten
élém
ents
àlim
iter(
éner
gie,
acid
esgr
assa
turé
s,su
cre
etse
l).
Chaq
uepr
odui
test
posi
tionn
ésu
rune
éche
lleà
5ni
veau
xal
lant
dupr
odui
t:–
Lepl
usfa
vora
ble
surl
epl
annu
triti
onne
l(cl
assé
A/v
ertf
oncé
)–
Aupr
odui
tle
moi
nsfa
vora
ble
surl
epl
annu
triti
onne
l(cl
assé
E/o
rang
efo
ncé)
Ce
qu’il
faut
com
pren
dre
1 lo
go e
t 5 n
ivea
ux d
iffér
ents
de
qual
ité n
utrit
ionn
elle
des
pro
duits
:
Le p
rodu
it 1
est c
lass
é B
car i
l co
ntie
nt u
ne q
uant
ité in
tére
ssan
te d
e lé
gum
es e
t de
fibre
s, m
ais a
ussi
parc
e qu
’il co
ntie
nt p
eu d
’élé
men
ts à
lim
iter c
omm
e le
sel o
u le
s aci
des
gras
satu
rés.
Le p
rodu
it 2
est c
lass
é D
car i
l est
pl
us ca
loriq
ue q
ue le
pro
duit
1,
cont
ient
dav
anta
ge d
e se
l et
d’ac
ides
gra
s sat
urés
et m
oins
de
légu
mes
et d
e fib
res.
+-
Plu
s fa
vora
ble
Mo
ins
favo
rab
leEc
helle
de
qual
ité n
utrit
ionn
elle
Prod
uit 1
Prod
uit 2
Figu
reC
.5:O
nepa
gela
bele
xpla
nati
on:N
utri
Scor
e
31

Q
u’es
tce
que
leN
utri
Mar
k?Ce
tét
ique
tage
,dé
jàte
sté
enAu
stra
lieet
enN
ouve
lle-Z
élan
de,
vous
info
rme
surl
aqu
alité
nutr
ition
nelle
d’un
prod
uitd
ede
uxfa
çons
:-D
efa
çon
synt
hétiq
ue:c
haqu
epr
odui
test
glob
alem
entp
ositi
onné
paru
nch
iffre
alla
ntde
0,5
à5
asso
cié
àde
sét
oile
s.Le
spr
odui
tsle
spl
usfa
vora
bles
sur
lepl
annu
triti
onne
lon
t5
étoi
les.
Les
prod
uits
les
moi
nsfa
vora
bles
surl
epl
annu
triti
onne
lont
0,5
étoi
les.
-De
faço
ndé
taill
ée:
les
donn
ées
sur
l’éne
rgie
,le
sm
atiè
res
gras
ses,
les
acid
esgr
assa
turé
s,le
ssu
cres
etle
sels
ont
four
nies
pour
une
port
ion
etex
prim
ées
d’un
epa
rten
vale
urab
solu
eet
d’au
tre
part
enpo
urce
ntag
ede
sap
port
sde
réfé
renc
e.
Ce
qu’il
faut
com
pren
dre
La co
ntrib
utio
n de
ces
mêm
es n
utrim
ents
est
ra
ppor
tée
aux
appo
rts q
uotid
iens
de
réfé
renc
e (e
n %
)
Pour
cha
cun
des n
utrim
ents
(é
nerg
ie, m
atiè
re g
rass
e, a
cide
s gra
s sa
turé
s, su
cre
et se
l), l’
appo
rt d
’une
po
rtio
n es
t ind
iqué
en
gram
mes
(g).
Les i
nfor
mat
ions
sont
don
nées
pour
une
por
tion
et in
diqu
ent
com
bien
de
port
ions
sont
co
nten
ues d
ans l
e pa
quet
Le n
ombr
e d’
étoi
les i
ndiq
ue q
ue le
pro
duit
1 es
t plu
s fav
orab
le su
r le
plan
nu
triti
onne
l que
le p
rodu
it 2.
La
cont
ribut
ion
en se
l de
la p
ortio
n du
pr
odui
t 2 e
st p
lus i
mpo
rtan
te q
ue c
elle
du
prod
uit 1
.
Le n
ombr
e d’
étoi
les e
st c
alcu
lé e
n pr
enan
t en
com
pte
la te
neur
en
élém
ents
à fa
voris
er (f
ibre
s, p
roté
ines
, fru
its e
t lég
umes
) et e
n él
émen
ts à
lim
iter (
éner
gie,
aci
des g
ras s
atur
és, s
ucre
et s
el).
Prod
uit 1
Prod
uit 2
Figu
reC
.6:O
nepa
gela
bele
xpla
nati
on:N
utri
Mar
k
32

Q
u’es
tce
que
leN
utri
Repè
re?
Ceté
tique
tage
estu
nere
prés
enta
tion
grap
hiqu
em
iseau
poin
tpar
des
expe
rts
ennu
triti
onqu
ipe
rmet
devi
sual
iser
en%
laco
ntrib
utio
nd’
une
port
ion
d’al
imen
taux
appo
rtsq
uotid
iens
deré
fére
nce
pour
unad
ulte
.Ai
nsiN
utri
Repè
revo
usin
diqu
ece
qu’u
nepo
rtio
nd’
alim
enta
ppor
teen
éner
gie,
ains
ique
pour
lesn
utrim
ents
suiv
ants
parr
appo
rtà
cequ
’iles
trec
omm
andé
deco
nsom
mer
:
Les i
nfor
mat
ions
sont
don
nées
pour
une
por
tion U
ne p
ortio
n du
pro
duit
1 co
ntie
nt 1
9 g
de m
atiè
res
gras
ses,
ce
qui
repr
ésen
te 2
7% d
es
appo
rts r
ecom
man
dés
sur 1
jour
née
(soi
t plu
s d’
un q
uart
)
>M
atiè
res g
rass
es>
Acid
es g
ras s
atur
és>
Sucr
es>
Sel
Ce
qu’il
faut
com
pren
dre?
Nut
riRe
père
perm
etde
com
pare
rles
appo
rtsn
utrit
ionn
elsd
espr
odui
tspa
rpor
tion.
Plus
la co
lonn
e es
t hau
te, p
lus
l’app
ort (
ici e
n se
l) es
t éle
vé
Une
seul
e po
rtio
n du
pr
odui
t 2 p
erm
et
d’at
tein
dre
le se
uil à
ne
pas
dép
asse
r en
acid
es g
ras s
atur
és
sur u
ne jo
urné
e (s
oit
100%
)
Une
por
tion
du p
rodu
it 2
cont
ient
2 fo
is pl
us d
’aci
des
gras
satu
rés q
ue le
pro
duit
1
Prod
uit 1
Prod
uit 2
Figu
reC
.7:O
nepa
gela
bele
xpla
nati
on:N
utri
Rep
ere
33

Q
u’es
tce
que
lere
père
alim
enta
ireSE
NS
?Ce
tétiq
ueta
gea
été
mis
aupo
intp
arde
sch
erch
eurs
nutr
ition
nist
esqu
iont
réal
isépo
urch
aque
prod
uit
unca
lcul
pren
ante
nco
mpt
e:
–Le
snut
rimen
tsdo
ntla
cons
omm
atio
nes
tàfa
voris
er(fi
bres
,om
éga
3,fr
uits
etlé
gum
es,…
)–
Lesn
utrim
ents
dont
laco
nsom
mat
ion
està
mod
érer
(aci
desg
rass
atur
és,s
ucre
,sel
,…)
Aprè
scal
cul,
une
indi
catio
nde
fréq
uenc
ede
cons
omm
atio
nes
tatt
ribué
eà
chaq
uepr
odui
t.
Ce
qu’il
faut
com
pren
dre
4 re
prés
enta
tions
indi
quen
t la
fréq
uenc
e de
con
som
mat
ion
sugg
érée
pou
r cha
que
prod
uit
Le p
rodu
it 1
peut
êtr
e co
nsom
mé
souv
ent c
ar il
con
tient
une
qua
ntité
in
tére
ssan
te d
e lé
gum
es e
t de
fibre
s,
mai
s aus
si pa
rce
qu’il
cont
ient
peu
d’
élém
ents
don
t la
cons
omm
atio
n es
t à
limite
r com
me
le se
l ou
les a
cide
s gr
as sa
turé
s
Le p
rodu
it 2
peut
êtr
e co
nsom
mé
régu
lière
men
t mai
s en
petit
e qu
antit
é ca
r il e
st a
ssez
cal
oriq
ue,
cont
ient
une
qua
ntité
impo
rtan
te
de se
l et d
’aci
des g
ras s
atur
és e
t m
oins
de
légu
mes
et d
e fib
res.
Prod
uit 1
Prod
uit 2
Figu
reC
.8:O
nepa
gela
bele
xpla
nati
on:S
ENS
34

Appendix D. Product catalog screenshots
SnacksCacahuètes grilléestrès pauvres en sel
1,00€200g
5,00€/Kg
Cacahuètes délicatement salées
1,09€220g
4,95€/Kg
Chips de maïs nature
2,49€230g
10,83€/Kg
Chips paysannes nature
2,48€300g
8,27€/Kg
Soufflés de maïs goût cacahuète
2,25€250g
9,00€/Kg
Biscuits apéritif à l'emmental
0,52€50g
10,40€/Kg
30
NUTRI COULEURSUne portion (25g) apporte
% de l'Apport de Référence (AR) d'un adulteEnergie pour 100g: 2613kJ / 625kcal
653kJ156kcal
8%
13g18%
1,8g9%
1,3g1%
<0,01g<1%
NUTRI COULEURSUne portion (30g) apporte
% de l'Apport de Référence (AR) d'un adulteEnergie pour 100g: 2533kJ / 606kcal
760kJ182kcal
9%
16g23%
2,7g13%
1,2g1%
0,30g5%
NUTRI COULEURSUne portion (30g) apporte
% de l'Apport de Référence (AR) d'un adulteEnergie pour 100g: 2077kJ / 497kcal
623kJ149kcal
7%
7,2g10%
0,6g3%
<0,5g<1%
0,21g4%
NUTRI COULEURSUne portion (30g) apporte
% de l'Apport de Référence (AR) d'un adulteEnergie pour 100g: 2508kJ / 600kcal
752kJ180kcal
9%
12g17%
1,2g6%
<0,5g<1%
0,45g8%
NUTRI COULEURSUne portion (25g) apporte
% de l'Apport de Référence (AR) d'un adulteEnergie pour 100g: 1956kJ / 468kcal
489kJ117kcal
6%
4,7g7%
0,7g3%
0,7g<1%
0,55g9%
NUTRI COULEURSUne portion (25g) apporte
% de l'Apport de Référence (AR) d'un adulteEnergie pour 100g: 2320kJ / 555kcal
580kJ139kcal
7%
9,0g13%
4,3g21%
1,4g2%
0,47g8%
Figure D.9
35

SnacksCacahuètes grilléestrès pauvres en sel
1,00€200g
5,00€/Kg
Cacahuètes délicatement salées
1,09€220g
4,95€/Kg
Chips de maïs nature
2,49€230g
10,83€/Kg
Chips paysannes nature
2,48€300g
8,27€/Kg
Soufflés de maïs goût cacahuète
2,25€250g
9,00€/Kg
Biscuits apéritif à l'emmental
0,52€50g
10,40€/Kg
30
Figure D.10
36

SnacksCacahuètes grilléestrès pauvres en sel
1,00€200g
5,00€/Kg
Cacahuètes délicatement salées
1,09€220g
4,95€/Kg
Chips de maïs nature
2,49€230g
10,83€/Kg
Chips paysannes nature
2,48€300g
8,27€/Kg
Soufflés de maïs goût cacahuète
2,25€250g
9,00€/Kg
Biscuits apéritif à l'emmental
0,52€50g
10,40€/Kg
30
NUTRI MARKCe produit contient 8 portions de 25g
Une portion vous apporte
653kJ156kcal
8%*
13g
18%*
1,8g
9%*
1,3g
1%*
<0,01g
<1%*
Pour 100g2613kJ/625kcal
* Pourcentage des apports de référence
NUTRI MARKCe produit contient 7 portions de 31g
Une portion vous apporte
760kJ182kcal
9%*
16g
23%*
2,7g
13%*
1,2g
1%*
0,30g
5%*
Pour 100g2533kJ/606kcal
* Pourcentage des apports de référence
NUTRI MARKCe produit contient 8 portions de 29g
Une portion vous apporte
623kJ149kcal
7%*
7,2g
10%*
0,6g
3%*
<0,5g
<1%*
0,21g
4%*
Pour 100g2077kJ/497kcal
* Pourcentage des apports de référence
NUTRI MARKCe produit contient 10 portions de 30g
Une portion vous apporte
752kJ180kcal
9%*
12g
17%*
1,2g
6%*
<0,5g
<1%*
0,45g
8%*
Pour 100g2508kJ/600kcal
* Pourcentage des apports de référence
NUTRI MARKCe produit contient 10 portions de 25g
Une portion vous apporte
489kJ117kcal
6%*
4,7g
7%*
0,7g
3%*
0,7g
<1%*
0,55g
9%*
Pour 100g1956kJ/468kcal
* Pourcentage des apports de référence
NUTRI MARKCe produit contient 2 portions de 25g
Une portion vous apporte
580kJ139kcal
7%*
9,0g
13%*
4,3g
21%*
1,4g
2%*
0,47g
8%*
Pour 100g2320kJ/555kcal
* Pourcentage des apports de référence
Figure D.11
37

SnacksCacahuètes grilléestrès pauvres en sel
1,00€200g
5,00€/Kg
Cacahuètes délicatement salées
1,09€220g
4,95€/Kg
Chips de maïs nature
2,49€230g
10,83€/Kg
Chips paysannes nature
2,48€300g
8,27€/Kg
Soufflés de maïs goût cacahuète
2,25€250g
9,00€/Kg
Biscuits apéritif à l'emmental
0,52€50g
10,40€/Kg
30
NUTRI REPEREUne portion (25g) apporte
653kJ156kcalEnergie
13gMatièresgrasses
1,8gAcides grassaturés
1,3gSucres
<0,01gSel
Pour 100g > 2613kJ/625kcal*pourcentage des apports de référence pour un adulte type 8400kJ/2000kcal par jour
8 %*18 %*
9 %* 1 %* <1 %*
NUTRI REPEREUne portion (30g) apporte
760kJ182kcalEnergie
16gMatièresgrasses
2,7gAcides grassaturés
1,2gSucres
0,30gSel
Pour 100g > 2533kJ/606kcal*pourcentage des apports de référence pour un adulte type 8400kJ/2000kcal par jour
9 %*23 %*
13 %*1 %* 5 %*
NUTRI REPEREUne portion (30g) apporte
623kJ149kcalEnergie
7,2gMatièresgrasses
0,6gAcides grassaturés
<0,5gSucres
0,21gSel
Pour 100g > 2077kJ/497kcal*pourcentage des apports de référence pour un adulte type 8400kJ/2000kcal par jour
7 %* 10 %* 3 %* <1 %* 4 %*
NUTRI REPEREUne portion (30g) apporte
752kJ180kcalEnergie
12gMatièresgrasses
1,2gAcides grassaturés
<0,5gSucres
0,45gSel
Pour 100g > 2508kJ/600kcal*pourcentage des apports de référence pour un adulte type 8400kJ/2000kcal par jour
9 %*17 %*
6 %* <1 %* 8 %*
NUTRI REPEREUne portion (25g) apporte
489kJ117kcalEnergie
4,7gMatièresgrasses
0,7gAcides grassaturés
0,7gSucres
0,55gSel
Pour 100g > 1956kJ/468kcal*pourcentage des apports de référence pour un adulte type 8400kJ/2000kcal par jour
6 %* 7 %* 3 %* <1 %* 9 %*
NUTRI REPEREUne portion (25g) apporte
580kJ139kcalEnergie
9,0gMatièresgrasses
4,3gAcides grassaturés
1,4gSucres
0,47gSel
Pour 100g > 2320kJ/555kcal*pourcentage des apports de référence pour un adulte type 8400kJ/2000kcal par jour
7 %*13 %*
21 %*2 %* 8 %*
Figure D.12
38

SnacksCacahuètes grilléestrès pauvres en sel
1,00€200g
5,00€/Kg
Cacahuètes délicatement salées
1,09€220g
4,95€/Kg
Chips de maïs nature
2,49€230g
10,83€/Kg
Chips paysannes nature
2,48€300g
8,27€/Kg
Soufflés de maïs goût cacahuète
2,25€250g
9,00€/Kg
Biscuits apéritif à l'emmental
0,52€50g
10,40€/Kg
30
Figure D.13
39

SnacksCacahuètes grilléestrès pauvres en sel
1,00€200g
5,00€/Kg
Cacahuètes délicatement salées
1,09€220g
4,95€/Kg
Chips de maïs nature
2,49€230g
10,83€/Kg
Chips paysannes nature
2,48€300g
8,27€/Kg
Soufflés de maïs goût cacahuète
2,25€250g
9,00€/Kg
Biscuits apéritif à l'emmental
0,52€50g
10,40€/Kg
30
Figure D.14
40