Numerical Simulation of Multifuel Combustion in a 200 MW Tangentially Fired Utility Boiler
11
Published: November 15, 2011 r2011 American Chemical Society 313 dx.doi.org/10.1021/ef201149p | Energy Fuels 2012, 26, 313–323 ARTICLE pubs.acs.org/EF Numerical Simulation of Multifuel Combustion in a 200 MW Tangentially Fired Utility Boiler Qingyan Fang, † Amir A. B. Musa, † Yan Wei, ‡ Zixue Luo, † and Huaichun Zhou* ,† † State Key Laboratory of Coal Combustion, Huazhong University of Science and Technology, Wuhan 430074, People’s Republic of China ‡ Department of Mechanical, Materials, and Aerospace Engineering, University of Central Florida, Orlando, Florida 32816-2450, United States ABSTRACT: A computational fluid dynamics (CFD) model of a 200 MW multifuel tangentially fired boiler has been developed using Fluent 6.3.26, which is able to model the three-fuel combustion system of coal, blast furnace gas (BFG), and coke oven gas (COG) with an eddy-dissipation model for simulating the gas-phase combustion. A level of confidence in the current CFD model has been established by carrying out a mesh independence test and validation against the experimental data obtained from the boiler for case study. The validated CFD model is then applied to investigate the effects of different BFG and COG flow rates on the boiler performance. It is found that increasing the BFG flow rate brings negative effects on the ignition of primary air and pulverized-coal mixture, pulverized-coal burnout, and heat transfer in the furnace and, consequently, decreases the thermal efficiency. However, increasing the COG flow rate can increase the thermal efficiency via improving the pulverized-coal burnout and heat transfer. Increasing both the BFG and COG flow rates is favorable for reducing NO emissions. The results also indicate that co-firing pulverized coal with BFG of about 20% heat input and COG of about 10% heat input is an optimal operating condition for improving the boiler performance at 180 MW load. The present study provides helpful information for understanding and optimizing the multifuel combustion of the boiler. 1. INTRODUCTION Blast furnace gas (BFG) and coke oven gas (COG), which are byproducts of the iron and steel manufacturing processes in the iron and steel industries, are important secondary energy sources. 16 The BFG mainly contains N 2 , CO 2 , and CO and slight amounts of H 2 . It is a typical low-heating-value gaseous fuel, with a lower heating value of ∼3700 kJ Nm 3 . While the COG dominantly contains H 2 , CH 4 , CO, CO 2 , and N 2 , with trace amounts of heavier hydrocarbon fuel, such as C 2 H 2 . The lower heating value of COG is ∼16 200 kJ Nm 3 . China is the world’s largest producer and consumer of iron and steel. Iron and steel producing are very energy-intensive manufacturing pro- cesses, producing large quantities of BFG and COG as byprod- ucts. The use of these gaseous fuels can reduce the requirements for external fuels and the emissions of waste gas and CO 2 ; 1,2 therefore, it is greatly important to recover and reuse these gaseous fuels. Multifuel combustion is usually used to improve the economic performance by increasing the fuel flexibility, improving combus- tion behavior, mitigating operation problems, and decreasing gaseous pollutant emissions. The subject has been discussed in some studies, 19 in which most of them focused on two-fuel combustion systems. Among the existing use methods for using BFG and COG, co-firing BFG and/or COG with pulverized coal in boilers is the most common method. 36 It is flexible in boiler operating when the parameters of the BFG and/or COG stream are unstable, because the pulverized-coal feed rate can be in- creased to ensure the boiler load when the flow rate of BFG and/ or COG decreases. COG is also able to serve as a reburning fuel for NO reduction in the power plant. Reburning technology combined with overfire air (OFA) can reduce NO emission by ∼56% in a 350 MW tangentially fired utility boiler using COG as the reburning fuel. 5 When co-firing BFG with pulverized coal in a utility boiler, the main problem is that, with increasing the BFG flow rate, the carbon content in fly ash obviously rises, decreasing the pulverized- coal burnout. 4,6 Therefore, the proper BFG flow rate is important to improve the boiler performance. Because of the more complex and high-coupled characteristics of flow, combustion, heat transfer, and NO emission in the three-fuel combustion system, such as co- firing pulverized coal with BFG and COG, it is critical to master more detailed information on the combustion process and control the flow rate of BFG and/or COG properly for improving the economic performance. Up to now, only Huang et al. 10 carried out experimental detection using a temperature measuring system for the three-fuel combustion of coal, BFG, and COG in a utility boiler. However, it is difficult from the limited experimental data to exhibit more detail on the combustion process in the furnace and the effects of changing the flow rate of BFG and/or COG on the performance of the three-fuel boiler. A numerical method, being able to reveal more detail, has been widely applied to investigate the combustion processes in different industrial combustors. 1126 Much numerical research Special Issue: 2011 Sino-Australian Symposium on Advanced Coal and Biomass Utilisation Technologies Received: July 31, 2011 Revised: November 15, 2011
-
Upload
independent -
Category
Documents
-
view
2 -
download
0
Transcript of Numerical Simulation of Multifuel Combustion in a 200 MW Tangentially Fired Utility Boiler
Published: November 15, 2011
r 2011 American Chemical Society 313 dx.doi.org/10.1021/ef201149p | Energy Fuels 2012, 26, 313–323
ARTICLE
pubs.acs.org/EF
Numerical Simulation of Multifuel Combustion in a 200 MWTangentially Fired Utility BoilerQingyan Fang,† Amir A. B. Musa,† Yan Wei,‡ Zixue Luo,† and Huaichun Zhou*,†
†State Key Laboratory of Coal Combustion, Huazhong University of Science and Technology, Wuhan 430074,People’s Republic of China‡Department of Mechanical, Materials, and Aerospace Engineering, University of Central Florida, Orlando, Florida 32816-2450,United States
ABSTRACT: A computational fluid dynamics (CFD) model of a 200 MW multifuel tangentially fired boiler has been developedusing Fluent 6.3.26, which is able to model the three-fuel combustion system of coal, blast furnace gas (BFG), and coke oven gas(COG) with an eddy-dissipation model for simulating the gas-phase combustion. A level of confidence in the current CFD modelhas been established by carrying out a mesh independence test and validation against the experimental data obtained from the boilerfor case study. The validated CFDmodel is then applied to investigate the effects of different BFG and COG flow rates on the boilerperformance. It is found that increasing the BFG flow rate brings negative effects on the ignition of primary air and pulverized-coalmixture, pulverized-coal burnout, and heat transfer in the furnace and, consequently, decreases the thermal efficiency. However,increasing the COG flow rate can increase the thermal efficiency via improving the pulverized-coal burnout and heat transfer.Increasing both the BFG and COG flow rates is favorable for reducing NO emissions. The results also indicate that co-firingpulverized coal with BFG of about 20% heat input andCOGof about 10% heat input is an optimal operating condition for improvingthe boiler performance at 180 MW load. The present study provides helpful information for understanding and optimizing themultifuel combustion of the boiler.
1. INTRODUCTION
Blast furnace gas (BFG) and coke oven gas (COG), which arebyproducts of the iron and steel manufacturing processes inthe iron and steel industries, are important secondary energysources.1�6 The BFG mainly contains N2, CO2, and CO andslight amounts of H2. It is a typical low-heating-value gaseousfuel, with a lower heating value of ∼3700 kJ Nm�3. While theCOG dominantly contains H2, CH4, CO, CO2, and N2, withtrace amounts of heavier hydrocarbon fuel, such as C2H2. Thelower heating value of COG is ∼16 200 kJ Nm�3. China is theworld’s largest producer and consumer of iron and steel. Iron andsteel producing are very energy-intensive manufacturing pro-cesses, producing large quantities of BFG and COG as byprod-ucts. The use of these gaseous fuels can reduce the requirementsfor external fuels and the emissions of waste gas and CO2;
1,2
therefore, it is greatly important to recover and reuse thesegaseous fuels.
Multifuel combustion is usually used to improve the economicperformance by increasing the fuel flexibility, improving combus-tion behavior, mitigating operation problems, and decreasinggaseous pollutant emissions. The subject has been discussed insome studies,1�9 in which most of them focused on two-fuelcombustion systems. Among the existing use methods for usingBFG and COG, co-firing BFG and/or COG with pulverized coalin boilers is the most common method.3�6 It is flexible in boileroperating when the parameters of the BFG and/or COG streamare unstable, because the pulverized-coal feed rate can be in-creased to ensure the boiler load when the flow rate of BFG and/or COG decreases. COG is also able to serve as a reburning fuelfor NO reduction in the power plant. Reburning technology
combined with overfire air (OFA) can reduce NO emission by∼56% in a 350MW tangentially fired utility boiler using COG asthe reburning fuel.5
When co-firing BFG with pulverized coal in a utility boiler, themain problem is that, with increasing the BFG flow rate, thecarbon content in fly ash obviously rises, decreasing the pulverized-coal burnout.4,6 Therefore, the proper BFG flow rate is importantto improve the boiler performance. Because of the more complexand high-coupled characteristics of flow, combustion, heat transfer,and NO emission in the three-fuel combustion system, such as co-firing pulverized coal with BFG and COG, it is critical to mastermore detailed information on the combustion process and controlthe flow rate of BFG and/or COG properly for improving theeconomic performance. Up to now, only Huang et al.10 carried outexperimental detection using a temperature measuring system forthe three-fuel combustion of coal, BFG, and COG in a utilityboiler. However, it is difficult from the limited experimental data toexhibit more detail on the combustion process in the furnace andthe effects of changing the flow rate of BFG and/or COG on theperformance of the three-fuel boiler.
A numerical method, being able to reveal more detail, has beenwidely applied to investigate the combustion processes indifferent industrial combustors.11�26 Much numerical research
Special Issue: 2011 Sino-Australian Symposium on Advanced Coal andBiomass Utilisation Technologies
Received: July 31, 2011Revised: November 15, 2011
314 dx.doi.org/10.1021/ef201149p |Energy Fuels 2012, 26, 313–323
Energy & Fuels ARTICLE
has been conducted for single-fuel combustions, such as the con-ventional pulverized-coal combustion,11�16 biomass combustion,17,18
and oxy-fuel combustion.19,20 Several numerical studies have beenperformed for two-fuel combustion systems, such as two differ-ent coals,21,22 coal/biomass,23 and coal/gaseous fuel.24,25 For atwo-fuel system, both two-mixture-fraction21�24 and eddy-dissipationmodels25 are suitable to model the gas-phase combustion.However, to the knowledge of the authors, no numerical studyhas been reported thus far on the three-fuel combustion systemco-firing pulverized coal with BFG and COG in a utility boiler.Furthermore, the two-mixture-fraction model cannot be used tosimulate the gas-phase combustion of a three-fuel system.
Therefore, it is the objective of this study to carry out numericalsimulations on the combustion performance of a 200 MW tan-gentially fired utility boiler co-firing pulverized coal with BFG andCOG. It was the first time to perform the numerical simulationof the three-fuel combustion in a utility boiler using the eddy-dissipation model to simulate the turbulent gas-phase reaction.The mesh andmodels adopted were validated by a mesh-indepen-dent test, an iteration convergence judgment, and a comparison ofthe simulated and experimental results. The co-combustion char-acteristics analysis was presented, and the effects of the flow ratesof BFG and COG on the combustion performance of the boilerwere investigated in detail.
2. METHODOLOGY
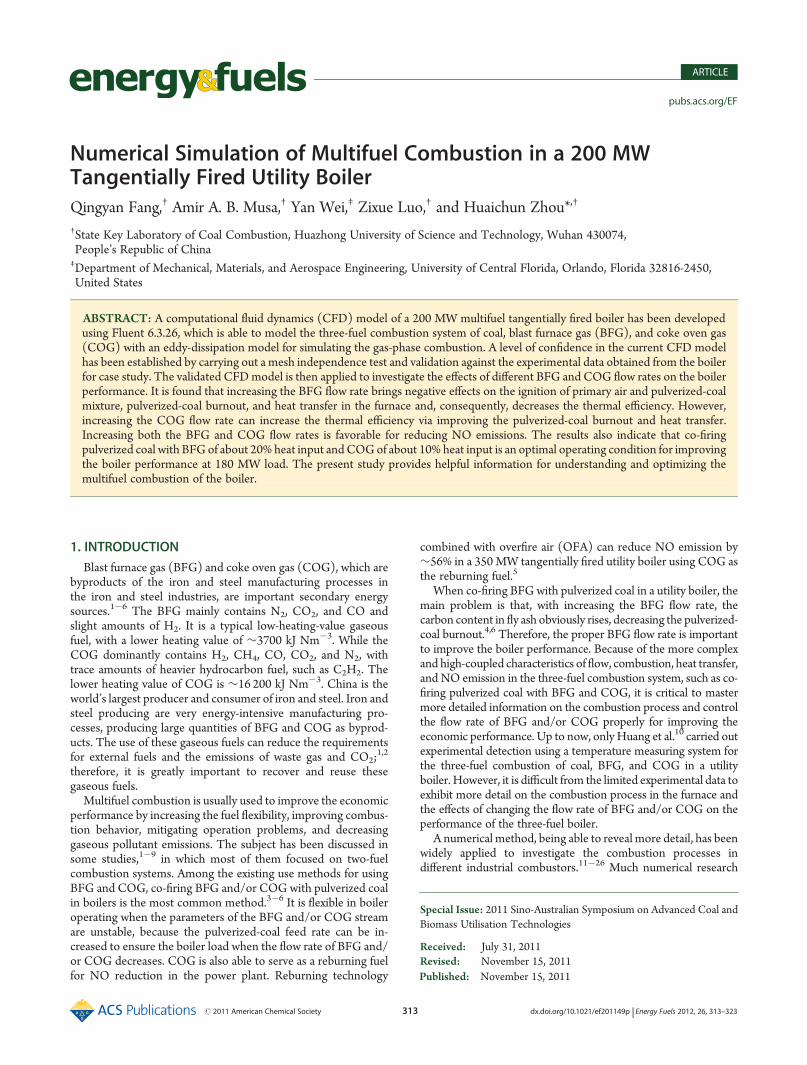
2.1. Boiler for Case Study. The case study boiler is a 200 MWtangentially fired utility boiler co-firing pulverized coal with BFG andCOG. The furnace is 10.80, 11.92, and 44.60 m in depth, width, andheight, respectively. Two sets of storage pulverized-coal preparationsystems are used. At each corner, there are 16 burner nozzles, made up offour primary air (PA) nozzles, six secondary air (SA) nozzles, twotertiary air (TA) nozzles, two BFG nozzles, and two COG nozzles.The TA is injected into the furnace with a contrary tangent direction tothe PA and SA. The contrary tangent angle is 10�. The BFG nozzles arelocated at the lowest position of the burner zone. The COG nozzles are
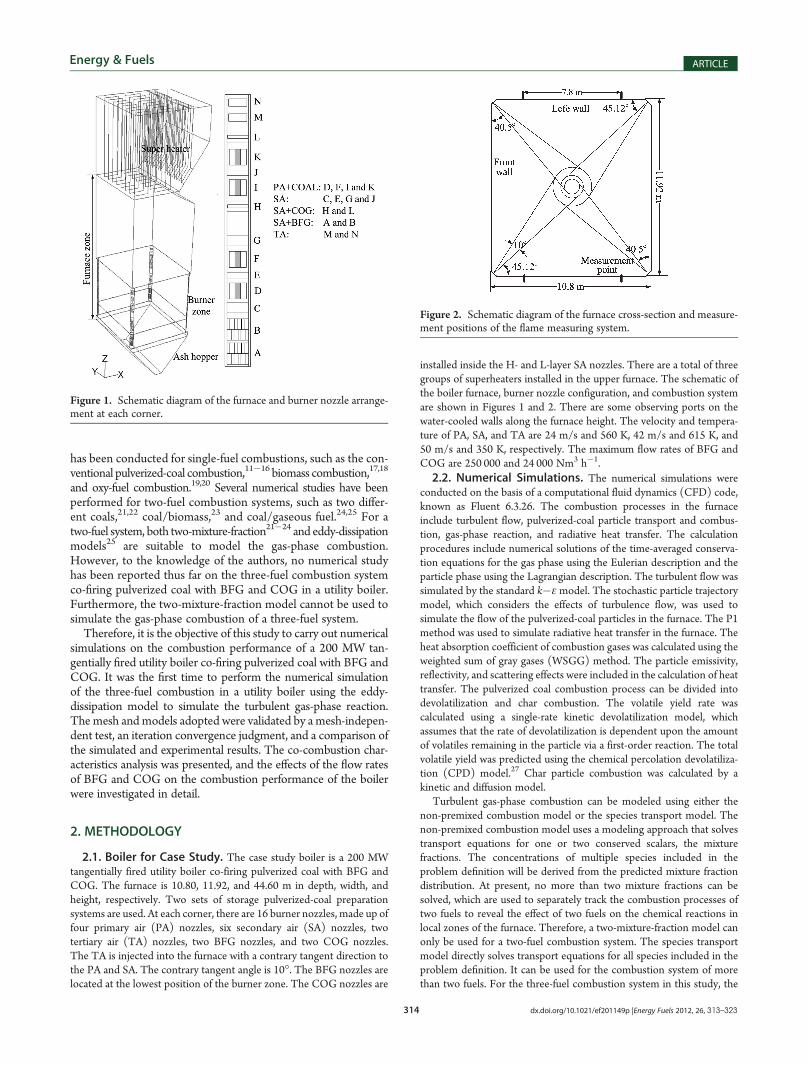
installed inside the H- and L-layer SA nozzles. There are a total of threegroups of superheaters installed in the upper furnace. The schematic ofthe boiler furnace, burner nozzle configuration, and combustion systemare shown in Figures 1 and 2. There are some observing ports on thewater-cooled walls along the furnace height. The velocity and tempera-ture of PA, SA, and TA are 24 m/s and 560 K, 42 m/s and 615 K, and50 m/s and 350 K, respectively. The maximum flow rates of BFG andCOG are 250 000 and 24 000 Nm3 h�1.2.2. Numerical Simulations. The numerical simulations were
conducted on the basis of a computational fluid dynamics (CFD) code,known as Fluent 6.3.26. The combustion processes in the furnaceinclude turbulent flow, pulverized-coal particle transport and combus-tion, gas-phase reaction, and radiative heat transfer. The calculationprocedures include numerical solutions of the time-averaged conserva-tion equations for the gas phase using the Eulerian description and theparticle phase using the Lagrangian description. The turbulent flow wassimulated by the standard k�εmodel. The stochastic particle trajectorymodel, which considers the effects of turbulence flow, was used tosimulate the flow of the pulverized-coal particles in the furnace. The P1method was used to simulate radiative heat transfer in the furnace. Theheat absorption coefficient of combustion gases was calculated using theweighted sum of gray gases (WSGG) method. The particle emissivity,reflectivity, and scattering effects were included in the calculation of heattransfer. The pulverized coal combustion process can be divided intodevolatilization and char combustion. The volatile yield rate wascalculated using a single-rate kinetic devolatilization model, whichassumes that the rate of devolatilization is dependent upon the amountof volatiles remaining in the particle via a first-order reaction. The totalvolatile yield was predicted using the chemical percolation devolatiliza-tion (CPD) model.27 Char particle combustion was calculated by akinetic and diffusion model.
Turbulent gas-phase combustion can be modeled using either thenon-premixed combustion model or the species transport model. Thenon-premixed combustion model uses a modeling approach that solvestransport equations for one or two conserved scalars, the mixturefractions. The concentrations of multiple species included in theproblem definition will be derived from the predicted mixture fractiondistribution. At present, no more than two mixture fractions can besolved, which are used to separately track the combustion processes oftwo fuels to reveal the effect of two fuels on the chemical reactions inlocal zones of the furnace. Therefore, a two-mixture-fraction model canonly be used for a two-fuel combustion system. The species transportmodel directly solves transport equations for all species included in theproblem definition. It can be used for the combustion system of morethan two fuels. For the three-fuel combustion system in this study, the
Figure 2. Schematic diagram of the furnace cross-section and measure-ment positions of the flame measuring system.
Figure 1. Schematic diagram of the furnace and burner nozzle arrange-ment at each corner.
315 dx.doi.org/10.1021/ef201149p |Energy Fuels 2012, 26, 313–323
Energy & Fuels ARTICLE
eddy-dissipation model was used to model the gas-phase turbulencecombustion for the volatile matter produced from pulverized coal, BFG,and COG. The eddy-dissipation model assumes that the chemicalreaction is fast relative to the transport processes in the flow.28 Whenthe volatile matter or other combustible components and oxygen aremixed at the molecular level, the reaction and formation of products takeplace instantaneously. The reaction paths of the volatile matter arerepresented by eqs 1 and 2, with α, β, and γ equal to 2.056, 1.136, and2.232 for the used coal, respectively. The reaction paths of BFG arerepresented by eqs 2 and 3. The reaction paths of COG are representedby eqs 2, 3, and 4. More detailed descriptions of these models can befound in the literature.28,29
volatile matter þ αO2 f βCO þ γH2O ð1Þ
CO þ 0:5O2 f CO2 ð2Þ
H2 þ 0:5O2 f H2O ð3Þ
CH4 þ 2O2 f CO2 þ 2H2O ð4ÞNOx simulation mainly considers the formation of thermal NO and fuelNO. Thermal NO is generated from the oxidation of N2 in thecombustion air. The formation of thermal NO is determined by a setof strongly temperature-dependent chemical reactions. The thermal NOwas simulated using a simple combined kinetic rate expression for theclassical Zeldovich mechanism.30 The partial equilibrium approach forboth atomic oxygen and hydroxyl radical was adopted. For the fuel NOmodeling, the global models proposed by De Soete31 are considered asthe fuel NO mechanism. It is assumed that the fuel-bound nitrogen ofthe coal is distributed between the volatile and the char. The nitrogen inthe volatile evolves as HCN or NH3 intermediates, and the nitrogen inthe char converts to NO directly. The CPDmodel with the prediction ofnitrogen release27,32 was adopted to predict the mass fraction of thenitrogen release in the volatile and the percentage of the nitrogen in thevolatile evolved as the HCN intermediate. The mass fractions of volatileand char nitrogen are 0.266 and 0.734, respectively. The conversionfraction of char nitrogen is taken as 0.8.
A reburning model was included in the NO calculation because COGis a hydrocarbon-containing fuel with CH4. In the reburning reactions,the following three reactions are the most important reactions of NOreduction by CH radicals:33
CH þ NO f HCN þ O ð5Þ
CH2 þ NO f HCN þ OH ð6Þ
CH3 þ NO f HCN þ H2O ð7ÞThe hydrocarbon radicals involved in the above reactions are formedfrom the following elementary reactions:33
CH4 þ H T CH3 þ H2 ð8Þ
CH3 þ OH T CH2 þ H2O ð9Þ
CH2 þ H T CH þ H2 ð10Þ
CH þ H T C þ H2 ð11ÞThe partial equilibrium approach34 was applied to calculate the con-centrations of important radicals. The reburning fuel was an equivalentof CH3 approximately considering the C/H ratio of the fuel itself.29
Because the concentration of NO is very small compared to theconcentrations of other main species in coal combustion, the NOtransport equation is commonly solved for a given combustion flow-fieldsolution. The NO model is, therefore, typically employed with a post-processing method. The turbulent mixing process results in temporalfluctuations in the temperature and species concentration that willinfluence the characteristics of the flame. Temperature and compositionfluctuations must be taken into account for the mean NO formation rate.In this study, an assumed shape of the probability density function(β PDF) was used to account for the temperature and oxygen speciesfluctuations on the NO formation in turbulent flows.16,24,28,29
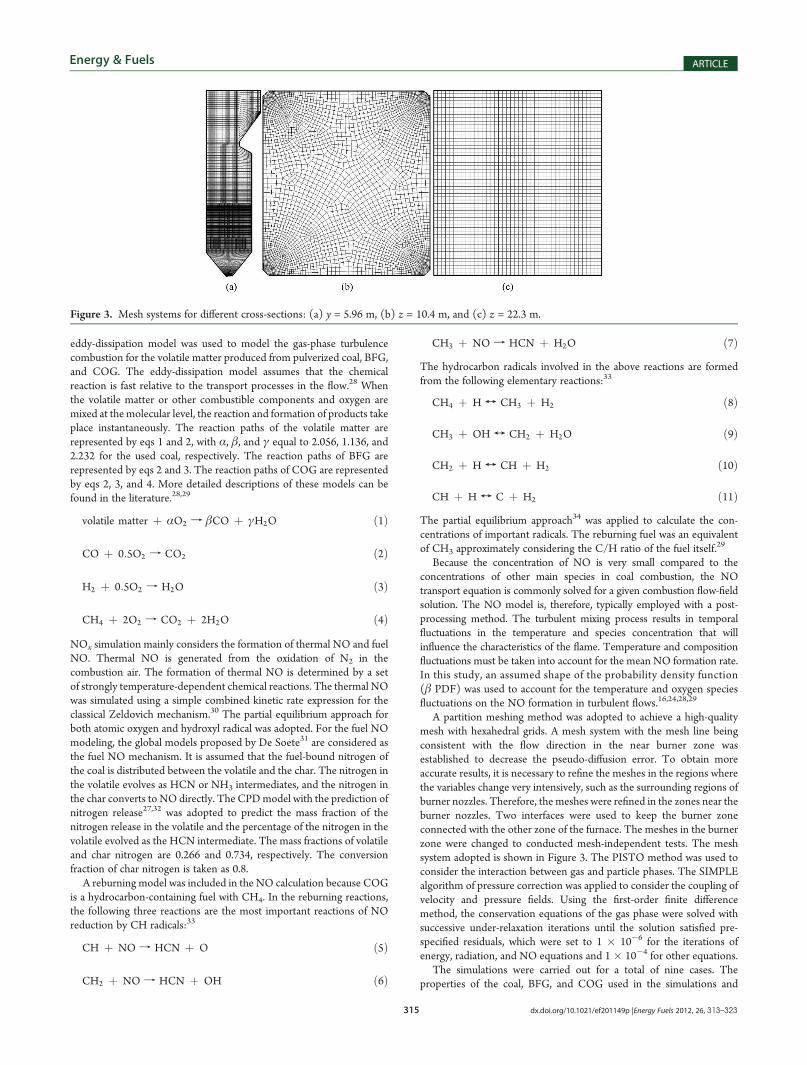
A partition meshing method was adopted to achieve a high-qualitymesh with hexahedral grids. A mesh system with the mesh line beingconsistent with the flow direction in the near burner zone wasestablished to decrease the pseudo-diffusion error. To obtain moreaccurate results, it is necessary to refine the meshes in the regions wherethe variables change very intensively, such as the surrounding regions ofburner nozzles. Therefore, the meshes were refined in the zones near theburner nozzles. Two interfaces were used to keep the burner zoneconnected with the other zone of the furnace. The meshes in the burnerzone were changed to conducted mesh-independent tests. The meshsystem adopted is shown in Figure 3. The PISTO method was used toconsider the interaction between gas and particle phases. The SIMPLEalgorithm of pressure correction was applied to consider the coupling ofvelocity and pressure fields. Using the first-order finite differencemethod, the conservation equations of the gas phase were solved withsuccessive under-relaxation iterations until the solution satisfied pre-specified residuals, which were set to 1 � 10�6 for the iterations ofenergy, radiation, and NO equations and 1� 10�4 for other equations.
The simulations were carried out for a total of nine cases. Theproperties of the coal, BFG, and COG used in the simulations and
Figure 3. Mesh systems for different cross-sections: (a) y = 5.96 m, (b) z = 10.4 m, and (c) z = 22.3 m.
316 dx.doi.org/10.1021/ef201149p |Energy Fuels 2012, 26, 313–323
Energy & Fuels ARTICLE
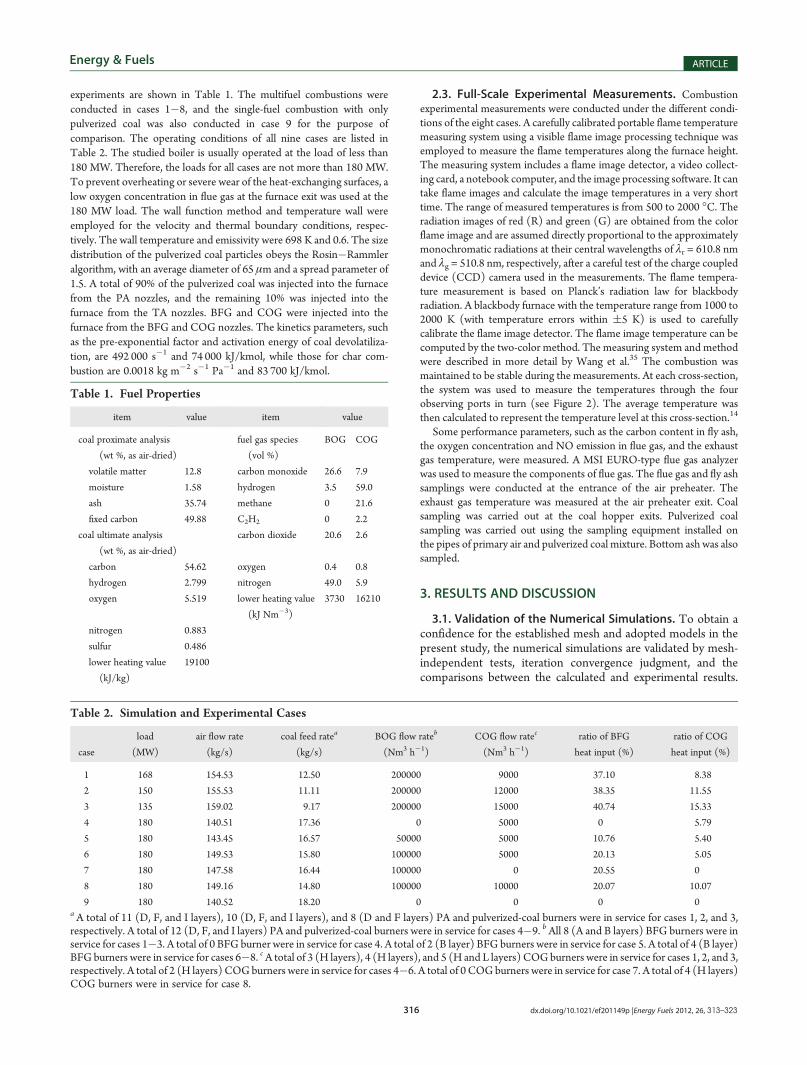
experiments are shown in Table 1. The multifuel combustions wereconducted in cases 1�8, and the single-fuel combustion with onlypulverized coal was also conducted in case 9 for the purpose ofcomparison. The operating conditions of all nine cases are listed inTable 2. The studied boiler is usually operated at the load of less than180 MW. Therefore, the loads for all cases are not more than 180 MW.To prevent overheating or severe wear of the heat-exchanging surfaces, alow oxygen concentration in flue gas at the furnace exit was used at the180 MW load. The wall function method and temperature wall wereemployed for the velocity and thermal boundary conditions, respec-tively. The wall temperature and emissivity were 698 K and 0.6. The sizedistribution of the pulverized coal particles obeys the Rosin�Rammleralgorithm, with an average diameter of 65 μm and a spread parameter of1.5. A total of 90% of the pulverized coal was injected into the furnacefrom the PA nozzles, and the remaining 10% was injected into thefurnace from the TA nozzles. BFG and COG were injected into thefurnace from the BFG and COG nozzles. The kinetics parameters, suchas the pre-exponential factor and activation energy of coal devolatiliza-tion, are 492 000 s�1 and 74 000 kJ/kmol, while those for char com-bustion are 0.0018 kg m�2 s�1 Pa�1 and 83 700 kJ/kmol.
2.3. Full-Scale Experimental Measurements. Combustionexperimental measurements were conducted under the different condi-tions of the eight cases. A carefully calibrated portable flame temperaturemeasuring system using a visible flame image processing technique wasemployed to measure the flame temperatures along the furnace height.The measuring system includes a flame image detector, a video collect-ing card, a notebook computer, and the image processing software. It cantake flame images and calculate the image temperatures in a very shorttime. The range of measured temperatures is from 500 to 2000 �C. Theradiation images of red (R) and green (G) are obtained from the colorflame image and are assumed directly proportional to the approximatelymonochromatic radiations at their central wavelengths of λr = 610.8 nmand λg = 510.8 nm, respectively, after a careful test of the charge coupleddevice (CCD) camera used in the measurements. The flame tempera-ture measurement is based on Planck’s radiation law for blackbodyradiation. A blackbody furnace with the temperature range from 1000 to2000 K (with temperature errors within (5 K) is used to carefullycalibrate the flame image detector. The flame image temperature can becomputed by the two-color method. The measuring system and methodwere described in more detail by Wang et al.35 The combustion wasmaintained to be stable during the measurements. At each cross-section,the system was used to measure the temperatures through the fourobserving ports in turn (see Figure 2). The average temperature wasthen calculated to represent the temperature level at this cross-section.14
Some performance parameters, such as the carbon content in fly ash,the oxygen concentration and NO emission in flue gas, and the exhaustgas temperature, were measured. A MSI EURO-type flue gas analyzerwas used to measure the components of flue gas. The flue gas and fly ashsamplings were conducted at the entrance of the air preheater. Theexhaust gas temperature was measured at the air preheater exit. Coalsampling was carried out at the coal hopper exits. Pulverized coalsampling was carried out using the sampling equipment installed onthe pipes of primary air and pulverized coal mixture. Bottom ash was alsosampled.
3. RESULTS AND DISCUSSION
3.1. Validation of the Numerical Simulations. To obtain aconfidence for the established mesh and adopted models in thepresent study, the numerical simulations are validated by mesh-independent tests, iteration convergence judgment, and thecomparisons between the calculated and experimental results.
Table 1. Fuel Properties
item value item value
coal proximate analysis
(wt %, as air-dried)
fuel gas species
(vol %)
BOG COG
volatile matter 12.8 carbon monoxide 26.6 7.9
moisture 1.58 hydrogen 3.5 59.0
ash 35.74 methane 0 21.6
fixed carbon 49.88 C2H2 0 2.2
coal ultimate analysis
(wt %, as air-dried)
carbon dioxide 20.6 2.6
carbon 54.62 oxygen 0.4 0.8
hydrogen 2.799 nitrogen 49.0 5.9
oxygen 5.519 lower heating value
(kJ Nm�3)
3730 16210
nitrogen 0.883
sulfur 0.486
lower heating value
(kJ/kg)
19100
Table 2. Simulation and Experimental Cases
case
load
(MW)
air flow rate
(kg/s)
coal feed ratea
(kg/s)
BOG flow rateb
(Nm3 h�1)
COG flow ratec
(Nm3 h�1)
ratio of BFG
heat input (%)
ratio of COG
heat input (%)
1 168 154.53 12.50 200000 9000 37.10 8.38
2 150 155.53 11.11 200000 12000 38.35 11.55
3 135 159.02 9.17 200000 15000 40.74 15.33
4 180 140.51 17.36 0 5000 0 5.79
5 180 143.45 16.57 50000 5000 10.76 5.40
6 180 149.53 15.80 100000 5000 20.13 5.05
7 180 147.58 16.44 100000 0 20.55 0
8 180 149.16 14.80 100000 10000 20.07 10.07
9 180 140.52 18.20 0 0 0 0aA total of 11 (D, F, and I layers), 10 (D, F, and I layers), and 8 (D and F layers) PA and pulverized-coal burners were in service for cases 1, 2, and 3,respectively. A total of 12 (D, F, and I layers) PA and pulverized-coal burners were in service for cases 4�9. bAll 8 (A and B layers) BFG burners were inservice for cases 1�3. A total of 0 BFG burner were in service for case 4. A total of 2 (B layer) BFG burners were in service for case 5. A total of 4 (B layer)BFG burners were in service for cases 6�8. cA total of 3 (H layers), 4 (H layers), and 5 (H and L layers) COGburners were in service for cases 1, 2, and 3,respectively. A total of 2 (H layers) COGburners were in service for cases 4�6. A total of 0 COGburners were in service for case 7. A total of 4 (H layers)COG burners were in service for case 8.
317 dx.doi.org/10.1021/ef201149p |Energy Fuels 2012, 26, 313–323
Energy & Fuels ARTICLE
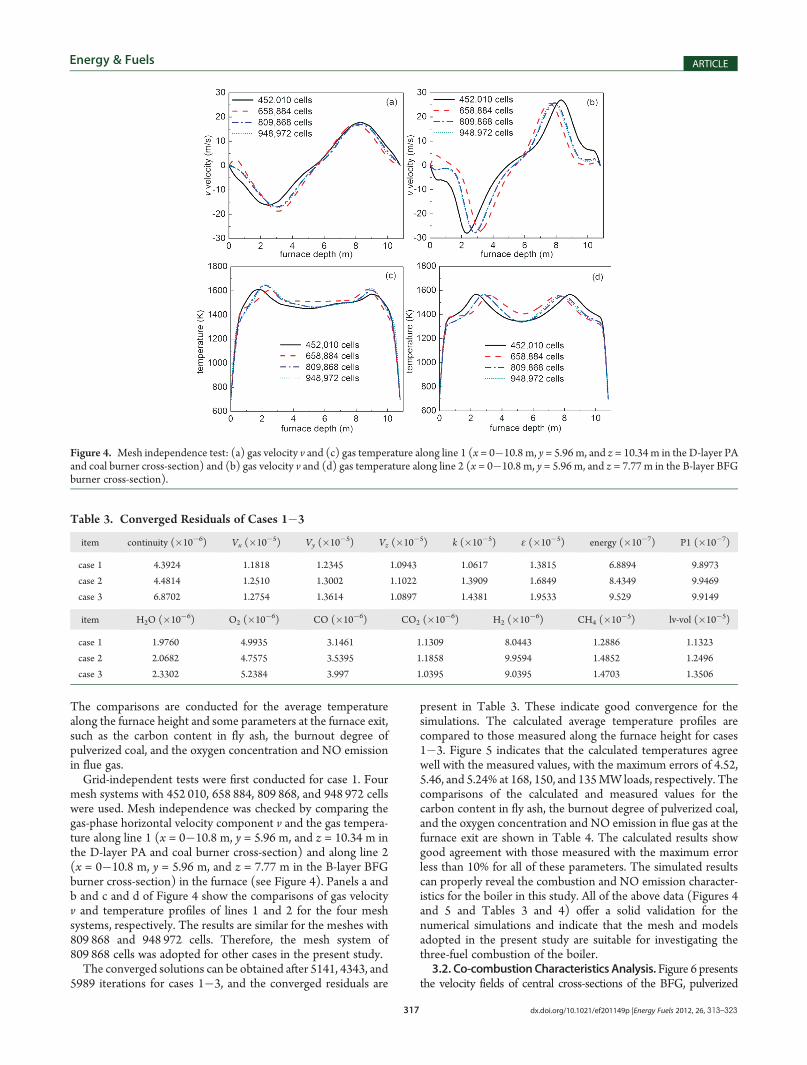
The comparisons are conducted for the average temperaturealong the furnace height and some parameters at the furnace exit,such as the carbon content in fly ash, the burnout degree ofpulverized coal, and the oxygen concentration and NO emissionin flue gas.Grid-independent tests were first conducted for case 1. Four
mesh systems with 452 010, 658 884, 809 868, and 948 972 cellswere used. Mesh independence was checked by comparing thegas-phase horizontal velocity component v and the gas tempera-ture along line 1 (x = 0�10.8 m, y = 5.96 m, and z = 10.34 m inthe D-layer PA and coal burner cross-section) and along line 2(x = 0�10.8 m, y = 5.96 m, and z = 7.77 m in the B-layer BFGburner cross-section) in the furnace (see Figure 4). Panels a andb and c and d of Figure 4 show the comparisons of gas velocityv and temperature profiles of lines 1 and 2 for the four meshsystems, respectively. The results are similar for the meshes with809 868 and 948 972 cells. Therefore, the mesh system of809 868 cells was adopted for other cases in the present study.The converged solutions can be obtained after 5141, 4343, and
5989 iterations for cases 1�3, and the converged residuals are
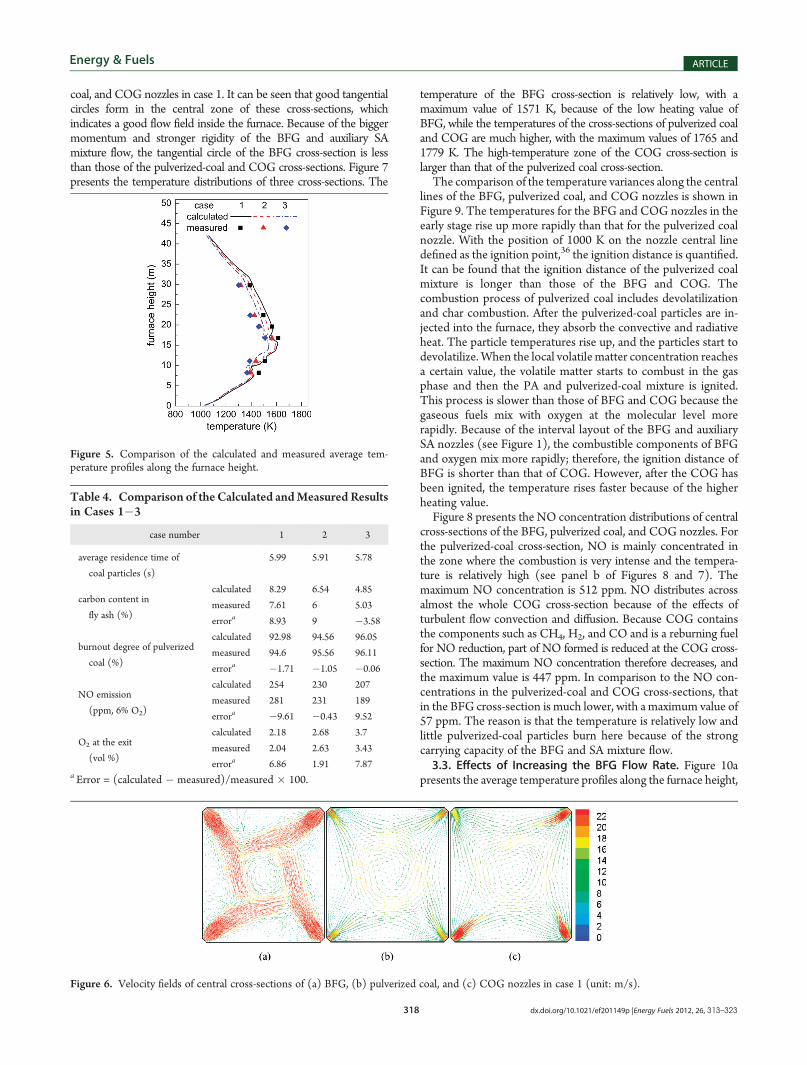
present in Table 3. These indicate good convergence for thesimulations. The calculated average temperature profiles arecompared to those measured along the furnace height for cases1�3. Figure 5 indicates that the calculated temperatures agreewell with the measured values, with the maximum errors of 4.52,5.46, and 5.24% at 168, 150, and 135MW loads, respectively. Thecomparisons of the calculated and measured values for thecarbon content in fly ash, the burnout degree of pulverized coal,and the oxygen concentration and NO emission in flue gas at thefurnace exit are shown in Table 4. The calculated results showgood agreement with those measured with the maximum errorless than 10% for all of these parameters. The simulated resultscan properly reveal the combustion and NO emission character-istics for the boiler in this study. All of the above data (Figures 4and 5 and Tables 3 and 4) offer a solid validation for thenumerical simulations and indicate that the mesh and modelsadopted in the present study are suitable for investigating thethree-fuel combustion of the boiler.3.2. Co-combustionCharacteristicsAnalysis.Figure 6 presents
the velocity fields of central cross-sections of the BFG, pulverized
Figure 4. Mesh independence test: (a) gas velocity v and (c) gas temperature along line 1 (x = 0�10.8 m, y = 5.96 m, and z = 10.34 m in the D-layer PAand coal burner cross-section) and (b) gas velocity v and (d) gas temperature along line 2 (x = 0�10.8 m, y = 5.96 m, and z = 7.77 m in the B-layer BFGburner cross-section).
Table 3. Converged Residuals of Cases 1�3
item continuity (�10�6) Vx (�10�5) Vy (�10�5) Vz (�10�5) k (�10�5) ε (�10�5) energy (�10�7) P1 (�10�7)
case 1 4.3924 1.1818 1.2345 1.0943 1.0617 1.3815 6.8894 9.8973
case 2 4.4814 1.2510 1.3002 1.1022 1.3909 1.6849 8.4349 9.9469
case 3 6.8702 1.2754 1.3614 1.0897 1.4381 1.9533 9.529 9.9149
item H2O (�10�6) O2 (�10�6) CO (�10�6) CO2 (�10�6) H2 (�10�6) CH4 (�10�5) lv-vol (�10�5)
case 1 1.9760 4.9935 3.1461 1.1309 8.0443 1.2886 1.1323
case 2 2.0682 4.7575 3.5395 1.1858 9.9594 1.4852 1.2496
case 3 2.3302 5.2384 3.997 1.0395 9.0395 1.4703 1.3506
318 dx.doi.org/10.1021/ef201149p |Energy Fuels 2012, 26, 313–323
Energy & Fuels ARTICLE
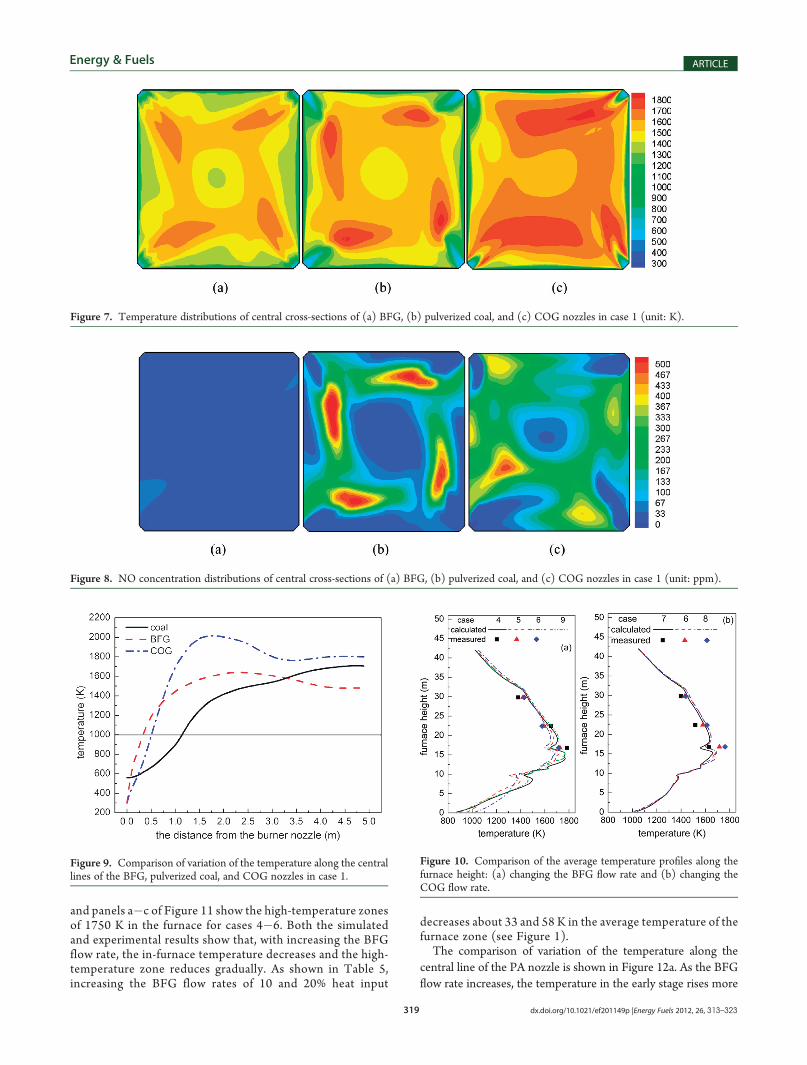
coal, and COG nozzles in case 1. It can be seen that good tangentialcircles form in the central zone of these cross-sections, whichindicates a good flow field inside the furnace. Because of the biggermomentum and stronger rigidity of the BFG and auxiliary SAmixture flow, the tangential circle of the BFG cross-section is lessthan those of the pulverized-coal and COG cross-sections. Figure 7presents the temperature distributions of three cross-sections. The
temperature of the BFG cross-section is relatively low, with amaximum value of 1571 K, because of the low heating value ofBFG, while the temperatures of the cross-sections of pulverized coaland COG are much higher, with the maximum values of 1765 and1779 K. The high-temperature zone of the COG cross-section islarger than that of the pulverized coal cross-section.The comparison of the temperature variances along the central
lines of the BFG, pulverized coal, and COG nozzles is shown inFigure 9. The temperatures for the BFG and COG nozzles in theearly stage rise up more rapidly than that for the pulverized coalnozzle. With the position of 1000 K on the nozzle central linedefined as the ignition point,36 the ignition distance is quantified.It can be found that the ignition distance of the pulverized coalmixture is longer than those of the BFG and COG. Thecombustion process of pulverized coal includes devolatilizationand char combustion. After the pulverized-coal particles are in-jected into the furnace, they absorb the convective and radiativeheat. The particle temperatures rise up, and the particles start todevolatilize.When the local volatile matter concentration reachesa certain value, the volatile matter starts to combust in the gasphase and then the PA and pulverized-coal mixture is ignited.This process is slower than those of BFG and COG because thegaseous fuels mix with oxygen at the molecular level morerapidly. Because of the interval layout of the BFG and auxiliarySA nozzles (see Figure 1), the combustible components of BFGand oxygen mix more rapidly; therefore, the ignition distance ofBFG is shorter than that of COG. However, after the COG hasbeen ignited, the temperature rises faster because of the higherheating value.Figure 8 presents the NO concentration distributions of central
cross-sections of the BFG, pulverized coal, and COG nozzles. Forthe pulverized-coal cross-section, NO is mainly concentrated inthe zone where the combustion is very intense and the tempera-ture is relatively high (see panel b of Figures 8 and 7). Themaximum NO concentration is 512 ppm. NO distributes acrossalmost the whole COG cross-section because of the effects ofturbulent flow convection and diffusion. Because COG containsthe components such as CH4, H2, and CO and is a reburning fuelfor NO reduction, part of NO formed is reduced at the COG cross-section. The maximum NO concentration therefore decreases, andthe maximum value is 447 ppm. In comparison to the NO con-centrations in the pulverized-coal and COG cross-sections, thatin the BFG cross-section is much lower, with a maximum value of57 ppm. The reason is that the temperature is relatively low andlittle pulverized-coal particles burn here because of the strongcarrying capacity of the BFG and SA mixture flow.3.3. Effects of Increasing the BFG Flow Rate. Figure 10a
presents the average temperature profiles along the furnace height,
Figure 5. Comparison of the calculated and measured average tem-perature profiles along the furnace height.
Table 4. Comparison of the Calculated andMeasured Resultsin Cases 1�3
case number 1 2 3
average residence time of
coal particles (s)
5.99 5.91 5.78
carbon content in
fly ash (%)
calculated 8.29 6.54 4.85
measured 7.61 6 5.03
errora 8.93 9 �3.58
burnout degree of pulverized
coal (%)
calculated 92.98 94.56 96.05
measured 94.6 95.56 96.11
errora �1.71 �1.05 �0.06
NO emission
(ppm, 6% O2)
calculated 254 230 207
measured 281 231 189
errora �9.61 �0.43 9.52
O2 at the exit
(vol %)
calculated 2.18 2.68 3.7
measured 2.04 2.63 3.43
errora 6.86 1.91 7.87a Error = (calculated � measured)/measured � 100.
Figure 6. Velocity fields of central cross-sections of (a) BFG, (b) pulverized coal, and (c) COG nozzles in case 1 (unit: m/s).
319 dx.doi.org/10.1021/ef201149p |Energy Fuels 2012, 26, 313–323
Energy & Fuels ARTICLE
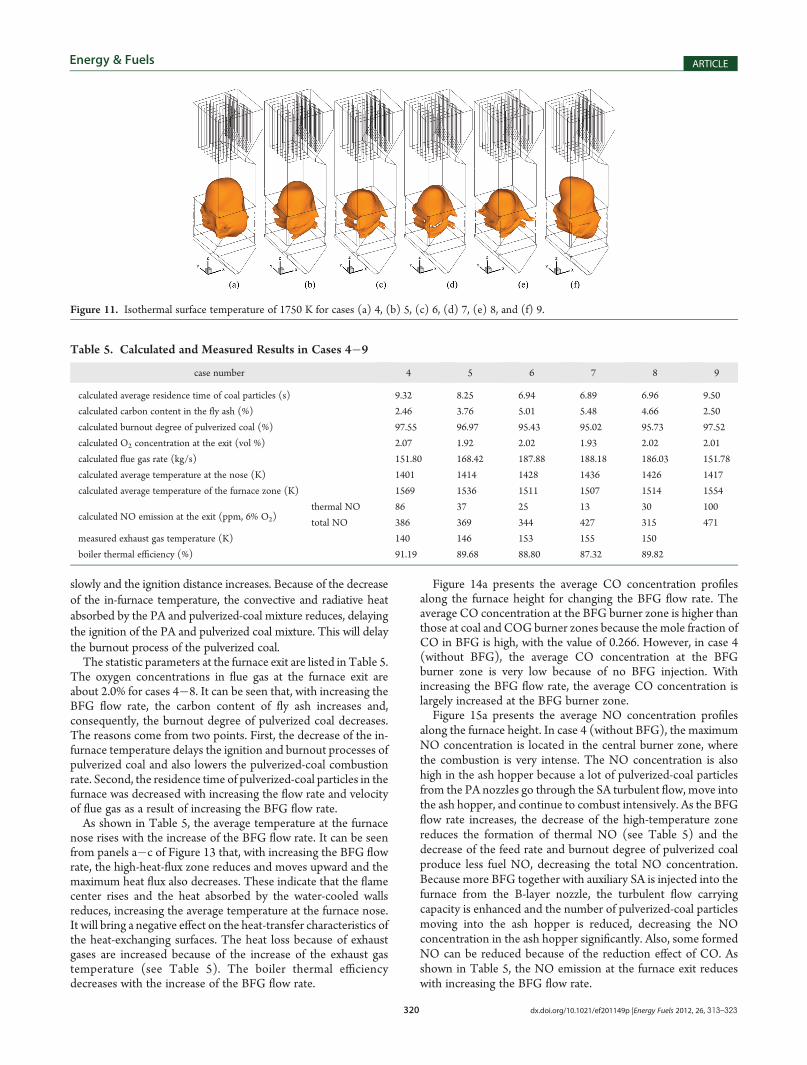
and panels a�c of Figure 11 show the high-temperature zonesof 1750 K in the furnace for cases 4�6. Both the simulatedand experimental results show that, with increasing the BFGflow rate, the in-furnace temperature decreases and the high-temperature zone reduces gradually. As shown in Table 5,increasing the BFG flow rates of 10 and 20% heat input
decreases about 33 and 58 K in the average temperature of thefurnace zone (see Figure 1).The comparison of variation of the temperature along the
central line of the PA nozzle is shown in Figure 12a. As the BFGflow rate increases, the temperature in the early stage rises more
Figure 7. Temperature distributions of central cross-sections of (a) BFG, (b) pulverized coal, and (c) COG nozzles in case 1 (unit: K).
Figure 8. NO concentration distributions of central cross-sections of (a) BFG, (b) pulverized coal, and (c) COG nozzles in case 1 (unit: ppm).
Figure 9. Comparison of variation of the temperature along the centrallines of the BFG, pulverized coal, and COG nozzles in case 1.
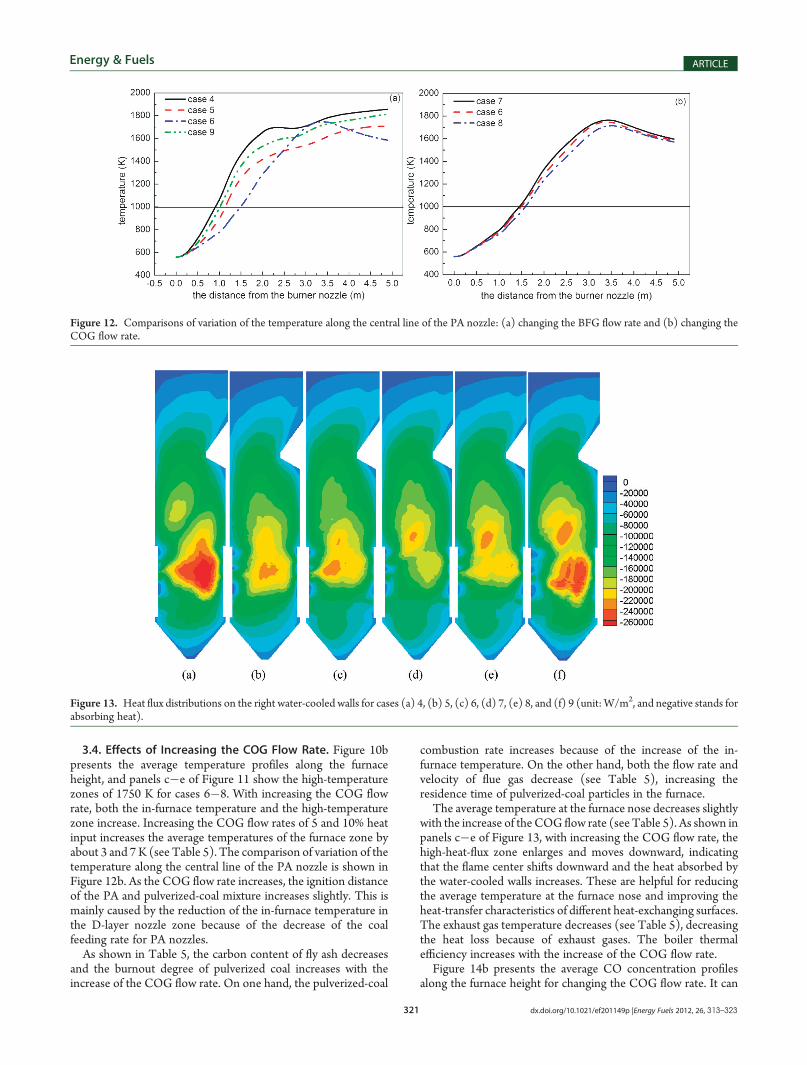
Figure 10. Comparison of the average temperature profiles along thefurnace height: (a) changing the BFG flow rate and (b) changing theCOG flow rate.
320 dx.doi.org/10.1021/ef201149p |Energy Fuels 2012, 26, 313–323
Energy & Fuels ARTICLE
slowly and the ignition distance increases. Because of the decreaseof the in-furnace temperature, the convective and radiative heatabsorbed by the PA and pulverized-coal mixture reduces, delayingthe ignition of the PA and pulverized coal mixture. This will delaythe burnout process of the pulverized coal.The statistic parameters at the furnace exit are listed in Table 5.
The oxygen concentrations in flue gas at the furnace exit areabout 2.0% for cases 4�8. It can be seen that, with increasing theBFG flow rate, the carbon content of fly ash increases and,consequently, the burnout degree of pulverized coal decreases.The reasons come from two points. First, the decrease of the in-furnace temperature delays the ignition and burnout processes ofpulverized coal and also lowers the pulverized-coal combustionrate. Second, the residence time of pulverized-coal particles in thefurnace was decreased with increasing the flow rate and velocityof flue gas as a result of increasing the BFG flow rate.As shown in Table 5, the average temperature at the furnace
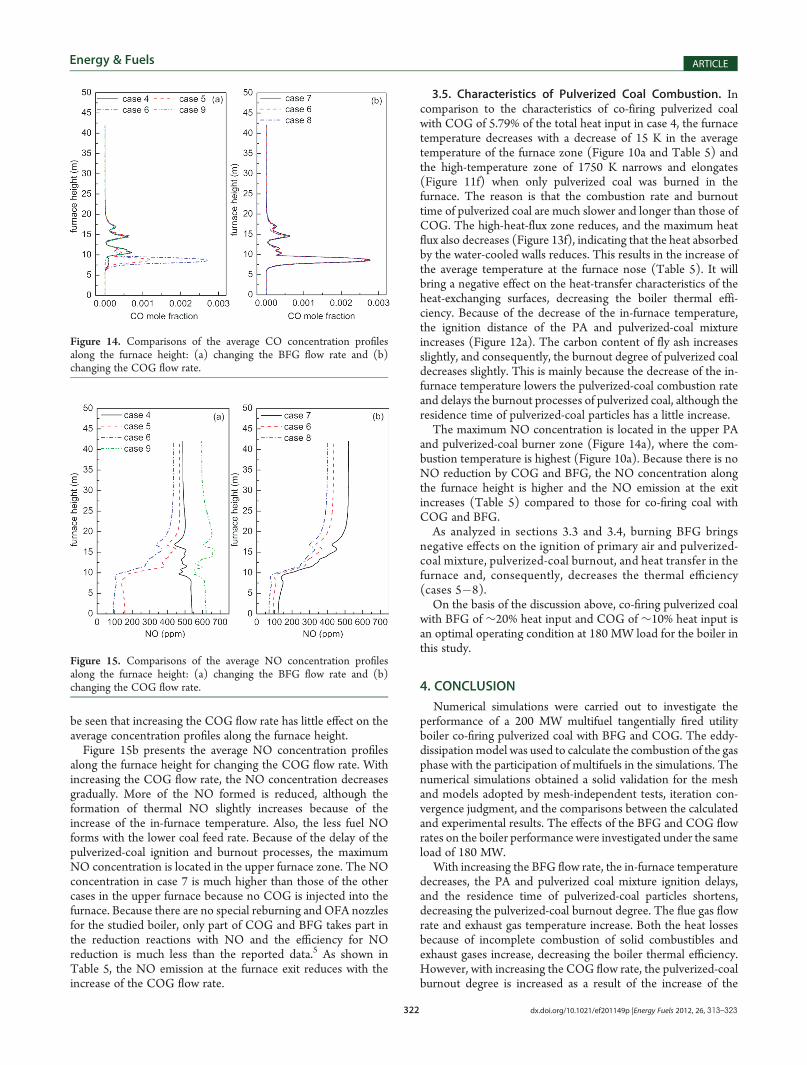
nose rises with the increase of the BFG flow rate. It can be seenfrom panels a�c of Figure 13 that, with increasing the BFG flowrate, the high-heat-flux zone reduces and moves upward and themaximum heat flux also decreases. These indicate that the flamecenter rises and the heat absorbed by the water-cooled wallsreduces, increasing the average temperature at the furnace nose.It will bring a negative effect on the heat-transfer characteristics ofthe heat-exchanging surfaces. The heat loss because of exhaustgases are increased because of the increase of the exhaust gastemperature (see Table 5). The boiler thermal efficiencydecreases with the increase of the BFG flow rate.
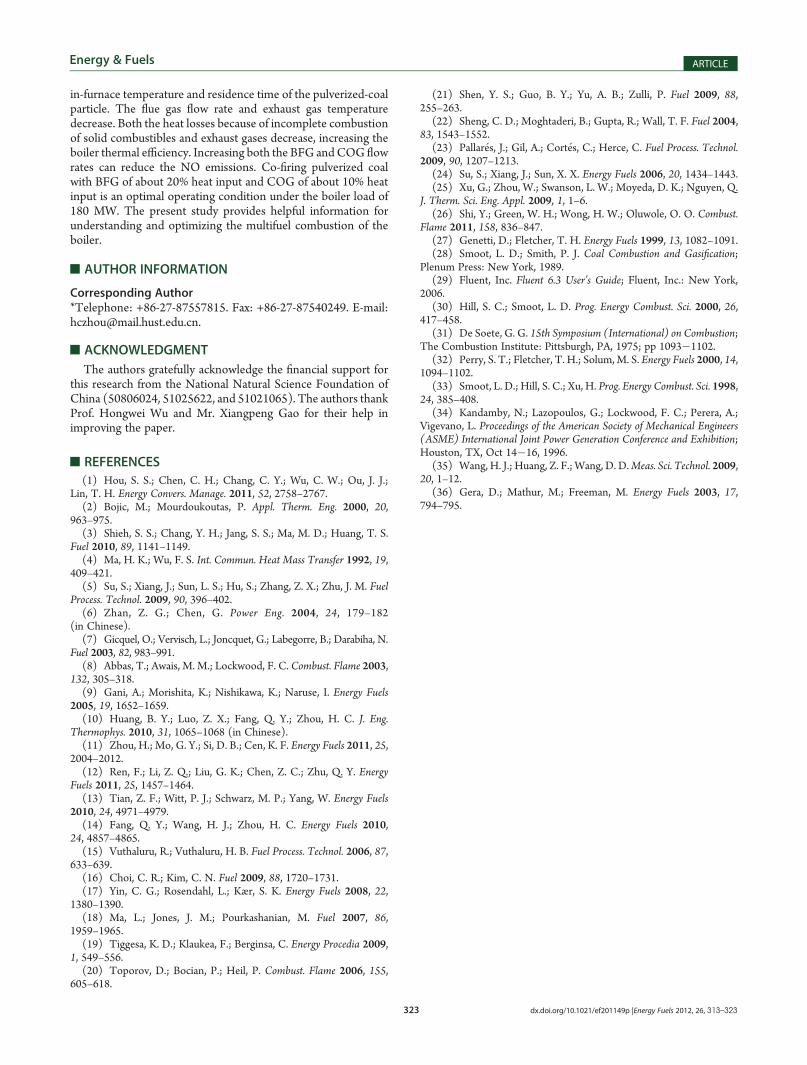
Figure 14a presents the average CO concentration profilesalong the furnace height for changing the BFG flow rate. Theaverage CO concentration at the BFG burner zone is higher thanthose at coal and COG burner zones because the mole fraction ofCO in BFG is high, with the value of 0.266. However, in case 4(without BFG), the average CO concentration at the BFGburner zone is very low because of no BFG injection. Withincreasing the BFG flow rate, the average CO concentration islargely increased at the BFG burner zone.Figure 15a presents the average NO concentration profiles
along the furnace height. In case 4 (without BFG), the maximumNO concentration is located in the central burner zone, wherethe combustion is very intense. The NO concentration is alsohigh in the ash hopper because a lot of pulverized-coal particlesfrom the PA nozzles go through the SA turbulent flow, move intothe ash hopper, and continue to combust intensively. As the BFGflow rate increases, the decrease of the high-temperature zonereduces the formation of thermal NO (see Table 5) and thedecrease of the feed rate and burnout degree of pulverized coalproduce less fuel NO, decreasing the total NO concentration.Because more BFG together with auxiliary SA is injected into thefurnace from the B-layer nozzle, the turbulent flow carryingcapacity is enhanced and the number of pulverized-coal particlesmoving into the ash hopper is reduced, decreasing the NOconcentration in the ash hopper significantly. Also, some formedNO can be reduced because of the reduction effect of CO. Asshown in Table 5, the NO emission at the furnace exit reduceswith increasing the BFG flow rate.
Figure 11. Isothermal surface temperature of 1750 K for cases (a) 4, (b) 5, (c) 6, (d) 7, (e) 8, and (f) 9.
Table 5. Calculated and Measured Results in Cases 4�9
case number 4 5 6 7 8 9
calculated average residence time of coal particles (s) 9.32 8.25 6.94 6.89 6.96 9.50
calculated carbon content in the fly ash (%) 2.46 3.76 5.01 5.48 4.66 2.50
calculated burnout degree of pulverized coal (%) 97.55 96.97 95.43 95.02 95.73 97.52
calculated O2 concentration at the exit (vol %) 2.07 1.92 2.02 1.93 2.02 2.01
calculated flue gas rate (kg/s) 151.80 168.42 187.88 188.18 186.03 151.78
calculated average temperature at the nose (K) 1401 1414 1428 1436 1426 1417
calculated average temperature of the furnace zone (K) 1569 1536 1511 1507 1514 1554
calculated NO emission at the exit (ppm, 6% O2)thermal NO 86 37 25 13 30 100
total NO 386 369 344 427 315 471
measured exhaust gas temperature (K) 140 146 153 155 150
boiler thermal efficiency (%) 91.19 89.68 88.80 87.32 89.82
321 dx.doi.org/10.1021/ef201149p |Energy Fuels 2012, 26, 313–323
Energy & Fuels ARTICLE
3.4. Effects of Increasing the COG Flow Rate. Figure 10bpresents the average temperature profiles along the furnaceheight, and panels c�e of Figure 11 show the high-temperaturezones of 1750 K for cases 6�8. With increasing the COG flowrate, both the in-furnace temperature and the high-temperaturezone increase. Increasing the COG flow rates of 5 and 10% heatinput increases the average temperatures of the furnace zone byabout 3 and 7 K (see Table 5). The comparison of variation of thetemperature along the central line of the PA nozzle is shown inFigure 12b. As the COG flow rate increases, the ignition distanceof the PA and pulverized-coal mixture increases slightly. This ismainly caused by the reduction of the in-furnace temperature inthe D-layer nozzle zone because of the decrease of the coalfeeding rate for PA nozzles.As shown in Table 5, the carbon content of fly ash decreases
and the burnout degree of pulverized coal increases with theincrease of the COG flow rate. On one hand, the pulverized-coal
combustion rate increases because of the increase of the in-furnace temperature. On the other hand, both the flow rate andvelocity of flue gas decrease (see Table 5), increasing theresidence time of pulverized-coal particles in the furnace.The average temperature at the furnace nose decreases slightly
with the increase of the COG flow rate (see Table 5). As shown inpanels c�e of Figure 13, with increasing the COG flow rate, thehigh-heat-flux zone enlarges and moves downward, indicatingthat the flame center shifts downward and the heat absorbed bythe water-cooled walls increases. These are helpful for reducingthe average temperature at the furnace nose and improving theheat-transfer characteristics of different heat-exchanging surfaces.The exhaust gas temperature decreases (see Table 5), decreasingthe heat loss because of exhaust gases. The boiler thermalefficiency increases with the increase of the COG flow rate.Figure 14b presents the average CO concentration profiles
along the furnace height for changing the COG flow rate. It can
Figure 12. Comparisons of variation of the temperature along the central line of the PA nozzle: (a) changing the BFG flow rate and (b) changing theCOG flow rate.
Figure 13. Heat flux distributions on the right water-cooled walls for cases (a) 4, (b) 5, (c) 6, (d) 7, (e) 8, and (f) 9 (unit: W/m2, and negative stands forabsorbing heat).
322 dx.doi.org/10.1021/ef201149p |Energy Fuels 2012, 26, 313–323
Energy & Fuels ARTICLE
be seen that increasing the COG flow rate has little effect on theaverage concentration profiles along the furnace height.Figure 15b presents the average NO concentration profiles
along the furnace height for changing the COG flow rate. Withincreasing the COG flow rate, the NO concentration decreasesgradually. More of the NO formed is reduced, although theformation of thermal NO slightly increases because of theincrease of the in-furnace temperature. Also, the less fuel NOforms with the lower coal feed rate. Because of the delay of thepulverized-coal ignition and burnout processes, the maximumNO concentration is located in the upper furnace zone. The NOconcentration in case 7 is much higher than those of the othercases in the upper furnace because no COG is injected into thefurnace. Because there are no special reburning and OFA nozzlesfor the studied boiler, only part of COG and BFG takes part inthe reduction reactions with NO and the efficiency for NOreduction is much less than the reported data.5 As shown inTable 5, the NO emission at the furnace exit reduces with theincrease of the COG flow rate.
3.5. Characteristics of Pulverized Coal Combustion. Incomparison to the characteristics of co-firing pulverized coalwith COG of 5.79% of the total heat input in case 4, the furnacetemperature decreases with a decrease of 15 K in the averagetemperature of the furnace zone (Figure 10a and Table 5) andthe high-temperature zone of 1750 K narrows and elongates(Figure 11f) when only pulverized coal was burned in thefurnace. The reason is that the combustion rate and burnouttime of pulverized coal are much slower and longer than those ofCOG. The high-heat-flux zone reduces, and the maximum heatflux also decreases (Figure 13f), indicating that the heat absorbedby the water-cooled walls reduces. This results in the increase ofthe average temperature at the furnace nose (Table 5). It willbring a negative effect on the heat-transfer characteristics of theheat-exchanging surfaces, decreasing the boiler thermal effi-ciency. Because of the decrease of the in-furnace temperature,the ignition distance of the PA and pulverized-coal mixtureincreases (Figure 12a). The carbon content of fly ash increasesslightly, and consequently, the burnout degree of pulverized coaldecreases slightly. This is mainly because the decrease of the in-furnace temperature lowers the pulverized-coal combustion rateand delays the burnout processes of pulverized coal, although theresidence time of pulverized-coal particles has a little increase.The maximum NO concentration is located in the upper PA
and pulverized-coal burner zone (Figure 14a), where the com-bustion temperature is highest (Figure 10a). Because there is noNO reduction by COG and BFG, the NO concentration alongthe furnace height is higher and the NO emission at the exitincreases (Table 5) compared to those for co-firing coal withCOG and BFG.As analyzed in sections 3.3 and 3.4, burning BFG brings
negative effects on the ignition of primary air and pulverized-coal mixture, pulverized-coal burnout, and heat transfer in thefurnace and, consequently, decreases the thermal efficiency(cases 5�8).On the basis of the discussion above, co-firing pulverized coal
with BFG of ∼20% heat input and COG of ∼10% heat input isan optimal operating condition at 180 MW load for the boiler inthis study.
4. CONCLUSION
Numerical simulations were carried out to investigate theperformance of a 200 MW multifuel tangentially fired utilityboiler co-firing pulverized coal with BFG and COG. The eddy-dissipationmodel was used to calculate the combustion of the gasphase with the participation of multifuels in the simulations. Thenumerical simulations obtained a solid validation for the meshand models adopted by mesh-independent tests, iteration con-vergence judgment, and the comparisons between the calculatedand experimental results. The effects of the BFG and COG flowrates on the boiler performance were investigated under the sameload of 180 MW.
With increasing the BFG flow rate, the in-furnace temperaturedecreases, the PA and pulverized coal mixture ignition delays,and the residence time of pulverized-coal particles shortens,decreasing the pulverized-coal burnout degree. The flue gas flowrate and exhaust gas temperature increase. Both the heat lossesbecause of incomplete combustion of solid combustibles andexhaust gases increase, decreasing the boiler thermal efficiency.However, with increasing the COG flow rate, the pulverized-coalburnout degree is increased as a result of the increase of the
Figure 14. Comparisons of the average CO concentration profilesalong the furnace height: (a) changing the BFG flow rate and (b)changing the COG flow rate.
Figure 15. Comparisons of the average NO concentration profilesalong the furnace height: (a) changing the BFG flow rate and (b)changing the COG flow rate.
323 dx.doi.org/10.1021/ef201149p |Energy Fuels 2012, 26, 313–323
Energy & Fuels ARTICLE
in-furnace temperature and residence time of the pulverized-coalparticle. The flue gas flow rate and exhaust gas temperaturedecrease. Both the heat losses because of incomplete combustionof solid combustibles and exhaust gases decrease, increasing theboiler thermal efficiency. Increasing both the BFG andCOG flowrates can reduce the NO emissions. Co-firing pulverized coalwith BFG of about 20% heat input and COG of about 10% heatinput is an optimal operating condition under the boiler load of180 MW. The present study provides helpful information forunderstanding and optimizing the multifuel combustion of theboiler.
’AUTHOR INFORMATION
Corresponding Author*Telephone: +86-27-87557815. Fax: +86-27-87540249. E-mail:[email protected].
’ACKNOWLEDGMENT
The authors gratefully acknowledge the financial support forthis research from the National Natural Science Foundation ofChina (50806024, 51025622, and 51021065). The authors thankProf. Hongwei Wu and Mr. Xiangpeng Gao for their help inimproving the paper.
’REFERENCES
(1) Hou, S. S.; Chen, C. H.; Chang, C. Y.; Wu, C. W.; Ou, J. J.;Lin, T. H. Energy Convers. Manage. 2011, 52, 2758–2767.(2) Bojic, M.; Mourdoukoutas, P. Appl. Therm. Eng. 2000, 20,
963–975.(3) Shieh, S. S.; Chang, Y. H.; Jang, S. S.; Ma, M. D.; Huang, T. S.
Fuel 2010, 89, 1141–1149.(4) Ma, H. K.; Wu, F. S. Int. Commun. Heat Mass Transfer 1992, 19,
409–421.(5) Su, S.; Xiang, J.; Sun, L. S.; Hu, S.; Zhang, Z. X.; Zhu, J. M. Fuel
Process. Technol. 2009, 90, 396–402.(6) Zhan, Z. G.; Chen, G. Power Eng. 2004, 24, 179–182
(in Chinese).(7) Gicquel, O.; Vervisch, L.; Joncquet, G.; Labegorre, B.; Darabiha, N.
Fuel 2003, 82, 983–991.(8) Abbas, T.; Awais, M. M.; Lockwood, F. C. Combust. Flame 2003,
132, 305–318.(9) Gani, A.; Morishita, K.; Nishikawa, K.; Naruse, I. Energy Fuels
2005, 19, 1652–1659.(10) Huang, B. Y.; Luo, Z. X.; Fang, Q. Y.; Zhou, H. C. J. Eng.
Thermophys. 2010, 31, 1065–1068 (in Chinese).(11) Zhou, H.; Mo, G. Y.; Si, D. B.; Cen, K. F. Energy Fuels 2011, 25,
2004–2012.(12) Ren, F.; Li, Z. Q.; Liu, G. K.; Chen, Z. C.; Zhu, Q. Y. Energy
Fuels 2011, 25, 1457–1464.(13) Tian, Z. F.; Witt, P. J.; Schwarz, M. P.; Yang, W. Energy Fuels
2010, 24, 4971–4979.(14) Fang, Q. Y.; Wang, H. J.; Zhou, H. C. Energy Fuels 2010,
24, 4857–4865.(15) Vuthaluru, R.; Vuthaluru, H. B. Fuel Process. Technol. 2006, 87,
633–639.(16) Choi, C. R.; Kim, C. N. Fuel 2009, 88, 1720–1731.(17) Yin, C. G.; Rosendahl, L.; Kær, S. K. Energy Fuels 2008, 22,
1380–1390.(18) Ma, L.; Jones, J. M.; Pourkashanian, M. Fuel 2007, 86,
1959–1965.(19) Tiggesa, K. D.; Klaukea, F.; Berginsa, C. Energy Procedia 2009,
1, 549–556.(20) Toporov, D.; Bocian, P.; Heil, P. Combust. Flame 2006, 155,
605–618.
(21) Shen, Y. S.; Guo, B. Y.; Yu, A. B.; Zulli, P. Fuel 2009, 88,255–263.
(22) Sheng, C. D.; Moghtaderi, B.; Gupta, R.; Wall, T. F. Fuel 2004,83, 1543–1552.
(23) Pallar�es, J.; Gil, A.; Cort�es, C.; Herce, C. Fuel Process. Technol.2009, 90, 1207–1213.
(24) Su, S.; Xiang, J.; Sun, X. X. Energy Fuels 2006, 20, 1434–1443.(25) Xu, G.; Zhou, W.; Swanson, L. W.; Moyeda, D. K.; Nguyen, Q.
J. Therm. Sci. Eng. Appl. 2009, 1, 1–6.(26) Shi, Y.; Green, W. H.; Wong, H. W.; Oluwole, O. O. Combust.
Flame 2011, 158, 836–847.(27) Genetti, D.; Fletcher, T. H. Energy Fuels 1999, 13, 1082–1091.(28) Smoot, L. D.; Smith, P. J. Coal Combustion and Gasification;
Plenum Press: New York, 1989.(29) Fluent, Inc. Fluent 6.3 User’s Guide; Fluent, Inc.: New York,
2006.(30) Hill, S. C.; Smoot, L. D. Prog. Energy Combust. Sci. 2000, 26,
417–458.(31) De Soete, G. G. 15th Symposium (International) on Combustion;
The Combustion Institute: Pittsburgh, PA, 1975; pp 1093�1102.(32) Perry, S. T.; Fletcher, T. H.; Solum,M. S. Energy Fuels 2000, 14,
1094–1102.(33) Smoot, L. D.; Hill, S. C.; Xu, H. Prog. Energy Combust. Sci. 1998,
24, 385–408.(34) Kandamby, N.; Lazopoulos, G.; Lockwood, F. C.; Perera, A.;
Vigevano, L. Proceedings of the American Society of Mechanical Engineers(ASME) International Joint Power Generation Conference and Exhibition;Houston, TX, Oct 14�16, 1996.
(35) Wang, H. J.; Huang, Z. F.;Wang, D. D.Meas. Sci. Technol. 2009,20, 1–12.
(36) Gera, D.; Mathur, M.; Freeman, M. Energy Fuels 2003, 17,794–795.