
E101-3161A - Bubbling Fluidized-Bed Boilers - Windsor Energy

Ž .Powder Technology 109 2000 27–40www.elsevier.comrlocaterpowtec
Numerical simulation of metallic solid bridging particles in a fluidizedbed at high temperature
Kenya Kuwagi ), Takafumi Mikami, Masayuki HorioDepartment of Chemical Engineering, Tokyo UniÕersity of Agriculture and Technology, Koganei, Tokyo 184-8588, Japan
Accepted 20 September 1999
Abstract
Ž .High temperature fluidization of iron particles was investigated by numerical simulation based on the discrete element method DEMas a case study for metallic bridging. A model was developed for metallic solid bridging by surface diffusion mechanism including theeffect of surface roughness. The simulated fluidization behavior was highly time dependent, which is completely different from our
w Ž . xprevious results for liquid bridging particles T. Mikami, H. Kamiya, M. Horio, Chem. Eng. Sci. 53 1998 1927. . Both the amplitude ofpressure fluctuation and the absolute value of bed pressure drop decreased with time. These tendencies agreed well with the experimental
w Ž . xdata of Mikami et al. T. Mikami, H. Kamiya, M. Horio, Powder Techonol. 89 1996 231. although temperature and bed size weredifferent. Size and shape of agglomerates were much different for different surface roughness models. Hypha-shaped agglomerates were
Ž .more dominant in the case of the lowest cohesiveness three-microcontact-point model . The size of agglomerates grown on the wall waslargest for the largest cohesiveness and smallest for the smallest cohesiveness. q 2000 Elsevier Science S.A. All rights reserved.
Keywords: Numerical simulation; Discrete element method; Surface diffusion; Iron particles; Agglomerate; Defluidization
1. Introduction
Metallic solid bridging is a well-recognized factor dom-inant in metallic fluidized bed processes such as iron oxidereduction and silicon CVD if they are conducted in a
w xfluidized bed. Mikami et al. 1 carried out an experimentalinvestigation for a typical case of iron particles at hightemperatures and concluded that the neck growth of solidbridging and the cohesion force between iron particles canbe predicted by the surface diffusion model of Kuczynski’sw x2 sintering models. Although investigations into metallicsolid bridging fluidized beds have been conducted for
w xprocess developments 3–5 , and defluidization modelsw xwere recently proposed by Iwadate and Horio 6 and
w xKnight et al. 7 , no attempt has ever been made toformulate the whole mechanism of agglomerating fluidiza-tion behavior of bridging metallic particles. Recently,
w x Ž .Mikami et al. 8 developed a simulation code SAFIREŽ .based on the discrete element method DEM , considering
cohesion force by liquid bridging, and they successfullysimulated agglomerating fluidized bed behavior of wet
) Corresponding author. Tel.: q81-42-388-7067; fax: q81-42-386-3303; e-mail: [email protected]
w xparticles. Iwadate and Horio 9 extended such simulationinto fluidized particles with van der Waals force interac-tion. However, the sintering phenomenon is quite timedependent because sintering necks between contacting par-ticles grow rather rapidly with time. Accordingly, thefluidization behavior of solid bridging particles is com-pletely different from that of liquid bridging particles or
w xgroup C particles of Geldart 10 classification. In thispaper, a solid bridging model is developed and applied fornumerical simulation of high temperature fluidization ofiron particles. Since agglomerating fluidization behaviordepends on the properties of agglomerates, attention isfocused also on the size and shape of agglomerates formedin the bed.
2. Theoretical analysis
2.1. Definition of time
Three kinds of time are used in the present model. Thefirst is the absolute time, t, starting from the beginning ofcomputation. The second is the time of neck growth, t ,neck
corresponding to each neck. When a neck is broken in acollision, t for the neck is reset to zero. The third is theneck
0032-5910r00r$ - see front matter q 2000 Elsevier Science S.A. All rights reserved.Ž .PII: S0032-5910 99 00224-7

( )K. Kuwagi et al.rPowder Technology 109 2000 27–4028
time, t , for collision analysis having its origin at anyc
instance of our interest.
2.2. GoÕerning equations
The following locally averaged equations of Andersonw xand Jackson 11 are used as governing equations for gas
phase. These are the same as those used in the previousŽ w x.DEM simulations e.g., Refs. 8,12 .
2.2.1. Fluid phaseContinuity equation:
E´ E ´ uŽ .iq s0. 1Ž .
E t E x i
Momentum balance:
E ´ u E ´ u u E pŽ . Ž .i i jr qr sy´ y f . 2Ž .f f iE t E x E xj i
´ is the voidage, p the fluid pressure, f the fluid–particlei
interaction force as shown in Appendix A. The SIMPLEŽ .Semi-Implicit Method for Pressure-Linked Equations
w xscheme of Patanker 13 is adopted to solve the pressurefield of fluid.
2.2.2. Particle motionEquations of motion for each particle are as
follows.Translational motion:
dÕm symgqF qF qF qF , 3Ž .pi n t cd t
Rotational motion:
dvI sF r , 4Ž .t pd t
where, m is the particle mass, F is fluid–particle interac-pi
tion force acting on a particle, g is gravity acceleration, Fn
is the normal component of the soft sphere contact interac-tion, F is the tangential component of the soft spheret
contact interaction, F is cohesive interaction force, I isc
moment of particle inertia, v is angular velocity, and r ispŽ .the radius of a particle. Eq. 4 is the corrected angular
w x Žmomentum equation of Mikami et al. 8 i.e., the right-Ž . < < .hand side of Eq. 4 was written as F r by mistake . F ,t p pi
F and F are defined in Appendix A. The expression forn t
F , the solid bridging force in the present investigation, isc
derived in Section 2.3.3.
2.3. Model for solid bridging force
2.3.1. Mechanism of sinteringThe surface diffusion and the volume diffusion mecha-
nisms are the most significant ones in sintering of metalw xpowders. Kuczynski 2 derived the following relationships
between neck growth time t and neck radius x forneck neck
both the surface diffusion and the volume diffusion cases:
1r7456gd3x s D a t surface diffusion ,Ž .neck s neckž /k TB
5Ž .1r5310gd
2x s D a t volume diffusion ,Ž .neck v neckž /k TB
6Ž .
where a is the curvature radius, D is the surface diffusions
coefficient, D is the volume diffusion coefficient, k isv B
the Boltzmann constant, T is temperature, g is the surfacetension, and d is the lattice constant.
It has been said that surface diffusion is the mainmechanism that plays in sintering of iron powder at lower
Ž . w xtemperatures -1323 K 14 . The surface diffusivity ofw xiron is given by Matsumura 14 by:
D sD exp yE rRT , 7aŽ . Ž .s 0,s s
where frequency factor, D , and activation energy of0,s
volume diffusion, E , are given as follows:s
D s2.4 m2rs,0,s
E s2.42=105 Jrmol T-1180 K : for ayFe ,Ž .s
7bŽ .
D s5.2=10y2 m2rs,0,s
E s2.21=105 Jrmol 1180 K-T : for gyFe .Ž .s
7cŽ .
[ ]2.3.2. Experimental results by Mikami et al. 1Experimental data of solid bridging particles by Mikami
w xet al. 1 are shown in Fig. 1. Typical SEM images of aŽ .contact point are shown in Fig. 1 a , where sintered necks
between particles can be observed. These samples wereprepared by keeping steel shots at 923 or 1123 K for 1 h.
Ž .In Fig. 1 b , it is shown how heat treatment temperatureaffected the neck diameter. The upper solid line in Fig.Ž .1 b shows the neck diameter calculated from the Kuczyn-
Ž .ski’s surface diffusion model, Eq. 5 . In the high tempera-Ž .ture region T)973 K , the observed neck diameters
agreed well with those calculated. However, in the lowtemperature region, the observed neck diameters weremuch smaller than those calculated for d s200 mm.p
Here, the curvature radius for surface roughness of ironparticles was estimated from SEM photographs as about
Ž .10 mm. The lower line in Fig. 1 b was calculated from thesurface diffusion model for as10 mm. The neck diame-ters, thus estimated from the neck growth behavior, agreedfairly well with the visually observed ones. From practicalviewpoints, the surface roughness appears to be an impor-tant parameter for estimating the defluidization behavior.

( )K. Kuwagi et al.rPowder Technology 109 2000 27–40 29
w xFig. 1. Experimental data of solid bridging particles 1 .
2.3.3. Assumptions for calculationsFor the present model formulation, the following as-
sumptions are made.
Ž .1 The spring constant of the solid bridge, for bothrepulsion and attraction, is the same as that of bulk mate-rial’s.

( )K. Kuwagi et al.rPowder Technology 109 2000 27–4030
Fig. 2. Schematic of surface roughness and magnification of a contact point.
Ž .2 A neck is formed between any particles in contact.Ž .3 The neck radius increases with contact time follow-
Ž Ž ..ing the Kuczynski’s surface diffusion model Eq. 5 .Accordingly, the solid bridging force is expressed as fol-lows:
F sp x 2 s . 8Ž .c neck neck
Ž .4 In particle collision calculation, softened HookeanŽ .spring constant ks800 Nrm is adopted due to computa-
tion efficiency. For dry particles as well as liquid bridgedparticles the spring constant was found not significantly
w xaffecting over the range of ks800–80 000 Nrm 15 .However, in the case of solid bridging, the neck size at theend of collision needs to be calculated based on the realtime for collision, i.e., the one for a nonmodified Hertzianspring, so that the judgement whether the neck is brokenafter collision or not is not affected by the adoption of thesoftened Hookean spring for computation economy. Inorder to compromise them, the neck growth rate during thedeformationrcollision period is adjusted so that the neckcan have the same size at the end of a softened Hookeancollision as that at the end of a nonsoftened Hertziancollision. This is expressed by the following equation:
t s t q tq , 9Ž .neck neck ,0 neck
where tq is an increment of the modified neck growthneck
time from the beginning of a collision now taking place tocalculate the neck size given by:
td ,Hertzqt s t . 10Ž .neck c td ,Hooke
The collision time from Hertz and Hooke models in thew xabove equation, t 16 and t , are given by:d,Hertz d,Hooke
1r52mt s2.44 , 11Ž .d ,Hertz 2ž /a Õr
mt sp , 12Ž .(d ,Hooke k
where Õ is the relative velocity at the beginning ofr
collisionrdeformation and:
E d( pa' . 13Ž .23 1ynŽ .
Accordingly, the size of a neck that had the size x atneck,0Ž .t s t , from Eq. 5 , can be expressed by:neck neck,0
1r7tneckx t sx . 14Ž . Ž .neck neck ,0 ž /tneck ,0
When a deformation period is over, i.e., t s t , the neckc c1
is examined if it can still survive. If it can, the additionaltime to compensate the above artificial retardation shouldbe introduced. At contact time t s t , t is set to returnc c1 neck
to the time of ordinary speed. Accordingly:
t s t q t . 15Ž .neck neck ,0 c1
ŽHowever, in the present computation, this correction wasnot executed. This implies the neck size might be 1.4times, at most, and the rupture force was two times,
.underestimated.Ž .5 Since surface roughness is important in estimating
neck diameter as discussed in Section 2.3.2, surface rough-ness is approximately taken into account by introducing

( )K. Kuwagi et al.rPowder Technology 109 2000 27–40 31
spherical subgrains into the particle surface as illustrated inFig. 2. The radius of a grain, r , is used as the curvatureg
Ž . w xradius a in Eq. 5 . For steel shots, Mikami et al. 1obtained 10 mm for the curvature radius of surface rough-ness and 6 mm for apparent diameter of roughness. Whensurface roughness exists, a macroscopic contact point maybe broken down to multiple microcontact points. Thenumber of microcontact points between particles with sur-
Žface roughness at one contact point is either 3 Case 2:. Žthree-microcontact-point model , or 9 Case 3: nine-micro-
.contact-point model as shown in the plan of Fig. 2. Thepresent computation covers only the earliest part of sinter-ing and accordingly further complications, such as themerge of microcontact points into a larger single contactpoints, were not attempted. The cohesive force due to solidbridging depends on the summation of the cross-sectionalarea of necks of the microcontact points. Neck cross-sec-
Ž .tional areas calculated by Kuczynski’s Eq. 5 are shownin Fig. 3 for the three cases. The tensile strengths of acontact point at neck growth time, t , for the three casesneck
are given as follows:
2r7456gd3F sps D a t 'Fc neck s neck c1ž /k TB
Case 1: Smooth surface , 16Ž . Ž .
2r74 356gd aF s3ps D t s0.417Fc neck s neck c1ž /½ 5k T 10B
Case 2: threeymicrocontactypoint model , 17Ž . Ž .
2r74 356gd aF s9ps D t s1.25Fc neck s neck c1ž /½ 5k T 10B
Case 3: nineymicrocontactypoint model , 18Ž . Ž .
where a is the curvature radius for Case 1, 100 mm. AsŽcan be seen from the above three expressions, Case 3 nine
.microcontact points gives the largest strength, then Case 1Ž . Ž .smooth surface and Case 2 three microcontact pointsgives the smallest.
Ž .6 Neck breakage takes place if either of the forcesacting on the contact point in normal or tangential direc-tion satisfies the following rupture conditions:
< <F Gs ÝA , 19Ž .n neck neck
< <F Gt ÝA , 20Ž .t neck neck
Ž . Ž .where A in Eqs. 19 and 20 is the sum of theneck
cross-sectional areas of all microcontact points in eachcontact point.
Ž .7 Friction coefficient of two particles in contact isassumed to be infinity so that a contact point can be fixed.
( )2.3.4. Determination of sintered true agglomeratesTo analyze the bed structure at one instant, agglomer-
ates are defined as clusters of primary particles connectedby necks strong enough to survive the whole deformationand elastic repulsion, which the relevant particles areexperiencing at a certain instant. Accordingly, taking oneprimary particle arbitrarily and checking all contact pointssuccessively for all connected particles, an agglomeratecan finally be determined. However, from assumption 2 inSection 2.3.3, a neck exists in all particle-to-particle con-tact points but some weak ones of them may be brokenalmost immediately. Also, by the effect of macroscopicbed motion, any already existing necks, not too weak ones,can be recompressed or restrained and severed again.Therefore, let us introduce a simplified analysis to judge ifa neck can exist after the rebounce of two particles having
Ž .deformation x i.e., the overlapping of two spheres ,0
relative velocity Õ and the sum of forces ÝF at an0 0
instant t s0 we are looking at. The overlapping length xc
of two particles satisfies the following momentum balanceequation:
d2 x d xm qh qkxsSF , 21Ž .2 d td t cc
where h is damping coefficient, ÝF is the sum of com-pression forces acting on two contacting particles. Assum-ing that ÝF remains constant during an ongoing contactŽ . Ž .i.e., ÝFsÝF , the general solution of Eq. 21 is given0
as follows:
2(h 4mkyh2 2(xsexp y t C qC sin t qbc 1 2 cž / ž /2m 2m
ÝF0q , 22Ž .
kh h
Õsy exp y tcž /2m 2m
=
2(4mkyh2 2(C qC sin t qb1 2 cž /2m
2(h 4mkyh2 2(qexp y t C qCc 1 2ž /2m 2m
=
2(4mkyhcos t qb , 23Ž .cž /2m
b' tany1 C rC ,Ž .1 2
where C and C are arbitrary constants.1 2
Suppose the displacement x and the relative velocity0Ž .Õ at present t s0 are known. From xsx and ÕsÕ0 c 0 0
at t s0, C and C are determined as:c 1 2
ÝF 2mÕ qhC0 0 1C sx y , C s . 24Ž .1 0 2 2k (4mkyh

( )K. Kuwagi et al.rPowder Technology 109 2000 27–4032
w xFig. 3. Neck growth by the surface diffusion mechanism 2 .
The time tU at which the overlap becomes zero can becŽ ŽŽapproximately determined i.e., assuming exp yhr
. U . . Ž . U2m t (1 from Eq. 22 by substituting xs0 at t s tc c c
and solving it for tU :c
2(h 4mkyhU U2 2(exp y t C qC sin t qbc 1 2 cž / ž /2m 2m
ÝF0q s0, 25Ž .
k
2m ÝFU y1t s ybysinc ( 2 2 2ž /4mkyh (k C qC1 2
= yt - tU - t , 26Ž . Ž .d c d
where t is duration of contact.dŽ . UFrom Eq. 26 , we have two solutions for t , onec
negative tU and the other positive tU , within yt - tU - t .1 2 d c d
tU is the time where the two particles are supposed to have1
come into contact and tU is the time when they will2
separate. From tU and tU , the time t when the fictitious1 2 m
of the two overlap reaches its maximum is calculated by:
tU q tU1 2
t s . 27Ž .m 2
Now, the maximum repulsion force F is obtained as:rep
h2 2(F skx sk exp y t C qCrep max m 1 2ž /2m
=
2(4mkyhsin t qb qSF . 28Ž .mž /2m
Accordingly, the neck strength can be judged by thefollowing criterion:1. If F )F , the neck breaks even if the two particlesrep c
remain in physical contact.
Table 1Computation conditions
Particles: steel shot Gas:H :N s3:12 2
Number of particles 7000 Temperature 1273 K3 y5Particle density 7800 kgrm Viscosity 2.29=10 Pa s
y2 3Particle diameter 200 mm Density 9.67=10 kgrm10 2Young modulus 8.0=10 Nrm Collision parameters
Poisson ratio 0.28 Restitution coefficient 0.9Tensile strength Friction coefficient `
6Normal, s 4.0=10 Pa Spring constant 800 Nrmneck7Tangential, t 1.6=10 Pa Computational grid parametersneck
y10Lattice constant 2.89=10 m Number of fluid cells 21=82y2 3 y6Boltzman constant 1.38=10 JrK Time step 1.00=10 s
Surface energy 1.72 Nrm Fluidized bed parametersColumn size 0.0153=0.06 mDistributor
Number of nozzles 3Diameter of a nozzle 0.73 mm

( )K. Kuwagi et al.rPowder Technology 109 2000 27–40 33
2. If F -F , the neck remains after the rebounce andrep c
the two particles are sintered to remain in the sameagglomerate.A growth of particles connected by both physical con-
tacts and sintered necks is called a ‘‘superficial agglomer-ate’’ and a group of particles connected only by sintered
necks is called a ‘true agglomerate’ in this paper if neces-sary.
2.4. Computation conditions
Computation condition is depicted in Table 1. Corre-w xsponding to the experimental condition 1 , the particle
Fig. 4. Pressure drop of bridging iron.

()
K.K
uwagiet
al.rP
owder
Technology
1092000
27–
4034
Fig. 5. Snapshots showing fluidization behavior of solid bridging particles without surface roughness.

()
K.K
uwagiet
al.rP
owder
Technology
1092000
27–
4035
Ž .Fig. 6. Snapshots showing fluidization behavior of solid bridging particles with surface roughness curvature radiuss10 mm, three microcontact points .

( )K. Kuwagi et al.rPowder Technology 109 2000 27–4036
diameter chosen was 200 mm. The bed was fluidized atsuperficial gas velocity, u s0.26 mrs and the bed aspect0
ratio LrD was 1.2. It took about 1.5 h for a bed tow xdefluidize by sintering at 773 K 1 . To save computation
time, the temperature in the present computation wasartificially set at a very high temperature 1273 K so thatsintering could take place much earlier. Sintering wasnumerically allowed to start after the first 0.5 s, i.e., after afree bubbling condition was achieved. For numerical deter-mination of agglomerate size and shape, all particle-to-par-ticle contact points were sampled for x and Õ and F0 0 rep
were estimated. Then the criterion defined in Section 2.3.4was applied to construct agglomerate images.
3. Results and discussions
3.1. Fluidization behaÕior
Ž .The calculated bed pressure drop is shown in Fig. 4 a .Both amplitude of pressure fluctuation and absolute valueof the pressure drop decreased with time. The formerdecrease corresponds to the decrease in the effective bedheight due to sintering in the bed bottom region and thelatter corresponds to gas flow through channels wherepressure drop is less than that through a dense bed. The
Ž .calculated result for Case 1 without surface roughnessŽshows the same tendency as that for Case 3 with surface
.roughness although defluidization took place earlier inCase 3. These two tendencies, i.e., decreasing amplitude ofpressure fluctuation and decreasing absolute value of pres-
Žsure drop, can be seen in the experimental result Fig.Ž ..4 b obtained for particles of the same density and diame-
ter as the computed except for temperature and the bedsize. In the experiment, the temperature was much lowerand the bed height was much higher than the computingcondition, and accordingly, the pressure fluctuation due tobubbling was much longer and the pressure decreasing ratewas much smaller.
Fig. 5 shows snapshots of the fluidization behavior ofŽsolid bridging particles for Case 1 without surface rough-
. Žness and Fig. 6 for Case 2 three-microcontact-point.model . These fluidization behaviors are completely differ-
w xent from that of liquid bridging particles 8 . In the snap-shots of Fig. 5, agglomerating fluidization can be found inthe upper region of the bed. In the bottom region betweennozzles, the dead zones are much larger than that of
w xnoncohesive particles 8 . In the snapshot at ts3.25 sroughly, the lower half of bed was sintered. On the otherhand, the dead zones between nozzles were smallest, chan-nels were shortest and the sintering was weakest in Case 2Ž .three-microcontact-point model .
Ž . Ž .Fig. 7. Agglomerates or ‘‘dead zones’’ grown on the wall ts1.21 s .

( )K. Kuwagi et al.rPowder Technology 109 2000 27–40 37
Table 2Number of contact points
Case 1 2 3
Surface Smooth Three micro- Nine micro-contact points contact points
Total contact points 7635 2262 7883Ž .physicalqsintered
Ž . Ž . Ž .Physical contact 108 1.41% 580 25.6% 157 1.99%points
Fig. 7 shows the dead zone, i.e., agglomerates adheredto the wall for the three cases at ts1.21 s. The deadzones growing between nozzles at the bottom in Case 1were much larger than those in Case 2. A large agglomer-ate is hanging from the left wall in Case 1 at this moment,
which should have been broken afterwards at least partlyby bubbles as can be seen in Fig. 5. In Case 3, theagglomerates adhered to the side walls were more stableand larger than in other cases. These are in accordancewith the order of cohesive force shown in Fig. 3.
3.2. Shape and size of agglomerates
Table 2 shows the number of contacting points. Thenumber of total contact points is small for the case ofthree-microcontact-point model and the number of physi-cal contact points is larger than others. This is understoodto be caused by the weakest cohesive force.
Fig. 8 shows cumulative size distributions of agglomer-Ž .ates at ts1.21 s, i.e., a cumulative over size in number
Fig. 8. Cumulative number and weight distributions of agglomerates.
( )K. Kuwagi et al.rPowder Technology 109 2000 27–4038
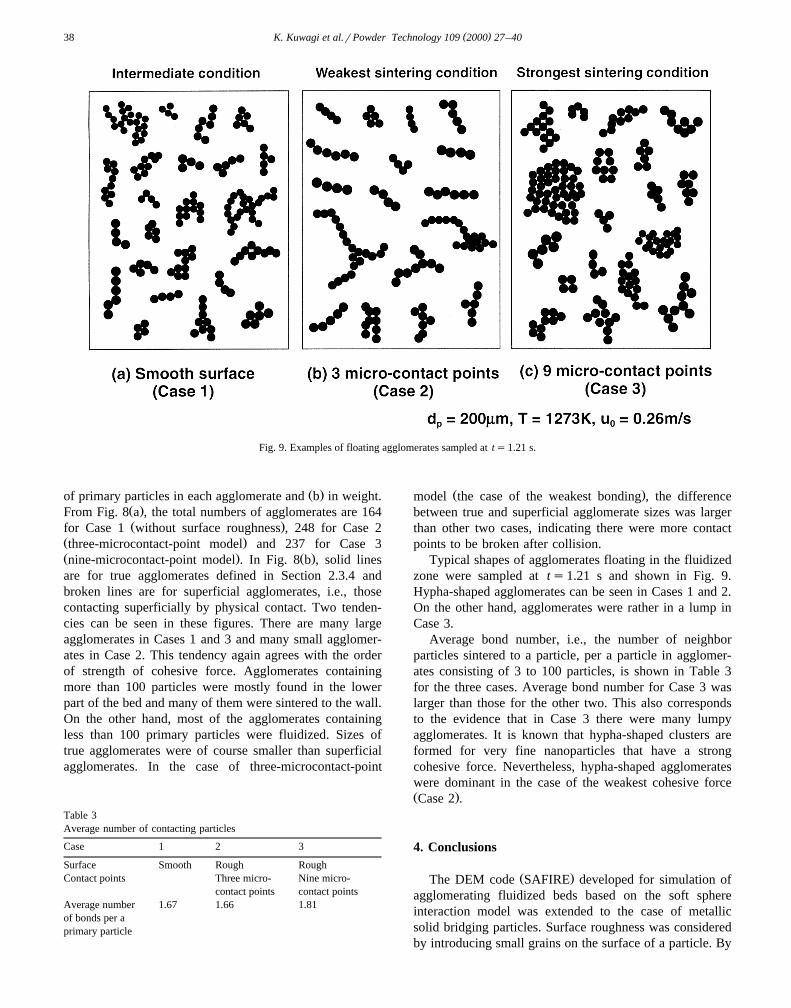
Fig. 9. Examples of floating agglomerates sampled at ts1.21 s.
Ž .of primary particles in each agglomerate and b in weight.Ž .From Fig. 8 a , the total numbers of agglomerates are 164Ž .for Case 1 without surface roughness , 248 for Case 2
Ž .three-microcontact-point model and 237 for Case 3Ž . Ž .nine-microcontact-point model . In Fig. 8 b , solid linesare for true agglomerates defined in Section 2.3.4 andbroken lines are for superficial agglomerates, i.e., thosecontacting superficially by physical contact. Two tenden-cies can be seen in these figures. There are many largeagglomerates in Cases 1 and 3 and many small agglomer-ates in Case 2. This tendency again agrees with the orderof strength of cohesive force. Agglomerates containingmore than 100 particles were mostly found in the lowerpart of the bed and many of them were sintered to the wall.On the other hand, most of the agglomerates containingless than 100 primary particles were fluidized. Sizes oftrue agglomerates were of course smaller than superficialagglomerates. In the case of three-microcontact-point
Table 3Average number of contacting particles
Case 1 2 3
Surface Smooth Rough RoughContact points Three micro- Nine micro-
contact points contact pointsAverage number 1.67 1.66 1.81of bonds per aprimary particle
Ž .model the case of the weakest bonding , the differencebetween true and superficial agglomerate sizes was largerthan other two cases, indicating there were more contactpoints to be broken after collision.
Typical shapes of agglomerates floating in the fluidizedzone were sampled at ts1.21 s and shown in Fig. 9.Hypha-shaped agglomerates can be seen in Cases 1 and 2.On the other hand, agglomerates were rather in a lump inCase 3.
Average bond number, i.e., the number of neighborparticles sintered to a particle, per a particle in agglomer-ates consisting of 3 to 100 particles, is shown in Table 3for the three cases. Average bond number for Case 3 waslarger than those for the other two. This also correspondsto the evidence that in Case 3 there were many lumpyagglomerates. It is known that hypha-shaped clusters areformed for very fine nanoparticles that have a strongcohesive force. Nevertheless, hypha-shaped agglomerateswere dominant in the case of the weakest cohesive forceŽ .Case 2 .
4. Conclusions
Ž .The DEM code SAFIRE developed for simulation ofagglomerating fluidized beds based on the soft sphereinteraction model was extended to the case of metallicsolid bridging particles. Surface roughness was consideredby introducing small grains on the surface of a particle. By

( )K. Kuwagi et al.rPowder Technology 109 2000 27–40 39
taking into account the cohesiveness of particles at hightemperatures by surface diffusion sintering, the fluidizationbehavior of metallic particles was successfully demon-strated in terms of decreasing pressure fluctuation andupward growing channels between dead zones.
Furthermore, size and shape of agglomerates were in-vestigated. A sintered agglomerate at an instance is definedas cluster of primary particles where all bridges containedin it can remain even when on-going collisions relax. Tojudge if a neck is remaining or parting after relaxation, thecohesive force and the repulsion force for each neck werecompared. The sizes and shape of agglomerates includingdead zones depended on the cohesive force. Many largeagglomerates as well as strong dead zones were observedin the case of strong cohesive force. Hypha-shaped ag-glomerates were found most in the cases of the three-mi-crocontact-point model and the smooth surface model. Onthe other hand, agglomerates showed a lump shape withfew hypha-shaped agglomerates for the case of the nine-microcontact-point model, although the cohesive force isalmost the same as in the case of a smooth surface.
5. Nomenclature
Ž 2 .A Neck cross-sectional area mneckŽ .a Curvature radius of surface roughness m
Ž 2 .D Surface diffusion coefficient m rssŽ 2 .D Frequency factor m rs0,sŽ .d Particle diameter mpŽ 2 .E Young’s modulus Nrm
E Activation energy of surface diffusionsŽ .Jrmol
Ž . Ž .F Cohesive force solid bridging force Nc
F Normal soft sphere interaction at contactnŽ .N
F Fluid–particle interaction force acting onpiŽ .a particle N
Ž .F Maximum repulsion force Nrep
F Tangential soft sphere interaction at con-tŽ .tact N
f Fluid–particle interaction force acting oniŽ 3.unit volume Nrm
Ž 2 .g Gravity acceleration mrsŽ 2 .I Moment of particle inertia kg m rs
Ž .k Spring constant NrmŽ .k Boltzmann constant JrKB
Ž .m Particle mass kgŽ .R Gas constant Jrmol K
Ž .r Curvature radius of a grain mgŽ .r Radius of a particle mp
Ž .T Temperature KŽ .t Time s
Ž .t Time for collision analysis sc
tU Time at which particles’ overlap becomescŽ .zero s
t Termination time of particle deformationc1Ž .s
t Duration of collision estimated by Hertzd,HertzŽ .theory s
t Duration of collision estimated by Hooked,HookeŽ .theory s
Ž .t Neck growth time sneckq Ž .t Modified neck growth time increment sneck
Ž .u Superficial gas velocity mrs0Ž .u Minimum fluidization velocity mrsmf
Ž .u Gas velocity mrsŽ .Õ Particle velocity mrs
Õ The relative velocity at the beginning ofrŽ .collisionrdeformation mrs
Ž .x Displacement by collision mŽ .x Neck radius mneck
Greek letters2Ž .a 'E d r3 1yn( p
Ž .D P Bed pressure drop PaŽ .d Lattice constant m
Ž .´ Voidage yŽ .h Damping coefficient y
Ž .m Friction coefficient yŽ .g Surface tension Nrm
Ž .m Gas viscosity PasfŽ .n Poisson’s ratio y
Ž 3.r Gas density kgrmfŽ 3.r Particle density kgrmp
Ž .s Tensile strength of a neck PaneckŽ .t Shear strength of a neck Paneck
Ž .v Angular velocity 1rs
Appendix A
Constitutive equations for fluid–particle and particle–particle interactions are as follows.
A.1. Fluid–particle interaction
Ž .For a cell being in a dense condition ´-0.8 , thew xwell-known pressure drop equation of Ergun 17 is used
to estimate the force acting on unit volume, f :i21y´ m uyÕŽ . Ž .f
f s150i 2´ dp
< <r uyÕ uyÕŽ .fq1.75 1y´ , 29Ž . Ž .
dp
where m is the gas viscosity, u is gas velocity and Õ isf
the average particle velocity in a fluid cell. The force, F ,pi
acting on a single particle in the fluid cell, is obtained bytaking into account the effective buoyancy force. Theeffective buoyancy force is caused by the pressure gradient

( )K. Kuwagi et al.rPowder Technology 109 2000 27–4040
of the gas phase. In the present calculations, the pressuregradient is estimated as yf r´ , which can be obtained byi
Ž . Žassuming in Eq. 2 that the acceleration term the sum of.the two terms in the left-hand side for the gas element is
negligible. Then we can write:
f d p ft iF s y V ( , 30Ž .pi pn d x ´ n
where n is the number of particles in a fluid cell and V isp
the volume of a particle. For a cell being in the diluteŽ .condition ´)0.8 , the modified Stokes-type single parti-
Ž w x.cle drag force Wen and Yu 18 is used for the force Fpi, l
acting on particle l in a cell i:p
X 2 2< <F s C r ´ uyÕ uyÕ d , 31Ž . Ž .pi , l D f l l p8
CX s´y4 .65C , 32Ž .D D
240.687C s lq0.15Re Re-1000,Ž .D Re
C s0.44 ReG1000, 33Ž .D
Ž < <.where Res r ´ d uyÕ rm , d is the particle diame-f p l f p
ter, C is the drag coefficient for an isolated singleD
particle, CX is the modified drag coefficient, and Õ is theD l
velocity of particle l. The summation of the force actingŽ .on all particles ls1–n in a fluid cell i is adopted for
F in the fluid dynamic calculation.pi, l
A.2. Particle–particle collision interaction
In the SAFIRE model for the particle collision, we useda simple model incorporating a Hooke’s simple linearspring and a dashpot for both normal and tangential com-
w xponents following Tsuji et al. 12 assuming Coulomb’slaw of friction.
The normal contact force of soft sphere interaction isgiven by:
d xnF sk D x yh . 34Ž .n n n n d tc
And the tangential contact force of soft sphere interac-tion is given by:
d x t< < < <F sk D x yh if F Fm F , 35Ž .t t t t t nd tc
x t< < < < < <F sm F if F )m F . 36Ž .t n t n< <x t
The damping coefficient, h, is determined in terms of therestitution coefficient, e. The duration of collision contact,t , is obtained approximately by solving a simple equationd
of motion for a spring and mass system as follows:2ln eŽ .
2'hs2g km , g s . 37Ž .2 2ln e qpŽ .
References
w x Ž .1 T. Mikami, H. Kamiya, M. Horio, Powder Technol. 89 1996 231.w x Ž .2 G.C. Kuczynski, Trans. ASME 185 1949 169.w x Ž .3 B.G. Langston, F.M. Stephans Jr., J. Met. 12 1960 312.w x4 H. Schenck, W. Wenzel, H.D. Butzmann, Arch. Eisenhuttenwes. 33
Ž .1962 211.w x5 V.W. Wenzel, F.R. Block, E. Wortberg, Arch. Eisenhuttenwes. 43
Ž .1972 805.w x Ž .6 Y. Iwadate, M. Horio, Powder Technol. 100 1998 223.w x7 P.C. Knight, H. Kamiya, M. Horio, J.P.K. Seville, Chem. Eng. Sci.,
in press.w x Ž .8 T. Mikami, H. Kamiya, M. Horio, Chem. Eng. Sci. 53 1998 1927.w x Ž .9 Y. Iwadate, M. Horio, in: L.S. Fan, T. Knowlton Eds. , Fluidization
IX, AIChE, 1998, p. 293.w x Ž .10 D. Geldart, Powder Technol. 7 1973 285.w x Ž .11 T.B. Anderson, R. Jackson, Ind. Eng. Chem. Fundam. 6 1967 527.w x Ž .12 Y. Tsuji, T. Kawaguchi, T. Tanaka, Powder Technol. 77 1993 79.w x13 S.V. Patanker, Numerical Heat Transfer and Fluid Flow, Hemi-
sphere, New York, 1980.w x Ž .14 G. Matsumura, Acta. Metall. 19 1971 851.w x15 T. Mikami, PhD thesis, Tokyo University of Agriculture and Tech-
nology, 1998, p. 62.w x16 S.P. Timoshenko, J.N. Goodier, Theory of Elasticity, McGraw-Hill,
Singapore, 1970, p. 421.w x Ž .17 S. Ergun, Chem. Eng. Prog. 48 1952 89.w x Ž .18 C.Y. Wen, Y.H. Yu, Chem. Eng. Prog., Symp. Ser. 62 1966 100.
Copyright © 2022 FDOKUMEN