Nucleotide Sequence Evolution at the \"Casein Locus: Evidence for Positive Selection Within the...
10
Copyright 0 1997 by the Genetics Society of America Nucleotide Sequence Evolution at the "Casein Locus: Evidence for Positive Selection Within the Family Bovidae Todd J. Ward, Rodney L. Honeycutt* and James N. Derr" Department of Veterinary Pathobiology, *Faculty of Genetics, Texas A & M University, College Station, Texas 77843-4467 Manuscript received July 2, 1997 Accepted for publication September 8, 1997 ABSTRACT K-Casein is a mammalian milk protein involved in a number of important physiological processes. In the gut, the ingested protein is split into an insoluble peptide (para K-casein) and a soluble hydrophilic glycopeptide (caseinomacropeptide). Caseinomacropeptide is responsible for increasedefficiency of digestion, prevention of neonate hypersensitivity to ingested proteins, and inhibition of gastric patho- gens. Variation within this peptide has significant effects associated with important traits such as milk production. The nucleotide sequences for regions of K-casein exon and intron four were determined for representatives of the artiodactyl family Bovidae. The pattern of nucleotide substitution in K-casein sequences for distantly related bovidtaxa demonstrates that positive selection has accelerated their divergence at the amino acid sequence level. This selection has differentially influenced the molecular evolution of the two Kcasein split peptides and is focused within a %-codon region of caseinomacro- peptide. K-CASEIN is a protein in mammalian milk that deter- mines the size and specific function of milk mi- celles (GUTIERREZ et al. 1996). These micelles increase the solubility of minerals and facilitate the transfer of nutrients from mother to offspring (DEV et al. 1994). The mature K-casein protein has a labile peptide bond that is cleaved in the gut by the action of rennin to produce an insoluble peptide (para Kcasein or PKC) as well as a soluble hydrophilic glycopeptide (caseino- macropeptide or CMP) (Qw et al. 1995). The function of PKC is not well known. However, CMP is responsible for clotting milk in the gut, which increases retention time and results in more efficient digestion (MERCIER et al. 1976). Caseinomacropeptide also reduces the im- mune response of neonates, preventing hypersensitivity reactions to ingested food proteins (OTANI and MONNAI 1993). In addition, species-specific glycosylation pat- terns of CMP can result in differential inhibition of gastric pathogens such as Helicobacterpylm' (STROMQVIST et al. 1995). Interestingly, the different alleles described in domestic cattle for the CMP peptide ofK-CaSein in- duce significantly differentamounts of glycosylation (LODES et al. 1996) and have been shown to produce significant differences in milk yield and protein percent ( - I and NGKWAI-HANG 1986). At the nucleotide sequence level, most mammalian protein encoding genes demonstrate a ratio of synony- mous to nonsynonymous substitutions per site of -5:l (LI 1997). Exon four of K-caseinappears to be an excep Currespading author: James N. Derr, Department of Veterinary Pa- thobiology, Texas A & M University,College Station, TX 778434467. E-mail [email protected] Genetics 147: 1863-1872 (December, 1997) tion to this rule. A recent phylogenetic study of several mammalian taxa revealed similar rates of synonymous and nonsynonymous substitutions per site within exon four of K-casein, with the divergence at each codon position being roughly equivalent (GATESY et al. 1996). Although this pattern of divergence at K-casein was in- terpreted by GATESY et al. (1996) as supporting a strictly neutral model of evolution for this gene, these authors did not compare thelevel of variation within exon four to that within intron four, and performed a limited analysis of their data. Because K-casein plays a critical role in several important physiological processes, it seems unlikely that this gene would be completely free of selective constraint. Therefore, we examined the pat- tern of nucleotide substitution within the K-casein gene of representative bovid taxato determine if the molecu- lar evolution of this gene is influenced by processes of selection. MATERIALS AND METHODS The nucleotide sequence of a 782-base pair (bp) segment of the K-casein gene was determined for Bison bison ( n = 1), B. bonasw ( n = 2), Bos javanicus (n = 3), B. grunniens ( n = 3), B. gaurus ( n = 1 ) , Syncerus c a f e caffm ( n = 1 ) , S. caffzr nanw (n = 1 ) , Tragelaphus imberbis (n = 1) , Bosehphus tragocawlw (n = l), and Capra hircw ( n = 1). Numbers in parenthesis refer to the number of individuals sequenced. These nucleotide sequences encompass 377-bp from exon four and 407-bp from intron four of the K-casein gene. In addition, the correspond- ing B. taurus sequence was obtained from ALEXANDER et al. (1988). Total genomic DNA was isolated from white blood cells by proteinase K treatment followed by phenol chloroform extraction (SAMBROOK et al. 1989).Previously published oligo-
-
Upload
independent -
Category
Documents
-
view
3 -
download
0
Transcript of Nucleotide Sequence Evolution at the \"Casein Locus: Evidence for Positive Selection Within the...

Copyright 0 1997 by the Genetics Society of America
Nucleotide Sequence Evolution at the "Casein Locus: Evidence for Positive Selection Within the Family Bovidae
Todd J. Ward, Rodney L. Honeycutt* and James N. Derr" Department of Veterinary Pathobiology, *Faculty of Genetics, Texas A & M University, College Station, Texas 77843-4467
Manuscript received July 2, 1997 Accepted for publication September 8, 1997
ABSTRACT K-Casein is a mammalian milk protein involved in a number of important physiological processes. In
the gut, the ingested protein is split into an insoluble peptide (para K-casein) and a soluble hydrophilic glycopeptide (caseinomacropeptide). Caseinomacropeptide is responsible for increased efficiency of digestion, prevention of neonate hypersensitivity to ingested proteins, and inhibition of gastric patho- gens. Variation within this peptide has significant effects associated with important traits such as milk production. The nucleotide sequences for regions of K-casein exon and intron four were determined for representatives of the artiodactyl family Bovidae. The pattern of nucleotide substitution in K-casein sequences for distantly related bovid taxa demonstrates that positive selection has accelerated their divergence at the amino acid sequence level. This selection has differentially influenced the molecular evolution of the two Kcasein split peptides and is focused within a %-codon region of caseinomacro- peptide.
K-CASEIN is a protein in mammalian milk that deter- mines the size and specific function of milk mi-
celles (GUTIERREZ et al. 1996). These micelles increase the solubility of minerals and facilitate the transfer of nutrients from mother to offspring (DEV et al. 1994). The mature K-casein protein has a labile peptide bond that is cleaved in the gut by the action of rennin to produce an insoluble peptide (para Kcasein or PKC) as well as a soluble hydrophilic glycopeptide (caseino- macropeptide or CMP) (Qw et al. 1995). The function of PKC is not well known. However, CMP is responsible for clotting milk in the gut, which increases retention time and results in more efficient digestion (MERCIER et al. 1976). Caseinomacropeptide also reduces the im- mune response of neonates, preventing hypersensitivity reactions to ingested food proteins (OTANI and MONNAI 1993). In addition, species-specific glycosylation pat- terns of CMP can result in differential inhibition of gastric pathogens such as Helicobacterpylm' (STROMQVIST et al. 1995). Interestingly, the different alleles described in domestic cattle for the CMP peptide of K-CaSein in- duce significantly different amounts of glycosylation (LODES et al. 1996) and have been shown to produce significant differences in milk yield and protein percent (-I and NGKWAI-HANG 1986).
At the nucleotide sequence level, most mammalian protein encoding genes demonstrate a ratio of synony- mous to nonsynonymous substitutions per site of -5:l (LI 1997). Exon four of K-casein appears to be an excep
Currespading author: James N. Derr, Department of Veterinary Pa- thobiology, Texas A & M University, College Station, TX 778434467. E-mail [email protected]
Genetics 147: 1863-1872 (December, 1997)
tion to this rule. A recent phylogenetic study of several mammalian taxa revealed similar rates of synonymous and nonsynonymous substitutions per site within exon four of K-casein, with the divergence at each codon position being roughly equivalent (GATESY et al. 1996). Although this pattern of divergence at K-casein was in- terpreted by GATESY et al. (1996) as supporting a strictly neutral model of evolution for this gene, these authors did not compare the level of variation within exon four to that within intron four, and performed a limited analysis of their data. Because K-casein plays a critical role in several important physiological processes, it seems unlikely that this gene would be completely free of selective constraint. Therefore, we examined the pat- tern of nucleotide substitution within the K-casein gene of representative bovid taxa to determine if the molecu- lar evolution of this gene is influenced by processes of selection.
MATERIALS AND METHODS
The nucleotide sequence of a 782-base pair (bp) segment of the K-casein gene was determined for Bison bison ( n = 1), B. bonasw ( n = 2 ) , Bos javanicus ( n = 3), B. grunniens ( n = 3), B. gaurus ( n = 1 ) , Syncerus c a f e caffm ( n = 1 ) , S. caffzr nanw ( n = 1 ) , Tragelaphus imberbis ( n = 1) , Bosehphus tragocawlw (n = l), and Capra hircw ( n = 1) . Numbers in parenthesis refer to the number of individuals sequenced. These nucleotide sequences encompass 377-bp from exon four and 407-bp from intron four of the K-casein gene. In addition, the correspond- ing B. taurus sequence was obtained from ALEXANDER et al. (1988).
Total genomic DNA was isolated from white blood cells by proteinase K treatment followed by phenol chloroform extraction (SAMBROOK et al. 1989). Previously published oligo-

1864 T. J. Ward, R L. Honeycutt and J. N. Derr
nucleotide primers (PINDER et al. 1991) were used to ampllfy DNA via PCR ( S A M et al. 1988). Amplifications consisted of an initial 5-min denaturation at 95" followed by 35 cycles of 45 sec at 95", 45 sec at 50", and 2.5 min at 74". Amplification products were run on 1.5% agarose gels and purified with QIAquick gel extraction columns (Qiagen). Nucleotide se- quences were determined on an AB1 PRISM 377 automated DNA sequencer (Applied Biosystems, Perkin Elmer) using the amplification primers as well as internal sequencing primers designed with MacVector 5.0 (International Biotechnologies Inc.) . Primer sequences will be made available upon request. Sequences were aligned using Clustal V (HIGGINS and SHARP 1989) and then manually inspected.
Selection can be difficult to detect because its impact may be highly localized within a gene. Therefore, para K-casein (PKC) and caseinomacropeptide (CMP) were analyzed sepa- rately because they are split into functionally different p e p tides in the gut and are potentially exposed to different selec- tive forces. However, no detailed information regarding re- gions of structural or functional importance are available for these peptides. In the absence of such biological information, exon four sequences were analyzed with the computer pro- gram PLAT0 (GRASSLY and HOLMES 1997) in order to idenw regions of possible selective importance. This program em- ployed a statistical method that used site likelihoods to iden- tify regions of nucleotide sequence that did not fit with the global maximum likelihood topology and substitution pro- cess. Regions of exon four identified as having a pattern of molecular evolution inconsistent with the overall pattern of the exon were examined separately in all subsequent analyses in order to determine if these regions were influenced by processes of selection. It should be noted that this analysis required a gene tree based on exon four sequences and did not require that this topology reflect the true phylogenetic relationships of the taxa examined.
The levels of total nucleotide sequence divergence within each gene region were determined for closely (Bos and Bison genera) and distantly related taxa separately. Distantly related taxa refer to pairs of taxa that diverged from each other at least 10 mya, while the closely related Bos and Bison species have divergence times of no more than 3 mya (MCDONALD 1981; J A N E C E K ~ ~ U ~ . 1996). B.jauanicuswas chosen to represent the Bos and Bison species in comparisons of distantly related taxa in order to simplify the analysis and to avoid biasing the results with repeated consideration of what would be nearly identical comparisons.
For distantly related taxa the number of nucleotide substitu- tions along each branch of three possible species trees (Figure 1) was determined for each gene region using PAUP 3.1.1 (SWOFFORD 1993). The program Fisher 6 (R. ADKINS, personal communication) was used to perform Fisher's exact tests to determine if the ratio of total nucleotide substitutions to total invariant sites was significantly different for pairwise compari- sons of the different gene regions examined. The number of invariant sites was determined for each branch of the tree and then added across the entire tree in order to account for multiple substitutions at a single nucleotide position.
To further examine the pattern of nucleotide divergence within the K-casein gene, MacClade 3.06 (MADDISON and MAD- DISON 1996) was used to determine the number of nucleotide substitutions at each codon position for each gene region individually using the three trees shown in Figure 1. Fisher 6 was then used to determine if the ratio of total nucleotide substitutions to total invariant sites was significantly different at first and second codon positions compared to third codon positions. The number of invariant sites was determined as
A A B.
S.
T.
B.
e. B c B.
S.
B.
T.
C. C
javanicus
ca@er
imberbis
tragocamelus
hircus
javanicus
cafler
tragocamelus
imberbis
hircus
r B. javanicus
[L s. ca8er
RGURE 1.-Three possible species trees for distantly re- lated bovid taxa showing (A) the tribes Bovini and Tragela- phini as sister taxa, (B) the tribes Bovini and Boselaphini as sister taxa, and ( C ) the tribes Boselaphini and Tragelaphini as sister taxa.
the sum of the total nucleotides along each branch minus the number of total changes on the tree.
Three different species trees were used in the above analy- ses because there is no consensus regarding the phylogenetic relationships of the three bovine tribes (Bovini, Tragelaphini, and Boselaphini) to one another (ALLARD et aL 1992;JANECEK et al. 1996). However, there has been a general consensus

Positive Selection at K-Casein 1865
B. taurus
- B. bonasus -
7 - B. bison - - B. grunnias -
B. gaurus n B. javanicus
rl s*ca8er 1 I T. imberbis
B. tragocamelus
I C. hircus
FIGURE 2.-Gene tree resulting from maximum likelihood analysis of K-casein exon four sequences.
that the Bos and Bison species form a single monophyletic group and that S. caffer (as representative of the true buffa- loes) is a sister taxon to this group (BOHLKEN 1958, 1961; GROVES 1981; WALL et al. 1992; JANECEK et al. 1996; MODI 1996). In addition, the placement of C. hircus (as representa- tive of the Caprinae) as a sister taxon to the other species examined in this study is well supported (PILGRIM 1947; JA- NECEK et al. 1996). Therefore, the three trees used in the above analyses represent all of the probable species trees for the distantly related taxa examined.
Due to the fact that there is no generally agreed upon topology for the closely related Bos and Bison species (BOHL KEN 1958,1961; GROVES 1981; WALL et al. 1992;JANECEK d al. 1996; MODI 1996), it was not possible to compare the levels of nucleotide divergence using the topology-based approach described for distantly related taxa. Therefore, the computer program MEGA (KUMAR et al. 1993) was used to calculate the average proportion of nucleotide differences for painvise comparisons of sequences from the various gene regions of closely related taxa. While this method did provide an indica- tion of the relative levels of divergence within the different gene regions, it was not possible to perform a detailed statisti- cal analysis on these data because of problems associated with the nonindependence of pairwise comparisons of this type.
The JukesCantor-corrected proportions of synonymous (Ds) and nonsynonymous differences (Dn) per site were cal- culated for closely and distantly related taxa separately using MEGA. Estimates of Ds and Dn were calculated by the method of NEI and GOJOBOFU (1986), and their associated variances were calculated by the method of NEI and JIN (1989). The significance of differences in Ds and Dn were assessed with
Intron 4 57 codons 68 codons 407 bp
I pSraK-easein ( caseinomacropeptide I \ I
PLATO de€ind region (PDR) 34 codons
FIGURE 3.-Diagram showing the relative position of the various K-casein gene regions examined.
one-tailed t-tests and infinite degrees of freedom (KUMAR et al. 1993).
RESULTS
Individuals from the two subspecies of S. caffm dif- fered by a single transition in intron four. To simplify analysis, only S. c. Gaffer sequence was used. The three B. grunniens also differed by a single nucleotide substitu- tion in intron four. Therefore, a single sequence repre- senting the species was selected at random. In all other species for which multiple individuals were sequenced, the sequences were identical.
The nucleotide sequences from exon four as well as a single gene tree (Figure 2) resulting from a maximum likelihood analysis of these sequences using the DNAML program of the PHYLIP software package (FELSENSTEIN 1995) were used in the analysis by the computer program PLATO (GRASSLY and HOLMES 1997). Using this program, we identified a 3 k o d o n region of anomalously evolving sequence located within the CMP portion of the Kcasein gene ( P < 0.01). The location of this PLATOdefined region (PDR) as well as the relative position of the PKC and CMP peptides are shown in Figure 3.
Pairwise comparisons of sequences from closely re- lated species within the Bos and Bison clade revealed levels of nucleotide sequence divergence within intron four that were equal to or greater than that within any region of exon four (Figure 4). In comparisons of dis- tantly related taxa there was no significant difference between the level of total nucleotide divergence within the PKC region of the exon and that found within in- tron four. However, significantly higher levels of total nucleotide sequence divergence were found within the CMP, PDR, and exon four as a whole relative to levels within intron four in these comparisons of distantly related bovid taxa (Table 1) . In addition, all branch lengths derived using the DELTRAN character state optimization option in PAUP 3.1.1 revealed a high amount of nucleotide substitution within these three

1866 T. J. Ward, R. L. Honeycutt and J. N. Derr
Exon 4 Votal) PKC PDR CMP lnmn 4
Gene region
FIGURE 4. -Average values of painvise divergences for com- parisons of the closely related Bos and Bison species.
coding regions relative to that within intron four for all three possible trees shown in Figure 1. These same re- sults were obtained when using the ACCTRAN charac- ter state optimization option, with the exception of one branch within tree 1B where the level of nucleotide divergence within the PDR region was equal to that of intron four and one branch within tree 1C where the level of divergence within intron four was greater than that of exon four as a whole. As shown in Figure 5, saturation effects cannot account for the intron's low level of divergence relative to the PDR and CMP regions of exon four. Therefore, the fact that the levels of nucle- otide substitution within exon four as a whole, specifi- cally within the PDR and CMP regions of the exon, exceeded that of intron four suggests that positive Dar- winian selection has accelerated the divergence of these coding sequences in distantly related bovid taxa.
Estimates of sequence divergence at each of the three codon positions were calculated for each region of the exon using each of the three probable species trees of distantly related taxa. The number of substitutions at both first and second codon positions w a s greater than at third positions within all regions of the exon for all
1 4 .- v, "T * *
/ . * *
4
0 0.01 0.02 0.03 0.04 0.05 0.06
Jukes-Cantor corrected genetic distance
FIGURE 5.-Transitional substitution within the intron four sequences of all taxa.
three trees (Table 2). However, the difference between divergence at first and third positions was found to be statistically significant ( P < 0.05) only in the compari- sons for exon four as a whole, while the difference between levels of divergence at second and third posi- tions was found to be statistically significant ( P < 0.05) for the PDR, CMP, and exon four as a whole using trees 1B and 1C. For species tree 1A the difference between levels of divergence at second and third positions was found to be statistically significant ( P < 0.05) within the PDR and exon four as a whole and was just above the 5% level ( P = 0.06) within the CMP region of the exon. Because all changes at second codon positions and most changes at first codon positions result in amino acid replacements, these results indicate that the accelerated rate of nucleotide substitution was caused by selection for divergence at the amino acid sequence level.
While the pattern of nucleotide substitution de- scribed above was indicative of positive selection, the standard test for deviation from neutrality has been to compare the rates of synonymous (Ds) and nonsynony- mous (Dn) substitution per site (HUGHES 1992; LEE et
TABLE 1
Total nucleotide sequence divergence for distantly related taxa using species tree 1B
Ratio of nucleotide substitutions/total number
Gene regions compared of invariant sites Significance of Region 1 Region 2 Region 1 Region 2 difference
Exon 4 (total) Intron 4 0.0235 0.0130 P < 0.005 CMP Intron 4 0.0337 0.0130 P < 0.001 PDR Intron 4 0.0464 0.0130 P < 0.001 Intron 4 PKC 0.0130 0.0125 NS CMP PKC 0.0337 0.0125 P < 0.001 PDR PKC 0.0448 0.0125 P < 0.001
The results for species tree 1C were identical to those shown, and results for species tree 1A were not significantly different. NS, not significant.
Positive Selection at K-Casein
TABLE 2
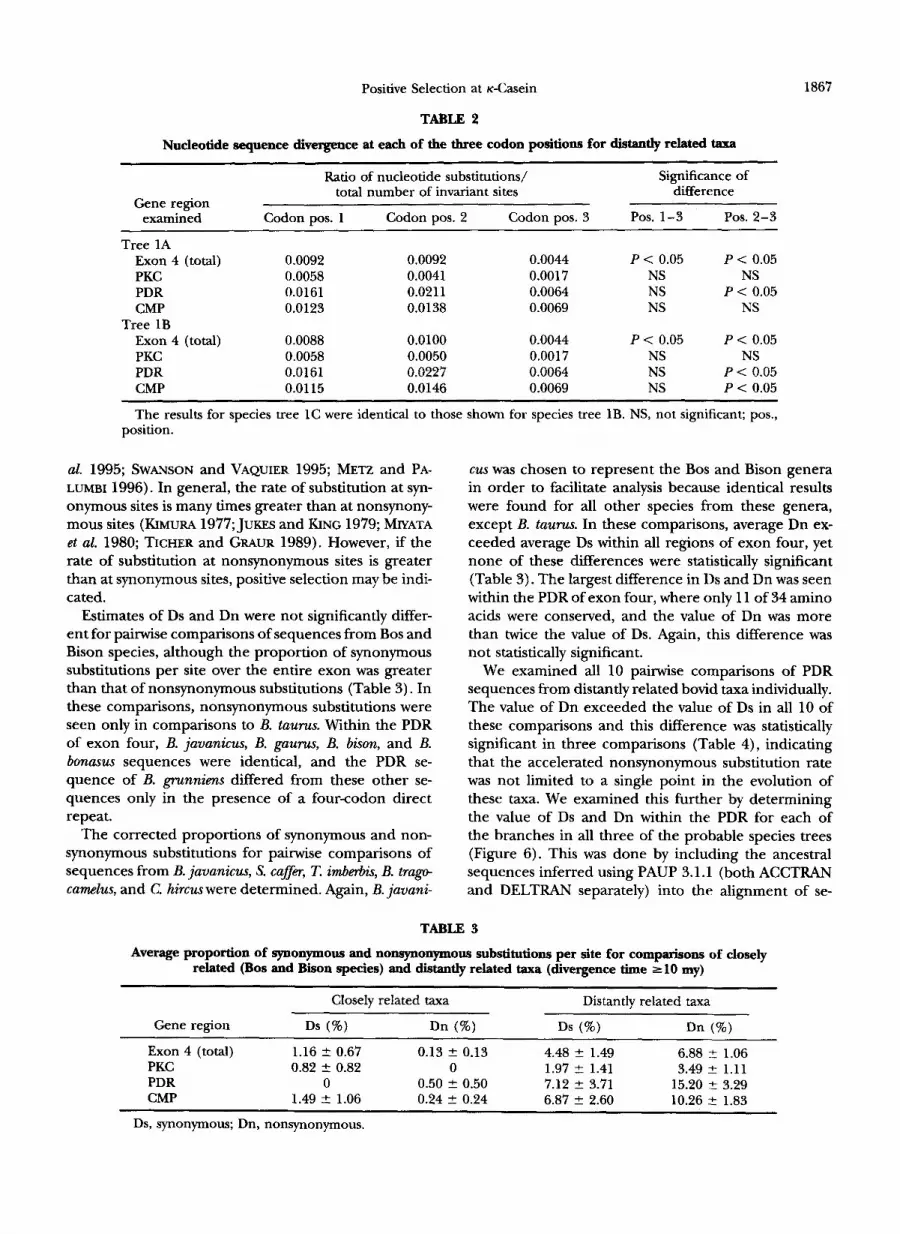
Nucleotide sequence divergence at each of the three codon positions for distantly related taxa
Ratio of nucleotide substitutions/ Significance of total number of invariant sites difference
Gene region examined Codon pos. 1 Codon pos. 2 Codon pos. 3 POS. 1-3 POS. 2-3
Tree 1A Exon 4 (total) 0.0092 0.0092 0.0044 P < 0.05 P < 0.05 PKC 0.0058 0.0041 0.0017 NS NS PDR 0.0161 0.0211 0.0064 NS P < 0.05 CMP 0.0123 0.0138 0.0069 NS NS
Exon 4 (total) 0.0088 0.0100 0.0044 P < 0.05 P < 0.05 PKC 0.0058 0.0050 0.0017 NS NS PDR 0.0161 0.0227 0.0064 NS P < 0.05 CMP 0.01 15 0.0146 0.0069 NS P < 0.05
The results for species tree 1C were identical to those shown for species tree 1B. NS, not significant; pos.,
Tree 1B
1867
position.
al. 1995; SWANSON and VAQUIER 1995; METZ and PA- LUMBI 1996). In general, the rate of substitution at syn- onymous sites is many times greater than at nonsynony- mous sites (KIMuRA 1977; J U ~ S and KING 1979; MIYATA et al. 1980; TICHER and GRAUR 1989). However, if the rate of substitution at nonsynonymous sites is greater than at synonymous sites, positive selection may be indi- cated.
Estimates of Ds and Dn were not significantly differ- ent for pairwise comparisons of sequences from Bos and Bison species, although the proportion of synonymous substitutions per site over the entire exon was greater than that of nonsynonymous substitutions (Table 3). In these comparisons, nonsynonymous substitutions were seen only in comparisons to B. tuum. Within the PDR of exon four, B. javanicus, B. gaum, B. bison, and B. bonmus sequences were identical, and the PDR se- quence of B. grunnias differed from these other se- quences only in the presence of a fourcodon direct repeat.
The corrected proportions of synonymous and non- synonymous substitutions for pairwise comparisons of sequences from B. javanicus, S. ca&, T. imberbis, B. t r a p camlus, and C. hircus were determined. Again, B. javani-
cus was chosen to represent the Bos and Bison genera in order to facilitate analysis because identical results were found for all other species from these genera, except B. tuum. In these comparisons, average Dn ex- ceeded average Ds within all regions of exon four, yet none of these differences were statistically significant (Table 3). The largest difference in Ds and Dn was seen within the PDR of exon four, where only 11 of 34 amino acids were conserved, and the value of Dn was more than twice the value of Ds. Again, this difference was not statistically significant.
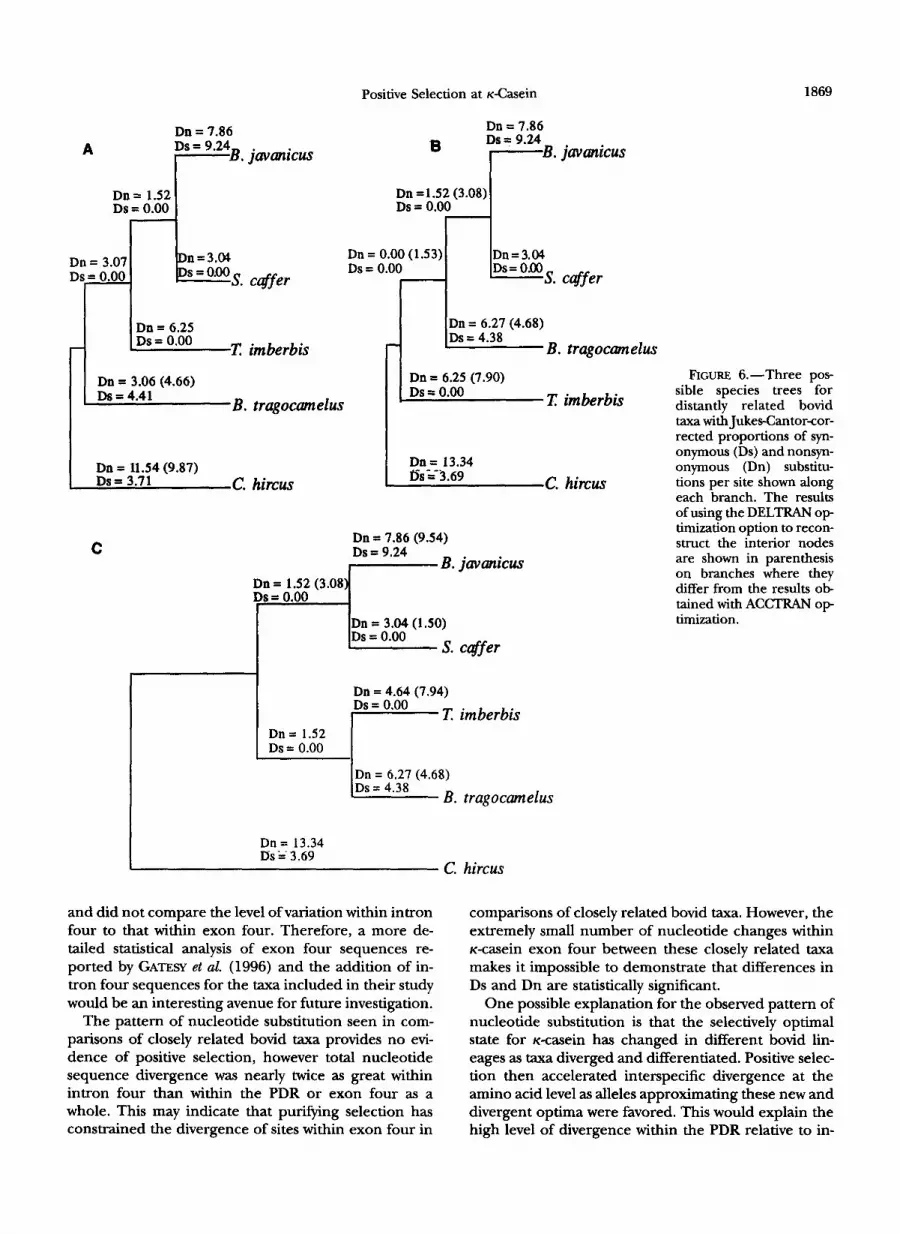
We examined all 10 pairwise comparisons of PDR sequences from distantly related bovid taxa individually. The value of Dn exceeded the value of Ds in all 10 of these comparisons and this difference was statistically significant in three comparisons (Table 4), indicating that the accelerated nonsynonymous substitution rate was not limited to a single point in the evolution of these taxa. We examined this further by determining the value of Ds and Dn within the PDR for each of the branches in all three of the probable species trees (Figure 6). This was done by including the ancestral sequences inferred using PAUP 3.1.1 (both ACCTRAN and DELTRAN separately) into the alignment of se-
TABLE 3
Average proportion of synonymous and nonsynonymous substitutions per site for comparisons of closely related (Bos and Bison species) and distantly related taxa (divergence time 210 my)
Closely related taxa Distantly related taxa
Gene region Ds (%) Dn (%) Ds (%) Dn (%)
Exon 4 (total) 1.16 t 0.67 0.13 t 0.13 4.48 +- 1.49 6.88 1.06 PKC 0.82 t 0.82 0 1.97 f 1.41 3.49 f 1.11 PDR 0 0.50 t 0.50 7.12 t 3.71 15.20 t 3.29 CMP 1.49 t 1.06 0.24 2 0.24 6.87 t 2.60 10.26 f 1.83
Ds, synonymous; Dn, nonsynonymous. ~~

1868 T. J. Ward, R. L. Honeycutt and J. N. Derr
TABLE 4
Proportion of synonymous and nonsynonymous subetitutions per site for pairwise comparisons of PDR sequences from distantly related taxa (divergence times 210 my)
Pairwise Comparison Ds (%) Dn (%) d = Dn - Ds (%)
B. juvanicus X S. caffer 9.31 ? 6.70 11.22 ? 4.33 1.91 f 7.98 B. juvanicus X T. imberbis 9.24 ? 6.65 16.64 f 5.43 7.40 t 8.59 B. javanicus X B. tragocamelus 14.22 f 8.43 16.69 ? 5.45 2.47 ? 10.04 B. j avan im X C. hircus 13.56 t 8.27 24.77 ? 6.93 11.21 f 10.79 S. caffm X T. imberbis 0.00 -c 0.00 11.22 f 4.33 11.22 2 4.33*** S. caffer X B. tragocamelus 4.48 ? 4.51 11.25 t 4.34 6.77 t 6.26 S. caffer X C. hircus 3.77 f 4.16 15.02 & 5.11 11.25 f 6.59* T. imberbis X B. tragocamelus 4.45 f 4.48 11.28 ? 4.35 6.83 5 6.24 T. imberbis X C. hircus 3.74 t 4.13 18.80 t 5.84 15.06 f 7.15** B. tragocamdus X C. hircus 8.43 5 6.32 15.11 f 5.14 6.68 +- 8.15 Average 7.12 ? 3.71 15.20 t 3.29 8.08 t 4.96
Significance of comparison: * P < 0.05; ** P < 0.025, and *** P < 0.005.
quences for distantly related terminal taxa. MEGA was then used to determine the value of Ds and Dn along every branch in the tree. As can be seen in Figure 6, Dn is greater than Ds along the majority of branches in each of the three trees. Graphical measures of diver- gence at synonymous sites within the PDR did not reveal any evidence of saturation for synonymous substitutions within this region (Figure 7). Therefore, these results provide strong evidence for the acceleration of diver- gence among bovid K-casein proteins being a conse- quence of positive Darwinian selection.
The difficulty in statistically demonstrating that the observed differences in the values of Dn and Ds (Table 4) are due to the influence of positive selection is largely attributable to the small number of nucleotides exam- ined and the collective variance associated with averages of pairwise comparisons that differ by a factor of two in time since divergence and consequently their overall level of divergence. In terms of the small number of nucleotides examined, if selection is affecting a very narrowly defined region of a gene, as we believe is the case within K-casein exon four, then there is little that can be done to increase the resolution of the analysis.
Because nucleotide composition bias can constrain the rate of substitution at silent sites (METZ and PA- LUMBI 1996), the nucleotide composition of the various regions of the Kcasein gene were determined (Table 5 ) . A strong A+T bias was seen in both intron four and the third codon positions of exon four. This result is consistent with the theory that mutational bias should favor the accumulation of A+T at sites free of selective constraint (LI 1997). Given that there was little variation in nucleotide composition among species or among regions of the exon, it is unlikely that differences in nucleotide composition can account for the highly ac- celerated rates of nucleotide and amino acid sequence divergence focused within the PDR region of exon four.
Synonymous codon usage bias for exon four se-
quences was moderate (0.42) as measured with a scaled chi square (SHIELDS et al. 1988). While equal codon usage would result in a relative synonymous codon us- age (RSCU) value of one (SHIELDS et al. 1988), the RSCU value for exon four sequences was greater for A+T (1.31 2 0.1’7) than for G+C (0.67 2 0.13) ending codons. This result is consistent with previous findings that codon usage bias in vertebrates is correlated with mutational bias and is not the result of selective con- straint on third position sites (HASTINGS and EMERSON 1983; HATFIELD and RICE 1986; WELLS et al. 1986; BULMER 1988). Therefore, it is unlikely that the higher rate of nonsynonymous change relative to synonymous change is due to selective constraints on silent sites within the exon.
DISCUSSION
If a strictly neutral model was appropriate for the evolution of Kcasein exon four as GATESY et al. (1996) have suggested, one would expect to see an equal num- ber of substitutions at each of the three codon positions and in the intron as well. In comparisons of distantly related bovid taxa, there was an uneven distribution of changes along the gene. In fact, there was an increased rate of nonsynonymous substitution concentrated within a 34codon region of caseinomacropeptide, and this region as well as the exon as a whole had a rate of total nucleotide substitution that exceeded that of in- tron four. Because there is no evidence that intron four is saturated, the overall increase in rate of substitution described above indicates that positive Darwinian selec- tion has accelerated the divergence of Kcasein in dis- tantly related bovid taxa. The apparent conflict between this conclusion and that of GATESY et al. (1996) may be due to the fact that they compared Ds and Dn for closely related taxa only. In addition, these authors did not examine the different regions of exon four individually
Positive Selection at K-Casein 1869
Dn = 7.86
A Dn = 7.86 Ds = 9.24
Dn = 3.07 Ds = 0.00 r
b n = 3.04
Dn =1.52 (3.08) Ds = 0.00
Dn = 0.00 (1.53) ri Dn = 3.04 Ds = 0.00
3 Dn = 11.54 (9.87) Ds = 3.71 C. hircus
C
(Ds=oaos. caffer
Dn = 6.27 (4.68)
B. tragocamelus Dn = 6.25 (7.90) Ds = 0.00 T imberbis
Dn- 13.34 ijsk"3.69 C. hircus
Dn = 7.86 (9.54) Ds = 9.24
1 B. javanicus Dn = 1.52 (3.08 Ds = 0.00
Dn = 3.04 (1 .SO) Ds = 0.00
Dn = 4.64 (7.94)
1- T. imberbis Ds = 0.00
B. tragocamelus Dn = 6.27 (4.68) Ds = 4.38
FIGURE 6.-Three pos sible species trees for distantly related bovid taxa with JukesCantorcor- rected proportions of syn- onymous (Ds) and nonsyn- onymous (Dn) substitu- tions per site shown along each branch. The results of using the DELTRAN op- timization option to recon- struct the interior nodes are shown in parenthesis on branches where they difFer from the results ob- tained with ACCTRAN o p timization.
Dn = 13.34 Ds =- 3.69
C. hircus
and did not compare the level of variation within intron four to that within exon four. Therefore, a more de- tailed statistical analysis of exon four sequences re- ported by GATESY et al. (1996) and the addition of in- tron four sequences for the taxa included in their study would be an interesting avenue for future investigation.
The pattern of nucleotide substitution seen in com- parisons of closely related bovid taxa provides no evi- dence of positive selection, however total nucleotide sequence divergence was nearly twice as great within intron four than within the PDR or exon four as a whole. This may indicate that purifying selection has constrained the divergence of sites within exon four in
comparisons of closely related bovid taxa. However, the extremely small number of nucleotide changes within K-casein exon four between these closely related taxa makes it impossible to demonstrate that differences in Ds and Dn are statistically significant.
One possible explanation for the observed pattern of nucleotide substitution is that the selectively optimal state for K-casein has changed in different bovid lin- eages as taxa diverged and differentiated. Positive selec- tion then accelerated interspecific divergence at the amino acid level as alleles approximating these new and divergent optima were favored. This would explain the high level of divergence within the PDR relative to in-

T. J. Ward, R. L. Honeycutt and J. N. Derr
4
0 I
0 0.05 0.1 0.15 0.2 0.25
Jukes-Cantor corrected genetic distance
FIGURE 7.--Sequence divergence at synonymous sites within the PDR of exon four for painvise comparisons of distantly related bovid taxa.
tron four in comparisons of distantly related bovid taxa. Selective sweeps (1MAyNARD SMITH and HAIGH 1974) of neutral or nearly neutral variation that had developed during the process of species differentiation at sites close to the site under strong positive selection would be expected to result in low levels of polymorphism within these species.
The very closely related Bos and Bison species may be biologically similar enough that a common optimum for K-casein has been retained. Purifylng selection would then be expected to maintain an optimal allele in all of these species, resulting in low levels of divergence within the PDR relative to intron four as was observed. In addition, directional selection may have recently fixed an optimal allele, resulting in a selective sweep of neutral or nearly neutral ancestral variation at sites linked to the site under selection.
The scenario described above would result in high interspecific divergence (between species with some minimal amount of differentiation) and low intraspe- cific polymorphism, violating the predictions of a strictly neutral model (KIMURA 1983) that levels of di- vergence and polymorphism should be concordant. Al- though data pertaining to intraspecific variation within
the K-casein gene are limited, they do seem to fit the expectation of low polymorphism. KAWAMOTO et aL (1992) report that, of the K-casein genes examined from 22 individual water buffalo (Bubalus bubalis) , there was no polymorphism detected by isoelectric focusing. In addition, we found no evidence of polymorphism within exon four of the three species in which multiple individuals were sequenced or between the two subspe- cies of S. cufm. However, more extensive investigations of these species need to be conducted.
In most of the previous examples of positive selec- tion, the selective agent was identified as playing a role in immunity or some process of self recognition (HUGHES 1992; LEE et al. 1995; SWANSON and VAQUIER 1995). Identification of the selective agent for K-casein is not easy because it is known to be involved in a variety of physiological processes and consists of two separate peptides, which may be exposed to very different selec- tive pressures. However, the role that caseinomacropep- tide plays in the downregulation of immune response in neonates seems to be a likely candidate for the selective agent. It also is conceivable that the selective pressure could come from caseinomacropeptide’s antimicrobial activity. Different genetic variants of K-casein produce changes in glycosylation patterns (LODES et al. 1996) that are known to be species specific and that influence the inhibition of infection by gastric pathogens (STROMQ
VIST et al. 1995). While it is not known if the functions of caseinomacropeptide described above are attribut- able to the amino acids within the PDR, it is interesting to note that caseinomacropeptide is responsible for all of these functions and that the PDR segment of this peptide is the region revealing the strongest evidence of positive selection. Thus, the biological and physiolog- ical information that we have is consistent with the ob- served pattern of evolution at the molecular level.
Although positive selection has been demonstrated in a number of previous examples, most of these involve comparisons of allelic variation within a single species or within a very closely related group of species (HUGHES and NEI 1988; HUGHES and NEI 1989; METZ and PA~UMBI 1996). Thus, in the majority of the pro- teins for which positive selection has been demon- strated, the level of polymorphism is exceptionally high.
TABLE 5
Nucleotide composition of ~caseio gene regions by codon position
Codon position 1 Codon position 2 Codon position 3 All positions
A + T G + C A + T G + C A + T G + C A + T G + C
Exon 4 (total) 47.1 52.9 51.0 49.0 66.8 33.2 55.0 45.0 PKC 45.4 54.6 53.1 46.9 64.4 35.5 54.3 45.7 PDR 39.8 60.1 49.0 51 .O 66.4 33.6 51.8 48.3 CMP 48.7 51.3 49.1 50.9 69.1 31 .O 55.6 44.4 Intron 4 N/A N/A N/A N/A N/A N/A 72.5 27.5
~~ ~~

Positive Selection at K-Casein 1871
The results of our examination of the molecular evolu- tion of K-casein differ from most of these previous stud- ies in that interspecific divergence is high, yet there is no evidence to suggest that intraspecific polymorphism is elevated. In addition, the results of this study are unique in that they demonstrate that positive selection at the Kcasein locus is a general factor in the evolution of taxa representing an entire mammalian family.
We are grateful toJOE BIELAWSKI, ALEX ROONEY, and JERRY TAYLOR for helpful comments and discussion and to NICK GRASSLY for instruc- tion on the use of the computer program PLATO. We also thank RON ADKINS for advice on the use of the Fisher’s exact test. In addition, we would like to acknowledge the two anonymous reviewers for their helpful comments. We also thank CLAIRE KOLENDA and DOUG MEL ENDY for technical assistance and JIM WOMACK for donations of DNA from various species. This work was supported by National Science Foundation grants DEE9622126 U.N.D.) and DEE9615163 (R.L.H.).
LITERATURE CITED
ALEXANDER, L. J., A. F. STEWART, A. G. MACKINLAY, T. V. KAPELIN- SKAYA, T. M. TKACH et al., 1988 Isolation and characterization of the bovine kappacasein gene. Eur. J. Biochem. 178 395-401.
ALLARD, M. W., M. M. MIYAMOTO, L. JARECKI, F. KRAus and M. R. TENNANT, 1992 DNA systematics and evolution of the artiodac- tyl family Bovidae. Proc. Natl. Acad. Sci. USA 8 9 3972-3976.
BOHLKEN, H., 1958 Vergleichende untersuchengen an wildrindern (TRIBUS BOVINI SIMPSON, 1945). Zool. Jahrb. 68: 113-202.
BOHLKEN, H., 1961 Haustiere und Zoologische systematik. Z. Tien. Zuechtungsbiol. 76: 107-1 13.
BULMER, M., 1988 Are codon usage patterns in unicellular organ- isms determined by selection-mutation balance? J. Evol. Biol. 1:
DEV, B. C., S. M. SOOD, S. DEWIND and C. W. SLATTERY, 1994 Kappa- casein and beta-caseins in human milk micelles: structural stud- ies. Arch. Biochem. Biophys. 314: 329-336.
FELSENSTEIN, J., 1995 PHYLIP version 3.57%. Department of Genet- ics, University of Washington, Seattle.
GATESY, J., C. HAYASHI, M. A. CRONIN and P. ARCTANDER, 1996 Evi- dence from milk casein genes that cetaceans are close relatives of hippopotamid artiodactyls. Mol. Biol. Evol. 1 3 954-963.
GRASSLY, N. C., and E. C. HOLMES, 1997 A likelihood method for the detection of selection and recombination using nucleotide sequences. Mol. Biol. Evol. 14: 239-247.
GROWS, C. P., 1981 Systematic relationships in the Bovini (Artiodac- tyla, Bovidae). Z. Zool. Syst. Evolutionforsch. 19: 264-278.
GUTIERREZ, A. A,, E. A. MAGA, H. MEADE, C. F. SHOEMAKER, J. F. ME- DRANO et al., 1996 Alterations of the physical characteristics of milk from transgenic mice producing bovine kappaiasein. J. Dairy Sci. 7 9 791-799.
HASTINGS, K. E. M., and C. P. EMERSON, 1983 Codon usage in mus- cle genes and liver genes. J. Mol. Evol. 19: 214-218.
HATFIELD, D., and M. RICE, 1986 Aminoacyl-tRNA (anticodon): co- don adaptation in human and rabbit reticulocytes. Biochem. Int.
HIGGINS, D. G., and P. M. SHARp, 1989 Fast and sensitive multiple sequence alignments on a microcomputer. CABIOS 5 151-153.
HUGHES, A. L., 1992 Positive selection and interallelic recombina- tion at the merozoite surface antigen-1 (MSA-1) locus of Plasm diurnfatcdparum. Mol. Biol. Evol. 9 381-393.
HUGHES, A. L., and M. NEI, 1988 Pattern of nucleotide substitution at major histocompatibility complex class I loci reveals overdomi- nant selection. Nature 335: 167-170.
HUGHES, A. L., and M. NEI, 1989 Nucleotide substitution at major histocompatibility complex class I1 loci: evidence for overdomi- nant selection. Proc. Natl. Acad. Sci. USA 8 6 958-962.
JANECEK, L. L., R. L. HONEYCUTT, R. M. ADKINS and S. K. DAVIS, 1996 Mitochondrial gene sequences and the molecular systematics of the artiodactyl subfamily Bovinae. Mol. Phylogenet. Evol. 6: 107- 119.
15-26.
13: 835-842.
JUKES, T. H., and J. L. KING, 1979 Evolutionary nucleotide replace- ments in DNA. Nature 281: 605-606.
KAWAMOTO, Y., T. AMANO, T. NAMIKAWA, T. NlSHIDA and H. B. UJUB HANDARY, 1992 Milk protein polymorphisms of water buffaloes in Nepal. Anim. Sci. Technol. 6 3 270-276.
KIMURA, M., 1977 Preponderance of synonymous changes as evi- dence for the neutral theory of molecular evolution. Nature 267:
KIMURA, M., 1983 TheNeutral T h e q ofEvolutim. Cambridge Univer- sity Press, Cambridge.
KUMAR, S., K. TAMURA and M. NEI, 1993 MEGA molecular evolu- tionary genetics analysis, version 1.01. The Pennsylvania State University, University Park, PA.
LEE, Y., T. OTA and V. D. VACQUIER, 1995 Positive selection is a general phenomenon in the evolution of abalone sperm lysin. Mol. Biol. Evol. 12: 231-238.
LI, W., 1997 Molecular Evolution. Sinauer Associates, Sunderland, MA.
LODES, A., I. KRAusE, J. BUCHBERGER, J. AUMANN and H. KLOSTER- MEYER, 1996 The influence of genetic variants of milk proteins on the compositional and technological properties of milk 1. Casein micelle size and the content of non-glycosylated Kcasein. Milchwissenschaft 51: 368-373.
MADDISON, W. P., and D. R. MADDISON, 1996 MacClade version 3.06. Sinauer Associates, Sunderland, MA.
MARZALI, A. S., and K. F. NGKWAI-HANG, 1986 Relationships be- tween milk protein polymorphisms and cheese yielding capacity. J. Dairy Sci. 6 9 1193-1201.
MAYNARD SMITH, J., and J. HAIGH, 1974 The hitch-hiking effect of a favorable gene. Genet. Res. 2 3 23-35.
MCDONALD, J. N., 1981 North Amaican Bison: Their Classification and Evolution. Univ. of California Press, Berkeley, CA.
MERCIER, J. C., J. M. CHOBERT and F. ADDEO, 1976 Comparative analysis of the amino acid sequences of the caseinomacropep tides from seven species. FEBS Lett. 7 2 208-214.
METZ, E. C., and S. R. PALUMBI, 1996 Positive selection and se- quence rearrangements generate extensive polymorphism in the gamete recognition protein binding. Mol. Biol. Evol. 13: 397- 406.
MNATA, T., T. YASUNAGA and T. NISHIDA, 1980 Nucleotide sequence divergence and functional constraint in mRNA evolution. Proc. Natl. Acad. S i . USA 77: 7328-7332.
MODI, W. S., D. S. GALLAGHER and J. E. WOMACK, 1996 Evolutionary histories of highly repeated DNA families among the Artiodactyla (Mammalia). J. Mol. Evol. 42: 337-349.
NEI, M., and T. GOJOBORI, 1986 Simple methods for estimating the numbers of synonymous and nonsynonymous nucleotide substi- tutions. Mol. Biol. Evol. 3: 418-426.
NEI, M., and L. JIN, 1989 Variances of the average numbers of nucle- otide substitutions within and between populations. Mol. Biol. Evol. 6: 290-300.
OTANI, H., and M. MONNAI, 1993 Inhibition of proliferative re- sponses of mouse spleen lymphocytes by bovine milk Kcasein digests. Food Agric. Immunol. 5: 219-229.
PILGRIM, G. E., 1947 The evolution of the buffaloes, oxen, sheep, and goats. J. Linn. SOC. Lond. Zool. 41: 272-286.
PINDER, S. J., B. N. PERRY, C. J. SKIDMORE and D. SAWA, 1991 Analy- sis of polymorphism in the bovine casein genes by use of the polymerase chain reaction. Anim. Genet. 22: 11-20.
QW, Z. Y., P. JOLIS, D. MIGLIORE-SAMOUR, F. SCHOENTGEN and A. FLAT, 1995 Sheep K-casein peptides inhibit platelet aggregation. Biochem. Biophys. Acta 1244: 411-417.
SAKI, R. K., D. H. GELFEND, S. STOFFEL, S. J. SCHARF, R. HIGUCHI et aL, 1988 Primerdirected enzymatic amplification of DNA with a thermostable DNA polymerase. Science 239 487-491,
SAMBROOK, J., E. F. FRITSCH and T. MANUTIS, 1989 Molecular C h - ingr A Laboratq Manual, 2nd ed. Cold Spring Harbor Laboratory Press, Plainview, NY.
SHIELDS, D. C., P. M. SHARP, D. G. HIGGINS and F. WRIGHT, 1988 “Silent” sites in Drosophila genes are not neutral: evidence of selection among synonymous codons. Mol. Biol. Evol. 5 704- 716.
STROMQVIST, M., P. FALK, S. BERGSTROM, L. HANSSON, B. LONNERDAL et al., 1995 Human milk K-casein and inhibition of Helicobacter
275-276.
1872 T. J. Ward, R. L. Honeycutt and J. N. Derr
prbi adhesion to human gastric mucosa. J. Pediatr. Gastroent- erol. Nutr. 21: 288-296.
SWANSON, W. J., and V. D. VACQUKER, 1995 Extraordinary diver- gence and positive Darwinian selection in a fusagenic protein coating the acrosomal process of abalone spermatozoa. Proc. Natl. Acad. Sci. USA 94: 4957-4961.
SWOFFORD, D. L., 1993 PAUP phylogenetic analysis using parsi- mony, version 3.1.1. Illinois Natural History Survey, Champaign, IL.
TICHER, A., and D. GRAIJR, 1989 Nucleic acid composition, codon
usage, and the rate of synonymous substitution in proteincoding genes. J. Mol. Evol. 48: 286-298.
WALL, D. A., S. K DAVIS and B. M. READ, 1992 Phylogenetic relation- ships in the subfamily Bovinae (Mammalia: Artiodactyla) based on ribosomal DNA. J. Mammal. 73: 262-275.
WELLS, D., W. BAUIS and L. KEDES, 1986 Codon usage in histone gene families of higher eukaryotes reflects functional rather than phylogenetic relationships. J. Mol. Evol. 23 224-241.
Communicating editor: W-H. LI