NRG WORKING PAPER SERIES BALANCING THE ROLES OF BUSINESS UNIT CONTROLLERS AN EMPIRICAL INVESTIGATION...
52
NRG WORKING PAPER SERIES BALANCING THE ROLES OF BUSINESS UNIT CONTROLLERS AN EMPIRICAL INVESTIGATION IN THE NETHERLANDS Hans ten Rouwelaar November 2006 no. 06-07 Nyenrode Research Group
Transcript of NRG WORKING PAPER SERIES BALANCING THE ROLES OF BUSINESS UNIT CONTROLLERS AN EMPIRICAL INVESTIGATION...

NRG WORKING PAPER SERIES
BALANCING THE ROLES OF BUSINESS UNITCONTROLLERS
AN EMPIRICAL INVESTIGATION IN THE NETHERLANDS
Hans ten RouwelaarNovember 2006 no. 06-07Nyenrode Research Group
NRG WORKING PAPER SERIES
Balancing the Roles of Business Unit Controllers An empirical investigation in the Netherlands
Hans ten Rouwelaar
November 2006 NRG Working Paper no. 06-07
ISSN 1872-3934
NRG The Nyenrode Research Group (NRG) is a research institute consisting of researchers from Nyenrode Business Universiteit and Hogeschool INHOLLAND, within the domain of Management and Business Administration. Straatweg 25, 3621 BG Breukelen P.O. Box 130, 3620 AC Breukelen The Netherlands Tel: +31 (0) 346 - 291 696 Fax: +31 (0) 346 - 291 250 E-mail: [email protected] NRG working papers can be downloaded at http://www.nyenrode.nl/research/publications
Abstract Business unit-controllers can fulfill two roles in business life: the support role and the control role. The support role is associated with supporting managerial decision-making in the business unit; the control role focuses on providing reliable and timely financial accounting information for the corporate level and ensuring that the financial function complies with relevant regulations. The purpose of this paper is to explain these two roles of business unit-controllers. Survey data from 119 business unit-controllers in Dutch multidivisional organizations indicate that business unit-controllers spend more time on the control role when their organization has a hierarchical or adhocracy culture and fewer employees. On the other hand, controllers spend more time on support activities when their organization is decentralized and when their organization is operating in the service or not-for-profit sector. Finally, controllers who are ‘open to new experiences’ spend less time on their control role, while controllers with a more agreeable personality spend more time on their control role. Please do not quote or distribute without permission of the author Keywords Contingency theory, controllers, culture, performance, support role and control role Address for correspondence Drs J.A. ten Rouwelaar Nyenrode Business Universiteit Straatweg 25, 3621 BG Breukelen, The Netherlands E-mail: [email protected] Phone: (+31) 346 – 291443 This paper has benefited from helpful comments from Jan Bots and Roland Speklé on earlier drafts of this paper, special thanks to Frank Verbeeten for his suggestions. In addition, comments from participants at the 29th congress of the EAA in Dublin (March 2006) are appreciated. I would like to acknowledge the financial support of the Nyenrode Research Group (NRG) of the Nyenrode Business Universiteit.
1 Introduction
Currently the position of the business unit management accountants, or business unit-
controllers1, as the ‘economic conscience of the organization’ has grown in importance.
Changes in reporting requirements, their personal liabilities and the advising of business
unit-managers in decision-making are redefining the roles of business unit (bu)-controllers.
However, we have little information about the current roles of bu-controllers. Until now, the
attention of researchers in this field has been focused on investigating the ways in which the
roles of bu-controllers could be questioned, categorized, and measured (Sathe, 1982). Most
empirical evidence in this area is based upon anecdotic study or case study evidence
(Indjejikian, 2006; Matĕjka, 2002). Roozen and Steens (2006) conclude “after the research of
Vijay Sathe into the controller involvement in 1982, no rigorous research into the
controller’s profession was executed” (Roozen & Steens, 2006, page 6). Empirical studies,
which actually measure and try to explain the roles of the bu-controllers by organizational
characteristics, are not available, except for two working papers by Verstegen et al. (working
paper) and Maas (working paper).
This study contributes to management accounting research by investing empirically the
determinants of the two roles of bu-controllers in large multidivisional organizations in the
Netherlands. According to the accounting literature the ‘position of the bu-controller’
generally consists of two main roles: the support role and the control role. Trends in
management accounting show that controllers spend more time on the support role (by
continuous improvement of operating activities, for example strategic analyses, life cycle
costing, and overhead value analyses) and less time on the control role (Bruin & Van der
Sande, 2005). In addition to the controller’s contribution to business decisions, which calls
for active involvement in management (support role), the bu-controller is also responsible
for the accuracy of financial reporting and for the integrity of internal control. These two
latter responsibilities of accuracy and integrity (control role) are also of growing importance 1 In this paper, I use the term ‘controllers’ to identify management accountants, financial managers, and CFO’s,
who were interviewed as “top-financial representative of the business unit”.
NRG 06-07 Balancing the Roles of Business Unit Controllers - ten Rouwelaar - 3 of 50
because of the discussion regarding corporate governance, the public disclosures concerning
corporate illegal payments, and the perception that corporate bribery has been concealed by
falsification of corporate books and records. New legislation, IFRS, and in-control
statements will probably force bu-controllers to pay more attention to their control role.
Three categories of factors are relevant in understanding and explaining variation in the
degree of controller involvement (Sathe, 1982): The first category of factors relates to the
controller’s motivation, personality, and interpersonal relationships with management; The
second set of factors relates to management’s expectations, orientation, and operating
philosophy; Finally, the third category of factors relates to the characteristics of the
company’s environment and business (Roozen & Steens, 2006, page 24).
This exploratory study focuses on the elements of the first category of factors, which I call
“the personal characteristics of the bu-controller”, and on elements of the third category of
factors are selected, which I call the “organizational characteristics”. The second category is
more difficult to study, because you would also have to interview bu-managers to investigate
what their expectations of the roles of the bu-controllers are. I therefore chose to investigate
this second category in a separate research project in 2006. Based upon existing management
accounting literature, I selected several organizational characteristics for my research model.
In this paper I describe the five of these characteristics, which are, from a data point of view,
the most effective in explaining the two roles. These characteristics are: (1) corporate culture;
(2) organizational structure (hierarchical relationships between the bu-controller and the bu-
manager or the corporate controller); (3) interdependencies among the business units; (4)
decentralization; and (5) performance or stress. From a ‘psychological theory’ point of view,
the personal characteristics and personal preferences of the bu-controller affect both roles. It
is interesting to find out what kind of personal characteristics fit to the control role or the
support role of the bu-controller, not only from HRM aspects, but also from educational
point of view (developing competences of future bu-controllers and new accounting process
techniques) (Cooper, 1996a; Helden, 1997; Kroon & Van der Steen, 2005; Maas, 2005). The
goal of this study is to measure these factors and (based upon data-analyses) to investigate
the theoretical framework for studies in examining bu-controllers’ roles.
NRG 06-07 Balancing the Roles of Business Unit Controllers - ten Rouwelaar - 4 of 50
The remainder of this paper is structured as follows: Section 2 provides the theoretical basis
for the empirical model in which six hypotheses will be tested. The description of the data
and research model are presented in Section 3. After presenting the results of the test in
Section 4, I provide a discussion and my concluding comments in Section 5.
2 Literature review and development hypotheses
2.1 The roles of the bu-controller
There are several definitions of a controller in the management accounting literature. A
widely used definition is: “A controller is the person in charge of both management
accounting and financial accounting in an organization; usually the chief accountant. Also
called comptroller” (Zimmerman, 2005, page 784). In this paper I will also use this definition
and in order to use Sathe’s conceptional framework and findings on controller involvement,
I confine this study to the bu-controller as “the top-financial representative of the business
unit”.
A controller is a crucial person within an organization. The controller plays key roles in line
management and in the design and operation of a management control system (Merchant &
Van der Stede, 2003, page 493). Bu-controllers are the financial measurement experts within
their business unit and are key members of management teams. As a member of the
management team, he can influence the decisions taken by the managers (act before the
fact). In addition to the bu-controller’s role of contribution in business decisions, the bu-
controller is responsible for the accuracy of financial reporting and for the integrity of
internal control (after the fact reporting).
Traditionally, the controller was at best tolerated as a necessary evil, viewed as a bean
counter or a corporate cop. Nowadays, the controller is welcomed into the halls of
management as a business partner, sought after for business acumen and the strategic
perspectives this professional brings to the table (Colton, 2001; Riedijk et al, 2002). Changes
triggered by a new competitive environment have created enormous new opportunities for
controllers. This new competitive environment demands much more accurate cost and
NRG 06-07 Balancing the Roles of Business Unit Controllers - ten Rouwelaar - 5 of 50
performance information on the organization’s activities, processes, products, services, and
customers. These changes in the environment of the bu-controller do not only have an
impact on the different tasks of the bu-controller, but also will also have influence on the
spread of attention and time between the two different roles of the bu-controller.
An author, who delivered several step stone publications in the seventies and eighties about
the roles of the controller, is Vijay Sathe. He considers two broad questions. First, why is it
that in some companies controllers are involved more actively in the business decision-
making process than in other companies? And the second question concerns the
consequences of controller involvement for company performance. Does active controller
involvement help to improve the company performance? (Sathe, 1982). These two questions
are still relevant today. In this paper I focus on answering the first question. To answer his
questions Sathe defined four ideal types of controllers. If primary emphasis is placed in the
controller’s management-service responsibility, the desired behavior for the controller is to
be actively involved in the business decision-making process (the involved controller). If
primary emphasis is placed on the controller’s financial reporting and internal control
responsibilities, the desired behavior for the controller is to retain objectivity and
independence in dealing with affiliated management (the independent controller). The
potential benefit is a greater assurance of financial reporting and the integrity of internal
control. There are two ways, according to Sathe, of underscoring both controllers’ financial
reporting and their management-service responsibilities. The first is to split the controller’s
role and assign each major responsibility to a different individual (the split controller), the
other way is to retain both major responsibilities in one individual, but than strong emphasis
is placed on both (the strong controller) (Sathe, 1983). But can such “strong controllers”,
who are highly involved as part of the management team, maintain the requisite degree of
independence to fulfill their fiduciary and management oversight responsibilities effectively?
In other words can controllers wear two hats - one role as a member of the management
team and confidant, and the other as a watchdog or police officer? Many people believe that
the control and report responsibilities often conflict with the controller’s management-
service responsibilities (Sathe, 1982; Matĕjka, 2002; Strikwirda, 2002; Indejikian & Matĕjka,
2006).
NRG 06-07 Balancing the Roles of Business Unit Controllers - ten Rouwelaar - 6 of 50
Most researchers define only two different roles for controllers, although they use different
names: One role is the management-service role (support role, or business advocate role),
which involves helping managers with their decision-making and control functions.
The other role is the oversight role, which involves ensuring that the actions of everyone
within the organization, and especially those of the managers, are legally, ethically correct,
and in the best interests of the organizations and its owners (Merchant & Van der Stede,
2003, page 493 or Hopper, 1980, page 402). In other literature there is a distinction between:
‘Corporate Policeman’ (control role), and ‘Business Advocate’ (support role) (Jablonsky et al,
1993; Van Helden, 1999, page 22). Verstegen et al (working paper) have distinguished two
groups of controllers that perform roughly similar activities in practice: the ‘transformers’,
who transform internal and external reports, and the ‘watchmen’, who score high on
prevailing activities that relate to accounting information system and risk management
(Verstegen et al, working paper).
In this paper I also distinguish two roles of the controller, namely: an active involvement in
management (support role) versus responsibilities of accuracy and integrity (control role).
Another reason for this choice, besides the connection to prior management accounting
literature, is the ambiguity of the two extreme points of the spectrum. By choosing both
ends of the spectrum, I can focus on the explanation why these two roles have main
differences.
2.2 Theoretical framework
The controller is responsible for the management accounting control system within an
organization. The applicability of a management accounting control system is contingent on
the circumstances faced by organizations. This approach is known as the contingency theory
approach to management accounting (Otley, 1980; Chehall, 2003).
Sathe (1982) developed a theoretical framework, in which it is possible to link situational
variables to role behavior, see figure 1. According to this framework, situational factors not
only influence role behavior indirectly via role sender expectations, as assumed in role theory
(arrow 2), but also directly by generating a demand for role behavior (arrow 3) just as role
NRG 06-07 Balancing the Roles of Business Unit Controllers - ten Rouwelaar - 7 of 50
sender expectations do (arrow 4). The translation of the demand behavior into actual
behavior is moderated by attributes of the person in the focal role and interpersonal factors,
as in role theory (arrow 5). This study investigates what kind of situational (organizational)
factors and what interpersonal (personal) factors influence the actual behavior.
--------------------------------------------------
INSERT FIGURE 1 ABOUT HERE
--------------------------------------------------
Based upon this framework of Sathe (1982), Roozen and Steens (2006) developed their
research framework to study controller effectiveness. The degree of actual controller
involvement (support role) and the degree of actual controller independence (control role)
are affected by “expectations and attributes of controller” and “interpersonal factors” (arrow
D1 and D2). Both have affect upon the Degree of controller effectiveness (arrow C1 and
C2) (Roozen & Steens, 2006, page 28). Besides this part of the research framework, Roozen
and Steens also paid attention to the degree of importance of staff
involvement/independence. This part of the framework is about the managers’ demand for
involvement/independence of their controllers, and is left for future research.
--------------------------------------------------
INSERT FIGURE 2 ABOUT HERE
--------------------------------------------------
Because each organization is unique, the potential range of situations or contingent factors is
enormous, which makes it impossible to study each one separately. To overcome this
problem I selected those organizational factors in my research model, which are probably
related with the two roles of bu-controllers (see figure 3), a selection based upon both the
findings of Sathe in 1982 and the instruments available in management accounting literature.
--------------------------------------------------
INSERT FIGURE 3 ABOUT HERE
--------------------------------------------------
NRG 06-07 Balancing the Roles of Business Unit Controllers - ten Rouwelaar - 8 of 50
The questionnaire contains four corporation’s characteristics (culture, interdependencies
among business units, corporate financial stress, and information asymmetry), four business
characteristics (decentralization, perceived environmental uncertainty, task uncertainty, and
bu-strategy), five personal characteristic (the Big-Five), and the roles of the bu-controller
were measured in three different ways (controller’s role, controller involvement, and
perceived time consumption). In this paper I will describe only the following five, from data
perspective most effective, organizational factors, namely: (1) corporate culture, (2)
organizational structure (hierarchical relationships), (3) interdependencies, (4)
decentralization, and (5) performance or stress. These kinds of factors are important for
analyzing the roles of bu-controllers, because in 1980 Hopper already stated that:
“accounting systems may be contingent upon organizational circumstances and that it is a
short step from such work to suggest that the role of the accountant is similarly contingent”
(Hopper, 1980, page 401).
2.2.1 Corporate Culture
Organizational/corporate culture has acquired a status similar to structure, strategy, and
control (Hofstede et al, 1990, page 286). Most organizational scholars and observers now
recognize that organizational culture has a powerful effect on the performance and long-
term effectiveness of organizations (Wikins & Ouchi, 1983; Cameron & Quinn, 1999). An
organizational culture depends for its existence on a definable organization, in the sense of a
number of people interacting with each other for the purpose of accomplishing some goal in
their defined environment (Schein, 1983). It was not until the 1980s that organizational
scholars began paying serious attention to the concepts of culture (Cameron & Quinn,
1999).
A useful tool for categorizing corporate cultures is the Organizational Culture Assessment
Instrument (OCAI) as described by Cameron and Quinn in 1999. The four types of
organizations in the OCAI model are based upon a theoretical model entitled the Competing
Values Framework. This framework has four different quadrants, based upon two axes:
Flexibility and Discretion versus Stability and Control (vertical) and Internal Focus and
NRG 06-07 Balancing the Roles of Business Unit Controllers - ten Rouwelaar - 9 of 50
Integration versus External Focus and Differentiation (horizontal). Each of the four
quadrants has been given a label to distinguish the four major culture types: Clan-,
Adhocracy-, Market-, and Hierarchy culture.
--------------------------------------------------
INSERT FIGURE 4 ABOUT HERE
--------------------------------------------------
The use of controls within the organization is likely to depend on the type of culture. In
organizations with different types of culture, the roles of the bu-controller will probably be
different too. Connecting different types of culture to the roles of the bu-controller will lead
to the following hypotheses.
The Hierarchy culture is based on organizations at the beginning of the Industrial Revolution,
which organizations were internally focused and which culture led to stable, efficient, highly
consistent products and services. Clear lines of decision-making authority, standardized rules
and procedures, and control and accountability mechanisms were valued as the keys to
success. In a Hierarchy culture the most highly valued criteria of effectiveness are: efficiency,
timeliness, smooth functioning, and predictability. Bu-controllers, working in a Hierarchy
culture, have more standards and are less frequently affected by changes in type of work.
Therefore, they will have more time for control tasks and less need for putting effort in
support tasks.
It is to be expected that in a Hierarchy culture the control role is more effective than the
support role, which leads to the following hypothesis:
H 1a In case the organization has a Hierarchy culture, the bu-controller will spend more
time on control tasks, and less time on support tasks.
The Market culture refers to a type of organization, that functions as a market in itself. It is
oriented towards the external environment (instead of internal affairs) and operates primarily
through economic market mechanisms, mainly monetary exchange. The major focus is to
conduct transactions with other constituencies to create competitive advantage. Profitability,
NRG 06-07 Balancing the Roles of Business Unit Controllers - ten Rouwelaar - 10 of 50
bottom line results, strength in market niches, stretch targets, and secure customer bases are
primary objectives of the market-organization. In a Market culture specific criteria are highly
valued, for example: achieving goals, outpacing the competition, and increasing market
share. The reason why the bu-controller, working in a business unit or organization with a
Market culture, will spend more time on the support role is probably because the bu-
manager has to react more frequently to changes in the environment of the business unit.
More competition, achieving goals and increasing market share are more dynamic criteria
than the criteria of the other cultures. In a Market culture it is to be expected that the
support role is more effective than the control role, which leads to the following hypothesis:
H 1b In case the organization has a Market culture, the bu-controller will spend more
time on support tasks, and less time on financial rapports (control tasks).
The third ideal form of organization is called Clan culture because of its similarity to a family-
type organization. Instead of rules and procedures of hierarchies or competitive profit
centers, typical characteristics of clan-type organizations are: teamwork, employee
involvement programs, and corporate commitment to employees. The Clan culture is
typified by a friendly place to work where people share a lot of themselves. It is like an
extended family. In the Clan culture rules and regulations are less important than loyalty and
support. It is to be expected that the support role of the bu-controller is more effective than
the control role, which lead to the following hypothesis:
H 1c In case the organization has a Clan culture, the bu-controller will spend more time
on support tasks, and less time on control tasks.
The last type of culture is the Adhocracy Culture. These are organizations in which innovation
and pioneering initiatives are what leads to success. A major goal of an Adhocracy
organization is to foster adaptability, flexibility, and creativity where uncertainty, ambiguity
and/or information-overload are typical. The need for diagnosing and rearranging
organizational culture is growing in importance partly because of an increasing need to
merge and mold different organizations’ cultures as structural changes have occurred (for
instance, when units are consolidated, or when entire organizations merge). In an Adhocracy
NRG 06-07 Balancing the Roles of Business Unit Controllers - ten Rouwelaar - 11 of 50
culture it is to be expected that the control role of the bu-controller is more effective than
the support role, which lead to the following hypothesis:
H 1d In case the organization has an Adhocracy culture, the bu-controller will spend
more time on control tasks, and less time on support tasks.
2.2.2 Organization of the Control function
A bu-controller always has dual responsibilities and provides information both to the bu-
management and the top-management (Simon et al, 1954; Sathe, 1978a; 1978b; Matĕjka,
2002). The bu-controller’s functional responsibility is to ensure that top-management knows
the ‘true’ financial state of the business unit. This includes regular reporting but also
maintaining an informal communication line with the functional superior (the so-called
‘dotted line’). As a part of the local responsibility, the bu-controller is in charge of local
accounting systems and provides reports relevant for decision-making by bu-managers.
Sometimes organizations place bu-controllers under supervision of the corporate controlling
department (the so-called ‘solid line’), which emphasizes the controller’s independency
(Merchant & Van der Stede, 2003, page 496). The bu-controller is than in danger of being
viewed by bu-management as an ‘outsider’, if not a ‘corporate spy’, and the bu-controller
may be denied access to sensitive information or is informed after the relevant decisions and
actions have already been taken (Sathe, 1983; Anthony & Govindarajan, 2004, page 74).
Some firms have found that solid-line reporting in the controller’s organization is effective for
the control of bu-controllers’ activities. Solid-line reporting means that the bu-controller’s
primary reporting relationship is to the corporate controller. The corporate controllers, not
the bu-managers, define the bu-controller’s tasks and priorities and evaluate their
performances. Solid-line reporting is designed to reduce the emotional attachment between
bu-controllers and the operating unit to which they are assigned. The primary cost of solid-
line reporting is a potential reduction in the quality of the controller’s management service
function. The solid-line controller can be viewed as a “corporate spy”, and will be excluded
from sensitive information of the business unit (Merchant, 1998, page 642). In case of a
hierarchical relationship between the bu-controller and the corporate controller (solid line),
the bu-controller (agent) will fulfill the wishes of the corporate controller (principal).
NRG 06-07 Balancing the Roles of Business Unit Controllers - ten Rouwelaar - 12 of 50
In case of a hierarchical relationship between the bu-manager and the bu-controller (dotted
line), the bu-controller (agent) will fulfill the wishes of the bu-manager (principal). The
relationship between the bu-controller and the corporate controller affects the bu-
controller’s roles, which leads to the following hypothesis:
H 2 In case of a hierarchical relationship between bu-controller and corporate controller
(solid line) the bu-controller will spend more time on control tasks, and less time on
support tasks.
2.2.3 Interdependencies among business units
Abernethy, Bouwens, and Van Lent (2004) investigated in their paper two relevant
determinants of the use of divisional summary measures: centralization and
interdependencies (Abernethy et al, 2004). Interdependencies occur when a business unit has
impact on other business units’ activities or performance. There are two types of
interdependencies: (1) when the business unit is influenced by the activities of other business
units (impact on you), and (2) when the business unit influences the performance of other
business units (impact on them) (Abernethy et al, 2004, page 549).
In case of more interdependencies among the business units the corporate controller has to
focus on all relations between the business units, so he will need adequate information of his
business units, and will need more financial rapports from the business units. It is to be
expected that the more impact a business unit has upon other the business units, the more
the bu-manager wants to be supported and the corporate controller will emphasis the
control role of the bu-controller, because of the impact of this business unit on other
business units. On the other hand, in case of influences of other business units upon your
performance, the bu-manager will have less impact on activities of other business units.
Therefore, there is also reason to believe that in case of ‘impact on you’ this bu-manager and
the corporate controller are less interested in the information of the bu-controller, so the
support role of the bu-controller and the control role would decrease. Based upon these
expectations, you might expect that:
H 3a There is a positive relationship between the impact on other business units and
the support role and control role of the bu-controller.
NRG 06-07 Balancing the Roles of Business Unit Controllers - ten Rouwelaar - 13 of 50
H 3b There is a negative relationship between the impact by other business units and
the support role and control role of the bu-controller.
2.2.4 Decentralization
The contingency theory suggests that Perceived Environmental Uncertainty (PEU) affects
organizational structure, and that controllers design organizational structures such that the
organization will be able to more effectively respond to the perceived environmental
demands (Gordon & Narayanan, 1984, page 36). According to the contingency theory
decentralization is also caused by knowledge and observability factors. Based upon
differences in information or knowledge about the transformation process and on outcome
(output)- and behavior (effort) observability top-management entrusts tasks to bu-
management since they neither have the time nor the ability to do the task themselves
(Nilakant & Hayagreeva, 1995, page 650). Or corporate management uses decentralization to
encourage the decisions capacity of their bu-managers, in order to increase the value of the
organization (Wruck & Jensen, 1994). Another reason to decentralize the decision rights to
bu-managers is the level of information asymmetry. Information asymmetry occurs when
lower-level managers have specific knowledge about the functioning of the business unit,
which knowledge is either not available to corporate management or is too costly for
corporate management to obtain (Christie et al, 2001). Abernethy et al. (2004) have found
that decentralization is positively related with the level of information asymmetry and
negatively to intra-firm interdependencies (Abernethy et al, 2004, page 547). As a result of
decentralization, bu-managers have opportunities to misrepresent information and divert
resources to their personal use. Decentralization refers to the level of autonomy delegated to
managers (Chenhall & Morris, 1986). By decentralization the bu-manager gets more rights to
take decisions without asking permission of corporate managers. Findings suggest that
attempts by the bu-controllers to improve response time and to assimilate information from
many resources into a broad scope of Management Accounting Systems are of particular
relevance to managers who perceive their operating situation as uncertain (Chenhall &
Morris, 1986). The bu-manager shall demand more adequate information (support) from his
bu-controller, so the support role will increase. On the other hand, the corporate managers
want to get information (reports) from their bu-managers to monitor the managers’ actions,
NRG 06-07 Balancing the Roles of Business Unit Controllers - ten Rouwelaar - 14 of 50
so the corporate controller could ask for more reports (control) as well. In fact the in case of
decentralization both roles will be emphasized:
H 4 There is a positive relationship between decentralization of decision rights to the
local bu-manager and the support role and control role of the bu-controller.
2.2.5 Performance or stress
The most common example of organizational stress influencing the choice of reporting
relationships is poor financial performance. Although there are exceptions, companies using
direct reporting to the corporate controller tend to be those with poorer performance
relative to the industry than those where bu-controllers report directly to bu-management
(Sathe, 1978a, page 102). In case of poor financial performance it is to be expected that the
control role of the bu-controller will be more important. Another form of organizational
stress that bears on reporting relationships for bu-controllers is stress caused by sudden
discovery of serious financial mismanagement in a business unit. These incidents cause top-
management to seriously question the integrity of the company’s reporting and control
system and tend to increase the probability that the corporate controller will be given greater
authority over bu-controllers (Sathe, 1978a, page102).
If the performance of the business unit is really important, not only the corporate controller
will be more focused on the reports, but also the bu-manager will have more stress than in
the situation wherein the performance of the business unit is relatively unimportant. In case
of declining profits, the bu-manager has to react and will need more support of the bu-
controller. Both control and support roles will be more important in case of poor financial
performance within the business unit. Therefore the following hypothesis will be tested:
H 5 There is a positive relationship between financial stress of the business unit and the
support role and the control role of the bu-controller.
NRG 06-07 Balancing the Roles of Business Unit Controllers - ten Rouwelaar - 15 of 50
2.3 Psychological theory
Personal Characteristics
According to Roosen and Steens (2006), controllers must take into account the fact that bu-
managers generally score higher than non-executives in terms of intelligence, dominance,
self-confidence, energy, perseverance and knowledge of the task for which they are
responsible. Personal characteristics however, do not make bu-managers effective; it is all
about how these characteristics influence their behavior. Given the fact that bu-controllers
have the same goal, i.e. influencing their bu-managers to ensure that the financial-economic
interest of decisions is adequately taken into account, this aspect of bu-managers makes the
job of bu-controllers especially difficult: the bu-controllers end up taking on experts in
exercising influence! (Roozen & Steens, 2006, page 102). For an effective collaboration and
a smooth working relationship, bu-controllers must be able to adapt their behavior to the
management style of their bu-managers. Besides insights into the management style, bu-
controllers must be aware which part of their own behavior is best suited to the situation.
Bu-controllers find themselves in a somewhat subordinated position vis-à-vis bu-managers
and they continuously have to weigh the pros and cons of being loyal to group control
(control role) on the one hand and to bu-management (support role) on the other. As soon
as a position of trust is achieved, bu-managers will also to a degree be prepared to adapt their
behavior towards their bu-controllers.
The behavior and personal characteristics of the bu-controller affect the effectiveness of bu-
controllers. Van der Ven (2002) found four generic conditions to be met if the bu-controller
has to effectively exercise its responsibilities: (1) substantive knowledge and skills; (2)
personal, intra social (individual instinctive) competences; (3) influencing behavior, by
applying the available tools and instruments bu-controllers have; and (4) a management style
expressing clarity regarding the steering relationship between bu-controllers and bu-
management on the one hand and between bu-controllers themselves on the other hand (in
dealing with ones functional superior: corporate controllers) (Van der Ven, 2002; Roozen &
Steens, 2006).
NRG 06-07 Balancing the Roles of Business Unit Controllers - ten Rouwelaar - 16 of 50
There are a lot of ways to describe the personal characteristics of humans. One of the best
ways (and therefore the most frequently used way) is the Five Factor Model of Howard and
Howard (Howard & Howard, 2001a). The Five Factor Model contains five dimensions: The
Big Five: Neuroticism (also emotional instability), Extraversion, Openness to new
experiences (the Originality Factor), Agreeableness (the Accommodation Factor), and
Conscientiousness (The Consolidation Factor) (Howard & Howard, 2001b; 2001c). Other
researchers have helped to develop this model further (Digman, 1990; Gosling et al, 2003).
In the Five Factor Model, there are five dimensions that all combined give a picture of the
person’s characteristics. These five ‘Big Five dimensions’ are:
1. Neuroticism (Need for Stability): This aspect refers to the degree in which a
person responds to stressful circumstances. More resilient persons (N-) react in a
calm, steady, and secure way. These persons tend to be more rational at work than
most people and they appear rather impervious sometimes to what’s going in around
them. At the other extreme of the Need for Stability continuum, there are the more
reactive persons (N+), who react in an alert, concerned, attentive, or excitable way.
They have high stress sensitiveness and are often unable to deal with stress or
stressful circumstances. In the middle there are the responsive people, who are a
mixture of the characteristics of the resilient and reactive people.
2. Extraversion: This aspect refers to the degree in which a person can tolerate sensory
stimulation from other people or situations. Persons with high scores (E+) are
characterized by their preference of being around other people and by their
involvement in many different activities. These extravert persons have a larger social
sphere in which to acquire the social skills necessary to maintain a larger, more
inclusive number of relationships (Mahony & Stasson, 2005). Persons with a low
degree of extraversion (E-) are characterized by a preference to work alone; they are
often described as quiet, serious, and private persons. These persons for whom
Extraversion is below average (labeled in the vernacular as “Introverts”) presumably
have fewer social interactions with other people (Mahony & Stasson, 2005).
3. Openness (Originality): This aspect refers to the degree in which a person is open
to new experiences or new ways of doing things. People who score high on this
dimension (O+), are called ‘explorers’; they have broader interests, and have a
NRG 06-07 Balancing the Roles of Business Unit Controllers - ten Rouwelaar - 17 of 50
fascination with novelty and innovations. They like to explore their creativity and
dislike repetitive, simple tasks (Tett & Burnett, 2003). The opposite kind of people
(O-), the so-called ‘preservers’, have narrower interests, are perceived as more
conservative, but not necessarily as more authoritarian. They are more comfortable
with the familiar circumstances than the ‘explorers’.
4. Agreeableness (Accommodation): This aspect refers to the social skills
component and the degree in which we defer to others. High accommodation (A+)
describes persons who tend to relate to others in being tolerant, agreeable, and
accepting towards others (so called ‘adapters’). Low accommodating people (A-) may
not accept information without checking; they come across to others as hostile, rude,
self-centered, and not a team player (so called ’challengers’).
5. Conscientiousness (Consolidation): This aspect refers to the degree in which a
person pushes toward reaching goals at work. People with a high consolidation (C+)
tend toward goals in an industrious, disciplined, and dependable fashion (so called
‘focused’). The definition of Conscientiousness includes a number of different
aspects: competence, order, dutifulness, achievement striving, self-discipline and
deliberation (Clarke & Robertson, 2005). A further aspect of Conscientiousness
related to deliberation and order, is reflected in thoroughness in decision-making
style. Low thoroughness is characterized by a lack of forward planning, absence of a
logical or systematic approach to decision making and inadequate cost-benefit
analysis and contingency planning (Clarke & Robertson, 2005). Low consolidation
types (C-) tend to approach goals in a relaxed, spontaneous, and open-ended fashion
(so called ‘flexible’). Towards the middle of the Conscientiousness continuum is the
‘balanced person’, who finds it easier to move from focus to laxity, and providing
just enough of both qualities to keep focus and relax periodically to enjoy life a little.
Bu-controller’s personal preferences and characteristics will affect both roles. For the
support role it is to be expected that bu-controllers are open to new experiences (O+), can
easily relate to others (A+) and have a more extrovert character (E+). For the control role it
is to be expected that bu-controllers have a focused (C+), more resilient character (N-).
NRG 06-07 Balancing the Roles of Business Unit Controllers - ten Rouwelaar - 18 of 50
It will be interesting to know what kind of personal characteristics fit to the control role or
the support role of the bu-controller. Based upon the expectation that bu-controllers have
characteristics that fit to their work and interests, the following hypotheses are interesting to
be tested:
H 6a Bu-controllers with high scores on Extraversion (extravert), Openness (explorer), or
Agreeableness (adapter) are related with the support role of the bu-controller.
H 6b Bu-controllers with low scores on Neuroticism (resilient), or high scores on
Conscientiousness (focused) are related with the control role of the bu-controller.
2.4 Control variables
There are several factors that do not affect the two roles directly, but that could influence the
other factors by enforcing or moderating these direct relationships. Data regarding two of
such factors, that could affect the two roles indirectly, are additionally selected for this paper,
which factors are: firm size and firm industry.
Firm Size
The relation between the two roles of bu-controllers and the size of the organization is
difficult to predict. On the one hand, the larger the organization (size of the organization),
the more business units the corporate organization has. So corporate management wants to
be well informed and they will ask for reports more frequently. But on the other hand, the
larger the company is the more decentralization, which results in more local decisions. So the
bu-manager will also need more support if the organization is larger. It is likely to assume
that there is an enforcing effect of the size of the organization upon the degree in which the
bu-manager will need support or upon the degree in which the corporate management well
need reports.
Firm Industry
The distribution of tasks of a bu-controller over his support - and control roles will depend
upon the type of industry of the organization. I will include a dummy variable for several
industries in order to standardize for the effects of industry.
NRG 06-07 Balancing the Roles of Business Unit Controllers - ten Rouwelaar - 19 of 50
2.5 Summary of hypothesis and Theoretical Framework
Table 1 provides the relations between the selected variables and the two roles, as a summary
of my expectations, hypothesis 1 up to and including 6.
--------------------------------------------------
INSERT TABLE 1 ABOUT HERE
--------------------------------------------------
The research model of this study is shown in Figure 5.
--------------------------------------------------
INSERT FIGURE 5 ABOUT HERE
--------------------------------------------------
3 Research Methodology
3.1 Sample description
The data for this paper were collected through a questionnaire survey, using NIVRA-
Nyenrode students in the Masters of Science in Controlling program to interview bu-
controllers working in practice. Respondents are working as bu-controllers in a business unit
which complies with two conditions: (1) the bu-manager of the business unit has profit- or
result responsibility to corporate headquarters, or division (=organization); and (2) at least 50
Full Time Equivalents (employees) are working within the business unit. In total 119
interviews were held and 119 questionnaires were completed. These 119 different bu-
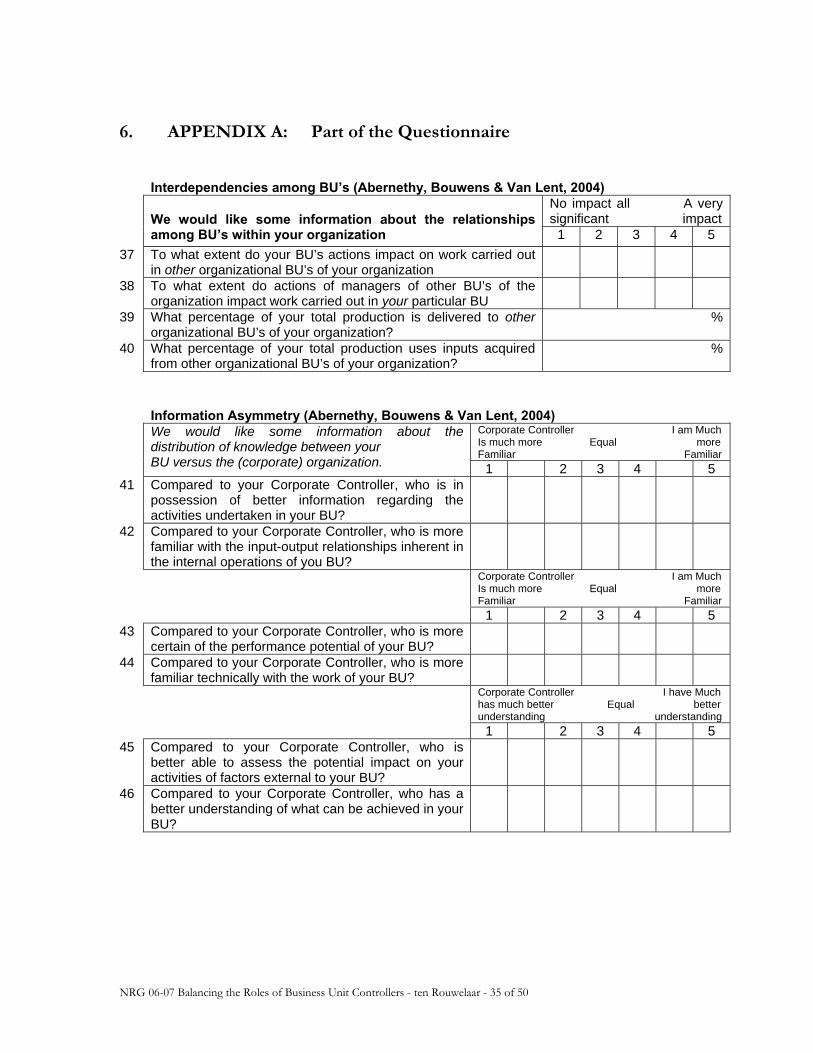
controllers work within 77 different organizations. A copy of the relevant questions from the
questionnaire is added to this paper in appendix A.
3.2 Variable instruments
In this section I discuss the measurement of the constructs in turn. The numbers (e.g. q110)
refer to the specific questions in Appendix A.
NRG 06-07 Balancing the Roles of Business Unit Controllers - ten Rouwelaar - 20 of 50
The roles of the Controller
Measuring the roles of the controller has been done in prior research in several, different
ways. In this paper, the roles of the bu-controller are measured by three different
instruments taken from previous literature: (1) Management accountant’s roles of Sathe
(1982), (2) Involvement instrument of Matjĕka (2002), and (3) Spent Time instrument of
Oude Vrielink & Verbeeten (2004).
Controllers’ roles
This instrument is developed by Sathe e.g. (Sathe, 1982; 1983), who considers the
controller’s management-service responsibility versus the controller’s financial-reporting and
internal-control responsibility. To measure the management-service responsibility the
following questions were used: q108 to q110, and q111 to q116 for the financial-reporting
and control responsibility. This instrument leads to two factors: the first factor is RESPCON
(explaining 24.7% of variance), the second is RESPSUP (explaining 17.5% of variance),
which indicates the controller’s control responsibility and management support
responsibility, respectively. The Cronbach Alpha of RESPSUP (q108 and q110) is 0.5203,
and the Alpha of RESPCON (q111 till q116, except q115) is 0.6580.
Involvement (INVOLV) and Independency (INDEP)
The second instrument to measure the roles of the controller is developed by Matjĕka in his
study, published in Chapter 2 of his Dissertation (Matĕjka, 2002). This instrument, listed in
the questionnaire in questions q118 until q124, measures the influence of the controller on
business actions (1=no influence, 5=strong influence).
My analysis results in two factors; the first factor is positively loaded by all questions q118 to
q124, but the second is negatively loaded by q122 to q124. The first factor I label INVOLV
and the second factor is labeled INDEP, because the first factor, INVOLV, shows that the
bu-controller is concerned with all kinds of tasks, the second factor, INDEP, shows that the
bu-controller doesn’t have any influence on management decisions and acts more
independently. The first factor explained 33.4% and the second factor explains 17.2% of
NRG 06-07 Balancing the Roles of Business Unit Controllers - ten Rouwelaar - 21 of 50
variance. So, both factors together explained 50.6% of variance. The Cronbach Alpha of
INVOLV, capturing all tasks (q118 till q124), is 0.6603.
Control Activities (CONACT) and Support Activities (SUPACT)
Another way in measuring the support role and control role by using the instrument of
Matjĕka (2002) is by defining two variables based upon the scores of the questions q118 to
q124. The variable CONACT is based upon the total score of the control activities: accounts
receivable (q118), inventory (q119), and operating expenses (q120). The variable SUPACT is
based upon the total score of the support activities: incentive systems (q122), target
customers segments (q123), and offered range of products (q124).
Time for Support (TIMESUP) and Time for Control (TIMECON)
The third instrument to measure the different roles is derived from Oude Vrielink and
Verbeeten (2004). They developed questions q125 to q132, which ask controllers how they
spent their time (in %) in the last 12 months to different tasks in four categories: Transaction
processing, Reporting & Consolidation, Planning & Control, and Decision Support,
respectively. CONTIME is based upon the first two categories (= q125 + q126), and
SUPTIME is based upon the third en fourth category (= q127 + q128).
Corporate Culture (CLANCULT, ADHOCULT, MARKCULT, HIERCULT)
To measure the corporate culture I use the Organizational Culture Assessment Instrument
(OCAI). The instrument, that Cameron and Quinn describe, requires individuals to respond
to just six items. Each question has four alternatives. By dividing 100 points over these four
alternatives, a total score is easily calculated. This instrument has been found to be both
useful and accurate in diagnosing important aspects of an organization’s underlying culture
(Cameron & Quinn, 1999, page 20 – 27).
The results of the calculations are four variables measuring the culture of the company:
CLANCULT = (q47 + q51 + q55 + q59 + q63 + q67);
ADHOCULT = (q48 + q52 + q56 + q60 + q64 + q68);
MARKCULT = (q49 + q53 + q57 + q61 + q65 + q69);
HIERCULT = (q50 + q54 + q58 + q62 + q66 + q70).
NRG 06-07 Balancing the Roles of Business Unit Controllers - ten Rouwelaar - 22 of 50
Each of these variables gives an indication on the degree of which the organization has a mix
of each of the four types of culture: Clan- (CLANCULT), Adhocracy- (ADHOCULT),
Market- (MARKCULT), or Hierarchy culture (HIERCULT). The Cronbach Alpha’s are:
0.7959; 0.779; 0.8901, and 0.7593 respectively.
Hierarchical Structure (CORPCNTR)
Respondents have been asked to indicate who their direct principal is: bu-manager or
corporate controller (q21 and q 22). Based upon the answers of these questions I calculated a
Dummy variable, called CORPCNTR, which is a Hierarchy Dummy (i.e. 1 = corporate-
controller is hierarchical principal of the bu-controller, 0 = other is hierarchical principal of
the bu-controller).
Interdependencies (IMPATHEM and IMPAYOU)
This instrument is derived from Abernethy, Bouwens, and Van Lent (2004). The instrument
measures in question q37 “to what extent your BU’s actions impact on work carried out to
other business units” (IMPAYOU) and in question q38 “to what extent other business units’
actions impact on work carried out in your particular business unit” (IMPATHEM) (1= no
impact, 5= a very significant impact). The Spearman’s correlation between both variables is
0.786 (p=0.000), so these variables are strongly correlated with each other.
Decentralization (DECENTR)
This instrument is taken from Abernethy, Bouwens, and Van Lent (2004). They measure in
five questions who can make the following decisions in: Strategy, Investment, Marketing,
Internal processes, and Human Resources, ranging 1=100% Business unit to 5=100%
Corporate (see questions q75 to q79 in the questionnaire). These questions are reversed
(reverse code = 6 minus score, makes r75 to r79 out of the questions q75 to q79) and then
factorized. The factor analyses show just one factor: DECENTR, which explains 46.2% of
variance. The Cronbach Alpha of DECENTR is 0.7062.
NRG 06-07 Balancing the Roles of Business Unit Controllers - ten Rouwelaar - 23 of 50
Performance (PERFORM)
An instrument of Abernethy, Bouwens and Van Lent (2004) which measures the
performance of the business unit by comparing the performance of the business unit to the
performance of external firms producing similar products or services (Abernethy et al,
working paper). The questions q134 to q139 measure just one factor called: PERFORM,
explaining 56.7% of variance. The Cronbach Alpha of PERFORM is 0.8458.
Personal Characteristics
There are a lot of different ways in measuring the personality characteristics of a person.
Through the years personality theories have tried to reduce the number of personality
characteristics to a small number of predispositions, resulting in the increasingly prominent
Five Factor Model (Mahony & Stasson, 2005).
Gosling et al (2003) have developed a small instrument to measure the Five Factor Model:
the Ten-Item Personality Inventory (T.I.P.I.) instrument. This instrument measures the
personal characteristics, with just two questions for each item representing a pole of the five
Big-Five personality dimensions. Gosling et al (2003) have tested this T.I.P.I. instrument and
concluded that the ten questions fit to the Five Factor Model. The instrument, which is
inserted in the questionnaire in q141 to q150, is the “Ten-item Personality Inventory”
(T.I.P.I.). Each item consists of two descriptors, separated by a comma, using the common
stem, “I see myself as:” Each of the five items was rated on a 5-points scale ranging from 1
(disagree strongly) to 5 (agree strongly). The result of the ten measures of T.I.P.I. is a score
on each of the five dimensions of the BIG-Five personality Inventory:
Extraversion (E) = q141 + (6 – q146), Agreeableness (A) = q147 + (6 – q142),
Conscientiousness (C) = q143 + (6 – q148), Neuroticism (N) = q144 + (6 – q149), and
Openness to Experience (O) = q145 + (6 – q150) respectively.
Control Variables
Besides the independent- and dependent variables, I added control variables to the
questionnaire. These control variables are Firm Size, and three indicators for different types
of Industry.
NRG 06-07 Balancing the Roles of Business Unit Controllers - ten Rouwelaar - 24 of 50
Firm Size (LOGSIZE)
There are different ways in which the size of the organization can be measured and
implemented in the research model. As proxy for the size of the organization I selected the
logarithm of the number of employees employed within the organization. Matĕjka also used
this variable as a control variable in his Dissertation (Matĕjka, 2002, page 13). The
Spearman’s correlation coefficients of LOGSIZE with Sales and Total Assets are: 0.446
(p<0.001) and 0.230 (p=0.026) respectively.
Industry (SERVICE, FINSERVI, PUBLIC)
Different types of Industry were measured by codes. In the questionnaire the respondents
could indicate in which industry the business unit is working. The number of codes has set
to 17 different codes. Based upon the number of organizations in the data set, I limited the
number of codes to just four different categories: (1) manufacturing organizations, code 4
and 5, (2) financial intermediation, code 10, (3) service organizations in trade, code 7, 8, 9,
and 11, and (4) public sector, code 12 – 15. The codes refer to the list at the end of
Appendix A.
4 Results
4.1. Descriptive Statistics
The bu-controllers who were interviewed, are working in variety of industry: 47.1% is
working in industry, 20.2% in trade, 9.2% in services, 16.0% in financial service, and 5.9% in
not for profit organizations (missing 1.7%). They have on average 9.0 years working
experience, of which 5.4 years as a bu-controller. On average the bu-controllers have worked
for 3.2 years within their current business unit. Of all 119 controllers, 57.2% has university
level education (Master level), 38.7% has a Bachelor level education (the remainder of them
(4.1%) has lower education or is not available in the data).
The bu-controller most frequently has a hierarchical relationship with the bu-manager in 79
business units (66%); in 17 business units (15%) there exists a hierarchical relationship with
the corporate controller. In the remaining 28 business units (19%) both bu-manager and
NRG 06-07 Balancing the Roles of Business Unit Controllers - ten Rouwelaar - 25 of 50
corporate controller have influence on the bu-controller, because of both functional and
hierarchical relationships.
Table 2 and 3 present descriptive statistics for all dependent and independent variables in the
estimation models described in the next sections.
--------------------------------------------------
INSERT TABLE 2 ABOUT HERE
--------------------------------------------------
Table 2 shows that the variables: RESPCON, RESPSUP, INVOLV and INDEP are all
variables, which have been factorized, because they have mean zero and standard deviation
equal to 1. The control time (CONTIME = q125 + q126) and support time (SUPTIME =
q127 + q128) express that the bu-controller on average spends 61.5% of his time on support
tasks and just 38.5% on control tasks. Though when you ask the bu-controller (in the
questions q118 till q124) which of the activities he can actually influence, the bu-controller
answers that he can influence control activities (mean 9.81) more than support activities
(mean 7.26).
--------------------------------------------------
INSERT TABLE 3 ABOUT HERE
--------------------------------------------------
Table 3 shows that almost all 119 respondents filled in all questions. Just two independent
variables, Market culture (MARKCULT) and Decentralization (DECENTR) were missing
one item. The control variables for the types of industry have 117 items. There were 35 (30
%) organizations in the service sector and 19 (16 %) in the financial service sector. There
were 7 (6%) organizations in the public sector in the data set. The remainder of the firms (56
(48%) firms) are active in the manufacturing sector.
NRG 06-07 Balancing the Roles of Business Unit Controllers - ten Rouwelaar - 26 of 50
--------------------------------------------------
INSERT TABLE 4 ABOUT HERE
--------------------------------------------------
Table 4, the correlation matrix of the dependent variables, shows that controllers, who
indicate that they are responsible for support tasks (RESPSUP), also spend more time in this
area (SUPTIME, 0.347, p<0.01) and are more involved in management decision-making
(INVOLVE, 0.285, p<0.01). It is strange to notice that RESPSUP is positively correlated
with both Support and Control activities (SUPACT 0.277, p<0.01, and CONACT 0.313,
p<0.01). This means that bu-controllers, who are responsible for support tasks, indicate that
they give more attention to both roles, which is also shown by the fact that INVOLV is
positively related with both CONACT (0.654, p<0.10) and SUPACT (0.856, p<0.10). Bu-
controllers, who indicate that they are more independent, are as expected, more related to
control activities and less related to support activities: INDEP is positively related with
control - and negatively related with support activities (0.699, p<0.01, -0.425, p<0.01). The
variables indicate that the time spend on control (CONTIME) is negatively correlated with
INVOLV (-0.226, p<0.05) and support activities SUPACT (-0.284, p<0.01). The time spent
on support SUPTIME is positively related with support activities SUPACT (0.284, p<0.01).
This is in conformity with the expectations.
--------------------------------------------------
INSERT TABLE 5 ABOUT HERE
--------------------------------------------------
Table 5, the correlation matrix of the independent variables, shows that the independent
variables are hardly correlated among themselves. This indicates that problems with
multicollineairity or biased econometric results are likely to be minimal.
NRG 06-07 Balancing the Roles of Business Unit Controllers - ten Rouwelaar - 27 of 50
4.2. Main Findings
Empirical testing of the hypothesis derived earlier involved assessing the impact of the
consistency factors on the support and control roles of the bu-controller. To estimate the
impact of the contextual factors, the following empirical model is defined:
X i = ß 0i + ß 1i * MARKTCULT i + ß 2i * HIERCULT i + ß 3i * ADHOCULT i + ß 4i * CORPCNTR i + ß 5i *
IMPATHEM i + ß 6i * IMPAYOU i + ß 7i * DECENTR i + ß 8i * LOGSIZE i + ß 9i * PERFORM i + ß 10i * N i
+ ß 11i * E i + ß 12i * O i + ß 13i * A i + ß 14i * C i + ß 15i * SERVICE i + ß 16i * FINSERVI i + ß 17i * PUBLIC i +
ε i
Where:
X = One of the following Dependent variables:
RESPCON i = degree of responsibility for control role by bu-controller of
organization i.
RESPSUP i = degree of responsibility for support role by bu-controller of
organization i.
CONTIME i = time spent on control role by bu-controller of organization i.
SUPTIME i = time spent on control role by bu-controller of organization i.
INVOLV i = the degree in which the bu-controller is involved in organization i.
INDEP i = the degree in which the bu-controller is independent in organization
i.
CONTACT i = control activities done by the bu-controller of organization i
SUPACT i = support activities done by the bu-controller of the organization i
And as Independent variables:
MARKTCULT i = Market culture of organization i.
HIERCULT i = Hierarchy culture of organization i.
ADHOCULT i = Adhocracy culture of organization i.
CORPCNTR i = Hierarchy Dummy (i.e. 1 = corporate-controller is hierarchical
principal of the bu-controller, 0 = other is hierarchical principal of
the bu-controller) of organization i.
NRG 06-07 Balancing the Roles of Business Unit Controllers - ten Rouwelaar - 28 of 50
IMPATHEM i = the impact of the business unit on other business units of
organization i.
IMPAYOU i = the impact of other business units on the business unit of
organization i.
DECENTR i = Degree of decentralization of activities to the business unit of
organization i.
LOGSIZE i = logarithm of the number of FTE within organization i.
PERFORM i = the degree in which the business units of organization i is successful.
N i = the degree in which the bu-controller is concerned or attentive.
E i = the degree in which the bu-controller is extrovert or social involved.
O i = the degree in which the bu-controller is open to new experiences.
A i = the degree in which the bu-controller is agreeable or tolerant.
C i = the degree in which the bu-controller is conscience or disciplined.
Control variables:
SERVICE i = Industry Dummy (i.e. 1 = service Industry, financial services
excluded, 0 = other industry) for organization i.
FINSERV i = Financial Service Industry Dummy (i.e. 1 = financial service centre, 0
= other industry) for organization i.
PUBLIC i = Public Service Industry Dummy (i.e. 1 = organization in not-for-
profit sector, 0 = other industry) for organization i.
ε i = error term of organization i.
Table 6 presents the results of the bu-controller’s responsibility and time analysis.
--------------------------------------------------
INSERT TABLE 6 ABOUT HERE
--------------------------------------------------
Table 6 indicates that both the support and the control responsibilities were negatively
influenced by the impact of other business units’ activities (IMPAYOU), but positively
NRG 06-07 Balancing the Roles of Business Unit Controllers - ten Rouwelaar - 29 of 50
influenced by influence on other business units (IMPATHEM). In case the organization has
more concern about the results, the control responsibility of the bu-controller will increase,
because more responsibility for control seems to be slightly, positively related with
performance or stress (0.150, p<0.15). Bu-controllers with a character ‘open to new
experiences’ will have more responsibility for support as expected. Bu-controllers with an
accommodating character have more responsibility for control. These findings partly
confirm hypotheses H 6a and H 6b.
Measuring the two roles of the bu-controller based upon the time analyses (CONTIME and
SUPTIME) provides the best results with the highest adjusted R-squared (0.141). Table 6
also indicates, that consistent with the expectations, the time spent by the bu-controller on
the control role is positively related with hierarchical and adhocracy cultures. Bu-controllers
with a character ‘open to new experiences’ are spending less time on control, in contrast to
the bu-controllers with an accommodating character. Bu-controllers with an accommodating
character are more positive toward control tasks. The size of the organization, conform
expectations, indicates that bigger organizations spent more time on support tasks and less
on control tasks. Other factors, like interdependency, decentralization and performance do
not have any effect on the time spent on either control or support tasks. Also, the
hierarchical position of the bu-controller doesn’t seem to have any influence on the way in
which the bu-controllers spend their time. However, organizations in the service- or the
public sector are spending less time on control and more on support than organizations
working in the manufacturing sector.
Table 7 presents the results of the analysis of Involvement and Activities.
--------------------------------------------------
INSERT TABLE 7 ABOUT HERE
--------------------------------------------------
Table 7 indicates that, consistent with expectations, the involvement of the bu-controller is
positively related with decentralization (0.159, P<0.15). Giving a bu-manager more
responsibility will increase the involvement of the bu-controller. Bu-controllers with a high
NRG 06-07 Balancing the Roles of Business Unit Controllers - ten Rouwelaar - 30 of 50
score on ‘neuroticism’ (reactive) seem to be less involved than bu-controllers with other
personal characteristics (-0.186, p<0.10). PERFORM, as an indication to the success of the
business unit, indicates to be slightly positively associated to the involvedness of the bu-
controller (0.161, p<0.15). Bu-controllers working in the financial service sector (-0.190,
P<0.10) or the public sector (-0.183, p<0.10) seem to be less involved in management
decisions than bu-controllers working in the manufacturing sector.
The results of the analysis based upon the measurement of control- and support activities,
are quite different in explanation. The regression of the control activities (CONACT) has an
adjusted R-square of 0.398, but the regression of the support activities (SUPACT) has an
adjusted R-square of just 0.164. The control activities of the bu-controller seem to be
negatively associated with all cultural factors and all organizational dummy variables.
Decentralization is positively related with support activities, which is in line with the
expectations (0.227, p<0.10). Bu-controllers with a high score on ‘neuroticism’ (reactive) are
slightly negatively related with control activities and support activities (- 0.125, p<0.15; and -
0.158, p<0.15 respectively). These results are also in line with the expectations (hypothesis
6b). In contrast to the results of the time analysis the relation between bu-controllers with an
agreeable character are now negatively related with control activities (-0.183, p<0.10). Table
7 shows that bu-controllers with these characteristics spend less time on their control tasks.
5 Discussion and Concluding Comments
5.1. Discussion
In this exploratory study the two roles of the bu-controller, support role and control role,
were related with two of the three categories of factors, developed by Sathe 1982: (1) factors
related to the characteristics of the company’s environment and business, and (2) factors
related to the controller’s motivation and personality.
In this paper five characteristics of the company’s environment and business were analyzed.
NRG 06-07 Balancing the Roles of Business Unit Controllers - ten Rouwelaar - 31 of 50
First, the relations with four different cultures were examined. When an organization has a
hierarchical or adhocracy culture the bu-controller will spend more time on the control role.
Second, the hierarchical relationship with the corporate controller was tested. The way in
which the bu-controller is supervised did not seem to affect the support or the control role
of the bu-controller.
Third, the relations between two factors of Interdependencies, the impact on other business
units (IMPATHEM) and the impact from other business units on the business units
(IMPAYOU), were tested. Both support and control responsibilities were negatively
influenced by the impact of other business units’ activities (IMPAYOU), but positively
influenced by influence on other business units (IMPATHEM).
Fourth, the involvement of the bu-controller is positively related with decentralization.
Giving a bu-manager more responsibility will in general mean that the involvement of the
bu-controller will increase.
Fifth, performance or financial stress indicates to be slightly positively associated to the
involvedness of the bu-controller, but doesn’t seem to have significantly strong influence on
the two roles of the bu-controller.
The second category of factors is the ‘personal characteristics’-category. In this category
several factors or ‘personal characteristics’ were also measured and interrelated with the two
roles. As expected, bu-controllers with a character ‘open to new experiences’ are spending
more time on support tasks. Bu-controllers with an agreeable or consolidation character are
spending more time to control tasks.
Extra control variables, like the size of the organization and types of industry, do not have
strong effects on the time spent on either control or support tasks. However, there appear to
be some industry effects: Organizations in the service- or the public sector are spending less
time on control tasks than organizations working in the manufacturing sector.
5.2. Limitations
Several steps were taken to limit the scope of this study and to keep the project manageable.
First, only Dutch organizations and their domestic business units are included in this
NRG 06-07 Balancing the Roles of Business Unit Controllers - ten Rouwelaar - 32 of 50
investigation. Second, the study is limited to large, multidivisional organizations. Other data
selected in another country or under other circumstances, could probably lead to other
results. Finally, the third category of factors, developed by Sathe (1982), the factors related to
management’s expectations, orientation, and operating philosophy, was not taken into
account, because it is labour-intensive to interview both bu-controllers and their bu-
managers, so only the bu-controllers were interviewed, and their bu-managers were not
included in this study.
5.3. Future research
Besides the organizational characteristics included in this paper, there are several other
contingency factors, of which it is expected that they have a relation with the roles of the bu-
controllers. For instance: (1) the size of the department the bu-controller: if the department
is very small the bu-controller has to do relatively more executive and reporting tasks, as a
result of which the time spend on the control role will increase; and (2) the degree in which
the bu-controller is relieved with a number of management accounting and ICT-tools, like
Activity Based Costing -, Enterprise Resource Planning (ERP) -, and computerized
Accounting Systems. It is to be expected that if the degree of such ICT-tools is high, the bu-
controller does not have to spend much time on executive (control) tasks, as a result of
which the support role will increase. These other organizational characteristics are interesting
to investigate in the future.
This study investigates bu-controllers only. To measure the effects of the support and
control roles more accurately the bu-managers should also participate in a future study. In
my second study in 2006, I will select data from both bu-controllers and their bu-managers
to explore the third category of factors, developed by Sathe (1982), the factors related to
management’s expectations, orientation, and operating philosophy.
Besides the search for missing organizational factors, other questions are interesting to
investigate in future research. For instance the research of the question whether controllers
are selected for their job based upon their personal characteristics or whether they shape
their job and adjust their tasks to their personal characteristics.
NRG 06-07 Balancing the Roles of Business Unit Controllers - ten Rouwelaar - 33 of 50
Future research could probably give better results if the instruments, by which the separate
roles are measured, would improve. Measuring the two roles of bu-controllers by more
adequate questions, that are related with the specific subject, or registration of the time
spend on several control – and support tasks and activities, would certainly improve the
insights of the balancing the roles of bu-controllers.
Despite the limitations, this paper is amongst the first that shed empirical light on the two
roles of bu-controllers and provides a starting-point for further exploring the theoretical
framework to study controller effectiveness, and theorizing the behavioral aspects of the
balance between the two roles of bu-controllers.
NRG 06-07 Balancing the Roles of Business Unit Controllers - ten Rouwelaar - 34 of 50
6. APPENDIX A: Part of the Questionnaire
Interdependencies among BU’s (Abernethy, Bouwens & Van Lent, 2004) No impact all A very
significant impact
We would like some information about the relationships among BU’s within your organization 1 2 3 4 5
37 To what extent do your BU’s actions impact on work carried out in other organizational BU’s of your organization
38 To what extent do actions of managers of other BU’s of the organization impact work carried out in your particular BU
39 What percentage of your total production is delivered to other organizational BU’s of your organization?
%
40 What percentage of your total production uses inputs acquired from other organizational BU’s of your organization?
%
Information Asymmetry (Abernethy, Bouwens & Van Lent, 2004)
Corporate Controller I am Much Is much more Equal more Familiar Familiar
We would like some information about the distribution of knowledge between your BU versus the (corporate) organization. 1 2 3 4 5
41 Compared to your Corporate Controller, who is in possession of better information regarding the activities undertaken in your BU?
42 Compared to your Corporate Controller, who is more familiar with the input-output relationships inherent in the internal operations of you BU?
Corporate Controller I am Much Is much more Equal more Familiar Familiar
1 2 3 4 5 43 Compared to your Corporate Controller, who is more
certain of the performance potential of your BU?
44 Compared to your Corporate Controller, who is more familiar technically with the work of your BU?
Corporate Controller I have Much has much better Equal better understanding understanding
1 2 3 4 5 45 Compared to your Corporate Controller, who is
better able to assess the potential impact on your activities of factors external to your BU?
46 Compared to your Corporate Controller, who has a better understanding of what can be achieved in your BU?
NRG 06-07 Balancing the Roles of Business Unit Controllers - ten Rouwelaar - 35 of 50
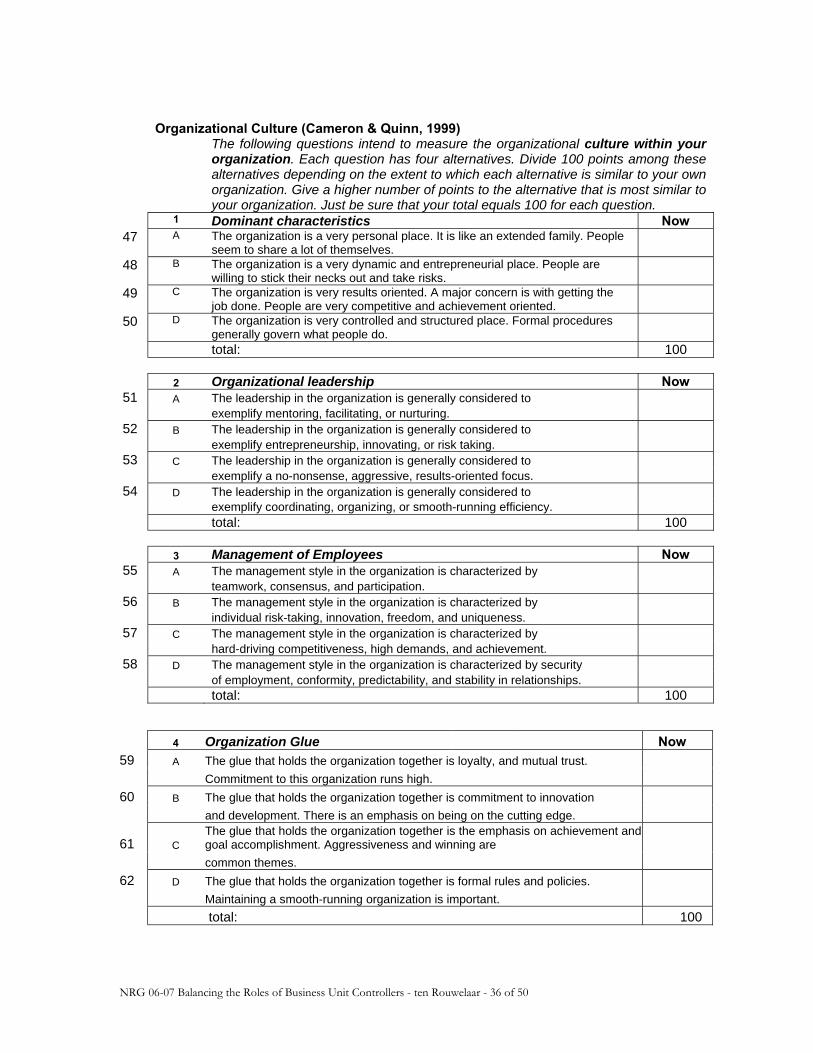
Organizational Culture (Cameron & Quinn, 1999)
The following questions intend to measure the organizational culture within your organization. Each question has four alternatives. Divide 100 points among these alternatives depending on the extent to which each alternative is similar to your own organization. Give a higher number of points to the alternative that is most similar to your organization. Just be sure that your total equals 100 for each question.
1 Dominant characteristics Now 47 A The organization is a very personal place. It is like an extended family. People
seem to share a lot of themselves.
48 B The organization is a very dynamic and entrepreneurial place. People are willing to stick their necks out and take risks.
49 C The organization is very results oriented. A major concern is with getting the job done. People are very competitive and achievement oriented.
50 D The organization is very controlled and structured place. Formal procedures generally govern what people do.
total: 100 2 Organizational leadership Now
51 A The leadership in the organization is generally considered to exemplify mentoring, facilitating, or nurturing.
52 B The leadership in the organization is generally considered to exemplify entrepreneurship, innovating, or risk taking.
53 C The leadership in the organization is generally considered to exemplify a no-nonsense, aggressive, results-oriented focus.
54 D The leadership in the organization is generally considered to exemplify coordinating, organizing, or smooth-running efficiency. total: 100 3 Management of Employees Now
55 A The management style in the organization is characterized by teamwork, consensus, and participation.
56 B The management style in the organization is characterized by individual risk-taking, innovation, freedom, and uniqueness.
57 C The management style in the organization is characterized by hard-driving competitiveness, high demands, and achievement.
58 D The management style in the organization is characterized by security of employment, conformity, predictability, and stability in relationships.
total: 100
4 Organization Glue Now 59 A The glue that holds the organization together is loyalty, and mutual trust. Commitment to this organization runs high. 60 B The glue that holds the organization together is commitment to innovation and development. There is an emphasis on being on the cutting edge.
61 C The glue that holds the organization together is the emphasis on achievement and goal accomplishment. Aggressiveness and winning are
common themes. 62 D The glue that holds the organization together is formal rules and policies. Maintaining a smooth-running organization is important. total: 100
NRG 06-07 Balancing the Roles of Business Unit Controllers - ten Rouwelaar - 36 of 50
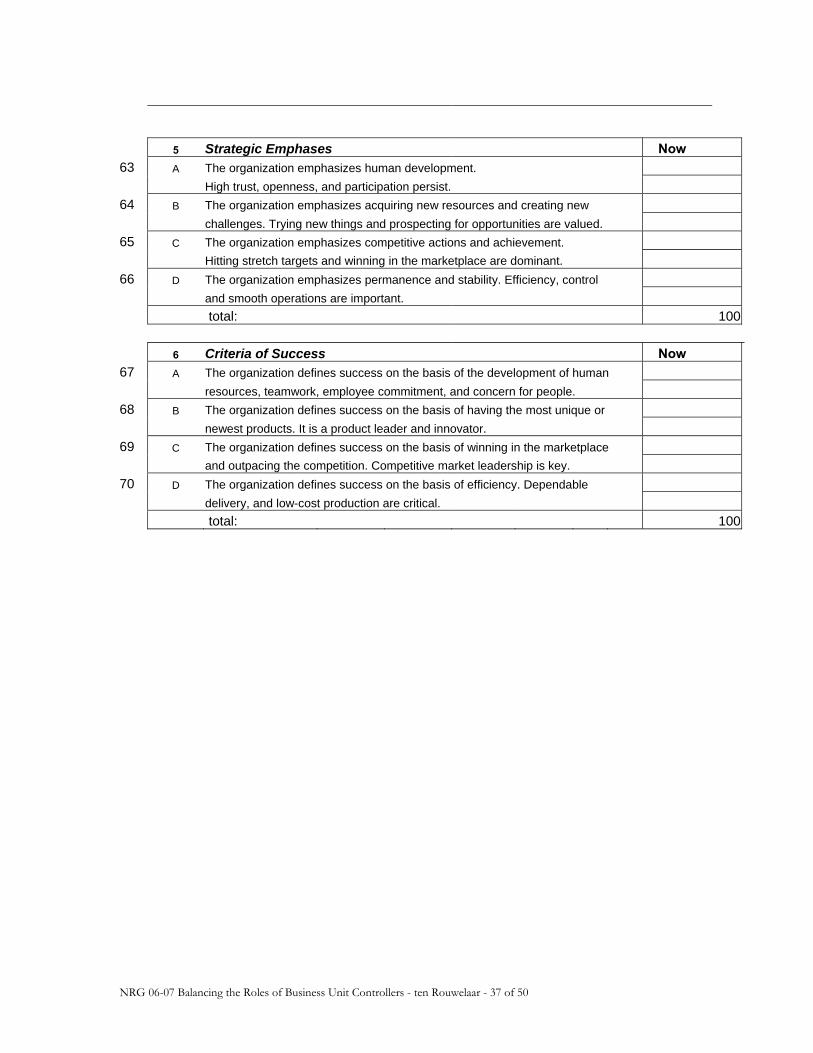
5 Strategic Emphases Now 63 A The organization emphasizes human development. High trust, openness, and participation persist. 64 B The organization emphasizes acquiring new resources and creating new challenges. Trying new things and prospecting for opportunities are valued. 65 C The organization emphasizes competitive actions and achievement. Hitting stretch targets and winning in the marketplace are dominant. 66 D The organization emphasizes permanence and stability. Efficiency, control and smooth operations are important. total: 100 6 Criteria of Success Now 67 A The organization defines success on the basis of the development of human resources, teamwork, employee commitment, and concern for people. 68 B The organization defines success on the basis of having the most unique or newest products. It is a product leader and innovator. 69 C The organization defines success on the basis of winning in the marketplace and outpacing the competition. Competitive market leadership is key. 70 D The organization defines success on the basis of efficiency. Dependable delivery, and low-cost production are critical. total: 100
NRG 06-07 Balancing the Roles of Business Unit Controllers - ten Rouwelaar - 37 of 50
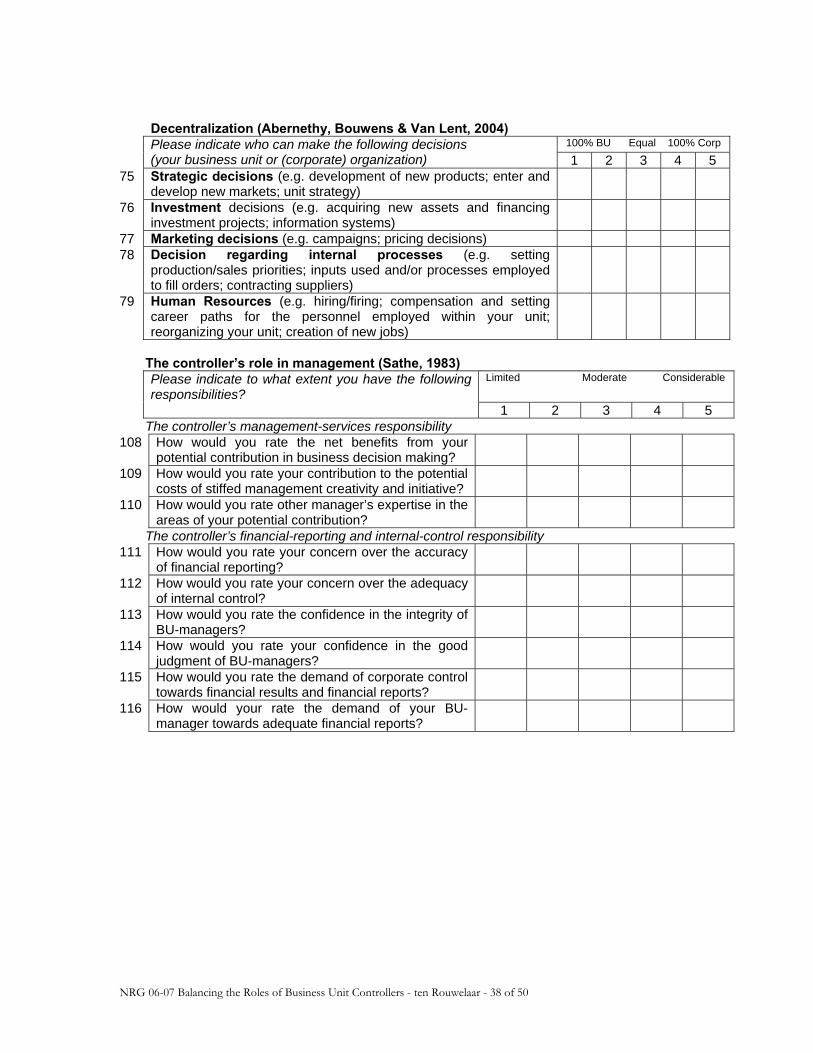
Decentralization (Abernethy, Bouwens & Van Lent, 2004) 100% BU Equal 100% Corp
Please indicate who can make the following decisions (your business unit or (corporate) organization) 1 2 3 4 5
75 Strategic decisions (e.g. development of new products; enter and develop new markets; unit strategy)
76 Investment decisions (e.g. acquiring new assets and financing investment projects; information systems)
77 Marketing decisions (e.g. campaigns; pricing decisions) 78 Decision regarding internal processes (e.g. setting
production/sales priorities; inputs used and/or processes employed to fill orders; contracting suppliers)
79 Human Resources (e.g. hiring/firing; compensation and setting career paths for the personnel employed within your unit; reorganizing your unit; creation of new jobs)
The controller’s role in management (Sathe, 1983) Please indicate to what extent you have the following
responsibilities? Limited Moderate Considerable
1 2 3 4 5 The controller’s management-services responsibility 108 How would you rate the net benefits from your
potential contribution in business decision making?
109 How would you rate your contribution to the potential costs of stiffed management creativity and initiative?
110 How would you rate other manager’s expertise in the areas of your potential contribution?
The controller’s financial-reporting and internal-control responsibility 111 How would you rate your concern over the accuracy
of financial reporting?
112 How would you rate your concern over the adequacy of internal control?
113 How would you rate the confidence in the integrity of BU-managers?
114 How would you rate your confidence in the good judgment of BU-managers?
115 How would you rate the demand of corporate control towards financial results and financial reports?
116 How would your rate the demand of your BU-manager towards adequate financial reports?
NRG 06-07 Balancing the Roles of Business Unit Controllers - ten Rouwelaar - 38 of 50
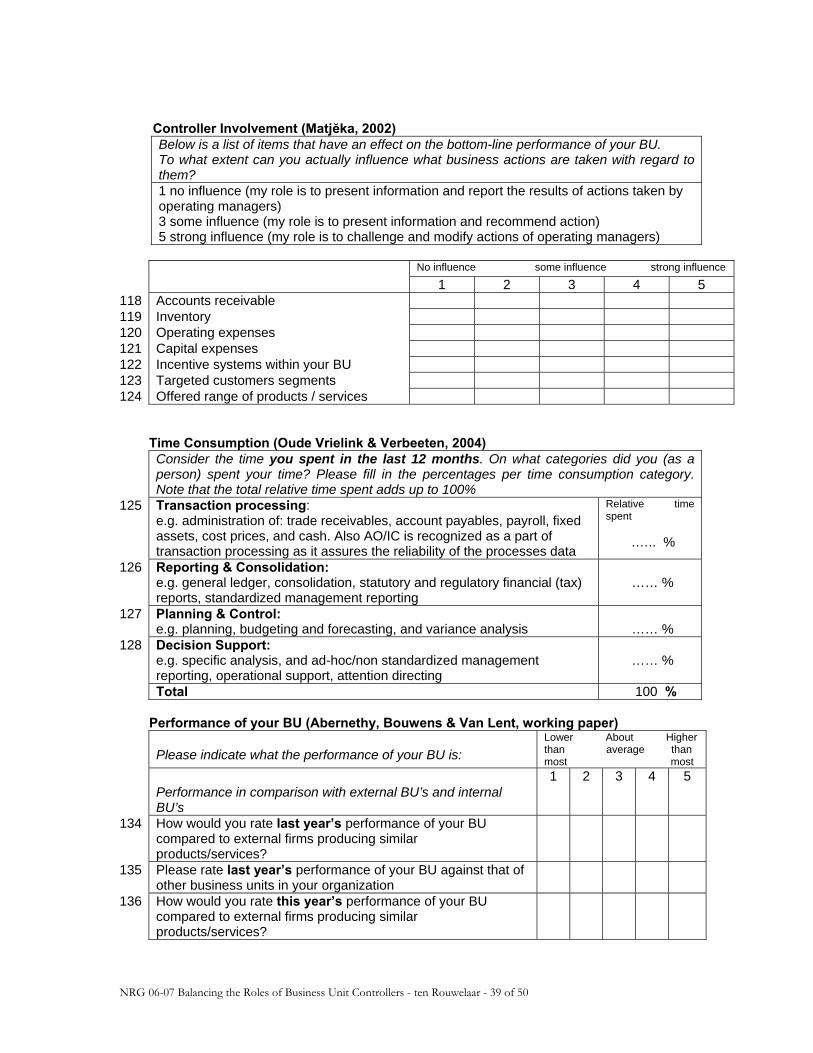
Controller Involvement (Matjĕka, 2002)
Below is a list of items that have an effect on the bottom-line performance of your BU. To what extent can you actually influence what business actions are taken with regard to them? 1 no influence (my role is to present information and report the results of actions taken by operating managers) 3 some influence (my role is to present information and recommend action) 5 strong influence (my role is to challenge and modify actions of operating managers)
No influence some influence strong influence
1 2 3 4 5 118 Accounts receivable 119 Inventory 120 Operating expenses 121 Capital expenses 122 Incentive systems within your BU 123 Targeted customers segments 124 Offered range of products / services Time Consumption (Oude Vrielink & Verbeeten, 2004)
Consider the time you spent in the last 12 months. On what categories did you (as a person) spent your time? Please fill in the percentages per time consumption category. Note that the total relative time spent adds up to 100%
125 Transaction processing: e.g. administration of: trade receivables, account payables, payroll, fixed assets, cost prices, and cash. Also AO/IC is recognized as a part of transaction processing as it assures the reliability of the processes data
Relative time spent .….. %
126 Reporting & Consolidation: e.g. general ledger, consolidation, statutory and regulatory financial (tax) reports, standardized management reporting
…… %
127 Planning & Control: e.g. planning, budgeting and forecasting, and variance analysis
…… %
128 Decision Support: e.g. specific analysis, and ad-hoc/non standardized management reporting, operational support, attention directing
…… %
Total 100 % Performance of your BU (Abernethy, Bouwens & Van Lent, working paper)
Please indicate what the performance of your BU is: Lower About Higher than average than most most
Performance in comparison with external BU’s and internal BU’s
1 2 3 4 5
134 How would you rate last year’s performance of your BU compared to external firms producing similar products/services?
135 Please rate last year’s performance of your BU against that of other business units in your organization
136 How would you rate this year’s performance of your BU compared to external firms producing similar products/services?
NRG 06-07 Balancing the Roles of Business Unit Controllers - ten Rouwelaar - 39 of 50
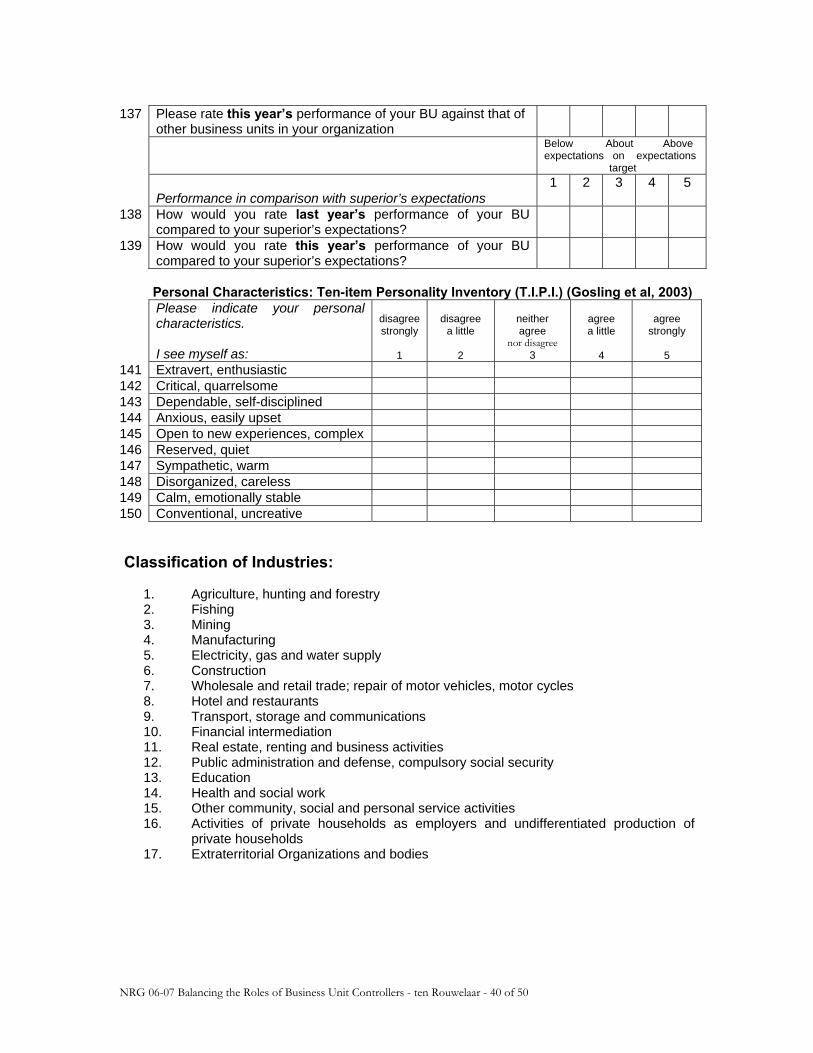
137 Please rate this year’s performance of your BU against that of other business units in your organization
Below About Above expectations on expectations target
Performance in comparison with superior’s expectations
1 2 3 4 5
138 How would you rate last year’s performance of your BU compared to your superior’s expectations?
139 How would you rate this year’s performance of your BU compared to your superior’s expectations?
Personal Characteristics: Ten-item Personality Inventory (T.I.P.I.) (Gosling et al, 2003) Please indicate your personal
characteristics. I see myself as:
disagree strongly
1
disagree
a little
2
neither agree
nor disagree 3
agree a little
4
agree
strongly
5 141 Extravert, enthusiastic 142 Critical, quarrelsome 143 Dependable, self-disciplined 144 Anxious, easily upset 145 Open to new experiences, complex 146 Reserved, quiet 147 Sympathetic, warm 148 Disorganized, careless 149 Calm, emotionally stable 150 Conventional, uncreative
Classification of Industries:
1. Agriculture, hunting and forestry 2. Fishing 3. Mining 4. Manufacturing 5. Electricity, gas and water supply 6. Construction 7. Wholesale and retail trade; repair of motor vehicles, motor cycles 8. Hotel and restaurants 9. Transport, storage and communications 10. Financial intermediation 11. Real estate, renting and business activities 12. Public administration and defense, compulsory social security 13. Education 14. Health and social work 15. Other community, social and personal service activities 16. Activities of private households as employers and undifferentiated production of
private households 17. Extraterritorial Organizations and bodies
NRG 06-07 Balancing the Roles of Business Unit Controllers - ten Rouwelaar - 40 of 50
References
Abernethy, M.A., Bouwens, J.F.M.G., & Van Lent, L.A.G.M. (2004). Determinants of Control
System Design in Divisionalized Firms, The Accounting Review, 79, 545 – 570. Abernethy, M.A., Bouwens, J.F.M.G., & Van Lent, L.A.G.M. (working paper). Decentralization,
Interdependence and Performance Measurement System Design: Sequence and Priorities. Anthony, R.N., & Govindarajan, V. (2004). Management Control Systems, eleventh edition, McGraw-Hill
Irwin. Bruin, R.C. de, & Sande, E.G.C.A. van de (2005). Trends in Cost Management, Maandblad voor
Accountancy en Bedrijfseconomie, 4, 24 – 31. Cameron, K.S., & Quinn, R.E. (1999). Diagnosing and Changing Organizational Culture, Based on the
Competing Values Framework, Addison Wesley, 221 pp. Chenhall, R.H., & Morris, D. (1986). The impact of Structure, Environment, and Interdependence
on the Perceived Usefulness of Management Accounting Systems, The Accounting Review, LXI, 16 – 35.
Chenhall, R.H. (2003). Management control systems design within its organizational context: findings from contingency-based research and directions for the future, Accounting, Organizations and Society, 28, 127 – 168.
Christie, A.A., Joye, M.P., & Watts, R.L. (2001). Decentralization of the Firm: Theory and Evidence, Journal of Corporate Finance, 9, 3 – 36.
Clarke, S., & Robertson, I.T. (2005). A meta-analytic review of the Big-Five personality factors and accident involvement in occupational and non-occupational settings, Journal of Occupational and Organizational Psychology, 78, 355 – 376.
Colton, S.D. (2001). The Changing Role of the Controller, Journal of Cost Management, 5 – 10. Cooper, R. (1996). Look out Management Accountants, part I, Management Accounting, 16, 20 – 26. Digman, J.M. (1990). Personality Structure: Emergence of the Big Five-Factor Model, Annual Review
Psychology, 41, 417 – 440. Gordon, L.A., & Narayanan, V.K. (1984). Management Accounting Systems, Perceived
Environmental Uncertainty and Organization Structure: An Empirical Investigation, Accounting, Organizations and Society, 9, 33 – 47.
Gosling, S.D., Rentfrow, P.J., & Swann, W.B. (2003). A very brief measure of the Big-Five personality domains, Journal of Research in Personality, 37, 504 – 528.
Helden, G.J. van (1997). Management Accountinggoeroes over de toekomst van de controller, Tijdschrift Financieel Management, 17, 81 – 87.
Helden, G.J. van (1999). Veranderingen in de functie en de rol van de controller, Handboek Management Accounting, 1 – 19.
Hofstede, G., Neuijen, B., Daval Ohayv, D., & Sanders, G. (1990). Measuring Organizational Cultures: A Qualitative and Quantitative Study across Twenty Cases, Administrative Science Quarterly, 35, 286 – 316.
Hopper, T.M. (1980). Role Conflicts of Management Accountants and their Position within Organizational Structures, Accounting, Organizations and Society, 5, 401 – 411.
Howard, P.J., & Howard, J.M. (2001a). Professional Manual for the Workplace Big Five Profile (WB5P), Center for Applied Cognitive Studies.
Howard, P.J., & Howard, J.M. (2001b). The Owner’s manual for Personality at Work, XT: Brad Press. Howard, P.J., & Howard, J.M. (2002c). WorkPlace Big Five Profile Workbook, Center for Applied
Cognitive Studies. Indejikian, R.J., & Matĕjka, M. (2006). Organizational Slack in Decentralized Firms: The Role of
Business Unit Controllers, The Accounting Review, 81, 849 – 872.
NRG 06-07 Balancing the Roles of Business Unit Controllers - ten Rouwelaar - 41 of 50
Jablonski, S.F., Keating, P.J., & Heian, HJ.B. (1993). Business advocate or corporate policeman? Assessing Your Role as a Financial Executive, Financial Executives Research Foundation.
Kroon, J. de, & Steen, E.Th. van der, (2005). Rasadministrateur wordt nooit Supercontroller, Tijdschrift Controlling, 8, 8 – 13.
Maas, V.S. (2005). De rol van de controller in Nederland, Maandblad voor Accountancy en Bedrijfseconomie, 5, 16 – 20.
Maas, V.S. (working paper). The effect of Controller Involvement in Management on Business Unit Performance Reporting: An Empirical Investigation, (January 2005), 1 - 59.
Mahony, J.M., & Stasson, M.F. (2005). Interpersonal and Personality Dimensions of Behavior: FIRO-B and the Big Five, North American Journal of Psychology, 7, 205 – 216.
Matjĕka, M. (2002). Management Accounting in Organizational Design: Three Essays, Dissertation Tilburg Universiteit.
Merchant, K.A. (1998). Modern Management Control Systems, Prentice-Hall Inc., 951 pp. Merchant, K.A., & Van der Stede, W.A. (2003). Management Control Systems, First edition, Pearson
Education Limited, 701 pp. Nilakant, V., & Hayagreeva, R. (1994). Agency Theory and Uncertainty in Organizations: An
Evolution, organization Studies, 15, 649 – 672. Otley, D.T. (1980). The contingency theory of management accounting: achievement and prognosis,
Accounting, Organizations and Society, 15, 649 – 672. Oude Vrielink, B., & Verbeeten, F.H.M. (2004). De invloed van ERP-systemen op de financiële
functie, Maandblad voor Accountancy en Bedrijfeconomie, 141 – 149. Riedijk, F., Tillema, S., & Moen, E. (2002). De ontwikkeling van de Controller in Nederland,
Maandblad voor Accountancy en Bedrijfseconomie, 337 – 347. Roozen, F.A., & Steens, H.B.A. (2006). Reflections on the Future of Finance and Control, Kluwer, 343 pp. Sathe, V. (1978a). Who should Control Division Controllers?, Harvard Business Review, 56, 99 – 104. Sathe, V. (1978b). Controllership in Divisionalized Firms: Structure, Evaluation, and Development, AMACOM. Sathe, V. (1982). Controller Involvement in Management, Prentice-Hall. Sathe, V. (1983). The Controller’s Role in Management, Organization Dynamics, 11, 31 – 48. Schein, E.H. (1983). The Role of the Founder in Creating Organizational Culture, Organizational
Dynamics, 12, 13 – 28. Simon, H.A., Guetskow, H., & Kozmetsky, G. (1954). Centralization versus decentralization in organizing
the controller’s department, The Controllership Foundation. Strikwirda, H. (2002). Kerncompetent of universele adviseur?, Controllers Magazine, 33 – 37. Tett, R.P., & Burnett, D.D. (2003). A Personality Trait-Based Interactionist Model of Job
Performance, Journal of Applied Psychology, 88 (3), 500 – 517. Ven, A.C.N. van de (2002). De controlleren de adaptie van beheersinstrumenten, MCA tijdschrift voor
organisaties in control, 13 – 16. Verstegen, B.H.J., Loo, I. de , Mol, P., Slagter, K., & Geerkens, H. (working paper). The classification
of Dutch controller graduated by activities: Images of a profession, (February 2005), 1 - 18. Wilkins, A.L., & Ouchi, W.G. (1983). Efficient Cultures: Exploring the Relationship between Culture
and Organizational Performance, Administrative Science Quarterly, 28, 468 – 481. Wruck, K.H., & Jensen, M.C. (1994). Science, Specific Knowledge, and Total Quality Management,
Journal of Accounting and Economics, 18, 247 – 287. Zimmerman, J.L. (2005). Accounting for Decision making and Control, fifth edition, McGraw-Hill Higher
education.
NRG 06-07 Balancing the Roles of Business Unit Controllers - ten Rouwelaar - 42 of 50
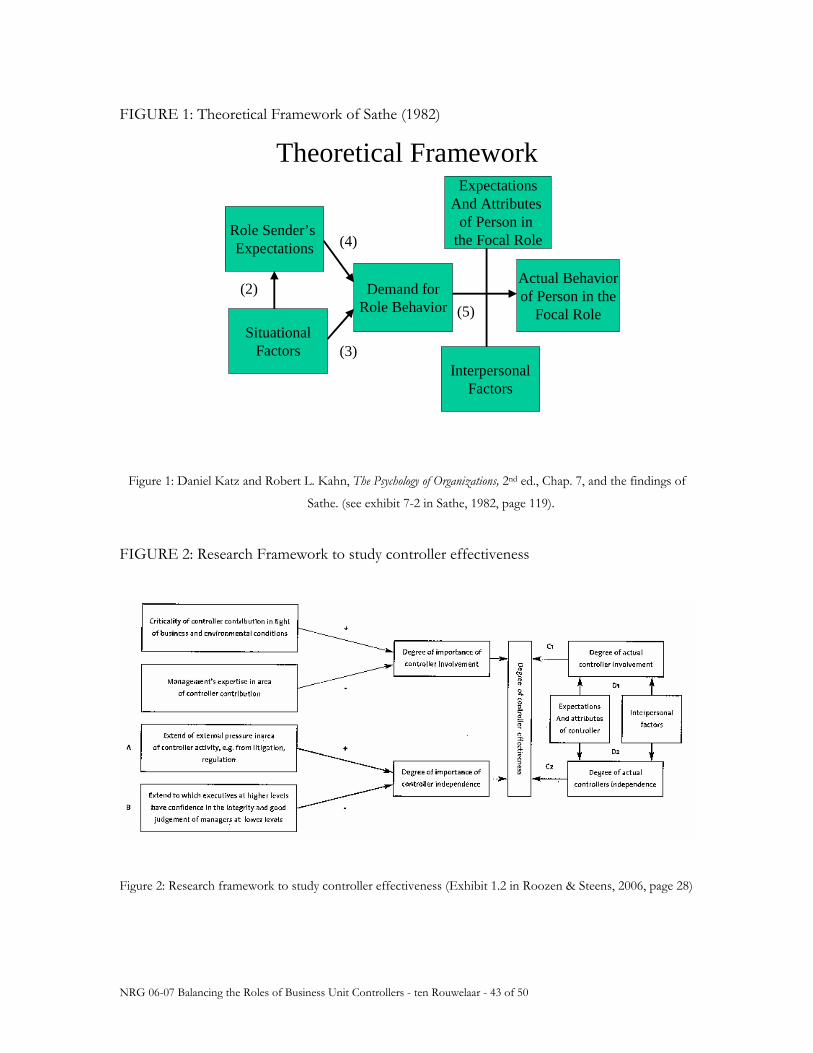
FIGURE 1: Theoretical Framework of Sathe (1982)
Theoretical Framework
Role Sender’s Expectations
SituationalFactors
Demand forRole Behavior
ExpectationsAnd Attributes
of Person in the Focal Role
Actual Behaviorof Person in the
Focal Role
InterpersonalFactors
(2)
(4)
(3)
(5)
Figure 1: Daniel Katz and Robert L. Kahn, The Psychology of Organizations, 2nd ed., Chap. 7, and the findings of
Sathe. (see exhibit 7-2 in Sathe, 1982, page 119).
FIGURE 2: Research Framework to study controller effectiveness
Figure 2: Research framework to study controller effectiveness (Exhibit 1.2 in Roozen & Steens, 2006, page 28)
NRG 06-07 Balancing the Roles of Business Unit Controllers - ten Rouwelaar - 43 of 50
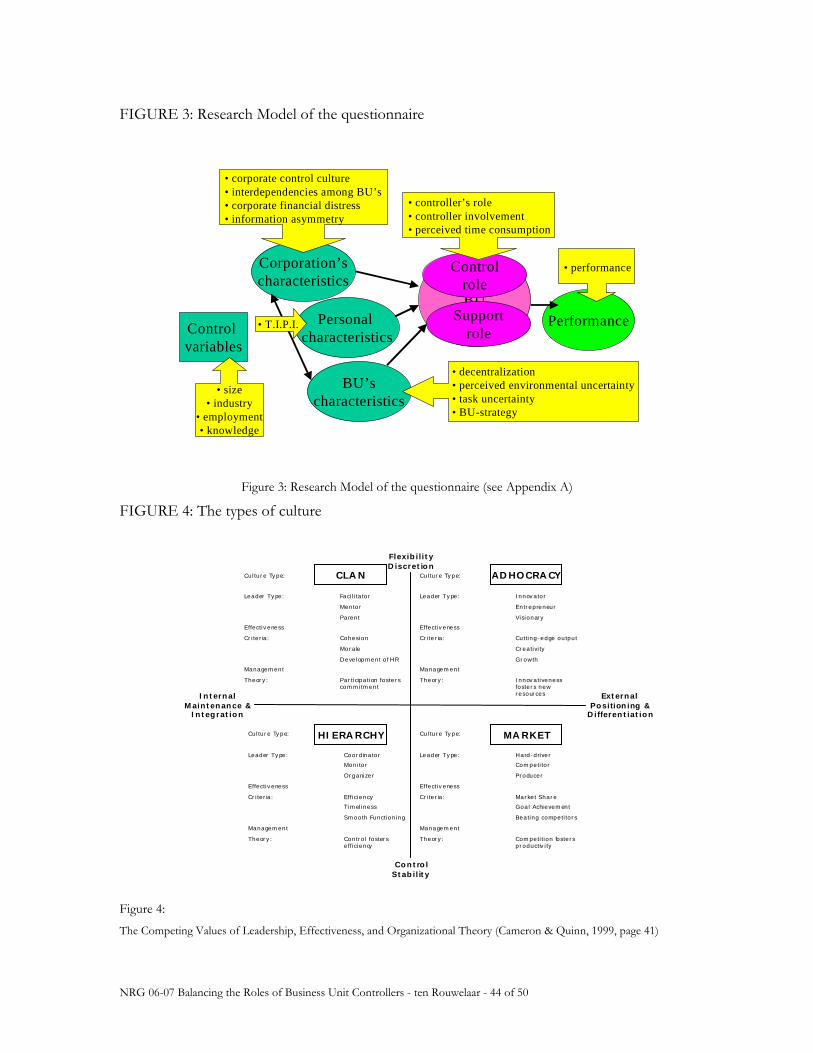
FIGURE 3: Research Model of the questionnaire
Role of BU
Controller
Corporation’scharacteristics
BU’scharacteristics
• corporate control culture • interdependencies among BU’s• corporate financial distress• information asymmetry
Controlrole
Supportrole
• decentralization• perceived environmental uncertainty• task uncertainty • BU-strategy
Performance
• performance
• controller’s role • controller involvement• perceived time consumption
Control variables
• size• industry
• employment• knowledge
Personal characteristics
• T.I.P.I.
Figure 3: Research Model of the questionnaire (see Appendix A)
FIGURE 4: The types of culture
FlexibilityDiscretion
ControlStability
ExternalPositioning &
Differentiation
InternalMaintenance &
Integration
Culture Type:
Leader Type: Facilitator
Mentor
Parent
Effectiveness
Criteria: Cohesion
Morale
Development of HR
Management
Theory: Participation fosters commitment
CLAN Culture Type:
Leader Type: Innovator
Entrepreneur
Visionary
Effectiveness
Criteria: Cutting-edge output
Creativity
Growth
Management
Theory: Innovativeness fosters new resources
ADHOCRACY
Culture Type:
Leader Type: Coordinator
Monitor
Organizer
Effectiveness
Criteria: Efficiency
Timeliness
Smooth Functioning
Management
Theory: Control fosters efficiency
HIERARCHY Culture Type:
Leader Type: Hard-driver
Competitor
Producer
Effectiveness
Criteria: Market Share
Goal Achievement
Beating competitors
Management
Theory: Competition fosters productivity
MARKET
Figure 4: The Competing Values of Leadership, Effectiveness, and Organizational Theory (Cameron & Quinn, 1999, page 41)
NRG 06-07 Balancing the Roles of Business Unit Controllers - ten Rouwelaar - 44 of 50
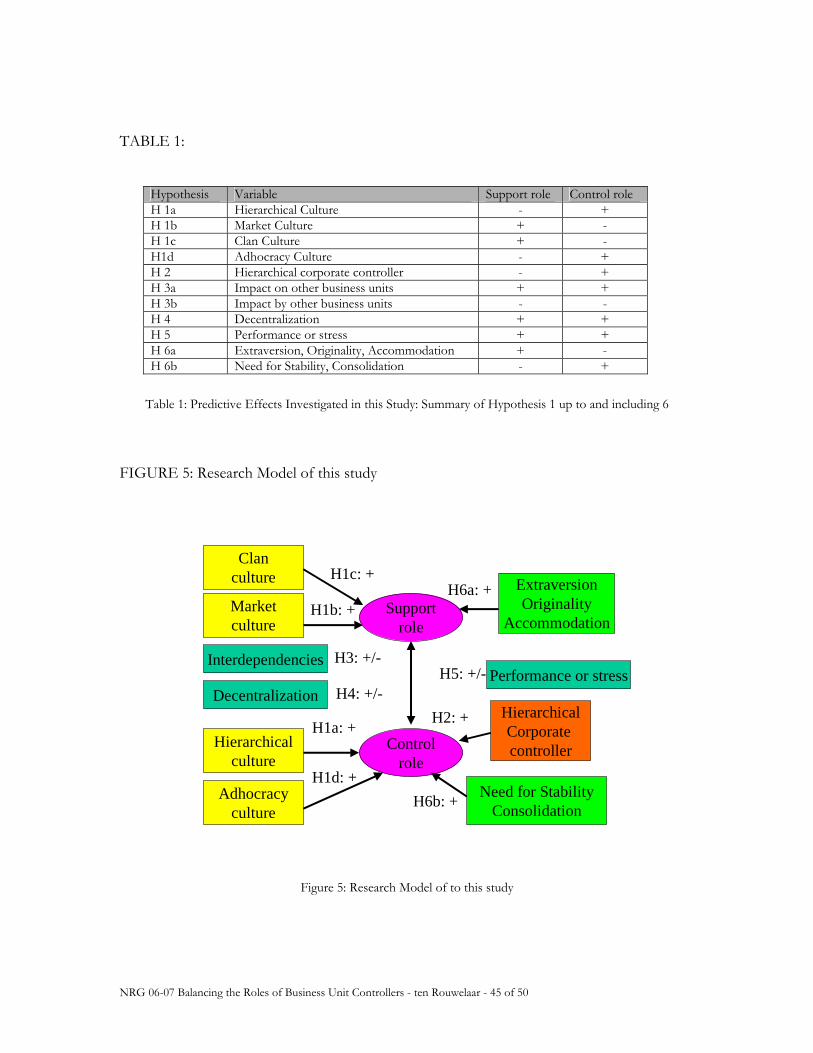
TABLE 1:
Hypothesis Variable Support role Control role H 1a Hierarchical Culture - + H 1b Market Culture + - H 1c Clan Culture + - H1d Adhocracy Culture - + H 2 Hierarchical corporate controller - + H 3a Impact on other business units + + H 3b Impact by other business units - - H 4 Decentralization + + H 5 Performance or stress + + H 6a Extraversion, Originality, Accommodation + - H 6b Need for Stability, Consolidation - +
Table 1: Predictive Effects Investigated in this Study: Summary of Hypothesis 1 up to and including 6
FIGURE 5: Research Model of this study
Controlrole
Supportrole
Clanculture
Marketculture
Adhocracyculture
Hierarchicalculture
ExtraversionOriginality
Accommodation
H1a: +HierarchicalCorporate controller
InterdependenciesPerformance or stress
Decentralization
Need for StabilityConsolidation
H1c: +
H1d: +
H6a: +
H6b: +
H2: +
H1b: +
H3: +/-
H4: +/-H5: +/-
Figure 5: Research Model of to this study
NRG 06-07 Balancing the Roles of Business Unit Controllers - ten Rouwelaar - 45 of 50
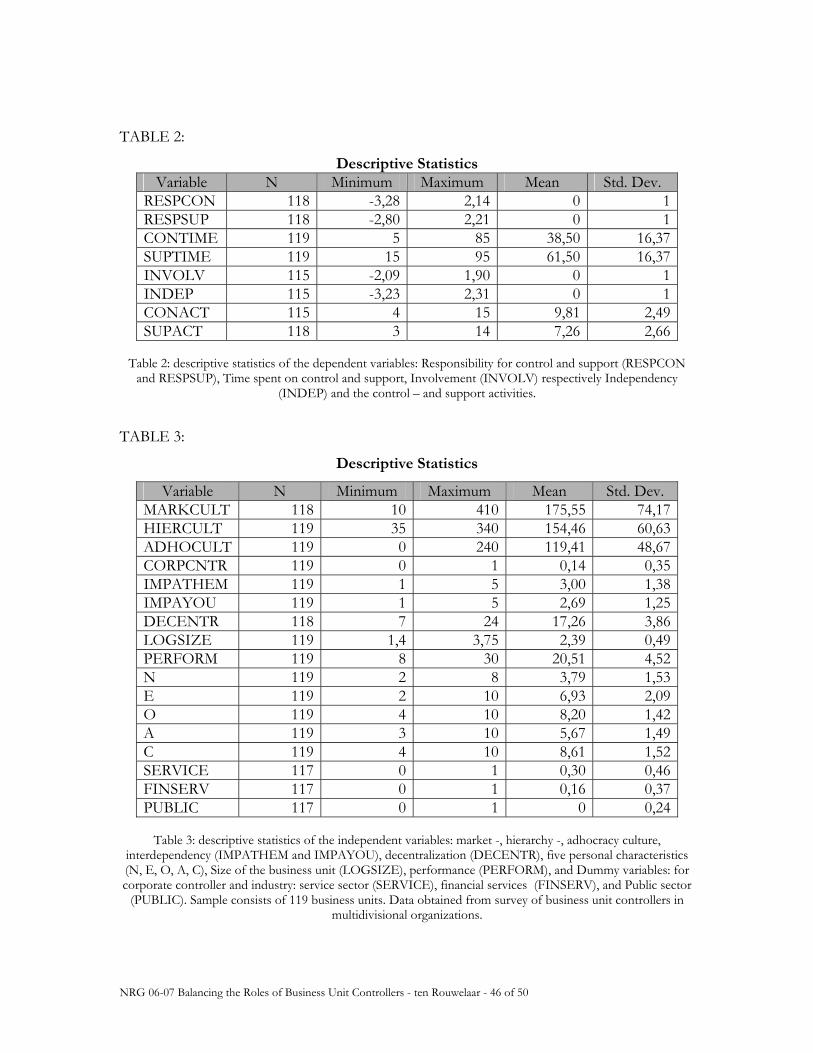
NRG 06-07 Balancing the Roles of Business Unit Controllers - ten Rouwelaar - 46 of 50
TABLE 2:
Descriptive Statistics Variable N Minimum Maximum Mean Std. Dev.
RESPCON 118 -3,28 2,14 0 1RESPSUP 118 -2,80 2,21 0 1CONTIME 119 5 85 38,50 16,37SUPTIME 119 15 95 61,50 16,37INVOLV 115 -2,09 1,90 0 1INDEP 115 -3,23 2,31 0 1CONACT 115 4 15 9,81 2,49SUPACT 118 3 14 7,26 2,66
Table 2: descriptive statistics of the dependent variables: Responsibility for control and support (RESPCON
and RESPSUP), Time spent on control and support, Involvement (INVOLV) respectively Independency (INDEP) and the control – and support activities.
TABLE 3:
Descriptive Statistics
Variable N Minimum Maximum Mean Std. Dev. MARKCULT 118 10 410 175,55 74,17HIERCULT 119 35 340 154,46 60,63ADHOCULT 119 0 240 119,41 48,67CORPCNTR 119 0 1 0,14 0,35IMPATHEM 119 1 5 3,00 1,38IMPAYOU 119 1 5 2,69 1,25DECENTR 118 7 24 17,26 3,86LOGSIZE 119 1,4 3,75 2,39 0,49PERFORM 119 8 30 20,51 4,52N 119 2 8 3,79 1,53E 119 2 10 6,93 2,09O 119 4 10 8,20 1,42A 119 3 10 5,67 1,49C 119 4 10 8,61 1,52SERVICE 117 0 1 0,30 0,46FINSERV 117 0 1 0,16 0,37PUBLIC 117 0 1 0 0,24
Table 3: descriptive statistics of the independent variables: market -, hierarchy -, adhocracy culture,
interdependency (IMPATHEM and IMPAYOU), decentralization (DECENTR), five personal characteristics (N, E, O, A, C), Size of the business unit (LOGSIZE), performance (PERFORM), and Dummy variables: for corporate controller and industry: service sector (SERVICE), financial services (FINSERV), and Public sector
(PUBLIC). Sample consists of 119 business units. Data obtained from survey of business unit controllers in multidivisional organizations.
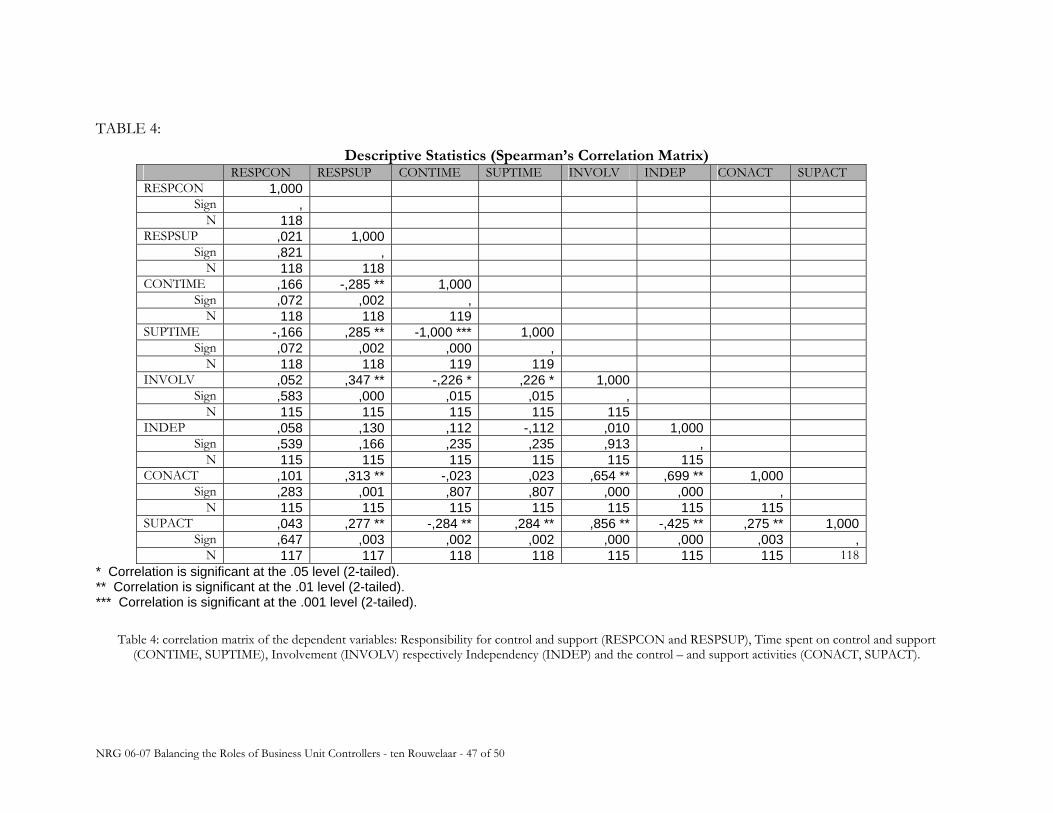
TABLE 4:
Descriptive Statistics (Spearman’s Correlation Matrix) RESPCON RESPSUP CONTIME SUPTIME INVOLV INDEP CONACT SUPACT RESPCON 1,000
Sign , N 118
RESPSUP ,021 1,000 Sign ,821 ,
N 118 118 CONTIME ,166 -,285 ** 1,000
Sign ,072 ,002 , N 118 118 119
SUPTIME -,166 ,285 ** -1,000 *** 1,000 Sign ,072 ,002 ,000 ,
N 118 118 119 119 INVOLV ,052 ,347 ** -,226 * ,226 * 1,000
Sign ,583 ,000 ,015 ,015 , N 115 115 115 115 115
INDEP ,058 ,130 ,112 -,112 ,010 1,000Sign ,539 ,166 ,235 ,235 ,913 ,
N 115 115 115 115 115 115CONACT ,101 ,313 ** -,023 ,023 ,654 ** ,699 ** 1,000
Sign ,283 ,001 ,807 ,807 ,000 ,000 ,N 115 115 115 115 115 115 115
SUPACT ,043 ,277 ** -,284 ** ,284 ** ,856 ** -,425 ** ,275 ** 1,000Sign ,647 ,003 ,002 ,002 ,000 ,000 ,003 ,
N 117 117 118 118 115 115 115 118* Correlation is significant at the .05 level (2-tailed). ** Correlation is significant at the .01 level (2-tailed). *** Correlation is significant at the .001 level (2-tailed).
Table 4: correlation matrix of the dependent variables: Responsibility for control and support (RESPCON and RESPSUP), Time spent on control and support (CONTIME, SUPTIME), Involvement (INVOLV) respectively Independency (INDEP) and the control – and support activities (CONACT, SUPACT).
NRG 06-07 Balancing the Roles of Business Unit Controllers - ten Rouwelaar - 47 of 50
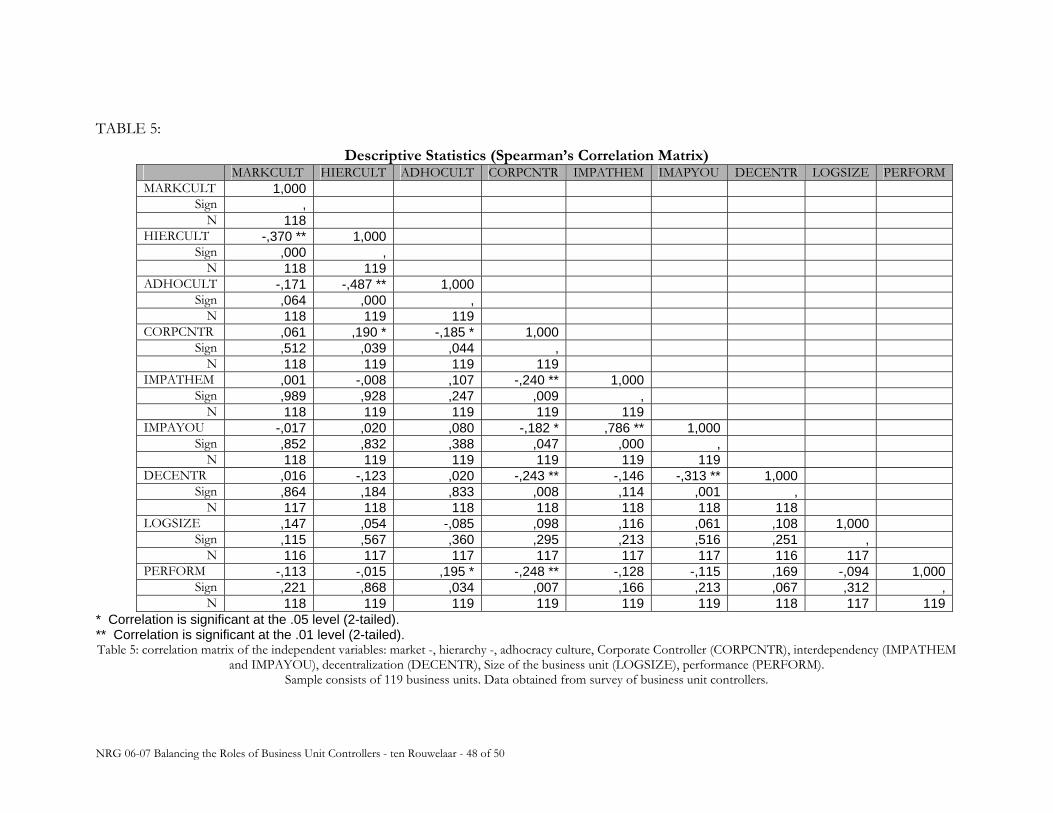
cing the Roles of Business Unit Controllers - ten Rouwelaar - 48 of 50
TABLE 5:
Descriptive Statistics (Spearman’s Correlation Matrix) MARKCULT HIERCULT ADHOCULT CORPCNTR IMPATHEM IMAPYOU DECENTR LOGSIZE PERFORMMARKCULT 1,000
Sign , N 118
HIERCULT -,370 ** 1,000 Sign ,000 ,
N 118 119 ADHOCULT -,171 -,487 ** 1,000
Sign ,064 ,000 , N 118 119 119
CORPCNTR ,061 ,190 * -,185 * 1,000 Sign ,512 ,039 ,044 ,
N 118 119 119 119 IMPATHEM ,001 -,008 ,107 -,240 ** 1,000
Sign ,989 ,928 ,247 ,009 , N 118 119 119 119 119
IMPAYOU -,017 ,020 ,080 -,182 * ,786 ** 1,000Sign ,852 ,832 ,388 ,047 ,000 ,
N 118 119 119 119 119 119DECENTR ,016 -,123 ,020 -,243 ** -,146 -,313 ** 1,000
Sign ,864 ,184 ,833 ,008 ,114 ,001 ,N 117 118 118 118 118 118 118
LOGSIZE ,147 ,054 -,085 ,098 ,116 ,061 ,108 1,000Sign ,115 ,567 ,360 ,295 ,213 ,516 ,251 ,
N 116 117 117 117 117 117 116 117PERFORM -,113 -,015 ,195 * -,248 ** -,128 -,115 ,169 -,094 1,000
Sign ,221 ,868 ,034 ,007 ,166 ,213 ,067 ,312 ,N 118 119 119 119 119 119 118 117 119
* Correlation is significant at the .05 level (2-tailed). ** Correlation is significant at the .01 level (2-tailed). Table 5: correlation matrix of the independent variables: market -, hierarchy -, adhocracy culture, Corporate Controller (CORPCNTR), interdependency (IMPATHEM
and IMPAYOU), decentralization (DECENTR), Size of the business unit (LOGSIZE), performance (PERFORM). Sample consists of 119 business units. Data obtained from survey of business unit controllers.
NRG 06-07 Balan
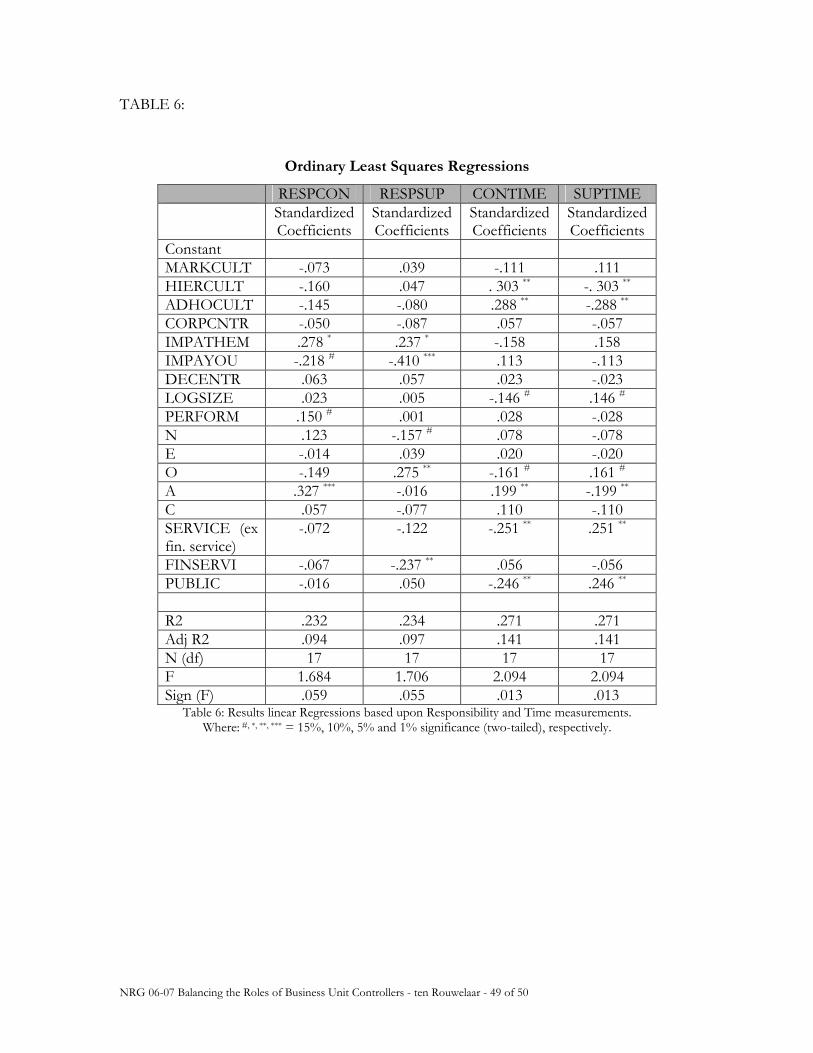
TABLE 6:
Ordinary Least Squares Regressions
RESPCON RESPSUP CONTIME SUPTIME Standardized
Coefficients Standardized Coefficients
Standardized Coefficients
Standardized Coefficients
Constant MARKCULT -.073 .039 -.111 .111 HIERCULT -.160 .047 . 303 ** -. 303 **
ADHOCULT -.145 -.080 .288 ** -.288 **
CORPCNTR -.050 -.087 .057 -.057 IMPATHEM .278 * .237 * -.158 .158 IMPAYOU -.218 # -.410 *** .113 -.113 DECENTR .063 .057 .023 -.023 LOGSIZE .023 .005 -.146 # .146 #PERFORM .150 # .001 .028 -.028 N .123 -.157 # .078 -.078 E -.014 .039 .020 -.020 O -.149 .275 ** -.161 # .161 #A .327 *** -.016 .199 ** -.199 **
C .057 -.077 .110 -.110 SERVICE (ex fin. service)
-.072 -.122 -.251 ** .251 **
FINSERVI -.067 -.237 ** .056 -.056 PUBLIC -.016 .050 -.246 ** .246 **
R2 .232 .234 .271 .271 Adj R2 .094 .097 .141 .141 N (df) 17 17 17 17 F 1.684 1.706 2.094 2.094 Sign (F) .059 .055 .013 .013
Table 6: Results linear Regressions based upon Responsibility and Time measurements. Where: #, *, **, *** = 15%, 10%, 5% and 1% significance (two-tailed), respectively.
NRG 06-07 Balancing the Roles of Business Unit Controllers - ten Rouwelaar - 49 of 50
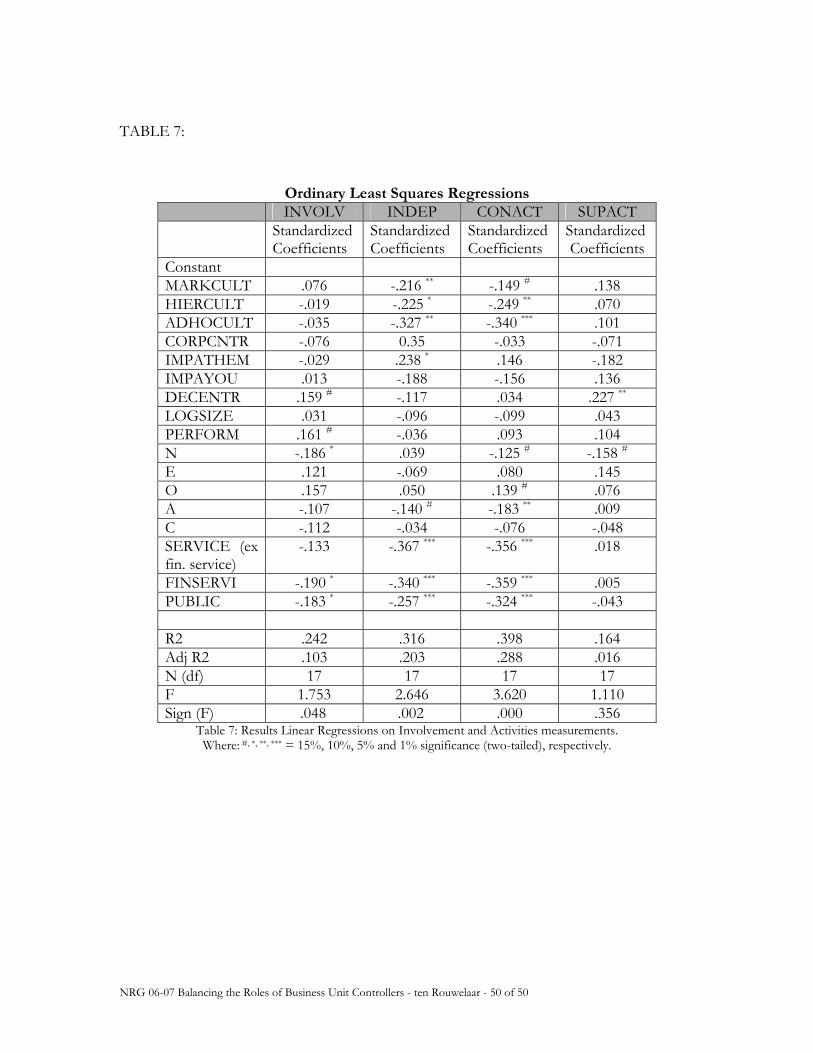
TABLE 7:
Ordinary Least Squares Regressions INVOLV INDEP CONACT SUPACT Standardized
Coefficients Standardized Coefficients
Standardized Coefficients
Standardized Coefficients
Constant MARKCULT .076 -.216 ** -.149 # .138 HIERCULT -.019 -.225 * -.249 ** .070 ADHOCULT -.035 -.327 ** -.340 *** .101 CORPCNTR -.076 0.35 -.033 -.071 IMPATHEM -.029 .238 * .146 -.182 IMPAYOU .013 -.188 -.156 .136 DECENTR .159 # -.117 .034 .227 **
LOGSIZE .031 -.096 -.099 .043 PERFORM .161 # -.036 .093 .104 N -.186 * .039 -.125 # -.158 #E .121 -.069 .080 .145 O .157 .050 .139 # .076 A -.107 -.140 # -.183 ** .009 C -.112 -.034 -.076 -.048 SERVICE (ex fin. service)
-.133 -.367 *** -.356 *** .018
FINSERVI -.190 * -.340 *** -.359 *** .005 PUBLIC -.183 * -.257 *** -.324 *** -.043 R2 .242 .316 .398 .164 Adj R2 .103 .203 .288 .016 N (df) 17 17 17 17 F 1.753 2.646 3.620 1.110 Sign (F) .048 .002 .000 .356
Table 7: Results Linear Regressions on Involvement and Activities measurements. Where: #, *, **, *** = 15%, 10%, 5% and 1% significance (two-tailed), respectively.
NRG 06-07 Balancing the Roles of Business Unit Controllers - ten Rouwelaar - 50 of 50
Nyenrode Research Group
Nyenrode Business UniversiteitNyenrode Research Group
Straatweg 25Postbus 130, 3620 AC BREUKELEN
T +31 346 291 696F +31 346 291 250E [email protected]
www.nyenrode.nl/nrg