Novotny J SAB 2014 Published
6
Technical Note A versatile interaction chamber for laser-based spectroscopic applications, with the emphasis on Laser-Induced Breakdown Spectroscopy ☆ J. Novotný a,b, ⁎, M. Brada a,b , M. Petrilak a,b , D. Prochazka a , K. Novotný a,c , A. Hrdička c , J. Kaiser a,b a Central European Institute of Technology, Brno University of Technology, Technicka 3058/10, 616 00 Brno, Czech Republic b Institute of Physical Engineering, Faculty of Mechanical Engineering, Brno University of Technology, Technicka 2896/2, 616 69 Brno, Czech Republic c Central European Institute of Technology, Masaryk University, Kamenice 753/5, 625 00 Brno, Czech Republic abstract article info Article history: Received 30 December 2013 Accepted 8 August 2014 Available online 20 August 2014 Keywords: Laser-induced breakdown spectroscopy LIBS Chamber Room Chemical mapping The technical note describes the interaction chamber developed particularly for the laser spectroscopy technique applications, such as Laser-Induced Breakdown Spectroscopy (LIBS), Raman Spectroscopy and Laser-Induced Fluorescence. The chamber was designed in order to provide advanced possibilities for the research in mentioned fields and to facilitate routine research procedures. Parameters and the main benefits of the chamber are described, such as the built-in module for automatic 2D chemical mapping and the possibility to set different ambient gas conditions (pressure value and gas type). Together with the chamber description, selected LIBS application examples benefiting from chamber properties are described. © 2014 Elsevier B.V. All rights reserved. 1. Introduction A modern analytical method known as the Laser-Induced Break- down Spectroscopy (LIBS) utilizes the optical emission of the plasma plume to determine the elemental composition of the analyzed material [1]. The plasma plume is induced on the sample surface by the focused laser pulse. This type of the atomic emission spectroscopy technique, where the excitation energy is in the form of a laser pulse, brings number of significant advantages to the field of material analysis. LIBS is able to identify a wide spectrum of chemical elements including those with low atomic numbers. There is no need for any special sample preparation and all states of matter can be analyzed. Results of the anal- ysis are available in a few seconds and one measurement may contain spectroscopic traces of all chemical elements present in the sample. Despite the fact that there still exist drawbacks, e.g. problematic quantitative analysis, matrix effect and relatively poor limits of de- tection (LOD, generally 1–100 ppm), LIBS has become a respected technique, complementary to the well-known techniques of chemical material analysis, such as Atomic Absorption Spectroscopy (AAS), X-Ray Fluorescence (XRF), Inductively Coupled Plasma Mass Spectroscopy (ICP-MS), and many others [2]. From the origins of the LIBS technique in the beginning of the 80's until present, the growing interest is noticeable particularly in the last two decades. LIBS applications and LIBS technique itself are the research subjects of many university laboratories and research institutes. Appli- cations of the LIBS technique as an analytical tool for the fast chemical analysis are under intensive investigation in the fields of steel industry, food industry, environmental diagnostics, archeology and cultural heritage, geology, forensic analysis, etc. The rapidness of LIBS analysis and the possibility to measure samples in-situ and remotely enable measurements to be carried out in the places and situations inaccessible for the conventional techniques. Thorough information overview including the references about the state and results of the research in all application fields can be found in LIBS books [1,3] and in the recent review articles [4–8]. Until now a number of modifications of the standard LIBS technique have been published, usually with the goal to enhance the LODs, accuracy, repeatability, spatial resolution or with the purpose of adapting to various environmental conditions of the actual measurement. Double-Pulsed LIBS, LIBS + LIFS (Laser-Induced Fluorescence), RLIBS (Resonance Laser-Induced Breakdown Spectroscopy), CF-LIBS (Calibration-Free LIBS), μLIBS, Liquid-LIBS, Stand-Off LIBS, Remote LIBS, and R-FIBS (Remote Filament-Induced LIBS) can be mentioned among others. Even though the assembly of the typical LIBS setup is relatively simple, high demands are placed on the parameters of the individual components. Development of the LIBS and its applications is highly dependent on the development progress in the fields of pulsed lasers, spectrometers and optical radiation detectors. Besides these basic Spectrochimica Acta Part B 101 (2014) 149–154 ☆ Selected paper from the 7th Euro-Mediterranean Symposium on Laser Induced Breakdown Spectroscopy (EMSLIBS 2013), Bari, Italy, 16–20 September 2013. ⁎ Corresponding author at: Institute of Physical Engineering, Faculty of Mechanical Engineering, Brno University of Technology, Technicka 2896/2, 616 69 Brno, Czech Republic. Tel.: +420 776758292; fax: +420 54114 2821. E-mail address: [email protected] (J. Novotný). http://dx.doi.org/10.1016/j.sab.2014.08.004 0584-8547/© 2014 Elsevier B.V. All rights reserved. Contents lists available at ScienceDirect Spectrochimica Acta Part B journal homepage: www.elsevier.com/locate/sab
-
Upload
independent -
Category
Documents
-
view
3 -
download
0
Transcript of Novotny J SAB 2014 Published

Spectrochimica Acta Part B 101 (2014) 149–154
Contents lists available at ScienceDirect
Spectrochimica Acta Part B
j ourna l homepage: www.e lsev ie r .com/ locate /sab
Technical Note
A versatile interaction chamber for laser-based spectroscopic applications,with the emphasis on Laser-Induced Breakdown Spectroscopy☆
J. Novotný a,b,⁎, M. Brada a,b, M. Petrilak a,b, D. Prochazka a, K. Novotný a,c, A. Hrdička c, J. Kaiser a,b
a Central European Institute of Technology, Brno University of Technology, Technicka 3058/10, 616 00 Brno, Czech Republicb Institute of Physical Engineering, Faculty of Mechanical Engineering, Brno University of Technology, Technicka 2896/2, 616 69 Brno, Czech Republicc Central European Institute of Technology, Masaryk University, Kamenice 753/5, 625 00 Brno, Czech Republic
☆ Selected paper from the 7th Euro-MediterraneanBreakdown Spectroscopy (EMSLIBS 2013), Bari, Italy, 16–⁎ Corresponding author at: Institute of Physical Engi
Engineering, Brno University of Technology, TechnickRepublic. Tel.: +420 776758292; fax: +420 54114 2821.
E-mail address: [email protected] (J. Novotný).
http://dx.doi.org/10.1016/j.sab.2014.08.0040584-8547/© 2014 Elsevier B.V. All rights reserved.
a b s t r a c t
a r t i c l e i n f oArticle history:Received 30 December 2013Accepted 8 August 2014Available online 20 August 2014
Keywords:Laser-induced breakdown spectroscopyLIBSChamberRoomChemical mapping
The technical note describes the interaction chamber developed particularly for the laser spectroscopy techniqueapplications, such as Laser-Induced Breakdown Spectroscopy (LIBS), Raman Spectroscopy and Laser-InducedFluorescence. The chamberwas designed in order to provide advanced possibilities for the research inmentionedfields and to facilitate routine research procedures. Parameters and the main benefits of the chamber aredescribed, such as the built-in module for automatic 2D chemical mapping and the possibility to set differentambient gas conditions (pressure value and gas type). Together with the chamber description, selected LIBSapplication examples benefiting from chamber properties are described.
© 2014 Elsevier B.V. All rights reserved.
1. Introduction
A modern analytical method known as the Laser-Induced Break-down Spectroscopy (LIBS) utilizes the optical emission of the plasmaplume to determine the elemental composition of the analyzedmaterial[1]. The plasma plume is induced on the sample surface by the focusedlaser pulse. This type of the atomic emission spectroscopy technique,where the excitation energy is in the form of a laser pulse, bringsnumber of significant advantages to the field of material analysis. LIBSis able to identify a wide spectrum of chemical elements includingthosewith low atomic numbers. There is no need for any special samplepreparation and all states of matter can be analyzed. Results of the anal-ysis are available in a few seconds and one measurement may containspectroscopic traces of all chemical elements present in the sample.
Despite the fact that there still exist drawbacks, e.g. problematicquantitative analysis, matrix effect and relatively poor limits of de-tection (LOD, generally 1–100 ppm), LIBS has become a respectedtechnique, complementary to the well-known techniques of chemicalmaterial analysis, such as Atomic Absorption Spectroscopy (AAS),X-Ray Fluorescence (XRF), Inductively Coupled Plasma MassSpectroscopy (ICP-MS), and many others [2].
Symposium on Laser Induced20 September 2013.neering, Faculty of Mechanicala 2896/2, 616 69 Brno, Czech
From the origins of the LIBS technique in the beginning of the 80'suntil present, the growing interest is noticeable particularly in the lasttwo decades. LIBS applications and LIBS technique itself are the researchsubjects of many university laboratories and research institutes. Appli-cations of the LIBS technique as an analytical tool for the fast chemicalanalysis are under intensive investigation in the fields of steel industry,food industry, environmental diagnostics, archeology and culturalheritage, geology, forensic analysis, etc. The rapidness of LIBS analysisand the possibility to measure samples in-situ and remotely enablemeasurements to be carried out in the places and situations inaccessiblefor the conventional techniques.
Thorough information overview including the references about thestate and results of the research in all application fields can be foundin LIBS books [1,3] and in the recent review articles [4–8]. Until now anumber of modifications of the standard LIBS technique have beenpublished, usually with the goal to enhance the LODs, accuracy,repeatability, spatial resolution or with the purpose of adapting tovarious environmental conditions of the actual measurement.Double-Pulsed LIBS, LIBS + LIFS (Laser-Induced Fluorescence),RLIBS (Resonance Laser-Induced Breakdown Spectroscopy), CF-LIBS(Calibration-Free LIBS), μLIBS, Liquid-LIBS, Stand-Off LIBS, RemoteLIBS, and R-FIBS (Remote Filament-Induced LIBS) can be mentionedamong others.
Even though the assembly of the typical LIBS setup is relativelysimple, high demands are placed on the parameters of the individualcomponents. Development of the LIBS and its applications is highlydependent on the development progress in the fields of pulsed lasers,spectrometers and optical radiation detectors. Besides these basic

Fig. 2. Chamber inner view — 1. motorized manipulator, 2. primary laser focusingoptomechanical assembly, 3. sample view optomechanical assembly, 4. secondary laserfocusing optomechanical assembly, 5. plasma radiation collecting optomechanicalassembly and 6. direction of the primary laser pulse.
150 J. Novotný et al. / Spectrochimica Acta Part B 101 (2014) 149–154
components, the LIBS setup consists ofmany other peripheral devices—e.g. pulse generators, photodiodes, power meters, a control PC, opticalassemblies, and optomechanical parts. One of them could be thechamber enclosing the laser–sample interaction.
The LIBS laboratory at Brno University of Technology (Brno, CzechRepublic) has been dealing with the LIBS method for more than15 years and gained considerable experience that served as an impulsefor the design of the interaction chamber. The main purpose was toextend the capabilities of the table-top LIBS setups, to simplify thenecessary mechanical alignment procedures, to speed up themeasurements and to enable automated acquirement of the seriesof spectroscopic data (e.g. for chemical mapping).
2. Experimental set-up
The interaction chamber (Fig. 1) for the laser-based spectro-scopic applications with special focus on LIBS has been developed.It meets the requirements of the LIBS method and its modificationsmentioned above.
The chamber basically consists of the manipulator, chamber body,series of optomechanical components and the pressure regulating sys-tem. In order to ensure high level of versatility, most of the constructionparts mentioned in the following sections have been designed in theform of a cage system. Thanks to that, these mounts are assembledfrom the standardized optical and mechanical parts and can be easilyadjusted, rebuilt or modified.
2.1. Manipulator
In the center of the chamber there is amotorized 3-axismanipulator(no. 1 in Fig. 2). It ismounted on the chamber door that can be slid out ofthe chamber up to 200 mm distance to guarantee easy access to theanalyzed sample. Three electromotors for the orthogonal x, y and zaxes have altogether the movement range of 80 × 60 × 50 mm.Movement resolution is below 2 μm. The stage on the manipulatorhas one centering and two mounting threaded holes to attach several
Fig. 1. The interaction chamber.
types of the sample holders. The sample stage can carry more than2 kg. Electromotors are able to operate in the vacuum down to UltraHigh Vacuum (UHV).
2.2. Primary input
Primary input for the laser beam is situated on the top of the cham-ber (no. 2 in Fig. 2), so the optical axis is perpendicular to the samplesurface. The input is equipped with the optomechanical assembly forthe focusation of the laser beam. The distance to the sample allowsutilizing the lens with the focal length up to 75 mm. Using a standardavailable adapters it is possible tomountmicroscopy objective to realizeμLIBS analysis. In the default configuration the focusing lens is anair-spaced doublet with suppressed spherical aberration and AR(anti-reflective) coating optimized for the Nd:YAG laser harmonicswavelength 1064 and 532 nm. With 32 mm focal length lens and532 nm wavelength the diameter of the craters is lower than80 μm. The front side of the focusing assembly is covered by theprotective window with AR coating.
2.3. Sample view
The primary laser pulse (no. 6 in Fig. 2) is reflected into the primaryinput by the dichroic mirror. Above the mirror — and thus above theprimary input, there is an optomechanical assembly for the sampleview (no. 3 in Fig. 2). It contains a tandem of view objectives for elec-tronically switchable field of view (1.5 and 7.5 mm) and CMOS camera(1280 × 1024, color, 25 fps) with the protective shutter. The sample isilluminated by the LED ring.
The sample view is used not only for better orientation on the sam-ple surface, but also for the laser autofocus system as the data provider.The developed autofocus algorithm [9] analyzes the sharpness of thecaptured sample view image based on a Fourier transform of theimagematrix. In a few iterative cycles it is able to place themanipulatorto the focal plane of the focusing lens with the accuracy of ±50 μm.

Fig. 4. The interaction chamber with slid door.
151J. Novotný et al. / Spectrochimica Acta Part B 101 (2014) 149–154
2.4. Collecting lens
The chamber has an integrated light collecting optomechanicalassembly (no. 5 in Fig. 2) that is intended for collecting the plasma radi-ation (in case of LIBS analysis). Optical part was designed apochromaticto cover spectral range 220–700 nm and consists of 1″ UVFS and CaF2lenses to ensure high transmission in the UV region. The focal pointcan be adjusted in 3 axes. The assembly is terminated by the standardSMA connector, so the optical fiber can be connected from the outsideof the chamber.
2.5. Lateral laser inputs
Other two chamber inputs— secondary (no. 4 in Fig. 2) and tertiary,are also equipped with the optomechanical assemblies for focusing thelaser beam. All 3 laser inputs aremutually orthogonal andenable the ap-plication ofmulti-pulse techniques Double-Pulsed LIBS and LIBS+ LIFS.In the default configuration the secondary and tertiary focusing assem-blies use the best-form singlets with protecting window covered by ARlayers. Laser focusing assemblies and light collecting assemblies aremounted on the chamber ports and can be easily slid out if needed.
2.6. The interaction chamber body
The chamber body is made from one piece of stainless steel with thewall thickness of 25mm (Fig. 3) in the thinnest part. Rigid constructionguarantees shape constancy in the various atmosphere pressure condi-tions inside the chamber and allows direct attachment of additionaldevices with no risk of the body shape deformation and misalignmentof optical parts. The chamber door and the sample view optical systemare covered by the plastic case (visible in Fig. 4). The outer dimensionsof the chamber (excluding the pedestal) are 390 × 330 × 560 mm andthe inner space allows placing the sample with the dimensions up to145 × 165 × 65 mm. The pedestal has mounting holes to attach thechamber on the optical desk with the standard metric or imperial gridof threaded holes.
Fig. 3. The interaction chamber — sectional view.
2.7. Ports
The interaction chamber has a number of input ports. Two of them,as mentioned above, are equipped to focus the laser beam and theother to collect the plasma radiation. There is also a large view port(100 mm in diameter) with protecting laser filter plate (optical density7 at 532 nm, 5 at 1064 nm) as can be seen in Fig. 4, a universal inputport and 8 smaller ports for connecting the pressure regulator systemand control electronics cables. All transparent feedthroughs aremade from UV Fused Silica glass to ensure high transmission in UVregion (N200 nm).
2.8. Pressure regulating system
The chamber has the pressure regulating system that enables to setthe inner atmosphere pressure in the range of 1–1300 mbar. Therefore,the analysis can be realized in the underpressure, overpressure or evenin the atmospheres of CO2 or inert gases (Ar, He, N2) in order to enhancethe limits of detection or to simulate specific environmental conditions.At the input of the pressure regulating system there is a gas cylinderfollowed by the reduction valve and a tandem of the pressure regulators(each for different pressure range) to cover whole designed pressurerange with the accuracy b4% of the set value. At the output of thechamber there is an electromagnetic valve and rotary vacuum pump,which is able to pump out the chamber to 1 mbar in 30 s. Chamber isalso equipped with the pressure equalizing valve and the overpressuresafety valve.
2.9. Control electronics and software
The control electronics is placed in the standardized 19″ rack boxand contains drivers for the electromotors, LED lights, shutter, valves,pressure regulators, etc. There can also be included a 4-output pulsegenerator with the time resolution of tens of ns, which is necessaryfor the synchronization of the connected lasers with the detector.The rack is connected to the control PC via serial (RS232) and USBinterface (Fig. 5).
All electronic components are controlled by the individual modulesof the control software. The primarymodule is the Sample viewmodule.It contains a large view of the sample and allows moving the sample,launching the autofocus procedure, changing the zoom level andswitching the illumination. The module for the chemical mappingallows defining the overall dimensions and other parameters of the
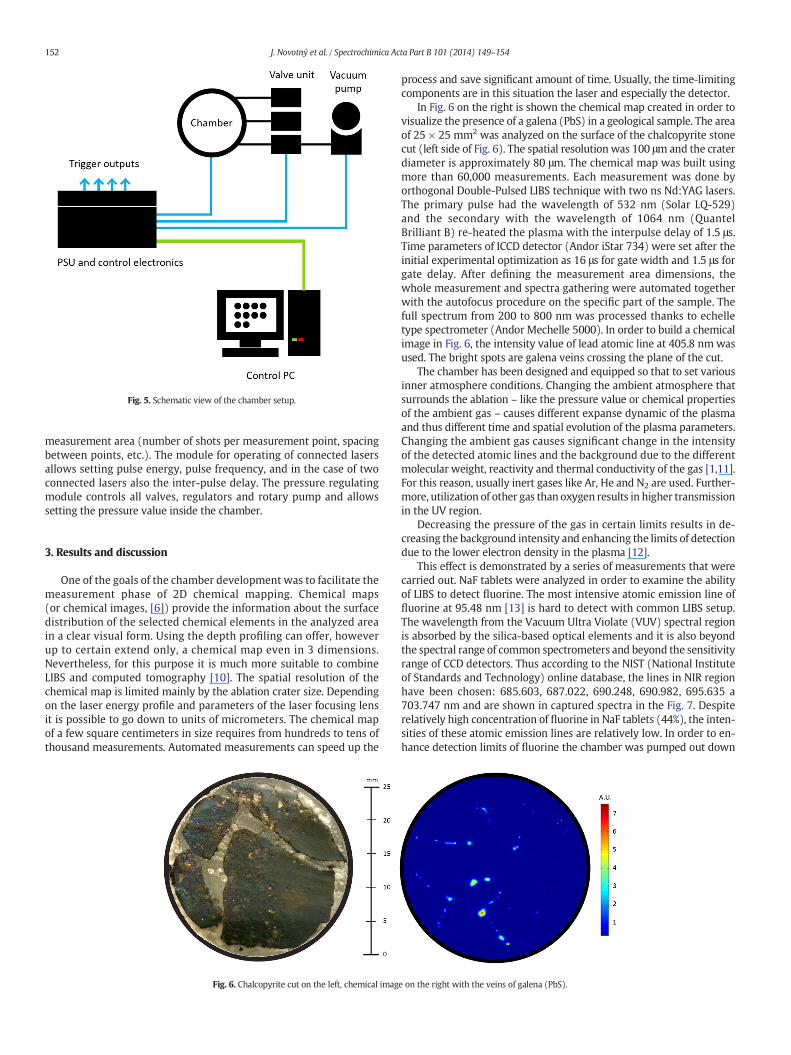
Fig. 5. Schematic view of the chamber setup.
152 J. Novotný et al. / Spectrochimica Acta Part B 101 (2014) 149–154
measurement area (number of shots per measurement point, spacingbetween points, etc.). The module for operating of connected lasersallows setting pulse energy, pulse frequency, and in the case of twoconnected lasers also the inter-pulse delay. The pressure regulatingmodule controls all valves, regulators and rotary pump and allowssetting the pressure value inside the chamber.
3. Results and discussion
One of the goals of the chamber development was to facilitate themeasurement phase of 2D chemical mapping. Chemical maps(or chemical images, [6]) provide the information about the surfacedistribution of the selected chemical elements in the analyzed areain a clear visual form. Using the depth profiling can offer, howeverup to certain extend only, a chemical map even in 3 dimensions.Nevertheless, for this purpose it is much more suitable to combineLIBS and computed tomography [10]. The spatial resolution of thechemical map is limited mainly by the ablation crater size. Dependingon the laser energy profile and parameters of the laser focusing lensit is possible to go down to units of micrometers. The chemical mapof a few square centimeters in size requires from hundreds to tens ofthousand measurements. Automated measurements can speed up the
Fig. 6. Chalcopyrite cut on the left, chemical imag
process and save significant amount of time. Usually, the time-limitingcomponents are in this situation the laser and especially the detector.
In Fig. 6 on the right is shown the chemical map created in order tovisualize the presence of a galena (PbS) in a geological sample. The areaof 25 × 25 mm2 was analyzed on the surface of the chalcopyrite stonecut (left side of Fig. 6). The spatial resolution was 100 μm and the craterdiameter is approximately 80 μm. The chemical map was built usingmore than 60,000 measurements. Each measurement was done byorthogonal Double-Pulsed LIBS technique with two ns Nd:YAG lasers.The primary pulse had the wavelength of 532 nm (Solar LQ-529)and the secondary with the wavelength of 1064 nm (QuantelBrilliant B) re-heated the plasma with the interpulse delay of 1.5 μs.Time parameters of ICCD detector (Andor iStar 734) were set after theinitial experimental optimization as 16 μs for gate width and 1.5 μs forgate delay. After defining the measurement area dimensions, thewhole measurement and spectra gathering were automated togetherwith the autofocus procedure on the specific part of the sample. Thefull spectrum from 200 to 800 nm was processed thanks to echelletype spectrometer (Andor Mechelle 5000). In order to build a chemicalimage in Fig. 6, the intensity value of lead atomic line at 405.8 nm wasused. The bright spots are galena veins crossing the plane of the cut.
The chamber has been designed and equipped so that to set variousinner atmosphere conditions. Changing the ambient atmosphere thatsurrounds the ablation – like the pressure value or chemical propertiesof the ambient gas – causes different expanse dynamic of the plasmaand thus different time and spatial evolution of the plasma parameters.Changing the ambient gas causes significant change in the intensityof the detected atomic lines and the background due to the differentmolecular weight, reactivity and thermal conductivity of the gas [1,11].For this reason, usually inert gases like Ar, He and N2 are used. Further-more, utilization of other gas than oxygen results in higher transmissionin the UV region.
Decreasing the pressure of the gas in certain limits results in de-creasing the background intensity and enhancing the limits of detectiondue to the lower electron density in the plasma [12].
This effect is demonstrated by a series of measurements that werecarried out. NaF tablets were analyzed in order to examine the abilityof LIBS to detect fluorine. The most intensive atomic emission line offluorine at 95.48 nm [13] is hard to detect with common LIBS setup.The wavelength from the Vacuum Ultra Violate (VUV) spectral regionis absorbed by the silica-based optical elements and it is also beyondthe spectral range of common spectrometers and beyond the sensitivityrange of CCD detectors. Thus according to the NIST (National Instituteof Standards and Technology) online database, the lines in NIR regionhave been chosen: 685.603, 687.022, 690.248, 690.982, 695.635 a703.747 nm and are shown in captured spectra in the Fig. 7. Despiterelatively high concentration of fluorine in NaF tablets (44%), the inten-sities of these atomic emission lines are relatively low. In order to en-hance detection limits of fluorine the chamber was pumped out down
e on the right with the veins of galena (PbS).

685 690 695 700 7050
23000
46000
69000
0
23000
46000
69000
0
23000
46000
69000
685 690 695 700 705
1000 mbar
wavelength (nm)
90 mbar
inte
nsity
(A.U
.)
703.747 nm
696.635 nm
15 mbar685.603 nm
687.022 nm
690.248 nm
690.982 nm
Fig. 7. Parts of the raw spectra with the fluorine atomic emission lines.
0 100 200 300 400 500 600 700 800 900 1000 1100
100
200
300
400
500
600
700
800
ambient gas pressure (mbar)
nois
e sd
ev (a
.u.)
Fig. 9. Standard deviation of the background noise as a function of the ambientgas pressure.
153J. Novotný et al. / Spectrochimica Acta Part B 101 (2014) 149–154
to 1 mbar pressure and afterwards slowly pumped back to 1000 mbar.The dependency of the atomic emission lines intensity on currentpressure was studied.
The single pulsed LIBSwas used for the analysis. Plasmawas inducedby the Nd:YAG laser (Solar LQ-529) with pulse energy 60 mJ, pulseduration 8 ns and wavelength 532 nm. Detection setup consisted ofechelle spectrometer (Andor Mechelle 5000) and ICCD detector(Andor iStar 734). The optimal time parameters for detector wereexperimentally determined as 1.2 μs for the gate delay and 15 μs forthe gate width. The gain of the detector was set at 160 (the maximumvalue is 255).
Fig. 7 shows part of the emission spectrum with the fluorine atomicemission lines at three mentioned pressures: 15, 90 and 1000 mbar.
Fig. 8 presents the overall detected intensity of the fluorine atomicemission line at 690.248 nm as a function of the ambient air pressure.Overall Intensity is visualized as the sum of signal intensity andbackground intensity. Standard deviation of the background noiseis shown in Fig. 9.
100 200 300 400 500 600 700 800 900 10000
10000
20000
30000
40000
50000
60000
70000
80000
1000 mbar SNR = 15.9SNB = 0.9
).u.a(ytisnetni
ambient gas pressure (mbar)
90 mBarSNR = 179.8SNB = 22.8
SignalBackground
Fig. 8. Intensity of the fluorine atomic emission line at 690.248 nm as a function of theambient gas pressure.
It is obvious that decreasing the ambient pressure value causesincrease of the atomic emission line intensity, while intensity of thebackground and the standard deviation of the noise decrease. The max-imum intensity of the atomic line was detected near the pressure valueof 90 mbar. Signal to noise ratio (SNR) and signal to background ratio(SNB) for this pressure were calculated as 179.8 and 22.8 respectively.Below this pressure the intensity of the atomic line decreases, whilethe SNB still grows up to value of 36 at the pressure of 15 mbar. Theresults show that compared to the values at atmospheric pressure(SNR = 15.9 a SNB = 0.9) it is possible to obtain 11× higher SNR and40× higher SNB by decreasing the ambient gas pressure.
To conclude, it is necessary to note that the intention of this experi-ment was to demonstrate the effect of pressure decreasing on LIBS sig-nal rather than exploring its full potential. For the simplicity the optimalvalues of gate width and gate delay of the detector were determined atthe atmospheric pressure and were set as a constant for all other pres-sure values. The optimization of these parameters for each pressurevalue individually would most probably lead to even higher SNRand SNB values. Realignment of the collecting optical assemblyincluding its defocus should also be performed. As seen in Fig. 10,
Fig. 10. Shape of the laser-induced plasma at different gas pressure conditions.

154 J. Novotný et al. / Spectrochimica Acta Part B 101 (2014) 149–154
while varying the pressure value of the ambient gas, the plasmamorphology changes rapidly.
The possibility to change atmospheric condition inside the chambercan serve not only for the purposes of a basic research of the plasmaevolution or for enhancing the limits of detection, but also for the simu-lation of the environmental conditions of real individual applications—low pressure for the extraterrestrial research, high pressure for the re-search in the field of nuclear reactors, etc.
Large side viewport of the chamber with the laser filter allows directobservation of the laser–matter interaction including the plasma evolu-tion. During presented measurement the viewport was used for moni-toring the shape of the plasma plume at different ambient gaspressures. Fig. 10 shows the laser-induced plasma shapes for discussedpressure values as captured by the digital camera. The exposition timeof the camera was set at 1.5 s, so the pictures show the whole plasmalifetime integrated.
Laser ablation catapults a significant amount of the ablated materialfrom the sample to the surrounding environment. A part of it will endup on the surface of nearby optical components. This results in loweringthe optical transmission or even irreversible damage of the lenses.Therefore laser focusing lens is protected by the window with AR coat-ing that has to be cleaned sometimes or replaced by a newone. The phe-nomenon of covering the lenses by the dust could be also partiallysuppressed by setting the pressure regulating system to the continualflushing.
4. Conclusions
The presented interaction chamber was developed with the goal tofacilitate the research in the field of laser-based spectroscopic applica-tions with a special focus on LIBS and to increase the analysis efficiency.The main purpose was to enhance the productivity i.e. save the time ofthe research team during the routine procedures (setup alignment,sample movement, etc.) and to provide advanced possibilities for theresearch using the LIBS technique (multi-pulse techniques, various am-bient gas conditions, etc.). Despite the fact that the chamber is still in thestage of development, it can be concluded that the original goals havealready been achieved. The main features of the chamber are:
• Chamber encloses the laser–sample interaction protecting the labora-tory staff against a high intensity laser and plasma radiation and hold-ing potentially dangerous vapors (from toxic elements).
• It contains 3-axesmotorized stage that enables laser autofocusing andautomated gathering of the spectroscopic data for the chemical map-ping.
• It is equipped with the sample view optical system with two zoomlevels and sample illumination.
• Thanks to multiple laser inputs chamber enables to use multi-pulsetechniques in orthogonal configuration.
• The chamber is equipped by a number of universal ports, some ofthem have laser focusing or light collecting optical assemblies imple-mented.
• It is possible to set the pressure of the inner atmosphere in the range1–1300 mbar or to substitute the air by a different gas to enhancelimits of detection or to simulate various environments.
• Rigid body of the chamber enables the direct attaching of the variousaccessories — e.g. attaching the detection system for detection ofatomic emission lines in VUV region.
The equipment of the chamber that was designed especially forthe LIBS technique can be used with certain modifications also forrelated techniques — Raman spectroscopy, Infrared Spectroscopy,X-Ray Fluorescence Spectroscopy, etc. The chamber originatesfrom a scanning electron microscopy chamber. The core equipmentand parameters, such as the UHV-ready design, precise motorizedmanipulator, number of universal ports and modular software,make it a universal tool effectively applicable in many other techniquesof material analysis.
Acknowledgments
Authors would like to acknowledge the project “Development of aninteraction chamber for Laser-Induced Breakdown Spectroscopy (LIBS)”(TA02011272) of Technology Agency of Czech Republic (TAČR) andproject “CEITEC — Central European Institute of Technology”(CZ.1.05/1.1.00/02.0068) from the European Regional DevelopmentFund. Jan Novotný acknowledges the project CZ.1.07/2.3.00/30.0005:“Support of Interdisciplinary Excellence Research Teams Establishmentat Brno University of Technology”.
References
[1] R. Noll, Laser-Induced Breakdown Spectroscopy: Fundamentals and Applications,Springer, 2012.
[2] J.D. Winefordner, I.B. Gornushkin, T. Correll, E. Gibb, B.W. Smith, N. Omenetto,Comparing several atomic spectrometric methods to the super stars: specialemphasis on laser induced breakdown spectrometry, LIBS, a future super star, J.Anal. At. Spectrom. 19 (2004) 1061, http://dx.doi.org/10.1039/b400355c.
[3] D.A. Cremers, L.J. Radziemski, Handbook of Laser-Induced Breakdown Spectroscopy,John Wiley & Sons, Ltd, New York (USA), 2006.
[4] D.W. Hahn, N. Omenetto, Laser-induced breakdown spectroscopy (LIBS), part II:review of instrumental and methodological approaches to material analysis andapplications to different fields, Appl. Spectrosc. 66 (2012) 347–419, http://dx.doi.org/10.1366/11-06574.
[5] M.A. Harith, R.S. Harmon, R.E. Russo, R.R. Hark, Applications of laser-inducedbreakdown spectroscopy for geochemical and environmental analysis: a compre-hensive review, Spectrochim. Acta Part B 87 (2013) 11–26, http://dx.doi.org/10.1016/j.sab.2013.05.017.
[6] V. Pinon, M.P. Mateo, G. Nicolas, V. Piñon, Laser-induced breakdown spectroscopyfor chemical mapping of materials, Appl. Spectrosc. Rev. 48 (2013) 357–383,http://dx.doi.org/10.1080/05704928.2012.717569.
[7] S. Carter, A.S. Fisher, M.W. Hinds, S. Lancaster, J. Marshall, Atomic spectrometryupdate. Review of advances in the analysis of metals, chemicals and materials, J.Anal. At. Spectrom. 28 (2013) 1814.
[8] J. Kaiser, K. Novotný, M.Z. Martin, A. Hrdlička, R. Malina, M. Hartl, et al., Trace ele-mental analysis by laser-induced breakdown spectroscopy— biological applications,Surf. Sci. Rep. (2012) 1–11, http://dx.doi.org/10.1016/j.surfrep.2012.09.001.
[9] J. Novotný, R. Malina, J. Kaiser, M. Liška, M. Galiova, K. Novotný, Implementation ofan autofocus algorithm based on searching the best in-focus image into a table-toplaser-induced breakdown spectroscopy setup, Opt. Eng. 48 (2009) 103604, http://dx.doi.org/10.1117/1.3250206.
[10] M. Galiová, J. Kaiser, K. Novotný, M. Ivanov, M. Nývltová Fisáková, L. Mancini,et al., Investigation of the osteitis deformans phases in snake vertebrae bydouble-pulse laser-induced breakdown spectroscopy, Anal. Bioanal. Chem. 398(2010) 1095–1107, http://dx.doi.org/10.1007/s00216-010-3976-1.
[11] A. De Giacomo, M. Dell'Aglio, R. Gaudiuso, S. Amoruso, O. De Pascale, Effects of thebackground environment on formation, evolution and emission spectra of laser-induced plasmas, Spectrochim. Acta Part B 78 (2012) 1–19, http://dx.doi.org/10.1016/j.sab.2012.10.003.
[12] A.J. Effenberger, J.R. Scott, Effect of atmospheric conditions on LIBS spectra, Sensors(Basel) 10 (2010) 4907–4925, http://dx.doi.org/10.3390/s100504907.
[13] G. Asimellis, S. Hamilton, A. Giannoudakos, M. Kompitsas, Controlled inert gasenvironment for enhanced chlorine and fluorine detection in the visible and near-infrared by laser-induced breakdown spectroscopy, Spectrochim. Acta Part B 60(2005) 1132–1139, http://dx.doi.org/10.1016/j.sab.2005.05.035.