November 2019 - Konkan Geographers Association of India
130
-
Upload
khangminh22 -
Category
Documents
-
view
0 -
download
0
Transcript of November 2019 - Konkan Geographers Association of India


National Conference on Global Research for Sustainable Development: Recent Trends, Challenges and Approaches
Volume: 23 | Nov-Dec 2019 | ISSN : 2277-4858
Peer Reviewed National Level Interdisciplinary Journal Page No. - 1
Abstract: Digital revolution is generally considered as the next industrial revolution. Many countries are moving towards cashless
economy. The concept of digitalization was initiated & introduced by our Prime-Minister Shri Narendra Modi. The process of
digitalization includes the use of technological devices such as internet facility, information & technology tools like the digital platform,
websites & mobile applications in various economic & business transactions. The ‘Digital India’ programme was introduced in 2015 to
make India’s economy into cashless economy. India is one of the fastest growing economies in the world & being recognized as a
knowledge based economy, the present paper tries to analyse the various measures introduced by the Government to make India digital
with special emphasis on rural India & how to improve rural internet connectivity & digital literacy. It is a conceptual study that focuses
on the measures undertaken by the Government to bridge the digital gap between urban & rural India.
Keywords: Digital India, digitalization, internet connectivity, rural India.
I. INTRODUCTION
In this era of globalization, digitalization is a new technological movement that has made business transactions fast & easy.
There are many countries that have superseded the process of digitalization. In India, the campaign of ‘Digital India’
introduced by the Modi Government is gaining momentum especially emphasizing in the rural districts. Digitalisation relates
to the usage of digital technologies with the help of information & communication technological devices. Gandhiji had said
India lives in villages, so if Digital India campaign has to become successful, it has to start with rural digitalization. Rural
digitalization helps in improving the rural economy & development. The present paper is an attempt to examine the extent of
digitalization in rural areas. Digital India is an initiative of the Government of India to ensure that government services are
made available to citizens electronically by improving online infrastructure and by increasing internet connectivity. It was
launched on 1st July 2015. The initiative includes plans to connect rural areas with high-speed internet networks. Digital India
has three core components namely the creation of digital infrastructure, delivery of services digitally & digital literacy. For a
country like India where 70% of the population lives in rural areas, economic development can be achieved only when there is
an urban & rural development. The policy makers have to formulate strategies & implement considerable efforts to reduce the
digital divide between urban & rural areas.
II. REVIEW OF LITERATURE
Dr. Priyadarshinipadhi (2017) provides an insight into the challenges in the implementation of the digital India
programme & discusses the reasons or causes that led to introduce digitalization in the economy. The main objective
being to improve online infrastructure by increasing internet connectivity to digitalise economic & business
operations.
Mrinalini Kaul & Purvi Mathur (2017),emphasise on the usage of information communication technological
devices to introduce digital literacy in India. They also focus on digital financial literacy & analyse the effectiveness
of the schemes & measures that are introduced & implemented in Digital India campaign.
Digitalisation and Rural Development in India
Prasanna B Joshi1 Dr. Abhay M. Patil
2
National Conference on Global Research for Sustainable Development: Recent Trends, Challenges and Approaches
Volume: 23 | Nov-Dec 2019 | ISSN : 2277-4858
Peer Reviewed National Level Interdisciplinary Journal Page No. - 2
Gupta and Arora,(2015),they relate to the importance of digital India programme & the preparedness of India to
digitalise its economy. They examine the importance & implication of the ‘Digital India’ campaign on the growth &
development of rural Indian economy.
Tukesh Kumar, Shwati Prdhi & Abhay Bisen (2016),analyse the various initiatives introduced by the Government
to digitalise India with special focus on rural India. The authors relate to the technological devices like cloud
computing & mobile applications. They discuss the significance & benefits of digitalizing India’s economy.
III. OBJECTIVES OF THE STUDY
a) To understand the concept of rural development
b) To ascertain the initiatives undertake to digitalize rural India.
c) To assess the extent of digitalization in rural India.
IV. RESEARCH METHODOLOGY
The study is based on secondary sources which include articles & internet sources.
a) Concept of Rural Development
Rural development is one of the strategies where the concept of digitalization can be introduced. In 1991 the percentage of
rural population was 74.3% which reduced to 72.2% in 2001 leading to 69.9% in 2011. This decrease in rural population could
be understood as an indication that there is a need to provide better facilities in rural areas. Rural development refers to
improving the quality of life & economic well-being of people living in rural areas. Generally, rural development is centered
on the exploitation of resources relating to agriculture & forestry, but increased urbanization changed conditions in rural
areas.Education, entrepreneurship, physical infrastructure, and social infrastructure play an important role in developing rural
regions. Rural development is also characterized by its emphasis on locally produced economic development strategies. In
contrast to urban regions, which have many similarities, rural areas are highly distinctive from one another. Rural development
essentially focuses on action for the development of areas outside the mainstream urban economic system. Rural development
is needed because modernization of village leads to urbanization. The Indian economy is predominantly rural with over
two-thirds of its population and workforce residing in rural areas. Rural India contributes a substantial part of the total net value
added in many sectors, with an overall 46% contribution to our national income. With a population of 833 million people
(which incidentally is larger than rural China) residing in 640,867 villages, it is projected that, by 2050, more than half of
India’s population will still be rural, despite rising urbanisation. Thus, the growth and development of the rural economy is
imperative for inclusive development and overall growth of the country. The Government ensured that by 2018 all villages will
be covered through mobile connectivity. The aim was to increase network penetration and cover gaps in all 44,000 villages.
Initiative was taken to train 10 million people in towns and villages for IT sector jobs within five years. It aimed to train 0.3
million agents to run viable businesses delivering IT services. Additionally, the project involved training of 0.5 million rural IT
workforce in five years. Rural India contributes a substantial part of the total net value added in many sectors, with an overall
46% contribution to our national income.
b) Concept of Digital India in Rural Areas
The purpose of Digital India is to create increased internet connectivity amongst rural masses & help in their small businesses
through the application of digital technologies such as digital infrastructure, e-commerce etc.
National Conference on Global Research for Sustainable Development: Recent Trends, Challenges and Approaches
Volume: 23 | Nov-Dec 2019 | ISSN : 2277-4858
Peer Reviewed National Level Interdisciplinary Journal Page No. - 3
Digital India Programme is categorized into nine support systems which are as follows:
Broadband Highways: Web based portals and Mobile apps will be developed to access online information while on the move.
High speed broadband highways will be provided through fiber optics that connects all the remote areas, Government
departments, Universities, R&D etc.
Universal Mobile Access: With Digital India programme nation is ready to be well-connected, efficient, and more
productive in every aspect. Network technologies like 3G, 4G and upcoming 5G will storm the speed.
Public Internet Access: The two sub components of Public Internet Access Programme are Common Service
Centres and Post Offices as multi-service centres. Common Service Centres would be made viable and
multi-functional end-points for delivery of government and business services. DeitY would be the nodal department
to implement the scheme. Post Offices are proposed to be converted into multi service centres.
E-Governance: This governance will transform every manual work into fully automation system through these
measures. Online access to applications i.e. availability of all databases and information in electronic format.
Effortlessly tracking of assignments. Interface between departments for superior production of work.
E-Kranti: This e-kranti will fully focus on digital knowledge program where education, health, farming, rights,
financial and many more services will be delivered on a very high bandwidth. Physical boundaries no longer are a
limitation when almost everyone and everything is a digital handshake away.
Electronics Manufacturing: This milestone will create a huge base for electronics manufacturing in india with the
aid of digital technologies and skills. The empowerment of manufacturing through the Internet of Things will enable
intelligent workshops that demonstrate data driven operational excellence and decentralized production control
systems within and beyond the physical factory walls.
IT for Jobs: The government is preparing to provide training and teaching skills to the youth for employment
opportunities in the IT sector.
Early Harvest: The Govt. has set up Aadhaar Allowed Fingerprint Presence Program in all central government
workplaces situated at Delhi. A web based application software system will allow online documenting of attendance
and its watching by the involved stakeholders.
Information for All: Websites and mobile apps will convey data and realistic participation and through social media.
Everything is connected through virtual networks. Swift work flow and no delays due to wait in queues.
Scope of Digital India in Rural Areas
The overall scope of Digital India in rural areas is to prepare India for a knowledge future & realize IT (Indian Talent) + IT
(Information Technology) = IT (India Tomorrow) On being an Umbrella Programme - covering many departments weaves
together a large number of ideas and thoughts into a single, comprehensive vision, so that each of them is seen as part of a
larger goal. The Digital India Programme will pull together many existing schemes which would be restructured and
re-focused and implemented in an organised manner. A wide range of applications and content relevant for rural consumers
must be accessible on mobile devices and the operators must provide service packages affordable to the target user. Broad
based availability of broadband services, through handheld devices, is a pre-requisite for the achievement of the goals of
Digital India. It has been found that the socio-economic potential and impact of electronic governance software and mobile
applications in rural India is much more than urban India. The digital platform will open a new era for rural citizens through a
variety of services like improved governance, land records, jobs, health, education and agriculture and digitization of personal
and public records for safekeeping.

National Conference on Global Research for Sustainable Development: Recent Trends, Challenges and Approaches
Volume: 23 | Nov-Dec 2019 | ISSN : 2277-4858
Peer Reviewed National Level Interdisciplinary Journal Page No. - 4
Rural E-Governance Initiatives in India
Computerised Rural Information Sytem Project (CRISP) : aims at assisting the District Rural Development
Agency [DRDA] in observing the exercise of poverty alleviation programmes through Computer based Information
System. So far four versions of CRISP application software packages have been developed. Rural Soft was the fourth
version. Through Rural soft 2000 common man can access all information on Government portals and it also enabled
Government to monitor workings of various agencies. It has been implemented in 15 districts of the country, which
have been wired using state-of-the-art VSAT (satellite based) network by the Ministry of Rural Development.
NeGP: National e-Governance Plan was launched with the following vision:“Make all Public Services accessible to
the common man in his locality, through common service delivery outlets and ensure efficiency, transparency and
reliability of such services at affordable costs to realize the basic needs of the common man.” This was introduced in
May 18, 2006 by Department of Electronics and Information Technology (DEIT) and Department of Administrative
Reforms and Public Grievances (DAR&PG). NeGP was set up with 27 Mission Mode Projects (MMPs) and 8
components. It was specially designed for rural areas and for the easy access of the services provided by NeGP State
Wide Area Network (SWAN) and Common Service Centre (CSC) was set up.
NIC: NIC is a part of the Indian Ministry of Communications and Information Technology's Department of
Electronics & Information Technology introduced in 1976. It is a website designed for all the e-governance initiatives
taken by government at one place. This includes blocks, districts, state government and central government. The ICT
network of NIC is called NICNET.
E-CHOUPAL : To help the farmers & reduce their dependence on middlemen a scheme known as e-Choupal (which
means a village meeting place) was introduced. Under this initiative various e-Choupals were set up in around 6500
villages by 2012 and each e-Choupal was equipped with a computer, internet connection, printer and Uninterrupted
Power Supplies (UPS).
Gyandoot: Civil servants consulted various Gram Panchayats in Dhar district in Madhya Pradesh. The project was
started in January,2000 and named as Gyandoot. Gyandoot is very beneficial as it is economical and is owned by rural
intranet system that is Soochnalaya, as it helps to fulfill the needs of villagers in the district. Rural youth manage 35
such centres which were established since January, 2000. The unemployed educated youth were trained and they ran
the Soochnalaya and are known as Soochaks. They provide various types of services information related to
agriculture, education, health, issues related to women, information about market and user fee is charged for all this.
They further serve inmaking application for the services provided by the district headquarter for ownership of land.
Soochnalaya are connected with dial-up lines through internet. Above 600 villages and approximately 50% of the
total population of a district are covered by the network of 31 such Kiosks.
Empowerment of rural entrepreneurs under ‘Digital India’ Digital India programme has launched many schemes that focuses on the empowerment of rural entrepreneurs of India. One of
such schemes is enhancing Rural Entrepreneurship through Common Services Centres (CSCs). Under this scheme rural
entrepreneurs can get loan for setting up their CSCs under the Micro Units Development and Refinance Agency (MUDRA)
Yojana. CSCs are information and communications technology enabled service delivery points at the village level for delivery
of government, financial, social and private services such as applying online passports, land record, digital locker and Aadhaar
cards. Another scheme for promoting rural entrepreneurship under Digitial India Programme is through Internet Kiosks.
Internet Kiosk is a kiosk with one or more computers, a tablet, Internet connection, with a web cam that can be the set up in
villages to be used as the hub of rural connectivity for providing education and training, information about agriculture and
health care, employment news and market information. These cyber-kiosks can be run by local entrepreneurs thereby
empowering the rural entrepreneurship. Empowerment of women of a nation leads to the successful growth and development

National Conference on Global Research for Sustainable Development: Recent Trends, Challenges and Approaches
Volume: 23 | Nov-Dec 2019 | ISSN : 2277-4858
Peer Reviewed National Level Interdisciplinary Journal Page No. - 5
of a nation. Digital India Programme has set the stage for empowering the Rural Indian Women. Arogya Sakhi helps rural
women by providing health care at rural doorsteps. Women armed with tablets and mobile healthcare devices like glucometers,
blood pressure checking machine visit homes and collect data from the village women. This data can be accessed by doctors at
any location who could provide treatment to the patients remotely. Internet Saathi aims to go deep with the internet usage
among rural women in India. W2E2 (India) Women for Empowerment and Entrepreneurship, in short W2E2 is helping rural
women with digital tools, e-learning, internet connection. Women tend to use the Internet for their own projects in fields like
sustainable agriculture and rural health. Some are setting up their own kiosks and shops to provide online services to the local
community, while others have taken up work as digital literacy trainers in their own local communities.
c) Extent of digitalization in rural India
Kerala is India’s first digital state because of its achievement of high e-literacy & mobile penetration. In February 2016, former
President Pranab Mukherjee declared Kerala as the first digital state of India. It was also the first state to complete the National
Optical Fibre Network (NOFN) project, granting high-speed Internet access to all its gram panchayats. This achievement is
significant especially in the area of rural development. Kerala has been setting benchmarks in terms of achievement of
digitalization targets.
Some of the digital initiatives introduced in Kerala are as follows:
1. Aadhaar Enabled Citizen Services (AECS): It is an IT digital tool and the e-district project deliver all district-level services
for citizens in a state-owned portal or through Common Service Centres (CSCs).
2. The Accelerating Change and Transformation in Organisation and Networking (ACTION) initiative has been developed to
track high-priority projects, their status and areas needing the attention of senior authorities.
3. Computer Emergency Response Team-Kerala (CERT-K) is another important initiative which deals with cyber security
threats and issues warnings to concerned departments as and when necessary. It works in coordination with the CERT-In
application.
India’s first digital village, Akodara, is located in Gujarat. The Government of Gujarat partnered with ICICI Bank, which
adopted the village and converted it into a working model for Digital India. From setting up bank accounts and going cashless
to installing CCTV cameras, the village is a perfect example of what a digital village would look like.
To meet the Internet for all objective of Digital India, the Andhra Pradesh Government is working on the fibre grid initiative.
Also, with the e-Pragati initiative, Andhra Pradesh has embarked on a journey to become the first to have state wide enterprise
architecture. Intel India has also announced the launch of ‘EkKadamUnnati Ki Aur’, an initiative aimed at working with the
government to create the blueprint for the digitization of rural India. The first such Digital India ‘Unnati’ Kendra has been set
up at a Common Services Center (CSC) in Nadimpalle village of Mahabubnagar district of Telangana
V. FINDINGS OF THE STUDY
Over 10 years ago, the government, through its flagship National e-Governance Plan, envisaged to empower rural citizens by
making available various government services to them via electronic media and created access points, i.e. common service
centres run by village-level entrepreneurs (VLEs) at the village and gram panchayat level. Financial inclusion is an important
priority of the government. Only 38% of the 117,200 branches of scheduled commercial banks are working in rural areas, and
a meagre 40% of the households have bank accounts. Thus, India is home to 19% of the world’s unbanked population. Rural
Indians have been getting online in increasing numbers, and are expected to catch up with urban India by 2020, when 48% of
the online population will be from rural India (up from 36% in 2016). And if Digital India delivers on its promise, rural India
will likely soon outnumber urban India online for a more real representation of the country. During demonetisation rural
people faced many hardships during the currency crunch and had a crash course on the benefits of digital services.
National Conference on Global Research for Sustainable Development: Recent Trends, Challenges and Approaches
Volume: 23 | Nov-Dec 2019 | ISSN : 2277-4858
Peer Reviewed National Level Interdisciplinary Journal Page No. - 6
VI. CONCLUSION
Rural India is expected to constitute nearly half of all Indian internet users by 2020. Digitisation can facilitate some of the key
needs of rural India including e-governance services, banking and financial services, educational and healthcare services,
mobile recharge, e-ticketing services, online shopping, etc.Digital connectivity is a basic amenity today. Digital India aims to
expand the digital infrastructure to connect the entire country and provide a digital platform for banking, governance,
healthcare and educational services. Digital literacy should provide knowledge to secure their online data. Massive awareness
has to be created particularly in rural areas.
REFERENCES
Ambika Bhatia & Chhavi Kiran (2015), ‘Rural Development through E-Governance Initiatives in India’, IOSR Journal of
Business and Management (IOSR-JBM) e-ISSN: 2278-487X, p-ISSN: 2319–7668
Dr. Priyadarshinipadhi (2017), ‘Digital India: Issues & Challenges’, International Journal of Research in IT and Management
(IJRIM) Vol. 7, Issue 5, May - 2017, pp.44~49 ISSN(o): 2231-4334 | ISSN(p): 2349-6517( Available online at:
http://euroasiapub.org)
Dr. K.Priyadarsini & Dr. N. Vijayaratnam, (2016),’ Digitalisation of India: Smart Villages towards Smart India’, International
Journal of Innovative Research in Information Security (IJIRIS) ISSN: 2349-7009(P),Issue 09, Volume 3,(ISSN: 2349-7017(O), (
www.ijiris.com )
Gupta and Arora,(2015), ,’Digital India: A roadmap for the development of rural India’, International Journal Of Business
Management,(ISSN NO. 2349-3402) Volume No. 2(2),1339 (www.ijbm.co.in)
Moseley, Malcolm J. (2003), Rural development : Principles and Practice (1. publ. ed.). London, SAGE. p. 5.
(ISBN 0-7619-4766-3)
Mrinalini Kaul & Purvi Mathur (2017),’ Impact of Digitalisation on the Indian Economy & Requirement of Financial Literacy’,
International Journal of Management and Applied Science, ISSN: 2394-7926 Volume-3, Issue-4, (http://iraj.in)
Tukesh Kumar, Shwati Prdhi & Abhay Bisen (2016),’Role of Digital India in Rural Areas’, International Seminar On
Non-Conventional Energy Sources for Sustainable Development of Rural Areas, IJAERD- International Journal of Advance
Engineering & Research Development e-ISSN: 2348-4470, p-ISSN:2348-6406
Ward, Neil; Brown, David L. (2009), "Placing the Rural in Regional Development". Regional Studies.43 (10): 1237–1244.
doi:10.1080/00343400903234696.
Westport, Conn (1996), Rural development research : a foundation for policy, Greenwood Press (ISBN 0-313-29726-6)
Van Assche, Kristof. & Hornidge, Anna-Katharina,(2015) Rural development. Knowledge & Expertise in
Governance,(Wageningen Academic Publishers, Wageningen)
AUTHOR’S BIOGRAPHY
1. Prasanna B Joshi, Assistant Professor & Head, Dept. of studies in Economics, Rani Parvati Devi College of Arts &
Commerce, Belagavi.
Email: [email protected]
2. Dr. Abhay M. Patil, Assistant Professor & Head, Department of Studies in Geogrpahy, Rani Parvati Devi College,
Belagavi.
Email: [email protected]

National Conference on Global Research for Sustainable Development: Recent Trends, Challenges and Approaches
Volume: 23 | Nov-Dec 2019 | ISSN : 2277-4858
Peer Reviewed National Level Interdisciplinary Journal Page No. - 7
Abstract: The term ‘Industrialization’ is used to designate the growth of manufacturing industry. The process entails the movement of
factors from primary activities to secondary activities with accompanied socio-economic changes. In border sense however, it is a wide
process, a process of ‘deepening’ and ‘widening’ of capital. It is the key to economic development and makes the best possible use of our
human and physical resources.
Rajasthan, at the time of Independence, had a poor status with respect to development of Industries. Until 1960, it had no place on the
industrial map of India. However, several strategies were planned to increase investment in public sector units and channelize private
investment towards them in different districts, which gradually led to development of industries in the state. Since development of
industries had a vast potentiality of providing substantial employment to people and generating income, thus eventually improving the
standard of living and overall well being of people, Rajasthan has always given emphasis on industrial development. Rajasthan’s
investor friendly policies, peaceful environment, hospitable people, vast and unexplored natural resources, has made Rajasthan
especially Jodhpur district as one of the preferred destination for the national and international investors.This study aims to investigate
the physical and socio economic set up of the district, the industrial development in the district over the years and its impact.
Keywords: Industrialization, Socio-economic Changes, Environment.
I. INTRODUCTION
The term ‘Industrialization’ is used to designate the growth of manufacturing industry. The process entails the
movement of factors from primary activities to secondary activities with accompanied socio-economic changes. In border
sense however, it is a wide process, a process of ‘deepening’ and ‘widening’ of capital. According to Prof. Paul M. Seweezy,
“Industrialization is simply the establishment of new industries”. Kulwinder Kaur views industrialization as the basic
transformation of society that touches upon behaviour patterns, value system, structure of social grouping and economic
arrangements. The industrialization process has been defined by the League of Nations as “Utilisation of power, machine,
latest techniques, organisational methods and capital investment on large scale, including divisibility of labour and developed
monetary system of goods and commodities”. Under Colonial rule, India, like most other developing countries, followed a
non-industrial model. But many Indian leaders believed that progress of the nation was retarded by this. They felt that true
economic progress lay in industrialization. India’s first Primer, Jawaharlal Nehru (1947 to 1964), saw industrialisation as the
key to poverty alleviation. It not only promised self-sufficiency for the nation that had just regained political sovereignty, but
also offered external economies accruing from technical progress. Since the potential of agriculture and exports was limited,
Indian government taxed agriculture by skewing the terms of trade against it and emphasised on import substitution. During
the Second five year plan, the priority of the Indian economy was shifted to heavy industries. In order to pursue consistent
industrial growth, various measures were proposed by the Planning commission during different five year plans. This included
enactment of various acts like the Industries (Development and regulation) Act (IRDA).
Today, Industrialisation is considered to be a prime modus operandi to stimulate the overall growth of the Rajasthan
state. In terms of production value, the textile industry, dominates the large and medium categories of industries. This is
followed by industries catering to agro based, food and allied products; cement and cement products: chemical gases lubricants
Economic Impact of Industrialization: A Case Study of Jodhpur District of Rajasthan
Yudhister Sharma

National Conference on Global Research for Sustainable Development: Recent Trends, Challenges and Approaches
Volume: 23 | Nov-Dec 2019 | ISSN : 2277-4858
Peer Reviewed National Level Interdisciplinary Journal Page No. - 8
and plastic; heavy machinery; metal allied products; automobile industries; electrical and electronics related products, minerals
stones and lime industry; drugs and pharmaceuticals; ceramics and glass wares and leather and footwear.
The state at present has deposits of 81 different types of minerals. Out of these, 57 minerals are being currently mined.
Rajasthan is the sole producer of lead and zinc ores and concentrate, Selenite and Wollastonite. Almost entire production of
Silver, Calcite and Gypsum in the country comes from Rajasthan. Rajasthan is also the leading Producer of Ball Clay,
Phosphorite, Ochre, Steatite, Felspar and Fire Clay in the Country. It also has prominent position in the Country in the
production of dimensional and decorative stones, such as Marble, Sandstone, and Granite etc. The State is leading Producer of
Cement Grade & Steel Grade Limestone in India. At present Mining leases are being granting by auction process.
II. OBJECTIVES
The objective of this paper is to review the development of Industries in the jodhpur district and its socio- economic impact, the
level of industrial development over the years.
III. STUDY AREA
Jodhpur, one of the largest district of Rajasthan state is centrally situated in Western region of the State, having
geographical area of 22850 sq. Kms. It has population of 28.81 Lacs as per 2001 census. The district stretches between 2600’
and 27037’ at north Latitude and between 72 55’ and 73 52’ at East Longitude. This district is situated at the height between
250-300 meters above sea level.
This district comes under Arid zone of the Rajasthan state. It covers 11.60% of total area of arid zone of the state. Some of
the area of Great Indian Desert THAR also comes with in the district. Extreme of heat in summer and cold in winter is the
characteristic of the desert. Jodhpur is no exception. The temperature varies from 49 degree in summer to 1 degree in winter.
The Sandstorm (andhi) spectacle for people from other region of India.
Jodhpur district is centrally located in western part of the State. It is divisional headquarter of western districts of the State,
i.e., Pali, Jodhpur, Sirohii, Barmer, Jalore and Jaisalmer. It streches between 26°37' north latitudes and 72° 55' to 73°52' east
longitudes. It is bounded by Bikaner and Jaisalmer districts in the north, Barmer and Pali districts in south, Pali Nagaur districts
in east and Jaisalmer district in the west. Jodhpur district is in the arid zone of the State and it covers 11.6% of the total arid
zone of the State. The area of the district is 22,850 sq.kms. which is 6.59% of the total area of the State.
IV. INDUSTRIAL AREAS OF JODHPUR DISTRICT
S.No Name of Industrial Areas Planned area 1 Basni-I 76.55 Acre 2 Basni – II 545.11 Acre 3 Boranada – I 52.72 Acre 4 Boranada – II 77.03 Acre 5 Boranada – III 102.55 Acre 6 Boranada – IV 208.43 Acre 7 Mini Growth Centre (Sangariya - I & II) 583.5 Acre 8 Mandore 133.74 Acre 9 B.K.K 2.95 Acre 10 Phalodi 72.98 Acre 11 Khichan 17.78 Acre 12 Mathania 30.32 Acre 13 E.P.I.P. 113.41 Acre 14 S.E.Z.(Notified B.I.P.) 109.37 Acre 15 Food Park 155.16 Acre 16 Stone Park 29.03 Acre 17 Pal Shilp Gram 22.04 Acre 18 New Jodhpur 19.94 Acre 19 Electrical Basni –I 1.67 Acre 20 Electronix Complex 1.45 Acre 21 Trans. Ind. Area 270.19 Acre 22 Cyber Park 3.90 Acre 23 Bap 47.71 Acre
Details of Industrial Area in Jodhpur District as on 31.03.2016 (Source RICCO)

National Conference on Global Research for Sustainable Development: Recent Trends, Challenges and Approaches
Volume: 23 | Nov-Dec 2019 | ISSN : 2277-4858
Peer Reviewed National Level Interdisciplinary Journal Page No. - 9
V. IMPACT OF INDUSTRIAL DEVELOPMENT
The rapid increase in the number of industries has lead to
Increase in the per capita income of the people,
Growth in International trade from the District
High level of investment.
Generation of employment.
Meets the requirements of people.
Growth of Infra structure like the development of modern industries i.e. banking, insurance, commerce, shipping, air
services etc.
Growth of science and technology
Thus the district economy is based on industrialization to a large extent.
VI. CONCLUSION
The industrial sector in Rajasthan contributed 29.09% of the Gross Value Added at Constant Price (2011-12) and
26.89 at current price in 2016-17.It has been reported as the second fastest growing sector during the period 2004-05 to
2015-16. Consequently the yearly Expenditure in this sector increased many fold from 247.49cr to 171.82cr between 2013-14
and 2017-18.
Currently various institutions are playing a prominent role in the Industrialisation process like commissionerate of Industries
department, Micro, Small and Medium Enterprises (MSME), Rural Non Farm Development Agency (RUDA), Bureau of
Investment Promotion (BIP), Rajasthan State Industrial Development and Investment Corporation (RIICO), Rajasthan Small
Industries Corporation Limited (RAJSICO), Rajasthan Financial Corporation (RFC) and Khadi and Village Industries (KVI).
Among the above institutions, Commissionerate of Industries is the nodal department with the prime motive to promote the
development of industries and handicrafts in the state and providing necessary guidance, assistance and facilities for industrial
activities. Today, 36 District Industrial Centres and 8 sub centres are working in the state for providing inputs and other
facilities to the entrepreneurs.
Thus, it is necessary to strengthen this industry through sustainability policies and practices that ensure greater
economic and social benefits and fewer negative impacts on the environment of the region as a whole. Addressing the matter of
sustainability requires the action and the mutual commitment of public and private actors, as well as the integration of
measures at the regional level so as to obtain the best results.
REFERENCES
Adebayo, M.A. Department of Estate Management, Federal University of Technology (2011); “Neigbourhood Effects of
Sustainable Industrial Land Use on Property Values: Case Study of Agbara, Ogun State, Nigeria”; “Journal of Sustainable
Development Vol. 4, No. 6;” pp. 230-238.
Dr. Aliya Z. Isiksal Odoh John Chimezie (2016);”Impact of Industrialization in Nigeria”; “European Scientific Journal April
vol.12”; pp.328-339.
Government of Rajasthan (2013-14); “Annual Survey of Industries Rajasthan.
Government of Rajasthan (2013); “Basic Statistics Report”.
Government of Rajasthan (2108-19); “Budget”;
National Conference on Global Research for Sustainable Development: Recent Trends, Challenges and Approaches
Volume: 23 | Nov-Dec 2019 | ISSN : 2277-4858
Peer Reviewed National Level Interdisciplinary Journal Page No. - 10
Government of Rajasthan (2017-18); “Economic Review”.
Government of Rajasthan (2012-13 to 2016-17); “Index on Industrial Production (IIP)”.
Government of Rajasthan (2010-11) “Socio-economic Statistics”.
J. Gutberlet, Department of Geography, University of Victoria, Canada; “The Impacts of Industrial Development in Brazil.”
Jan Mertl, Radim Valenčík; “The Socioeconomic consequences of industrial development.”
Jana Hambrock and Sebastian Hauptmann; “Industrialisation in India”.
Khurshid AIi Quraishi, Buland Akhtar, Ch. Muhammad Aslam, Malik Ikram AIi & Asghar AIi Khan (1994); “Socioeconomic
Effect of Industrialization on the surrounding rural areas with special reference to agriculture: a case study of Islamahad
district”; “Pak. J. Agri. Sci., Vol. 31, No. 3”.
Lionel Effiom and Enang Bassey Udah (2014); “Industrialization and Economic Development in A Multicultural Milieu: Lessons
for Nigeria”; “British Journal of Economics, Management & Trade”.
Mohammad Amiri and Bharati Chavan (2016); “A Study of socio-economic changes in newly Industrialised areas in Pune
district”; “Indian Journal of Fundamental and Applied Life Sciences; pp.384-390.
“Policy Research for Development (REPOA)”;“Making Industrialization work for socio-economic transformation”.
Sutikno, Muhammad Sri Wahyudi Suliswanto; “The Impact of Industrialization on The Regional Economic Development and
Community Welfare”; “Jurnal Ilmu Ekonomi”; pp.231-246.
United Nations Industrial Development Organisation (2015); “Inclusive and Sustainable Industrial Development Working Paper
Series”.
Walter C Neale (1956); “Social Effects of Industrialization”
Tukesh Kumar, Shwati Prdhi & Abhay Bisen (2016),’Role of Digital India in Rural Areas’, International Seminar On
Non-Conventional Energy Sources for Sustainable Development of Rural Areas, IJAERD- International Journal of Advance
Engineering & Research Development e-ISSN: 2348-4470, p-ISSN:2348-6406
Ward, Neil; Brown, David L. (2009), "Placing the Rural in Regional Development". Regional Studies.43 (10): 1237–1244.
doi:10.1080/00343400903234696.
Westport, Conn (1996), Rural development research : a foundation for policy, Greenwood Press (ISBN 0-313-29726-6)
Van Assche, Kristof. & Hornidge, Anna-Katharina,(2015) Rural development. Knowledge & Expertise in
Governance,(Wageningen Academic Publishers, Wageningen)
AUTHOR’S BIOGRAPHY
Yudhister Sharma, Research Scholar, Raj Rishi Bharthari Matsya University, Geography Department, Alwar, Rajasthan E-mail address: [email protected]

National Conference on Global Research for Sustainable Development: Recent Trends, Challenges and Approaches
Volume: 23 | Nov-Dec 2019 | ISSN : 2277-4858
Peer Reviewed National Level Interdisciplinary Journal Page No. - 11
Abstract: Rainfall in Maharashtra differs from region to region. Thane, Raigad, Ratnagiri and Sindhudurg district receive heavy rains
of an average of 200 cm. annually. But the district of Nashik, Pune, Ahmednagar, Dhule, Jalgaon,Satara,Sangli,Solapur and part of
Kolhapur less than 50cm. Rainfall is the ultimate source of water but sometimes it caused worst situation. In this year monsoon was
received heavy rain in the western part of Maharashtra. The floods in Western Maharashtra, falling torrential rains and sudden release
of water from dam on the Krishna River claimed over 50 lives, displaced half a million people and destroyed hundreds of villages in
Sangli, Satara and Kolhapur districts in the western part of the state. In month of August, Satara and Kolhapur received the highest
rainfall in last 25 years and precipitation was the highest in Sangli since 2006, according to the Indian Metrological Department data.
Although flooding inevitable due to extreme rainfall, there was lack of coordination between authorities in Maharashtra and Karnataka
for simultaneous release of water from Almatti dam on the Krishna, magnified the tragedy. Almost is the first dam on the Krishna as the
river leaves Maharashtra and enters in the Karnataka. The Krishna river basin is the fourth largest in India and the 1400 km long river
runs through Maharashtra, Karnataka, Telangana and Andhra Pradesh before draining into the Bay of Bengal. Due to delay in
discharge from Almatti water kept coming back to upstream Krishna, which leads to floods in Maharashtra village.
I. STUDY AREA
The Krishna River is the fourth –biggest river in terms of water inflows and river area in India, after the Ganga,
Godavari, and Brahmaputra. The river is almost 1,400 km (870ml) long. The River is also called as ‘Krishnaveri’.It is one of
the major source of irrigation for Maharashtra, Karnataka, Telangana and Andhra Pradesh. The Krishna river rises in the
western Ghats at an elevation of about 1,337m( 4,386ft) just north of Mahabaleshwar, about 64km(40ml ) from the Arabian
Sea. IT flows for about 1,400km and outfalls into the Bay of Bengal. The principal tributaries joining Krishna are the
Ghataqprabha River, Malaprabha River, Bhīma River, Tungabhadra River and Musi River. Most of this basin comprises
rolling and inducting country, except for the Western border, which is formed by an unbroken line of the Western Ghats. The
important soil types found in the basin are black soil, red soil, laterite soil, alluvium, mixed soils red and black soils and saline
and alkaline soils.
II. OBJECTIVES OF STUDY
The objectives of my study area are:
1) To study the Geographical setup of the Krishna Basin
2) To study the Rainfall pattern and flood in Maharashtra.
3) To assess the rainfall and flood in Sangli and Kolhapur in the year of 2019.
4) To explore the causing factors of flood
4) To assess the socio-economic impact of flood on the people alongside all rivers of Sangli and Kolhapur
5) To explore the major problems of people in the study area.
5) To suggest a remedial measures to improve the socio-economic status of village people through water management.
Rainfall in Maharashtra and Its Socio-Economic Impact on People: A Case Study of Krishna
Basin Flood August 2019 Asha R. Kadam
National Conference on Global Research for Sustainable Development: Recent Trends, Challenges and Approaches
Volume: 23 | Nov-Dec 2019 | ISSN : 2277-4858
Peer Reviewed National Level Interdisciplinary Journal Page No. - 12
III. METHODOLOGY
The present study is entirely based on the data collected from secondary sources.
Collection of data: Secondary data was collected through District Census Hand Book, Sandarbha Maharashtra, Published and
unpublished materials from District socio economic review; District of Satara, Sangli and Kolhapur. Besides data also
collected from reference Books, Journals, Article from the News papers and Internet.
Data analysis: Data has been purely analyzed and studied by using secondary data which has been collected from different
sources.
IV. RAINFALL PATTERN IN MAHARASHTRA
It is well known that the rainfall of the same region varies from one year to another. In any two years the departures of
rainfall from the long term mean in the same region are not the same either in actual value of even percentage wise. A
quantitative measure of this variability is the coefficient of variation. The coastal strip of Konkan and the windward side of
Western Ghats receive an annual rainfall of over 200-250cm, where the annual variability ranges from 20-25%. To the leeward
side of the Ghats, rainfall rapidly decreases to 60cm over the Western part of Madhya Maharashtra. A sizable portion East
Madhya Maharashtra receive scanty annual rainfall of less than 60 cm. Parts of the district of Dhule and Nashik in the north
and Pune, Satara ,Solapur in the south receive even less than 50cm. In this generally scanty rain belt the co-efficient of
variation of the rainfall exceed 30%.Western parts of Maharashtra sub division receive 60-75cm. Annual rainfall then
progressively increase to 100cm with the variability touching 30% over part of Akola and Amravati districts.
The state reveals great contrasts in rainfall varying continuously from 600cm over Western Ghats to lee than 50 cm in Phaltan
areas of Madhya Maharashtra. From the windward to the leeward of the Western Ghats, the gradient of the rainfall is very
steep, the value falls 600cm over the crest to about less than 50 cm over a broad region less than 100km to the east.
V. RAINFALL IN KRISHNA BASIN
Krishna basin receives 85% of its annual rainfall during south-west monsoon. The rainfall, unevenly distributed
varies temporary and spatially across the basin. Upper reaches of Krishna basin lie in the 25kmwide crest zone of western
Ghats which is the belt of heavies’ rainfall region. Annual rainfall varies from 1000 to 3000mm in this reach. River further
entries in the region falling in the rain shadow area of Western Ghat which receives less than 600mm annual rainfall. Rainfall
gradually increases to about average annual rainfall in the basin is 1096.92mm.
There has been above normal rainfall in Upper Krishna basin in Maharashtra, which mainly includes district of Kolhapur,
Sangli and Satara. In these three districts, the rainfall as per IMDs figures has been 2068.5 mm which is 70% above normal,
480.7 mm which is 60% above normal and 1028.1 mm which has been 78% above normal.
This district has received rainfall much above rainfall during August 1-8, with rainfall of 716.6, 177.6 and 363.6 mm
respectively. The rainfall was being about 400% above normal in this first week of August.
Causes of flood in Krishna Basin:
1) Excessive Rainfall: The Bartiya Janta Party- Shiv Sena led Maharashtra Government believes that excessive rains
triggered the floods. In 2005, Sangli experienced 200% rain in 31 days. In 2019, 750% of rainfall occurred in nine
days alone. In Kolhapur, 31 days of 2005 recorded 160% rainfall while in 2019 Kolhapur saw 180% rainfall in nine
days.
National Conference on Global Research for Sustainable Development: Recent Trends, Challenges and Approaches
Volume: 23 | Nov-Dec 2019 | ISSN : 2277-4858
Peer Reviewed National Level Interdisciplinary Journal Page No. - 13
The rainfall all over was unprecedented. The combined effect of the Krishna, Konya and Panchganga rivers caused
the caused current flood situation. Maharashtra Chief Minister Devenra Fadnavis said at a press conference after a
tour of Sangli.
2) Arabian Sea Branch Monsoon hit: Scientist say that the Arabian Sea branch in the beginning of August. The Bay
of Bengal branch, on the other hand was weak. The Arabian Sea and Bay of Bengal are home to two branches of
monsoon winds which, when they encounter land, given rain to India.
3) Massive Construction in the prohibited zone: According to the Environmentalists, massive construction in the
prohibited zones of the floodplain of the river Panchganga as the prime reason for the floods devastation.
Pune –based environmental activist Sarang Yadwadkar said “There has been massive construction alongside all rivers
in Sangli and Kolhapur.
4) Encroachment on riverbeds: Encroachment on riverbeds has reduced their carrying capacity of flood waters over
the years. Therefore after heavy rainfall, swollen rivers ruptured their banks and flood water gushed through houses
built on the floodplains leading devastation.
Floodplains, the flat land along the river, provide the space for rivers to spread their waters, when this space is
encroached upon; river ecology (such as its capacity to hold extra water changes) is drastically impacted.
5) Deforestation and Mining: Deforestation and mining make the area more vulnerable to floods said environmentalist
Vikrant Tongad
6) Lacks of regulations: Lacks of regulations with regards to the protection of river floodplains, expert said.
7) Sudden Discharge: Besides, experts associated with South Asia Network on Dams, Rivers and People (SANDRP)
said that sudden discharge by many dams in the upper Krishna basin with no coordination with Almatti dam in lower
Krishna basin added to the flood fury in Maharashtra and Karnataka both.
VI. EFFECT OF FLOOD IN KRISHNA BASIN
1. Effect on Human Life: Human life got hit very hard due to floods and was the most badly affected category. Arey and
Kothi are among the 600 villages in Sangli, Kolhapur and Satara districts of Maharashtra which were battered by the
decade’s worst monsoon. Over 50 people lost their lives and more than 10,000 families lost their houses. Around 3813
houses got affected due to floods and 89 houses got completely damaged. Due to floods around 2 lakh people were
living without electricity for more than four days.
2. Effect on Agriculture: The heavy rainfall had a very drastic and negative impact on the agricultural sector in these
three districts. As a result of flooding many agricultural fields got submerged in water and crops like sugarcane, paddy
and banana got destroyed on which most of the farmers are dependent for their livelihood as their primary occupation is
agriculture. Approx. 67,000 hectares of agricultural area got damaged due to floods.
3. Effect on Livestock: Large number of livestock was lost due to excessive floods. A farmer in Sukhwadi village, Palus
Tehsil of Sangli district, lost 16 cattle in the flood as his cattle yard was very close to Krishna River. Around 170 dairy
cows and buffalo have died due to floods in different villages. Thousands of cows and buffalos have been standing in
the rains, without roofs on yards. This will damage the quality of their milk and also reduce milk output. Many cows and
buffalo suffered from diseases like dermatitis, respiratory disorders, joint dislocations, diarrhea, indigestion etc.
4. Effect on Dairy Business: Almost 12 days after the floods hit the three districts, Kolhapur, Sangli and Satara, the dairy
industry has come to a standstill. Farmers in these three districts collect about 10 lakh liter milk per day. For almost
eight days they could not collect a single liter of milk which means a total of almost 80 lakh liters. This has caused huge
amount of financial loss to dairy farmers. There are thousands of farmers who are facing a loss of almost Rs 5,000 on
cattle yard in a single day.
National Conference on Global Research for Sustainable Development: Recent Trends, Challenges and Approaches
Volume: 23 | Nov-Dec 2019 | ISSN : 2277-4858
Peer Reviewed National Level Interdisciplinary Journal Page No. - 14
5. Effect on Tourism Sector: The heavy downpour and the recent floods in the Kolhapur district had taken a toll on local
tourism. Popular destinations like Panhala, Jyotiba and Amboli Ghats were inaccessible because of the bad road
conditions even as the public works department tried to restore them. People avoided Kolhapur because of the fear of
floods. Panhala residents are the worst affected as the only road to the historic fort is closed. Tourism, the main source
of income for the local residents which has been badly affected. The number of devotees and tourists had reduced
drastically as they were not visiting Mahalaxmi Temple and Panhala anymore. Roads going to Amboli Ghat were
washed away and many caved in due to excessive rain fall and resulted flooding.
6. Effect on Roads: Heavy flooding in Kolhapur, Sangli and Satara districts has destroyed a total of 484km of road length
an estimated damage of Rs 186 crore. Around73 roads of the Public Works Department (PWD), totaling 484 have been
washed away. Around 84 important roads were washed away in these three districts.
VII. RELIEF AND REHAB WORK IN THE FLOOD HIT AREAS OF MAHARASHTRA
1) The state and private groups have rushed in large quantities of medicines to prevent outbreak of water-borne diseases.
The supply of chlorine tablets to purify drinking water, DDT and bleaching powders for cleaning of houses and
neighborhood has been stepped up.
2) Nearly 475,000 people were shifted to 596 temporary camps after these worst floods.
3) The supply of power has been restored in stages to 136,303 consumers and 34,179 farmers and efforts were made to
revive power to the rest.
4) Around 105 teams of army, air force, NDRF, SDRF, district, municipal and local bodies with 164 boats were engaged
in rescue operation.
5) The Brihan Mumbai Municipal Corporation (BMC) has been set team of Doctors, cleaners, sweepers and pest control
experts to help sanitize the flood-hit areas for the local to return home safely.
6) Hundreds of trucks and tempos were laden with good, bound for different parts of state and outside, which were
stranded for nearly 12 days, have started moving towards their destinations as the waters started receding the highways
were declared safe.
7) The students of DY Patil College in Pune have collected the sanitary pads and supply to the flood affected areas to
ensure that women’s and girls’ will not have to suffer in any manners.
VIII. PREVENTIVE MEASURES TO REDUCE THE DESTRUCTIVE EFFECTS OF FLOODS
1. Preventing illegal construction in the river bed
2. Imposing strict rules and regulations regarding watershed management
3. Regular discharge of water during monsoon in a gradual and slow process to prevent further flood like situation
4. Paying attention to weather warnings notified by the meteorological department regarding excessive rainfall in the
region
5. Increase the height of the dam and thus making it capable of holding large volume of water during heavy rainfall
6. Rehabilitating the families which have been illegally encroaching on the river bed
7. Preventing mining activities along and near the river bed
8. Building of river embankments along-side the flood prone river area
9. Increasing the height of the houses which are situated in close proximity of the river
10. Installing flood warning systems in the villages around the river to prevent damage to human and animal life
National Conference on Global Research for Sustainable Development: Recent Trends, Challenges and Approaches
Volume: 23 | Nov-Dec 2019 | ISSN : 2277-4858
Peer Reviewed National Level Interdisciplinary Journal Page No. - 15
REFERENCES
Jaymala Diddee and S.R.Jog, (2002) Geography of Maharashtra, Published by Prem Rawat publication, Jaipur.
P.K Das (1968) The Monsoons, Published by the Director, National Book Trust, India New Delhi.
https:// India mongabay.com, By Kanchan Srivastava (4th Oct 2019) Article on Western Maharashtra floods: A Man –made
Disaster.
South Asia Networking on Dams, Rivers, and People (SANDRP), (August8, 2019), Aug 2019 Krishna Basin Floods in
Maharashtra- Karnataka: How dams harming rather than helping.
Press Trust of India (August9, 2019) Floods hit power, water supply in Sangli, Kolhapur in Maharashtra.
The Times of India (13 August 2019), After Floods, Maharashtra Launches Relief and Rehab Works.
hptt:// mumbaimirror.Indiatimes.com on 13 Aug 2019, Big dams cause for flooding in Kolhapur, Sangli: Report
hptt://wap-business—standard-com.cdn.ampproject.org. (August 21, 2019), what caused the floods in Maharashtra and why are
they significant.
hptt://m-timesofindia-com.cdn.ampproject.org on SEP2, 2019, Goa ICAR assists Kolhapur flood-affected animals.
hptt:// india.mongoboy.com.by Kanchan Srivastava on 18 September` 2019, Dam mismanagement worsens impact of extreme
rainfall in Maharashtra.
AUTHOR’S BIOGRAPHY
Asha R. Kadam, Assistant Professor, Chetana’s H.S.College of Commerce and Economic, Bandra

National Conference on Global Research for Sustainable Development: Recent Trends, Challenges and Approaches
Volume: 23 | Nov-Dec 2019 | ISSN : 2277-4858
Peer Reviewed National Level Interdisciplinary Journal Page No. - 16
Abstract: Meteorologically Kerala is the land of tropical monsoon climate and is experiencing four distinct climatic seasons. This south
west coastal state of India experiences Hot season in March to the end of May, Southwest monsoon season from June first to the
beginning of October, North east Monsoon season from October to December and Winter Season in the months of January and
February.
I. INTRODUCTION
Compared to other states of India extreme humid conditions prevailed here due to the nearness to the equatorial
location, proximity of Arabian Sea coast, presence of thick vegetal covered western ghat, coastal agrarian lands and windward
location. Due to these geographical advantages the average relative humidity of Kerala during monsoon period ie, June, July
August and September months reaches about 85%, whereas during January to March it reduces between 60 %and 71% in the
interior and coastal areas. The state experience between 28°C and 33°C mean maximum temperature in the month of July
rainy season. The total annual rainfall in the State varies from 360 cm. over the extreme northern parts to about 180 cm. in the
southern parts.
REGION OF STUDY
In the case of rainfall distribution the southern part of Kerala receives about 180 cm amount of annual rainfall, whereas the
northern districts receives about 360 cm rainfall. During April and may months of hot summer season Kerala receives
convectional type of rainfall . The South West Monsoon in Kerala starts in the month of May end or June First week in
Malayalam this season is called as EDAVAPAATHI- which means in the middle of the Malayalam Month Edavam. As
most of the parts of Kerala lies in the windward side of the Ecologically significant Western Ghat and receive heavy rainfall
during this season. Nearly 85% of the total rainfall receives during this season. Whereas the northeast monsoon season –
October- November Months in Kerala is known as THULAVARSHAM - Thulam is the month of Malayalam. During this
periods Kerala receives convectional type of rainfall or 4 ‘O’ clock rainfall accompanied by lightening and thunderstorms.
II. HISTORICAL BACKGROUND
During the year 2018 the onset of south west monsoon started on May 29th , three days ahead of its normal date of
June 1st 2018 and the advancement of monsoon started accordingly ahead of schedule and contrary to previous years by June
29th itself the southwest monsoon covered the entire country two weeks earlier than the normal date of July 15, 2018. In
previous years, by June 26th 2015 and June 16th 2013 itself South west Monsoon covered the entire country by its rapid
advance. However in 2018 greater variability in rainfall with in season was noticed.
The actual rainfall received in Kerala during southwest monsoon season (June 1 to September 30, 2018) was 2,515.7
mm as against the normal rainfall of 2,039.7 mm showing (+)23 per cent departure from normal. Out of the 14 Districts, seven
Districts received normal rainfall and the other seven Districts received excess rainfall. The highest rainfall of 3,794 mm was
The Geographical Reasons of the Recent Floods in Kerala and its Impact on Human Life
Dr. V. Sanalkumar1, Dr.Rajaram B.Patil
2

National Conference on Global Research for Sustainable Development: Recent Trends, Challenges and Approaches
Volume: 23 | Nov-Dec 2019 | ISSN : 2277-4858
Peer Reviewed National Level Interdisciplinary Journal Page No. - 17
recorded in Idukki District showing (+)67 per cent departure from the normal, were the lowest rainfall of 1,023.7 mm was
recorded in Thiruvananthapuram District showing departure of (+)17 per cent from the normal.
In August 2018 the State of Kerala experienced heavy rainfall and worst floods in the last one century. Over 31,000
crore damage has been estimated , 453 persons died, all the rivers and reservoirs were overflowed. Shutters of the Main dams
opened, large scale landslides and mud flows destroyed human life and properties, Cochin international air ports closed, low
lying and coastal areas became under water, residential buildings , private vehicles, streets and roads were flooded with
water. Till August 21st Kerala received 53% above normal rainfall during the southwest monsoon season. It is to be noted that
before August 8th 2018 itself six out of seven major dams were almost 90 % filled. The electricity board has not released the
water by ignoring the alarms of the Meteorological Department . The electricity Board had not been able to anticipate the
further torrential rainfall after August 10, 2018 till the completion of the south west and northwest monsoon season. Contrary
to expectation after 14th August 2018 three days sudden extreme rainfall in the catchment area of western ghats of kerala and
aggravated the situation, Idukki, Malampuzha, Bhanasurasagar, Kakki, Periyar, Pamba, Achankovilaretc dams and reservoirs
were filled with full capacity. The major dam shutters were opened, all the rivers, catchment areas and low lying areas were
flooded with discharged and torrential rainfall water. This was one of the main reason of severe floods in the districts of
Pathanamthitta, Alappuzha Kuttanad belt, Kottayam, Idukki, Ernakulam, Thrissur, Malappuram, Kozhikodu and Wayanad
districts.
Rivers are overflowing and many low-lying areas have been inundated. In most parts of the state, heavy rains and road
blockades are hampered rescue operations; and in many regions in the northern districts of Wayanad, Palakkad, Malappuram
and Kannur, vehicles and buildings remain half buried in flood waters.
It is to be noted that eight districts in the state witnessed 80 landslides in three days of heavy rainfall of August 2018 Rainfall.
Most of the deaths were caused by landslides in Idukki, Palakkad, Wayanad ,Malappuram and Thrissur Districts and people
were buried inside the landslide muds.
Compared with the last 100 years of history of monsoon rainfall of Kerala since 1924 great flood, in 2018 this coastal
state witnessed more worst situation. Over 523 people were died or missing, over 10 lakh people were affected, On august 16
all the 14 districts were declared red alerts and the Government of India declared the flood as a calamity of a severe nature.
Before august 8th itself due to heavy rainfall almost all the reservoirs of Kerala were filled and contrary to expectation not
released the water fearing in shortage of South east rainfall in September October months. If dams are filled can able to
generate more hydro electricity was the priority given by State irrigation Department till August 14th2018 . Meanwhile on
August 16th 2018 unexpected heavy rain lashed out through out Kerala with great flood and its fury continued three more days.
Almost all the natural reservoirs and 44 Dams were filled, out of which the shutters of the 33 dams were opened in a single day.
Besides Idukkki and Malampuzha dams also opened and the coastal districts of central Kerala became worst affected.
Chengannur, Pandanad, Edanad, Aranmula, Kozhencherry, Ayiroor, Ranni, Pandalam, Kuttanad, Malappuram, Aluva, Chala
kudy, Thrissur, Thiruvalla, Eraviperoor, Vallamkulam, North Paravur, Chellanam, Vypin Island and Palakkad were worst
affected. Red alert was given to all 14 districts.
Current Condition-2019:
In 2019 also due to heavy rain 80 landslides in two days ,121 people killed , and another 23 were missing under the
mud in the districts of Palakkad, Malappuram and wayanad due to monsoon fury.
The nature and rhythms of rain fall have changed in the last two years. Throughout Kerala widespread and frequent
landslides happened in the western ghat caused death.
The absence of a scientific flood and disaster management system have aggravated the situation and failed to prevent the loss
of human lives and property. The human encroachments on the river banks, sea coasts, forests and ecologically sensitive hilly

National Conference on Global Research for Sustainable Development: Recent Trends, Challenges and Approaches
Volume: 23 | Nov-Dec 2019 | ISSN : 2277-4858
Peer Reviewed National Level Interdisciplinary Journal Page No. - 18
areas are creating greater threats in future also. Over 3,000 houses have already been damaged partially and fully due to flood
impact.
Monsoon 2018:
Compared with the previous years Kerala received excess rainfall with a departure of (+)37 per cent from the normal between
March 1st and May 31st during hot summer pre-monsoon season was the one of the prime reason of causing flood during South
west Monsoon season.
During this period 379.9 mm was the normal rainfall, however the state received 521.8 mm. Out of the 14 Districts of Kerala
, 10 Districts received excess rainfall . Kozhikode (93 per cent) followed by Palakkad (69 %) Malappuram (65 per cent),
Wayanad (64 %) and Kasaragod (61 %) Districts recorded highest percentage departure from normal. It is interest to notice
that the southern most capital district Thiruvananthapuram recorded negative departure of (-)1 and one of the worst flood
affected district Alappuzha recorded negative departure of 5 per cent respectively from the normal.
However in 2018 the winter rainfall between January 1st and February 28th , 2018 Kerala recoded deficient amount of
rainfall with a departure of (-)30 per cent from the normal.
Most noticeable feature of rainfall distribution in August, 2018 was the large spatial variability with excess
rainfall recording 196 percent of the LPA. During the northeast monsoon season 2018 (October 1 to December 31, 2018) the
State received 465.5 mm of rainfall. This was (-)3 per cent from the normal rain fall of 480.7mm. Seven Districts in Kerala
received normal rainfall during this season. Kollam, Thrissur, Palakkad and Kasaragod recorded deficient rainfall. Percentage
departure from the normal was highest in Kottayam District (+) 49 per cent, which recorded excess rainfall .
Monsoon 2012:
The Pre monsoon rainfall received in the state from 1st March 2012 to 31st May 2012 was normal with a
departure of -19 percent from the normal.
The actual rainfall received in Kerala during the South West Monsoon season (1st June to 30thSeptember 2012) was 1551.3 mm
as against the normal rainfall of 2039.6 mm which was -24 percent deficient. 2011 -During the previous SW monsoon (2011)
Kerala had received an actual rainfall of 2215.8 mm.During the North East Monsoon season 2012 ( 1st October to
31st December 2012) the state received 310.8 mm of rainfall as against 480.7 mm of normal rainfall which was deficient with
a percentage departure of -35 percent from the normal.
Monsoon 2013:
The pre monsoon rainfall received in the State from 1st March 2013 to 31st May 2013 was normal with a departure
of -42 percent from the normal. The actual rainfall received during the period was 218.9 mm. The actual rainfall received in
Kerala during the South West Monsoon season (1st June to 30th September 2013) was 2570.3 mm as against the normal
rainfall of 2039.6 mm which was 26 percent excess. During the previous SW monsoon (2012) Kerala had received an actual
rainfall of 1551.3 mm which was -24 percent deficient.
Monsoon 2014:
The pre monsoon rainfall which is received in Kerala during March to May was normal this year with a departure of
-4 percent from normal. The actual rainfall in Kerala during pre monsoon season was 364.4mm, Monsoon current advanced
over the Andaman sea two days earlier than its normal date of 20th May. However, it set in over Kerala on 6th June, five days
later than its normal date of 1st June and covered the entire country by 17th July, two days later than its normal date 15th July.

National Conference on Global Research for Sustainable Development: Recent Trends, Challenges and Approaches
Volume: 23 | Nov-Dec 2019 | ISSN : 2277-4858
Peer Reviewed National Level Interdisciplinary Journal Page No. - 19
The actual rainfall received in Kerala during south west monsoon season (1st June to 30th September) was 2163.3mm as against
the normal rainfall of 2039.7mm in 2014 showing +6percent departure from normal. There was an excess on 26 percent in the
south west monsoon rainfall during 2013. During north east monsoon season the actual rainfall received in Kerala was
461.4mm as against the normal rainfall of 464.2mm
Monsoon 2015:
The actual rainfall received in Kerala during southwest monsoon season (1st June to 30th September 2015) was
1514.3 mm as against the normal rainfall of 2039.7 mm in 2015 showing -26 per cent departure from normal During north east
monsoon season the actual rainfall received in Kerala was 610.1 mm as against the normal rainfall of 480.7 mm showing
excess rainfall from normal (+27%).
Monsoon 2016:
The realized rainfall during the South-West monsoon season (June- September 2016) over the country as a whole was
97 per cent of the Long Period Average (LPA) and it was in the normal category (96-104 per cent of LPA. The actual rainfall
received in Kerala during the South-West monsoon (June 1 to September 30, 2016) was 1352.3 mm as against the normal
rainfall of 2039.7 mm in 2016 showing (-)34 percent departure from the normal, which was the highest in the country. All the
deficiency in rains continued during the North-East monsoon season also as the actual rainfall received in Kerala was 185.0
mm against the normal rainfall of 480.7 mm, which was a (-) 62 per cent departure from normal.
Pre - Monsoon Rainfall in Kerala 2016:
The pre-monsoon rainfall received in the State from March 1, 2016 to May 31, 2016 was normal with a departure of (-)18
percent from the normal. The actual rainfall received during the period was 313 mm.
Monsoon 2017:
The actual rainfall received in Kerala during Southwest monsoon (June 1 to September 30, 2017) was 1855.9 mm as
against the normal rainfall of 2039.7 mm in 2017 showing (-)9 percent departure from normal. From October 1 to November
1, the actual rainfall received in Kerala was 236.3 mm against the normal rainfall of 301.9 mm (22 per cent lower than normal).
The pre monsoon rainfall received in the State from March 1, 2017 to May 31, 2017 was normal this year with a
departure of (-)7 percent from the normal. The actual rainfall received during the period was 354.3 mm against the normal
rainfall of 379.9 mm. The southwest monsoon reached parts of southeast Bay of Bengal, south Andaman sea and Nicobar
Islands on May 14, 6 days ahead of its normal date of 20th May and set in Kerala on 30th May 2017. The south west monsoon
covered the entire country by 19th July, 4 days later than its normal date of July 15. The monsoon withdrawal was delayed and
commenced from parts of northwest India on September 27 (with a delay of nearly 3 weeks). It withdrew from some more parts
of northwest India on September 30. As on October 11, the monsoon has withdrawn from most parts of northwest India except
east Uttar Pradesh.
Northeast Monsoon in Kerala, 2017
The rainfall received during North East Monsoon (October 1, 2017 to December 31, 2017) was normal with a departure
of (-)8 percent from the normal. The actual rainfall during the period was 441.8 mm against the normal rainfall of 480.7 mm.

National Conference on Global Research for Sustainable Development: Recent Trends, Challenges and Approaches
Volume: 23 | Nov-Dec 2019 | ISSN : 2277-4858
Peer Reviewed National Level Interdisciplinary Journal Page No. - 20
III. REASONS OF PRESENT CLIMATIC CHANGE AND NATURAL CALAMITIES
It is to be noted that after 2000 AD the summer season was warmer that the previous seasons in the country with the maximum
day temperature expected to rise above 1 degree Celsius,.Latest assessment of sea surface temperature (SST) available from
the National Data Centre of the Pune based Indian Meteorological Department shows remarkable temperature anomalies over
the Arabian sea and Bay of Bengal. Under the influence of the warmer than normal waters of the Indian sea, air temperature
over the country is becoming hotter, more moisture is adding to the atmosphere through the process of precipitation, resulting
heavy rainfall and floods.
Recent years weather conditions shows that summer is becoming hotter. Sea surface temperature anomalies by the
effect of El Nino factors are aggravating the situations, after the El Nino also, the sea surface temperature rising one or two
degree Celsius. It is to be noted that even after the existence of El Nino phenomenon the ocean water and the sources of water
bodies around the world would be still more warm . The average ocean temperature is rising two to five degrees in recent
years. This phenomenon is found in the monsoon dominant Indian Ocean also. Since the Indian ocean is warmer than other
oceans, the increase of its temperature is of more climatic significance than the warming of other oceans. Its impact will be felt
more on the Peninsular India due to the influx of South west Monsoon currents from the Indian Ocean under the influence of
rotation of the earth and coriolis effect, intensively developed Low pressure Tropical Trough region and positioning of the
Inter Tropical Convergence Zone over the North Indian Plain region. This is one reason why the summer is becoming more
scorching.
In recent years the maximum day temperature was 1 degree Celsius to 2 degree Celsius warmer than normal over most part of
the Country. Meteorological data also shows that the El Nino phenomenon has now given way to La Nina which makes the
Eastern Pacific colder than other waters. The elnino, in turn, is the phenomenon by which the equatorial East pacific Ocean
from the International Date Line to the Peru coast gets heated from April to December due to certain atmospheric –
oceanographic dialogue.
Other than the lingering El Nino effect, global warming is another factor effecting an increase in day temperature. Because
of global warming, air temperature anomalies were recorded all over India during the last decade. Meteorologists have
compiled the temperature readings in the winter month of November for the decades to underscore this observation. Such a
studies shows that maximum temperature was above normal over most part of the country.
1. Climate change is realised all over the world and is significantly altering the structure and functioning of many
ecosystems.
2. the planet’s average surface temperature has risen about 1.1 0Celsius since the late 19th century.
3. Increased carbon dioxide and other human-made emissions into the atmosphere by fossil-fuel burning and
deforestation. Most of the warming has occurred in the past 35 years.
4. Anthropogenic greenhouse gas (GHG) emission.
5. Increased atmospheric moisture content.
6. Climate will be warmer than the present climate. The response of this warming climate to precipitation is rather
complex.
7. The shifting of climate patterns between El Nino and La Nina events.
8. While La Nina events promote wetter conditions in many places, as has happened in recent years. These short-term and
regional variations are expected to become more extreme in a warming climate.
9. Sudden Cloud explosion type Heavy Rainfall
National Conference on Global Research for Sustainable Development: Recent Trends, Challenges and Approaches
Volume: 23 | Nov-Dec 2019 | ISSN : 2277-4858
Peer Reviewed National Level Interdisciplinary Journal Page No. - 21
10. Over Atmospheric Population
11. Deforestation at Hilly areas
12. Changing the Flow of Rivers due to sand mining and human encroachments
13. Mismanagement of running water, rainwater and Dams
14. Improper Construction of River, Lagoons and sea coast Banks
15. Construction of Buildings on ecologically sensitive Hilly Areas
16. Unscrupulous Sand and Granite Rock Mining and Quarrying for construction.
17. Dumping of Pollutants thrown in Rivers
18. Concrete Buildings and Tiles.
19. Clustered
IV. CONCLUSION
We cannot always nature alone for such destructions occurring due to human induced rain floods. The shifts in rhythm of
monsoon climate, frequent floods, natural calamities, lose of life and properties raise in ocean and atmospheric temperature
are mainly due to the acts of human by diluting purity of nature.
AUTHOR’S BIOGRAPHY
1. Dr. V. Sanalkumar, Geography Faculty Member, Jayakeralam HSS, Pulluvazhi, Ernakumam District, Kerala State.
2. Dr.Rajaram B.Patil, Head Department of Geography, Arts And Commerce College Phondaghat, Tal :Kankavli,
Dist :Sindhudurg (MS)

National Conference on Global Research for Sustainable Development: Recent Trends, Challenges and Approaches
Volume: 23 | Nov-Dec 2019 | ISSN : 2277-4858
Peer Reviewed National Level Interdisciplinary Journal Page No. - 22
Abstract: In demography we study growth of population, its distribution and characteristics, its religious and linguistic sex structure, sex
ratio, age composition migration, standard of living, its economic structure etc. we also study adaption of various human groups to their
respective environments in different parts of the world. Various aspects of population have been studied since long. The aim of present
paper is study of sex ratio in Ratnagiri district of Maharashtra. The present research paper is based on secondary sources of data. The
secondary data obtained from District census handbook, District Gazetteers, District statistical department, Socio-economic review and
district statistical abstract etc. Collected data is processed and presented in the forms of tabular and graphical methods. According to
revised figures of 2011 census, the total population of Ratnagiri district was 1615069. Out of total population 761121 are males and
853948 are females. Thus, the sex ratio for Ratnagiri district population is 1053 (Census 2011).
Keywords- Sex composition, Sex Ratio, Male, Female.
I. INTRODUCTION
Sex composition is one of the basic demographic characteristics, which is extremely vital for any meaningful
demographic analysis. Changes in sex composition largely reflect the underlying socioeconomic and cultural pattern of a
society in different ways. It is an important social indicator to measure the extent of prevailing equity between males and
females at a given point of time. Since, it influences the marriage and growth rate of population. Sex ratio is an index of
socio-economic conditions, revealing in an area and is useful tool for regional analysis. Sex ratio also influences the volume
and nature of social need and employment and consumption pattern. In India, sex ratio is generally expressed in terms of
number of females per 1000 males.
Sex composition varies both in time and space. Sex composition of the human population is one of the basic
demographic characteristics, which is extremely vital for any meaningful demographic analysis. Changes in sex ratio
composition largely reflect the underlying socio-economic and cultural pattern of a society in different ways. It is an important
social indicator to measure the extent of prevailing equity between males and females at a given point of time. Here, I have
attempt to delineate the sex composition in Ratnagiri district of Maharashtra based on statistical approach.
II. OBJECTIVE
The main objective of the present research paper is to have detailed study the sex composition (1901 to 2011 Census)
in the Ratnagiri district of Maharashtra.
III. DATA BASE AND METHODOLOGY
The data is collected from various sources, which includes both published and unpublished books, government publications
and private publications. Data published by Government and non-government agencies, research organizations, research
studies formed the source of secondary data. Secondary data has been obtained from the District Census Handbook, District
A Study of Sex Composition in Ratnagiri District, Maharashtra India
Sudhir M. Buva1 , Tejas N. Jaykar
2
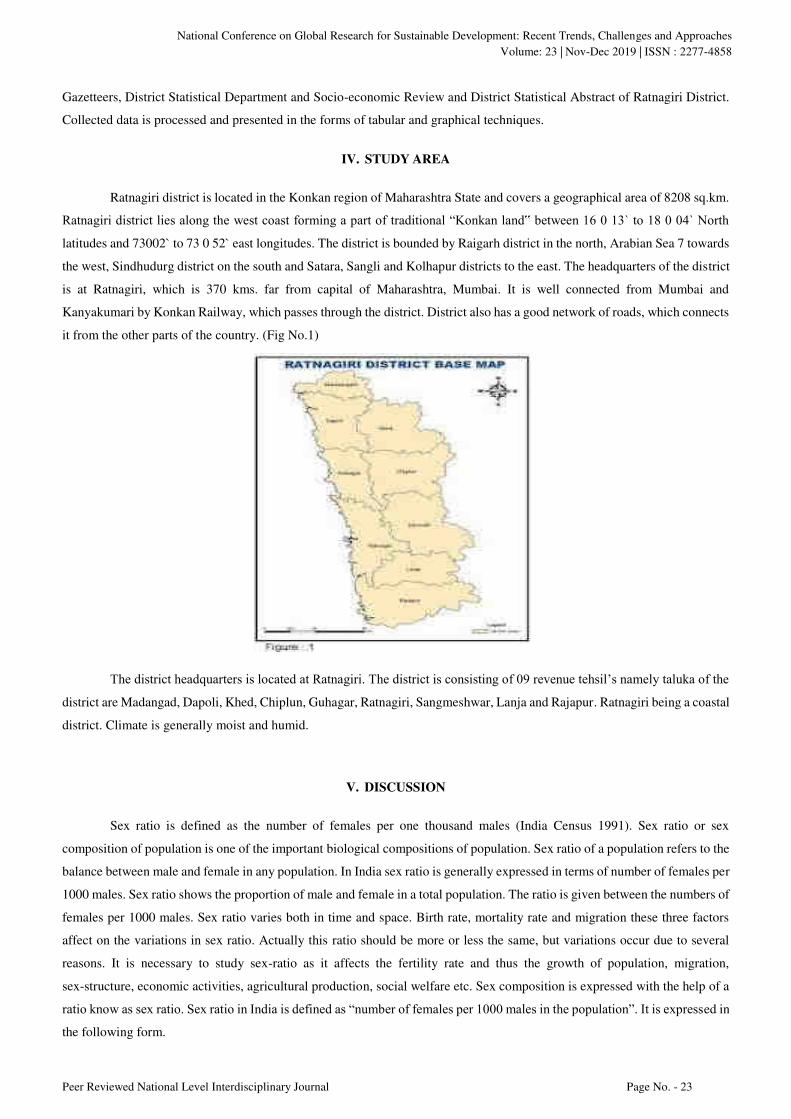
National Conference on Global Research for Sustainable Development: Recent Trends, Challenges and Approaches
Volume: 23 | Nov-Dec 2019 | ISSN : 2277-4858
Peer Reviewed National Level Interdisciplinary Journal Page No. - 23
Gazetteers, District Statistical Department and Socio-economic Review and District Statistical Abstract of Ratnagiri District.
Collected data is processed and presented in the forms of tabular and graphical techniques.
IV. STUDY AREA
Ratnagiri district is located in the Konkan region of Maharashtra State and covers a geographical area of 8208 sq.km.
Ratnagiri district lies along the west coast forming a part of traditional “Konkan land‟ between 16 0 13` to 18 0 04` North
latitudes and 73002` to 73 0 52` east longitudes. The district is bounded by Raigarh district in the north, Arabian Sea 7 towards
the west, Sindhudurg district on the south and Satara, Sangli and Kolhapur districts to the east. The headquarters of the district
is at Ratnagiri, which is 370 kms. far from capital of Maharashtra, Mumbai. It is well connected from Mumbai and
Kanyakumari by Konkan Railway, which passes through the district. District also has a good network of roads, which connects
it from the other parts of the country. (Fig No.1)
The district headquarters is located at Ratnagiri. The district is consisting of 09 revenue tehsil’s namely taluka of the
district are Madangad, Dapoli, Khed, Chiplun, Guhagar, Ratnagiri, Sangmeshwar, Lanja and Rajapur. Ratnagiri being a coastal
district. Climate is generally moist and humid.
V. DISCUSSION
Sex ratio is defined as the number of females per one thousand males (India Census 1991). Sex ratio or sex
composition of population is one of the important biological compositions of population. Sex ratio of a population refers to the
balance between male and female in any population. In India sex ratio is generally expressed in terms of number of females per
1000 males. Sex ratio shows the proportion of male and female in a total population. The ratio is given between the numbers of
females per 1000 males. Sex ratio varies both in time and space. Birth rate, mortality rate and migration these three factors
affect on the variations in sex ratio. Actually this ratio should be more or less the same, but variations occur due to several
reasons. It is necessary to study sex-ratio as it affects the fertility rate and thus the growth of population, migration,
sex-structure, economic activities, agricultural production, social welfare etc. Sex composition is expressed with the help of a
ratio know as sex ratio. Sex ratio in India is defined as “number of females per 1000 males in the population”. It is expressed in
the following form.
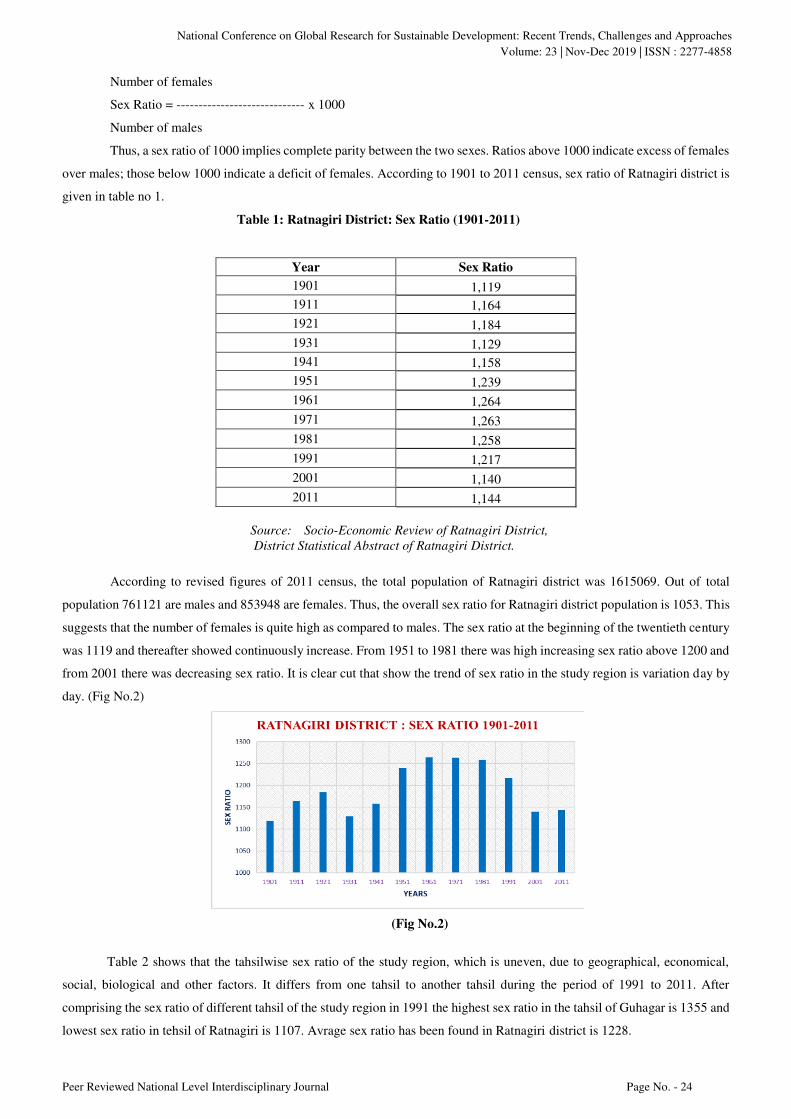
National Conference on Global Research for Sustainable Development: Recent Trends, Challenges and Approaches
Volume: 23 | Nov-Dec 2019 | ISSN : 2277-4858
Peer Reviewed National Level Interdisciplinary Journal Page No. - 24
Number of females
Sex Ratio = ----------------------------- x 1000
Number of males
Thus, a sex ratio of 1000 implies complete parity between the two sexes. Ratios above 1000 indicate excess of females
over males; those below 1000 indicate a deficit of females. According to 1901 to 2011 census, sex ratio of Ratnagiri district is
given in table no 1.
Table 1: Ratnagiri District: Sex Ratio (1901-2011)
Year Sex Ratio
1901 1,119
1911 1,164
1921 1,184
1931 1,129
1941 1,158
1951 1,239
1961 1,264
1971 1,263
1981 1,258
1991 1,217
2001 1,140
2011 1,144
Source: Socio-Economic Review of Ratnagiri District, District Statistical Abstract of Ratnagiri District.
According to revised figures of 2011 census, the total population of Ratnagiri district was 1615069. Out of total
population 761121 are males and 853948 are females. Thus, the overall sex ratio for Ratnagiri district population is 1053. This
suggests that the number of females is quite high as compared to males. The sex ratio at the beginning of the twentieth century
was 1119 and thereafter showed continuously increase. From 1951 to 1981 there was high increasing sex ratio above 1200 and
from 2001 there was decreasing sex ratio. It is clear cut that show the trend of sex ratio in the study region is variation day by
day. (Fig No.2)
(Fig No.2)
Table 2 shows that the tahsilwise sex ratio of the study region, which is uneven, due to geographical, economical,
social, biological and other factors. It differs from one tahsil to another tahsil during the period of 1991 to 2011. After
comprising the sex ratio of different tahsil of the study region in 1991 the highest sex ratio in the tahsil of Guhagar is 1355 and
lowest sex ratio in tehsil of Ratnagiri is 1107. Avrage sex ratio has been found in Ratnagiri district is 1228.

National Conference on Global Research for Sustainable Development: Recent Trends, Challenges and Approaches
Volume: 23 | Nov-Dec 2019 | ISSN : 2277-4858
Peer Reviewed National Level Interdisciplinary Journal Page No. - 25
Table No. 2 Ratnagiri District: Tahsilwise Sex Ratio (1991-2011)
Sr. No. Tahsil 1991 2001 2011
1 Mandangad 1280 1247 1220
2 Dapoli 1277 1196 1153
3 Khed 1175 1121 1100
4 Chiplun 1125 1081 1071
5 Guhagar 1355 1132 1253
6 Ratnagiri 1107 1042 1053
7 Sangameshwar 1231 1190 1094
8 Lanja 1227 1182 1140
9 Rajapur 1277 1212 1183
Ratnagiri District 1228 1156 1141
Source: Based on Census of Ratnagiri Districts, 2010-11
During the year of 2001, the sex ratio of the Ratnagiri District was 1156. Among the all tahsil highest sex ratio is
found in the tahsil of Mandangad 1247. The lowest sex ratio is recorded in Ratnagiri tahsil (1042).
As compared with the census year of 1991 and 2001, the sex ratio has decreased in all the tahsil in the year of 2011.
The overall sex ratio in the year of 2011 is 1141 of the Ratnagiri district. During the year of 2011, the highest sex ratio has been
found in the tahsil of Guhagar 1253. The lowest sex ratio has been seen in the tahsil of Ratnagiri1053. (Fig No.3)
(Fig No. 3)
VI. CONCLUSION
According to revised figures of 2011 census, the total population of Ratnagiri district was 1615069. Out of total
population 761121 are males and 853948 are females. Thus, the average sex ratio for Ratnagiri district population is 1107. This
suggests that the number of females is high as compared to males. In other words, the sex ratio in the district had always
favorable to females. The sex ratio at the beginning of the twentieth century was 1119 (census year 1901) and twenty-one
centuries was 1144 (census year 2011). It is observed that the trend of sex ratio in the study region is always above 1100 per
male.
National Conference on Global Research for Sustainable Development: Recent Trends, Challenges and Approaches
Volume: 23 | Nov-Dec 2019 | ISSN : 2277-4858
Peer Reviewed National Level Interdisciplinary Journal Page No. - 26
REFERENCES
Franklin, S.J. (1956):” Pattern of Sex Ratio in New Zealand”, Economic Geographer, Vol.32, p.168.
Trewartha, G.T. (1953):” A case for population Geography”, Annals of Association of American Geography Vol.43, pp.71&97.
Bose, A. (1961): "Population growth and the Industrialization. Urbanization Process in India. 1951-61", Men in India, 41,
pp.255-275.
Census of India 1971, "General population tables" II-A. Maharashtra.
Census of India, 1971 "Migration Tables" IID. Vol, 1 & 2 of Maharashtra.
Chandna, R.C. (1976):"Population growth of India’s cities. 1901-71" Asian profile, Vol.4 No.l.
Gosal G.S. (1974):"Population growth in India. 1961-71: A special perspective" Asian Profile.
AUTHOR’S BIOGRAPHY
1. Sudhir M. Buva, Asst. Prof, Dept. of Geography, S. P. K. College, Swantwadi (MS).
2. Tejas N. Jaykar , Research students, Dept. of Geography, Shivaji University, Kolhapur

National Conference on Global Research for Sustainable Development: Recent Trends, Challenges and Approaches
Volume: 23 | Nov-Dec 2019 | ISSN : 2277-4858
Peer Reviewed National Level Interdisciplinary Journal Page No. - 27
Abstract: Climate change in the world is caused by various activities. When climate change occurs; temperatures can increase affectedly.
When temperature rises, different changes occur on Earth. It results in more floods, droughts, or intense rain, as well as more frequent
and severe heat waves. Oceans and glaciers have also experienced some changes: oceans are warming and becoming more acidic,
glaciers are melting, and sea levels are rising. As these changes frequently occurand in future decades, they will likely present challenges
to our society and environment. During the past century, human activities have released large amounts of carbon dioxide and other
greenhouse gases into the atmosphere. Most of the gases come from burning fossil fuels to produce energy. Greenhouse gases are like a
blanket around the Earth, trapping energy in the atmosphere and causing it to warm. While greenhouse gases buildup, the climate
changes and result in dangerous effects on human health and ecosystems therefore, it is natural and necessary to support life on earth.
This article examines the impact of climate change on human infectious diseases. It identifies research possibilities on how human
society may respond to, adapt to, and prepare for the related changes.
Keywords: Climate change , Green house gases , Ecosystem, Infectious diseases, Health impact, Support system
Sources: Data from the Internet, Books, Journals, Articles.
I. INTRODUCTION
Climate change, together with other natural and human-made health stressors, influences human health and disease in nu-
merous ways. Some existing health threats will intensify and new health threats will emerge. Not everyone is equally at risk.
Important considerations include age, economic resources, and location. Preventive and adaptive actions, such as setting up
extreme weather early warning systems and improving water infrastructure, can reduce the severity of these impacts, but there
are limits to the effectiveness of such actions in the face of some projected climate change threats.
During the past century, human activities have released large amounts of carbon dioxide and other greenhouse gases into the
atmosphere. Most of the gases come from burning fossil fuels to produce energy. Greenhouse gases are like a blanket around
the Earth, trapping energy in the atmosphere and causing it to warm. This is called the greenhouse effect and it is natural and
necessary to support life on earth. People have adapted to the stable climate since the last ice age which ended several thousand
years ago. A warmer climate can bring changes that can affect our water supplies, agriculture, power and transportation
systems, the natural environment, and even our own health and safety. There are some climate changes that are unavoidable
and nothing can be done about it. For example, carbon dioxide can stay in the atmosphere for nearly a century, so Earth will
continue to warm in the future affecting life and bio-diversity. This study is based on a survey of related publications between
1990 and 2015, the terms used for literature selection reflect three aspects — the components of infectious diseases, climate
variables, and selected infectious diseases.
II. PREVIOUS STUDY
Humans' vulnerability to the potential health impacts by climate change is evident in literature. As an active agent, human
beings may control the related health effects effectively through adopting proactive measures, including better understanding
of the climate change patterns and compound disease-specific health effects, and effective allocation of technologies and
Impacts of Climate Change on Human Health
Dr. Mousumi S Manna

National Conference on Global Research for Sustainable Development: Recent Trends, Challenges and Approaches
Volume: 23 | Nov-Dec 2019 | ISSN : 2277-4858
Peer Reviewed National Level Interdisciplinary Journal Page No. - 28
resources to promote healthy lifestyles and public awareness. Certain adaptation measures were recommended: such as
empirical observations of the association between climate change and infectious diseaseswith scientific explanations, to
improve the prediction of spatial–temporal process of climate change and to establish locally effective early warning
systems for the health effects of predicated climate change.
According to the European Environment Agency (EEA, 2008), the global average surface temperature has increased by
0.74 °C in the 20th century, the global sea level has been rising 1.8 mm per year since 1961, and the Arctic sea ice has been
shrinking by 2.7% per decade. Moreover, mountain glaciers are contracting, ocean water is becoming more acidic, and
extreme weather events are occurring more often. The Intergovernmental Panel on Climate Change (IPCC) predicted an
average temperature rise of 1.5–5.8 °C across the globe during the 21st century, accompanied by increased extreme and
anomalous weather events including heat-waves, floods and droughts (IPCC, 2001). Responding to global changes by
pursuing a sustainable development is a major challenge to human society.
Climate Changealso presents a global public health problem, with serious health impacts in many ways in different parts of the
world. Countrieswill be affected by disruptions of physical, biological, and ecological systems, including disturbances
originating in the Western side,Eastern side and elsewhere. Health effects of these disruptions include increased respiratory
and cardiovascular disease, injuries and premature deaths related to extreme weather events, changes in the prevalence and
geographical distribution of food- and waterborne illnesses and other infectious diseases, and threats to mental health.
III. KEY WEATHER AND CLIMATE DRIVERS
Climate change’s key weather and climate drivers of health impacts include increasingly frequent, intense, and longer-lasting
extreme heat waves, which worsens drought, wildfire, and air pollution risks; increasingly frequent extreme precipitation,
intense storms, and changes in precipitation patterns that lead to drought andecosystem changes; and rising sea levels that
intensify coastal flooding and creations of storms. Key drivers of vulnerability include the attributes of certain groups (age,
socioeconomic status, race, current level of health: Indigenous Peoplefor example and on vulnerable populations) and of place
(floodplains, coastal zones, and urban areas), as well as the resilience of critical public health infrastructure. Multi-stressor
situations, such as impacts on vulnerable populations following natural disasters that also damage the social and physical in-
frastructure necessary for resilience and emergency response, are particularly important to consider when preparing for the
impacts of climate change on human health.
These changes may impact the survival, reproduction, or distribution of disease pathogens and hosts, as well as the means of
their transmission environment. The health effects reveal shifts in the geographic and seasonal patterns of human infectious
diseases, and changes in their outbreak frequency and severity results in many types of infectious diseases, including
vector-borne, water-borne, air-borne, and food-borne diseases.
Humans are an important and active factor during this process; they may mitigate the impact of climate change through
adaptation practices such as those recommended by Kovats et al. (2000). Fig.

National Conference on Global Research for Sustainable Development: Recent Trends, Challenges and Approaches
Volume: 23 | Nov-Dec 2019 | ISSN : 2277-4858
Peer Reviewed National Level Interdisciplinary Journal Page No. - 29
IV. WIDE RANGING HEALTH IMPACTS
Air Pollution:
Industrial and vehicle emissions in hot, humid cities contribute to poor air quality due to smog, resulting in increased morbidity
and mortality from respiratory diseases. Excessive use of Automatic/ Electronic machines, Air conditioners are increasing the
Carbon-Fluro combination of gases( Green House Gases) and depleting the Ozone layer of Ground-level (a key component of
smog) which is associated with many health problems, such as diminished lung function, increased hospital admissions and
repeated bouts of asthma, and increase in premature deaths. (Other respiratory illness are, pollen allergies, heart disease,
obesity or diabetes)OtherFactors that affect ozone formation include heat, concentrations of precursor chemicals, and methane
emissions, wildfire emissions and air stagnation episodes.
Drought conditions increases the environmental exposure to another set of health hazards wildfires, dust storms, extreme heat
events, flash flooding, degraded water quality, and reduced water quantity, degraded air quality which have been associated
with increased incidence of Coccidioidomycosis (Valley fever), a fungal pathogen, in Arizona ,California and other dry
regions.Wind and dust storms affect the transmission of infectious diseases. Wind acts as a transportation means for pathogen
and virus of air-borne diseases. Pathogens can spread from endemic regions to other regions through interregional dust
storms.Human influenza virus could be transported from Asia to the Americas in winter months by prevailing wind over the
Pacificocean. (Hamnett et al., 1999).While Asian countries suffer from Influenza during seasonal changes.
Temperature Extremes:
Extreme heat events have long threatened public health in the World over.Many countries in the tropical region, Asia, Africa,
North and South America have suffered drastic increases in death rates during heat waves.Extreme heat can make working
outdoors dangerous, leading to irregular heartbeats and stroke. Deaths result not only from heat stroke and related
conditions,but also from cardiovascular diseases, respiratory diseases, and cerebrovascular diseases.Heat waves are also
associated with increased hospital admissions for cardiovascular, kidney, and respiratory disorders.However, extreme heat
events remain a cause of preventable death nationwide. Increase in seasonal temperatures and longer growing seasons due to an
abundance of carbon dioxide, and the resulting pollen from allergenic plant species contributes to increase in allergies and
asthma.Whilemilder winters resulting from a warming climate can reduce illness, injuries, and deaths associated with cold and
snow.Urban heat, heavy rainfall concentrate, combined with an aging population and increased urbanization, are projected to
increase the vulnerability to cold / heat-related health impacts now and in the future.
Heavy Rainfall:
Increases in both extreme precipitation / rainfall and total rainfall have contributed to increase in severe flooding events in
certain regions. Floods are the second deadliest of all weather-related hazards in the World over, accounting for approximately
maximum deaths per year,mostly due to drowning.Flash floods (That we have witnessed last year in Maharashtra) and regular
flooding associated with tropical storms result in massive destruction of life and property.
In addition to the immediate health hazards associated with extreme precipitation events when flooding occurs, other hazards
can often appear once a storm event has passed. Waterborne disease outbreaks have been reported in the weeks following
resulting in epidemics.Water intrusion into buildings can result in mold contamination that manifests later, leading to indoor air
quality problems. Buildings damaged during hurricanes are especially susceptible to water intrusion. Populations living in
damp indoor environments experience increased prevalence of asthma and other upper respiratory tract symptoms, such as
coughing and wheezingas well as lower respiratory tract infections such as Pneumonia, Respiratory Syncytial Virus (RSV),
National Conference on Global Research for Sustainable Development: Recent Trends, Challenges and Approaches
Volume: 23 | Nov-Dec 2019 | ISSN : 2277-4858
Peer Reviewed National Level Interdisciplinary Journal Page No. - 30
Dengue, Leptospirosis , Cholera, as well as indirect effects such as compromised sanitation systems that contribute to
increased incidence of Diarrheal diseasesand Diphtheria.
Diseasescarried by Vectors:
Climate Change also influences the distribution of diseases borne by vectors such as fleas, ticks, and mosquitoes, which spread
pathogens that cause wide spread illnesses. Other vector-borne diseases, includes Lyme,dengue fever,West Nile virus,Rocky
Mountain spotted fever,plague, and tularemia.Vector-borne pathogens not currently found in the United States, such as
Chikungunya, and Rift Valley fever viruses, pose great threats to tropical places like India, Bangladesh and China. These
diseases causes death if not treated timely.
Food Security:
Elevated atmospheric CO2 is associated with decreased plant nitrogen concentration, and decreased protein, in many crops,
such as barley, sorghum, and soyThe nutrient content of cropsi also decreases if soil nitrogen levels are suboptimal, with
reduced levels of nutrients such as calcium, iron, zinc, vitamins, and sugars, although this effect is alleviated if sufficient
nitrogen is supplied.Farmers are expected to use more herbicides and pesticides because of increased growth of pestsand
weedsas well as decreased effectivenessand durationof some of these chemicals. Farmers, farmworkers, and consumers will
thus sustain increased exposure to these substances and their residues, which are toxic resulting in increase of Cancer and
Renal failure cases.
V. CONCLUSION
At-risk populations can have co-occurring vulnerabilities withincreased risk of illnesses, injury or death from environmental
conditions attributable to climate change, particularly if they are simultaneously lacking the financial, social or community
resilience necessary to cope with or recover from additional stressors.Climate change requires systematic and sustained
disaster risk management. In addition to relief efforts, public health responses include prevention and preparedness before
disasters occurrence. National and international guidelines should inform local planning activities. Climate change adaptation
(preparedness) and mitigation (prevention) can occur through policies and interventions at international, national, and local
levels.Fields of tropical medicine will need to confront some of the most widespread, and dangerous pronounced human health
impacts of climate change. These health research outcomes must bedocumentedin localized contexts, highlighting regional
adaptation needs for public health agencies, which will guide policymakers and the public andto enable practitioners to target
treatment according to health vulnerabilities.
VI. KEY MESSAGES AND MEASURES
1. 1.Climate change threatens human health and well-being in many ways, including impacts from increased extreme
weather events, wildfire, decreased air quality, threats to mental health, and illnesses transmitted by food, water, and
disease-carriers such as mosquitoes and ticks. Some of these health impacts are being dealt with by researches.
2. Climate change will, intensify some of the existing health threats the world now faces. Certain people and communities
are especially vulnerable, including children, the elderly, the sick, the poor, and some communities of colour.
3. Public health actions, especially preparedness and prevention, can do much to protect people from some of the impacts
of climate change. As threats increase, our ability to adapt to future changes may be limitedso early action is required.
National Conference on Global Research for Sustainable Development: Recent Trends, Challenges and Approaches
Volume: 23 | Nov-Dec 2019 | ISSN : 2277-4858
Peer Reviewed National Level Interdisciplinary Journal Page No. - 31
4. Responding to climate change provides opportunities to improve human health and well-being across many sectors,
including energy, agriculture, and transportation. Many of these strategies offer a variety of benefits, protecting people while
combating climate change and providing other societal benefits.
REFERENCES
Bell, M., D. Davis, L. Cifuentes, A. Krupnick, R. Morgenstern, and G. Thurston, 2008: Ancillary human health benefits of
improved air quality resulting from climate change mitigation. Environmental Health, 7, 1-18, doi:10.1186/1476-069x-7-41.
Bell, M. L., R. Goldberg, C. Hogrefe, P. L. Kinney, K. Knowlton, B. Lynn, J. Rosenthal, C. Rosenzweig, and J. A. Patz, 2007:
Climate change, ambient ozone, and health in 50 US cities. Climatic Change, 61-76, doi:10.1007/s10584-006-9166-7.
Ebi, K. L., and G. McGregor, 2008: Climate change, tropospheric ozone and particulate matter, and health impacts.
Environmental Health Perspectives, 1449-1455, doi:10.1289/ehp.11463. [Available online at
http://www.ncbi.nlm.nih.gov/pmc/articles/ PMC2592262/]
EPA, 2008: Review of the Impact of Climate Variability and Change on Aeroallergens and Their Associated Effects.
EPA/600/R-06/164F, 125 pp., U.S. Environmental Protection Agency, Washington, D.C. [Available online at http://ofmpub.
epa.gov/eims/eimscomm.getfile?p_download_id=490474]
Gallup JL, Sachs JD, Mellinger AD, 1999.The Regional Impacts of Climate Change: An Assessment of Vulnerability. Cambridge,
United Kingdom: Cambridge University Press. 3.
Kreslake et al. BMC Public Health (2016) 16:946 Page 4
Rosenthal J, 2009. Climate change and the geographic distribution of infectious diseases. EcoHealth 6: 489–495.
AUTHOR’S BIOGRAPHY
\
Dr. Mousumi S Manna, Associate Professor, H.S College of Commerce and Economics, Chetana’s Bandra, Mumbai

National Conference on Global Research for Sustainable Development: Recent Trends, Challenges and Approaches
Volume: 23 | Nov-Dec 2019 | ISSN : 2277-4858
Peer Reviewed National Level Interdisciplinary Journal Page No. - 32
Lkkjka”k % izkphudky ls gh cqf) KkukRed fØ;kvksa esa ppkZ dk fo"k; jgk gSA dgk tkrk gS fd ̂cqf);ZL;
cyarjjk* vFkkZr~ ftlesa cqf) gS ogh cyoku gSA cqf) ds dkj.k gh ekuo vU; izkf.k;ksa ls Js"B ekuk
tkrk gSA euksfoKku ds {ks= esa Hkh cqf) ppkZ dk fo"k; jgk gSA gtkjksa o"kZ iwoZ ls gh O;fDr;ksa dks cqf)
ds vk/kkj ij vyx&vyx oxksZa esa ckaVk x;kA dqN O;fDr cqf)eku dgykrs gSa dqN de cqf) ds] dqN
ew< cqf) ds rks dqN tM+ cqf) dgykrs gSaA
cqf) og ekufld 'kfDr gS tks oLrqvksa ,oa rR;ksa dks le>us] muesa vkilh lEcU/k [kks tkus rFkk
rdZiw.kZ Kku izkIr djus esa lgk;d gksrh gSA ;g Hkkouk vkSj vUr% izKk ls vyx gSA cqf) rkfdZd fparu
gS ;g Lih;jeSu us dgk gS fd ̂ ^cqf) fctyh ds leku gS] ftls ifjHkkf"kr djuk dfBu gS ijUrq ekiuk
laEHko vkSj vklku gSaA
ifjHkk"kk,¡
cafd?ke & ^^lh[kus dh ;ksX;rk dh cqf) gSA**
jkWl& ^^fofHkUu ifjfFkfr;ksa esa psruk vuqdwyu gh cqf) gSA**
VeZu & ^^ vewrZ fpUru dh ;ksX;rk gh cqf) gSA**
oqMoFkZ & ^^dk;Z; djus dh ;ksX;rk gh cqf) gSA**
fo'ks"krk,¡
cqf) ,d tUetkr ;ksX;rk gS vFkkZr~ cqf) vkuqokaf'kd laxBu dk ifj.kke gSA
lh[kus ds ;ksX;rk dh cqf) gSA
izf'k{k.kksa vkSj okrkoj.k dk izHkko cqf) ij i<+rk gS ysfdu vkftZr cqf) ij u fd vkuqokaf'kd
cqf) ijA
vuqHkoksa ls ykHk mBkus dh ;ksX;rk cqf) gSA
foijhr ifjfLFkfr;ksa esa lQyrk izkfIr gh cqf) gSA
rdZ] fpUru] euu dh ;ksX;rk cqf) gSA
cqf) (Intelligence)
Akshita Kachhawah

National Conference on Global Research for Sustainable Development: Recent Trends, Challenges and Approaches
Volume: 23 | Nov-Dec 2019 | ISSN : 2277-4858
Peer Reviewed National Level Interdisciplinary Journal Page No. - 33
cqf) ds izdkj
FkkWuZMkbd vkSj xSjsV ds vuqlkj cqf) ds rhu izdkj gS &
1½ ewrZ cqf)@;kaf=d@Bksl cqf)
2½ vewrZ cqf)
3½ lkekftd cqf)
1½ ewrZ cqf) %&
bl cqf) ds /kuh O;fDr cLrqvksa dks ewrZ :i ls ns[kdj gh viuh jk; izdV djrs gS vFkkZr budk
laca/k ewrZ izR;k{khdj.k ls gSA
tSls & feL=h] dkjhxj] bathfu;j] fdlku] 'kY; fpfdRldA
2½ vewrZ cqf)%&
bl cqf) dk laca/k vewrZ rkfdZd fpUru] euu] dYiu'khyrk ls gSA
tSls& xf.krK] lkfgR;dkj] dfo] MkWDVj] oSKkfudA
3½ lkekftd cqf)%&
bl cqf) dk vk/kkj lkekftd lEcU/kksa ls gSA ;g cqf) O;fDr dks lkekftd ifjos'k esa vuqdwfyr
cukrh gSaA
tSls & MkWDVj] odhy] jktusrk] lkekftd dk;ZdÙkkZ] Ø;&foØ; vf/kdkjh ¼O;kikjh½] f'k{kdA
dSVy ds vuqlkj cqf) ds nks izdkj gSa&
1- vkuqokaf'kd cqf)
2- vftZr cqf)
1½ vuqokaf'kd cqf)%&
;g vkuqokaf'kd y{k.kksa ds :i esa ,d ih<+h ls nwljh ih<+h esa oa'kkuqxr gksrh gS] bls rjy cqf) Hkh
dgrs gSaA
2½ vftZr cqf)%&
bl cqf) dks okrkoj.k }kjk vftZr fd;k tkrk gS] bls Bksl cqf) Hkh dgrs gSA
gSc ds vuqlkj cqf) ds rhu izdkj gSa&
1½ Type- A
2½ Type-B
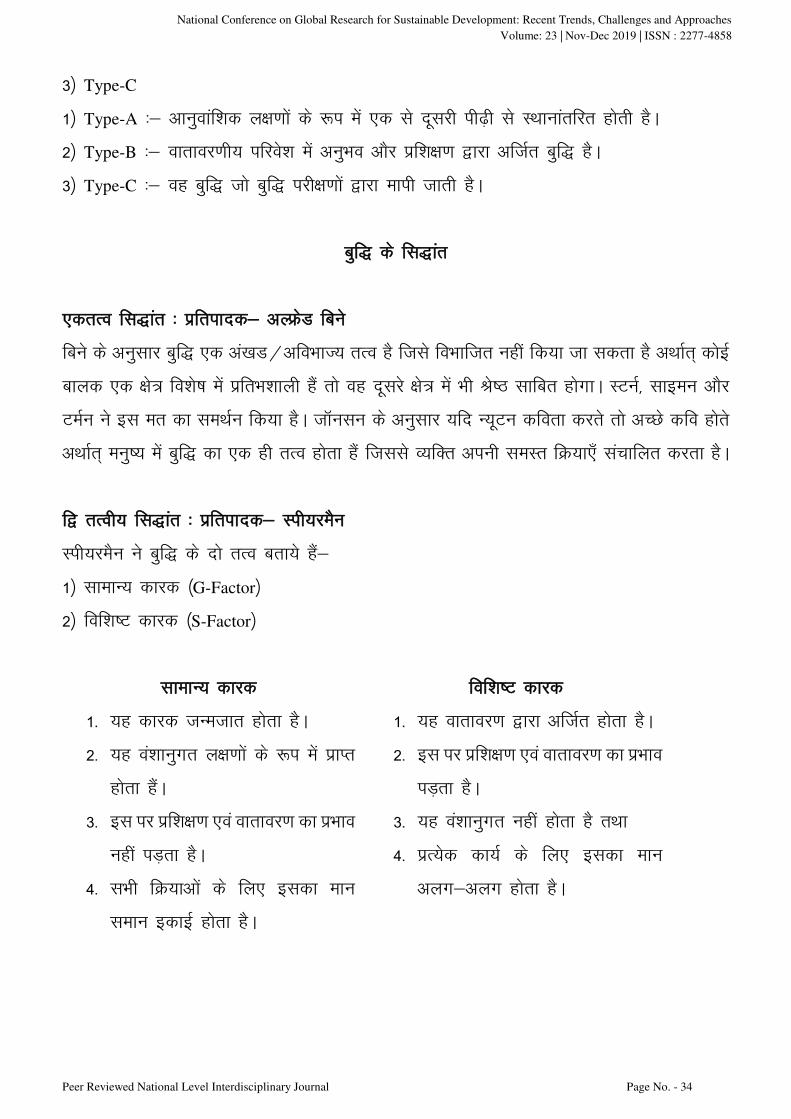
National Conference on Global Research for Sustainable Development: Recent Trends, Challenges and Approaches
Volume: 23 | Nov-Dec 2019 | ISSN : 2277-4858
Peer Reviewed National Level Interdisciplinary Journal Page No. - 34
3½ Type-C
1½ Type-A %& vkuqokaf'kd y{k.kksa ds :i esa ,d ls nwljh ih<+h ls LFkkukarfjr gksrh gSA
2½ Type-B %& okrkoj.kh; ifjos'k esa vuqHko vkSj izf'k{k.k }kjk vftZr cqf) gSA
3½ Type-C %& og cqf) tks cqf) ijh{k.kksa }kjk ekih tkrh gSA
cqf) ds fl)kar
,drRo fl)kar % izfriknd& vYÝsM fcus
fcus ds vuqlkj cqf) ,d va[kM@vfoHkkT; rRo gS ftls foHkkftr ugha fd;k tk ldrk gS vFkkZr~ dksbZ
ckyd ,d {ks= fo'ks"k esa izfrHk'kkyh gSa rks og nwljs {ks= esa Hkh Js"B lkfcr gksxkA LVuZ] lkbeu vkSj
VeZu us bl er dk leFkZu fd;k gSA tkWulu ds vuqlkj ;fn U;wVu dfork djrs rks vPNs dfo gksrs
vFkkZr~ euq"; esa cqf) dk ,d gh rRo gksrk gSa ftlls O;fDr viuh leLr fØ;k,¡ lapkfyr djrk gSA
f} rRoh; fl)kar % izfriknd& Lih;jeSu
Lih;jeSu us cqf) ds nks rRo crk;s gSa&
1½ lkekU; dkjd ¼G-Factor½
2½ fof'k"V dkjd ¼S-Factor½
lkekU; dkjd fof'k"V dkjd
1- ;g dkjd tUetkr gksrk gSA
2- ;g oa'kkuqxr y{k.kksa ds :i esa izkIr
gksrk gSaA
3- bl ij izf'k{k.k ,oa okrkoj.k dk izHkko
ugha iM+rk gSA
4- lHkh fØ;kvksa ds fy, bldk eku
leku bdkbZ gksrk gSA
1- ;g okrkoj.k }kjk vftZr gksrk gSA
2- bl ij izf'k{k.k ,oa okrkoj.k dk izHkko
iM+rk gSA
3- ;g oa'kkuqxr ugha gksrk gS rFkk
4- izR;sd dk;Z ds fy, bldk eku
vyx&vyx gksrk gSA
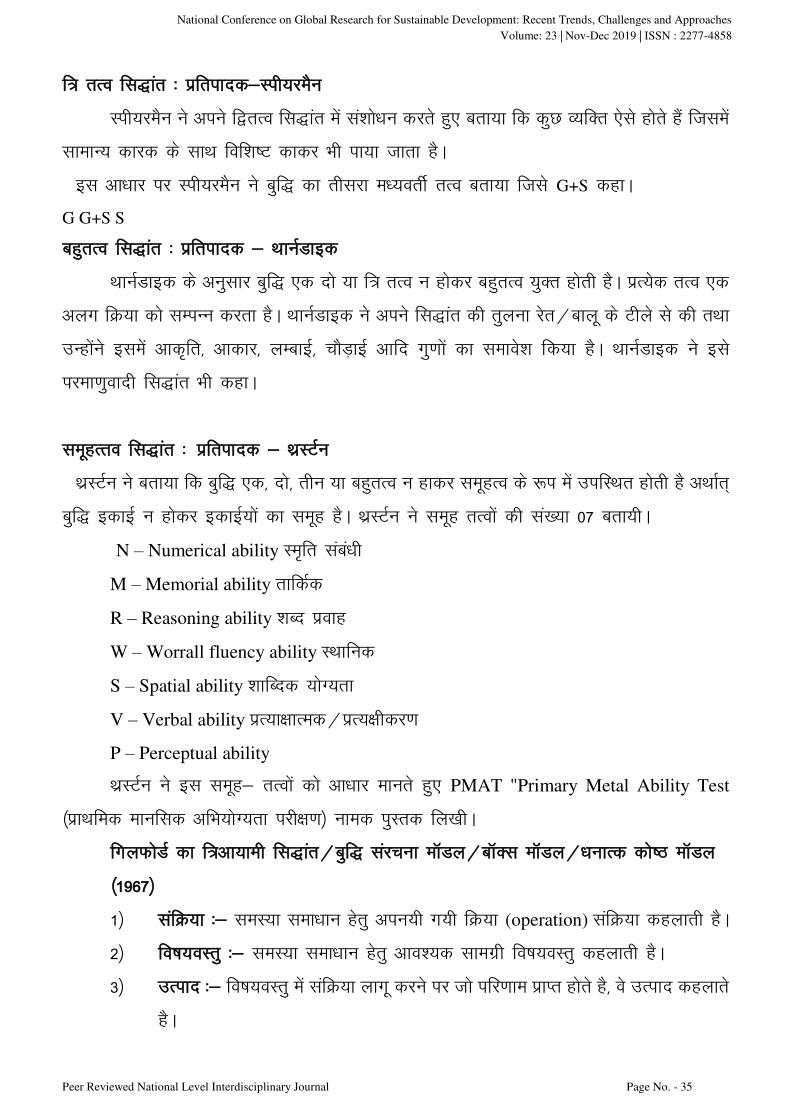
National Conference on Global Research for Sustainable Development: Recent Trends, Challenges and Approaches
Volume: 23 | Nov-Dec 2019 | ISSN : 2277-4858
Peer Reviewed National Level Interdisciplinary Journal Page No. - 35
f= rRo fl)kar % izfriknd&Lih;jeSu
Lih;jeSu us vius f}rRo fl)kar esa la'kks/ku djrs gq, crk;k fd dqN O;fDr ,sls gksrs gSa ftlesa
lkekU; dkjd ds lkFk fof'k"V dkdj Hkh ik;k tkrk gSA
bl vk/kkj ij Lih;jeSu us cqf) dk rhljk e/;orhZ rRo crk;k ftls G+S dgkA
G G+S S
cgqrRo fl)kar % izfriknd & FkkuZMkbd
FkkuZMkbd ds vuqlkj cqf) ,d nks ;k f= rRo u gksdj cgqrRo ;qDr gksrh gSA izR;sd rRo ,d
vyx fØ;k dks lEiUu djrk gSA FkkuZMkbd us vius fl)kar dh rqyuk jsr@ckyw ds Vhys ls dh rFkk
mUgksaus blesa vkd`fr] vkdkj] yEckbZ] pkSM+kbZ vkfn xq.kksa dk lekos'k fd;k gSA FkkuZMkbd us bls
ijek.kqoknh fl)kar Hkh dgkA
lewgRro fl)kar % izfriknd & FkzLVZu
FkzLVZu us crk;k fd cqf) ,d] nks] rhu ;k cgqrRo u gkdj lewgRo ds :i esa mifLFkr gksrh gS vFkkZr~
cqf) bdkbZ u gksdj bdkbZ;ksa dk lewg gSA FkzLVZu us lewg rRoksa dh la[;k 07 crk;hA
N – Numerical ability Le`fr laca/kh
M – Memorial ability rkfdZd
R – Reasoning ability 'kCn izokg
W – Worrall fluency ability LFkkfud
S – Spatial ability 'kkfCnd ;ksX;rk
V – Verbal ability izR;k{kkRed@izR;{khdj.k
P – Perceptual ability
FkzLVZu us bl lewg& rRoksa dks vk/kkj ekurs gq, PMAT "Primary Metal Ability Test
¼izkFkfed ekufld vfHk;ksX;rk ijh{k.k½ uked iqLrd fy[khA
fxyQksMZ dk f=vk;keh fl)kar@cqf) lajpuk ekWMy@ckWDl ekWMy@/kukRd dks"B ekWMy
¼1967½
1½ lafØ;k %& leL;k lek/kku gsrq viu;h x;h fØ;k (operation) lafØ;k dgykrh gSA
2½ fo"k;oLrq %& leL;k lek/kku gsrq vko';d lkexzh fo"k;oLrq dgykrh gSA
3½ mRikn %& fo"k;oLrq esa lafØ;k ykxw djus ij tks ifj.kke izkIr gksrs gS] os mRikn dgykrs
gSA
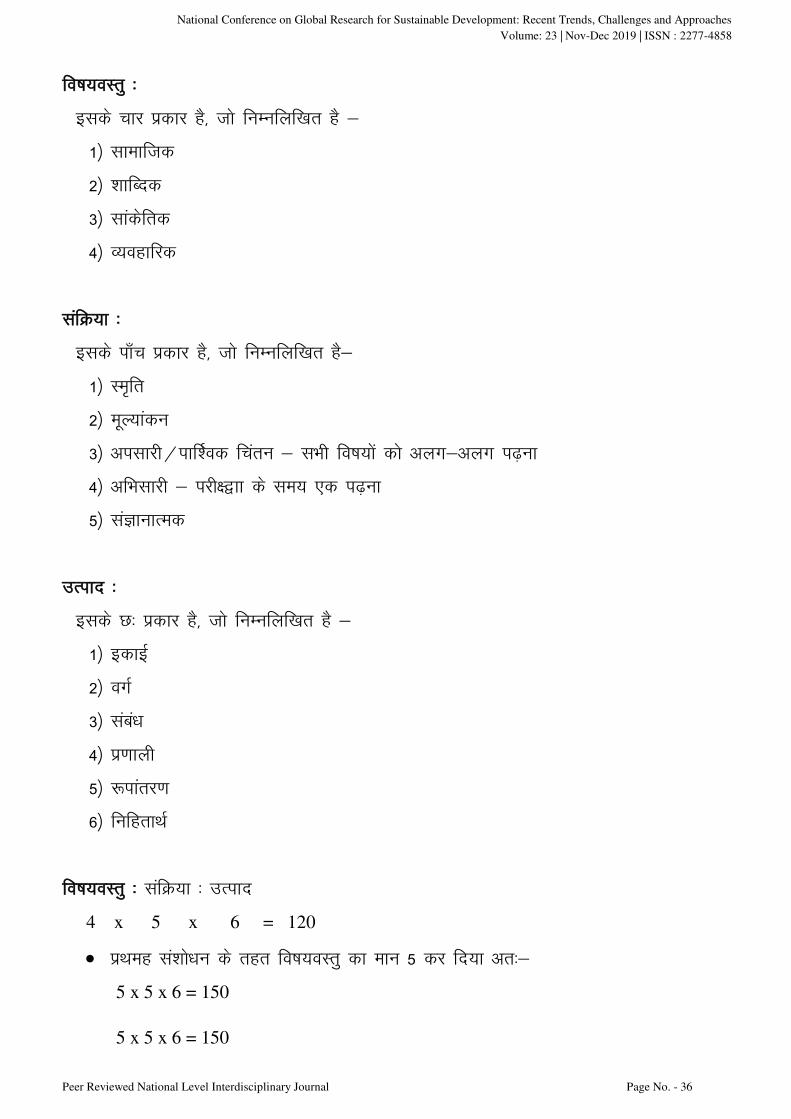
National Conference on Global Research for Sustainable Development: Recent Trends, Challenges and Approaches
Volume: 23 | Nov-Dec 2019 | ISSN : 2277-4858
Peer Reviewed National Level Interdisciplinary Journal Page No. - 36
fo"k;oLrq %
blds pkj izdkj gS] tks fuEufyf[kr gS &
1½ lkekftd
2½ 'kkfCnd
3½ lkadsfrd
4½ O;ogkfjd
lafØ;k %
blds ik¡p izdkj gS] tks fuEufyf[kr gS&
1½ Le`fr
2½ ewY;kadu
3½ vilkjh@ikf'Zod fparu & lHkh fo"k;ksa dks vyx&vyx i<+uk
4½ vfHklkjh & ijh{}kk ds le; ,d i<+uk
5½ laKkukRed
mRikn %
blds N% izdkj gS] tks fuEufyf[kr gS &
1½ bdkbZ
2½ oxZ
3½ laca/k
4½ iz.kkyh
5½ :ikarj.k
6½ fufgrkFkZ
fo"k;oLrq % lafØ;k % mRikn
4 x 5 x 6 = 120
izFkeg la'kks/ku ds rgr fo"k;oLrq dk eku 5 dj fn;k vr%&
5 x 5 x 6 = 150
5 x 5 x 6 = 150
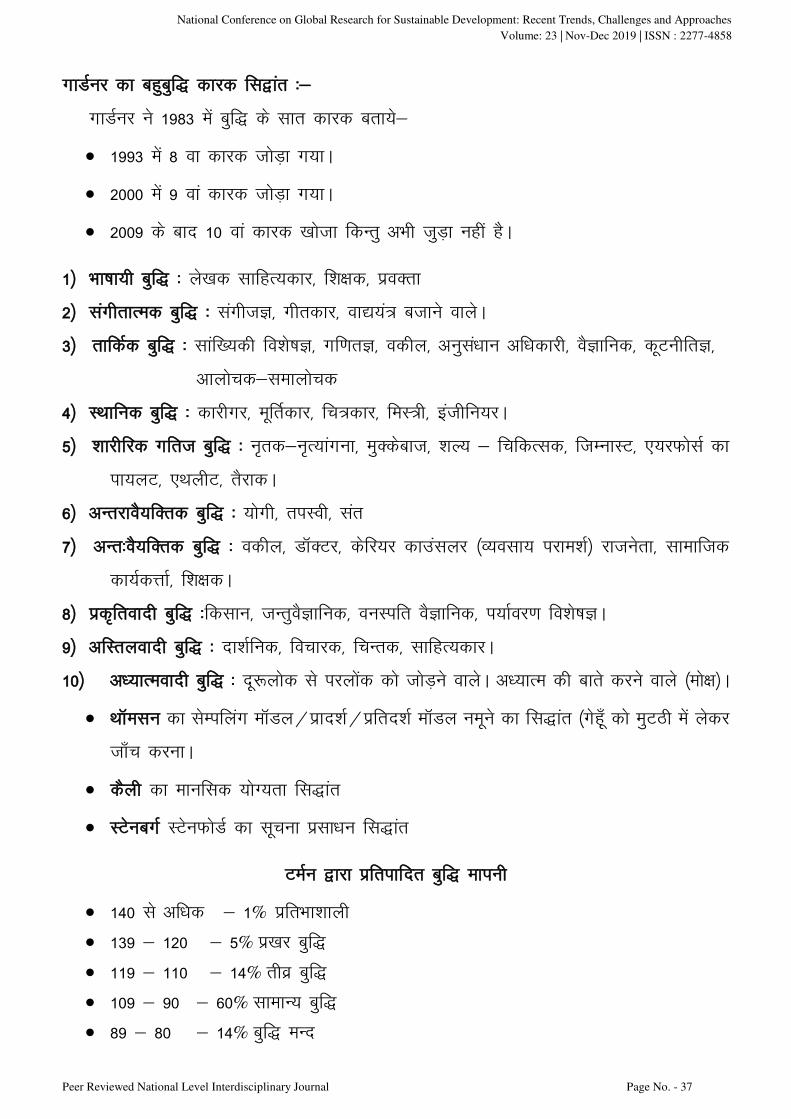
National Conference on Global Research for Sustainable Development: Recent Trends, Challenges and Approaches
Volume: 23 | Nov-Dec 2019 | ISSN : 2277-4858
Peer Reviewed National Level Interdisciplinary Journal Page No. - 37
xkMZuj dk cgqcqf) dkjd fl}kar %&
xkMZuj us 1983 esa cqf) ds lkr dkjd crk;s&
1993 esa 8 ok dkjd tksM+k x;kA
2000 esa 9 oka dkjd tksM+k x;kA
2009 ds ckn 10 oka dkjd [kkstk fdUrq vHkh tqM+k ugha gSA
1½ Hkk"kk;h cqf) % ys[kd lkfgR;dkj] f'k{kd] izoDrk
2½ laxhrkRed cqf) % laxhtK] xhrdkj] ok|;a= ctkus okysA
3½ rkfdZd cqf) % lkaf[;dh fo'ks"kK] xf.krK] odhy] vuqla/kku vf/kdkjh] oSKkfud] dwVuhfrK]
vkykspd&lekykspd
4½ LFkkfud cqf) % dkjhxj] ewfrZdkj] fp=dkj] feL=h] bathfu;jA
5½ 'kkjhfjd xfrt cqf) % u`rd&u`R;kaxuk] eqDdsckt] 'kY; & fpfdRld] ftEukLV] ,;jQkslZ dk
ik;yV] ,FkyhV] rSjkdA
6½ vUrjkoS;fDrd cqf) % ;ksxh] riLoh] lar
7½ vUr%oS;fDrd cqf) % odhy] MkWDVj] dsfj;j dkmalyj ¼O;olk; ijke'kZ½ jktusrk] lkekftd
dk;ZdÙkkZ] f'k{kdA
8½ izd`froknh cqf) %fdlku] tUrqoSKkfud] ouLifr oSKkfud] i;kZoj.k fo'ks"kKA
9½ vfLryoknh cqf) % nk'kZfud] fopkjd] fpUrd] lkfgR;dkjA
10½ v/;kReoknh cqf) % nw:yksd ls ijyksad dks tksM+us okysA v/;kRe dh ckrs djus okys ¼eks{k½A
FkkWelu dk lsEifyax ekWMy@izkn'kZ@izfrn'kZ ekWMy uewus dk fl)kar ¼xsgw¡ dks eqVBh esa ysdj
tk¡p djukA
dSyh dk ekufld ;ksX;rk fl)kar
LVsucxZ LVsuQksMZ dk lwpuk izlk/ku fl)kar
VeZu }kjk izfrikfnr cqf) ekiuh
140 ls vf/kd & 1% izfrHkk'kkyh
139 & 120 & 5% iz[kj cqf)
119 & 110 & 14% rhoz cqf)
109 & 90 & 60% lkekU; cqf)
89 & 80 & 14% cqf) eUn

National Conference on Global Research for Sustainable Development: Recent Trends, Challenges and Approaches
Volume: 23 | Nov-Dec 2019 | ISSN : 2277-4858
Peer Reviewed National Level Interdisciplinary Journal Page No. - 38
79 & 70 & 5% cqf) fucZy
69 & 50 & 1% ew[kZ
49 & 25 & ew<+ cqf)
25 ls uhps & tM+ cqf) ¼Idiol½
laosxkRed & cqf) (Emotional Intelligence)
laosxkRed cqf) dks vaxzsth esa ^beks'kuy baVsyhtsUl* dgrs gSA ;g xzhd ;k ysfVu Hkk"kk ds 'kCn
'EMOVERE' ls feydj cuk gSA ftldk vFkZ gS mFky&iqFky epkuk@Økafr djuk@ekufld :i
ls fopfyr djuk mÙksftr djukA
fo'ks"krk,¡
laosxk vpkud mRiUu gksrs gSA
laosxksa esa rhozrk gksrh gSA
laosxksa {kf.kd gksrs gSA
laosxksa ls ekufld ,oa 'kkjhfjd ifjorZu vkrs gSA
laosxkRed cqf) gesa crkrh gS fd dksbZ O;fDr thou esa ¼Hkfo"; ds :i esa½ fdruk lQy gksxkA
laosxkRed cqf) ds ckjs esa lcls igys MkW- ihVj lykos rFkk es;j ¼vesfjdk½ us crk;k ysfdu orZeku
lanHkZ esa ftl laosxkRed cqf) dk v/;;u fd;k tkrk gS] og 'kCn MkW- Msfu;u xksyksesj izfrikfnr
gSaA
MkW- Msfu;u xksyeSu us viuh iqLrd ^^laosxkRed cqf) cqf)rdZ egRoiw.kZ D;ksa** esa laosxkRed cqf)
'kCn dk iz;ksx fd;kA
laosxkRed cqf) dk vfHkizk; viuh rFkk nwljksa dh Hkkoukvksa rFkk laosxksa dks le>uk vkSj mís';
izkfIr esa mudk mi;ksx gSA laosxkRed cqf) gSA
vr% mi;qZDr fooj.k ls Li"V gS fd lekt esa mPp Lrj djus gsrq] laca/kksa esa ?kfu"Brk cuk;s j[kus
gsrq] okafNr mís';ksa izkfIr gsrq] d{kk esa izFke LFkku izkIr djus gsrq] mPp miyfC/k Lrj izkfIr gsrq vkSj
thou dks lq[ke; ,oa 'kkafriz; cukus esa cqf) dh egRoiw.kZ Hkwfedk gksrh gSA
AUTHOR’S BIOGRAPHY
Akshita Kachhawah, Research Scholar, Department of Education, Deepshikha College University of Technology
National Conference on Global Research for Sustainable Development: Recent Trends, Challenges and Approaches
Volume: 23 | Nov-Dec 2019 | ISSN : 2277-4858
Peer Reviewed National Level Interdisciplinary Journal Page No. - 39
Abstract: The role of the social sciences in analysing and understanding the society has never been emphasised enough. Social scientist
are said to be the backbone of a society. So the work in social science naturally has to be given the importance it deserves. Research in
the area of social sciences therefore acquires key importance. In National and international conferences, Asia in general and India in
particular, the status and role of social scientist and the emerging challenges in policy issues are always discussed. In this context we will
look at,
How social science research can help in governance and development? Especially in a country like India where the election seasons
are very often
How much the social science researches can lead government policy and as well as political parties in formulating their policies, and
on the other hand how the political parties use the social science research in their policy decisions.
Are the social science researches acting as driving policies or helping policy makers and law makers?
Indeed the role of social science research is to understand the society, economy and polity, understand the problem and find out why
the problem exists and then suggests the solutions. Most of the social science researches not only develop an understanding, but also
lead to the policy which the government is supposed to adopt and try to deal the issues. Social science research has a very important
role in developing evidence-based policies and addressing the problems in the country. All the policy making bodies make use of
these social science researches. Political policies are driven by these researches. We also should try to understand as to why there is
so much of mismatch between the political approach and social scientist approach? Today, I am not here to comment on political
issues, but certainly to discuss about the quality of the research. Off course, if the results are of quality and the results are justified
then it develops a faith, thereby the research can be taken into consideration for making policy.
I. INTRODUCTION
Curiosity and inquisitiveness is a distinctive feature of human beings. Curiosity to know about ourselves, our institutions, our
environment, our planets and the Universe is inherent in us. Innumerable questions go on arising in our mind. What are the
parameters of sound health of a person? How problems of health do arise? What are the remedies? What is the shape of the
earth? And so on… Whenever such questions arise we seek answers to them. Whenever we encounter problems, we try to find
solutions to them. Seeking answer to questions and finding the solution to problems have been the basis of human progress. A
systematic search for an answer to a question or a solution to a problem is called research.
II. WHAT IS RESEARCH?
Thus research means a search for a facts or answer to questions and solutions to problems.
Research is a purposive investigation, it is organized inquiry. It seeks to find explanations to unexplained phenomenon, to
clarify the doubtful propositions and to correct the misconceived facts
III. METHODS TO SEARCH FOR THE FACTS
There are two methods to search the facts i.e. Arbitrary and Scientific method.
Arbitrary Method: Arbitrary method of seeking answer to questions is based on imagination, opinions, blind beliefs or
impressions. For example : A big snake swallows the sun or moon causing solar and lunar eclipse. This method suffers
Ethics in Social Science Research
Dr. Abhay M. Patil 1
Prasanna B. Joshi2

National Conference on Global Research for Sustainable Development: Recent Trends, Challenges and Approaches
Volume: 23 | Nov-Dec 2019 | ISSN : 2277-4858
Peer Reviewed National Level Interdisciplinary Journal Page No. - 40
from serious weakness or drawbacks. It is subjective; the finding will vary from person to person depending on his
impression or imaginations. It is vague and inaccurate.
Scientific Methods: This is systematic and rational approach for seeking facts. It eliminate the drawbacks of Arbitrary
methods. It is objective, precise and arrives at conclusions on the basis of verifiable evidences.
IV. WHAT IS ETHICS
Ethics: The term ethics really is synonymous with the term morality its really applied to special realm of human conduct or
typically applied to professional behaviour by definition it implies values.
Ethics is a branch of philosophy, dealing with values relating to human conduct, with respect to the rightness and
wrongness of certain actions and to the goodness and badness of the motive and ends of such action.
Values are deep seated and it tend to remain constant over a period time, it is a strong belief about What is good ?
What is right ? and What is appropriate ?
And they are often based fundamentally on religious teaching
V. ETHICS IN SOCIAL SCIENCE
All scientific activities, including those of research in social science, are conducted
with the participation of human beings and it has an impact on human beings or on the wider society and environment.
Therefore, it is essential that researchers must understand the ethical issues and the implications of their scientific work and act
accordingly. For making ethical judgement, the researchers rely upon various standards of ethics, which could be universal or
specific to the culture(s) or localities.
Indeed, it is essential that researchers share and discuss the ethical issues in their work and evolve collective standards of their
own.The issue of ethics in social sciences, unlike in medical research, has been given less prominence in India. Although many
social scientists have paid serious attention to the appropriate conduct of research and set personal examples, they are often not
discussed as ethics and no efforts are made to formalise some guidelines based on such experience(s). Our national councils for
social science research and their institutions have many guidelines either as administrative orders or for improving the quality
of research but enough efforts have not been made to bring them together as comprehensive ethical guidelines. Besides, in the
absence of such comprehensive guidelines, ethics are hardly there in the social science education curriculum.
There has been a steady growth of research in the social sciences in India. A wide range of research topics and issues
including those that have the potential to seriously invade the privacy and security of individuals are being studied.
Methodologies employed for such research have also expanded in range and depth. There is a considerable increase in the
types and numbers of individuals and institutions undertaking such research and those sponsoring and funding it. While it is
encouraging that social science research are getting the attention they deserve, the growth of research without social and
ethical commitment could adversely affect the credibility of research, the autonomy of researchers, the quality of research and
the rights of participants. In fact, there is a growing concern about indifference to ethics in some of the social science
researches in India. Social and ethical commitment and self-regulation are, therefore, imperative for all parties in research,
namely, institutions undertaking research, researchers, funders/sponsors and those who publish material generated from
research. Their individual and joint efforts are needed in order to achieve consensus on a common framework for research,
and to improve and strengthen the system and environment in which research is conducted. The ethical principles and
guidelines for research are, therefore, a part of such a process, and also a necessary and desirable step.
National Conference on Global Research for Sustainable Development: Recent Trends, Challenges and Approaches
Volume: 23 | Nov-Dec 2019 | ISSN : 2277-4858
Peer Reviewed National Level Interdisciplinary Journal Page No. - 41
VI. ETHICAL PRINCIPLES AND GUIDELINES
To sensitise and protect researchers who are often under pressures from various quarters/forces while undertaking
research.
To preserve and promote the autonomy of research through the observance of ethics, ethical values and ethical
self-regulation.
To protect and promote the human rights of participants and to sensitise and encourage researchers and organisations to
respect participants' rights and needs.
To improve quality, legitimacy and credibility of social science research
To make ethics an integral part of the planning and methodology of research, and to enable organisations and individuals
to develop appropriate mechanisms for ethical self-regulation.
The four well-known moral principles constitute the basis for ethics in research are:
i. The Principles of Beneficence:
a. Research should also make a positive contribution towards the welfare of people.
It is the moral duty to do good
b. It is the fundamental obligation to act for the benefits of the mankind or research subject
c. Research should make a positive contribution towards the welfare of people or society.
d. The rule that emerges from the principle of beneficence, That, we try to do the greatest good to the greatest
people.....that is beneficence
ii. The Principle of Non-maleficence:
a. Research must not cause harm to the participants in particular and to people in general. It means, it is the moral duty
to do good, but not doing harm.
b. If the researcher is not able to solve the problem then, he should do not make the situation worse for example,
sometimes cure is worse than the illness.
iii. The Principle of Autonomy:
a. Research must respect and protect the rights and dignity of participants.
b. The participants may be subject to social pressure of their peer group
c. This is particularly prevalent in research groups
iv. The Principle of Justice:
a. The benefits and risks of research should be fairly distributed among people.
b. Justice means, treat persons fairly / equally
Ten General Ethical Principles : Presently relevant for social science research in India:
Essentiality: For undertaking research it is necessary to make all possible efforts to get and give adequate consideration
to existing literature/knowledge and its relevance, and the alternatives available on the subject/issue under the study.
Maximisation of public interest and of social justice: Research is a social activity, carried out for the benefit of society.
It should be undertaken with the motive of maximisation of public interest and social justice.
Knowledge, ability and commitment to do research: Sincere commitment to research in general and to the relevant
subject in particular, and readiness to acquire adequate knowledge, ability and skill for undertaking particular research are
essential prerequisites for good and ethical research.
Respect and protection of autonomy, rights and dignity of participants: Research involving participation of
individual(s) must not only respect, but also protect the autonomy, the rights and the dignity of participants. The
participation of individual(s) must be voluntary and based on informed consent
National Conference on Global Research for Sustainable Development: Recent Trends, Challenges and Approaches
Volume: 23 | Nov-Dec 2019 | ISSN : 2277-4858
Peer Reviewed National Level Interdisciplinary Journal Page No. - 42
Privacy, anonymity and confidentiality: All information and records provided by participants or obtained directly or
indirectly on/about the participants are confidential. For revealing or sharing any information that may identify
participants, permission of the participants is essential.
Precaution and risk minimisation: All research carries some risk to the participants and to society. Taking adequate
precautions and minimising and mitigating risks is, therefore, essential.
Non-exploitation: Research must not unnecessarily consume the time of participants or make them incur undue loss of
resources and income. It should not expose them to risks due to participation in the research. The relationship within the
research team, including student and junior members, should be based on the principle of non-exploitation. Contribution
of each member of the research team should be properly acknowledged and recognised.
Public domain: All persons and organisations connected to research should make adequate efforts to make public in
appropriate manner and form, and at appropriate time, information on the research undertaken, and the relevant results
and implications of completed research.
Accountability and transparency: The conduct of research must be fair, honest and transparent. It is desirable that
institutions and researchers are amenable to social and financial review of their research by an appropriate and
responsible social body. They should also make appropriate arrangements for the preservation of research records for a
reasonable period of time.
Totality of responsibility: The responsibility for due observance of all principles of ethics and guidelines devolves on all
those directly or indirectly connected with the research. They include institution(s) where the research is conducted,
researcher(s), sponsors/funders and those who publish material generated from research.
VII. RIGHTS AND RESPOSIBILITIES OF RESEARCHERS AND INSTITUTIONS
A. Relationship between researchers and institutions
Institutions have a responsibility to respect the autonomy of researchers and the ethical guidelines for
research.Institutions should create and maintain an environment with adequate support systems to enable researchers to
follow ethical guidelines.Institutions have a responsibility to take appropriate and adequate steps for protection against
pressures inimical to the observance of ethical guidelines for research.
B. Protection and promotion of integrity in research
Researchers have a right, as well as a responsibility, to refrain from undertaking or continue undertaking any research that
contravenes ethical guidelines, violates the integrity of research and/or compromises their autonomy in research,
including design methodology, analysis and interpretation of findings and publication. If they feel that their rights are
being violated, or that the study is unethical, they should make all possible efforts at making corrections. In the event of
failure of remedial measures they should exercise their right to terminate the study or to opt out of it.
Researchers should undertake only such research that according to their understanding will be useful to society or for the
furtherance of knowledge on the subject. Researchers should not undertake secret or classified research, any secret
assignment under the garb of research nor research whose findings are to be kept confidential. Researchers have a right as
well as responsibility to make all necessary efforts to bring the research and its findings. Researchers have a responsibility
towards the interests of those involved in or affected by their own work. They should make reasonable efforts to
anticipate and to guard against possible misuse and undesirable or harmful consequences of research. Researchers should
take reasonable corrective steps when they come across misuse or misrepresentation of their work.Researchers should
ensure that there is honesty and transparency at every stage of research as these are indispensable for good and ethical
National Conference on Global Research for Sustainable Development: Recent Trends, Challenges and Approaches
Volume: 23 | Nov-Dec 2019 | ISSN : 2277-4858
Peer Reviewed National Level Interdisciplinary Journal Page No. - 43
research.All parties involved in research and dissemination of its findings should inculcate and practice sensitivity and
respect for culture and other aspects of the group or community studied. Researchers must ensure respect, protection and
promotion of rights of participants. Criteria for the selection of participants of research should be fair, besides being
scientific.Peer review should be an essential part of every research endeavour or initiative, and should be sought at
various stages of research.
VIII. OTHER ETHICAL ISSUES
Plagiarism
Self Plagiarism
Unnecessary use of statistical tool
Non-publication of data
Faulty data-gathering procedures
Poor data storage and retention
IX. CONCLUSION
Social and ethical commitment and self-regulation are, therefore, imperative for all parties in research, namely, institutions
undertaking research, researchers, funders/sponsors and those who publish material generated from research. The individual
and joint efforts are needed in order to achieve consensus on a common framework for research, and to improve and strengthen
the system and environment in which research is conducted. The ethical principles and guidelines for research are, therefore, a
part of such a process, and also a necessary and desirable step.
AUTHOR’S BIOGRAPHY
\
1. Dr. Abhay M. Patil Assistant Professor & Head, Department of Studies in Geogrpahy, Rani Parvati Devi College,
Belagavi. Email: [email protected] 2. Prasanna B Joshi, Assistant Professor & Head, Dept. of studies in Economics, Rani Parvati Devi College of Arts & Commerce, Belagavi. Email: [email protected]

National Conference on Global Research for Sustainable Development: Recent Trends, Challenges and Approaches
Volume: 23 | Nov-Dec 2019 | ISSN : 2277-4858
Peer Reviewed National Level Interdisciplinary Journal Page No. - 44
Abstract: Global food security will remain a worldwide concern for the next 50 years and beyond. The global food security challenge is
straightforward: by 2050, the world must feed 9 billion people. The demand for food will be 60% greater than it is today. The United
Nations has set ending hunger, achieving food security and improved nutrition, and promoting sustainable agriculture as the second of
its 17 Sustainable Development Goals (SDGs) for the year 2030.
To achieve these objectives requires addressing a host of issues, from gender parity and ageing demographics to skills development and
global warming. Agriculture sectors have to become more productive by adopting efficient business models and forging public-private
partnerships. And they need to become sustainable by addressing greenhouse gas emissions, water use and waste. The risks:
malnutrition, hunger and even conflict.
Keywords: Global Security, Hunger, Food Security, Sustainable Agriculture, Malnutrition etc.
I. INTRODUCTION
Nearly a billion people across the world experience the effects of food insecurity. According to the United States Agency for
International Development (USAID), food security means having, at all times, both physical and economic access to sufficient
food to meet dietary needs for a productive and healthy life. Put more simply, families are able to afford and obtain enough
nutritious food. A family is food secure when its members do not live in hunger or fear of hunger. Both in the United States and
in developing nations, food insecurity is often linked to poverty. Shifts in the global economy, including rises in global food
and oil prices, can affect food security throughout the world, with especially severe effects in low-income countries.
II. ASPECTS OF FOOD SECURITY
The World Health Organization (WHO) defines three main aspects of food security. The first is food availability, having a
sufficient supply of food available on a consistent basis. This food can be either locally produced or imported from other
places. In some cases, communities may be unable to produce their own food locally because of inappropriate agricultural
technologies or practices; lack of natural resources or productive land; climate constraints; emergency situations like natural
disasters; or health constraints, such as HIV/AIDS, that prevent people from engaging in labor. Communities may be unable to
import food from other places because of issues like lack of foreign exchange, political unrest, or lack of transportation.
The second aspect of food security is food access, having sufficient resources to obtain appropriate foods for a nutritious diet.
Even when a sufficient supply of food exists to feed everyone, food may not always be accessible to everyone. People need to
have sufficient incomes and resources in order to obtain food. There are a number of factors that can affect a person's economic
access to food, including lack of job opportunities that can provide sufficient income, or lack of training or business knowledge
for success with income generating activities.
The final aspect of food security is known as food utilization, or consuming a nutritious diet. This means that people make
appropriate use of food, based on knowledge of basic nutrition and care, and have access to water and sanitation for preparing
food and maintaining proper hygiene.
Global Food Security
Divya Vishnoi 1
Jitendra Kumar Yogi2
National Conference on Global Research for Sustainable Development: Recent Trends, Challenges and Approaches
Volume: 23 | Nov-Dec 2019 | ISSN : 2277-4858
Peer Reviewed National Level Interdisciplinary Journal Page No. - 45
III. SOME IMPORTANT FACTS AND SUGGESTIONS
Nutrition education can be an important part of improving food utilization-making sure people are aware of the variety of foods
their bodies need to maintain good health. In many parts of the world experiencing food insecurity, people may consume
sufficient quantities of starchy staple foods like potatoes, rice, maize, and cassava, but insufficient quantities of protein, oils,
dairy, fruits and vegetables that make up a balanced diet. Changing this may not only require nutrition education, but also
increasing food availability through improved agricultural practices and resources. Looking at food security globally, the
number of people experiencing food insecurity in developed nations makes up only about two percent of the global. The United
Nations Food and Agriculture Organization (FAO) states that 925 million people in the world are undernourished. The largest
percentage of undernourished people live in Asia and the Pacific Islands, followed by Sub-Saharan Africa. Fortunately, there is
enough food in the world today for everyone to have the nourishment they need for a healthy and productive life. A key factor
in addressing the world's food security challenges is improving the availability, access, and utilization of food across global
communities.
IV. THE CHALLENGE
Food security occurs when all people are able to access enough safe and nutritious food to meet their requirements for a healthy
life, in ways the planet can sustain into the future. However, food security faces a number of challenges across both production
and consumption which research will be essential to solve.
Many countries are facing the double burden of hunger and undernutrition alongside overweight and obesity, with one in three
people across the globe currently suffering from some form of malnutrition. Indeed it is not unusual to find people with
different forms of malnutrition living side-by-side in one country, in one community, or even in the same household.
The prevalence rates of overweight, obesity and diet-related noncommunicable diseases (NCDs) such as cardiovascular
disease, stroke, certain cancers and type II diabetes, are increasing in every region, in both developed and developing countries.
Globally there are now more people who are overweight or obese than underweight, with the two combined accounting for
more than half of the world population: a new normal . The estimated cost to the world economy of disease and death from
overweight and obesity is $2 trillion. At the same time, around 795 million people face hunger on a daily basis and more than
two billion people lack vital micronutrients (e.g. iron, zinc, vitamin A), affecting their health and life expectancy. Nearly a
quarter of all children aged under five today are stunted, with diminished physical and mental capacities, and less than a third
of all young infants in 60 low and middle-income countries meet the minimum dietary diversity standards needed for growth.
Climate change will only make things worse as elevated levels of CO2 reduce the nutritional content of grains, tubers and
legumes, affecting key nutrients such as zinc and iron.
The estimated impact of under nutrition on gross domestic product (GDP) is 11% every year – more than the annual economic
downturn caused by the global financial crisis. A growing population means more mouths to feed. The expanding global
population is getting wealthier, and richer people tend to eat more and demand food that is resource intensive to produce,
particularly meat and dairy. It has been estimated that we need to produce more food in the next 35 years than we have ever
produced in human history, given the projected increases in world population, and on the basis that rising incomes will
continue to change diets. However, there is by good approximation no new land for agriculture, with increasing competition
from urbanisation (the world will be 70% urbanised by 2050), sea level rise reducing land availability, and the growing need
for land for bioenergy, carbon capture and storage (BECCS) to remove greenhouse gases (GHGs) from the atmosphere. This
implies sustainable intensification (SI) of agriculture on the land that is available (i.e. produce more without expanding the
agricultural area) . Food production is ultimately dependent on other ecosystem services so it is essential that these are

National Conference on Global Research for Sustainable Development: Recent Trends, Challenges and Approaches
Volume: 23 | Nov-Dec 2019 | ISSN : 2277-4858
Peer Reviewed National Level Interdisciplinary Journal Page No. - 46
maintained. For example, agriculture uses 70% of all fresh water, produces around a third of all GHG emissions, and
contributes to biodiversity loss and soil degradation (around 69% of agricultural land is degraded). If food demand continues to
grow as projected, by 2050 we would need 120% more water, 42% more cropland, lose 14% more forest, and produce 77%
more GHG emissions. Even with yield gap closure through SI, we would still need 56% more water, 5% more cropland, lose
8% more forest and produce 42% more GHG emissions. It is clear that we will need to use every technology available,
alongside best practice farming to sustainably increase production, but this has to be accompanied by changes to food demand
including measures on both consumption and waste.
A major challenge is understanding how can we re-design the food system to be healthy, sustainable, and more resilient to
climate change, helping to meet both the Sustainable Development Goals and the Paris Agreement. Achieving food security
needs policy and investment reforms on multiple fronts, including human resources, agricultural research, rural infrastructure,
water resources, and farm- and community-based agricultural and natural resources management. Increased investment in
people is essential to accelerate food security improvements. In agricultural areas, education works directly to enhance the
ability of farmers to adopt more advanced technologies and crop-management techniques and to achieve higher rates of return
on land. Moreover, education encourages movement into more remunerative nonfarm work, thus increasing household
income. Women’s education affects nearly every dimension of development, from lowering fertility rates to raising
productivity and improving environmental management Poverty reduction is usually enhanced by an increase in the proportion
of educational resources going to primary education and to the poorest groups or regions. Investments in health and nutrition,
including safe drinking water, improved sewage disposal, immunization, and public health services, also contribute to poverty
reduction Making substantial progress in improving food security will be difficult Together with investment in research and
water and transport infrastructure, we can make major improvements to global food security.
REFERENCES
Anderson, J.R., 2018a. Concepts of food sustainability. In: Ferranti, P., Berry, E., Anderson, J.R. (Eds.), Encyclopedia of Food
Security and Sustainability.
Anderson, J.R., 2018b. Concepts of food stability in food security. In: Ferranti, P., Berry, E., Anderson, J.R. (Eds.), Encyclopedia
of Food Security and Sustainability.
Berry, E.M., Dernini, S., Burlingame, B., Meybeck, A., Conforti, P., 2015. Food security and sustainability: can one exist without
the other? Public Health Nutr. 18, 2293–2302. Expert Panel of the American Institute of Nutrition & Life Science Research Office,
1990
FAO, 1983. World Food Security: A Reappraisal of the Concepts and Approaches. Director General’s Report. FAO, Rome.
FAO, 1996. Rome Declaration on Food Security and World Food Summit Plan of Action. FAO, Rome.
FAO, 2002. The State of Food Insecurity in the World 2001. FAO, Rome.
FAO, 2008. Food Security Information for Action: Practical Guides. EC - FAO Food Security Programme, Rome.
FAO, 2009. Declaration of the World Food Summit on Food Security. FAO, Rome. 9. FAO, 2018. The Food Insecurity Experience
Scale. Voices of the Hungry.
FAO, IFAD and WFP, 2015. The State of Food Insecurity in the World 2015. Meeting the 2015 International Hunger Targets:
Taking Stock of Uneven Progress. FAO, Rome.
FAO, IFAD, UNICEF, WFP and WHO, 2017. The State of Food Security and Nutrition in the World 2017– Building Resilience for
Peace and Food Security. FAO, Rome.
FAO, WFP and IFAD, 2012. The State of Food Insecurity in the World 2012: Economic Growth Is Necessary but Not Sufficient to
Accelerate Reduction of Hunger and Malnutrition. FAO, Rome.
FAO, WFP and IFAD, 2013. The State of Food Insecurity in the World 2013: The Multiple Dimensions of Food Security. FAO,
Rome.
Headey, D., 2011. Was the Global Food Crisis Really a Crisis? IFPRI, Washington DC.

National Conference on Global Research for Sustainable Development: Recent Trends, Challenges and Approaches
Volume: 23 | Nov-Dec 2019 | ISSN : 2277-4858
Peer Reviewed National Level Interdisciplinary Journal Page No. - 47
HLPE, 2012. Social Protection for Food Security. HLPE Report 4. A report by the High Level Panel of Experts on Food Security
and Nutrition of the Committee on World Food Security (HLPE), Rome.
HLPE Report 12. A report by High Level Panel of Experts on Food Security and Nutrtion of the Committee on World Food
Security (HLPE), Rome.
National Research Council, 2006. Food Insecurity and Hunger in the United States: An Assessment of the Measure.
National Research Council, Washington, DC. Peng, W., Berry, E.M., 2018. Global Nutrition 1990–2015: a shrinking hungry, and
expanding fat world.
UN Development Programme, 1994. Human Development Report. Oxford University Press, Oxford and New York.
United Nations, 1975. Report of the World Food Conference, Rome, 5–16 November 1974. United Nations, New York.
World Bank, 1986. Poverty and Hunger: Issues and Options for Food Security in Developing Countries. World Bank, Washington,
DC.
AUTHOR’S BIOGRAPHY
\
1. Divya Vishnoi, Research Scholar, Raj Rishi Bhartrihari Matsya University, Alwar, Rajasthan
Email : [email protected]
2. Jitendra Kumar Yogi, Research Scholar, Raj Rishi Bhartrihari Matsya University, Alwar, Rajasthan
Email: [email protected]
National Conference on Global Research for Sustainable Development: Recent Trends, Challenges and Approaches
Volume: 23 | Nov-Dec 2019 | ISSN : 2277-4858
Peer Reviewed National Level Interdisciplinary Journal Page No. - 48
tyok;q ifjorZu dk izHkko v/;;u {ks= djkSyh CykWd esa Hkh D;k jgs gS\ blh ds vfHkKku ds fy,
izLrqr 'kks/k i= dk eq[; mís'; gS ftlls djkSyh CykWd ds tyok;q ifjorZu izHkkokvksa dk vkadyu
dj muds izfr i;kZoj.kh; vuqdwyu dks izkIr djus ds iz;kl fd;s tk ldsA v/;;u {ks= djkSyh
CykWd esa gq, tyok;q ifjorZu vkaf'kd izHkko dh >yd d`f"k Qlyksa ij fn[kkbZ nsus yxh gSA ftlls
Qly pØ] Qly izfr:i ds le; esa cnyko gks jgk gS dqN Qlys tYnh gh rS;kj gksus dh fLFkfr
esa vk tkrh gS ogh mudk mRiknu dh ek=k ,oa xq.kkRedrk Hkh izHkkoh gqbZ gSA ftlesa [kk| ,oa frygu
Qlys vf/kd izHkkfor gksus dh fLFkfr esa jgh gSA
v/;;u {ks=
djkSyh CykWd ftldk v{kka'kh; foLrkj 26º26'15" mÙkjh v{kka'k ls 26º33'45" mÙkjh v{kka'k rFkk
ns'kkUrjh; foLrkj 76º54' iwohZ ns'kkUrj ls 79º9'15"iwohZ ns'kkUrj ds e/; fLFkr gSA bldk dqy
HkkSxksfyd {ks=Qy 1024 oxZ fdeh gSA ;g djkSyh CykWd dk e/;orhZ Hkkx gSA vofLFkfr ds vUrxZr
blds mÙkj if'pe esa rglhy ds xkao gh vofLFkr gSA
djkSyh ftys dk og Hkkx gS tgka o"kkZ dk fooj.k lkekU; ls vf/kd jgrk gS rFkk ;gka dh viokg
iz.kkyh Hkh tyxzg.k dh mi;qDr n'kkvksa dks izLrqr djrh gSA v/;;u {ks= esa eq[;r% 6 xzke iapk;rksa
dks 'kkfey fd;k x;k gS ftuesa yxHkx 29 jktLo xzke 'kkfey gSA ;s lEiw.kZ v/;;u {ks= djkSyh
CykWd ds pkjks vksj yxHkx 20 fdeh dh nwjh rd QSys gq;s gSA
'kks/k v/;;u ds mís';
1- tyok;q ifjorZu dh O;k[;k djukA
2- ifjorZu ds Lrj dk vkadyu djukA
3- n'kdh; ifjorZu izo`fÙk dk vfHkKkuA
tyok;q ifjorZu izHkko % djkSyh CykWd ds lanHkZ esa
,d HkkSxksfyd v/;;u
Beeram Singh Gurjar

National Conference on Global Research for Sustainable Development: Recent Trends, Challenges and Approaches
Volume: 23 | Nov-Dec 2019 | ISSN : 2277-4858
Peer Reviewed National Level Interdisciplinary Journal Page No. - 49
26030' W 26027'30”N
ifjdYiuk,¡
1- v/;;u {ks= dk Hkwfe mi;ksx ifjorZu gqvk gSA
2- Qly pØ ds Øe esa cnyko gqvk gSA
3- mUur [kkn~ chtksa dk mi;ksx esa o`f) gqbZ gSA

National Conference on Global Research for Sustainable Development: Recent Trends, Challenges and Approaches
Volume: 23 | Nov-Dec 2019 | ISSN : 2277-4858
Peer Reviewed National Level Interdisciplinary Journal Page No. - 50
v/;;u fof/k
izLrqr 'kks/k dk;Z esa djkSyh CykWd esa tyok;q ifjroZu ds izHkkoksa dk v/;;u gsrq f}rh; vkadM+ksa dk
lg;ksx fy;k x;k gS] ftlesa vkadM+ksa }kjk rkfydkvksa dk fuekZ.k] izfr'kr] n'kdh; ifjorZu ds vafdr
fd;k x;k rFkk v/;;u dh Li"Vrk ,oa fo"k; oLrq izkIr ds vuqlkj vkjs[kksa ekufp= vkfn dk lg;ksx
izkIr fd;k rFkk v/;;u dk fo'ys"k.k Øfed :i ls fd;k x;k gSA
Hkwfe mi;ksx ,oa tyok;q ifjorZu
v/;;u {ks= esa tyok;q ifjorZu esa lokZf/kd izHkko Hkwfe mi;ksx ij gqvk gS ftlls d`f"k Qlyksa ds
{ks= esa izHkko iM+k gSA budk Øfed [kk|~ ,oa frygu Qlyksa ds lkFk 'kq"d Qlyksa ds {ks= ij izHkko
vf/kd iM+k gSA ftlds v/;;u dh Li"V ds fy, Hkwfe mi;ksx ds v/;;u dks 'kkfey fd;k gS ftldk
fuEu izdkj fo'ys"k.k fd;k x;k gS%&
ou {ks=
ou izd`fr dh ,d vewY; nsu gS ouLifr tks ekuo ds gLr{ksi ds fcuk gh i`Foh ij izlkfjr gS] izkd`frd
ouLifr dgykrh gSA
izkd`frd lalk/kuksa esa ouksaa dk egRoiw.kZ LFkku gSA ouksaa dh Hkkjrh; laLd`fr ,oa tutohu ls izkphu
dky ls gh vVwV lEcU/k jgk gSA ou i`Foh ij izkjfEHkd dky ls gh i'kq&i{kh ,oa ekuo tkfr dh
'kj.kLFkyh ,oa thou fuokZg dk izeq[k lk/ku jgs gSaA Hkkjr esa fofHkUu /kkfeZd voljksa ij cjxn]+ ihiy]
dsyk] vkWoyk] rqylh vkfn o`{kksa dh iwtk dh tkrh gSA vkt ls rhu 'krkCnh iwoZ i`Foh dk 60 izfr'kr
Hkkx izkd`frd ouksaa ls <dk gqvk FkkA
v/;;u {ks= djkSyh CykWd esa ou {ks= ds vUrZxr o"kZ 1991 esa 1967-94 gSDVs;j Hkkx Fkk tks dqy
Hkwfe 12-38 izfr'kr FkkA blh izdkj ;g c<+dj o"kZ 2011 esa 3123-6 gSDVs;j gks x;k tks dqy Hkwfe
dk 19-39 izfr'kr jgk gSA foxr chl o"kksZa blds vUrxZr 7-01 izfr'kr dh o`f) gqbZ gS ftldk dkj.k
ou fodkl dk;ZØe jgs gSA ¼rkfydk & 1½

National Conference on Global Research for Sustainable Development: Recent Trends, Challenges and Approaches
Volume: 23 | Nov-Dec 2019 | ISSN : 2277-4858
Peer Reviewed National Level Interdisciplinary Journal Page No. - 51
rkfydk & 1
djkSyh CykWd Hkwfe mi;ksx ifjorZu fooj.k o"kZ 1991 & 2011
Hkwfe
oxhZdj.k
o"kZ 1991 o"kZ 2011 chl o"khZ;
ifjorZu
{ks=Qy ¼gS0½ izfr'kr {ks=Qy ¼gS0½ izfr'kr
ou 1967-94 12-38 3123-6 19-39 7-01
flafpr {ks= 1641-64 10-33 1883 11-68 1-35
vflafpr {ks= 3300-37 20-76 2835-7 17-60 &3-16
d`f"k ;ksX;
catj Hkwfe
1733-12 10-90 1445-8 8-97 &1-93
d`f"k ds fy,
vuqiyC/k
Hkwfe
2312-21 14-54 2103-2 13-06 &1-48
'kq) cks;k
x;k {ks=
4942-01 31-09 4718-7 29-30 &1-79
dqy 15897-29 100 16110 100 &
lzksr%& ftyk tux.kuk iqfLrdk ,oa lh-Mh-] o"kZ 1991&2011
flafpr {ks=
flafpr {ks= ds vUrxZr jch ,oa [kjhQ Qlyksa dh ty }kjk flapkbZ dh tkrh gSA ftls flapkbZ ds
vUrxZr 'kkfey fd;k tkrk gSA v/;;u {ks= djkSyh CykWd esa flafpr {ks= ds vUrZxr o"kZ 1991 esa
1641-64 gSDVs;j Hkkx Fkk tks dqy Hkwfe 10-33 izfr'kr FkkA blh izdkj ;g c<+dj o"kZ 2011 esa 1883
gSDVs;j gks x;k tks dqy Hkwfe dk 11-68 izfr'kr jgk gSA foxr chl o"kksZa blds vUrxZr 1-35 izfr'kr
dh o`f) gqbZ gS ftldk dkj.k o"kkZ dh deh ,oa flapkbZ ds lk/kuksa esa o`f) jgh gSA

National Conference on Global Research for Sustainable Development: Recent Trends, Challenges and Approaches
Volume: 23 | Nov-Dec 2019 | ISSN : 2277-4858
Peer Reviewed National Level Interdisciplinary Journal Page No. - 52
vflafpr {ks=
vflafpr {ks= ds vUrxZr [kjhQ Qlyksa dks mRiknu fd;k tkrk gSA ;s Qlys iw.kZr% o"kkZ ij vk/kkfjr
gksrh gS rFkk buesa o"kkZ dh deh ij dqN ek=k esa flapkbZ dh Hkh vko';drk gksrh gSA v/;;u {ks=
djkSyh CykWd esa vflafpr {ks= ds vUrZxr o"kZ 1991 esa 3300-37 gSDVs;j Hkkx Fkk tks dqy Hkwfe 20-76
izfr'kr FkkA blh izdkj ;g de gks dj o"kZ 2011 esa 2835-7 gSDVs;j gks x;k tks dqy Hkwfe dk 17-60
izfr'kr jgk gSA foxr chl o"kksZa blds vUrxZr 3-16 izfr'kr dh deh jgh gS ftldk dkj.k flafpr
{ks= esa o`f) gksuk vFkkZr~ vflafpr {ks= esa Hkh flapkbZ }kjk d`f"k mRiknu gksus yxh gSA tks o"kkZ dh
deh dks Li"V djrk gSA
d`f"k ;ksX; catj Hkwfe
d`f"k ;ksX; ijUrq catj Hkwfe ds vUrxZr ml Hkwfe dks j[kk tkrk gS tks d`f"k ds fy, rks mi;qDr
gS] fdUrq fdUgha dkj.kksa ls d`f"k ds mi;ksx esa ugha yh tk jgh gSA bl CykWd esa d`f"k;ksX; ijrh Hkwfe
dks jktLo fjdkMZ esa flok; pd ds uke ls tkuk tkrk gSA bl Hkwfe dks ljdkj le;≤ ij
Hkwfeghu d`"kdkas ,oa vuqlwfpr tkfr ,oa tutkfr ds yksxksa dks jktLo f'kfoj vk;ksftr djds xjhc
rcds yksxksa dks d`f"k gsrq miyC/k djkrh gSA futh LokfeRo esa Hkh d`f"k ;ksX; catj Hkwfe gks ldrh
gSA
blds vUrxZr v/;;u {ks= djkSyh CykWd esa o"kZ 1991 esa 1733-12 gSDVs;j Hkkx Fkk tks dqy Hkwfe 10-90
izfr'kr FkkA blh izdkj ;g de gks dj o"kZ 2011 esa 1445-8 gSDVs;j gks x;k tks dqy Hkwfe dk 8-97
izfr'kr jgk gSA foxr chl o"kksZa blds vUrxZr 1-93 izfr'kr dh deh gqbZ gSA
d`f"k ds fy, vuqiyC/k Hkwfe & blds vUrxZr v/;;u {ks= esa o"kZ 1991 esa 2312-21 {ks= Fkk tks dqy
Hkwfe dk 14-54 izfr'kr FkkA tcfd ;g 2011 esa ?kVdj 2103-2 gSDVs;j jg x;k tks dqy Hkwfe dk
13-05 izfr'kr gSA foxr 20 o"kkZsa esa blds vUrxZr 1-48 izfr'kr deh gqbZ gSA
'kq) cks;k x;k {ks=Qy
okLrfod cks;s x;s {ks= dks 'kq) cks;k x;k {ks= ;k fujk cks;k x;k {ks= Hkh dgk tkrk gSS bl {ks=
ls rkRi;Z ,d o"kZ esa okLro esa cks;s x;s {ks= ls gSA okLrfod cks;k x;k {ks= dh x.kuk djus ds fy;s

National Conference on Global Research for Sustainable Development: Recent Trends, Challenges and Approaches
Volume: 23 | Nov-Dec 2019 | ISSN : 2277-4858
Peer Reviewed National Level Interdisciplinary Journal Page No. - 53
dqN Qlyh {ks= ;k leLr cks;s x;s {ks= esa ls Åit {ks= vFkkZr ,d ckj ls vf/kd cks;s x;s {ks=
dks ?kVk fn;k tkrk gSA
okLrfod cks;k x;k {ks= esa flafpr ,oa vflafpr {ks= dks 'kkfey fd;k tkrk gSA blds vUrxZr v/;;u
{ks= esa o"kZ 1991 esa 4942-01 {ks= Fkk tks dqy Hkwfe dk 31-09 izfr'kr FkkA tcfd ;g 2011 esa ?kVdj
4718-7 gSDVs;j jg x;k tks dqy Hkwfe dk 29-30 izfr'kr gSA ¼vkjs[k&1½ foxr 20 o"kkZsa esa blds vUrxZr
1-79 izfr'kr deh gqbZ gSA
vkjs[k & 1

National Conference on Global Research for Sustainable Development: Recent Trends, Challenges and Approaches
Volume: 23 | Nov-Dec 2019 | ISSN : 2277-4858
Peer Reviewed National Level Interdisciplinary Journal Page No. - 54
fu"d"kZ
vr% v/;;u ls Li"V gS fd blds {ks= esa 1-79 dh deh gqbZ tks Qlyh {ks= dh deh dks n'kkZrk
gS ftldk izeq[k dkj.k o"kkZ dh deh lokZf/kd izHkkoh jgh gSA ¼rkfydk 1½
tyok;q ifjorZu us Hkwfe mi;ksx dks izHkkfor fd;k gS ftlesa ou {ks= esa 7-01 izfr'kr dh o`f) gqbZA
blh izdkj flafpr {ks= ds vUrxZr 1-35 izfr'kr dh o`f) gqbZ ftldk dkj.k flapkbZ dh vko';drk
dk c<+uk gSA tks tyok;q ifjorZu dks Li"V djrk gSA vflafpr {ks= ds vUrxZr 3-16 izfr'kr dh
deh vFkkZr flafpr {ks= dk c<+uk ;k vflafpr d`f"k Hkh flafpr d`f"k esa cnyxbZ tks tyok;q vFkkZr~
o"kkZxr dkjd dk izHkko jgk gSA
d`f"k ;ksX; catj Hkwfe esa foxr chl o"kksZa ds vUrxZr 1-93 dh deh gqbZ vFkkZr~ ;gka flapkbZ lqfo/kkvksa
ls d`f"k ;ksX; catj Hkwfe esa deh gqbZ gSA blh izdkj d`f"k ds vuqiyC/k Hkwfe esa 1-46 izfr'kr dh deh
gqbZA blh izdkj v/;;u {ks= ds eq[; Qlyh {ks= 'kq) cks;k x;k {ks= esa 1-79 izfr'kr dh chl o"khZ;
deh ;g Li"V djrh gS fd Qlyksa dh deh gksus ls 'kq) cks;k x;k {ks= esa 1-79 izfr'kr dh deh
vkbZ gSA ftldk dkj.k feV~Vh ,oa ok;qe.My esa ueh dh deh gS] ;g tyok;q n'kkvksa vFkkZr~ tyok;q
ifjorZu dk izHkko gSA
REFERENCES
Anderson, J.R., 1976: Landuse Landcover Changes – A Framework for Monitoring, Journal of Research, U.S.
Geological Survey, Volume 5, No.3 143-153.
Lillesand, T.M. & Keifer, R.W., 1979 Remote Sensing and Image Interpretation, New York : John Wiley & Sons, Inc,
2-10.
'kekZ ,p-,l-] 'kekZ ,e-,y- ¼2006½ % & jktLFkku dk Hkwxksy] iap'khy izdk'ku] t;iqjA
Ekgoj xksihyky o izlkn jkek ¼2010½ % jktLFkku esa Hkwfe mi;ksx dk HkkSxksfyd fo'ys"k.k vWukYl vad XXVII i`"B 210&217
dqekj mins'k] ¼2009½ Hkjriqj ftys esa d`f"k vk/kkfjr m|ksxksa dk HkkSxksfyd v/;;u] vizdkf'kr 'kks/k izcU/k Hkwxksy foHkkx] jktLFkku
fo'ofo|ky;] t;iqjA
cuthZ mik/;k;] ¼1992½ % tyok;q foKku] fgUnh xzUFk vdkneh] t;iqjA
lSuh] 'kadj ¼2005½ % Hkjriqj ftys esa d`f"k ikfjfLFkfrdh dk v/;;u] vizdkf'kr 'kks/k izcU/k Hkwxksy foHkkx] jktLFkku fo'ofo|ky;]
t;iqjA
AUTHOR’S BIOGRAPHY
Beeram Singh Gurjar, Scholar, Department of Geography, Rajasthan University, Jaipur, Rajasthan
National Conference on Global Research for Sustainable Development: Recent Trends, Challenges and Approaches
Volume: 23 | Nov-Dec 2019 | ISSN : 2277-4858
Peer Reviewed National Level Interdisciplinary Journal Page No. - 55
Abstract:
Leasing: A contract granting use of assets during a specified time for a specified consideration.
“Leasing is effectively source of finance but it always relates to specific assets. Under a lease contract, the ownership of the assets
remains with the lessor whilst the use of the assets is available to the lease in return of the payment of a fixed rental. Lease finance is very
similar to debt in that the lease payment is a fixed contractual obligation. Leasing will therefore, increase the level of gearing and
financial risk of the company. There is a need to look at the financial implications of leasing and especially at the tax implication for both
the lessor and the lessee”.
I. INTRODUCTION OF THE STUDY
A lease is a contractual arrangement whereby one party i.e. the owner of an asset grants the other party “the right to use “in
return for a periodical fixed payment. The one who essentially rents the asset is known as the lessee”. A lessee can be an
individual, a firm or a company interested in the use of the asset without owing it, while the lessor may be the seller, a supplier,
a finance company or the manufacturer who can acquire the asset using his own funds or taking finance from financial
institution. Under the lease contract, the ownership of the asset always reset with the lessor whereas the use of the assets is
available to the lessee. In return, the lessee has to pay a fixed periodical amount to the lesser. This periodical payment is known
as the lease rental. Normally, the lease rental is fixed and the amount and timings of its payment are a matter of agreement
between the lessor and the lessee.
II. SCOPE OF THE STUDY
Whether Leasing is a cost effective tool to increase the sale. Is Leasing is a viable business and to understand the Leasing
Business.
III. UTLITY OF THE STUDY
This study will help us to understand the leasing business, how leasing is cost effective ,whether developed countries should
emphasize on leasing business to develop their economic growth, what all parameters need to be taken care of give the
appropriate support to developing the leasing industry and how can the lessee use the assets without owing the same.
IV. TERMS OF LEASE
The term’s duration may be conditional; in which case, it lasts until some specified event occurs, for example the quantum of
specified usage. The term of the Automobile lease may be fixed, periodical or of indefinite duration.
Role of Leasing in Economical Growth with Special Reference to Automobile Industries in India
Dr. Ranjeeta Bhandari
National Conference on Global Research for Sustainable Development: Recent Trends, Challenges and Approaches
Volume: 23 | Nov-Dec 2019 | ISSN : 2277-4858
Peer Reviewed National Level Interdisciplinary Journal Page No. - 56
V. EVOLUTION OF LEASING IN INDIA
Mr.A.C.Muthia and MR.Farrouk Irani formed the very first Indian Leasing by the name of “First Leasing Company of India
Ltd: in 1973.In 1981 the trend change and many financial institutions started offering Leasing product. The four major players
were Shetty Investment &Finance ,jaybharat Credit & Investment, Motor General Finance and Sunaram Finance. In 1982
many commercial banks announced a leasing business or took the initiative to get the leasing business started in 1994 RBI
allowed banks to offer financial Leasing to pamper the leasing market.
In 1996 GE Capital and ORLX both international successful player entered Leasing market. Both the company was only
focused on Financial Leasing and was not mature to deliver the operating Lease product.
In 1999, Lease Plan corporation Netherlands, then a wholly owned subsidiary of ABN AMRO Bank and now owned by
Volkswagen financial services launched its operation in India by the name of Lease Plan India Ltd. Lease Plan globally owns
and manages a fleet of over 1.2 million vehicles in more than 34 countries and was totally prepared to offer different
combinations of Operating Lease products in market. This was a revolutionary ere as before this none of the leasing companies
offered fully operating lease product. After that in 2005 ,three major international player entered into Indian Automobile
Leasing market by the name of ALD,ARVALand HERTZ all of them are offering Operating Lease products to MNC’s and the
Public sector.
VI. DEFINITION OF LEASING
In very simple way we can define a Lease as a process by which a firm can obtain the use of a certain fixed asset for which it
must pay a series of contractual taxes. Leasing typically starts for a minimum tenure of 12 months and doesn’t provide for east
termination or vehicle swapping. Moreover a dedicated vehicle is provided by the Lessor to the Lessee and it remains in
“Possession and Control” of the Lessee.
VII. DIFFERENT TYPES OF LEASING AGREEMENTS
There are five types of Leasing Agreement which are following:
Financial Lease/Capital Lease
Operating Lease
Sale and Lease Back
Leveraged Leasing
Direct Leasing
a) Financial Leasing / Capital Lease:- Long – term, non – cancellable lease contracts are known as Financial leases.
The essentials point of financial lease agreement is that it contains a condition whereby the lessor agree to transfer the
title for the asset at the end of the lease period at a nominal cost. At least it must give an option to the lessee to
purchase the asset he has used at the expiry of the lease. Under this lease the lessor recovers 90% of the fair value of
the asset as lease rentals and the lease period is 75% of the economic life of the asset.
b) Operating Lease:- An operating lease is an agreement in which the lessee acquires the use of an asset on a period – to
– period basis. It is a lease agreement for a period considerably shorter than the life of the asset. The lessor may lease
the assets to different lessee one after another. The lease one after another. The lease rental payable by one lessee
during his lease period is not sufficient to cover full the cost of the asset plus a reasonable return on that.

National Conference on Global Research for Sustainable Development: Recent Trends, Challenges and Approaches
Volume: 23 | Nov-Dec 2019 | ISSN : 2277-4858
Peer Reviewed National Level Interdisciplinary Journal Page No. - 57
c) Sale and Lease Back:- In sale and lease back the lessee is already the owner of the assets. He, under the lease
agreements, sells the assets to the lessor who, in turn, leases the assets back to the owner (now the lessee). Under the
sale and lease back, the lessee not only retains the use of the assets but also gets funds from the “SALE” of the assets
to the lessor to free their capital.
d) Leveraged Lease:- Under leveraged leasing arrangements, a third party is involved besides the lessor and lessee. The
lessor borrows a part of the purchase cost (say 80%) of the asset from the third party i.e. lender and the asset so
purchased are held as security against the loan.
e) Direct Lease:- In direct Lease, the lessor itself purchases the assets and hands it over to the lessee. Normally
automobile Manufacture under lease agreement delivers the assets to the lessee.
Difference between Operating Lease Vs Outright Purchase by the Company
Leasing is a source of financing provided by the lessor to the lessee. The lessee receives the services of the asset for a
specified period of time in exchange for the payment of fixed lease rental, The only way, the lessee could obtain the
services of the given asset would be to purchase it outright, and the outright purchase of the asset would require
sufficient funds.
Difference between Lease and Bank Loan
The tenure of Leasing is shorter than the Loan recovers entire loan amount of 100% during the tenure and that is why
higher monthly payment needs to be paid where as Leasing recovers only difference between Assets cost minus to
lessee by outsourcing the complete maintenance and all relevant hassle. Weakness is that Lessee pays reasonable
amount of assets cost but does not get any ownership on the assets.
VIII. ADVANTAGE OF LEASING
The biggest benefit of leasing is off balance sheet and the complete Lease rental is taken under expenses head that
gives a tax benefit to the Lessee. The lessee also gets VAT input credit benefit as the Lessor don’t charge the same and
pass on the benefit to the Lessee which reduce the lease rent drastically. As all add on services are included in
operating lease product the lessee can plan his outflow accordingly. Lease rent is calculation happen after deduction
of assets cost minus future residual value, by paying less lessee enjoys benefits of bigger assets.
Leasing industry plays an important role in the economic development of a country by making products affordable to
the large segment of customers.
IX. DISADVANGATES OF LEASING
In leasing, the lessee also plays some part of assets cost; however, at the time of the sale of assets he doesn’t get
benefit of that. The Lessor takes all benefits linked to sale of asset as the absolute ownership vests with the Lessor.
The Lessor hardly discloses he implicit residual value that causes non – clarity of lease rental. Leasing is not suitable
for all types of businesses. The interest rate in case of Leasing is higher than bank loan, as leasing industries add up
their margin on top of Bank Prime lending rate.
National Conference on Global Research for Sustainable Development: Recent Trends, Challenges and Approaches
Volume: 23 | Nov-Dec 2019 | ISSN : 2277-4858
Peer Reviewed National Level Interdisciplinary Journal Page No. - 58
X. CONCLUSION
India is being amongst the top five economies in the world is consistently growing further at a rate of over 7%
annually. It is worth to mention that the growth of the Automobile industry has been contributing significantly to the
GDP. Growth of this industry is a result of the overall growth of the economy, change in the life style of people,
increase in disposable income and lower input cost especially the labour for manufacturing. The Automobile industry
has been growing at a rate of over 16% annually and India will touch a 2 Million Market size within next 2-4 years and
thus will become the second largest market in the world. A considering this potential almost all global car
manufacturers are now present in India. Lot of these has set up their manufacturing hubs in India due to low cost of
components, labour and a hefty increase in domestic consumption. Furthermore, India has become a hub for their
export market too.
T he tremendous growth registered by the automotive sector has attracted almost all global leasing players and they
see a great potential in this sector too. Currently, approx 75% of automotive sales happen through Bank Finance, and
the rest is by other modes via outright purchase, hire purchase, and Lease that is contrary to the Europe and America
where most sales happens by the leasing route. One of the prime factors for this reversal in practice is the Individual’s
credit rating and innovating lease concept wherein the leased car expenses is deductible from the individual’s income
before computation of tax irrespective of the employer. One can change the jobs frequently without change of the
Lessor. The day India accepts this kind of global policy, this Industry will boom and India will follow the global
trends. It is seen that this industry has shown better results during economic recessions as one would always like to
restrict the cash out flow while mitigating all kinds of risks and Leasing provides all these.
AUTHOR’S BIOGRAPHY
\
Dr. Ranjeeta Bhandari, Associate Professor, Vyas Institute of Commerce and Business Administration, Jodhpur
National Conference on Global Research for Sustainable Development: Recent Trends, Challenges and Approaches
Volume: 23 | Nov-Dec 2019 | ISSN : 2277-4858
Peer Reviewed National Level Interdisciplinary Journal Page No. - 59
jktLFkku Hkkjr ds lcls [kwclwjr jkT;ksa esa ls ,d gSA ;gk¡ dh laLÑfr nqfu;kHkj esa e'kgwj gSA jktLFkku
dh laLÑfr esa fofHkUu leqnk;ksa vkSj 'kkldksa dk ;ksxnku gSA vkt Hkh tc dHkh jktLFkku dk uke fy;k
tk, rks gekjh vk¡[kksa ds vkxs Fkkj jsfxLrku] Å¡V dh lokjh] ?kwej vkSj dkycsfy;k u`R; vkSj jax&fcjaxs
ikjEifjd ifj/kku vkrs gSaA vius lH; LoHkko vkSj 'kkyhu esgekuuokth ds fy, tkuk tkrk gS ;s jkT;A
pkgs Lons'kh gks ;k fons'kh] ;gk¡ dh laLÑfr fdlh dk Hkh eu pqVfd;ksa esa eksg ysrh gSA vkf[kj fdldk
eu ugha djsxk jkr ds oDr jsfxLrku esa vkx tykdj dkycsfy;k u`R; ns[kus dkA ftUgksaus jktLFkku
dh laLÑfr dk vuqHko fd;k gS oks cgqr [kq'ku'khc gSA
jktLFkku esa eqf'dy ls dksbZ eghuk ,slk tkrk gksxk] ftlesa /kkfeZd mRlo ugha gksrk gksA jktLFkku
dh laLÑfr vuks[kh vkSj ,sfrgkfld vrhr ds leku jaxhu gSA jktLFkku laLÑfr jkT; ds jaxhu bfrgkl
dks n'kkZrh gSA yksxksa dks vius yksd u`R;ksa] ikjEifjd O;atuksa] ;gk¡ ds yksxksa vkSj muds jkstejkZ ds thou
esa laLÑfr dk lkj fey ldrk gSA ,d jktlh jkT; gksus ds ukrs] jktLFkku viuh 'kkgh HkO;rk vkSj
jkW;YVh ds fy, tkuk tkrk gSA ;g viuh lqUnj ijEijkvksa] laLÑfr yksxksa] bfrgkl vkSj Lekjdksa ds
lkFk nqfu;k Hkj ds i;ZVdksa dks vkdf"kZr djrh gSA
jktLFkkuh ifj/kku
tgk¡ ckr lH;rk vkSj lqUnjrk dks ,d lkFk tksM+us dh gks rks jktLFkku diM+ksa ds vkxs dqN ugha fVdrkA
efgykvksa ds fy, ikjEifjd jktLFkkuh diM+s dkQh lH;] lqUnj vkSj vkjkenk;d gksrs gSaA ;gk¡ dh
efgyk,¡ ikjEifjd ?kkxjk] pksyh vkSj vks<+uh ¼nqiêk½ igurh gSA efgykvksa ds ;s diM+s pVd jax ds
gksrs gSa] ftuesa xksVk ¼ckWMZj½ yxk gksrk gSA vius ls cM+ksa ds lkeus vkSj ckgjh yksxksa ds vkxs efgyk,¡
?kwa?kV fudky dj j[krh gSA blrjg ls oks ml O;fDr dks vius ls lEeku nsrh gS] ogha iq#"k /kksrh&dqrkZ
;k dqrkZ&itek ilUn djrs gSaA blds vykok dqN iq#"k flj ij ca/kst ds fizaV okyh lwrh diM+s dh
ixM+h Hkh igurs gSaA muds fy, ixM+h flQZ flj <dus okyh ,d Vksih dh rjg ugha gksrh] cfYd bTtr
gksrh gSA
jktLFkku dk ikjEifjd Kku] laLÑfr vkSj oSpkfjd vknku&iznku
Dr. Manimala Sharma
National Conference on Global Research for Sustainable Development: Recent Trends, Challenges and Approaches
Volume: 23 | Nov-Dec 2019 | ISSN : 2277-4858
Peer Reviewed National Level Interdisciplinary Journal Page No. - 60
jktLFkkuh vkHkw"k.k
jktLFkkuh vkHkw"k.k u flQZ jktLFkku esa cfYd iwjs fo'o esa e'kgwj gks jgs gSaA vkHkw"k.k dsoy efgyk,¡
gh ugha iq#"k Hkh igurs gSaA iq#"k ds xys esa lksus dh pSu] gkFk esa iq#"kksa okyh Hkkjh lh pwM+h vkSj ,d
dku esa lksus dh ckyh ;k ykSax igurs gSaA
efgykvksa ds vkHkw"k.k yksd izfl) gSA jktLFkku dk lcls izfl) vkSj efgykvksa }kjk lcls T;knk ilUn
fd;k tkus okyk vkHkw"k.k gS] cksjykA cksjyk ,d izdkj dk ekax Vhdk gksrk gS tks fn[kus esa yêw tSlk
fn[krk gSA ;s jktLFkku ds ikjEifjd vkHkw"k.kksa esa ls ,d gSA blds vykok efgyk,¡ dejcUn] cktwcan
vkSj yk[k rFkk lhi ds daxu Hkh igurh gSA
jktLFkkuh u`R;
jktLFkku dk fof'k"V u`R; ?kwej gS] ftls mRloksa ds volj ij dsoy efgykvksa }kjk fd;k tkrk gSA
?ksj u`R; ¼efgykvksa vkSj iq#"kksa }kjk fd;k tkus okyk½] ifugkj ¼efgykvksa dk ykfyR;iw.kZ u`R;½ o dPph
?kksM+h ¼ftlesa iq#"k urZd cukoVh ?kksM+h ij cSBs gksrs gSa½ Hkh yksdfiz; gSaA lcls izfl) xhr ^dqtkZ* gS]
ftlesa ,d L=h dh dgkuh gS] tks vius ifr dks dqtkZ i{kh ds ek/;e ls lans'k Hkstuk pkgrh gS o
mldh bl lsok ds cnys mls cs'kdherh iqjLdkj dk ok;nk djrh gSA jktLFkku us Hkkjrh; dyk esa
viuk ;ksxnku fn;k gS vkSj ;gk¡ lkfgfR;d ijEijk ekStwn gSA fo'ks"kdj HkkV dfork dhA pancjnkbZ
dk dkO; i`Fohjkt jklks ;k pan&jklks] fo'ks"k mYys[kuh; gS] ftldh izkjfEHkd gLrfyfi 12oha 'krkCnh
dh gSA euksjatu dk yksdfiz; ek/;e [+;ky gS] tks ,d u`R;&ukfVdk gS vkSj blds dkO; dh fo"k;&oLrq
mRlo] bfrgkl ;k iz.k;&izlaxksa ij vk/kkfjr jgrh gSA jktLFkku esa izkphu nqyZHk oLrq,¡ izpqj ek=k
esa gS] ftlesa ckS) f'kykys[k] tSu efUnj] fdys] 'kkunkj fj;klrh egy vkSj efLtn o xqEcn 'kkfey
gSA
jktLFkku esa fdlh Hkh lekjksg esa {ks=h; dykdkjksa ds yksd u`R; ds izn'kZu ds fcuk v/kwjk jgrk gSA
iks'kkd] vfHkO;fDr] pky vkSj rky mRÑ"V izn'kZu djrs gSaA jktLFkku ds dqN yksdfiz; u`R; gSA
dkycsfy;k u`R; ,d izkphu u`R; dkycsfy;k leqnk; dh efgykvksa }kjk vH;kl fd;k tkrk gSA tcfd
?kwej u`R; jktiwr efgykvksa }kjk fd;k tkrk gSA
jktLFkku ds lqUnj yksd laxhr dqN ,slk gS fd og ,d cstku ls jsfxLrku esa Hkh tku Mky nsrs gSaA
bu xhrksa dks vyx vyx dgkuh lqukrs gq, xk;k tkrk gSA os cgqr vPNs vkSj lEeksgd gS vkSj vke
rkSj ij fo'ks"k voljksa vkSj R;ksgkjksa ds nkSjku xk;k tkrk gSA jktLFkkuh laxhr u dsoy Hkkjr esa cfYd
iwjs fo'o esa izfl) gSA

National Conference on Global Research for Sustainable Development: Recent Trends, Challenges and Approaches
Volume: 23 | Nov-Dec 2019 | ISSN : 2277-4858
Peer Reviewed National Level Interdisciplinary Journal Page No. - 61
jktLFkkuh dyk vkSj f'kYi
viuh mÙke gLrf'kYi oLrqvksa ds lkFk jktLFkkuh vkHkw"k.k] jaxhu&diM+s] d<kbZ okys diM+s vkSj peM+s
ds mRiknksa dks [kjhnus dk vlk/kkj.k LFkku gSA y?kq&fp=ksa] gkFkksa ls cqus gq, xyhps vkSj dBiqrfy;k¡
i;ZVdksa }kjk vDlj [kjhns tkrs gSaA ydM+h ds Meh ds lkFk dBiqryh 'kks jktLFkku esa Hkh iznf'kZr
fd, tkrs gSa tks dbZ i;ZVdksa dks vdf"kZr djrh gSA pwafd jkT; vius jktLFkkuh oL=] VkbZ&MkbZ dke]
/kkrq /kkxk d<+kbZ vkSj gkFk CykWd fpf=r diM+s ds fy, izfl) gS] ;gk¡ dkQh yksdfiz; gSA
jktLFkkuh O;atu
jktLFkku vius ikjEifjd O;atuksa ds fy, tkuk tkrk gSA ?kh] eD[ku vkSj Hkkjrh; elkyksa dh ,d
lj.kh ds lkFk cus] jktLFkkuh [kkuk bruk Lokfn"V gksrk gS fd yksx maxfy;k pkVrs jg tkrs gSaA
nky&ckVh] pwjek] xês dh lCth] fephZ cM+k] jkt dpksjh] ?ksoj] chdkusjh Hkqft;k vkSj fny [kq'kky dqN
[kkl jkspd O;atu gSA jktLFkku dk Hkkstu u dsoy Hkkjr esa cfYd iwjs fo'o esa izfl) gSA jktLFkku
dk ikjEifjd Hkkstu iwjs o"kZ i;ZVdksa dh ekax esa cgqr T;knk gSA
jktLFkku ds esys vkSj R;ksgkj
jktLFkku csgn jaxhu jkT; gSA jktkvksa vkSj jktiwrksa dk x<+ gksus ds ukrs ;gk¡ ij vusdksa jhfr&fjokt
vkSj R;ksgkjksa dh foLr`rrk fn[krh gSA
lcls mYys[kuh; o fof'k"V mRlo x.kxkSj gS] ftlesa egknso o ikoZrh dh feêh dh ewfrZ;ksa dh iwtk
15 fnu rd lHkh tkfr;ksa dh fL=;ksa ds }kjk dh tkrh gS] vkSj ckn esa mugsa ty esa folftZr dj fn;k
tkrk gSA foltZu dh 'kksHkk;k=k esa iqjksfgr o vf/kdkjh Hkh 'kkfey gksrs gSa o xkts ckts ds lkFk 'kksHkk;k=k
fudyrh gSA fgUnw vkSj eqlyeku nksuksa ,d&nwljs ds R;ksgkjksa esa 'kkfey gksrs gSaA bu voljksa ij mRlkg
o mYykl dk cksyckyk jgrk gSA ,d vU; izeq[k mRlo vtesj ds fudV iq"dj esa gksrk gS] tks /kkfeZd
mRlo o i'kq esys dk fefJr Lo:i gSA ;gk¡ jkT; Hkj ds fdlku vius Å¡V o xk;&HkSal vkfn ysdj
vkrs gSaA vtesj fLFkr lwQh v/;kReoknh [oktk eksbuqíhu fp'rh dh njxkg Hkkjr dh eqlyekuksa dh
ifo= njxkgksa esa ls ,d gSA mlZ ds volj ij izR;sd o"kZ yxHkx rhu yk[k J)kyq ns'k&fons'k ls
njxkg ij vkrs gSaA
jktLFkku esyksa vkSj mRloksa dh /kjrh gSA ;gk¡ ,d dgkor izfl) gS & lkr okj ukS R;ksgkjA ;gk¡ ds
esys vkSj ioZ jkT; dh laLÑfr ds ifjpk;d gSa ;gk¡ yxus okys i'kq esys O;fDr vkSj i'kqvksa ds chp
dh vkilh fuHkZjrk dks fn[kkrs gSA jkT; ds cM+s esyksa esa iq"dj dk dkfrZd esyk] ijcrlj vkSj ukxkSj
ds rstkth dk esyk fxuk tkrk gSA ;gk¡ rht dk ioZ lcls cM+k ekuk x;k gSA Jko.k ekg ds blh

National Conference on Global Research for Sustainable Development: Recent Trends, Challenges and Approaches
Volume: 23 | Nov-Dec 2019 | ISSN : 2277-4858
Peer Reviewed National Level Interdisciplinary Journal Page No. - 62
ioZ ds lkFk R;ksgkjksa dh Ük`a[kyk vkjEHk gksrh gS] tks x.kxkSj rd pyrh gSA bl lEcU/k esa dFku gS
fd rht R;ksgkjk ckojh ys Mwch x.kxkSjA gksyh] nhikoyh] fot;kn'keh] fØlel tSls izeq[k jk"Vªh;
R;ksgkjksa ds vykok vusd nsoh&nsorkvksa] larksa vkSj yksduk;dksa rFkk ukf;dkvksa ds tUefnu euk, tkrs
gSaA
;gk¡ ds egÙoiw.kZ esys gS rht] x.kxkSj ¼t;iqj½] vtesj 'kjhQ vkSj xfy;kdksV ds okf"kZd mlZ] csus'oj
¼Mwaxjiqj½ dk tutkrh; dqaHk] Jh egkohj th ¼lokbZ ek/kksiqj esyk½] jkensojk ¼tSlyesj½] taHk s'oj th
esyk ¼eqdke&chdkusj½] dkfrZd iwf.kZek vkSj i'kq esyk ¼iq"dj&vtesj½ vkSj ';ke th esyk ¼lhdj½ vkfnA
jktLFkku dks QsfLVoy VwfjT+e dk izeq[k dsUnz dguk dksbZ vfr'k;ksfDr ugha gksxhA iq"dj esyk ns'k
ds lcls cM+s vkd"kZ.kksa esa ls gSA gj lky yk[kksa J)kyq iq"dj vkdj ifo= >hy esa Mqcdh yxkrs gSaA
;gk¡ nqfu;k dk lcls cM+k Å¡Vksa dk esyk Hkh yxrk gS ftlesa yxHkx 50]000 Å¡V fgLlk ysrs gSaA ;g
esyk fons'kh i;ZVdksa dks Hkh cgqr vkdf"kZr djrk gSA bykgkckn] gfj}kj] mTtsu vkSj ukfld esa gj
12 lky ij dqaHk gksrk gS] tcfd N% lky esa v)ZdqEHk dk vk;kstu gfj}kj vkSj iz;kx esa gksrk gSA buesa
fons'kh i;ZVd Hkkjh rknkn esa vkrs gSaA
jktLFkku Hkkjr dk ,d jkT; gS tks i;ZVu ds fy, lcls vPNk jkT; ekuk tkrk gSA jktLFkku VwfjT;
vFkok jktLFkku i;ZVu fodkl fuxe fyfeVsM (RTDC) dEiuh vf/kfu;e 1956 ds rgr t;iqj esa
iathÑr dEiuh gSA ;g dEiuh iwjh rjg ls jktLFkku ljkdkj ds LokfeRo esa gSA
RTDC lEeku] Hkjkslseanrk] leiZ.k ns[kHkky ds lkFk vius xzkgd dh lsok djrs gSaA RTDC—
jktLFkku VwfjTe fodkl LFkkfir djus ds mRizsjd ds :i esa dk;Z djrk gSA dbZ jsLrjka] dSQsVsfj;k]
gksVy] eksVy] ckj] ukSdk;u vkSj ifjogu dk izcU/ku dj] fofHkUu ifj;kstuk vkSj ;kstuk dks fu"ikfnr
dj jkT; ds i;ZVu dks rst djrk gSA i;ZVu ds vuqHko dks c<+kus ds fy, fuxe iSdst Vwj] esys] R;ksgkj
vkSj euksjatu] [kjhnnkjh vkSj ifjogu lsokvksa dk Hkh vk;kstu djrk gSA
Hkkjr vkSj fons'k esa vius vPNh rjg ls LFkkfir foi.ku usVodZ ds ek/;e ls RTDC ?kjsyw vkSj vUrjkZ"Vªh;
Lrj ij izHkko lsokvksa ds cktkjksa esa i;ZVu dks c<kok nsus esa ,d egÙoiw.kZ Hkwfedk fuHkkrk gSA
fuxe us vxz.kh ctV ;k=k m|ksx esa lcls ekU;rk izkIr VªsMekxZ cuk;k gSA ;g xzkgdksa dks lQyrkiwoZd
vkdf"kZr dj jgk gS vkSj Hkfo"; dh pqukSfr;ksa dk lkeuk djus ds fy, xfr esa gSA xq.koÙkk izkIr djuk
,d py jgh izfØ;k gS ftlds fy, daiuh n`<+rk ls izfrc) gSA fuxe dh xq.koÙkk izfØ;k dh vk/kkjf'kyk
ßxzkgd lsok dh laLÑfrÞ dk fuekZ.k vkSj iks"k.k gSA jktLFkku dh izeq[k dyk laxejej ds iRFkj ls
cuus okyh ewfrZ;k gSA laxejej iRFkj dh ewfrZ dyk dk mn~xe LFkku vyoj ftys dk fd'kksjh xk¡o
National Conference on Global Research for Sustainable Development: Recent Trends, Challenges and Approaches
Volume: 23 | Nov-Dec 2019 | ISSN : 2277-4858
Peer Reviewed National Level Interdisciplinary Journal Page No. - 63
gSA ;gk¡ ds vkfnxkSM+ czkã.k lekt us ewfrZdyk dks fodflr fd;kA Hkkjr dk lcls cM+k ewfrZ cktkj
t;iqj esa fLFkr gSA jktLFkku ds edjkuk ¼ukxkSj½ esa fudyus okyk laxejej iRFkj fo'oizfl) gS ftls
fo'o dh dbZ laLFkkvksa us iqjkrkfRod /kjksgj ds :i esa Lohdkj fd;k gSA fo'o izfl) vkxjk dk rktegy
edjkuk ds iRFkj ls fufeZr gSA
blds vfrfjDr jktLFkkuh Hkk"kk lkfgR; ,oa laLÑfr vdkneh ¼chdkusj½] jktLFkku cztHkk"kk vdknfed
¼t;iqj½] jktLFkku fgUnh xzUFk vdkneh ¼t;iqj½] jktLFkku laLÑr vdkneh ¼t;iqj½] vjch&Qkjlh
'kks/k laLFkku ¼Vksad½] jktLFkku flU/kh vdkneh ¼t;iqj½] fo|k Hkou laLFkku ¼mn;iqj½] jktLFkku lkfgR;
vdkneh ¼mn;iqj½] jktLFkku vfHkys[kkxkj ¼chdkusj½] :ik;u laLFkku cks:ank ¼tks/kiqj½] johUnz jaxeap
¼t;iqj½] t;iqj dFkd dsUnz ¼t;iqj½] jktLFkku laxhr ukVd vdkneh ¼tks/kiqj½] iqjkrRo ,oa laxzgky;
foHkkx ¼t;iqj½] jktLFkku Ldwy vkWQ vkVZ~l ¼t;iqj½] jktLFkku yfyr dyk vdkneh ¼t;iqj½]
jktLFkku izkP; fo|k izfr"Bku ¼tks/kiqj½] tokgj dyk dsUnz ¼t;iqj½] jktLFkku mnwZ vdkneh ¼t;iqj½
vkfn jktLFkku dh egÙoiw.kZ dyk laLÑfr bdkb;k¡ gSA
lkjr% okfYedh us] ftl jktLFkku izns'k dks ̂ e:dkUrkj* dgk vkSj tkWtZ FkkWel us jktiwrkuk 'kCn
dk iz;ksx ftl Hkw&Hkkx ds fy, fd;k Fkk] duZy tsEl VkWM us bl izns'k dk uke ̂jk;Fkku* j[kk D;ksafd
LFkkuh; lkfgR; ,oa cksypky esa jktkvksa ds fuokl ds izkUr dks ^jk;Fkku* dgrs FksA mUgksaus 1829 bZ-
esa fyf[kr viuh izfl) ,sfrgkfld iqLrd 'Annals& Antiquities of Rajkasthan (or Central and
Western Rajput States of India)' esa loZizFke bl HkkSxksfyd izns'k ds fy, jktLFkku 'kCn dk iz;ksx
fd;kA
AUTHOR’S BIOGRAPHY
Dr. Manimala Sharma, Assistant Professor, Department of Philosophy, Chodhary Balludev Godara Government Girls
Collge, Sriganganagar, Rajasthan
Email:[email protected]
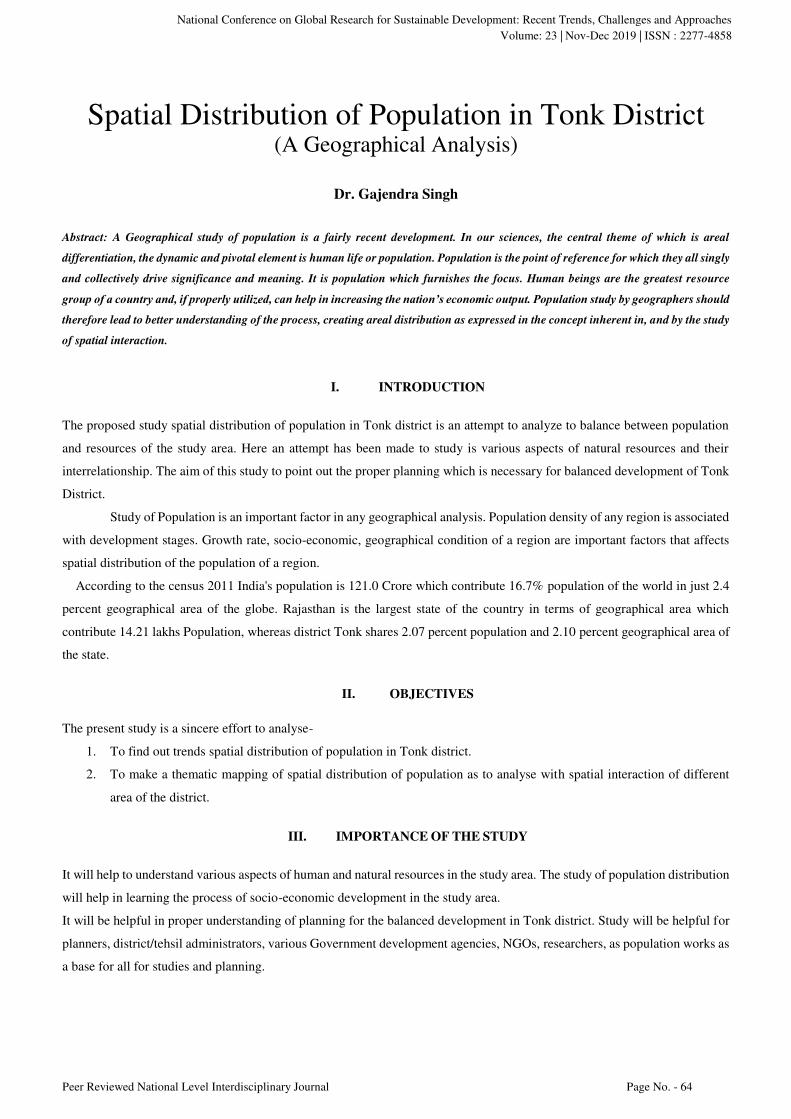
National Conference on Global Research for Sustainable Development: Recent Trends, Challenges and Approaches
Volume: 23 | Nov-Dec 2019 | ISSN : 2277-4858
Peer Reviewed National Level Interdisciplinary Journal Page No. - 64
Abstract: A Geographical study of population is a fairly recent development. In our sciences, the central theme of which is areal
differentiation, the dynamic and pivotal element is human life or population. Population is the point of reference for which they all singly
and collectively drive significance and meaning. It is population which furnishes the focus. Human beings are the greatest resource
group of a country and, if properly utilized, can help in increasing the nation’s economic output. Population study by geographers should
therefore lead to better understanding of the process, creating areal distribution as expressed in the concept inherent in, and by the study
of spatial interaction.
I. INTRODUCTION
The proposed study spatial distribution of population in Tonk district is an attempt to analyze to balance between population
and resources of the study area. Here an attempt has been made to study is various aspects of natural resources and their
interrelationship. The aim of this study to point out the proper planning which is necessary for balanced development of Tonk
District.
Study of Population is an important factor in any geographical analysis. Population density of any region is associated
with development stages. Growth rate, socio-economic, geographical condition of a region are important factors that affects
spatial distribution of the population of a region.
According to the census 2011 India's population is 121.0 Crore which contribute 16.7% population of the world in just 2.4
percent geographical area of the globe. Rajasthan is the largest state of the country in terms of geographical area which
contribute 14.21 lakhs Population, whereas district Tonk shares 2.07 percent population and 2.10 percent geographical area of
the state.
II. OBJECTIVES
The present study is a sincere effort to analyse-
1. To find out trends spatial distribution of population in Tonk district.
2. To make a thematic mapping of spatial distribution of population as to analyse with spatial interaction of different
area of the district.
III. IMPORTANCE OF THE STUDY
It will help to understand various aspects of human and natural resources in the study area. The study of population distribution
will help in learning the process of socio-economic development in the study area.
It will be helpful in proper understanding of planning for the balanced development in Tonk district. Study will be helpful for
planners, district/tehsil administrators, various Government development agencies, NGOs, researchers, as population works as
a base for all for studies and planning.
Spatial Distribution of Population in Tonk District (A Geographical Analysis)
Dr. Gajendra Singh

National Conference on Global Research for Sustainable Development: Recent Trends, Challenges and Approaches
Volume: 23 | Nov-Dec 2019 | ISSN : 2277-4858
Peer Reviewed National Level Interdisciplinary Journal Page No. - 65
IV. DATABASE AND METHODOLOGY
To achieve the above said objectives population data have been obtained from the census hand book of different years. Data
other than census have also been collected from District Statistical office, Agriculture, Irrigation departments. Information
regarding Tonk Dist. has been collected from the district gazetteer. Arithmetic mean, Standard deviation, Coefficient of
variations and Standardised value have been calculated from the data.
Thematic maps have been drawn to understand the spatial distribution of population and causative relationship between
various attribute data and population data.
V. STUDY AREA
Tonk as one of the muslimriyasat of Rjaputana, is located between 25°41' North to 26°24' North latitude and 75°19' East to
76°16 East longitude. Tonk is delimited by Jaipur in the North, Bundi in the South, Bhilwara in the West and SawaiMadhopur
in the East. Banas, a tributary of river Chambal divides the district into South and North part. The study area is dominated by
Muslim, Scheduled Casts & Scheduled tribe population. The district has 7184 Sq. Km. area with seven tehsils named as Newai,
Tonk, Uniara, Deoli, Todraisingh, Malpura and newly formed tehsil Peeplu. It comes under semi arid conditions with average
annual rainfall of 60cm. Bisalpur dam built recently over river Banas, near Deoli, has changed the agricultural scenario of the
district. Like other parts of the State, Tonk district's economy primarily depend on agriculture. Due to the shadow effect of
major cities and lack of industrial, agricultural and economical development people are migrating towards big urban centres
like Jaipur, Kota and Delhi in search of jobs, which directly influence population density. Areal distribution patterns of
population reflect the economic potentiality of different areas. Keeping in vie these aspects, the density of population of the
study area has been examined with the help of various indicators.
VI. POPULATION DENSITY
Men and land are the ultimate elements in the life of human society, so that the number of people in proportion to the amount of
land is a fundamental consideration in population studies. The concept of density or the relationship between people and land
is usually expressed as a simple arithmetic ratio, which divides total population by total area.
Maximum population density of the country is 1030 person / sq km is recorded in West Bengal whereas among the Union
Territories Delhi (9340 person/sq km) has recorded the highest population density. The state with least population density is
Arunachal Pradesh with 17 person/sq km and among the union territories Andaman and Nicobar Island with 46 person/sq km.
Maximum population density in Rajasthan has recorded 598 person/sq km in Jaipur whereas the lowest recorded in Jaisalmer
with 17 person/sq km. In case of Tonk district maximum population density with 366 person/sq km has recorded in Tonk tehsil
and minimum with 149person/sq km has recorded in Todaraisingh tehsil. Tonk district has registered lower population density
in comparison to the state as well as the national average. It is due to less developed infrastructure, health, education,
socio-ecomomicdevelopement. Most of the people depend on agriculture but low rainfall and less under ground water are also
important issues in this regard.
It is an accepted fact that all parts of the country and state are not equally habitable. This is true with Tonk as well.
Today we have 7 tehsils in the district. Equitable distribution of both area and population among the districts is an impossible
ideal. There is a great disparity in area as well as in population among the districts.
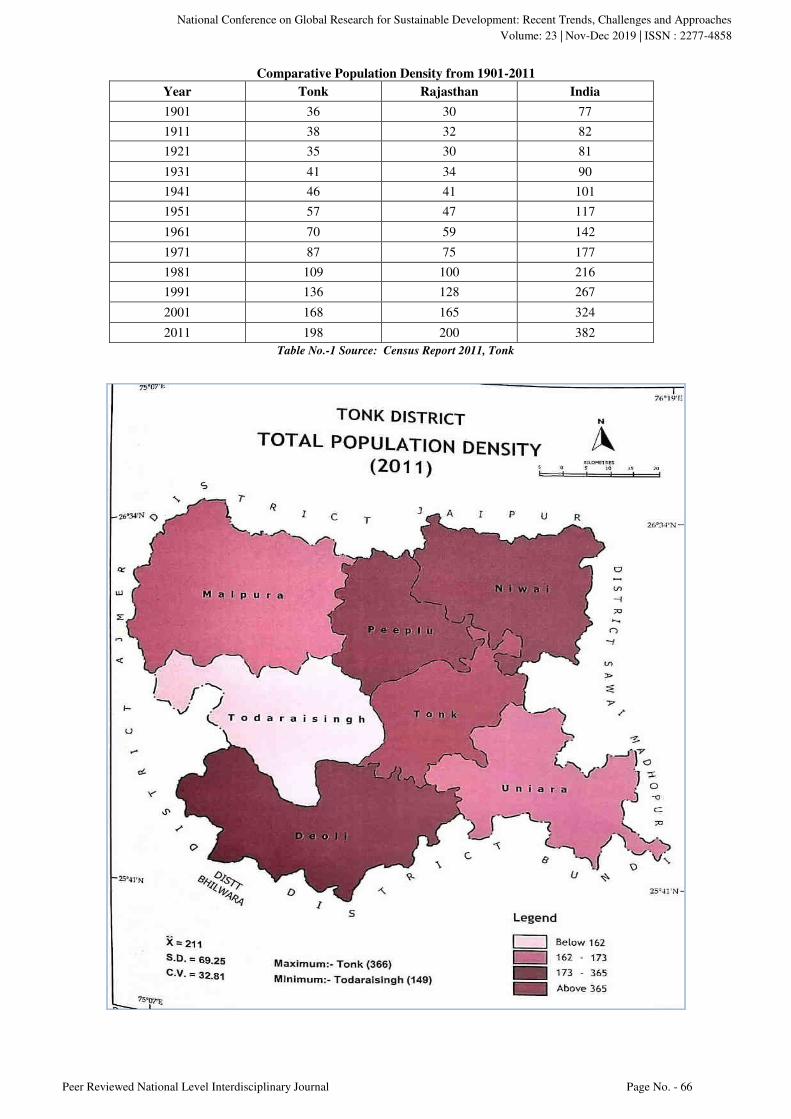
National Conference on Global Research for Sustainable Development: Recent Trends, Challenges and Approaches
Volume: 23 | Nov-Dec 2019 | ISSN : 2277-4858
Peer Reviewed National Level Interdisciplinary Journal Page No. - 66
Comparative Population Density from 1901-2011
Year Tonk Rajasthan India
1901 36 30 77
1911 38 32 82
1921 35 30 81
1931 41 34 90
1941 46 41 101
1951 57 47 117
1961 70 59 142
1971 87 75 177
1981 109 100 216
1991 136 128 267
2001 168 165 324
2011 198 200 382
Table No.-1 Source: Census Report 2011, Tonk

National Conference on Global Research for Sustainable Development: Recent Trends, Challenges and Approaches
Volume: 23 | Nov-Dec 2019 | ISSN : 2277-4858
Peer Reviewed National Level Interdisciplinary Journal Page No. - 67
The area of Tonk district is 2.10 percent of the total area of the state and it has to support 2.14 percent population of Rajasthan,
Whereas the population density of Rajasthan is 200 person/sq km. and Population density of Tonk district is 198 person/sq km.
Population density of Tonk district was 30 person/sq km in 1901 which has reached 4 times during last 100 years. The
comparative population density figures as given in the table no.1.
According to the census 2011 population density of India has registered 382 person/sq.km. whereas Rajasthan has recorded
200 person/sq.km., Tonk district has registered 198 person/sq.km. which is lower than state and national average , as shown in
table no.1
The proverbial concept of a thinly populated district Tonk has to be partially set aside with the density of population per sq
Km. rising form 168 person in 2001 to 198 in 2011. The net increases of 30 persons in density of population of the district
during the decade 2001-2011.Tonk tehsil is the most thickly populated area; the density being 366 persons per sq. Km. and the
lowest density has been recorded in Todaraising tehsil. The highest density in Tonk tehsil is due to fairly high rate of
urbanization, industrial, agricultural development and socio cultural reasons. The lowest density in Todaraisingh is due to less
developed transformational and economic development. The average density of the district is 211 person/sq. km. with S.D.
69.25 and co-efficient of variation is 32.81 percent as shown in map no. 1
Tehsil wise comparison of population density of Tonk district (2001-2011)
S. No. Category Range Tehsil Included
1 Very high >365 Tonk
2 High 175-365 Newai, Deoli, Peeplu
3. Moderate 162-175 Uniara, Malpura
4. Low <162 Todaraisingh
Table No. 2
The first category ranges less than 162 person/sq. km. found in Todaraisingh tehsil. It is due to less developed
transportation, education, health and infrastructure facilities.
The second category ranging from 162 to 172 persons/sq. km, Malpura and Uniara tehsils have registered under this
category. This is due to less job opportunities and other developmental facilities.
The third category ranging from 173 to 365persons/sq.km, Newai, Peeplu and Deoli tehsils come under this category.
It is due to fair transport connectivity, educational, economical and irrigational facilities.
The fourth category ranging above 365persons/sq. km. Tonk tehsil is registered under this category. It is due to its
location at the district head quarter, fairly developed transportation, industrial, social and agricultural, activities,
shown in table no. 1
Tehsil wise Rural/Urban population density of Tonk District (2001-2011)
S. No. Tehsil Population Density (Persons/sq. km.)
Rural Urban Total
2011 2001 2011 2001 2011 2001
1. Malpura 143 138 769 546 162 103
2. Newai 200 189 966 511 239 133
3. Tonk 168 167 2732 6253 366 119
4. Todaraisingh
132 126 435 326 149 92
5. Deoli 157 153 5884 4474 175 110
6. Uniara 151 145 5044 2308 171 105
7. Peeplu 173 148 N.A. N.A. 173 148
Table No. 3

National Conference on Global Research for Sustainable Development: Recent Trends, Challenges and Approaches
Volume: 23 | Nov-Dec 2019 | ISSN : 2277-4858
Peer Reviewed National Level Interdisciplinary Journal Page No. - 68
VII. RURAL DENSITY
As shown table no.3 the highest rural density 200 persons/sq. Km. is found in Newai tehsil and the lowest 132persons/sq. Km.
is registered in Todaraisingh with mean value of 159 person/sq. km., S.D. 18.07 and C.V. 11.36 percent.
The first category ranges less than 143person /sq. Km. found in Todaraisingh tehsil. It is due to less developed
transportation, educational, health and other infrastructure facilities.
The Second category ranges from 143 to 157person /sq. Km, Malpura and Uniara tehsils have registered under this
category. It is due to less employment opportunities and other pull factors.
The third category starts from 157 to 199person /sq. Km, Tonk and Deoli tehsils come under this category. As this
area is under irrigation facilities of Bisalpur dam and influence of nearby urban centers.
The fourth category ranging above 199 person /sq. Km, Newai tehsil come under this category. It is due to well
developed transport connectivity and fair economic development.
The highest population density is found in agriculturally and economically developed area whereas the lowest
population density found in areas with less irrigation facilities. Most of the villages of the district do not have proper
educational, administrative, health, employment and portable water facilities. In recent years due to MGNERGA program rural
employment has increased at some extent.
VIII. URBAN DENSITY
Urban areas are the high density areas compared to rural area. There are certain factors for higher population density which are
industrial, religious, educational, health& employment facilities.
The highest urban density of 5884person /sq. Km. found in Deoli tehsil. It is due to fair opportunities of employment, education
and transportation facilities with mean value 2500 person, S.D. 2245.36 and C.V. 89.81%, as shown in table no.3
Uniara tehsil with 5044 and Tonk 2732person/sq. km are very high population density tehsils. This is due to social cultural and
fair rate of urbanization reasons.
The first category ranges less than 769 person/sq. km only Todaraisingh tehsil found under this category. It is due to
less developed transportation, educational, health and infrastructure facilities as shown in table no.3
The second category range starts from 769 to 2732 person/sq. km, Malpura and Newai tehsils have registered under
this category. This is due to fair rate of urbanisation and migration from near by areas.
The third category range starts from 2732 to 5883 person/sq. km. Tonk and Uniara tehsils come under this category.
This is due to socio cultural reasons and migration of people from nearby rural areas.
The fourth category ranges above 5883 person/sq. km, only Deoli tehsil has registered under this category. It is due to
well-developed transportation, industrial, social and economic activities as well as cannel irrigational facilities of
Bisalpur dam.
IX. CONCLUSION AND SUGGESTIONS
I. The population density is fairly high in the study area and dependent on agriculture. Expansion of non-agricultural
occupations is limited. The possibilities of employment opportunities are minimal. Growing population is exerting
heavy strains on the agricultural resources It is high time the Govt. enhanced existing resources before the economic
situation takes a serious turn.
II. The fragmentation of land holding under the prevailing set up of inheritance will further reduce the size of land
holdings retarding the demand of agricultural labours.

National Conference on Global Research for Sustainable Development: Recent Trends, Challenges and Approaches
Volume: 23 | Nov-Dec 2019 | ISSN : 2277-4858
Peer Reviewed National Level Interdisciplinary Journal Page No. - 69
III. Well developed rail and road transport facilities are the main problems adversely affecting the development of the
district. So a sincere effort should be made to link Newai, Tonk and Deoli tehsils with rail network.
IV. In terms of quality of population the district is educationally, economically and socially backward with domination of
S.C. S.T. and Muslim population. Therefore, sincere efforts should be made to improve economic, educational and
social conditions of the people.
V. Parts of Uniara, Deoli, Todaraisingh and Tonk Tehsils folling in Bisalpur Command Area get very good crops.
Economic phenomena of the area have changed and demography of the area like growth, distribution, literacy, sex
ratio and work force is gradually changing. Therefore, an integrated human resource development program for the
district is the prime need for progress and development.
REFERENCES
Agarwal S.N. (1974) : India's population problems. Tata M.Hill, New Delhi.
Bouge, Ashish (1969) : Principles of Demography, (New York Johan Wiley).
Census of India (1971-2011), District Census Handbook of Tonk District.
Chandra, R.C. and Sindhu, M.S. (1980) : Introduction of Population Geography, Kalyani Pub, New Delhi.
Govt. of Rajasthan, (2017) : Directorate of Statistics & Economics, Jaipur, Statical Abstracts of Tonk district.
Govt. of India (2011) : National Population Policy Statement.
AUTHOR’S BIOGRAPHY
\
Dr. Gajendra Singh, Associate Professor in Geography, Department of Higher Education, Govt. of Rajasthan, Jaipur

National Conference on Global Research for Sustainable Development: Recent Trends, Challenges and Approaches
Volume: 23 | Nov-Dec 2019 | ISSN : 2277-4858
Peer Reviewed National Level Interdisciplinary Journal Page No. - 70
Abstract:
We know that a peaceful world cannot long exist, one-third rich and two-thirds hungry.” Jimmy Carter
Food security is of fundamental importance for human existence. Food security exists when all people, at all times, have physical, social
and economic access to sufficient, safe and nutritious food that meets their dietary needs and food preferences for an active and healthy
life. Global food security will remain a worldwide concern for the next 50 years and beyond. This research paper aims that Food security
is both a complex and challenging issue to resolve as it cannot be characterized or limited by geography nor defined by a single grouping,
i.e., demography, education, geographic location or income. Currently, approximately one billion people (16% of global population)
suffer from chronic hunger in a time when there is more than enough food to feed everyone on the planet. Therein lies the Food security
challenge to implement an ability to deal with increasing food shortages, caused by a combination of waste and an ever expanding world
population. At current levels prediction state that we must increase global food production by 70% on already over exploited finite
infrastructures before 2050. This review paper firstly introduces the concept of Food Security with an overview of its scale and depth in
the context of the and global hunger index. It then highlights the main points of Global hunger index 2019 currently released on four
parameters..
Keywords: Food resources, Food security, Global Hunger Index (GHI), Hunger, Malnutrition & Population.
I. INTRODUCTION
Food security is defined as the availability of food and one's access to it. A household is considered food secure when its
occupants do not live in hunger or fear of starvation. Stages of food insecurity range from food secure situations to full-scale
famine. The World Food Summit of 1996 defined food security as existing "when all people at all times have access to
sufficient, safe, nutritious food to maintain a healthy and active life". The World Food Summit of 1996 defined food security
as existing "when all people at all times have access to sufficient, safe, nutritious food to maintain a healthy and active
life". Commonly, the concept of food security is defined as including both physical and economic access to food that meets
people's dietary needs as well as their food preferences. Household food security exists when all members, at all times, have
access to enough food for an active, healthy life. Food security incorporates a measure of resilience to future disruption or
unavailability of critical food supply.
a
II. FOUR PILLERS OF FOOD SECURITIES
Food security exists when all people, at all times, have physical and economic access to sufficient safe and nutritious food
that meets their dietary needs and food preferences for an active and healthy life. - 1996 World Food Summit From this
definition, four main dimensions of food security can be identified as:
Availability: Food availability relates to the supply of food through production, distribution, and exchange. Food
production is determined by a variety of factors including land and use of soil management and crop selection,
Global Hunger Index Report 2019:A Hole in
Global Food Security with Reference of India
Dr. Rupali Srivastava1, Dr.Anuradha Sharma
2

National Conference on Global Research for Sustainable Development: Recent Trends, Challenges and Approaches Volume: 23 | Nov-Dec 2019 | ISSN : 2277-4858
Peer Reviewed National Level Interdisciplinary Journal Page No. - 71
breeding and management; livestock breeding and management; and harvesting. Crop production can be affected by
changes in rainfall and temperatures .The use of land, water, and energy to grow food often competes with other uses,
which can affect food production. Land used for agriculture can be used for urbanization or lost to desertification,
salinization, and soil erosion due to unsustainable agricultural practices. Crop production is not required for a country
to achieve food security. Nations don't have to have the natural resources required to produce crops in order to achieve
food security, as seen in the examples of Japan and Singapore because food consumers outnumber producers in every
country food must be distributed to different regions or nations. Food distribution involves the storage, processing,
transport, packaging, and marketing of food. Food-chain infrastructure and storage technologies on farms can also
affect the amount of food wasted in the distribution process. Poor transport infrastructure can increase the price of
supplying water and fertilizer as well as the price of moving food to national and global markets. Around the world,
few individuals or households are continuously self-reliant for food. This creates the need for a bartering, exchange,
or cash economy to acquire food. The exchange of food requires efficient trading systems and market institutions,
which can affect food security. Per capita world food supplies are more than adequate to provide food security to all,
and thus food accessibility is a greater barrier to achieving food security.
Access: Food access refers to the affordability and allocation of food, as well as the preferences of individuals and
households. The UN Committee on Economic, Social, and Cultural Rights noted that the causes of hunger and
malnutrition are often not a scarcity of food but an inability to access available food, usually due to poverty. Poverty
can limit access to food, and can also increase how vulnerable an individual or household is to food price
spikes Access depends on whether the household has enough income to purchase food at prevailing prices or has
sufficient land and other resources to grow its own food. There are two distinct types of access to food: direct access,
in which a household produces food using human and material resources, and economic access, in which a household
purchases food produced elsewhere.
Food access refers to the affordability and allocation of food, as well as the preferences of individuals and
households. The UN Committee on Economic, Social, and Cultural Rights noted that the causes of hunger and
malnutrition are often not a scarcity of food but an inability to access available food, usually due to poverty. Poverty
can limit access to food, and can also increase how vulnerable an individual or household is to food price
spikes Access depends on whether the household has enough income to purchase food at prevailing prices or has
sufficient land and other resources to grow its own food. There are two distinct types of access to food: direct access,
in which a household produces food using human and material resources, and economic access, in which a household
purchases food produced elsewhere.
Utilization: The next pillar of food security is food utilization, which refers to the metabolism of food by
individuals. Once food is obtained by a household, a variety of factors affect the quantity and quality of food that
reaches members of the household. In order to achieve food security, the food ingested must be safe and must be
enough to meet the physiological requirements of each individual. Food safety affects food utilization, and can be
affected by the preparation, processing, and cooking of food in the community and household. Nutritional values of
the household determine food choice and whether food meets cultural preferences is important to utilization in terms
of psychological and social well-being. Access to healthcare is another determinant of food utilization, since the
health of individuals controls how the food is metabolized. For example, intestinal parasites can take nutrients from
the body and decrease food utilization. Sanitation can also decrease the occurrence and spread of diseases that can
affect food utilization. Education about nutrition and food preparation can affect food utilization and improve this
pillar of food security.

National Conference on Global Research for Sustainable Development: Recent Trends, Challenges and Approaches Volume: 23 | Nov-Dec 2019 | ISSN : 2277-4858
Peer Reviewed National Level Interdisciplinary Journal Page No. - 72
Stability: Food stability refers to the ability to obtain food over time. Food insecurity can be transitory, seasonal, or
chronic. In transitory food insecurity, food may be unavailable during certain periods of time. At the food production
level natural disasters and drought result in crop failure and decreased food availability. Civil conflicts can also
decrease access to food. Instability in markets resulting in food-price spikes can cause transitory food insecurity.
Other factors that can temporarily cause food insecurity are loss of employment or productivity, which can be caused
by illness. Seasonal food insecurity can result from the regular pattern of growing seasons in food production.
Chronic (or permanent) food insecurity is defined as the long-term, persistent lack of adequate food. In this case,
households are constantly at risk of being unable to acquire food to meet the needs of all members. Chronic and
transitory food insecurity are linked, since the reoccurrence of transitory food security can make households more
vulnerable to chronic food insecurity.
III. GLOBAL INDEX HUNGER-2019
The GHI is a peer-reviewed annual report, jointly published by Ireland's Concern Worldwide and Germany's
Welthungerhilfe. The Global Hunger Index (GHI) is a tool that measures and tracks hunger globally, by region, and by
country. The GHI is calculated annually, and its results appear in a report issued in October each year. Created in 2006, the
GHI was initially published by the US based International Food Policy Research Institute (IFPRI) and Germany
based Welthungerhilfe. In 2007, the Irish NGO Concern Worldwide also became a co-publisher. 2018 onwards, the GHI is a
joint project of Welthungerhilfe and Concern Worldwide, with IFPRI stepping aside from its involvement in the report.
The Global Hunger Index calculates the levels of hunger and under nutrition worldwide. The four indicators for the index
are undernourishment, child stunting, child wasting and child mortality. Globally, the levels of hunger have decreased
and the global indicator has changed from ‘serious’ to the cusp of ‘moderate and serious.’ The index says this
achievement coincides with a global decline in levels of poverty from 1999 to 2015, and cites that poverty and hunger
and closely related .India makes a significant dent on the global values: “Because of its large popula tion, India’s
GHI indicator values have an outsized impact on the indicator values for the region. ”Child wasting in India is the highest
rate of wasting for any country in the world at 20.8%. Child stunting is at 37.9%. India has been classified as a coun try
with ‘serious’ levels of hunger according to the 2019 Global Hunger Index. India has been ranked 102 out of 117
countries in terms of severity of hunger. The country with the severest problem of hunger at rank 117 is the Central
African Republic. India’s score on hunger is 30.3, which means it suffers from a level of hunger that is ‘serious.’ While
this is an improvement upon India’s performance in the last few years (India’s score was 38.8 in 2000, 38.9 in 2005, and
32 in 2010), there is little to celebrate .The report makes a mention of the Swachh Bharat campaign but says that it has not
worked well enough, despite being important: “Even with new latrine construction, however, open defecation is still
practiced. This situation jeopardizes the population’s health and consequently, children’s growth and development as
their ability to absorb nutrients is compromised. ”While India continues to weigh the world down on hunger, two
neighboring South Asian countries have done well: Bangladesh and Nepal. The United nations publish an annual report on
the state of food security and nutrition across the world. Led by the FAO, the 2019 report was joint authored by four other UN
agencies: the WFP, IFAD, WHO and UNICEF. The FAO's yearly report provides a statistical overview on the prevalence of
hunger around the world, and is widely considered the main global reference for tracking hunger. No simple set of statistics
can ever fully capture the multi- dimensional nature of hunger however. Reasons include that the FAO's key metric for
hunger, "undernourishment", is defined solely in terms of dietary energy availability – disregarding micro-nutrients such as
vitamins or minerals. Second, the FAO uses the energy requirements for minimum activity levels as a benchmark; many
people would not count as hungry by the FAO's measure yet still be eating too little to undertake hard manual labor, which
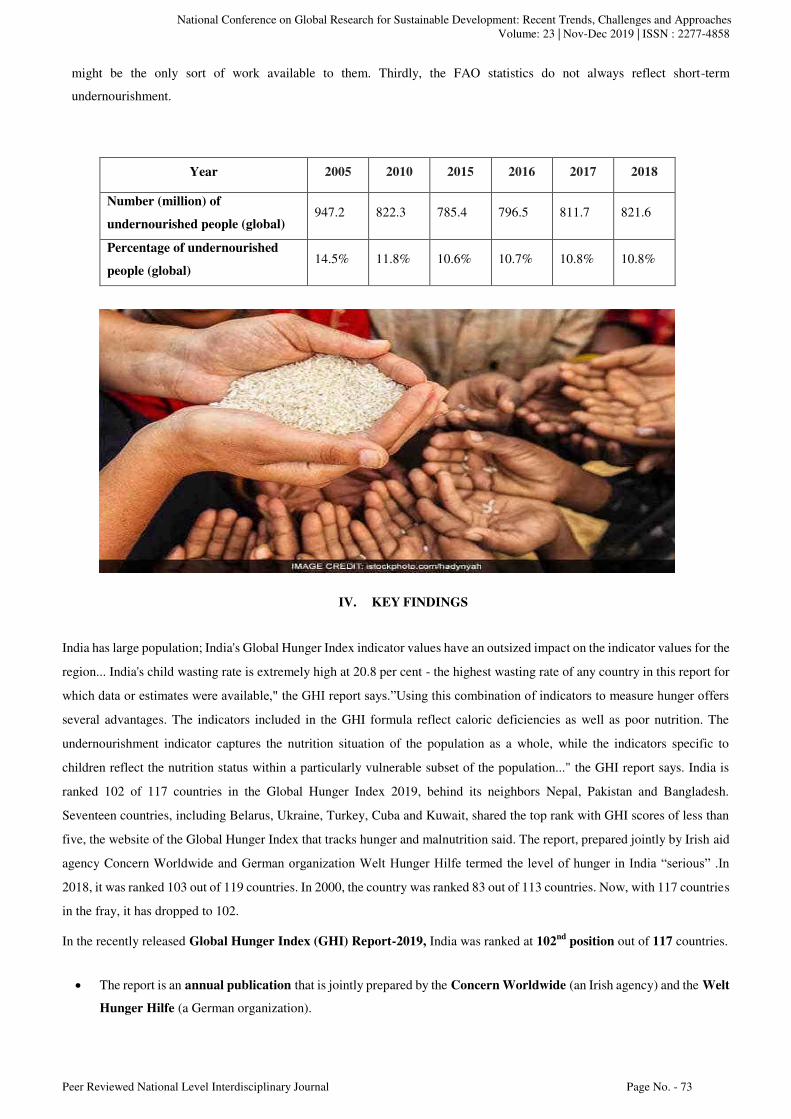
National Conference on Global Research for Sustainable Development: Recent Trends, Challenges and Approaches Volume: 23 | Nov-Dec 2019 | ISSN : 2277-4858
Peer Reviewed National Level Interdisciplinary Journal Page No. - 73
might be the only sort of work available to them. Thirdly, the FAO statistics do not always reflect short-term
undernourishment.
Year 2005 2010 2015 2016 2017 2018
Number (million) of
undernourished people (global) 947.2 822.3 785.4 796.5 811.7 821.6
Percentage of undernourished
people (global) 14.5% 11.8% 10.6% 10.7% 10.8% 10.8%
IV. KEY FINDINGS
India has large population; India's Global Hunger Index indicator values have an outsized impact on the indicator values for the
region... India's child wasting rate is extremely high at 20.8 per cent - the highest wasting rate of any country in this report for
which data or estimates were available," the GHI report says.”Using this combination of indicators to measure hunger offers
several advantages. The indicators included in the GHI formula reflect caloric deficiencies as well as poor nutrition. The
undernourishment indicator captures the nutrition situation of the population as a whole, while the indicators specific to
children reflect the nutrition status within a particularly vulnerable subset of the population..." the GHI report says. India is
ranked 102 of 117 countries in the Global Hunger Index 2019, behind its neighbors Nepal, Pakistan and Bangladesh.
Seventeen countries, including Belarus, Ukraine, Turkey, Cuba and Kuwait, shared the top rank with GHI scores of less than
five, the website of the Global Hunger Index that tracks hunger and malnutrition said. The report, prepared jointly by Irish aid
agency Concern Worldwide and German organization Welt Hunger Hilfe termed the level of hunger in India “serious” .In
2018, it was ranked 103 out of 119 countries. In 2000, the country was ranked 83 out of 113 countries. Now, with 117 countries
in the fray, it has dropped to 102.
In the recently released Global Hunger Index (GHI) Report-2019, India was ranked at 102nd
position out of 117 countries.
The report is an annual publication that is jointly prepared by the Concern Worldwide (an Irish agency) and the Welt
Hunger Hilfe (a German organization).
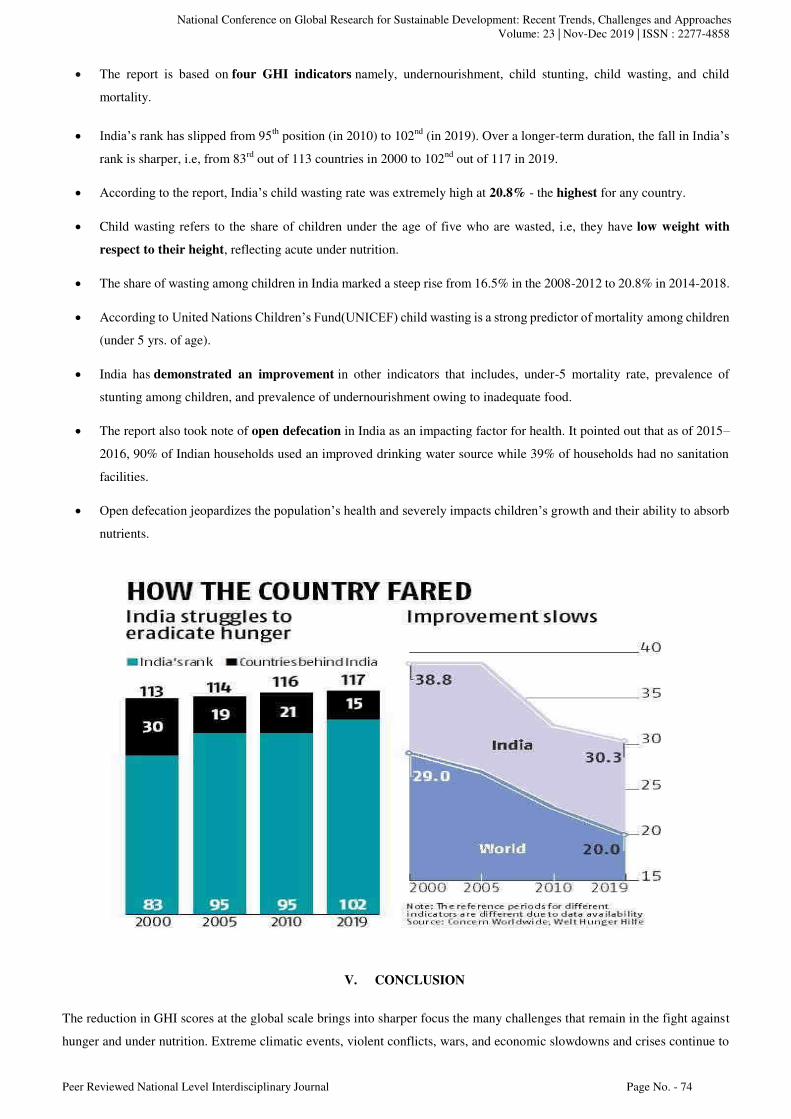
National Conference on Global Research for Sustainable Development: Recent Trends, Challenges and Approaches Volume: 23 | Nov-Dec 2019 | ISSN : 2277-4858
Peer Reviewed National Level Interdisciplinary Journal Page No. - 74
The report is based on four GHI indicators namely, undernourishment, child stunting, child wasting, and child
mortality.
India’s rank has slipped from 95th position (in 2010) to 102nd (in 2019). Over a longer-term duration, the fall in India’s
rank is sharper, i.e, from 83rd out of 113 countries in 2000 to 102nd out of 117 in 2019.
According to the report, India’s child wasting rate was extremely high at 20.8% - the highest for any country.
Child wasting refers to the share of children under the age of five who are wasted, i.e, they have low weight with
respect to their height, reflecting acute under nutrition.
The share of wasting among children in India marked a steep rise from 16.5% in the 2008-2012 to 20.8% in 2014-2018.
According to United Nations Children’s Fund(UNICEF) child wasting is a strong predictor of mortality among children
(under 5 yrs. of age).
India has demonstrated an improvement in other indicators that includes, under-5 mortality rate, prevalence of
stunting among children, and prevalence of undernourishment owing to inadequate food.
The report also took note of open defecation in India as an impacting factor for health. It pointed out that as of 2015–
2016, 90% of Indian households used an improved drinking water source while 39% of households had no sanitation
facilities.
Open defecation jeopardizes the population’s health and severely impacts children’s growth and their ability to absorb
nutrients.
V. CONCLUSION
The reduction in GHI scores at the global scale brings into sharper focus the many challenges that remain in the fight against
hunger and under nutrition. Extreme climatic events, violent conflicts, wars, and economic slowdowns and crises continue to

National Conference on Global Research for Sustainable Development: Recent Trends, Challenges and Approaches Volume: 23 | Nov-Dec 2019 | ISSN : 2277-4858
Peer Reviewed National Level Interdisciplinary Journal Page No. - 75
drive hunger in many parts of the world (FSIN 2019; FAO et al. 2019). Inequalities within country borders allow hunger and
undernutrition to persist even in countries that appear to do well according to national averages. The prevalence of
undernourishment—the percentage of the population without regular access to adequate calories—has stagnated since 2015,
and the number of people who are hungry has actually risen to 822 million from 785 million in 2015 (FAO et al. 2019).There is
still much work to be done before hunger and undernutrition can be eradicated for good. This report provides an overview of
the current situation at national, and international levels.. To address the current challenges while also preparing to sustainably
feed a world population expected to number about 10 billion by 2050, monumental changes to the global food system are
needed (Willett et al. 2019). The reduction in GHI scores since 2000 demonstrates that hunger and undernutrition are not
immutable problems and serves as cause for cautious optimism. In many countries, however, progress is too slow to be able to
achieve the second Sustainable Development Goal—known in short as Zero Hunger—by 2030. At the current pace,
approximately 45 countries will fail even to reach low hunger as defined by the GHI Severity Scale by 2030. It is now essential
to double down on the task of reducing hunger and undernutrition in the many parts of the world that are faltering.
REFERENCES
"Global hunger worsening, warns UN". BBC (Europe). 14 October 2009. Retrieved 22 August 2010.
"Map: The World's Hunger Problem". The Washington Post. 12 October 2015. Retrieved 20 October 2015.
"2016 Global Hunger Index: Revealed - the worst countries in the world at feeding their own people". The Independent. 17
October 2016. Retrieved 1 December 2016.
Welthungerhilfe, IFPRI, and Concern Worldwide: 2019 Global Hunger Index - The challenge of hidden hunger. Bonn,
Washington D. C., Dublin. October 2019.[verification needed] Evans, A. (2009): The Feeding of the Nine Billion. Global Food Security
for the 21st Century. Chatham House, London..
FAO (2012): The State of Food Insecurity in the World. Economic growth is necessary but not sufficient to accelerate reduction of
hunger and malnutrition. Rome.
FAO (2010): The State of Food Insecurity in the world. Addressing food insecurity in protracted crises. Rome.
Vanhaute, E. (2011) From famine to food crisis: what history can teach us about local and global subsistence crises. Journal of
Peasant Studies, Vol. 38, No. 1. p. 50.
AUTHOR’S BIOGRAPHY
1. Dr. Rupali Srivastava,
Assistant Regional Director IGNOU , Regional Center, Jodhpur, Rajasthan
2. Dr.Anuradha Sharma, Head of Department (D .El. Ed.) Symboyzia Girls College, Agra, Uttar Pradesh

National Conference on Global Research for Sustainable Development: Recent Trends, Challenges and Approaches Volume: 23 | Nov-Dec 2019 | ISSN : 2277-4858
Peer Reviewed National Level Interdisciplinary Journal Page No. - 76
Abstract: A survey of the global comparative opinion shows that people in India and indeed all countries, have a marked and rising
concern about sustainable development and climate change in recent years. Even as the science of climate change grapples with
uncertainties, the world is witnessing more extreme events.
In 1987, the United nations world commission on’ environment and development ‘released the report namely, our common future’ which
is commonly known as the ‘Brundtland report’on the name of the chairman of commission.
In 1992 the UN conference on the environment and development published the EARTH CHARTER
outlining the building of a just sustainable and peaceful world society in 21st century. It is also known as agenda 21.it imphsises that
broad public participation decision making is a fundamental prerequisite for achieving sustainable development.
The year 2015 witnessed two landmark international events--the historic climate change agreement under the UNFCCC
in Paris in December 2015 and the adoption of the SDGs in September 2015.
I. INTRODUCTION AND MEANING
“Sustainable development is development that meets the need of the present without compromising the ability of future generations to meet their own needs. “
“Climate change is no longer some far-off problem: it is happening here, it is happening now”. : Barack Obama, Former President of USA
A large population on the earth is still to get the ‘bare minimum’for development, humanity is at the crossroad where it is faced
with the first of its kind challenge - the challenge of ‘Climate Change ‘.
a
II. GLOBAL EMISSIONS
As per the WMO(World meteorologica organisation) 2016 was the warmest year with temperature 1°c above the pre industrial
era. This was owing to El nino and warming caused by greenhouse gases.
III. SUSTAINABLE DEVELOPMENT GOALS AND INITIATIVES
The UN general assembly in its 17th session in September 2015 announced a set of 17 SDGs and 169 targets which will
stimulate action over the next 15 years. The goals were proposed in the RIO+20 in June 2012. The SDGs will be effective
between 2016-2030.
“The coming years will be a vital period to save the planet and to achieve sustainable, inclusive human development.”
António Guterres, Secretary-General, United Nations
Global Research for Sustainable Development: Recent Trends, Challenges and Approaches
(Climate Change and Energy) Astha Singh Rao
National Conference on Global Research for Sustainable Development: Recent Trends, Challenges and Approaches Volume: 23 | Nov-Dec 2019 | ISSN : 2277-4858
Peer Reviewed National Level Interdisciplinary Journal Page No. - 77
The year 2016 witnessed hectic activities at the ministry of environment, forest and climate change on the
inrernational and national fronts. The environment ministry held the first National Stakeholders Consultation on
the biodiversity finance initiative. The object of the meeting is to introduce the BIOFIN project to the various
stakeholders, enumerate the programmes, being undertaken by different organisations in the context of India’s 12
natinal biodiversity targets. The ministry partnered with the UNDP in a global project on BIOFIN.
COP24 -
The 24th meeting of Conference Of Parties (COP24) to the UNFCCC was held at katowice, Poland.Thr key focus
of meeting was to finalize guidelines for implementation of the Paris agreement of 2015 in post 2020 period.
INDIA reiterated its commitment to Paris Agreement in a collective manner and followed an approach guided by
principles of equality and common but differentiated Responsibility and Respective Capability (CBPR-RC).
GREEN FINACE-
The idea gets its first mention in the UN document at the UN conference on sustainable development, 2012.There
is no universal definition of green finance.
INDIA AND GREEN DEVELOPMENT-
Green finance is yet to pick up in India. Attaining the ambitious solar energy target, development of solar cities,
setting upwidn power projects, developing smart cities and the sanitation under the clean India are all activities
needing green finance.
India created a corpus called the NCEF in 2010-11 out of the cess or coal produced for the purpose of financing
and promotinc clean energy initiative.
IV. SUSTAINABLE DEVELOPMENT AND CLIMATE CHANGE IN THE INDIAN CONTEXT
A portal on environment information system was launched to find out new ways to reach out to people and
popularise science, as well as sustainable practices, ENVIS portal http://envis.nic.in,a new initiative, runs parallel
with the digital India objective, which works on improving the digital literacy in the environment sector and
deliver services digitally all over the country.
The state of the environment report by the MoEF clubs the issues under five key challenges faced by India -
Climate Change
Food Security
Water Security
Energy Security
Managing Urbanisation
Climate change is disturbing the natural eco system and the sustainable development.
As per the SECOND NATIONAL COMMUNICATION submitted by India to the UNFCCC it is projected that the
annual mean surface temperature rise by the end of the century ranges from 3.5°c to 4.3°c whereas the sea level
along the Indian coast has been rising at the rate of about 1.3mm/year on an avg. These climate change projections
are likely to impact human health, agriculture, water, resources and biodiversity.
India has been the part of 94 multilateral environmental agreement. India has also voluntarily agreed to reduce its
emission intensity of its GDP by 20 - 25 % over 2005 levels by 2020.
National Conference on Global Research for Sustainable Development: Recent Trends, Challenges and Approaches Volume: 23 | Nov-Dec 2019 | ISSN : 2277-4858
Peer Reviewed National Level Interdisciplinary Journal Page No. - 78
The 9th meeting of the NATIONAL STEERING COMMITTEE ON CLIMATE CHANGE was held. The
Committee approved the detailed project reports on adaptions submitted by govt. Of Telangana, Mizoram, J&K,
Meghalaya, and Chhattisgarh for funding, under the NAFCC at a total coat of approximately ₹108 cr. for
implementation in these states.
Our PM Shri Narendra Modi inaugurated the international conference on the rule of the law for supporting the
2030 sustainable development goal. The PM emphasised that sustainable development is our priority.
INDCs
The INDCs are palns by government communicated to the UNFCCC regarding the steps they will take to address
climate change domestically. As per the COP 19 decision, all parties were requested to prepare the INDCs without
prejudice to the legal nature.
INDIA’S INDCs
India submitted its INDCs to the UNFCCC in October 2015 which is quite exhausting -
To put forward and further propogate a healthy and sustainable way of living based on traditions and
values of conservation and moderation.
To reduce the emission intensity of its GDP by 33 to 35 % of the 2005 level by 2030.
To create an additional carbon sink of 2.5to 3 billion tonnes of CO2 equivalent through additional forest
and tree cover by 2030.
V. INDIA’S CLIMATE, ENERGY CHALLENGES AND EFFORTS
India house 30% of the global poor,24% of the global population without access to electricity, and 92 million
people without access to safe drinking water. As per the global climate risk index 2019, it had world's second
highest number of deaths due to extreme climate and is 14th most vulnerable to climate change risk.
NAPCC- In 2017-18, the PM modis Council on climate change (PMCCC) directed the mission under the
NAPCCC to enhance their ambitions.
A new mission on climate change and health is currently under formulation and a National Expert Group on
Climate change and health has been constituted.
The proposed waste to energy mission will incentivise efforts towards harnessing energy from waste and aim at
lowering indias dependence on coal, oil, and gas for power production.
NITI Aayog and UN sign sustainable development framework for 2018 - 2022 at an event in NEW DELHI.
The agreement is a reflection of the commitment and effort made by India towards attaining the SDGs. Under the
framework, the UN will support the union government on the North - South cooperation, in partnership with the
ministry of external affairs.
Coal Cess and National Clean-
India is one of the few countries around the world to have a carbon tax in the form of a cess on coal. Not only has
India imposed such a cess but it has also been progressively increasing it. The NCEF which is supported by the

National Conference on Global Research for Sustainable Development: Recent Trends, Challenges and Approaches Volume: 23 | Nov-Dec 2019 | ISSN : 2277-4858
Peer Reviewed National Level Interdisciplinary Journal Page No. - 79
cess on coal was created for the purpose of financing and promoting clean energy initiative,funding research in the
areas of clean energy and for any other related activities.
VI. DEVELOPMENT WITH WISHDOM
Hardly anything makes economic sense unless its continuance for a long time can be projected without running
into absurdities.
As GANDHIJI has said “Earth provides enough to satisfy every man’s need but for not every ones’s greed.”
VII. CONCLUSION
Mankind needs introspect not only a outfits present needs but the way those needs are being met. We are ethically
and morally responsible to care and manage the earth. We must work towards the development of sustainable
society that manages its economy and population size without doing irreparable harm by over loading earth's
capacity to absorb environmental ins and outs.our physical needs have a direct link with the resources we have at
our disposal to meet them. We must think globally and act locally and conserve our climate and energy
resources.
AUTHOR’S BIOGRAPHY
Astha Singh Rao, Smt. Narayani Devi Verma Women Teacher Training College, Bhilwara, Rajasthan
Email- [email protected]

National Conference on Global Research for Sustainable Development: Recent Trends, Challenges and Approaches Volume: 23 | Nov-Dec 2019 | ISSN : 2277-4858
Peer Reviewed National Level Interdisciplinary Journal Page No. - 80
Abstract: Since 1998, the Food and Agriculture Organization of the United Nations (FAO) has been publishing its
electronic publications in the FAO Corporate Document Repository (CDR). The electronic publishing workflow is
maintained by the Electronic Information Management System (EIMS). The EIMS-CDR holds more than 38 500
documents and is the gateway to FAO's publications. The EIMS-CDR coexists with the FAODOC – the online catalogue
for documents produced by FAO. FAODOC catalogues and indexes both electronic and printed documents while the
EIMS-CDR manages full text documents and a minimal set of metadata. This paper discusses the merger of the
EIMS-CDR and the FAODOC into a unique FAO Open Archive based on the integration of the electronic publishing and
the bibliographic cataloguing requirements. The FAO Open Archive will be the foundation for the collection, management,
maintenance and timely dissemination of material published by FAO. To improve the effectiveness of the proposed
repository, it is necessary to streamline the current electronic publishing workflow. The merger of the EIMS-CDR and the
FAODOC will strengthen FAO’s role as a knowledge dissemination organization. Especially, as one of the principal tasks
of the FAO is to efficiently collect and disseminate information regarding food, nutrition, agriculture, fisheries and
forestry.
Keywords: open access; open archive initiative; interoperability; digital repositories; data content standards
I. INTRODUCTION
The Food and Agriculture Organization of the United Nations (FAO) has more than 50 years of experience in the
production and the dissemination of information, both through its headquarters-based regular programme and
through field projects. The collection, analysis, interpretation and dissemination of information relating to
nutrition, food and agriculture are FAO’s main functions [1]. The World Wide Web has proven to be a powerful
means for FAO to disseminate multilingual information.
In this context, FAO was an early implementer of:
1. an online catalogue for documents produced by FAO (FAODOC, Figure 1), a multilingual online
catalogue which contains bibliographic metadata of FAO electronic and printed documents [2];
2. the Electronic Information Management System (EIMS), a workflow management tool and database
which manages the publication of electronic documents and multimedia resources on FAO’s Web sites
[3]; and
3. the Corporate Document Repository (CDR, Figure 2), a corporate output interface for FAO full text
electronic publications stored in the EIMS [4, 5].
The FAO Open Archive: Enhancing Access to
FAO Publications Using International Standards
and Exchange Protocols
Dr. Jayshree Soni

National Conference on Global Research for Sustainable Development: Recent Trends, Challenges and Approaches
Volume: 23 | Nov-Dec 2019 | ISSN : 2277-4858
Peer Reviewed National Level Interdisciplinary Journal Page No. - 81
The FAODOC is a multilingual, online catalogue of documents and publications produced by FAO since 1945.
The system uses UNESCO's CDS/ISIS software [6]. More than 160 000 documents have currently been
catalogued. Since its inception, the FAODOC has focused on the production of high quality bibliographic records.
The FAO Web site was released in 1995 and the first electronic publishing workflow (through EIMS) was initiated
in 1998. Currently, more than 38 550 resources (full text documents and multimedia items) are managed by the
EIMS (Table 1). Photos, videos and audio are accessible through different systems on the FAO Web site. The
CDR was conceived as the online digital library of FAO electronic documents and publications, as well as selected
non-FAO material. At present, more than 23 000 full text documents are available through the CDR.
Table 1: Resources at FAO (as at 10 April 2007) For each system described above, the objectives are different. The FAODOC focuses on the cataloguing of FAO
documents. The EIMS deals with electronic publishing, especially the management at the full text level (rather
than the description of documents). The CDR focuses on the dissemination of FAO documents archived through
the EIMS. In 2003, a link between both databases was created, linking the FAODOC records to the full text
documents archived in EIMS-CDR.
Figure 1: FAODOC user interface
Resource type Number of Records full text documents 23 000 photos 8 500 videos 6 300 audio 750 Total 38 550

National Conference on Global Research for Sustainable Development: Recent Trends, Challenges and Approaches
Volume: 23 | Nov-Dec 2019 | ISSN : 2277-4858
Peer Reviewed National Level Interdisciplinary Journal Page No. - 82
This paper describes the process of merging the EIMS-CDR and the FAODOC and the creation of the FAO Open
Archive. The result will be one unique sustainable digital repository offering a solid foundation for the collection,
management, maintenance and timely dissemination of material published by FAO. To improve the effectiveness
of the proposed repository, it will be necessary to streamline the existing electronic publishing workflow and to
integrate the current functions into new modules. The FAO Open Archive is based on three key elements:
1. a metadata set based on international description guidelines and format;
2. a workflow procedure that guarantees the processing of all documents published by FAO; and
3. a system architecture based on cataloguing and electronic publishing.
This paper is divided into the following sections: Section 2 presents the current situation for the EIMS-CDR and
the FAODOC; Section 3 details the objectives of the FAO Open Archive; Section 4 describes the workflow
procedures, the new architecture, the compliance to International Standards for Bibliographical Description
(ISBD) [7] and metadata sharing with other systems; and Section 5 is the conclusion and the next steps in
implementing the FAO Open Archive.
Figure 2: CDR user interface

National Conference on Global Research for Sustainable Development: Recent Trends, Challenges and Approaches Volume: 23 | Nov-Dec 2019 | ISSN : 2277-4858
Peer Reviewed National Level Interdisciplinary Journal Page No. - 83
a
II. OBJECTIVES
The objective of the FAO Open Archive is to create a unique sustainable digital repository for the dissemination of FAO
publications and simultaneously, enhance interoperability with other information systems. The FAO Open Archive will
guarantee efficient electronic publishing and metadata management, the effective dissemination of FAO information
resources and the preservation of the Organization’s institutional memory.
III. CURRENT SITUATION FOR EIMS-CDR AND FAODOC
FAODOC has been managing all bibliographic information for FAO documents and publications for over 30 years (since
1976). Since 1998, FAO established a workflow to manage the electronic publishing and dissemination of FAO full text
documents through the EIMS-CDR [8]. The EIMS-CDR and the FAODOC workflows, actors and content are described
below.
3.1 EIMS-CDR, the Electronic Publishing and Digital Repository
There are four different user profiles in the EIMS-CDR workflow: Originator – the person within the FAO unit responsible for providing the source files and/or the printed copy of
the publication;
Data owner – the FAO unit responsible for the content of the publication;
Focal point – the person responsible in EIMS-CDR for managing requests from FAO units [9]; and
Liaison officer – the person within a FAO unit who ensures that publications are made available online. The
liaison officer is the link between the originator and the focal point.
Detailed guidelines of the EIMS-CDR workflow are available to all FAO users and EIMS-CDR administrators.
Following is a brief description of standard workflow steps:
The originator provides source files to the external printing unit. When the publication is printed, the external
printing unit provides the focal point with the source files, the PDF version and the hard copy. In some cases files
are provided by the originator;
The data owner creates and locates a record in EIMS;
The data owner notifies the focal point of the record and the uploaded files;
The focal point completes the record. Conversion to HTML or PDF is handled by focal points or outsourced to an
external company. When conversion is completed, the focal point notifies the data owner of the test URL for
reviewing the publication;
The data owner reviews the publication and either approves it or requests changes, by notifying the focal point;
The focal point reviews the final publication, publishes it and notifies the data owner of the public URL. If no
conversion is required, the focal point prepares an HTML table of contents that links to the low-resolution PDF
files and notifies the data owner of the public URL (in some cases only PDF files are published without the
associated HTML pages).
Publications are made available in various electronic formats:
Full HTML version; HTML loads quickly and is easier to read on-screen. ~14 000 records;
Full PDF version; PDF is better for printing and downloading a local copy. ~2 200 records;
Full HTML version and PDF version. ~6 500 records; and
HTML table of contents linked to Full PDF version. ~500 records
3.2 FAODOC, the Online Catalogue

National Conference on Global Research for Sustainable Development: Recent Trends, Challenges and Approaches Volume: 23 | Nov-Dec 2019 | ISSN : 2277-4858
Peer Reviewed National Level Interdisciplinary Journal Page No. - 84
The FAODOC cataloguing process involves various actors:
Originator – the person within the FAO unit responsible for delivering to FAODOC the hard copy of the
publications and/or the full text documents to be published in EIMS-CDR;
EIMS-CDR focal point – the person who notifies the FAODOC cataloguer of a new record in EIMS-CDR, so
they link the FAODOC record to the EIMS-CDR full text document; and
Cataloguer – the person who selects and catalogues the publications (hard copies and full text documents from
EIMS-CDR).
The FAODOC manages the cataloguing of document and the dissemination of bibliographic information through
an Online Public Access Catalogue (OPAC). There are procedures for the exchange of information between the
FAODOC and the document producers, but there is no specific electronic tool to manage the reception of documents,
as exists in the EIMS-CDR workflow. The lack of any workflow management system makes it difficult to control
the reception and cataloguing of documents.
3.3 Main Differences between EIMS-CDR and FAODOC
The process of merging the two existing databases is a challenging task, as each has a different structure and
workflow procedure. The first step towards the FAO Open Archive was to determine the similarities and differences
between the EIMS-CDR and the FAODOC.
3.3.1 Software Overview
The EIMS-CDR was developed by FAO to manage the electronic publishing workflow. The CDR and the EIMS both run
on a Microsoft Windows platform with an Oracle 9 database server. The software uses Microsoft’s ASP programming
language (Active Server Pages), with some ad hoc modules and functionalities developed in ASP.Net (the successor to
ASP). The EIMS architecture results from the interaction of several modules that manage different aspects of the overall
workflow. All modules interact with a single database that stores the records’ descriptive metadata and detailed workflow
information.
The FAODOC uses CDS/ISIS, a software package for information storage and retrieval – developed, maintained and
disseminated by UNESCO. It is freely available for non-commercial purposes. The customization of data input and
output interfaces occurred in Poland at the Institute for Computer and Information Engineering and at FAO.
3.3.2 Metadata Structure
CDS/ISIS manages a database whose main content is text, while the EIMS-CDR uses a relational Oracle database. The
structure and logic of the two databases are completely different. However, these differences are not a barrier for the
merger into a new single relational database.
Both systems use a very similar set of metadata fields to describe documents. The FAODOC contains detailed
document information, while the EIMS-CDR provides fewer details on the actual document, but stores much
information related to the actors, workflow and full text management. The mapping of the EIMS-CDR and the
FAODOC databases has already occurred. It was not a complicated procedure, as both systems use a similar
metadata field set. The compliance of both databases to the Dublin Core metadata standard and the AGRIS AP
at export level, facilitated the mapping. Only those fields required for the EIMS-CDR workflow have been
added to those that already exist in the FAODOC.
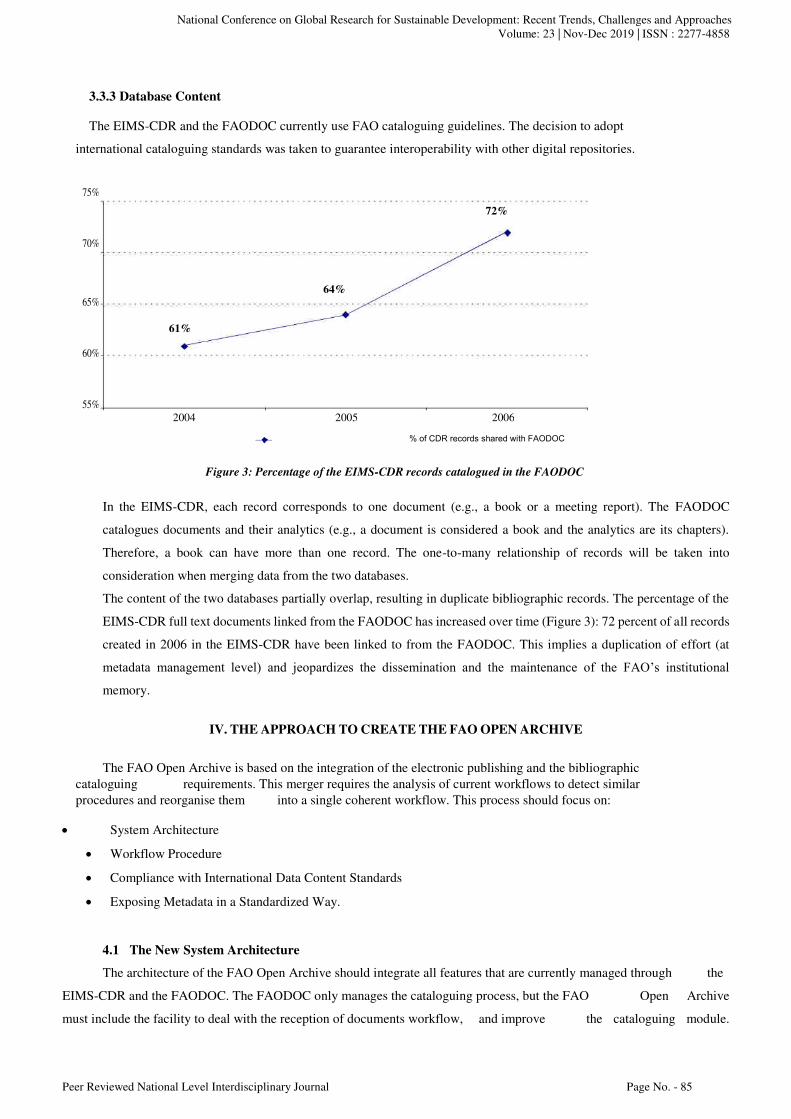
National Conference on Global Research for Sustainable Development: Recent Trends, Challenges and Approaches Volume: 23 | Nov-Dec 2019 | ISSN : 2277-4858
Peer Reviewed National Level Interdisciplinary Journal Page No. - 85
3.3.3 Database Content
The EIMS-CDR and the FAODOC currently use FAO cataloguing guidelines. The decision to adopt
international cataloguing standards was taken to guarantee interoperability with other digital repositories.
75%
72%
70%
65% 64%
61%
60%
55% 2004 2005 2006
% of CDR records shared with FAODOC
Figure 3: Percentage of the EIMS-CDR records catalogued in the FAODOC
In the EIMS-CDR, each record corresponds to one document (e.g., a book or a meeting report). The FAODOC
catalogues documents and their analytics (e.g., a document is considered a book and the analytics are its chapters).
Therefore, a book can have more than one record. The one-to-many relationship of records will be taken into
consideration when merging data from the two databases.
The content of the two databases partially overlap, resulting in duplicate bibliographic records. The percentage of the
EIMS-CDR full text documents linked from the FAODOC has increased over time (Figure 3): 72 percent of all records
created in 2006 in the EIMS-CDR have been linked to from the FAODOC. This implies a duplication of effort (at
metadata management level) and jeopardizes the dissemination and the maintenance of the FAO’s institutional
memory.
IV. THE APPROACH TO CREATE THE FAO OPEN ARCHIVE
The FAO Open Archive is based on the integration of the electronic publishing and the bibliographic cataloguing requirements. This merger requires the analysis of current workflows to detect similar procedures and reorganise them into a single coherent workflow. This process should focus on: System Architecture
Workflow Procedure
Compliance with International Data Content Standards
Exposing Metadata in a Standardized Way.
4.1 The New System Architecture
The architecture of the FAO Open Archive should integrate all features that are currently managed through the
EIMS-CDR and the FAODOC. The FAODOC only manages the cataloguing process, but the FAO Open Archive
must include the facility to deal with the reception of documents workflow, and improve the cataloguing module.
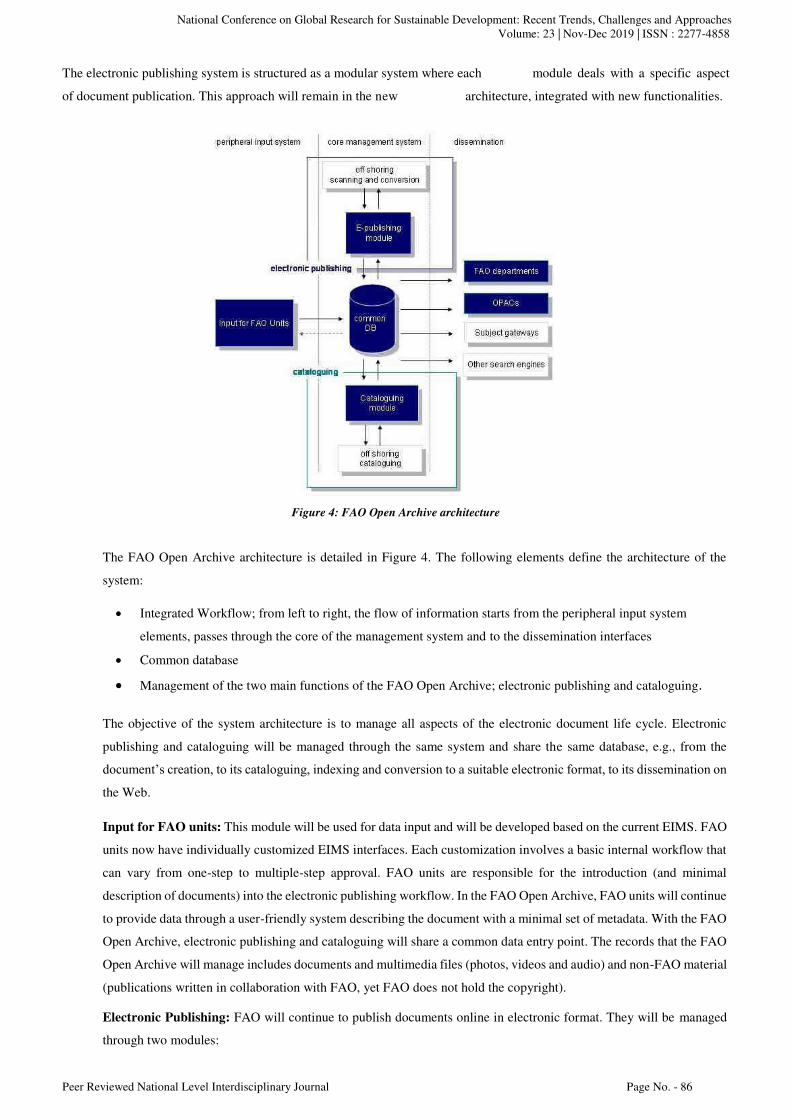
National Conference on Global Research for Sustainable Development: Recent Trends, Challenges and Approaches Volume: 23 | Nov-Dec 2019 | ISSN : 2277-4858
Peer Reviewed National Level Interdisciplinary Journal Page No. - 86
The electronic publishing system is structured as a modular system where each module deals with a specific aspect
of document publication. This approach will remain in the new architecture, integrated with new functionalities.
Figure 4: FAO Open Archive architecture
The FAO Open Archive architecture is detailed in Figure 4. The following elements define the architecture of the
system:
Integrated Workflow; from left to right, the flow of information starts from the peripheral input system
elements, passes through the core of the management system and to the dissemination interfaces
Common database
Management of the two main functions of the FAO Open Archive; electronic publishing and cataloguing.
The objective of the system architecture is to manage all aspects of the electronic document life cycle. Electronic
publishing and cataloguing will be managed through the same system and share the same database, e.g., from the
document’s creation, to its cataloguing, indexing and conversion to a suitable electronic format, to its dissemination on
the Web.
Input for FAO units: This module will be used for data input and will be developed based on the current EIMS. FAO
units now have individually customized EIMS interfaces. Each customization involves a basic internal workflow that
can vary from one-step to multiple-step approval. FAO units are responsible for the introduction (and minimal
description of documents) into the electronic publishing workflow. In the FAO Open Archive, FAO units will continue
to provide data through a user-friendly system describing the document with a minimal set of metadata. With the FAO
Open Archive, electronic publishing and cataloguing will share a common data entry point. The records that the FAO
Open Archive will manage includes documents and multimedia files (photos, videos and audio) and non-FAO material
(publications written in collaboration with FAO, yet FAO does not hold the copyright).
Electronic Publishing: FAO will continue to publish documents online in electronic format. They will be managed
through two modules:

National Conference on Global Research for Sustainable Development: Recent Trends, Challenges and Approaches Volume: 23 | Nov-Dec 2019 | ISSN : 2277-4858
Peer Reviewed National Level Interdisciplinary Journal Page No. - 87
core module for electronic publishing – this module will be used to review the information from FAO units,
based on EIMS, and to manage the conversion of full text documents into electronic formats (HTML, PDF,
etc.); and
scanning requests managing module – this module will be directly connected to the core module for electronic
publishing and will be used to keep track of the work assigned to internal resources or of the work orders sent
for scanning and/or conversion to external companies.
Cataloguing. FAO will offshore the cataloguing, using the minimal set of metadata and the full text provided by the
FAO units. FAO cataloguers will check and validate the offshored records in order to guarantee the quality of the
bibliographic description for the full text documents. Cataloguing will also be managed through two modules:
core module for cataloguing – this module will be used to select records to be offshored for cataloguing and
indexing and to check metadata quality. It will be used exclusively by cataloguers to manage the information to
be released into the Open Archive; and
cataloguing offshoring module – this module will be directly connected to the core module for cataloguing and
will be used to manage the XML exports of data to be catalogued by external companies and to manage import
and validation of offshored records.
4.2 Workflow Procedures
As well as the architecture, the workflow of the FAO Open Archive must integrate two main activities that so
far have been conducted separately: electronic publishing and cataloguing. Figure 5 shows a top-down representation
of the new workflow:
FAO units initiate a record by inserting a minimal set of metadata into the data input module. Only minimal
information is requested to initiate a record: author, title, year and job number (a FAO unique identifier). The
system verifies whether the job number exists in the database. A simple validation workflow within the
peripheral input system will ensure that the records inserted are eligible for publication in the FAO Open
Archive.
The electronic publishing administration and the cataloguing administration are notified of the addition of a
new record. They can take action simultaneously on the full text and the metadata of the records.
If the document received is already in electronic format it requires validation and conversion to the
most suitable format. This task can be carried out in-house or can be offshored. If the document
needs digitalization then it is offshored for scanning.
Using the minimal set of metadata in the system and the link to the full texts, the documents are
catalogued and indexed by FAO and/or external cataloguers. The records that are selected for
offshoring are exported using XML. When exported records are received from the external
company they are imported into the system, checked and validated.
Validated records are disseminated through FAO Web sites. Moreover, search engines, services providers and
digital libraries will harvest the records’ metadata enhancing access to FAO documents.
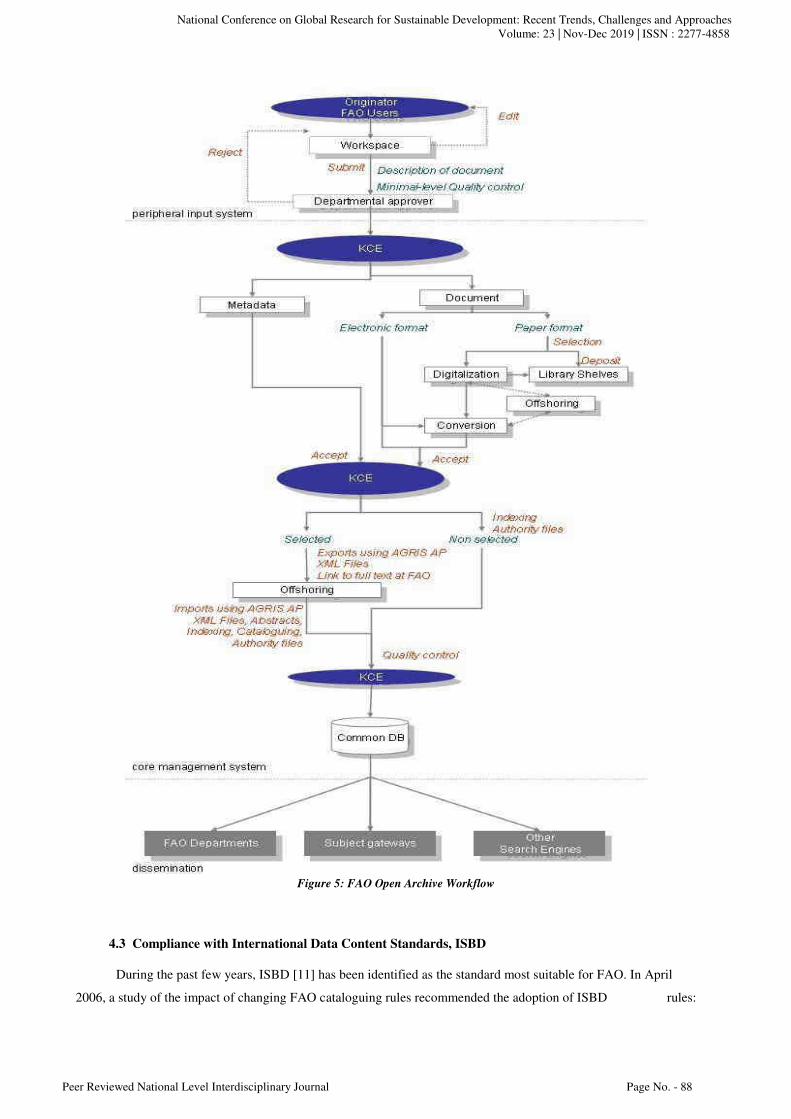
National Conference on Global Research for Sustainable Development: Recent Trends, Challenges and Approaches Volume: 23 | Nov-Dec 2019 | ISSN : 2277-4858
Peer Reviewed National Level Interdisciplinary Journal Page No. - 88
Figure 5: FAO Open Archive Workflow
4.3 Compliance with International Data Content Standards, ISBD
During the past few years, ISBD [11] has been identified as the standard most suitable for FAO. In April
2006, a study of the impact of changing FAO cataloguing rules recommended the adoption of ISBD rules:

National Conference on Global Research for Sustainable Development: Recent Trends, Challenges and Approaches Volume: 23 | Nov-Dec 2019 | ISSN : 2277-4858
Peer Reviewed National Level Interdisciplinary Journal Page No. - 89
“... recommend that FAO adopt the ISBD rules and build a system that will send and accept queries
according to the OpenURL standard. In this way, FAO will build a system that will work with (interoperate
with) other catalogues, while making FAO documents far more accessible to users. FAO, OCLC and other
databases can create OpenURLs based on records that follow international guidelines and in this way,
create an interoperable system [12]”.
ISBD rules are rigorous and exact. ISBD is based on the principles of adequate identification, searchability and
consistency so that:
1. no two different documents can be confused with each other; and
2. the many details comprising a description, are presented in a uniform manner so that they can be interpreted
without unnecessary ambiguity [13].
By applying the ISBD rules, FAO will not only enhance the international exchange of FAO records, but will also assist
in the interpretation of records across languages, because ISBD records can be interpreted on a first level
(identification of elements) by users of every language. This is because of the fixed order of ISBD records. Finally,
ISBD is independent of any metadata format. In conclusion, ISBD rules are simple, exact, widely used and supported
by the International Federation of Library Associations and Institutes (IFLA). ISBD will facilitate the interoperability
with other institutions and/or services providers, as it is an international standard followed by many of the world’s
major libraries and bibliographic institutions.
One of the biggest challenges will be the handling of the legacy data; old records require re-cataloguing, e.g., titles
need to be transcribed according to ISBD rules. A possible solution could be to import bibliographic records from
databases that have already catalogued FAO documents, ignoring fields that are not relevant to FAO’s needs and
adding specific information already existing in FAO records, e.g., AGROVOC Thesaurus [14] descriptors. However,
the legacy data can be updated, prioritizing those records which have the full text available and/or are accessed on a
regular basis. The introduction of an additional code to distinguish old from new ISBD records is required.
The FAO units will introduce a minimal-level description based on ISBD and the offshored and FAO cataloguers
could then bring the records to full ISBD level.
4.4 Exposing Metadata in a Standardised Way
This is a very important issue, and it has been addressed successfully by the Open Archives Initiative (OAI). Open
Archive Initiative Protocol for Metadata Harvesting (OAI-PMH) is a simple protocol that allows data providers to
expose their metadata for harvesting to services providers. The FAO Open Archive will be OAI compliant, so the FAO
metadata can be harvested by any services providers and/or digital libraries.
The concept of OAI-PMH can be applied to a wide range of digital materials, e.g. images, audio or videos. It is
mandatory to expose metadata as Dublin Core. It is important to note that the protocol enables multiple metadata
formats. These alternative forms of metadata can be as rich as is necessary to describe content. During the last few
years, FAO has made an intensive effort to promote the exchange of high-quality metadata within the AGRIS
Network, an international initiative based on a collaborative network of institutions in agriculture and related subjects.
The AGRIS AP is a metadata format that facilitates sharing of metadata across different information systems. It is a

National Conference on Global Research for Sustainable Development: Recent Trends, Challenges and Approaches Volume: 23 | Nov-Dec 2019 | ISSN : 2277-4858
Peer Reviewed National Level Interdisciplinary Journal Page No. - 90
metadata schema which uses elements from metadata standards such as Dublin Core (DC), Australian Government
Locator Service Metadata (AGLS) [15] and Agricultural Metadata Element Set (AgMES) [16] namespaces. The
standard enhances the quality of the description of agricultural information resources, enabling greater processing
possibilities by service providers. The AGRIS AP has proved to be a successful initiative, and as a result, the FAO
Open Archive will be fully compliant with the AGRIS AP at export level.
In conclusion, exposing metadata will:
Improve the retrieval of FAO documents from a large number of sources (e.g., portals, aggregators and
services providers);
Allow aggregators to detect FAO documents and thereby help to disseminate them; and
Enhance the visibility and awareness of FAO’s available resources.
V. CONCLUSIONS AND NEXT STEPS
This paper illustrates the first phase for the creation of the FAO Open Archive, focussing on finding a
strategy to solve:
The duplication of efforts in creating and managing metadata.
The lack of integration of electronic publishing and cataloguing.
The relevant findings from this first phase are:
The FAODOC and the EIMS-CDR will use a common database and a workflow supported by a workflow
management system. FAO will supply FAO bibliographic metadata together with the full text.
The conversion of the FAODOC and the EIMS-CDR to the FAO Open Archive will facilitate the data input
and maintenance of information. The FAO units will continue to be involved in the metadata creation process.
The use of ISBD rules will simplify the creation of metadata. The legacy data will be updated to ISBD
standards, prioritizing those records, which a) are accessed on a regular basis, and b) have the full text
available to improve the effectiveness of the OpenURL protocol.
The visibility and dissemination of FAO documents will be maximized by exposing content through
OAI-PMH. The FAO Open Archive should have the ability to transfer and use information in a uniform and
efficient manner across multiple organisations and information technology systems.
The creation of the FAO Open Archive will strengthen FAO’s role as a knowledge dissemination organization.
The following phase is related to the software implementation. The integration of open source software into FAO
Open archive is still under evaluation.
REFERENCES
FAO Constitution, Article I. http://www.fao.org/docrep/x1800e/x1800e01.htm#1 Last accessed in April 2007.
Catalogue for Documents produced by FAO (FAODOC) http://www4.fao.org/faobib/index.html Last accessed in
April 2007.
Electronic Information Management Services (EIMS). http://www.fao.org/eims/ Last accessed in April 2007.
Corporate Document Repository (CDR) http://www.fao.org/documents/ Last accessed in April 2007.
National Conference on Global Research for Sustainable Development: Recent Trends, Challenges and Approaches Volume: 23 | Nov-Dec 2019 | ISSN : 2277-4858
Peer Reviewed National Level Interdisciplinary Journal Page No. - 91
The Knowledge Exchange & Capacity Building Division (KCE) of FAO is the responsible for all the above
mentioned systems.
AGRIS/CARIS Centre of Information Management for international agricultural research
http://www.fao.org/Agris/ Last accessed in April 2007.
International Standards for Bibliographic Description (ISBDs http://www.ifla.org/VI/3/nd1/isbdlist.htm Last accessed
in April 2007.
SALOKHE, G.; PASTORE, A.; RICHARDS, B.; WEATHERLEY, S.; AUBERT, A.; KEIZER, J.; NADEAU, A.;
KATZ, S.; RUDGARD, S.; MANGSTL; ANTON. FAO’s role in Information Management and Dissemination –
Challenges, Innovation, Success, Lessons Learned. 2005. ftp://ftp.fao.org/docrep/fao/008/af238e/af238e00.pdf
Last accessed in April 2007.
This task involves the scanning and conversion of documents, corrections, modifications and the publication of
HTML/PDF files.
The AGRIS Application Profile for the International Information System on Agricultural Sciences and Technology
Guidelines on Best Practices for Information Object Description
http://www.fao.org/docrep/008/ae909e/ae909e00.htm Last accessed in April 2007.
In 1969 the International Federation of Library Associations and Institutes (IFLA) created a general framework for the
creation of standards to regularize the form and content of bibliographic descriptions (Byrum, J.D., "The Birth and
Re-birth of the ISBDs: Process and Procedures for Creating and Revising the International Standard BibIiographic
Descriptions". IFLA journal, Vol. 27, No. 1, 2001). The work resulted in the ISBD rules which specify the requirements
for the description and identification of the most common types of resources that are likely to appear in library
collections.
WEINHEIMER, J. (2006). Consequences of changing FAO cataloguing rules & format with
ISBD/AACR2/MARC21: a report for the Food and Agriculture Organization of the United Nations. Internal
report.
COETZEE, H. (2005). Do we still need bibliographic standards in computer systems?
http://www.liasa.org.za/interest_groups/igbis/papers/IGBIS_WSJul04_Bib_Stds_Helena_Coetzee.doc Last accessed
in April 2007.
AGROVOC is a multilingual structured and controlled vocabulary designed to cover the terminology of all subject
fields in agriculture, forestry, fisheries, food and related domains. http://www.fao.org/aims/ag_intro.htm
AGLS Metadata Standard http://www.naa.gov.au/recordkeeping/gov_online/agls/summary.html Last accessed in
April 2007.
Agricultural Metadata Element Set (AgMES) http://www.fao.org/aims/intro_meta.jsp Last accessed in April 2007.
AUTHOR’S BIOGRAPHY
Dr. Jayshree Soni, Research Scholar, Department of Political Science, Jai Narain Vyas University, Jodhpur (Raj.)
Email- [email protected]
National Conference on Global Research for Sustainable Development: Recent Trends, Challenges and Approaches Volume: 23 | Nov-Dec 2019 | ISSN : 2277-4858
Peer Reviewed National Level Interdisciplinary Journal Page No. - 92
Abstract: Climate change is serious issue which brings attention of environmentalists from all over the world. Climate change occurs
since ancient times but in recent few decades it become more and more intensive and in turn it adversely affect both flora and fauna in all
regions across the world. Impacts of climate change are more intensive in Western Rajasthan of Rajasthan as this region already has
harsh climatic conditions. In this paper various issues and challenges of climate change in western Rajasthan will be studied.
Keywords: Climate change, Thar desert
I. INTRODUCTION
In simple words the word ‘climate’ may be defined as average weather of a particular place which includes many geographical
factors like changing temperature, humidity, rainfall, wind velocity of a particular area. In other words climate may be defined
as variability of these factors over some specific period of time. The most important feature of climate is that it is always
varying and climate of an area for two specific time periods are never exactly alike.
The climate of earth is every changing throughout the history, but the change remains very negligible for many decades but due
to combination of many reasons the climate of earth is changing at very faster rate than any point in the history of modern
civilization. Climate change adversely affects life of whole society and it resulted in series of impacts across every region of
world. Developing country like India is already facing tremendous pressures from rapid urbanisation, industrialisation and
economic development and the Climate change may pose additional stresses on ecological and socioeconomic systems of
country.
According to Commissioned Research Report entitled “India: The Impact of Climate Change to 2030” prepared By Joint
Global Change Research Institute and Battelle Memorial Institute, Pacific Northwest Division warming of 0.5 C is likely over
all India by the year 2030 and a warming of 2-4 C by the end of this century, with the maximum increase over northern India.
II. IMPACTS ON CLIMATE CHANGE
Today, climate change is emerged most vital global challenge of the 21st century which brings attention of scientists, social
workers, governments. Though, the problem of climate change exceeds all geographical and political boundaries and evenly
affects the global population but impacts of climate change are felt differently by different groups of people in different areas.
Specially, due to low adaptive capacities of western desertic regions of Rajasthan, climatic variables are highly susceptible to
climate-induced tragedies.
Climate change is affecting the people in many ways like health, agriculture, food, water, rainfall etc. Ecosystem of any region
is greatly affected by changing climate change. Due to climate change temperature is increasing and rainfall cycle is greatly
disturbed which badly affect the agriculture practices. Also prolonged summer season badly affects the human health in many
ways.
Climate Change:Impact Assessment in Thar
Region Covering Western Rajasthan
Khushal

National Conference on Global Research for Sustainable Development: Recent Trends, Challenges and Approaches
Volume: 23 | Nov-Dec 2019 | ISSN : 2277-4858
Peer Reviewed National Level Interdisciplinary Journal Page No. - 93
Surface and groundwater supplies in some regions are already stressed, and water quality is diminishing in many areas, in part
due to increasing sediment and contaminant concentrations after heavy downpours. In some regions, prolonged periods of high
temperatures associated with droughts contribute to conditions that lead to larger wildfires and longer fire seasons.
The capacity of ecosystems like forests, barrier beaches, and wetlands to buffer the impacts of extreme events like fires, floods,
and severe storms is being overwhelmed. The rising temperature and changing chemistry of ocean water is combining with
other stresses, such as overfishing and pollution, to alter marine-based food production and harm fishing communities.
III. IMPACTS ON CLIMATE CHANGE IN WESTERN RAJASTHAN
Western Rajasthan is part of thar desert region which is subjected to many harsh climatic conditions like low rainfall, drought,
high temperature etc. which exerts excessive pressure on both flora and fauna of the region. Thirteen districts of Rajasthan state
viz., Ganganagar, Hanumangarh, Bikaner, Churu, Nagaur, Jhunjhunu, Sikar, Jodhpur, Barmer, Jaisalmer, Jalore, Pali and
Sirohi constitute western Rajasthan.
The Inter Governmental Panel on Climate Change (IPCC, 2007) along with the PRECIS model in their reports projected that
due to increase in temperature in thar region covering western Rajasthan, days will become hotter and night will be more
warmth in 21st century. They also predicted that there will be reduction in rainfall in thar region and also the rainfall pattern will
be changed. IPCC report also stated that due to increase in temperature water demand will be increased which will adversely
affect the ecosystem of thar region. The imbalance in ecosystem will lead to migration of people and the habitat pattern of thar
region is expected to change.
To understand the climate changes in Thar region, long-term trends in annual rainfall and temperatures for Thar region were
analyzed.
IV. TEMPERATURE
The report showed that due to climate change temperature is expected to increase in thar region covering thirteen districts of
western Rajasthan. The study reveals that at the end of 21st century, at Bikaner the temperatures is likely to increase by +3.3
C, at Jaisalmer by +3.4C, at Jodhpur by +2.9 C and +2.5 C at Pali district of Western Rajasthan.
V. ANNUAL RAINFALL
The study predicts that the annual rainfall of is likely to be increased by +100 mm at Bikaner, +124 mm at Jaisalmer, -40 mm
at Jodhpur and +21 mm at Pali.
VI. EVOPOTRANSPIRATION
The spatial and temporal variation in potential evapotranspiration requirement of Thar region ranged from 2.1 mm/day to 12.2
mm/day and on an annual basis between 1500 mm to 2220 mm. Further, the impact of projected air temperature upto a rise of
4 C by 21st century increases in evapotranspiration requirements by 9 to 23% during monsoon period and 13-47% during
winter period and such increased demand in water due to global warming will reduce the water and feed resources of Thar
region.
National Conference on Global Research for Sustainable Development: Recent Trends, Challenges and Approaches
Volume: 23 | Nov-Dec 2019 | ISSN : 2277-4858
Peer Reviewed National Level Interdisciplinary Journal Page No. - 94
VII. CONCLUSION
Climate change directly affecting flora and fauna across the world and the Thar region covering many districts of western
Rajasthan are more prone to adverse impacts of climate change. Thar region already facing very harsh climatic conditions and
climate change will further worse the climatic conditions of this region. There is urgent need to address this problem to reduce
the bad impacts of climate change on flora and fauna of thar region.
REFERENCES
IPCC, Cambridge, Climate Change 2007: The Physical Science Basis. Contribution of the Working Group I to the Fourth
Assessment Report of the Intergovernmental Panel on Climate Change, 996 pp. [Solomon, S., D. Qin., M. Manning., Z. Chen., M.
Marquis., K.B. Averyt., M. Tignor and H.L.Miller (Eds)]. Cambridge University Press, Cambridge, U.K., and New York, the USA,
2007.
Pant, G.B. and Hingane, L.S., 1988. Climatic changes in and around the Rajasthan desert during the 20th century. J. Climate 8:
391-401.
Pant, G.B. and Maliekal, J.A., 1987. Holocene climatic changes over north-west India. An appraisal. Climate Change 10:
183-194.
Surendra Poonia and A.S. Rao, Climate Change and Its Impact on Thar Desert Ecosystem, Journal of Agricultural Physics ISSN
0973-032X, Vol. 13, No. 1, pp. 71-79 (2013)
Ramana Rao, B.V., Sastri, A.S.R.A.S. and Ramakrishna, Y.S., 1981. An integrated scheme of drought classification as applicable to
Indian arid region. Idojaras 85: 317-322.
IMD (2008) Daily district-wise normals of meteorological parameters data. India Meteorological Department, Pune.
https://www.dni.gov/files/documents/climate2030_india.pdf
https://www.undp.org/content/dam/india/docs/undp_climate_change.pdf
AUTHOR’S BIOGRAPHY
Khushal, Research Scholar, Department of Geography, Jai Narain Vyas University, Jodhpur
National Conference on Global Research for Sustainable Development: Recent Trends, Challenges and Approaches
Volume: 23 | Nov-Dec 2019 | ISSN : 2277-4858
Peer Reviewed National Level Interdisciplinary Journal Page No. - 95
Abstract: As the world’s largest humanitarian organization fighting hunger, and primary expositor of food insecurity in sub-Saharan
Africa, the World Food Programme’s (WFP) activities offer a unique opportunity to examine the contemporary food-security nexus. In
this article, we examine the ‘turn’ toward resilience in the practices and policies of the WFP. Our analysis emphasizes that resilience is
one of a family of security strategies through which the WFP seeks to govern food security. As such, it is impossible to claim, as some
have, that resilience is displacing security as the dominant logic for governing insecurity. Nevertheless, resilience is a cornerstone of the
WFPs’ current activities. Whereas more familiar strategies of security attempt to pre-empt or contain disruptive events – in the context of
food crises – resilience is a style of thinking that assumes the inevitability of unpredictable, high-impact events and aims to foster the
capability for systems and people to adapt, absorb, and bounce back from their effects. Resilience, while championed as part of an overall
solution to a range of ills afflicting human populations today, aims only to equip people and populations with the capacity to live with the
instabilities of a neoliberal food system without questioning, destabilizing, or resisting the very sources of socio-economic and political
instability.
Keywords: Food security, governance, resilience, sub-Saharan Africa, World Food Programme
I . INTRODUCTION
Resilience, commonly understood as the ability of things to ‘bounce back’ from changes or external pressures, is increasingly
seen as a valuable characteristic for populations experiencing food crises. Much of the logic of international food aid
institutions now centres on how to make people and populations resilient to food crises. The embrace of resilience as a logic for
managing food crises and those who bear its weight is said to stem from the failures attributable to international aid efforts that
coupled economic development with security. Indeed, some claim that the ‘development-security’ nexus that stabilized in the
post-Cold War decades is being eclipsed by a ‘resilience-disaster management’ nexus in which uncertainty – rather than
security – is embraced as the ‘ultimate expression of freedom’ (Sörensen and Söderbaum, 2012: 14; see also Duffield, 2012;
Reid, 2012).
The purpose of this article is to question the nature and extent of this shift within the programs and practices of the World
Food Programme (WFP). Our starting point is that claims in which resilience is eclipsing security in international development
only hold if security is understood as a singular logic or condition. This view is mis-leading as it overlooks the multiple, and at
times contradictory, logics and practices of governance that comprise how security is secured (see Valverde, 2010). We
under-stand security in biopolitical terms as a family of practices that aim to identify, sort, and act upon the future so as to
optimize the well-being of a population (Foucault, 2007b). From this perspective we view resilience as a form of biopolitical
security, one that can be pursued alongside other forms of security, and not a singular logic of governance displacing the
equally singular logic of security. Rather than diagnosing epochal shifts in global governance, our analytical challenge is to
examine the multi-ple articulations of security present in specific security projects and how these articu-lations interact in
potentially incommensurate ways (Anderson, 2015; Valverde, 2010; Walters, 2012).
Living with Insecurity: Food Security, Resilience
and the World Food Programme (WFP)
Dr. Veena Soni
National Conference on Global Research for Sustainable Development: Recent Trends, Challenges and Approaches
Volume: 23 | Nov-Dec 2019 | ISSN : 2277-4858
Peer Reviewed National Level Interdisciplinary Journal Page No. - 96
We pursue this line of questioning below with an examination of the activities of the WFP in sub-Saharan Africa. We show
how the embrace of resilience by the WFP in the last decade is not displacing other security strategies for governing food
crises; instead, resilience is one strategy within a field of interacting security strategies through which the WFP governs food
insecurity. Nevertheless, resilience is a cornerstone of the WFP’s efforts and is distinctive in the view of the world that it
presumes. Whereas more famil-iar strategies of security attempt to pre-empt or contain disruptive events such as food crises,
resilience is a style of thinking that assumes the inevitability of unpredictable, high-impact events and aims to foster the
capability for systems and people to adapt, absorb, and bounce back from their effects (Chandler, 2014; Joseph, 2013;
Kaufmann, 2013). Our claim is that resilience normalizes and naturalizes the political and eco-nomic sources of food insecurity
today as something that populations can only adapt to. Resilience, while championed as part of an overall solution to a range of
ills afflicting human populations today, aims only to equip people and populations with capacities to live with the instabilities
of a neoliberal food system without questioning, destabilizing, or resisting the very sources of socio-economic and political
instability.1
II. THEORIZING SECURITY
Food supply, and access to food, was one of a series of historical problems around which Foucault anchored his early thoughts
on biopolitical security (Foucault, 2007a; see also Nally, 2011). Instead of the coercive control of citizens and territory by a
sovereign power, Foucault viewed biopolitical security as the problem of managing the life of a population in terms of its
densities and regularities (Eldon, 2007) in order to maximize life-enhancing actions, encounters, and exchanges. He argued
that biopolitical security emerged as a problem of circulation within the medium or ‘milieu’ of an urban space. This urban
milieu comprised both natural environmental elements, such as rivers and hills, and artificial elements such as variable
numbers of accumulating units (inhabitants and households), various indeterminate circulations (of goods, disease, and waste)
and various indeterminate events (arrivals, exchanges, and contagions) (see Foucault, 2007b: 55–56). As a space of interacting
elements, units, circulations, and events, the milieu was exposed to an uncertain future, one that could only be knowby
estimations of potentials and calculations of probabilities (Foucault, 2007b: 55).
Practices of biopolitical security are underpinned by techniques of calculation. Calculation enables the regularities of the
milieu to be identified, sorted, and acted upon to promote productive, life-supporting, and life-enhnacing encounters and
exchanges while minimizing disturbances and undesirable variances. To secure a milieu is to intervene in the interconnected
series of events to optimize the life of the population without destroying the very productive encounters, processes, and
opportu-nities one seeks to defend (Lentzos and Rose, 2009; Welsh, 2014). As Foucault (2007a) remarks, biopolitical security
is fundamentally ‘a matter of organizing circulation, … making a division between good and bad circulations, and maximizing
the good circu-lation by diminishing the bad’ (p. 18). To secure the milieu in this manner is to know, by calculating
probabilities, which elements are likely to disrupt life-enhancing activi-ties and to act preventatively or pre-emptively to
ward-off disprution. As a biopolitical strategy, security aims to shape a future which enables life-enhancing events while
disabling those imaged to be disruptive.
Contemporary forms of biopolitical food security share a family resemblance with Foucault’s insights on how biopolitical
security problems are formulated and acted upon. However, contemporary strategies of biopolitical security are shaped by
what is seen to be the condition of irreducible complexity where myriad milieu combine to form an ‘environment’ and where
disruptions in one milieu have the potential to flow-over into others, resulting in the amplification of disruptive consequences
and life-diminishing potentials (Anderson and Adey, 2012; Massumi, 2009). The potential for sudden and far-reaching
disruption is therefore thought to be intrinsic to, and ubiquitous in, modern life. The calculative practices that underpin
classical biopolitical security measures are increasingly regarded as ineffectual as environmental complexities confound the
calcu-lations that underpin conventional security efforts (Dillon, 2007: 46). Consequently, cal-culative forms of biopolitical
National Conference on Global Research for Sustainable Development: Recent Trends, Challenges and Approaches
Volume: 23 | Nov-Dec 2019 | ISSN : 2277-4858
Peer Reviewed National Level Interdisciplinary Journal Page No. - 97
security, like prevention and pre-emption, are progressively supplemented with non-calculative security measures, such as
emergency preparedness and resilience, where the latter are more attuned to sudden, unpredictable, and largely incalculable
disruptions that are seen to be intrinsic to contemporary global security environments (Adey and Anderson, 2012; Lentzos and
Rose, 2009).
Pre-emptive strategies of security aim to cancel out undesirable, life-diminishing security outcomes by acting on variations
in advance rather than developing compensa-tory reactions after disruptions have already transpired. By constituting intervals,
thresh-olds, borders, checkpoints, transit zones, or access and egress points in milieu, pre-emptive security aims to make flows
legible and accountable by developing codes or normative standards to differentiate units and identify those that are likely to
produce disruption. Coding techniques can identify potential threats, such as the characteristics that make households
vulnerable to food-insecurity, and pre-emptive actions can work to prevent the threat from actualizing. Similar techniques are
used to code travellers to identify potential drug couriers or terror threats, to code defendants to identify those not likely to
appear at trial, and to code critical infrastructure to identify potential vulnerabilities or ‘soft spots’ and suspicious elements
(such as unattended bags at airports) (O’Connor and De Lint, 2009). The aim of pre-emptive security is to identify threats
before disruptions and undesirable outcomes materialize.
Preparedness and resilience denote non-calculative forms of biopolitical security that are underpinned by notions of a
security ‘environment’. Unlike pre-emptive security which aims to annul prospective threats before they actualize, strategies
of preparedness and resil-ience assume the inevitability of disruptive events and seek to intervene in ways that either minimize
or instrumentalize their effects. Preparedness targets an unfolding series of possi-ble disruptions in the interval between a
disruptive event and its potential serial propagation (Anderson and Adey, 2012). The problem for preparedness is not just that
the force of the emergency will disrupt the normal course of things, but that it may also confound conven-tional security
responses resulting in an even wider scale disruption. For preparedness, risk lies in the temporal interstice between manageable
disruptions and unmitigated disasters (Grove, 2013). Technologies of preparedness attempt to mitigate this risk by prioritizing
techniques of coordination that link together, if only temporarily, the forces and capacities of diverse authorities to deal with
contingencies traversing diverse milieu (Boyle, 2012).
Resilience shares with preparedness a non-calculative ontology and yet is concerned with the governance of uncertainty in
general (O’Malley, 2010). Resilience views the security environment in terms of persistent states of potential disruption rather
than spe-cific and probable threats to be reckoned with (Walker and Cooper, 2011). Rather than looking to contain and mitigate
disruptions, resilience encourages embracing catastro-phes so that people and institutions can adapt and ‘bounce forward’ from
catastrophe through innovation, adaptation, and alteration of their ‘fitness-related characteristics’ (Evans and Reid, 2013;
Moritz and Agudo, 2013). As Lentzos and Rose (2009) indicate, this logic entails a systematic, widespread, organizational,
structural and personal strengthening of subjective and material arrangements so as to be better able to anticipate and tolerate
disturbances in complex worlds without collapse, to withstand shocks, and to rebuild as necessary. (p. 243)
Our purpose in sketching out these forms of security is not to arrive at conceptual and terminological exactitude detached from
empirical substance or to propose a series of ideal types. Rather, it is to elaborate on Foucault’s initial thoughts on biopolitics in
order to challenge the conceptual and normative distinctions that have been made between security and resilience. As we have
argued, ‘security’ consists of multiple articulations of power that share the aim of optimizing the well-being of populations.
From this perspec-tive, resilience can be seen as one variation or form of security in the historical develop-ment of biopolitical
security, one that has emerged alongside other forms to promote life-enhancing activities and exchanges within the irreducible
complexity of contempo-rary global security environments. The extent to which this particular form of security displaces other
security strategies, or how multiple articulations of security interact, is an empirical question answerable only in the context of
specific security projects (Valverde, 2010; Walters, 2012). We take up such an analysis below by focusing on the WFP’s
activities in sub-Saharan Africa.
National Conference on Global Research for Sustainable Development: Recent Trends, Challenges and Approaches
Volume: 23 | Nov-Dec 2019 | ISSN : 2277-4858
Peer Reviewed National Level Interdisciplinary Journal Page No. - 98
III. GOVERNING : THE WFP
The WFP was established in 1961 as an experimental 3-year multilateral food aid facil-ity, administered jointly by the United
Nations (UN) and the Food and Agriculture Organization (FAO). It has become the world’s largest humanitarian organization
fight-ing hunger worldwide and is considered one of the most successful of the UN Special Agencies (Clay, 2003), most
notably for its logistical and operational effectiveness and its organizational norms to ‘feed the hungry’ (Ross, 2007). The
mandate of the WFP has historically included a mix of development initiatives and emergency relief, but since the 1980s
emergency relief accounts for the vast majority of WFP assistance (Ross, 2007). Initially emphasizing discrete emergency
relief projects, this orientation has developed into a concern for managing complex life-diminishing events that are seen to be
multi-causal and require ongoing intervention (Calhoun, 2004; Pingali et al., 2005; Wiggins and Slater, 2010). That is to say
that food insecurity is increasingly understood by the WFP as the outcome of complex interactions between political, social,
economic, geo-graphic, and ecological milieux that require large-scale, system-wide responses.
In June 2007, the WFP’s Executive Director warned of a ‘perfect storm’ for the world’s most vulnerable and food-insecure.
By the end of the year, and at the onset of a financial crisis that would engulf the banking system around the world, the cost of
food staples and fuel reached record highs as global food stocks and the US dollar hit historic lows. The immediate result was
two-fold: less food available for the world’s poorest and the rise of a ‘new face of hunger’ – the urban poor – who could no
longer afford to buy food at local markets. Contributing to the severity of the situation are complex interac-tions of various
elements such as climate change, environmental degradation, natural disasters, ethnic conflicts, and the loss of indigenous
capacity to produce food in tradi-tional and sustainable ways (European Commission, 2012; Jarosz, 2011; McMichael, 2009).
The WFP describes the multi-faceted and complex nature of food crises generated by the confluence of these elements as the
‘new normal’ for millions of individuals in developing regions across the globe (WFP, 2009d, 2014). The response of the WFP
to this new normal over the past decade has centred on the idea of resilience, which the WFP defines as the ‘the capacity of
people, communities, and countries to resist and recover from extreme events’ and which it regards as the ‘bedrock of its work
in fighting purchase, barter, borrowing, or food aid), and how they utilize food (knowledge of nutrition and food safety suited
to the provision of sufficient energy and nutrients with safe water, sanitation, storage, and processing practices). For the WFP,
nutrition information is then coded as a household food consumption score (FCS), which com-bines elements such as food
diversity, frequency, and nutritional importance. Measuring women of reproductive age and young children against nutritional
stand-ards is a way to code vulnerability, for example, where children exhibit signs of stunt-ing (low height-for-age), wasting
(low weight-for-height), and malnourishment (low weight-for-age) (WFP, 2014: 20). Coping is calculated via a Coping
Strategies Index (CSI) based on the frequency and severity of strategies used to confront food crises such as buying cheaper
products, switching to less preferred foods, limiting portion sizes or the number of meals per day, increasing debt, or depleting
asset wealth. Some conventional coping strategies, such as increasing debt or depleting asset wealth, are problematized for
potentially propagating food emergencies, largely because these measures are considered to produce both long-term and
irreversible effects. Such measures are considered extreme forms of coping and are indicators of greater food insecurity (WFP,
2008b).
According to the WFP, a key measure of a household’s ability to cope in a crisis is its asset wealth. Household assets include
natural (land), physical (tools and equipment), human (skills and knowledge), financial (cash and liquid assets), and social
assets (norms and values). As the CFSVA Handbook explains, Asset wealth is a good indicator of coping capacity. With
increasing asset wealth, the coping strategy of choice would typically include less severe measures than fasting an entire day or
scavenging for food. It is also the poor who often report eating less. Conclusion: wealthy households do not only utilize
effective coping strategies more often, but they also only rarely feel that a certain situation affects their customary ability to
procure or consume food. In short, they are more resilient. (WFP, 2009a: 255)

National Conference on Global Research for Sustainable Development: Recent Trends, Challenges and Approaches
Volume: 23 | Nov-Dec 2019 | ISSN : 2277-4858
Peer Reviewed National Level Interdisciplinary Journal Page No. - 99
The WFP (2009c) claims ‘the richer and more liquid the [household] asset base, the better the access to food’ (p. 56).
Diversified households are able to maintain their func-tioning and social integration when faced with food disruptions.
Changing vulnerability codes through the diversification of routines and practices, functions as a security strat-egy to minimize
the loss of welfare in the face of unnamed disasters (WFP, 2009a: 244). CFSVA codes also provide ‘crucial information on the
type of interventions most effec-tive in reducing hunger’ (WFP, 2009a: 244) such as ‘food distributions, school feeding,
support to re-establish livelihoods, or more innovative interventions such as cash/ voucher programmes’ (WFP, 2009b).
Repeated CFSVA measures allow the WFP to track regional changes in the security profile of households. Knowing the type of
household liable to fail to cope with a disaster enables the identification of potential secuirty ‘soft spots,’ or geographic regions
and populations most at risk for large-scale disruption:
Ultimately the vulnerability of a household or community is determined by their ability to cope with their exposure to the risk
posed by shocks such as droughts, floods, economic fluctuations, and conflict. This ability is determined largely by household
and community characteristics, most notably a household or community’s asset base and the livelihood and food security
strategies it pursues. (WFP, 2009a: 27–28)
Knowledge of the elements of vulnerability and their geo-location supports prepara-tory efforts aimed at identifying vulnerable
targets and designing interventions to pre-vent larger-scale food crises (WFP, 2012a).
While food security risks like annual flooding or drought can be anticipated and, to a degree, planned for, the aim of
vulnerability mapping is not to accurately predict or quan-tify the nature, magnitude, or scale of the shock (WFP, 2009a: 245)
but to identify the subjects most vulnerable to food crises of any type or scale. CFSVA’s conducted in all crisis-prone
food-insecure countries serve as key reference points for decision-makers tasked with planning food security strategies. The
VAM unit has developed and installed the spatial information environment in all WFP regional bureaux to standardize food
security monitoring and to establish a ‘global food security baseline’, a norm against which WFP interventions can be
compared. As Larner and Le Heron (2004) argue, such benchmarks are key techniques of security governance in that they
identify and make legible potentially problematic places and subjects. Like other studies emphasizing the technical and
calculative devices used in international governing processes (Ilcan, 2013; Rojas, 2004), coding household food-security
makes the subjects of food securitization both visible and amenable to the social safety nets envisioned elsewhere from within
the WFP (see WFP, 2012a on ‘social safety nets’).
IV. PREPAREDNESS : BUILDING THE WFP’S ‘READINESS’ CAPACITIES
Where vulnerability is an index of potential food crises, preparedness programs invest in promoting the capacity to minimize
the spatial and temporal spill-over of actual food crises. Emergency preparedness acts to forestall future disruptions that
emerge from complexly interdependent series such as supply chains, just-in-time production systems, and interrelated and
international flows of resources, power, and telecommunication. Here, environments are imagined to harbour endemic security
threats that can either coalesce from disparate events to create emergency situations or result from single events that can
amplify in scale and cascade disruption across interdependent circulaitons (see Ophir, 2010 on catastrophes; Anderson and
Adey, 2012 on wide area emergencies). In either case, the problem is that a disruptive event can initiate a series of even more
dis-ruptive events. To be prepared is to stand ready to act in advance of coalescent or cascad-ing disruptions. As the WFP’s
preparedness policy states, the WFP operates in contexts that are ‘increasingly unpredictable and challenging … requiring it to
adapt its emer-gency responses in order to respond effectively’ (WFP, 2012b).
The WFP makes use of a wide range of technologies and partnerships to enable timely and coordinated responses when
potential disasters strike. For instance, Disaster Management Interoperability Simulation and Training (DeMIST) is a software
program that simulates a wide range of emergencies, ‘putting aid workers in the same situations they face while responding to
National Conference on Global Research for Sustainable Development: Recent Trends, Challenges and Approaches
Volume: 23 | Nov-Dec 2019 | ISSN : 2277-4858
Peer Reviewed National Level Interdisciplinary Journal Page No. - 100
real-life crises’ (Prior, 2010; Standley, 2010). As part of the WFP’s ‘Readiness Initiative’, planned exercises, or simulations,
are increasingly used ‘as a tool to sharpen WFP’s readiness “edge,”’ whereby WFP staff are provided with real-life situations
to ‘test plans, find gaps, [become familiar] with processes and infor-mation flows’ and build ‘teams of people who understand
a common way of operating in times of crisis’ (Prior, 2010). Rather than seeking to pre-empt the occurrence of a disas-trous
event by redressing vulnerabilities, preparedness activities assume that such events will happen – it’s just a matter of where and
when. The task then is to mitigate catastro-phe by ‘having plans to address [disastrous events] already in place and to have
exercised for their eventuality – in other words, to maintain an ongoing capability to respond appropriately’ (Lakoff, 2007:
254).
In addition to simulation exercises, the WFP has sought to build its readiness capaci-ties in developing countries through its
partnership with the Inter-Agency Standing Committee (IASC), which coordinates discrete authorities from different scales
(local, national, and international) to deal with issues such as telecommunications, and food import, export, and procurement
operations. The IASC was established in 1992 in response to a UN resolution calling for stronger international humanitarian
assistance for conflict-driven and environmental emergencies. The IASC is the primary mechanism through which
governmental, non-governmental, and private entities come together to coordinate activities in crisis situations. The IASC is
premised on what is known as the ‘cluster approach’ where nine different areas of humanitarian relief are coordinated through
the IASC Emergency Relief Coordinator. These include: agriculture, led by FAO; food security, led by WFP; camp
management and protection, led by UN High Commissioner for Refugees (UNHCR); early recovery, led by United Nations
Development Programme (UNDP); education, led by UNICEF; emergency shelter, led by UNHCR; health, led by the World
Health Organization (WHO); logistics, led by WFP; and water/sanitation led by UNICEF (IASC, 2006: 3). The 9-node cluster
network is stratified into global and countries’ levels, where the role of the global level is to ‘strengthen system-wide
preparedness and technical capacity to respond to humanitarian emergencies’ (IASC, 2006: 2) by providing leadership,
expertise, and operational sup-port to country-level clusters, which in turn are responsible for delivering operational relief. The
global-level IASC network thus serves as an informational network that coun-tries can draw upon for open-ended emergency
contingencies.
Different nodes within the IASC network are the responsibility of different IASC partners. The WFP is responsible to provide
overarching logistical and communications support for the international humanitarian community when dealing with
large-scale or wide-area emergencies that demand coordinated and multi-agency response. It coordi-nates a number of
preparedness initiatives to support these responsibilities, including the UN Humanitarian Air Service, which provides both
passenger air transport and airlifts of relief supplies to more than 200 locations worldwide (WFP, 2009e). This air service
network is anchored by UN Humanitarian Response Depots that are strategically placed in five countries around the world –
Italy, Panama, Ghana, United Arab Emirates, and Malaysia – and which hold pre-positioned stocks of supplies such as medical
kits, shelter items, information technology (IT) equipment, and prefabricated office, and storage units. The WFP has also
established the Augmented Logistics Intervention Team for Emergencies (ALITE). ALITE is a global network of technical
expertise. The WFP describes ALITE as ‘a one-stop shop for procurement, transport, customs, import-and-export services, and
technical field assistance’ that will ‘kick-start logistics operations’ in emergency situations (WFP, 2010c: 8). Private
corporations are integral members in ALITE teams, which in the past have included Caterpillar, Citigroup, Google, Pepsi, and
shipping companies like TNT Express (aquired by Federal Express, May 2016) and the United Parcel Service . The WFP
describes these partners as ‘force multipliers’ to WFP operations (WFP, 2010c: 8).
Telecommunications services for the IASC are also consolidated under the WFP. Through the Emergency Preparedness
Integration Centre (EPIC), the WFP provides a single integrated IT platform that enables emergency responders around the
globe to be ‘connected at all times’ (WFP, 2010b). To enable a rapid and efficient response to emer-gencies, EPIC provides
humanitarian responders with an online portal that supplies immediate access to up-to-date information, a ‘customisable
interface’ with relevant software and database applications, and mission-specific applications that provide maps, contact
National Conference on Global Research for Sustainable Development: Recent Trends, Challenges and Approaches
Volume: 23 | Nov-Dec 2019 | ISSN : 2277-4858
Peer Reviewed National Level Interdisciplinary Journal Page No. - 101
directories, and security updates. These information and communication tech-nologies manage and track humanitarian actors,
convert vulnerabilities into standardized formats, and enable the global positioning of food-insecure and vulnerable
populations. The WFP’s security preparedness apparatus relies on a wide range of practices, tools, and relationships in order to
‘maintain order in a time of emergency’ (Lakoff, 2007: 254). These techniques, which include simulations to test plans and
reveal gaps, stockpiling relief supplies, global crisis communication systems, and logistical planning for coordi-nating diverse
actors – all part of the WFP’s ‘Readiness Initiative’ – make it possible to intervene in and manage events in order to prevent
them from cascading into unmitigated disasters.
Although couched in the broader discourse of poverty reduction, the report under-scores the link between resilience and
environmental forces by encouraging the poor to ‘participate in an increasingly integrated and globalized economy’ (UNDP,
2008: ix). This kind of participation is fostered by a number of international networks, such as the FAO’s Farmer Information
Network. This global information network aims to transfer knowledge so as to reduce farmer reliance on external assistance by
making them self-governing agents (Ilcan and Phillips, 2008: 218).
The WFP supports a number of development initiatives aimed at building resilience among food-insecure populations,
many of which target small food producers in Africa. One such programme is an environmental rehabilitation and
income-generating food-for-assets project in Ethiopia called ‘Managing Environmental Resources to Enable Transitions to
More Sustainable Livelihoods’ (MERET). This programme uses food ‘as a means to increase household and community assets
so that they are less likely to expe-rience food shortages in the future’ (WFP, 2008a). While food-for-work programmes existed
in the past,2 the WFP has refashioned the conventional food-for-work exchanges into resilent strategies that do not prevent
disruptions, but seek to optimize their secu-ritizing effects (see Bourbeau, 2013; Zebrowski, 2013). The logic of resilience
suggests that increasing the exposure of the food insecure to the risks and opportunities of ‘envi-ronmental forces’ will enhance
their adaptive responses and thus their capacity to man-age crises in the future.
Under the MERET programme, roughly 800,000 food-insecure people participate in activities designed to enhance assets,
income, and food-source diversity. These activities include reforestation, restoring springs and rainwater ponds, reconstructing
agricultural terraces, and building roads to improve access to adequate food storage facilities and markets (WFP, 2009e: 31,
2015a). Each person receives 3 kg of cereal per workday (for up to 3 months) and has access to tools, construction materials,
and expert knowledge systems ‘to build local capacity and teach farmers the latest techniques’ (WFP, 2009e: 31). According to
WFP, MERET shows that it is possible to build resil-ience to a wide array environmental shocks ranging from ‘high food and
fuel prices to environmental and climatic shocks, such as prolonged droughts’ (WFP, 2010a). In a similar WFP food-for-assets
programme, the Zifuva community in Mozambique built a spring-fed irrigation to meet the communities’ harvest needs and,
beyond that, to enable small-scale farmers to sell surplus produce on the open market. The Zifuva community is said to be ‘a
living example of the one important rule of tackling climate change: adaptation is key’ – not only have they ‘mastered the skills
to produce food in times of unpredictable weather and great uncertainty, but they now intend to reap some benefits from global
warming by growing crops that can be used for biofuels’ (WFP, 2007: 23).
An additional income and consumption source diversity initiative is the WFP Partners for Progress (P4P) programme. The P4P
programme is a market-based initiative that aims to connect smallholder and low-income farmers, the majority of whom are
women, with local markets to enhance their capacity to grow, sell, and earn more, and to become more competitive players in
their local market. The WFP does this by creating market opportunities for farmers:
As the world’s largest humanitarian agency, WFP is a major staple food buyer. In 2012 WFP bought US$1.1 billion worth of
food – more than 75 percent of this in developing countries … P4P is a logical continuation of this local procurement with the
intent to achieve a higher developmental gain with WFP’s procurement footprint by buying increasingly in a
smallholder-friendly way. (WFP, 2015b)
Supported in part by the Bill & Melinda Gates Foundation and the Howard G. Buffett Foundation, P4P is a US$168 million
dollar, five-year pilot project operating in 21 coun-tries in Africa, Asia, and Latin America. Given that much of the food
National Conference on Global Research for Sustainable Development: Recent Trends, Challenges and Approaches
Volume: 23 | Nov-Dec 2019 | ISSN : 2277-4858
Peer Reviewed National Level Interdisciplinary Journal Page No. - 102
purchased by the WFP − for local school-feeding programmes and other humanitarian operations further afield − is locally
procured, buying from local smallholder farmers also serves the addi-tional aim of providing farmers access to technologies
and practices that can enhance the quantity and quality of their crop production (WFP, 2009c: 2). P4P reconfigures local
farmers as ‘partners’ participating in regional, national, and global agriculture and mar-kets. This participation is aimed at
enhancing farmers’ knowledge of commodity mar-kets, strengthening their business skills (by providing training in
agricultural management, contract negotiations, and accounting systems), promoting adherence to high-quality production,
pricing, storage, and packaging standards, improving access to credit, and increasing female participation in agriculture. P4P
also aims to enhance the quality and quantity of food production while reducing post-harvest losses. This aim is to support
food-for-work infrastructure rehabilitation projects that serve to expedite access to agri-cultural inputs like seeds and fertilizers
and adequate crop storage facilities (WFP, 2015a). In line with resilience aims, the P4P programme works to convert food
insecurity into opportunities by transforming food insecure farmers into global food producers with access to diverse food
production inputs and markets, including food-aid markets. Increasing exposure to environmental (market) forces creates
opportunities to respond in resilient ways to immanent food crisis by fostering productive, biopolitical adaptations within
vulnerable populations.
While the poor certainly benefit from the WFP’s food-for-work programmes, the broader and more critical point we wish to
make is that resilience strategies do not look to develop ways to avoid disaster in the first place. Instead, the empahsis shifts to
estab-lishing conditions where the poor cede their ‘autonomy over the conditions of their social reproduction to agents of
international civil society’ (Essex, 2008: 20) as the uncertain-ties associated with disasters are displaced by the contingencies
of regional and national infrastructure projects and the vagaries of global markets. As Edkins (2000) argues, the popularity of
food-for-work programmes has less to do with the concrete outcomes of such projects in the form of improving public
infrastructure or food security and more to do with the disciplinary effects on hungry populations. Moreover, contemporary
food-for-work initiatives not only enroll civil society and non-state actors as partners in the delivery of food aid, but they also
aim to produce resilient subjects who, through reor-ganization of their quotidian food routines, human capital, assets, and
access to produc-tive work, are better adapted to ongoing food crises.
V. CONCLUSION
Food security has long been a concern for international governing organizations. Various attempts to secure food production,
distribution, and consumption have evolved efforts to ward off humanitarian food crises, prevent food emergencies, and
manage emergency food situations. Much contemporary discourse revolves around the concept of resilience in which
complexly interdependent environments, where emergent threats that are unpredict-able and beyond the reach of conventional
securitization strategies are seen as opportuni-ties to evolve resilient capacities in relation to the environmental risks they
effectuate. To be resilient is to accept that unpredictable threats and dangers are normal, and to adapt as food-insecure
populations via open-ended and modulating strategies for living with uncer-tainty. While the logic of resilience increasingly
sees or conceives of security milieux as naturalized ‘environments’ harboring endemic biopolitical threats, it is impossible to
claim that resilience is displacing security as the dominant logic of international development. As our examination of the WFP
shows, efforts to instill resilience in populations are pursued alongside longstanding and refurbished efforts to, on one hand,
calculate the elements of conventional life most likely to propagate food disruption and, on the other, to prepare for the worst
by coordinating a diverse global network of food-security forces to respond to threats to food security any-where, any-time,
and in any form. Efforts to instill resilience in food-insecure populations are interwoven with the logics of pre-emption and
preparedness in ways that undercut claims of a wholesale shift from security to resilience.
Resilience shares an uneasy tension with pre-emption and preparedness efforts in that the former is to a large extent
premised on the failures of the latter (see O’Connor et al., 2014 on governing failure). Given the tendency to see security milieu

National Conference on Global Research for Sustainable Development: Recent Trends, Challenges and Approaches
Volume: 23 | Nov-Dec 2019 | ISSN : 2277-4858
Peer Reviewed National Level Interdisciplinary Journal Page No. - 103
as security envi-ronments with resilience-building potential, efforts to insulate populations from expo-sure to environmental
insecurities may come to be seen as problematic and counterproductive of resilience initiatives. Instead of imagining food
disruption as a problem to be pre-empted or prevented, mitigated or resisted, the logic of resilience views exposure to food
insecurity as an immanent source of innovation in food produc-tion, distribution, and consumption. Exposure to generalized
environmental insecurity enables environmental forces to be absorbed and adapted as capacities and value-added enterprising
solutions which, in turn, function as immunities against future shocks (Abrahamsen, 2004; Lee and Zhu, 2006). Governing
food insecurity through resilience is an effort to maximize the biopolitical potentials of crises with a minimum of interven-tion.
In a world of imagined disasters in the making, this logic naturalizes the political and economic sources of food insecurity and
seeks to equip households with the capacity to adapt and even thrive amidst inherent environmental uncertainties ‘with little or
no external assistance’ (Manyena, 2006: 433). As we have emphasized in our analysis, resil-ience as a form of security requires
the most vulnerable to transform their food routines by developing capacities to produce, distribute, and access food through
markets, even improvised markets in the case of P4P programmes. Not surprisingly, given contempo-rary neoliberal distain for
state-centric initiatives, exposure to markets is the favoured solution to managing endemic risks and the best way to live with
insecurity.
We suggest that the alternative to international security-based approaches to manag-ing the problem of food security may lie in
food sovereignty initiatives. Broadly defined as the peoples’ right to define their own food and agricultural systems (Bezner
Kerr et al. 2016), food sovereignty was born of the perceived failure of international schemes to alleviate food insecurity
through exposure to open and deregulated environments. Food sovereignty initiatives centre on the notion re-territorializing
food security within defined geographic scales. This requires states to actively re-regulate food practices by develop-ing
frameworks aimed at supporting small-scale, autonomous, and sustainable agricul-ture practices that are adapted to local
socio-ecological conditions and derive from indigenous knowledge, innovation, and locally embedded agroecological methods
(Whittman 2015; Bezner Kerr el al. 2016).
Food sovereignty initiatives face numerous challenges from international trade regimes that systematically aim to remove
support for domestic food and agricul-ture programs by countering state initiatives to create public food-stocks and pro-cure
food from small-scale and local producers (Whittman 2015). However, some localization initiatives, in Malawi for example,
show early promise in reduced dependency on industrial inputs, significantly improving household food security (both in terms
of availability and dietary diversity), and enhancing social coopera-tion and support among farming households (Bezner Kerr
et al. 2016: 7-8). Rather than simply identifying those local practices that are seen to be complicit in the production of food
insecurity (as in the Vulnerability Analysis and Mapping exer-cises discussed above), food sovereignty initiatives may prove
to be powerful mechanisms of food security. By encouraging the development of alternative indig-enous solutions to the
problem, food sovereignty initiatives challenge the conven-tional or ‘recognized’ ways of thinking about and acting on
vulnerabilities by donor states and international organizations.3
Notes
4. We substantiate our claims by drawing on a selection of recent policy documents, reports, strategic plans, fact sheets, and
other literature addressing food security from the WFP and other international agencies collected over a three-year period
(2012–2014).
5. The workhouses of early industrial Britain functioned on the food-for-work principle, as did many British famine ‘relief’
programmes in colonial India (Essex, 2012: 197).
6. For an extended analysis of indigenous justice alternatives in the context of the social recon-struction of so-called failed
states, see Brisson-Bovin and O’Connor (2008).
National Conference on Global Research for Sustainable Development: Recent Trends, Challenges and Approaches
Volume: 23 | Nov-Dec 2019 | ISSN : 2277-4858
Peer Reviewed National Level Interdisciplinary Journal Page No. - 104
REFERENCES
Abrahamsen R (2004) The power of partnerships in global governance. Third World Quarterly 25(8): 1453–1467.
Adey P and Anderson B (2012) Anticipating emergencies: Technologies of preparedness and thematter of security. Security
Dialogue 43(2): 99–117.
Alinovi L, Mane E and Romano D (2009) Measuring household resilience to food insecurity: Application to Palestinian
households. European Commission and the United Nations Food & Agriculture Organization working paper. Available at:
http://www.fsnnetwork.org/sites/ default/files/measuring_household_resilience_to_food_insecurity.pdf (accessed 2 June 2015).
Anderson B (2010) Pre-emption, precaution, preparedness: Anticipatory action and future geographies. Progress in Human
Geography 34(6): 777–798.
Anderson B (2015) What kind of thing is resilience? Politics 35(1): 60–66.
Anderson B and Adey P (2012) Governing events and life: “emergency” in UK civil contingencies. Political Geography 31(1): 24–
33.
Bezner Kerr R, Nyantakyi-Frimpong H, Lupafya E and Dakishoni L (2016) Food sovereignty, agroecology and resilience:
Competing or complementary frames? Colloquium Paper, International Institute of Social Studies. Netherlands: The Hague, Feb.
4–5.
Bourbeau P (2013) Resiliencism: Premises and promises in securitisation research. Resilience1(1): 3–17.
Boyle P (2012) Risk, resiliency and urban governance: The Case of the 2010 winter Olympic
Games. Canadian Review of Sociology 49(4): 350–369.
Brisson-Boivin K and O’Connor D (2013) The rule of law, security-development and penal aid:
The case of detention in Haiti. Punishment & Society 15(5): 515–533.
Calhoun C (2004) A world of emergencies: Fear, intervention, and the limits of cosmopolitan order. Canadian Review of
Sociology 41(4): 373–95.
Chandler D (2014) Resilience: The Governance of Complexity. London: Routledge.
Clay E (2003) Responding to change: WFP and the global food aid system. Development Policy
Review 21(5–6): 697–709.
Collier S and Lakoff A (2008) Distributed preparedness: The spatial logic of domestic security in the United States. Environment
and Planning D: Society and Space 26: 7–28.
Dillon M (2007) Governing through contingency: The security of biopolitical governance. Political Geography 26: 41–47.
Duffield M (2012) Challenging environments: Danger, resilience and the aid industry. Security Dialogue 43(5): 475–492.
Edkins J (2000) Whose Hunger? Concepts of Famine, Practices of Aid. Minneapolis, MN:University of Minnesota Press.
Eldon S (2007) Rethinking governmentality. Political Geography 26: 29–33.
Essex J (2008) The neoliberal geopolitics of food security: The case of Indonesia. Human Geography 1(20): 14–25.
Essex J (2012) Idle hands are the devil’s tools: The geopolitics and geoeconomics of hunger.
Annals of the Association of American Geographers 102(1): 191–207.
European Commission (2012) The EU approach to resilience: Learning from food security cri-ses. Communication from The
Commission to The European Parliament and The Council, 3 October, Brussels, pp. 1–13. Available at:
http://ec.europa.eu/echo/files/policies/resilience/ com_2012_586_resilience_en.pdf (accessed 2 May 2015).
Evans B and Reid J (2013) Dangerously exposed: The life and death of the resilient subject.Resilience 1(2): 83–98.
FAO (2012) Urgent action to support the resilience of vulnerable populations. Food and Agricultural Organization of the United
Nations. Available at: http://www.fao.org/fileadmin/ user_upload/ emergencies /docs /Programme %20document_Sahel%
20crisis_ENGLISH.pdf (accessed 12 May 2015).
Foucault M (2007a) Security, Territory, Population. New York: Picador.
Foucault M (2007b) Spaces of security: The example of the town. Lecture of 11th January 1978.
Political Geography 26: 48–56.
National Conference on Global Research for Sustainable Development: Recent Trends, Challenges and Approaches
Volume: 23 | Nov-Dec 2019 | ISSN : 2277-4858
Peer Reviewed National Level Interdisciplinary Journal Page No. - 105
Grove K (2013) From emergency management to managing emergence: A genealogy of disas-ter management in Jamaica. Annals
of the Association of American Geographers 103(3): 570–588.
IASC (2006) Guidance note on using the cluster approach to strengthen humanitarian response. Inter-Agency Standing
Committee. Available at: http://interagencystandingcommittee.org/ system/files/legacy_files/Cluster% 20implementation% 2C%
20Guidance%20Note%2C%20 WG66%2C%2020061115-.pdf (accessed 12 April 2015).
Ilcan S (2013) Paradoxes of humanitarian aid: Mobile populations, biopolitical knowledge, and acts of social justice in Osire
refugee camp. In: Ilcan S (ed.) Mobilities, Knowledge, and Social Justice. Montreal, QC, Canada and London: McGill-Queen’s
University Press, pp. 177–206.
Ilcan S and Phillips L (2003) Making food count: Expert knowledge and global technologies of government. Canadian Review of
Sociology and Anthropology 40(4): 441–461.
Ilcan S and Phillips L (2008) Governing through global networks: Knowledge mobilities and participatory development. Current
Sociology 56(5): 711–734.
Jarosz L (2011) Defining world hunger: Scale and neoliberal ideology in international food security policy discourse. Food,
Culture & Society 14(1): 117–139.
Joseph J (2013) Resilience as embedded neoliberalism: A governmentality approach. Resilience:
International Policies, Practices & Discourses 1(1): 38–52.
Kaufmann M (2013) Emergent self-organization in emergencies: Resilience rationales in interconnected societies. Resilience:
International Policies, Practices & Discourses 1(1): 53–68.
Lakoff A (2007) Preparing for the next emergency. Public Culture 19(2): 247–271.
Larner W and Le Heron R (2004) Global benchmarking: Participating “at a distance” in the globalizing economy. In: Larner W
and Walters W (eds) Global Governmentality: Governing
International Spaces. London: Routledge, pp. 212–232.
Lee J and Zhu YP (2006) Urban governance, neoliberalism and housing reform in China. The Pacific Review 19(1): 39–61.
Lentzos F and Rose N (2009) Governing insecurity: Contingency planning, protection, resilience.
Economy and Society 38(2): 230–254.
McMichael P (2009) A food regime analysis of the world food crisis. Agriculture & Human Values 26: 281–295.
Manyena S (2006) The concept of resilience revisited. Disasters 30(4): 433–450.
Massumi B (2009) National enterprise emergency: Steps toward an ecology of powers. Theory,
Culture, & Society 26(6): 153–185.
Moritz C and Agudo R (2013) The future of species under climate change: Resilience or decline?
Science 341: 504–08.
Nally D (2011) The biopolitics of food provisioning. Transactions of the Institute of British Geographers 36: 37–53.
O’Connor D and De Lint W (2009) Frontier government: The folding of the Canada-US border.
Studies in Social Justice 3(1): 39–66.
O’Connor D, Brisson-Boivin K and Ilcan S (2014) Governing failure: Development, aid, and audit in Haiti. Conflict, Security, and
Development 14(3): 309–330.
O’Malley P (2010) Resilient subjects: Uncertainty, warfare and liberalism. Economy and Society 39(4): 488–509.
Ophir A (2010) The politics of catastrophization. Available at: http://www.mara-stream.org/think-tank /adi-ophir- the-politics-
of-catastrophization (accessed 2 June 2015).
Pingali P, Alinovi L and Sutton J (2005) Food security in complex emergencies: Enhancing food resilience. Disasters 29(1): 5–24.
Prior M (2010) Simulation software helps aid teams prepare for emergencies. Available at:
https://www.wfp.org/stories/simulation-software-helps-aid-teams-prepare-emergencies (accessed 23 March 2016).
Reid J (2012) The disastrous and politically debased subject of resilience. Development Dialogue 58: 67–79.
Rojas C (2004) Governing through the social: Representations of poverty and global governmentality. In: Larner W and Walters
W (eds) Global Governmentality: Governing International Spaces. London: Routledge, pp. 97–115.

National Conference on Global Research for Sustainable Development: Recent Trends, Challenges and Approaches
Volume: 23 | Nov-Dec 2019 | ISSN : 2277-4858
Peer Reviewed National Level Interdisciplinary Journal Page No. - 106
Ross S (2007) The World Food Programme: A case of benign US policy? Australian Journal of International Affairs 61(2): 267–
281.
Sörensen JS and Söderbaum F (2012) The end of the development-security nexus? Development Dialogue 58: 7–20.
Standley J (2010) Simulation exercises … Why not just read the manual? Available at: https://
www.wfp.org/aid-professionals/blog/simulation-exerciseswhy-not-just-read-manual (accessed 23 March 2016).
United Nations Development Programme (UNDP) (2008) World resources 2008: Roots of resil-ience–growing the wealth of the
poor. World Resources Institute, Washington, UNDP. Available at: http://www.wri.org /sites/default/files/
pdf/world_resources_2008_roots_of_ resilience.pdf (accessed 8 February 2015).
Valverde M (2010). Questions of security: A framework for research. Theoretical Criminology 15(1): 3–22.
Walker J and Cooper M (2011) Genealogies of resilience: From systems ecology to the political economy of crisis adaptation.
Security Dialogue 42(2): 143–160.
Walters W (2012) Governmentality: Critical Encounters. London: Routledge.
Welsh M (2014) Resilience and responsibility: Governing uncertainty in a complex world. The Geographical Journal 180(1): 15–
26.
Wiggins S and Slater R (2010) Food security. In: Burgess P (ed.) The Routledge Handbook of New Security Studies. London:
Routledge, pp. 132–143.
World Food Programme (WFP) (2005) Strategic Plan 2006–2009. WFP. Available at: http://one. wfp.org/eb/docs/2005
/wfp050757~2.pdf (accessed 20 May 2015).
World Food Programme (WFP) (2007) World Food Programme 2007 annual report. WFP. Available at:
http://www.wfp.org/sites/default/files/2007_Ann_Rep_English_0.pdf (accessed 12 May 2014).
World Food Programme (WFP) (2008a) Malawi: Increasing food security through food for assets. WFP. Available at:
http://www.wfp.org/sites/default/files/Increasing%20Food%20 Security%20through%20Food%20for%20Assets.pdf (accessed 20
June 2014).
World Food Programme (WFP) (2008b) The coping strategies index: Field methods manual. WFP. Available at:
http://documents.wfp.org/stellent/groups/public/documents/man-ual_guide_proced/wfp211058.pdf?_ga=1.73610448.333914517
.1467725012 (accessed 2 August 2015).
World Food Programme (WFP) (2009a) Comprehensive food security and vulnerability analysis guidelines. WFP. Available at:
https://www.wfp.org/content/comprehensive-food-security-and-vulnerability-analysis-cfsva-guidelines-first-edition (accessed
June 16 2014).
World Food Programme (WFP) (2009b) Emergency food security assessment handbook. WFP. Available at:
https://www.wfp.org/content/emergency-food-security-assessment-handbook (accessed 10 June 2014).
World Food Programme (WFP) (2009c) Hunger and markets. WFP. Available at:
http://docu-ments.wfp.org/stellent/groups/public/documents/communications/wfp200279.pdf (accessed 10 June 2014).
World Food Programme (WFP) (2009d) We’re in and era of food insecurity. WFP. Available at:
http://www.wfp.org/stories/we-in-era-food-insecurity (accessed 20 June 2014).
World Food Programme (WFP) (2009e) World Food Programme 2009 Annual Report. WFP.
Available at: http://home.wfp.org/stellent/groups/public/documents/newsroom/wfp204445.pdf (accessed 20 June 2014).
World Food Programme (WFP) (2010a) Climate change: Enabling people to adapt for the future. WFP. Available at:
http://www.wfp.org/sites/default/files/WFP_Climate%20 Change_tajik%28lowres%29.pdf (accessed 20 June 2014).
World Food Programme (WFP) (2010b) Emergency preparedness integration centre. WFP. Available at:
http://documents.wfp.org/stellent/groups/public/documents/newsroom/wfp225858.pdf (accessed 20 June 2014).
World Food Programme (WFP) (2010c) Logistics: We deliver. WFP. Available at:
http://docu-ments.wfp.org/stellent/groups/public/documents/webcontent/wfp251670.pdf (accessed 20 June 2014).
World Food Programme (WFP) (2012a) Update on WFP’s safety nets policy: The role of food assistance in social protection.
Available at: http://documents.wfp.org/stellent/groups/public/ documents/resources/wfp245751.pdf (accessed 9 September 2014).
World Food Programme (WFP) (2012b) WFP preparedness and response enhancement pro-gramme. WFP/EB.A/2012/5-H, 7
May. Available at: http://documents.wfp.org/stellent/ groups/public/documents/eb/wfpdoc061871.pdf (accessed 7 August 2013).

National Conference on Global Research for Sustainable Development: Recent Trends, Challenges and Approaches
Volume: 23 | Nov-Dec 2019 | ISSN : 2277-4858
Peer Reviewed National Level Interdisciplinary Journal Page No. - 107
World Food Programme (WFP) (2013) Building resilience on a fragile continent: WFP and cli-mate change in Asia. Available at:
http://www.wfp.org/content/building-resilience-fragile-continent-wfp-and-climate-change-asia (accessed 7 August 2013).
World Food Programme (WFP) (2014) Yemen comprehensive food security survey. Available at:
http://documents.wfp.org/stellent/groups/public/documents/ena/wfp269771.pdf (accessed 12 August 2014).
World Food Programme (WFP) (2015a) A road to prosperity in Zambia. Available at: https://
www.wfp.org/stories/road-prosperity-zambia (accessed 13 August 2015).
World Food Programme (WFP) (2015b) P4P overview. Available at: http://www.wfp.org/pur-chase-progress/overview (accessed
15 August 2015).
Wittman H (2015) From protest to policy: The challenges of institutionalizing food sovereignty.
Canadian Food Studies 2(2): 174–182.
Zebrowski C (2013) The nature of resilience. Resilience 1(3): 159–173.
AUTHOR’S BIOGRAPHY
Dr. Veena Soni, Post Doctoral, Department of Political Science, Jai Narain Vyas University, Jodhpur
National Conference on Global Research for Sustainable Development: Recent Trends, Challenges and Approaches
Volume: 23 | Nov-Dec 2019 | ISSN : 2277-4858
Peer Reviewed National Level Interdisciplinary Journal Page No. - 108
Abstract: Water is an indispensable natural resource for life on this planet. Groundwater has emerged as the main source for
agriculture, domestic and the industry. In general, groundwater is a reliable source of water for the agriculture and can be used in a
flexible manner. However, it is important to realize that groundwater is not a resource that could be utilized indiscriminately. Issues
such as water logging, salinity, agricultural toxins, and industrial effluents need to be looked upon. As for the environment,
groundwater plays a very important role in keeping the water level and flow into rivers, lakes and wetlands. Ground water has slowly
become the mainstay of India's agriculture and drinking water security as it is considered a dependable source. India being a home to
more than 1.3 billion people, the increasing population, urbanization and non-uniform extraction have accelerated depletion of
ground water resources. This is reflected in falling ground water levels trends and contamination of aquifers. In addition, there has
not been adequate thoughtfulness to water conservation, efficiency in water use, water re-use & recycle, groundwater recharge, and
ecosystem sustainability. This calls for dedicated plans and schemes to manage this scarce resource. In the era of climate change,
groundwater may act as a buffering resource in the time of drought and it needs to be managed more intensively to enhance its
sustainability. In the state of Rajasthan, surface water resources are meager and the entire state is principally dependent on
groundwater. The problem is a consequence of low precipitation and hence low recharge to aquifers and high evapotranspiration. As
a result of increasing population, urbanization, expansion of irrigated agriculture and other activities, the ground water level in Sawai
Madhopur district has come under the category of 'over exploitation' category and the quality of water has also come down. This
paper highlights the ground water resources and sustainable management of ground water in Sawai Madhopur district.
Keywords: Groundwater, Replenishable, Hydrogeological, NHNS, GEC-2015.
I. INTRODUCTION
Water is a fundamental resource for life. Sustainable development and efficient management of this scarce resource has
become a challenge in India. Increasing population, growing urbanization and rapid industrialization combined with the need
for raising agricultural production generates competing demands for water. Ground water has steadily emerged as the
backbone of India’s agriculture and drinking water security. Contribution of ground water is nearly 62% in irrigation, 85% in
rural water supply and 45% in urban water supply (MoWR, RD & GR).Ground water is an annually replenishable resource but
its availability is no uniform in space and time. It is the quantity of ground water available in the zone of water level fluctuation,
which is replenished annually with rainfall being the dominant contributor. Hence, the sustainable utilization of ground water
resources demands a realistic quantitativeassessment based on reasonably valid scientific principles. National Water Policy,
2012 has laid emphasis on periodic assessment of ground water resources on scientific basis. The trends in water availability
due to various factors including climate change must also be assessed and accounted for during water resources planning. To
meet the increasing demands of water, it advocates direct use of rainfall, desalination and avoidance of inadvertent
evapotranspiration for augmenting utilizable water resources.
The rainfall is erratic and there is a large variation in the rainfall pattern in the state. Average annual rainfall of the state is 531
mm. The state has witnessed frequent drought and famine conditions in the past 50 years. Groundwater is not available in many
parts even for drinking purpose. Sometimes water is being transported by trains, trucks and other means. Groundwater is a
Ground Water Resources and Management: A Case Study of Sawai Madhopur District
Prem Sonwal
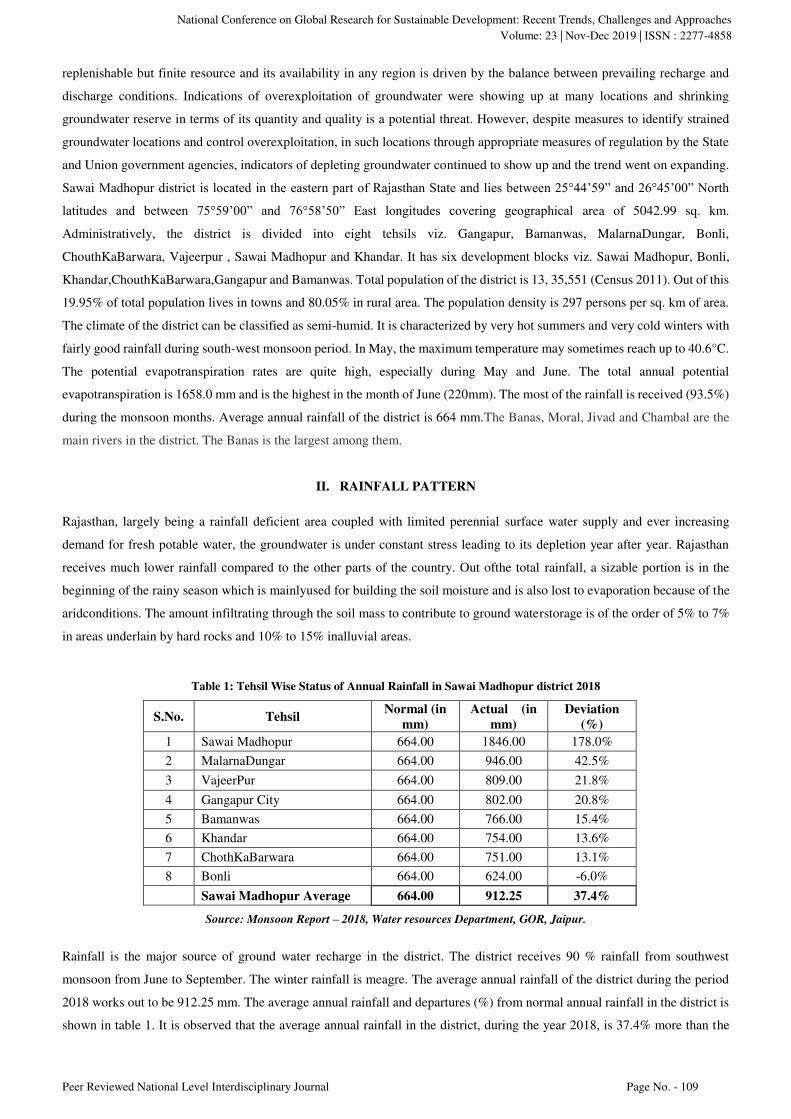
National Conference on Global Research for Sustainable Development: Recent Trends, Challenges and Approaches
Volume: 23 | Nov-Dec 2019 | ISSN : 2277-4858
Peer Reviewed National Level Interdisciplinary Journal Page No. - 109
replenishable but finite resource and its availability in any region is driven by the balance between prevailing recharge and
discharge conditions. Indications of overexploitation of groundwater were showing up at many locations and shrinking
groundwater reserve in terms of its quantity and quality is a potential threat. However, despite measures to identify strained
groundwater locations and control overexploitation, in such locations through appropriate measures of regulation by the State
and Union government agencies, indicators of depleting groundwater continued to show up and the trend went on expanding.
Sawai Madhopur district is located in the eastern part of Rajasthan State and lies between 25°44’59” and 26°45’00” North
latitudes and between 75°59’00” and 76°58’50” East longitudes covering geographical area of 5042.99 sq. km.
Administratively, the district is divided into eight tehsils viz. Gangapur, Bamanwas, MalarnaDungar, Bonli,
ChouthKaBarwara, Vajeerpur , Sawai Madhopur and Khandar. It has six development blocks viz. Sawai Madhopur, Bonli,
Khandar,ChouthKaBarwara,Gangapur and Bamanwas. Total population of the district is 13, 35,551 (Census 2011). Out of this
19.95% of total population lives in towns and 80.05% in rural area. The population density is 297 persons per sq. km of area.
The climate of the district can be classified as semi-humid. It is characterized by very hot summers and very cold winters with
fairly good rainfall during south-west monsoon period. In May, the maximum temperature may sometimes reach up to 40.6°C.
The potential evapotranspiration rates are quite high, especially during May and June. The total annual potential
evapotranspiration is 1658.0 mm and is the highest in the month of June (220mm). The most of the rainfall is received (93.5%)
during the monsoon months. Average annual rainfall of the district is 664 mm.The Banas, Moral, Jivad and Chambal are the
main rivers in the district. The Banas is the largest among them.
II. RAINFALL PATTERN
Rajasthan, largely being a rainfall deficient area coupled with limited perennial surface water supply and ever increasing
demand for fresh potable water, the groundwater is under constant stress leading to its depletion year after year. Rajasthan
receives much lower rainfall compared to the other parts of the country. Out ofthe total rainfall, a sizable portion is in the
beginning of the rainy season which is mainlyused for building the soil moisture and is also lost to evaporation because of the
aridconditions. The amount infiltrating through the soil mass to contribute to ground waterstorage is of the order of 5% to 7%
in areas underlain by hard rocks and 10% to 15% inalluvial areas.
Table 1: Tehsil Wise Status of Annual Rainfall in Sawai Madhopur district 2018
S.No. Tehsil Normal (in
mm)
Actual (in
mm)
Deviation
(%)
1 Sawai Madhopur 664.00 1846.00 178.0%
2 MalarnaDungar 664.00 946.00 42.5%
3 VajeerPur 664.00 809.00 21.8%
4 Gangapur City 664.00 802.00 20.8%
5 Bamanwas 664.00 766.00 15.4%
6 Khandar 664.00 754.00 13.6%
7 ChothKaBarwara 664.00 751.00 13.1%
8 Bonli 664.00 624.00 -6.0%
Sawai Madhopur Average 664.00 912.25 37.4%
Source: Monsoon Report – 2018, Water resources Department, GOR, Jaipur.
Rainfall is the major source of ground water recharge in the district. The district receives 90 % rainfall from southwest
monsoon from June to September. The winter rainfall is meagre. The average annual rainfall of the district during the period
2018 works out to be 912.25 mm. The average annual rainfall and departures (%) from normal annual rainfall in the district is
shown in table 1. It is observed that the average annual rainfall in the district, during the year 2018, is 37.4% more than the

National Conference on Global Research for Sustainable Development: Recent Trends, Challenges and Approaches
Volume: 23 | Nov-Dec 2019 | ISSN : 2277-4858
Peer Reviewed National Level Interdisciplinary Journal Page No. - 110
normal annual rainfall. A perusal of Table 1 reveals that during the year 2018, 7 tehsil received above annual normal rainfall
and among which Gangapur, Bamanwas, MalarnaDungar, ChouthKaBarwara, Vajeerpur, Sawai Madhopur and Khandar
received 20.8, 15.4, 42.5, 13.1, 21.8, 178.0 and 13.6% above normal annual rainfall. But 1 tehsil received below normal annual
rainfall which is Bonli (-6.0%).
Table 2 :Annual Rainfall With Deviation From Normal (Year 2014-18) in Sawai Madhopur District
Normal
Rainfall
(mm.)
2014 2015 2016 2017 2018
Actual
(mm)
Deviation
(%)
Actual
(mm)
Deviation
(%)
Actual
(mm)
Deviation
(%)
Actual
(mm)
Deviation
(%)
Actual
(mm)
Deviation
(%)
664.0 621.8 -6.4 436.13 -34.3 909.38 37.0 377.00 -43.0 912.25 37.4
Source: Monsoon Report – 2018, Water resources Department, GOR, Jaipur.
According to Table 2, the actual rainfall in the district from year 2014 to 2018 shows the deviation from normal rainfall.
According to this, the highest rainfall in these 5 years was 912.25 mm in the year 2018 and the lowest rainfall was 377.00 mm
in the year 2017. The annual rainfall received in the district in the year 2018 was 37.4% more than the normal rainfall.
III. WATER LEVEL SCENARIO
Central Ground Water Board periodically monitors the National Hydrograph Network Stations (NHNS) stations in the Sawai
Madhopur district, four times a year i.e. in January, May (Pre-monsoon), August and November (Post monsoon). A
monitoring network comprising dugwells and piezometers located in all blocks of the District was monitored duringthe
survey.There are 138 water level monitoring stations (District Key Wells) which includes 51 Piezometers spread all over the
district. Water level isavailable in 61 and 61 during Pre monsoon and Post monsoon survey2018 respectively. Other
monitoring stations, in which water level is notavailable, are either dried up or water level have gone deep in the boring orcould
not be measured due to one or other reason.
Table 3: Average water level of Pre-Monsoon 2009 to 2018 & Fluctuation in Sawai Madhopur District (in mbgl)
WL Pre-Monsoon (mbgl) YEARS YEARS
2009 2010 2011 2012 2013 2014 2015 2016 2017 2018 Fluctuation, Change in Avg. Water
level (Avg.2009 to 2017)-2018
18.77 19.62 19.08 17.52 16.99 12.57 14.10 17.60 15.49 21.46 -4.60
Source: Water resources Department, GOR, Jaipur.mbgl – meter below ground level
Table 3 shows the pre-monsoon water level in Sawai Madhopur district from the year 2009 to the year 2018. The water level in
these 10 years was the lowest in the year 2018 at 21.40mbgl and the highest in the year 2014 was 12.57mbgl. There has been a
decrease of -4.60mbgl in the year 2018 as compared to the average water level of the year 2009 to year 2017.
IV. COMPARATIVE STUDY OF GROUND WATER
Ground water occurs both in unconsolidated and consolidated formations of the district. Consolidated formations including
schist, phyllite, shale, slate and quartzite of Bhilwara Super Group; sandstone, shale and limestone of Vindhyan Super
Group;and quartzite, schist and gneiss of Delhi Super Group covering about 60% of district form the principal aquifer in the
district. Ground water occurs under unconfined condition in weathered and fractured portions of the consolidated formations.
These form generally poorer aquifer than alluvium and are tapped by open wells, dug cum bore wells, and bore wells. Ground
water occurs under unconfined to confined conditions in unconsolidated formation (alluvium of Quaternary age) which is

National Conference on Global Research for Sustainable Development: Recent Trends, Challenges and Approaches
Volume: 23 | Nov-Dec 2019 | ISSN : 2277-4858
Peer Reviewed National Level Interdisciplinary Journal Page No. - 111
tapped through various ground water abstraction structures viz. dug well, dug cum borewell and tube well. Alluvium forms
aquifer in large part of the area lying in central, northern and north western parts of the district and in area along the Chambal
river in south eastern part of the district. It consists of gravel, sand, silt, clay and kankar. Out of these, sand, clay and silty clay
with kankar form the most dominating constituent which generally occur in upper zone and are being tapped by dug wells.
Gravels generally occur at depth near the basement and these too generally do not form continuous layer. Alluvium forms most
important aquifer which is being tapped by dug wells, dug cum borewells and tube wells. Ground water occurs under
unconfined, semi-confined and confined conditions in these formations. The yield of dug wells varies from 50 to 150 m 3 /day.
The GEC 97 Methodology for ground water resource assessment was revised and the 2017 assessment has been carried out
using the revised GEC 2015 Methodology. The ground water resources assessment for reference year 2017 at the State Level
have been carried out jointly by State Ground Water Departments and Central Ground Water Board under the supervision of
State Level Committees, with technical guidance from Central Level Expert Group.Ground water resource of the year 2017 has
been estimated following the guidelines of the GEC 2015 methodology. The previous resource assessments in the years 2004,
2009, 2011 and 2013 were completed following GEC-97 methodology. In the present report, GEC-2015 methodology has been
used and based on the data availability, the assessment has been made using appropriate assumptions. There are minor changes
in the terminology used in GEC-2015 methodology and the corresponding changes for the terms have been tabulated below:
Table 4: Comparison of Groundwater Resource Estimation Methodology
GEC- 97 Methodology GEC-2015 Methodology
Annual Replenishable Resources Total Annual Groundwater Recharge
Net Groundwater Availability Annual Extractable Groundwater Resources
Annual Groundwater Draft for all uses Current Annual Groundwater Extraction for all uses
Projected Demand for Domestic aIndustrial uses up to 2025
Annual ground water allocation for domestic water supply as on 2025
Groundwater Availability for future irrigation
Net Annual Groundwater Availability for future Use
Stage of Groundwater Development Stage of Ground Water Extraction
Source: CGWB, (2019). Dynamic Ground Water Resources of India, 2017.GEC: Ground Water Estimation Committee
The Ground water resources for the state have been assessed block-wise. Rajasthan state is categorized as the most water
stressed states of the country as far as ground water is concerned. As per the latest estimates of ground water jointly carried out
by the Ground Water Department of the state and CGWB, the scope for future groundwater resource development in the state
of Rajasthan is very less. The year 2017 groundwater resource estimation report reveals that thetotal Annual Groundwater
Recharge of the State has been assessed as 13.21bcm and Annual Extractable Ground Water Resource as 11.99bcm. The
Annual Ground Water extraction is 16.77bcm and the Stage of ground water extraction in the state is 140%. Out of the 295
assessed blocks, 185 blocks have been categorized as ‘Over Exploited’, 33 as ‘Critical’, 29 as ‘Semi-Critical’, 45 blocks as
‘Safe’ and 3 as ‘Saline’.

National Conference on Global Research for Sustainable Development: Recent Trends, Challenges and Approaches
Volume: 23 | Nov-Dec 2019 | ISSN : 2277-4858
Peer Reviewed National Level Interdisciplinary Journal Page No. - 112
Table 5: Block wise Ground Water Resources of Sawai Madhopur (March 2009) (in mcm)
Block
Annual
Replenishable
Ground
Water
Resources
Net
Annual
Ground
Water
Availability
Existing
Gross
Ground
Water
Draft for
Irrigation
Existing
Gross
Ground
Water
Draft for
Dom.&
Industrial
Use
Existing
Gross
Ground
Water
Draft for
All Uses
Stage of
Ground
Water
Development
(%)
Category
Bamanwas 60.9951 54.8956 63.1284 7.9266 71.0550 129 OE Bonli 68.7343 62.7109 52.6128 14.0116 66.6244 106 OE Gangapur 63.4050 57.8099 87.0178 19.2056 106.2234 184 OE Khandar 91.7055 83.3144 69.9900 11.6538 81.6438 98 C S.Madhopur 97.2326 87.5094 93.6192 24.4491 118.0683 135 OE Total 382.0726 346.2403 366.3682 77.2467 443.6149 128 OE
Source: Reappraisal of ground water resources of Sawai Madhopur district (As on 31.03.2009), Ground Water Dept., GoR,Jaipur.
Groundwater availability in Sawai Madhopur is highly variable, depending on hydrological conditions.The limited ground
water resources in Sawai Madhopur are increasingly being exploited for irrigation and domestic uses. The District is heavily
dependent on groundwater for drinking water and irrigation. Total Annual Ground water Recharge of the district has been
assessed as 490.04mcm and Annual Extractable Ground Water Resource as 449.82mcm. The Annual Ground Water extraction
is 605.25mcm and the Stage of ground water extraction in the district is 134.55% (March, 2017). As compared to 2009
estimate, the Annual Ground Water Recharge and Annual Extractable Ground Water Resource have increased from 382.0726
to 449.8258mcm and 11.26 to 11.99bcm respectively. Annual ground water extraction and stage of ground water extraction has
increased marginally from 443.6149 to 605.2522mcm and 128 to 134.55% respectively (table 5 & 6). The marginal change in
recharge is due to changes in norms of GEC-2015 methodology and increased draft is due to revision of well census data.
Table 6: Block wise Ground Water Resources of Sawai Madhopur (March 2017) (in mcm)
Block
Annual
Extractable
Ground
Water
Recharge
Existing
Gross
Ground
Water
Draft for
Irrigation
Existing
Gross
G.W.
Draft for
Dom. &
Ind. Use
Ground
Water
Extraction
for all uses
(GEALL)
Allocation
for Dom.
& Ind.
Requirem
ent
Stage of
G.W.
Extraction
(%)
Category
Bamanwas 67.6998 66.5439 10.9434 77.4873 14.6642 114.46 OE
Bonli 76.3983 69.0128 19.3680 88.3808 25.9531 115.68 OE
ChauthKa Barwara
46.3845 45.5932 8.5605 54.1537 11.4711
116.75 OE
Gangapur 81.9526 132.4125 26.7242 159.1367 35.8104 194.98 OE
Khandar 86.5047 85.3147 14.7726 100.0873 19.7953 115.70 OE
S.Madhopur 90.8858 99.9064 26.1002 126.0066 34.9743 136.68 OE
Total 449.8258 498.7833 106.4689 605.2522 142.6683 134.55 OE
Source:Central Ground Water Board, Western Region, Jaipur.mcm-million cubic metres
Table 7 shows the categories of ground water from the year 1984 to 2017 of 6 blocks located in Sawai Madhopur district.
ChauthKaBarwada has been included as a new block in the district in the assessment of ground water of the year 2017. While
all the blocks of the district were in white or safe category in the year 1984 in the case of ground water, in the year 2017 all the
blocks of the district have reached the state of over exploitation.The district has reached a dangerous position in terms of
ground water level since 2001. At present, the entire district has come under the category of ‘Over-exploited’.

National Conference on Global Research for Sustainable Development: Recent Trends, Challenges and Approaches
Volume: 23 | Nov-Dec 2019 | ISSN : 2277-4858
Peer Reviewed National Level Interdisciplinary Journal Page No. - 113
Table 7: Block wise Category of Ground Water in Sawai Madhopur District (1984-2017)
Criteria of Categorisation
Source: Ground Water Department, GOR, Jaipur.
W-WHITE, G-GREY, D-DARK, O.E. - OVER-EXPLOITED, S- SAFE, SC-SEMI-CRITICAL, C-CRITICAL
V. GROUND WATER MANAGEMENT STRATEGY
For rapidly expanding urban, industrial and agricultural water requirement of the state ground water utilization is of
fundamental importance therefore, reliable estimation of ground water resource is a prime necessity. The stage of ground water
development for the district is 134.55%. Out of total 6 blocks, all blocks viz. Bamanwas, Bonli, Gangapur,ChauthkaBarwara,
Khandar and Sawai Madhopur have stage of ground water development more than 100% and fall under over-exploited
category. No recommendation is extended for additional ground water development except for drinking purposes. Ground
water should be used judiciously by cultivating crops requiring less watering and use of sprinkler and drip irrigation systems
should be encouraged. A modern agriculture management has to be taken into account for effective water management
techniques involving economic distribution of water, maintaining minimum pumping hours and also by selecting the most
suitable cost effective cropping pattern i.e. for getting maximum agriculture production through minimum withdrawal.
Adopting proper soil and water management even using ground water with somewhat dissolved solids (TDS) may also be
suitable for irrigation for growing salt tolerant crops in the area having high salinity.
Northern part of the district is underlain by unsaturated moderate thickness of alluvium which provides sufficient scope for
artificial recharge to ground water body as alluvial formation has very good storage and transmission capacity. In alluvial area,
following ways of recharge techniques may be adopted:
Roof top/paved area rain water harvesting for recharge to ground water in urban and industrial area.
Village water runoff/roof top rain water harvesting by dug wells/percolation tanks in rural area.
Construction of recharge shafts with gabion structures in nalas.
Recharge by dug well/percolation pit in agriculture farms.
Revival of traditional rainwater storage system i.e. Baori, open wells, tanka etc. for rainwater conservation for use in
day to day life will reduce ground water draft.
High water requirement crops should be discouraged. Proper agricultural extension services should be provided to
the farmers so that they can go for alternate low water requirement economical crops.
S.
NO. BLOCK
CATEGORY OF BLOCK
1984 1988 1990 1992 1995 1998 2001 2004 2007 2009 2011 2013 2017
1. BAMANWAS W W D D W S S C O.E. O.E. O.E. O.E. O.E.
2. BONLI W W W W W S S C O.E. O.E. O.E. O.E. O.E.
3. GANGAPUR W D D O.E. D C C O.E. O.E. O.E. O.E. O.E. O.E.
4. KHANDAR W W W W W S S C C C C O.E. O.E.
5. S.MADHOPUR W W W W W S SC O.E. O.E. O.E. O.E. O.E. O.E.
6. C.K. B. - - - - - - - - - - - - O.E.
Upto 1995
CategoryStage of G.W.Dev.(%)
White < 65
Grey 65-85
Dark 85-100
Over-exploited > 100
1995 onwards
Category (Old Category)Stage of G.W.Dev.(%)
Safe ( White ) < 70
Semi-critical (Grey) 70-90
Critical (Dark) 90-100
Over-exploited > 100

National Conference on Global Research for Sustainable Development: Recent Trends, Challenges and Approaches
Volume: 23 | Nov-Dec 2019 | ISSN : 2277-4858
Peer Reviewed National Level Interdisciplinary Journal Page No. - 114
In hard rock terrain, nalabunding, anicuts, dug wells, percolation tanks etc. are feasible structures which may be used to
recharge the ground water body. These will certainly enhance the recharge to ground water body resulting in arrest of decline
in water level. Mass awareness programmes should be arranged at local level to make common people aware of importance of
ground water resources, its better practices of use in domestic, irrigation and industrial sectors, present status of ground water
scenario, need and ways of its conservation etc.An adequate storage capacity is available in the aquifer system where water
levelduring pre monsoon period is less than 10m bgl. Therefore, the undergroundstorage of additional water in those areas will
not only ensure the availability ofwater during dry season but also reduce the evaporation losses.
Concurrent with the above measures the work of impounding and recharging thestorm water run-off from other sources may be
adopted. Suitable locations innalas& gullies should be utilised for the construction of check-dams, sub-surfacedams, ponds etc.
for ensuring stagnation of water & thus its infiltrationunderground for augmenting ground water storage. Such structures must
belocated and designed keeping in full view the geology, Geomorphology andhydrogeological set-up prevailing in the
area.Re-use and recycling of urban wastewater should receive added attention ofmunicipal bodies. The liquid urban wastes can
be recycled through aquifers toimprove their quality and pumped out for reuse particularly for irrigation. It shallhowever, be
essential to ensure that urban & industrial wastes are not intermixed. Where such a situation exists, the industrial wastes must
be treated beforedisposal to remove the toxic elements. After primary treatment the liquid urbanwastes can also be used for
direct irrigation in suitable areas. It will reduce thedependence on ground water to some extent and shall also ensure
conservationand use of the wastewater, which is otherwise lost to evaporation.To reduce dependence of ground water,
measures aimed at affecting economy inwater use be implemented. These could include installation of new small
capacitycisterns in toilets and other household means of saving water, use of improvedirrigation systems like sprinkler and
drip, etc. Wherever feasible, metering of waterand charging of economic costs, relocating high water-use industries to
surpluswater available areas, etc. should be undertaken.
Ground water development is a ‘People’s programme’. Therefore, education andinvolvement of people in its management
projects including development,conservation, protection and augmentation will be the prime requisite to protectresource
against quality degradation and guarantee quality assurance. Massawareness programmes aimed at educating the users
regarding the adverseeffects of over-exploitation of ground water on its quality & quantity, economic and
efficient use of water, voluntary regulation of abstraction, etc. will ensureutilisation of the resource at optimal levels. Planning
for the development and management of ground water in any area in the state must address the factors like low rainfall, limited
ground water storage availability, ground water salinity in many areas, deep water levels in most of western parts of state and
desertic conditions in nearly 50% of the state’s area. These aspects should be taken as a core consideration for planning and
implementing ground water development and management programmes. A holistic approach taking all aspects into
consideration shall therefore, need to be adopted.
VI. CONCLUSION
The development of ground water has played a vital role in India's socio-economic development. Ground water contributes to
nearly 62% of total irrigated area of the country and nearly 85% of the rural drinking water supply. The limited ground water
resources in the state are under threat due to the increasing demands of growing population, urbanization and industrialization.
Intensive and unregulated ground water pumping in many areas has caused rapid and widespread decline in ground water level
as well as reduction in the sustainability of ground water abstraction structures. The problem of reduction in ground water
availability is further compounded by deteriorating ground water quality in some parts of the state. To meet the increasing
demand, thereis a need for water conservation and reducing watercontamination in all sectors. Further, there is a need for
increasing water use efficiency in all the sectors.Time has now come to think beyond normal ways of implementing various
National Conference on Global Research for Sustainable Development: Recent Trends, Challenges and Approaches
Volume: 23 | Nov-Dec 2019 | ISSN : 2277-4858
Peer Reviewed National Level Interdisciplinary Journal Page No. - 115
government propelled interventions and partly switch over to community led interventions through participatory ground water
management.The increasing awareness of ground water management problems has resulted in a need for information on
ground water quality and quantity so that remedial action may be taken in time to mitigate these problems or to prevent their
re-occurrence in future. There is a true proverb in Hindi “Jal hai to Kalhai” which means if there is water then only our future
is safe.
REFERENCES
Bouwer, H. 1978 Ground water Hydrology, MC GrowHill, New-York.
Central Ground Water Board, (2019). Government of India,Faridabad, Dynamic Ground Water Resources of India, 2017.
CGWB (2013). Ground water brochure, Sawai Madhopur district, Rajasthan. Central Ground Water Board, Western Region,
Jaipur, p.10.
Chaturvedi, M.C. (1987). “Water Resources Systems Planning and Management” Tata McGraw-Hill Publishing Company
Limited, New Delhi.
Foster,M. D. 1942. Chemistry of Ground water in hydrology MC Grow Hill, New-York.
Garg, S.P. 1984 Ground water and tube wells Oxford and IBH publication. Co. 2nd Edn. New Delhi.
Ground Water Year Book 2016 – 2017 Rajasthan State ,Central Ground Water Board Western Region Jaipur August 2017.
Heath, R.C. and Frenk, W. Trainer 1968, Introduction of Ground Water Hydrology. John Willey
Hydrogeological Atlas of Rajasthan (2013) ,Sawai Madhopur District ,Ground water department ,Rajasthan ,Jaipur & ROLTA
India Ltd.
Karanath , K.R. Groundwater assessment development and management. Tata Mc Graw Hill Publication Co. Ltd. New Delhi.
Lautze , Jonathan. Edited (2014): Key concepts in water resource management: a review and critical evaluation, Routledge
(Earthscan), Abingdon, UK and New York, USA.
Ministry of Water Resources, GOI: National Water Policy, 2012.
Ministry of Water Resources, GOR,Jaipur: State Water Policy, 2010.
Monsoon Report – 2018, Water resources Department, Govt of Rajasthan, Jaipur.
Singh, S. and Rathore, M. S., (2010). Rainfed Agriculture in India - Perspectves and
Challenges, RawatPublicatons, Jaipur.
Talman, C.F.( 1973): Ground Water, , McGraw-Hill Co., New York.
Todd, D.K. (1976, 1959)”Groundwater Hydrology", John Wiley & Sons, Inc, New York.
AUTHOR’S BIOGRAPHY
Prem Sonwal (Research Scholar), Assistant Professor, Department of Geography, SCRS Government College,
Sawai Madhopur (Rajasthan)
Email: [email protected]

National Conference on Global Research for Sustainable Development: Recent Trends, Challenges and Approaches
Volume: 23 | Nov-Dec 2019 | ISSN : 2277-4858
Peer Reviewed National Level Interdisciplinary Journal Page No. - 116
Abstract: Human Resource Development (HRD) has assumed considerable importance in the recent years. Human Resource
Development plays vital role in every organisations because it is now considered as a part of modern management system. In Banks HRD
is a must for the overall development of employees. Todays increasing complex, and volatile business environment characterized by
globalisation, liberalisation and transnational invasion ensures that managing would not be the same again. As we are in 21st century
competitiveness is global market place presents the ultimate challenges to policy makers, business leaders and entrepreneur's in any
industry, including banking. The need for HRD is all the more great in service oriented in situations like banks.
This paper mainly concentrates on challenges faced by private sector banks in present competitive scenario and also mentions the
different HRD practices along with some conclusions and suggestions.
Keywords: Banks, Globalization, Liberalization, Concepts, Human Resource Development, Human Resource Management.
I. INTRODUCTION AND CONCEPT OF HRD
Human Resource Development (HRD) is the frame work for helping employees develop their personal and organizational
skills, knowledge and abilities. Today more importance is being given to "People" in organisations. This is mainly because
organisations are realising that human assets are the most important of all assets. This emphasis can also be partly attributed to
the new emerging values of humanism and humanisation.
Human Resource Development (HRD) is a process by which the employees of an organisation are helped, in a continuous,
planned way to:-
Acquire or sharpen capabilities required to perform various Functions associated with their present or expected roles,
develop their general capabilities as individuals and discover and exploit their potentials for their own and / or
organisational development purposes and,
develop an organisational culture in which supervision subordinate relationship, team work and collaboration among
Sub-units are strong and contribute to the professional well being, motivation and pride of employees (Rao 1985).
In the opinion of some management thinkers, japan is the first country to stress and use HRD practices.
According to Prof. UdaiPareek, as for as India is concerned the term HRD was introduced for the first time in the State Bank
Of India in 1972.
Human resource development is a multi dimensional concept. It has been defined differently by economists, social scientists,
industrialists, managers and other academicians from different angles.
Basically HRD involves two issues; relationship of the person to (i) One self and (ii) to the Society.
Human Resource Development and Practices in Indian Banks
Dr. Rekha Chouhan

National Conference on Global Research for Sustainable Development: Recent Trends, Challenges and Approaches
Volume: 23 | Nov-Dec 2019 | ISSN : 2277-4858
Peer Reviewed National Level Interdisciplinary Journal Page No.- 117
A person may be an asset or liability to himself and the society depending upon the development of his Skills and abilities and his social attitudes and values. The focus of all aspects of Human Resource Development is on developing the most superior work force so that the
organisation and individual employees can accomplish their work goals in service to cutomers.
Human Resource Development includes such opportunities as employee training, employee career development performance
management and development, coaching, mentoring. Succession planning, key employee identification, tuition assistance and
organisation development.
II. HRD IN BANKING SECTOR
What is a Bank?
A bank is a financial institution licensed to receive deposits and make loans. Banks may also provide financial services, such as
wealth management, currency exchange and safe deposit boxes. There are two types of banks, commerical/retail banks and
investment banks. In most countries banks are regulated by the national government or central bank.
Over the last three decades, there has been a remarkable increase in the size, spread and activities of banks in India. The
number of bank branches arose considerably during this period. The business profile of banks has transformed dramatically to
include non-tradintional activities like merchant banking, mutual funds, new financial services and products and the Human
Resource Development change is the only constant factor in this dynamic world and banking is not an exception.
The changes staring in the face of bankers relates to the fundamental way of banking which is undergoing rapid transformation
in the world of tody. The major challenges face by banks today is to protect the falling margins due to the impact of
competition. Another significant impact of banks today is the use of technology. There is an imperative need for not mere
technology up gradation but also its integration with the general way of functioning of banks. All this is possible with the help
of efficient human resource management.
The need for HRD is all the more great in service oriented institutions like banks. An efficient, effective and disciplined
banking system helps the process of economic development as per the national priorities. It functions as catalytic agent for
bringing about economical, industrial and agriculture growth and prosperity of the country.
The banking industry (ICICI Bank, HDFC Bank, IDBI Bank, SBI Bank etc.) has also realized the fact that the human resource
or the personnel are to play an important role to achieve a high rate of growth of the bank. An employee is generally regarded
as an innovator and supporter of innovations and a conscious developer of business in banking industry. The key to successful
management in any banking industry lies in effective utilization of the personnel they recruit from time to time (Rao 1993).
Hypothesis
The study is based on the hypothesis that private and public sector banks having well establish HRD system.
III. SCOPE OF THE STUDY
The scope of the study extents to examine the policies and procedure relating to human resource planning, recruitment and
selection procedure, management of training and development programmers, evaluation of wages and salary administration
programmes and analysis of employees welfare services, employee problems and to examine the ways of performance
appraisal.

National Conference on Global Research for Sustainable Development: Recent Trends, Challenges and Approaches
Volume: 23 | Nov-Dec 2019 | ISSN : 2277-4858
Peer Reviewed National Level Interdisciplinary Journal Page No.- 118
IV. RESEARCH METHODOLOGY
This explorative study is based on both primary and secondary data. The primary data has been collected with the help of
through direct interviews with branch managers and employees. Secondary data has been collected from internal records of the
banks.
V. OBJECTIVE OF THE STUDY
The study has been undertaken with the following objectives:-
To study the outcomes of human resource development for the banks, individual employees, groups and the society at
large in both private as well as public sector banks.
Identifying the training needs level of job satisfaction performance. Appraisal system etc.
To find out the weakness/short comings in the prevailing HRD system in both private as well as public sector banks.
To suggest wage & wins to improve the present HRD system.
To enquire into the HRD philosophy of banks.
To study the organizational and HRD climate in the banks.
To enquire into the practices of various HRD techniques.
VI. EVALUATIONS AND SUGGESTIONS
The findings and observations on various items support the hypothesis of the present study. The research shows that the
policies, norms, rules followed by any of the branch (private and public) is same as that decided by the Head office of the bank.
There is a pressing need to develop work practices which encourage efficiency in this banking sector.
There is a need to adopt global best practices in financial sector regulation and supervision and adopt them to the
domestic environment. This largely depends on the functioning and policies of public institutions, such as RBI as it is
increasingly subject to public discussion and debate.
The system of the performance appraisal should be de signed as simple as possible so that it is neither difficult to
understand nor' impossible to practices.
Top management should conduct more programmers on stress management, yoga and time management in order to
enjoy the Jobs/tasks done by the bank staff. Because banking industry is undergoing sea changes and putting the staff
always under pressure.
The job evaluator should be well educated and updated with the knowledge because if evaluator is not well versed in
the techniques and principles of job evaluation, Job classification and Job grading, the results of the job evaluation
will be quite inconsistent. Moreover, if evaluator is biased to a particular job. It will be assigned more weightage.
The training system requires commitment, flexibility and adoptively on the part of the trainer and trainees. The
trainees should be prepared to take account of the changing socio-economic environment and should undertake such
studies which may eventually help in the growth of the system itself,likewise flexibility in the training programmers
and plans is an essential quality to get adjusted to the changing socio-economic environments.
Top management should organize programmers on stress and time management especially for female bank staff.
Human resource development is a central challenge. Theseis a gap in middle level management which has to be
addressed through lateral hiring, better training etc. This is essential for public sector banks.

National Conference on Global Research for Sustainable Development: Recent Trends, Challenges and Approaches
Volume: 23 | Nov-Dec 2019 | ISSN : 2277-4858
Peer Reviewed National Level Interdisciplinary Journal Page No.- 119
VII. CONCLUSION
This paper aims to identify the items for administrative skills, competitiveness and HR policies. On the present changing
environment all the organisations stressed upon HRD aspects. Banking sector also tries to implement the modern ideas on
management regarding development of human resources. HRD climates plays a very important role in the success of any
organization because directly or indirectly it affects the performance of the employees. If the HRD climate is effective than the
employees will do their best for the achievement of the organisational goals. The long term vision for India's banking system is
to transform itself from being a domestic one to the global level may sound improbable at presents.
New generation private banks entered with clear business positioning (Investment, retail and corporate banking) and to a
certain extent lured away the cream of experienced and trained human resource in the respective fields from public sector
banks (PsBs) and that too in the lower and middle management levels (that constituted the core customer relations human
resource). In the present competitive world the banking sector especially of the developing economies like India, is facing lot
of tough competition talent crunch and skill shortage. All these have made the banks feel that the internal customer is also more
important equally with external customers, so every bank is trying to devise innovative HR practices to attract best talent and
give them comfortable environment to work with, that enables the banks to retain talents.
Thus to conclude it can be said that Human Resource Development Practices pave the way for solving the HRis sues in the
service sector industries leading to achievement of organizational objectives employee satisfaction and long term sustain
ability,which make India as a strong nation.
REFERENCES
Aswathappa, K.: Human Resources & Personnel Management, Tata McGraw Hill, New Delhi, 1997.
BasotiaG.R. "Human Resource Management" Mangal Deep Publication, Jaipur 1999, p. 182.
Chadha K Narendra "Human Resource Management", Issues, Case Studies and EperientialExcercises, Second Edition 2002,
Excel Prints, New Delhi-28.
D.A. Decenzo and S.P. Robbins, "Personnel/Human Resource management", New Delhi, Prentice Hall, 2004.
Edwin B. Flippo "Principals of Personnel Management", MaGraw-Hill, New York, 4th Edition, 1976, p. 5.
Kaushal Kumar, "Human Resource management", ABD Publishers jaipur (First Edition) 2001, p 2.
Khanadelwal, Anil K (Ed); "HRD in Banks", Oxford &IBH, New Delhi (1988), p. 2.
MalgiT.S. : Private Sector Banks – Bright Days Ahed, Economics & Political Weekly.
Nadlerm, Leonard (1984). The Handbook of Human Resource Development (Glossary). New York. John Wiley & Sons.
Pigors and Myers,. "Personnel Administration" McGraw-Hill, New York, 4th Edition, 1961, p. 12.
R.K. Mali, "Applying Human Resource Accounting to Banking Industry" Yojna, vol. 30 No. 13, July 16-31, p.4
RaoV.S.P. : "Human Resource Management", Text and cases, New Delhi, 2000.
T.V. Raoet.al., Alternative Approaches and Strategies of HRD, Rawat Publications, Jaipur, 1988.
T.V. Rao the HRD Missionary, Oxford and IBH, New Delhi, 19990.
UdaiParek, T.V. Rao, "Designing and Managing Human Resources Systems", Oxford IBH, New Delhi 1981.
National Conference on Global Research for Sustainable Development: Recent Trends, Challenges and Approaches
Volume: 23 | Nov-Dec 2019 | ISSN : 2277-4858
Peer Reviewed National Level Interdisciplinary Journal Page No.- 120
WEBSITES
www.msnsearch.com
www.banknetindia.com
www.hdfcbank.com
www.humanresource.com
www.icicibank.com
www.idbibank.com
www.indusindbank.co.in
https://www:jstor.org
https://papers.ssrn.com>so13>papers
www:eminencejournal.com
AUTHOR’S BIOGRAPHY
Dr. Rekha Chouhan, Assistant Professor, G.D. Memorial College, Jodhpur, Rajasthan
National Conference on Global Research for Sustainable Development: Recent Trends, Challenges and Approaches
Volume: 23 | Nov-Dec 2019 | ISSN : 2277-4858
Peer Reviewed National Level Interdisciplinary Journal Page No.- 121
ikuh ls lar`Ir Hkw&Hkkx dks vkæZHkwfe dgrs gSaA dbZ Hkw&Hkkx o"kZ Hkj vknzZ jgrs gSaA tSo fofo/krk dh n`f"V
ls ;g vR;ar laosnu”khy gksrh gS tks fd fo”ks’k ouLifr ds mxus o Qyus Qwyus ds fy, gksrh gSA
fo”o ue Hkwfe fnol 2 Qjojh dks euk;k tkrk gS ftldk mís’; vke yksxksa dks vknzZ Hkwfe ds egRo
o ykHkksa ds izfr tkx:d djuk gSA Hkkjr ds dqy 4-63 izfr”kr {kS=Qy ij vknZz Hkwfe ikbZ tkrh gS
ftuesa ls 69-22 izfr”kr vkUrfjd vknzZ Hkwfe }kjk vPNkfnr gS rFkk 27-13 izfr”kr rVh; vknzZHkwfe gSA
uyljksoj ¼xqtjkr½] fpYdk ¼mM+hlk½ Hkhrjdfudk lqUncu ¼ia- caxky½] dsoyknso ¼jktLFkku½] vks[kyk
¼fnYyh½ izeq[k vknzZHkwfe gSA yksdVd >hy ¼ef.kiqj½ dks rSjrk izk.kh fogkj dgk tkrk gSA blesa ,d
ikS/kk mxrk gS tks rSjrk jgrk gSA Aquatic Plant ftls cqyyketkvksa [kjirokj ;k dqeM+h dgrs gS
tks fd dsoy ;gh gksrk gSA bl ij fgj.k dh ,d iztkfr iyrh gS ftls fixHkh ;k lkaxkbZ dgrs gSaA
iznw"k.k ds dkj.k ;g ikS/kk [krjs esa gSa ftlls fgj.k dh iztkfr Hkh [krjs esa gksrh tk jgh gSA
blds vfrfjDr nynyh fgj.k ¼if”pe caxky½] ,d lhax okyk xSaMk dk thjxka o ekul ¼vlkse½]
rjkbZ {kS= esa fQf”kaxdSV ¼ePNhekj fcYyh½ xSaxsfVd] Mjksax] MkfYQu] xqtjkr dk taxyh x/kk] ?kfM+;ky]
exjePN fjMysVVZy dNqvk vkfn iztkfr;k¡ jsM MkVk cqd esa “kkfey gks xbZ gSA
buds lja{k.k gsrq Hkkjr ds 15 jkT;ksa esa 27 vknZzHkwfe {kS= fpfUgr fd,s x;s tgk¡ lja{k.k gsrq
tkx:drk ykus dk iz;kl fd;k tk jgk gSA buesa datyh] gfjds ¼iatkc½] lq[kuk ¼paMhx<+½] js.kqdk
¼fgekpy izn s”k½ buds vfrfjDr dsoyknso] lqUnjcu] ekul] dkihjaxk vkfn vH;kj.;ksa dks fo”o fojklr
esa “kkfey fd;k x;k gSA
2 Qjojh 1971 jkelj ¼bZjku½ esa 70 jk"Vªksa dk lEesyu vknZzHkwfe ds fy, gqvk D;ksafd ;g fo”o
Lrj ij vkfFkZd] lkekftd o lkaLd`frd vk/kkj gSA bls jkelj lfU/k dgrs gSa ftlij 163 n s”kksa esa
gLrk{kj fd;s gSA
vHkh rd fo”o dh 2062 vknZz Hkwfe;ksa dks jkelj {kS=ksa (Ramsar Sight) esa fpfUgr fd;k x;k
gS ftlesa 35 izfr”kr i;ZVu lEHkkfor o 45 izfr”kr dks fo”o fojklr esa “kkfey fd;k x;k gSA
fpYdk ¼mM+hlk½ o dsoyknso ¼jktLFkku½ jkelj ds rgr~ lajf{kr izFke nks nyny FksA Hkkjr
dk lcls cM+k jkelj lkbZV HkhecUn dkSyoSV yS.M 1512-5 km2 dsjy esa fLFkr gSA Hkkjr us 1981
esa bl le>kSrs ij gLrk{kj fd, vkSj ;gk¡ ds 26 vknzZ Hkwfe;ksa dks jkelj lajf{kr ntkZ gkfly gSA
tSo&fofo/krk % ue@vkæZHkwfe dk lja{k.k
Girish Kumar Bairwa

National Conference on Global Research for Sustainable Development: Recent Trends, Challenges and Approaches
Volume: 23 | Nov-Dec 2019 | ISSN : 2277-4858
Peer Reviewed National Level Interdisciplinary Journal Page No.- 122
ue Hkwfe dk lja{k.k
Hkkjr ljdkj }kjk 1985&86 ls jkT;ksa ds lg;ksx }kjk jk"Vªh; vknzZ Hkwfe lja{k.k dk;ZØe pyk;k
tk jgk gS ftldk izeq[k mís”; vknzZ Hkwfe;ksa ds lja{k.k vkSj muds mfpr mi;ksx ds fy, fn”kk funsZ”k
tkjh djuk rFkk izkFkfedrk okys {kS=ksa esa xgu lja{k.k ds mik; djuk gSaA
eksaVsDl fjdkMZ
vUrZjk"Vªh; egRo dh vknZz Hkwfe;ksa dh lwph;ksa ij vknzZ LFkyksa dk jftLVj gS tgk¡ rduhdh fodkl]
iznw"k.k o vU; ekuoh; gLr{ksi ds dkj.k ikfjfLFkfrdh esa ifjorZu vk;k gS ;k vkus dh laHkkouk gSA
ty esa vklsZfud dh ek=k c<+us dk izeq[k dkj.k [kuu o vkS|ksfxdhdj.k gSA blds dkj.k vklsZuksfll
o dsjsVksfll uked jksx gks tkrs gaSA ;fn “kjhj esa ty ds lkFk 130mg ls vf/kd vklsZfud igq¡prk
gS rks “kjhj esa QQksysa iM+ tkrs gaS rFkk Ropk xyus yxrh gSA fdMuh dks Hkkjh uqdlku igqaprk gSA
Water supply and Senitation Kolebuletion ds vuqlkj fo”o esa yxHkx 4 vjc yksx LoPNrk
ds vHkko esa th jgs gSaA fodkl”khy ns”kksa esa 30 yk[k yksx izfro"kZ v”kq) ty ds dkj.k ej tkrs gSa
ftudh lokZf/kd la[;k vÝhdk] ,f”k;k o ySfVu vesfjdk eas gSA
d`f"k esa iz;qDr jlk;u] vkS|ksfxd vif”k"V o ekuo vif”k"Vksa dk lgh <ax ls fuLrkj.k u gksus
ij ;g ty o e`nk dks iznwf"kr djrs gSaA iznwf"kr ty esa vkWDlhtu dh ek=k de gksus ds dkj.k tyh;
tho&tUrq o ikniksa dh e`R;q gksus yxrh gS o iwjh [kk| J`a[kyk izHkkfor gksrh gSA tyh; rki esa o`f)
Hkh ,d rjg dk iznw"k.k gS ftlls 'khr :f/kj o vlerkih izkf.k;ksa dh e`R;q gks tkrh gSA jlk;uksa] rsy
o fMVZtsaUV dh mifLFkfr ls dod esa o`f) gksrh gS rFkk lw;Zrki vf/kd xgjkbZ rd ugha tk ldrk
tks fd tyh; ikniksa o thoksa dh o`f) dks izHkkfor djrs gSaA cSfDVfj;k dh mifLFkfr ls rhoz vi?kVu
gksrk gS rFkk tyh; ikni o tho u"V gks tkrs gaSA
ty iznw"k.k funku ds mik;
iznw"k.k fu;=.k dkuwuksa dk dM+kbZ ls ikyuA
vkS|ksfxd] d`f"k o vU; ekuoh; tfur vif”k"Vksa dk oSKkfud fuLrkj.kA
Ik”kqvksa] okguksa o euq";ksa dk lQkbZ dk;ZØe ij jksdA
National Conference on Global Research for Sustainable Development: Recent Trends, Challenges and Approaches
Volume: 23 | Nov-Dec 2019 | ISSN : 2277-4858
Peer Reviewed National Level Interdisciplinary Journal Page No.- 123
ejs gq, tkuojksa o euq";ksa ds ty fuLrkj.k ij jksdA
vif”k"Vksa dk Hk{k.k djus okys thoksa dk fodkl tSls eNyh] ?kkas?kk vkfnA
jklk;fud [kkn ds LFkku ij tSfod [kkn dk iz;ksxA
,sls thok.kqvksa dk fodkl tks iznw"kdksa dh ek=k de djsA tSls&Bombay High thok.kq tks fd
rsy dk 50 izfr”kr ls 70 izfr”kr Hkkx de dj nsrs gSaA
tydqEHkh dk foLrkj jksdk tk;s rkfd ?kqfyr vkWDlhtu dh ek=k de uk gksA
xzkeh.k {kS=ksa esa ty laj{k.k gsrq tkx:drk QSykbZ tk,sA
“kgjh {kS=ksa esa ty ds lhfer mi;ksx ij jSyh] laxksf"B;ksa] iksLVj o pkVZ }kjk tkx:drk QSykbZ
tk,sA
mi;qZDr lq>koksa ds lkFk ge ty laj{k.k djds ue Hkwfe dks cpk ldrs gSa D;ksafd ue Hkwfe
,d foLr`r ikfjfLFkfrdh {kS= gS ftlesa tho&tUrq o ikniksa dh vla[; iztkfr;k¡ fuokl dj
jgh gSA vr% lja{k.k o lao/kZu dh vo/kkj.kk dks foLr`r djds gh tSo fofo/krk dks u"V gksus
ls cpk;k tk ldrk gSA
AUTHOR’S BIOGRAPHY
Girish Kumar Bairwa, Assistant Professor, Department of Geography, Shri Verdhaman Girls Collge, Beawar, Rajasthan
Email: [email protected]

National Conference on Global Research for Sustainable Development: Recent Trends, Challenges and Approaches
Volume: 23 | Nov-Dec 2019 | ISSN : 2277-4858
Peer Reviewed National Level Interdisciplinary Journal Page No.- 124
Abstract: Due to urbanization economic development take place & cities are conceptualized as the best source of economic growth, where
a better use of technology & information network. Had took place. lurbanization is the cause. For modern industrial & service sector-led,
economy that offer opportunities. For the young generation. Due to development of urban areas. Economic restructuring new forms of
urbanization is being rapidly explored &studied in the contemporary urban geography research. The UN Habitat report (2008) slated
that by 2030 all people will have more living in urban areas than in rural areas.
Keywords: Information Technology, Urban Planning, Smart City, Urban Development.
I. INTRODUCTION
The idea of smart city has its origin in this growing discourse which stresses on new to develop gties are and the world in
efficient ways by use of advanced technologies &communication system.
The rise of idea of smart city is connected with economy &its profit in urban technology & govt’s public sector stress on use of
technology. Both are depend to each other. The creation( establishment) of smart cities is interconnected with globalization is
it develops a “network society” where flows of moneg info &.Techno seen an interlinked process in regions &. Nations.
Brugman (history famed crest & coasts) of Arms fault globalization & network society by saying, They occur within
geographies infrastructures, buildings & organized communities with very local histories &cultures that are all organized
communities with, very local histories & culture, that are all organized into distinct tangible, 3-dimentional city places that
create the, economies & social dynamics for particular kind of activities &living “(2009:8) it shows social ecology, economic
growth &. Information technology it affect & create urban development processes. & overall urban planning. The idea of smart
city shows hardship b/w MNCS & activists for control of cities looking toward city we find that a smart city is another
upgraded city when we saw into several ideas it carries a differ knowledge & followed by group of aims.
The idea of smart city shows a struggle b/w MNCS & activist for handle of cities, looking through the ideology, find that a
smart city is another “ developed” city with the notion & each one carries a different ways & have a set of goals. The smart city
only “ only shows the . the common thing intends to improve” quality of life” . smart city means . sustainable cities, resilient
cities, healthy cities, loveable cities, creative cities for ex. The city life has a quality of life is confined & comfort in home at
working place 1 provides a luxurious life by IT & provides all services.
II. CONCEPTUAL FRAMEWORK
This treaty of urban planning which, impacts urban development & effects in socioeconomic & technological context. Firstly,
theory of cities as smart cites is linked to a post industrial occurrence in most of advanced countries.
Most noteworthy facet of aggregate cities is that organized around. Consumption than production. It entangle how cities are
subject to transformation due to change to life style. Emergence of new lifestyle. Secondly, It is growing role of science &
techno in marking a Urban landscape (developed) .
New Forms of Urban Development: An Overview of Smart Cities Paradigm India’s Urban Policy
Dr. Naveen Kumar

National Conference on Global Research for Sustainable Development: Recent Trends, Challenges and Approaches
Volume: 23 | Nov-Dec 2019 | ISSN : 2277-4858
Peer Reviewed National Level Interdisciplinary Journal Page No.- 125
It reflects a move from accounts that techno. Situated a examine role in developing city. Shows the process of making by
brevity in cities.
Thirdly New urbanism movement gives rules for development modals to guide public. Policy, development practice, urban
plans, & effects of sprawl. It also focuses on unit of the contemporary cities.
Fourthly the idea of smart cities. Viewed as socio technical theory of action. This term literally means both the social. &
technological. Factors. Smart city are. Not only defined by Into technology alone, also by use of It effect. & with broader &
social contexts,
Also, it acknowledges the fact that steps for creating smart cities will face. Hard challenged, public & political actions, socially
diverse multiple inequalities.
The question arises that how cities are developed how this project in India is going to deal with multiple developed problems.
This paper presents attempt of study the theory of smart cities, & its role to words urban development.
This study applies approach to study changes in urban planning, & exploring its implication on Indian cities.
The questions this paper attempts are .
(a) What is a smart city, & its constituent. Elements?
(b) What are the major issue areas .
(c) What would it contribute towards spatial structure. , the institutional mechanism & urban, governance?
III. WHAT IS SMART CITY ?
The theory of smart city. Gives definition depend on word “smart” which means that digital city, sustainable city, intelligent
city, urban city, ubiquitous city, knowledge city.
it is not new Portland oregan is remembered as an examples of smart city. ”smart city”. This word literally gives the. Meaning
that development. Or growth. The day to day growth of the urbon areas. By Information Tecnology & social are called smart
lities where now more & more growth is impossible for some while.
The smartness of a city is described by its ability of bringing together all its resources to useful & achieve the aims & complete
the purposes & goals that has set itself.
While the main help of I C T to development can be considerable. A smart city seen as. Integrated management of information
that creates value by applying advanced technology , access transfer & process information for different uses.
The aim for providing smart city is progress & providing them extra. Featured & good technological machineries & innovative
services provide to the public, best way of using natural resources, better management of lifestyle, sustainable economic
development.
Generally there are two type of smart city modals.
Simply medals that aims to develop a city by a particular view & a goal which they set & how the contributor have to work
together. Mosaic modals that aims. To define elements of the city in a knowledge city to many levels of commonness develop
a way of explaining all contributor, the works, the connections.& results etc. of a city in a constant way .
A smart city vision have some factor:-
1 Management & organization
2 Technology
3 The economy
4 Built infrastructure
5 Governance
6 Policy
7 People & communities
8 The natural environment

National Conference on Global Research for Sustainable Development: Recent Trends, Challenges and Approaches
Volume: 23 | Nov-Dec 2019 | ISSN : 2277-4858
Peer Reviewed National Level Interdisciplinary Journal Page No.- 126
IV. INDIA’S ASSIGNATION WITH SMART CITIES
A planning policy survey gives result that there. Is continuous. Works by government of India to make over cities of different
seals, This is sorted with the most elaborated policy Jawaharlal Nehru urban Renewal Mission (JNNURM) launched in 2005. It
was based on two central rationales
1 Anxious with strong gradual relation such as economic import’s that bring economic growth.
2 coercion of the serenity Development goals by urban growth in states of India.
J N N U R M aimed on the sixty five cities in a mission mode with aimed upon two things.
(1) Urban infastuclurc & governance.
(2) & basic service to the urban poor.
According to High Powered Expert Committee for estimating the investment Requisitions for urban Infrastructure
services ion requirement for New developed J N N U R M.
Despite a big abort by centre towards modify by a substantial umber of cites, condition of a area haven’t improved
much.
Due to same issues, some are highlighted in national plans.
In the visions of our cities, the twelfth five year plan tells that the dream of smart cities would be fastly going on & they are
fast fight for investment nationally & internationally too. The lities should get best infrastructure well facilities at good
best which give a best completion corner to economic activities.
Now India is going to making to making intelligent lities. Which having some properties like minimum pollution level,
self sustainable maximum receding , extra technological efficient transportation, communication, best use of resources,
advanced technology.
Like some examples are Dholera , a industrial hub on. The Delhi-Mumbai border.
Gujarat International Finance Tecno. City in Ahmadabad. M U D Has launched the smart cities mission in 2015. Treaty
premers. Gestate smart cities are those attract investment, expert, probbessional establish an company & make it capable
with out any civil inconvenience. Are important in future citizen focused & venture capitalist smart city inteligent lities
progress with prominence on ambitions feasible & quality of life.
The disruption of the Intelligent cities may be select from some following :-
One satellite city of each of the cities with a population of 4 million people or more (9 cities)
Most of the cities in population range of 1-4 million (about 35 out 44 cities .)
All state/UTS capitals, ever if they have a population of less than one million (17 cities)
Cities of tourist religions & economic importance not included in above (10 cities)
Cities in the 0.2-1.0 million population range (25 cities)
According to the Document of intelligent city the internal infrastructure element of area should contain enough portable water
supply, adeguate electricity sufficient housing, robust it connectivity, best commanding, supply, sanitation, sufficient lirban
mobility sustainable environment, safety & security for citizens, health & education.
The main aim is to bring economic growth.& imprecise standardness of life of the people by providing then. Area development
& wonderful technology New areas will be originpte around.
Urban in order to lodge enlarging population in urban areas.
The calculated component of area based on development ore following : -
National Conference on Global Research for Sustainable Development: Recent Trends, Challenges and Approaches
Volume: 23 | Nov-Dec 2019 | ISSN : 2277-4858
Peer Reviewed National Level Interdisciplinary Journal Page No.- 127
Its will define planning to achieve smart city purposes to retrofitting more area more well organized & sustainable. In
retrofitting, an area.
Consisting of more than 500 acres will be discourse with people to prepare. Plan. Concentrated framework services.
Re-development It effect a substitution of the living. Built up. Environment & sanction, co creation of a new outcome with
enhanced frame work using mixed land use speed up density.
Greenfield = It will introduce more of the intelligent solution in a backy empty area ( more than 250 acres) using appropriate
strategy, plan financing. & application tools with facilities. For enough housing, e specially for the poor.
Pan – city = It envisages :- application of chosen intelligent result so be living city wide frame work. Treaty of Intelligent
results. Will bring use of technology, data to make ground work.
REFERENCES
Bartlett, M.S. (1978) “Nearest Neighbour Models in the Analysis of Field Experiements”, Journal of the Royal Statistical Sociely,
Series-B vol. 40,pp.147-174.
Bharati, K. and C. Singh (2013):’Ageing in India: Need for a Comprehensive Policy,’ IIMB WP421, IIM Bangalore.
Agrawal, A, & Gibson, C, C, (1999) Enchantment and /disenchantment: the role of community in natural resource Conservation.
World Development, 27, 629-649.
Khullar, D. R (2014): India: A Comprehensive Geography, Kalyani publisher, New Delhi.
Datt, G and Mahajan, A. (2014) “ Indian Economy” S. Chand & Company Pvt. Ltd. New Delhi.
AUTHOR’S BIOGRAPHY
Dr. Naveen Kumar, Associate Professor Department of Geography, Aishwarya College, Jodhpur (Rajasthan)
Email: [email protected]