Novel concept of composite phase change material wall system for year-round thermal energy savings
14
Energy and Buildings 42 (2010) 1759–1772 Contents lists available at ScienceDirect Energy and Buildings journal homepage: www.elsevier.com/locate/enbuild Novel concept of composite phase change material wall system for year-round thermal energy savings Bogdan M. Diaconu a,b,∗ , Mihai Cruceru b a IST-ICIST, Universidade Técnica de Lisboa, Av. Rovisco Pais, 1049-001 Lisboa, Portugal b University “Constantin Brancusi” of Tg-Jiu, Calea Eroilor 30, Tg-Jiu, Romania article info Article history: Received 19 February 2010 Received in revised form 21 April 2010 Accepted 13 May 2010 Keywords: Latent heat thermal energy storage PCM building materials Energy saving Passive building Building simulation abstract A new type of composite wall system incorporating phase change materials (PCMs) was proposed and its potential for air conditioning/heating energy savings in continental temperate climate was evaluated. The novelty of the wall system consists of the fact that two PCM wallboards, impregnated with different PCMs are used. The structure of the new wall system is that of a three-layer sandwich-type insulating panel with outer layers consisting of PCM wallboards and middle layer conventional thermal insulation. The PCM wallboard layers have different functions: the external layer has a higher value of the PCM melting point and it is active during hot season and the internal layer with a PCM melting point near set point temperature for heating is active during cold season. A year-round simulation of a room built using the new wall system was carried out and the effect of PCM presence into the structure of the wall system was assessed. It was found that the new wall system contributes to annual energy savings and reduces the peak value of the cooling/heating loads. The melting point values for the two PCMs resulting in the highest value of the energy savings were identified. © 2010 Elsevier B.V. All rights reserved. 1. Introduction Heat transfer of the built environment through the building envelope has a significant weight in the overall energy balance contributing to a high extent to the cooling and heating load. Passive methods used for the thermal energy management of the built environment include the thermal mass, which can con- tribute to downsizing of the AC/heating equipment and reducing the AC/heating demand. In addition, increasing the thermal mass of the built environment can contribute to increasing the indoor thermal comfort. The use of PCMs in building elements with the purpose of increasing the thermal mass was extensively studied [1–4].A review of PCMs application in the built environment can be found in [5]. PCMs can be integrated into building materials or prefab- ricated building elements such as concrete, gypsum wallboards, plaster, etc. Gypsum wallboards incorporating PCMs such as fatty acids [6], mixture of lauric and myristic acids [7], eutectic mixtures of capric Abbreviations: AC, air conditioning; DSC, differential scanning calorimetry; PCM, phase change material. ∗ Corresponding author at: IST-ICIST, Universidade Técnica de Lisboa, Av. Rovisco Pais, 1049-001 Lisboa, Portugal. Tel.: +351 218412216; fax: +351 218470762. E-mail address: [email protected] (B.M. Diaconu). acid and lauric acid [8], mixture of capric acid and stearic acid [9], butyl stearate [1], etc. A key issue in developing building materi- als and building elements incorporating PCMs is the integration of the PCM into the structure of the matrix material. The method of incorporation depends mainly on the nature of the building mate- rial. Khudhair and Farid [10] described the most commonly used methods for integration of PCMs into the building materials and building elements. Feldman et al. [11] used immersion of gypsum wallboards into a mixture of 93–95 wt% commercial Methyl Palmitate with 7–5 wt% commercial Methyl Stearate at 45 ◦ C for approximately 25 s. A PCM mass absorption degree of approximately 24% was found. The thermo-physical properties of the resulting impregnated wallboard were assessed by means of DSC analysis. A phase transition tem- perature range of approximately 2 ◦ C and a latent heat capacity varying between 35 and 55 kJ/kg were found. Rozanna et al. [6] used immersion of gypsum boards with the thickness values of 6 and 12.5 mm into an eutectic mixture of lauric and stearic acids for 1 h. A mass absorption degree of 27–28.5% and a maximum value of the latent heat of 56 kJ/kg were identified. The phase transition process was affected by a hysteresis-type behaviour in the sense that the melting temperature range was different from solidification tem- perature range. Sari et al. [9] developed a phase change wallboard by immersing gypsum wallboards into an eutectic mixture of com- mercial 83 wt% capric acid and 17 wt% lauric acid for approximately 1 h. A mass absorption degree of 25 wt% was found and no separa- 0378-7788/$ – see front matter © 2010 Elsevier B.V. All rights reserved. doi:10.1016/j.enbuild.2010.05.012
Transcript of Novel concept of composite phase change material wall system for year-round thermal energy savings
Nt
Ba
b
a
ARRA
KLPEPB
1
ecPtttot
irirp
m
p
P
0d
Energy and Buildings 42 (2010) 1759–1772
Contents lists available at ScienceDirect
Energy and Buildings
journa l homepage: www.e lsev ier .com/ locate /enbui ld
ovel concept of composite phase change material wall system for year-roundhermal energy savings
ogdan M. Diaconua,b,∗, Mihai Crucerub
IST-ICIST, Universidade Técnica de Lisboa, Av. Rovisco Pais, 1049-001 Lisboa, PortugalUniversity “Constantin Brancusi” of Tg-Jiu, Calea Eroilor 30, Tg-Jiu, Romania
r t i c l e i n f o
rticle history:eceived 19 February 2010eceived in revised form 21 April 2010ccepted 13 May 2010
eywords:
a b s t r a c t
A new type of composite wall system incorporating phase change materials (PCMs) was proposed andits potential for air conditioning/heating energy savings in continental temperate climate was evaluated.The novelty of the wall system consists of the fact that two PCM wallboards, impregnated with differentPCMs are used. The structure of the new wall system is that of a three-layer sandwich-type insulatingpanel with outer layers consisting of PCM wallboards and middle layer conventional thermal insulation.
atent heat thermal energy storageCM building materialsnergy savingassive buildinguilding simulation
The PCM wallboard layers have different functions: the external layer has a higher value of the PCMmelting point and it is active during hot season and the internal layer with a PCM melting point near setpoint temperature for heating is active during cold season. A year-round simulation of a room built usingthe new wall system was carried out and the effect of PCM presence into the structure of the wall systemwas assessed. It was found that the new wall system contributes to annual energy savings and reducesthe peak value of the cooling/heating loads. The melting point values for the two PCMs resulting in thehighest value of the energy savings were identified.
. Introduction
Heat transfer of the built environment through the buildingnvelope has a significant weight in the overall energy balanceontributing to a high extent to the cooling and heating load.assive methods used for the thermal energy management ofhe built environment include the thermal mass, which can con-ribute to downsizing of the AC/heating equipment and reducinghe AC/heating demand. In addition, increasing the thermal massf the built environment can contribute to increasing the indoorhermal comfort.
The use of PCMs in building elements with the purpose ofncreasing the thermal mass was extensively studied [1–4]. Aeview of PCMs application in the built environment can be foundn [5]. PCMs can be integrated into building materials or prefab-
icated building elements such as concrete, gypsum wallboards,laster, etc.Gypsum wallboards incorporating PCMs such as fatty acids [6],ixture of lauric and myristic acids [7], eutectic mixtures of capric
Abbreviations: AC, air conditioning; DSC, differential scanning calorimetry; PCM,hase change material.∗ Corresponding author at: IST-ICIST, Universidade Técnica de Lisboa, Av. Roviscoais, 1049-001 Lisboa, Portugal. Tel.: +351 218412216; fax: +351 218470762.
E-mail address: [email protected] (B.M. Diaconu).
378-7788/$ – see front matter © 2010 Elsevier B.V. All rights reserved.oi:10.1016/j.enbuild.2010.05.012
© 2010 Elsevier B.V. All rights reserved.
acid and lauric acid [8], mixture of capric acid and stearic acid [9],butyl stearate [1], etc. A key issue in developing building materi-als and building elements incorporating PCMs is the integration ofthe PCM into the structure of the matrix material. The method ofincorporation depends mainly on the nature of the building mate-rial. Khudhair and Farid [10] described the most commonly usedmethods for integration of PCMs into the building materials andbuilding elements.
Feldman et al. [11] used immersion of gypsum wallboards into amixture of 93–95 wt% commercial Methyl Palmitate with 7–5 wt%commercial Methyl Stearate at 45 ◦C for approximately 25 s. APCM mass absorption degree of approximately 24% was found. Thethermo-physical properties of the resulting impregnated wallboardwere assessed by means of DSC analysis. A phase transition tem-perature range of approximately 2 ◦C and a latent heat capacityvarying between 35 and 55 kJ/kg were found. Rozanna et al. [6] usedimmersion of gypsum boards with the thickness values of 6 and12.5 mm into an eutectic mixture of lauric and stearic acids for 1 h.A mass absorption degree of 27–28.5% and a maximum value of thelatent heat of 56 kJ/kg were identified. The phase transition processwas affected by a hysteresis-type behaviour in the sense that the
melting temperature range was different from solidification tem-perature range. Sari et al. [9] developed a phase change wallboardby immersing gypsum wallboards into an eutectic mixture of com-mercial 83 wt% capric acid and 17 wt% lauric acid for approximately1 h. A mass absorption degree of 25 wt% was found and no separa-
1760 B.M. Diaconu, M. Cruceru / Energy and
Nomenclature
A surface area (m2)ACH air changes per hour (h−1)c specific heat capacity (J kg−1 K−1)Fo Fourier number Fo = a�x−2
H specific enthalpy (J kg−1)h convection coefficient (W m−2 K−1)k thermal conductivity coefficient (W m−1 K−1)L latent heat of fusion (J kg−1)M melting peak factor (J kg−1)n number of nodesq heat flux (W m−2)Q heat flow (W)t temperature (◦C or K)U overall heat transfer coefficient (W m−2 K−1)V volume (m3)x spatial coordinate (m)
Greek symbols˛ thermal diffusivity (m2 s−1)ı layer thickness (m)� density (kg m−3)� time (s or h)
Subscripts0 initiala air (indoor environment)amb ambient (temperature)H/C heating/cooling (load)HVAC heating or air conditioning equipmentI/V infiltration/ventilationint internal (room)l layerL infiltration and ventilationlq liquid (phase)m meltingr roomrad radiativeref references solid (phase)SET set pointt (phase) transition
tmbasa
pimam
ccaic
W windoww wall
ion of the PCM from the matrix material was observed after 5000elting/solidification cycles. Shilei et al. [12] used the gypsum wall-
oard immersion into a mixture of 82% capric acid and 18% lauriccid as a method of PCM incorporation. The immersion of the gyp-um wallboards into the liquid PCM was maintained for 6–10 minchieving a PCM absorption degree of approximately 26 wt%.
Feldman and Banu [13] developed PCM wallboards by incor-orating various PCMs directly into the gypsum paste prepared
n a way similar to production of commercial wallboards. A PCMass percentage of the resulting PCM wallboard was between 20
nd 25 wt%. It was found that the PCM incorporation at the time ofixing resulted in a more even PCM distribution in the wallboard.Zhang et al. [14] described a method of PCM incorporation into
oncrete. It was found that the thermo-physical properties of theoncrete containing PCM (butyl stearate), including the latent heatnd phase transition temperature range, were influenced to anmportant extent by the physical properties of the aggregates (espe-ially porosity).
Buildings 42 (2010) 1759–1772
Schossig et al. [15] investigated the incorporation of PCMmicrocapsules into gypsum wallboard. PCM microencapsulationprevents the interaction between the matrix material and the PCMthat could change the properties of the first. Another advantageof PCM microencapsulation is leakage prevention that could occurduring the lifetime of the building element. An attenuation of theindoor temperature fluctuations of approximately 2 ◦C was foundby means of simulations compared to the case of the walls withoutPCM microcapsules.
The potential of PCM building materials of energy saving andimproving the indoor thermal comfort was confirmed by bothexperimental and numerical studies.
Darkwa and Callaghan [16] carried out a simulation of a passiveroom with PCM drywalls modelling the phase transition processby an increase of the effective heat capacity around the PCM melt-ing point. A Gaussian-type variation of the effective heat capacitywith various values of the phase transition temperature range wasconsidered. Two methods of PCM integration into the buildingmaterials were considered: laminated PCM boards and randomlymixed PCM boards. An attenuation of the indoor temperature pro-file of approximately 2 ◦C was found compared to an identical roombuilt of drywalls without PCM. Ismail and Castro [4] conducteda simulation of a three-layer wall with the exterior layers con-sisting of conventional building materials and the middle layerconsisting of PCM. It was found that the presence of the PCM inthe structure of the exterior wall resulted in downsizing of theheating equipment and decreasing the energy demand for AC.Neeper [17] conducted a simulation of a wallboard with latentstorage modelling the effective heat capacity of the PCM using aGaussian function. It was found that the maximum diurnal energystorage occurs when the PCM melting point equals the averageroom temperature (for a sinusoidal variation of the room temper-ature) and for a narrow phase transition temperature range. Xu etal. [18] investigated numerically and experimentally a test roomwith shape-stabilized PCM floor. It was found that the suitablePCM melting point should be approximately equal to the averageindoor temperature during winter sunny days. Athienitis et al. [1]developed a mathematical model for the transient heat conduc-tion through a PCM-gypsum board. The simulation results werecompared with experimental measurements obtaining satisfactoryagreement, which indicated that the explicit one-dimensional non-linear finite difference model can be used successfully in simulationof the PCM-gypsum wallboard room.
Composite wall systems incorporating PCMs were investigatedby Pasupathy and Velraj [19]. Chen et al. [20], Zhou et al. [21],Kuznik and Virgone [22], Ahmad et al. [23], Halford and Boehm[24], Darkwa [25], Carbonari et al. [26].
Modelling thermo-physical properties of PCMs poses some diffi-culties. Diaconu et al. [27] determined experimentally the apparentheat capacity of a microencapsulated PCM slurry by means of DSC.It was found that the apparent heat capacity was DSC scanning ratedependent and it followed a hysteresis-type pattern. A key conclu-sion was that the hysteresis of the microencapsulated PCM slurryH–t curve made impossible to predict the variation of enthalpy withtemperature. Moreover, it was found that the magnitude of the hys-teresis in the H–t curve was DSC scanning rate dependent. Complexand unpredictable behaviour of the H–t curves was found in cases inwhich temperature did not sweep completely the phase transitiontemperature range.
Arkar and Medved [28] used DSC to determine the thermo-physical properties of a paraffin type (RT20). It was found that
the scanning rate influences to a significant extent both thermo-physical properties and the phase transition temperature range. Tothe authors’ knowledge, an accurate analytical model of the tran-sient heat conduction in a PCM impregnated building material wasnot developed so far. Various simplifying assumptions were made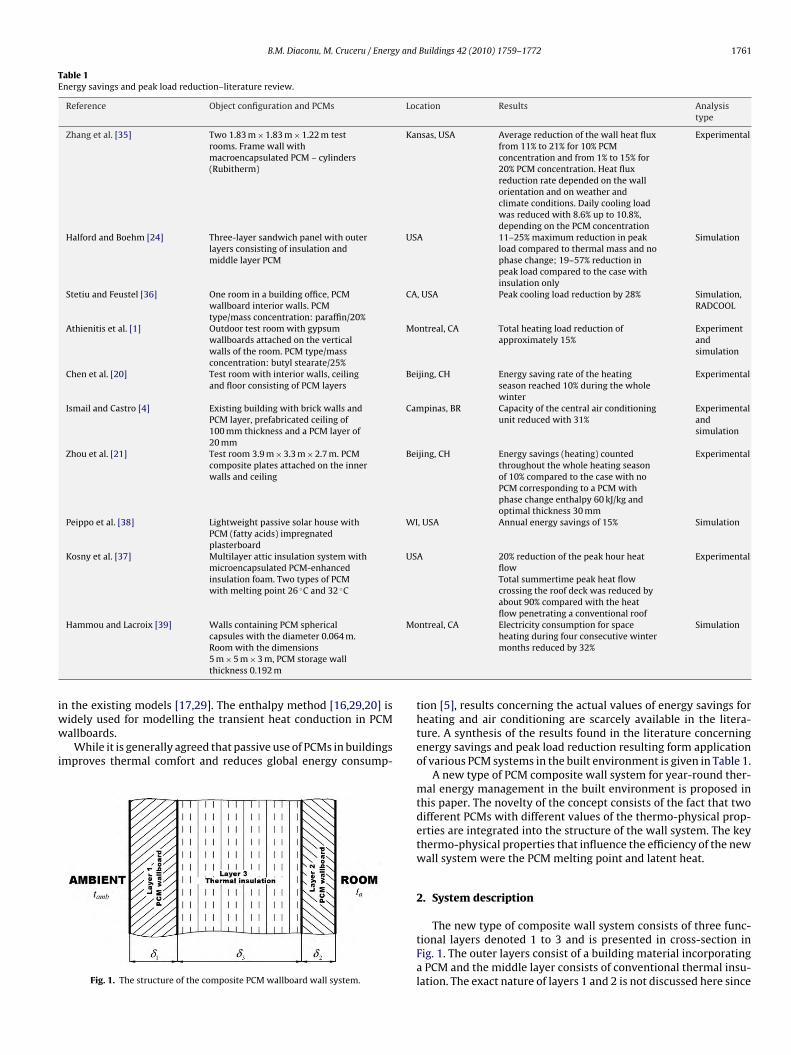
B.M. Diaconu, M. Cruceru / Energy and Buildings 42 (2010) 1759–1772 1761
Table 1Energy savings and peak load reduction–literature review.
Reference Object configuration and PCMs Location Results Analysistype
Zhang et al. [35] Two 1.83 m × 1.83 m × 1.22 m testrooms. Frame wall withmacroencapsulated PCM – cylinders(Rubitherm)
Kansas, USA Average reduction of the wall heat fluxfrom 11% to 21% for 10% PCMconcentration and from 1% to 15% for20% PCM concentration. Heat fluxreduction rate depended on the wallorientation and on weather andclimate conditions. Daily cooling loadwas reduced with 8.6% up to 10.8%,depending on the PCM concentration
Experimental
Halford and Boehm [24] Three-layer sandwich panel with outerlayers consisting of insulation andmiddle layer PCM
USA 11–25% maximum reduction in peakload compared to thermal mass and nophase change; 19–57% reduction inpeak load compared to the case withinsulation only
Simulation
Stetiu and Feustel [36] One room in a building office, PCMwallboard interior walls. PCMtype/mass concentration: paraffin/20%
CA, USA Peak cooling load reduction by 28% Simulation,RADCOOL
Athienitis et al. [1] Outdoor test room with gypsumwallboards attached on the verticalwalls of the room. PCM type/massconcentration: butyl stearate/25%
Montreal, CA Total heating load reduction ofapproximately 15%
Experimentandsimulation
Chen et al. [20] Test room with interior walls, ceilingand floor consisting of PCM layers
Beijing, CH Energy saving rate of the heatingseason reached 10% during the wholewinter
Experimental
Ismail and Castro [4] Existing building with brick walls andPCM layer, prefabricated ceiling of100 mm thickness and a PCM layer of20 mm
Campinas, BR Capacity of the central air conditioningunit reduced with 31%
Experimentalandsimulation
Zhou et al. [21] Test room 3.9 m × 3.3 m × 2.7 m. PCMcomposite plates attached on the innerwalls and ceiling
Beijing, CH Energy savings (heating) countedthroughout the whole heating seasonof 10% compared to the case with noPCM corresponding to a PCM withphase change enthalpy 60 kJ/kg andoptimal thickness 30 mm
Experimental
Peippo et al. [38] Lightweight passive solar house withPCM (fatty acids) impregnatedplasterboard
WI, USA Annual energy savings of 15% Simulation
Kosny et al. [37] Multilayer attic insulation system withmicroencapsulated PCM-enhancedinsulation foam. Two types of PCMwith melting point 26 ◦C and 32 ◦C
USA 20% reduction of the peak hour heatflowTotal summertime peak heat flowcrossing the roof deck was reduced byabout 90% compared with the heatflow penetrating a conventional roof
Experimental
Hammou and Lacroix [39] Walls containing PCM spherical Montreal, CA Electricity consumption for space Simulation
iww
i
capsules with the diameter 0.064 m.Room with the dimensions5 m × 5 m × 3 m, PCM storage wallthickness 0.192 m
n the existing models [17,29]. The enthalpy method [16,29,20] is
idely used for modelling the transient heat conduction in PCMallboards.While it is generally agreed that passive use of PCMs in buildingsmproves thermal comfort and reduces global energy consump-
Fig. 1. The structure of the composite PCM wallboard wall system.
heating during four consecutive wintermonths reduced by 32%
tion [5], results concerning the actual values of energy savings forheating and air conditioning are scarcely available in the litera-ture. A synthesis of the results found in the literature concerningenergy savings and peak load reduction resulting form applicationof various PCM systems in the built environment is given in Table 1.
A new type of PCM composite wall system for year-round ther-mal energy management in the built environment is proposed inthis paper. The novelty of the concept consists of the fact that twodifferent PCMs with different values of the thermo-physical prop-erties are integrated into the structure of the wall system. The keythermo-physical properties that influence the efficiency of the newwall system were the PCM melting point and latent heat.
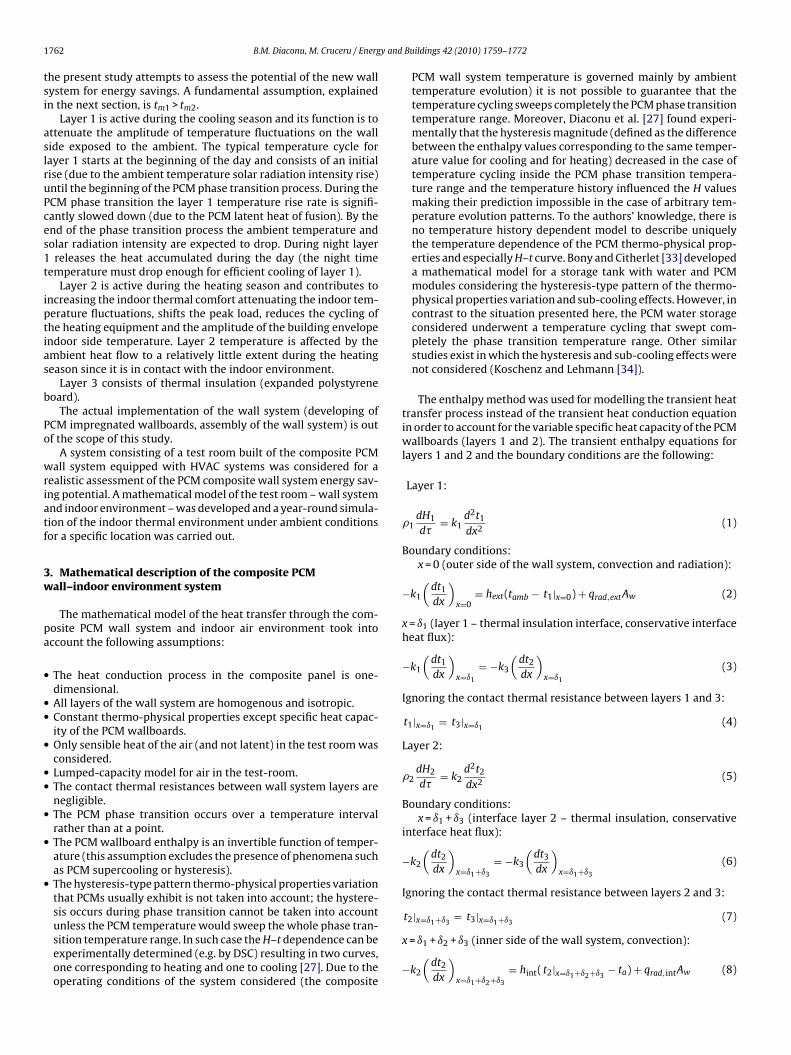
2. System description
The new type of composite wall system consists of three func-tional layers denoted 1 to 3 and is presented in cross-section inFig. 1. The outer layers consist of a building material incorporatinga PCM and the middle layer consists of conventional thermal insu-lation. The exact nature of layers 1 and 2 is not discussed here since
1 y and
tsi
aslruPces1t
iptias
b
Po
wriatf
3w
pa
•
••
•
••
•
•
•
762 B.M. Diaconu, M. Cruceru / Energ
he present study attempts to assess the potential of the new wallystem for energy savings. A fundamental assumption, explainedn the next section, is tm1 > tm2.
Layer 1 is active during the cooling season and its function is tottenuate the amplitude of temperature fluctuations on the wallide exposed to the ambient. The typical temperature cycle forayer 1 starts at the beginning of the day and consists of an initialise (due to the ambient temperature solar radiation intensity rise)ntil the beginning of the PCM phase transition process. During theCM phase transition the layer 1 temperature rise rate is signifi-antly slowed down (due to the PCM latent heat of fusion). By thend of the phase transition process the ambient temperature andolar radiation intensity are expected to drop. During night layerreleases the heat accumulated during the day (the night time
emperature must drop enough for efficient cooling of layer 1).Layer 2 is active during the heating season and contributes to
ncreasing the indoor thermal comfort attenuating the indoor tem-erature fluctuations, shifts the peak load, reduces the cycling ofhe heating equipment and the amplitude of the building envelopendoor side temperature. Layer 2 temperature is affected by thembient heat flow to a relatively little extent during the heatingeason since it is in contact with the indoor environment.
Layer 3 consists of thermal insulation (expanded polystyreneoard).
The actual implementation of the wall system (developing ofCM impregnated wallboards, assembly of the wall system) is outf the scope of this study.
A system consisting of a test room built of the composite PCMall system equipped with HVAC systems was considered for a
ealistic assessment of the PCM composite wall system energy sav-ng potential. A mathematical model of the test room – wall systemnd indoor environment – was developed and a year-round simula-ion of the indoor thermal environment under ambient conditionsor a specific location was carried out.
. Mathematical description of the composite PCMall–indoor environment system
The mathematical model of the heat transfer through the com-osite PCM wall system and indoor air environment took intoccount the following assumptions:
The heat conduction process in the composite panel is one-dimensional.All layers of the wall system are homogenous and isotropic.Constant thermo-physical properties except specific heat capac-ity of the PCM wallboards.Only sensible heat of the air (and not latent) in the test room wasconsidered.Lumped-capacity model for air in the test-room.The contact thermal resistances between wall system layers arenegligible.The PCM phase transition occurs over a temperature intervalrather than at a point.The PCM wallboard enthalpy is an invertible function of temper-ature (this assumption excludes the presence of phenomena suchas PCM supercooling or hysteresis).The hysteresis-type pattern thermo-physical properties variationthat PCMs usually exhibit is not taken into account; the hystere-sis occurs during phase transition cannot be taken into account
unless the PCM temperature would sweep the whole phase tran-sition temperature range. In such case the H–t dependence can beexperimentally determined (e.g. by DSC) resulting in two curves,one corresponding to heating and one to cooling [27]. Due to theoperating conditions of the system considered (the compositeBuildings 42 (2010) 1759–1772
PCM wall system temperature is governed mainly by ambienttemperature evolution) it is not possible to guarantee that thetemperature cycling sweeps completely the PCM phase transitiontemperature range. Moreover, Diaconu et al. [27] found experi-mentally that the hysteresis magnitude (defined as the differencebetween the enthalpy values corresponding to the same temper-ature value for cooling and for heating) decreased in the case oftemperature cycling inside the PCM phase transition tempera-ture range and the temperature history influenced the H valuesmaking their prediction impossible in the case of arbitrary tem-perature evolution patterns. To the authors’ knowledge, there isno temperature history dependent model to describe uniquelythe temperature dependence of the PCM thermo-physical prop-erties and especially H–t curve. Bony and Citherlet [33] developeda mathematical model for a storage tank with water and PCMmodules considering the hysteresis-type pattern of the thermo-physical properties variation and sub-cooling effects. However, incontrast to the situation presented here, the PCM water storageconsidered underwent a temperature cycling that swept com-pletely the phase transition temperature range. Other similarstudies exist in which the hysteresis and sub-cooling effects werenot considered (Koschenz and Lehmann [34]).
The enthalpy method was used for modelling the transient heattransfer process instead of the transient heat conduction equationin order to account for the variable specific heat capacity of the PCMwallboards (layers 1 and 2). The transient enthalpy equations forlayers 1 and 2 and the boundary conditions are the following:
Layer 1:
�1dH1
d�= k1
d2t1
dx2(1)
Boundary conditions:x = 0 (outer side of the wall system, convection and radiation):
−k1
(dt1
dx
)x=0
= hext(tamb − t1|x=0) + qrad,extAw (2)
x = ı1 (layer 1 – thermal insulation interface, conservative interfaceheat flux):
−k1
(dt1
dx
)x=ı1
= −k3
(dt2
dx
)x=ı1
(3)
Ignoring the contact thermal resistance between layers 1 and 3:
t1|x=ı1= t3|x=ı1
(4)
Layer 2:
�2dH2
d�= k2
d2t2
dx2(5)
Boundary conditions:x = ı1 + ı3 (interface layer 2 – thermal insulation, conservative
interface heat flux):
−k2
(dt2
dx
)x=ı1+ı3
= −k3
(dt3
dx
)x=ı1+ı3
(6)
Ignoring the contact thermal resistance between layers 2 and 3:
t2|x=ı +ı = t3|x=ı +ı (7)
1 3 1 3x = ı1 + ı2 + ı3 (inner side of the wall system, convection):
−k2
(dt2
dx
)x=ı1+ı2+ı3
= hint( t2|x=ı1+ı2+ı3− ta) + qrad,intAw (8)
B.M. Diaconu, M. Cruceru / Energy and
Fep
B
f
−
xf
−
I
�
w
Q
Q
spbctd
�
B
x
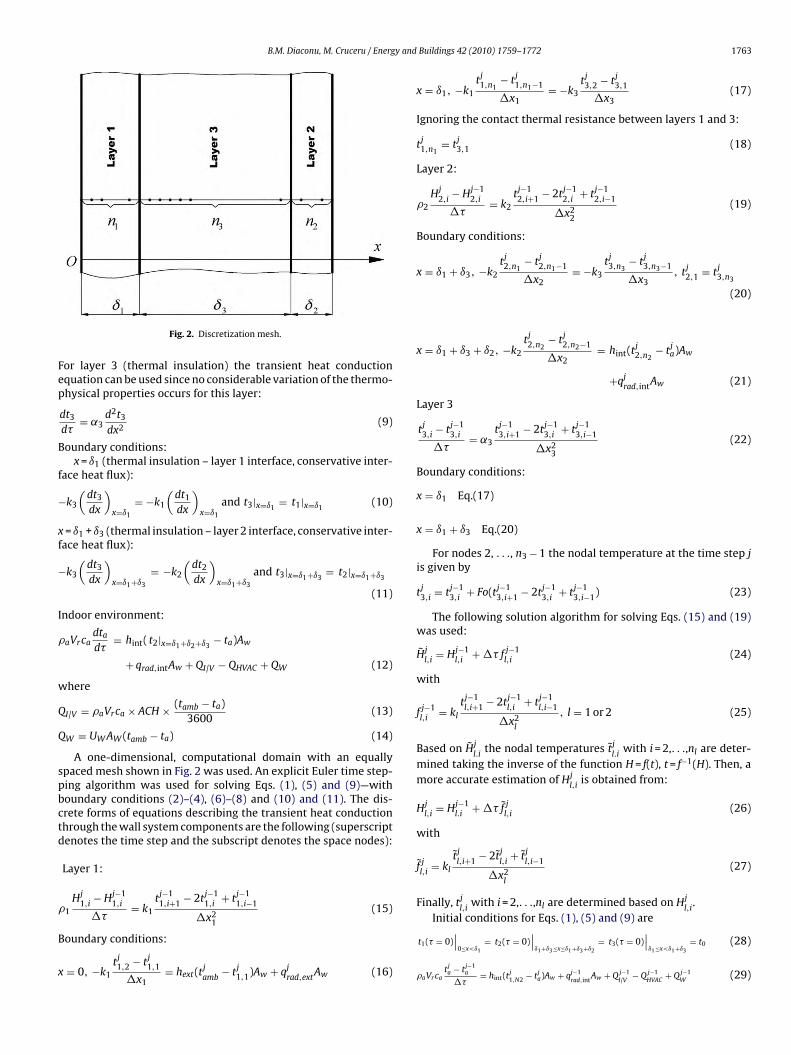
Fig. 2. Discretization mesh.
or layer 3 (thermal insulation) the transient heat conductionquation can be used since no considerable variation of the thermo-hysical properties occurs for this layer:
dt3
d�= ˛3
d2t3
dx2(9)
oundary conditions:x = ı1 (thermal insulation – layer 1 interface, conservative inter-
ace heat flux):
k3
(dt3
dx
)x=ı1
= −k1
(dt1
dx
)x=ı1
and t3|x=ı1= t1|x=ı1
(10)
= ı1 + ı3 (thermal insulation – layer 2 interface, conservative inter-ace heat flux):
k3
(dt3
dx
)x=ı1+ı3
= −k2
(dt2
dx
)x=ı1+ı3
and t3|x=ı1+ı3= t2|x=ı1+ı3
(11)
ndoor environment:
aVrcadta
d�= hint( t2|x=ı1+ı2+ı3
− ta)Aw
+ qrad,intAw + QI/V − QHVAC + QW (12)
here
I/V = �aVrca × ACH × (tamb − ta)3600
(13)
W = UW AW (tamb − ta) (14)
A one-dimensional, computational domain with an equallypaced mesh shown in Fig. 2 was used. An explicit Euler time step-ing algorithm was used for solving Eqs. (1), (5) and (9)—withoundary conditions (2)–(4), (6)–(8) and (10) and (11). The dis-rete forms of equations describing the transient heat conductionhrough the wall system components are the following (superscriptenotes the time step and the subscript denotes the space nodes):
Layer 1:
1
Hj1,i
− Hj−11,i
��= k1
tj−11,i+1 − 2tj−1
1,i+ tj−1
1,i−1
�x2(15)
1
oundary conditions:
= 0, −k1tj1,2 − tj
1,1
�x1= hext(t
jamb
− tj1,1)Aw + qj
rad,extAw (16)
Buildings 42 (2010) 1759–1772 1763
x = ı1, −k1
tj1,n1
− tj1,n1−1
�x1= −k3
tj3,2 − tj
3,1
�x3(17)
Ignoring the contact thermal resistance between layers 1 and 3:
tj1,n1
= tj3,1 (18)
Layer 2:
�2
Hj2,i
− Hj−12,i
��= k2
tj−12,i+1 − 2tj−1
2,i+ tj−1
2,i−1
�x22
(19)
Boundary conditions:
x = ı1 + ı3, −k2
tj2,n1
− tj2,n1−1
�x2= −k3
tj3,n3
− tj3,n3−1
�x3, tj
2,1 = tj3,n3
(20)
x = ı1 + ı3 + ı2, −k2
tj2,n2
− tj2,n2−1
�x2= hint(t
j2,n2
− tja)Aw
+qjrad,intAw (21)
Layer 3
tj3,i
− tj−13,i
��= ˛3
tj−13,i+1 − 2tj−1
3,i+ tj−1
3,i−1
�x23
(22)
Boundary conditions:
x = ı1 Eq.(17)
x = ı1 + ı3 Eq.(20)
For nodes 2, . . ., n3 − 1 the nodal temperature at the time step jis given by
tj3,i
= tj−13,i
+ Fo(tj−13,i+1 − 2tj−1
3,i+ tj−1
3,i−1) (23)
The following solution algorithm for solving Eqs. (15) and (19)was used:
Hjl,i
= Hj−1l,i
+ �� f j−1l,i
(24)
with
f j−1l,i
= kl
tj−1l,i+1 − 2tj−1
l,i+ tj−1
l,i−1
�x2l
, l = 1 or 2 (25)
Based on Hjl.i
the nodal temperatures tjl.i
with i = 2,. . .,nl are deter-mined taking the inverse of the function H = f(t), t = f−1(H). Then, amore accurate estimation of Hj
l,iis obtained from:
Hjl,i
= Hj−1l.i
+ �� f jl,i
(26)
with
f jl,i
= kl
tjl,i+1 − 2tj
l,i+ tj
l,i−1
�x2l
(27)
Finally, tjl,i
with i = 2,. . .,nl are determined based on Hjl,i
.Initial conditions for Eqs. (1), (5) and (9) are
t1(� = 0)∣∣
0≤x<ı1= t2(� = 0)
∣∣ı1+ı3≤x≤ı1+ı3+ı2
= t3(� = 0)∣∣
ı1≤x<ı1+ı3= t0 (28)
�aVr catja − tj−1
a
��= hint(t
j1,N2 − tj
a)Aw + qj−1rad,int
Aw + Q j−1I/V
− Q j−1HVAC
+ Q j−1W
(29)
1764 B.M. Diaconu, M. Cruceru / Energy and Buildings 42 (2010) 1759–1772
pacity profiles used in the simulation.
a
Q
Tl
t
•
•
•
c
e
a
Table 2Main characteristics of the climate considered in simulation.
Parameter Value
Minimum temperature −0.7 ◦C◦
b
Fig. 3. Apparent specific heat ca
The cooling/heating load was calculated from the energy bal-nce equation:
C/H = hint( t2|x=ı1+ı2+ı3− tSET )Aw + �aVrca × ACH × (tamb − tSET )
3600
+ UW AW (tamb − tSET ) + qrad,intAw (30)
he enthalpy of the PCM wallboard is ideally modelled by the fol-owing equation:
Solid phase x = 0:
H(t) =∫ t
tref
cs(� − tref ) d� (31)
with � dummy variable for integrationPhase transition 0 < x < 1:
H(tm, x) =∫ tm
tref
cs(� − tref ) d� + xL (32)
Liquid phase x = 1:
H(t) =∫ tm
tref
cs(� − tref )d� + L +∫ t
tm
clq(t − �) d� (33)
The model for the PCM wallboard used in this paper considershe following:
Constant values of the PCM wallboard material with PCM in liquidand solid phase.The phase transition process occurs within a temperature rangecentred around tm, [tm − �tt,tm + �tt], and not at a single point.The phase transition process is modelled by an increase of theapparent specific heat capacity over the phase transition tem-perature range.
The function c = f(t) used for modelling the phase transition pro-ess is assumed continuous and integrable.
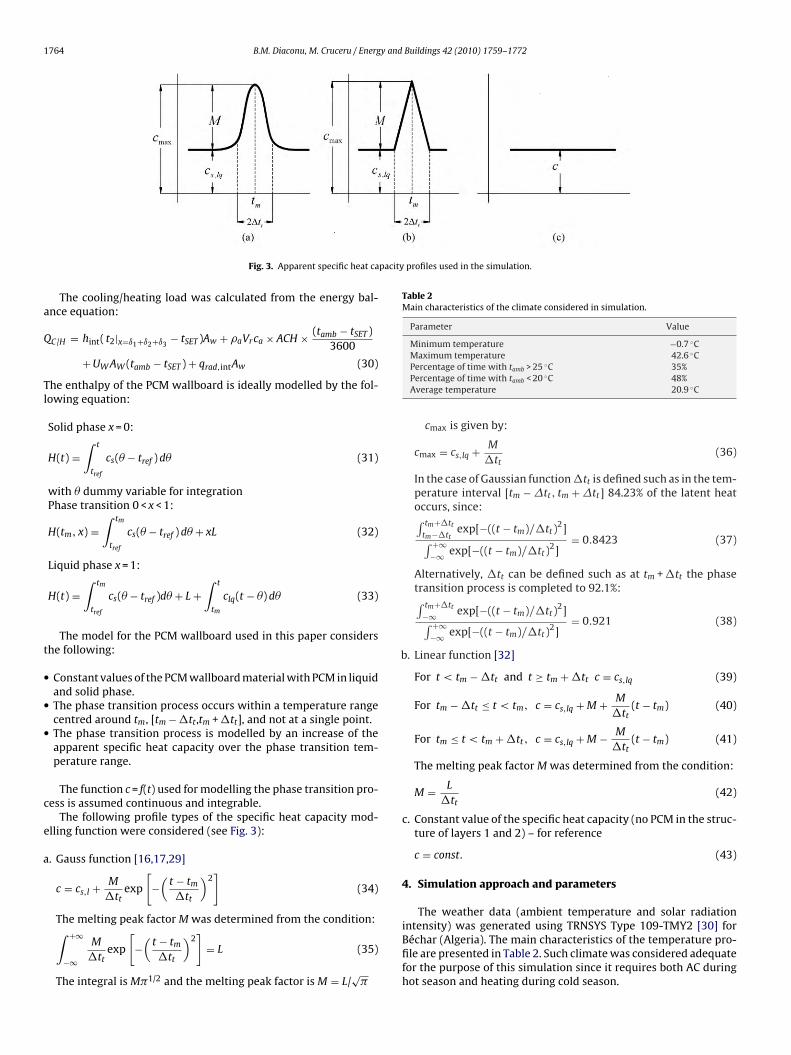
The following profile types of the specific heat capacity mod-lling function were considered (see Fig. 3):
. Gauss function [16,17,29]
c = cs,l + M
�ttexp
[−(
t − tm
�tt
)2]
(34)
The melting peak factor M was determined from the condition:
∫ +∞−∞
M
�ttexp
[−(
t − tm
�tt
)2]
= L (35)
The integral is M�1/2 and the melting peak factor is M = L/√
�
Maximum temperature 42.6 CPercentage of time with tamb > 25 ◦C 35%Percentage of time with tamb < 20 ◦C 48%Average temperature 20.9 ◦C
cmax is given by:
cmax = cs,lq + M
�tt(36)
In the case of Gaussian function �tt is defined such as in the tem-perature interval [tm − �tt, tm + �tt] 84.23% of the latent heatoccurs, since:∫ tm+�tt
tm−�ttexp[−((t − tm)/�tt)
2]∫ +∞−∞ exp[−((t − tm)/�tt)
2]= 0.8423 (37)
Alternatively, �tt can be defined such as at tm + �tt the phasetransition process is completed to 92.1%:∫ tm+�tt
−∞ exp[−((t − tm)/�tt)2]∫ +∞
−∞ exp[−((t − tm)/�tt)2]
= 0.921 (38)
. Linear function [32]
For t < tm − �tt and t ≥ tm + �tt c = cs,lq (39)
For tm − �tt ≤ t < tm, c = cs,lq + M + M
�tt(t − tm) (40)
For tm ≤ t < tm + �tt, c = cs,lq + M − M
�tt(t − tm) (41)
The melting peak factor M was determined from the condition:
M = L
�tt(42)
c. Constant value of the specific heat capacity (no PCM in the struc-ture of layers 1 and 2) – for reference
c = const. (43)
4. Simulation approach and parameters
The weather data (ambient temperature and solar radiation
intensity) was generated using TRNSYS Type 109-TMY2 [30] forBéchar (Algeria). The main characteristics of the temperature pro-file are presented in Table 2. Such climate was considered adequatefor the purpose of this simulation since it requires both AC duringhot season and heating during cold season.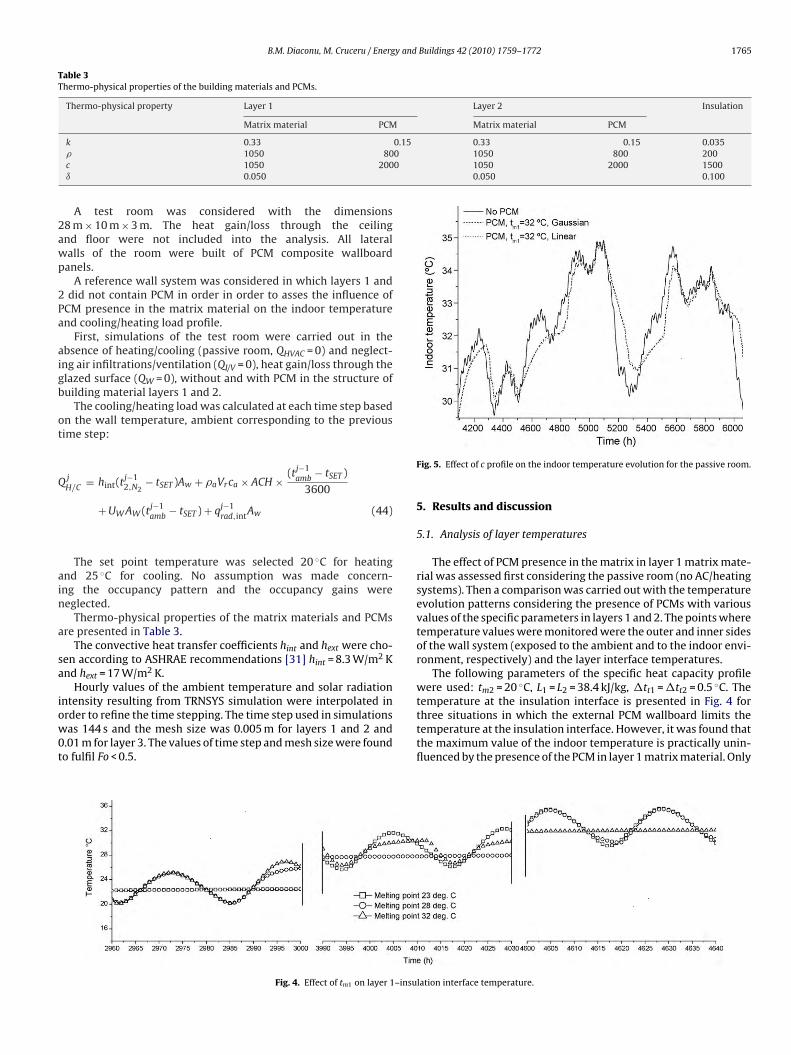
B.M. Diaconu, M. Cruceru / Energy and Buildings 42 (2010) 1759–1772 1765
Table 3Thermo-physical properties of the building materials and PCMs.
Thermo-physical property Layer 1 Layer 2 Insulation
Matrix material PCM Matrix material PCM
0.15 0.33 0.15 0.0350 1050 800 2000 1050 2000 1500
0.050 0.100
2awp
2Pa
aigb
ot
Q
ain
a
sa
iow0t
k 0.33� 1050 80c 1050 200ı 0.050
A test room was considered with the dimensions8 m × 10 m × 3 m. The heat gain/loss through the ceilingnd floor were not included into the analysis. All lateralalls of the room were built of PCM composite wallboardanels.
A reference wall system was considered in which layers 1 anddid not contain PCM in order in order to asses the influence of
CM presence in the matrix material on the indoor temperaturend cooling/heating load profile.
First, simulations of the test room were carried out in thebsence of heating/cooling (passive room, QHVAC = 0) and neglect-ng air infiltrations/ventilation (QI/V = 0), heat gain/loss through thelazed surface (QW = 0), without and with PCM in the structure ofuilding material layers 1 and 2.
The cooling/heating load was calculated at each time step basedn the wall temperature, ambient corresponding to the previousime step:
jH/C
= hint(tj−12,N2
− tSET )Aw + �aVrca × ACH × (tj−1amb
− tSET )
3600
+ UW AW (tj−1amb
− tSET ) + qj−1rad,intAw (44)
The set point temperature was selected 20 ◦C for heatingnd 25 ◦C for cooling. No assumption was made concern-ng the occupancy pattern and the occupancy gains wereeglected.
Thermo-physical properties of the matrix materials and PCMsre presented in Table 3.
The convective heat transfer coefficients hint and hext were cho-en according to ASHRAE recommendations [31] hint = 8.3 W/m2 Knd hext = 17 W/m2 K.
Hourly values of the ambient temperature and solar radiation
ntensity resulting from TRNSYS simulation were interpolated inrder to refine the time stepping. The time step used in simulationsas 144 s and the mesh size was 0.005 m for layers 1 and 2 and.01 m for layer 3. The values of time step and mesh size were foundo fulfil Fo < 0.5.
Fig. 4. Effect of tm1 on layer 1–insu
Fig. 5. Effect of c profile on the indoor temperature evolution for the passive room.
5. Results and discussion
5.1. Analysis of layer temperatures
The effect of PCM presence in the matrix in layer 1 matrix mate-rial was assessed first considering the passive room (no AC/heatingsystems). Then a comparison was carried out with the temperatureevolution patterns considering the presence of PCMs with variousvalues of the specific parameters in layers 1 and 2. The points wheretemperature values were monitored were the outer and inner sidesof the wall system (exposed to the ambient and to the indoor envi-ronment, respectively) and the layer interface temperatures.
The following parameters of the specific heat capacity profilewere used: tm2 = 20 ◦C, L1 = L2 = 38.4 kJ/kg, �tt1 = �tt2 = 0.5 ◦C. Thetemperature at the insulation interface is presented in Fig. 4 for
three situations in which the external PCM wallboard limits thetemperature at the insulation interface. However, it was found thatthe maximum value of the indoor temperature is practically unin-fluenced by the presence of the PCM in layer 1 matrix material. Onlylation interface temperature.
1766 B.M. Diaconu, M. Cruceru / Energy and Buildings 42 (2010) 1759–1772
tpwei
icPshctpwFtricecd
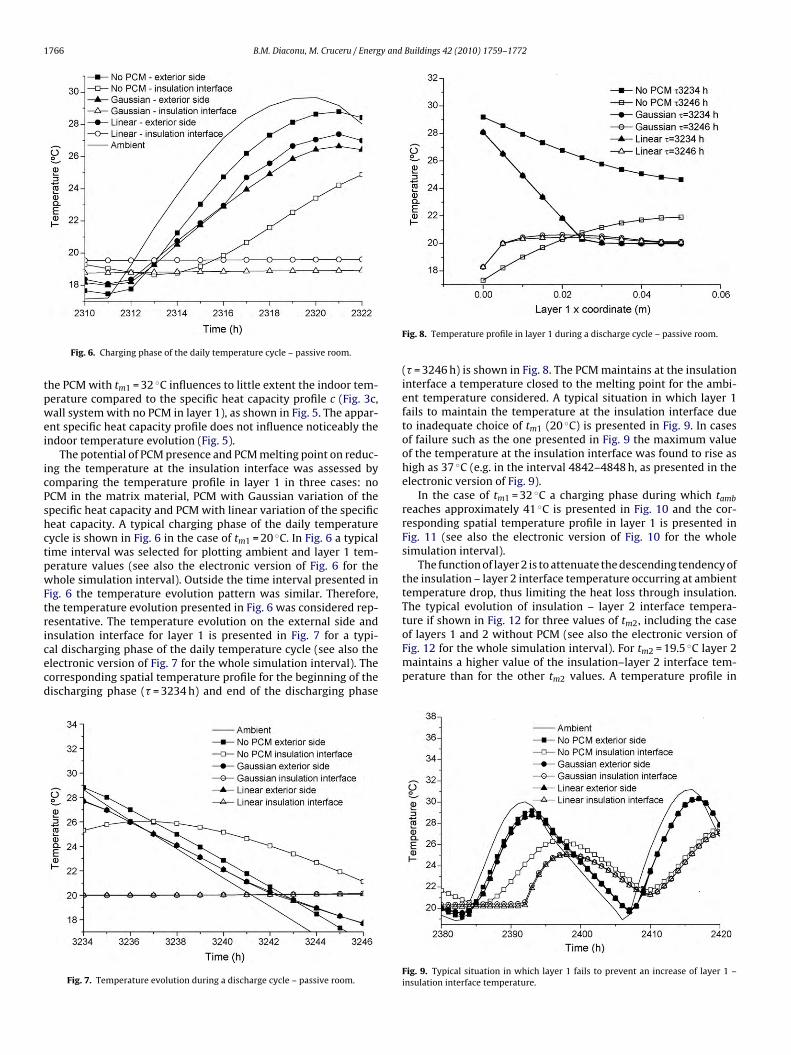
Fig. 6. Charging phase of the daily temperature cycle – passive room.
he PCM with tm1 = 32 ◦C influences to little extent the indoor tem-erature compared to the specific heat capacity profile c (Fig. 3c,all system with no PCM in layer 1), as shown in Fig. 5. The appar-
nt specific heat capacity profile does not influence noticeably thendoor temperature evolution (Fig. 5).
The potential of PCM presence and PCM melting point on reduc-ng the temperature at the insulation interface was assessed byomparing the temperature profile in layer 1 in three cases: noCM in the matrix material, PCM with Gaussian variation of thepecific heat capacity and PCM with linear variation of the specificeat capacity. A typical charging phase of the daily temperatureycle is shown in Fig. 6 in the case of tm1 = 20 ◦C. In Fig. 6 a typicalime interval was selected for plotting ambient and layer 1 tem-erature values (see also the electronic version of Fig. 6 for thehole simulation interval). Outside the time interval presented in
ig. 6 the temperature evolution pattern was similar. Therefore,he temperature evolution presented in Fig. 6 was considered rep-esentative. The temperature evolution on the external side and
nsulation interface for layer 1 is presented in Fig. 7 for a typi-al discharging phase of the daily temperature cycle (see also thelectronic version of Fig. 7 for the whole simulation interval). Theorresponding spatial temperature profile for the beginning of theischarging phase (� = 3234 h) and end of the discharging phaseFig. 7. Temperature evolution during a discharge cycle – passive room.
Fig. 8. Temperature profile in layer 1 during a discharge cycle – passive room.
(� = 3246 h) is shown in Fig. 8. The PCM maintains at the insulationinterface a temperature closed to the melting point for the ambi-ent temperature considered. A typical situation in which layer 1fails to maintain the temperature at the insulation interface dueto inadequate choice of tm1 (20 ◦C) is presented in Fig. 9. In casesof failure such as the one presented in Fig. 9 the maximum valueof the temperature at the insulation interface was found to rise ashigh as 37 ◦C (e.g. in the interval 4842–4848 h, as presented in theelectronic version of Fig. 9).
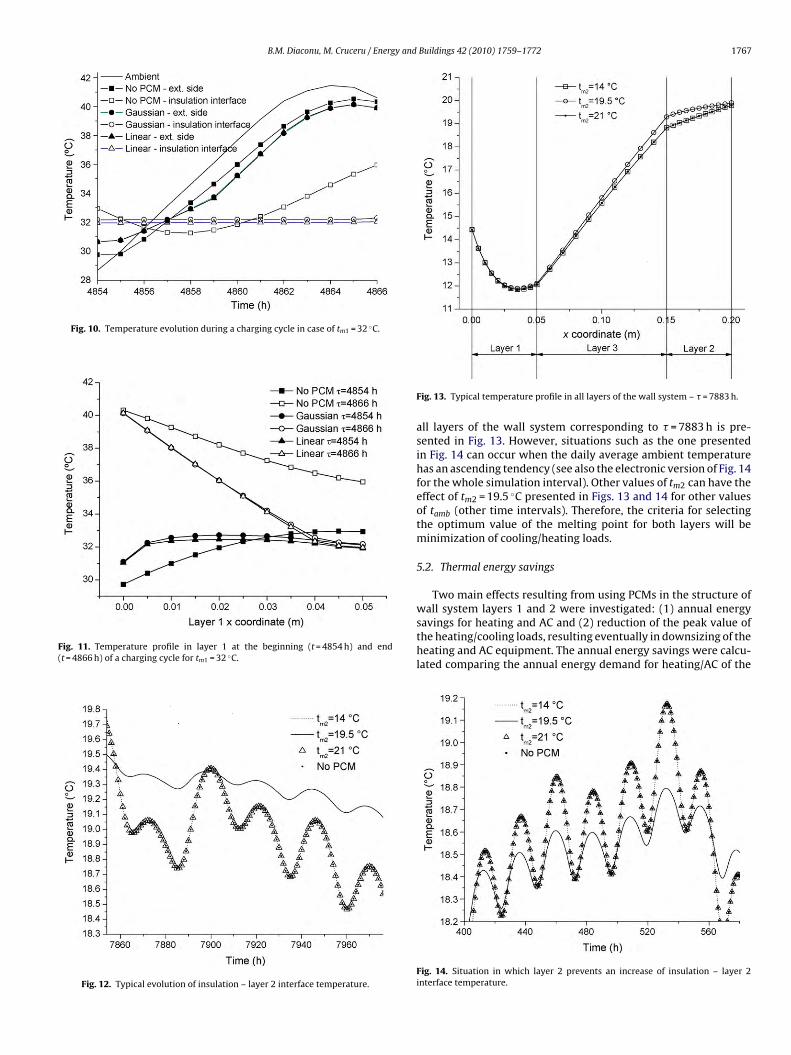
In the case of tm1 = 32 ◦C a charging phase during which tambreaches approximately 41 ◦C is presented in Fig. 10 and the cor-responding spatial temperature profile in layer 1 is presented inFig. 11 (see also the electronic version of Fig. 10 for the wholesimulation interval).
The function of layer 2 is to attenuate the descending tendency ofthe insulation – layer 2 interface temperature occurring at ambienttemperature drop, thus limiting the heat loss through insulation.The typical evolution of insulation – layer 2 interface tempera-ture if shown in Fig. 12 for three values of tm2, including the case
of layers 1 and 2 without PCM (see also the electronic version ofFig. 12 for the whole simulation interval). For tm2 = 19.5 ◦C layer 2maintains a higher value of the insulation–layer 2 interface tem-perature than for the other tm2 values. A temperature profile inFig. 9. Typical situation in which layer 1 fails to prevent an increase of layer 1 –insulation interface temperature.
B.M. Diaconu, M. Cruceru / Energy and Buildings 42 (2010) 1759–1772 1767
Fig. 10. Temperature evolution during a charging cycle in case of tm1 = 32 ◦C.
Fig. 11. Temperature profile in layer 1 at the beginning (t = 4854 h) and end(t = 4866 h) of a charging cycle for tm1 = 32 ◦C.
Fig. 12. Typical evolution of insulation – layer 2 interface temperature.
Fig. 13. Typical temperature profile in all layers of the wall system – � = 7883 h.
all layers of the wall system corresponding to � = 7883 h is pre-sented in Fig. 13. However, situations such as the one presentedin Fig. 14 can occur when the daily average ambient temperaturehas an ascending tendency (see also the electronic version of Fig. 14for the whole simulation interval). Other values of tm2 can have theeffect of tm2 = 19.5 ◦C presented in Figs. 13 and 14 for other valuesof tamb (other time intervals). Therefore, the criteria for selectingthe optimum value of the melting point for both layers will beminimization of cooling/heating loads.
5.2. Thermal energy savings
Two main effects resulting from using PCMs in the structure of
wall system layers 1 and 2 were investigated: (1) annual energysavings for heating and AC and (2) reduction of the peak value ofthe heating/cooling loads, resulting eventually in downsizing of theheating and AC equipment. The annual energy savings were calcu-lated comparing the annual energy demand for heating/AC of theFig. 14. Situation in which layer 2 prevents an increase of insulation – layer 2interface temperature.
1768 B.M. Diaconu, M. Cruceru / Energy and Buildings 42 (2010) 1759–1772
Fig. 15. Cooling load profile: (a) wall system without PCMs; (b) tm1 = 24.5 ◦C; (c) tm1 = 33.2 ◦C.
) and
re1w
AM walC,ann
M
T
P
Fig. 16. Effect of tm1 on QC,annual (a
oom without PCMs in the layers 1 and 2 structure with the annualnergy demand for heating/AC of the room with PCMs in the layersand 2 structure. The relative value of the energy savings valueas calculated with:
nnual energy savings for heating/AC =Q Wallboards without PCM
H/C,annual− Q PC
H/
Q Wallboards without PCH/C,annual
he relative value of the peak load reduction was calculated with:
eak load reduction =max(Q Wallboards without PCM
H/C) − max(Q PCM wallboards
H/C)
max(Q Wallboards without PCMH/C
)
peak value of the cooling load (b).
lboardsual × 100
The annual energy savings and the peak load reduction are pre-sented in Table 7.
The influence of the PCMs characteristics (especially tm,l) wasassessed, varying the values of tm,l, Ll and �tt,l (l = 1, 2).
× 100
B.M. Diaconu, M. Cruceru / Energy and Buildings 42 (2010) 1759–1772 1769
er interfaces: (a) tm1 = 24.5 ◦C and the corresponding cooling load (b).
5
b
Q
aFs
of
wil(
mitQ
tl
Table 4Influence of c profile and �tt on the values of QC,annual .
Layer 2 Layer 1 Qc,annual (kWh)
c profile �tt c profile �tt (◦C) tm1 = 24.5 ◦C tm1 = 33.5 ◦C
Gaussian 2 Gaussian 0.50 917.7 928.12 1.75 919.8 928.22 3.00 921.1 928.1
Fig. 17. Typical evolution of temperature on wall sides and lay
.2.1. Cooling loadThe annual energy demand for air conditioning was calculated
y integrating the cooling load values over the cooling season:
C,annual =∫
cooling season
QCd� (45)
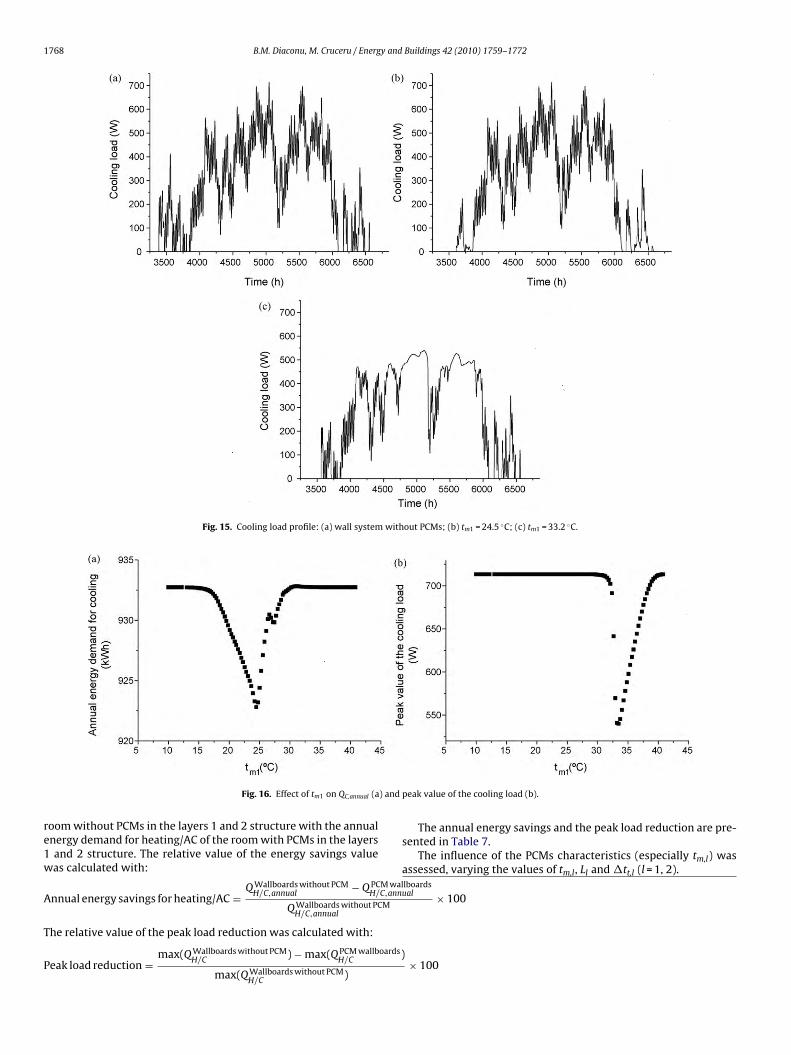
The cooling load corresponding to the wall system without PCMnd neglecting radiative exchange and air infiltration is shown inig. 15a (see also the electronic version of Fig. 15 for the wholeimulation interval)
The annual energy demand for AC was found to be dependentn tm1 as shown in Fig. 16a, where QC,annual was plotted against tm1or L1 = L2 = 57.3 kJ/kg ([32], paraffin) and �tt1 = �tt2 = 0.5 ◦C.
The tm1 value for which QC,annual reached its minimum valueas approximately 24.5 ◦C (Fig. 15a). However, layer 1 incorporat-
ng PCM with tm1 = 24.5 ◦C does not flatten significantly the coolingoad profile (Fig. 15b) compared to the wall system without PCMsFig. 15a).
tm1 value for which the peak value of QC reached a mini-um (approximately 540 W) was approximately 33.2 ◦C as shown
n Fig. 16b. The cooling load profile is shown in Fig. 15c for◦
m1 = 33.2 C. The influence of c profile and �tt on the values ofC,annual is resumed in Table 4.
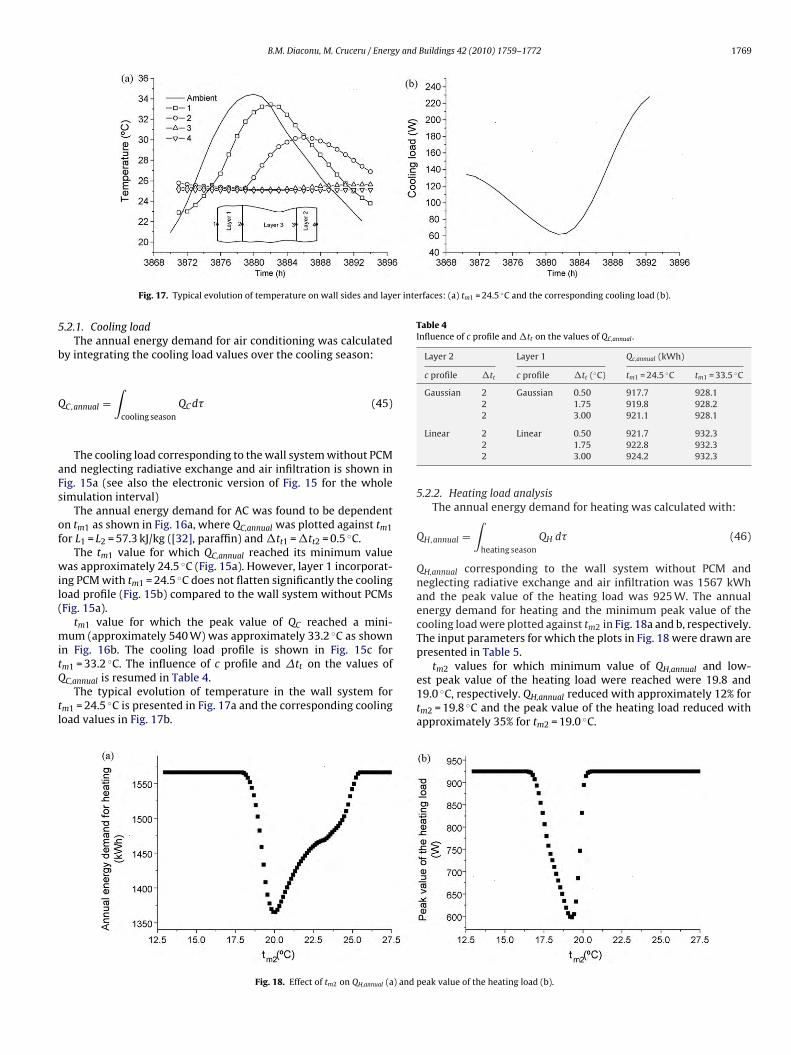
The typical evolution of temperature in the wall system form1 = 24.5 ◦C is presented in Fig. 17a and the corresponding coolingoad values in Fig. 17b.
Fig. 18. Effect of tm2 on QH,annual (a) and
Linear 2 Linear 0.50 921.7 932.32 1.75 922.8 932.32 3.00 924.2 932.3
5.2.2. Heating load analysisThe annual energy demand for heating was calculated with:
QH,annual =∫
heating season
QH d� (46)
QH,annual corresponding to the wall system without PCM andneglecting radiative exchange and air infiltration was 1567 kWhand the peak value of the heating load was 925 W. The annualenergy demand for heating and the minimum peak value of thecooling load were plotted against tm2 in Fig. 18a and b, respectively.The input parameters for which the plots in Fig. 18 were drawn arepresented in Table 5.
tm2 values for which minimum value of QH,annual and low-est peak value of the heating load were reached were 19.8 and19.0 ◦C, respectively. QH,annual reduced with approximately 12% fortm2 = 19.8 ◦C and the peak value of the heating load reduced withapproximately 35% for tm2 = 19.0 ◦C.
peak value of the heating load (b).
1770 B.M. Diaconu, M. Cruceru / Energy and Buildings 42 (2010) 1759–1772
Table 5Layers 1 and 2 parameters for plots in Fig. 18.
Parameter Layer 1 Layer 2
L (kJ/kg) 57.3 57.3�tt (◦C) 0.5 0.5c profile Gaussian Gaussiantm 24.5 Variable
F
Pps
ablise
Table 7Maximum values of energy savings and peak load reduction and the correspondingmelting point values.
AC [%] Heating [%]
TT
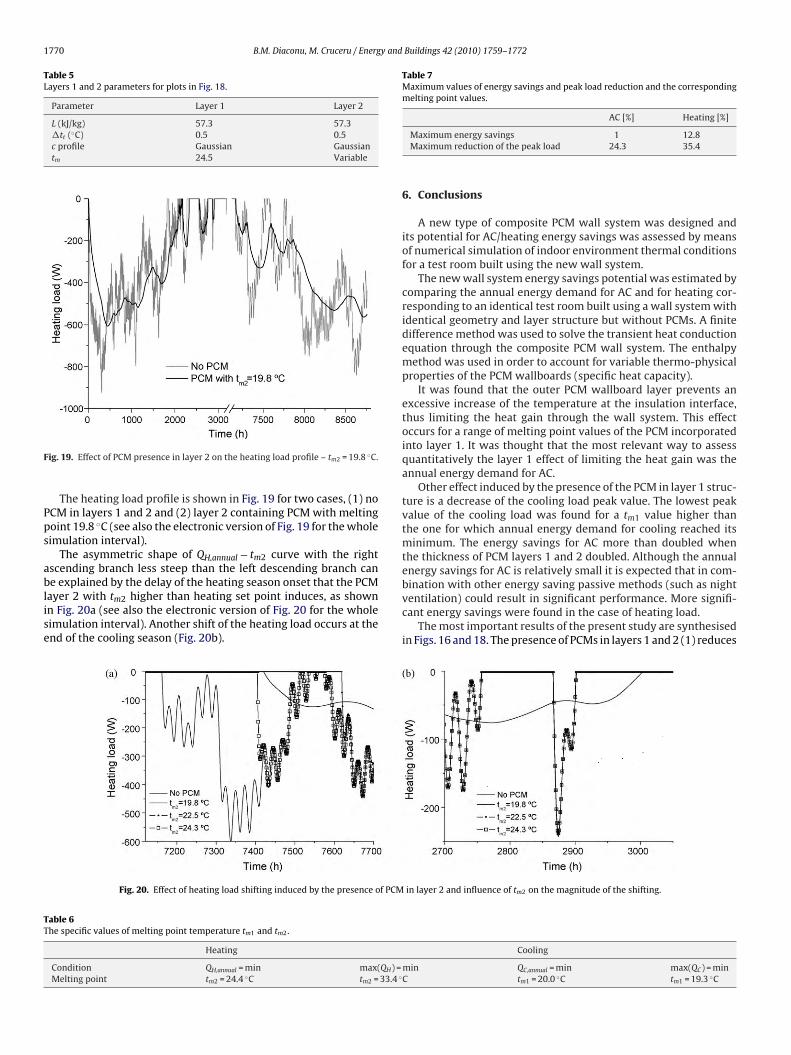
ig. 19. Effect of PCM presence in layer 2 on the heating load profile – tm2 = 19.8 ◦C.
The heating load profile is shown in Fig. 19 for two cases, (1) noCM in layers 1 and 2 and (2) layer 2 containing PCM with meltingoint 19.8 ◦C (see also the electronic version of Fig. 19 for the wholeimulation interval).
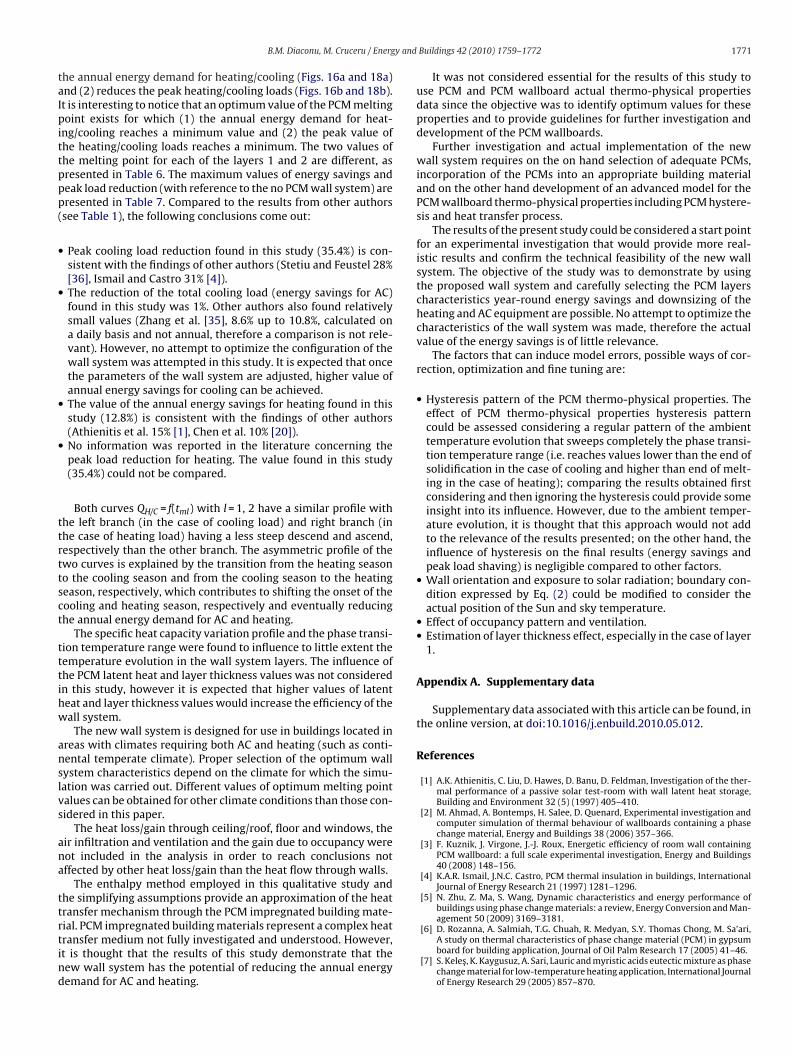
The asymmetric shape of QH,annual − tm2 curve with the rightscending branch less steep than the left descending branch cane explained by the delay of the heating season onset that the PCM
ayer 2 with t higher than heating set point induces, as shown
m2n Fig. 20a (see also the electronic version of Fig. 20 for the wholeimulation interval). Another shift of the heating load occurs at thend of the cooling season (Fig. 20b).Fig. 20. Effect of heating load shifting induced by the presence of PCM
able 6he specific values of melting point temperature tm1 and tm2.
Heating
Condition QH,annual = min max(QH) =Melting point tm2 = 24.4 ◦C tm2 = 33.4 ◦
Maximum energy savings 1 12.8Maximum reduction of the peak load 24.3 35.4
6. Conclusions
A new type of composite PCM wall system was designed andits potential for AC/heating energy savings was assessed by meansof numerical simulation of indoor environment thermal conditionsfor a test room built using the new wall system.
The new wall system energy savings potential was estimated bycomparing the annual energy demand for AC and for heating cor-responding to an identical test room built using a wall system withidentical geometry and layer structure but without PCMs. A finitedifference method was used to solve the transient heat conductionequation through the composite PCM wall system. The enthalpymethod was used in order to account for variable thermo-physicalproperties of the PCM wallboards (specific heat capacity).
It was found that the outer PCM wallboard layer prevents anexcessive increase of the temperature at the insulation interface,thus limiting the heat gain through the wall system. This effectoccurs for a range of melting point values of the PCM incorporatedinto layer 1. It was thought that the most relevant way to assessquantitatively the layer 1 effect of limiting the heat gain was theannual energy demand for AC.
Other effect induced by the presence of the PCM in layer 1 struc-ture is a decrease of the cooling load peak value. The lowest peakvalue of the cooling load was found for a tm1 value higher thanthe one for which annual energy demand for cooling reached itsminimum. The energy savings for AC more than doubled whenthe thickness of PCM layers 1 and 2 doubled. Although the annualenergy savings for AC is relatively small it is expected that in com-bination with other energy saving passive methods (such as night
ventilation) could result in significant performance. More signifi-cant energy savings were found in the case of heating load.The most important results of the present study are synthesisedin Figs. 16 and 18. The presence of PCMs in layers 1 and 2 (1) reduces
in layer 2 and influence of tm2 on the magnitude of the shifting.
Cooling
min QC,annual = min max(QC) = minC tm1 = 20.0 ◦C tm1 = 19.3 ◦C
y and
taIpittppp(
•
•
•
•
ttrttsct
tttihw
anslvs
ana
ttrtind
B.M. Diaconu, M. Cruceru / Energ
he annual energy demand for heating/cooling (Figs. 16a and 18a)nd (2) reduces the peak heating/cooling loads (Figs. 16b and 18b).t is interesting to notice that an optimum value of the PCM meltingoint exists for which (1) the annual energy demand for heat-
ng/cooling reaches a minimum value and (2) the peak value ofhe heating/cooling loads reaches a minimum. The two values ofhe melting point for each of the layers 1 and 2 are different, asresented in Table 6. The maximum values of energy savings andeak load reduction (with reference to the no PCM wall system) areresented in Table 7. Compared to the results from other authorssee Table 1), the following conclusions come out:
Peak cooling load reduction found in this study (35.4%) is con-sistent with the findings of other authors (Stetiu and Feustel 28%[36], Ismail and Castro 31% [4]).The reduction of the total cooling load (energy savings for AC)found in this study was 1%. Other authors also found relativelysmall values (Zhang et al. [35], 8.6% up to 10.8%, calculated ona daily basis and not annual, therefore a comparison is not rele-vant). However, no attempt to optimize the configuration of thewall system was attempted in this study. It is expected that oncethe parameters of the wall system are adjusted, higher value ofannual energy savings for cooling can be achieved.The value of the annual energy savings for heating found in thisstudy (12.8%) is consistent with the findings of other authors(Athienitis et al. 15% [1], Chen et al. 10% [20]).No information was reported in the literature concerning thepeak load reduction for heating. The value found in this study(35.4%) could not be compared.
Both curves QH/C = f(tml) with l = 1, 2 have a similar profile withhe left branch (in the case of cooling load) and right branch (inhe case of heating load) having a less steep descend and ascend,espectively than the other branch. The asymmetric profile of thewo curves is explained by the transition from the heating seasono the cooling season and from the cooling season to the heatingeason, respectively, which contributes to shifting the onset of theooling and heating season, respectively and eventually reducinghe annual energy demand for AC and heating.
The specific heat capacity variation profile and the phase transi-ion temperature range were found to influence to little extent theemperature evolution in the wall system layers. The influence ofhe PCM latent heat and layer thickness values was not consideredn this study, however it is expected that higher values of latenteat and layer thickness values would increase the efficiency of theall system.
The new wall system is designed for use in buildings located inreas with climates requiring both AC and heating (such as conti-ental temperate climate). Proper selection of the optimum wallystem characteristics depend on the climate for which the simu-ation was carried out. Different values of optimum melting pointalues can be obtained for other climate conditions than those con-idered in this paper.
The heat loss/gain through ceiling/roof, floor and windows, their infiltration and ventilation and the gain due to occupancy wereot included in the analysis in order to reach conclusions notffected by other heat loss/gain than the heat flow through walls.
The enthalpy method employed in this qualitative study andhe simplifying assumptions provide an approximation of the heatransfer mechanism through the PCM impregnated building mate-
ial. PCM impregnated building materials represent a complex heatransfer medium not fully investigated and understood. However,t is thought that the results of this study demonstrate that theew wall system has the potential of reducing the annual energyemand for AC and heating.Buildings 42 (2010) 1759–1772 1771
It was not considered essential for the results of this study touse PCM and PCM wallboard actual thermo-physical propertiesdata since the objective was to identify optimum values for theseproperties and to provide guidelines for further investigation anddevelopment of the PCM wallboards.
Further investigation and actual implementation of the newwall system requires on the on hand selection of adequate PCMs,incorporation of the PCMs into an appropriate building materialand on the other hand development of an advanced model for thePCM wallboard thermo-physical properties including PCM hystere-sis and heat transfer process.
The results of the present study could be considered a start pointfor an experimental investigation that would provide more real-istic results and confirm the technical feasibility of the new wallsystem. The objective of the study was to demonstrate by usingthe proposed wall system and carefully selecting the PCM layerscharacteristics year-round energy savings and downsizing of theheating and AC equipment are possible. No attempt to optimize thecharacteristics of the wall system was made, therefore the actualvalue of the energy savings is of little relevance.
The factors that can induce model errors, possible ways of cor-rection, optimization and fine tuning are:
• Hysteresis pattern of the PCM thermo-physical properties. Theeffect of PCM thermo-physical properties hysteresis patterncould be assessed considering a regular pattern of the ambienttemperature evolution that sweeps completely the phase transi-tion temperature range (i.e. reaches values lower than the end ofsolidification in the case of cooling and higher than end of melt-ing in the case of heating); comparing the results obtained firstconsidering and then ignoring the hysteresis could provide someinsight into its influence. However, due to the ambient temper-ature evolution, it is thought that this approach would not addto the relevance of the results presented; on the other hand, theinfluence of hysteresis on the final results (energy savings andpeak load shaving) is negligible compared to other factors.
• Wall orientation and exposure to solar radiation; boundary con-dition expressed by Eq. (2) could be modified to consider theactual position of the Sun and sky temperature.
• Effect of occupancy pattern and ventilation.• Estimation of layer thickness effect, especially in the case of layer
1.
Appendix A. Supplementary data
Supplementary data associated with this article can be found, inthe online version, at doi:10.1016/j.enbuild.2010.05.012.
References
[1] A.K. Athienitis, C. Liu, D. Hawes, D. Banu, D. Feldman, Investigation of the ther-mal performance of a passive solar test-room with wall latent heat storage,Building and Environment 32 (5) (1997) 405–410.
[2] M. Ahmad, A. Bontemps, H. Salee, D. Quenard, Experimental investigation andcomputer simulation of thermal behaviour of wallboards containing a phasechange material, Energy and Buildings 38 (2006) 357–366.
[3] F. Kuznik, J. Virgone, J.-J. Roux, Energetic efficiency of room wall containingPCM wallboard: a full scale experimental investigation, Energy and Buildings40 (2008) 148–156.
[4] K.A.R. Ismail, J.N.C. Castro, PCM thermal insulation in buildings, InternationalJournal of Energy Research 21 (1997) 1281–1296.
[5] N. Zhu, Z. Ma, S. Wang, Dynamic characteristics and energy performance ofbuildings using phase change materials: a review, Energy Conversion and Man-agement 50 (2009) 3169–3181.
[6] D. Rozanna, A. Salmiah, T.G. Chuah, R. Medyan, S.Y. Thomas Chong, M. Sa’ari,A study on thermal characteristics of phase change material (PCM) in gypsumboard for building application, Journal of Oil Palm Research 17 (2005) 41–46.
[7] S. Keles, K. Kaygusuz, A. Sari, Lauric and myristic acids eutectic mixture as phasechange material for low-temperature heating application, International Journalof Energy Research 29 (2005) 857–870.
1 y and
[
[
[
[
[
[
[
[
[
[
[
[
[
[
[
[
[
[
[
[
[[[
[
[
[
[
[
772 B.M. Diaconu, M. Cruceru / Energ
[8] L. Shilei, Z. Neng, F. Guohui, Eutectic mixtures of capric acid and lauric acidapplied in building wallboards for heat energy storage, Energy and Buildings38 (2006) 708–711.
[9] A. Sari, A. Karaipekli, K. Kaygusuz, Capric acid and stearic acid mixture impreg-nated with gypsum wallboard for low-temperature latent heat thermal energystorage, International Journal of Energy Research 32 (2008) 154–160.
10] A.M. Khudhair, M.M. Farid, A review on energy conservation in building applica-tion with thermal storage by latent heat using phase change materials, EnergyConversion and Management 45 (2004) 263–275.
11] D. Feldman, D. Banu, D.W. Hawes, Development and application of organicphase change mixtures in thermal storage gypsum wallboard, Solar EnergyMaterials and Solar Cells 36 (1995) 147–157.
12] L. Shilei, F. Guohui, Z. Neng, D. Li, Experimental study and evaluation of latentheat storage in phase change materials wallboards, Energy and Buildings 39(2007) 1088–1091.
13] D. Feldman, D. Banu, DSC analysis for the evaluation of an energy storing wall-board, Thermochimica Acta 272 (1996) 243–251.
14] D. Zhang, Z. Li, J. Zhou, K. Wu, Development of thermal energy storage concrete,Cement and Concrete Research 34 (2004) 927–934.
15] P. Shossig, H.-M. Henning, S. Gschwander, T. Haussmann, Micro-encapsulatedphase-change materials integrated into construction materials, Solar EnergyMaterials & Solar Cells 89 (2005) 297–306.
16] K. Darkwa, P.W. O’Callaghan, Simulation of phase change drywalls in a passivesolar building, Applied Thermal Engineering 26 (2006).
17] D.A. Neeper, Thermal dynamics of wallboard with latent heat storage, SolarEnergy 68 (5) (2000) 393–403.
18] X. Xu, Y. Zhang, K. Lin, H. Di, R. Yang, Modeling and simulation on the thermalperformance of shape-stabilized phase change material floor used in passivesolar buildings, Energy and Buildings 37 (2005) 1084–1091.
19] A. Pasupathy, R. Velraj, Effect of double layer phase change material in build-ing roof for year round thermal management, Energy and Buildings 40 (2008)193–203.
20] C. Chen, H. Guo, Y. Liu, H. Yue, C. Wang, A new kind of phase change material(PCM) for energy-storing wallboard, Energy and Buildings 40 (2008) 882–890.
21] G. Zhou, Y. Zhang, X. Wang, K. Lin, W. Xiao, An assessment of mixed type PCM-gypsum and shape-stabilized PCM plates in a building for passive solar heating,Solar Energy 81 (2007) 1351–1360.
22] F. Kuznik, J. Virgone, Experimental investigation of wallboard containing phasechange material: data for validation of numerical modelling, Energy and Build-ings 41 (2009) 561–570.
23] M. Ahmad, A. Bontemps, H. Sallée, D. Quenard, Thermal testing and numericalsimulation of a prototype cell using light wallboards coupling vacuum isolationpanels and phase change material, Energy and Buildings 38 (2006) 673–681.
[
[
Buildings 42 (2010) 1759–1772
24] C.K. Halford, R.F. Boehm, Modeling of phase change material peak load shifting,Energy and Buildings 39 (2007) 298–305.
25] K. Darkwa, Evaluation of regenerative phase change drywalls: low-energybuildings application, International Journal of Energy Research 23 (1999)1205–1212.
26] A. Carbonari, M. De Grassi, C. Di Perna, P. Principi, Numerical, experimentalanalyses of PCM containing sandwich panels for prefabricated walls, Energyand Buildings 38 (2006) 472–483.
27] B.M. Diaconu, S. Varga, A.C. Oliveira, Experimental assessment of heatstorage properties and heat transfer characteristics of a phase change mate-rial slurry for air conditioning application, Applied Energy 87 (2) (2010)620–628.
28] C. Arkar, S. Medved, Influence of accuracy of thermal property data of a phasechange material on the result of a numerical model of a packed bed latent heatstorage with spheres, Thermochimica Acta 438 (2005) 192–201.
29] J.-S. Kim, K. Darkwa, Simulation of an integrated PCM-wallboard system, Inter-national Journal of Energy Research 27 (2003) 215–223.
30] http://www.trnsys.com/.31] F. Kreith (Ed.), Mechanical Engineering Handbook, CRC Press, 1999.32] J.P. Barbour, D.C. Hittle, Modeling phase change materials with conduction
transfer functions for passive solar applications, ASME Transactions 128 (2006)58–68.
33] J. Bony, S. Citherlet, Numerical model and experimental validation of heatstorage with phase change materials, Energy and Buildings 39 (2007)1065–1072.
34] M. Koschenz, B. Lehmann, Development of a thermally activated ceiling panelwith PCM for application in lightweight and retrofitted buildings, Energy andBuildings 36 (2004) 567–578.
35] M. Zhang, M.A. Medina, J.B. King, Development of a thermally enhanced framewall with phase change materials for on-peak air conditioning demand reduc-tion and energy savings in residential buildings, International Journal of EnergyResearch 29 (2005) 795–809.
36] C. Stetiu, H.E. Feustel, Phase-Change Wallboard and Mechanical Night Venti-lation in Commercial Buildings, Lawrence Berkeley National Laboratory, 1998,http://epb.lbl.gov/thermal/.
37] J. Kosny, D. Yarbrough, W. Miller, T. Petrie, P. Childs, A.M. Syed, D. Leuthold,PCM-Enhanced Building Envelopes in Current ORNL Research Projects, Oak
Ridge National Laboratory, 2007, http://www.ornl.gov/sci/.index.shtml/.38] K. Peippo, P. Kauranen, P.D. Lund, A multicomponent PCM wall optimized forpassive solar heating, Energy and Buildings 17 (1991) 259–270.
39] Z. Hammou, M. Lacroix, A new PCM storage system for managing simul-taneously solar and electric energy, Energy and Buildings 38 (2006)258–265.