2 Wind Turbines Theory -The Betz Equation and Optimal Rotor Tip Speed Ratio
Upload
independentCategory
view
3download
0
For permission to copy or republish, contact the American Institute of Aeronautics and Astronautics1801 Alexander Bell Drive, Suite 500, Reston, VA 20191-4344
AIAA 2001-2148
A Novel Approach for Reducing RotorTip-Clearance Induced Noise In TurbofanEngines
Mehdi R. KhorramiFei LiHigh Technology Corporation28 Research DriveHampton, VA 23666
Meelan ChoudhariNASA Langley Research CenterHampton, VA 23681-2199
7th AIAA/CEAS AeroacousticsConference
28--30 May, 2001, Maastricht, Netherlands

AIAA-2001-2148
1
A Novel Approach for Reducing Rotor Tip-Clearance Induced Noise in Turbofan Engines
Mehdi R. Khorrami* and Fei Li**
High Technology Corporation Hampton, VA 23666
Meelan Choudhari†
NASA Langley Research Center Hampton, VA 23681
*Senior Scientist; currently Research Scientist, Computational Modeling and Simulation Branch, NASA Langley Research Center, Hampton, VA 23681-2199. Senior Member AIAA **Senior Scientist †Research Scientist. Senior Member AIAA Copyright© 2001 by High Technology Corporation. Published by the American Institute of Aeronautics & Astronautics, with permission.
Abstract
Rotor tip-clearance induced noise, both in the form of rotor self noise and rotor-stator interaction noise, constitutes a significant component of total fan noise. Innovative yet cost effective techniques to suppress rotor-generated noise are, therefore, of foremost importance for improving the noise signature of turbofan engines. To that end, the feasibility of a passive porous treatment strategy to positively modify the tip-clearance flow field is addressed. The present study is focused on accurate viscous flow calculations of the baseline and the treated rotor flow fields. Detailed comparison between the computed baseline solution and experimental measurements shows excellent agreement. Tip-vortex structure, trajectory, strength, and other relevant aerodynamic quantities are extracted from the computed database. Extensive comparison between the untreated and treated tip-clearance flow fields is performed. The effectiveness of the porous treatment for altering the rotor-tip vortex flow field in general and reducing the intensity of the tip vortex, in particular, is demonstrated. In addition, the simulated flow field for the treated tip clearly shows that substantial reduction in the intensity of both the shear layer roll-up and boundary layer separation on the wall is achieved.
1 Introduction
1.1 Significance of the Fan Noise Problem
Communities near airports are often exposed to high noise levels due to low flying aircraft in the takeoff or landing phase of flight. Propulsion noise is a major contributor to the overall radiated sound field. Each
engine component, such as fan, turbine, and compressor, can produce significant levels of both tonal and broadband noise. With the advent of modern high-bypass-ratio turbofan engines, however, the most prominent noise sources are associated with the fan. These sources include rotor leading edge shocks, inflow disturbances/rotor interaction, rotor-wake/stator interaction, and tip-clearance vortex/stator interaction. Recently, the tip-clearance vortex has been identified as a significant contributor to rotor noise (Ganz et al.1). Unfortunately, control and reduction of noise generated by the rotor-tip flow field has not received the full attention it deserves, primarily due to a lack of physical understanding and the geometrical and flow complexities involved. Presently, there is little information available in open literature with regard to effective mitigation and prevention of tip-leakage induced noise generation.
Experimental measurements by Suder and Celestina,2 Hah et al.,3 Kameier and Neise,4 Devenport and Ragab5 have produced a reasonably detailed picture of the flow field in the vicinity of a rotor tip. By documenting various stages of the tip vortex formation—the strength, path and trajectory of the vortex—and regions of significant pressure and velocity fluctuations, these measurements have shed new light on possible noise sources associated with the tip-clearance vortex. Yet, there is no available technique for effective suppression of these noise sources via alteration of the unsteady turbulent flow field over the rotor tips.
To facilitate future growth in air transportation while ensuring compliance with increasingly stringent noise regulations, urgent attention to noise reduction and prediction technologies is required. The current research effort presents a potentially effective yet cost-
AIAA-2001-2148
2
efficient control approach to address this critical need. The overall objective of the present study is to investigate, via steady computational simulations, the technical merits of a passive control strategy for reducing tip-clearance vortex/stator interaction noise and rotor-tip self noise. Specifically, attention is focused on application of porous-tip treatment to rotor blades to promote alteration of the tip-vortex trajectory and reduction in vortex strength.
The paper is organized as follows. The remainder of this section presents a brief overview of rotor tip-clearance flow field and the associated acoustic field. Both rotor-tip self noise and vortex/stator interaction noise as well as past applications of the porous-tip treatment are discussed. Section 2 is devoted to the description of the selected baseline case and the necessary computational steps (i.e., grid distribution, flow solver, etc.) for simulating the steady flow field. To establish accuracy and fidelity of the simulations, extensive comparison between measured and computed flow fields for the baseline case is provided in section 3. Analysis of computed results for the treated rotor-tip and comparison with the untreated rotor is presented in section 4. A detailed description of our computational methodology for applying porous treatment is also provided in this section. The effects of reduced tip-clearance on the rotor flow field are discussed in section 5 and the paper ends with concluding remarks in section 6.
1.2 Rotor Tip-Clearance Flow and Acoustic Field
The two operating points of interest for community noise, namely, approach and takeoff, correspond to subsonic and supersonic tip Mach numbers, respectively.6 Studies by Cumpsty and Lowrie,7 Feiler and Merriman,8 Dittmar,9 and Dittmar et al.10 have revealed the prominence of the rotor/stator interaction noise at subsonic tip speeds. Accordingly, the proposed approach is focused on the alteration of rotor flow field for a subsonic fan. For supersonic tip speeds, computational and experimental studies of Suder and Celestina,2 Copenhaver et al.,11 Sellin et al.,12 and Adamczyk et al.13 have elucidated pertinent features of the flow field in the gap and tip regions. Although the supersonic tip flow is more complex than its subsonic counterpart, the noise reduction approach advocated here is equally applicable at higher speeds, with minimal fine tuning.
From the standpoint of efficiency and aerodynamic performance of the turbofan, it is desirable to have a minimal clearance between the rotor tip and the fan
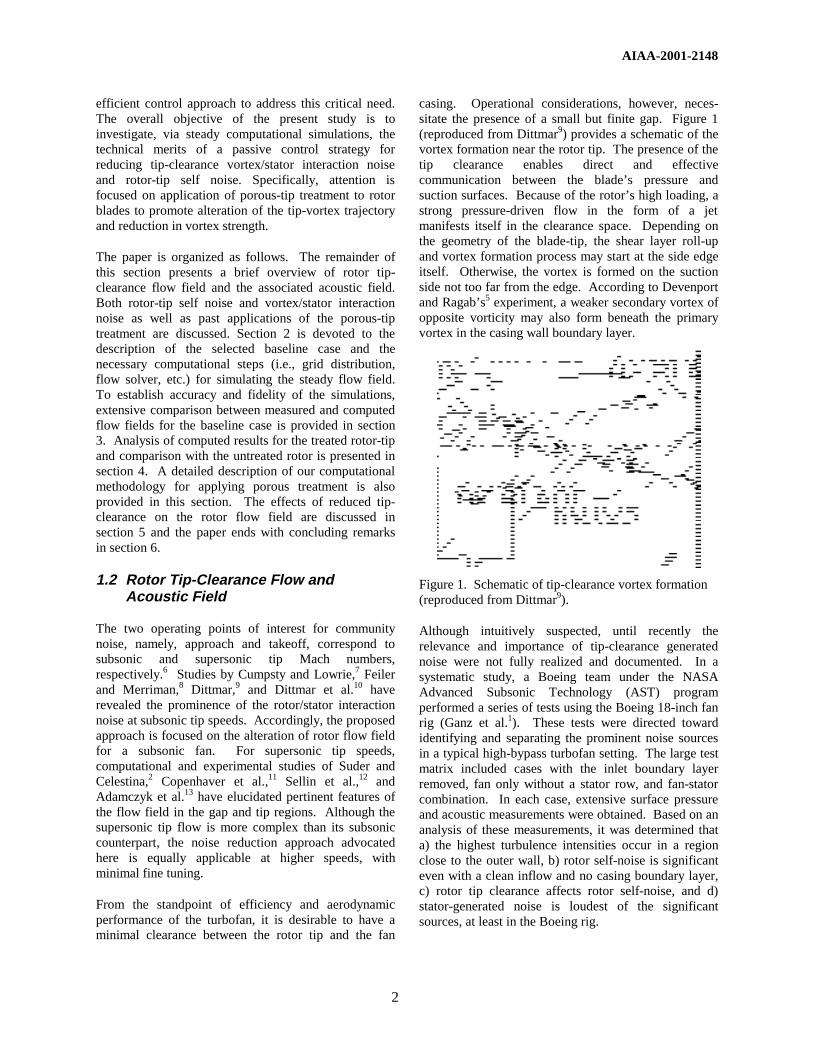
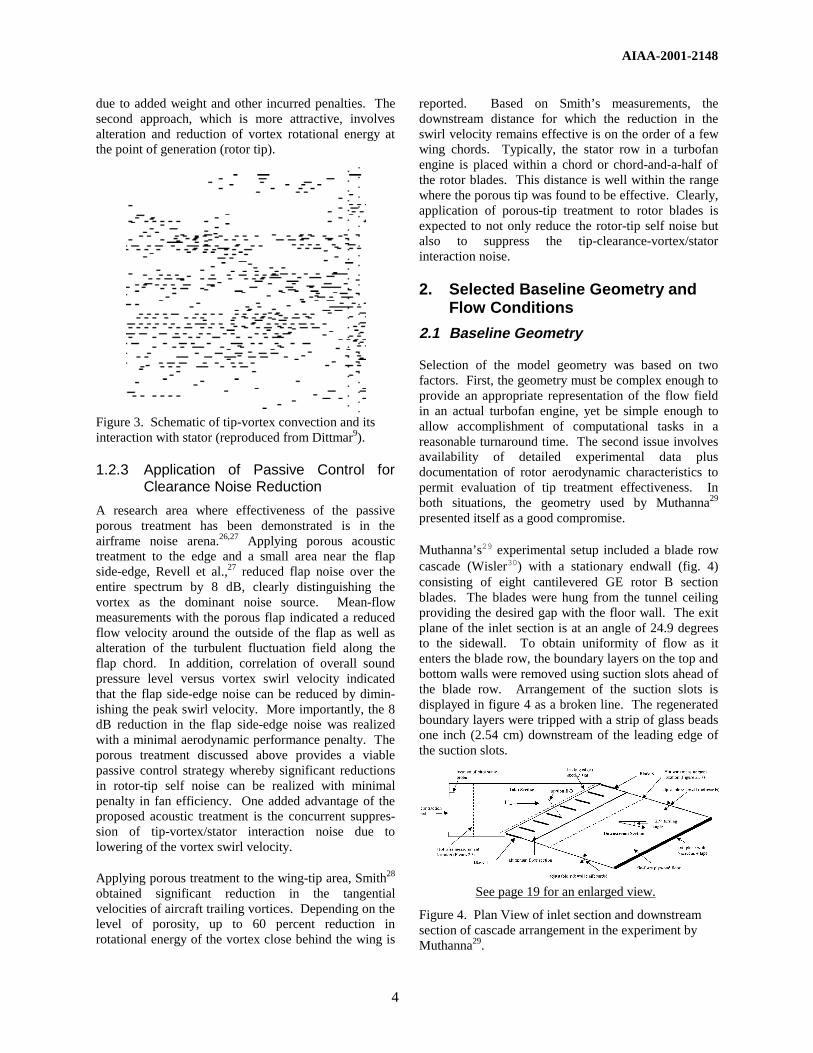
casing. Operational considerations, however, neces-sitate the presence of a small but finite gap. Figure 1 (reproduced from Dittmar9) provides a schematic of the vortex formation near the rotor tip. The presence of the tip clearance enables direct and effective communication between the blade’s pressure and suction surfaces. Because of the rotor’s high loading, a strong pressure-driven flow in the form of a jet manifests itself in the clearance space. Depending on the geometry of the blade-tip, the shear layer roll-up and vortex formation process may start at the side edge itself. Otherwise, the vortex is formed on the suction side not too far from the edge. According to Devenport and Ragab’s5 experiment, a weaker secondary vortex of opposite vorticity may also form beneath the primary vortex in the casing wall boundary layer.
Figure 1. Schematic of tip-clearance vortex formation (reproduced from Dittmar9).
Although intuitively suspected, until recently the relevance and importance of tip-clearance generated noise were not fully realized and documented. In a systematic study, a Boeing team under the NASA Advanced Subsonic Technology (AST) program performed a series of tests using the Boeing 18-inch fan rig (Ganz et al.1). These tests were directed toward identifying and separating the prominent noise sources in a typical high-bypass turbofan setting. The large test matrix included cases with the inlet boundary layer removed, fan only without a stator row, and fan-stator combination. In each case, extensive surface pressure and acoustic measurements were obtained. Based on an analysis of these measurements, it was determined that a) the highest turbulence intensities occur in a region close to the outer wall, b) rotor self-noise is significant even with a clean inflow and no casing boundary layer, c) rotor tip clearance affects rotor self-noise, and d) stator-generated noise is loudest of the significant sources, at least in the Boeing rig.
AIAA-2001-2148
3
According to the analysis by Ganz et al.,1 it is evident that tip-clearance noise is a prominent source of noise in a turbofan engine. Thus, techniques and concepts that help to reduce tip-clearance noise without sacrificing aerodynamic efficiency are highly desired and needed.
In a broad sense, tip-clearance noise can be separated into two broad mechanisms. On one hand, the unsteady flow field in the vicinity of the tip (e.g., oscillating vortex) interacts with the tip surface, which results in a broadband self-generated noise. On the other hand, downstream convection of the primary (tip) vortex and its interaction with the stator vanes produces mainly tonal noise. A brief discussion on each noise source is given below.
1.2.1 Rotor-Tip Self Noise
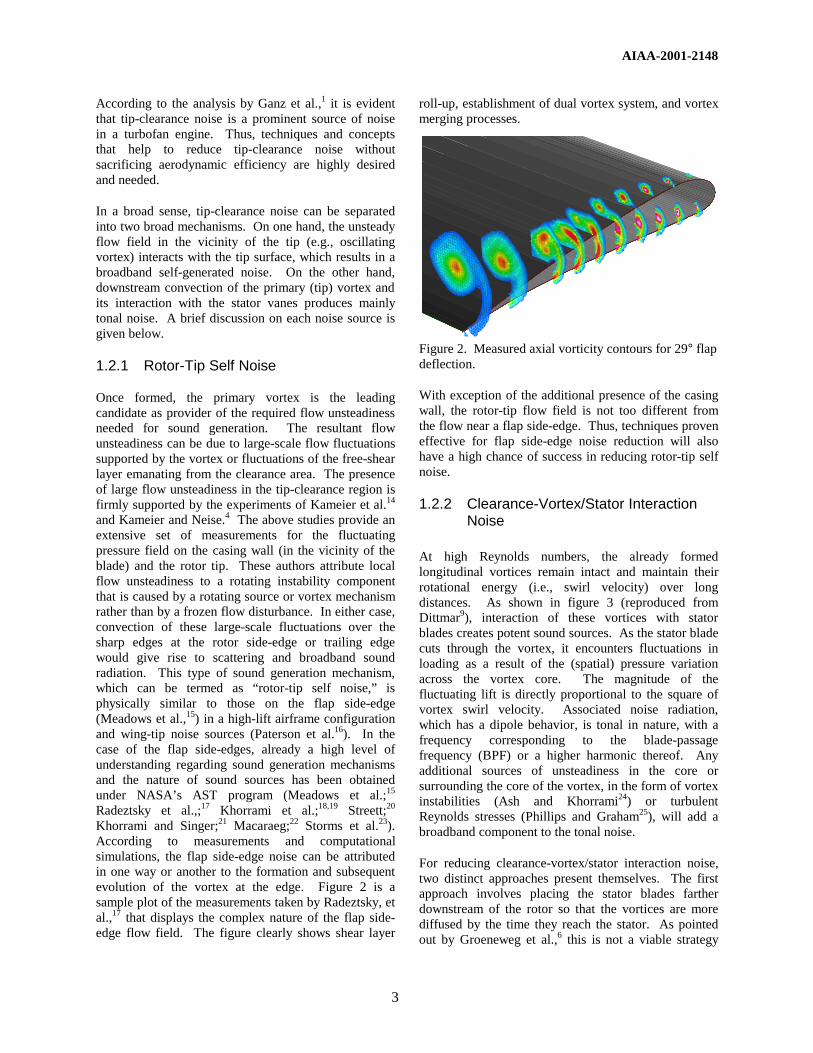
Once formed, the primary vortex is the leading candidate as provider of the required flow unsteadiness needed for sound generation. The resultant flow unsteadiness can be due to large-scale flow fluctuations supported by the vortex or fluctuations of the free-shear layer emanating from the clearance area. The presence of large flow unsteadiness in the tip-clearance region is firmly supported by the experiments of Kameier et al.14 and Kameier and Neise.4 The above studies provide an extensive set of measurements for the fluctuating pressure field on the casing wall (in the vicinity of the blade) and the rotor tip. These authors attribute local flow unsteadiness to a rotating instability component that is caused by a rotating source or vortex mechanism rather than by a frozen flow disturbance. In either case, convection of these large-scale fluctuations over the sharp edges at the rotor side-edge or trailing edge would give rise to scattering and broadband sound radiation. This type of sound generation mechanism, which can be termed as “rotor-tip self noise,” is physically similar to those on the flap side-edge (Meadows et al.,15) in a high-lift airframe configuration and wing-tip noise sources (Paterson et al.16). In the case of the flap side-edges, already a high level of understanding regarding sound generation mechanisms and the nature of sound sources has been obtained under NASA’s AST program (Meadows et al.;15 Radeztsky et al.,;17 Khorrami et al.;18,19 Streett;20 Khorrami and Singer;21 Macaraeg;22 Storms et al.23). According to measurements and computational simulations, the flap side-edge noise can be attributed in one way or another to the formation and subsequent evolution of the vortex at the edge. Figure 2 is a sample plot of the measurements taken by Radeztsky, et al.,17 that displays the complex nature of the flap side-edge flow field. The figure clearly shows shear layer
roll-up, establishment of dual vortex system, and vortex merging processes.
Figure 2. Measured axial vorticity contours for 29° flap deflection.
With exception of the additional presence of the casing wall, the rotor-tip flow field is not too different from the flow near a flap side-edge. Thus, techniques proven effective for flap side-edge noise reduction will also have a high chance of success in reducing rotor-tip self noise.
1.2.2 Clearance-Vortex/Stator Interaction Noise
At high Reynolds numbers, the already formed longitudinal vortices remain intact and maintain their rotational energy (i.e., swirl velocity) over long distances. As shown in figure 3 (reproduced from Dittmar9), interaction of these vortices with stator blades creates potent sound sources. As the stator blade cuts through the vortex, it encounters fluctuations in loading as a result of the (spatial) pressure variation across the vortex core. The magnitude of the fluctuating lift is directly proportional to the square of vortex swirl velocity. Associated noise radiation, which has a dipole behavior, is tonal in nature, with a frequency corresponding to the blade-passage frequency (BPF) or a higher harmonic thereof. Any additional sources of unsteadiness in the core or surrounding the core of the vortex, in the form of vortex instabilities (Ash and Khorrami24) or turbulent Reynolds stresses (Phillips and Graham25), will add a broadband component to the tonal noise.
For reducing clearance-vortex/stator interaction noise, two distinct approaches present themselves. The first approach involves placing the stator blades farther downstream of the rotor so that the vortices are more diffused by the time they reach the stator. As pointed out by Groeneweg et al.,6 this is not a viable strategy
AIAA-2001-2148
4
due to added weight and other incurred penalties. The second approach, which is more attractive, involves alteration and reduction of vortex rotational energy at the point of generation (rotor tip).
Figure 3. Schematic of tip-vortex convection and its interaction with stator (reproduced from Dittmar9).
1.2.3 Application of Passive Control for Clearance Noise Reduction
A research area where effectiveness of the passive porous treatment has been demonstrated is in the airframe noise arena.26,27 Applying porous acoustic treatment to the edge and a small area near the flap side-edge, Revell et al.,27 reduced flap noise over the entire spectrum by 8 dB, clearly distinguishing the vortex as the dominant noise source. Mean-flow measurements with the porous flap indicated a reduced flow velocity around the outside of the flap as well as alteration of the turbulent fluctuation field along the flap chord. In addition, correlation of overall sound pressure level versus vortex swirl velocity indicated that the flap side-edge noise can be reduced by dimin-ishing the peak swirl velocity. More importantly, the 8 dB reduction in the flap side-edge noise was realized with a minimal aerodynamic performance penalty. The porous treatment discussed above provides a viable passive control strategy whereby significant reductions in rotor-tip self noise can be realized with minimal penalty in fan efficiency. One added advantage of the proposed acoustic treatment is the concurrent suppres-sion of tip-vortex/stator interaction noise due to lowering of the vortex swirl velocity.
Applying porous treatment to the wing-tip area, Smith28 obtained significant reduction in the tangential velocities of aircraft trailing vortices. Depending on the level of porosity, up to 60 percent reduction in rotational energy of the vortex close behind the wing is
reported. Based on Smith’s measurements, the downstream distance for which the reduction in the swirl velocity remains effective is on the order of a few wing chords. Typically, the stator row in a turbofan engine is placed within a chord or chord-and-a-half of the rotor blades. This distance is well within the range where the porous tip was found to be effective. Clearly, application of porous-tip treatment to rotor blades is expected to not only reduce the rotor-tip self noise but also to suppress the tip-clearance-vortex/stator interaction noise.
2. Selected Baseline Geometry and Flow Conditions
2.1 Baseline Geometry
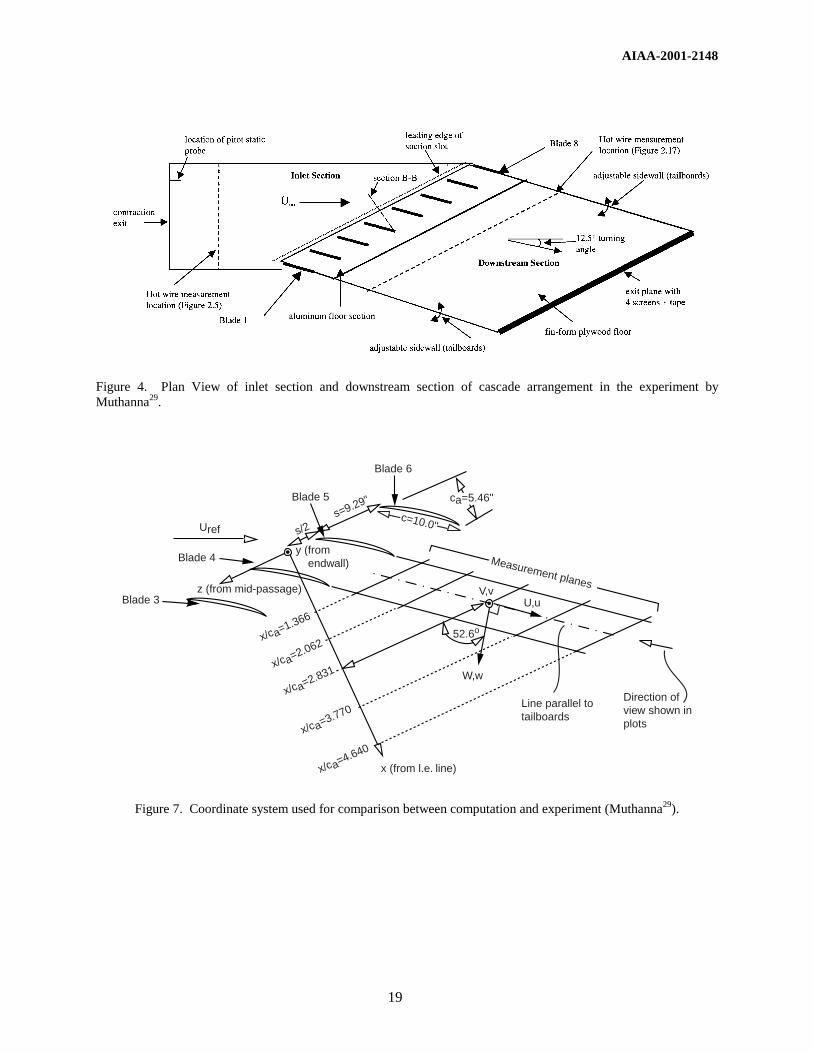
Selection of the model geometry was based on two factors. First, the geometry must be complex enough to provide an appropriate representation of the flow field in an actual turbofan engine, yet be simple enough to allow accomplishment of computational tasks in a reasonable turnaround time. The second issue involves availability of detailed experimental data plus documentation of rotor aerodynamic characteristics to permit evaluation of tip treatment effectiveness. In both situations, the geometry used by Muthanna29 presented itself as a good compromise.
Muthanna’s29 experimental setup included a blade row cascade (Wisler30) with a stationary endwall (fig. 4) consisting of eight cantilevered GE rotor B section blades. The blades were hung from the tunnel ceiling providing the desired gap with the floor wall. The exit plane of the inlet section is at an angle of 24.9 degrees to the sidewall. To obtain uniformity of flow as it enters the blade row, the boundary layers on the top and bottom walls were removed using suction slots ahead of the blade row. Arrangement of the suction slots is displayed in figure 4 as a broken line. The regenerated boundary layers were tripped with a strip of glass beads one inch (2.54 cm) downstream of the leading edge of the suction slots.
See page 19 for an enlarged view.
Figure 4. Plan View of inlet section and downstream section of cascade arrangement in the experiment by Muthanna29.
AIAA-2001-2148
5
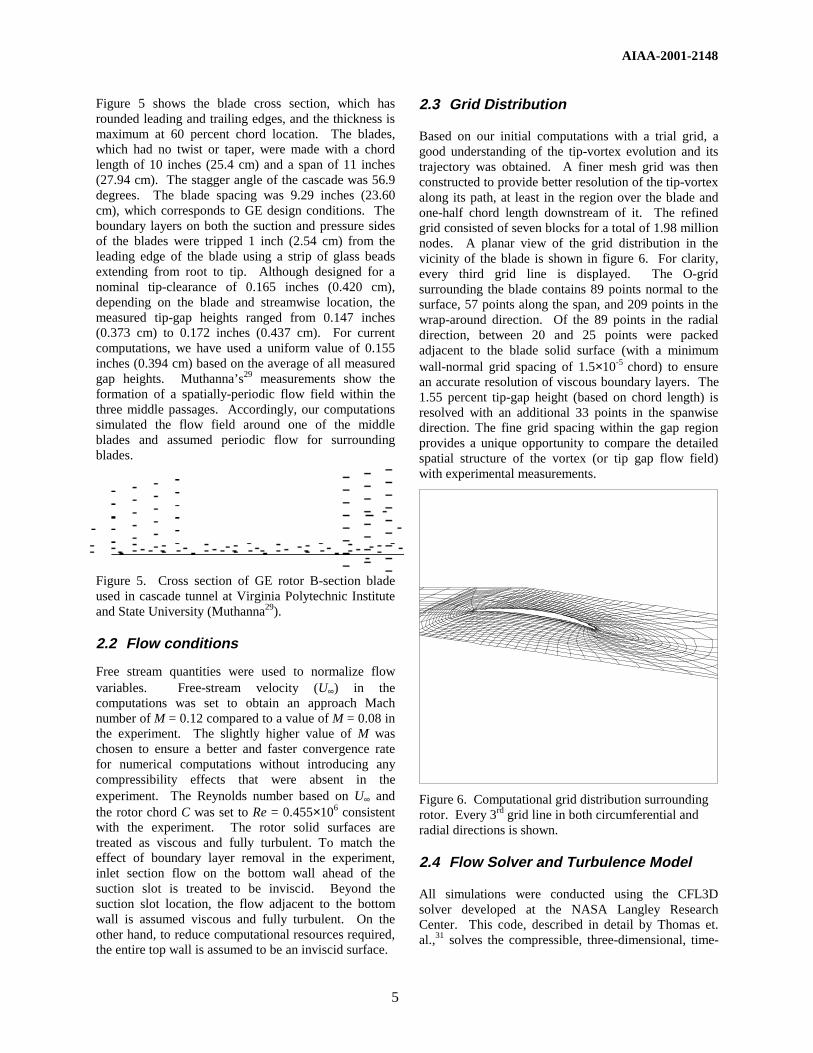
Figure 5 shows the blade cross section, which has rounded leading and trailing edges, and the thickness is maximum at 60 percent chord location. The blades, which had no twist or taper, were made with a chord length of 10 inches (25.4 cm) and a span of 11 inches (27.94 cm). The stagger angle of the cascade was 56.9 degrees. The blade spacing was 9.29 inches (23.60 cm), which corresponds to GE design conditions. The boundary layers on both the suction and pressure sides of the blades were tripped 1 inch (2.54 cm) from the leading edge of the blade using a strip of glass beads extending from root to tip. Although designed for a nominal tip-clearance of 0.165 inches (0.420 cm), depending on the blade and streamwise location, the measured tip-gap heights ranged from 0.147 inches (0.373 cm) to 0.172 inches (0.437 cm). For current computations, we have used a uniform value of 0.155 inches (0.394 cm) based on the average of all measured gap heights. Muthanna’s29 measurements show the formation of a spatially-periodic flow field within the three middle passages. Accordingly, our computations simulated the flow field around one of the middle blades and assumed periodic flow for surrounding blades.
Figure 5. Cross section of GE rotor B-section blade used in cascade tunnel at Virginia Polytechnic Institute and State University (Muthanna29).
2.2 Flow conditions
Free stream quantities were used to normalize flow variables. Free-stream velocity (U∞) in the computations was set to obtain an approach Mach number of M = 0.12 compared to a value of M = 0.08 in the experiment. The slightly higher value of M was chosen to ensure a better and faster convergence rate for numerical computations without introducing any compressibility effects that were absent in the experiment. The Reynolds number based on U∞ and the rotor chord C was set to Re = 0.455×10⁶ consistent with the experiment. The rotor solid surfaces are treated as viscous and fully turbulent. To match the effect of boundary layer removal in the experiment, inlet section flow on the bottom wall ahead of the suction slot is treated to be inviscid. Beyond the suction slot location, the flow adjacent to the bottom wall is assumed viscous and fully turbulent. On the other hand, to reduce computational resources required, the entire top wall is assumed to be an inviscid surface.
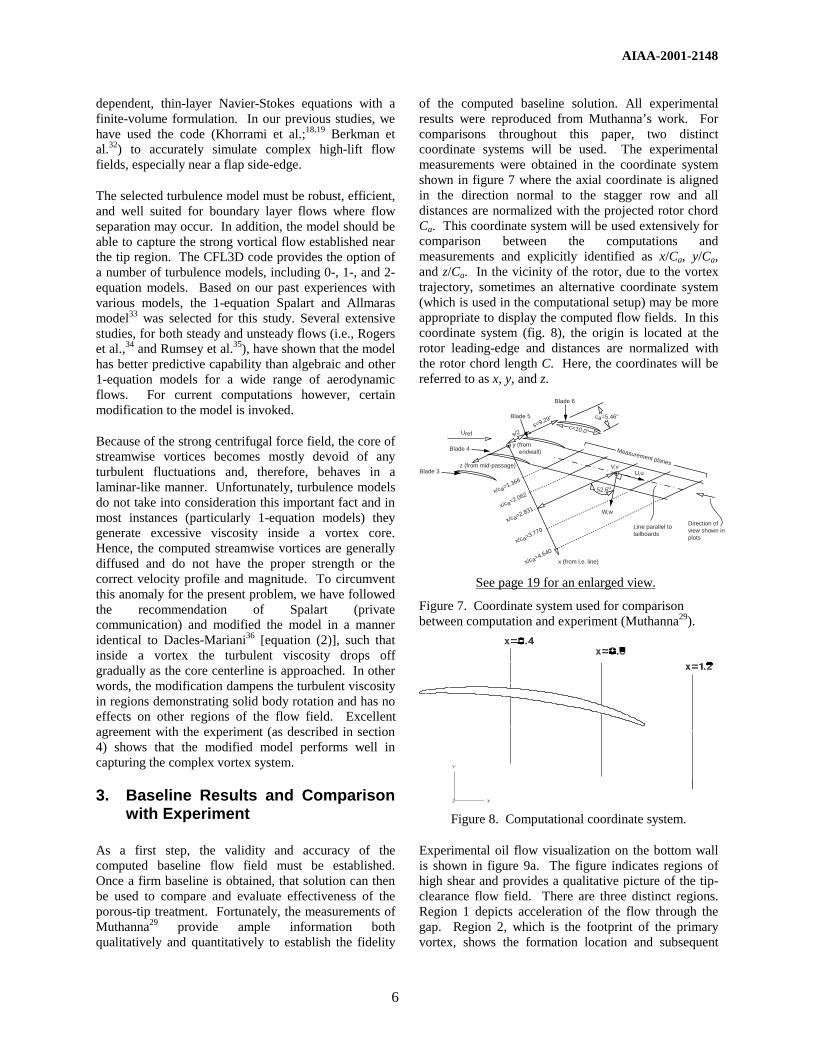
2.3 Grid Distribution
Based on our initial computations with a trial grid, a good understanding of the tip-vortex evolution and its trajectory was obtained. A finer mesh grid was then constructed to provide better resolution of the tip-vortex along its path, at least in the region over the blade and one-half chord length downstream of it. The refined grid consisted of seven blocks for a total of 1.98 million nodes. A planar view of the grid distribution in the vicinity of the blade is shown in figure 6. For clarity, every third grid line is displayed. The O-grid surrounding the blade contains 89 points normal to the surface, 57 points along the span, and 209 points in the wrap-around direction. Of the 89 points in the radial direction, between 20 and 25 points were packed adjacent to the blade solid surface (with a minimum wall-normal grid spacing of 1.5×10⁻⁵ chord) to ensure an accurate resolution of viscous boundary layers. The 1.55 percent tip-gap height (based on chord length) is resolved with an additional 33 points in the spanwise direction. The fine grid spacing within the gap region provides a unique opportunity to compare the detailed spatial structure of the vortex (or tip gap flow field) with experimental measurements.
Figure 6. Computational grid distribution surrounding rotor. Every 3rd grid line in both circumferential and radial directions is shown.
2.4 Flow Solver and Turbulence Model
All simulations were conducted using the CFL3D solver developed at the NASA Langley Research Center. This code, described in detail by Thomas et. al.,31 solves the compressible, three-dimensional, time-
AIAA-2001-2148
6
dependent, thin-layer Navier-Stokes equations with a finite-volume formulation. In our previous studies, we have used the code (Khorrami et al.;18,19 Berkman et al.32) to accurately simulate complex high-lift flow fields, especially near a flap side-edge.
The selected turbulence model must be robust, efficient, and well suited for boundary layer flows where flow separation may occur. In addition, the model should be able to capture the strong vortical flow established near the tip region. The CFL3D code provides the option of a number of turbulence models, including 0-, 1-, and 2-equation models. Based on our past experiences with various models, the 1-equation Spalart and Allmaras model33 was selected for this study. Several extensive studies, for both steady and unsteady flows (i.e., Rogers et al.,34 and Rumsey et al.35), have shown that the model has better predictive capability than algebraic and other 1-equation models for a wide range of aerodynamic flows. For current computations however, certain modification to the model is invoked.
Because of the strong centrifugal force field, the core of streamwise vortices becomes mostly devoid of any turbulent fluctuations and, therefore, behaves in a laminar-like manner. Unfortunately, turbulence models do not take into consideration this important fact and in most instances (particularly 1-equation models) they generate excessive viscosity inside a vortex core. Hence, the computed streamwise vortices are generally diffused and do not have the proper strength or the correct velocity profile and magnitude. To circumvent this anomaly for the present problem, we have followed the recommendation of Spalart (private communication) and modified the model in a manner identical to Dacles-Mariani36 [equation (2)], such that inside a vortex the turbulent viscosity drops off gradually as the core centerline is approached. In other words, the modification dampens the turbulent viscosity in regions demonstrating solid body rotation and has no effects on other regions of the flow field. Excellent agreement with the experiment (as described in section 4) shows that the modified model performs well in capturing the complex vortex system.
3. Baseline Results and Comparison with Experiment
As a first step, the validity and accuracy of the computed baseline flow field must be established. Once a firm baseline is obtained, that solution can then be used to compare and evaluate effectiveness of the porous-tip treatment. Fortunately, the measurements of Muthanna29 provide ample information both qualitatively and quantitatively to establish the fidelity
of the computed baseline solution. All experimental results were reproduced from Muthanna’s work. For comparisons throughout this paper, two distinct coordinate systems will be used. The experimental measurements were obtained in the coordinate system shown in figure 7 where the axial coordinate is aligned in the direction normal to the stagger row and all distances are normalized with the projected rotor chord Ca. This coordinate system will be used extensively for comparison between the computations and measurements and explicitly identified as x/Ca, y/Ca, and z/Ca. In the vicinity of the rotor, due to the vortex trajectory, sometimes an alternative coordinate system (which is used in the computational setup) may be more appropriate to display the computed flow fields. In this coordinate system (fig. 8), the origin is located at the rotor leading-edge and distances are normalized with the rotor chord length C. Here, the coordinates will be referred to as x, y, and z.
x/ca=1.366
x/ca=2.062
x/ca=2.831
x/ca=3.770
x/ca=4.640
Direction ofview shown inplots
Line parallel to tailboards
x (from l.e. line)
W,w
52.6o
V,vU,u
z (from mid-passage)
Uref
y (from endwall)
ca=5.46"
c=10.0"
Measurement planes
Blade 5
Blade 6
Blade 4
Blade 3
s/2 s=9.29"
See page 19 for an enlarged view.
Figure 7. Coordinate system used for comparison between computation and experiment (Muthanna29).
Figure 8. Computational coordinate system.
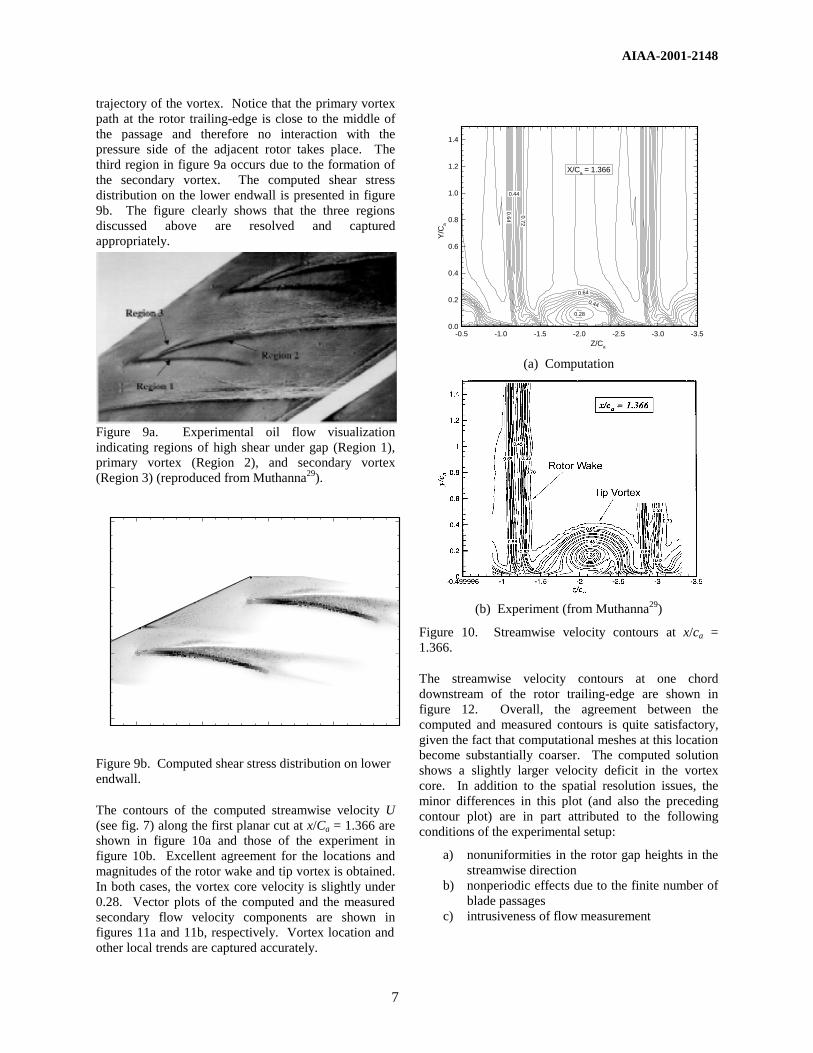
Experimental oil flow visualization on the bottom wall is shown in figure 9a. The figure indicates regions of high shear and provides a qualitative picture of the tip-clearance flow field. There are three distinct regions. Region 1 depicts acceleration of the flow through the gap. Region 2, which is the footprint of the primary vortex, shows the formation location and subsequent
AIAA-2001-2148
7
trajectory of the vortex. Notice that the primary vortex path at the rotor trailing-edge is close to the middle of the passage and therefore no interaction with the pressure side of the adjacent rotor takes place. The third region in figure 9a occurs due to the formation of the secondary vortex. The computed shear stress distribution on the lower endwall is presented in figure 9b. The figure clearly shows that the three regions discussed above are resolved and captured appropriately.
Figure 9a. Experimental oil flow visualization indicating regions of high shear under gap (Region 1), primary vortex (Region 2), and secondary vortex (Region 3) (reproduced from Muthanna29).
Figure 9b. Computed shear stress distribution on lower endwall.
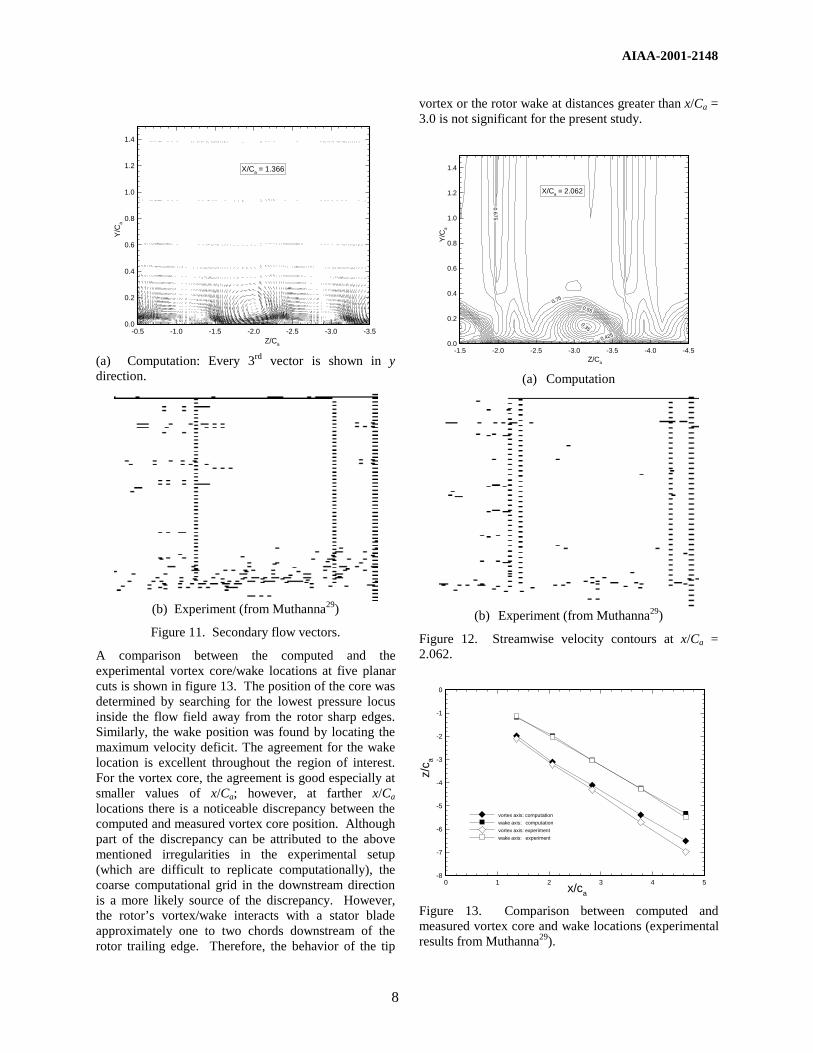
The contours of the computed streamwise velocity U (see fig. 7) along the first planar cut at x/Ca = 1.366 are shown in figure 10a and those of the experiment in figure 10b. Excellent agreement for the locations and magnitudes of the rotor wake and tip vortex is obtained. In both cases, the vortex core velocity is slightly under 0.28. Vector plots of the computed and the measured secondary flow velocity components are shown in figures 11a and 11b, respectively. Vortex location and other local trends are captured accurately.
-3.5-3.0-2.5-2.0-1.5-1.0-0.50.0
0.2
0.4
0.6
0.8
1.0
1.2
1.4
0.28
0.64
0.44
0.44
0.72
0 .64
Z/Ca
Y/C
a
X/Ca = 1.366
(a) Computation
(b) Experiment (from Muthanna29)
Figure 10. Streamwise velocity contours at x/ca = 1.366.
The streamwise velocity contours at one chord downstream of the rotor trailing-edge are shown in figure 12. Overall, the agreement between the computed and measured contours is quite satisfactory, given the fact that computational meshes at this location become substantially coarser. The computed solution shows a slightly larger velocity deficit in the vortex core. In addition to the spatial resolution issues, the minor differences in this plot (and also the preceding contour plot) are in part attributed to the following conditions of the experimental setup:
a) nonuniformities in the rotor gap heights in the streamwise direction
b) nonperiodic effects due to the finite number of blade passages
c) intrusiveness of flow measurement
AIAA-2001-2148
8
-3.5-3.0-2.5-2.0-1.5-1.0-0.50.0
0.2
0.4
0.6
0.8
1.0
1.2
1.4
Z/Ca
Y/C
a
X/Ca = 1.366
(a) Computation: Every 3rd vector is shown in y direction.
(b) Experiment (from Muthanna29)
Figure 11. Secondary flow vectors.
A comparison between the computed and the experimental vortex core/wake locations at five planar cuts is shown in figure 13. The position of the core was determined by searching for the lowest pressure locus inside the flow field away from the rotor sharp edges. Similarly, the wake position was found by locating the maximum velocity deficit. The agreement for the wake location is excellent throughout the region of interest. For the vortex core, the agreement is good especially at smaller values of x/Ca; however, at farther x/Ca locations there is a noticeable discrepancy between the computed and measured vortex core position. Although part of the discrepancy can be attributed to the above mentioned irregularities in the experimental setup (which are difficult to replicate computationally), the coarse computational grid in the downstream direction is a more likely source of the discrepancy. However, the rotor’s vortex/wake interacts with a stator blade approximately one to two chords downstream of the rotor trailing edge. Therefore, the behavior of the tip
vortex or the rotor wake at distances greater than x/Ca = 3.0 is not significant for the present study.
-4.5-4.0-3.5-3.0-2.5-2.0-1.50.0
0.2
0.4
0.6
0.8
1.0
1.2
1.4
0.35
0.55
0.675
0.425
0.75
Z/Ca
Y/C
a
X/Ca = 2.062
(a) Computation
(b) Experiment (from Muthanna29)
Figure 12. Streamwise velocity contours at x/Ca = 2.062.
0 1 2 3 4 5-8
-7
-6
-5
-4
-3
-2
-1
0
z/c a
x/ca
vortex axis: computation
wake axis: computation
vortex axis: experiment
wake axis: experiment
Figure 13. Comparison between computed and measured vortex core and wake locations (experimental results from Muthanna29).
AIAA-2001-2148
9
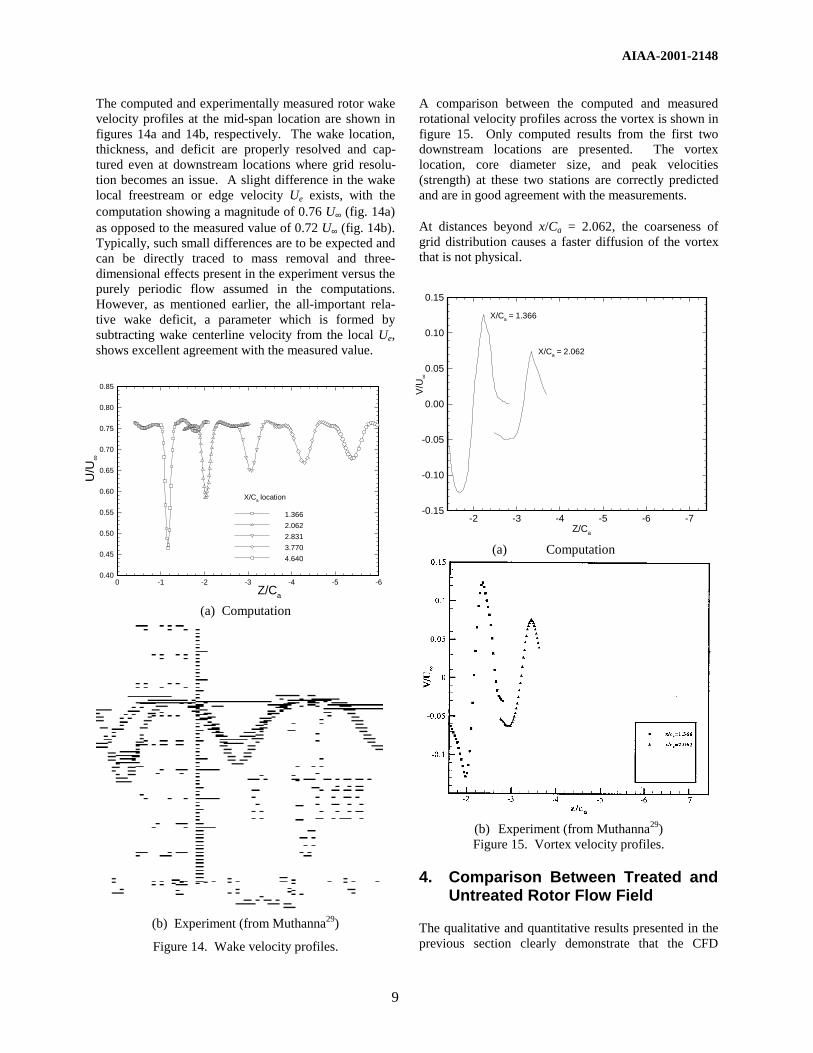
The computed and experimentally measured rotor wake velocity profiles at the mid-span location are shown in figures 14a and 14b, respectively. The wake location, thickness, and deficit are properly resolved and cap-tured even at downstream locations where grid resolu-tion becomes an issue. A slight difference in the wake local freestream or edge velocity Ue exists, with the computation showing a magnitude of 0.76 U∞ (fig. 14a) as opposed to the measured value of 0.72 U∞ (fig. 14b). Typically, such small differences are to be expected and can be directly traced to mass removal and three-dimensional effects present in the experiment versus the purely periodic flow assumed in the computations. However, as mentioned earlier, the all-important rela-tive wake deficit, a parameter which is formed by subtracting wake centerline velocity from the local Ue, shows excellent agreement with the measured value.
-6-5-4-3-2-100.40
0.45
0.50
0.55
0.60
0.65
0.70
0.75
0.80
0.85
Z/Ca
U/U
∞
1.366
2.062
2.831
3.770
4.640
X/Ca location
(a) Computation
(b) Experiment (from Muthanna29)
Figure 14. Wake velocity profiles.
A comparison between the computed and measured rotational velocity profiles across the vortex is shown in figure 15. Only computed results from the first two downstream locations are presented. The vortex location, core diameter size, and peak velocities (strength) at these two stations are correctly predicted and are in good agreement with the measurements.
At distances beyond x/Ca = 2.062, the coarseness of grid distribution causes a faster diffusion of the vortex that is not physical.
-7-6-5-4-3-2-0.15
-0.10
-0.05
0.00
0.05
0.10
0.15
Z/Ca
V/U
∞
X/Ca = 1.366
X/Ca = 2.062
(a) Computation
(b) Experiment (from Muthanna29) Figure 15. Vortex velocity profiles.
4. Comparison Between Treated and Untreated Rotor Flow Field
The qualitative and quantitative results presented in the previous section clearly demonstrate that the CFD
AIAA-2001-2148
10
simulation has accurately captured the relevant features of the rotor flow field. The excellent agreement obtained between the computed and measured quantities establishes the simulated flow field as a reliable baseline against which the effectiveness of the porous tip treatment can be measured.
4.1 Development of Computational Boundary Conditions for Porous Walls
In the computational mode, it is neither desirable nor necessary to include details of the flow in the immediate vicinity of the pores on the perforated surface. Because of the relatively small length scales associated with the pores, the effect of porosity on the overall flow can usually be simulated by prescribing a jump condition that specifies the relation between (area averaged) flow quantities on both sides of the surface. Porous surfaces used in similar aeronautical applications (such as engine inlet liners, wings with active suction) tend to have small open area ratios and a relatively high flow resistance. Therefore, the area averaged transpiration velocities are rather small in magnitude, being primarily determined by the local characteristics of the perforated surface. The suitably nondimensionalized jump condition at any point on the treated surface can thus be expressed in the form
( ) RPPv inoutn /−=
where the normal velocity vn, pressures Pout and Pin above and below the surface, and the surface resistivity R refer to local values of the respective quantities. Specification of the resistivity R is usually based on experimental measurements of pressure drop across a sample of the perforated surface (Motsinger et al.37). In general, R can depend on the transpiration velocity vn; however, this nonlinear dependence is a function of the hardware configuration involved (i.e., details of the porous treatment). For simplicity, therefore, R was taken to be a constant in the present investigation. To close the problem, one must specify the internal pressure distribution Pin (x,y,z), which is determined by the dynamics of the cavity region inside the porous surface. The simplest model for the cavity region that is consistent with the hypothesis of an open-area-ratio is to assume that the cavity pressure is uniform, with a value that lies in between the minimum and maximum pressures outside the surface. This uniform pressure is easily determined by imposing the constraint of passive
porosity, namely, that 0=∫ dAvnρ across the entire
porous region. Numerically, the above constraint can be imposed by lagging the cavity pressure calculation behind the outer flow by a single iteration. We found that the simpler approach based on a manual tuning of
the cavity pressure at the end of every few hundred iterations also worked well in practice. With just three or four instances of tuning the cavity pressure, the passive porosity constraint was satisfied for all practical purposes.
4.2 Application of Porous-Tip Treatment
The boundary condition described in section 4.1 was applied to the entire rotor-tip side-edge surface and the pressure and suction surfaces adjacent to this edge. The two relevant and adjustable parameters for fine tuning the effectiveness of the treatment are the spanwise extent of the treated surface area and the coefficient R, which determines the resistance of the perforated facesheet. For the present work, the treated surface area on both pressure and suction sides is comprised of uniform strips that cover an area from the rotor’s leading-edge to the trailing-edge and extend inboard two percent of the span. The resistance coefficient R was fixed throughout the present study. The computation was terminated when the net mass flux through the overall porous surface was less than two percent of the mass flux through the treated segment along the suction surface of the airfoil. The converged solution indicated that the primary path for the fluid forced inward through the pressure surface of the airfoil was toward the tip surface rather than to the suction surface of the airfoil. The magnitude of the normal flow velocities over the treated segments was generally less than two percent of the free-stream velocity. The relatively small magnitude of the transpiration velocity tends to support the assumption of uniform cavity pressure used during the computations. With such small surface velocity magnitudes, the desired local flow alterations in the tip region were realized while keeping the rotor’s global characteristics (e.g., aerodynamic lift) virtually unaffected. As a preliminary proof of concept study, however, no systematic attempts at optimizing the relevant parameters were taken. Given the high level of success achieved with the present assigned values (as will be shown in the following section), we are confident that optimization of the porous treatment will provide further gains in noise reduction.
4.3 Results
For the purpose of rotor self-noise, prevention or delay of vortex roll-up process, reduction of vortex strength, and modification of the vortex trajectory near the tip clearance are of paramount importance for suppressing both tonal and broadband noise generation mechanisms. A significantly weaker vortex will be less productive in terms of generating secondary unsteady flow on the casing wall and/or interacting with the rotor-tip edge. As described below, the porous tip treatment advocated

AIAA-2001-2148
11
here can accomplish the necessary flow-field alteration without leading to any detrimental side effects.
The origin of the vortex and its subsequent trajectory for both treated and untreated rotor tips are shown in figure 16. For reference purposes, the cross section of the rotor is also included in the figure. In the untreated case (solid line), the vortex is fully formed at 18 percent chord. It gains strength rapidly in the downstream direction. The vortex interacts with and remains close to the upper corner of the tip up to the first 50 percent of the chord. For the treated rotor (broken line), vortex formation is delayed and moved back to an x location corresponding to 30-percent chord, as opposed to 18 percent chord in the untreated case. In addition, the vortex now originates farther away from the blade (i.e. larger y distance) as compared to the untreated case. This shift in the vortex path becomes more pronounced as the vortex is convected downstream. The magnitude of the shift may seem small on the scale of figure 16; however, previous experience with tip vortices (Revell et al.27) has shown that a vortex movement of comparable magnitude would provide significant reduction in vortex self-generated noise.
0.0 0.2 0.4 0.6 0.8 1.0-0.2
-0.1
0.0
0.1
0.2
x
y
Untreated
Treated
Figure 16. Tip-Vortex trajectory.
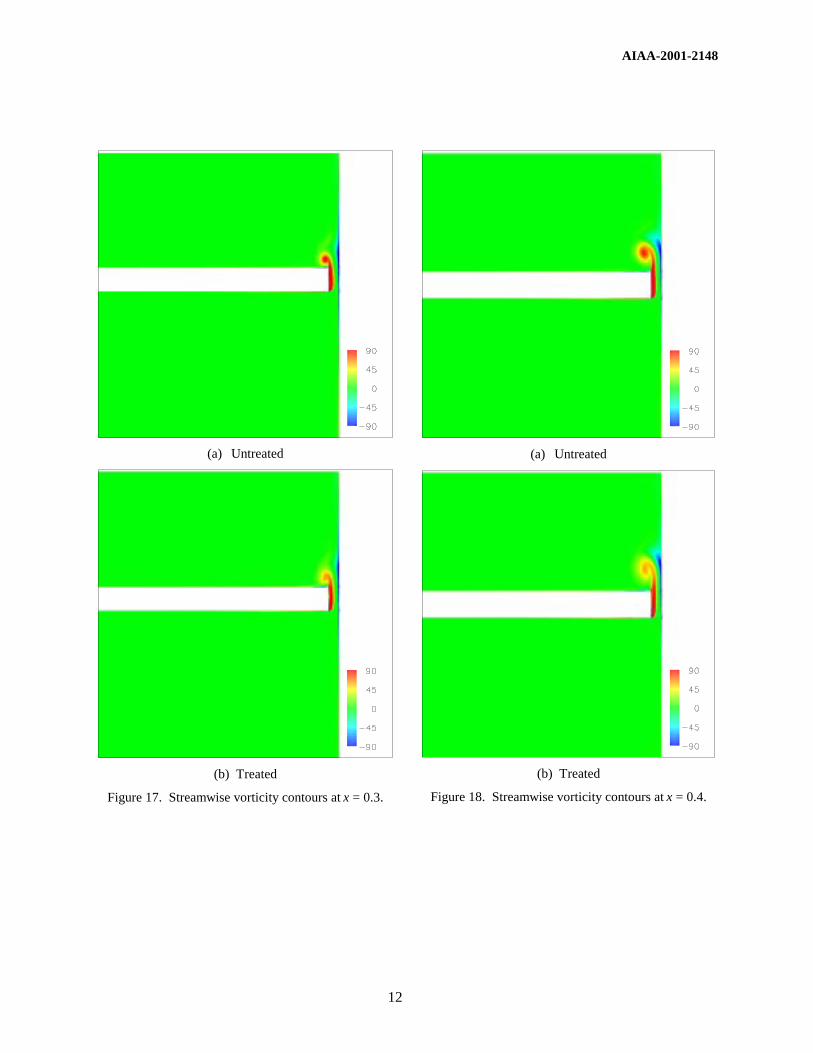
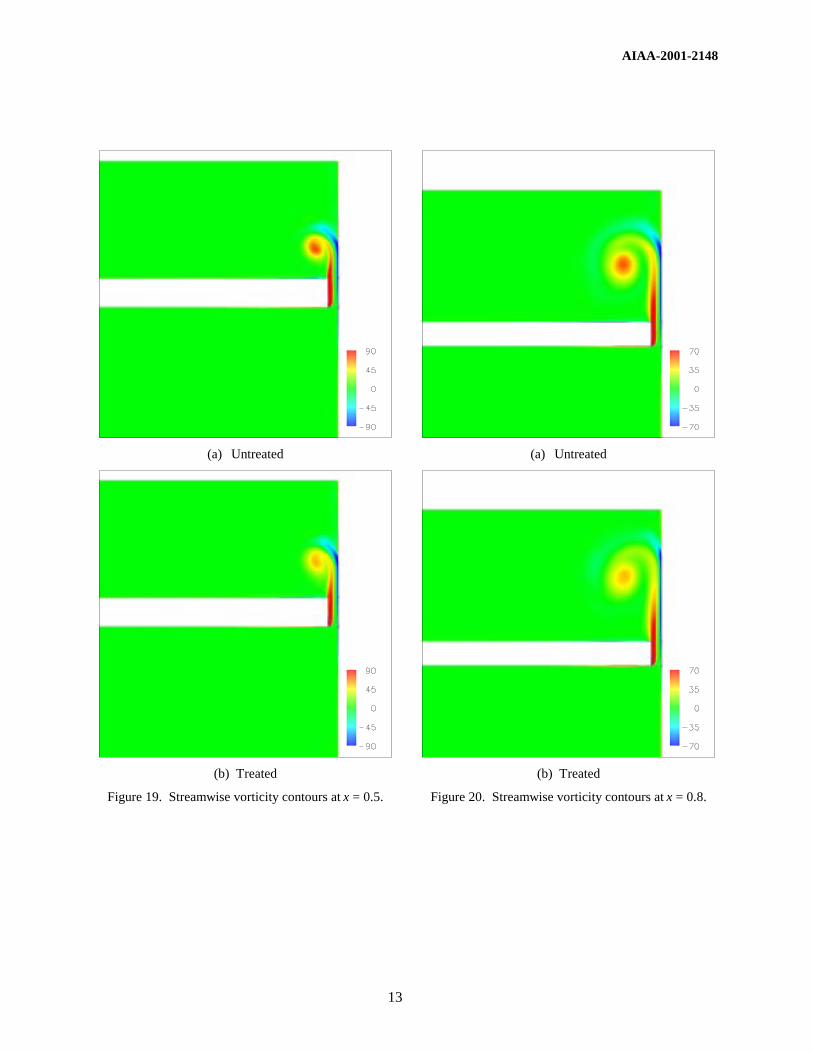
To display the reduction in vortex strength due to application of the porous tip treatment, we resort to streamwise vorticity contours at several axial locations along the computational coordinate x. (For a description of the coordinate system used, see fig. 8.) For comparison purposes, contours for both untreated and treated cases are shown side by side using identical scales. The vorticity fields at x = 0.3 (where the treated vortex first appears) are presented in figures 17a and 17b, respectively. Observe that the strong untreated vortex is fully formed at this location. Because of the presence of the vortex, the boundary layer on the bottom wall (right side of figures 17-22) is beginning to separate and form a region of opposite signed vorticity. In contrast, the vortex near a treated tip is significantly weaker, as depicted by the colors of contours in the core region.
The vorticity fields at x = 0.4 are shown in figures 18a and 18b. At this location, the vortex and the shear layer that feeds it are both very well defined. The boundary
layer on the bottom wall is fully separated, forming a secondary vortex of opposite rotation. This secondary flow field corresponds to Region 3 in the oil-flow visualization of figure 9a. The two counter rotating vortices induce a region of strong flow jetting and high shear in between. The region of high shear manifests itself clearly at x = 0.5 (fig. 19) where the separated boundary layer is stretched severely and wrapped around the primary vortex. According to Muthanna’s29 measurements, some of the most intense turbulent Reynolds stresses and fluctuations are observed in this region where the boundary layer is lifted off the surface. Such intense turbulence production has strong ramifications, both in terms of rotor self-noise and rotor-stator interaction noise. The treated vortex at the same location (fig. 19b) shows a substantially diffused/weaker vortex and a vorticity layer that feeds it. Probing of the vorticity field indicated a 30 to 40 percent reduction in peak value when compared to the baseline case. Although difficult to discern from the figure, the porous tip treatment leads to a similar reduction in the peak vorticity of the secondary vortex. Such significant reductions in the vorticity levels (or the shear) necessarily entail comparable reductions in the turbulent Reynolds stress and fluctuations fields that lead to noise generation.
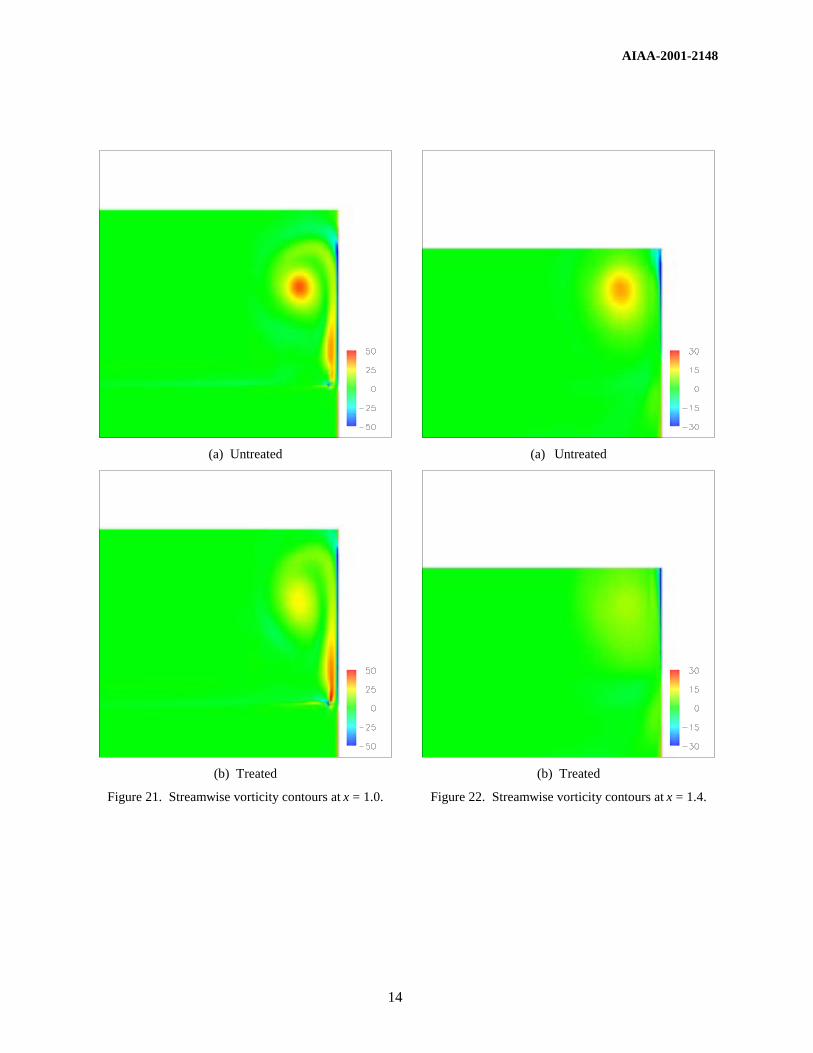
Development of the tip-clearance flow field at locations further downstream (corresponding to x = 0.8, 1.0, and 1.4) are shown in figures 20 through 22, respectively. In particular, one may note the dramatic effectiveness of the porous-tip treatment at locations beyond the trailing edge (figs. 21-22). At these locations, the tip-clearance vortex becomes quite diffused and is weak in comparison with that in the untreated case. The importance and ramifications of this reduced strength become apparent when the physical mechanisms behind rotor-stator interaction noise are considered.
Rotor-stator interaction noise is similar in nature to the Blade-Vortex Interaction (BVI) noise generated by helicopters, particularly during hover. The noise is produced by the moving helicopter blade cutting through the vortex core. Due to the lower pressures inside the core, presence of the vortex is felt by the blade as a moving pressure pulse producing a fluctuating (unsteady) lift. For turbofan engines, of course, it is the vortex that is moving and the stator blade remains stationary. The overall scenario, however, is the same as BVI. In order to diminish the strength of the pressure pulse, one must reduce the peak rotational velocity in the vortex core. As shown below, the present porous-tip treatment concept accomplishes this task very effectively.
AIAA-2001-2148
12
(a) Untreated
(b) Treated
Figure 17. Streamwise vorticity contours at x = 0.3.
(a) Untreated
(b) Treated
Figure 18. Streamwise vorticity contours at x = 0.4.
AIAA-2001-2148
13
(a) Untreated
(b) Treated
Figure 19. Streamwise vorticity contours at x = 0.5.
(a) Untreated
(b) Treated
Figure 20. Streamwise vorticity contours at x = 0.8.
AIAA-2001-2148
14
(a) Untreated
(b) Treated
Figure 21. Streamwise vorticity contours at x = 1.0.
(a) Untreated
(b) Treated
Figure 22. Streamwise vorticity contours at x = 1.4.
AIAA-2001-2148
15
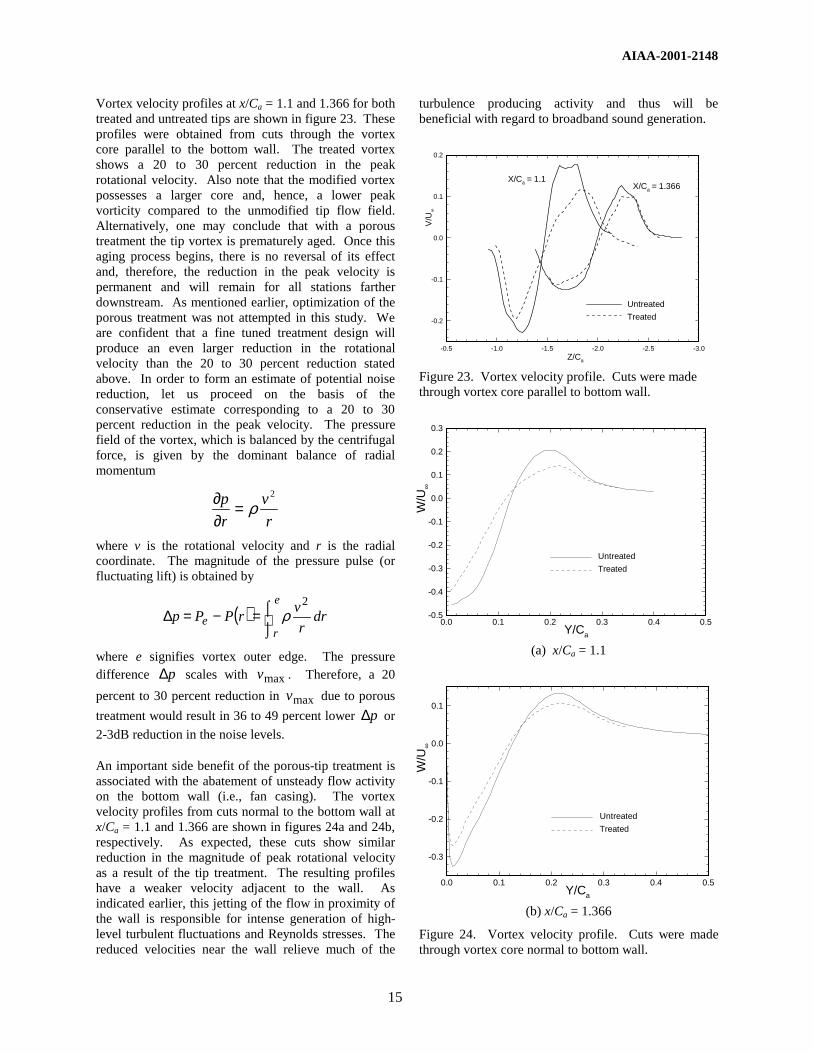
Vortex velocity profiles at x/Ca = 1.1 and 1.366 for both treated and untreated tips are shown in figure 23. These profiles were obtained from cuts through the vortex core parallel to the bottom wall. The treated vortex shows a 20 to 30 percent reduction in the peak rotational velocity. Also note that the modified vortex possesses a larger core and, hence, a lower peak vorticity compared to the unmodified tip flow field. Alternatively, one may conclude that with a porous treatment the tip vortex is prematurely aged. Once this aging process begins, there is no reversal of its effect and, therefore, the reduction in the peak velocity is permanent and will remain for all stations farther downstream. As mentioned earlier, optimization of the porous treatment was not attempted in this study. We are confident that a fine tuned treatment design will produce an even larger reduction in the rotational velocity than the 20 to 30 percent reduction stated above. In order to form an estimate of potential noise reduction, let us proceed on the basis of the conservative estimate corresponding to a 20 to 30 percent reduction in the peak velocity. The pressure field of the vortex, which is balanced by the centrifugal force, is given by the dominant balance of radial momentum
r
v
r
p 2
ρ=∂∂
where v is the rotational velocity and r is the radial coordinate. The magnitude of the pressure pulse (or fluctuating lift) is obtained by
( ) ⌡⌠=−=∆
e
re dr
r
vrPPp
2ρ
where e signifies vortex outer edge. The pressure difference p∆ scales with maxv . Therefore, a 20
percent to 30 percent reduction in maxv due to porous
treatment would result in 36 to 49 percent lower p∆ or
2-3dB reduction in the noise levels.
An important side benefit of the porous-tip treatment is associated with the abatement of unsteady flow activity on the bottom wall (i.e., fan casing). The vortex velocity profiles from cuts normal to the bottom wall at x/Ca = 1.1 and 1.366 are shown in figures 24a and 24b, respectively. As expected, these cuts show similar reduction in the magnitude of peak rotational velocity as a result of the tip treatment. The resulting profiles have a weaker velocity adjacent to the wall. As indicated earlier, this jetting of the flow in proximity of the wall is responsible for intense generation of high-level turbulent fluctuations and Reynolds stresses. The reduced velocities near the wall relieve much of the
turbulence producing activity and thus will be beneficial with regard to broadband sound generation.
-3.0-2.5-2.0-1.5-1.0-0.5
-0.2
-0.1
0.0
0.1
0.2
Z/Ca
X/Ca = 1.1X/Ca = 1.366
Untreated
Treated
V/U
∞
Figure 23. Vortex velocity profile. Cuts were made through vortex core parallel to bottom wall.
0.0 0.1 0.2 0.3 0.4 0.5-0.5
-0.4
-0.3
-0.2
-0.1
0.0
0.1
0.2
0.3
Y/Ca
W/U
∞
Untreated
Treated
(a) x/Ca = 1.1
0.0 0.1 0.2 0.3 0.4 0.5
-0.3
-0.2
-0.1
0.0
0.1
Y/Ca
W/U
∞
Untreated
Treated
(b) x/Ca = 1.366
Figure 24. Vortex velocity profile. Cuts were made through vortex core normal to bottom wall.
AIAA-2001-2148
16
5. Computation of Reduced Tip- Clearance
Because a reduced tip clearance would also lead to a weaker tip vortex, it is instructive to compare the associated flow-field modification with that produced by the porous tip treatment. While the aerodynamic benefits of reduced tip clearance (in particular, in terms of increased efficiency) are known, practical considerations limit the tip clearance to a finite value. The porous tip treatment can, thus, be used either in conjunction with or in lieu of reduced tip clearance to achieve the acoustic benefits in terms of reduced tip-clearance noise. To that end, we now describe the results obtained for a solid (i.e., nonporous) tip but with a smaller tip clearance compared to the baseline case examined in section 3.
Although the highest fan aerodynamic efficiency is achieved in the limit of zero tip-clearance, operational considerations dictate the presence of a finite gap. Depending on the engine manufacturer and type, the ratio of tip-clearance to blade span ranges between 0.5 percent and 1.5 percent in a typical high-bypass engine fan. The tip-clearance in our baseline simulation is 0.155 inches (0.394 cm). Based on the present 11 inches (27.94 cm) rotor span, a ratio of 1.4 percent is obtained, which falls within the above range. To form an estimate of effective tip-clearance for the porous treatment, tip-clearance for the untreated baseline configuration was reduced by 50 percent to 0.7 percent (0.0775 inches [0.197 cm]) and the computation was repeated.
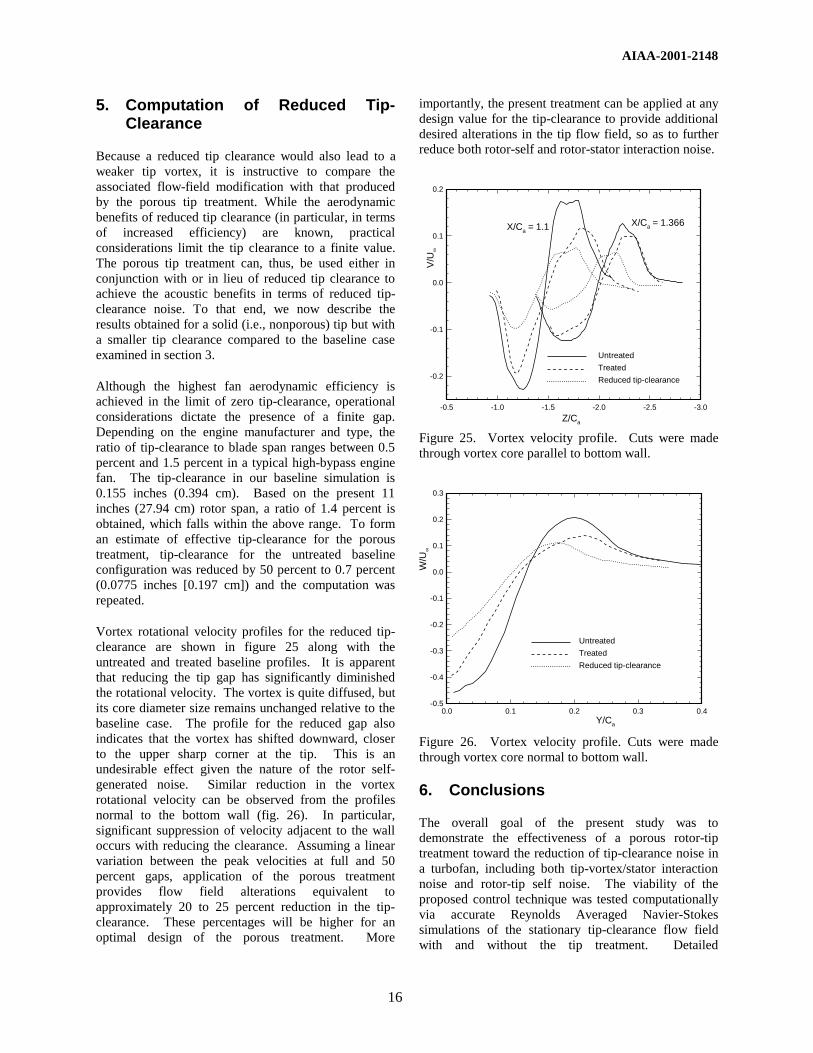
Vortex rotational velocity profiles for the reduced tip-clearance are shown in figure 25 along with the untreated and treated baseline profiles. It is apparent that reducing the tip gap has significantly diminished the rotational velocity. The vortex is quite diffused, but its core diameter size remains unchanged relative to the baseline case. The profile for the reduced gap also indicates that the vortex has shifted downward, closer to the upper sharp corner at the tip. This is an undesirable effect given the nature of the rotor self-generated noise. Similar reduction in the vortex rotational velocity can be observed from the profiles normal to the bottom wall (fig. 26). In particular, significant suppression of velocity adjacent to the wall occurs with reducing the clearance. Assuming a linear variation between the peak velocities at full and 50 percent gaps, application of the porous treatment provides flow field alterations equivalent to approximately 20 to 25 percent reduction in the tip-clearance. These percentages will be higher for an optimal design of the porous treatment. More
importantly, the present treatment can be applied at any design value for the tip-clearance to provide additional desired alterations in the tip flow field, so as to further reduce both rotor-self and rotor-stator interaction noise.
-3.0-2.5-2.0-1.5-1.0-0.5
-0.2
-0.1
0.0
0.1
0.2
Untreated
Treated
Reduced tip-clearance
Z/Ca
V/U
∞
X/Ca = 1.1 X/Ca = 1.366
Figure 25. Vortex velocity profile. Cuts were made through vortex core parallel to bottom wall.
0.0 0.1 0.2 0.3 0.4-0.5
-0.4
-0.3
-0.2
-0.1
0.0
0.1
0.2
0.3
Untreated
Treated
Y/Ca
W/U
∞
Reduced tip-clearance
Figure 26. Vortex velocity profile. Cuts were made through vortex core normal to bottom wall.
6. Conclusions
The overall goal of the present study was to demonstrate the effectiveness of a porous rotor-tip treatment toward the reduction of tip-clearance noise in a turbofan, including both tip-vortex/stator interaction noise and rotor-tip self noise. The viability of the proposed control technique was tested computationally via accurate Reynolds Averaged Navier-Stokes simulations of the stationary tip-clearance flow field with and without the tip treatment. Detailed
AIAA-2001-2148
17
comparison between the computed baseline solution and experimental measurements for the untreated configuration showed excellent agreement. Subsequently, extensive analysis of the computational database for the treated and untreated cases was performed. Relevant features of the gap flow field—such as primary and secondary vortex formation, boundary layer separation, and vortex structure—were extracted. Computed mean-flow modification as a result of the treatment was used in conjunction with previously known mechanisms of noise generation to assess the aeroacoustic implications of the proposed tip treatment. Even without any optimization of the treatment design, the proposed treatment was able to alter the acoustically relevant features of the tip-clearance flow, both in the vicinity of the tip and farther downstream (i.e., near the anticipated stator location). We showed that the proposed tip treatment moves the vortex trajectory away from the tip edge and, hence, substantially weakens a dominant component of the rotor self-noise. Strength of the tip-clearance vortex is also diminished as a result of the treatment, yielding additional noise suppression via reduced rotor-stator interaction noise. A noteworthy aspect of the proposed treatment concept is that the accompanying changes in aerodynamic performance are practically insignificant.
Acknowledgements
Most of the present study was accomplished under a Phase I SBIR award from NASA Glenn Research Center. The authors would like to express their deepest appreciation to Dr. James Dittmar of NASA Glenn and Professor William J. Devenport of Virginia Polytechnic Institute and State University for providing crucial information pertaining to this study as well as for several helpful discussions. The contribution of Dr. Edward B. Parlette of Vigyan Corporation, who generated the initial grid and all the required modifications thereafter, is also greatly appreciated.
References 1. Ganz, U. W., Joppa, P. D., Patten, T. J., and
Scharpf, D. F., “Boeing 18-Inch Fan Rig Broadband Noise Test,” NASA Contractor Report CR-1998-208704 (1998).
2. Suder, K. L. and Celestina, M. L., “Experiments and Computational Investigation of the Tip Clearance Flow in a Transonic Axial Compressor Rotor,” NASA TM 106711 (1994).
3. Hah, C., Loellbach, J. M., and Lee, Y. T., “Generation and Transport of Tip Clearance Vortices in a High Reynolds Number Axial Flow Rotor,” In: Computational Fluid Dynamics in
Aeropropulsion; Proceedings of the ASME International Mechanical Engineering Congress and Exposition, San Francisco, CA, Nov. 12-17, 1995, pp. 31-44 (1995)
4. Kameier, F. and Neise, W., “Experimental Study of Tip Clearance Losses and Noise in Axial Turbo-machines and Their Reduction,” ASME J. Turbomachinery, Vol. 119, pp. 460-471 (1997).
5. Devenport, W. J. and Ragab, S. A., “Results from the Virginia Tech Fan Cascade,” presented at NASA Advance Subsonic Technology Engine Noise Workshop held at Ohio Aerospace Institute, April 21-23 (1998).
6. Groeneweg, J. F., Sofrin, T. G., Rice, E. J., and Gliebe, P. R., “Turbomachinery Noise,” Aeroacoustics of Flight Vehicles: Theory and Practice, NASA Ref. Pub. 1258, Vol. 1, 151 (1991).
7. Cumpsty, N. A. and Lowrie, B. W., “The Cause of Tone Generation by Aero-Engine Fans at High Subsonic Tip Speeds and the Effect of Forward Speed,” ASME Paper 73-WA/GT-4 (1973).
8. Feiler, C. E. and Merriman, J. E., “Effects of Forward Velocity and Acoustic Treatment on Inlet Fan Noise,” AIAA Paper 74-946 (1974).
9. Dittmar, J., “Interaction of Rotor Tip Flow Irregularities with Stator Vanes as a Noise Source,” NASA TM 73706 (1977).
10. Dittmar,. J. H., Woodward, R. P., and MacKinnon, M. J., “Fan Noise Reduction Achieved by Removing Tip Flow Irregularities Behind the Rotor-Forward Arc Test Configuration,” NASA TM 83616 (1984).
11. Copenhaver, W. W., Puterbaugh, S. L., and Hah, C., “Unsteady Effects Due to Interactions Between Tip-Clearance Vortex and Rotor Passage Shock in a Transonic Compressor Rotor,” In: ISABE-International Symposium on Air Breathing Engine, 12th, Melbourne, Australia, Sept. 10-15, 1995, Proceedings, Vol. 2, Washington, DC, AIAA, pp. 793-801 (1995).
12. Sellin, M. D., Puterbaugh, S. L., and Copenhaver, W. W., “Tip Shock Structures in Transonic Compressor Rotors,” AIAA Paper 93-1869 (1993).
13. Adamczyk, J. J., Celestina, M. L., and Greitzer, E. M., “The Role of Tip Clearance in High-Speed Fan Stall,” ASME J. Turbomachinery, Vol. 115, pp. 28-39 (1993).
14. Kameier, F., Nawrot, T., and Neise, W., “Experimental Investigation of Tip Clearance Noise in Axial Flow Machines,” Proc. 14th DGLR/AIAA Aeroacoustics Conference Aachen,
AIAA-2001-2148
18
DGLR Bericht 92-03, pp. 250-259, Paper No. 92-02-040, Bonn, Germany (1992).
15. Meadows, K. R., Brooks, T. F., Humphreys, W. M., Hunter, W. H., and Gerhold, C. H., “Aeroacoustic Measurements of a Wing-Flap Configuration,” AIAA Paper 97-1595 (1997).
16. Paterson, R. W., Amiet, R. K., and Munch, C. L., “Isolated Airfoil-Tip Vortex Interaction Noise,” J. Aircraft, Vol. 12, pp. 34-40 (1975).
17. Radeztsky, R. H., Singer, B. A., and Khorrami, M. R., “Detailed Measurements of a Flap Side-Edge Flow Field,” AIAA Paper 98-0700 (1998).
18. Khorrami, M. R., Singer, B. A. and Takallu, M., "Analysis of Flap Side-Edge Flow field for Identification and Modeling of Possible Noise Sources," SAE Paper No. 971917, SAE Noise and Vibration Conference and Exposition, Traverse City, MI, May (1997).
19. Khorrami, M. R., Singer, B. A., and Radeztsky, Jr., R. H., “Reynolds Averaged Navier-Stokes Computations of a Flap Side-Edge Flow Field,” AIAA Journal, Vol. 37, No. 1, pp. 14-22 (1999).
20. Streett, C. L., “Numerical Simulation of Fluctuations Leading to Noise in a Flap-Edge Flow field,” AIAA Paper 98-0628 (1998).
21. Khorrami, M. R. and Singer, B. A., “Stability Analysis for Noise-Source Modeling of a Part-Span Flap,” AIAA J., Vol. 37, No. 10, pp. 1206-1212 (1999).
22. Macaraeg, M. G., “Fundamental Investigations of Airframe Noise,” AIAA Paper 98-2224 (1998).
23. Storms, B. L., Ross, J. C., Horne, W. C., Hayes, J. A., Dougherty, R. P., Underbrink, J. R., Scharpf, D. F., and Moriarty, P. J., “An Aeroacoustic Study of an Unswept Wing with a Three-Dimensional High-Lift System,” NASA TM-1998-112222 (1998).
24. Ash, R. L., and Khorrami, M. R., “Vortex Stability,” Chapter 8 in Fluid Vortices (edited by S. I. Green), Kluwer Academic Publishers, (1995).
25. Phillips, W. R. and Graham, J. A. H., “Reynolds-Stress Measurements in a Turbulent Trailing Vortex,” J. Fluid Mech., Vol. 147, pp. 353-371 (1984).
26. Fink, M. R. and Bailey, D. A., “Airframe Noise Reduction Studies and Clean-Airframe Noise Investigation,” NASA Contractor Report 159311 (1980).
27. Revell, J. D., Kuntz, H. L., Balena, F. J., Horne, C., Storms, B. L., and Dougherty, R. P., "Trailing-Edge Flap Noise Reduction by Porous Acoustic Treatment,” AIAA Paper 97-1646 (1997).
28. Smith, H. C., “Method for Reducing the Tangential Velocity in Aircraft Trailing Vortices,” J. Aircraft, Vol. 17, No. 12, pp. 861-866 (1980).
29. Muthanna, C., "Flow field Downstream of a Compressor Cascade with Tip Leakage," Master's thesis, Virginia Polytechnic Institute and State University (1998).
30. Wisler, D. C., “Core Compressor Exit Stage Study, Volume IV-Date and Performance Report for the Best Stage Configuration,” NASA Contractor Report CR-165357, 1981.
31. Thomas, J., Krist, S., and Anderson, W., “Navier-Stokes Computations of Vortical Flows Over Low Aspect-Ratio Wings,” AIAA J., Vol. 28, pp. 205 (1990).
32. Berkman, M. E., Khorrami, M. R., Choudhari, M. M., and Sadowski, S. S., “Investigation of High-Lift Flowfield of an Energy Efficient Transport Wing,” J. Aircraft, Vol. 37, No. 1, pp. 45-52 (1999).
33. Spalart, P. R. and Allmaras, S. R., “A One-Equation Turbulence Model for Aerodynamic Flows,” AIAA Paper 92–0439 (1992).
34. Rogers, S. W., Menter, F. R., Durbin, P. A., and Mansour, N. N., “A Comparison of Turbulence Models in Computing Multi-Element Airfoil Flows,” AIAA Paper 94–9201 (1994).
35. Rumsey, C. L., Sanetrik, M. D., Biedron, R. T., Melson, N. D., and Parlette, E. B., “Efficiency and Accuracy of Time-Accurate Turbulent Navier-Stokes Computations,” Computers & Fluids, Vol. 25, No. 2, pp. 217–236 (1996).
36. Dacles-Mariani, J., Rogers, S., Kwak, D., Zilliac, G., and Chow, J., “A Computational Study of Wingtip Vortex Flowfield,” AIAA Paper 93-3010, AIAA 24 th Fluid Dynamics Conference, July 6-9, Orlando, FL (1993)
37. Motsinger, R. E., Syed, A. A., and Manley, M. B., “The Measurement of the Steady Flow Resistance of Porous Materials,” AIAA Paper 83-0779 (1983).
AIAA-2001-2148
19
Figure 4. Plan View of inlet section and downstream section of cascade arrangement in the experiment by Muthanna29.
x/ca=1.366
x/ca=2.062
x/ca=2.831
x/ca=3.770
x/ca=4.640
Direction ofview shown inplots
Line parallel to tailboards
x (from l.e. line)
W,w
52.6o
V,vU,u
z (from mid-passage)
Uref
y (from endwall)
ca=5.46"
c=10.0"
Measurement planes
Blade 5
Blade 6
Blade 4
Blade 3
s/2 s=9.29"
Figure 7. Coordinate system used for comparison between computation and experiment (Muthanna29).
Copyright © 2022 FDOKUMEN