Notions and expectations related to work and jobs among first ...
18
NOTIONS AND EXPECTATIONS RELATED TO WORK AND JOBS AMONG FIRST-YEAR UNIVERSITY STUDENTS Adrian Nagy University of Debrecen, Debrecen, Hungary e-mail: [email protected] ORCID: 0000-0002-3813-9759 Veronika Liskuné Vathy University of Debrecen, Debrecen, Hungary e-mail: [email protected] ORCID: 0000-0003-3923-216X © 2019 Adrian Nagy, Veronika Liskuné Vathy This is an open access article distributed under the Creative Commons Attribution-NonCommercial- -NoDerivs license (http://creativecommons.org/licenses/by-nc-nd/3.0/) DOI: 10.15611/fins.2019.4.05 JEL Classification: O15 FINANCIAL SCIENCES NAUKI O FINANSACH Year 2019, Vol. 24, No. 4 ISSN 2080-5993 e-ISSN 2449-9811 Abstract: Demands concerning the labor market in Hungary tend to change these days faster than ever. It can be seen even in the plans and expectations of students enrolled in higher education institutions. In our research project, we have tried to find answers to the following questions: What kind of work experience did students have when they started their university studies in the 2019/2020 academic year? What jobs do they foresee for themselves in the future? What kind of salary do they expect to get for this, and what sort of considerations and persons influence them in the process of choosing a workplace? Furthermore, do they wish to live and work in Hungary or in another country? During the course of our survey, we used a questionnaire, for the analysis of which we completed correlation analyses and cross-tab(ulation) analyses among other things. After the evaluation of the findings and results, we may state that the majority of the students in the sample do have some work experience. Furthermore, the criteria influencing their choice of work(place) are also presented. Keywords: higher education, employment, workplace, salary. 1. Introduction Nowadays, starting to make plans for the future is worthwhile for students in higher education as early as at the beginning of their studies. Young people today have very specific notions about finding a job. They have plans about what kind of a job they would like to get, where and at what sort of a workplace they imagine for their future, and what kind of salary they expect to receive. Even as early as during the course of their studies, they keep paying attention to and devoting their energies to
-
Upload
khangminh22 -
Category
Documents
-
view
3 -
download
0
Transcript of Notions and expectations related to work and jobs among first ...

NOTIONS AND EXPECTATIONS RELATED TO WORK AND JOBS AMONG FIRST-YEAR UNIVERSITY STUDENTS
Adrian NagyUniversity of Debrecen, Debrecen, Hungarye-mail: [email protected]: 0000-0002-3813-9759
Veronika Liskuné VathyUniversity of Debrecen, Debrecen, Hungarye-mail: [email protected]: 0000-0003-3923-216X
© 2019 Adrian Nagy, Veronika Liskuné VathyThis is an open access article distributed under the Creative Commons Attribution-NonCommercial- -NoDerivs license (http://creativecommons.org/licenses/by-nc-nd/3.0/)
DOI: 10.15611/fins.2019.4.05 JEL Classification: O15
FINANCIAL SCIENCES NAUKI O FINANSACHYear 2019, Vol. 24, No. 4
ISSN 2080-5993 e-ISSN 2449-9811
Abstract: Demands concerning the labor market in Hungary tend to change these days faster than ever. It can be seen even in the plans and expectations of students enrolled in higher education institutions. In our research project, we have tried to find answers to the following questions: What kind of work experience did students have when they started their university studies in the 2019/2020 academic year? What jobs do they foresee for themselves in the future? What kind of salary do they expect to get for this, and what sort of considerations and persons influence them in the process of choosing a workplace? Furthermore, do they wish to live and work in Hungary or in another country? During the course of our survey, we used a questionnaire, for the analysis of which we completed correlation analyses and cross-tab(ulation) analyses among other things. After the evaluation of the findings and results, we may state that the majority of the students in the sample do have some work experience. Furthermore, the criteria influencing their choice of work(place) are also presented.
Keywords: higher education, employment, workplace, salary.
1. Introduction
Nowadays, starting to make plans for the future is worthwhile for students in higher education as early as at the beginning of their studies. Young people today have very specific notions about finding a job. They have plans about what kind of a job they would like to get, where and at what sort of a workplace they imagine for their future, and what kind of salary they expect to receive. Even as early as during the course of their studies, they keep paying attention to and devoting their energies to

56 Adrian Nagy, Veronika Liskuné Vathy
demands of financing. Primarily, they assess the opportunities provided by the institutions of higher education, such as the possibility of applying for scholarships. Students whose performance does not qualify them for receiving a scholarship may find numerous opportunities for themselves in taking student jobs. Related to student jobs, the significance of accessing experience is also present in addition to earning money. They can also benefit from this after they graduate. Quite a number of students make up their minds already in high school that they would like to work abroad after graduation from college or university. During the course of our survey, we have overviewed the starting salary potential by individual fields, the salary expectations, and the changes in the minimal wage during the past time period. Following the secondary research, we shall also present the primary research, which we completed with the participants of the freshers’ camp held at the University of Debrecen in 2019. In the present paper, the responses received from the students of two faculties (Faculty of Medicine and Faculty of Law) are evaluated.
During the course of the survey, the respondents were students who started their studies at the University of Debrecen in the first semester of the 2019/2020 academic year. Responses from students of two faculties (Faculty of Medicine and Faculty of Law) were aggregated and analyzed. After the data cleaning process, 132 questionnaires from the Faculty of Medicine and 131 questionnaires from the Faculty of Law could be analyzed and evaluated.
2. Research topicality
The significance of this research lies in the fact that there were 187 faculties operating in 64 institutions of higher education in Hungary in the fall semester of the 2018/2019 academic year. The number of students enrolled in higher education in the 2000/2001 and the 2018/2019 academic years was between 283,000 and 424,000, which concerns directly 2.04 % of the total population of 9 772 756. As many as an average of 200,000 of this number were full-time students. Compared to the last year’s figure, a total of 1.1% less students did not pursue their studies. A decrease could be observed in the case of BA students (1.6%) and in the case of MA students (4.1%), while the number of students working for a doctoral degree increased by 1.3% [I5, I6].
According to Statisztikai Tükör [I6] published by Központi Statisztikai Hivatal (Hungarian Central Statistical Office), the changes in the number of full-time students in the various programs between 2010 and 2018 are illustrated in the following chart (Figure 1).
Students in higher education first come across scholarships and other opportunities primarily provided by their institutions during the course of their studies [Fenyves et al. 2019]. As a consequence, we intend to present various types of scholarships they can receive if they are eligible. Means of support provided by the University of Debrecen are as follows [I2].

Notions and expectations related to work and jobs among first year university students 57
Figure 1. Number of full-time students in institutions of higher education
Source: [I6], p. 4.
These can be divided into two groups. The first group contains the types of support based on academic performance, while the second group comprises forms of support available on the basis of the students’ social standing or background.
After graduation, an important component in the process of making a decision about what job to choose is the extent of available salary. During the course of identifying the amount of a starting salary, the basis is often the minimum wage. According to the official data released by Nemzeti Adó- és Vámhivatal (National Tax and Customs Administration of Hungary), the amount of the minimum wage has changed in the past years as shown in the table below (Table 1). It is clearly visible that it displays a continuously increasing tendency: by 2019, it has grown to a gross HUF 149,000. In addition to this, the amount of the guaranteed minimum wage should also be noted, which has increased to a gross HUF 195,000 [I8].
Table 1. Gross minimum wage in the time period between 2012 and 2019
2012 HUF 93,0002013 HUF 98,0002014 HUF 101,5002015 HUF 105,0002016 HUF 111,0002017 HUF 127,5002018 HUF 138,0002019 HUF 149,000
Source: [I8].

58 Adrian Nagy, Veronika Liskuné Vathy
In our research project, we have examined the opinions of first-year students who will graduate to find employment in the fields of medicine and law. Related to this, the officially announced wage/salary amounts in their professions are also overviewed. We wish to highlight how the salaries of physicians have changed, presenting them in Figure 2. The chart clearly shows that the gross amount of the salaries of physicians reached HUF 400,000 by 2018 [I1].
Figure 2. Salaries of physicians in the time period between 2012 and 2018
Source: [I1].
The labor market today has to face the problem of fresh graduates who do not wish to find a job for themselves in Hungary but somewhere else abroad. As a consequence of this, there are a lot of vacant job positions. In various sectors, like, for example, in healthcare, a big problematic issue is the emigration of physicians from Hungary. In his study Varga [2016] gives the reason of the decrease in the number of physicians which partly is migration, and also the fact that young people opt for a career change in Hungary. Another study by Pónusz et al. [2016] reaches the conclusion that “it is necessary to increase the extent of financial and ethical appreciation in the Hungarian healthcare system in order to reduce the extent of taking jobs abroad”. There are various studies published about how it is possible to measure the emigration of physicians and what kind of possibilities are available for an international comparison [see: Buchan et.al. (eds.) 2014; Dumont, Zurn 2007; Mercay et al. 2015; Tjadens et.al. (eds.) 2013; Böcskei et. al. 2018].
In general, emigration may have a number of different reasons. In addition to financial rewards, several other factors have also appeared. One of them concerns the psychic effect of it, which has been detailed by Golovics [2016], who arrives at the conclusion that it has evolved into a novel approach to migration, which needs to be noted and considered [Böcskei et al. 2019].
0 50000 100000 150000 200000 250000 300000 350000 400000 450000
2018
2017
2016
2015
2014
2013
2012
HUF
Yea
r
Notions and expectations related to work and jobs among first year university students 59
High-volume emigration from Hungary to western countries started due to the 2008 economic crisis [Obádovics 2017]. Around 2014, the demand to deal with the problem caused by the emigration emerged, which was prompted by the fact that there was a deficiency of highly qualified experts and specialists [Hegedűs 2014]. We believe that this problem has become even more serious by now, which has resulted in a growing degree of labor shortage.
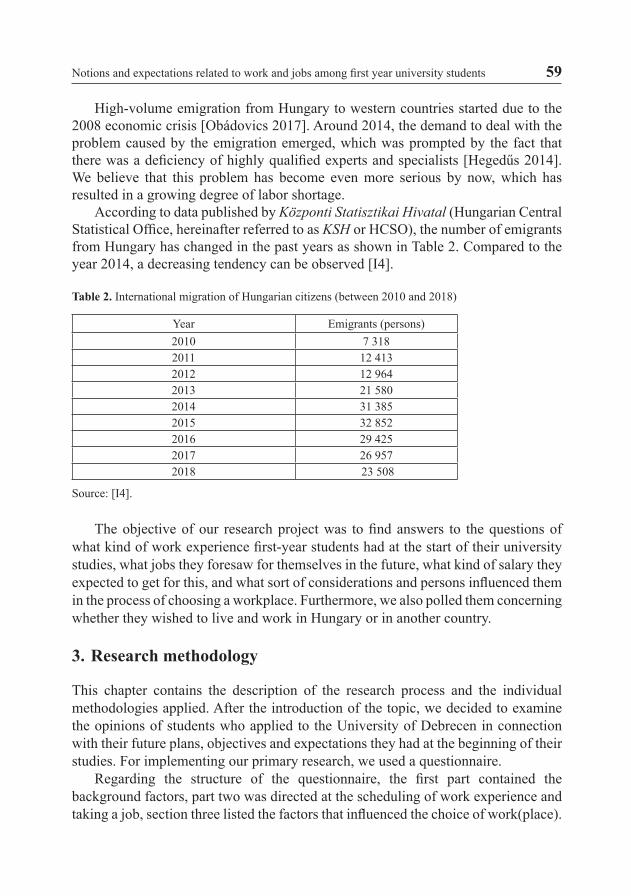
According to data published by Központi Statisztikai Hivatal (Hungarian Central Statistical Office, hereinafter referred to as KSH or HCSO), the number of emigrants from Hungary has changed in the past years as shown in Table 2. Compared to the year 2014, a decreasing tendency can be observed [I4].
Table 2. International migration of Hungarian citizens (between 2010 and 2018)
Year Emigrants (persons)2010 7 3182011 12 4132012 12 9642013 21 5802014 31 3852015 32 8522016 29 4252017 26 9572018 23 508
Source: [I4].
The objective of our research project was to find answers to the questions of what kind of work experience first-year students had at the start of their university studies, what jobs they foresaw for themselves in the future, what kind of salary they expected to get for this, and what sort of considerations and persons influenced them in the process of choosing a workplace. Furthermore, we also polled them concerning whether they wished to live and work in Hungary or in another country.
3. Research methodology
This chapter contains the description of the research process and the individual methodologies applied. After the introduction of the topic, we decided to examine the opinions of students who applied to the University of Debrecen in connection with their future plans, objectives and expectations they had at the beginning of their studies. For implementing our primary research, we used a questionnaire.
Regarding the structure of the questionnaire, the first part contained the background factors, part two was directed at the scheduling of work experience and taking a job, section three listed the factors that influenced the choice of work(place).

60 Adrian Nagy, Veronika Liskuné Vathy
while the last unit was directed at the exploration of students’ interests and the potential form(at)s of orientation.
We started the evaluation with the survey data cleaning, the result of which was a total item number of 263. Furthermore, we implemented a transformation referring to the responses which concerned the identification of the major, as there were three different majors identified by only one person, each at the Faculty of Medicine (in their case, we created the category ‘other’). The recoding process was done with the function of SPSS Recode into Different Variables [Csallner 2015]. From the aspect of response choices, the survey contained open-ended, partially closed-ended and closed-ended questions, as well as direct and indirect questions from the aspect of direction.
3.1. The process of statistical analysis
The analysis consisted of three main phases. The first phase comprised the preparation of the database, the aim of which was to test reliability and to prepare the Likert scales for the analysis. The second phase consisted of the examination of the database, the aim of which was the implementation of the normality test and the preparation of the descriptive statistics. Finally, in the third phase, we examined the relationships between the considerations and the connection between the considerations and the socio-demographic factors. In the case of the questions containing the scales, we carried out the following examinations. We implemented the reliability test occurring during the course of the preparation of the database by specifying Cronbach’s alpha coefficient. The importance of the examination lies in whether the reliability of the scale satisfies the criteria identified. Cronbach’s alpha values can be divided into six categories [Gliem 2003]. Following this, we completed the normality test. Before the evaluation of the questionnaire, we examined if the sample had a normal degree of distribution. For this examination, we conducted the Kolmogorov-Smirnov test. In the case of normal distribution, the p-value is above 0.05, whereas any value below that means that the sample does not display normal distribution.
For the analyses, we used the program of IBM SPSS 22 Statistics. The software was used for the following examinations: the normality test, the identification of the reliability level, and correlation analyses. The diagrams were prepared with the help of Microsoft Excel.
4. Findings and results
In this chapter, we present the results of the questionnaire analysis in detail. The first focus is on the presentation of descriptive statistics. In Figure 3, it is clearly visible that, on the basis of the gender proportion of students enrolled in the two faculties, the number of female students is higher. The female-male ratio at the two faculties is proportionally identical: there are roughly twice as many female students as males.

Notions and expectations related to work and jobs among first year university students 61
According to the statistics issued by Oktatási hivatal (Educational Authority), the ratio of female students in the time period between the 2000 and the 2017 academic years was between 52% and 58% [I9].
The next analysis was directed at surveying the permanent addresses of students. The following pie chart (Figure 4) shows that students from the two faculties came mainly from cities (120 persons) and from the county seat (90 persons).
Figure 4. Distribution of students according to settlements (N=263)
Source: own work 2019.
Figure 3. Gender distribution of the sample
Source: own work 2019.
0
20
40
60
80
100
120
female male
Pers
ons
Gender N = 263
Faculty of Law Faculty od Medicine
90
120
16
N=263
county seat city major village minor village
37 capita
90 capita
16 capita
120 capita

62 Adrian Nagy, Veronika Liskuné Vathy
The distribution by major is shown in Figure 5. The largest groups that stand out at the two faculties are those majoring as lawyers and in (general) medicine.
Figure 5. Distribution by major (persons), N=263
Source: own work 2019.
The following table shows the number of students whose application was accepted for the 2019/2020 academic year, according to the data published by the website Felvi.hu. It is clearly visible that both of these faculties were massively (multiply) oversubscribed. Of the total number of students admitted, 131 of those from the Faculty of Law completed the questionnaire, which corresponds to 26.7%, while the corresponding percentage figure at the Faculty of Medicine was 40.6%.
Table 3. Number of students admitted to DE-ÁJK and DE-ÁOK in the fall semester of the 2019/2020 academic year
Faculty Code Faculty Name Applicants/
TotalAdmitted/
TotalUD-FL Faculty of Law at the University of Debrecen 1110 490UD-FM Faculty of Medicine at the University of Debrecen 1645 325
Source: own work based on data published by Felvi.hu (2019).
The next two questions were about if they had any work experience and what kind of a job they expected as their future occupation. We examined the responses received with the help of correlation analysis. During the analysis, we asked four questions to which the respondents could answer by using a 4-grade Likert scale. For
3 19 11
85
35
110
Faculty of Medicine (other) medical diagnostic analyst legal assistantlawyer judicial administration medicine

Notions and expectations related to work and jobs among first year university students 63
the analysis, we used Pearson’s Correlation, the value of which is located between r = -1 and 1 and indicates what kind of a relationship can be identified between the considerations and aspects [Sajtos, Mitev 2007].
Table 4. Correlation analysis – job types
Correlations Intellectual activity Teamwork Manual work Looking for
challengesIntellectual activity
Pearson Correlation 1 0,011 -0,038 0,171**
Sig. (2-tailed) 0,861 0,540 0,005N 263 263 263 263
Teamwork Pearson Correlation 0,011 1 0,215** 0,013
Sig. (2-tailed) 0,861 0,000 0,838N 263 263 263 263
Manual work Pearson Correlation -0,038 0,215** 1 0,065
Sig. (2-tailed) 0,540 0,000 0,290N 263 263 263 263
Looking for challenges
Pearson Correlation 0,171** 0,013 0,065 1
Sig. (2-tailed) 0,005 0,838 0,290 N 263 263 263 263
** Correlation is significant at the 0.01 level (2-tailed).
Source: own work 2019.
In Table 4, it can be seen that, in the interest of supporting the hypothesis examination, the significance level of 0.000 is achieved in one case only: where the correlation between manual work and teamwork is 0.215. Among the respondents, 180 (68.44%) persons have previous work experience and 83 (31.56%) persons do not have any work experience of any kind. To this question, five answers could be chosen, where the fifth one was in the category ”other”. In the case of ”other”, all respondents wrote about some kind of work experience, so their responses were also filed under the group of affirmative answers. The first two choices allowed responses concerning work before their studies in higher education, while the remaining two choices were tantamount to the negative response.
In the following stage, we examined the initial salary identification. First, we looked at Faculty of Law student responses, which are shown in Figure 6.
The figure shows that the average net initial salary expectation is HUF 279,122. There are some outstanding values, such as the minimum amount of HUF 50,000

64 Adrian Nagy, Veronika Liskuné Vathy
Figure 6. The initial salary expectations of Faculty of Law students (N=131)
Source: own work 2019.
Figure 7. Initial salary expectations of Faculty of Medicine students (N=132)
Source: own work 2019.
0
200000
400000
600000
800000
1000000
1200000
0 20 40 60 80 100 120 140
HU
F
0
100000
200000
300000
400000
500000
600000
700000
800000
900000
0 20 40 60 80 100 120 140
HU
F

Notions and expectations related to work and jobs among first year university students 65
and the maximum amount of HUF 1, 000,000. The median value was HUF 250,000 and the standard deviation value was HUF 139,555.
Figure 7 presents the initial salary expectations of Faculty of Medicine students. The average in this case is HUF 288,522. The minimum value identified was HUF 110,000 and the maximum value was HUF 800,000. The median value was HUF 250,000 and the standard deviation value was HUF 110,818.
When examining the initial salary expectations or requirements of the first-year students, we can see that the students of both faculties identified an approximately similar amount on average. What is noteworthy is that, in both cases, the median value was HUF 250,000. According to the survey conducted by Paylab, the members of the so-called Generation Z have expectations for a initial salary that are 9% higher than what would be realistic in their case [I7]. That is to say, if we take this into consideration and calculate with the median value, the realistic initial salary expectation in their case would be HUF 227,500. Figure 8 illustrates the joint analysis of salary expectations.
Figure 8. Initial salary expectations
Source: own work 2019.

66 Adrian Nagy, Veronika Liskuné Vathy
The next two questions concerned if they were planning to work abroad and, if they were, for how long. In this case, we applied a cross-tab analysis. Table 5 shows that a total of 114 students had plans for taking a job abroad. 16% of them planned to spend only a few months outside Hungary while working, 55% considered at least 2 or 3 years for this purpose, while 29% thought they could live and work abroad for a longer time period. Figure 9 displays how the plans to work abroad can be distributed
14
25
6
21
60
5
0 10 20 30 40 50 60 70 80 90
judicial administration
lawyer
legal assistant
Would like to work abroad Faculty of Law N=131
Yes No
0 10 20 30 40 50 60 70
medicine
medical diagnostic analyst
other
Would like to work abroad Faculty of Medicine N=132
No Yes
Table 5. Cross-tab analysis – plans to work abroad
CountTime abroad
Totalmaximum for a few months
for as long as 2-3 years
work and live abroad for a long time period
Planning to work abroad yes 24 64 34 122
Total 24 64 34 122
Source: own work 2019.
Figure 9. Plans to work abroad broken down by majors
Source: own work 2019.
Notions and expectations related to work and jobs among first year university students 67
among individual majors. We would wish to highlight that the responses from students of medicine show that more of them wish to work abroad than in Hungary.
For answering the next question, the respondents could use a 7-point Likert scale to evaluate the criteria influencing the choice of a workplace. For examining the reliability of the scale, we checked the Cronbach’s Alpha value, which is 0.753, and that means that the scale can be considered acceptable from the aspect of reliability. Then we performed Pearson’s Correlation. The results are shown in Appendix 1. Several aspects seem to be related here. We would wish to highlight the relationship between salary and atmosphere at the workplace, where the value of r is 0.496, which means a medium/moderate positive relationship, and also the relationship between the reputation of an enterprise (company) and the size of an enterprise, with a value of 0.550, which also indicates a medium/moderate positive relationship. The next question was an inquiry about the persons influencing the decision concerning the choice of a workplace. The choices for influencing individuals comprised the opinions of family, friends, partners, favourite teacher and people working there as well as the role of personal intuition. For this question, we introduced a 4-point Likert scale. The reliability of the scale was within the acceptable range, as its Cronbach’s Alpha value was 0.739. We also completed a Pearson’s Correlation analysis here, and the results are shown in Appendix 2. The relationships between the opinions of family and friends (0.647), family and partners (0.586), friends and partners (0.532), and the relevant university instructor and favourite teacher (0.560) are all moderate positive.
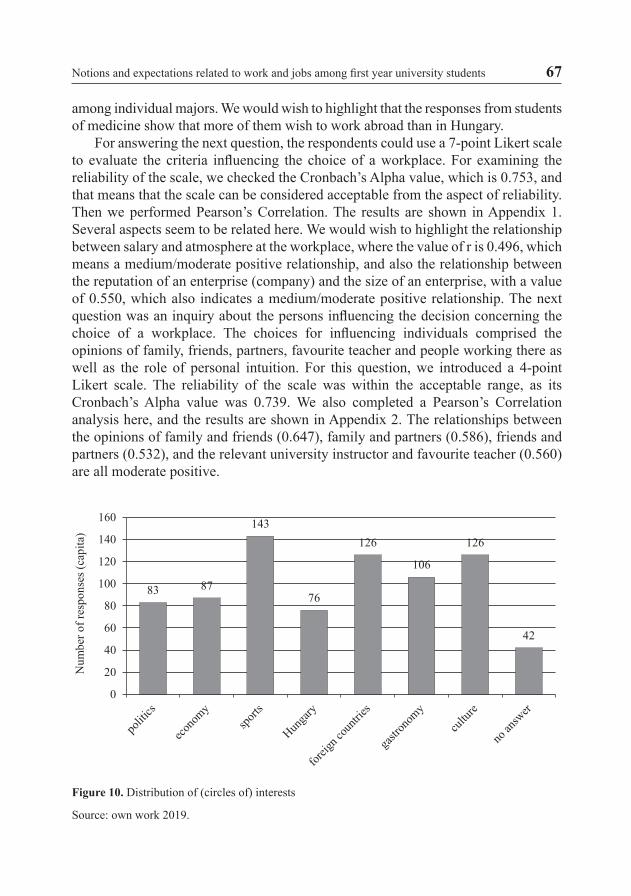
Figure 10. Distribution of (circles of) interests
Source: own work 2019.
83 87
143
76
126
106
126
42
0
20
40
60
80
100
120
140
160
Num
ber o
f res
pons
es (c
apita
)

68 Adrian Nagy, Veronika Liskuné Vathy
The last two questions concerned (circles of) interests and form(at)s of obtaining information. First, we wish to present interests. Due to the way the question was formulated, respondents had to identify three categories. If they identified only one or two of them, we put them in the group classified as ”no answer”. In Figure 10, it can be seen that they could choose from seven different categories. Among these circles of interests, respondents devoted significant attention to sports, foreign countries and culture.
Figure 11. Sources of information accessed
Source: own work 2019.
Figure 11 provides information about the sources of information accessed by students about the world in general. In the modern world of the Internet, our preliminary notion was supported by their choice of putting Internet news portals and social media to the first two places. The third place went to conversations with friends, which we believe is very important. The results show that print media and online newsletters are not ranked among popular sources of obtaining information. In the case of the members of Generation Z, it can be generally stated that their expectations differ from those of the other generations. These differences can be observed at the workplace during the course of working with others, which might come from the differing value system [I3].
5. Summary
On the basis of responses received to the questions formulated about the objective of our research, we reached the following results and conclusions. Today by selecting a variety of possibilities, young people do tend to take a job before they start their
201 209
21
72
141
24 57 64
0
50
100
150
200
250
Num
ber o
f res
pons
es (c
apita
)

Notions and expectations related to work and jobs among first year university students 69
studies in an institution of higher education. Almost 70% of students enrolled at the Faculty of Law and the Faculty of Medicine of the University of Debrecen for the first semester of the 2019/2020 academic year have some work experience. Concerning their expectations about their future work, they reckon that they can possibly get an initial net salary of HUF 250,000. A number of students would also wish to work abroad for a certain time period.
As regards their future, the members of Generation Z display an attitude towards work that is different from that of older generations. On the basis of our analysis, we can see that the most important factor influencing a choice of workplace for them is salary, followed by the atmosphere of the workplace, the reputation of the enterprise and its size. Furthermore, they make decisions concerning work on the basis of the opinions of family members, friends, partners, and the teaching staff who work in the institutions of higher education. One of the characteristic features of this generation is that its members grow up in a digital world, for which reason the most obvious source of accessing information for them are Internet-based news portals, social media sites and the opportunities provided by conversations and chats with their friends.
References
Böcskei E., Bács Z., Kovács B., Tarnóczi T., Fenyves V., 2018, Fókuszpontban a mobilitás – a magyar felsőoktatás a számok tükrében, Controller Info VI, no. 4, pp. 17-20.
Böcskei E., Bács Z., Kovács B., Tarnóczi T., Fenyves V., 2019, A nemzetközi diplomamobilitás stra- tégiai irányvonalai – a Magyarországon tanulmányokat folytató külföldi hallgatók motiváció, valamint a külföldi tanulmányokat befolyásoló tényezők vizsgálata, Competitio XVIII, no. 1-2, pp. 3-38.
Buchan J., Wismar M., Glinos I.A., Bremner J. (eds.), 2014, Health professional mobility in a changing Europe. New dynamics, mobile individuals and diverse responses, The European Observatory on Health Systems and Policies, Observatory Studies Series, Vol. II, no. 32, WHO, Copenhagen.
Csallner A.E., 2015, Bevezetés az SPSS statisztikai programcsomag használatába, Szegedi Tudo-mányegyetem, Szeged, p. 133.
Dumont J.Ch., Zurn P., 2007, Immigrant Health Workers in OECD Countries in the Broader Context of Highly Skilled Migration. International Migration Outlook, Sopemi, OECD, Paris, pp. 161-207.
Fenyves V., Bács Z., Kovács B., Tarnóczi T., Nemeslaki A., Böcskei E., 2019, Analysis of factors influ-encing foreign studies–strategic decisions–results of a Hungarian survey, Journal of Entrepreneur-ship Education, Vol. V, no. 22, pp. 1-21.
Gliem J.A., 2003, Calculating, Interpreting, and Reporting Cronbach’s Alpha Reliability Coefficient for Likert-Type Scales, Midwest Research-to-Practice Conference in Adult, The Ohio State University, Columbus.
Golovics J., 2016, Kivándorlás vagy maradás? A hűség szerepe a migrációs döntésekben, Competitio, Vol. XV, no. 2, pp. 3-21.
Hegedűs H., 2014, Munkavállalói mobilitás a hazai munkaerőpiacon, különös tekintettel a közszolgála-tra, Hadtudomány, Vol. XXIV, no. 1-2, pp. 35-43.
Merçay C., Dumont J.Ch., Lafortune G., 2015, Changing Patterns in the International Migration of Doctors and Nurses to OECD Countries, International Migration Outlook, OECD, Paris, pp. 105-176.

70 Adrian Nagy, Veronika Liskuné Vathy
Obádovics C.S., 2017, Hogyan alakult volna Magyarország népességszáma, ha a migrációs folyama-tok a Lengyel mintát követték volna?, Korfa, no. 2.
Pónusz R., Kovács D., Raposa L.B., Hock M., Decsi, T., Kránicz J., Endrei D., 2016, Külföldi munka-vállalás és pályaelhagyási indítékok a magyar gyógytornászok körében, Orvosi hetilap, Vol. 157, no. 9, pp. 342-349.
Sajtos L., Mitev A,. 2007, SPSS Kutatási és Adatelemzési Kézikönyv, Alinea Kiadó, Budapest, p. 404.Tjadens F., Weilandt C., Eckert J. (eds.), 2013, Mobility of Health Professionals. Health Systems, Work
Conditions, Patterns of Health Workers’ Mobility and Implications for Policy Makers, Springer-Verlag, Berlin-Heidelberg.
Varga J., 2016, Hová lettek az orvosok, Közgazdasági Szemle, Vol. LXIII, Január, pp. 1-26.
Internet sources:
I1 Barna E., 2019, Mennyit keres egy orvos?, https://www.hrportal.hu/hr/mennyit-keres-egy--orvos-20190430.html (access 10.10.2019).
I2 Debreceni Egyetem Ösztöndíjak és Juttatások, 2017, https://unideb.hu/hu/osztondijak-juttatasok, (access 20.09.2019).
I3 Istók E., 2019, Generációs problémák a munkahelyen, https://www.profession.hu/cikk/generacios--problemak-a-munkahelyen (access 15.10.2019).
I4 Központi Statisztikai Hivatal, 2019, A magyar állampolgárok nemzetközi vándorlása (2010), https://www.ksh.hu/docs/hun/xstadat/xstadat_eves/i_wnvn004.html (access 09.10.2019).
I5 Központi Statisztikai Hivatal, 2019, Magyarország népesség összesen, https://www.ksh.hu/docs/hun/eurostat_tablak/tabl/tps00001.html (access 05.09.2019).
I6 Központi Statisztikai Hivatal, 2019, Statisztikai Tükör 2019: A felsőoktatási intézmények nappali képzésein tanuló hallgatók számának alakulása, http://www.ksh.hu/docs/hun/xftp/idoszaki/oktat/oktatas1819.pdf (access 05.09.2019).
I7 Magabiztosak vagy irreálisak? Egyedül a pályakezdők fizetési elvárásai magasabbak, mint a valós bérek, https://www.fizetesek.hu/elemzesek/magabiztosak-vagy-irrealisak-egyedul-a-palyakezdok- -fizetesi-elvarasai-magasabbak-mint-a-valos-berek/50481? (access 20.09.2019).
I8 Nemzeti Adó- és Vámhivatal, 2019, Minimálbér alakulása, https://www.nav.gov.hu/nav/ado/jaru-lek/Minimalber__garantalt_berminimum.html (access 10.10.2019).
I9 Oktatási Hivatal, 2017, Egyetemi és főiskolai szintű, valamint alap-, mester- és osztatlan képzésben a nő hallgatók száma, https://www.oktatas.hu/felsooktatas/kozerdeku_adatok/felsooktatasi_ada-tok_kozzetetele/felsooktatasi_statisztikak (access 06.09.2019).
WYOBRAŻENIA I OCZEKIWANIA ZWIĄZANE Z PRACĄ I ZATRUDNIENIEM WŚRÓD STUDENTÓW PIERWSZEGO ROKU
Streszczenie: Wymagania dotyczące rynku pracy na Węgrzech zmieniają się obecnie szybciej niż kie-dydykolwiek. Jest to widoczne nawet w planach i oczekiwaniach studentów wyższych uczelni. W pro-jekcie badawczym staraliśmy się znaleźć odpowiedzi na następujące pytania: Jakie doświadczenie z pracą mają studenci kiedy zaczynali studia uniwersyteckie w roku akademickim 2019/2020? Jakie prace przewidują, że podejmą w przyszłości? Jakich spodziewają się zarobków oraz jakie względy i osoby mają na nich wpływ w procesie wyboru miejsca pracy? Ponadto, czy zamierzają mieszkać i pracować na Węgrzech, czy w innym kraju? W badaniu wykorzystaliśmy ankietę, dla analizy której przeprowadziliśmy między innymi analizy korelacji i tabel krzyżowych. Po przeprowadzeniu oceny danych i wyników możemy stwierdzić, że większość studentów objętych próbą ma pewne doświadcze-nie w pracy. Dodatkowo przedstawiliśmy kryteria wpływające na wybór miejsca pracy.
Słowa kluczowe: studia, zatrudnienie, miejsce pracy, wynagrodzenie.

Appendix 1 71
APPENDICESAppendix 1 Correlation analysis: factors influencing the process of finding a job
Cor
rela
tions
Fi
ndin
g a
job
with
in th
e pr
ofes
sion
Sala
ryR
eput
atio
n of
th
e en
terp
rise
Atm
osph
ere
at th
e w
orkp
lace
Dis
tanc
e fr
om
hom
e
Cle
ar
iden
tific
atio
n of
task
s
Size
of
ent
erpr
ise
Cha
nces
of
prom
otio
n
Get
ting
a fr
ee h
and
durin
g w
ork
Are
ther
e fr
iend
s wor
king
th
ere
who
re
com
men
d it
Find
ing
a jo
b w
ithin
the
prof
essi
on
Pear
son
Cor
rela
tion
10,
195**
0,15
7*0,
320**
0,26
0**0,
229**
0,14
8*0,
264**
0,20
2**0,
188**
Sig.
(2-ta
iled)
0,
002
0,01
10,
000
0,00
00,
000
0,01
60,
000
0,00
10,
002
N26
326
326
326
326
326
326
326
326
326
3Sa
lary
Pear
son
Cor
rela
tion
0,19
5**1
0,49
6**0,
214**
0,18
3**0,
121
0,34
5**0,
307**
0,25
4**0,
215**
Sig.
(2-ta
iled)
0,00
2
0,00
00,
000
0,00
30,
050
0,00
00,
000
0,00
00,
000
N26
326
326
326
326
326
326
326
326
326
3R
eput
atio
n of
th
e en
terp
rise
Pear
son
Cor
rela
tion
0,15
7*0,
496**
10,
262**
0,15
9**0,
177**
0,55
0**0,
292**
0,23
4**0,
347**
Sig.
(2-ta
iled)
0,01
10,
000
0,
000
0,01
00,
004
0,00
00,
000
0,00
00,
000
N26
326
326
326
326
326
326
326
326
326
3A
tmos
pher
e at
the
wor
kpla
ce
Pear
son
Cor
rela
tion
0,32
0**0,
214**
0,26
2**1
0,21
7**0,
106
0,19
1**0,
392**
0,25
8**0,
128*
Sig.
(2-ta
iled)
0,00
00,
000
0,00
0
0,00
00,
087
0,00
20,
000
0,00
00,
038
N26
326
326
326
326
326
326
326
326
326
3D
ista
nce
from
hom
ePe
arso
n C
orre
latio
n0,
260**
0,18
3**0,
159**
0,21
7**1
0,21
0**0,
169**
0,11
90,
096
0,32
1**
Sig.
(2-ta
iled)
0,00
00,
003
0,01
00,
000
0,
001
0,00
60,
054
0,12
10,
000
N26
326
326
326
326
326
326
326
326
326
3C
lear
id
entif
icat
ion
of ta
sks
Pear
son
Cor
rela
tion
0,22
9**0,
121
0,17
7**0,
106
0,21
0**1
0,29
1**0,
059
0,18
8**0,
198**
Sig.
(2-ta
iled)
0,00
00,
050
0,00
40,
087
0,00
1
0,00
00,
337
0,00
20,
001
N26
326
326
326
326
326
326
326
326
326
3Si
ze o
f en
terp
rise
Pear
son
Cor
rela
tion
0,14
8*0,
345**
0,55
0**0,
191**
0,16
9**0,
291**
10,
385**
0,24
6**0,
379**
Sig.
(2-ta
iled)
0,01
60,
000
0,00
00,
002
0,00
60,
000
0,
000
0,00
00,
000
N26
326
326
326
326
326
326
326
326
326
3C
hanc
es o
f pr
omot
ion
Pear
son
Cor
rela
tion
0,26
4**0,
307**
0,29
2**0,
392**
0,11
90,
059
0,38
5**1
0,25
9**0,
177**
Sig.
(2-ta
iled)
0,00
00,
000
0,00
00,
000
0,05
40,
337
0,00
0
0,00
00,
004
N26
326
326
326
326
326
326
326
326
326
3G
ettin
g a
free
han
d du
ring
wor
k
Pear
son
Cor
rela
tion
0,20
2**0,
254**
0,23
4**0,
258**
0,09
60,
188**
0,24
6**0,
259**
10,
257**
Sig.
(2-ta
iled)
0,00
10,
000
0,00
00,
000
0,12
10,
002
0,00
00,
000
0,
000
N26
326
326
326
326
326
326
326
326
326
3A
re th
ere
frie
nds w
orki
ng
ther
e w
ho
reco
mm
end
it
Pear
son
Cor
rela
tion
0,18
8**0,
215**
0,34
7**0,
128*
0,32
1**0,
198**
0,37
9**0,
177**
0,25
7**1
Sig.
(2-ta
iled)
0,00
20,
000
0,00
00,
038
0,00
00,
001
0,00
00,
004
0,00
0
N26
326
326
326
326
326
326
326
326
326
3
** C
orre
latio
n is
sign
ifica
nt a
t the
0.0
5 le
vel (
2-ta
iled)
.**
Cor
rela
tion
is si
gnifi
cant
at t
he 0
.01
leve
l (2-
taile
d).
Sour
ce: o
wn
wor
k 20
19.

72 Appendix 2 C
orre
latio
ns
Fa
mily
’s
opin
ion
My
frie
nds’
opin
ion
My
partn
er’s
op
inio
nPe
rson
al
intu
ition
Favo
rite
teac
her’s
op
inio
nR
elev
ant u
nive
rsity
te
am’s
opi
nion
Fam
ily’s
op
inio
nPe
arso
n C
orre
latio
n1
0,64
7**0,
586**
0,11
80,
201**
0,32
0**
Sig.
(2-ta
iled)
0,
000
0,00
00,
055
0,00
10,
000
N26
326
326
326
326
326
3
My
frie
nds’
opin
ion
Pear
son
Cor
rela
tion
0,64
7**1
0,53
2**0,
131*
0,20
6**0,
347**
Sig.
(2-ta
iled)
0,00
0
0,00
00,
034
0,00
10,
000
N26
326
326
326
326
326
3
My
partn
er’s
op
inio
n
Pear
son
Cor
rela
tion
0,58
6**0,
532**
10,
105
0,18
5**0,
291**
Sig.
(2-ta
iled)
0,00
00,
000
0,
088
0,00
30,
000
N26
326
326
326
326
326
3
Pers
onal
in
tuiti
onPe
arso
n C
orre
latio
n0,
118
0,13
1*0,
105
10,
128*
0,12
7*
Sig.
(2-ta
iled)
0,05
50,
034
0,08
8
0,03
80,
039
N26
326
326
326
326
326
3
Favo
rite
teac
her’s
op
inio
n
Pear
son
Cor
rela
tion
0,20
1**0,
206**
0,18
5**0,
128*
10,
560**
Sig.
(2-ta
iled)
0,00
10,
001
0,00
30,
038
0,
000
N26
326
326
326
326
326
3
Rel
evan
t un
iver
sity
te
am’s
op
inio
n
Pear
son
Cor
rela
tion
0,32
0**0,
347**
0,29
1**0,
127*
0,56
0**1
Sig.
(2-ta
iled)
0,00
00,
000
0,00
00,
039
0,00
0
N26
326
326
326
326
326
3
** C
orre
latio
n is
sign
ifica
nt a
t the
0.0
5 le
vel (
2-ta
iled)
.**
Cor
rela
tion
is si
gnifi
cant
at t
he 0
.01
leve
l (2-
taile
d).
Sour
ce: o
wn
wor
k 20
19.
Appendix 2
Correlation analysis: opinion of persons influencing the process of finding a job