Notice of Annual General Meeting and Integrated ... - Wipro
399
June 19, 2021 The Manager - Listing BSE Limited (BSE: 507685) The Manager - Listing National Stock Exchange of lndia Limited (NSE:WIPRO) The Market Operations NYSE, New York (NYSE: WIT) Dear Sir/Madam, Sub: Notice of Annual General Meeting and Integrated Annual Report for Financial Year 2020-21 Please refer to our letter dated June 18, 2021 intimating that the 75 th Annual General Meeting of the Company is scheduled to be held on Wednesday, July 14, 2021 at 9.00 AM IST through video conferencing. In continuation to the aforesaid letter, and pursuant to Section 108 of the Companies Act, 2013 and Regulations 30 and 34 of SEBI (Listing Obligations and Disclosure Requirements) Regulations, 2015, we are enclosing herewith the following: 1. Notice of the 75 th Annual General Meeting (including e-voting instructions) 2. Integrated Annual Report for the Financial Year 2020-21 The aforesaid documents are available on the website of the Company at https://www.wipro.com/investors/annual-reports/ and are being dispatched to all eligible shareholders whose email IDs are registered with the Company/Depositories. This is for your information and records. Thanking You, For Wipro Limited M Sanaulla Khan Company Secretary ENCL: As above.
-
Upload
khangminh22 -
Category
Documents
-
view
1 -
download
0
Transcript of Notice of Annual General Meeting and Integrated ... - Wipro

June 19, 2021
The Manager - Listing BSE Limited (BSE: 507685)
The Manager - Listing National Stock Exchange of lndia Limited (NSE:WIPRO)
The Market Operations NYSE, New York (NYSE: WIT)
Dear Sir/Madam,
Sub: Notice of Annual General Meeting and Integrated Annual Report for Financial Year 2020-21
Please refer to our letter dated June 18, 2021 intimating that the 75th Annual General Meeting of the Company is scheduled to be held on Wednesday, July 14, 2021 at 9.00 AM IST through video conferencing.
In continuation to the aforesaid letter, and pursuant to Section 108 of the Companies Act, 2013 and Regulations 30 and 34 of SEBI (Listing Obligations and Disclosure Requirements) Regulations, 2015, we are enclosing herewith the following:
1. Notice of the 75th Annual General Meeting (including e-voting instructions)2. Integrated Annual Report for the Financial Year 2020-21
The aforesaid documents are available on the website of the Company athttps://www.wipro.com/investors/annual-reports/ and are being dispatched to all eligibleshareholders whose email IDs are registered with the Company/Depositories.
This is for your information and records.
Thanking You,For Wipro Limited
M Sanaulla KhanCompany Secretary
ENCL: As above.

Registered Office: Doddakannelli, Sarjapur Road, Bengaluru- 560 035, Telephone: +91-80-28440011, Fax: +91-80-28440054, Website: www.wipro.com, E-mail: [email protected],
CIN: L32102KA1945PLC020800
Dear Members,
Invitation to attend the 75th Annual General Meeting on Wednesday, July 14, 2021
You are cordially invited to attend the Seventy Fifth Annual General Meeting of the Company to be held on Wednesday, July 14, 2021 at 9.00 AM IST through video conferencing. The notice convening the Annual General Meeting is attached herewith.
In order to enable ease of participation of the Members, we are providing below the key details regarding the meeting for your reference:
Sl.No.
Particulars Details
1 Link for live webcast of the AGM https://www.wipro.com/AGM2021/
2 Link for remote e-voting Members may refer to the instructions provided under “Procedure for E-Voting” section in the subsequent pages of this Notice
3 Helpline number for VC participation For any assistance or support before or during the AGM, Members may contact the Company at 080 - 2844 0011 or [email protected], or [email protected], or [email protected]
4 Cut-off date for e-voting Wednesday, July 7, 2021
5 Time period for remote e-voting Commences at 9.00 AM IST on Saturday, July 10, 2021 and ends at 5.00 PM IST on Tuesday, July 13, 2021
6 Book closure dates Monday, July 12, 2021 to Tuesday, July 13, 2021 (both days inclusive)
7 Link for Members to temporarily update e-mail address https://www.wipro.com/investors/
8 Last date for publishing results of the e-voting Friday, July 16, 2021
9 Registrar and Share Transfer Agent contact details Ms. Rajitha Cholleti, Assistant General Manager-Corporate Registry and Mr. B Srinivas, Manager (Unit: Wipro Limited), KFin Technologies Private Limited (KFintech)E-mail: [email protected]; [email protected] Contact no.: 040 - 6716 2222, Toll free no.: 1-800-3094-001
Yours truly,
Rishad A. Premji Chairman
Bengaluru June 9, 2021
WIPRO LIMITED
1Notice 2020-21

Registered Office: Doddakannelli, Sarjapur Road, Bengaluru- 560 035, Telephone: +91 80 28440011, Fax: +91-80-28440054, Website: www.wipro.com, E-mail: [email protected],
CIN: L32102KA1945PLC020800
NOTICE TO MEMBERS
Notice is hereby given that the Seventy Fifth Annual General Meeting of Wipro Limited will be held on Wednesday, July 14, 2021 at 9.00 AM IST through video conferencing (“VC”), to transact the following businesses:
ORDINARY BUSINESS
1. To receive, consider and adopt the Audited Financial Statements of the Company (including consolidated financial statements) for the financial year ended March 31, 2021, together with the Reports of the Board of Directors and Auditors thereon.
2. To confirm the payment of Interim Dividend of ` 1 per equity share already paid during the year as the Final Dividend for the Financial Year 2020-21.
3. To consider appointment of a Director in place of Mr. Thierry Delaporte (DIN: 08107242) who retires by rotation and being eligible, offers himself for re-appointment.
SPECIAL BUSINESS
4. Appointment of Ms. Tulsi Naidu (DIN: 03017471) as an Independent Director of the Company
To consider and, if thought fit, to pass the following resolution as an Ordinary Resolution:
RESOLVED THAT pursuant to the provisions of Sections 149, 150, 152 read with Schedule IV and other applicable provisions of the Companies Act, 2013 and the Companies (Appointment and Qualification of Directors) Rules, 2014 (including any statutory modification(s) or re-enactment thereof for the time being in force), Ms. Tulsi Naidu (DIN: 03017471) who has been appointed as an Additional Director in the capacity of Independent Director of the Company by the Board of Directors effective July 1, 2021 in terms of Section 161 of the Companies Act, 2013, and whose appointment as an Independent Director is recommended by the Board Governance, Nomination and Compensation Committee and the Board of Directors of the Company, and in respect of whom the Company has received a notice in writing from a Member proposing her candidature for the office of Director pursuant to Section 160 of the Companies Act, 2013, be and is hereby appointed as an Independent
Director of the Company for a period of five years with effect from July 1, 2021 to June 30, 2026, not subject to retirement by rotation, upon such remuneration as detailed in the explanatory statement hereto and as may be determined by the Board of Directors of the Company from time to time within the overall limits of remuneration under the Companies Act, 2013.
5. Revision in the terms of remuneration of Mr. Rishad A. Premji (DIN: 02983899) as Whole Time Director (designated as “Executive Chairman”) of the Company
To consider and, if thought fit, to pass the following resolution as an Ordinary Resolution:
RESOLVED THAT pursuant to the recommendation of the Board Governance, Nomination and Compensation Committee and the Board of Directors and pursuant to Sections 196, 197, 198 and other applicable provisions, if any, of the Companies Act, 2013 and the Companies (Appointment and Remuneration of Managerial Personnel) Rules, 2014, read with Schedule V of the Companies Act, 2013 (including any statutory modification(s) or re-enactment thereof for the time being in force), and in partial modification of the resolutions passed by the Members at the 73rd Annual General Meeting of the Company held on July 16, 2019, consent of the Members of the Company be and is hereby accorded to revise the terms of remuneration payable to Mr. Rishad A. Premji (DIN: 02983899), as Whole Time Director (designated as “Executive Chairman”), as follows:
Remuneration:
a) Fixed Salary: In the range of ` 5,00,00,000 (Rupees Five Crores only) per annum to ` 12,00,00,000 (Rupees Twelve Crores only) per annum. The Fixed Salary can be paid as basic salary and through various allowances under Wipro Benefits Plans & Allowances, which is a basket of various allowances/reimbursements, like Leave Travel Allowance, Commutation Allowance, House Rent Allowance, and Company leased car & accommodation, etc., which one can plan as per the Company policy. The Fixed Salary may include one-time payouts, if any, as well
WIPRO LIMITED
Wipro Limited2

as contribution to Provident Fund, Pension Fund, and Superannuation as per Company policy and Gratuity in accordance with the provisions of the Payment of Gratuity Act. For the purpose of Gratuity, Provident Fund, Pension Fund, Superannuation and other like benefits, if any, the service of Mr. Rishad A. Premji will be considered as continuous service from the date of his joining the Company.
b) Commission: Commission at the rate of 0.35% of the incremental consolidated net profits of the Company for the full year payable on an annual basis as may be determined by the Board Governance, Nomination and Compensation Committee.
Other Perquisites and Benefits:
a) Furniture & Equipment Program: As per Company policy.
b) Corporate Club Fees: Fees of 2 identified clubs.
c) Personal Accident Insurance, Group Life Insurance: Personal accident cover and group life insurance cover as per Company policy.
d) Medical: Reimbursement of self, spouse and dependent children up to maximum of one month’s basic pay as per the Company policy. In addition, he will be entitled to medical insurance and annual health check-up as per Company policy.
e) Leave with full pay and allowance: Leave with full pay and allowance as per Company’s policy.
f) Reimbursement of travel, stay and entertainment expenses actually and properly incurred in the course of business as per the Company’s policy.
g) Minimum remuneration: Notwithstanding anything to the contrary herein contained, where in any financial year during the tenure of the Executive Chairman, the Company has no profits, or its profits are inadequate, the Company will pay remuneration by way of salary including perquisites and allowances as specified under Section II of Part II of Schedule V to the Companies Act, 2013.
h) Sitting Fees: The Executive Chairman shall not be entitled to sitting fees for attending the meetings of the Board of Directors of the Company or any committees thereof.
RESOLVED FURTHER THAT the overall remuneration payable to Mr. Rishad A. Premji shall not exceed the limits prescribed under the applicable provisions of the Companies Act, 2013 and the provisions of SEBI (Listing Obligations and Disclosure Requirements) Regulations, 2015.
RESOLVED FURTHER THAT apart from the aforesaid revision in remuneration, the other terms and conditions of appointment of Mr. Rishad A. Premji, as previously approved by the shareholders at the 73rd Annual General Meeting of the Company held on July 16, 2019, shall remain unchanged and continue to be effective.
RESOLVED FURTHER THAT the Board of Directors be and is hereby authorized to alter and vary the terms and conditions of the appointment and/or remuneration based on the recommendation of the Board Governance, Nomination and Compensation Committee subject to the applicable provisions of the Companies Act, 2013 and the overall remuneration not exceeding the limits specified under Section 197 read with Schedule V of the Companies Act, 2013 (including any statutory modification(s) or re-enactment thereof for the time being in force).
RESOLVED FURTHER THAT the Board of Directors be and is hereby authorized to do all such acts, deeds and things and execute all such documents, instruments and writings as may be required and to delegate all or any of its powers herein conferred to any Committee of Directors or Director(s) to give effect to the aforesaid resolutions.
By Order of the Board of DirectorsFor Wipro Limited
Sd/- June 9, 2021 M Sanaulla Khan Bengaluru Company Secretary
3Notice 2020-21

NOTES:
Company Secretaries, as the Scrutinizer to scrutinize the e-voting process in a fair and transparent manner.
8) As per the Companies Act, 2013, a Member entitled to attend and vote at the AGM is entitled to appoint a proxy to attend and vote on his/her behalf. Since the 75th
AGM is being held through VC as per the MCA Circulars, physical attendance of Members has been dispensed with. Accordingly, the facility for appointment of proxies by the Members will not be made available for the 75th
AGM and hence the Proxy Form and Attendance Slip are not annexed to this Notice.
9) Corporate Members are required to access the link https://evoting.kfintech.com and upload a certified copy of the Board resolution authorizing their representative to vote on their behalf. Institutional investors are encouraged to attend and vote at the meeting through VC.
10) In case of joint holders attending the meeting, only such joint holder who is higher in the order of names will be entitled to vote.
11) The Register of Members and Share Transfer books will remain closed from Monday, July 12, 2021 to Tuesday, July 13, 2021 (both days inclusive).
12) In line with the MCA and SEBI Circulars, the notice of the 75th AGM along with the Annual Report 2020-21 are being sent only by electronic mode to those Members whose e-mail addresses are registered with the Company/Depositories. Members may please note that this Notice and Annual Report 2020-21 will also be available on the Company’s website at https://www.wipro.com/investors/annual-reports/, websites of the Stock Exchanges i.e. BSE Limited and National Stock Exchange of India Limited at www.bseindia.com and www.nseindia.com respectively, and on the website of KFin Technologies Private Limited at https://evoting.kfintech.com.
13) Members who have not registered their e-mail address are requested to register the same in respect of shares held in electronic form with the Depository through their Depository Participant(s) and in respect of shares held in physical form by writing to the Company’s Registrar and Share Transfer Agent, KFin Technologies Private Limited, Selenium, Plot 31 & 32, Gachibowli Financial District, Nanakramguda, Hyderabad-500 032.
Members may note that the Company has enabled a process for the limited purpose of receiving the Company’s annual report and notice for the Annual General Meeting (including remote e-voting instructions) electronically, and Members may temporarily update their email address by accessing the link https://www.wipro.com/investors/.
14) The following documents will be available for inspection by the Members electronically during the 75th AGM.
1) In view of the ongoing COVID-19 pandemic, the Ministry of Corporate Affairs (MCA) vide its General Circular No. 14/2020 dated April 8, 2020, General Circular No. 17/2020 dated April 13, 2020, General Circular No. 20/2020 dated May 5, 2020, General Circular No. 22/2020 dated June 15, 2020, General Circular No. 33/2020 dated September 28, 2020, General Circular No. 39/2020 dated December 31, 2020 and Circular no. 02/2021 dated January 13, 2021 (collectively “MCA Circulars”) and Securities and Exchange Board of India (“SEBI”) vide its circular no. SEBI/HO/CFD/CMD1/CIR/P/2020/79 dated May 12, 2020 and circular no. SEBI/HO/CFD/CMD2/CIR/P/2021/11 dated January 15, 2021 (collectively “SEBI Circulars”), have permitted companies to conduct AGM through VC or other audio visual means, subject to compliance of various conditions mentioned therein. In compliance with the aforesaid MCA Circulars and SEBI Circulars and the applicable provisions of Companies Act, 2013 and rules made thereunder, and SEBI (Listing Obligations and Disclosure Requirements) Regulations, 2015, the 75th AGM of the Company is being convened and conducted through VC.
2) The Company has enabled the Members to participate at the 75th AGM through VC facility. The instructions for participation by Members are given in the subsequent pages. Participation at the AGM through VC shall be allowed on a first-come-first-served basis.
3) In addition to the above, the proceedings of the 75th AGM will be web-casted live for all the shareholders as on the cut-off date i.e. Wednesday, July 7, 2021. The shareholders can visit https://www.wipro.com/AGM2021/ to watch the live proceedings of the 75th AGM on Wednesday, July 14, 2021 from 9.00 AM IST onwards.
4) As per the provisions under the MCA Circulars, Members attending the 75th AGM through VC shall be counted for the purpose of reckoning the quorum under Section 103 of the Companies Act, 2013.
5) The Company has provided the facility to Members to exercise their right to vote by electronic means both through remote e-voting and e-voting during the AGM. The process and instructions for remote e-voting are provided in the subsequent pages. Such remote e-voting facility is in addition to voting that will take place at the 75th AGM being held through VC.
6) Members joining the meeting through VC, who have not already cast their vote by means of remote e-voting, shall be able to exercise their right to vote through e-voting at the AGM. The Members who have cast their vote by remote e-voting prior to the AGM may also join the AGM through VC but shall not be entitled to cast their vote again.
7) The Company has appointed Mr. V. Sreedharan/ Ms. Devika Sathyanarayana/Mr. Pradeep B. Kulkarni, partners of V. Sreedharan & Associates, Practicing
Wipro Limited4

Members seeking to inspect such documents can send an email to [email protected].
a) Certificate from the Statutory Auditors relating to the Company’s Stock Options/Restricted Stock Units Plans under SEBI (Share Based Employee Benefits) Regulations, 2014.
b) Register of Directors and Key Managerial Personnel and their shareholding, and the Register of Contracts or Arrangements in which the Directors are interested, maintained under the Companies Act, 2013.
c) All such documents referred to in the accompanying Notice and the Explanatory Statement.
15) Details of the Directors seeking appointment/ re-appointment at the 75th AGM are provided in Annexure A of this Notice. The Company has received the requisite consents/declarations for the appointment/re-appointment under the Companies Act, 2013 and the rules made thereunder.
16) Members who hold shares in dematerialized form and want to provide/change/correct the bank account details should send the same immediately to their concerned Depository Participant(s) and not to the Company. Members are also requested to give the MICR Code of their bank to their Depository Participant(s). The Company will not entertain any direct request from such Members for change of address, transposition of names, deletion of name of deceased joint holder and change in the bank account details. While making payment of Dividend, the Registrar and Share Transfer Agent is obliged to use only the data provided by the Depositories, in case of such dematerialized shares.
17) Members who are holding shares in physical form are advised to submit particulars of their bank account, viz. name and address of the branch of the bank, MICR code of the branch, type of account and account number to our Registrar and Share Transfer Agent, KFin Technologies Private Limited (Unit: Wipro Limited), Selenium Tower B, 31-32, Financial District, Nanakramguda, Gachibowli, Hyderabad - 500 032.
18) Members who are holding shares in physical form in identical order of names in more than one folio are requested to send to the Company or its Registrar and Share Transfer Agent the details of such folios together with the share certificates for consolidating their holding in one folio. The share certificates will be returned to the Members after making requisite changes, thereon. Members are requested to use the share transfer Form SH-4 for this purpose.
19) In accordance with the proviso to Regulation 40(1) of the Securities and Exchange Board of India (Listing Obligations and Disclosure Requirements) Regulations, 2015, effective from April 1, 2019, transfers of securities of the Company shall not be processed unless the securities are held in the dematerialized form with a depository. Accordingly, shareholders holding equity
shares in physical form are urged to have their shares dematerialized so as to be able to freely transfer them.
20) Non-resident Indian shareholders are requested to inform about the following immediately to the Company or its Registrar and Share Transfer Agent or the concerned Depository Participant(s), as the case may be:
a) the change in the residential status on return to India for permanent settlement, and
b) the particulars of the NRE account with a Bank in India, if not furnished earlier.
21) Members who wish to claim Dividends, which remain unclaimed, are requested to either correspond with the Corporate Secretarial Department at the Company’s registered office or the Company’s Registrar and Share Transfer Agent (KFin Technologies Private Limited) for revalidation and encashment before the due dates. The details of such unclaimed dividends are available on the Company’s website at www.wipro.com. Members are requested to note that the dividend remaining unclaimed for a continuous period of seven years from the date of transfer to the Company’s Unpaid Dividend Account shall be transferred to the Investor Education and Protection Fund (IEPF). In addition, all shares in respect of which dividend has not been paid or claimed for seven consecutive years or more shall be transferred by the Company to demat account of the IEPF Authority within a period of thirty days of such shares becoming due to be transferred to the IEPF.
In the event of transfer of shares and the unclaimed dividends to IEPF, Members are entitled to claim the same from the IEPF authority by submitting an online application in the prescribed Form IEPF-5 available on the website http://www.iepf.gov.in/ and sending a physical copy of the same duly signed to the Company along with the requisite documents enumerated in Form IEPF-5. Members can file only one consolidated claim in a financial year as per the IEPF Rules.
22) Pursuant to the Rule 5(8) of the Investor Education and Protection Authority (Accounting, Audit, Transfer and Refund) Rules, 2016, the Company has uploaded details of unpaid and unclaimed amounts lying with the Company as on July 13, 2020 (date of last Annual General Meeting) on its website at https://www.wipro.com/investors/ and also on the website of the Ministry of Corporate Affairs.
23) Members holding shares in single name and physical form are advised to make nomination in respect of their shareholding in the Company. The Nomination Form SH-13 prescribed by the Government can be obtained from the Registrar and Share Transfer Agent or the Secretarial Department of the Company at its registered office.
24) In case of any queries regarding the Annual Report, the Members may write to [email protected] to receive an email response.
25) As the 75th AGM is being held through VC, the route map is not annexed to this Notice.
5Notice 2020-21

EXPLANATORY STATEMENT PURSUANT TO SECTION 102 OF THE COMPANIES ACT, 2013
of Sections 149 and 152 of the Companies Act, 2013. The Company has also received a notice in writing from a Member proposing the candidature of Ms. Tulsi Naidu to be appointed as Director of the Company.
The Company has received a declaration from Ms. Tulsi Naidu confirming that she meets the criteria of independence under the Companies Act, 2013 and SEBI (Listing Obligations and Disclosure Requirements) Regulations, 2015. Further, the Company has also received Ms. Naidu’s consent to act as a Director in terms of section 152 of the Companies Act, 2013 and a declaration that she is not disqualified from being appointed as a Director in terms of Section 164 of the Companies Act, 2013.
In the opinion of the Board, Ms. Tulsi Naidu fulfils the conditions specified in the Companies Act, 2013 and rules made thereunder and SEBI (Listing Obligations and Disclosure Requirements) Regulations, 2015 for her appointment as an Independent Director of the Company and is independent of the management.
In line with the Company’s remuneration policy for Independent Directors, Ms. Tulsi Naidu will be entitled to receive remuneration by way of sitting fees as approved by the Board of Directors, reimbursement of expenses for participation in the Board meetings and commission on a quarterly basis of such sum as may be approved by the Board of Directors on the recommendation of the Board Governance, Nomination and Compensation Committee within the overall limits under Companies Act, 2013 of up to 1% of the net profits of the Company during any financial year, in aggregate payable to all Non-Executive Directors put together. Details of remuneration paid to Independent Directors shall be disclosed as part of the Annual Report.
Considering Ms. Tulsi Naidu’s experience of over two decades as a reputed and internationally experienced leader from the financial services industry, her track record of implementing large business transformations coupled with her strong hold on regulatory/public affairs and capability to streamline and simplify business operations, the Board of Directors is of the opinion that it would be in the interest of the Company to appoint her as an Independent Director for a period of five years with effect from July 1, 2021 to June 30, 2026.
Draft letter of appointment of Ms. Tulsi Naidu setting out the terms and conditions of appointment is being made available for inspection by the Members through electronic mode.
Additional information in respect of Ms. Tulsi Naidu, pursuant to Regulation 36 of SEBI (Listing Obligations and Disclosure Requirements) Regulations, 2015 and the Secretarial Standards on General Meetings (SS-2), is provided at Annexure A to this Notice. A brief profile of Ms. Tulsi Naidu is also provided at Annexure B to this Notice.
Except Ms. Tulsi Naidu and/or her relatives, none of the Directors and Key Managerial Personnel of the Company
The following statement sets out all material facts relating to certain ordinary business and the special businesses mentioned in the accompanying Notice of Annual General Meeting:
Item No. 3
Though not statutorily required, the following is being provided as additional information to the Members.
Pursuant to the provisions of Section 152 and other applicable provisions of the Companies Act, 2013 and the Company’s Articles of Association, not less than two-thirds of total number of Directors of the Company shall be liable to retire by rotation. One-third of these Directors must retire from office at each AGM, but each retiring Director is eligible for re-election at such meeting. Independent Directors and the Executive Chairman are not subject to retirement by rotation.
In July 2020, Mr. Azim H. Premji was subject to retirement by rotation and was re-appointed by Members at the 74th AGM. Accordingly, Mr. Thierry Delaporte is now required to retire by rotation at this AGM and being eligible, has offered himself for re-appointment.
Considering Mr. Thierry Delaporte’s skills, competencies, expertise and experience, the Board of Directors is of the opinion that it would be in the interest of the Company to re-appoint him as a Director of the Company.
Additional information in respect of Mr. Thierry Delaporte, pursuant to Regulation 36 of SEBI (Listing Obligations and Disclosure Requirements) Regulations, 2015 and the Secretarial Standard on General Meetings (SS-2), is provided at Annexure A to this Notice. A brief profile of Mr. Thierry Delaporte is also provided at Annexure B to this Notice.
Except Mr. Thierry Delaporte and/or his relatives, none of the Directors and Key Managerial Personnel of the Company and/or their relatives are concerned or interested, financially or otherwise, in the resolution set out at Item No. 3.
The Board of Directors recommends the resolution proposing the re-appointment of Mr. Thierry Delaporte as set out in Item No. 3 for approval of the Members by way of an Ordinary Resolution.
Item No. 4
On May 13, 2021, the Board of Directors appointed Ms. Tulsi Naidu as an Additional Director of the Company in the capacity of Independent Director for a term of 5 years with effect from July 1, 2021 to June 30, 2026, subject to approval of the Members of the Company.
In terms of section 160 of the Companies Act, 2013, the Board Governance, Nomination and Compensation Committee and the Board have recommended the appointment of Ms. Tulsi Naidu as an Independent Director pursuant to the provisions
Wipro Limited6

and/or their relatives are concerned or interested, financially or otherwise, in the resolution set out at Item No. 4.
The Board of Directors recommends the resolution proposing the appointment of Ms. Tulsi Naidu as an Independent Director of the Company, as set out in Item No. 4 for approval of the Members by way of an Ordinary Resolution.
Item No. 5
Mr. Rishad A. Premji was appointed as Whole Time Director (designated as “Executive Chairman”) of the Company with effect from July 31, 2019, to hold office for a term up to July 30, 2024. The terms of appointment and remuneration were approved by the Members vide resolution passed at the 73rd Annual General Meeting of the Company held on July 16, 2019.
In recognition of the leadership and strategic guidance provided by Mr. Rishad A. Premji to the Company as Executive Chairman over the last couple of years, and to ensure that the overall remuneration payable to him shall not exceed the limits of remuneration approved by the Members of the Company, the Board Governance, Nomination and Compensation Committee and the Board of Directors have, at the meeting held on April 15, 2021, approved revision in the terms of remuneration payable to Mr. Rishad A. Premji, in accordance with the provisions contained in Section 196, 197, 198 and 203 of the Companies Act, 2013, subject to the approval of Members of the Company.
In this regard, it is proposed to revise the remuneration payable to Mr. Rishad A. Premji to increase the Fixed Salary from the existing range of ` 4,50,00,000 (Rupees Four Crores Fifty Lakhs only) to ` 9,00,00,000 (Rupees Nine Crores only) per annum to ` 5,00,00,000 (Rupees Five Crores only) to ` 12,00,00,000 (Rupees Twelve Crores only) per annum. Members may note that the proposed revision is only enabling in nature and for the purpose of providing absolute clarity, the Fixed Salary may include one-time payouts, if any, within the proposed overall range of remuneration as may be approved by the Board of Directors based on the recommendation
of the Board Governance, Nomination and Compensation Committee from time to time.
Further, Mr. Rishad A. Premji shall also be entitled to Commission at the rate of 0.35% of the incremental consolidated net profits of the Company for the full year payable on an annual basis as may be determined by the Board Governance, Nomination and Compensation Committee.
The revision in terms of remuneration shall be effective from the date of approval of the resolutions at Item No. 5 by the Members.
Apart from the revision in terms of remuneration stated in the resolutions at Item No. 5, the other terms and conditions of appointment of Mr. Rishad A. Premji, as previously approved by the shareholders at the 73rd Annual General Meeting of the Company held on July 16, 2019, shall remain unchanged and continue to be effective.
In accordance with the provisions contained in Section 196, 197, 198 and 203 of the Companies Act, 2013, read with Schedule V and applicable rules, approval of the Members is requested by way of an Ordinary Resolution for the revised terms of remuneration of Mr. Rishad A. Premji as stated in the resolution at Item No. 5.
Additional information in respect of Mr. Rishad A. Premji, pursuant to the Secretarial Standards on General Meetings (SS-2) is provided at Annexure A to this Notice. A brief profile of Mr. Rishad A. Premji is also provided at Annexure B to this Notice.
Except Mr. Rishad A. Premji and Mr. Azim H. Premji, and/or their relatives, none of the Directors and Key Managerial Personnel of the Company and/or their relatives are concerned or interested, financially or otherwise, in the resolution set out at Item No. 5.
The Board of Directors recommends the resolution proposing the revision in the terms of remuneration of Mr. Rishad A. Premji, as set out in Item No. 5 for approval of the Members by way of an Ordinary Resolution.
7Notice 2020-21

ANNEXURE-A
Details of Directors seeking appointment/re-appointment/or whose terms of remuneration are being revised at the 75th Annual General Meeting to be held on July 14, 2021
[Pursuant to Regulation 36(3) of the SEBI (Listing Obligations and Disclosure Requirements) Regulations, 2015]
Name of the Director Rishad A. Premji Thierry Delaporte Tulsi Naidu
Date of Birth January 9, 1977 May 28, 1967 October 19, 1973
Age 44 54 47
Date of Appointment May 1, 2015 July 6, 2020 July 1, 2021
Relationship with Directors and Key Managerial Personnel
Relative (Son) of Mr. Azim H. Premji
None None
Expertise in specific functional area
Economics, Finance and wide managerial experience
Technology, Sales, Finance, Operations and Consulting, and wide management experience
Financial services sector and wide management experience
Qualification(s) MBA from Harvard Business School and BA in Economics from Wesleyan University
Bachelor’s degree in Economy and Finance from Sciences Po Paris, Masters in Law from the Sorbonne University
Post Graduate Diploma in Management from Indian Institute of Management, Ahmedabad and Bachelor’s degree in Mathematics, Economics and Statistics from Nizam College, Hyderabad
Board Membership of other listed Companies as on March 31, 2021
- - -
Chairmanships/Memberships of the Committees of other public limited companies as on March 31, 2021
a. Audit Committee - - -
b. Stakeholders’ Grievance Committee
- - -
c. Nomination and Remuneration Committee
- - -
d. CSR Committee - - -
e. Other Committee(s) - - -
Number of equity shares held in the Company as at March 31, 2021
17,38,057# - -
# Shares are held by Mr. Rishad A. Premji jointly with his relatives.
Notes:1. The Directorship, Committee Memberships and Chairmanships do not include positions in foreign companies, unlisted
companies and private companies, position as an advisory board member and position in companies under Section 8 of the Companies Act, 2013.
2. Information pertaining to remuneration paid to the Directors who are being appointed/re-appointed or whose terms of remuneration are being revised and the number of Board Meetings attended by them during the year 2020-21, wherever applicable, have been provided in the Corporate Governance Report forming part of the Annual Report.
Wipro Limited8

ANNEXURE-B
Brief profile of Directors seeking appointment/re-appointment/or whose terms of remuneration are being revised
at the 75th Annual General Meeting to be held on July 14, 2021
i. Rishad A. Premji is the Chairman of the Company and the Board, since July 31, 2019. Mr. Rishad A. Premji has been a member of the Board since May 2015. He also serves as a member on our Administrative and Shareholders/Investors Grievance Committee. Prior to being appointed the Chairman of the Company, he was the Chief Strategy Officer, responsible for shaping Wipro’s strategy to drive sustained and profitable growth. Mr. Rishad A. Premji was also responsible for Investor Relations and government relations for the Company. As the Chief Strategy Officer, he led Wipro’s M&A strategy and conceptualized Wipro Ventures– a $250 million fund to invest in start-ups developing technologies and solutions that will complement Wipro’s businesses with next-generation services and products.
Mr. Rishad A. Premji is on the Boards of Wipro Enterprises (P) Limited, a leading player in FMCG and Infrastructure Engineering and Wipro-GE, a joint venture between Wipro Enterprises (P) Limited and General Electric in the healthcare domain. Separately, he is also on the Board of Azim Premji Foundation, one of the largest not-for-profit initiatives in India, which is focused on improving public school education, and works with over 350,000 government schools across seven states in India. Mr. Rishad A. Premji is also on the Board of Azim Premji Philanthropic Initiatives, which provides grants to organizations that contribute to social change.
Mr. Rishad A. Premji was the Chairman of the National Association of Software and Services Companies (NASSCOM), the trade body of India’s $190 billion software industry, for financial year 2018-19.
Prior to joining Wipro Limited in 2007, Mr. Rishad A. Premji was with Bain & Company in London, working on assignments across the consumer products, automobile, telecom and insurance industries. He also worked with GE Capital in the US in the insurance and consumer lending space and is a graduate of GE’s Financial Management Program.
Mr. Rishad A. Premji has an MBA from Harvard Business School and a BA in Economics from Wesleyan University in the US. In 2014, he was recognized as a Young Global Leader by the World Economic Forum for his outstanding leadership, professional accomplishments, and commitment to society. Mr. Rishad A. Premji is the son of Mr. Azim H. Premji, the Founder Chairman of the Company.
ii. Thierry Delaporte is the Chief Executive Officer and Managing Director of the Company, since July 6, 2020. With 26 years of experience in the IT services industry, Mr. Delaporte brings strategic insights to Wipro’s leadership team, and deep operational knowledge of driving business growth, furthering partnerships, and leading cross-cultural teams.
Prior to joining Wipro, Mr. Delaporte held various leadership positions in Capgemini since 1995, including Chief Operating Officer from September 2017 to May 2020, and was a member of the Group Executive Board. He drove Capgemini’s strategic planning and operations for several key businesses, and led the group’s transformation agenda. Mr. Delaporte is President and co-founder of “Life Project 4 Youth”, a not-for-profit organization dedicated to the professional and social integration of young adults living in extreme poverty.
Always passionate about meaningful change, Mr. Delaporte believes prioritizing people and customers, and streamlining processes, are the keys to success in today’s digital world. Mr. Delaporte holds a Bachelor’s degree in Economy and Finance from Sciences Po Paris, and a Master of Laws from the Sorbonne University.
iii. Tulsi Naidu has 25 years of financial services experience in Europe and Asia. She is CEO Asia Pacific of Zurich Insurance Group (Zurich), a member of Zurich’s Executive Committee and a Trustee of the Z Zurich Foundation. Ms. Naidu was appointed CEO of Zurich’s UK business in November 2016 and implemented an extensive transformation program– reshaping the business, simplifying structure, improving technical and digital capabilities, and positioning it for growth in its core markets.
Prior to joining Zurich, Ms. Naidu spent 14 years at Prudential in a variety of executive positions across their UK & Europe business. Her last position with Prudential was Executive Director, UK & Offshore. She was previously Chief Operating Officer for Prudential UK & Europe and prior to that held several general management roles in the company focused on driving strategic transformational change.
Ms. Naidu holds a Post Graduate Diploma in Management from Indian Institute of Management, Ahmedabad and Bachelor’s degree in Mathematics, Economics and Statistics from Nizam College, Hyderabad.
9Notice 2020-21

PROCEDURE FOR E-VOTING
I. Remote e-voting: In compliance with the provisions of Section 108 of the Companies Act, 2013, read with Rule 20 of the Companies (Management and Administration) Rules, 2014, as amended, Regulation 44 of the Securities and Exchange Board of India (Listing Obligations and Disclosure Requirements) Regulations, 2015, read with SEBI circular no. SEBI/HO/CFD/CMD/CIR/P/2020/242 dated December 9, 2020, the Members are being provided with the facility to cast their vote electronically, through the modes listed below, on all resolutions set forth in this Notice, by way of remote e-voting:
MODE OF
E-VOTING
THROUGH DEPOSITORIES
THROUGH DEPOSITORY
PARTICIPANT(S)NSDL CDSL
Individual shareholders holding securities in demat mode
1. Members already registered for IDeAS facility may follow the below steps:
i. Visit the following URL: https://eservices.nsdl.com
ii. On the home page, click on the “Beneficial Owner” icon under the ‘IDeAS’ section.
iii. On the new screen, enter User ID and Password. Post successful authentication, click on “Access to e-Voting” under e-voting services.
iv. Click on Company name or e-voting service provider name i.e. KFintech and you will be re-directed to KFintech website for casting your vote.
2. Members who have not registered for IDeAS facility may follow the below steps:
a) To register for this facility, visit the URL: https://eservices.nsdl.com
b) On the home page, select “Register Online for IDeAS”
c) On completion of the registration formality, follow the steps provided above.
3. Members may alternatively vote through the e-voting website of NSDL in the manner specified below:
a) Visit the URL: https://www.evoting.nsdl.com/
b) Click on the “Login” icon available under the “Shareholder/Member” section.
c) Enter User ID (i.e. 16-digit demat account number held with NSDL), Password/OTP, as applicable, and the verification code shown on the screen.
d) Post successful authentication, you will be redirected to the NSDL IDeAS site wherein you can see the e-voting page.
e) Click on company name or e-Voting service provider name i.e. KFintech and you will be redirected to KFintech website for casting your vote.
4. For any technical assistance, Members may contact NSDL helpdesk by writing to [email protected] or calling the toll free no.: 18001020990 or 1800224430.
1. Members already registered for Easi/Easiest facility may follow the below steps:
a) Visit the following URL: https://web.cdslindia.com/myeasi/home/login or www.cdslindia.com
b) Click on the “Login” icon and opt for “New System Myeasi” (only applicable when using the URL: www.cdslindia.com)
c) On the new screen, enter User ID and Password. Without any further authentication, the e-voting page will be made available.
d) Click on Company name or e-voting service provider name i.e. KFintech to cast your vote.
2. Members who have not registered for Easi/ Easiest facility may follow the below steps:
a) To register for this facility, visit the URL: https://web.cdslindia.c o m / m y e a s i / R e g i s t r a t i o n /EasiRegistration
b) On completion of the registration formality, follow the steps provided above.
3. Members may alternatively vote through the e-voting website of CDSL in the manner specified below:
a) Visit the URL: www.cdslindia.com b) Enter the demat account number and
PAN c) Enter OTP received on mobile number
and email registered with the demat account for authentication.
d) Post successful authentication, the member will receive links for the respective e-voting service provider i.e. KFintech where the e-voting is in progress.
4. For any technical assistance, Members may contact CDSL helpdesk by writing to [email protected] or calling at 022-23058738 or 022-23058542-43.
Members may alternatively log-in using the credentials of the demat account through their Depository Participant(s) registered with NSDL/CDSL for the e-voting facility. On clicking the e-voting icon, members will be re-directed to the NSDL/CDSL site, as applicable, on successful authentication. Members may then click on Company name or e-voting service provider name i.e. KFintech and will be redirected to KFintech website for casting their vote.
Wipro Limited10

MODE OF E-VOTING THROUGH KFINTECH
Non-individual shareholders holding securities in demat mode and Shareholders holding securities in physical mode
1. In case of Members whose email IDs are registered with the Company/Depository Participants(s)], please follow the below instructions:
a) Visit the following URL: https://evoting.kfintech.com b) Enter the login credentials (i.e. User ID and password as communicated in the e-mail from KFintech).
In case of physical folio, User ID will be EVEN (E-Voting Event Number) followed by folio number. In case of Demat account, User ID will be your DP ID and Client ID. However, if you are already registered with KFin for e-voting, you can use your existing User ID and password for casting your vote.
c) After entering these details appropriately, click on “LOGIN”. d) You will now reach password change menu, wherein you are required to mandatorily change your
password. The new password shall comprise of minimum 8 characters with at least one upper case (A-Z), one lower case (a-z), one numeric value (0-9) and a special character (@,#,$, etc). The system will prompt you to change your password and update your contact details like mobile number, email ID, etc., on your first login. It is strongly recommended that you do not share your password with any other person and that you take utmost care to keep your password confidential.
e) You need to login again with the new credentials. f) On successful login, the system will prompt you to select the “EVENT” and click on “Wipro Limited”. g) You may then cast your vote and click on “Submit”. You may either click “OK” to confirm else “CANCEL”
to modify, in the confirmation box. Once you have voted on the resolution(s), you will not be allowed to modify your vote. During the voting period, Members can login any number of times till they have voted all the resolution(s).
2. In case of Members who have not registered their e-mail address (including Members holding shares in physical form), please follow the steps for registration of e-mail address as mentioned in para 13 of the “Notes”. For obtaining the User ID and Password for e-voting, members may refer the instructions below:
a) If the mobile number of the Member is registered against Folio No./DP ID Client ID, the Member may send SMS: MYEPWD<space>E-Voting Event Number+Folio No. or DP ID Client ID to 9212993399. Example for NSDL - MYEPWD<space>IN12345612345678, Example for CDSL - MYEPWD <space> 1402345612345678, Example for Physical - MYEPWD<space>XXXX1234567890.
b) If e-mail address or mobile number of the Member is registered against Folio No./DP ID Client ID, then on the home page of https://evoting.kfintech.com, the Member may click “Forgot Password” and enter Folio No. or DP ID Client ID and PAN to generate a password.
c) KFintech shall endeavour to send User ID and Password to those new Members whose e-mail ids are available.
3. In case of any query and/or grievance, Members may refer to the Help & Frequently Asked Questions (FAQs) and E-voting user manual available at the download section of https://evoting.kfintech.com or may contact Mr. B Srinivas, Manager (Unit: Wipro Limited) of KFin Technologies Private Limited, Selenium, Plot 31 & 32, Gachibowli Financial District, Nanakramguda, Hyderabad-500 032 or at [email protected] and [email protected] or call KFintech’s toll free No. 1-800-3094-001 for any further clarifications.
II. Voting at the Annual General Meeting: Those Members who are present in the Meeting through VC and have not cast their vote on resolutions through remote e-voting, can vote through e-voting at the Meeting. The members may vote through the Insta Poll facility that will be made available on the Meeting page (after you log into the Meeting). An icon, “Vote”, will be available on the Meeting Screen. Members will be able to cast their vote by clicking on this icon, using the user ID and Password as communicated in the e-mail from KFintech as the credentials.
A Member can opt for only single mode of voting i.e. through remote e-voting or voting at the AGM. If a Member casts votes by both modes i.e. voting at AGM and remote e-voting, voting done through remote e-voting shall prevail and vote at the AGM shall be treated as invalid.
11Notice 2020-21

GENERAL INSTRUCTIONS ON E-VOTING
1) The remote e-voting period commences at 9.00 AM IST on Saturday, July 10, 2021 and ends at 5.00 PM IST on Tuesday, July 13, 2021. During this period, Members of the Company, holding shares either in physical form or in dematerialized form, as on the cut-off date of Wednesday, July 7, 2021, may cast their votes electronically as per the process detailed in this Notice. The remote e-voting module shall be disabled for voting thereafter. Once the vote on a resolution(s) is cast by the Member, the Member shall not be allowed to change it subsequently. A person who is not a Member as on the cut-off date should treat this Notice for information purposes only.
2) The voting rights of Members shall be in proportion to their share of the paid-up equity share capital of the Company as on the cut-off date i.e. Wednesday, July 7, 2021.
3) Members who are unable to retrieve User ID/Password are advised to use “Forgot User ID”/“Forgot Password” options available on the websites of Depositories/Depository Participants.
4) On the voting page, enter the number of shares (which represents the number of votes) as on the cut-off date of July 7, 2021 under “FOR/AGAINST” for each item of the notice separately or alternatively, you may partially enter any number “FOR” and partially “AGAINST” but the total number in “FOR/AGAINST” taken together shall not exceed your total shareholding as on the Cut-off date. You may also choose the option “ABSTAIN”. If the Member does not indicate either “FOR” or “AGAINST”, it will be treated as “ABSTAIN” and the shares held will not be counted under either head.
5) Members holding multiple folios/demat accounts shall choose the voting process separately for each folio/demat accounts.
6) You can also update your mobile number and e-mail id in the user profile details of the folio which may be used for sending future communication(s).
7) The Scrutinizer will submit his report to the Chairman after the completion of scrutiny, and the result of the voting will be announced by the Chairman or any Director of the Company duly authorized, on or before Friday, July 16, 2021 and will also be displayed on the website of the Company (www.wipro.com), besides being communicated to the Stock Exchanges, Depositories and Registrar and Share Transfer Agent.
INSTRUCTIONS FOR ATTENDING THE AGM THROUGH VC
1) Members may access the platform to attend the AGM through VC at https://www.wipro.com/AGM2021/ by providing their DP ID-Client ID/Folio no., as applicable, as the credentials.
2) The facility for joining the AGM shall open 30 minutes before the scheduled time for commencement of the AGM and shall be closed after the expiry of 30 minutes after such scheduled time.
3) Members are encouraged to join the Meeting using Google Chrome (preferred browser), Safari, Internet Explorer, Microsoft Edge or Mozilla Firefox 22.
4) Members are advised to use stable Wi-Fi or LAN connection to participate at the AGM through VC in a smooth manner. Participants may experience audio/video loss due to fluctuation in their respective networks.
5) Members who may want to express their views or ask questions at the AGM may visit https://www.wipro.com/AGM2021/ to register as speakers, by mentioning their name, demat account number/folio number, email ID and mobile number. The window for registration shall remain open until 5.00 PM IST on Friday, July 9, 2021. The Company will subsequently communicate the link for participation at the AGM to all such registered members.
Wipro Limited12

Building aBold Tomorrow
INTEGRATED REPORT 2020-21
STATUTORY REPORTS AND FINANCIAL STATEMENTS87 Board's Report121 Corporate Governance Report144 Standalone Financials under Ind AS219 Consolidated Financials under Ind AS309 Consolidated Financials under IFRS384 Business Responsibility Report391 Glossary
MANAGEMENT DISCUSSION & ANALYSIS30 Industry Overview31 Business Overview32 Our Business Strategy34 Operating Segment Overview38 Risk Management Framework43 Stakeholder Engagement and Materiality
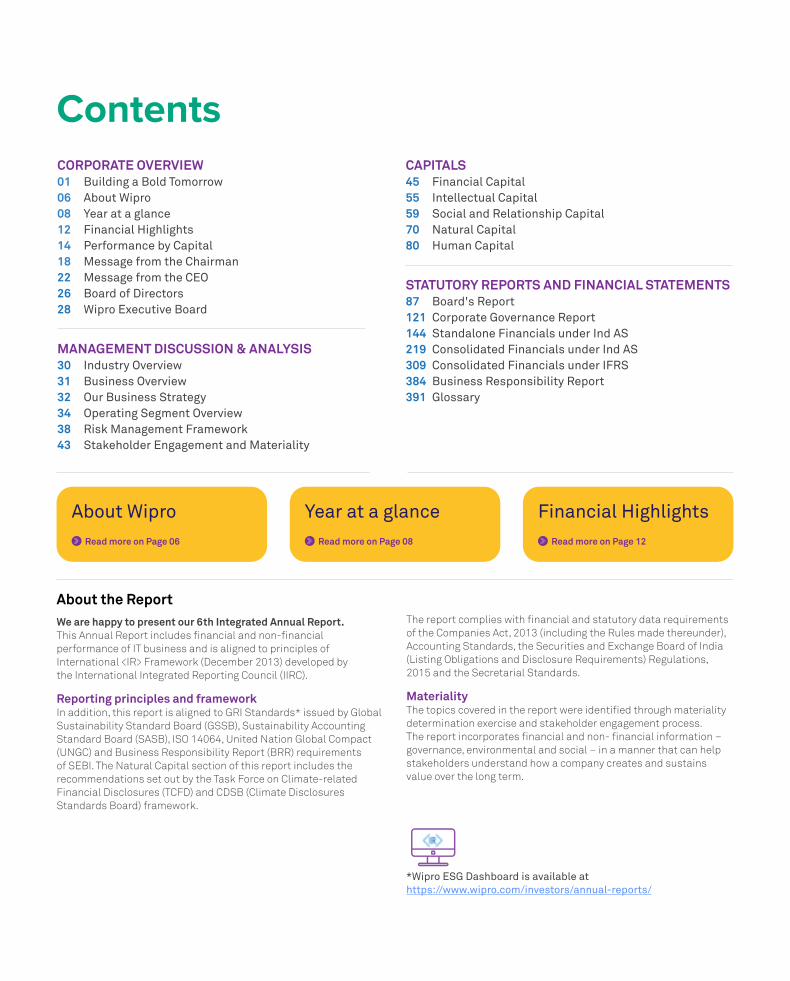
About the ReportWe are happy to present our 6th Integrated Annual Report. This Annual Report includes financial and non-financial performance of IT business and is aligned to principles of International <IR> Framework (December 2013) developed by the International Integrated Reporting Council (IIRC).
Reporting principles and framework In addition, this report is aligned to GRI Standards* issued by Global Sustainability Standard Board (GSSB), Sustainability Accounting Standard Board (SASB), ISO 14064, United Nation Global Compact (UNGC) and Business Responsibility Report (BRR) requirements of SEBI. The Natural Capital section of this report includes the recommendations set out by the Task Force on Climate-related Financial Disclosures (TCFD) and CDSB (Climate Disclosures Standards Board) framework.
CORPORATE OVERVIEW 01 Building a Bold Tomorrow06 About Wipro08 Year at a glance12 Financial Highlights14 Performance by Capital18 Message from the Chairman22 Message from the CEO26 Board of Directors28 Wipro Executive Board
Contents
The report complies with financial and statutory data requirements of the Companies Act, 2013 (including the Rules made thereunder), Accounting Standards, the Securities and Exchange Board of India (Listing Obligations and Disclosure Requirements) Regulations, 2015 and the Secretarial Standards.
Materiality The topics covered in the report were identified through materiality determination exercise and stakeholder engagement process. The report incorporates financial and non- financial information – governance, environmental and social – in a manner that can help stakeholders understand how a company creates and sustains value over the long term.
*Wipro ESG Dashboard is available at https://www.wipro.com/investors/annual-reports/
About WiproRead more on Page 06
Year at a glanceRead more on Page 08 Read more on Page 12
Financial Highlights
CAPITALS45 Financial Capital55 Intellectual Capital59 Social and Relationship Capital70 Natural Capital80 Human Capital

A tomorrow built on the promise of technology, and the progress of all.
Where we can accelerate digital transformation, while transforming the ways we create meaningful impact.
At Wipro, we’re helping leaders around the world harness the power of cognitive computing, robotics, cybersecurity, the cloud, and emerging technologies to transform their companies and communities into engines of growth.
We’re reimagining the role of sustainability – making it more than just a daily business practice, but a part of the company’s enduring purpose.
With more than 200,000 employees across 55 countries, We’re committed to creating a more resilient world — for business, and for all.
2020 – A Year of Bold changesInnovation has always been a focus for Wipro, and 2020 made that focus urgent, more critical. We moved quickly to help our customers, employees, and communities adapt to the pandemic.
We also looked inward. As a global company, we have teams and customers around the world who have been sharing their experiences, helping us identify strengths and weaknesses in our operations and develop truly impactful solutions that will transform Wipro into a more supportive, inclusive, and successful organization.
The result is a bold new Wipro, driven by a powerful strategy that balances ambitious business goals with a renewed commitment to empowering people. We are setting a high bar, committing ourselves to driving meaningful change and sustained growth in everything we do going forward.
Building a Bold Tomorrow

Technology adoption increased significantly in 2020. As businesses responded to the pandemic, many began exploring new technologies or doubling down on earlier investments, accelerating digital transformations worldwide and driving demand in areas like IT services. Across industries, companies are likely to continue investing in operational efficiency programs to reduce costs of operations, then reinvest the savings in transforming business models and leveraging new technologies.
Perhaps most importantly, consumers and businesses will increasingly make choices based on trust. Systems and data need to be secure,
reliable, and resilient. Similarly, customers will do business with people they trust.
Wipro is a global leader in IT services, and we intend to build on that reputation, establishing our brand and our clients as some of the most forward-thinking organizations in business today.
Guided by our new strategy, empowered leadership, and global talent, we will deliver more comprehensive digital solutions, push the envelope with better business practices and talent management, and make real progress in building a bold tomorrow.
Empowering our clients
Transforming our workforceSimplicity over perfectionTalent is essential to our new growth strategy. We are investing heavily in our teams and nurturing top talent. We have updated our competency development programs to keep our project, delivery, and program managers equipped with the latest skills.
We are leveraging TopGear and Topcoder to enable us and our clients to tap a global talent pool of Wipro employees, as well as a highly skilled external crowd, to execute even the most challenging projects. With remote work on the rise, crowdsourcing has potential to become a key delivery model. Wipro is a front-runner in the crowdsourcing space, and we intend to use our advantage to push more innovative solutions in with this delivery model.
Respect and inclusivity are fundamental to Wipro, but last year was a reminder that we can all do more. Our new approach to talent management focuses on increasing diversity throughout our organization and providing greater support across the board to empower our employees and their growth.
This renewed focus on acquiring, developing, and maintaining talent will increase performance across our global teams, translating to greater innovation, efficiency, and quality.
During one of the most difficult years in recent history, we embarked on a radical transformation of the Wipro organization. We shifted to the new operating model, and have been receiving great feedback from internal teams, clients, investors, and analysts. We are also moving away from traditional delivery models, encouraging delivery leaders to adopt more flexible, powerful methods of working.
We appointed new leaders in many roles and significantly simplified the structure at the top. This is an impressive group of people, with fresh perspectives and a lot of experience to share with our teams and our clients. We are confident that their expertise will help us advance our strategy and provide the support and leadership that is essential for long-term growth.
Over the years, our mergers and acquisitions have created a vibrant community of diverse talent around the world. We are happy to continue that growth with our recent acquisitions of IVIA, 4C, Encore Theme, Eximius, CAPCO and Ampion. Acquiring CAPCO significantly strengthens our position in the global financial services market, and Ampion will help us expand our footprint in Australia, accelerating our growth in the Asia-Pacific region.
In April 2021, we fully integrated seven of our previously acquired companies and subsets of those individual brands. We now have almost everyone united under one Wipro brand — one identity, one mindset, one shared ambition. This move allows all of us to go to market as One Wipro.
In April 2021, we fully integrated seven of our
previously acquired companies. We now have almost everyone united under one Wipro brand
Wipro is a global leader in IT services, and we intend
to build on that reputation, establishing our brand
and our clients as some of the most forward-thinking
organizations in business today
#OneWiproWe now have all our colleagues from 4C, Appirio, Encore Theme, Eximius, Healthplan Services,
IVIA and Opus united under #OneWipro brand.
32
Integrated Annual Report 2020-21
Wipro Limited
Building a Bold Tomorrow

Driven to create a humane, sustainable and resilient future for allSince our beginning, Wipro has been driven by the notion that purpose fuels our business, and our business fuels purpose. Energized by what we call The Spirit of Wipro, we commit ourselves to be a catalyst for building a just, equitable, humane and sustainable society. We believe the “power to do good” stems from building deliberately designed, sustainable and locally relevant programs in the communities in which we operate. We are committed to using the same level of rigor, strategic thinking and critical evaluation in our development and implementation of these programs as we would in our business initiatives.
Transforming our cultureThe Five Habits is our culture transformation initiative. These habits — Being Respectful, Being Responsive, Always Communicating, Demonstrating Stewardship and Building Trust — are our values in action, and represent how we experience Wipro every day.
In a world defined by change and complexity, the Five Habits instill our commitment to each other and to the communities which we belong. They drive us towards building a growth mindset, a continued culture transformation that sets the foundation of who we are, how we behave and who we aspire to be.
At Wipro, we believe that our leaders are the most visible examples of our culture. And with this initiative, we encourage every leader to exemplify the fundamental behaviors aligned to each of the Five Habits, demonstrate them to their teams, and to embody these behaviors every day, in every aspect of their roles.
Wipro is dedicated to being a responsive and good corporate citizen in times of crisis. The COVID-19 pandemic is taking a tremendous toll on our society, devastating lives and our global economy. Wipro and the Azim Premji Foundation moved swiftly to help lead the response to the pandemic around the world.
After Wipro converted its Pune campus to a COVID-19 hospital, it found that vital information from various medical stakeholders was disorganized and hard to access. This led Wipro to build the Global Coalition for COVID-19 Medical Care (GCCMC), a knowledge-sharing platform created for doctors, dedicated to education, efficiency, and improved outcomes. Wipro also reached out to 13 million beneficiaries throughout India with supply of dry rations and hygiene kits.
Meeting the moment
Economic value is sustainable only if created on a foundation of ethics
and responsibility.Azim Premji, Founder Chairman
Being Responsive
The Five Habits are
our values in action
Being Respectful1
2
Always Communicating3
Demonstrating Stewardship4
Building Trust5
54
Integrated Annual Report 2020-21
Wipro Limited
Building a Bold Tomorrow

Wipro Limited is a leading global information technology, consulting and business process services company. We harness the power of cognitive computing, hyper-automation, robotics, cloud, analytics and emerging technologies to help our clients adapt to the digital world and make them successful. A company recognized globally for its comprehensive portfolio of services, strong commitment to sustainability and good corporate citizenship, we have over 200,000 dedicated employees serving clients across six continents. Together, we discover ideas and connect the dots to build a better and a bold new future.
We began our business as a vegetable oil manufacturer in 1945 at Amalner, a small town in Western India and thereafter, forayed into soaps and other consumer care products. During the early 1980s, we entered the Indian IT industry by manufacturing and selling mini computers. In the 1990s, we leveraged our hardware R&D design and software development expertise and began offering software services to global clients. In 2013, we demerged the non-IT Diversified Businesses. With a track record of over 30 years in IT Services, we are, today, focused entirely on the global Information Technology business. Wipro is listed on National Stock Exchange and Bombay Stock Exchange in India and New York Stock Exchange in the US.
In December 2020, we completed 75 years of transformation powered by Values, People, Purpose.
For more information, please visit wipro.com
Spirit of WiproThe Spirit of Wipro is the core of Wipro. These are our Values. It is about who we are. It is our character. It is reflected consistently in all our behavior. The Spirit is deeply rooted in the unchanging essence of Wipro. It also embraces what we must aspire to be. It is the indivisible synthesis of the four values. The Spirit is a beacon. It is what gives us direction and a clear sense of purpose. It energizes us and is the touchstone for all that we do.
About Wipro
Be passionate about clients’ successWe succeed when we make our clients successful. We collaborate to sharpen our insights and amplify this success. We execute with excellence. Always.
Be global and responsibleWe will be global in our thinking and our actions. We are responsible citizens of the world. We are energized by the deep connectedness between people, ideas, communities and the environment
Unyielding integrity in everything we doIntegrity is our core and is the basis of everything. It is about following the law, but it’s more. It is about delivering on our commitments. It is about honesty and fairness in action. It is about being ethical beyond any doubt, in the toughest of circumstances.
Treat each person with respectWe treat every human being with respect. We nurture an open environment where people are encouraged to learn, share and grow. We embrace diversity of thought, of cultures, and of people.
7
Integrated Annual Report 2020-21
Wipro Limited
6 Building a Bold Tomorrow

March-April 2020Wipro’s COVID-19 responseAgile & resilient processes ensured business continuity and employee safety. Adapted @ scale and rapidly enabled working from home
First NIFTY company to announce results
July 2020Change of guardThierry Delaporte assumes office as CEO and Managing Director of Wipro Limited
July 2020PerformanceQ1’21 results reflect the resilience, while revenues were down 7.5% sequential CC, net profit remained flat YoY. Held our first virtual AGM, enabling participation by a record number of shareholders from different parts of India
October 2020PerformanceQ2’21 results indicate the return of stability as we grew 2.0% sequentially CC and retained margins at 19.2%, a YoY improvement of 110 bps November 2020
Strategic realignmentUnveiling of our new strategy at Wipro’s first ever virtual Analyst Day
December 2020PerformanceAnnounced our largest deal ever in Continental Europe with Metro AG for a potential spend of $1 billion
Milestone75 Years since incorporation, a company powered by its Values, People, Purpose and Innovation
January 2021PerformanceStrong Q3'21 results reflecting robust demand. Highest sequential growth in 36 quarters as we grew 3.3% in CC. Operating Margins improved to 21.7%
Completed our fourth successful share buyback in five years, to the tune of `9,500 crore
RestructuringMoved to a simplified operating model, a structure led by 4 SMUs and 2 GBLs. Largest leadership transformation as many new leaders inducted
RewardsIncluded in the 2021 Bloomberg Gender-Equality Index
March 2021PerformanceLargest ever acquisition, CAPCO for $1.45 billion. Best Q4'21 performance in the last 10 years with revenue growth of 3.0% sequential CC and Operating Margins at 21% a 344 bps improvement YoY
Another mega deal closed that can lead to revenues of $1 billion+ over the deal duration
Committed to achieving Net Zero Greenhouse Gas emissions by 2040 and a 55% reduction by 2030
—a year of resurgence
Building a Bold tomorrow.
A year of resilience—
Integrated Annual Report 2020-21
Wipro Limited
98 Building a Bold Tomorrow

Governance → Build and maintain the highest standards of
ESG governance at the board and executive levels: (i) Effective sustainability risk oversight (ii) Strong data privacy protection for stakeholders (iii) Rigorous and fair Ombuds process (iv) Transparent and balanced disclosures
Communities→ Contribute to societal progress and
community wellbeing: Work in a focused manner on the dimensions of Education, Ecology and Primary Health Care; Support proximate communities in times of extreme crises (e.g. natural disasters and pandemics)
Customers and Partners→ Strengthen and consolidate our deep
engagement across the ‘Digital’ value chain: (i) Integrated value delivery for customers on Digital, AI, Data Analytics and Sustainability (ii) Build capacity in the academic ecosystem through faculty and student learning programs
→ Collaboratively develop and enhance a sustainable and responsible supply chain: Proactively expand diversity of supplier base with active focus on women , minority owned enterprises and MSME’s. Ensure responsible supplier conduct with respect to environment and human rights in the supply chain. Ensure transparent supplier governance process that guarantees fair practices and zero tolerance for corruption
People→ Maintain and enhance Wipro's workplace
diversity and foster a culture of inclusion that protects human dignity and empowers employees: (i) Increase diversity of gender, ethnicity and persons with disability. Increase gender representation in senior leadership levels to 20% by 2025 (ii) Foster a company-wide culture of inclusion
→ Empower employees through a culture of continuous learning, open communication and ethical conduct: (i) Provide ample opportunities at every stage of the career cycle for employees to engage in continuous learning that encourages innovative thinking and execution (ii) Catalyze and encourage employees to internalize Wipro's values and culture as embodied in Spirit of Wipro, the Brand Promise and the Five Habits
→ Prioritize health, well-being and safety at all times: Adopt a holistic lifecycle approach that emphasizes health and mental well-being of employees; Cascade safe work practices across the value chain
Environmental → Contribute effectively to addressing the
Climate Change Challenge: Achieve Net Zero GHG emissions by 2040 with an intermediate target of 55% reduction by 2030 for all the three Scopes 1,2 and 3
→ Responsible management of scarce water resources: (i) Reduce absolute and area based intensity consumption of externally procured freshwater for our operations by 50% by the year 2030 (ii) Contribute to deeper understanding of systemic challenges of urban water in the major cities in India we operate from
→ Minimize waste generation from operations and its impact on communities: Ensure 100% of organic waste is recycled. To ensure by 2025, less than 2% goes to landfill *excluding construction and demolition waste
→ Enhance the biodiversity quotient of Wipro owned campuses: Incorporate biodiversity as a key element in the design and maintenance of all Wipro-owned campuses
Our business model is set around our overarching ESG goals
Our Vision Strategic Priorities Operating Model Impacts to Capitals
Be a trusted partner to
our clients
Deliver value to our
clients as part of their
transformation journey
Unwavering commitment
to the society and
communities
Strategic Market Units (SMUs)
Global Business Lines (GBLs)
Financial capital
Intellectual capital
Human capital
Social and relationship capital
Natural capital
Accelerate growth
Strengthen clients and partnerships
Lead with business solutions
Build talent @ scale
Simplified operating model
1110 Building a Bold Tomorrow
Integrated Annual Report 2020-21
Wipro Limited
1110 Building a Bold Tomorrow

Financial Highlights(Figures in I Million except otherwise stated)
Financial performance under IFRS 2016-17 2017-18 2018-19 2019-20 2020-21
Revenue1 554,179 546,359 589,060 613,401 622,425
Profit before Depreciation, Amortization, Interest
and Tax 116,986 105,418 119,384 126,592 150,709
Depreciation and Amortization 23,107 21,124 19,474 20,862 27,656
Profit before Interest and Tax 93,879 84,294 99,910 105,730 123,053
Profit before Tax 110,356 102,474 115,415 122,512 139,007
Tax 25,213 22,390 25,242 24,799 30,345
Profit after Tax – attributable to equity holders 84,895 80,081 90,031 97,218 107,946
Per share data
Earnings Per Share – Basic (I)2 13.11 12.64 14.99 16.67 19.11
Earnings Per Share – Diluted (I)2 13.07 12.62 14.95 16.62 19.07
Financial position
Share Capital 4,861 9,048 12,068 11,427 10,958
Net Worth 522,695 485,346 570,753 559,333 554,593
Gross cash (A) 344,740 294,019 379,245 334,134 345,500
Total Debt (B) 142,412 138,259 99,467 78,042 83,332
Net Cash (A-B) 202,328 155,760 279,778 256,092 262,168
Property, Plant and Equipment (C) 69,794 64,443 70,601 81,120 85,192
Intangible Assets (D) 15,922 18,113 13,762 16,362 13,085
Property, Plant and Equipment and Intangible Assets
(C+D) 85,716 82,556 84,363 97,482 98,277
Goodwill 125,796 117,584 116,980 131,012 139,127
Net Current Assets 309,355 292,649 357,556 303,458 293,146
Capital Employed 665,107 623,605 670,220 637,375 637,925
Shareholding related
Number of Shareholders3 241,154 269,694 330,075 511,881 818,539
Market Price Per Share (I)4 193.4 210.9 254.8 196.7 414.2
1 Revenue is aggregate revenue for the purpose of segment reporting including the impact of exchange rate fluctuations2 EPS adjusted for the years prior to the bonus issue. Bonus issue in the proportion of 1:3 was approved by shareholders in February 20193 Number of shareholders (as at March 31 of respective years) represents holders of equity shares and does not include holders of ADRs4 Market price of shares is based on closing price in NSE as on March 31 of respective years and has been adjusted for bonus issue in 2019
1 IT services operating margin refers to segment results total as reflected in IFRS financials 2 Net Income has been considered after adjusting for profit attributable to non-controlling interest (minority interest) 3 Attrition rates refers to voluntary attrition computed on a trailing twelve-month basis excluding Digital Operations & Platform, a service line which is
a part of the iCORE business 4 For convenience, the market capitalization in Indian Rupees as per NSE have been translated into United States Dollars at the certified
foreign exchange rate published by the Federal Reserve Board of Governors on the last day of the respective financial years 5 Payout Ratio has been computed by dividing the payout (comprising interim and final dividend declared for the respective financial year and
buyback, if any, considered based on the date of the Board’s approval) to shareholders by net income on a trailing three-year basis
Revenue IT Services ($ Million)
FY 19 FY 21
8,136.5
FY 20
8,252.88,120.3
Operating Cash Flow to EBITDA (%)
FY 19 FY 21
97.9
FY 20
79.597.4
FY 19 FY 21
12.1
FY 20
14.717.6
Attrition3 (%)
IT Services Operating Margin1 (%)
FY 19 FY 21
20.3
FY 20
18.117.9
Free Cash Flow to Net Income (%)
FY 19 FY 21
119.3
FY 20
80.7
106.0
Market Capitalization4 ($ billion)
FY 19 FY 21
31.0
FY 20
14.9
22.2
Net Income to Turnover2 (%)
FY 19 FY 21
17.3
FY 20
15.815.3
Gross Utilization (%)
FY 19 FY 21
75.7
FY 20
72.274.4
Payout5 (%)
FY 19 FY 21
81.2
FY 20
87.3
60.7
1312
Integrated Annual Report 2020-21
Wipro Limited
Building a Bold Tomorrow

Performance by Capital
Intellectual Capital
Natural Capital
Human Capital
It covers the knowledge, thought leadership, intellectual property rights, brand properties supporting the business.
The natural resources consumed to run our business.
Cumulative skill, knowledge and diversity of thought of our employees
Social & Relationship Capital
It includes our relationships with customers, suppliers, investors, and communities.
Total GHG emission (tons of Co2 eq.)
Water recycled (% of total water consumption)
Waste sent to landfill (excluding C&D)
Renewable energy (% of total energy consumption)
EPI (KwH units per sq. meter per annum )
498,236
42
3.0%
40.0%
142.0
559,510
41
3.0%
35.0%
144.0
447,683
32*
3.9%
42.6%
194.7*
Total employees
Women employees (%)
Nationalities in workforce
175,690
35.2
125+
Employees trained in digital skills
133,000+ 155,000+ 156,000+
188,270
35.0
130+
201,665
35.7
130+
Persons with disabilities
545 578 667
R&D expense(C million)
Patents filed cumulatively till date
Patents granted till date
3,942
2,200+
558
4,619
2,300+
741
3,703*
2,000+
904
FY2019 FY2021FY2020FY2019 FY2021FY2020
CSR spend (` million)
Total employees engaged with Wipro Cares (volunteering or monetary contribution or both)
Community partners
Active customers
1,853
30,000+
1,179
175+
1,818
32,000+
1,140
2,512
25,000+
1,180
230+*165+*Including partners for COVID-19 response
*due to low occupancy of campuses
*majorly due to shift of work to offshore in pandemic
14 Building a Bold Tomorrow 1514
Integrated Annual Report 2020-21
Wipro Limited
Building a Bold Tomorrow

Education, Ecology and Community CareSchool education→ Supported 124 organizations
working towards systemic reforms in school education through 125 projects in 26 states and UTs
→ Nearly 8,800 children from underprivileged communities benefited from our 22 education projects in 9 states through our community program
→ Education for Children with Disability program supports the educational and rehabilitative needs of over 2,200 underprivileged children through 14 projects in 5 states
Engineering education→ Supported 37,000 students
cumulatively to pursue higher education in engineering through WASE, WiSTA and WIMS programs
→ Trained 60,000+ students and 100 faculty members cumulatively on digital technologies through our TalentNext program
Sustainability education→ Participation in flagship Wipro
Earthian Program from 900+ schools and colleges across 79 districts in 29 states and 3 UTs
SDG where we have direct positive impact through our programs
SDG where our work is indirectly contributes to positive impact
→ Wipro received ATD's Best of the BEST Award 2021 for the 5th consecutive year
→ Wipro has been included in 2021 Bloomberg Gender-Equality Index (GEI)
→ Wipro has received a rating of 95 in the Corporate Equality Index 2021, by the Human Rights Campaign Foundation
→ Wipro was recognized as winner for ‘Best Employer for Persons with Disabilities’ and second runner-up for ‘Best Employer for D&I’, in the large category at 2nd ASSOCHAM Diversity & Inclusion Excellence Awards
→ Wipro has been recognized as ‘Disability Confident Committed Employer’ in the UK. This is a government certification in the UK for making sustained efforts to strengthen disability inclusion
→ Wipro was named as India Workplace Equality Index (IWEI) Top Employer for LGBT+ inclusion in 2020
→ Wipro has been recognized for its framework and innovative strategies for hiring and inclusion of persons with disabilities by Zero Project, an international platform for assessing and felicitating innovative work done in the space of disability inclusion
→ 2020 Working Mother & Avtar Most Inclusive Companies Index (MICI): Declared as a “Exemplar of Inclusion”
→ 2020 Working Mother & Avtar Best Companies for Women in India (BCWI) list: Declared as one of the “100 Best Companies for Women in India”
→ Wipro has been recognized as a Top Employer in Australia for 2020 by the Top Employers Institute
Rewards & Recognition
Member of Dow Jones Sustainability Index (DJSI), World for the 11th time in a row
Named as 2021 World’s Most Ethical Company for the 10th successive year by the Ethisphere Institute
Received Silver Class Sustainability Yearbook Award 2021
Ecovadis-CSR rating of Gold
Member of Vigeo Eiris Emerging Market Sustainability Index (comprises of the 70 most advanced companies in the Emerging Market Region)
Member of FTSE4Good Index Series and also a global sector leader
Received A- in Carbon Disclosure Project (CDP) - Climate Change Assessment
→ The 10th Wipro Earthian Awards was held virtually for the first time with attendees including winning teams, program partners and employees
Science Education Fellowship Program→ Started in 2012, the Wipro SEF
USA is a two-year program designed to improve individual teacher practice, foster teacher leadership opportunities and create a district corps of teacher leaders supporting sustainable positive changes in science education
→ Launched the Wipro SEF program in the UK in FY 2019 in partnership with Kings College, London (KCL) and Sheffield Hallam University (SHU)
Community → Over 1,30,000 people from
disadvantaged communities have access to primary healthcare through 10 healthcare projects across 5 states
→ Supported more than 6,000 people that were affected by natural disasters (cyclones
& floods) through 6 disaster response projects
→ Community ecology project helped around 400 farmers in planting 40,000 trees and promoting agroforestry among farmer communities
Urban ecology→ Urban water program focusing on
advocacy, citizen engagement and on ground interventions in 4 cities - Bengaluru, Pune, Chennai and Hyderabad
→ Bengaluru Sustainability Forum: A platform for dialogues and conversations around urban sustainability. In FY20, hosted series on "Reading for change", "Climate conversations", Food economy and on boarded 4th cohort of collaborative small grants
International chapters→ Our Employee participate in local
community initiatives such as tree plantation, books donation and education for disadvantaged across seven countries
1716
Integrated Annual Report 2020-21
Wipro Limited
Building a Bold Tomorrow

Message from the ChairmanTechnology is often at the forefront of economic recovery, but especially so now, as the pandemic precipitated structural changes across industries and challenged established ways of working. So, whether it is digital commerce, online education, or telemedicine, technology-enabled business models have emerged across the board, with Cloud technology as the cornerstone of this transformation.
As vaccination efforts ramp up globally, and economies start seeing a rebound, our customers are ever so keen to invest in and accelerate their digital transformation. For companies such as ours, the key to success is to respond to this opportunity with speed and agility.
With the rapid shift to digital, the demand for talent will outpace supply, and become a key dependency for growth. Already we see new delivery models, such as ‘work from anywhere’ and ‘Crowdsourcing’, become the mainstay. We expect virtual, remote, community-based, and distributed work models to be the future of work.
Building a Bold Tomorrow for Wipro
I believe Wipro is well-positioned to leverage, as well as enable such transformations. In the last six months, we have effected bold changes to help serve our customers better.
Early last year, we set out to make the first bold change, embracing the direction set by our new CEO & Managing Director, Thierry Delaporte. The Board and I cannot be more confident of Thierry, and his leadership. As a result, I feel more optimistic about our future than ever before.
The difficult but necessary changes we have made, has made us a stronger and better organization.
Proximity to customers is key, as is reflected in our new business model.
Deep and prioritized focus on countries, industry sectors, offerings, and partnership, along with an operating structure that makes us agile and nimble in a post-crisis world, that will be all about impact at speed. Overall, I see a much stronger external market
orientation at Wipro. Several new leaders have joined us to take forward this transformation.
The acquisition of CAPCO, a leading strategy and consulting firm in the Banking and Financial Services Industry, was our largest ever and another bold move for us. With a purchase consideration of $1.45 billion, CAPCO brings to us over $700 million in annual revenues and over 5,000 consultant colleagues around the world. With this acquisition, we are now in a select league of service providers, who provide integrated end-to-end consulting, digital, cloud and IT transformation services for the BFSI sector at scale. It also expands our presence into a large set of strategic clients uniquely complementary to our existing customer base. Most importantly, CAPCO and Wipro share similar culture and values.
Building a Bold Tomorrow for our employees
As I write this letter, India, where over 160,000 of our employees are based, is emerging out of a ravaging second wave of COVID-19. The last couple of months have been incredibly hard, mentally and emotionally, on us all. In this time of deep stress and grief, we are doing everything we can to help our employees. These include providing COVID-19 Isolation Care centers for our staff and their families, partnering with major hospitals to provide medical support to critically ill employees, additional medical reimbursement and leaves related to COVID-19, as well as vaccination at our campuses. We have also partnered with leading global EAP providers to help employees seek counselling 24x7.
Earlier last year, when the pandemic broke out, we triggered our business continuity plans to quickly enable remote working. Even today, less than 3% of our global workforce work from our offices. We have settled well into this new way of working and have continued to make our customers successful. We enjoy their confidence, and I have no doubt that a hybrid model may well be how we work in the future. But for the inspirational, inclusive and seamless teamwork, this massive change wouldn’t have been possible. We must take a moment to recognize and celebrate the tremendous commitment and ownership our teams have demonstrated.
Dear Stakeholders,
This has been an unimaginable year. And despite all the pain and suffering, the unbreakable human spirit shines through – in the large and small acts of kindness, empathy and compassion.
In many ways, humanity has come together to fight this global pandemic. Global cooperation has never been more important than it is now. The vaccines for COVID-19 are one of the greatest examples of collaboration and pioneering science. We must now work to scale the supply chain, build mechanisms for equitable distribution and drive an efficient administration for these life-saving vaccines.
We complete 75 years since incorporation! This fabulous journey would not have been
possible but for the tireless efforts of our employees, their dedication and inventiveness. They embody
the true spirit of Wipro!Rishad A Premji, Chairman
Building a Bold Tomorrow for customers
Many of us have lived through an economic crisis before. Without fail, the world has adapted and bounced back. In the last fifteen months, we have unlearnt old habits, adopted technology rapidly and challenged ourselves to adapt to new ways of working. I am so glad, and proud, that Wipro has been a trusted partner for our customers right through this journey, and together, we have emerged stronger.
1918
Integrated Annual Report 2020-21
Wipro Limited
Building a Bold Tomorrow

Building a Bold Tomorrow for our communities
While we have emerged stronger and bolder from the COVID-19 pandemic, we are acutely aware that the pandemic has widened socio-economic inequities. Our responsibility towards our communities has increased manifold.
In April 2020, Wipro Ltd, Wipro Enterprises Pvt. Ltd. and Azim Premji Foundation, together committed C1,125 crore (~$150M) towards tackling the unprecedented health and humanitarian crisis arising from the COVID-19 pandemic outbreak.
Over the past 12 months, we have supported more than 1,500 projects covering humanitarian aid, integrated healthcare support, and livelihood regeneration. Cumulatively, we have reached out directly to more than 18 million people
through our coordinated and comprehensive COVID-19 response, to provide humanitarian aid and help with livelihoods regeneration.
To deal with the unprecedented second wave, we have ramped up our response on multiple fronts - our approach has been to address short-term emergency response as well as contribute towards strengthening our public health infrastructure. The hospital we had set up in Pune, in the Indian state of Maharashtra, by converting our tech-campus into a 450-bed Covid-care hospital, continues to save lives.
Our overall healthcare efforts have built capacity and run programs, closely collaborating with the public health system, to serve geographies that have a population of over 150 million people.
The other major challenge facing humanity today is the climate crisis. Wipro has always believed that businesses must be at the forefront to address this challenge. Wipro’s climate change program goes back nearly two decades, and this year we announced our commitment to achieving Net-Zero Greenhouse Gas (GHG) emissions by 2040, in line with the objectives of the Paris agreement. Our approach emphasizes the importance of not just reaching that goal but doing so in a way that aligns with Wipro’s core values of integrity and business responsibility.
Our Performance & Return to Shareholders
Even as we focused on our employees’ safety and customers’ success, we drove focused action on our costs to respond to a deceleration in revenues in the first quarter of the year as the pandemic took hold globally. Just as effectively, we quickly pivoted to meet the rising demand, through an efficient supply chain in the second half of the financial year. For the year ending 31st March 2021, our IT Services Revenues was at $8.1 billion, a decline of 1.4% YoY in reported currency. Our Net Income at D107.9 billion grew by 11% YoY aided by improved operating margins. We also ended the year with strong order booking, including two mega billion-dollar deal wins. For the full year, the EPS was at D19.11 per share, up 14.6% YoY, and the Operating Cash Flows at D147.6 billion was at
136.7% of our Net Income. Our Gross Cash was at $4.7 billion and Net Cash was at $3.6 billion. Our pay-out for FY21 was at D122.1 billion through buyback and dividends (including dividend distribution tax) to our shareholders, which is 113.1% of our Net Income. Our market cap and share price increased by over 108% in the last 12 months.
Our Values & Growth mindset
This year is special. We complete 75 years since incorporation! This fabulous journey would not have been possible but for the tireless efforts of our employees, their dedication and inventiveness. They embody the true spirit of Wipro! As a result, Wipro is recognized the world over as an exemplar of corporate citizenship with the highest standards of governance, ethics, and values.
I personally champion this culture, mindset and ways of working, something we call the Five Habits: Being Respectful, Being Responsive, Always Communicating, Demonstrating Stewardship, and Building Trust. Embarking on and sparking a cultural movement was a strategic imperative for us, allowing Wipro to focus on driving a growth mindset across the firm.
I am thankful to our clients, partners, employees, and other stakeholders who have placed their trust and confidence in us. I am very excited about the path we are on, and confident you will see a bolder and more ambitious Wipro as we move forward, that is unafraid to shake up the status quo, make tough calls, invest deep, and think big.
Very Sincerely,
Rishad A Premji
Over the past 12 months, we have supported more
than 1,500 projects covering humanitarian aid, integrated
healthcare support, and livelihood regeneration.
Wipro’s climate change program goes back nearly two decades,
and this year we announced our commitment to achieving
Net-Zero Greenhouse Gas (GHG) emissions by 2040.
2120
Integrated Annual Report 2020-21
Wipro Limited
Building a Bold Tomorrow

Message from the CEOBuilding a Bold Tomorrow – Our Strategy
In the pre-COVID-19 business landscape, companies were embarking on transformation programs to enhance agility, improve operational efficiency and optimize costs. The pandemic has served to accelerate this need. The time to change is now, and if your business does not, it will be left behind. This sentiment forms the precursor to our value proposition to the market: Wipro is a transformation partner you can trust.
Our ability to deliver change is underpinned by three core components. The first is Technology, which is at the heart of all transformation. Next is Talent, which drives our technological engine. The third is Trust, without it a partnership cannot be expected to thrive.
Partners who can challenge the status quo, ideate together, provide insight, innovate, and lead with flawless execution, will always deliver value over the longer term. This has led to both business, and providers, revaluating what is important from a service. Once it used to be about cost and efficiencies. Now, Speed and Agility matter more. The ability to disrupt oneself at speed will allow a company to separate itself from its competition and take a unique position in its market.
We know that industry growth will largely be led by next-generation technologies and services. We can therefore expect to see huge incremental growth in areas such as Digital, Cloud, Data, Engineering, Cybersecurity.
Cloud definitely is at the center of customer conversations, and is becoming not just the operating platform of choice but a fundamental part of Digital Transformation. The emergence of new work models such as work-from-anywhere or crowdsourcing, has meant that cybersecurity has become a top priority for businesses.
For long, Wipro has been helping customers navigate the full spectrum of IT transformation.
Our customers appreciate our passion for innovation, our commitment to excellence in delivery, and that we are invested – and invest in – our customer’s success.
That said, our ambition is to constantly raise the bar and be a true global leader of our industry. In order to realize this, we have made bold changes ourselves, challenge our existing areas of focus, our approach to growth, and our ability to deliver excellence across all markets, in all sectors, for all customers.
We are Building a Bolder Tomorrow for Wipro through our five-point strategy:
1. Accelerating growth by prioritizing the sectors and markets we operate in. We are channeling our efforts and investments for maximum results, going deeper in areas we believe we have strengths in, while doubling down and scaling in those areas we are winning in, to secure a leadership position.
2. Strengthening clients and partnerships with strategic clients by investing in good talent and a focused structure that can shape and win larger transformational deals. We are also leveraging relationships with our strategic partners and using M&A as a key strategic enabler to accelerate growth.
3. Leading with business solutions that enhance our portfolio, resonate with our clients, and align with business and functional spend pools. We are developing and scaling these solutions by leveraging industry expertise, technology capability and ecosystem partnerships.
4. Building talent at scale. This will be the most critical factor for success. An ambitious program to scale talent across front-end, domain and technology areas are playing out at Wipro as we speak. I am also committed to building leadership diversity throughout our business, including most importantly, our leadership ranks. Industry-leading growth will only come from industry-leading plurality.
Dear Stakeholders,
It has been my privilege and honor to lead Wipro for the past year, an exceptional company that is both an industry pioneer, and a force for good in the communities which we serve.
The financial year that ended March 31, 2021 capped a landmark 12 months for Wipro, a period of total transformation. We announced a new strategy, completed the biggest organizational restructuring in our history, delivered strong performances for
consecutive quarters, and sealed our largest-ever acquisition, all in the middle of a global pandemic. We finished FY21 with healthy revenue growth, prestigious deal wins, strong margins and robust cash flows.
Change takes time, but I am pleased to share that we are now well-settled into these new ways of working and remain resolutely focused on fulfilling our customers’ needs.
Technology is at the core of business transformation, but
talent remains the driving force. In the new world of work, Wipro’s commitment is to our
clients’ success, and to that of our employees, and the larger
community.Thierry Delaporte, CEO
2322
Integrated Annual Report 2020-21
Wipro Limited
Building a Bold Tomorrow
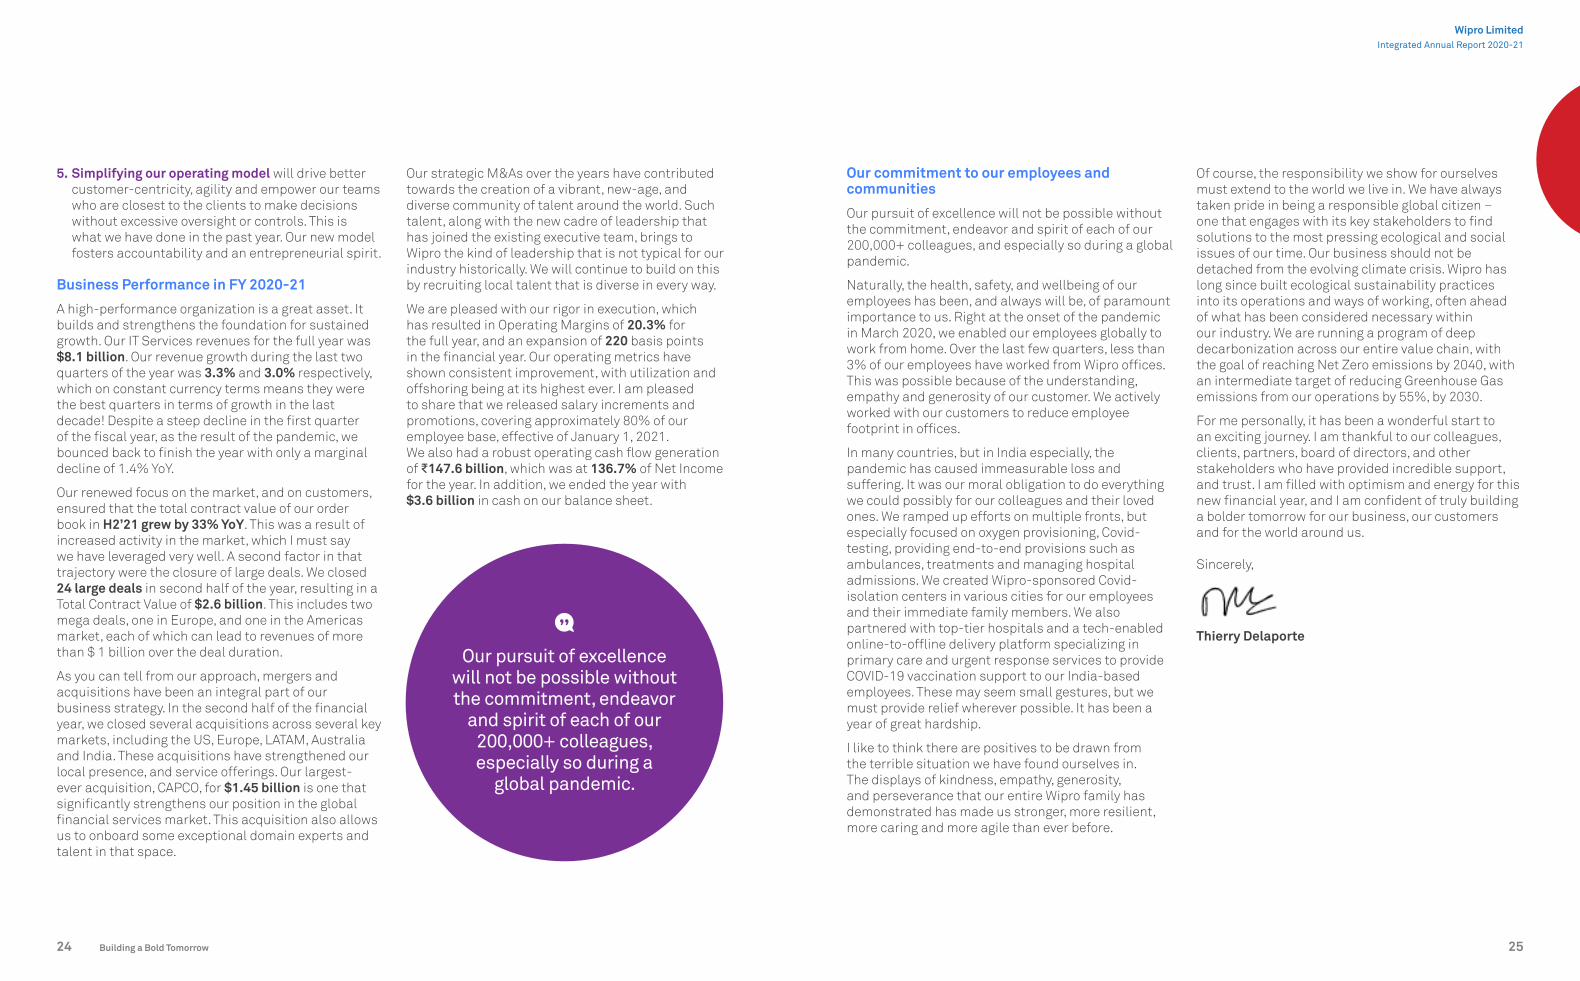
5. Simplifying our operating model will drive better customer-centricity, agility and empower our teams who are closest to the clients to make decisions without excessive oversight or controls. This is what we have done in the past year. Our new model fosters accountability and an entrepreneurial spirit.
Business Performance in FY 2020-21
A high-performance organization is a great asset. It builds and strengthens the foundation for sustained growth. Our IT Services revenues for the full year was $8.1 billion. Our revenue growth during the last two quarters of the year was 3.3% and 3.0% respectively, which on constant currency terms means they were the best quarters in terms of growth in the last decade! Despite a steep decline in the first quarter of the fiscal year, as the result of the pandemic, we bounced back to finish the year with only a marginal decline of 1.4% YoY.
Our renewed focus on the market, and on customers, ensured that the total contract value of our order book in H2’21 grew by 33% YoY. This was a result of increased activity in the market, which I must say we have leveraged very well. A second factor in that trajectory were the closure of large deals. We closed 24 large deals in second half of the year, resulting in a Total Contract Value of $2.6 billion. This includes two mega deals, one in Europe, and one in the Americas market, each of which can lead to revenues of more than $ 1 billion over the deal duration.
As you can tell from our approach, mergers and acquisitions have been an integral part of our business strategy. In the second half of the financial year, we closed several acquisitions across several key markets, including the US, Europe, LATAM, Australia and India. These acquisitions have strengthened our local presence, and service offerings. Our largest-ever acquisition, CAPCO, for $1.45 billion is one that significantly strengthens our position in the global financial services market. This acquisition also allows us to onboard some exceptional domain experts and talent in that space.
Our strategic M&As over the years have contributed towards the creation of a vibrant, new-age, and diverse community of talent around the world. Such talent, along with the new cadre of leadership that has joined the existing executive team, brings to Wipro the kind of leadership that is not typical for our industry historically. We will continue to build on this by recruiting local talent that is diverse in every way.
We are pleased with our rigor in execution, which has resulted in Operating Margins of 20.3% for the full year, and an expansion of 220 basis points in the financial year. Our operating metrics have shown consistent improvement, with utilization and offshoring being at its highest ever. I am pleased to share that we released salary increments and promotions, covering approximately 80% of our employee base, effective of January 1, 2021. We also had a robust operating cash flow generation of D147.6 billion, which was at 136.7% of Net Income for the year. In addition, we ended the year with $3.6 billion in cash on our balance sheet.
Our commitment to our employees and communities
Our pursuit of excellence will not be possible without the commitment, endeavor and spirit of each of our 200,000+ colleagues, and especially so during a global pandemic.
Naturally, the health, safety, and wellbeing of our employees has been, and always will be, of paramount importance to us. Right at the onset of the pandemic in March 2020, we enabled our employees globally to work from home. Over the last few quarters, less than 3% of our employees have worked from Wipro offices. This was possible because of the understanding, empathy and generosity of our customer. We actively worked with our customers to reduce employee footprint in offices.
In many countries, but in India especially, the pandemic has caused immeasurable loss and suffering. It was our moral obligation to do everything we could possibly for our colleagues and their loved ones. We ramped up efforts on multiple fronts, but especially focused on oxygen provisioning, Covid-testing, providing end-to-end provisions such as ambulances, treatments and managing hospital admissions. We created Wipro-sponsored Covid-isolation centers in various cities for our employees and their immediate family members. We also partnered with top-tier hospitals and a tech-enabled online-to-offline delivery platform specializing in primary care and urgent response services to provide COVID-19 vaccination support to our India-based employees. These may seem small gestures, but we must provide relief wherever possible. It has been a year of great hardship.
I like to think there are positives to be drawn from the terrible situation we have found ourselves in. The displays of kindness, empathy, generosity, and perseverance that our entire Wipro family has demonstrated has made us stronger, more resilient, more caring and more agile than ever before.
Of course, the responsibility we show for ourselves must extend to the world we live in. We have always taken pride in being a responsible global citizen – one that engages with its key stakeholders to find solutions to the most pressing ecological and social issues of our time. Our business should not be detached from the evolving climate crisis. Wipro has long since built ecological sustainability practices into its operations and ways of working, often ahead of what has been considered necessary within our industry. We are running a program of deep decarbonization across our entire value chain, with the goal of reaching Net Zero emissions by 2040, with an intermediate target of reducing Greenhouse Gas emissions from our operations by 55%, by 2030.
For me personally, it has been a wonderful start to an exciting journey. I am thankful to our colleagues, clients, partners, board of directors, and other stakeholders who have provided incredible support, and trust. I am filled with optimism and energy for this new financial year, and I am confident of truly building a bolder tomorrow for our business, our customers and for the world around us.
Sincerely,
Thierry Delaporte
Our pursuit of excellence will not be possible without the commitment, endeavor
and spirit of each of our 200,000+ colleagues, especially so during a
global pandemic.
2524
Integrated Annual Report 2020-21
Wipro Limited
Building a Bold Tomorrow

Board of Directors
Azim H. PremjiFounder Chairman
Tulsi NaiduIndependent Director
Patrick DupuisIndependent Director
Ireena VittalIndependent Director
Deepak M. SatwalekarIndependent Director
Dr. Patrick J. EnnisIndependent Director
M. K. SharmaIndependent Director
Rishad A. PremjiChairman
William Arthur OwensIndependent Director
1. The Board of Directors approved the appointment of Ms. Tulsi Naidu as an Independent Director for a term of five years, with effect from July 1, 2021, subject to approval of shareholders of the Company.
2. Mr. M. K. Sharma will retire from the Board as an Independent director with effect from close of business hours on June 30, 2021.
Thierry DelaporteChief Executive Officer and Managing Director
Wipro LimitedIntegrated Annual Report 2020-21
2726 Building a Bold Tomorrow

Saurabh GovilChief Human
Resources Officer
Sanjeev SinghChief Operations Officer
Stephanie TrautmanChief Growth Officer
Jatin DalalChief Financial Officer
Rajan KohliManaging Partner -
iDEAS Business Line
Nagendra P. BandaruManaging Partner -
iCORE Business Line
Srini PalliaCEO - Americas 1
Pierre Bruno CEO - Europe
N. S. BalaCEO - Asia Pacific,
Middle East and Africa
Angan GuhaCEO - Americas 2
Wipro Executive Board
Thierry DelaporteChief Executive Officer and Managing Director
Wipro LimitedIntegrated Annual Report 2020-21
2928 Building a Bold Tomorrow

Management Discussion and Analysis Industry OverviewIT ServicesThe COVID-19 pandemic has affected every industry, and has disrupted trade, supply chains, work and business models, employment and consumer behaviors. During the pandemic, companies across the world accelerated their digital transformation initiatives to address these disruptions and secure their businesses. While some companies have now set up advanced business continuity measures, others have embarked on new innovative services and products. As companies focused on protecting employees from the pandemic, technology enabled a seamless transition to remote working by shifting to digital channels and digital customer engagement models. Various stay at home orders resulted in large scale adoption of models such as buy-online-pickup-in-store in retail, tele-medicine and virtual care in healthcare, touchless experiences in finance and virtual solutions for online learning.
According to the Strategic Review 2021 published by NASSCOM (the “NASSCOM Report”), India’s technology industry is forecasted to grow at 2.3% to reach approximately $194 billion in fiscal year 2021 (excluding e-commerce). According to the NASSCOM Report, exports are estimated to grow at 1.9% to reach approximately $150 billion in fiscal year 2021 and the domestic sector is forecasted to reach approximately $45 billion in fiscal year 2021, growing at 3.4%. According to the NASSCOM Report, the growth is driven by increased demand for digital transformation and infrastructure modernization.
As per the NASSCOM Report, digital revenues account for 28-30% of total industry revenues for fiscal year 2021, growing at five times the overall services growth. Share of digital services in new contracts is up by 90% from fiscal year 2020, driven by cloud, collaboration and cybersecurity. The growth of cloud, artificial intelligence (“AI”), machine learning (“ML”), internet of things (“IoT”), analytics, automation and collaboration software were accelerated during the COVID-19 pandemic, led by remote working and transformation engagements for contactless activities and customer experience. It is expected that the IT services industry will move to hybrid work models, with implications on hiring, team structures, compliance and cybersecurity.
Global IT service providers offer a range of end–to-end software development, digital services, IT business solutions, research and development services, technology infrastructure services, business process services, consulting and related support functions.
The conditions caused by the COVID-19 pandemic continue to evolve as new variants of the virus are emerging in some of our markets, leaving the recovery outlook varied and uncertain. Despite demand stability being high and ongoing large-scale vaccination drives, economic outlook remains uncertain. However, companies will continue to invest in digital transformation to address new pandemic-driven consumer behaviors with the support of technology.
30 Building a Bold Tomorrow
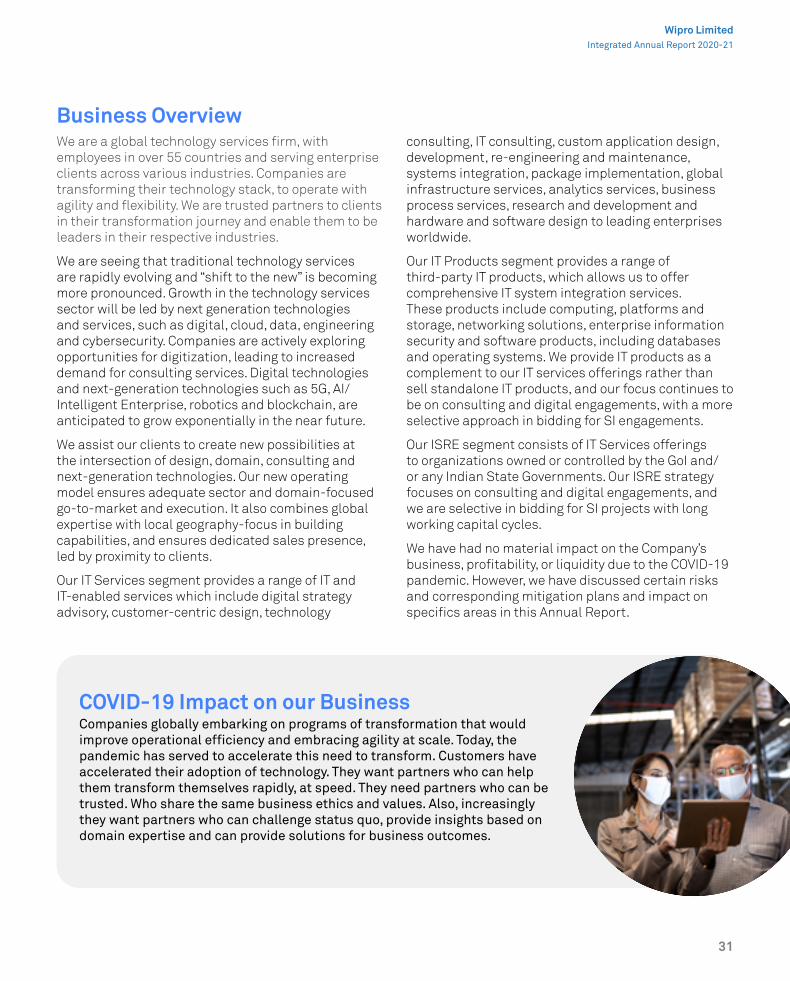
Business Overview
COVID-19 Impact on our Business
We are a global technology services firm, with employees in over 55 countries and serving enterprise clients across various industries. Companies are transforming their technology stack, to operate with agility and flexibility. We are trusted partners to clients in their transformation journey and enable them to be leaders in their respective industries.
We are seeing that traditional technology services are rapidly evolving and “shift to the new” is becoming more pronounced. Growth in the technology services sector will be led by next generation technologies and services, such as digital, cloud, data, engineering and cybersecurity. Companies are actively exploring opportunities for digitization, leading to increased demand for consulting services. Digital technologies and next-generation technologies such as 5G, AI/Intelligent Enterprise, robotics and blockchain, are anticipated to grow exponentially in the near future.
We assist our clients to create new possibilities at the intersection of design, domain, consulting and next-generation technologies. Our new operating model ensures adequate sector and domain-focused go-to-market and execution. It also combines global expertise with local geography-focus in building capabilities, and ensures dedicated sales presence, led by proximity to clients.
Our IT Services segment provides a range of IT and IT-enabled services which include digital strategy advisory, customer-centric design, technology
Companies globally embarking on programs of transformation that would improve operational efficiency and embracing agility at scale. Today, the pandemic has served to accelerate this need to transform. Customers have accelerated their adoption of technology. They want partners who can help them transform themselves rapidly, at speed. They need partners who can be trusted. Who share the same business ethics and values. Also, increasingly they want partners who can challenge status quo, provide insights based on domain expertise and can provide solutions for business outcomes.
consulting, IT consulting, custom application design, development, re-engineering and maintenance, systems integration, package implementation, global infrastructure services, analytics services, business process services, research and development and hardware and software design to leading enterprises worldwide.
Our IT Products segment provides a range of third-party IT products, which allows us to offer comprehensive IT system integration services. These products include computing, platforms and storage, networking solutions, enterprise information security and software products, including databases and operating systems. We provide IT products as a complement to our IT services offerings rather than sell standalone IT products, and our focus continues to be on consulting and digital engagements, with a more selective approach in bidding for SI engagements.
Our ISRE segment consists of IT Services offerings to organizations owned or controlled by the GoI and/or any Indian State Governments. Our ISRE strategy focuses on consulting and digital engagements, and we are selective in bidding for SI projects with long working capital cycles.
We have had no material impact on the Company’s business, profitability, or liquidity due to the COVID-19 pandemic. However, we have discussed certain risks and corresponding mitigation plans and impact on specifics areas in this Annual Report.
31
Integrated Annual Report 2020-21
Wipro Limited

Our Business StrategyOur strategy supports value creation for clients and growth for our organization through five strategic priorities: accelerate growth, strengthen clients and partnerships, lead with business solutions, building talent at scale, and a simplified operating model. We are focusing our efforts and our investments on maximum results, going deeper in areas that we believe we have strength and defocusing on others, and scaling up to secure leadership positions. Our new strategy will bring us closer to clients, drive greater agility and responsiveness and help us become the employer of choice.
Our vision is to:
→ be a trusted partner to our clients in their transformation journey and enable them in achieving leadership in their respective industries
→ deliver value to our clients as part of their transformation journey through sector focused ‘Business Solutions’, ‘Digital’ and ‘Technology’ capabilities, cutting edge innovation, leveraging our strategic partnerships and our world class talent
We aim to realize our vision through five key strategic priorities:
1. Accelerate growth – focus and scale Our first priority is growth through focus on identified markets and sectors within markets, bringing the best of Wipro to our clients.
Our choice of sectors in a market is being driven by both market attractiveness and by Wipro’s competitive positioning and strengths. We have therefore prioritized specific sectors in certain markets, and we will build or sustain, as the case may be, our leadership position in those intersections.
Our priority markets include the Americas, certain countries in Europe and APMEA. The Americas continues to be a large market and continues to be our key focus. We are also building a strong growth plan for Europe, Asia and the Middle East.
2. Strengthen clients and partnershipsOur second strategic priority is to strengthen clients and partnerships through four levers:
→ Global account executive model: We have global account executives, senior leaders representing Wipro for our key clients, who are enabled by a team of industry and technology specialists and delivery leaders and with strong decision-making capabilities including committing on investments, to grow these client accounts.
→ Large deals expertise: The second lever where we are significantly boosting our capabilities is in large deal origination and signing. We have invested in a large deal expertise team consisting of deal principals, financial and commercial modelers, experienced consultants and program directors, to bring expertise in large deal creation, solutioning, structuring and supporting our SMUs in signing large deals.
→ Strategic partnerships: We are committed to scale partnerships with our key alliances such as Amazon Web Services, Microsoft, Google Cloud Platform, ServiceNow, Salesforce, SAP and IBM. We have intensified our efforts to build dedicated ‘Cloud Studios’ and ‘Centers of Excellence’, talent, and our capability to take joint business solutions to our clients.
→ Market and capability leadership through M&A and Wipro Ventures: We are focused on M&A as a key area to fast-track solutions and capability building in emerging areas and accelerating our access and presence in identified markets. With a strong post-merger integration focus, we are committed to driving synergies and effectively integrating acquisitions. In the last six months, we have doubled down our investments both organic and inorganic in order to deepen our presence in key markets and sectors. We closed acquisitions across several key markets, including the US, Europe,
32 Building a Bold Tomorrow

LATAM, Australia and India. These acquisitions have strengthened our local presence, and service offerings. We closed our largest-ever acquisition, Capco for $1.45 billion . This acquisition will significantly strengthen our position in the global financial services market and we are very excited to onboard some exceptional domain experts and leadership talent in that space.
Our renewed focus on the market and customers ensured we had healthy order book. We closed two mega deals; one in Europe and one in the Americas market, each of which can lead to revenues of $1 billion+ over the deal duration.
3. Lead with business solutionsWe are focusing on multiplying our business solutions, and building a catalog of industry-specific solutions, relevant to our clients in their industries by leveraging industry expertise, technology capability and ecosystem partnerships. A few examples of solutions we have built for our clients include digital banking solutions, core modernization for a telecom company for faster 5G deployment, the Open Subsurface Data Universe platform (data and analytics platform in the upstream oil and gas sector) and warehouse management solution for consumer companies.
4. Building talent at ScaleClients need partners who will challenge old ways of working, bring forth new ideas and proactively drive change. We are investing in deep domain and technology expertise and market makers. Our priorities include:
→ Hiring talent in the front end, domain and technology areas. We are investing in consulting, transformation architects, and domain and in cutting-edge areas of technology such as AI, data sciences and engineering.
→ Reskilling and building onsite and local scale in digital and next-generation capabilities. Our learning and talent transformation programs conform to the new ways of working, and are modelled on ‘Anytime, Anywhere’ learning, social learning, community learning and through mentoring networks and talent champions.
→ Building leadership diversity to significantly improve gender and ethnic diversity in our leadership ranks.
→ Driving a ‘high-performance’ culture.
There is now a new cadre of leadership that has joined the existing executive team, we have hired numerous regional leadership across markets and all key positions have been filled
5. Simplified operating modelAll of our strategic priorities will be executed through our simplified operating model. It is a two-axis model of SMUs and GBLs, supported by our business functions.
From a client standpoint, our model ensures adequate sector- and domain-focus in our go-to-market and execution. This enables focused growth, combines global expertise with local geography-focus in building capabilities, and ensures dedicated sales presence led by proximity to clients. Effective January 1st 2021, we have moved into a new organization structure. The operating model is simple and effective.
Integrated Annual Report 2020-21
Wipro Limited
33
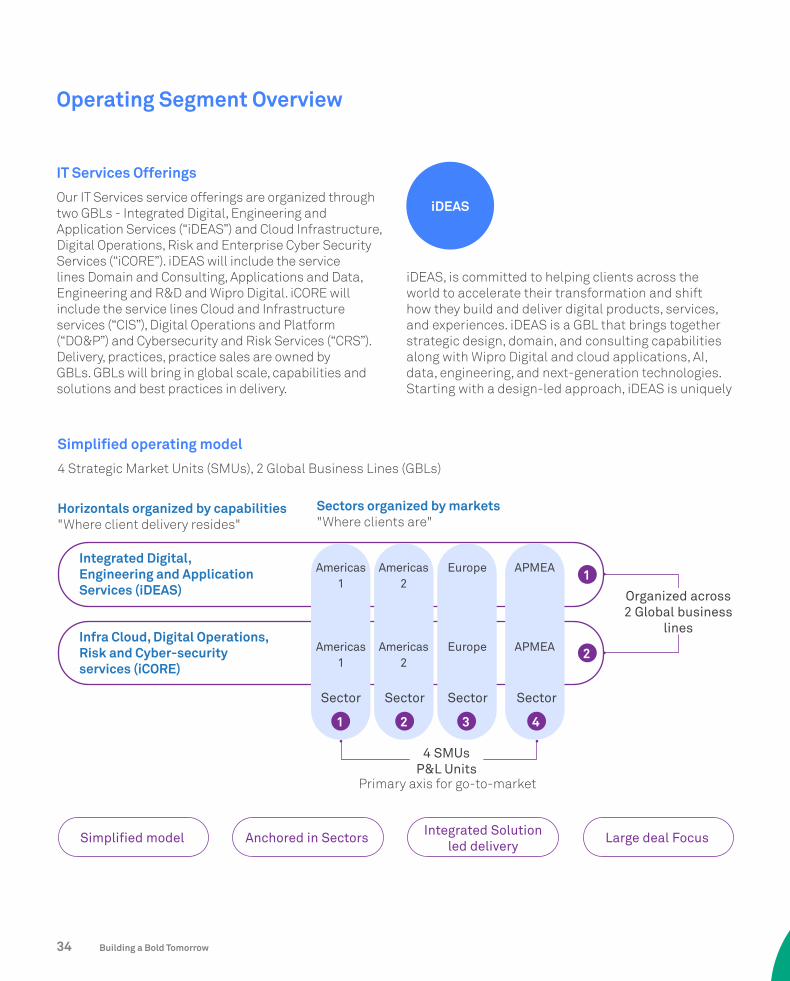
IT Services Offerings
Our IT Services service offerings are organized through two GBLs - Integrated Digital, Engineering and Application Services (“iDEAS”) and Cloud Infrastructure, Digital Operations, Risk and Enterprise Cyber Security Services (“iCORE”). iDEAS will include the service lines Domain and Consulting, Applications and Data, Engineering and R&D and Wipro Digital. iCORE will include the service lines Cloud and Infrastructure services (“CIS”), Digital Operations and Platform (“DO&P”) and Cybersecurity and Risk Services (“CRS”). Delivery, practices, practice sales are owned by GBLs. GBLs will bring in global scale, capabilities and solutions and best practices in delivery.
iDEAS, is committed to helping clients across the world to accelerate their transformation and shift how they build and deliver digital products, services, and experiences. iDEAS is a GBL that brings together strategic design, domain, and consulting capabilities along with Wipro Digital and cloud applications, AI, data, engineering, and next-generation technologies. Starting with a design-led approach, iDEAS is uniquely
Operating Segment Overview
Simplified operating model
4 Strategic Market Units (SMUs), 2 Global Business Lines (GBLs)
Integrated Solution led delivery
Anchored in SectorsSimplified model Large deal Focus
Horizontals organized by capabilities"Where client delivery resides"
Organized across 2 Global business
lines
4 SMUsP&L Units
Primary axis for go-to-market
Integrated Digital, Engineering and Application Services (iDEAS)
Infra Cloud, Digital Operations, Risk and Cyber-security services (iCORE)
1
2
1 2 3 4
Americas 1
Americas 1
Sector Sector Sector Sector
Americas 2
Americas 2
Europe
Europe
APMEA
APMEA
Sectors organized by markets"Where clients are"
iDEAS
34 Building a Bold Tomorrow

iCORE is committed to accelerating the transformation journey of our customers and enabling the enterprise of the future that is agile, intelligent, and resilient. iCORE focuses on the core of any enterprise by leveraging next-generation technologies and solutions across cloud, infrastructure, cybersecurity, process, and business operations to enable this transformation. Our iCORE service lines include:
→ CIS: CIS helps organizations modernize their IT landscape and transform into future-ready digital enterprises leveraging its offerings in cloud, data center, digital workplace, connected intelligence, IoT, and edge computing.
→ CRS: CRS helps our customers achieve a resilient cyber future through advisory-led security and risk management solutions at the leading edge of technology innovation.
→ DO&P: DO&P service line combines our core business knowledge with leading technologies such as digital, robotics process automation, cognitive technologies, and analytics to offer powerful business intelligence that helps improve business visibility and resilience.
IT Services SMUs StructureDuring the year ended March 31, 2021, the Company re-organized IT Services segment from seven industry vertical to four SMUs - Americas 1, Americas 2, Europe and APMEA. Americas 1 and Americas 2 are primarily organized by industry sector, while Europe and APMEA are organized by countries.
→ Americas 1 includes Healthcare and Medical Devices, Consumer Goods and Lifesciences, Retail, Transportation and Services, Communications, Media and Information services, Technology Products and Platforms, in the United States of America and entire business of Latin America (“LATAM”).
positioned to deliver business solutions required by companies to create what matters to them. iDEAS comprises of the following practices and includes Wipro Digital:
→ Applications and Data: This practice includes Cloud Enterprise Platforms (SAP, Oracle, Salesforce, MS Dynamics and Process Transformation and Growth Practices), Data and AI.
→ Application Engineering and Modernization (AEM): This consists of five practices: Microsoft, Legacy Modernization, Tanzu Application Services, Digital Business Integration (“DBI”) and Quality Engineering and Testing (“QET”).
→ Cloud Transformation: This practice brings together our dedicated focus on Cloud hyperscalers along with our transformation and consulting capabilities in the Operating Model, Modernization, High end engineering, Agile and DevSecOps space.
→ Digital Experience (DX): DX delivers customer experience transformation from customer acquisition to customer service by leveraging two key pillars, interaction experience and business process agility.
→ Digital Interactive: This practice includes our strategic and service design unit, Designit.
→ Engineering, Research and Development (ER&D): ER&D enables customers across sectors to engineer products, platforms and technologies and adopt operational technologies required for Industry 4.0 and IoT. Wipro HOLMESTM Platform is part of ER&D.
→ Domain and Consulting: Domain and Consulting brings Wipro’s deep industry and consulting expertise to clients across the globe, developing thought leadership and customizing our solutions to address industry needs.
iCORE
35
Integrated Annual Report 2020-21
Wipro Limited

→ Americas 2 includes Banking, Financial Services and Insurance, Manufacturing, Hi-tech, Energy and Utilities Industry sectors in the United States of America and entire business of Canada.
→ Europe consists of United Kingdom and Ireland, Switzerland, Germany, Benelux, the Nordics and Southern Europe.
→ APMEA consists of Australia and New Zealand, India, Middle East, South East Asia, Japan and Africa.
IT Services Competition The market for IT services is competitive and rapidly changing. The following factors differentiate us from our competition:
→ The comprehensive and integrated suite of IT solutions, including digital strategy advisory, customer-centric design, technology consulting, IT consulting, custom application design, development, re-engineering and maintenance, systems integration, package implementation, global infrastructure services, cloud, mobility and analytics services, business process services, research and development and hardware and software design.
→ Wipro Digital has integrated propositions in customer mapping and interaction, seamless integration and data science and insight differentiate its approach with customer journey engineering.
→ Our organizational culture of innovation and our early start in deploying cutting edge platforms and technologies that drive hyper-automation and achieve industrialization of service delivery, such as Wipro HOLMESTM.
→ Our investments in developing IP across products, platforms, frameworks, solutions, components, accelerators, tools and apps that enable us to provide standardized solutions to our customers and obtain enormous time-to-market advantage.
→ Crowdsourcing (Topcoder): A community and crowdsourcing platform with over one million developers, designers, data scientists and testers. Topcoder provides focused enterprise offerings around AI/ML and analytics, DX, Quality as a Service
(“QaaS”), workforce transformation, Talent as a Service (“TaaS”) and hybrid (certified) communities.
→ Our decades of experience in serving in the IT business, proven track record of delivery excellence and satisfied customers who recommend our services to other corporations.
→ Our ability to provide an entire range of research and development services from concept to product realization.
→ Our global delivery model, that leverages our global, regional and local near-shore development centers and collaborative technologies to help us better serve our clients in this modern technology era.
→ Our ability to access, attract and retain highly skilled personnel across key markets.
→ Our emphasis on acquiring companies with new age technologies and integrating them with our service offerings, to maximize synergies for our clients.
→ Our ability to offer opportunities to work with cutting edge technologies and focus on training is a critical differentiator to the quality of our manpower.
→ The Wipro brand that is recognized globally for its comprehensive portfolio of services, a practitioner’s approach to delivering innovation and an organization-wide commitment to sustainability.
→ Our commitment to the highest levels of corporate governance.
IT Products
We provide IT products as a complement to our IT services offerings rather than sell standalone IT products.
IT Products CustomersWe provide our offerings to enterprises in all major industries, primarily in the India market: government, defense, IT and IT-enabled services, telecommunications, manufacturing, Utilities, Education and Financial services sectors.
We have a diverse range of customers. For the year ended March 31, 2021, we had one customer that accounted for 15.4% of our overall IT Products segment revenue.
Operating Segment Overview
36 Building a Bold Tomorrow

IT Products Sales and MarketingWe are valued-added resellers of third-party enterprise products through our direct sales force. Our sales teams are organized by industry vertical. Our global account executives and client executives receive support from our corporate marketing team to assist in brand building and other corporate level marketing efforts for various market segments.
IT Products CompetitionOur competitors in the IT Products market include global system integrators as well as local and niche services providers operating in specific geographies like India. One of the major challenges we encounter is margin pressure due to competitive pricing. Achieving mindshare and market share in a crowded market place requires differentiated strategies on pricing, branding, delivery and products design. We are favorably positioned based on our brand, quality leadership, expertise in target markets and our ability to create customer loyalty by delivering value to our customers.
→ Our decades of experience in serving in the IT business, proven track record of delivery excellence and satisfied customers who recommend our services to other corporations.
→ Our deep understanding of the market especially in India.
→ Our trusted ability to provide impartial advice on selection of products.
→ The Wipro brand that is recognized for serving the Indian market over seventy-five years.
→ Our commitment to environmental sustainability as well as deep engagement with communities.
ISRE
The ISRE segment consists of IT Services offerings to departments or ministries of the GoI and/or the Indian State Governments, as well as to corporate entities where more than 51% of the paid-up capital is held by the GoI or any Indian State Government, either individually or jointly (i.e., a “Public Sector Undertaking”). In certain cases, corporate entities which are held by the Central / State Government (more than 51%), in turn hold more than 51% stake of paid-up capital in other entities (i.e., a controlling stake), such other entities are also classified as an ISRE.
We have pivoted our ISRE strategy to focus more on consulting and digital engagements and to be selective in bidding for SI projects with long working capital cycles.
We will be leveraging our strong practices in areas such as taxation and e-governance, oil, gas, and utilities, along with our strong partner system, to work with Indian government entities, Public Sector Undertakings and other large companies classified as ISREs. For BFSI projects in our ISRE segment, we aim to replicate our successes in areas such as core banking transformation, and consulting.
Customers We have customers across the GoI, Indian State Governments and in industry segments such as BFSI and ENU in the form of corporate entities where more than 51% of the paid-up capital is held by the Central and/or State governments of India. We work with multiple ISRE customers and our top two ISRE customers contributed approximately 26% of our ISRE revenues for the year ended March 31, 2021. Our largest ISRE customer accounted for 19.0% of our overall ISRE segment revenue for the year ended March 31, 2021.
ISRE Sales and MarketingOur ISRE business unit will focus on the unique customer requirements and will create a “Go to Market” approach that will address the needs of the present as well as future.
ISRE Competition In the ISRE sector, our competition comes from both local and global IT services companies, including large global consulting firms. For the GoI segment, several small companies have entered the market as disruptors, with most of these small companies focused on penetration strategy.
→ Our deep technology knowledge and domain expertise specifically in BFSI and ENU.
→ Our strong partnership with key alliance partners including hardware and software partners.
→ Significant experience in successfully delivering key marquee programs and strong reference across the ISRE sector.
37
Integrated Annual Report 2020-21
Wipro Limited

Risk Management FrameworkThe risk landscape in the current business environment is changing dynamically with the dimensions of Cyber security, Information Security and Business Continuity, Data Privacy and Large Deal Execution figuring prominently in the risk charts for most organizations in our sector. To effectively mitigate these risks, we have employed a risk management framework, which helps proactively identify, prioritize and mitigate risks. The framework is based on principles laid out in the four globally recognized standards as below.
COSO; Enterprise Risk Management- Integrating with strategy and performance (2017) by Tread way Commission
AS/NZS ISO 31000:2009 Risk Management - Principles and Guidelines by AUS/NZ Standards Board
ISO - ISO 31000:2018, Risk Management -Guidelines
Orange Book by UK Government Treasury
Audit Committee of the boardGovernance Oversight Tone @ The Top
Dev
elop
& d
eplo
y P
olic
y/Fr
amew
ork
Continuous Im
provement
Standard ERM framework People, Process, Technology
Risk Management
Identification
Governance
Evaluation
Operational
Monitoring
Reporting
Analysis
Strategic
Treatment
Compliance
Risk Categories
Risk Management Team
Framework Management
Business Units & FunctionsRisk Ownership
38 Building a Bold Tomorrow

Business Continuity Risk This arises out of global disruptions like pandemic, natural disasters, IT outages, cyber security, terror attacks and unrest, power disruptions.
Internal Financial Reporting and Control In response to the COVID-19 pandemic, we initiated our business continuity program in March 2020 and facilitated our employees to work remotely/work from home. Our business continuity program and the design of our processes allow for remote execution with accessibility to secure data. There were no changes to our internal control over financial reporting that have materially affected or are reasonably likely to materially affect our internal control over financial reporting during the period covered in this Annual Report.
Mitigation plan
→ Business Continuity Management System (BCMS) and a framework aligned to ISO 22301 across global locations, accounts and service functions
→ Core BCM team is a skilled cross-functional team comprising members from Delivery, Legal, Office Administration, HR, Procurement, IT enablement & IT security teams
Pandemic and COVID-19 This includes COVID-19 outbreak within the company’s premises, impacting employee safety and well-being.
Mitigation plan
→ Work from home policy – Implemented WFH policy wherein most employees continue to work from home, barring the absolute essential staff mandated by customer requirement
→ Workplace safety measures – Availability of medical support within premises
→ Wellness focus – physical and emotional well being, financial support
Regulatory Compliance It covers various federal, state, local and foreign laws relating to various aspects of the business operations and non- compliances can result in substantial fines, sanctions, etc.
Mitigation plan
→ A program on statutory compliance is in place with the objective to track all applicable regulations, obligations and corresponding action items that require to be adhered to ensure compliance along with necessary workflows enabled
Mitigation plan
→ Effective security controls implemented to detect, prevent and remediate threats
→ Program to continuously monitor the effectiveness of the controls are implemented to effectively sustain the security controls
→ Focus on continuous improvement of the efficacy of the security controls with the adoption of new processes and latest technology solutions
Escalation of Information Security, Cyber Security and Technology Risk On account of increase in surface area of devices
39
Wipro LimitedIntegrated Annual Report 2020-21

M&A integration M&A is a key strategy for Wipro. The seamless and successful integration of the new entities into the larger organization is a key focus.
Mitigation plan
→ Involved a cross functional team to plan the integration, right from the due diligence stage to post integration and until steady state operations
Data Privacy Regulations (such as General Data Protection Regulation in Europe) relating to personal information dealt with both by and on behalf of Wipro increases the risk of non-compliance.
Mitigation plan
→ Strengthened the Data Privacy program, taking into consideration the privacy regulatory requirements, with specific emphasis to revalidate all existing frameworks, policies and processes that can be leveraged by respective support function and delivery teams, covering all applicable geographies and areas of operations
→ Executed Data process/ Data transfer agreements with customers as well as vendors for flow down DTA/DPA to ensure governance
→ Also strengthened Wipro systems to ensure personal data governance from controller perspective
→ Adherence to privacy by design is a non-negotiable requirement incorporated in the application development and rollout process
→ Set up a well-defined process to handle subject access requests related to personal data, to cater to the SAR requirements
→ Implemented a 24*7 personal incident management process to ensure speedy governance on personal data related incidents; if any
→ Made mandatory data privacy awareness and refresher sessions for all employees as part of Wipro onboarding process
Geo-political or Economic Situations Risk of Protectionism policies impacting the business in that market.
Mitigation plan
→ Country Risk Assessment framework
Employee work place Environment, Health, Safety and Security Risk is a major focus area
Mitigation plan
→ Addressing employee health and safety requirements including both the physical and mental well-being
→ Extended safe and healthy work environment to all our contractors, customers, visitors at our premises and to our extended value chain
→ OHSAS ISO45001 implemented across campuses
Risk Management Framework
Building a Bold Tomorrow40

Intellectual Property (IP) Violating or misusing our client's intellectual property rights or for breaches of third-party intellectual property rights or confidential information in connection with services to our clients can lead to reputational and financial risk. Inadequate protection of Wipro IP can lead to financial loss and loss of market opportunity.
Mitigation plan
→ An elaborate program exists to safeguard our clients and Wipro's Intellectual Property
→ The dedicated IP unit ensure that all Wipro and client IP is protected, reviews and enhances program on an on-going basis and ensures a strong Governance
→ Undertake employee awareness and training programs, employee IP declaration, systemic controls and periodic reviews to ensure adherence
Service Delivery and Obligation Management RiskMitigation plan
→ Risk Management framework is implemented for large value deals to assess solution fitness, credit risks, financial risks, technology risks among other risk factors
→ Contractual compliance programs ensure regular project reviews and highlights any risk to service delivery
→ Early warning systems and customer satisfaction surveys help to assess effectiveness
→ Additional risk assessment of Functions ensures pro-active mitigation of risks that are likely to impact service delivery
Talent RiskAttracting, up-skilling and retaining talent is a key risk.
Mitigation plan
→ Initiated an organization re-structuring program including a simple delivery model that will yield economies of scale
→ It will also help achieve our goal of becoming an employer of choice
Fraud RiskThis is related to information dealt with both by and on behalf of Wipro and increases the risk of non-compliance.
Mitigation plan
→ Put in place a robust Fraud Management program to identify potential areas of failure and proactively implement mitigations
→ The Code of Business Conduct, Zero tolerance policy on integrity, Anti- Bribery and Anti-Corruption program (ABAC), Finance Risk Management program, Vendor Management program and our Ombuds program ensures a strong governance around fraud management
→ The ABAC program classifies each country from a risk perspective basis factors and build control and mitigation plans accordingly.
See ‘Natural Capital’ section
Environmental & Climate Related Risks
41
Integrated Annual Report 2020-21
Wipro Limited

Good Governance and Management Practices
Corporate GovernanceWipro’s corporate governance framework is more than just adherence to the statutory and regulatory requirements. It is equally about focusing on voluntary practices that underlie the highest levels of transparency and propriety.
Our Corporate Governance philosophy is put into practice at Wipro through the following four functional layers:
Governance by Shareholders
Governance by Board of Directors
Governance by Sub-Committees of Board of Directors
→ Audit, Risk and Compliance Committee (also acts as Risk Management Committee)
→ Board Governance, Nomination and Compensation Committee, which also acts as CSR Committee
→ Administrative, Shareholders and Investors Grievance Committee (Stakeholders Relationship Committee)
Governance by Management ProcessEnsuring regulatory compliance and adherence to standards is of utmost importance to Wipro. Wipro has a compliance framework and the objective of this framework is to deploy appropriate practices and processes to ensure compliance with all applicable laws and regulations, globally and to ensure compliance risks are identified, and adequately mitigated. The Compliance framework includes the Global Statutory Compliance Policy and Certification Process as approved by the Audit Committee and Board of Wipro Limited. Electronic dashboards, self-deceleration checklists on statutory obligations and audits are some of the mechanisms to monitor and manage compliance in Wipro.
The Risk Steering Council and Risk and Governance committee, meet on monthly & quarterly basis respectively, to review key risk themes and provide direction and oversight, to the risk management process.
Governance by Code of Business ConductWipro has an organization wide Code of Business Conduct which reflects general principles to guide employees in making ethical decisions. The Code outlines fundamental ethical considerations as well as specific considerations that need to be maintained for professional conduct. Our Code of Business Conduct is available at https://www.wipro.com/investors/corporate-governance/
Governance by Management Process
→ Risk Management
→ Code of Business Conduct
→ Compliance Framework
→ The Ombuds process
→ Spirit of Wipro
42 Building a Bold Tomorrow

Materiality Determination & Stakeholder Engagement
At Wipro, stakeholder engagement is an ongoing process. Stakeholders identification is based on attributes such as Impact, Influence, Interest, Legitimacy, Urgency and Diverse Perspective. These attributes help identify stakeholders across value chain that are important to business and necessitates meaningful engagement. Based on these attributes, we identified eight stakeholder groups - Employees, Customers, Investors, Suppliers, Education System, Communities & civil societies, Government and Policy Networks and The Young Citizen and Future Generation. We believe stakeholder inclusiveness is central to the materiality determination process and it is important to consider reasonable expectations and interests of stakeholders so as to provide a balanced view of the issues that emerge.
1Refer to Summary of Stakeholder Engagement2Materiality Determination Exercise at https://www.wipro.com/
content/dam/nexus/en/sustainability/sustainability_reports/wipro-
sustainability-report-2019-20.pdf
Materiality determination for the organization is based on a comprehensive process that include an internal materiality determination and external benchmarking with peers and sustainability standards. A significant part of materiality determination stems from the organization’s overall mission, values, commitments and competitive strategy as well as the impact of or on its economic performance. An internal perspective on risks as identified through organizational processes like risk assessment studies and audits or self-assessments using disclosure frameworks
like financial/sustainability reports, DJSI, CDP, etc. is considered. For external benchmarking, we conduct an extensive review of literature to identify issues considered as material and identified as risks by our business peers and also to understand expectations expressed in international standards and agreements like Sustainability Accounting Standard Board (SASB). The issues are then prioritized based on multiple dimensions of risk, returns and relevance.
Stakeholders identification is based on attributes such as Impact,
Influence, Interest, Legitimacy, Urgency, and
Diverse Perspective.
43
Integrated Annual Report 2020-21
Wipro Limited

We have used capital framework namely Financial, Human, Intellectual, Social & Relationship and Natural capitals to report on value created by the organization across its value chain. We have classified key material issues under these five capitals and report on our approach, policies, process and initiatives implemented under each capital sections. The table below depicts the interconnectedness of capitals through the lens of material issues for the organization.
Inter-relationships among Capitals
Input Capital
Name of Capital Material Aspects
Human Capital (HC)
Hiring & Onboarding
Performance & Talent ManagementLearning & Development
Employee Well-being
Employee Experience, Engagement & Communication
Social & Relationship Capital (S&RC)
Data Security & IT Privacy
Customer Engagement
Supplier Envt/Social Assessment
Community & Education
Intellectual capital (IC)
Innovation
Financial Capital (FC)
Financial Performance
Natural Capital (NC)
Emissions & Energy, Waste, Water, Biodiversity
Relationship with other capitals
– Improved business performance
– Creation of IP, technology expertise
– Customer Engagement and improvement in CSAT/NPS scores
– Improved business performance
– Improved business performance
– Customer Engagement and improvement in experience index scores
– Better experience index score – Revenue, Profitability
– Customer retention and new customer acquisition
– Reduce impact on environment
– Better Employee Satisfaction Survey (ESS) – Increase in brand and reputation
– Revenue from new services
– Patents, IP, Platforms
– Employee Benefits
– Creating value for Customers Suppliers, Community, Investors
– Operational cost reduction
– Creating value for Customers Suppliers, Community, Investors
44 Building a Bold Tomorrow

(` in millions except earnings per share data)
Consolidated results FY2020 FY2021 YoY Change
Revenues1 613,401 622,425 1.5%Cost of revenues (436,085) (423,205) (3.0)%Gross profit 177,316 199,220 12.4%Selling and marketing expenses (42,907) (41,400) (3.5)%General and administrative expenses (29,823) (34,686) 16.3%Other Operating Income2 1,144 (81) (107.1)%Operating Income 105,730 123,053 16.4%Finance Expenses (7,328) (5,088) (30.6)%Finance and Other Income 24,081 20,912 (13.2)%Income Taxes (24,799) (30,345) 22.4%Profit attributable to equity holders 97,218 107,946 11.0%As a Percentage of RevenueGross Margin3 28.9% 32.0% 3.2%Selling and marketing expenses 7.0% 6.7% (0.3)%General and administrative expenses 4.9% 5.6% 0.7%Operating Margin3 17.2% 19.8% 2.6%
Earnings per share-Basic (I)4 16.67 19.11 14.6%
Earnings per share-Diluted (I)4 16.62 19.07 14.7%
1 For segment reporting, we have included the impact of exchange rate fluctuations in revenue. Excluding the impact of exchange rate fluctuations, revenue, as reported in our statements of income, is H610,232 and H619,430 million for the years ended March 31, 2020 and 2021, respectively
2 Other operating income represents: (i) For the year ended March 31, 2020, (a) change in fair value of the callable units upon partial achievement of business targets pertaining to sale of data center business, and (b) gain on sale of assets pertaining to Workday business and Cornerstone OnDemand business in Portugal, France and Sweden. (ii) For the year ended March 31, 2021, change in fair value of the callable units upon partial achievement of cumulative business targets pertaining to sale of our hosted data center services business
3 Gross margin and operating margin as a percentage of revenue for year have been calculated by including Other Operating Income with Revenue
4 In FY 2020-21, EPS growth is higher than Net profit growth largely due to reduction in number of equity shares due to completion of buyback
Financial Capital
45
Wipro LimitedIntegrated Annual Report 2020-21

Results of operations for the years ended March 31, 2021 and 2020
RevenueOur revenue increased by 1.5%. Our IT Services segment revenue increased by 2.0%. The revenue of all SMUs, except for Americas 2, grew during the year, with growth led by Europe and APMEA. The growth in these SMUs was led by a surge in demand for IT services by our customers, a ramp up of our new deal wins and depreciation of the Indian Rupee against foreign currencies, including the Euro, Pound Sterling and Australian Dollar. The decline in revenues from Americas 2 was primarily due to reduction in revenue from the banking, financial services and insurance sector and manufacturing sector.
Revenue of the IT Products segment declined by 34.1%, which was primarily due to our focus on providing IT products as a complement to our IT services offerings, rather than selling standalone IT products, as well as our change in strategy to focus on consulting and digital engagements with ISRE clients rather than SI engagements.
Revenue of the ISRE segment increased by 12.1%, which was primarily due to improved execution of SI deals during the year ended March 31, 2021.
ProfitabilityIn absolute terms, cost of revenues decreased by 3.0%, primarily because of decrease in travel costs due to the COVID-19 pandemic, and lower subcontracting costs due to the Company’s cost efficiency efforts. Improvement in key operational parameters and higher offshoring also contributed to this increase. This was partially offset by an increase in employee compensation due to the impact of salary increases and increase in headcount, and depreciation of the Indian Rupee against foreign currencies, including the Euro, Pound Sterling and Australian Dollar. As a result of the foregoing factors, our gross profit as a percentage of our total revenue increased by 316 basis points (“bps”).
Selling and Marketing expensesOur selling and marketing expenses as a percentage of total revenue decreased from 7.0% for the year ended March 31, 2020 to 6.7% for the year ended March 31, 2021. In absolute terms, selling and marketing expenses decreased by 3.5% primarily because of decrease in travel costs and marketing and brand building costs due to the COVID-19 pandemic. This was partially offset by an increase in depreciation, amortization and impairment, due to an impairment charge of H2,418 million on certain intangibles assets recognized on acquisitions.
General and Administrative expensesOur general and administrative expenses as a percentage of revenue increased from 4.9% for the year ended March 31, 2020 to 5.6% for the year ended March 31, 2021. In absolute terms, general and administrative expenses increased by 16.3%, primarily due to increase in communication cost, rates, taxes and insurance costs and contributions towards COVID-19, included under “Others” in the year ended March 31, 2021. These increases have been partially offset by the decrease in travel costs due to the COVID-19 pandemic in the year ended March 31, 2021 as compared to the year ended March 31, 2020.
Finance expensesOur finance expenses decreased from H7,328 million for the year ended March 31, 2020 to H5,088 million for the year ended March 31, 2021. Reduction in exchange fluctuation expense due to repayment of foreign currency loans and reduction in interest rates during the year ended March 31, 2021, primarily resulted in lower finance expense.
Other Operating incomeDuring the year ended March 31, 2021, we recorded H(81) million towards change in fair value of the callable units upon partial achievement of cumulative business targets pertaining to the sale of our hosted data center services business.
During the year ended March 31, 2020, we recorded (a) H992 million toward change in fair value of the
Financial Capital
46 Building a Bold Tomorrow

callable units upon partial achievement of first and second year’s business targets pertaining to the sale of our hosted data center business, and (b) H152 million toward gain on sale of assets pertaining to the divestment of the Workday and Cornerstone OnDemand business in Portugal, France and Sweden.
As a result of the foregoing factors, our operating income increased by 16.4%, from H105,730 million for the year ended March 31, 2020 to H123,053 million for the year ended March 31, 2021. As a result of the above, our results from operating activities as a percentage of revenue (operating margin) increased by 257 bps from 17.2% to 19.8%.
Finance and Other incomeOur finance and other income decreased from H24,081 million for the year ended March 31, 2020 to H20,912 million for the year ended March 31, 2021. The decrease is primarily due to decrease in interest income by H3,322 million during the year ended March 31, 2021 compared to the year ended March 31, 2020.
Income taxesOur income taxes increased by H5,546 million from H24,799 million for the year ended March 31, 2020 to H30,345 million for the year ended March 31, 2021. Our effective tax rate has increased from 20.2% for the year ended March 31, 2020 to 21.8% for the year ended March 31, 2021. This increase is primarily due to reduction in special economic zone tax benefits in India.
Profit attributable to non-controlling interestOur profit attributable to non-controlling interest has increased from H495 million for the year ended March 31, 2020 to H716 million for the year ended March 31, 2021.
As a result of the foregoing factors, our profit attributable to equity holders increased by H10,728 million or 11.0%, from H97,218 million for the year ended March 31, 2020 to H107,946 million for the year ended March 31, 2021.
1 For the purpose of segment reporting, we have included the impact of exchange rate fluctuations amounting to `3,232 million and `2,955 for the years ended March 31, 2020 and 2021, respectively, in revenue
2 Includes Other operating income, which is being included to present the effect in the year ended March 31, 2020, the Company’s concluding the sale of assets pertaining to the Workday business and Cornerstone OnDemand business in Portugal, France and Sweden and the recognized change in fair value of the callable units upon partial achievement of business targets pertaining to sale of our hosted data center business and, in the year ended March 31, 2021, the recognized change in fair value of the callable units upon partial achievement of cumulative business targets pertaining to sale of our hosted data center services business
3 Gross margin and operating margin as a percentage of revenue have been calculated by including Other Operating Income with Segment Revenue
(` in millions)
IT Services FY2020 FY2021 YoY Change
Revenues1 593,798 605,815 2.0%
Gross Profit 178,794 197,404 10.4%
Selling and Marketing expenses (42,418) (40,985) (3.4)%
General and administrative expenses (29,847) (33,488) 12.2%
Other Operating Income 1,144 (81) (107.1)%
Operating Income2 107,673 122,850 14.1%As a Percentage of RevenueGross Margin3 30.1% 32.6% 2.5%
Selling and marketing expenses 7.1% 6.8% (0.4)%
General and administrative expenses 5.0% 5.5% 0.5%
Operating Margin3 18.1% 20.3% 2.2%
IT Services Financials
47
Integrated Annual Report 2020-21
Wipro Limited

During the year ended March 31, 2021, we recorded H(81) million towards change in fair value of the callable units upon partial achievement of cumulative business targets pertaining to the sale of our hosted data center services business.
As a result of the above, segment results as a percentage of our revenue from our IT Services segment increased by 218 bps, from 18.1% to 20.3%. In absolute terms, the segment results of our IT Services segment increased by 14.1%.
In response to COVID-19, we are focusing on various cost optimization initiatives, including:
1. Re-skilling and re-deployment of our workforce from our existing pool of talent, and new hiring will be done only for business-critical reasons; and
2. Optimization of costs relating to travel, facilities and other discretionary spends like marketing events
Performance against guidanceHistorically, we have followed a practice of providing constant currency revenue guidance for our largest business segment, namely, IT Services in dollar terms. The guidance is provided at the release of every quarterly earnings when revenue outlook for the succeeding quarter is shared. The following table presents the performance of IT Services Revenue against outlook previously communicated for the eight quarters of FY 2021 and FY 2020. Our revenue performance two the quarters of FY 2021 and all quarters of FY 2020 has been within the guidance range.
Guided Outlook versus Actuals(Figures in $ million)
Quarter ending GuidanceAchievement
in guided currency
Reported currency revenue
March 2021 2,102-2,143 2,132.9 2,152.4December 2020 2,022-2,062 2,058.1 2,070.8September 2020 - - 1,992.4 June 2020 - - 1,921.0 March 2020 2,095-2,137 2,104.1 2,072.8December 2019 2,065-2,106 2,085.7 2,094.8September 2019 2,039-2,080 2,061.0 2,048.9June 2019 2,046-2,087 2,061.0 2,038.8
Results of operations for the years ended March 31, 2021 and 2020
IT ServicesThe IT Services segment revenue increased by 2.0% in the year ended March 31, 2021 compared to our revenue in the year ended March 31, 2020. The revenue of all SMUs, except for Americas 2, grew during the year, led by Europe and APMEA. The growth in these SMUs was a result of execution of large deals and acquisitions, as well as depreciation of the Indian Rupee against foreign currencies, including Euro, Pound Sterling and Australian Dollar. The decline in revenues from Americas 2 was primarily due to reduction in revenue in the banking, financial services and insurance sector and manufacturing sector.
Our gross profit as a percentage of our revenue from our IT Services segment increased by 254 bps, primarily because of decrease in travel costs and subcontracting costs due to the COVID-19 pandemic and the Company’s cost efficiency efforts. This was partially offset by an increase in employee compensation due to the impact of salary increases and increase in headcount and an increase in depreciation, amortization and impairment cost.
Selling and marketing expenses as a percentage of revenue from our IT Services segment decreased from 7.1% for the year ended March 31, 2020 to 6.8% for the year ended March 31, 2021. In absolute terms, selling and marketing expenses decreased by H1,433 million primarily because of decrease in travel costs and marketing and brand building costs. This was partially offset by an increase in depreciation, amortization and impairment, due to an impairment charge on certain intangibles assets recognized on acquisitions.
General and administrative expenses as a percentage of revenue from our IT Services segment increased from 5.0% for the year ended March 31, 2020 to 5.5% for the year ended March 31, 2021. In absolute terms, general and administrative expenses increased by H3,641 million, primarily due to increase in an increase in employee compensation due to the impact of salary increases and increase in headcount, communication cost and rates, taxes and insurance costs.
Financial Capital
48 Building a Bold Tomorrow

Sector-wise performance(Figures in $ millions except otherwise stated)
Sector Revenue FY20 Revenue FY21Growth YoY% in
reported currencyGrowth YoY% in
constant currency
BFSI 2,563 2,501 (2.4)% (3.0)%
CBU 1,346 1,334 (0.9)% (1.3)%
COMM 470 419 (10.8)% (12.5)%
ENU 1,062 1,064 0.2% (2.4)%
Health BU 1,088 1,099 1.0% 0.7%
MFG 669 662 (1.1)% (2.1)%
TECH 1,054 1,057 0.2% (0.2)%
Total 8,253 8,136 (1.4)% (2.3)%
Strategic Market Unit wise performance
(Figures in $ million)
Revenue FY20 Revenue FY21
Americas 1 2,447 2,391
Americas 2 2,523 2,416
Europe 2,188 2,222
APMEA 1,095 1,107
Total 8,253 8,136
Our revenue from the IT Products segment decreased by 34.1% in the year ended March 31, 2021 compared to our revenue in the year ended March 31, 2020. The decline was primarily due to our focus on providing IT products as a complement to our IT services offerings rather than sell standalone IT products, and our adoption of a more selective approach in bidding for SI engagements.
Our gross profit as a percentage of our IT Products segment revenue increased by 218 bps, primarily because of decrease in cost of hardware and software.
Selling and marketing expenses as a percentage of revenue from our IT Products segment decreased from 2.4% for the year ended March 31, 2020 to 1.4% for the year ended March 31, 2021. In absolute terms, selling and marketing expenses decreased by H165 million.
General and administrative expenses as a percentage of revenue from our IT Products segment decreased from 1.1% for the year ended March 31, 2020 to 0.9% for the year ended March 31, 2021. In absolute terms, general and administrative expenses decreased by H62 million primarily on account of decrease in lifetime expected credit loss.
As a result of the above, in absolute terms, segment results of our IT Products segment recorded a profit of H45 million for the year ended March 31, 2021 as compared to segment loss of H323 million for the year ended March 31, 2020.
IT Products(Figures in ` million except otherwise stated)
FY2020 FY2021
Revenues1 11,657 7,685
Gross Profit 79 220
Selling and Marketing expenses (274) (109)
General and administrative expenses
(128) (66)
Operating Income (323) 45
As a Percentage of Revenue
Gross Margin 0.7% 2.9%
Selling and marketing expenses 2.4% 1.4%
General and administrative expenses
1.1% 0.9%
Operating Margin (2.8)% 0.6%
1 For the purpose of segment reporting, we have included the impact of exchange rate fluctuations amounting to `(26) million and `20 million for the years ended March 31, 2020 and 2021, respectively, in revenue
49
Integrated Annual Report 2020-21
Wipro Limited

Resource Allocation StrategyYear ended March 31st
Net cash provided by/ (used in) 2019 2020 2021 YoY change
Operating activities 116,316 100,643 147,550 46,907
Investing activities 50,126 34,012 7,739 (26,273)
Financing activities (49,369) (150,998) (128,840) 22,158
Net change in cash and cash equivalents 117,073 (16,343) 26,449 42,792
Effect of exchange rate changes on cash and cash equivalent 526 1,922 (890) (2,812)
Cash and cash equivalent at the end of the period 158,525 144,104 169,663 25,559
ISRE(Figures in ` million except otherwise stated)
ISRE FY2020 FY2021
Revenues1 7,950 8,912
Gross Profit (1,087) 1,630
Selling and Marketing expenses (368) (294)
General and administrative expenses
(394) (275)
Operating Income (1,849) 1,061
As a Percentage of Revenue
Gross Margin (13.7)% 18.3%
Selling and marketing expenses 4.6% 3.3%
General and administrative expenses
5.0% 3.1%
Operating Margin (23.3)% 11.9%
Our revenue from the ISRE segment increased by 12.1% in the year ended March 31, 2021 compared to our revenue in the year ended March 31, 2020, primarily due to large SI deals executed during the year ended March 31, 2021.
Our gross profit as a percentage of our ISRE segment revenue increased from (13.7)% for the year ended March 31, 2020 to 18.3% for the year ended March 31, 2021, primarily due to decrease in subcontracting costs by H1,569 million and led by Company’s cost efficiency efforts.
Selling and marketing expenses as a percentage of revenue from our ISRE segment decreased from 4.6% for the year ended March 31, 2020 to 3.3% for the year ended March 31, 2021. In absolute terms, selling and marketing expenses decreased by H74 million, primarily due to decrease in employee compensation.
General and administrative expenses as a percentage of revenue from our ISRE segment decreased from 5.0% for the year ended March 31, 2020 to 3.1% for the year ended March 31, 2021. In absolute terms, general and administrative expenses decreased by H119 million. This was primarily on account of decrease in lifetime expected credit loss.
As a result of the above, in absolute terms, segment results of our ISRE segment recorded a profit of H1,061 million for the year ended March 31, 2021 as compared to a loss of H1,849 million for the year ended March 31, 2020.
As of March 31, 2021, we had cash and cash equivalent and short-term investments of H345,500 million. Cash and cash equivalent and short-term investments, net of total debt, was H262,168 million.
In addition, we have unutilized credit lines of H66,488 million. To utilize these lines of credit, we require the consent of the lender and compliance
with certain financial covenants. We have historically financed our working capital and capital expenditures through our operating cash flows and through bank debt, as required.
Cash generated by operating activities for the year ended March 31, 2021 increased by H46,907 million while profit for the year increased by H10,949 million during the same period. The increase in cash
1. For the purpose of segment reporting, we have included the impact of exchange rate fluctuations amounting to `(32) million and `5 million for the years ended March 31, 2020 and 2021, respectively, in revenue
Financial Capital
50 Building a Bold Tomorrow

generated by operating activities is primarily due to decreased working capital requirements. This was partially offset by an increase in income tax payments during the year ended March 31, 2021.
Cash generated from investing activities for the year ended March 31, 2021 was H7,739 million. The cash generated from sale of investments (net of purchases) amounted to H16,808 million. Cash utilized for the payment for business acquisitions amounted to H9,873 million. We purchased property, plant and equipment amounting to H19,577 million which was primarily driven by the growth strategy of the Company.
Cash used in financing activities for the year ended March 31, 2021 was H128,840 million as against H150,998 million for the year ended March 31, 2020. This is primarily on account of outflow for an equity share buyback (including tax on buyback) amounting to H116,644 million. Payment toward the dividend for the year ended March 31, 2021 amounted to H5,459 million. This was partially offset by increased net inflow from loans and borrowings amounting to H6,212 million. Dividends paid in the year ended March 31, 2021 represents interim (and final) dividend declared for the year ended March 31, 2021 amounting to H1 per share.
We maintain a debt/borrowing level that we have established through consideration of a number of factors including cash flow expectations, cash required for operations and investment plans. We continually monitor our funding requirements, and strategies are executed to maintain sufficient flexibility to access global funding sources, as needed.
As of March 31, 2021, we have deferred certain indirect tax liabilities and payroll related tax liabilities in certain countries, which are payable over a period of twelve months pursuant to COVID-19 relief measures enacted by the governments of the respective countries. We do not anticipate any liquidity challenges in paying these liabilities, even if such COVID-19 relief measures are withdrawn.
As discussed above, cash generated from operations is our primary source of liquidity. We believe that our cash and cash equivalents along with cash generated from operations will be sufficient to meet our working capital requirements as well as repayment obligations with respect to debt and borrowings. Our choices of sources of funding will be driven with the objective of maintaining an optimal capital structure.
As of March 31, 2021, we had contractual commitments of H7,490 million ($102.4 million) related to capital expenditures on construction or expansion of software development facilities and H15,411 million ($210.7 million) related to other purchase obligations. Plans to construct or expand our software development facilities are determined by our business requirements.
We will rely on funds generated from operations and external debt to fund potential acquisitions and shareholder returns. We expect that our cash and cash equivalents, investments in liquid and short-term mutual funds and the cash flows expected to be generated from our operations in the future will generally be sufficient to fund the growth aspirations, as applicable.
We completed our acquisition of CAPCO on April 29, 2021, and the payment of upfront cash consideration of H108,760 million was funded through bank borrowings and cash and cash equivalents.
In the normal course of business, we transfer certain accounts receivables and net investment in finance lease (financial assets) to banks on a non-recourse basis. The incremental impact of such transactions on our cash flow and liquidity for the years ended March 31, 2020 and 2021 is not material.
Our liquidity and capital requirements are affected by many factors, some of which are based on the normal ongoing operations of our businesses and some of which arise from uncertainties related to global economies and the markets that we target for our services, as well as uncertainties around COVID-19. We cannot be certain that additional financing, if needed, will be available on favorable terms, if at all.
As of March 31, 2020 and 2021, our cash and cash equivalents were primarily held in Indian Rupees, U.S. Dollars, Pound Sterling, Euros, Saudi Riyal, Omani Riyal, Japanese Yen and Australian Dollars.
Shareholders ReturnWe have always strived to enhance shareholder value for our investors. The Company’s policy has been to provide regular, stable and consistent distribution of return. There is no change in our philosophy on shareholder return.
51
Integrated Annual Report 2020-21
Wipro Limited

Cash dividendsThe cash dividend paid per equity share during the year ended March 31, 2020 was an interim dividend of H1, and the Board recommended the adoption of the interim dividend of H1 per equity share as the final dividend. The cash dividend paid per equity share during the year ended March 31, 2021 was an interim dividend of H1, and the Board recommended the adoption of the interim dividend of H1 per equity share as the final dividend.
Buyback of equity sharesDuring the year ended March 31, 2021, we concluded the buyback of 237,500,000 equity shares at a price of H400 ($5.47) per equity share, as approved by the Board of Directors on October 13, 2020 and by our shareholders by resolution dated November 16, 2020 passed through postal ballot by electronic voting. This resulted in a total cash outflow of H116,445 million ($1,592.1 million) including tax on buyback of H21,445 ($293.2 million). As a result of the buyback, our share capital has reduced by H475 million ($6.5 million).
Assessment of key risksGlobal economic and Geo political risksWe derive approximately 59% of our IT Services segment revenue from the Americas (including the United States) and 27% of our IT Services segment revenue from Europe. Our business and financial performance is and will continue to be affected by economic conditions globally. Increased protectionism and the risk of global trade war, resulting in weaker global trade and economic activity could adversely affect our business. If the economy in the Americas or Europe continues to be volatile or uncertain or conditions in the global financial market deteriorate, pricing for our services may become less attractive and our clients located in these geographies may reduce or postpone their technology spending significantly. Reduction in spending on IT services may lower the demand for our services and negatively affect our revenues and profitability.
Taxation risksOur profits for the period earned from providing services at client premises outside India are subject to tax in the country where we perform the work. Most of our taxes paid in countries other than India can be applied as a credit against our Indian tax liability to the extent that the same income is subject to taxation in India. Currently, we benefit from certain tax incentives under Indian tax laws. These tax incentives include a tax holiday from payment of Indian corporate income taxes for our businesses operating from specially designated Special Economic Zones (“SEZs”). Changes to these incentives and other exemptions we receive due to government policies can impact our financial performance.
Wage pressureOur wage costs in India have historically been significantly lower than wage costs in the U.S. and Europe for comparably skilled professionals, and this has been one of our competitive advantages. However, wage increases in India may prevent us from sustaining this competitive advantage and may negatively affect our profit margins. We have historically experienced significant competition for employees from large multinational companies that have established and continue to establish offshore operations in India, as well as from companies within India. We may need to increase the levels of our employee compensation more rapidly than in the past to retain talent. Once the effective date is notified by the GoI, we may also experience increased costs in future years for employment and post-employment benefits in India as a result of the issuance of The Code on Social Security, 2020. Unless we are able to continue to increase the efficiency and productivity of our employees over the long term, wage increases may reduce our profit margins. Furthermore, any inability to increase the proportion of employees with less experience, or source talent from other low-cost locations, like Eastern Europe, China or Southeast Asia could also negatively affect our profits.
Financial Capital
52 Building a Bold Tomorrow
Risk management proceduresWe manage market risk through a corporate treasury department, which evaluates and exercises independent control over the entire process of market risk management. Our corporate treasury department recommends risk management objectives and policies, which are approved by senior management and Audit Committee. The activities of this department include management of cash resources, implementing hedging strategies for foreign currency exposures, borrowing strategies, and ensuring compliance with market risk limits and policies.
Internal control systems and their adequacy We have presence across multiple countries, and a large number of employees, suppliers and other partners collaborate to provide solutions to our customer needs. Robust internal controls and scalable processes are imperative to manage the global scale of operations. We have adopted policies and procedures for ensuring the orderly and efficient conduct of the business, including adherence to the Company’s policies, the safeguarding of its assets, the prevention and detection of frauds and errors, the accuracy and completeness of the accounting records, and the timely preparation of reliable financial disclosures.
Key risksForeign currency risk We operate internationally and a major portion of our business is transacted in several currencies, making us exposed to currency fluctuation.
Mitigation plan
→ We evaluate our exchange rate exposure arising from these transactions and enter into foreign currency derivative instruments to mitigate such exposure.
→ We follow established risk management policies, including the use of derivatives like foreign exchange forward/option contracts to hedge forecasted cash flows denominated in foreign currency.
Interest rate riskInterest rate risk primarily arises from floating rate borrowing, including various revolving and other lines of credit.
Mitigation plan
→ Our investments are primarily in short-term investments, which do not expose us to significant interest rate risk.
→ Periodically, to manage our net exposure to interest rate risk relating to borrowings, we may enter into interest rate swap agreements, which allows us to exchange periodic payments based on a notional amount and agreed upon fixed and floating interest rates.
Credit riskCredit risk arises from the possibility that customers may not be able to settle their obligations as agreed.
Mitigation plan
→ We periodically assess the financial reliability of customers, considering the financial condition, current economic trends, analysis of historical bad debts and ageing of accounts receivable. Individual risk limits are set accordingly.
→ No single customer accounted for more than 10% of the accounts receivable as of March 31, 2021 or for revenues for the year ended March 31, 2021.
→ As per the policy, the total hedges shall be 45% to 100% of the next four quarters of inflows in addition to select long term contracts which are beyond one year in tenor. Our Hedge Book as on March 31, 2021 stood at $3.2 billion dollars.
Counterparty riskCounterparty risk encompasses issuer risk on marketable securities, settlement risk on derivative and money market contracts and credit risk on cash and time deposits.
Mitigation plan
→ Issuer risk is minimized by only buying securities in India which are at least AA rated by Indian rating agencies.
53
Integrated Annual Report 2020-21
Wipro Limited

FY 2020 FY 2021 YoY change
Revenue in ` million (% terms) 613,401 622,425 1.5% F
IT Services Operating Margin (% terms) 18.1% 20.3% 2.2% F
Net Income Margin (% terms) 15.8% 17.3% 1.5% F
Earnings per share in ` (% terms) 16.67 19.11 14.6% F
Price Earnings Ratio (times)1 11.8 21.7 9.9 F
Return on Networth (% terms)2 17.3% 19.4% 2.1% F
Current Ratio (times) 2.4 2.3 (0.1) A
Debtors Turnover (times) 5.5 6.3 0.8 F
Free Cash Flow as % of Net Income (% terms)3 80.7% 119.3% 38.6% F
Debt-equity (times) 0.1 0.2 0.1 A
Interest Coverage Ratio (times)4 20.6 28.6 8.0 F
Key Ratios
F - FavourableA - Adverse
Reasons for significant changes:1 Price earnings ratio is computed as Market share price as on 31st March of respective years by Earnings per share. The increase in PE ratio reflects
the share price increase by 111% at year end. Share price as on 31st March 2020 was lower due to the uncertainty and volatility caused in equity markets owing to the onset of pandemic.
2 Return on Networth is computed as Net Profit by average Networth. The increase in the Net income from C97,218 million in FY 2020 to C107,946 million in FY 2021 has resulted in improvement of Return on Networth.
3 Our Free Cash flow is computed as operating cash flow less net capital expenditure. Our operating cash flow was higher due to improved collection and higher profit during the year ended 31st March, 2021.
4 Interest coverage ratio is computed as Operating profit by Interest expense. The increase in Operating profit from C105,730 in FY2020 to C123,053 in FY2021 and lower interest expense in FY2021 has resulted in improvement of the ratio.
→ Settlement and credit risk is reduced by the policy of entering transactions with counterparties that are usually banks or financial institutions with acceptable credit ratings.
→ There are limits on credit exposure to any financial institution. The limits are regularly assessed and determined based upon credit analysis.
Liquidity riskLiquidity risk is defined as the risk that we will not be able to settle or meet our obligations on time or at a reasonable price.
Mitigation plan
→ Our corporate treasury department is responsible for liquidity and funding as well as settlement management.
→ Processes and policies related to such risks are overseen by senior management. Management monitors the Company’s net liquidity position through rolling forecasts on the basis of expected cash flows. As of March 31, 2021, our cash and cash equivalents are held with major banks and financial institutions.
Financial Capital
54 Building a Bold Tomorrow

Intellectual Capital is core to Wipro’s Strategy. It creates value for the customers and drives sustained growth, differentiation, non-linearity, and profitability for Wipro. Wipro’s Intellectual Capital comprises scalable domain and technology Business Solutions which are powered by IPs built for high opportunity areas leveraging partners, academia, and start-up ecosystem.
Wipro has a versatile portfolio of Business Solutions, which cover the whole nine yards of Business Transformation, Process Transformation, Technology Transformation, and Cybersecurity. They are composites that have IP-based assets at their core and are packaged along with our people-based expertise, capabilities from our partners or start-ups and are targeted to solve specific business challenges.
Our Business Solutions are easily consumable and are offered in flexible and simplified outcome-based and as-a-service commercial constructs.
Wipro runs an idea-hunting program called “The Great Blue Heron” (The bird – Great Blue Heron is a great fisher and fishing is used as a metaphor for idea hunting) for capturing high-potential opportunities across customers, domains and technologies. The Great Blue Heron’s HaBBIT Framework is then leveraged to add the solution to the portfolio. Through HaBBIT, the solutions can be commercialized using any of the five ways – Harvest & co-Innovate (E.g. TOPS, WHRS), Build IP (E.g. Wipro VirtuadeskTM), Buy IP (E.g. ITI), Invest through Wipro Ventures and Technology Enablement.
Intellectual Capital
55
Wipro LimitedIntegrated Annual Report 2020-21

Once the solution and development approach are finalized, it can then be funded through the Horizon Program which is designed to identify & incubate disruptive ideas and drive significant growth & differentiation for Wipro from a 2-3-year horizon standpoint. Through this program, Wipro funds development of business solutions, products, platforms, and competencies. During FY21, we incubated themes like Robotics, Autonomous mobility, Virtual Automation Engineer (a quality assurance and testing product), and industry solutions like Open Subsurface Data Universe (OSDU). Wipro has also funded building new and differentiated skills on ServiceNow through this program.
Business Solutions powered by IPs: Wipro has a rich portfolio of enterprise-grade Business Solutions and has been actively investing in strengthening, enhancing, and refreshing the portfolio. Here are some examples:
Wipro’s Digital Lending Business Solution powered by NetOxygen Loan Origination System (LOS) and NetOxygen Launchpad Point of Sale (POS) system is the choice of prominent US lenders. With loan origination capabilities spanning across mortgage, consumer and commercial space, lenders have leveraged our solutions to reduce origination costs and boost production efficiency through automation, while enabling quicker deployment and scalability.
Open Subsurface Data Universe (OSDU) is an Open Group forum for development of data management standards for the Oil & Gas Industry. Wipro is a contributing member of this forum since inception. We are an exclusive partner for implementation of the OSDU specifications. We have participated in OSDU technical committees and have been instrumental in deploying the first operator ready versions of OSDU for several major Oil companies.
Wipro’s Cloud Studio is a one-stop marketplace that enables our customers to reimagine their cloudification journey and move to Cloud. We provide this through a highly automated and industrialized approach that enables ‘lift and shift’, re-factor, re-platform, and deploys a Cloud native and DevOps environment while ensuring security and compliance. The 'phygital' studio includes immersive customer experience zones, collaboration pods for ideating and developing next generation solutions with hyper-scalers and futuristic workspaces.
Wipro has continued its investments in strengthening Business Solutions like Medicare Advantage, Promax, Wipro HOLMESTM, Wipro VirtuadeskTM, Topcoder and its Cybersecurity Platforms around Cloud Security, Digital Identity & Access Management, and Threat Detection & Response.
Intellectual Capital
56 Building a Bold Tomorrow

Co-Innovation and Open InnovationOur Open Innovation programs further enriches our innovation capabilities by co-opting an extended innovation ecosystem of start-up partners, academia and expert networks. During the year, we signed into a MoU with Tel Aviv University (“TAU”) for jointly working on identifying possible quantum computing approaches to complicated business problems. Wipro research teams work with the University of Texas at Austin, TAU, IIT Kharagpur, IIT Madras, IISc Bengaluru, and the Institute of Wood Sciences, Bengaluru, among others on various topics in AI, NLP, encryption, 5G, blockchain, autonomous vehicles, CV and other critical new technologies. We also continued to incubate new innovative start-up partnerships and in scaling existing relationships through joint engagements.
Our robotics practice is focusing on industrial robotics developing smart solutions using industrial robots, cobots, AGVs, AMRs, drones and other technologies that aim to make industrial operations hyper-efficient. We have partnered with Wipro-PARI to provide integrated IT-OT solutions to our customers. For all of our robotics projects, we are digitizing, orchestrating the process using AI and generating rich analytics that will help reimagine production. We believe that these initiatives will enable the factory of the future. We have helped our customers with physical automation solution integrated with ERP, drone based automated stock-check, intelligent machine tending, optimize logistic package handling operations and remote management of production line. We have signed a partnership agreement with Yaskawa to develop and deploy production ready solutions to our customers. We have signed research partnership with Fraunhofer Institute of Manufacturing Engineering and Automation to jointly develop AI solutions for the factory of the future.
We are working on building capability in application of 5G technologies. We are engaging with IIT Kharagpur on RF, new waveform and precision localization technology research for 5G and beyond. As an engineering solutions organization, we are investing in building our IP portfolios, in contributing to standards
build, in creating use cases to demonstrate new possibilities and enabling customers to embark on new technology journeys. We have invested in academic collaboration in strategic areas like RF, baseband and remote connectivity with the aim of building deep technology competency and demonstrate thought leadership through valuable patents, standards contribution. We are a member of TSDSI, an organizational partner of 3gpp that defines 5G specification. We are also a member in leading open source initiatives like ONAP, Akraino, O-RAN, TIP and has also set up a 5G COE with development tool chains. Our 5G lab enables our clients to realize use cases leveraging edge computing, network programmability and dynamic orchestration.
AutoInsights, a connected vehicle and mobility platform, is a strategic investment by Wipro. Today, this platform is used across the globe by various automotive original equipment manufacturers (“OEMs”) and related ecosystem players to help them maximize a vehicle’s lifetime value. Recently, we have also signed a co-innovation agreement with a motorcycle OEM to customize AutoInsights patented solutions - this will build a unique and industry-first dealership digitalization experience using connected motorcycle data and voice enabled smart helmets. We also have a number of patents associated with AutoInsights.
Wipro Ventures, the strategic investment arm of Wipro, invests in early- to mid-stage enterprise software startups. The areas of investment include AI, analytics, business automation, cloud infrastructure, cybersecurity, data management, IoT and testing automation.
As of March 31, 2021, Wipro Ventures manages 16 active investments. In addition to direct equity investments in emerging startups, Wipro Ventures has invested in five enterprise-focused venture funds: B Capital, Boldstart Ventures, Glilot Capital Partners, TLV Partners and Work – Bench.
57
Integrated Annual Report 2020-21
Wipro Limited

We have invested in crowdsourcing through Topcoder, a Wipro Company, the world’s largest technology network and on-demand digital talent platform with more than 1.5 million developers, designers, data scientists, and testers around the globe. Topcoder empowers organizations to leverage the flexibility of its key enterprise offerings around Enterprise Crowdsourcing (Design, QA, Dev, Data Science), TaaS, and Workforce Transformation (Strategic Consulting). Our community and our customers come together on the Topcoder platform to collaborate and build enterprise grade digital assets. Enterprises distribute work through the platform where community members develop innovative solutions, win money, gain experience, and earn recognition. Topcoder became a part of Wipro Limited in November 2016.
We are also investing in TopGear, our social learning and crowdsourcing platform. TopGear is a powerful learning platform, focusing on workforce transformation in Digital and “in-demand” skills. It consists of over 2,000 learning assignments and case studies across 200 skills in addition to live projects. It provides hands-on experience to employees on emerging digital skills that enable them to become customer-deployable on those skills. Employees can self-select projects that interest them and prepare themselves for future projects. TopGear also enables workforce transformation through structured learning paths aligned to business-specific needs.
Innovation CentersOur innovation centers, the Technovation Center at Bengaluru and the Silicon Valley Innovation Center in Mountain View, California are state of the art innovation incubation centers that build technology-led innovations to realize the “art of the possible” in emerging business environments for our enterprises world over.
These centers bring together an innovation ecosystem, a set of best practices, IP and research and development resources to help our clients develop successful initiatives. To overcome the constraint of COVID-19 pandemic we created a digital twins of our innovation centers become truly virtual and hosted around a number of our customers and other visitors over the last year and showcased our best technologies and solutions. Additionally, the
Technovation center has developed human free and autonomous industry solutions concepts at the convergence of information technology, operations technologies, engineering technologies and industrial game technologies. These are rendered into the CAVE and holographic systems – both room scale augmented virtuality environments. Business technology themes like hybrid augmented intelligence, augmented virtuality, intelligent mechatronics and integrated approach to simulation and modelling are driving these research activities.
Patent FilingsOur focus on innovation has contributed, as in past years, to some significant patent applications during the year ended March 31, 2021. We have been continuously investing in building a patent portfolio that protects critical Wipro IP, and during the year ended March 31, 2021, in spite of the unique challenges of the COVID-19 pandemic, our investment has continued apace. As of March 31, 2021, we have 2,085 patents filed in various patent jurisdictions around the world, of which 904 have been granted.
Intellectual Capital
58 Building a Bold Tomorrow

Social & Relationship Capital
GovernanceWe are committed to undertake a stakeholder inclusive governance approach and maintaining strong relationships with our stakeholders through transparent and effective communication. The Board takes overall responsibility for ensuring a stakeholder inclusive governance approach. During the year, we had various engagements with our stakeholder base.
Key material issues Key stakeholders
→ Data Security & IT Privacy
→ Customer Engagement
→ Supplier Envt/Social Assessment
→ Community & Education
→ Customers
→ Communities
→ Shareholders
→ Employees
→ Regulatory bodies
59
Integrated Annual Report 2020-21
Wipro Limited

13k+ new laptopsprocured within few weeks of the lockdown
30k+ Wipro Desktopswere moved from offices to residence of employees
Enablement of VDI/VPN accesson the personal assets of our employees by installing the requisite software on their personal system
15k+ dongles were provided to the employees and 4k USB Wi-Fi adaptors were provided for ensuring Internet connectivity
CustomersWe assist our clients to create new possibilities at the intersection of design, domain, consulting and next-generation technologies. Our new operating model ensures adequate sector and domain-focused go-to-market and execution. It also combines global expertise with local geography-focus in building capabilities, and ensures dedicated sales presence, led by proximity to clients. We are creating value for clients through sector focused business solutions, digital and technology capabilities, cutting edge innovation, leveraging strategic partnerships and talent.
COVID-19 pandemic accelerated disruption in the global economy, healthcare, higher education, services, small businesses, and the enterprise. Seeing the fast spread of COVID-19 and its impact, we activated our business continuity plan. We started
aligning and reshaping our business strategy in order to implement business continuity plans, so as to minimize any possible disruption that might have occurred during the virus outbreak, without compromising the safety and security of our employees, clients and community.
We reaffirmed our passion and commitment towards our client’s success, while ensuring the well-being of all the stakeholders and community. Given the contagious nature of COVID-19, Work from Home (WFH) was enabled from mid of March 2020. The CIO function diligently worked towards ensuring the business continuity in terms of providing the support and services to our customers and employees, and availability of the infrastructure for the business operation without compromising with security posture.
Our standard operation team, helpline facility and support practices are designed to be ready to handle such situations without any redundancy or disruption to support the teams working from different geographical locations and time zones.
Active engagement at multiple levels is critical to meet and understand customer expectations. In the reporting year, we rolled out new reimagined CSAT survey stemmed from the changes in organization priorities, fast moving industry trends and feedback received from customers and leaders. The new survey has elements of both Feedback and Feed-forward, capturing client’s experience as well as their future priorities and expectations. The ‘Experience Index’ is based on four dimensions – satisfaction, loyalty, advocacy and business value.
The key material issues for our customers continue to be Data privacy, IT Security and our approach on sustainability.
IT Security Wipro’s IT infrastructure is certified under the ISO 27001 standard which provides assurance in the areas of information security, physical security and business continuity. We benchmark our processes to meet the EU’s General Data Protection Regulation (GDPR) and SOX IT compliance requirements.
Social & Relationship Capital
60 Building a Bold Tomorrow

Data privacy is an integral part of the Wipro's Code of Business Conduct (COBC), emphasizing the importance of privacy in business transactions. The COBC applies to all employees and members of the Board of Directors of the Company. It also applies to individuals who serve the Company on contract, subcontract, retainer, consultant or any other such basis. In addition to Code of Business Conduct, Wipro has defined ‘Data Protection and Privacy’ policy and procedures that adopt globally accepted data protection principles. The objective of this policy is to define the controls required during the lifecycle of processing of personal data including collecting, using, accessing, sharing, storing, transmitting, transferring, securely disposing and destroying data as per applicable laws and regulations. The privacy policies and procedures are reviewed internally at periodic intervals.
To demonstrate Wipro’s commitment to the authority and independence of its compliance oversight efforts and to facilitate the effectiveness of those efforts, a Global Data Privacy team has been set up and reports into Enterprise Risk Management. In FY20, the team started through work towards assessing 250+ internal Wipro Application to drive GDPR compliance program. The team also inculcated the Privacy By Design in Wipro Data Privacy culture and conducted multiple workshops to imbibe the culture of Privacy By Design to take Wipro DP Compliance program to next stage.
Wipro has 'Security Incident Management' Policy (covering Data Privacy) which describe various channels available to the users for reporting security incidents; identify, contain, and manage security incidents which may have potential impact, and define a process for managing security incidents as part of Customer engagements.
Data PrivacyWipro 'Privacy Statement' articulates the privacy and data protection principles followed by Wipro Limited and its entities around the world with regards to the personal information of its customers (including products, outsourcing and other services clients), partners, employees (current or former employees, trainees), applicants, contractors, prospects and vendors and current or former members of the Board of Directors, whose personal information are processed by Wipro. Wipro does not share personal information about customers with affiliates, partners, service providers, group entities and non-affiliated companies except: (a) to provide products or services you’ve requested; (b) when we have your permission or (c) under circumstances such as – being compliant with legal requirements. Refer to Privacy Statement for more details https://www.wipro.com/privacy-statement/
In addition, Wipro has 'Data Collection and Usage' Policy to govern collection, usage and disclosure of Wipro employees’ and clients’ Personal Data or Confidential Data as required to perform the processing of such data in line with the intended purpose, contractual requirements, and as mandated by applicable laws and regulations.
Wipro has a dedicated privacy incident management team to manage any potential or actual incident or data breach related to customer privacy or personal data of customers through our internal Security Incident Reporting (SIR). A Privacy Incident Management procedure has been established to identify and document roles and responsibilities of stakeholders. There were no substantiated incidents concerning breaches of customer privacy and / or loss of customer data during FY 2020-21.
61
Integrated Annual Report 2020-21
Wipro Limited
Sustainability Related AspectsThe undeniable impacts of climate change, along with stakeholders’ increasing attention to corporate sustainability, compel all responsible companies to develop a sustainability strategy. Concurrently, the world has never had a stronger focus on labor and human rights. Companies that adjust their business model with sustainability at its core can help address these issues while positioning themselves to succeed as the world encounters new challenges. At Wipro, we bring our global expertise and capabilities to address the immediate needs of achieving sustainability for our clients. Our sustainability solution domain includes
Assessment and Sustainability Reporting
Circularity and Transition to a Sustainability Future
Operational Risk Management
Decarbonization
Energy Management
Environmental Data Management
For more information, refer to https://www.wipro.com/sustainability/
We have 100+ of our customers who are part of independent raters like CDP Supply Chain, Ecovadis and industry led consortiums (JAC, Quest) that assess company’s performance on sustainability related aspects like human rights, environment, supply chain, labour practices, etc.
SuppliersWipro’s supply chain ecosystem continues to create all-round socio-economic developmental opportunities in the communities it operates in. It emphasizes role of a mutually progressive partnership with suppliers in meeting its corporate objectives.
Our procurement requirements caters to the entire gamut of the Information Technology related products and services, along with indirect spends that cater to our internal consumption to run the organization. As we take pride in calling our suppliers as Partners, a predominant part of our requirement is met through partners supplying extended workforce, which supplements core delivery of IT Services and Solutions by Wipro. This is also referred to as the Human Capital section. The other substantial group of partners supply material, equipment, finished goods, business support services and facility management services for our operations.
Summary of supplier sustainability engagement
Ethical and accountable partnershipsIn line with the core values of Wipro, the Code of Business Conduct (COBC) and the Spirit of Wipro values provide the ethical guidelines for conducting business with our partners. In addition to the COBC, the Supplier Code of Conduct (SCOC) further underlines our environmental and social expectations with the partners.
Wipro is an Equal Opportunity employer and it strongly advocates the same in its supply chain practice by encouraging supplier diversity. Our inclusive diversity programs promote the participation of small and medium enterprises, local or indigenous suppliers, businesses owned by women, LGBTQ, people with disabilities, minorities, etc. In Wipro, we believe that a diverse supplier base encourages innovation, supports local entrepreneurship, creates an inclusive business environment and contributes to the overall well-being of the society. During the times of the unprecedented pandemic, Wipro has strengthened its payment processes to ensure timely payments to the partners, to avoid any delay affecting sustainability of their businesses.
Social & Relationship Capital
62 Building a Bold Tomorrow

InvestorsWipro’s endeavor is to, not merely, report true and fair financial results in a timely manner but also communicate the business outlook, risks and opportunities transparently to the investor community. Increasingly, discerning investors are interested in the longer term strategy of the organization and issues which are material to the industry. We deploy multiple channels of communications to keep investors informed about various development and events. In FY21, we conducted 5 road shows, held 404 investors meetings and 4 earning conference calls. We also hosted our first ever Virtual Analyst Day in November 2020 through which we communicated our new strategy and ambition. We also attended 14 investor conferences.
In addition, we participate in leading investor led disclosures like Dow Jones Sustainability Index, Vigeo, FTSE Russell ESG, MSCI ESG, Sustainalytics and Carbon Disclosure Project. Wipro was selected as a member of the global DJSI 2020 for the eleventh year in succession and included in both the DJSI World and Emerging Markets Indices. The Euronext Vigeo Emerging Market Sustainability Index also includes Wipro among the 70 most advanced companies in the Emerging Market Region. We are part of FTSE4Good and are a Global Sector leader.
Communities and Civil SocietiesAt Wipro, we think it is critical for business to engage with the social and ecological challenges that face humanity in a deep and meaningful manner with long-term commitment; for that is the only way by which real change can happen on the ground. We engage with communities on issues that matter to them most. Wipro’s social initiatives center on the three dimensions Education, Community Care and Ecology. Our programs on Ecology are covered in Natural Capital Section.
Summary of initiatives in IT products and services
In 2019, we purchased more than +108,400 EPEAT Gold and over 590 EPEAT Silver and Bronze category products across desktops, laptops, displays, imaging equipment and mobiles. This led to GHG reduction of 15,566 metric ton ofCo2 equivalent, energy savings of 25,967 MWh and water savings of 4.9 million liters
Till date we have migrated 20000 users from traditional physical desktop to Virtual Desktop Infrastructure (VDI) across 5 locations. This has led to reduction in energy consumption, easier operations and cost saving
Through proactive maintenance and upgrades, we have been able to reutilize 18% of the assets – desktops, laptops and thin clients post their scheduled end of life
Where possible our partners adapted to the COVID-19 situation through:
(a) mohalla classes with the help of community volunteers and the partner organizations
(b) worksheets and books distributed through schools when parents came to collect mid-day-meal supplies
(c) Facilitate WhatsApp groups, community radio/, online classes
63
Integrated Annual Report 2020-21
Wipro Limited
Governance & Strategy for CSRThe Board Governance, Nomination and Compensation Committee is the apex body that oversees our CSR policy and programs. The committee comprises of all independent directors. The goals and objectives along with the annual budgets for CSR are discussed and signed off at the beginning of every year with the board CSR committee and the Board of Directors. This happens as part of the annual strategic and operating plan processes of the organization.
Our Key programs in EducationOur work in education covers a range of initiatives in school and higher education in India and overseas. The common vision that ties this together is our belief that good education is the primary enabler of change towards a better society.
Systemic reforms in School EducationOur School Education program, started in 2001, continues to be the cornerstone of our CSR initiatives. In 2015, we initiated the Wipro Education Fellowship program under the School Education programs. Our partners work on close to 10 thematic areas and the impact has been in the areas of curriculum, textbooks, teacher capacity, and school leadership among other aspects.
Education for underprivileged childrenThe program addresses a gamut of critical issues faced by disadvantaged communities when it comes to school education – starting from enrollment in schools to nutrition for children, counseling services for parents, remedial education, among others. These children are from some of the most vulnerable groups in our society – urban slums, HIV-affected families, migrant labor families, street children.
Education for Children with DisabilityThe program supports the educational and rehabilitative needs of children with disabilities from underprivileged backgrounds. We integrate enabling factors like availability of nutrition, community support, specially trained teachers, assistive technology, access to healthcare etc.
Highlights of the programs
Over 50,000 children through online and direct engagements were supported through our 97 Fellowship and Grant partners across 23 States and UTs
19th Partners' Forum was organized online on ‘adaptations in the time of COVID-19’. The 2-day event saw 200+ participants from 100+ organizations
Our community programs helped around8,800 underprivileged children through 22 education projects in 9 states
Supported the educational and rehabilitative needs of 2200+ underprivileged children with disabilities, through 14 projects in 5 states
Supported 9 new organization based in 7 states and UTs in FY21 under education fellowship program
The implementation of the CSR programs happens through multiple channels – Wipro Foundation, a separate trust set up in April 2017, Wipro Cares, a trust for employee contributions that are matched by Wipro and in some cases, directly through functions and groups within Wipro Ltd. Wipro Corporate Social Responsibility policy is available at https://www.wipro.com/investors/corporate-governance/
Social & Relationship Capital
64 Building a Bold Tomorrow

Wipro Science Education Fellowship Program in USAStarted in 2012, the Wipro Science Education Fellowship (SEF) is a two-year program designed to improve individual teacher practice, foster teacher leadership opportunities and create a district corps of teacher leaders supporting sustainable positive changes in science education.
Wipro Science Education Fellowship Program in UKStarted in 2019, we work with Kings College London (KCL) to offer UK’s first Master’s program in STEM education. We work with Sheffield Hallam (SHU) University to provide rigorous continuous professional development to STEM teachers through Wipro Teacher Fellowship and Wipro Teacher Mentor programs.
Sustainability EducationThe flagship Wipro earthian brings together two of our key concerns, Education and Sustainability, into a nation-wide initiative for schools and colleges. Wipro earthian runs in two phases – the Wipro earthian outreach program and the Continuous Engagement Program (CEP).
Highlights of the programs
Wipro Teacher Fellowship and Wipro Teacher Mentor programs running in partnership with Sheffield Hallam University (SHU UK) to provide continuous professional development to STEM teachers, supported 50+ Fellows in two cohorts till date
Wipro Science Education Fellowship Program USA is running in partnership with 7 universities and is working with 600 teachers across 35 school districts in 7 states
Highlights of the programs
Wipro sustainability internships completed by 15 students from 6 colleges
Wipro earthian Sustainability quiz conducted on a virtual quizzing platform with 4,800 college students registered for the 2020 quiz
Adapting to the crisis
With the onset of COVID-19 crisis, about 50 of our education partners, were deeply involved in providing humanitarian relief – reaching out to over 1.1 Lakh beneficiaries in 14 states. Adhering to the safety and government norms, where possible, mohalla classes were started with the help of community volunteers and the partner organizations; worksheets and books were distributed through schools when parents came to collect mid-day-meal supplies; WhatsApp groups/ community radio/ online classes etc. were explored.
In another program - Sustainability Education, we introduced a new section to encourage students to take this opportunity to investigate the kind of stresses that are present in their respective village/town/city and understand how or what role the individuals and communities play in building a more resilient society. They were also encouraged to reflect on how this pandemic has changed for the better or for worse, the lives of people around them. Similarly, college students had to explore the three areas of Water, Waste, and Food through the lens of the pandemic and analyze the stresses created by it.
65
Integrated Annual Report 2020-21
Wipro Limited

TalentNextThe program offers Digital Technology courses to the faculty members of Engineering Colleges for 2 weeks on Industry relevant skills and certify them. They in turn leverage our course contents, platform, assignments, case studies and assessments to train their 6th semester students as part of the curriculum. The students trained by these faculty have to go through a 250-hour self-directed learning and must qualify coding challenge to participate in Wipro’s campus selection process. The program also offers Digital leadership training program to academic leaders. We offered NASSCOM’s FutureSkills for 10,000 students in 20 Engineering colleges in India. We also launched the second phase of FutureSkills program for 20,000 students from 50 colleges. The students would receive a joint certificate from Wipro and NASSCOM on successful completion.
Highlights of the programs
26,100+ students successfully completed M.Tech degrees over last two decades
In FY21, the total number of new entrants into the work integrated learning program was 2,682 while the aggregate strength across 4 years was about 8,040
Trained 60,000+ students and 100 faculty in digital technologies through our program TalentNext cumulatively
Used project-based learning approach to train 400 professors from 169 engineering colleges in India
In FY21, 18,000+ students trained through this approach and 1,100+ received Wipro’s campus offer
200+ professors from 81 colleges trained on advances technologies such as AI, machine learning, big data analytics
Supported 37,000 students to pursue higher education in engineering through WASE, WiSTA and WIMS programs cumulatively
Community CareOur community care interventions are channelled through Wipro Cares, a unique platform that is based on the operating model of employee contributions which are matched by Wipro Limited 1:1. During the reporting year, we significantly focused on addressing healthcare and humanitarian need arising due to the crisis. Below is our comprehensive response to the pandemic.
Social & Relationship Capital
66 Building a Bold Tomorrow

Key Highlights of Integrated Response along with Azim Premji Foundation
Over the past 12 months, we have supported more than 1,561 projects covering humanitarian aid, integrated healthcare support, and livelihoods regeneration, cumulatively reaching over 10 million people through our coordinated and comprehensive COVID-19 response. Some of the key highlights of our integrated response are
10.2 million peoplereceived food, dry rations, and personal hygiene kits across 26 states and 3 union territories
330 million mealsdistributed
396,000 PPE kits and N95 masksdistributed across 8 states
8.2 million peoplebeing helped for livelihood regeneration in 12 states
500+ non-profit partnersinvolved in delivering humanitarian and healthcare aid
Our humanitarian and health care efforts have reached 505 Districts across 29 States and 1 Union Territory.
GCMC - curated a digital platform for doctors and healthcare experts to exchange emerging good practices in COVID-19 care.
Converted our Pune IT facility to a fully equipped and staffed 450 bed COVID-19 hospital.
Vaccination drive in Wipro Campus
Wipro Canteen
67
Integrated Annual Report 2020-21
Wipro Limited

Primary Health CareWe work with partners who provide quality primary health care services to extremely disadvantaged communities in Nagaland, West Bengal, Karnataka, Delhi and Maharashtra. Through our projects we address the issues related to maternal and child health, adolescent health, nutrition, community hygiene and sanitation, preventive and curative care, health education & counselling. With the onslaught of COVID-19 pandemic, we recalibrated the work of our existing healthcare projects by integrating COVID-19 care along with the key primary healthcare interventions.
Disaster RehabilitationStarting with the Gujarat earthquake in 2001, we have responded to several natural calamities wherein Wipro’s employees have also risen to the occasion and played a sterling role. In past two years, we initiated disaster response projects for Cyclonic Storm Fani in 2019 and Amphan cyclone in 2020. Our program well adapted to the challenges exasperated while providing utilities and shelter needs to affected communities from natural disasters due to the COVID-19 pandemic.
We also provide a brief on our existing programs - primary healthcare, disaster rehabilitation and community ecology below
4,500+Affected families in Kolkata by Amphan were provided shelter and utilities
Highlights of the programs
In response to cyclone Fani, provided fishing equipment and gear to 155 affected fishermen and livelihood training to 10 women Self Help Groups (SHGs) to Bhoi community of Puri, Odisha
Urban SWM project provides social, nutritional and health security to more than 13,000 workers in the informal sector
Helped 400 farmers in implementing integrated farming by planting 40,000 trees in Tamil Nadu
Over 1,30,000 people from disadvantaged communities have access to primary healthcare through 10 healthcare projects across 5 states in FY21
Community EcologyOur project in agro-forestry in rural Tamil Nadu help farmers in effectively implementing integrated farming practices. Urban solid waste management (SWM) projects at Bengaluru and Mysore provides comprehensive skills upgradation and social, nutritional and health security to workers in the informal sector of waste. Both the programs faced operational challenges due to ongoing pandemic. A number of adaptive measures were undertaken such as use of digital platforms for information sharing, trainings of staff and waste pickers, switch to online submission of application for social security.
Social & Relationship Capital
68 Building a Bold Tomorrow

Employees are integral to many of our social programs in many ways. Providing them a platform to engage develops a sense of citizenship and larger responsibility towards society. Wipro employees are currently engaged with Wipro Cares either through volunteering or by way of monetary contributions or both. In FY 2021, 25,000 Wipro employees contributed monetarily.
The power of engaged employees
Our employees across the world participate in local community initiatives. Thousands of employees across six continents and 36 countries came together virtually to participate in the Spirit of Wipro (SoW) Run and contributed towards their local charities in FY21. In the US and Canada, through our various initiatives with First Book, over 60,000 books were donated, impacting more than 28,000 children from underserved communities. Other initiatives included tree plantation drive in UKI and Romania, coastal clean-up drive in Philippines, education for disadvantaged particularly children with disabilities
International Chaptersin Singapore, South Africa and UKI and humanitarian and healthcare support against COVID-19 to the disadvantaged communities across the globe.
In addition, a global donation program was conducted for Wipro employees to support communities that are disproportionately impacted by the pandemic. For each donation made by the employee, Wipro matched the contribution with 2:1. The program supported six organizations - First Book, Project HOPE, Save The Children, Food Banks Canada, Oxfam, Hunger Free America, across the globe.
Stories from our Employees
“It’s been two months since I joined the ProjectOne initiative. I have had to speak to all sorts of people including family members of those who succumbed to the virus. It has been emotionally challenging for us as volunteers and those on the other side of the phone. Yet, personally I felt good to provide that moral support to patients and their family members. In my earlier organization too, I used to donate, be it money or clothes. But actually working “on the field”, even if remotely now, gives me another level of satisfaction. Going forward, I would like to do more. After being in IT for 15 years, I want to do something different and give back to society.”
Prasad Tanksali
"I started volunteering when we were at the peak of the second wave. My most touching experience was with a senior citizen in Delhi, isolating in a room and we ended up chatting for almost half an hour. He was happy to have finally spoken to someone after days of being in quarantine. I have volunteered during the last lockdown to distribute food, but e-volunteering is new to me. Two takeaways from this experience are: 1) It might be just a phone call, but it makes a difference to people’s lives. 2) There might not have been a face to the names, but nevertheless, there was a personal connect for those few minutes."
Sony Shetty
Around 500 employees contributed about 1,500 hours in helping Wipro Cares partners, distributing dry ration and hygiene kits, and organizing awareness and health camps. With introducing the concept of e-volunteering and other virtual volunteering initiatives, around 700 employees spent about 2,000 hours in helping Wipro. In the Wipro Cares-Project StepOne, Wiproites have been volunteering to support the Indian government’s efforts in tele-screening COVID-19 patients using Interactive Voice Response System (IVRS).
69
Integrated Annual Report 2020-21
Wipro Limited

Capital-wise performance
While the pandemic is putting to test human systems and resilience, we all have to put together intent and action on another epochal crisis staring at us - Climate Change. The scientific consensus is now very clear that the global temperature rise has to be kept below 1.5 degree Celsius from pre-industrial levels to avoid disastrous impacts of climate change driven events. Action on climate cannot be seen in isolation, but are closely intertwined with water scarcity, biodiversity loss and land use change, chemical and industrial pollution – and its impacts on humanity, especially the most vulnerable among us. Natural capital is a framework that attempts to take into account on how human activities impact the planet's ecosystem.
Wipro’s approach to Natural Capital embraces the continuum of Governance
Our sustainability governance is informed by our strategic choice to work across both dimensions – business operations and with the larger community. The former is about ensuring that the ecological footprint of our operations is minimized, the organization is compliant with all regulations, and runs its business with integrity. The latter dimension goes beyond the boundaries of the organization and contributes towards development of the larger community.
Initiatives ‘within the organization’ that focus on reducing the energy, water, waste and biodiversity footprint of our business operations; and
Engaging on key external programs through a diverse set of partners on the issue of ecology
Natural Capital
70 Building a Bold Tomorrow

All key organizational stakeholders, right from the board of directors, executive leadership and different functions have defined responsibilities related to planning, execution, review, evangelization and advocacy of the sustainability charter. Strategic oversight of sustainability programs rest at the corporate level with our Chairman, Board of Directors and Group Executive Council. The goals and objectives
are jointly set with inputs from across functions. The quarterly reviews are attended by the Chairman, CEO and Chief HR Officer apart from the Chief Sustainability Officer and Global Head of Operations. We benchmark our performance with our global peers through extensive disclosures as well as a system of rigorous internal and external audits.
Management ApproachAt Wipro, we have identified Energy efficiency and Green House Gases (GHG) mitigation, Water efficiency and Responsible Water management, Pollution and Waste management, and Campus Biodiversity as our most material issues and have developed programs around them.
Our Ecological Sustainability Policy, available at https://www.wipro.com/investors/corporate-governance/ forms the structural framework for our environmental programs and management systems. We have been following the guidelines of the ISO 14001 framework for nearly two decades now as one of the cornerstones of our Environmental Management System (EMS). 20 of our campus sites in India and 8 in Australia are certified to ISO 14001 and ISO 45001 (Occupational Health and Safety) standard. Other campuses are benchmarked against the same standard as a part of our internal review/audit process. We were one of the early adopters of Green Building Design with 22 of our current buildings across campuses certified to the international LEED standard
(Silver, Gold, and Platinum) during commissioning. We strive to maintain the same standards in the maintenance of our facilities.
We have been responding to Carbon Disclosure Project (CDP) Climate Change Investor and Supply Chain for over 10 years. In addition we apply the Natural Capital Protocol guidelines arrive at the valuation of our natural capital (NCV) which we publish in our annual Environmental Profit and Loss account. In 2020, we also signed up as one of the 9 founding members of the ‘Transform to Net Zero’ coalition. We are part of the advisory group of CII’s Climate Change Council and the India Climate Collaborative. We also chair the Bengaluru chapter of the CII-GBC Greenco chapter.
Strategic Partnerships are key to achieving our goals across the value chain. We work with renewable energy suppliers, energy efficient hardware manufacturers and service providers and other partners who help to reduce our overall GHG footprint including employee commute and business travel footprint.
Environmental RisksThe Enterprise Risk Management and Sustainability functions at Wipro jointly oversee environmental and climate change related risk identification and mitigation. Impacts of extreme weather events, urban water stress, air pollution, waste management and their impacts on employee health and wellbeing are the most material issues we engaged with.
In 2020, we completed a comprehensive climate change risk assessment program, encompassing both physical and transitional risks, for our major operational locations across the globe, covering India (12 cities), China, Philippines, Germany, Romania, the UK and the US. This has been carried out for two scenarios (based on the IPCC defined RCP 4.5 and RCP 8.5) covering medium to long term (2030-2050) time frames. In both scenarios, we see increased probability of higher incidence of water stress, and heat waves across cities. Below are the list of cities and regions where we see an increase in frequency of climate change risks under RCP 4.5 scenario (increase of global temperatures between 1.1 to 2.6 degree Celsius relative to 1986-2005).
71
Integrated Annual Report 2020-21
Wipro Limited

Energy efficiency & GHG mitigationTargets We have SBTI (Science Based Targets Initiative) approved targets for Scope 1, Scope 2 and Scope 3 till 2030 that are based on well below 2 degree temperature goal. We have committed to Net Zero goals by 2040, with absolute emissions reduction of 55% by 2030 with respect to the 2017 base year. These are aligned with the objectives of the Paris agreement to limit temperature rise to 1.5 degree Celsius.
Climate change related impacts Our risk assessment exercise is undertaken at both the company level and at the asset level. A well-defined Business Continuity Policy prescribes principles to plan for climatic disruptions which could disrupt business objectives. The Corporate Business Continuity Team (CBCMT) governs and guides the standard risk assessment methodology at every location to identify risks which could potentially impact continuity of business and associated financial parameters like revenues and profitability as well as reputational and legal parameters. This group collaborates with various support groups in the organization to assess risks for human resources, facilities and IT infrastructure with identified impacts and their probability/likelihood as well as the corresponding controls in place. A severity matrix of Low, Medium and High impacts is defined and an identified crisis management group is vested with the responsibility to respond, recover, resume, return and restore from these situations. The detailed climate modelling and impact assessment exercise will help in further calibrating our risk management program.
Water StressDelhi
Noida
Bengaluru
Chennai
Kochi
Mysuru
Vishakhapatnam
Mumbai
Pune
Kolkata
Heat WavesDelhi
Noida
Bengaluru
Kochi
Mysuru
Vishakhapatnam
Mumbai
Other than India, impact to Wipro from physical climate risks is more prominent in: Philippines - cyclones, floods, fluctuating rainfall & humidity China - coastal flooding Romania - floods, droughts US - tropical storms and tornadoes German, US, UK, China and Romania - transitional risk
We are in the process of incorporating the findings of the study into our BCP and Enterprise Risk Management (ERM) framework.
Energy Intensity in terms of EPI (Energy Performance Index)Achieve EPI of 125 KwH per sq. mt by 2025 from baseline of 181 in 2017 and maintain EPI thereafter
GHG Emission Intensity (Scope 1 and Scope 2) on Floor Area (FAR) basisAnnual reduction of 5 % in GHG intensity from 117 KgCo2 eq./ Sq. Mt. (kgpsm) to 60 kgpsm ofCo2 – eq by 2030
Achieve Scope 1 and 2 absolute emissions level of 80,000 tons by 2030 from 2017 baseline
The following are our interim subsidiary goals till 2030
Natural Capital
72 Building a Bold Tomorrow

Renewable Energy (RE)renewable energy procurement to 110 million units by 2030 from the present average procurement of 75 million units
Absolute reduction of 55% in Scope 3 emissions for Business Travel, Employee commute and Upstream fuel and energy related emissions by 2030
Our plan to meet the above goals is through a mitigation hierarchy that is primarily focused on emissions reduction activities in the value chain. As a first principle, we will defer carbon removal projects (offsets) to the net zero target year (2040). This is in line with the science based targets approach of not using offsets for value chain emissions. Over the next few months, we will evolve a detailed plan for the same.
Energy ConsumptionThe overall energy consumption from Scope 1 and 2 boundaries (operational and financial control) is 661.5 million Mjoules, compared to 915.3 million Mjoules in the previous year, a decrease of 27.7%. The total energy consumption - electricity and diesel based backup power - for office spaces in India is 151.3 million units; after including the electricity consumption for leased spaces, our global electricity consumption is 174 million units. Data centers in India contribute another 22.9 million units.
For India operations, about 64.85 million units constitute renewable energy procured through independent PPAs (Power Purchase agreements) with private producers. Of this 60.7 million units is with green attributes (zero emissions). Another 13 million units is attributable to renewable resources for our downstream leased spaces. In total, the renewable energy footprint in our portfolio is 73.7 million units.
Performance Against Goals
Absolute EmissionsThe absolute Scope 1 and 2 emissions (India) for FY 2021 has decreased by 29% from 137,930 tons to 97,348 tons. This is due to low occupancy and resultant lesser conditioned area (50% reduction) at our offices. The dashboard below provides a summary of our Global and India GHG emissions, including data centers. The figures are net emissions for all years, after considering zero emissions for renewable energy procured.
Office emissionsThough the occupancy is low (average of 5%), the building air conditioning, lighting and allied electrical systems load use would not be proportional. From an assessment of three large campuses representing 35% of total campus area, we see that the conditioned area average was around 50%. Around 70% of the energy consumption for offices is from air conditioning system. Hence, the absolute energy consumption and emissions for buildings is not commensurate with low occupancy. We have also considered 50% of building area for calculating the area intensities.
Emissions IntensityOur India office space emissions intensity (Scope 1 and Scope 2) is at 108 KgCo2 eq. per Sq. Mt. per annum, up by 24% from FY 2020 – for reasons mentioned in under 'Notes on FY21 emissions'. We are not publishing people based emissions intensity for this year due to the low occupancy of office space.
FY2018-19 FY2019-20 FY2020-21
Offices 113,082 135,537 84,140
Data centers 4,208 2,458 13,207
73
Integrated Annual Report 2020-21
Wipro Limited

Energy IntensityEPI for company-owned office spaces, measured in terms of energy per unit area has been increased to 194.7 KwH units per sq. meter per annum (from previous years 144 KwH). This is because while the conditioned area has reduced by half on an average, the energy consumption has reduced by 32% compared to the previous year for reasons mentioned earlier.
Scope 3 EmissionsOur total scope 3 emissions for FY 2020-21 is 350,336 tons of Co2 eq, which accounts for 78% of our total footprint. Out of the 15 categories of scope 3 reporting as per the new GHG corporate value chain standard, we are currently reporting on all of the 8 categories applicable to us.
18,055Employee Commute
Tons (CO2 eq.)
13,538Business Travel
140Waste
53,937Upstream Fuel+Energy emissions
215,830Purchased goods / services (including capital goods)
12,606Upstream and Downstream Leased Assets
36,230Work From Home emissions
350,336Total
*Purchased goods and services are based on material group and category spend for Tier 1 suppliers. If we include all tiers, the emissions are estimated to be around 500,000 tons. We aim to engage with top suppliers (contributing to 80% of impact) to arrive at the next level of detail in understanding emissions breakdown and planning mitigating actions.
Work From Home Emissions - Calculation MethodologyDuring the reporting year, most of the employees in India and overseas worked from their places of residence. We have estimated the emissions due to WFH scenario for FY21, and have included in our Scope 3 emissions portfolio.
The methodology* is based on incremental energy consumption (electricity and natural gas) in a household in which members have transitioned to working from home, causing an increase in residential energy use. These are averages of select countries covered by various studies on remote work. The baseline energy consumption per household was derived based on IEA data of residential energy consumption by population of the country. We have considered the number of employees working from home across the following geographies – ANZ and APAC, EMEA; and LATAM & North America to calculate WFH emissions.
The total emissions due to WFH globally is estimated at 36,230 tons of Co2 eq, with the US contributing to 36% and India contributing to 23%. Though 80% of the employees are based in India, its contribution to emissions is less due to significant lower energy intensity per capita compared to other countries.
* Anthesis paper on Estimating Energy Consumption & GHG Emissions for Remote Workers
Natural Capital
74 Building a Bold Tomorrow

Total EmissionsThe overall GHG emissions across all scopes is 447,683 tonnes, the main contributors to which are: Purchased Goods and Services (48.7%), Electricity – Purchased and Generated (19.1%), Upstream Fuel and Energy emissions (12%) and Work From Home emissions (8%).
GHG Mitigation MeasuresOur five year GHG mitigation plan consists of three key elements – Energy Efficiency (Reduce), Renewable Energy (RE) Purchase (Replace) and Business Travel Substitution (Reduce and Replace); of this, RE procurement will contribute the maximum, 80% share to GHG emission mitigation strategy for Scope 1 and 2.
Energy EfficiencyThese measures include new retrofit technologies to improve Chiller and Air Handling Units (AHUs), integrated design and monitoring platforms. The Global Energy command center aggregates Building Management System inputs on a common platform to optimize operational control and improve energy efficiency.
Since 2007, we have been working on a server rationalization and virtualization program, through which we have decommissioned old physical servers and replaced the processing capacity with virtualization technology on fewer numbers of servers. As of March 2021, we have 13,133 virtual servers (10,155 in March 2020) running on 758 physical servers which contributes to an energy savings of approximately 57.9 million units in the reporting year. The savings showed an increase of 21% over the previous year.
Virtual Desktop Infrastructure (VDI) provide high-capacity scalable infrastructure with On Demand
provisioning, High Availability and High Performance Computing environment. We have enabled 9,333 VDI’s to end users across locations. Thin clients being used in one of our location, which consumes less energy (80% less) compared to Desktop, resulting in savings of 1.2 million units.
ProcurementFor the reporting period of FY 2021, RE purchase contributed to approximately 73.7 million units or 42.6% of our total India energy consumption of which 12.9 million units are for downstream leased spaces. For details on green procurement in IT hardware and other categories, please see 'supplier section'.
Business Travel and Employee CommuteDue to the pandemic, the business travel footprint was 11% and employee commute was 21% of the previous years footprint. This includes (i) travel by air, bus, train, local conveyance and hotel stays for the category of business travel and (ii) personal cars two wheelers, public transport and Wipro arranged transport for employee commute. As things return back to normalcy, we are looking to transition to low emission travel choices and policies.
Over the past few years, we have taken steps to facilitate a shift towards improved access to public transport for employees (buses, commuter trains) and carpooling. Our carpooling initiative till the previous year had over 1 Lakh registered users across locations. In the reporting year, we had negligible car pooling trips due to majority of employees working from home as well as the requirements of COVID-19 appropriate behavior.
We are the first major Indian business to join EV100, a global initiative by The Climate Group , in our commitment to transition our global fleet to electric vehicles (EVs) by 2030.
75
Integrated Annual Report 2020-21
Wipro Limited

Water ResponsibilityTo ensure responsible water management in proximate communities, especially in locations that are prone to water scarcity. We are also collaborating on building capacity and advocacy platforms at the city level for integrated urban water management.
Freshwater recycling and efficiencyFreshwater consumption has seen a drop of 47.5% from last year to 850 million litres. The recycled water generation was 407.5 million liters, with a recycling ratio of 32%. Due to the low average occupancy (6.5%) of our offices due to the pandemic, the per capita consumption of water is not comparable. The fresh water consumption has not seen a commensurate reduction for the same reasons as mentioned in energy consumption – use of higher amount of fresh water for HVAC systems of the conditioned spaces as well as lower efficiency and loading of recycling plants. Consequently, the freshwater area intensity at 1.094 KL per square meter has shown a marginal increase of 4.8% compared to the earlier year. We have achieved 12.5% reduction in absolute freshwater consumption from FY16 till the previous year FY20.
Water efficiency and responsible use At Wipro, we view water through inter-related lens of efficiency of use and conservation coupled with our approach of engaging with urban water as a boundaryless issue. Our articulated goals are therefore derived from this approach.
Water Efficiency
Reduce both absolute and area based intensity consumption of externally procured freshwaterfor our operations by 50% by the year 2030 with respect to baseline consumption of FY17
Contribute to deeper understanding of systemic challenges of urban water in the major cities in India we operate from
Natural Capital
Freshwater use-India Offices
Freshwater (KL)
FY2020-21
FY2019-20
FY 2018-19
850,151
1,621,501
1,518,934
Area IntensityFY2020-21
FY2019-20
FY 2018-19
1.094
1.044
0.957
People IntensityFY2020-21
FY2019-20
FY 2018-19
6.854
0.930
0.951
76 Building a Bold Tomorrow

Sourcing of WaterOur water is from four sources – private water (mainly ground water delivered by tanker water suppliers), municipal water, water supplied by industry associations, in-situ ground water and harvested rain water – with the first two sources accounting for nearly 94% of the sourced water. Water purchased from private sources is primarily extracted from ground water. Ground water contributes to nearly 46% of our total freshwater consumption across cities in India. Our urban/ peri-urban facilities located in three states – Karnataka, Tamil Nadu and Telangana, are located in water stressed basins. The water supplied by the municipal bodies is sourced primarily from river or lake systems. The table below provides parentage of water sourced from different freshwater sources during the reporting year.
Collaborative advocacy on waterOur long term projects on Urban Water in cities are providing key policy insights and levers for citizen engagement and advocacy on ground water management and its relationships to surface water flows and water bodies like lakes/tanks and wetlands. We bring together hydrogeologists, academia, government, citizen groups for a nuanced understanding of issues Catalyzing citizen action on the ground.
We are continuing our work in Bengaluru by catalyzing more on-the-ground engagements across city on rain-water harvesting. This is backed up by targeted advocacy work through case studies, engagement with the city utility administrators and development of national guidelines. The program will also monitor and estimate the groundwater (shallow aquifer) potential for city, and recommend suggested practices for better management and integration with utility supply. In Pune, we are building a first of its kind city level data, interpretation and decision support platform for ground water management. This will closely work with citizen groups as well as the municipal authority to build appropriate capacities and catalyze on-ground interventions. In Chennai, through the small grants program we are supporting three community based interventions on water. In Hyderabad, we are putting together a knowledge repository of water in the city – consumption, sources, water bodies, built infrastructure and impacts on water flows. It will also aim to create a network of communities, water practitioners , curate workshops/exhibits and support on ground interventions.
41.7%A. Private water (mainly Ground water)
54% B. Municipal and industry bodies
4.3%C. Ground water
1%D. Rainwater
Collaborative advocacy on sustainabilityWe are actively engaged in several forums that advance advocacy on climate change and other related environmental impacts. Examples include the 'Transform to Net Zero Coalition', the World Economic Forum's Climate Change working group, 'Business for Nature' coalition, 'CII Greenco' and 'India Climate Collaborative'.
A specific city-level initiative we convened is the ‘Bengaluru Sustainability Forum’.
77
Integrated Annual Report 2020-21
Wipro Limited

Regular monitoring of air, water and noise pollution to ensure they are well within regulatory and industry norms
Reducing materials impact on the environment through recycling and reuse
Arranging for safe disposal of waste that goes outside our organizational boundaries. To operationalize our strategy, we segregate and monitor waste processing across 13 broad categories and nearly 40 sub categories
Pollution and waste managementPollution of air and water poses one of the most serious threats to community health and societal welfare. Managing these ‘commons’ in an urban context requires business organizations to look beyond its own boundaries and adopt an integrated approach.
Our waste management goals are: 1: 100% of organic waste generated from business operations is recycled for effective reuse. 2: To ensure by 2025 more than 98% of other categories of waste is recycled as per appropriate national standards with less than 2% reaching landfill (excluding construction and demolition waste).
Our waste management strategy includes:Total waste disposed during FY 2021 was 2,087 tons – a reduction of 58% compared to the previous year. This is primarily due to lower occupancy in our campuses due to the pandemic. For the reporting year our effective safe disposal percentage was 96%.
The summary of our performance on solid waste management (SWM) is as follows:
→ 90% of organic waste is recycled in house and the balance sent as animal feed outside the campus.
→ Close to 100% of the inorganic waste is recycled through approved partners.
→ 52% of the total mixed solid waste and scrap is currently recycled and the rest sent to landfills. Our target is to improve this to 80% by 2023.
→ Biomedical and hazardous waste is incinerated as per approved methods.
→ All our E-waste is currently recycled by approved vendors.
Other elements: We monitor diesel generator stack emissions (NOX, SOX and SPM), indoor air quality (CO,Co2, VOC’s, RSPM), treated water quality and ambient noise levels across 25 key locations every month. All of these meet the specified regulatory norms.
Urban BiodiversityThe twin primary aims of our campus urban biodiversity program have been to convert our existing campuses to biodiversity zones and to develop them as platforms for wider education and advocacy, both within our organization and outside.
Our biodiversity projects integrate multiple benefits of water conservation, ambient temperature reduction, air pollution mitigation and employee engagement. In this regard, we have drafted a set of biodiversity management guidelines for adoption across our campuses.
Natural Capital
78 Building a Bold Tomorrow

Butterfly ParkFlagship program completed in 2013
Park witnesses hundreds of migratory butterflies every year
Wetland ParkUse of recycled and excess rain water
106 species of plants
9 thematic sectionsEducational and information signages
Pune Biodiversity Project10 thematic gardens
250+ species of native plants
Bengaluru Sustainability Forum (BSF)This forum was set up in early 2018 and convened by Wipro along with the National Center for Biological Sciences. This year due to the pandemic, all the outreach activities were online. In the year, we hosted a reading and discussion series on the UN sustainable goals, called “Reading for change”. It curated conversations with authors of six leading books related to health (pandemic), gender equality, quality education, sustainable cities, clean energy and reduced inequalities.
We also hosted a “Climate Conversations” series in partnership with the Bangalore International Center and a workshop on the food economy of Bengaluru in association with Science Gallery, Bengaluru. We are also working on a series of podcasts on various urban sustainability dimensions.
Wipro’s Natural Capital Valuation Program Natural capital valuation is a rigorous framework that assesses and quantified impacts - positive and negative - on nature or natural capital on account of a company’s operations and value chain. Natural Capital Impacts are calculated across six key performance indicators (KPIs) namely, GHG emissions, air pollution, water consumption, water and land pollution, waste generation and land use change. The methodology
uses a value for the social cost of carbon that varies by country and geography – typically, it uses a higher discount rate for developing countries as compared to developed countries.
For calculating impacts due to air pollution only human health Impacts were considered as they contribute to 95% of total impact from air pollution. Land use valuation was based on net change in economic value due to loss of ecosystem service and was calculated only for the electricity procured from the grid mix, since for the direct operations, land use change is not considered to be material. For calculating impact due to water consumption, the following factors were taken into consideration – impact on human health, incidence of infectious disease and impact of energy consumption.
In FY2021, the total environmental costs related to Wipro’s operations and supply chain were quantified at $0.20 billion ($0.23 billion in FY20), of which operational and supply chain impacts contribute 8% ($16.3 million) and 92% ($187 million) respectively. Of the operational impacts, the highest contribution is from electricity consumption at 80% ($12.8 million). Within Wipro’s upstream supply chain, purchased goods and services across all tiers of suppliers (88%; $161 million) and fuel and energy related activities (12%; $22 million) are the top two impact categories. In terms of the sources of impact, air pollution (57%; $117.6 million), greenhouse gas emissions (30%; $60 million) are the top two contributors.
79
Integrated Annual Report 2020-21
Wipro Limited

Human Capital
The New NormalSince March 2020, 95% of our workforce has been working from home due to the global COVID-19 pandemic. Working on client deliverables while maintaining top class support infrastructure and compliance with all legal stipulations has become the hallmark of remote working. There is a huge shift in the ways of working and the way employees interact and collaborate. Issues such as remote learning and mental and physical wellbeing have come to the forefront of HR strategy and employee experience. Coupled with this, we underwent one of our largest organizational restructuring exercises of the last decade. This change was completely managed remotely with minimum disruption to clients. These large macro and enterprise-level changes have driven and shaped our HR strategy, processes, policies and systems. These changes are closely tracked by senior leadership in both business and HR. As we continue to transform, certain things have remained at the core of the way we work, be it our unflinching commitment to the Spirit of Wipro values,
Key material issues
→ Hiring and onboarding
→ Performance and talent management
→ Learning and development
→ Employee well being
→ Employee Experience
→ Engagement & Communication
Key stakeholders
→ Employees
our culture transformation powered by Five Habits and our commitment to the globally recognized principles of business responsibility, human rights and corporate governance.
80 Building a Bold Tomorrow

People StrategyOur people strategies are geared towards creating an unparalleled employee experience through diverse learning opportunities, great careers, a strong employer brand, an empowering and inclusive culture where our employees find meaning in what they do while they create value for Wipro. Our focus now is to create hybrid ways of working to ensure employee wellbeing as well as business continuity.
Culture Transformation and Inclusion & DiversityCulture / ValuesSince our founding in 1945, Wipro has been driven by the belief that purpose fuels business and vice versa. Our Founder Chairman Azim Premji led the way for Wipro being an organization known for its moral compass and an unflinching commitment to values. This has helped us foster a more inclusive workplace for employees, vendors and clients alike. While our company has transformed many times over the years, the Spirit of Wipro, our core values, has remained constant. Chairman Rishad Premji, introduced the Five Habits essential to drive a Growth Mindset in early 2020, which are our values in action. The Five Habits are more relevant than ever before in light of the
ongoing pandemic as it asks each of us to be reflective, supportive, and collaborative. So far, over 21,000 leaders globally have been part of 75 immersive and interactive sessions on the Five Habits. The Five Habits can transform how we all experience Wipro as each Wiproite is a visible example of the organization culture.
Inclusion and Diversity (I&D)Inclusion and Diversity remains at the core of Wipro. We are committed to creating and nurturing a sense of belonging through equitable practices and by embracing all forms of differences. We renewed our I&D strategy and rearticulated our I&D policy. While we continue to have a structured approach for Gender, Disability, LGBTQ+, Race and Ethnicity inclusion, our journey involves embracing other forms of diversities including generational/ nationality/ supplier diversity, among others. We remain focused on encouraging plurality of ideas and elimination of unconscious bias. The I&D council was constituted in 2018 continues to provide direction and strategic guidance to the charter. The council is sponsored by the CEO and chaired by the Global I&D Head and consists of diverse leaders across businesses. Further, Business Unit and geography specific I&D councils drive the organizational and unit charter, led by a senior business leader from the unit or geography. They are supported by a network of Inclusion Champs.
People Processes: Key Highlights FY 2020-21
Hiring and OnboardingAs part of our Digitalization initiatives, we had invested in transforming our hiring and on-boarding processes for a more seamless and automated experience. These initiatives helped us navigate the pandemic effectively. Our entire hiring process was touchless and remote. We organized virtual walk-ins and leveraged digital technologies to connect and engage with candidates. Post selection, the offer roll-out process, document
collection and verification as well as onboarding were done remotely. New employees were onboarded via virtual sessions. They were enabled to be productive from the first day as we provided them with the necessary infrastructure in a work from home situation. Our strategy of localization continued to gain momentum with an increased number of local candidates in all the geographies that we operate in.
81
Integrated Annual Report 2020-21
Wipro Limited

Performance and Talent ManagementThe talent management processes contribute to the strategic priorities of Wipro by driving high performance across the organization. Our talent differentiation is sharp and is based on outcomes. Rewards are closely linked to performance outcomes. Career growth is based on sustained high performance. We believe values and performance must go hand in hand. Our quarterly review process continues to be a strong platform to encourage candid, constructive and meaningful feedforward discussions between employees and managers. Our performance management system leverages Artificial Intelligence to aid employees and managers in writing effective reviews thereby nudging and training them while they submit reviews quarter on quarter. There is an annual 360-degree feedback survey where employees in middle and senior level roles receive feedback from their teams, peers, internal customers, managers, external customers. At Wipro, succession planning is an annual exercise. Talent is classified in terms of performance and potential; successors are identified for critical roles and development actions are framed. Executive coaching is provided to senior leadership to facilitate their all-round development. Career building is an important pillar of our employee value proposition and in line with that the promotion and rotation policies have been strengthened to ensure more employees can take up internal roles and build a career that they aspire for.
Learning and DevelopmentWe continue to make significant investments in our learning & development function towards building a resilient organization, focused on business imperatives in the new normal. Our comprehensive efforts in digitalizing offerings and completely moving our curriculum online, have enabled employees to effectively manage the transition to a virtual work environment. We have been able to engage employees, ensure their wellbeing and cater to diverse learner needs through Virtual Instructor Led Trainings (VILTs), self-paced modules, virtual learning journeys, social learning, virtual mentoring, gamified interventions and e-summits. With the change in the ways of working due to COVID-19, we created six e-learning modules on Work From Home (WFH) readiness, work etiquette, managing stress in times of crisis, staying positive in trying times, leading in a crisis situation and empathy in difficult times.
Human Capital
82 Building a Bold Tomorrow

Employee WellbeingWith the ongoing pandemic, employee wellbeing has become an area of strategic focus for Wipro. Our employee wellness programs encompass the three areas of employee wellbeing, namely physical, emotional and financial wellbeing.
Physical WellbeingWipro provides a safe and healthy workplace for all employees. Our key focus areas to enhance the physical wellbeing of our employees are Health and Safety Risk Assessment, all round safety and security measures, including training and sensitization to meet the standard competence required by law in performing one's duties. All campuses maintain a conducive work environment in line with Indian/International standards. A Food Safety Standards Authority of India (FSSAI) license is mandatory for vendors operating within Wipro owned locations in India. All our facilities have safety committees, which meet quarterly and participate in risk assessments, safety inspections, incident investigations and hygiene audits. During 2020-21, more than 8,400 permanent and contract employees, were part of awareness camps and programmes. Awareness sessions were also conducted regarding off-the-job safety and road safety. More than 8,000 permanent and contract employees participated in committees on safety, food, transport, etc. across India, to represent the interests of the workforce.
Emotional WellbeingIn the new normal, to ensure the emotional and mental wellbeing of our employees, we have partnered with leading global EAP providers across the globe. It enables employees to reach out to counsellors 24x7 in-person and/or on phone to seek assistance for issues pertaining to personal or professional life. We conducted multiple sessions across geographies on topics including COVID-19, Work from Home and Emotional Wellbeing to enable employees cope with the new ways of working and remain emotionally strong. Key policy changes this year included changes in medical assistance, insurance and leaves.
COVID-19- Business Continuity ProcessThe exceptional circumstances around COVID-19 have brought to light emerging risks and have made previously identified risks more critical. We identified business critical functions, equipment and employees, and also determined how, where and by whom critical services would be provided. We suspended non-essential work to reduce risk of exposure to the virus and maintained social distancing norms. We carefully monitored employee availability, health and safety. Business continuity plans were put in place to maintain seamless operations. We analyzed and assessed supply chains to identify risks which exist in our operations. Wipro also mobilized infrastructure to support remote working, to ensure employees have the necessary hardware, software, equipment and internet connectivity to work safely and efficiently from home. A real time communication plan was put in place to keep employees updated at all times.
83
Integrated Annual Report 2020-21
Wipro Limited

Employee Experiences, Engagement and CommunicationEmployee CommunicationThe COVID-19 pandemic compelled us to reimagine how we engage and communicate globally. Even before the pandemic, we were leveraging technology and new channels of communication. Our focus was on transparent and timely communication, regular leadership connects, coupled with initiatives on physical and mental wellness, inclusion & diversity, culture, and more, kept the employee morale high.
Employee Experience Survey (EES) and Employee Insights EES is the formal mechanism to capture employee feedback, annually. However, we could not conduct this survey because of the ongoing pandemic. Instead we conducted three short COVID-19 Sentiment Surveys focusing on pillars relevant to employees working from home, such as remote enablement, work life balance and productivity, remote communities, manager and senior leadership effectiveness, physical and mental health and confidence in our future. Over 172,000 employees participated in these surveys, cumulatively. The results of these surveys have been analyzed and the key action areas were to focus more on Mental and Physical Health. We took several policy decisions based on these inputs, detailed in Employee Wellbeing section.
Digitalization and Talent AnalyticsWe continue to digitalize and transform our internal systems to drive business outcomes and enhance employee experience. Relevant analytics and insights are made available to HR business partners and business to enable decision-making based on data.
Financial WellbeingWe continually strive to provide our full-time and part-time employees with compensation packages commensurate with their skills and experience and in accordance with laws of the land. Our benefits program follows an integrated approach and provides a range of options for better financial and social security, including efficient tax-management options, life and accident insurance, medical packages and assistance in managing financial issues. For employees in India, we have organized periodic panel discussions and webinars on importance of insurance and investment awareness. We provide long-term incentives (LTI) by granting restricted stock units (RSUs) and Performance Stock Units (PSUs) to key executives. Our LTI plans are aimed at motivating and retaining key leaders. We continue to drive a high-performance and growth-oriented culture through our variable pay programs. Our management compensation is closely aligned with organizational objectives and priorities and rewards higher performance.
Human Capital
People ResultsWe have a culture of transparent and voluntary reporting which include the Business Responsibility Report, the Sustainability Report, the Dow Jones Sustainability Index, Ethisphere Institute etc. This has strengthened our employer brand and internal business processes. Leaders who significantly influence human capital strategies of the organization are measured on the performance of key indicators in this area. The indicators provide insights into the effectiveness of human capital strategies and are reviewed regularly both at organizational and individual business unit levels. For a detailed view on People Results please refer to Additional Supporting metrics of the Annual Report.
84 Building a Bold Tomorrow
Human Rights & Values at Wipro
Commitment to Human RightsWipro is committed to protecting and respecting Human Rights and remedying rights violations in case they are identified; for example, issues relating to human trafficking, forced labour, child labour, freedom of association, the right to collective bargaining, equal remuneration and discrimination. Providing equal employment opportunity, ensuring distributive, procedural, and interactional fairness, creating a harassment-free, safe environment and respecting fundamental rights are some of the ways in which we ensure the same. As an equal opportunity employer, we do not discriminate on the basis of race, colour, religion, sex, national origin, gender identity, gender expression, sexual orientation or disability status. Our Code of Business Conduct (COBC), Supplier Code of Conduct and Human Rights Policy are aligned to globally accepted standards and frameworks like the U.N. Global Compact, U.N. Universal Declaration of Human Rights and International Labour Organization’s Declaration on Fundamental Principles and Rights at Work (ILO Declaration). They cover all employees, suppliers, clients, communities and countries across geographies where we do business. Wipro is also one of the founding members of CII’s Business for Human Rights Initiative.
Freedom of AssociationWe respect the right of employees to freely associate without fear of reprisal, discrimination, intimidation or harassment. Our employees are represented by formal employee representative groups in certain geographies including Continental Europe and Latin America which constitute 2.3% of our workforce with a further 1.6% under collective bargaining agreements. Our HR representatives ensure legislative awareness and compliance and meet these groups periodically to inform and consult on any change that can impact their terms and conditions / work environment.
Risk Identification ProcessWe have established committees and processes like the Ombuds, Prevention of Sexual Harassment Committee, Employee Experience Survey, Audit/Risk & Compliance committees, EHS, an Inclusion & Diversity Council and Culture council to review progress and formulate strategies to address issues pertaining to compliance, safety and a harassment-free workplace. These processes are periodically reviewed by the top management. We keep our employees informed about these processes regularly through trainings, mailers and internal social media platforms. We have identified the need for a continuing Human Rights due diligence program, which we plan to carry out when the pandemic situation stabilizes. Also, a detailed due diligence is done before each merger or acquisition which outlines compliance and governance risks.
Identified Risks Through various projects, audits and feedback we have identified the following as potential risks to Human Rights:
Benefits and engagement of extended/contract workforce
Unconscious bias at the workplace
Returning mothers
85
Integrated Annual Report 2020-21
Wipro Limited

Initiatives to support our employeesAt the onset of the pandemic in mid-March last year, we enabled Wiproites globally to Work From Home. Currently, less than 2% of our employees are working from Wipro offices. We are taking additional actions to protect and provide support to our employees and their immediate family members. Some of our key initiatives to support our employees are:
COVID-19 Isolation Care CentersCreated COVID-19 Isolation Care Centers for our employees and their immediate family members across locations
Medical SupportPartnered with major hospitals across India to ensure critically ill employees can access the best medical facilities facilitated through a 24/7 helpline
Wellness platformPartnered with a tech-enabled online-to-offline delivery platform specializing in primary care and urgent response services
Vaccination SupportProviding free vaccines to employees and their immediate family members
COVID-19 safety webinar seriesOrganized a series of webinars on COVID-19 safety, vaccination, recovery, and more
COVID-19 Support CommunicationContinued to share critical updates with employees regularly through multiple channels. COVID-19 support emergency helpdesk numbers were shared with employees via mailers and SMS for further reinforcement
Human Capital
Mitigation Policies/ProcessesWe have created specific interventions to tackle these issues:
Returning MothersWe are formulating a comprehensive set of support initiatives across all stages (before, during and post return from maternity) for returning mothers. The key elements include building manager awareness of unconscious bias and effective handling of women employees post return from Maternity Leave. A governance committee to oversee the program deployment and settling in of returning mothers and an ecosystem enablement through policy, process and system interventions have been also suggested.
Contract Employee EngagementWe engage contract employees for supporting our projects in India for short-term assignments. The duration of such engagements varies depending upon the project and the role. We ensured insurance coverage for these employees during the COVID-19 pandemic along with complete compliance on processes like internal mandatory trainings (i.e. Information Security, Data Privacy, and Prevention of Sexual Harassment, among others) as well as background verification. The resignation portal for contract employees has been modified to include asset declaration. Processes like reimbursement and invoicing have been digitalized to provide contract employees with a faster and more seamless experience.
Sensitization on Unconscious BiasUnder the umbrella of our #BreaktheBias campaign, we have monthly leadership blogs, mailers and a mandatory e-learning module to raise awareness among employees on how they can eliminate biases at the workplace. At present, over 164,000 employees have undertaken the Unconscious Bias E-module and received certification.
86 Building a Bold Tomorrow

Board’s Report
Dear Members,
On behalf of the Board of Directors (the “Board”) of the Company, it gives me immense pleasure to present the 75th Board’s Report, along with the Balance Sheet, Profit and Loss Account and Cash Flow Statements, for the financial year ended March 31, 2021.
I. FINANCIAL PERFORMANCEThe standalone and consolidated financial statements of the Company for the financial year ended March 31, 2021, have been prepared in accordance with the Indian Accounting Standards (Ind AS) as notified by the Ministry of Corporate Affairs and as amended from time to time.
On a consolidated basis, your Company’s sales increased to ` 619,430 million for the current year as against ` 610,232 million in the previous year, recording an increase of 1.51%. Your Company’s net profits increased to ` 108,680 million for the current year as against ` 97,718 million in the previous year, recording an increase of 11.22%.
On a standalone basis, your Company’s sales decreased to ` 502,994 million for the current year as against ` 503,877 million in the previous year, recording a decrease of -0.18%. Your Company’s net profits increased to ` 100,609 million in the current year as against ` 86,807 million in the previous year, recording an increase of 15.90%.
Key highlights of financial performance of your Company for the financial year 2020-21 are provided below: (` in millions)
Standalone Consolidated2020-21 2019-20 2020-21 2019-20
Sales 502,994 503,877 619,430 610,232Other Operating Income - 193 (81) 1,144Other Income 23,829 24,766 23,907 27,250Profit before Tax 126,848 110,077 139,029 122,519Provision for Tax 26,239 23,270 30,349 24,801Net profit for the year 100,609 86,807 108,680 97,718
Other comprehensive (loss)/income for the year 6,337 (4,284) 6,817 4,257Total comprehensive income for the year 106,946 82,523 115,497 101,975Total comprehensive income for the period attributable to:Minority Interest - - 663 653
Equity holders 106,946 82,523 114,834 101,322AppropriationsDividend 5,478 5,713 5,459 5,689
Tax on distribution of dividend - 1,174 - 1,174EPS- Basic 17.81 14.88 19.11 16.67- Diluted 17.77 14.84 19.07 16.63
DividendPursuant to Regulation 43A of the Securities and Exchange Board of India (Listing Obligations and Disclosure Requirements) Regulations, 2015, as amended (“Listing Regulations”), the Board has approved and adopted a Dividend Distribution Policy. The policy details various considerations based on which the Board may recommend or declare Dividend, your Company’s dividend track record, usage of retained earnings for corporate actions, etc. The Dividend Distribution policy and Capital Allocation Policy are available on the Company’s website at https://www.wipro.com/content/dam/nexus/en/investor/corporate-governance/policies-and-guidelines/ethical-guidelines/12769-dividend-distribution-policy-october-2016.pdf.
Pursuant to the approval of the Board on January 13, 2021, your Company paid an interim dividend of ` 1/- per equity share of face value of ` 2/- each, to shareholders who were on the register of members as on January 25, 2021, being the record date fixed for this purpose, after deduction of applicable taxes. The Board did not recommend a final dividend and the interim dividend of ` 1/- per equity share declared by the Board in January 2021 shall be the final dividend for the financial year 2020-21. Thus, the total dividend for the financial year 2020-21 remains ` 1/- per equity share.
Your Company is in compliance with its Dividend Distribution Policy and Capital Allocation Policy as approved by the Board.
87
Integrated Annual Report 2020-21Wipro Limited

Board’s Report
Buyback of Equity Shares Pursuant to the approval of the Board on October 13, 2020 and approval of shareholders through special resolution dated November 16, 2020 passed through postal ballot by e-voting, your Company concluded the buyback of 237,500,000 equity shares of face value of ` 2/- each at a price of ` 400/- per equity share, for an aggregate amount of ` 95,000 million (excluding buyback tax), in January 2021.
The buyback was made from all existing shareholders of the Company as on December 11, 2020, being the record date for the purpose, on a proportionate basis under the tender offer route in accordance with the provisions of the Securities and Exchange Board of India (Buyback of Securities) Regulations, 2018 and the Companies Act, 2013 and rules made thereunder.
Transfer to ReservesAppropriations to general reserves for the financial year ended March 31, 2021 as per standalone and consolidated financial statements were:
(` in millions)Standalone Consolidated
Net profit for the year 100,609 107,964* Balance of Reserves at the beginning of the year
453,110 541,790
Transfer to General Reserves - -Balance of Reserves at the end of the year
441,458 538,052
* excluding non-controlling interest
For complete details on movement in Reserves and Surplus during the financial year ended March 31, 2021, please refer to the Statement of Changes in Equity included in the Standalone and Consolidated financial statements on page nos. 156 to 157 and 229 to 230 respectively of this Annual Report.
Share CapitalDuring the financial year 2020-21, the Company allotted 3,281,165 equity shares consequent to exercise of employee stock options. Your Company also extinguished 237,500,000 equity shares consequent to buyback in January 2021 and reduced the paid-up equity share capital by ` 475 million. Consequently, the paid-up equity share capital of the Company as of March 31, 2021 stood at ` 10,958 million consisting of 5,479,138,555 equity shares of ` 2/- each.
Subsidiary CompaniesIn accordance with Section 129(3) of the Companies Act, 2013, a statement containing salient features of the financial statements of the subsidiary companies in Form AOC-1 is
provided at page nos. 302 to 308 of this Annual Report. The statement also provides details of performance and financial position of each of the subsidiaries.
Audited financial statements together with related information and other reports of each of the subsidiary companies have also been placed on the website of the Company at https://www.wipro.com/investors/annual-reports/.
Your Company funds its subsidiaries, from time to time, in the ordinary course of business and as per the funding requirements, through equity, loan, guarantee and/or other means to meet working capital requirements.
In terms of the Company’s Policy on determining “material subsidiary”, during the financial year ended March 31, 2021, Wipro LLC was determined as a material subsidiary whose income exceeds 10% of the consolidated income of the Company in the immediately preceding financial year. Further details on the subsidiary monitoring framework have been provided as part of the Corporate Governance report.
In June 2021, Wipro IT Services LLC, a wholly owned step-down subsidiary of your Company incorporated under the laws of Delaware, United States of America has approved the proposal for issuance of U.S. dollar denominated notes (“Notes”) in an aggregate principal amount of up to US$ 750 million. The Notes will be guaranteed by the Company vide a corporate guarantee. The net proceeds of the Notes are intended to be utilised for refinancing or repaying existing debt, general corporate purposes and/or for any other purpose permitted by law. The Notes are proposed to be listed on the Singapore Stock Exchange.
The Board of Directors of your Company, at their meeting held on June 9, 2021, granted its approval to unconditionally and irrevocably guarantee the due and prompt payment of the principal and interest and any additional amount payable in respect of the Notes, as and when the same shall become due and payable. The Guarantee is subject to the aggregate liability of the Company not exceeding US$ 865 million (115% of the principal amount of the Notes).
Particulars of Loans, Advances, Guarantees and InvestmentsPursuant to Section 186 of the Companies Act, 2013 and Schedule V of the Listing Regulations, disclosure on particulars relating to Loans, Advances, Guarantees and Investments are provided as part of the financial statements.
II. BUSINESS AND OPERATIONS
Your Company is a global technology services firm, with employees in over 55 countries and serving enterprise clients across various industries. Your Company’s business is
88

comprised of the IT Services, IT Products and ISRE segments. Companies are transforming their technology stack, to operate with agility and flexibility. Your Company is a trusted partner to its clients in their transformation journey and enable them to be leaders in their respective industries.
During the year ended March 31, 2021, your Company adopted a new organizational structure designed to simplify its go-to-market execution and ensure sector focus and growth in non-US markets. The previous structure of multiple delivery units has been replaced by a simplified model designed to bring the best of Wipro closer to its customers. This model consists of four Strategic Market Units (“SMUs”) and two Global Business Lines (“GBLs”). The four SMUs are Americas 1, Americas 2, Europe, and Asia Pacific Middle East Africa (“APMEA”).
Your Company organizes its customer-facing functions of sales, marketing and business development into teams that focus primarily on the four SMUs and service offerings, enabling it to deliver services to customers based on deep domain insight. Your Company’s customer-facing functions in each SMU are predominantly locally staffed.
Your Company is seeing that traditional technology services are under stress and “shift to the new” is becoming more pronounced. Growth in the technology services sector will be led by next generation technologies and services, such as digital, cloud, data, engineering and cybersecurity. Companies are actively exploring opportunities for digitization, leading to increased demand for consulting services. Digital technologies are expected to grow 15%-20% over the next five years and next-generation technologies such as 5G, AI/Intelligent Enterprise, robotics and blockchain, is anticipated to grow exponentially in the near future.
Your Company assist its clients to create new possibilities at the intersection of design, domain, consulting and next-generation technologies. Your Company’s new operating model ensures adequate sector and domain-focused go-to-market and execution. It also combines global expertise with local geography-focus in building capabilities, and ensures dedicated sales presence, led by proximity to clients. Your Company is creating value for clients through sector focused business solutions, digital and technology capabilities, cutting edge innovation, leveraging strategic partnerships and talent.
Your Company’s IT Services segment provides a range of IT and IT-enabled services which include digital strategy advisory, customer-centric design, technology consulting, IT consulting, custom application design, development, re-engineering and maintenance, systems integration, package implementation, global infrastructure services, analytics services, business process services, research and development and hardware and software design to leading enterprises worldwide.
Your Company’s IT Products segment provides a range of third-party IT products, which allows us to offer comprehensive IT system integration services. These products include computing, platforms and storage, networking solutions, enterprise information security and software products, including databases and operating systems. Your Company provides IT products as a complement to its IT services offerings rather than sell standalone IT products, and its focus continues to be on consulting and digital engagements, with a more selective approach in bidding for System Integration (“SI”) engagements.
Further information on your Company’s IT services and products offerings, business strategy, operating segments overview and business model are presented as part of the Management Discussion and Analysis Report (“MD & A Report”) from page no. 30 onwards.
Material Changes and Commitments Affecting the Business Operations and Financial Position of the CompanyThe ongoing global COVID-19 pandemic has caused and continues to cause significant loss of life and has resulted in curtailment of economic activities across the world as local administrations and governments seek to limit spread of the disease, including through lockdown policies, restriction on business activities and business shutdowns. Among other things, many of your Company’s and its clients’ offices have been closed and employees have been working from home and many customer-facing businesses have closed or are operating at a significantly lower capacity to observe various social distancing requirements and government-mandated COVID-19 protocols.
During the COVID-19 pandemic, your Company continued to sign large deals and deliver large-scale transformation projects.
In March 2020, at the onset of the COVID-19 pandemic, your Company enabled its employees globally to work from home. Since then, fewer than 3% of employees have been working from Company’s offices.
Additional information regarding potential impact of COVID-19 pandemic on your Company’s business operations and financial position are provided as part of the MD & A Report from page no. 30 onwards.
Outlook Global IT service providers offer a range of end-to- end software development, digital services, IT business solutions, research and development services, technology infrastructure services, business process services, consulting and related support functions.
89
Integrated Annual Report 2020-21Wipro Limited

Board’s Report
According to the Future of technology Services– Winning in this Decade published by NASSCOM, Indian technologies services industry is forecasted to grow 10%-12% CAGR in 5 years to reach $300-$350B revenues.
According to the Future of technology Services– Winning in this Decade published by NASSCOM, share of digital in Indian technology services revenue is likely to be 55%-60% by 2025 with an annual growth of 25%-30%.
Acquisitions, Divestments, Investments and MergersAcquisitions are a key enabler for driving capability to build industry domain, focus on key strategic areas, strengthening presence in emerging technology areas including Digital, and increase market footprint in newer markets. Your Company focuses on opportunities where it can further develop its domain expertise, specific skill sets and its global delivery model to maximize service and product enhancements and higher margins.
a) In August 2020, your Company acquired 4C NV and its subsidiaries, a Salesforce multi-cloud partner in Europe, U.K., and the Middle East.
b) In August 2020, your Company also acquired IVIA Serviços de Informática Ltda., a specialized IT services provider to financial services, retail and manufacturing sectors in Brazil.
c) In December 2020, as part of strategic digital and IT partnership deal, your Company entered into a definitive agreement with Metro AG, the leading global wholesale company that is redefining the food service distribution industry. Duration of the deal is for 5 years with the intention to extend it up to additional 4 years. As part of this transaction, your Company had taken over the IT units of Metro AG, namely METRO-NOM GMBH and METRO Systems Romania S.R.L. effective April 1, 2021.
d) In December 2020, your Company acquired 83.4% stake in Encore Theme Technologies Private Limited, a Finastra trade finance solutions partner across the Middle East, Africa, India and Asia Pacific. The remaining 16.6% equity stake will be acquired subject to and after receipt of certain regulatory approvals/confirmations.
e) In February 2021, your Company acquired Eximius Design, LLC and Eximius Design India Private Limited, a leading engineering services company with expertise in semiconductor, software and systems design.
f) In April 2021, your Company announced that it has signed definitive agreement to acquire Ampion, an Australia-based provider of cyber security, DevOps and quality engineering services. The transaction is expected to be completed during the quarter ending June 30, 2021, subject to customary closing conditions and regulatory approvals.
g) In April 2021, your Company acquired Capco, a global management and technology consultancy providing digital, consulting and technology services to financial institutions in the Americas, Europe and the Asia Pacific.
h) Wipro Ventures, the strategic investment arm of Wipro, invests in early-to-mid-stage enterprise software startups. The areas of investment include Artificial Intelligence, Analytics, Business Automation, Cloud Infrastructure, Cyber security, Data Management, Internet of Things and Testing Automation. As of March 31, 2021, Wipro Ventures manages 16 active investments. In addition to direct equity investments in emerging startups, Wipro Ventures has invested in five enterprise-focused venture funds: B Capital, Boldstart Ventures, Glilot Capital Partners, TLV Partners and Work-Bench.
i) During the financial year 2020-21, your Company has carried out the merger of Cellent GmbH, Germany with and into Wipro Technologies GmbH, Germany.
Management Discussion and Analysis ReportIn terms of Regulation 34 of the Listing Regulations and SEBI circular SEBI/HO/CFD/CMD/CIR/P/2017/10 dated February 6, 2017, your Company has adopted salient features of Integrated Reporting prescribed by the International Integrated Reporting Council (‘IIRC’) as part of its MD & A Report. The MD & A report, capturing your Company’s performance, industry trends and other material changes with respect to your Company’s and its subsidiaries, wherever applicable, are presented from page no. 30 onwards of this Annual Report.
The MD & A Report provides a consolidated perspective of economic, social and environmental aspects material to your Company’s strategy and its ability to create and sustain value to its key stakeholders and includes aspects of reporting as required by Regulation 34 of the Listing Regulations on Business Responsibility Report. Statutory section of Business Responsibility Report is provided from page nos. 384 to 390 of this Annual Report.
III. GOVERNANCE AND ETHICS
Corporate Governance
Your Company believes in adopting best practices of corporate governance. Corporate governance principles are enshrined in the Spirit of Wipro, which form the core values of Wipro. These guiding principles are also articulated through the Company’s code of business conduct, Corporate Governance Guidelines, charter of various sub-committees and disclosure policy.
90

As per Regulation 34 of the Listing Regulations, a separate section on corporate governance practices followed by your Company, together with a certificate from V. Sreedharan & Associates, Company Secretaries, on compliance with corporate governance norms under the Listing Regulations, is provided at page no. 121 onwards.
Board of Directors
Board’s Composition and IndependenceYour Company’s Board consists of global leaders and visionaries who provide strategic direction and guidance to the organization. As on March 31, 2021, the Board comprised of two Executive Directors, six non-executive Independent Directors and one non-executive non-independent Director.
Definition of ‘Independence’ of Directors is derived from Regulation 16 of the Listing Regulations, NYSE Listed Company Manual and Section 149(6) of the Companies Act, 2013. The Company has received necessary declarations under Section 149(7) of the Companies Act, 2013 and Regulation 25(8) of the Listing Regulations, from the Independent Directors stating that they meet the prescribed criteria for independence. The Board, after undertaking assessment and on examination of the relationships disclosed, considered the following Non-Executive Directors as Independent Directors:
Mr. M. K. Sharma
Mrs. Ireena Vittal
Mr. William Arthur Owens
Dr. Patrick J. Ennis
Mr. Patrick Dupuis
Mr. Deepak M. Satwalekar
All Independent Directors have affirmed compliance to the code of conduct for independent directors as prescribed in Schedule IV to the Companies Act, 2013.
Meetings of the BoardThe Board met six times during the financial year 2020-21 on April 15, 2020, May 29, 2020, July 14, 2020, October 12-13, 2020, January 13, 2021 and February 24, 2021. The necessary quorum was present for all the meetings. The maximum interval between any two meetings did not exceed 120 days.
Directors and Key Managerial PersonnelAt the 74th Annual General Meeting (AGM) held on July 13, 2020, the shareholders of the Company approved the following:
1. Appointment of Mr. Thierry Delaporte (DIN: 08107242) as the Chief Executive Officer and Managing Director of the Company for a period of 5 years from July 6, 2020
to July 5, 2025, whose office shall be liable to retire by rotation.
2. Appointment of Mr. Deepak M. Satwalekar (DIN: 00009627) as an Independent Director for a period of five years from July 1, 2020 to June 30, 2025, whose office shall not be liable to retire by rotation.
Pursuant to the recommendation of Board Governance, Nomination and Compensation Committee, the Board approved re-appointment of Dr. Patrick J. Ennis (DIN: 07463299) and Mr. Patrick Dupuis (DIN: 07480046) as Independent Directors of the Company for a second term of 5 years with effect from April 1, 2021 to March 31, 2026, based on their skills, experience, knowledge and positive outcome of performance evaluation. The said re-appointment was approved by shareholders of the Company vide special resolutions dated June 4, 2021, passed through postal ballot by e-voting.
Pursuant to the recommendation of Board Governance, Nomination and Compensation Committee, the Board has, on May 13, 2021, approved the appointment of Ms. Tulsi Naidu (DIN: 03017471) as an Additional Director in the capacity of Independent Director for a term of 5 years with effect from July 1, 2021 to June 30, 2026, subject to approval of the shareholders of the Company. Necessary resolutions for her appointment are being placed for the approval of shareholders as part of the notice of the 75th AGM.
In the opinion of the Board, all our Independent Directors possess requisite qualifications, experience, expertise and hold high standards of integrity for the purpose of Rule 8(5)(iiia) of the Companies (Accounts) Rules, 2014. List of key skills, expertise and core competencies of the Board, including the Independent Directors, is provided at page no. 123 of this Annual Report.
Pursuant to the provisions of Section 152 of the Companies Act, 2013 and the Articles of Association of the Company, Mr. Thierry Delaporte (DIN: 08107242) will retire by rotation at the 75th AGM and being eligible, has offered himself for re-appointment.
During the financial year, Mr. Abidali Z. Neemuchwala resigned as the Chief Executive Officer and Managing Director of the Company with effect from the end of the day on June 1, 2020. Further, Mrs. Arundhati Bhattacharya stepped down as an Independent Director from the Board with effect from close of business hours on June 30, 2020.
Committees of the Board
Your Company’s Board has the following committees:
1. Audit, Risk and Compliance Committee, which also acts as Risk Management Committee.
2. Board Governance, Nomination and Compensation
91
Integrated Annual Report 2020-21Wipro Limited

Board’s Report
Committee, which also acts as Corporate Social Responsibility Committee.
3. Administrative and Shareholders/Investors Grievance Committee (Stakeholders Relationship Committee).
4. Strategy Committee.
At the Board Meeting held on April 15, 2021, it was decided to discontinue the Strategy Committee, as the entire Board will be deliberating matters pertaining to the strategy of the Company going forward.
Details of terms of reference of the Committees, Committee membership changes, and attendance of Directors at meetings of the Committees are provided in the Corporate Governance report from page nos. 128 to 132 of this Annual Report.
Board EvaluationIn line with the Corporate Governance Guidelines of the Company, Annual Performance Evaluation was conducted for all Board Members as well as the working of the Board and its Committees. This evaluation was led by the Chairman of the Board Governance, Nomination and Compensation Committee with specific focus on performance and effective functioning of the Board. The Board evaluation framework has been designed in compliance with the requirements under the Companies Act, 2013 and the Listing Regulations, and in accordance with the Guidance Note on Board Evaluation issued by SEBI in January 2017. The Board evaluation was conducted through questionnaire designed with qualitative parameters and feedback based on ratings.
Evaluation of the Board was based on criteria such as composition and role of the Board, Board communication and relationships, functioning of Board Committees, review of performance of Executive Directors, succession planning, strategic planning, etc.
Evaluation of Committees was based on criteria such as adequate independence of each Committee, frequency of meetings and time allocated for discussions at meetings, functioning of Board Committees and effectiveness of its advice/recommendation to the Board, etc.
Evaluation of Directors was based on criteria such as participation and contribution in Board and Committee meetings, representation of shareholder interest and enhancing shareholder value, experience and expertise to provide feedback and guidance to top management on business strategy, governance, risk and understanding of the organization’s strategy, etc.
The outcome of the Board Evaluation for the financial year 2020-21 was discussed by the Board Governance,
Nomination and Compensation Committee and the Board at their respective meetings held in April 2021. The Board has received highest ratings on Board communication and relationships, legal and financial duties of the Board and Composition and Role of the Board. The Board noted the actions taken in improving Board effectiveness based on feedback given in the previous year. Further, the Board also noted areas requiring more focus in the future, which includes further progress on Board diversity, Strategy especially post COVID-19, discussion on succession planning, and risk management.
Policy on Director’s Appointment and RemunerationThe Board Governance, Nomination and Compensation Committee has framed a policy for selection and appointment of Directors including determining qualifications and independence of a Director, Key Managerial Personnel (KMP), Senior Management Personnel and their remuneration as part of its charter and other matters provided under Section 178(3) of the Companies Act, 2013.
Pursuant to Section 134(3) of the Companies Act, 2013, the nomination and remuneration policy of the Company which lays down the criteria for determining qualifications, competencies, positive attributes and independence for appointment of Directors and policies of the Company relating to remuneration of Directors, KMP and other employees is available on the Company’s website at https://www.wipro.com/content/dam/nexus/en/investor/corporate-governance/policies-and-guidelines/ethical-guidelines/wipro-limited-remuneration-policy.pdf. We affirm that the remuneration paid to Directors, senior management and other employees is in accordance with the remuneration policy of the Company.
Policy on Board Diversity The Board Governance, Nomination and Compensation Committee has framed a policy for Board Diversity which lays down the criteria for appointment of Directors on the Board of your Company and guides organization’s approach to Board Diversity.
Your Company believes that, Board diversity basis the gender, race, age will help build diversity of thought and will set the tone at the top. A mix of individuals representing different geographies, culture, industry experience, qualification and skill set will bring in different perspectives and help the organization grow. The Board of Directors is responsible for review of the policy from time to time. Policy on Board Diversity has been placed on the Company’s website at https://www.wipro.com/investors/corporate-governance/.
92

Risk ManagementYour Company has put in place an Enterprise Risk Management (ERM) framework and adopted an enterprise risk management policy based on globally recognized standards. The ERM framework is administered by the Audit, Risk and Compliance Committee. The objective of the ERM framework is to enable and support achievement of business objectives through risk-intelligent assessment apart from placing significant focus on constantly identifying and mitigating risks within the business. The ERM framework covers various categories of risks including, inter alia, information security and cyber security risks, effectiveness of the controls that have been implemented to prevent such risks and continuous improvement of the systems and processes to mitigate such risks. For more details on the Company’s risk management framework, please refer to page nos. 38 to 41 of this Annual Report.
Compliance Management FrameworkThe Board has approved a Global Statutory Compliance Policy providing guidance on broad categories of applicable laws and process for monitoring compliance. In furtherance to this, your Company has instituted an online compliance management system within the organization to monitor compliances and provide update to the senior management and Board on a periodic basis. The Audit, Risk and Compliance Committee and the Board periodically monitor status of compliances with applicable laws.
Code for Prevention of Insider TradingYour Company has adopted a Code of Conduct to regulate, monitor and report trading by designated persons and their immediate relatives as per the requirements under the Securities and Exchange Board of India (Prohibition of Insider Trading) Regulations, 2015. This Code of Conduct also includes code for practices and procedures for fair disclosure of unpublished price sensitive information which has been made available on the Company’s website at https://www.wipro.com/investors/corporate-governance/.
Vigil MechanismYour Company has adopted an Ombuds process as a channel for receiving and redressing complaints from employees and directors, as per the provisions of Section 177(9) and (10) of the Companies Act, 2013, Regulation 22 of the Listing Regulations and Regulation 9A of Securities and Exchange Board of India (Prohibition of Insider Trading) Regulations, 2015.
Under this policy, your Company encourages its employees to report any incidence of fraudulent financial or other information to the stakeholders, reporting of instance(s)
of leak or suspected leak of unpublished price sensitive information, and any conduct that results in violation of the Company’s code of business conduct, to the management (on an anonymous basis, if employees so desire). Further, your Company has prohibited discrimination, retaliation or harassment of any kind against any employee who reports under the Vigil Mechanism or participates in the investigation.
Awareness of policies is created by, inter alia, sending group mailers highlighting actions taken by the Company against the errant employees. Mechanism followed under the Ombuds process has been displayed on the Company’s intranet and website at https://www.wipro.com/investors/corporate-governance/#WiprosOmbudsProcess.
All complaints received through Ombuds process and investigative findings are reviewed and approved by the Chief Ombuds person. All employees and stakeholders can also register their concerns either by sending an email to [email protected] or through web-based portal at https://www.wipro.com/investors/corporate-governance/#WiprosOmbudsProcess. Following an investigation of the concerns received, a decision is made by the appropriate authority on the action to be taken basis the findings of the investigation. In case the complainant is non-responsive for more than 15 days, the concern may be closed without further action.
The below table provides details of complaints received/disposed during the financial year 2020-21:
No. of complaints pending at the beginning of financial year 85
No. of complaints filed during the financial year 870
No. of complaints disposed during the financial year 917
No. of complaints pending at the end of the financial year 38
All cases were investigated and actions taken as deemed appropriate. Based on self-disclosure data, 19% of these cases were reported anonymously. The top categories of complaints were people processes at 33% and workplace concerns and harassment at 28%. The majority of cases (76%) were resolved through engagement of human resources or mediation, or closed since they were unsubstantiated.
The Audit, Risk and Compliance Committee periodically reviews the functioning of this mechanism. No personnel of the Company were denied access to the Audit, Risk and Compliance Committee.
Information Required under Sexual Harassment of Women at Workplace (Prevention, Prohibition & Redressal) Act, 2013Your Company has constituted Internal Complaints Committee under the Sexual Harassment of Women at
93
Integrated Annual Report 2020-21Wipro Limited
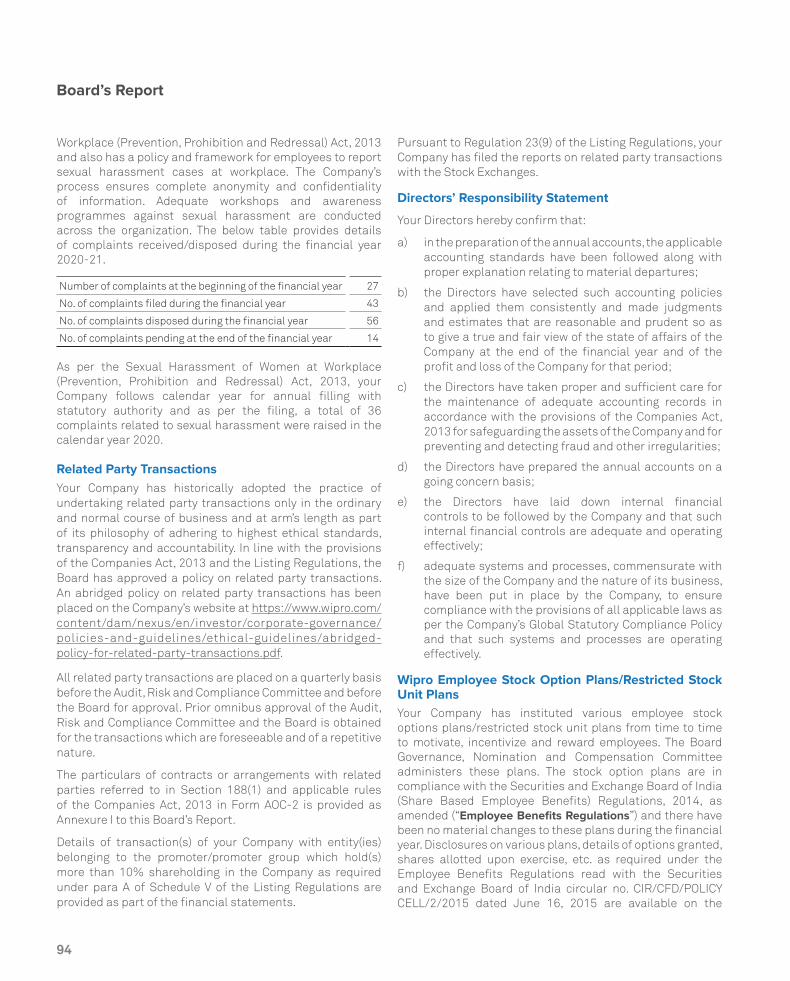
Board’s Report
Workplace (Prevention, Prohibition and Redressal) Act, 2013 and also has a policy and framework for employees to report sexual harassment cases at workplace. The Company’s process ensures complete anonymity and confidentiality of information. Adequate workshops and awareness programmes against sexual harassment are conducted across the organization. The below table provides details of complaints received/disposed during the financial year 2020-21.
Number of complaints at the beginning of the financial year 27
No. of complaints filed during the financial year 43
No. of complaints disposed during the financial year 56
No. of complaints pending at the end of the financial year 14
As per the Sexual Harassment of Women at Workplace (Prevention, Prohibition and Redressal) Act, 2013, your Company follows calendar year for annual filling with statutory authority and as per the filing, a total of 36 complaints related to sexual harassment were raised in the calendar year 2020.
Related Party TransactionsYour Company has historically adopted the practice of undertaking related party transactions only in the ordinary and normal course of business and at arm’s length as part of its philosophy of adhering to highest ethical standards, transparency and accountability. In line with the provisions of the Companies Act, 2013 and the Listing Regulations, the Board has approved a policy on related party transactions. An abridged policy on related party transactions has been placed on the Company’s website at https://www.wipro.com/content/dam/nexus/en/investor/corporate-governance/policies-and-guidelines/ethical-guidelines/abridged-policy-for-related-party-transactions.pdf.
All related party transactions are placed on a quarterly basis before the Audit, Risk and Compliance Committee and before the Board for approval. Prior omnibus approval of the Audit, Risk and Compliance Committee and the Board is obtained for the transactions which are foreseeable and of a repetitive nature.
The particulars of contracts or arrangements with related parties referred to in Section 188(1) and applicable rules of the Companies Act, 2013 in Form AOC-2 is provided as Annexure I to this Board’s Report.
Details of transaction(s) of your Company with entity(ies) belonging to the promoter/promoter group which hold(s) more than 10% shareholding in the Company as required under para A of Schedule V of the Listing Regulations are provided as part of the financial statements.
Pursuant to Regulation 23(9) of the Listing Regulations, your Company has filed the reports on related party transactions with the Stock Exchanges.
Directors’ Responsibility Statement
Your Directors hereby confirm that:
a) in the preparation of the annual accounts, the applicable accounting standards have been followed along with proper explanation relating to material departures;
b) the Directors have selected such accounting policies and applied them consistently and made judgments and estimates that are reasonable and prudent so as to give a true and fair view of the state of affairs of the Company at the end of the financial year and of the profit and loss of the Company for that period;
c) the Directors have taken proper and sufficient care for the maintenance of adequate accounting records in accordance with the provisions of the Companies Act, 2013 for safeguarding the assets of the Company and for preventing and detecting fraud and other irregularities;
d) the Directors have prepared the annual accounts on a going concern basis;
e) the Directors have laid down internal financial controls to be followed by the Company and that such internal financial controls are adequate and operating effectively;
f) adequate systems and processes, commensurate with the size of the Company and the nature of its business, have been put in place by the Company, to ensure compliance with the provisions of all applicable laws as per the Company’s Global Statutory Compliance Policy and that such systems and processes are operating effectively.
Wipro Employee Stock Option Plans/Restricted Stock Unit PlansYour Company has instituted various employee stock options plans/restricted stock unit plans from time to time to motivate, incentivize and reward employees. The Board Governance, Nomination and Compensation Committee administers these plans. The stock option plans are in compliance with the Securities and Exchange Board of India (Share Based Employee Benefits) Regulations, 2014, as amended (“Employee Benefits Regulations”) and there have been no material changes to these plans during the financial year. Disclosures on various plans, details of options granted, shares allotted upon exercise, etc. as required under the Employee Benefits Regulations read with the Securities and Exchange Board of India circular no. CIR/CFD/POLICY CELL/2/2015 dated June 16, 2015 are available on the
94

Company’s website at https://www.wipro.com/content/dam/nexus/en/investor/annual-reports/2020-2021/disclosure-under-sebi-share-based-employee-benefits-regulations-2014-for-the-year-ended-march-31-2021.pdf. No employee was issued stock options during the year equal to or exceeding 1% of the issued capital of the Company at the time of grant.
Particulars of EmployeesInformation required pursuant to Section 197(12) of the Companies Act, 2013 read with Rule 5(1) of the Companies (Appointment and Remuneration of Managerial Personnel) Rules, 2014 is provided as Annexure II to this report.
A statement containing, inter alia, the names of top ten employees in terms of remuneration drawn and every employee employed throughout the financial year and in receipt of remuneration of ` 102 lakhs or more and, employees employed for part of the year and in receipt of remuneration of ` 8.50 lakhs or more per month, pursuant to Rule 5(2) the Companies (Appointment and Remuneration of Managerial Personnel) Rules, 2014 is provided as Annexure III to this report.
IV. INTERNAL FINANCIAL CONTROLS AND AUDIT
Internal Financial Controls and their AdequacyThe Board of your Company has laid down internal financial controls to be followed by the Company and that such internal financial controls are adequate and operating effectively. Your Company has adopted policies and procedures for ensuring the orderly and efficient conduct of its business, including adherence to the Company’s policies, the safeguarding of its assets, the prevention and detection of frauds and errors, the accuracy and completeness of the accounting records, and the timely preparation of reliable financial disclosures.
Statutory AuditAt the 71st AGM held on July 19, 2017, Deloitte Haskins & Sells LLP, Chartered Accountants (Registration No. 117366W/W- 100018) was appointed as statutory auditors of the Company for a term of 5 years from the financial year 2017-18 onwards. Accordingly, Deloitte Haskins & Sells LLP will continue as statutory auditors of the Company till the financial year 2021-22.
There are no qualifications, reservations or adverse remarks made by Deloitte Haskins & Sells LLP, Statutory Auditors, in their report for the financial year ended March 31, 2021.
Pursuant to provisions of the Section 143(12) of the Companies Act, 2013, neither the Statutory Auditors nor the Secretarial Auditor has reported any incident of fraud to the Audit, Risk and Compliance Committee during the year under review.
Secretarial Audit
Pursuant to the provisions of Section 204 of the Companies Act, 2013 and the Companies (Appointment and Remuneration of Managerial Personnel) Rules, 2014, the Company has appointed Mr. V. Sreedharan, Partner, V. Sreedharan & Associates, a firm of Company Secretaries in Practice, to conduct Secretarial Audit of the Company. The Report of the Secretarial Audit in Form MR-3 for the financial year ended March 31, 2021 is enclosed as Annexure IV to this Report. There are no qualifications, reservations or adverse remarks made by the Secretarial Auditor in his report.
V. KEY AWARDS AND RECOGNITIONSYour Company is one of the most admired and recognized companies in the IT industry. Your Company has won several awards and accolades, out of which key recognitions are given below:
1. Wipro was included in the Dow Jones Sustainability Index (DJSI) - World and Emerging Markets for the 11th time in succession.
2. Wipro has been recognized as one of the World’s Most Ethical Companies for the 10th successive year by the Ethisphere Institute.
3. Wipro has received the award for “Leadership” category in corporate governance practices for the 4th consecutive year under corporate governance scorecard developed by BSE Limited (BSE), International Finance Corporation (IFC) and IiAS.
4. Wipro was positioned as a leader in Gartner's Magic Quadrant for Data Center Outsourcing and Hybrid Infrastructure Managed Services, Asia Pacific.
5. Wipro has won the Data Estate Modernization 2020 Microsoft Partner of the Year Award.
6. Wipro was recognized as leader in Everest Group PEAK MatrixTM for Healthcare Payer Operations Service Providers 2020.
7. Wipro has won the ‘Oracle UK & Ireland Partner of the Year 2020’ award in ‘Customer Experience’ category.
8. Wipro has won the Application Innovation 2020 Microsoft Partner of the Year Award for demonstrating excellence in innovation and implementation of customer solutions based on Microsoft technology.
9. Wipro was positioned as a Leader and Star Performer in Everest Group PEAK Matrix for Open Banking IT Service Providers 2020.
10. Wipro was positioned as a Leader in Everest Group’s BFS Risk and Compliance IT Services PEAK Matrix Assessment 2020.
11. Wipro was positioned as a Leader in Gartner’s Magic Quadrant for Data Center Outsourcing and Hybrid Infrastructure Managed Services, North America.
95
Integrated Annual Report 2020-21Wipro Limited

Board’s Report
12. Wipro has been positioned as a ‘Leader’ in Gartner’s 2020 Magic Quadrant for Public Cloud Infrastructure Professional and Managed Services, Worldwide.
Further details of awards and accolades won by your Company are provided at page no. 17 of this Annual Report.
VI. SOCIAL RESPONSIBILITY AND SUSTAINABILITY
Corporate Social Responsibility
Your Company is at the forefront of Corporate Social Responsibility (CSR) and sustainability initiatives and practices. Your Company believes in making lasting impact towards creating a just, equitable, humane and sustainable society. Your Company has been involved with social initiatives for more than a decade and half and engages in various activities in the field of education, healthcare and communities, ecology and environment, etc.
As per the provisions of the Companies Act, 2013, a company meeting the specified criteria shall spend at least 2% of its average net profits for three immediately preceding financial years towards CSR activities. Accordingly, your Company spent ` 2,512 million towards CSR activities during the financial year 2020-21.
In April 2020, your Company committed ` 1,000 million towards tackling the unprecedented health and humanitarian crisis arising from the COVID-19 pandemic outbreak and out of that an amount of 868 million was spent. Your Company’s Covid response involved working closely with around 100 non-government organizations (NGOs) who were engaged directly on the ground in supporting affected communities. In the early stages of the pandemic (March-June), your Company’s response was focused on humanitarian relief in cities that were severely affected and where it has significant operational presence-Bengaluru, Chennai, NCR, Mumbai, Kolkata and Hyderabad. In parallel, your Company along with Azim Premji Foundation developed and implemented a strategic response to the COVID-19 healthcare challenge that extended for most of the year. The response addressed in-depth the entire spectrum of issues from awareness creation to testing, isolation and hospital care.
There were three innovative projects your Company conceptualized and executed directly. These were: (i) the preparation and distribution of nearly 3 million cooked meals to more than 2.5 lakh people from the Wipro canteens in Bengaluru, Pune and Kolkata, (ii) Converting its Pune IT facility to a fully equipped and staffed 450 bed Covid hospital. The hospital has established a solid reputation with the surrounding communities and has seen nearly 5,500 admissions till date and (iii) Designing and running a digital platform for doctors and healthcare experts to exchange and
collaborate on emerging good practices in Covid care– the Global Coalition for COVID-19 Medical Care (GCCMC). The platform has been very active with a number of webinars and interactive sessions organized on COVID-19 control and vaccination.
Along with the integrated Covid response, your Company also continued to focus and support its regular programs in Education, Urban Ecology, Primary Health Care and Disaster Response. Your Company’s partner network comprising nearly 200 committed organizations from across the country adapted very well to the changing dynamics on the ground and ensured continuity of work through a hybrid model that combined online intervention with some field work.
The contents of the CSR policy and revised format of CSR Report notified in the Companies (Corporate Social Responsibility Policy) Amendment Rules, 2021 dated January 22, 2021, is attached as Annexure V to this report. CSR policy is also available on the Company’s website at h t t p s : // w w w.w i p r o . c o m /c o n t e n t /d a m /n e x u s /e n /investor/corporate-governance/policies-and-guidelines/ethical-guidelines/12773-policy-on-corporate-social-responsibility.pdf.
The terms of reference of CSR committee, framed in accordance with Section 135 of the Companies Act, 2013, forms part of Board Governance, Nomination and Compensation Committee.
The Committee consists of three Independent Directors, Mr. William Arthur Owens, Mr. M. K. Sharma and Mrs. lreena Vittal, as its members. Mr. William Arthur Owens is the Chairman of the Committee.
Particulars Regarding Conservation of Energy and Research and Development and Technology Absorption
Details of steps taken by your Company to conserve energy through its “Sustainability” initiatives, Research and Development and Technology Absorption have been disclosed as part of the MD & A Report.
VII. DISCLOSURES
Foreign Exchange Earnings and Outgoings
During the year 2020-21, your Company’s foreign exchange earnings were ` 463,447 million and foreign exchange outgoings were 213,295 million as against 460,794 million of foreign exchange earnings and ` 229,491 million of foreign exchange outgoings for the financial year 2019-20.
Annual ReturnPursuant to Section 92(3) and Section 134(3)(a) of the Companies Act, 2013, the Company has placed a copy of the
96

Annual Return as at March 31, 2021 on its website at https://www.wipro.com/content/dam/nexus/en/investor/annual-reports/2020-2021/draft-annual-return-2020-21.pdf. By virtue of amendment to Section 92(3) of the Companies Act, 2013, the Company is not required to provide extract of Annual Return (Form MGT-9) as part of the Board’s report.
Other Disclosuresa) Your Company has not accepted any deposits from the
public and as such, no amount on account of principal or interest on public deposits was outstanding as on the date of the balance sheet.
b) Your Company has not issued shares with differential voting rights and sweat equity shares during the year under review.
c) Your Company has complied with the applicable Secretarial Standards relating to ‘Meetings of the Board of Directors’ and ‘General Meetings’ during the year.
d) Maintenance of cost records and requirement of cost Audit as prescribed under the provisions of Section 148(1) of the Companies Act, 2013 are not applicable to the business activities carried out by the Company.
e) There are no significant material orders passed by the Regulators/Courts which would impact the going concern status of the Company and its future operations.
f) Details of unclaimed dividends and equity shares transferred to the Investor Education and Protection Fund authority have been provided as part of the Corporate Governance report.
g) There are no proceedings initiated/pending against your Company under the Insolvency and Bankruptcy Code, 2016 which materially impact the business of the Company.
Acknowledgements and Appreciation
Your Directors take this opportunity to thank the customers, shareholders, suppliers, bankers, business partners/associates, financial institutions and Central and State Governments for their consistent support and encouragement to the Company. I am sure you will join our Directors in conveying our sincere appreciation to all employees of the Company and its subsidiaries and associates for their hard work and commitment. Their dedication and competence have ensured that the Company continues to be a significant and leading player in the IT Services industry.
For and on behalf of the Board of Directors,
Bengaluru Rishad A. Premji
June 9, 2021 Chairman
97
Integrated Annual Report 2020-21Wipro Limited

Ann
exur
e I
Par
ticul
ars
of c
ontr
acts
/arr
ange
men
ts m
ade
with
rel
ated
par
ties
Form
No.
AO
C-2
(Pur
suan
t to
clau
se (h
) of s
ub-s
ectio
n (3
) of S
ectio
n 13
4 of
the
Com
pani
es A
ct, 2
013
and
Rul
e 8
(2) o
f the
Com
pani
es (A
ccou
nts)
Rul
es, 2
014
)Th
is F
orm
per
tain
s to
the
disc
losu
re o
f par
ticu
lars
of c
ontr
acts
/arr
ange
men
ts e
nter
ed in
to b
y th
e C
ompa
ny w
ith
rela
ted
part
ies
refe
rred
to in
Sub
-sec
tion
(1) o
f Sec
tion
188
of t
he
Com
pani
es A
ct, 2
013
incl
udin
g ce
rtai
n ar
m’s
leng
th tr
ansa
ctio
ns u
nder
thir
d pr
ovis
o th
eret
o.
Det
ails
of c
ontr
acts
or
arra
ngem
ents
or
tran
sact
ions
not
at a
rm’s
leng
th b
asis
Ther
e w
ere
no c
ontr
acts
or
arra
ngem
ents
or
tran
sact
ions
ent
ered
into
dur
ing
the
year
end
ed M
arch
31,
202
1, w
hich
wer
e no
t at a
rm’s
leng
th b
asis
.
Det
ails
of m
ater
ial c
ontr
acts
or
arra
ngem
ents
or
tran
sact
ions
at a
rm’s
leng
th b
asis
Ther
e w
ere
no m
ater
ial c
ontr
acts
or
arra
ngem
ents
or
tran
sact
ions
ent
ered
into
dur
ing
the
year
end
ed M
arch
31,
202
1 cr
ossi
ng t
he m
ater
ialit
y th
resh
old
of 1
0% o
f th
e an
nual
co
nsol
idat
ed tu
rnov
er o
f the
Com
pany
. The
det
ails
of c
ontr
acts
or
arra
ngem
ents
or
tran
sact
ions
at a
rm’s
leng
th b
asis
for
the
year
end
ed M
arch
31,
202
1 ar
e as
follo
ws:
Nam
e of
Rel
ated
Par
tyN
atur
e of
Rel
atio
nshi
pD
urat
ion
of C
ontr
act
Sal
ient
Ter
ms*
Am
ount
(` in
Mn)
Sal
es o
f Goo
ds a
nd S
ervi
ces
Wip
ro, L
LCS
ubsi
diar
y01
-04-
05 -
Ong
oing
As
per T
rans
fer
Pri
cing
gui
delin
es 4
5,3
55
W
ipro
Gal
lagh
er S
olut
ions
, LLC
Sub
sidi
ary
01-0
4-16
- O
ngoi
ngA
s pe
r Tra
nsfe
r P
rici
ng g
uide
lines
1,4
74
Wip
ro O
pus
Ris
k S
olut
ions
LLC
(for
mer
ly k
now
n as
Wip
ro
Opu
s M
ortg
age
Sol
utio
ns L
LC/O
pus
Cap
ital
Mar
kets
C
onsu
ltan
ts, L
LC)
Sub
sidi
ary
01-0
4-16
- O
ngoi
ngA
s pe
r Tra
nsfe
r P
rici
ng g
uide
lines
137
Wip
ro T
echn
olog
ies
SA
DE
CV
Sub
sidi
ary
01-0
1-12
- O
ngoi
ngA
s pe
r Tra
nsfe
r P
rici
ng g
uide
lines
570
W
ipro
Tec
hnol
ogie
s S
.A.
Sub
sidi
ary
01-0
4-09
- O
ngoi
ngA
s pe
r Tra
nsfe
r P
rici
ng g
uide
lines
3
Wip
ro In
form
atio
n Te
chno
logy
Net
herl
ands
BV
Sub
sidi
ary
01-0
6-08
- O
ngoi
ngA
s pe
r Tra
nsfe
r P
rici
ng g
uide
lines
42
5
Wip
ro P
ortu
gal S
.A.
Sub
sidi
ary
01-0
4-07
- O
ngoi
ngA
s pe
r Tra
nsfe
r P
rici
ng g
uide
lines
8
Wip
ro d
o B
rasi
l Tec
hnol
ogia
Ltd
aS
ubsi
diar
y01
-04-
05 -
Ong
oing
As
per T
rans
fer
Pri
cing
gui
delin
es 1
32
Wip
ro T
echn
olog
ies
Gm
bHS
ubsi
diar
y01
-03-
11-
Ong
oing
As
per T
rans
fer
Pri
cing
gui
delin
es 1
,933
W
ipro
Tec
hnol
ogy
Chi
le S
PAS
ubsi
diar
y01
-01-
16 -
Ong
oing
As
per T
rans
fer
Pri
cing
gui
delin
es 6
W
ipro
Out
sour
cing
Ser
vice
s (Ir
elan
d) L
imit
edS
ubsi
diar
y12
-11-
12 -
Ong
oing
As
per T
rans
fer
Pri
cing
gui
delin
es 1
5
Wip
ro In
form
atio
n Te
chno
logy
Kaz
akhs
tan
LLP
Sub
sidi
ary
15-0
5-14
- O
ngoi
ngA
s pe
r Tra
nsfe
r P
rici
ng g
uide
lines
24
Wip
ro (T
haila
nd) C
o. L
imit
edS
ubsi
diar
y01
-11-
10 -
Ong
oing
As
per T
rans
fer
Pri
cing
gui
delin
es 9
5
PT.
WT
Indo
nesi
aS
ubsi
diar
y01
-11-
12 -
Ong
oing
As
per T
rans
fer
Pri
cing
gui
delin
es 2
91
Wip
ro IT
Ser
vice
s P
olan
d S
P Z
.O.O
.S
ubsi
diar
y01
-04-
14 -
Ong
oing
As
per T
rans
fer
Pri
cing
gui
delin
es 2
20
W
ipro
Tec
hnol
ogie
s S
outh
Afr
ica
(Pro
prie
tary
) Lim
ited
Sub
sidi
ary
01-0
4-12
- O
ngoi
ngA
s pe
r Tra
nsfe
r P
rici
ng g
uide
lines
50
1 W
ipro
Tec
hnol
ogie
s N
iger
ia L
imit
edS
ubsi
diar
y01
-04-
14 -
Ong
oing
As
per T
rans
fer
Pri
cing
gui
delin
es 2
72
Wip
ro S
hang
hai L
imit
edS
ubsi
diar
y27
-04-
04 -
Ong
oing
As
per T
rans
fer
Pri
cing
gui
delin
es 0
.18
Wip
ro T
echn
olog
ies
Aus
tral
ia P
ty L
td.
Sub
sidi
ary
01-0
8-12
- O
ngoi
ngA
s pe
r Tra
nsfe
r P
rici
ng g
uide
lines
736
W
ipro
Pro
max
Ana
lyti
cs S
olut
ions
Am
eric
as L
LCS
ubsi
diar
y01
-04-
16 -
Ong
oing
As
per T
rans
fer
Pri
cing
gui
delin
es 8
W
ipro
Che
ngdu
Lim
ited
Sub
sidi
ary
01-0
4-09
- O
ngoi
ngA
s pe
r Tra
nsfe
r P
rici
ng g
uide
lines
59
W
ipro
Net
wor
ks P
te L
imit
edS
ubsi
diar
y01
-04-
16 -
Ong
oing
As
per T
rans
fer
Pri
cing
gui
delin
es 1
,70
3 W
ipro
Tec
hnol
ogie
s S
DN
BH
DS
ubsi
diar
y01
-04-
13 -
Ong
oing
As
per T
rans
fer
Pri
cing
gui
delin
es 3
W
ipro
Sol
utio
ns C
anad
a Li
mit
edS
ubsi
diar
y16
-08-
14 -
Ong
oing
As
per T
rans
fer
Pri
cing
gui
delin
es 2
,78
5
Des
igni
t Col
ombi
a S
A S
Sub
sidi
ary
01-0
4-18
- O
ngoi
ngA
s pe
r Tra
nsfe
r P
rici
ng g
uide
lines
8
98

Nam
e of
Rel
ated
Par
tyN
atur
e of
Rel
atio
nshi
pD
urat
ion
of C
ontr
act
Sal
ient
Ter
ms*
Am
ount
(` in
Mn)
Hea
lthP
lan
Ser
vice
s, In
c.S
ubsi
diar
y01
-06-
16 -
Ong
oing
As
per T
rans
fer
Pri
cing
gui
delin
es 6
57
Wip
ro A
ppir
io, I
nc. (
form
erly
kno
wn
as A
ppir
io, I
nc.)
Sub
sidi
ary
01-0
1-17
- O
ngoi
ngA
s pe
r Tra
nsfe
r P
rici
ng g
uide
lines
50
7 W
ipro
Hol
ding
s (U
K) L
imit
edS
ubsi
diar
y01
-04-
10 -
Ong
oing
As
per T
rans
fer
Pri
cing
gui
delin
es 1
,078
W
ipro
Ara
bia
Co.
Lim
ited
Sub
sidi
ary
23-1
2-06
- O
ngoi
ngA
s pe
r Tra
nsfe
r P
rici
ng g
uide
lines
1,7
15
Wip
ro D
oha
LLC
Sub
sidi
ary
01-0
4-14
- O
ngoi
ngA
s pe
r Tra
nsfe
r P
rici
ng g
uide
lines
38
9
Wip
ro G
ulf L
LCS
ubsi
diar
y01
-04-
17 -
Ong
oing
As
per T
rans
fer
Pri
cing
gui
delin
es 3
14
Wip
ro B
ahra
in L
imit
ed C
O. W
.L.L
.S
ubsi
diar
y01
-01-
15 -
Ong
oing
As
per T
rans
fer
Pri
cing
gui
delin
es 1
57
Wip
ro IT
Ser
vice
s B
angl
ades
h Li
mit
edS
ubsi
diar
y31
-03-
18 -
Ong
oing
As
per T
rans
fer
Pri
cing
gui
delin
es 5
87
Wip
ro J
apan
KK
Sub
sidi
ary
01-0
4-19
- O
ngoi
ngA
s pe
r Tra
nsfe
r P
rici
ng g
uide
lines
1,13
2
Des
igni
t Spa
in D
igit
al, S
.L.
Sub
sidi
ary
01-1
0-19
- O
ngoi
ngA
s pe
r Tra
nsfe
r P
rici
ng g
uide
lines
17
Wip
ro A
ppir
io (I
rela
nd) L
imit
ed (f
orm
erly
kno
wn
as
App
irio
Ltd
)S
ubsi
diar
y01
-01-
18 -
Ong
oing
As
per T
rans
fer
Pri
cing
gui
delin
es 4
7
Wip
ro A
ppir
io U
K L
imit
ed (f
orm
erly
kno
wn
as A
ppri
o Lt
d)S
ubsi
diar
y01
-01-
17 -
Ong
oing
As
per T
rans
fer
Pri
cing
gui
delin
es 6
In
tern
atio
nal T
echn
egro
up In
c.S
ubsi
diar
y01
-10-
19 -
Ong
oing
As
per T
rans
fer
Pri
cing
gui
delin
es 1
70
Info
cros
sing
, LLC
Sub
sidi
ary
01-0
4-20
- O
ngoi
ngA
s pe
r Tra
nsfe
r P
rici
ng g
uide
lines
28
1 W
ipro
Tec
hnol
ogie
s Li
mit
edS
ubsi
diar
y01
-05-
08 -
Ong
oing
As
per T
rans
fer
Pri
cing
gui
delin
es 2
1 W
ipro
Tec
hnol
ogie
s P
eru
S.A
.CS
ubsi
diar
y01
-01-
16 -
Ong
oing
As
per T
rans
fer
Pri
cing
gui
delin
es 1
4 D
esig
nit D
enm
ark
A/S
Sub
sidi
ary
01-0
4-20
- O
ngoi
ngA
s pe
r Tra
nsfe
r P
rici
ng g
uide
lines
1
Des
igni
t Tok
yo L
td.
Sub
sidi
ary
01-0
4-20
- O
ngoi
ngA
s pe
r Tra
nsfe
r P
rici
ng g
uide
lines
2
Des
igni
t Osl
o A
/SS
ubsi
diar
y01
-04-
20 -
Ong
oing
As
per T
rans
fer
Pri
cing
gui
delin
es 2
W
ipro
IT S
ervi
ces
Aus
tria
Gm
bH
(for
mer
ly k
now
n as
Cel
lent
Gm
bH)
Sub
sidi
ary
01-1
1-18
- O
ngoi
ngA
s pe
r Tra
nsfe
r P
rici
ng g
uide
lines
30
Des
igni
t Nor
th A
mer
ica,
Inc.
(f
orm
erly
kno
wn
as C
oope
r S
oftw
are
Inc.
)S
ubsi
diar
y01
-04-
20 -
Ong
oing
As
per T
rans
fer
Pri
cing
gui
delin
es 2
1
Inte
rnat
iona
l Tec
hneG
roup
Ltd
.S
ubsi
diar
y01
-04-
20 -
Ong
oing
As
per T
rans
fer
Pri
cing
gui
delin
es 2
4 W
ipro
Ent
erpr
ises
Pri
vate
Lim
ited
Ent
ity
cont
rolle
d by
P
rom
oter
s01
-04-
14 -
Ong
oing
As
per
Rel
ated
Par
ty T
rans
acti
on
Pol
icy
guid
elin
es 5
7
Wip
ro G
E H
ealt
hcar
e P
riva
te L
imit
edJo
int V
entu
re b
etw
een
Wip
ro E
nter
pris
es
Pri
vate
Lim
ited
and
G
ener
al E
lect
ric
Ong
oing
As
per
Rel
ated
Par
ty T
rans
acti
on
Pol
icy
guid
elin
es 7
Asi
an P
aint
s Li
mit
edC
omm
on D
irec
tors
Ong
oing
As
per
Rel
ated
Par
ty T
rans
acti
on
Pol
icy
guid
elin
es 2
2
Tita
n C
ompa
ny L
imit
edC
omm
on D
irec
tors
Ong
oing
As
per
Rel
ated
Par
ty T
rans
acti
on
Pol
icy
guid
elin
es 3
Veda
nta
Lim
ited
Com
mon
Dir
ecto
rsO
ngoi
ngA
s pe
r R
elat
ed P
arty
Tra
nsac
tion
P
olic
y gu
idel
ines
416
Sta
ndar
d C
hart
ered
Ban
k C
omm
on D
irec
tors
Ong
oing
As
per
Rel
ated
Par
ty T
rans
acti
on
Pol
icy
guid
elin
es 3
7
Pur
chas
e of
Ser
vice
sW
ipro
, LLC
Sub
sidi
ary
01-0
4-05
- O
ngoi
ngA
s pe
r Tra
nsfe
r P
rici
ng g
uide
lines
2,6
99
In
focr
ossi
ng, L
LCS
ubsi
diar
y01
-04-
08 -
Ong
oing
As
per T
rans
fer
Pri
cing
gui
delin
es 1
6
99
Integrated Annual Report 2020-21Wipro Limited
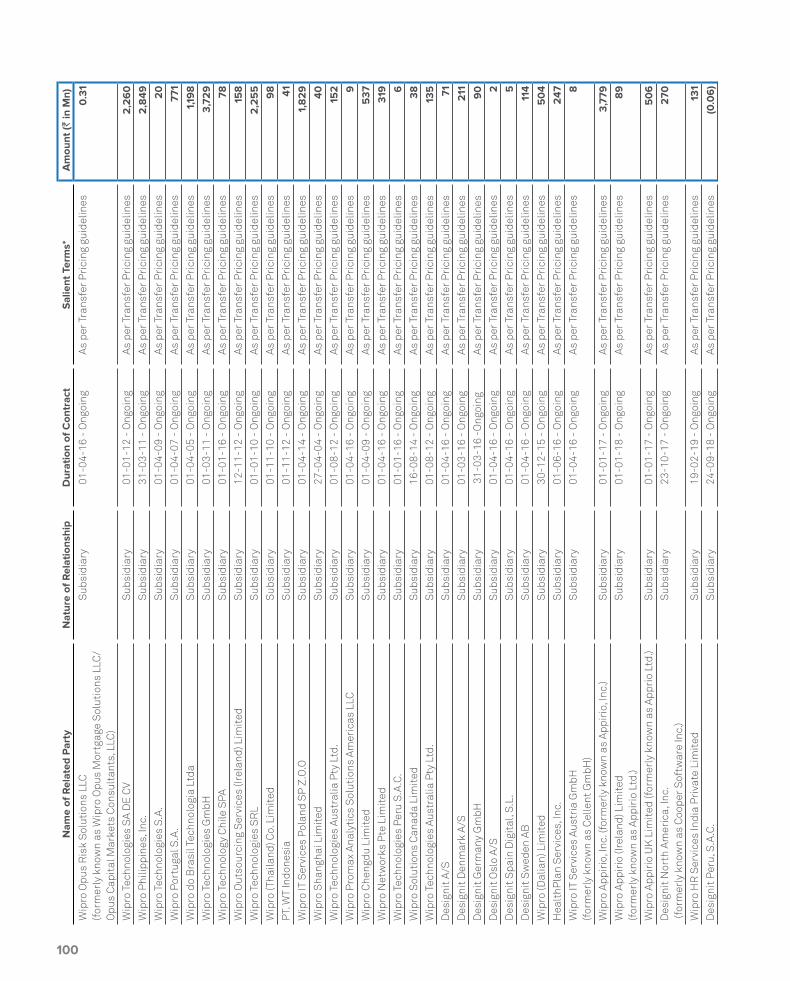
Nam
e of
Rel
ated
Par
tyN
atur
e of
Rel
atio
nshi
pD
urat
ion
of C
ontr
act
Sal
ient
Ter
ms*
Am
ount
(` in
Mn)
Wip
ro O
pus
Ris
k S
olut
ions
LLC
(f
orm
erly
kno
wn
as W
ipro
Opu
s M
ortg
age
Sol
utio
ns L
LC/
Opu
s C
apit
al M
arke
ts C
onsu
ltan
ts, L
LC)
Sub
sidi
ary
01-0
4-16
- O
ngoi
ngA
s pe
r Tra
nsfe
r P
rici
ng g
uide
lines
0.3
1
Wip
ro T
echn
olog
ies
SA
DE
CV
Sub
sidi
ary
01-0
1-12
- O
ngoi
ngA
s pe
r Tra
nsfe
r P
rici
ng g
uide
lines
2,2
60
W
ipro
Phi
lippi
nes,
Inc.
S
ubsi
diar
y31
-03-
11 -
Ong
oing
As
per T
rans
fer
Pri
cing
gui
delin
es 2
,849
W
ipro
Tec
hnol
ogie
s S
.A.
Sub
sidi
ary
01-0
4-09
- O
ngoi
ngA
s pe
r Tra
nsfe
r P
rici
ng g
uide
lines
20
W
ipro
Por
tuga
l S.A
.S
ubsi
diar
y01
-04-
07 -
Ong
oing
As
per T
rans
fer
Pri
cing
gui
delin
es 7
71
Wip
ro d
o B
rasi
l Tec
hnol
ogia
Ltd
aS
ubsi
diar
y01
-04-
05 -
Ong
oing
As
per T
rans
fer
Pri
cing
gui
delin
es 1
,198
W
ipro
Tec
hnol
ogie
s G
mbH
Sub
sidi
ary
01-0
3-11
- O
ngoi
ngA
s pe
r Tra
nsfe
r P
rici
ng g
uide
lines
3,7
29
W
ipro
Tec
hnol
ogy
Chi
le S
PAS
ubsi
diar
y01
-01-
16 -
Ong
oing
As
per T
rans
fer
Pri
cing
gui
delin
es 7
8
Wip
ro O
utso
urci
ng S
ervi
ces
(Irel
and)
Lim
ited
Sub
sidi
ary
12-1
1-12
- O
ngoi
ngA
s pe
r Tra
nsfe
r P
rici
ng g
uide
lines
15
8
Wip
ro T
echn
olog
ies
SR
LS
ubsi
diar
y01
-01-
10 -
Ong
oing
As
per T
rans
fer
Pri
cing
gui
delin
es 2
,25
5
Wip
ro (T
haila
nd) C
o. L
imit
edS
ubsi
diar
y01
-11-
10 -
Ong
oing
As
per T
rans
fer
Pri
cing
gui
delin
es 9
8
PT.
WT
Indo
nesi
aS
ubsi
diar
y01
-11-
12 -
Ong
oing
As
per T
rans
fer
Pri
cing
gui
delin
es 4
1 W
ipro
IT S
ervi
ces
Pol
and
SP
Z.O
.OS
ubsi
diar
y01
-04-
14 -
Ong
oing
As
per T
rans
fer
Pri
cing
gui
delin
es 1
,82
9
Wip
ro S
hang
hai L
imit
edS
ubsi
diar
y27
-04-
04 -
Ong
oing
As
per T
rans
fer
Pri
cing
gui
delin
es 4
0
Wip
ro T
echn
olog
ies
Aus
tral
ia P
ty L
td.
Sub
sidi
ary
01-0
8-12
- O
ngoi
ngA
s pe
r Tra
nsfe
r P
rici
ng g
uide
lines
15
2
Wip
ro P
rom
ax A
naly
tics
Sol
utio
ns A
mer
icas
LLC
Sub
sidi
ary
01-0
4-16
- O
ngoi
ngA
s pe
r Tra
nsfe
r P
rici
ng g
uide
lines
9
Wip
ro C
heng
du L
imit
edS
ubsi
diar
y01
-04-
09 -
Ong
oing
As
per T
rans
fer
Pri
cing
gui
delin
es 5
37
Wip
ro N
etw
orks
Pte
Lim
ited
Sub
sidi
ary
01-0
4-16
- O
ngoi
ngA
s pe
r Tra
nsfe
r P
rici
ng g
uide
lines
319
W
ipro
Tec
hnol
ogie
s P
eru
S.A
.C.
Sub
sidi
ary
01-0
1-16
- O
ngoi
ngA
s pe
r Tra
nsfe
r P
rici
ng g
uide
lines
6
Wip
ro S
olut
ions
Can
ada
Lim
ited
Sub
sidi
ary
16-0
8-14
- O
ngoi
ngA
s pe
r Tra
nsfe
r P
rici
ng g
uide
lines
38
W
ipro
Tec
hnol
ogie
s A
ustr
alia
Pty
Ltd
.S
ubsi
diar
y01
-08-
12 -
Ong
oing
As
per T
rans
fer
Pri
cing
gui
delin
es 1
35
Des
igni
t A/S
Sub
sidi
ary
01-0
4-16
- O
ngoi
ngA
s pe
r Tra
nsfe
r P
rici
ng g
uide
lines
71
Des
igni
t Den
mar
k A
/SS
ubsi
diar
y01
-03-
16 -
Ong
oing
As
per T
rans
fer
Pri
cing
gui
delin
es 2
11
Des
igni
t Ger
man
y G
mbH
Sub
sidi
ary
31-0
3-16
-O
ngoi
ngA
s pe
r Tra
nsfe
r P
rici
ng g
uide
lines
90
D
esig
nit O
slo
A/S
Sub
sidi
ary
01-0
4-16
- O
ngoi
ngA
s pe
r Tra
nsfe
r P
rici
ng g
uide
lines
2
Des
igni
t Spa
in D
igit
al, S
.L.
Sub
sidi
ary
01-0
4-16
- O
ngoi
ngA
s pe
r Tra
nsfe
r P
rici
ng g
uide
lines
5
Des
igni
t Sw
eden
AB
Sub
sidi
ary
01-0
4-16
- O
ngoi
ngA
s pe
r Tra
nsfe
r P
rici
ng g
uide
lines
114
W
ipro
(Dal
ian)
Lim
ited
Sub
sidi
ary
30-1
2-15
- O
ngoi
ngA
s pe
r Tra
nsfe
r P
rici
ng g
uide
lines
50
4 H
ealt
hPla
n S
ervi
ces,
Inc.
Sub
sidi
ary
01-0
6-16
- O
ngoi
ngA
s pe
r Tra
nsfe
r P
rici
ng g
uide
lines
247
W
ipro
IT S
ervi
ces
Aus
tria
Gm
bH
(for
mer
ly k
now
n as
Cel
lent
Gm
bH)
Sub
sidi
ary
01-0
4-16
- O
ngoi
ngA
s pe
r Tra
nsfe
r P
rici
ng g
uide
lines
8
Wip
ro A
ppir
io, I
nc. (
form
erly
kno
wn
as A
ppir
io, I
nc.)
Sub
sidi
ary
01-0
1-17
- O
ngoi
ngA
s pe
r Tra
nsfe
r P
rici
ng g
uide
lines
3,7
79
Wip
ro A
ppir
io (I
rela
nd) L
imit
ed
(for
mer
ly k
now
n as
App
irio
Ltd
.)S
ubsi
diar
y01
-01-
18 -
Ong
oing
As
per T
rans
fer
Pri
cing
gui
delin
es 8
9
Wip
ro A
ppir
io U
K L
imit
ed (f
orm
erly
kno
wn
as A
ppri
o Lt
d.)
Sub
sidi
ary
01-0
1-17
- O
ngoi
ngA
s pe
r Tra
nsfe
r P
rici
ng g
uide
lines
50
6
Des
igni
t Nor
th A
mer
ica,
Inc.
(f
orm
erly
kno
wn
as C
oope
r S
oftw
are
Inc.
)S
ubsi
diar
y23
-10-
17 -
Ong
oing
As
per T
rans
fer
Pri
cing
gui
delin
es 2
70
Wip
ro H
R S
ervi
ces
Indi
a P
riva
te L
imit
edS
ubsi
diar
y19
-02-
19 -
Ong
oing
As
per T
rans
fer
Pri
cing
gui
delin
es 1
31
Des
igni
t Per
u, S
.A.C
.S
ubsi
diar
y24
-09-
18 -
Ong
oing
As
per T
rans
fer
Pri
cing
gui
delin
es (0
.06
)
100

Nam
e of
Rel
ated
Par
tyN
atur
e of
Rel
atio
nshi
pD
urat
ion
of C
ontr
act
Sal
ient
Ter
ms*
Am
ount
(` in
Mn)
Wip
ro D
esig
nit S
ervi
ces
Inc.
(f
orm
erly
kno
wn
as R
atio
nal I
nter
acti
on In
c.)
Sub
sidi
ary
01-0
4-20
- O
ngoi
ngA
s pe
r Tra
nsfe
r P
rici
ng g
uide
lines
64
Wip
ro 4
C N
V (f
orm
erly
kno
wn
as 4
C N
V)S
ubsi
diar
y11
-08-
20 -
Ong
oing
As
per T
rans
fer
Pri
cing
gui
delin
es 6
W
ipro
Wea
re4C
UK
Lim
ited
(f
orm
erly
kno
wn
as W
eare
4C U
K L
imit
ed)
Sub
sidi
ary
11-0
8-20
- O
ngoi
ngA
s pe
r Tra
nsfe
r P
rici
ng g
uide
lines
30
Clo
udso
cius
DM
CC
Sub
sidi
ary
11-0
8-20
- O
ngoi
ngA
s pe
r Tra
nsfe
r P
rici
ng g
uide
lines
8
Wip
ro V
LSI D
esig
n S
ervi
ces,
LLC
(f
orm
erly
kno
wn
as E
xim
ius
Des
ign,
LLC
)S
ubsi
diar
y25
-02-
21 -
Ong
oing
As
per T
rans
fer
Pri
cing
gui
delin
es 2
5
Wip
ro T
echn
olog
ies
Lim
ited
Sub
sidi
ary
01-0
5-08
- O
ngoi
ngA
s pe
r Tra
nsfe
r P
rici
ng g
uide
lines
17
Wip
ro J
apan
KK
Sub
sidi
ary
01-0
4-19
- O
ngoi
ngA
s pe
r Tra
nsfe
r P
rici
ng g
uide
lines
0.2
7 W
ipro
Tec
hnol
ogie
s S
DN
BH
DS
ubsi
diar
y01
-04-
20 -
Ong
oing
As
per T
rans
fer
Pri
cing
gui
delin
es 1
W
ipro
IT S
ervi
ces
Ban
glad
esh
Lim
ited
Sub
sidi
ary
01-0
4-20
- O
ngoi
ngA
s pe
r Tra
nsfe
r P
rici
ng g
uide
lines
0.12
In
tern
atio
nal T
echn
egro
up In
c.S
ubsi
diar
y01
-10-
19-
Ong
oing
As
per T
rans
fer
Pri
cing
gui
delin
es 3
8
Den
im G
roup
Lim
ited
Ass
ocia
te01
-03-
18 -
Ong
oing
As
per
RP
T P
olic
y gu
idel
ines
21
Dri
vest
ream
, Inc
.A
ssoc
iate
12-0
6-17
- O
ngoi
ngA
s pe
r R
PT
Pol
icy
guid
elin
es 2
1 W
ipro
Ent
erpr
ises
Pri
vate
Lim
ited
Ent
ity
cont
rolle
d by
P
rom
oter
s01
-04-
14 -
Ong
oing
As
per
RP
T P
olic
y gu
idel
ines
419
Wip
ro G
E H
ealt
hcar
e P
riva
te L
imit
edJo
int V
entu
re b
etw
een
Wip
ro E
nter
pris
es
Pri
vate
Lim
ited
and
G
ener
al E
lect
ric
Ong
oing
As
per
RP
T P
olic
y gu
idel
ines
4
Com
mis
sion
Pai
dW
ipro
Tec
hnol
ogie
s G
mbH
Sub
sidi
ary
01-0
3-11
- O
ngoi
ngA
s pe
r Tra
nsfe
r P
rici
ng g
uide
lines
79
0
Wip
ro T
rave
l Ser
vice
s Li
mit
edS
ubsi
diar
y01
-02-
03 -
Ong
oing
As
per T
rans
fer
Pri
cing
gui
delin
es 2
1 W
ipro
Jap
an K
KS
ubsi
diar
y26
-03-
01-
Ong
oing
As
per T
rans
fer
Pri
cing
gui
delin
es 6
78
Ren
t Pai
dA
zim
Has
ham
Pre
mji
Pro
mot
erO
ngoi
ngA
s pe
r A
gree
men
t 7
W
ipro
Hol
ding
s (U
K) L
imit
edS
ubsi
diar
yO
ngoi
ngA
s pe
r A
gree
men
t 5
7 W
ipro
, LLC
Sub
sidi
ary
Ong
oing
As
per
Agr
eem
ent
41
Des
igni
t Spa
in D
igit
al, S
.LS
ubsi
diar
yO
ngoi
ngA
s pe
r A
gree
men
t 4
W
ipro
Jap
an K
KS
ubsi
diar
yO
ngoi
ngA
s pe
r A
gree
men
t 2
4 D
esig
nit O
slo
A/S
Sub
sidi
ary
Ong
oing
As
per
Agr
eem
ent
1
Des
igni
t A/S
Sub
sidi
ary
Ong
oing
As
per
Agr
eem
ent
4
Wip
ro T
echn
olog
ies
Aus
tral
ia P
ty L
td.
Sub
sidi
ary
Ong
oing
As
per
Agr
eem
ent
32
W
ipro
Ent
erpr
ises
Pri
vate
Lim
ited
Ent
ity
cont
rolle
d by
P
rom
oter
sO
ngoi
ngA
s pe
r A
gree
men
t 2
Cor
pora
te G
uara
ntee
Com
mis
sion
Wip
ro, L
LCS
ubsi
diar
y01
-04-
14 -
Ong
oing
As
per T
rans
fer
Pri
cing
gui
delin
es 9
6
Wip
ro T
echn
olog
ies
Gm
bHS
ubsi
diar
y16
-06-
17 -
Ong
oing
As
per T
rans
fer
Pri
cing
gui
delin
es 9
W
ipro
IT S
ervi
ces
Pol
and
SP
Z.O
.OS
ubsi
diar
y01
-12-
15 -
Ong
oing
As
per T
rans
fer
Pri
cing
gui
delin
es 0
.28
W
ipro
Sol
utio
ns C
anad
a Li
mit
edS
ubsi
diar
y01
-09-
15 -
Ong
oing
As
per T
rans
fer
Pri
cing
gui
delin
es 4
3
101
Integrated Annual Report 2020-21Wipro Limited

Nam
e of
Rel
ated
Par
tyN
atur
e of
Rel
atio
nshi
pD
urat
ion
of C
ontr
act
Sal
ient
Ter
ms*
Am
ount
(` in
Mn)
Wip
ro T
echn
olog
ies
Aus
tral
ia P
ty L
td.
Sub
sidi
ary
01-0
8-12
- O
ngoi
ngA
s pe
r Tra
nsfe
r P
rici
ng g
uide
lines
7
Wip
ro H
oldi
ngs
(UK
) Lim
ited
Sub
sidi
ary
20-0
6-17
- O
ngoi
ngA
s pe
r Tra
nsfe
r P
rici
ng g
uide
lines
1
Wip
ro A
rabi
a C
o. L
imit
edS
ubsi
diar
y01
-04-
14-
Ong
oing
As
per T
rans
fer
Pri
cing
gui
delin
es 8
Ren
tal I
ncom
eW
ipro
Gal
lagh
er S
olut
ions
, LLC
Sub
sidi
ary
01-0
1-16
- O
ngoi
ngA
s pe
r A
gree
men
t 2
W
ipro
Tra
vel S
ervi
ces
Lim
ited
Sub
sidi
ary
21-1
2-15
- O
ngoi
ngA
s pe
r A
gree
men
t 3
D
esig
nit D
enm
ark
A/S
Sub
sidi
ary
01-0
3-16
- O
ngoi
ngA
s pe
r A
gree
men
t 2
9
Wip
ro L
LCS
ubsi
diar
yO
ngoi
ngA
s pe
r A
gree
men
t 1
82
D
esig
nit A
/SS
ubsi
diar
y15
-10-
19 -
Ong
oing
As
per
Agr
eem
ent
4
Wip
ro H
R S
ervi
ces
Indi
a P
riva
te L
imit
edS
ubsi
diar
y01
-09-
20 -
Ong
oing
As
per
Agr
eem
ent
0.2
6
Wip
ro T
echn
olog
ies
Aus
tral
ia P
ty L
td.
Sub
sidi
ary
28-0
1-21
- O
ngoi
ngA
s pe
r A
gree
men
t 2
W
ipro
Ent
erpr
ises
Pri
vate
Lim
ited
Ent
ity
cont
rolle
d by
P
rom
oter
s01
-04-
14 -
Ong
oing
As
per
Agr
eem
ent
44
Azi
m P
rem
ji Fo
unda
tion
Ent
ity
cont
rolle
d by
P
rom
oter
sO
ngoi
ngA
s pe
r A
gree
men
t 6
Man
agem
ent S
ervi
ce F
ees
Azi
m P
rem
ji Fo
unda
tion
Ent
ity
cont
rolle
d by
P
rom
oter
sO
ngoi
ngM
anag
emen
t Ser
vice
fees
2
Wip
ro E
nter
pris
es P
riva
te L
imit
edE
ntit
y co
ntro
lled
by
Pro
mot
ers
01-0
4-14
- O
ngoi
ngM
anag
emen
t Ser
vice
fees
10
7
Res
tric
ted
Stoc
k U
nit (
RS
U) C
ompe
nsat
ion
Cos
t Allo
catio
nD
esig
nit A
/SS
ubsi
diar
yO
ngoi
ngA
s pe
r A
lloca
tion
0.3
1 D
esig
nit O
slo
A/S
Sub
sidi
ary
Ong
oing
As
per
Allo
cati
on 1
D
esig
nit T
LV L
td.
Sub
sidi
ary
Ong
oing
As
per
Allo
cati
on 1
H
ealt
hPla
n S
ervi
ces,
Inc.
Sub
sidi
ary
Ong
oing
As
per
Allo
cati
on 2
In
focr
ossi
ng, L
LCS
ubsi
diar
yO
ngoi
ngA
s pe
r A
lloca
tion
0.19
In
tern
atio
nal T
echn
egro
up In
c.S
ubsi
diar
yO
ngoi
ngA
s pe
r A
lloca
tion
0.17
W
ipro
Opu
s R
isk
Sol
utio
ns L
LC
(for
mer
ly k
now
n as
Wip
ro O
pus
Mor
tgag
e S
olut
ions
LLC
/O
pus
Cap
ital
Mar
kets
Con
sult
ants
, LLC
)
Sub
sidi
ary
Ong
oing
As
per
Allo
cati
on 0
.19
Topc
oder
, LLC
Sub
sidi
ary
Ong
oing
As
per
Allo
cati
on 5
W
ipro
App
irio
, Inc
. (fo
rmer
ly k
now
n as
App
irio
, Inc
.)S
ubsi
diar
yO
ngoi
ngA
s pe
r A
lloca
tion
(0.2
7)D
esig
nit N
orth
Am
eric
a, In
c.
(for
mer
ly k
now
n as
Coo
per
Sof
twar
e In
c.)
Sub
sidi
ary
Ong
oing
As
per
Allo
cati
on 1
Wip
ro d
o B
rasi
l Ser
vico
s de
Tec
nolo
gia
S.A
.S
ubsi
diar
yO
ngoi
ngA
s pe
r A
lloca
tion
2
Wip
ro A
rabi
a C
o. L
imit
edS
ubsi
diar
yO
ngoi
ngA
s pe
r A
lloca
tion
5
Wip
ro B
ahra
in L
imit
ed C
O. W
.L.L
Sub
sidi
ary
Ong
oing
As
per
Allo
cati
on 0
.17
Wip
ro d
o B
rasi
l Tec
hnol
ogia
Ltd
aS
ubsi
diar
yO
ngoi
ngA
s pe
r A
lloca
tion
7
Wip
ro G
alla
gher
Sol
utio
ns, L
LCS
ubsi
diar
yO
ngoi
ngA
s pe
r A
lloca
tion
0.13
W
ipro
HR
Ser
vice
s In
dia
Pri
vate
Lim
ited
Sub
sidi
ary
Ong
oing
As
per
Allo
cati
on 7
W
ipro
Jap
an K
KS
ubsi
diar
yO
ngoi
ngA
s pe
r A
lloca
tion
1
102

Nam
e of
Rel
ated
Par
tyN
atur
e of
Rel
atio
nshi
pD
urat
ion
of C
ontr
act
Sal
ient
Ter
ms*
Am
ount
(` in
Mn)
Wip
ro L
LCS
ubsi
diar
yO
ngoi
ngA
s pe
r A
lloca
tion
7
Wip
ro T
echn
olog
ies
Gm
bHS
ubsi
diar
yO
ngoi
ngA
s pe
r A
lloca
tion
2
Wip
ro T
echn
olog
ies
S.A
DE
C. V
Sub
sidi
ary
Ong
oing
As
per
Allo
cati
on 2
5
Oth
er C
osts
Wip
ro E
nter
pris
es P
riva
te L
imit
edE
ntit
y co
ntro
lled
by
Pro
mot
ers
01-0
4-14
- O
ngoi
ngO
n A
ctua
l Cos
t Bas
is 3
1
Azi
m P
rem
ji Fo
unda
tion
Ent
ity
cont
rolle
d by
P
rom
oter
sO
ngoi
ngO
n A
ctua
l Cos
t Bas
is 3
Asi
an P
aint
s Li
mit
edC
omm
on D
irec
tors
Ong
oing
On
Act
ual C
ost B
asis
2
Atr
ia C
onve
rgen
ce T
echn
olog
ies
Lim
ited
Com
mon
Dir
ecto
rsO
ngoi
ngO
n A
ctua
l Cos
t Bas
is 1
B
ain
and
Com
pany
Com
mon
Dir
ecto
rsO
ngoi
ngO
n A
ctua
l Cos
t Bas
is 2
3 G
odre
j Con
sum
er P
rodu
cts
Lim
ited
Com
mon
Dir
ecto
rsO
ngoi
ngO
n A
ctua
l Cos
t Bas
is 0
.12
Indi
an S
choo
l of B
usin
ess
Com
mon
Dir
ecto
rsO
ngoi
ngO
n A
ctua
l Cos
t Bas
is 0
.03
Wip
ro G
E H
ealt
hcar
e P
riva
te L
imit
edJo
int V
entu
re b
etw
een
Wip
ro E
nter
pris
es
Pri
vate
Lim
ited
and
G
ener
al E
lect
ric
Ong
oing
On
Act
ual C
ost B
asis
8
Veda
nta
Lim
ited
Com
mon
Dir
ecto
rsO
ngoi
ngO
n A
ctua
l Cos
t Bas
is 6
Inte
rest
Inco
me
Wip
ro, L
LCS
ubsi
diar
yO
ngoi
ngA
s pe
r A
gree
men
t 1
33
Am
ount
s in
the
abov
e ta
ble
are
subj
ect t
o ro
undi
ng-o
ff a
djus
tmen
ts.
*App
ropr
iate
app
rova
ls h
ave
been
take
n fr
om th
e A
udit
Com
mit
tee
and
Boa
rd o
f Dir
ecto
rs o
f the
Com
pany
from
tim
e to
tim
e fo
r th
e re
late
d pa
rty
tran
sact
ions
as
men
tion
ed a
bove
.
Ris
had
A. P
rem
ji M
. K. S
harm
a M
. San
aulla
Kha
nC
hair
man
D
irec
tor
Com
pany
Sec
reta
ry
Thie
rry
Del
apor
te
Jatin
Pra
vinc
hand
ra D
alal
Chi
ef E
xecu
tive
Offi
cer
and
Man
agin
g D
irec
tor
Chi
ef F
inan
cial
Offi
cer
Ben
galu
ruJu
ne 9
, 202
1
103
Integrated Annual Report 2020-21Wipro Limited

ANNEXURE II
Statement of Disclosure of Remuneration under Section 197 of Companies Act, 2013 and Rule 5(1) of Companies Appointment and Remuneration of Managerial Personnel) Rules, 2014
Remuneration paid to Whole time Directors
Name of Directors Designation
% Increase/Decrease of remuneration in
2021 as compared to 2020*
Ratio of remuneration to MRE*
Ratio of remuneration to MRE and WTD*
Rishad A. Premji (1) Chairman 128.89 164.29 164.29
Thierry Delaporte (2)(3) Chief Executive Officer and Managing Director
NA 896.37 896.37
Abidali Z. Neemuchwala (4) Chief Executive Officer and Managing Director
NA 31.64 31.64
MRE – Median Remuneration of employees, WTD – Whole Time Director
* Rounded off to two decimals(1) Mr. Rishad A. Premji had foregone his variable pay and profit linked commission for the relevant period for fiscal 2020 to show solidarity
with the team in facing the situation caused by COVID-19. Accordingly, the remuneration considered for the table above does not include the same and is hence not comparable.
(2) Mr. Thierry Delaporte was appointed as the Chief Executive Officer and Managing Director of the Company with effect from July 6, 2020. The remuneration disclosed in the above table is for the period July 6, 2020 to March 31, 2021 and hence, comparable figures have not been provided.
(3) The remuneration of Chief Executive Officer and Managing Director is computed on an accrual basis. It also includes the amortization of RSUs granted to him, which vest over a period of time. This also includes RSUs that will vest based on performance parameters of the Company.
(4) Mr. Abidali Z. Neemuchwala resigned as the Chief Executive Officer and Managing Director with effect from the end of the day on June 1, 2020. The compensation disclosed for Mr. Neemuchwala is for the period April 1, 2020 to June 1, 2020. Considering the same, comparable figures have not been provided in the above table.
Remuneration paid to Other Directors
Name of Directors Designation % Increase/Decrease of remuneration in 2021 as
compared to 2020*
Ratio of remuneration to MRE*
Ratio of remuneration to MRE and WTD *
Azim H. Premji (5) Founder Chairman NA 10.80 10.80
Ireena Vittal Independent Director 7.15 15.10 15.10
M. K. Sharma Independent Director 13.24 17.00 17.00
Dr. Patrick J. Ennis Independent Director 7.15 29.71 29.71
Patrick Dupuis (6) Independent Director 42.26 29.71 29.71
William A. Owens Independent Director 10.40 41.53 41.53
Deepak M. Satwalekar (7) Independent Director NA 9.83 9.83
Arundhati Bhattacharya (7) Independent Director NA 3.37 3.37
MRE – Median Remuneration of employees, WTD – Whole Time Director
* Rounded off to two decimals(5) Mr. Azim H. Premji was appointed as Non-Executive, Non-Independent Director of the Company with effect from July 31, 2019. In support
of Wipro’s humanitarian efforts to combat COVID-19, Mr. Azim H. Premji had foregone the profit linked commission payable to him for the relevant period for fiscal 2020. Considering the same, comparable figures have not been provided in the above table.
(6) In support of Wipro’s humanitarian efforts to combat COVID-19, Mr. Patrick Dupuis, Independent Director, had foregone the commission payable to him for the quarter ended March 31, 2020.
(7) Comparable figures have not been provided as Ms. Arundhati Bhattacharya resigned as an Independent Director with effect from close of business hours on June 30, 2020 and Mr. Deepak M. Satwalekar was appointed as an Independent Director with effect from July 1, 2020.
104

Remuneration paid to other Key Managerial Personnel (KMP)
Name of KMPs Designation% Increase/Decrease of remuneration in 2021 as
compared to 2020*
Ratio of remuneration to
MRE *
Ratio of remuneration to MRE and WTD *
Jatin Pravinchandra Dalal Chief Financial Officer 67.52 103.79 103.79
M Sanaulla Khan** Company Secretary 36.80 28.16 28.16
MRE- Median Remuneration of Employees, WTD- Whole Time Director*Round off to two decimals** Remuneration includes perquisites value of Restricted Stock Units exercised during the respective years.
Notes:
1. The median remuneration of employees (MRE) excluding Whole time Directors was ` 717,900 and ` 652,000 in fiscal 2021 and fiscal 2020 respectively. The increase in MRE excluding the Whole time Director in fiscal 2021 as compared to fiscal 2020 is 10.11%.
2. The median remuneration of employees (MRE) including Whole time Directors was ` 717,900 and ` 652,000 in fiscal 2021 and fiscal 2020 respectively. The increase in MRE excluding the Whole time Director in fiscal 2021 as compared to fiscal 2020 is 10.11%.
3. The number of permanent employees on the rolls of the Company as of March 31, 2021 and March 31, 2020 was 201,665 and 182,886 respectively.
4. The aggregate remuneration of employees excluding WTD grew by 5.7% over the previous fiscal, attributed to the increase in headcount. The aggregate increase in salary for WTDs and other KMPs was 95.78% in fiscal 2021 over fiscal 2020, on account of the following:
a. For the fiscal 2021, Mr. Rishad A. Premji was paid commission as per the terms approved by the shareholders at the Annual General Meeting held in July 2019. The profit linked commission payable to him for fiscal 2020 was foregone by him to show solidarity with the team in facing the situation caused by COVID-19.
b. The compensation disclosed for Mr. Thierry Delaporte is for the period from July 6, 2020 to March 31, 2021. It includes components such as an one-time cash award, annual stock grant (1,200,000 ADS restricted stock units, comprising of 300,000 ADS restricted stock units and 900,000 ADS performance stock units and one-time grant of 300,000 ADS restricted stock units), which will vest over a period of time, among other things, as per the terms approved by the Shareholders at the Annual General Meeting held in July 2020.
c. Computation of remuneration to Mr. Jatin Pravinchandra Dalal is on an accrual basis and it includes the amortization of Restricted Stock Units (RSU), granted to him, which will vest over a period of time. This also includes RSUs that will vest based on performance parameters of the Company.
5. The Company affirms that the remuneration is paid as per the remuneration policy of the Company.
Variable Pay CompensationThe variable pay of executive officers, including the Chief Executive Officer and Managing Director, is based on clearly laid out criteria and measures, which are linked to the desired performance and business objectives of the organization. The criteria for variable pay, which is paid out quarterly/annually, includes financial parameters like revenue, profit achievement, operating margin achievement and other strategic goals as decided by the Board from time to time.
Apart from the variable pay component, long term (typically greater than one year) incentives granted to executive officers, including the Chief Executive Officer and Managing Director, includes both time-based stock units (RSUs) and performance-based stock units (PSUs).
The vesting of PSU’s is based on performance parameters of the Company over a defined performance period and is linked to pre-defined financial goals. Time-based stock units typically vest over a defined period. The vesting pattern and schedule for both these types of stock units are as determined by the Board Governance, Nomination and Compensation Committee.
105
Integrated Annual Report 2020-21Wipro Limited

Ann
exur
e III
Info
rmat
ion
as p
er R
ule
5(2
) of t
he C
ompa
nies
(App
oint
men
t and
Rem
uner
atio
n of
Man
ager
ial P
erso
nnel
) Rul
es, 2
014
A) T
op 1
0 e
mpl
oyee
s in
term
s of
sal
ary
draw
n du
ring
the
finan
cial
yea
r 2
02
0-2
1S
l N
o.N
ame
of th
e Em
ploy
eeD
ate
of J
oini
ng
(DD
-MM
-YY
YY
)G
ross
R
emun
erat
ion
(in `
)Ed
ucat
iona
l Q
ualifi
catio
nA
geEx
peri
ence
(y
rs)
Last
Em
ploy
men
tD
esig
natio
n
1Th
ierr
y D
elap
orte
#06
-07-
2020
643,
500,
805
Bac
helo
r's
Deg
ree
in
Eco
nom
y an
d Fi
nanc
e, M
aste
rs i
n La
w
5426
Cap
gem
ini
Chi
ef E
xecu
tive
Offi
cer
and
Man
agin
g D
irec
tor
2R
isha
d A
. Pre
mji
20-0
7-20
0711
7,94
6,58
2B
.A, M
BA
4422
Bai
n &
Com
pany
Exe
cuti
ve C
hair
man
3A
nand
Pad
man
abha
n02
-05-
1994
106,
824,
327
BE
5531
Alm
oaye
d D
ata
Gro
upP
resi
dent
-Str
ateg
ic S
ales
and
G
eogr
aphi
es
4Ja
tin
Pra
vinc
hand
ra D
alal
*01
-07-
2002
74,
514,
301
BE
, CA
, PG
DB
A, C
FA
(US
A),
CG
MA
(UK
), C
MA
4622
GE
Indi
aP
resi
dent
and
Chi
ef F
inan
cial
O
ffice
r
5B
hanu
mur
thy
B M
03-0
9-19
92 4
8,79
9,71
5 B
Tec
h, P
GD
M57
34C
MC
Lim
ited
Pre
side
nt a
nd C
hief
Ope
rati
ng
Offi
cer
6S
aura
bh G
ovil
11-0
5-20
09 4
5,39
5,17
8 B
.Sc.
, PG
DM
- P
M
& IR
5332
GE
Indi
aP
resi
dent
and
Chi
ef H
uman
R
esou
rces
Offi
cer
7A
yask
ant S
aran
gi
03-1
2-20
12 3
4,62
7,23
1 P
GD
BM
4623
GE
Indi
aS
enio
r Vic
e P
resi
dent
- H
uman
R
esou
rces
8D
ipak
Kum
ar B
ohra
14-0
6-20
02 3
4,34
7,38
9 B
Com
, CA
, IC
WA
I48
24A
dity
a B
irla
G
roup
Sen
ior V
ice
Pre
side
nt a
nd C
hief
of
Inte
rnal
Aud
it
9D
eepa
k A
char
ya01
-02-
2018
31,
932,
498
BS
c, L
LB, F
CS
5325
Pro
cter
& G
ambl
e S
inga
pore
Sen
ior V
ice
Pre
side
nt &
Gen
eral
C
ouns
el
10A
nuj B
halla
15-0
5-19
96 3
1,42
5,92
3 B
E, M
BA
5025
Firs
t Em
ploy
men
tS
enio
r Vic
e P
resi
dent
& G
loba
l D
eliv
ery
Hea
d
Not
es:
1.
Rem
uner
atio
n co
mpr
ises
sal
ary,
allo
wan
ces,
com
mis
sion
, per
form
ance
bas
ed p
aym
ents
, per
quis
ite
and
Com
pany
’s c
ontr
ibut
ion
to P
rovi
dent
Fun
d an
d su
per-
annu
atio
n as
pe
r defi
niti
on c
onta
ined
in S
ecti
on 2
(78)
of t
he C
ompa
nies
Act
, 201
3, p
aid
duri
ng th
e ye
ar. I
t als
o in
clud
es p
erqu
isit
es v
alue
of R
estr
icte
d S
tock
Uni
ts (R
SU
s) e
xerc
ised
, if a
ny,
by e
mpl
oyee
s.
2.
The
natu
re o
f em
ploy
men
t is
cont
ract
ual i
n al
l the
abo
ve c
ases
.3.
N
one
of t
he e
mpl
oyee
s em
ploy
ed t
hrou
ghou
t th
e fi
nanc
ial y
ear
or p
art
ther
eof,
wer
e in
rec
eipt
of
rem
uner
atio
n in
tha
t ye
ar, w
hich
in t
he a
ggre
gate
, or
as t
he c
ase
may
be
at a
rat
e w
hich
, in
the
aggr
egat
e, is
in e
xces
s of
tha
t dr
awn
by t
he M
anag
ing
Dir
ecto
r or
Who
le T
ime
Dir
ecto
r or
Man
ager
and
hol
ds b
y hi
mse
lf o
r al
ong
wit
h hi
s sp
ouse
and
de
pend
ent c
hild
ren,
not
less
than
two
perc
ent o
f the
equ
ity
shar
es o
f the
Com
pany
.4.
In
ter
ms
of p
rovi
so t
o R
ule
5 of
the
Com
pani
es (A
ppoi
ntm
ent
and
Rem
uner
atio
n of
Man
ager
ial P
erso
nnel
) Rul
es, 2
014,
par
ticu
lars
of
empl
oyee
s po
sted
and
wor
king
in a
co
untr
y ou
tsid
e In
dia,
not
bei
ng D
irec
tors
or
thei
r re
lati
ves,
hav
e no
t bee
n in
clud
ed in
the
abov
e st
atem
ent.
5.
Mr.
Ris
had
A. P
rem
ji, w
ho is
in th
e em
ploy
men
t of t
he C
ompa
ny, i
s th
e so
n of
Mr.
Azi
m H
. Pre
mji,
Fou
nder
Cha
irm
an o
f the
Com
pany
. Com
puta
tion
of r
emun
erat
ion
of M
r. R
isha
d A
. Pre
mji,
Cha
irm
an, i
nclu
des
cash
bon
us (p
art o
f his
allo
wan
ces)
on
an a
ccru
al b
asis
, whi
ch is
pay
able
ove
r a
peri
od o
f tim
e.#
Th
e co
mpe
nsat
ion
disc
lose
d is
for t
he p
erio
d Ju
ly 6
, 202
0 to
Mar
ch 3
1, 2
021.
Fig
ures
men
tion
ed in
` a
re e
quiv
alen
t of a
mou
nts
paid
in fo
reig
n cu
rren
cy, a
s m
ay b
e ap
plic
able
. It
incl
udes
com
pone
nts
such
as
an o
ne-t
ime
cash
aw
ard,
ann
ual s
tock
gra
nt (1
,200
,000
AD
S r
estr
icte
d st
ock
unit
s, c
ompr
isin
g of
300
,000
AD
S r
estr
icte
d st
ock
unit
s an
d 90
0,00
0 A
DS
per
form
ance
sto
ck u
nits
and
one
-tim
e gr
ant
of 3
00,0
00 A
DS
res
tric
ted
stoc
k un
its)
, whi
ch w
ill v
est
over
a p
erio
d of
tim
e, a
mon
g ot
her
thin
gs, a
s pe
r th
e te
rms
appr
oved
by
the
Sha
reho
lder
s at
the
Ann
ual G
ener
al M
eeti
ng h
eld
in J
uly
2020
.*
Com
puta
tion
of r
emun
erat
ion
to th
e C
hief
Exe
cuti
ve O
ffice
r an
d M
anag
ing
Dir
ecto
r, C
hief
Fin
anci
al O
ffice
r is
on
an a
ccru
al b
asis
and
incl
udes
the
amor
tiza
tion
of R
estr
icte
d S
tock
Uni
ts (R
SU
s), g
rant
ed to
them
, whi
ch w
ill v
est o
ver
a pe
riod
of t
ime.
Thi
s al
so in
clud
es R
SU
s th
at w
ill v
est b
ased
on
perf
orm
ance
par
amet
ers
of th
e C
ompa
ny.
106

Ann
exur
e III
Info
rmat
ion
as p
er R
ule
5(2
) of t
he C
ompa
nies
(App
oint
men
t and
Rem
uner
atio
n of
Man
ager
ial P
erso
nnel
) Rul
es, 2
014
A) T
op 1
0 e
mpl
oyee
s in
term
s of
sal
ary
draw
n du
ring
the
finan
cial
yea
r 2
02
0-2
1S
l N
o.N
ame
of th
e Em
ploy
eeD
ate
of J
oini
ng
(DD
-MM
-YY
YY
)G
ross
R
emun
erat
ion
(in `
)Ed
ucat
iona
l Q
ualifi
catio
nA
geEx
peri
ence
(y
rs)
Last
Em
ploy
men
tD
esig
natio
n
1Th
ierr
y D
elap
orte
#06
-07-
2020
643,
500,
805
Bac
helo
r's
Deg
ree
in
Eco
nom
y an
d Fi
nanc
e, M
aste
rs i
n La
w
5426
Cap
gem
ini
Chi
ef E
xecu
tive
Offi
cer
and
Man
agin
g D
irec
tor
2R
isha
d A
. Pre
mji
20-0
7-20
0711
7,94
6,58
2B
.A, M
BA
4422
Bai
n &
Com
pany
Exe
cuti
ve C
hair
man
3A
nand
Pad
man
abha
n02
-05-
1994
106,
824,
327
BE
5531
Alm
oaye
d D
ata
Gro
upP
resi
dent
-Str
ateg
ic S
ales
and
G
eogr
aphi
es
4Ja
tin
Pra
vinc
hand
ra D
alal
*01
-07-
2002
74,
514,
301
BE
, CA
, PG
DB
A, C
FA
(US
A),
CG
MA
(UK
), C
MA
4622
GE
Indi
aP
resi
dent
and
Chi
ef F
inan
cial
O
ffice
r
5B
hanu
mur
thy
B M
03-0
9-19
92 4
8,79
9,71
5 B
Tec
h, P
GD
M57
34C
MC
Lim
ited
Pre
side
nt a
nd C
hief
Ope
rati
ng
Offi
cer
6S
aura
bh G
ovil
11-0
5-20
09 4
5,39
5,17
8 B
.Sc.
, PG
DM
- P
M
& IR
5332
GE
Indi
aP
resi
dent
and
Chi
ef H
uman
R
esou
rces
Offi
cer
7A
yask
ant S
aran
gi
03-1
2-20
12 3
4,62
7,23
1 P
GD
BM
4623
GE
Indi
aS
enio
r Vic
e P
resi
dent
- H
uman
R
esou
rces
8D
ipak
Kum
ar B
ohra
14-0
6-20
02 3
4,34
7,38
9 B
Com
, CA
, IC
WA
I48
24A
dity
a B
irla
G
roup
Sen
ior V
ice
Pre
side
nt a
nd C
hief
of
Inte
rnal
Aud
it
9D
eepa
k A
char
ya01
-02-
2018
31,
932,
498
BS
c, L
LB, F
CS
5325
Pro
cter
& G
ambl
e S
inga
pore
Sen
ior V
ice
Pre
side
nt &
Gen
eral
C
ouns
el
10A
nuj B
halla
15-0
5-19
96 3
1,42
5,92
3 B
E, M
BA
5025
Firs
t Em
ploy
men
tS
enio
r Vic
e P
resi
dent
& G
loba
l D
eliv
ery
Hea
d
Not
es:
1.
Rem
uner
atio
n co
mpr
ises
sal
ary,
allo
wan
ces,
com
mis
sion
, per
form
ance
bas
ed p
aym
ents
, per
quis
ite
and
Com
pany
’s c
ontr
ibut
ion
to P
rovi
dent
Fun
d an
d su
per-
annu
atio
n as
pe
r defi
niti
on c
onta
ined
in S
ecti
on 2
(78)
of t
he C
ompa
nies
Act
, 201
3, p
aid
duri
ng th
e ye
ar. I
t als
o in
clud
es p
erqu
isit
es v
alue
of R
estr
icte
d S
tock
Uni
ts (R
SU
s) e
xerc
ised
, if a
ny,
by e
mpl
oyee
s.
2.
The
natu
re o
f em
ploy
men
t is
cont
ract
ual i
n al
l the
abo
ve c
ases
.3.
N
one
of t
he e
mpl
oyee
s em
ploy
ed t
hrou
ghou
t th
e fi
nanc
ial y
ear
or p
art
ther
eof,
wer
e in
rec
eipt
of
rem
uner
atio
n in
tha
t ye
ar, w
hich
in t
he a
ggre
gate
, or
as t
he c
ase
may
be
at a
rat
e w
hich
, in
the
aggr
egat
e, is
in e
xces
s of
tha
t dr
awn
by t
he M
anag
ing
Dir
ecto
r or
Who
le T
ime
Dir
ecto
r or
Man
ager
and
hol
ds b
y hi
mse
lf o
r al
ong
wit
h hi
s sp
ouse
and
de
pend
ent c
hild
ren,
not
less
than
two
perc
ent o
f the
equ
ity
shar
es o
f the
Com
pany
.4.
In
ter
ms
of p
rovi
so t
o R
ule
5 of
the
Com
pani
es (A
ppoi
ntm
ent
and
Rem
uner
atio
n of
Man
ager
ial P
erso
nnel
) Rul
es, 2
014,
par
ticu
lars
of
empl
oyee
s po
sted
and
wor
king
in a
co
untr
y ou
tsid
e In
dia,
not
bei
ng D
irec
tors
or
thei
r re
lati
ves,
hav
e no
t bee
n in
clud
ed in
the
abov
e st
atem
ent.
5.
Mr.
Ris
had
A. P
rem
ji, w
ho is
in th
e em
ploy
men
t of t
he C
ompa
ny, i
s th
e so
n of
Mr.
Azi
m H
. Pre
mji,
Fou
nder
Cha
irm
an o
f the
Com
pany
. Com
puta
tion
of r
emun
erat
ion
of M
r. R
isha
d A
. Pre
mji,
Cha
irm
an, i
nclu
des
cash
bon
us (p
art o
f his
allo
wan
ces)
on
an a
ccru
al b
asis
, whi
ch is
pay
able
ove
r a
peri
od o
f tim
e.#
Th
e co
mpe
nsat
ion
disc
lose
d is
for t
he p
erio
d Ju
ly 6
, 202
0 to
Mar
ch 3
1, 2
021.
Fig
ures
men
tion
ed in
` a
re e
quiv
alen
t of a
mou
nts
paid
in fo
reig
n cu
rren
cy, a
s m
ay b
e ap
plic
able
. It
incl
udes
com
pone
nts
such
as
an o
ne-t
ime
cash
aw
ard,
ann
ual s
tock
gra
nt (1
,200
,000
AD
S r
estr
icte
d st
ock
unit
s, c
ompr
isin
g of
300
,000
AD
S r
estr
icte
d st
ock
unit
s an
d 90
0,00
0 A
DS
per
form
ance
sto
ck u
nits
and
one
-tim
e gr
ant
of 3
00,0
00 A
DS
res
tric
ted
stoc
k un
its)
, whi
ch w
ill v
est
over
a p
erio
d of
tim
e, a
mon
g ot
her
thin
gs, a
s pe
r th
e te
rms
appr
oved
by
the
Sha
reho
lder
s at
the
Ann
ual G
ener
al M
eeti
ng h
eld
in J
uly
2020
.*
Com
puta
tion
of r
emun
erat
ion
to th
e C
hief
Exe
cuti
ve O
ffice
r an
d M
anag
ing
Dir
ecto
r, C
hief
Fin
anci
al O
ffice
r is
on
an a
ccru
al b
asis
and
incl
udes
the
amor
tiza
tion
of R
estr
icte
d S
tock
Uni
ts (R
SU
s), g
rant
ed to
them
, whi
ch w
ill v
est o
ver
a pe
riod
of t
ime.
Thi
s al
so in
clud
es R
SU
s th
at w
ill v
est b
ased
on
perf
orm
ance
par
amet
ers
of th
e C
ompa
ny.
B) E
mpl
oyee
s dr
awin
g sa
lary
of `
10
2 la
khs
or a
bove
per
ann
um a
nd p
oste
d in
Indi
a
Nam
e of
the
Em
ploy
eeD
ate
of J
oini
ng
(DD
-MM
-YY
YY
)
Gro
ss
Rem
uner
atio
n (i
n `)
E
duca
tion
al Q
ualifi
cati
onA
geE
xper
ienc
e (y
rs)
Last
Em
ploy
men
tD
esig
nati
on
Aja
y B
hask
ar08
-07-
2002
14,3
16,1
04
BE
, MB
A48
26H
indu
stan
Lev
er L
td.
Vice
Pre
side
nt-
Hea
d of
Cor
pora
te S
trat
egy
& IP
Aja
y N
ahar
24-0
6-20
1910
,330
,444
M
BA
(Int
erna
tion
al B
usin
ess
&
Fina
nce)
4219
Ern
st &
You
ng
G
ener
al M
anag
er
Am
al B
hatt
acha
rya
03-0
8-20
1013
,024
,248
C
orpo
rate
PG
DB
A, B
E56
30S
un M
icro
syst
ems
Gen
eral
Man
ager
& P
resa
les
Hea
d-In
dia
Am
it B
ajor
ia30
-10-
2000
19,5
29,7
27
CA
4320
Firs
t Em
ploy
men
tS
enio
r Vic
e P
resi
dent
Anu
rag
Set
h03
-05-
1990
15,0
84,3
70
BE
, PG
DB
M -
Info
rmat
ion
Man
agem
ent
5431
Firs
t Em
ploy
men
tVP
& H
ead-
Tal
ent T
rans
form
atio
n, T
opG
ear
& B
usin
ess
Apa
rna
Iyer
21-0
4-20
0311
,517
,721
C
A
40
18Fi
rst E
mpl
oym
ent
Vice
Pre
side
nt
Ara
vind
V S
22-0
4-20
0226
,995
,798
P
GD
BM
4119
Firs
t Em
ploy
men
tS
enio
r Vic
e P
resi
dent
Ash
ok N
agar
11-0
4-20
0513
,495
,254
P
GD
CA
5026
Tech
nova
Indi
a P
vt L
tdG
ener
al M
anag
er
Ash
ok P
hilip
ose
16-0
4-19
9610
,228
,856
B
E
51
26P
enta
four
Sof
twar
e
Vice
Pre
side
nt
Bal
asub
ram
ania
n K
17-0
4-20
0225
,767
,070
B
.Com
,CA
4119
Firs
t Em
ploy
men
tVi
ce P
resi
dent
Bha
skar
Pan
dey
01-1
0-20
1912
,542
,773
P
ost G
radu
ate
MM
S50
27Va
ra In
fote
ch L
tdG
ener
al M
anag
er &
Sec
tor
Hea
d-In
dia
PR
E
Bha
vani
Pad
man
abha
n09
-05-
2016
11,3
92,7
32
LLB
, Mas
ters
in B
usin
ess
Law
5229
SA
BM
iller
Indi
a Li
mit
ed
VP &
Dep
uty
Gen
eral
Cou
nsel
- G
loba
l Le
gal H
ead-
IP
Byo
mok
esh
Trip
athy
07-0
7-20
1413
,748
,865
M
BA
4521
GE
App
lianc
es a
nd L
ight
ing
Vi
ce P
resi
dent
Cha
ndra
She
kar
S N
06-1
1-19
9523
,992
,163
B
E
4825
Indi
an In
dust
rial
Mac
hine
sVi
ce P
resi
dent
Den
ny J
ohn
12-0
8-19
9610
,651
,819
B
E
49
30M
odi O
livet
ti L
td
Vi
ce P
resi
dent
Dev
ende
r M
alho
tra
23-0
8-20
0224
,204
,011
B
E, P
GD
4926
Sat
yam
GE
Sof
twar
eVP
& G
loba
l Del
iver
y H
ead,
CIS
Gur
mee
t Sin
gh S
ran
16-0
7-20
0916
,810
,489
M
.Sc
5126
Gen
pact
Sen
ior
Pra
ctic
e D
irec
tor
Har
i Raj
a S
06-0
1-20
2016
,234
,469
B
usin
ess
Man
agm
ent S
cien
ce44
17C
ogni
zant
Tec
hnol
ogie
s
Vice
Pre
side
nt &
Pra
ctic
e H
ead
- S
ales
Fo
rce
Har
ish
Dw
arka
nhal
li10
-12-
2019
29,9
64,4
10
BE
4624
Cog
niza
nt T
echn
olog
ies
P
resi
dent
- A
pplic
atio
ns &
Dat
a
Har
sh B
hati
a07
-11-
2002
11,9
16,6
99
B.S
C
55
33D
akS
H
Vi
ce P
resi
dent
- O
pera
tion
s
Jaya
nt P
rabh
u K
05-0
8-19
9610
,421
,231
B
E
4524
Firs
t Em
ploy
men
tVi
ce P
resi
dent
Kam
ini S
hah
18-0
1-20
1711
,113
,666
C
A51
24H
ewle
tt P
acka
rd
Vi
ce P
resi
dent
and
BFM
Hea
d- A
mer
icas
1
Key
ur M
ania
r12
-03-
2007
27,5
04,8
18
BE
, MB
A51
27C
apit
al O
ne F
inan
cial
Sen
ior V
ice
Pre
side
nt
Kir
an K
Des
ai21
-09-
1998
20,9
61,8
13
BE
, PG
Dip
lom
a55
34U
nico
rp In
dust
ries
Sen
ior V
ice
Pre
side
nt -
GIS
Kri
shna
kum
ar N
05-0
9-19
9431
,162
,918
B
.Sc
,MS
c (C
ompu
ter
Sci
ence
)53
29D
RD
OVi
ce P
resi
dent
- G
loba
l Hea
d S
ervi
ce
Tran
sfor
mat
ion
Kri
shna
n S
ubra
man
ian
13-0
4-20
1515
,021
,666
C
A
53
29C
onte
nt M
edia
Indi
a P
vt L
td
Vice
Pre
side
nt
Kum
udha
Sri
dhar
an31
-05-
1995
15,9
22,0
16
BE
5734
ITI L
tdS
enio
r Vic
e P
resi
dent
Mad
husu
dan
Nar
ayan
a M
urth
y10
-08-
2015
10,1
32,3
00
B.S
c
48
22S
apie
nt
Gen
eral
Man
ager
Man
ish
N02
-12-
2019
12,1
20,9
65
BE
5029
SA
P L
abs
Indi
a P
vt L
td
Vi
ce P
resi
dent
Man
juna
th A
V01
-05-
1995
16,4
97,8
38
BE
5129
Sta
ndar
d A
utol
ogVi
ce P
resi
dent
Man
oj M
adhu
sudh
anan
07-0
7-20
0310
,531
,299
B
E
48
26S
kand
a S
oftw
are
Fello
w -
Wip
ro D
igit
al
Mili
nd H
alap
eth
15-0
1-20
0717
,704
,471
B
E, M
BA
4827
Pub
licis
Gro
upe
Vice
Pre
side
nt
Moh
it B
Lal
16-0
3-19
9922
,314
,355
B
.Sc.
, MC
A51
27M
XSS
Del
hiVi
ce P
resi
dent
& S
ervi
ce D
eliv
ery
Hea
d
107
Integrated Annual Report 2020-21Wipro Limited

Nam
e of
the
Em
ploy
eeD
ate
of J
oini
ng
(DD
-MM
-YY
YY
)
Gro
ss
Rem
uner
atio
n (i
n `)
E
duca
tion
al Q
ualifi
cati
onA
geE
xper
ienc
e (y
rs)
Last
Em
ploy
men
tD
esig
nati
on
Mur
ali P
arth
asar
athy
01-0
8-20
1215
,415
,851
B
E52
29A
llgre
en E
cote
ch S
olut
ions
P
vt L
td
Vice
Pre
side
nt
Nan
da K
isho
re N
01-0
8-19
94 1
6,98
3,87
0 B
E, P
G D
iplo
ma
4927
Hyp
erm
edia
Info
Sys
tem
sVi
ce P
resi
dent
Nik
hil A
sopa
03-1
0-20
1615
,742
,819
M
BA
4924
Tata
Con
sult
ancy
Ser
vice
s
Vice
Pre
side
nt-
Bus
ines
s &
Ope
rati
ons
Hea
d, In
dia
Pav
an P
apal
al A
graw
al10
-10-
2012
10,8
74,3
27
BE
4926
Info
sys
Ltd
Vice
Pre
side
nt
Pra
sad
Gan
tasa
i01
-02-
2006
19,1
27,4
99
B.A
, MS
W47
26Is
oft I
ndia
Vice
Pre
side
nt &
Hea
d-H
R
Pra
senj
it L
ahir
i05
-01-
1995
20,9
92,4
68
BE
5227
TVS
Ele
ctro
nics
Vi
ce P
resi
dent
Put
ul M
athu
r24
-04-
2006
14,1
38,7
18
PG
Dip
lom
a in
Per
sonn
el
Man
agem
ent a
nd In
dust
rial
R
elat
ions
5226
Nit
tany
Out
sour
cing
S
ervi
ces
Vice
Pre
side
nt -
Hum
an R
esou
rces
Rah
ul M
ansh
aram
ani
19-1
0-20
0413
,272
,779
B
E, P
G D
iplo
ma
45
21E
iche
r M
otor
s Li
mit
edVi
ce P
resi
dent
Rah
ul S
hah
02-1
1-20
1516
,364
,398
P
GD
M50
25In
fosy
s D
igit
al
Vice
Pre
side
nt
Raj
anee
sh K
ini R
02-0
1-20
2013
,146
,525
M
aste
rs in
Sof
twar
e, P
GD
BM
4322
Alt
ran
grou
p C
ompa
ny
Vi
ce P
resi
dent
Raj
esh
Seh
gal
04-0
6-20
0111
,521
,540
B
E, M
BA
5125
Hoo
gove
ns
Vice
Pre
side
nt
Ram
acha
ndra
n P
16-1
2-19
9611
,895
,467
B
E
46
24Fi
rst E
mpl
oym
ent
Vice
Pre
side
nt
Ran
u S
ingh
05-0
8-20
1912
,292
,359
B
.SC
, MB
A (F
inan
ce)
4619
Gen
pact
Hea
lthc
are
& P
&C
H
ead-
Buy
Sid
e In
sura
nce
Pro
duct
s
Rav
i Gup
ta28
-11-
2011
10,7
60,9
61
PG
Dip
lom
a44
19G
enpa
ct
Sen
ior
Par
tner
Rey
nold
s A
lex
P A
09-0
7-20
0112
,658
,927
P
GD
BA
– S
ales
and
Mar
keti
ng49
22O
nly
plas
tics
.com
Gen
eral
Man
ager
Sai
bal B
asu
15-0
7-20
0211
,870
,832
B
.Sc
5531
Trig
ent S
oftw
are
Vice
Pre
side
nt
Sam
ir G
adgi
l09
-10-
2004
17,1
18,9
94
BE
, MP
M
4522
Ced
ar C
onsu
ltin
gVi
ce P
resi
dent
-Hum
an R
esou
rces
San
aulla
Kha
n M
oham
med
12-0
5-20
1520
,214
,162
M
.Com
, FC
S50
27IC
ICI P
rude
ntia
l Lif
e In
sura
nce
Co.
Ltd
.Vi
ce P
resi
dent
& C
ompa
ny S
ecre
tary
San
deep
Agg
arw
al11
-05-
2020
15,4
70,7
52
CA
4525
Alig
ht S
ervi
ces
Indi
a P
vt L
tdVi
ce P
resi
dent
, Fin
ance
iDE
AS
San
jay
Tars
emla
l Jai
reth
21-0
5-20
1911
,075
,982
M
BA
4722
Mph
asis
G
ener
al M
anag
er &
Sec
tor
Hea
d In
dia
SR
E
BFS
I S
anje
ev S
ingh
02-1
1-20
1828
,341
,236
B
.Tec
h, P
GD
M55
20A
egis
Lim
ited
Sen
ior V
ice
Pre
side
nt
Sat
ish
Y19
-04-
2000
12,8
77,4
29
BE
4825
Jind
al V
ijaya
naga
r S
teel
Ltd
Vice
Pre
side
nt
She
etal
Sha
rad
Meh
ta16
-09-
1994
14,5
14,9
36
BE
4827
Firs
t Em
ploy
men
tS
enio
r Vic
e P
resi
dent
S
rini
vas
Sai
N
idad
havo
lu16
-08-
2002
11,5
39,3
82
B.C
om, P
GD
M48
25A
gro
Tech
Foo
ds
Vi
ce P
resi
dent
& P
ract
ice
Hea
d -
SA
P
Sri
niva
san
G14
-04-
1999
10,3
62,0
78
BE
5130
Indc
hem
Ele
ctro
nics
Vice
Pre
side
nt
Sud
hir
Kes
avan
09-0
1-20
1712
,153
,481
B
.Tec
h
4724
Valu
e La
bsVi
ce P
resi
dent
Sum
it T
anej
a08
-05-
2006
14,6
66,1
61
BA
, PG
D43
17Ta
ta M
otor
s Lt
d
Vi
ce P
resi
dent
Sun
ita
Che
rian
04-1
1-19
9624
,707
,333
B
.Tec
h, P
GD
BA
4724
Firs
t Em
ploy
men
tS
enio
r Vic
e P
resi
dent
- H
uman
Res
ourc
es
Sur
endr
anat
h G
arim
ella
10-0
7-20
0610
,422
,116
B
.SC
, MC
A53
31M
SG
Sys
tem
sVi
ce P
resi
dent
Sya
m V
ijay
Kum
ar
Yella
prag
ada
28-0
9-19
9815
,299
,566
B
.Tec
h51
24B
hara
t Dyn
amic
s Lt
dG
ener
al M
anag
er &
Pra
ctic
e H
ead
IDP
T V
Sri
ram
30-0
9-20
1914
,275
,356
P
GD
, BE
5129
Juni
per
Net
wor
ks S
olut
ion
Indi
a P
riva
te L
imit
ed
Vice
Pre
side
nt
Venk
atar
aman
M
ahad
evan
10-0
8-20
0416
,005
,770
B
.Sc.
, Adv
ance
Dip
lom
a in
SM
GT
5016
NIIT
Lim
ited
Vice
Pre
side
nt
Vija
yala
kshm
i R
amat
chan
dira
ne15
-07-
2016
10,5
56,9
81
ME
4925
Tata
Con
sult
ancy
Ser
vice
s Li
mit
ed
Vice
Pre
side
nt
Vija
yasi
mha
Alil
ugha
tta
28-0
2-20
1425
,106
,689
B
E47
25In
fosy
s Li
mit
edS
enio
r Vic
e P
resi
dent
Vipi
n C
hand
ran
Nai
r12
-03-
2012
10,6
75,9
49
M.A
. in
Eco
nom
ics
5027
Tick
erP
lant
Ltd
Gen
eral
Man
ager
& H
ead-
Com
mun
icat
ions
Vi
swan
atha
n R
amas
wam
y06
-02-
2014
21,5
26,3
91
M.T
ech
5434
Voda
fone
Indi
a Lt
dVi
ce P
resi
dent
108

C) E
mpl
oyed
for p
art
of t
he y
ear w
ith
an a
vera
ge s
alar
y of
` 8
.5 la
khs
or a
bove
per
mon
th a
nd p
oste
d in
Indi
a
Nam
e of
the
Em
ploy
eeD
ate
of J
oini
ng
(DD
-MM
-YY
YY
)G
ross
Rem
uner
atio
n (i
n `)
Edu
cati
onal
Q
ualifi
cati
onA
geE
xper
ienc
e (y
rs)
Last
Em
ploy
men
tD
esig
nati
on
Abi
dali
Z. N
eem
uchw
ala*
01-0
4-20
1522
,715
,472
BE
, Ele
ctro
nics
an
d C
omm
unic
atio
n,
Mas
ters
in
Indu
stri
al
Man
agem
ent
5329
Tata
Con
sult
ancy
S
ervi
ces
Chi
ef E
xecu
tive
Offi
cer
and
Man
agin
g D
irec
tor
Arj
un R
amar
aju
08-1
1-19
9442
,677
,113
B
E48
26Fi
rst E
mpl
oym
ent
Sen
ior V
ice
Pre
side
nt
Gan
esh
Kho
pkar
06-0
8-20
0710
,074
,170
B
. Com
, MFM
5026
AB
N A
mro
Cen
tral
E
nter
pris
e S
ervi
ces
Pvt
Ltd
G
ener
al M
anag
er
Gau
tam
Sar
kar
22-0
4-20
0314
,382
,204
P
GD
BM
52
28U
sha
Com
mun
icat
ions
Vice
Pre
side
nt &
Bus
ines
s H
ead,
Com
mun
icat
ions
Har
i Men
on27
-06-
1994
12,6
72,1
53
B.S
c, M
CA
51
27S
onat
a Vi
ce P
resi
dent
-Ind
ustr
ial M
anuf
actu
ring
Ver
tica
l
Jaya
nta
Dey
13
-10-
1988
31,9
26,2
89
BE
, MB
A55
33Fi
rst E
mpl
oym
ent
Vice
Pre
side
nt
Kap
il S
harm
a24
-05-
1995
13,4
32,5
03
BE
5127
Lars
en &
Tou
rbo
Gen
eral
Man
ager
and
Bus
ines
s H
ead
Man
ish
Pra
sad
18-0
2-20
199,
191,
038
BTe
ch
49
24S
AP
Lab
s In
dia
Pvt
. Lt
d.
Vice
Pre
side
nt
Nam
biar
San
jay
Ram
chan
dran
17-1
1-20
1714
,977
,845
B
E
46
24In
fosy
s Li
mit
ed
Vice
Pre
side
nt
Nan
dini
Mat
iyan
i01
-10-
2013
11,6
03,6
15
BE
4826
Onm
obile
Glo
bal L
tdVi
ce P
resi
dent
Raj
eev
Raj
agop
alan
28-0
5-20
209,
634,
180
BE
4624
Con
duen
tVi
ce P
resi
dent
& A
mer
icas
-2 D
eliv
ery
Hea
d
Ram
esh
Nag
araj
an25
-01-
1991
34,0
50,6
72
ME
5532
Firs
t Em
ploy
men
tS
enio
r Vic
e P
resi
dent
- C
loud
Ser
vice
s
Roh
it A
dlak
ha
30-0
5-19
9518
,128
,406
B
E47
25Fi
rst E
mpl
oym
ent
Sen
ior V
ice
Pre
side
nt a
nd G
loba
l Hea
d W
ipro
HO
LME
S
San
deep
Kum
ar20
-02-
2006
9,67
4,58
0 B
. Com
, MB
A57
32Fi
rst E
mpl
oym
ent
Vice
Pre
side
nt
San
jay
San
kar
Bas
u06
-05-
2019
10,3
65,5
29
BE
, PG
DM
5427
SA
P L
abs
Indi
a P
vt.
Ltd.
Vi
ce P
resi
dent
San
jiv K
R16
-11-
1988
32,3
40,1
13
MM
S57
33D
CM
Dat
a P
rodu
cts
Chi
ef T
echn
olog
y O
ffice
r
Sau
rabh
Ray
25-0
9-20
1711
,556
,959
B
.Tec
h
51
25Ta
ta C
onsu
ltan
cy
Ser
vice
s
Vi
ce -
Pre
side
nt
Sha
ntan
u R
ohat
gi15
-05-
1989
18,8
69,2
45
BE
, MB
A53
32Fi
rst E
mpl
oym
ent
Vice
Pre
side
nt-P
RE
Ent
erpr
ise
Som
it K
apoo
r25
-02-
2002
12,8
96,8
14
BE
4419
New
Hol
land
Vi
ce P
resi
dent
Vija
yaku
mar
K K
02-1
2-19
9612
,183
,969
B
.Sc
5533
Son
ata
Sof
twar
eVi
ce P
resi
dent
Not
es:
1 Th
e ab
ove
tabl
e co
ntai
ns d
etai
ls o
f em
ploy
ees
in a
lpha
beti
cal o
rder
and
doe
s no
t in
clud
e th
e de
tails
of
rem
uner
atio
n dr
awn
by t
he t
op 1
0 em
ploy
ees
as t
heir
det
ails
are
pro
vide
d in
item
(A) o
f A
nnex
ure
III to
this
Boa
rd’s
Rep
ort.
2 R
emun
erat
ion
com
pris
es s
alar
y, a
llow
ance
s, c
omm
issi
on, p
erfo
rman
ce b
ased
pay
men
ts, p
erqu
isit
e an
d C
ompa
ny’s
con
trib
utio
n to
pro
vide
nt fu
nd a
nd s
uper
annu
atio
n as
per
the
defi
niti
on c
onta
ined
in
Sec
tion
2(7
8) o
f the
Com
pani
es A
ct, 2
013
paid
dur
ing
the
year
. It a
lso
incl
udes
per
quis
ites
val
ue o
f Res
tric
ted
Sto
ck U
nits
(RS
Us)
exe
rcis
ed, i
f any
, by
empl
oyee
s.
3 Th
e na
ture
of e
mpl
oym
ent i
s co
ntra
ctua
l in
all t
he a
bove
cas
es.
4 N
one
of t
he e
mpl
oyee
s ho
ld 2
% o
r m
ore
of t
he p
aid-
up e
quit
y sh
are
capi
tal o
f the
Com
pany
as
per
clau
se (i
ii) o
f sub
-rul
e (2
) of R
ule
5 of
Com
pani
es (A
ppoi
ntm
ent
and
Rem
uner
atio
n of
Man
ager
ial
Per
sonn
el) R
ules
, 201
4.
5 In
term
s of
the
prov
iso
to R
ule
5 of
the
Com
pani
es (A
ppoi
ntm
ent a
nd R
emun
erat
ion
of M
anag
eria
l Per
sonn
el) R
ules
, 201
4, p
arti
cula
rs o
f em
ploy
ees
post
ed a
nd w
orki
ng in
a c
ount
ry o
utsi
de In
dia,
not
be
ing
Dir
ecto
rs o
r th
eir
rela
tive
s, h
ave
not b
een
incl
uded
in th
e ab
ove
stat
emen
t.
* C
ompe
nsat
ion
disc
lose
d in
the
tab
le a
bove
is f
or t
he p
erio
d fr
om A
pril
1, 2
020
to J
une
1, 2
020.
Fig
ures
men
tion
ed in
` a
re e
quiv
alen
t of
am
ount
s pa
id in
for
eign
cur
renc
y, a
s m
ay b
e ap
plic
able
. M
r. A
bida
li Z
. Nee
muc
hwal
a re
sign
ed a
s th
e C
hief
Exe
cuti
ve O
ffice
r an
d M
anag
ing
Dir
ecto
r of
the
Com
pany
wit
h ef
fect
from
the
end
of th
e da
y on
Jun
e 1,
202
0.
109
Integrated Annual Report 2020-21Wipro Limited

ANNEXURE IV
Form No. MR-3
SECRETARIAL AUDIT REPORT
[Pursuant to Sub Section (1) of Section 204 of the Companies Act, 2013 and Rule 9 of the Companies (Appointment and Remuneration of Managerial Personnel) Rules, 2014]
For the Financial Year Ended March 31, 2021
b. The Securities and Exchange Board of India (Prohibition of Insider Trading) Regulations, 2015;
c. The Securities and Exchange Board of India (Issue of Capital and Disclosure Requirements) Regulations, 2018;
d. The Securities and Exchange Board of India (Share Based Employee Benefits) Regulations, 2014;
e. The Securities and Exchange Board of India (Issue and Listing of Debt Securities) Regulations, 2008 (Not Applicable to the Company during the Audit Period);
f. The Securities and Exchange Board of India (Registrars to an Issue and Share Transfer Agents) Regulations, 1993 regarding the Companies Act and dealing with client;
g. The Securities and Exchange Board of India (Delisting of Equity Shares) Regulations, 2009 (Not Applicable to the Company during the Audit Period);
h. The Securities and Exchange Board of India (Buy-back of Securities) Regulations, 2018; and
i. Securities and Exchange Board of India (Listing Obligations and Disclosure Requirements) Regulations, 2015.
vi. Other laws applicable specifically to the Company namely:
a. Information Technology Act, 2000 and the rules made thereunder
b. Special Economic Zones Act, 2005 and the rules made thereunder
c. Software Technology Parks of India rules and regulations
We have also examined compliance with the applicable clauses of the following:
i. Secretarial Standards issued by The Institute of Company Secretaries of India on Meetings of the Board of Directors and General Meetings.
ii. Listing Agreements entered into by the Company with BSE Limited and National Stock Exchange of India Limited.
We have not examined compliance by the Company with applicable financial laws, like direct and indirect tax laws, since the same have been subject to review by statutory financial audit and other designated professionals.
To,The Members,Wipro Limited,Doddakannelli,Sarjapur Road,Bengaluru - 560 035
We have conducted the secretarial audit of the compliance of applicable statutory provisions and the adherence to good corporate practices by Wipro Limited (the Company). Secretarial Audit was conducted in a manner that provided us a reasonable basis for evaluating the corporate conducts/statutory compliances and expressing our opinion thereon.
Based on our verification of the Company’s books, papers, minute books, forms and returns filed and other records maintained by the Company and also the information provided by the Company, its officers, agents and authorized representatives during the conduct of secretarial audit, we hereby report that in our opinion, the Company has, during the audit period covering the financial year ended on March 31, 2021 (the audit period) complied with the statutory provisions listed hereunder and also that the Company has proper Board-processes and compliance-mechanism in place to the extent, in the manner and subject to the reporting made hereinafter:
We have examined the books, papers, minute books, forms and returns filed, and other records maintained by the Company for the financial year ended on March 31, 2021 according to the provisions of:
i. The Companies Act, 2013 (the Act) and the rules made thereunder;
ii. The Securities Contracts (Regulation) Act, 1956 (‘SCRA’) and the rules made thereunder;
iii. The Depositories Act, 1996 and the Regulations and Bye-laws framed thereunder;
iv. Foreign Exchange Management Act, 1999 and the rules and regulations made thereunder to the extent of Foreign Direct Investment and Overseas Direct Investment. There was no External Commercial Borrowing by the Company during the period under review;
v. The following Regulations and Guidelines prescribed under the Securities and Exchange Board of India Act, 1992 (‘SEBI Act’):
a. The Securities and Exchange Board of India (Substantial Acquisition of Shares and Takeovers) Regulations, 2011;
110

During the period under review, the Company has complied with the provisions of the Act, Rules, Regulations, Guidelines, etc. mentioned above.
We further report that:
The Board of Directors of the Company is duly constituted with proper balance of Executive Directors, Non-Executive Directors and Independent Directors. The changes in the composition of the Board of Directors that took place during the period under review were carried out in compliance with the provisions of the Act.
Adequate notice is given to all directors to schedule the Board Meetings, agenda and detailed notes on agenda were sent at least seven days in advance and a system exists for seeking and obtaining further information and clarifications on the agenda items before the meeting and for meaningful participation at the meeting.
As per the minutes of the meetings duly recorded and signed by the Chairman, the decisions of the Board were unanimous, and no dissenting views have been recorded.
We further report that based on the review of the compliance reports/certificates of the Company Secretary which were taken on record by the Board of Directors, there are adequate systems and processes in the company commensurate with the size and operations of the company to monitor and ensure compliance with applicable laws, rules, regulations, and guidelines.
We further report that during the audit period, except for the following events, there was no event/action having a major bearing on the Company’s affairs in pursuance of the above referred laws, rules, regulations, guidelines etc.:
a. The Company had bought back 23,75,00,000 (Twenty-Three Crores Seventy-Five Lakhs) fully paid-up Equity Shares of the Company of Face Value of Rs.2/- (Rupees Two Only) each at a price of Rs. 400/- (Rupees Four Hundred Only) per Equity Share on a proportionate basis through the tender offer process.
b. Mr. Thierry Delaporte (DIN: 08107242) has been appointed as Executive Director designated as Chief Executive Officer and Managing Director of the Company for a period of 5 years with effect from July 6, 2020.
For V. SREEDHARAN & ASSOCIATESCompany Secretaries
(V. Sreedharan)PartnerFCS: 2347; CP No. 833
BengaluruJune 09, 2021
UDIN: F002347C000436594 Peer Review Certificate No. 589/2019
This report is to be read with our letter of even date which is annexed as ‘Annexure 1’ and forms an integral part of this report.
111
Integrated Annual Report 2020-21Wipro Limited

Annexure - 1
5. The compliance of the provisions of Corporate and other applicable laws, rules, regulations, standards is the responsibility of management. Our examination was limited to the verification of procedures on test basis.
6. The Secretarial Audit report is neither an assurance as to the future viability of the Company nor of the efficacy or effectiveness with which the management has conducted the affairs of the Company.
7. Due to the ongoing Covid-19 pandemic, we have conducted online verification and examination of records, as facilitated by the Company for the purpose of issuing this report.
For V. SREEDHARAN & ASSOCIATESCompany Secretaries
(V. Sreedharan)PartnerFCS: 2347; CP No. 833
BengaluruJune 09, 2021
UDIN: F002347C000436594 Peer Review Certificate No. 589/2019
To,The MembersWipro Limited,Doddakannelli,Sarjapur Road,Bengaluru - 560 035
Our report of even date is to be read along with this letter:
1. Maintenance of secretarial records is the responsibility of the management of the Company. Our responsibility is to express an opinion on these secretarial records based on our audit.
2. We have followed the audit practices and processes as were appropriate to obtain reasonable assurance about the correctness of the contents of the Secretarial records. The verification was done on test basis to ensure that correct facts are reflected in secretarial records. We believe that the processes and practices, we followed provide a reasonable basis for our opinion.
3. We have not verified the correctness and appropriateness of financial records and Books of Accounts of the Company.
4. Wherever required, we have obtained the Management representation about the compliance of laws, rules and regulations and happening of events, etc.
112

ANNEXURE V
CORPORATE SOCIAL RESPONSIBILITY REPORT FOR THE FINANCIAL YEAR 2020-21
We present our report on Wipro’s Corporate Social Responsibility (CSR) for the financial year 2020-21. We begin by reiterating that the values of ‘Spirit of Wipro’ guide all our actions and embody the letter and spirit of being a responsible corporate citizen.
Our vision of ‘value through values’ drives our goals of (i) making Wipro a more sustainable business in its operations and value chain as defined broadly by the triple bottom-line and ESG frameworks (Environment, Social and Governance) and (ii) contributing to a more just, inclusive and sustainable society.
i. As a first principle, we constantly strengthen the alignment of our core business purpose with salient ESG goals in the areas of Energy, Climate Change, Water, Diversity and Inclusion at the workplace and Health and Well-Being of employees. All of this is based on the bedrock foundation of good governance and ethical conduct. During the year, we made a significant commitment to transforming to a Net Zero Company by 2040. Our targets of net zero greenhouse gas emissions are based on the globally accepted Science Based Targets Initiative. Our approach prioritizes deep decarbonization of our own operations and value chain while deferring offsets till 2040. This is in line with our core values and we believe we are well positioned to meet our commitments.
ii. In the larger social sphere, our primary areas of work are in Education, Urban Ecology, Primary Health Care, Disaster Response and Public Spaces in cities. A common strand running across our social initiatives is a deliberative focus on inclusion and empowerment of disadvantaged communities. Our emphasis is on deep, meaningful, long-term work implemented by our carefully identified network of nearly 200 partners in India and all the major overseas geographies we are present in US, Europe, LATAM and APAC.
The year 2020 threw up the biggest challenge humanity has faced for a long time, the Covid-19 pandemic. From the very beginning, it was clear to us that our response had to be commensurate with the severity and scale of the crisis. Together with Azim Premji Foundation and Wipro Enterprises Private Limited, we committed ` 11,250 Mn of which our contribution was ` 1,000 Mn. For more than 12 months now, we have been engaged deeply in crafting and executing an integrated response that addresses the deeply intertwined humanitarian and healthcare aspects of the problem. We recognize that the pandemic and its after-effects is going to be with us for some time. Keeping this in mind, we have ensured that a significant part of our support is towards strengthening and augmenting the capacity of the public health system in India, especially in some of the most underserved areas. Of the several initiatives we supported, there were two outstanding projects that represent our ability to respond with agility and innovatively: (a) the first involved leveraging the canteen infrastructure in our Bengaluru, Pune and Kolkata facilities to deliver nearly 3 Mn cooked meals to vulnerable communities in distress and (b) the second project conceptualised and executed the converting of our Pune campus to a full-fledged 450 bed Covid hospital that has seen nearly 5,500 patients treated till now.
We would like to highlight the fact that our Covid response and investments were in addition to the regular CSR work, which we continued to support to the fullest extent. Our partners adopted a hybrid model of online and field work over the course of the year adapting dynamically to the situation on the ground. For example, our healthcare partners combined primary healthcare with essential frontline Covid work.
You will find a comprehensive articulation of our work in the Annual Report, which is based on the International Integrated Reporting framework of how value is created on both, financial and non-financial capitals and how they feed and reinforce each other.
113
Integrated Annual Report 2020-21Wipro Limited

ANNUAL REPORT ON CORPORATE SOCIAL RESPONSIBILITY (CSR) ACTIVITIES FOR FY 2020-21
1. Brief outline on CSR Policy of the Company: A brief outline of the Company’s CSR policy including overview of the projects or programs proposed to be undertaken is available at https://www.wipro.com/sustainability-archive/. Details are also captured under CSR Highlights for the financial year 2020-21 on page no. 113.
2. Composition of CSR Committee: The Board Governance, Nomination and Compensation Committee (“Committee”) also acts as the CSR Committee of the Company.
Sl. No.
Name of Director Designation/Nature of DirectorshipNumber of meetings of CSR Committee held
during the year
Number of meetings of CSR Committee attended
during the year1. William Arthur Owens Independent Director, Chairman of the
Committee5 5
2. M. K. Sharma Independent Director, Member of the Committee
5 5
3. Ireena Vittal Independent Director, Member of the Committee
5 5
3. Provide the web-link where Composition of CSR committee, CSR Policy and CSR projects approved by the board are disclosed on the website of the company: Details on composition of CSR committee, CSR Policy and CSR projects approved by the Board of Directors are available at https://www.wipro.com/sustainability-archive/.
4. Provide the details of Impact Assessment of CSR projects carried out in pursuance of sub-rule (3) of rule 8 of the Companies (Corporate Social responsibility Policy) Rules, 2014, if applicable: The Company will carry out impact assessment of projects undertaken after January 22, 2021, as may be applicable, and will provide details of the same as part of its future reports as required pursuant to rule 8(3) of the Companies (Corporate Social Responsibility Policy) Rules, 2014.
5. Details of the amount available for set off in pursuance of sub-rule (3) of rule 7 of the Companies (Corporate Social Responsibility Policy) Rules, 2014 and amount required for set off for the financial year, if any: Not Applicable
6. Average net profit of the company as per section 135(5) (calculated for 3 preceding financial years i.e. FY 2017-18, FY 2018-19 and FY 2019-20): ` 82,817 Million
7. a) Two percent of average net profits of the company as per section 135(5): ` 1,656 Million
b) Surplus arising out of the CSR projects or programs or activities of the previous financial years: NIL
c) Amount required to be set off for the financial year 2020-21, if any: NIL
d) Total CSR obligation for the financial year 2020-21 (7a+7b-7c): ` 1,656 Million
8. a) CSR amount spent or unspent for the financial year 2020-21:
Total Amount Spent for the Financial Year (in ` Million)
Amount Unspent (in `)
Total Amount transferred to Unspent CSR Account as per section 135(6)
Amount transferred to any fund specified under Schedule VII as per second proviso to section 135(5)
Amount Date of transfer Name of the Fund Amount Date of transfer2,512
(inclusive of administrative overheads)Nil Nil Nil Nil Nil
114

b)
Det
ails
of C
SR
am
ount
spe
nt a
gain
st o
ngoi
ng p
roje
cts
for
the
fina
ncia
l yea
r:
(In `
Mill
ion)
12
34
56
78
911
12
Sl.
No.
Nam
e of
the
Proj
ect
Item
from
the
list o
f ac
tiviti
es in
Sch
edul
e VI
I to
the
Act
Loca
l are
a (Y
es/
No)
Loca
tion
of th
e pr
ojec
t
Proj
ect
dura
tion
Amou
nt
allo
cate
d fo
r th
e pr
ojec
t (fo
r cu
rrent
fina
ncia
l ye
ar)
Amou
nt
spen
t in
the
curre
nt
finan
cial
Ye
ar
Amou
nt tr
ansf
erre
d to
Uns
pent
CSR
Ac
coun
t for
the
proj
ect a
s per
Se
ctio
n 13
5(6)
Mod
e of
Im
plem
enta
tion-
Di
rect
(Y
es/N
o)
Mod
e of
Impl
emen
tatio
n-
Thro
ugh
Impl
emen
ting
Agen
cy
Stat
eDi
stric
tNa
me
CSR
Regi
stra
tion
num
ber
1.Co
mm
unity
Hea
lthca
rePr
omot
ing
heal
th
care
in
clud
ing
prev
entiv
e he
alth
ca
re
Proj
ect i
s im
plem
ente
d pa
n-In
dia
Refe
r enc
losu
reOn
goin
g 1
010
NIL
NoW
ipro
Car
esCS
R000
0474
7
2.Ed
ucat
ion
for U
nder
privi
lege
d
Prom
otin
g ed
ucat
ion,
in
clud
ing
spec
ial
educ
atio
n an
d em
ploy
men
t en
hanc
ing
voca
tion
skill
s es
peci
ally
am
ong
child
ren,
wo
men
, el
derly
an
d th
e di
ffere
ntly
ab
led
and
livel
ihoo
d en
hanc
emen
t pr
ojec
ts
Proj
ect i
s im
plem
ente
d pa
n-In
dia
Refe
r enc
losu
reOn
goin
g85
76.5
NIL
NoW
ipro
Car
es
& W
ipro
Fo
unda
tion
CSR0
0004
747
& CS
R000
0490
5
3.Ed
ucat
ion
: Sys
tem
ic R
efor
ms
Proj
ect i
s im
plem
ente
d pa
n-In
dia
Refe
r enc
losu
reOn
goin
g85
78NI
LNo
Wip
ro
Foun
datio
nCS
R000
0490
5
4.Ed
ucat
ion
for C
hild
ren
with
Di
sabi
lity
Proj
ect i
s im
plem
ente
dpa
n-In
dia
Refe
r enc
losu
reOn
goin
g11
11NI
LNo
Wip
ro C
ares
CSR0
0004
747
5.Hi
gher
Edu
catio
n fo
r Ski
lls
Build
ing
Proj
ect i
s im
plem
ente
d pa
n-In
dia
Refe
r enc
losu
reOn
goin
g1,
000
932
NIL
Yes
--
6.En
gine
erin
g Ed
ucat
ion
Yes
Refe
r enc
losu
reOn
goin
g9
6NI
LYe
s-
-7.
Sust
aina
bilit
y Edu
catio
n
Ensu
ring
envir
onm
enta
l su
stai
nabi
lity,
ecol
ogic
al
bala
nce,
prot
ectio
n of
flor
a an
d fa
una,
ani
mal
wel
fare
, ag
rofo
rest
ry,
cons
erva
tion
of n
atur
al r
esou
rces
and
m
aint
aini
ng q
ualit
y of
soi
l, ai
r and
wat
er
Proj
ect i
s im
plem
ente
d pa
n-In
dia
Refe
r enc
losu
reOn
goin
g32
23NI
LYe
s, an
d th
roug
h im
plem
entin
g ag
ency
Wip
ro
Foun
datio
nCS
R000
0490
5
8.Ec
olog
y-W
ater
Proj
ect i
s im
plem
ente
d pa
n-In
dia
Refe
r enc
losu
reOn
goin
g3.
53
NIL
NoW
ipro
Fo
unda
tion
CSR0
0004
905
9.Ec
olog
y-Bi
odive
rsity
Proj
ect i
s im
plem
ente
d pa
n-In
dia
Refe
r enc
losu
reOn
goin
g1
0.4
NIL
NoW
ipro
Fo
unda
tion
CSR0
0004
905
10.
Rene
wabl
e En
ergy
Yes
Refe
r enc
losu
reOn
goin
g55
037
1NI
LYe
s-
-11
.Co
mm
unity
Eco
logy
Proj
ect i
s im
plem
ente
d pa
n-In
dia
Refe
r enc
losu
reOn
goin
g2.
52.
5NI
LNo
Wip
ro C
ares
CSR0
0004
747
12.
Sust
aina
bilit
y Adv
ocac
y and
Re
sear
chCo
ntrib
utio
ns
to
publ
ic
fund
ed
Unive
rsiti
es
and
inst
itutio
ns
enga
ged
in
cond
uctin
g re
sear
ch
in
scie
nce,
tech
nolo
gy,
engi
neer
ing
and
med
icin
e ai
med
at
pr
omot
ing
Sust
aina
ble
Deve
lopm
ent
Goal
s (SD
Gs)
Proj
ect i
s im
plem
ente
d pa
n-In
dia
Refe
r enc
losu
reOn
goin
g16
14NI
LYe
s, an
d th
roug
h im
plem
entin
g ag
ency
Wip
ro
Foun
datio
nCS
R000
0490
5
13.
Rura
l live
lihoo
d pr
ogra
ms
Rura
l dev
elop
men
t pro
ject
sPr
ojec
t is
impl
emen
ted
pan-
Indi
a
Refe
r enc
losu
reOn
goin
g6.
56.
5NI
LNo
Wip
ro C
ares
CSR0
0004
747
14.
Prot
ectio
n of
nat
iona
l her
itage
, ar
t and
cultu
rePr
otec
tion
of
natio
nal
herit
age,
art
and
cultu
re
incl
udin
g re
stor
atio
n of
bu
ildin
gs
and
site
s of
hi
stor
ical
im
port
ance
and
wo
rks
of a
rt;
setti
ng u
p pu
blic
lib
rarie
s; pr
omot
ion
and
deve
lopm
ent
of
tradi
tiona
l ar
t an
d ha
ndic
rafts
Yes
Refe
r enc
losu
reOn
goin
g68
68NI
LNo
Wip
ro
Foun
datio
nCS
R000
0490
5
115
Integrated Annual Report 2020-21Wipro Limited

12
34
56
78
911
12
Sl.
No.
Nam
e of
the
Proj
ect
Item
from
the
list o
f ac
tiviti
es in
Sch
edul
e VI
I to
the
Act
Loca
l are
a (Y
es/
No)
Loca
tion
of th
e pr
ojec
t
Proj
ect
dura
tion
Amou
nt
allo
cate
d fo
r th
e pr
ojec
t (fo
r cu
rrent
fina
ncia
l ye
ar)
Amou
nt
spen
t in
the
curre
nt
finan
cial
Ye
ar
Amou
nt tr
ansf
erre
d to
Uns
pent
CSR
Ac
coun
t for
the
proj
ect a
s per
Se
ctio
n 13
5(6)
Mod
e of
Im
plem
enta
tion-
Di
rect
(Y
es/N
o)
Mod
e of
Impl
emen
tatio
n-
Thro
ugh
Impl
emen
ting
Agen
cy
Stat
eDi
stric
tNa
me
CSR
Regi
stra
tion
num
ber
15.
COVI
D-19
Med
ical
Infra
stru
ctur
ePr
omot
ing
heal
th
care
in
clud
ing
prev
entiv
e he
alth
ca
re;
disa
ster
m
anag
emen
t, in
clud
ing
relie
f, re
habi
litat
ion
and
reco
nstru
ctio
n ac
tiviti
es
Yes
Refe
r enc
losu
reOn
goin
g16
316
3Ni
lYe
s-
-
TOTA
L*2,
042.
51,7
65*
Am
ount
s in
the
abov
e ta
ble
are
subj
ect t
o ro
undi
ng-o
ff a
djus
tmen
ts.
c)
Det
ails
of C
SR
am
ount
spe
nt a
gain
st o
ther
than
ong
oing
pro
ject
s fo
r th
e fi
nanc
ial y
ear:
(In
` M
illio
n)
12
34
56
78
Sl.
No.
Nam
e of
the
Proj
ect
Item
from
the
list o
f act
iviti
es in
Sc
hedu
le V
II to
the
Act
Loca
l are
a (Y
es/N
o)
Loca
tion
of th
e pr
ojec
tAm
ount
sp
ent f
or th
e pr
ojec
t
Mod
e of
Im
plem
enta
tion
–Di
rect
(Yes
/No)
Mod
e of
Impl
emen
tatio
n -
Thro
ugh
Impl
emen
ting
Agen
cy
Stat
eDi
stric
tNa
me
CSR
Regi
stra
tion
num
ber
1.CO
VID
19-C
ontr
ibut
ion
Erad
icat
ing
hung
er,
pove
rty
and
mal
nutr
ition
, pr
omot
ing
heal
th c
are
incl
udin
g pr
even
tive
heal
th c
are
and
sani
tatio
n in
clud
ing
cont
ribut
ion
to
the
Swac
h Bh
arat
Kos
h se
t-up
by
the
Cent
ral G
over
nmen
t for
the
prom
otio
n of
sani
tatio
n an
d m
akin
g ava
ilabl
e saf
e dr
inki
ng w
ater
; dis
aste
r man
agem
ent,
incl
udin
g re
lief,
reha
bilit
atio
n an
d re
cons
truct
ion
activ
ities
Proj
ect i
s im
plem
ente
d pa
n-In
dia
Proj
ect i
s im
plem
ente
d pa
n-In
dia
301
NoW
ipro
Car
es &
Wip
ro
Foun
datio
nCS
R000
0474
7 &
CSR0
0004
905
2.CO
VID
19-C
ontr
ibut
ion
Proj
ect i
s im
plem
ente
d pa
n-In
dia
Proj
ect i
s im
plem
ente
d pa
n-In
dia
7No
Wip
ro C
ares
CSR0
0004
747
3.CO
VID
19-R
elie
f M
easu
re: F
ood
Dist
ribut
ion
Proj
ect i
s im
plem
ente
d pa
n-In
dia
Proj
ect i
s im
plem
ente
d pa
n-In
dia
101
Yes
--
4.CO
VID-
19: D
istr
ibut
ion
of P
PE K
its, B
ody s
uits
&
N95
Mas
ks
Proj
ect i
s im
plem
ente
d pa
n-In
dia
Proj
ect i
s im
plem
ente
d pa
n-In
dia
46Ye
s-
-
5.CO
VID-
19: C
ontr
ibut
ion
to P
M R
elie
f fun
d
Cont
ribut
ion
to t
he P
rime
Min
iste
r's
natio
nal r
elie
f fun
d or
Prim
e M
inis
ter’s
Ci
tizen
As
sist
ance
an
d Re
lief
in
Emer
genc
y Si
tuat
ions
Fu
nd
(PM
CA
RES
Fund
) or a
ny o
ther
fund
set
up
by t
he c
entra
l go
vern
men
t fo
r so
cio
econ
omic
dev
elop
men
t and
relie
f and
we
lfare
of
the
sche
dule
cas
te, t
ribes
, ot
her
back
ward
cl
asse
s, m
inor
ities
an
d wo
men
Proj
ect i
s im
plem
ente
d pa
n-In
dia
Proj
ect i
s im
plem
ente
d pa
n-In
dia
250
Yes
--
TOTA
L*70
5
* A
mou
nts
in th
e ab
ove
tabl
e ar
e su
bjec
t to
roun
ding
-off
adju
stm
ents
.
116

d) Amount spent in Administrative Overheads: ` 42 Million
e) Amount spent on Impact Assessment, if applicable: Not Applicable
f) Total amount spent for the Financial Year 2020-21 (8b+8c+8d+8e): ` 2,512 Million
g) Excess amount for set off, if any: ` 856 Million
Sl. No. Particular Amount (in ` Million)
(i) Two percent of average net profit of the company as per Section 135(5) (calculated for 3 preceding Financial Years i.e. FY 2017-18, FY 2018-19 and FY 2019-20)
1,656
(ii) Total amount spent for the Financial Year 2020-21 2,512
(iii) Excess amount spent for the financial year 2020-21 [(ii)-(i)] 856
(iv) Surplus arising out of the CSR projects or programmes or activities of the previous financial years, if any
NIL
(v) Amount available for set off in succeeding financial years [(iii)-(iv)] 856
9. a) Details of Unspent CSR amount for the preceding three financial years: Not Applicable
b) Details of CSR amount spent in the financial year for ongoing projects of the preceding financial year(s):
(In ` Million)
1 2 3 4 5 6 7 8 9
Sl.No. Project ID Name of the
Project
Financial Year in
which the project was commenced
Project duration#
Total amount
allocated for the project
Amount spent on the
project in the reporting Financial Year
Cumulative amount spent
at the end of reporting
Financial Year
Status of the project- Completed/
Ongoing
1. Community Healthcare
Community Healthcare
2018-19 3 years 10 10 57 Ongoing
2. Education for Underprivileged
Education for Underprivileged
2018-19 3 years 85 76.5 206.5 Ongoing
3. Education: Systemic Reforms
Education: Systemic Reforms
2018-19 3 years 85 78 545 Ongoing
4. Education for Children with Disability
Education for Children with Disability
2018-19 3 years 11 11 138 Ongoing
5. Sustainability Education
Sustainability Education
2018-19 3 years 32 23 193 Ongoing
6. Higher Education for skills building
Higher Education for skills building
2018-19 3 years 1,000 932 7,235 Ongoing
7. Engineering Education
Engineering Education
2018-19 3 years 9 6 29 Ongoing
8. Ecology-Water Ecology-Water 2018-19 3 years 3.5 3 33 Ongoing
9. Ecology-Biodiversity
Ecology-Biodiversity
2018-19 3 years 1 0.4 32.4 Ongoing
10. Renewable Energy Renewable Energy
2018-19 3 years 550 371 3,157 Ongoing
11. Community Ecology Community Ecology
2018-19 3 years 2.5 2.5 14.5 Ongoing
12. Sustainability Advocacy and Research
Sustainability Advocacy and Research
2018-19 3 years 16 14 119 Ongoing
13. Rural livelihood programs
Rural livelihood programs
2018-19 3 years 6.5 6.5 34.5 Ongoing
TOTAL* 1,811.5 1,534 11,794
# The duration of project mentioned above excludes the financial year in which such project commenced, as defined under rule 2(i) of the Companies (Corporate Social Responsibility Policy) Rules, 2014.
* Amounts in the above table are subject to rounding-off adjustments.
117
Integrated Annual Report 2020-21Wipro Limited

10. In case of creation or acquisition of capital asset, furnish the details relating to the asset so created or acquired through CSR spent in the financial year (asset-wise details): Not Applicable
a) Date of creation or acquisition of the capital asset(s).
b) Amount of CSR spent for creation or acquisition of capital asset.
c) Details of the entity or public authority or beneficiary under whose name such capital asset is registered, their address etc.
d) Provide details of the capital asset(s) created or acquired (including complete address and location of the capital asset).
11. Specify the reason(s), if the company has failed to spend two per cent of the average net profit as per Section 135(5): Not Applicable
Sd/-Rishad A. Premji
Chairman
Sd/-William Arthur Owens
(Chairman of Board Governance,Nomination and Compensation Committee)
118

List
of i
mpl
emen
ting
part
ners
Sl.
No.
Proj
ect N
ame
Nam
e of
Impl
emen
ting
Part
ners
Stat
e D
istr
ict
1.
Com
mun
ity
Hea
lthc
are
Doc
tors
For
You
, Fou
ndat
ion
for
Mot
her
and
Child
Hea
lth
(FM
CH),
Late
Va
ibha
v Ph
alan
ikar
M
emor
ial
Foun
dati
on
(LVM
F),
Nir
amay
a H
ealt
h Fo
unda
tion
, Rur
al L
itera
cy a
nd H
ealt
h Pr
ogra
mm
e (R
LHP)
, Sab
uj S
angh
a,
SNEH
Fou
ndat
ion,
Suk
arya
, The
Ele
uthe
ros
Chri
stia
n So
ciet
y (E
CS)
Mah
aras
htra
, K
arna
taka
, W
est
Ben
gal,
Har
yana
, Nag
alan
dM
umba
i, Pu
ne,
Mys
uru,
K
olka
ta, G
urug
ram
, Tue
nsan
g
2.
Educ
atio
n fo
r U
nder
priv
ilege
d
Sam
ridh
dhi T
rust
, Arm
y N
avy
Air
Forc
e W
ives
Act
ivit
y, As
eem
a Ch
arit
able
Tr
ust,
ASH
A Fo
unda
tion
, Com
mun
ity
Educ
atio
nal C
entr
e So
ciet
y (C
ECS)
, G
ubba
chi
Lear
ning
Co
mm
unit
y, M
akka
la
Jagr
iti,
Nat
ive
Med
icar
e Ch
arit
able
Tru
st, O
lcot
t Edu
cati
on S
ocie
ty, S
ahas
ra D
eepi
ka In
tern
atio
nal
for E
duca
tion
(SD
IE),
Sugr
a H
umay
un M
irza
Wak
f, Th
e In
stit
utio
n of
Soc
ial
Stud
ies
Trus
t (IS
ST),
The
Soci
ety
for
Doo
r St
ep S
choo
l (D
SS),
Tow
ards
Fu
ture
, Van
avil
Trus
t
Kar
nata
ka,
Utt
ar
Prad
esh,
M
ahar
asht
ra,
Nag
alan
d, T
amil
Nad
u,
Tela
ngan
a,
Del
hi-N
CR,
Wes
t Ben
gal
Ben
galu
ru,
Gau
tam
B
uddh
N
agar
, N
oida
, M
umba
i, D
imap
ur, C
oim
bato
re, C
henn
ai,
Hyd
erab
ad,
East
Del
hi,
Pune
, K
olka
ta
3.
Educ
atio
n: S
yste
mic
Ref
orm
s (O
rgan
izat
ions
fund
ed
thro
ugh
dire
ct g
rant
s)
Aavi
shka
ar Y
aatr
aa,
Aaw
aj J
an K
alya
n Sa
mit
i, Ag
raga
mee
, Ar
t Sp
arks
Fo
unda
tion
, Aya
ng T
rust
, Boo
kwor
m T
rust
& L
ibra
ry, C
ARM
DAK
SH (C
entr
e fo
r Ac
tion
Res
earc
h &
Man
agem
ent
in D
evel
opin
g At
titu
des,
Kno
wle
dge,
Sk
ills
in H
uman
Res
ourc
es),
Chal
e Ch
alo,
Coh
esio
n Fo
unda
tion
Tru
st,
Dak
shin
Fou
ndat
ion,
Dig
anta
r Sh
iksh
a Ev
am K
helk
hud
Sam
iti,
Doo
ars
Jagr
on,
Ekla
vya
Foun
dati
on,
Ekta
ra T
rust
, I
am a
Tea
cher
, Jh
amts
e G
atsa
l Ch
ildre
n’s
Com
mun
ity,
Jodo
Gya
n Ed
ucat
iona
l Se
rvic
es, M
aarg
a,
Nag
alan
d Ce
ntre
for
Hum
an D
evel
opm
ent
& I
nfor
mat
ion
Tech
nolo
gy
(NCH
D-I
T),N
atur
e Co
nser
vati
on
Foun
dati
on
(NCF
), O
rgan
isat
ion
for
Earl
y Li
tera
cy (
OEL
P), P
alak
niti
Par
iwar
, Par
arth
Sam
iti,
Pata
ng, R
oshn
i Tr
ust,
Rur
al A
id, S
amer
th C
hari
tabl
e Tr
ust,
Scho
ol E
duca
tion
tru
st fo
r th
e D
isad
vant
aged
(SE
TD),
Shah
eed
Vire
nder
Sm
arak
Sam
iti
(SVS
S), S
pace
fo
r N
urtu
ring
Cre
ativ
ity
(SN
C), S
yner
gy S
anst
han,
The
Fer
dina
nd C
entr
e fo
r Ed
ucat
ion
(TFC
), U
nnat
i Ins
titu
te f
or S
ocia
l and
Edu
cati
onal
Cha
nge,
Va
nang
ana,
Vid
ya M
ytri
Tru
st, V
ikra
msh
ila E
duca
tion
Res
ourc
e So
ciet
y, Vi
sion
Em
pow
er
Him
acha
l Pr
ades
h,
Mad
hya
Prad
esh,
O
dish
a,
Kar
nata
ka,
Goa
, Ch
hatt
isga
rh,
Guj
arat
, R
ajas
than
, Wes
t B
enga
l, D
elhi
-N
CR,
Nag
alan
d, M
ahar
asht
ra,
Utt
ar
Prad
esh,
H
arya
na,
Utt
arak
hand
, Ass
am, A
ndam
an
& N
icob
ar I
slan
ds,
Arun
acha
l Pr
ades
h
Pala
mpu
r, B
hopa
l, H
arda
, Ta
mia
, Chh
indw
ara,
Ray
agad
a,
Sund
erga
rh,
Sam
balp
ur,
Bar
garh
, B
enga
luru
, K
oppa
l, H
anga
l, H
aver
i, Pa
naji,
Kor
ba,
Kut
ch,
Juha
pura
, Ve
jalp
ur,
Ahm
edab
ad, J
aipu
r, B
anar
hat,
Jalp
aigu
ri,
Kol
kata
, K
alch
ini,
Alip
urdu
ar,
Gur
gaon
, N
ew
Del
hi,
Kip
hire
, Pu
ne,
Akol
a,
Alig
arh,
B
anda
, Sa
mal
kha,
K
edar
nath
val
ley,
Rud
rapr
ayag
, M
ajul
i, An
dam
ans,
Lu
mla
, Ta
wan
g
Educ
atio
n: S
yste
mic
Ref
orm
s (O
rgan
izat
ions
fund
ed
thro
ugh
seed
ing
fello
wsh
ips)
Aafa
aq F
ound
atio
n, A
dhva
n, A
gran
i Sam
aj, A
ntra
l, Ar
t of P
lay
Foun
dati
on,
ASW
A (A
mm
a So
cial
Wel
fare
Ass
ocia
tion
), Av
anit
i Edu
cati
on a
nd T
rain
ing
Foun
dati
on, A
wad
h Pe
ople
s Fo
rum
, Bar
efoo
t, B
ELIE
F (B
ette
r Ed
ucat
ion
Life
styl
e an
d En
viro
nmen
t Fo
unda
tion
),
Eika
s Fo
unda
tion
, Fe
athe
rs,
Gra
mot
than
, H
ad A
nhad
, H
appy
Hor
izon
Tru
st,
Inqu
ilab
Foun
dati
on,
I-sa
ksha
m,
Kan
avu,
Kar
unar
, K
heti
Tru
st,
Kar
unod
aya
Foun
dati
on,
Key
Ed
ucat
ion
Foun
dati
on,
Ksh
amta
laya
, Le
t’s E
duca
te C
hild
ren
in N
eed
(LEC
IN),
Lets
Ope
n a
Boo
k, L
ibra
ry f
or A
ll, M
anzi
l Mys
tics
, Mil
Ke
Chal
o,
Mus
ht, N
orth
Eas
t Ed
ucat
ion
Trus
t, Pi
Jam
, PR
AYO
G, R
REA
(R
ecog
nize
, R
ise
and
Empo
wer
As
soci
atio
n),
rZam
ba,
Saho
daya
Fo
unda
tion
, Sa
jag,
Sam
aave
shi
Paat
hsha
la,
Sam
ait
Shal
a, S
anjh
i Si
khiy
a, S
atir
tha,
Sh
iksh
arth
Tr
ust,
Sim
ple
Educ
atio
n Fo
unda
tion
, SR
I (S
elf
Rel
iant
In
dia)
, Sw
aTal
eem
Fou
ndat
ion,
Sw
atan
tra
Talim
, Tea
ch f
or G
reen
, Thr
ive
Fo
unda
tion
, U
moy
a Sp
orts
, U
nive
rse
Sim
plifi
ed F
ound
atio
n, U
pkra
m,
Vard
ishn
u, V
arit
ra F
ound
atio
n, V
idhy
a Vi
dhai
, Vid
yoda
ya, W
e, T
he P
eopl
e Ab
hiya
n
Him
acha
l Pr
ades
h,
Mah
aras
htra
, M
adhy
a Pr
ades
h,
Jhar
khan
d,
Del
hi-
NCR
, R
ajas
than
, Te
lang
ana,
Ch
hatt
isga
rh,
Utt
ar
Prad
esh,
Ta
mil
Nad
u,
Odi
sha,
B
ihar
, As
sam
, K
arna
taka
, M
anip
ur,
Lada
kh,
Guj
arat
, Pu
njab
, U
ttar
akha
nd, H
arya
na
Cham
ba,
Sola
n,
Laha
ul
and
Spit
i, M
umba
i, Pu
ne,
Jalg
aon,
K
olha
pur,
Amal
ner,
Kar
jat,
Seon
i, In
dore
, K
hand
wa,
R
anch
i, N
orth
D
elhi
, Ea
st
Del
hi,
Sout
h D
elhi
, N
ew
Del
hi,
Fari
daba
d,
Jhun
jhun
u,
Uda
ipur
, R
anga
R
eddy
, H
yder
abad
, D
ham
tari
, Su
kma,
Ay
odhy
a, L
uckn
ow,
Gur
ugra
m,
Sonb
hadr
a, S
itap
ur,
Chen
nai,
Mad
urai
, Cu
ddal
ore,
Son
epur
, Sa
hars
a,
Gay
a,
Gop
alga
nj,
Jam
ui,
Jorh
at,
Guw
ahat
i, N
agao
n,
Ben
galu
ru,
Ukh
rul,
Imph
al,
Kam
jong
, K
argi
l, Ah
med
abad
, Fat
ehga
rh S
ahib
, Ch
ampa
wat
, Te
hri
Gar
hwal
, R
ewar
i, M
ewat
, Kar
nal
119
Integrated Annual Report 2020-21Wipro Limited
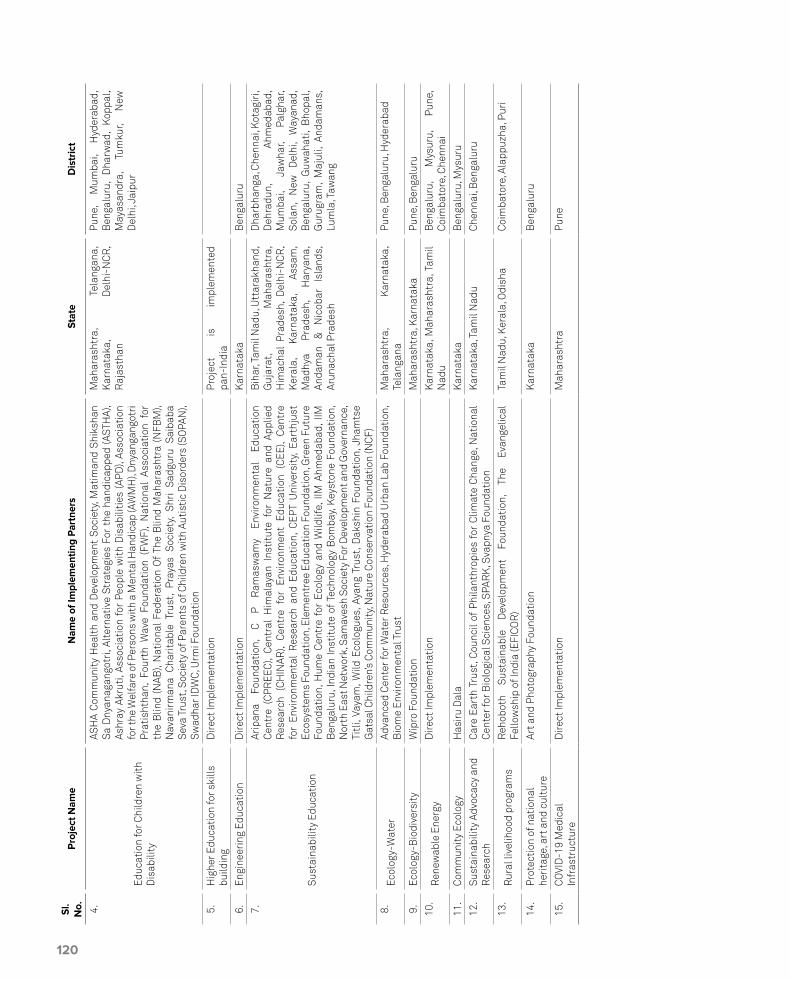
Sl.
No.
Proj
ect N
ame
Nam
e of
Impl
emen
ting
Part
ners
Stat
e D
istr
ict
4.
Educ
atio
n fo
r Chi
ldre
n w
ith
Dis
abili
ty
ASH
A Co
mm
unit
y H
ealt
h an
d D
evel
opm
ent
Soci
ety,
Mat
iman
d Sh
iksh
an
Sa D
nyan
agan
gotr
i, Al
tern
ativ
e St
rate
gies
For
the
han
dica
pped
(AST
HA)
, As
hray
Akr
uti,
Asso
ciat
ion
for
Peop
le w
ith
Dis
abili
ties
(APD
), As
soci
atio
n fo
r the
Wel
fare
of P
erso
ns w
ith
a M
enta
l Han
dica
p (A
WM
H),
Dny
anga
ngot
ri
Prat
isht
han,
Fou
rth
Wav
e Fo
unda
tion
(FW
F),
Nat
iona
l As
soci
atio
n fo
r th
e B
lind
(NAB
), N
atio
nal F
eder
atio
n O
f Th
e B
lind
Mah
aras
htra
(N
FBM
), N
avan
irm
ana
Char
itab
le T
rust
, Pr
ayas
Soc
iety
, Sh
ri S
adgu
ru S
aiba
ba
Seva
Tru
st, S
ocie
ty o
f Par
ents
of C
hild
ren
wit
h Au
tist
ic D
isor
ders
(SO
PAN
), Sw
adha
r ID
WC,
Urm
i Fou
ndat
ion
Mah
aras
htra
, Te
lang
ana,
K
arna
taka
, D
elhi
-NCR
, R
ajas
than
Pune
, M
umba
i, H
yder
abad
, B
enga
luru
, D
harw
ad,
Kop
pal,
May
asan
dra,
Tu
mku
r, N
ew
Del
hi, J
aipu
r
5.H
ighe
r Edu
cati
on fo
r ski
lls
build
ing
Dir
ect I
mpl
emen
tati
onPr
ojec
t is
im
plem
ente
d
pan-
Indi
a
6.En
gine
erin
g Ed
ucat
ion
Dir
ect I
mpl
emen
tati
onK
arna
taka
Ben
galu
ru
7.
Sust
aina
bilit
y Ed
ucat
ion
Arip
ana
Foun
dati
on,
C P
Ram
asw
amy
Envi
ronm
enta
l Ed
ucat
ion
Cent
re (
CPR
EEC)
, Ce
ntra
l H
imal
ayan
Ins
titu
te f
or N
atur
e an
d Ap
plie
d R
esea
rch
(CH
INAR
), Ce
ntre
for
Env
ironm
ent
Educ
atio
n (C
EE),
Cent
re
for
Envi
ronm
enta
l R
esea
rch
and
Educ
atio
n, C
EPT
Uni
vers
ity,
Eart
hjus
t Ec
osys
tem
s Fo
unda
tion
, Ele
men
tree
Edu
cati
on F
ound
atio
n, G
reen
Fut
ure
Foun
dati
on, H
ume
Cent
re f
or E
colo
gy a
nd W
ildlif
e, I
IM A
hmed
abad
, IIM
B
enga
luru
, Ind
ian
Inst
itut
e of
Tec
hnol
ogy
Bom
bay,
Key
ston
e Fo
unda
tion
, N
orth
Eas
t Net
wor
k, S
amav
esh
Soci
ety
For D
evel
opm
ent a
nd G
over
nanc
e,
Titl
i, Va
yam
, Wild
Eco
logu
es, A
yang
Tru
st, D
aksh
in F
ound
atio
n, J
ham
tse
Gat
sal C
hild
ren’
s Co
mm
unit
y, N
atur
e Co
nser
vati
on F
ound
atio
n (N
CF)
Bih
ar, T
amil
Nad
u, U
ttar
akha
nd,
Guj
arat
, M
ahar
asht
ra,
Him
acha
l Pr
ades
h, D
elhi
-NCR
, K
eral
a,
Kar
nata
ka,
Assa
m,
Mad
hya
Prad
esh,
H
arya
na,
Anda
man
&
N
icob
ar
Isla
nds,
Ar
unac
hal P
rade
sh
Dha
rbha
nga,
Che
nnai
, Kot
agir
i, D
ehra
dun,
Ah
med
abad
, M
umba
i, Ja
wha
r, Pa
lgha
r, So
lan,
N
ew
Del
hi,
Way
anad
, B
enga
luru
, G
uwah
ati,
Bho
pal,
Gur
ugra
m,
Maj
uli,
Anda
man
s,
Lum
la, T
awan
g
8.Ec
olog
y-W
ater
Adva
nced
Cen
ter f
or W
ater
Res
ourc
es, H
yder
abad
Urb
an L
ab F
ound
atio
n,
Bio
me
Envi
ronm
enta
l Tru
stM
ahar
asht
ra,
Kar
nata
ka,
Tela
ngan
aPu
ne, B
enga
luru
, Hyd
erab
ad
9.Ec
olog
y-B
iodi
vers
ity
Wip
ro F
ound
atio
nM
ahar
asht
ra, K
arna
taka
Pune
, Ben
galu
ru
10.
Ren
ewab
le E
nerg
yD
irec
t Im
plem
enta
tion
Kar
nata
ka, M
ahar
asht
ra, T
amil
Nad
uB
enga
luru
, M
ysur
u,
Pune
, Co
imba
tore
, Che
nnai
11.
Com
mun
ity
Ecol
ogy
Has
iru
Dal
aK
arna
taka
Ben
galu
ru, M
ysur
u
12.
Sust
aina
bilit
y Ad
voca
cy a
nd
Res
earc
hCa
re E
arth
Tru
st, C
ounc
il of
Phi
lant
hrop
ies
for
Clim
ate
Chan
ge, N
atio
nal
Cent
er fo
r Bio
logi
cal S
cien
ces,
SPA
RK
, Sva
pnya
Fou
ndat
ion
Kar
nata
ka, T
amil
Nad
uCh
enna
i, B
enga
luru
13.
Rur
al li
velih
ood
prog
ram
sR
ehob
oth
Sust
aina
ble
Dev
elop
men
t Fo
unda
tion
, Th
e Ev
ange
lical
Fe
llow
ship
of I
ndia
(EFI
COR
)Ta
mil
Nad
u, K
eral
a, O
dish
aCo
imba
tore
, Ala
ppuz
ha, P
uri
14.
Prot
ecti
on o
f nat
iona
l he
rita
ge, a
rt a
nd c
ultu
reAr
t and
Pho
togr
aphy
Fou
ndat
ion
Kar
nata
kaB
enga
luru
15.
COVI
D-1
9 M
edic
al
Infr
astr
uctu
reD
irec
t Im
plem
enta
tion
Mah
aras
htra
Pune
120

Integrated Annual Report 2020-21Wipro Limited
Corporate Governance Report
I. WIPRO’S PHILOSOPHY ON CORPORATE GOVERNANCE
Wipro’s governance framework is driven by the objective of enhancing long term stakeholder value without compromising on ethical standards and corporate social responsibilities. Efficient corporate governance requires a clear understanding of the respective roles of the Board of Directors (“Board”) and of senior management and their relationships with others in the
corporate structure. Sincerity, fairness, good citizenship and commitment to compliance are key characteristics that drive relationships of the Board and senior management with other stakeholders.
Corporate governance philosophy of Wipro flows from the “Spirit of Wipro” which represents core values by which policies and practices of the organization are guided. The values encapsulated in the “Spirit of Wipro” are:
Unyielding integrity in everything we do
Be passionate about clients’ success
Treat each person with respect
Be global and responsible
While our Company has transformed many times over the years, the Spirit of Wipro and our core values, have remained constant.
Our Chairman introduced the Five Habits essential to drive a Growth Mindset in early 2020, which are our values in action:
• Being respectful
• Being responsive
• Always communicating
• Demonstrating stewardship
• Building trust
So far, over 21,000 employees globally have been part of 75 immersive and interactive sessions hosted by our senior leadership team on the Five Habits.
Corporate governance at Wipro is implemented through robust board governance processes, internal control systems and processes, and strong audit mechanisms. These are articulated through the Company’s Code of Business Conduct, Corporate Governance Guidelines and charters of various sub-committees of the Board and the Company’s Disclosure Policy. Wipro’s corporate governance practices can be described through the following four layers:
a) Governance by Shareholders
b) Governance by Board of Directors
c) Governance by Sub-committees of Board, and
d) Governance through management process
In this report, we have provided details on how the corporate governance principles are put in to practice within Wipro.
II. SHAREHOLDERS
The Companies Act, 2013, Securities and Exchange Board of India (Listing Obligations and Disclosure Requirements) Regulations, 2015 (“Listing Regulations”) and New York Stock Exchange (NYSE) Listed Company Manual prescribe the governance mechanism by shareholders in terms of passing of ordinary and special resolutions, voting rights, participation in the corporate actions such as bonus issue, buyback of shares, declaration of dividend, etc. Your Company follows a robust process to ensure that the shareholders of the Company are well informed of Board decisions both on financial and non-financial matters and adequate notice with a detailed explanation is sent to the shareholders well in advance to obtain necessary approvals.
III. BOARD OF DIRECTORS1. Composition of Board
As at March 31, 2021, our Board had two Executive Directors, six non-executive Independent Directors and one non-executive non-independent Director. The Executive Chairman and Whole Time Director, and the non-executive non-independent Director are Promoter Directors. The Chief Executive Officer (CEO) and Managing Director is a professional CEO who is responsible for the day to day operations of the Company. Of the seven Non-Executive Directors, six are Independent Directors, free from any business or other relationship that could materially influence their judgment. In the opinion of the Board, all the Independent Directors are independent of the management and satisfy the criteria of independence as defined under the Companies Act, 2013, the Listing Regulations and the NYSE Listed Company manual.
121

Corporate Governance Report
The Board is well diversified and consists of a woman Independent Director and three Directors who are foreign nationals. The profiles of our Directors are available on our website at https://www.wipro.com/leadership.
2. Board Meetings We decide about the Board meeting dates in
consultation with the Board members. The schedule of the Board meetings and Board Committee meetings is communicated in advance to the Directors to enable them to attend the meetings.
Our Board meetings are normally scheduled over two days. In addition, every quarter, Independent Directors meet amongst themselves exclusively. In line with Para 4 of Schedule B of SEBI (Prohibition of Insider Trading) Regulations, 2015, it is the endeavor of the Company that the gap between the clearance of accounts by audit committee and board meeting is as narrow as possible, and Wipro is committed to adhere to this requirement.
3. Information flow to the Board Members Information is provided to the Board Members on a
continuous basis for their review, inputs and approval from time to time. More specifically, we present our annual Strategic Plan and Operating Plans of our business to the Board for their review, inputs and approval. Likewise, our quarterly financial statements and annual financial statements are first presented to the Audit Committee and subsequently to the Board for their approval. In addition, various matters such as appointment of Directors and Key Managerial Personnel, corporate actions, review of internal and statutory audits, details of investor grievances, specific cases of acquisitions, important managerial decisions, material positive/negative developments and legal/statutory matters are presented to the respective Committees of the Board and later with the recommendation of Committees to the Board of Directors for their approval as may be required.
As a system, in most cases, information to Directors is submitted along with the agenda papers well in advance of the Board meeting. Inputs and feedback of Board Members are taken and considered while preparation of agenda and documents for the Board meeting.
Documents containing Unpublished Price Sensitive Information are submitted to the Board and Committee Members, at a shorter notice, as per the general consent taken from the Board, from time to time.
Post-Meeting Follow-Up System After the Board meeting, we have formal system of
follow-up, review and reporting on actions taken by the management on the decisions of the Board and sub-committees of the Board.
4. Appointment of Directors The Board has adopted the provisions with respect
to appointment and tenure of Independent Directors consistent with the Companies Act, 2013 and the Listing Regulations.
As per the provisions of the Companies Act, 2013, the Independent Directors shall be appointed for not more than two terms of maximum of five years each and shall not be liable to retire by rotation.
At the time of appointment of an Independent Director, the Company issues a formal letter of appointment outlining his/her role, function, duties and responsibilities as a Director. The template of the letter of appointment is available on our website at h t t p s : //w w w.w i p ro.c o m / i nv e s to rs /c o r p o ra te -governance/.
Details of Directors proposed for appointment/re-appointment at the 75th Annual General Meeting (“AGM”) is provided at page no. 91 as part of the Board’s Report and in the notice convening the 75th AGM.
Lead Independent Director The Board has designated Mr. M. K. Sharma as
the Lead Independent Director. The role of the Lead Independent Director is described in the Corporate Governance guidelines of your Company and is available on the Company’s website at h t t p s : //w w w.w i p ro.c o m / i nv e s to rs /c o r p o ra te -governance/.
5. Policy for Nomination of Directors, their Remuneration and Board Diversity
The Board Governance, Nomination and Compensation Committee has adopted a policy which, inter alia, deals with the manner of selection of Directors and payment of their remuneration as described herein below.
The Company has also adopted a policy on Board Diversity which guides the organization’s approach to diversity in the composition of the Board.
Criteria for Selection of Independent Directors and Key Skills, Expertise, and Core Competencies of the Board
The Board of the Company comprises of eminent personalities and leaders in their respective fields. These Directors are nominated based on well-defined
122

Integrated Annual Report 2020-21Wipro Limited
selection criteria. The Board Governance, Nomination and Compensation Committee considers, inter alia, experience, qualifications, skills, expertise and competencies, whilst recommending to the Board the candidature for appointment as Independent Director.
In case of appointment of Independent Directors, the Board Governance, Nomination and Compensation Committee satisfies itself about the independence of the Directors vis-à-vis the Company to enable the Board to function independently of the management and discharge its functions and duties effectively. In case of re-appointment of Independent Directors, the Board also takes into consideration, the performance
evaluation and engagement level of the Independent Directors.
The Board Governance, Nomination and Compensation Committee ensures that the candidates identified for appointment as Directors are not disqualified for appointment under Section 164 and other applicable provisions of the Companies Act, 2013.
As required under Rule 6 of the Companies (Appointment and Qualification of Directors) Rules, 2014, all the Independent Directors have completed the registration with the Independent Directors Databank and, wherever required, also completed the online proficiency test, conducted by Indian Institute of Corporate Affairs.
In the opinion of the Board and the Board Governance, Nomination and Compensation Committee, the following is a list of core skills/expertise/competencies required in the context of the Company’s business and which are available with the Board:
Wide management and leadership experience
Strong management and leadership experience, including in areas of business development, strategic planning and mergers and acquisitions, ideally with major public companies with successful multinational operations in technology, manufacturing, banking, investments and finance, international business, scientific research and development, senior level government experience and academic administration.
Information Technology Expertise or experience in information technology business, technology consulting and operations, emerging areas of technology such as digital, cloud and cyber security, intellectual property in information technology domain, and knowledge of technology trends.
Diversity Diversity of thought, experience, knowledge, perspective, gender and culture brought to the Board by individual members. Varied mix of strategic perspectives, geographical focus with knowledge and understanding of key geographies.
Functional and managerial experience
Knowledge and skills in accounting and finance, business judgment, general management practices and processes, crisis response and management, industry knowledge, macro-economic perspectives, human resources, labour laws, international markets, sales and marketing, and risk management.
Personal values Personal characteristics matching the Company’s values, such as integrity, accountability, and high performance standards.
Corporate governance Experience in developing and implementing good corporate governance practices, maintaining board and management accountability, managing stakeholders’ interests and Company’s responsibilities towards customers, employees, suppliers, regulatory bodies and the communities in which it operates. Experience in boards and committees of other large companies.
Given below is a list of core skills, expertise and competencies of the individual Directors:
Name of Director
Skills/Expertise/CompetenciesWide Management
and Leadership experience1
Information Technology
DiversityFunctional and
Managerial Experience1
Personal Values
Corporate Governance
Mr. Rishad A. Premji
Mr. Azim H. Premji
Mr. Thierry Delaporte2
Mr. William Arthur Owens
Mr. M. K. Sharma -
Mrs. Ireena Vittal
Dr. Patrick J. Ennis
Mr. Patrick Dupuis
Mr. Deepak M. Satwalekar3 1 These skills/competencies are broad-based, encompassing several areas of expertise/experience. Each Director may possess varied combinations of skills/experience within the described set of parameters, and it is not necessary that all Directors possess all skills/experience listed therein.
2 Mr. Thierry Delaporte was appointed as the Chief Executive Officer and Managing Director for a term of 5 years with effect from July 6, 2020 to July 5, 2025.3 Mr. Deepak M. Satwalekar was appointed as an Independent Director for a term of 5 years with effect from July 1, 2020 to June 30, 2025.
123

6. Familiarization Programme and Training for Independent Directors
The Company has an orientation process/familiarization programme for its independent directors that includes:
a) Briefing on their role, responsibilities, duties, and obligations as a member of the Board.
b) Nature of business and business model of the Company, Company’s strategic and operating plans.
c) Matters relating to Corporate Governance, Code of Business Conduct, Risk Management, Compliance Programs, Internal Audit, etc.
As a process when a new independent director is appointed, a familiarization programme as described above is conducted by the senior management team and whenever a new member is appointed to a Board Committee, information relevant to the functioning of the Committee and the role and responsibility of Committee members is informed. Each of our independent directors have attended such orientation process/familiarization programme when they were inducted into the Board.
As part of ongoing training, the Company schedules quarterly meetings of business heads and functional heads with the Independent Directors. During these meetings, comprehensive presentations are made on the various aspects such as business models, new business strategies and initiatives by Business Leaders, risk minimization procedures, recent trends in technology, changes in domestic/overseas industry scenario, Digital Transformation, state of Global IT Services industry, and regulatory regime affecting the Company globally. These meetings also facilitate Independent Directors to provide their inputs and suggestions on various strategic and operational matters directly to the business and functional heads. The details of the familiarization programme are also available on the website of the Company at https://www.wipro.com/content/dam/nexus/en/investor/corporate-governance/policies-and-guidelines/ethical-guidelines/12771-familiarization-programmes-imparted-to-independent-directors.pdf.
7. Succession Planning
We have an effective mechanism for succession planning which focuses on orderly succession of Directors, including Executive Directors and other senior management team and other executive officers. The Board Governance, Nomination and Compensation Committee implements this mechanism in concurrence with the Board.
The Board Governance, Nomination and Compensation Committee presents to the Board on a periodic basis, succession plans for appointments to the Board based on various factors such as current tenure of Directors, outcome of performance evaluation, Board diversity and business requirements. In addition, the Company conducts an annual Talent Review Process for senior management and other executive officers which provides a leadership-level talent inventory and capability map that reflects the extent to which critical talent needs are fulfilled vis-a-vis business drivers.
The Board Governance, Nomination and Compensation Committee reviews the outcome of this process and presents the succession plan for senior management and other executive officers to the Board.
8. Board Evaluation
Details of methodology adopted for Board evaluation have been provided at page no. 92 of the Board’s Report.
9. Remuneration Policy and Criteria for Making Payments to Directors, Senior Management and Key Managerial Personnel
The Independent Directors are entitled to receive remuneration by way of sitting fees, reimbursement of expenses for participation in the Board/Committee meetings and commission as detailed hereunder:
a) Sitting fees for each meeting of the Board or Committee of the Board attended by him or her, of such sum as may be approved by the Board within the overall limits prescribed under the Companies Act, 2013.
b) Commission on a quarterly basis, of such sum as may be approved by the Board and Members on the recommendation of the Board Governance, Nomination and Compensation Committee. The aggregate commission payable to all the Independent Directors and non-executive directors put together shall not exceed 1% of the net profits of the Company during any financial year. The commission is payable on pro-rata basis to those Directors who occupy office for part of the year.
c) Reimbursement of travel, stay and other expenses for participation in Board/Committee meetings.
d) Independent Directors and Promoter Directors are not entitled to participate in the stock option schemes of the Company.
Following are terms and conditions for determining the remuneration to Mr. Azim H. Premji, who is a Non-Executive, Non-Independent Director:
Corporate Governance Report
124

Integrated Annual Report 2020-21Wipro Limited
a) Remuneration as applicable to other Non-Executive Directors of the Company, in addition to the sitting fees for attending the meetings of the Board thereof, as may be determined by the Board, provided however that the aggregate remuneration, including commission, paid to the Directors other than the Managing Director and Whole Time Directors in a financial year shall not exceed 1% of the net profits of the Company, in terms of Section 197 of the Companies Act, 2013 and computed in the manner referred to in Section 198 of the Companies Act, 2013.
b) Maintenance of Founder Chairman’s office including executive assistant at Company’s expense.
c) Reimbursement of travel, stay and entertainment expenses actually and properly incurred in the course of business as per the Company’s policy.
In determining the remuneration of Chairman, CEO and Managing Director, and Senior Management Employees and Key Managerial Personnel, the Board Governance, Nomination and Compensation Committee and the Board shall ensure/consider the following:
a) The balance between fixed and variable pay reflecting short and long-term performance objectives, appropriate to the working of the Company and its goals.
b) Alignment of remuneration of Key Managerial Personnel and Directors with long-term interests of the Company.
c) Company’s performance vis-à-vis the annual achievement, individuals’ performance vis-à-vis KRAs/KPIs, industry benchmark and current compensation trends in the market.
The Board Governance, Nomination and Compensation Committee recommends the remuneration for the Chairman, CEO and Managing Director, Senior Management and Key Managerial Personnel. The payment of remuneration to the Executive Directors and Non-Executive Directors is approved by the Board and Members. Approval of Members is also obtained in case of remuneration payable to Non-Executive Directors. There was no change to the remuneration policy during the financial year.
Details of Remuneration to DirectorsDetails of remuneration paid to the Directors for the services rendered and stock options granted during the financial year 2020-21 are given below. No stock options were granted to any of the Independent Directors and Promoter Directors during the financial year 2020-21.
(in ` Million)
Rishad A. Premji(2)(3)
Thierry Delaporte(1)(4)(5)
Azim H. Premji
William Arthur
Owens(1)M. K.
SharmaIreena Vittal
Patrick J. Ennis(1)
Patrick Dupuis(1)
Deepak M. Satwalekar(6)
Arundhati Bhattacharya(7)
Abidali Z. Neemuchwala(1)(8)
Relationship with directors Son of Azim H. Premji
None Father of Rishad A.
Premji
None None None None None None None None
Salary 14.30 68.63 NA NA NA NA NA NA NA NA 14.14
Allowances 43.93 27.40 NA NA NA NA NA NA NA NA NA
Commission/Incentives/Variable Pay
55.68 112.79 7.15 29.21 11.60 10.24 20.73 20.73 6.65 2.22 2.42
Other annual compensation 0.17 379.19 NA NA NA NA NA NA NA NA 6.15
Retirals 3.86 55.49 NA NA NA NA NA NA NA NA 0.002
Sitting fees NA NA 0.60 0.60 0.60 0.60 0.60 0.60 0.40 0.20 NA
TOTAL 117.94 643.50 7.75 29.81 12.20 10.84 21.33 21.33 7.05 2.42 22.72
Grant of ADS Restricted Stock Units during the year
NA 1,500,000 NA NA NA NA NA NA NA NA NA
Notice period Up to 180 days
Up to 180 days NA NA NA NA NA NA NA NA NA
Figures in the above table are subject to rounding-off adjustments
Notes:
(1) Figures mentioned in ` are equivalent to amounts paid in foreign currency, wherever applicable.
(2) Mr. Rishad A. Premji is entitled to a commission at the rate of 0.35% on incremental consolidated net profits of Wipro Limited for fiscal year 2021 over the previous year, computed in accordance with the provisions of the Companies Act, 2013.
(3) Mr. Rishad A. Premji’s compensation also included cash bonus (part of his allowances) on an accrual basis, which is payable over a period of time.
(4) The compensation disclosed for Mr. Thierry Delaporte is for the period from July 6, 2020 to March 31, 2021. It includes components such as a one-time cash award, annual stock grant which will vest as per the vesting pattern approved by the Board Governance, Nomination and Compensation Committee (1,200,000 ADS restricted stock units, comprising of 300,000 ADS restricted stock units expiring in July 2024 and 900,000 ADS
125
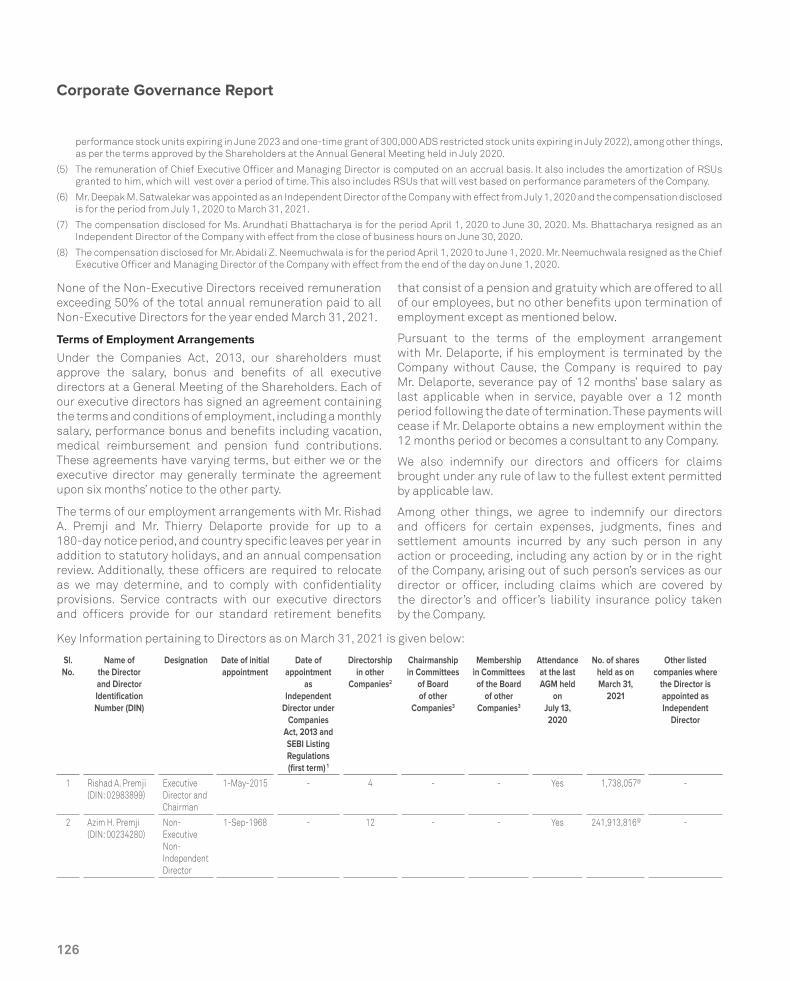
performance stock units expiring in June 2023 and one-time grant of 300,000 ADS restricted stock units expiring in July 2022), among other things, as per the terms approved by the Shareholders at the Annual General Meeting held in July 2020.
(5) The remuneration of Chief Executive Officer and Managing Director is computed on an accrual basis. It also includes the amortization of RSUs granted to him, which will vest over a period of time. This also includes RSUs that will vest based on performance parameters of the Company.
(6) Mr. Deepak M. Satwalekar was appointed as an Independent Director of the Company with effect from July 1, 2020 and the compensation disclosed is for the period from July 1, 2020 to March 31, 2021.
(7) The compensation disclosed for Ms. Arundhati Bhattacharya is for the period April 1, 2020 to June 30, 2020. Ms. Bhattacharya resigned as an Independent Director of the Company with effect from the close of business hours on June 30, 2020.
(8) The compensation disclosed for Mr. Abidali Z. Neemuchwala is for the period April 1, 2020 to June 1, 2020. Mr. Neemuchwala resigned as the Chief Executive Officer and Managing Director of the Company with effect from the end of the day on June 1, 2020.
None of the Non-Executive Directors received remuneration exceeding 50% of the total annual remuneration paid to all Non-Executive Directors for the year ended March 31, 2021.
Terms of Employment Arrangements
Under the Companies Act, 2013, our shareholders must approve the salary, bonus and benefits of all executive directors at a General Meeting of the Shareholders. Each of our executive directors has signed an agreement containing the terms and conditions of employment, including a monthly salary, performance bonus and benefits including vacation, medical reimbursement and pension fund contributions. These agreements have varying terms, but either we or the executive director may generally terminate the agreement upon six months’ notice to the other party.
The terms of our employment arrangements with Mr. Rishad A. Premji and Mr. Thierry Delaporte provide for up to a 180-day notice period, and country specific leaves per year in addition to statutory holidays, and an annual compensation review. Additionally, these officers are required to relocate as we may determine, and to comply with confidentiality provisions. Service contracts with our executive directors and officers provide for our standard retirement benefits
that consist of a pension and gratuity which are offered to all of our employees, but no other benefits upon termination of employment except as mentioned below.
Pursuant to the terms of the employment arrangement with Mr. Delaporte, if his employment is terminated by the Company without Cause, the Company is required to pay Mr. Delaporte, severance pay of 12 months’ base salary as last applicable when in service, payable over a 12 month period following the date of termination. These payments will cease if Mr. Delaporte obtains a new employment within the 12 months period or becomes a consultant to any Company.
We also indemnify our directors and officers for claims brought under any rule of law to the fullest extent permitted by applicable law.
Among other things, we agree to indemnify our directors and officers for certain expenses, judgments, fines and settlement amounts incurred by any such person in any action or proceeding, including any action by or in the right of the Company, arising out of such person’s services as our director or officer, including claims which are covered by the director’s and officer’s liability insurance policy taken by the Company.
Key Information pertaining to Directors as on March 31, 2021 is given below:
Sl. No.
Name of the Director and Director Identification Number (DIN)
Designation Date of initial appointment
Date of appointment
as Independent
Director under Companies
Act, 2013 and SEBI Listing Regulations (first term) 1
Directorship in other
Companies2
Chairmanship in Committees
of Board of other
Companies3
Membership in Committees of the Board
of other Companies3
Attendance at the last AGM held
on July 13, 2020
No. of shares held as on March 31,
2021
Other listed companies where
the Director is appointed as Independent
Director
1 Rishad A. Premji (DIN: 02983899)
Executive Director and Chairman
1-May-2015 - 4 - - Yes 1,738,057@ -
2 Azim H. Premji (DIN: 00234280)
Non-Executive Non- Independent Director
1-Sep-1968 - 12 - - Yes 241,913,816@ -
Corporate Governance Report
126

Integrated Annual Report 2020-21Wipro Limited
Sl. No.
Name of the Director and Director Identification Number (DIN)
Designation Date of initial appointment
Date of appointment
as Independent
Director under Companies
Act, 2013 and SEBI Listing Regulations (first term) 1
Directorship in other
Companies2
Chairmanship in Committees
of Board of other
Companies3
Membership in Committees of the Board
of other Companies3
Attendance at the last AGM held
on July 13, 2020
No. of shares held as on March 31,
2021
Other listed companies where
the Director is appointed as Independent
Director
3 Thierry Delaporte (DIN: 08107242)
Chief Executive Officer and Managing Director
6-Jul-2020 - - - - Yes - -
4 William Arthur Owens (DIN: 00422976)
Independent Director
1-Jul-2006 23-Jul-2014 - - - Yes - -
5 M. K. Sharma (DIN: 00327684)
Independent Director
1-Jul-2011 23-Jul-2014 9 3 2 Yes - 1. Asian Paints Limited
2. United Spirits Limited
3. Ambuja Cements Limited
4. Vedanta Limited
6 Ireena Vittal (DIN: 05195656)
Independent Director
1-Oct-2013 23-Jul-2014 5 - 2 Yes - 1. Godrej Consumer Products Limited
2. Housing Development Finance Corporation Limited
7 Patrick J. Ennis (DIN: 07463299)
Independent Director
1-Apr-2016 1-Apr-2016 - - - Yes - -
8 Patrick Dupuis (DIN: 07480046)
Independent Director
1-Apr-2016 1-Apr-2016 - - - Yes - -
9 Deepak M. Satwalekar (DIN: 00009627)
Independent Director
1-Jul-2020 1-Jul- 2020 5 1 1 Yes - 1. Piramal Enterprises Limited
2. Asian Paints Limited
3. Home First Finance Company India Limited
4. Piramal Capital & Housing Finance Limited
1. At the 70th AGM, Mr. M. K. Sharma was re-appointed as Independent Director for a second term from July 1, 2016 to June 30, 2021. At the 71st AGM, Mr. William Arthur Owens was re-appointed as Independent Director for a second term from August 1, 2017 to July 31, 2022. At the 72nd AGM, Mrs. Ireena Vittal was re-appointed as Independent Director for a second term from October 1, 2018 to September 30, 2023. At the 74th AGM, Mr. Thierry Delaporte was appointed as the Chief Executive Officer and Managing Director of the Company to hold office for a period
of five years from July 6, 2020 to July 5, 2025. At the 74th AGM, Mr. Deepak M. Satwalekar was appointed as an Independent Director for a period of five years from July 1, 2020 to June 30, 2025. Dr. Patrick J. Ennis and Mr. Patrick Dupuis were re-appointed as Independent Directors of the Company for a second term of 5 years, with effect from
April 1, 2021 to March 31, 2026. The said re-appointment was approved by shareholders of the Company vide special resolutions dated June 4, 2021, passed through postal ballot by e-voting.
127

2. This does not include position in foreign companies and position as an advisory board member but includes position in private companies and companies under Section 8 of the Companies Act, 2013. None of our Directors hold directorship in more than seven listed companies.
3. In accordance with Regulation 26 of the Listing Regulations, Membership/Chairmanship of only Audit Committees and Stakeholders’ Relationship Committees in all public limited companies have been considered.
@ Includes equity shares held jointly with immediate family members.
IV. COMMITTEES OF BOARD
Our Board has constituted sub-committees to focus on specific areas and make informed decisions within the authority delegated to each of the Committees. Each Committee of the Board is guided by its Charter, which defines the scope, powers and composition of the Committee. All decisions and recommendations of the Committees are placed before the Board for information or approval.
During the financial year, the Board has accepted the recommendations of Committees on matters where such a recommendation is mandatorily required. There have been no instances where such recommendations have not been considered.
We have four sub-committees of the Board as at March 31, 2021:
1. Audit, Risk and Compliance Committee, which also acts as the Risk Management Committee
2. Board Governance, Nomination and Compensation Committee, which also oversees the CSR initiatives of the Company and acts as the CSR Committee
3. Administrative and Shareholders/Investors Grievance Committee (Stakeholders Relationship Committee)
4. Strategy Committee
1. Audit, Risk and Compliance CommitteeThe Audit, Risk and Compliance Committee of our Board reviews, acts on and reports to our Board with respect to various auditing and accounting matters. The primary responsibilities include overseeing:
a) Auditing and accounting matters, including recommending the appointment of our independent auditors to the shareholders;
b) Compliance with legal and statutory requirements;
c) Integrity of the Company’s financial statements, discussions with the independent auditors regarding the scope of the annual audits, and fees to be paid to the independent auditors;
d) Performance of the Company’s internal audit function, independent auditors and accounting practices;
e) Review of related party transactions and functioning of whistle blower mechanism;
f) Implementation of the applicable provisions of the Sarbanes Oxley Act of 2002 (the “Sarbanes Oxley Act”), including review of the progress of internal control mechanisms to prepare for certification under Section 404 of the Sarbanes Oxley Act;
g) Evaluation of internal financial controls, risk management systems and policies including review of cyber security;
h) Review of utilization of loans and advances from, and investment by, the Company in its subsidiaries exceeding ` 100 crore or 10% of the asset size of the subsidiary, whichever is lower, including existing loans, advances and investments; and
i) Such other matters and activities as the Committee deems necessary for fulfilment of the above or as may be approved by the Board of Directors or as may be prescribed by applicable law from time to time.
The Audit, Risk and Compliance Committee also acts as the Risk Management Committee in compliance with the Listing Regulations. The Committee reviews, acts on and reports to our Board with respect to risk management matters. The primary responsibilities include the following:
a) To formulate a detailed risk management policy which shall include:
• A framework for identification of internal and external risks specifically faced by the Company, in particular including financial, operational, sectoral, sustainability (specifically, Environmental, Social and Governance related risks and impact), information and cyber security risks.
• Measures for risk mitigation
• Systems for internal controls
• Business contingency plan
b) To monitor and oversee implementation of the risk management policy, including evaluating the adequacy of risk management and internal control systems;
c) Ensure that appropriate methodology, processes and systems are in place to monitor and evaluate risks associated with the business of the listed entity;
Corporate Governance Report
128

Integrated Annual Report 2020-21Wipro Limited
d) Evaluate risks related to cyber security and significant risk exposures of the Company and assess steps taken by the management to mitigate the exposures in a timely manner (including business continuity and disaster recovery planning);
e) To review the risk management policy on annual basis, including by considering the changing industry dynamics and evolving complexity;
f) To keep the Board of Directors informed about the nature and content of its discussions, recommendations and actions to be taken; and
g) The appointment, removal and terms of remuneration of the Chief Risk Officer (if any) shall be subject to review by the Audit, Risk and Compliance Committee, jointly with the Board Governance, Nomination and Compensation Committee.
Mr. Deepak Acharya has been appointed as the Chief Risk Officer of the Company.
The detailed charter of the Committee is posted on our website and available at https://www.wipro.com/investors/corporate-governance/. All members of our Audit, Risk and Compliance Committee are Independent Directors and financially literate. The Chairman of our Audit, Risk and Compliance Committee has the accounting and financial management related expertise.
Statutory Auditors as well as Internal Auditors always have independent meetings with the Audit, Risk and Compliance Committee and also participate in the Audit, Risk and Compliance Committee meetings. Our Chief Financial Officer, General Counsel, Internal Auditor, Finance Controller and other Corporate Officers make periodic presentations to the Audit, Risk and Compliance Committee on various issues.
Mr. M. K. Sharma, Independent Director, is the Chairman of the Audit, Risk and Compliance Committee. The other members of the Committee as at March 31, 2021 were Mrs. Ireena Vittal and Mr. Deepak M. Satwalekar. The Chairman of the Committee was present at the AGM held on July 13, 2020.
2. Board Governance, Nomination and Compensation CommitteeThe Board Governance, Nomination and Compensation Committee reviews, acts on and reports to our Board with respect to various governance, nomination and compensation matters. The primary responsibilities include:
a) Developing and recommending to the Board corporate governance guidelines applicable to the Company;
b) Evaluating the Board on a continuing basis, including an assessment of the effectiveness of the full Board, operations of the Board Committees and contributions of individual directors;
c) Establishing policies and procedures to assess the requirements for induction of new members to the Board;
d) Implementing policies and processes relating to corporate governance principles;
e) Ensuring that appropriate procedures are in place to assess Board membership needs and Board effectiveness;
f) Reviewing the Company’s policies that relate to matters of corporate social responsibility (CSR), including public issues of significance to the Company and its shareholders;
g) Formulating the Disclosure Policy, its review and approval of disclosures;
h) Approving and evaluating the compensation plans, policies and programs for full-time directors and senior management;
i) Acting as Administrator of the Company’s Employee Stock Option Plans and Employee Stock Purchase Plans drawn up from time to time; and
j) Reviewing and recommending of all remuneration, in whatever form, payable to senior management.
The detailed charter of Board Governance, Nomination and Compensation Committee is posted on our website and is available at https://www.wipro.com/investors/corporate-governance/.
Our Chief Human Resources Officer makes periodic presentations to the Board Governance, Nomination and Compensation Committee on compensation reviews and performance linked compensation recommendations. All members of the Board Governance, Nomination and Compensation Committee are independent non-executive directors. The Board Governance, Nomination and Compensation Committee is the apex body that oversees our Corporate Social Responsibility policy and programs.
Mr. William Arthur Owens, Independent Director, is the Chairman of the Board Governance, Nomination and Compensation Committee. The other members of the Committee as at March 31, 2021 were Mrs. Ireena Vittal and Mr. M. K. Sharma. The Chairman of the Committee was present at the AGM held on July 13, 2020.
3. Administrative and Shareholders/Investors Grievance Committee (Stakeholders Relationship Committee)
The Administrative and Shareholders/Investors Grievance Committee carries out the role of
129

Stakeholders Relationship Committee in compliance with Section 178 of the Companies Act, 2013 and the Listing Regulations.
The Administrative and Shareholders/Investors Grievance Committee reviews, acts on and reports to our Board with respect to various matters relating to stakeholders. The primary responsibilities include:
a) Redressal of Grievances of the shareholders of the Company pertaining to transfer or transmission of shares, non-receipt of annual report and declared dividends, issue of new or duplicate share certificates, and grievances pertaining to corporate actions;
b) Approving consolidation, split or sub-division of share certificates, transmission of shares, issue of duplicate share certificates, re-materialization of shares;
c) Reviewing the grievance redressal mechanism implemented by the Company in coordination with Company’s Registrar and Transfer Agent (“RTA”) from time to time;
d) Reviewing the measures taken by the Company for effective exercise of voting rights by shareholders;
e) Implementing and overseeing the procedures and processes in handling and maintenance of records, transfer of securities and payment of dividend by the Company, RTA and dividend processing bank;
f) Reviewing the various measures and initiatives taken by the Company for reducing the quantum of unclaimed dividends and ensuring timely receipt of dividend warrants, annual reports and statutory notices by the shareholders of the Company.
g) Overseeing administrative matters like opening and closure of Company’s bank accounts, grant and revocation of general, specific and banking powers of attorney; and
h) Considering and approving allotment of equity shares pursuant to exercise of stock options, setting up branch offices and other administrative matters as delegated by Board from time to time.
The detailed charter of the Committee is available on our website at https://www.wipro.com/investors/corporate-governance/.
Mr. M. K. Sharma, Independent Director, is the Chairman of the Administrative and Shareholders/Investors Grievance Committee. The other members of the Committee as at March 31, 2021 were Mr. Deepak M. Satwalekar and Mr. Rishad A. Premji. The Chairman of the Committee was present at the Annual General Meeting of the Company held on July 13, 2020.
Mr. M. Sanaulla Khan, Company Secretary, is our Compliance Officer under the Listing Regulations.
Status Report of investor queries and complaints for the period from April 1, 2020 to March 31, 2021 is given below:
Sl. No. Particulars No. of
Complaints1. Investor complaints pending at the
beginning of the yearNIL
2. Investor complaints received during the year
1,374*
3. Investor complaints disposed of during the year
1,332
4. Investor complaints remaining unresolved at the end of the year
42**
* of the 1,374 complaints received, 921 were clarifications regarding buyback of equity shares.
** These queries were received between March 25, 2021 and March 31, 2021, and subsequently responded before April 6, 2021.
Apart from these queries/complaints, there are certain pending cases relating to dispute over title to shares in which in certain cases the Company has been made a party. However, these cases are not material in nature.
4. Strategy CommitteeThe Strategy Committee reviews, acts and reports to our Board with respect to the mission, vision and strategic direction of the Company. Primary responsibilities of this Committee, inter alia, are:
a) Making recommendations to the Board relating to the Company’s mission, vision, strategic initiatives, major programs and services;
b) Ensuring management has established an effective strategic planning process, including development of a three to five-year strategic plan with measurable goals and time targets;
c) Annually reviewing the strategic plan for the Company and for each division and entity as well and recommending updates to the Board;
d) Establishing criteria for management to evaluate potential strategic investments, reviewing proposals for acquisition or divestment opportunities for the Company and making appropriate recommendations to the Board, and reviewing post-transaction integration matters; and
e) Monitoring the Company performance against measurable targets (e.g. market share, increase in revenue, or Operating Margin) or progress points (such as emerging technologies).
Corporate Governance Report
130
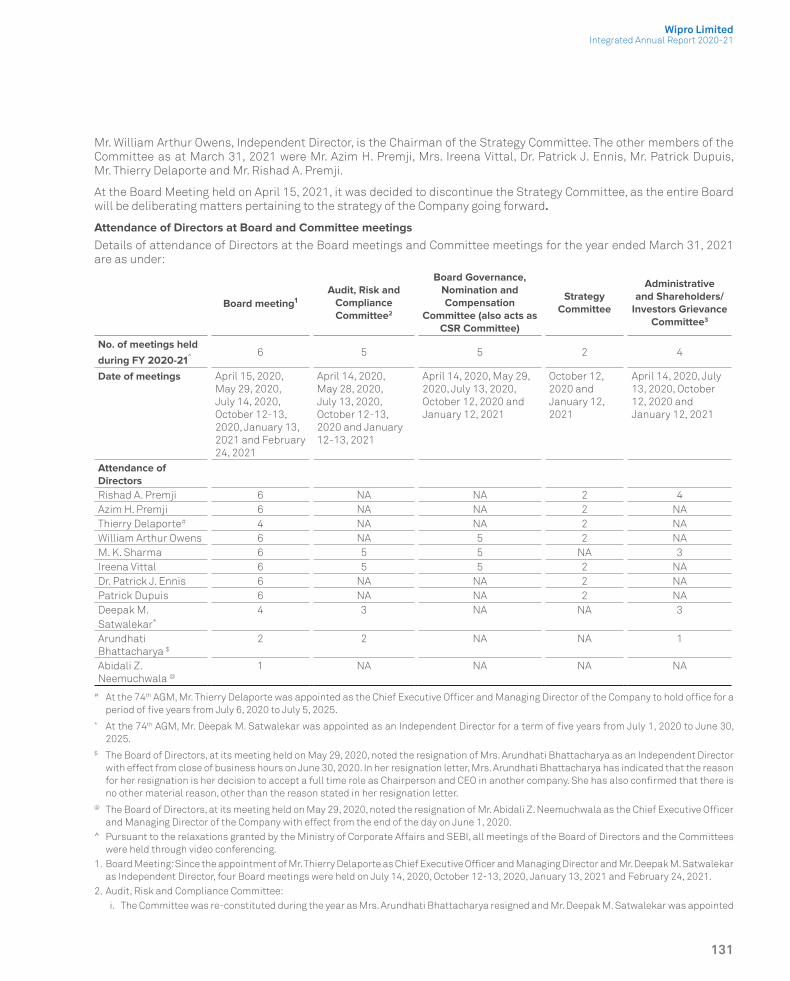
Integrated Annual Report 2020-21Wipro Limited
Mr. William Arthur Owens, Independent Director, is the Chairman of the Strategy Committee. The other members of the Committee as at March 31, 2021 were Mr. Azim H. Premji, Mrs. Ireena Vittal, Dr. Patrick J. Ennis, Mr. Patrick Dupuis, Mr. Thierry Delaporte and Mr. Rishad A. Premji.
At the Board Meeting held on April 15, 2021, it was decided to discontinue the Strategy Committee, as the entire Board will be deliberating matters pertaining to the strategy of the Company going forward.
Attendance of Directors at Board and Committee meetingsDetails of attendance of Directors at the Board meetings and Committee meetings for the year ended March 31, 2021 are as under:
Board meeting1Audit, Risk and
Compliance Committee2
Board Governance, Nomination and Compensation
Committee (also acts as CSR Committee)
Strategy Committee
Administrative and Shareholders/
Investors Grievance Committee3
No. of meetings held
during FY 2020-21^ 6 5 5 2 4
Date of meetings April 15, 2020, May 29, 2020, July 14, 2020, October 12-13, 2020, January 13, 2021 and February 24, 2021
April 14, 2020, May 28, 2020, July 13, 2020, October 12-13, 2020 and January 12-13, 2021
April 14, 2020, May 29, 2020, July 13, 2020, October 12, 2020 and January 12, 2021
October 12, 2020 and January 12, 2021
April 14, 2020, July 13, 2020, October 12, 2020 and January 12, 2021
Attendance of DirectorsRishad A. Premji 6 NA NA 2 4Azim H. Premji 6 NA NA 2 NAThierry Delaporte# 4 NA NA 2 NAWilliam Arthur Owens 6 NA 5 2 NAM. K. Sharma 6 5 5 NA 3Ireena Vittal 6 5 5 2 NADr. Patrick J. Ennis 6 NA NA 2 NAPatrick Dupuis 6 NA NA 2 NADeepak M.Satwalekar*
4 3 NA NA 3
Arundhati Bhattacharya $
2 2 NA NA 1
Abidali Z. Neemuchwala @
1 NA NA NA NA
# At the 74th AGM, Mr. Thierry Delaporte was appointed as the Chief Executive Officer and Managing Director of the Company to hold office for a period of five years from July 6, 2020 to July 5, 2025.
* At the 74th AGM, Mr. Deepak M. Satwalekar was appointed as an Independent Director for a term of five years from July 1, 2020 to June 30, 2025.
$ The Board of Directors, at its meeting held on May 29, 2020, noted the resignation of Mrs. Arundhati Bhattacharya as an Independent Director with effect from close of business hours on June 30, 2020. In her resignation letter, Mrs. Arundhati Bhattacharya has indicated that the reason for her resignation is her decision to accept a full time role as Chairperson and CEO in another company. She has also confirmed that there is no other material reason, other than the reason stated in her resignation letter.
@ The Board of Directors, at its meeting held on May 29, 2020, noted the resignation of Mr. Abidali Z. Neemuchwala as the Chief Executive Officer and Managing Director of the Company with effect from the end of the day on June 1, 2020.
^ Pursuant to the relaxations granted by the Ministry of Corporate Affairs and SEBI, all meetings of the Board of Directors and the Committees were held through video conferencing.
1. Board Meeting: Since the appointment of Mr. Thierry Delaporte as Chief Executive Officer and Managing Director and Mr. Deepak M. Satwalekar as Independent Director, four Board meetings were held on July 14, 2020, October 12-13, 2020, January 13, 2021 and February 24, 2021.
2. Audit, Risk and Compliance Committee: i. The Committee was re-constituted during the year as Mrs. Arundhati Bhattacharya resigned and Mr. Deepak M. Satwalekar was appointed
131

as a member of the Committee. Consequently, the composition of the Committee is as follows: Mr. M. K. Sharma (Chairman), Mrs. Ireena Vittal and Mr. Deepak M. Satwalekar (Members).
ii. Since the appointment of Mr. Deepak M. Satwalekar as member of the Committee, there were three Committee meetings held on July 13, 2020, October 12-13, 2020, and January 12-13, 2021.
3. Administrative and Shareholders/Investors Grievance Committee: i. The Committee was re-constituted during the year as Mrs. Arundhati Bhattacharya resigned and Mr. Deepak M. Satwalekar was appointed
as a member of the Committee. Consequently, the composition of the Committee is as follows: Mr. M. K. Sharma (Chairman), Mr. Deepak M. Satwalekar and Mr. Rishad A. Premji (Members).
ii. Since the appointment of Mr. Deepak M. Satwalekar as member of the Committee, there were three Committee meetings held on July 13, 2020, October 12, 2020 and January 12, 2021.
The Chief of Internal Audit reports to the Chairman of the Audit, Risk and Compliance Committee and administratively to the Chief Financial Officer. Chief of Internal Audit has regular and exclusive meetings with the Audit, Risk and Compliance Committee.
The internal audit function is guided by its charter, as approved by the Audit, Risk and Compliance Committee. The internal audit function formulates an annual risk based audit plan based on consultations and inputs from the Board and business leaders and presents it to the Audit, Risk and Compliance Committee for approval. Findings of various audits carried out during the financial year are also periodically presented to the Audit, Risk and Compliance Committee. The internal audit function adopts a risk based audit approach and covers core areas such as compliance audits, financial audits, technology audits, third party risk audits, M&A audits, etc.
The internal audit team comprises of personnel with professional qualifications and certifications in audit and is rich on diversity. The audit team hones its skills through a robust knowledge management program to continuously assimilate the latest trends and skills in the domain and to retain the knowledge gained for future reference and dissemination. The internal audit team re-asserts its independence across all its staff.
A key strategic vision of Internal Audit is auditing in the new digital environment “Auditing Digital and Auditing with Digital”- in line with this, the Internal Audit function has actively adopted Technology and Innovation to be better equipped to carry out audits.
The function, which was the first Indian Internal audit unit to get ISO certified in 1998 and win International award from Institute of Internal Auditors (IIA) in 2002, was also an early adopter of the new ISO 9001:2015 Version. During the year Internal Audit function is assessed to have “Met International Standards” prescribed by the Professional Practice of Internal Auditing issued by “International Institute of Internal Auditors (IIA)” by external firm (KPMG). Testimony to the functions’ innovation and excellence are the IIA awards won in these categories continuously over the last few years.
V. GOVERNANCE THROUGH MANAGEMENT PROCESS
1. Code of Business Conduct
In the year 1983, we articulated ‘Wipro Beliefs’ consisting of six statements. At the core of beliefs was integrity, articulated as “individual and company relationship should be governed by the highest standard of conduct and integrity”.
Over years, this articulation has evolved in form but remained constant in substance. Today, we articulate it as Code of Business Conduct.
In our Company, the Board and all employees have a responsibility to understand and follow the Code of Business Conduct. All employees are expected to perform their work with honesty and integrity. Wipro’s Code of Business Conduct reflects general principles to guide employees in making ethical decisions. This Code is also applicable to our representatives. This Code outlines fundamental ethical considerations as well as specific considerations that need to be maintained for professional conduct. This Code has been displayed on the Company’s website at https://www.wipro.com/investors/corporate-governance/.
2. Internal AuditThe Company has a robust internal audit function which has been in place for last 4 decades with the stated vision of “To be the best in class Internal Audit function globally”. In pursuit of this vision, the function provides an independent, objective assurance services to value-add and improve Operations of Business Units and processes by:
a) Financial, Business Process and Compliance Audit
b) Cyber Defense and Technology Audit
c) Operations Reviews
d) Best Practices and Benchmarking
e) Leadership Development
The function taking cognizance of changes in business climate and technology risks has taken upon itself to infuse and adopt Technology in its operations.
Corporate Governance Report
132

Integrated Annual Report 2020-21Wipro Limited
3. Disclosure PolicyIn line with requirements under Regulation 30 of the Listing Regulations, the Company has framed a policy on disclosure of material events and information as per the Listing Regulations, which is available on our website at https://www.wipro.com/investors/corporate-governance/. The objective of this policy is to have uniform disclosure practices and ensure timely, adequate and accurate disclosure of information on an ongoing basis. The Company has constituted a Disclosure Committee consisting of senior officials, which approves all disclosures required to be made by the Company. Parity in disclosures are maintained through simultaneous disclosure on National Stock Exchange of India Limited, the BSE Limited and the New York Stock Exchange.
4. Policy for Preservation of Documents Pursuant to the requirements under Regulation 9 of
the Listing Regulations, the Board has formulated and approved a Document Retention Policy prescribing the manner of retaining the Company’s documents and the time period up to which certain documents are to be retained. The policy percolates to all levels of the organization who handle the prescribed categories of documents.
5. Other Policies The Company has adopted an Ombuds policy (vigil
mechanism), a policy for prevention, prohibition & redressal of sexual harassment of women at workplace, as well as a code of conduct to regulate, monitor and report insider trading. Details of these are provided as part of the Board’s report.
VI. DISCLOSURES
1. Disclosure of Materially Significant Related Party Transactions
All related party transactions entered during the financial year were at an arm’s length basis and in the ordinary course of business. There are no materially significant related party transactions made by the Company with Promoters, Directors, Key Managerial Personnel or other designated persons which may have a potential conflict with the interest of the Company at large.
As required under Regulation 23 of Listing Regulations, the Company has adopted a policy on Related Party Transactions. The abridged policy on Related Party
Transactions is available on the Company’s website at https://www.wipro.com/content/dam/nexus/en/investor/corporate-gover nance/pol ic ies-and-guidelines/ethical-guidelines/abridged-policy-for-related-party-transactions.pdf.
Apart from receiving director remuneration, none of the Directors has any pecuniary relationships or transactions vis-à-vis the Company. During the year 2020-21, no transactions of material nature were entered by the Company with the Management or their relatives that may have a potential conflict of interest with the Company and the concerned officials have given undertakings to that effect as per the provisions of the Listing Regulations.
The Register under Section 189 of the Companies Act, 2013 is maintained and particulars of the transactions have been entered in the Register, as applicable.
2. Subsidiary Monitoring Framework
All the subsidiary companies of the Company are managed by their Boards having the rights and obligations to manage these companies in the best interest of respective stakeholders. The Company nominates its representatives on the Board of subsidiary companies and monitors performance of such companies, inter alia, by reviewing:
a) Financial statements, the investment, inter-corporate loans/advances made by the unlisted subsidiary companies, statement containing all significant transactions and arrangements entered by the unlisted subsidiary companies forming part of the financials being reviewed by the Audit, Risk and Compliance Committee of the Company on a quarterly basis.
b) Minutes of the meetings of the unlisted subsidiary companies, if any, are placed before the Company’s Board regularly.
c) Providing necessary guarantees, letter of comfort and other support for their day-to-day operations from time-to-time.
As required under Regulation 16(1)(c) and 24 of Listing Regulations, the Company has adopted a policy on determining “material subsidiary” and the said Policy is available on the Company’s website at https://www.wipro.com/content/dam/nexus/en/investor/corporate-gover nance/pol ic ies-and-guidelines/ethical-guidelines/abridged-policy-for-related-party-transactions.pdf.
133
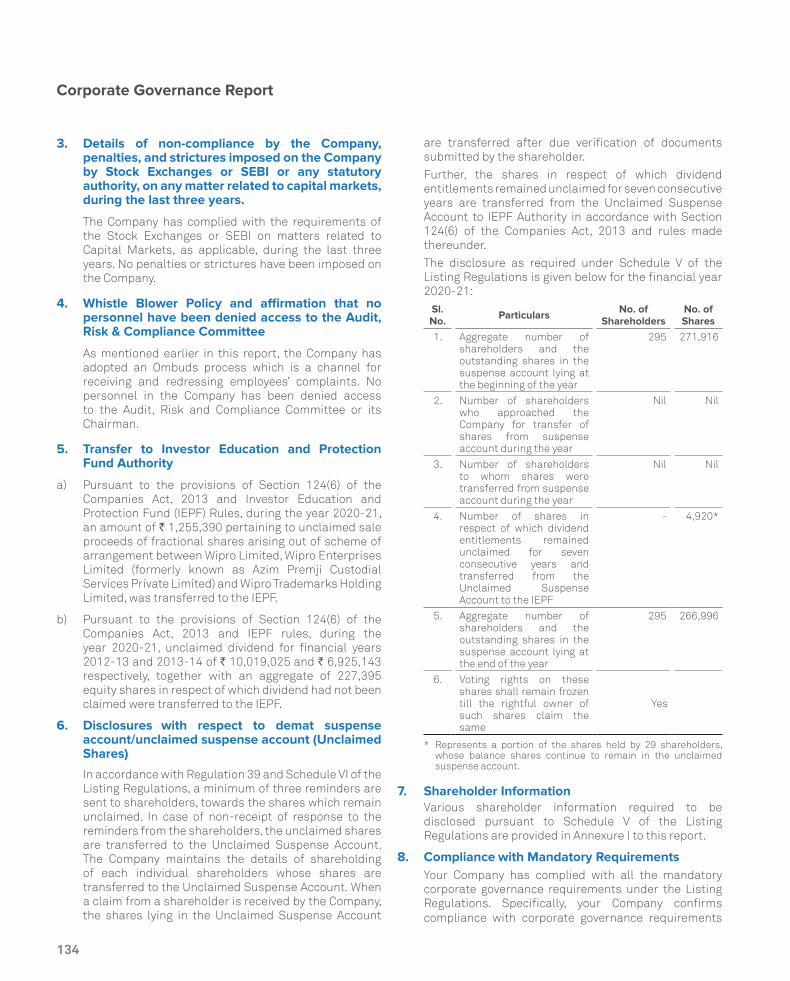
3. Details of non-compliance by the Company, penalties, and strictures imposed on the Company by Stock Exchanges or SEBI or any statutory authority, on any matter related to capital markets, during the last three years.
The Company has complied with the requirements of the Stock Exchanges or SEBI on matters related to Capital Markets, as applicable, during the last three years. No penalties or strictures have been imposed on the Company.
4. Whistle Blower Policy and affirmation that no personnel have been denied access to the Audit, Risk & Compliance Committee
As mentioned earlier in this report, the Company has adopted an Ombuds process which is a channel for receiving and redressing employees’ complaints. No personnel in the Company has been denied access to the Audit, Risk and Compliance Committee or its Chairman.
5. Transfer to Investor Education and Protection Fund Authority
a) Pursuant to the provisions of Section 124(6) of the Companies Act, 2013 and Investor Education and Protection Fund (IEPF) Rules, during the year 2020-21, an amount of ` 1,255,390 pertaining to unclaimed sale proceeds of fractional shares arising out of scheme of arrangement between Wipro Limited, Wipro Enterprises Limited (formerly known as Azim Premji Custodial Services Private Limited) and Wipro Trademarks Holding Limited, was transferred to the IEPF.
b) Pursuant to the provisions of Section 124(6) of the Companies Act, 2013 and IEPF rules, during the year 2020-21, unclaimed dividend for financial years 2012-13 and 2013-14 of ` 10,019,025 and ` 6,925,143 respectively, together with an aggregate of 227,395 equity shares in respect of which dividend had not been claimed were transferred to the IEPF.
6. Disclosures with respect to demat suspense account/unclaimed suspense account (Unclaimed Shares)
In accordance with Regulation 39 and Schedule VI of the Listing Regulations, a minimum of three reminders are sent to shareholders, towards the shares which remain unclaimed. In case of non-receipt of response to the reminders from the shareholders, the unclaimed shares are transferred to the Unclaimed Suspense Account. The Company maintains the details of shareholding of each individual shareholders whose shares are transferred to the Unclaimed Suspense Account. When a claim from a shareholder is received by the Company, the shares lying in the Unclaimed Suspense Account
are transferred after due verification of documents submitted by the shareholder.
Further, the shares in respect of which dividend entitlements remained unclaimed for seven consecutive years are transferred from the Unclaimed Suspense Account to IEPF Authority in accordance with Section 124(6) of the Companies Act, 2013 and rules made thereunder.
The disclosure as required under Schedule V of the Listing Regulations is given below for the financial year 2020-21:
Sl. No. Particulars No. of
ShareholdersNo. of Shares
1. Aggregate number of shareholders and the outstanding shares in the suspense account lying at the beginning of the year
295 271,916
2. Number of shareholders who approached the Company for transfer of shares from suspense account during the year
Nil Nil
3. Number of shareholders to whom shares were transferred from suspense account during the year
Nil Nil
4. Number of shares in respect of which dividend entitlements remained unclaimed for seven consecutive years and transferred from the Unclaimed Suspense Account to the IEPF
- 4,920*
5. Aggregate number of shareholders and the outstanding shares in the suspense account lying at the end of the year
295 266,996
6. Voting rights on these shares shall remain frozen till the rightful owner of such shares claim the same
Yes
* Represents a portion of the shares held by 29 shareholders, whose balance shares continue to remain in the unclaimed suspense account.
7. Shareholder Information Various shareholder information required to be
disclosed pursuant to Schedule V of the Listing Regulations are provided in Annexure I to this report.
8. Compliance with Mandatory Requirements Your Company has complied with all the mandatory
corporate governance requirements under the Listing Regulations. Specifically, your Company confirms compliance with corporate governance requirements
Corporate Governance Report
134

Integrated Annual Report 2020-21Wipro Limited
specified in Regulation 17 to 27 and clauses (b) to (i) of Sub-regulation (2) of Regulation 46 of the Listing Regulations.
9. Certificates from Practising Company SecretaryThe certificate dated June 9, 2021, issued by Mr. V. Sreedharan, Partner, V. Sreedharan & Associates, Practising Company Secretaries is given at page no. 142 of this Annual Report in compliance with corporate governance norms prescribed under the Listing Regulations.
The Company has received certificate dated June 9, 2021, from Mr. V. Sreedharan, Partner, V. Sreedharan & Associates, Practising Company Secretaries, confirming that none of the Directors of the Company have been debarred or disqualified from being appointed or continuing as director of companies by the SEBI/Ministry of Corporate of Affairs or any such authority. The certificate is given at page no. 143 of this Annual Report.
VII. COMPLIANCE REPORT ON DISCRETIONARYREQUIREMENTS UNDER REGULATION 27(1) OFTHE LISTING REGULATIONS
1. The BoardAs per Para A of Part E of Schedule II of the Listing Regulations, a non-executive Chairman of the Board may be entitled to maintain a Chairman’s Office at the company’s expense and also allowed reimbursement of expenses incurred in performance of his duties. The Chairman of the Company is an Executive Director and hence this provision is not applicable to us.
2. Shareholders rightsConsidering the dynamic shareholder demography and trading on the stock exchanges, as a prudent measure, we display our quarterly and half yearly results on our website www.wipro.com and also publish our results in widely circulated newspapers. We have communicated the payment of dividend by e-mail to shareholders in
addition to dispatch of letters to all shareholders. We publish the voting results of shareholder meetings and make it available on our website www.wipro.com, and report the same to Stock Exchanges in terms of Regulation 44 of the Listing Regulations.
3. Modified opinion(s) in audit reportThe Auditors have issued an unmodified opinion on the financial statements of the Company.
4. Reporting of Internal AuditorReporting of Head of Internal Audit is to the Chairman of the Audit, Risk and Compliance Committee and administratively to the Chief Financial Officer. Head of Internal Audit has regular and exclusive meetings with the Audit Committee.
5. NYSE Corporate Governance Listing Standards The Company has made necessary disclosures in compliance with the New York Stock Exchange Listing Standards and NYSE Listed Company Manual on its website https://www.wipro.com/investors/corporate-governance
Bengaluru Rishad A. PremjiJune 9, 2021 Chairman
Declaration as required under Regulation 34(3) and Schedule V of the Listing Regulations
All Directors and senior management personnel of the Company have affirmed compliance with Wipro’s Code of Business Conduct for the financial year ended March 31, 2021.
Bengaluru Rishad A. PremjiJune 9, 2021 Chairman
Thierry DelaporteChief Executive Officer and Managing Director
135

ANNEXURE ISHAREHOLDER INFORMATION
Annual General Meeting
Pursuant to the General Circular No. 14/2020 dated April 8, 2020, the General Circular No. 17/2020 dated April 13, 2020, the General Circular No. 20/2020 dated May 5, 2020, the General Circular No. 22/2020 dated June 15, 2020, the General Circular No. 33/2020 dated September 28, 2020, the General Circular No. 39/2020 dated December 31, 2020 and the General Circular No. 02/2021 dated January 13, 2021 issued by the Ministry of Corporate Affairs (“MCA Circulars”), the 75th Annual General Meeting (“AGM”) for the year ended March 31, 2021 is scheduled to be held on Wednesday, July 14, 2021 at 9 am IST through Video Conferencing (“VC”).
The Members may attend the 75th AGM scheduled to be held on Wednesday, July 14, 2021, 9 am IST onwards, through VC or watch the live web-cast at https://www.wipro.com/AGM2021/. Detailed instructions for participation are provided in the notice of the 75th AGM. The proceedings of the 75th AGM will be available through VC and live web-cast to the shareholders as on the cut-off date i.e. July 7, 2021.
Annual General Meetings and Other General Body meeting of the last three years and Special Resolutions, if any.Financial Year Date and Time Venue Special resolutions passed
2017-18 July 19, 2018 at 4.00 pm
Wipro Campus, Cafeteria Hall EC-3, Ground Floor,
Opp. Tower 8, No. 72, Keonics, Electronic City,
Hosur Road, Bengaluru – 561 229
i. Re-appointment of Mrs. Ireena Vittal (DIN: 05195656) as Independent Director of the Company.
2018-19 July 16, 2019 at 4.00 pm
i. Amendments to the Articles of Association of the Companyii. Appointment of Mr. Azim H. Premji (DIN: 00234280) as Non-Executive,
Non-Independent Director of the Company
2019-20 July 13, 2020 at 9.00 am
Meeting held through VC i. Appointment of Mr. Deepak M. Satwalekar (DIN: 00009627) as an Independent Director of the Company
Details of resolutions passed through postal ballot during Financial Year 2020-21 and details of the voting patternThe Company sought the approval of shareholders through notice of postal ballot dated October 13, 2020 for approval for Buyback of Equity Shares by way of special resolution. The aforesaid resolutions were duly passed and the results of postal ballot/e-voting were announced on November 17, 2020. Mr. V. Sreedharan/Ms. Devika Sathyanarayana/Mr. Pradeep B. Kulkarni, partners of V. Sreedharan & Associates, Practicing Company Secretaries, were appointed as the Scrutinizer to scrutinize the postal ballot and remote e-voting process in a fair and transparent manner.
Resolution No. of Votes Polled
No. of Votes Cast in Favour
No. of Votes Cast Against
% of Votes Cast in Favour on Votes
Polled
% of Votes Cast Against on Votes
PolledApproval for Buyback of Equity Shares
5,089,856,744 5,078,618,396 11,238,348 99.78 0.22
Procedure for Postal BallotThe postal ballot is conducted in accordance with the provisions contained in Section 110 and other applicable provisions, if any, of the Companies Act, 2013, read with Rule 22 of the Companies (Management and Administration) Rules, 2014. The Shareholders are provided the facility to vote either by physical ballot or through e-voting. The postal ballot notice is sent to shareholders as per the permitted mode wherever applicable. The Company also publishes a notice in the newspapers in accordance with the requirements under the Companies Act, 2013.
Shareholders holding equity shares as on the cut-off date may cast their votes through e-voting or through postal ballot during the voting period fixed for this purpose. After completion of scrutiny of votes, the scrutinizer submits his report to the Chairman and the results of voting by postal ballot are announced within 2 working days of conclusion of the voting period. The results are displayed on the website of the Company (www.wipro.com), and communicated to the Stock Exchanges, Depositories, and Registrar and Share Transfer Agents. The resolutions, if passed by the requisite majority, are deemed to have been passed on the last date specified for receipt of duly completed postal ballot forms or e-voting.
In view of the COVID-19 pandemic, the MCA permitted companies to transact items through postal ballot as per the framework set out in Circular No. 14/2020 dated April 8, 2020, Circular No. 17/2020 dated April 13, 2020, the General Circular No. 22/2020 dated June 15, 2020, Circular No. 33/2020 dated September 28, 2020 and General Circular No. 39/2020 dated December 31, 2020. In accordance with the aforementioned circulars, e-voting facility was provided to all the shareholders to cast their votes only through the remote e-voting process as per notice of postal ballot dated October 13, 2020 for approval for Buyback of Equity Shares.
136

Integrated Annual Report 2020-21Wipro Limited
Further, the Company sought the approval of shareholders through notice of postal ballot dated April 15, 2021 for the re-appointment of Dr. Patrick J. Ennis (DIN: 07463299) and Mr. Patrick Dupuis (DIN: 07480046) as Independent Directors on the Board of Wipro Limited by way of special resolutions. The aforesaid resolutions were duly passed and the results of postal ballot/e-voting were announced on June 6, 2021. Mr. V. Sreedharan/Ms. Devika Sathyanarayana/Mr. Pradeep B. Kulkarni, partners of V. Sreedharan & Associates, Practicing Company Secretaries, were appointed as the Scrutinizer to scrutinize the postal ballot and remote e-voting process in a fair and transparent manner.
Resolution No. of Votes Polled
No. of Votes Cast in Favour
No. of Votes Cast Against
% of Votes Cast in Favour on Votes
Polled
% of Votes Cast Against on Votes
PolledRe-appointment of Dr. Patrick J. Ennis (DIN: 07463299) as an Independent Director of the Company
4,905,658,196 4,869,602,676 36,055,520 99.27 0.73
Re-appointment of Mr. Patrick Dupuis (DIN: 07480046) as an Independent Director of the Company
4,905,658,087 4,880,958,490 24,699,597 99.50 0.50
Means of Communication with Shareholders/AnalystsWe have established procedures to disseminate, in a planned manner, relevant information to our shareholders, analysts, employees and the society at large. Our Audit, Risk and Compliance Committee reviews the earnings press releases, Form 20-F filed with Securities Exchange Commission (SEC) filings and annual and quarterly reports of the Company, before they are presented to the Board for their approval for release. The details of the means of communication with shareholders/analysts are given below: News Releases and Presentations
All our news releases and presentations made at investor conferences and to analysts are posted on the Company’s website at https://www.wipro.com/investors.
Quarterly results Our quarterly results are published in widely circulated national newspapers such as Financial Express and the local daily Kannada Prabha.
Website The Company’s website contains a dedicated section for Investors (https://www.wipro.com/investors), where annual reports, earnings press releases, stock exchange filings, quarterly reports, and corporate governance policies are available, apart from the details about the Company, Board of Directors and Management.
Annual Report Annual Report containing audited standalone accounts, consolidated financial statements together with Board’s Report, Corporate Governance Report, Management Discussion and Analysis Report, Auditors Report and other important information are circulated to the Members entitled thereto through permitted mode(s).
Other Disclosures/Filings Our Form 20-F filed with SEC containing detailed disclosures, along with other disclosures including Press Releases etc. are available at https://www.wipro.com/investors.
Communication of Results:Means of Communications Number of times during 2020-21Earnings Calls 4
Publication of results 4
Analysts/Investors Meetings/Analyst Day Details are provided in the MD&A Report forming part of this Annual Report.
Financial CalendarThe financial year of the Company starts from the 1st day of April and ends on 31st day of March of next year. Our tentative calendar for declaration of results for the financial year 2021-22 are as given below. In addition, the Board may meet on other dates as and when required.
Quarter Ending Release of ResultsFor the Quarter ending June 30, 2021 Third week of July, 2021
For the Quarter and half year ending September 30, 2021 Third week of October, 2021
For the Quarter and nine months ending December 31, 2021 Third week of January, 2022
For the year ending March 31, 2022 Third week of April, 2022
The Register of Members and Share Transfer books will remain closed from Monday, July 12, 2021 to Tuesday, July 13, 2021 (both days inclusive).
137

Fees Paid to Statutory AuditorsThe details of total fees for all services paid by the Company and its subsidiaries, on a consolidated basis, to the statutory auditor and all the entities in the network firm/network entity of which the statutory auditor is a part, are as follows:
(In ` Mn)Type of Service FY 2020-21 FY 2019-20Audit Fees 83 81
Tax Fees 44 51
Others 13 17
Total 140 149
Corporate Information a) Corporate Identity Number (CIN): L32102KA1945PLC020800b) Company Registration Number: 20800c) International Securities Identification Number (ISIN): INE075A01022d) CUSIP Number for Wipro American Depository Shares: 97651M109e) Details of exchanges where Company’s shares are listed in as at March 31, 2021:Equity shares Stock Codes AddressBSE Limited (BSE) 507685 BSE Limited, Phiroze Jeejeebhoy Towers, Dalal Street,
Mumbai - 400 001
National Stock Exchange of India Limited (NSE) WIPRO Exchange Plaza, C-1, Block G, Bandra Kurla Complex, Bandra (E), Mumbai – 400 051
American Depository ReceiptsNew York Stock Exchange (NYSE) WIT 11 Wall St, New York, NY 10005, United States of America
Notes:1. Listing fees for the year 2021-22 has been paid to the Indian Stock Exchanges as on date of this report.2. Listing fees to NYSE for the calendar year 2021 has been paid as on date of this report.3. The stock code on Reuters is WIPR.NS and on Bloomberg is WPRO:IN
Distribution of Shareholding as on March 31, 2021
Category (No. of Shares)
March 31, 2021 March 31, 2020
No. of Shareholders
% of Shareholders No. of Shares
% of Total Equity
No. of Shareholders
% of Shareholders No. of Shares
% of Total Equity
1-5000 829,647 98.93 83,119,655 1.52 507,272 99.10 82,232,977 1.445001- 10000 3,628 0.43 12,699,508 0.23 1,697 0.33 12,032,833 0.2110001- 20000 1,936 0.23 13,864,634 0.25 1,049 0.20 14,869,292 0.2620001- 30000 751 0.09 9,354,600 0.17 400 0.08 9,808,813 0.1730001- 40000 371 0.04 6,483,397 0.12 240 0.05 8,376,285 0.1540001- 50000 261 0.03 5,881,802 0.11 162 0.03 7,250,873 0.1350001- 100000 668 0.08 23,626,382 0.43 358 0.07 25,599,263 0.45100001 & Above 1,329 0.17 5,324,108,577 97.17 703 0.14 5,553,187,054 97.20
Total 838,591 100.00 5,479,138,555 100.00 511,881 100.00 5,713,357,390 100.00
Market Share Price DataThe performance of our stock in the financial year 2020-21 is tabulated below:
2020-21
April May June July August September October November December January February MarchVolume traded on NSE
133,037,800 151,908,123 195,006,806 460,217,867 195,174,626 435,740,889 587,943,024 148,723,864 241,053,563 467,630,831 225,393,445 260,495,775
NSEHigh 202.95 214.9 230 290.8 287.4 324.5 381.7 361.4 390.5 467.45 451.75 444.3Date 09-Apr-20 29-May-20 26-Jun-20 31-Jul-20 18-Aug-20 21-Sep-20 13-Oct-20 24-Nov-20 29-Dec-20 13-Jan-21 09-Feb-21 04-Mar-21Volume 3,465,831 30,630,218 19,194,612 16,700,905 12,054,273 22,739,047 36,092,383 10,092,441 11,459,126 29,190,193 29,474,830 12,963,797Low 173.8 178 206.3 218.35 268 269 312.05 332.65 346.25 385.05 408 397.75Date 21-Apr-20 19-May-20 12-Jun-20 01-Jul-20 31-Aug-20 01-Sep-20 01-Oct-20 03-Nov-20 01-Dec-20 01-Jan-21 26-Feb-21 25-Mar-21
138

Integrated Annual Report 2020-21Wipro Limited
Volume 9,043,319 5,743,344 6,209,370 3,952,617 20,571,550 12,293,054 9,257,331 4,757,798 10,693,567 5,042,336 11,731,941 12,737,129 S&P CNX NIFTY
High 9,889.05 9,598.85 10,553.15 11,341.4 11,794.25 11,618.1 12,025.45 13,145.85 14,024.85 14,753.55 15,431.75 15,336.3Low 8,055.8 8,806.75 9,544.35 10,299.6 10,882.25 10,790.2 11,347.05 11,557.4 12,962.8 13,596.75 13,661.75 14,264.4
Wipro Price Movement vis-à-vis Previous Month High/Low (%)High -13.23% 5.89% 7.03% 26.43% -1.17% 12.91% 17.63% -5.32% 8.05% 19.71% -3.36% -1.65%Low 9.03% 2.42% 15.90% 5.84% 22.74% 0.37% 16.00% 6.60% 4.09% 11.21% 5.96% -2.51%
S&P CNX Nifty Index vis-à-vis Previous Month High/Low (%)
High -13.50% -2.93% 9.94% 7.47% 3.99% -1.49% 3.51% 9.32% 6.69% 5.20% 4.60% -0.62%
Low 7.25% 9.32% 8.38% 7.91% 5.66% -0.85% 5.16% 1.85% 12.16% 4.89% 0.48% 4.41%
ADS Share Price during the Financial Year 2020-21April May June July August September October November December January February March
Wipro ADS price in NYSE during each month closing
3.4 3.36 3.32 4.34 4.33 4.76 4.9 5.17 5.67 6.36 6.24 6.42
NYSE TMT index during each month closing
8,529.46 8,672.52 8,851.62 9,354.97 9,909.38 9,594.92 9,298.03 10,382.02 10,720.47 10,541.65 10,900.66 10,941.79
Wipro ADS Price Movement (%) vis-à-vis Previous month Closing
8.28% -1.18% -1.19% 30.72% -0.23% 9.93% 2.94% 5.51% 9.67% 12.17% -1.89% 2.88%
NYSE TMT Index movement (%) vis-à-vis Previous month closing
8.04% 1.68% 2.07% 5.69% 5.93% -3.17% -3.09% 11.66% 3.26% -1.67% 3.41% 0.38%
Performance of Wipro equity shares relative to the SENSEX and NYSE Composite index during the period April 1, 2020 to March 31, 2021 is given in the following chart:
708090
100110120130140150160170180190200210220230240250
1-Ap
r-20
20
1-M
ay-2
020
31-M
ay-2
020
30-Ju
n -20
20
30-Ju
l-202
0
29-A
ug-2
020
28-S
ep-2
020
28-O
ct-2
020
27-N
ov-2
020
27-D
ec- 2
020
26-Ja
n-20
21
25-F
eb-2
021
27-M
ar-2
021
Wipro Sensex NYSE Composite Index
139

Other DisclosuresDescription of Voting Rights All our equity shares carry voting rights on a pari-passu basis.
Dematerialisation of Shares and Liquidity 99.85% of outstanding equity shares have been dematerialized as at March 31, 2021.
Outstanding ADR/GDR/Warrants or any other Convertible instruments, Conversion Date and Likely Impact on Equity
The Company has 2.61% of outstanding ADRs as on March 31, 2021.
Commodity Price Risk or Foreign Exchange Risk and Hedging Activities
The Company had no exposure to commodity and commodity risks for the financial year 2020-21. For Foreign exchange risk and hedging activities, please refer Management Discussion and Analysis Report for details.
Credit Ratings The ICRA Committee of ICRA has reaffirmed the long-term rating for lines of credit of Wipro Limited at [ICRA]AAA. The Outlook on the long-term rating is stable. The Rating Committee of ICRA has also re-affirmed the short-term rating at [ICRA]A+. Fitch Ratings has assigned Long-Term Foreign- and Local-Currency Issuer Default Ratings (IDR) and foreign-currency senior unsecured rating of ‘A-’. Standard & Poor has also assigned a rating of A-. The Outlook is Stable.
Plant Locations The Company has various offices in India and abroad. Details of these locations as on March 31, 2021 are available on our website www.wipro.com.
Overseas Depository for ADSs - J.P. Morgan Chase Bank N.A. 383 Madison Avenue, Floor 11 New York, NY10179General: +1 800 990 1135From outside the U.S.: +1 651 453 2128Tel: +1 212 552 8926 New YorkE-mail: [email protected]
Indian Custodian for ADSsIndia Sub CustodyOffice Address: J.P. Morgan Chase Bank, N.A. Mumbai Branch, Paradigm B-Wing, 6th Floor, Mindspace, Malad (W), Mumbai - 400 064Phone: +91 022 6649 2515 | F: +91 022 6649 2509The e-mail address and contact details for all service related queries is: [email protected]
Contact Persons:Rohit Keer- E-mail id: [email protected],Nekzad Behramkamdin- E-mail id: [email protected] Nayan Vyas- E-mail id: [email protected]
Web-Based Query Redressal SystemMembers may utilize this facility extended by the Registrar & Transfer Agents for redressal of their queries.
Please visit https://karisma.kfintech.com and click on “investors” option for query registration through free identity registration to log on. Investor can submit the query in the “QUERIES” option provided on the website, which will generate the grievance registration number. For accessing the status/response to your query, please use the same number at the option “VIEW REPLY” after 24 hours. The investors can continue to put additional queries relating to the case till they are satisfied.
Registrar and Transfer AgentsCompany’s share transfer and related activities are operated through its Registrar and Share Transfer Agents: KFin Technologies Private Limited, Hyderabad.
Share Transfer SystemIn accordance with the proviso to Regulation 40(1) of the Listing Regulations, effective from April 1, 2019, transfers of shares of the Company shall not be processed unless the shares are held in the dematerialized form with a depository. Accordingly, shareholders holding equity shares in physical form are urged to have their shares dematerialized so as to be able to freely transfer them.
Investor Queries and Grievances RedressalShareholders may write either to the Company or the Registrar and Transfer Agents for redressal of queries and grievances. The address and contact details of the concerned officials are given below.
Registrar and Share Transfer AgentsKFin Technologies Private Limited, Unit: Wipro Limited, Selenium Tower B, Plot 31 & 32, Financial District, Nanakramguda, Serilingampally Mandal, Hyderabad - 500 032, Telangana. Toll Free No.: 1800 3454 001 Phone: (040) 7961 1000
Contact Person:Mr. B. Srinivas- e-mail id: [email protected]. Rajitha Cholleti- e-mail id: [email protected] Grievance can also be sent through e-mail to the following designated e-mail id: [email protected].
140
Integrated Annual Report 2020-21Wipro Limited
Shareholders can also send their correspondence to the Company with respect to their shares, dividend, request for annual reports and shareholder grievances. The contact details are provided below:Mr. M. Sanaulla Khan Vice President and Company Secretary Wipro Limited, Doddakannelli, Sarjapur Road, Bengaluru - 560 035
Ph: +91 80 28440011 (Extn: 226185)Fax: +91 080 28440054E-mail: [email protected]
Mr. G. Kothandaraman General Manager, FinanceWipro Limited, Doddakannelli, Sarjapur Road, Bengaluru - 560 035
Ph: +91 80 28440011 (Extn: 226183)Fax: +91 080 28440054E-mail: [email protected]
Analysts can reach our Investor Relations Team for any queries and clarification on Financial/Investor Relations related matters:Ms. Aparna C. Iyer Vice President, FinanceCorporate Treasurer and Investor RelationsWipro Limited, Doddakannelli, Sarjapur Road, Bengaluru - 560 035
Ph: +91 80 28440011 (Extn: 226186)Fax: +91 80 28440054E-mail: [email protected]
Mr. Abhishek Kumar Jain General ManagerInvestor RelationsWipro Limited, Doddakannelli, Sarjapur Road, Bengaluru - 560 035
Ph: +91-80-6142 6143Fax: +91 80 28440054E-mail: [email protected]
Due to the ongoing COVID-19 pandemic, majority of our staff is working from home. In case of any queries, stakeholders are requested to write to the above mentioned Email IDs for a quicker response.
141

Corporate Governance Compliance Certificate
Corporate Identity Number: L32102KA1945PLC020800 Nominal Capital: ` 2527.40 crores
To the Members of Wipro LimitedDoddakannelli, Sarjapur Road, Bengaluru – 560035
We have examined all the relevant records of Wipro Limited (“Company”) for the purpose of certifying compliance of the conditions of the Corporate Governance under the SEBI (Listing Obligations and Disclosure Requirements) Regulations, 2015 for the financial year ended March 31, 2021. We have obtained all the information and explanations which to the best of our knowledge and belief were necessary for the purposes of certification.
The compliance of conditions of corporate governance is the responsibility of the Management. Our examination was limited to the procedure and implementation process adopted by the Company for ensuring the compliance of the conditions of the corporate governance.
This certificate is neither an assurance as to the future viability of the Company nor of the efficacy or effectiveness with which the management has conducted the affairs of the Company.
In our opinion and to the best of our information and according to the explanations and information furnished to us, we certify that the Company has complied with all the mandatory requirements of Corporate Governance as stipulated in Schedule II of the said Regulations. As regards Discretionary Requirements specified in Part E of Schedule II of the SEBI (Listing Obligations and Disclosure Requirements) Regulations, 2015, the Company has complied with items C and E.
For V. SREEDHARAN & ASSOCIATES Company Secretaries
(V. Sreedharan) Partner FCS: 2347; CP No. 833
BengaluruJune 9, 2021
UDIN: F002347C000436627
NOTE: Due to the ongoing Covid-19 pandemic, we have conducted online verification and examination of records, as facilitated by the Company for the purpose of issuing this Certificate.
142

Integrated Annual Report 2020-21Wipro Limited
CERTIFICATE OF NON-DISQUALIFICATION OF DIRECTORS [Pursuant to Regulation 34(3) and Schedule V Para C Clause (10)(i) of the SEBI (Listing
Obligations and Disclosure Requirements) Regulations, 2015]
To, The Members of WIPRO LIMITEDDoddakannelli, Sarjapur Road, Bengaluru- 560035 We have examined the relevant registers, records, forms, returns and disclosures received from the Directors of WIPRO LIMITED, having CIN L32102KA1945PLC020800 and having registered office at Doddakannelli, Sarjapur Road, Bengaluru- 560035 (hereinafter referred to as ‘the Company’), produced before us by the Company for the purpose of issuing this Certificate, in accordance with Regulation 34(3) read with Schedule V Para-C Sub-clause 10(i) of the Securities and Exchange Board of India (Listing Obligations and Disclosure Requirements) Regulations, 2015. In our opinion and to the best of our information and according to the verifications (including Directors Identification Number (DIN) status at the portal www.mca.gov.in) as considered necessary and explanations furnished to us by the Company and its officers, we hereby certify that none of the Directors on the Board of the Company as stated below for the Financial Year ending on March 31, 2021 have been debarred or disqualified from being appointed or continuing as Directors of companies by the Securities and Exchange Board of India (SEBI) and Ministry of Corporate Affairs (MCA), or any such other Statutory Authority.
Details of Directors:
Sl. No. Name of Director DINDate of appointment in the
Company1. Mr. Azim Premji Hasham 00234280 01/09/1968
2. Mr. Mahendra Kumar Sharma 00327684 01/07/2011
3. Mr. William Arthur Owens 00422976 01/07/2006
4. Mr. Rishad Premji Azim 02983899 01/05/2015
5. Mrs. Ireena Vittal 05195656 01/10/2013
6. Mr. Patrick John Ennis 07463299 01/04/2016
7. Mr. Patrick Lucien Andre Dupuis 07480046 01/04/2016
8. Mr. Deepak Madhav Satwalekar 00009627 01/07/2020
9. Mr. Thierry Delaporte 08107242 06/07/2020 Ensuring the eligibility for the appointment/continuity of every Director on the Board is the responsibility of the management of the Company. Our responsibility is to express an opinion based on our verification. This certificate is neither an assurance as to the future viability of the Company nor of the efficiency or effectiveness with which the management has conducted the affairs of the Company. For V. SREEDHARAN & ASSOCIATES Company Secretaries
(V. Sreedharan) Partner FCS: 2347; CP No. 833
BengaluruJune 09, 2021
UDIN: F002347C000436638
NOTE: Due to the ongoing Covid-19 pandemic, we have conducted online verification and examination of records, as facilitated by the Company for the purpose of issuing this Certificate.
143

Independent Auditor’s Report
To The Members of Wipro Limited
Report on the Audit of the Standalone Financial Statements
OpinionWe have audited the accompanying standalone financial statements of Wipro Limited (“the Company”), which comprise the Balance Sheet as at March 31, 2021, the Statement of Profit and Loss (including Other Comprehensive Income), the Statement of Changes in Equity and the Statement of Cash Flows for the year then ended, and a summary of significant accounting policies and other explanatory information (herein after referred to as “the Standalone Financial Statements”).
In our opinion and to the best of our information and according to the explanations given to us, the aforesaid Standalone Financial Statements give the information required by the Companies Act, 2013 (“the Act”) in the manner so required and give a true and fair view in conformity with the Indian Accounting Standards prescribed under Section 133 of the Act read with the Companies (Indian Accounting Standards) Rules, 2015, as amended, (“Ind AS”) and other accounting principles generally accepted in India, of the state of affairs of the Company as at March 31, 2021, and its profit, total comprehensive income, changes in equity and its cash flows for the year ended on that date.
Basis for OpinionWe conducted our audit of the Standalone Financial Statements in accordance with the Standards on Auditing specified under Section 143(10) of the Act (SAs). Our responsibilities under those Standards are further described in the Auditor’s Responsibility for the Audit of the Standalone Financial Statements section of our report. We are independent of the Company in accordance with the Code of Ethics issued by the Institute of Chartered Accountants of India (ICAI) together with the ethical requirements that are relevant to our audit of the Standalone Financial Statements under the provisions of the Act and the Rules made thereunder, and we have fulfilled our other ethical responsibilities in accordance with these requirements and the ICAI’s Code of Ethics. We believe that the audit evidence obtained by us is sufficient and appropriate to provide a basis for our audit opinion on the Standalone Financial Statements.
Key Audit MattersKey audit matters are those matters that, in our professional judgment, were of most significance in our audit of the Standalone Financial Statements of the current period. These matters were addressed in the context of our audit of the Standalone Financial Statements as a whole, and in forming our opinion thereon, and we do not provide a
separate opinion on these matters. We have determined the matters described below to be the key audit matters to be communicated in our report.
Fixed price contracts using the percentage of completion method - Refer Notes 2 (iii)(a), 3(xiii)B and 22 to the financial statements.
Key Audit Matter Description
Revenue from fixed-price contracts, including software development, and integration contracts, where the performance obligations are satisfied over time, is recognized using the percentage-of-completion method.
Use of the percentage-of-completion method requires the Company to determine the project costs incurred to date as a percentage of total estimated project costs required to complete the project. The estimation of total project costs involves significant judgement and is assessed throughout the period of the contract to reflect any changes based on the latest available information. In addition, provisions for estimated losses, if any, on uncompleted contracts are recorded in the period in which such losses become probable based on the estimated project costs.
We identified the revenue recognition for fixed price contracts where the percentage-of-completion method is used as a key audit matter because of the significant judgment involved in estimating the efforts to complete such contracts.
This estimate has a high inherent uncertainty and requires consideration of progress of the contract, efforts incurred to-date and estimates of efforts required to complete the remaining contract performance obligations over the lives of the contracts.
This required a high degree of auditor judgment in evaluating the audit evidence supporting the application of the input method used to recognize revenue and a higher extent of audit effort to evaluate the reasonableness of the total estimated amount of revenue recognized on fixed-price contracts.
How the Key Audit Matter was addressed in the Audit
Our audit procedures related to estimates of efforts to complete for fixed-price contracts accounted using the percentage-of-completion method included the following, among others:
• We tested the effectiveness of controls relating to (1) recording of efforts incurred and estimation of efforts required to complete the remaining contract performance obligations, and (2) access and application controls pertaining to time recording and allocation systems, which prevents unauthorised changes to recording of efforts incurred.
Standalone Financial Statement under Ind AS
144

• We evaluated management’s ability to reasonably estimate the progress towards satisfying the performance obligation by comparing actual information to estimates for performance obligations that have been fulfilled.
• We selected a sample of fixed price contracts with customers accounted using percentage-of-completion method and performed the following:
• Read the contract and based on the terms and conditions evaluated whether recognizing revenue over time was appropriate, and the contract was included in management’s calculation of revenue over time.
• Evaluated other information that supported the estimates of the progress towards satisfying the performance obligation.
• Evaluated the appropriateness of and consistency in the application of management’s policies and methodologies to estimate progress towards satisfying the performance obligation.
• Compared efforts incurred with Company’s estimate of efforts incurred to date to identify significant variations and evaluate whether those variations have been considered appropriately in estimating the remaining efforts to complete the contract.
• Tested the estimate for consistency with the status of delivery of milestones and customer acceptances to identify possible delays in achieving milestones, which require changes in estimated efforts to complete the remaining performance obligations.
Allowance for credit losses Refer Notes 2(iii)(g), 3(ix)(A), and 9 to the financial statements
Key Audit Matter Description
The Company determines the allowance for credit losses based on historical loss experience adjusted to reflect current and estimated future economic conditions. The Company considered current and anticipated future economic conditions on the basis of the credit reports and other related credit information for its customers to estimate the probability of default in future and has taken into account estimates of possible effect from the pandemic relating to COVID-19.
We identified allowance for credit losses as a key audit matter because of the significant judgement involved in calculating the expected credit losses. This required a high degree of auditor judgment and an increased extent of effort when performing audit procedures to evaluate the reasonableness of management’s estimate of the expected credit losses.
How the Key Audit Matter was addressed in the Audit
Our audit procedures related to the allowance for credit losses for trade receivables, unbilled receivables and contract assets included the following, among others:
• We tested the effectiveness of controls over the (1) development of the methodology for the allowance for credit losses, including consideration of the current and estimated future economic conditions, (2) completeness and accuracy of information used in the estimation of probability of default, and (3) computation of the allowance for credit losses.
• For a sample of customers we tested the input data such as credit reports and other credit related information used in estimating the probability of default by comparing them to external and internal sources of information.
• We evaluated the incorporation of the applicable assumptions into the estimate of expected credit losses and tested the mathematical accuracy and computation of the allowances by using the same input data used by the Company.
• We evaluated the qualitative adjustment to the historical loss rates, including assessing the basis for the adjustments and the reasonableness of the significant assumptions.
Information other than the Financial Statements and Auditor’s Report thereon
• The Company’s Board of Directors is responsible for the other information. The other information comprises the information included in the Board’s Report and Corporate Governance Report, but does not include the Consolidated Financial Statements, Standalone Financial Statements and our auditor’s report thereon.
• Our opinion on the Standalone Financial Statements does not cover the other information and we do not express any form of assurance conclusion thereon.
• In connection with our audit of the Standalone Financial Statements, our responsibility is to read the other information and, in doing so, consider whether the other information is materially inconsistent with the Standalone Financial Statements or our knowledge obtained during the course of our audit or otherwise appears to be materially misstated.
• If, based on the work we have performed, we conclude that there is a material misstatement of this other information, we are required to report that fact. We have nothing to report in this regard.
Integrated Annual Report 2020-21Wipro LimitedStandalone Financial Statement under Ind AS
145

Management’s Responsibility for the Standalone Financial Statements
The Company’s Board of Directors is responsible for the matters stated in section 134(5) of the Act with respect to the preparation of these Standalone Financial Statements that give a true and fair view of the financial position, financial performance including other comprehensive income, changes in equity and cash flows of the Company in accordance with the Ind AS and other accounting principles generally accepted in India. This responsibility also includes maintenance of adequate accounting records in accordance with the provisions of the Act for safeguarding the assets of the Company and for preventing and detecting frauds and other irregularities; selection and application of appropriate accounting policies; making judgments and estimates that are reasonable and prudent; and design, implementation and maintenance of adequate internal financial controls, that were operating effectively for ensuring the accuracy and completeness of the accounting records, relevant to the preparation and presentation of the Standalone Financial Statements that give a true and fair view and are free from material misstatement, whether due to fraud or error.
In preparing the Standalone Financial Statements, management is responsible for assessing the Company’s ability to continue as a going concern, disclosing, as applicable, matters related to going concern and using the going concern basis of accounting unless management either intends to liquidate the Company or to cease operations, or has no realistic alternative but to do so.
The Board of Directors are also responsible for overseeing the Company’s financial reporting process.
Auditor’s Responsibility for the Audit of the Standalone Financial Statements
Our objectives are to obtain reasonable assurance about whether the Standalone Financial Statements as a whole are free from material misstatement, whether due to fraud or error, and to issue an auditor’s report that includes our opinion. Reasonable assurance is a high level of assurance, but is not a guarantee that an audit conducted in accordance with SAs will always detect a material misstatement when it exists. Misstatements can arise from fraud or error and are considered material if, individually or in the aggregate, they could reasonably be expected to influence the economic decisions of users taken on the basis of these Standalone Financial Statements.
As part of an audit in accordance with SAs, we exercise professional judgment and maintain professional skepticism throughout the audit. We also:
• Identify and assess the risks of material misstatement of the Standalone Financial Statements, whether due
to fraud or error, design and perform audit procedures responsive to those risks, and obtain audit evidence that is sufficient and appropriate to provide a basis for our opinion. The risk of not detecting a material misstatement resulting from fraud is higher than for one resulting from error, as fraud may involve collusion, forgery, intentional omissions, misrepresentations, or the override of internal control.
• Obtain an understanding of internal financial control relevant to the audit in order to design audit procedures that are appropriate in the circumstances. Under section 143(3)(i) of the Act, we are also responsible for expressing our opinion on whether the Company has adequate internal financial controls system in place and the operating effectiveness of such controls.
• Evaluate the appropriateness of accounting policies used and the reasonableness of accounting estimates and related disclosures made by the management.
• Conclude on the appropriateness of management’s use of the going concern basis of accounting and, based on the audit evidence obtained, whether a material uncertainty exists related to events or conditions that may cast significant doubt on the Company’s ability to continue as a going concern. If we conclude that a material uncertainty exists, we are required to draw attention in our auditor’s report to the related disclosures in the Standalone Financial Statements or, if such disclosures are inadequate, to modify our opinion. Our conclusions are based on the audit evidence obtained up to the date of our auditor’s report. However, future events or conditions may cause the Company to cease to continue as a going concern.
• Evaluate the overall presentation, structure and content of the Standalone Financial Statements, including the disclosures, and whether the Standalone Financial Statements represent the underlying transactions and events in a manner that achieves fair presentation.
Materiality is the magnitude of misstatements in the Standalone Financial Statements that, individually or in aggregate, makes it probable that the economic decisions of a reasonably knowledgeable user of the Standalone Financial Statements may be influenced. We consider quantitative materiality and qualitative factors in (i) planning the scope of our audit work and in evaluating the results of our work; and (ii) to evaluate the effect of any identified misstatements in the Standalone Financial Statements.
We communicate with those charged with governance regarding, among other matters, the planned scope and timing of the audit and significant audit findings, including any significant deficiencies in internal control that we identify during our audit.
Independent Auditor’s Report
Standalone Financial Statement under Ind AS
146

We also provide those charged with governance with a statement that we have complied with relevant ethical requirements regarding independence, and to communicate with them all relationships and other matters that may reasonably be thought to bear on our independence, and where applicable, related safeguards.
From the matters communicated with those charged with governance, we determine those matters that were of most significance in the audit of the Standalone Financial Statements of the current period and are therefore the key audit matters. We describe these matters in our auditor’s report unless law or regulation precludes public disclosure about the matter or when, in extremely rare circumstances, we determine that a matter should not be communicated in our report because the adverse consequences of doing so would reasonably be expected to outweigh the public interest benefits of such communication.
Report on Other Legal and Regulatory Requirements1. As required by Section 143(3) of the Act, based on our
audit we report, that:
a) We have sought and obtained all the information and explanations which to the best of our knowledge and belief were necessary for the purposes of our audit.
b) In our opinion, proper books of account as required by law have been kept by the Company so far as it appears from our examination of those books.
c) The Balance Sheet, the Statement of Profit and Loss (including Other Comprehensive Income), the Statement of Changes in Equity and the Statement of Cash Flows dealt with by this Report are in agreement with the relevant books of account.
d) In our opinion, the aforesaid Standalone Financial Statements comply with the Ind AS specified under Section 133 of the Act.
e) On the basis of the written representations received from the directors as on March 31, 2021 taken on record by the Board of Directors, none of the directors is disqualified as on March 31, 2021 from being appointed as a director in terms of Section 164(2) of the Act.
f) With respect to the adequacy of the internal financial controls over financial reporting of the Company and the operating effectiveness of such controls, refer to our separate Report in “Annexure A”.
Our report expresses an unmodified opinion on the adequacy and operating effectiveness of the Company’s internal financial controls over financial reporting.
g) With respect to the other matters to be included in the Auditor’s Report in accordance with the requirements of section 197(16) of the Act, as amended, in our opinion and to the best of our information and according to the explanations given to us, the remuneration paid by the Company to its directors during the year is in accordance with the provisions of section 197 of the Act.
h) With respect to the other matters to be included in the Auditor’s Report in accordance with Rule 11 of the Companies (Audit and Auditors) Rules, 2014, as amended, in our opinion and to the best of our information and according to the explanations given to us:
i. The Company has disclosed the impact of pending litigations on its financial position in its Standalone Financial Statements;
ii. The Company has made provision, as required under the applicable law or accounting standards, for material foreseeable losses, if any, on long-term contracts including derivative contracts;
iii. There has been no delay in transferring amounts, required to be transferred, to the Investor Education and Protection Fund by the Company.
2. As required by the Companies (Auditor’s Report) Order, 2016 (“the Order”) issued by the Central Government in terms of Section 143(11) of the Act, we give in “Annexure B” a statement on the matters specified in paragraphs 3 and 4 of the Order.
For DELOITTE HASKINS & SELLS LLPChartered AccountantsFirm Registration Number: 117366W/W-100018
Vikas BagariaPartnerMembership number: 60408
BengaluruJune 9, 2021
Integrated Annual Report 2020-21Wipro LimitedStandalone Financial Statement under Ind AS
147

(Referred to in paragraph (f) under ‘Report on Other Legal and Regulatory Requirements’ section of our report to the Members of Wipro Limited of even date)
Report on the Internal Financial Controls Over Financial Reporting under Clause (i) of Sub-section 3 of Section 143 of the Companies Act, 2013 (“the Act”)
We have audited the internal financial controls over financial reporting of Wipro Limited (“the Company”) as of March 31, 2021 in conjunction with our audit of the Standalone Financial Statements of the Company for the year ended on that date.
Management’s Responsibility for Internal Financial Controls
The Board of Directors of the Company are responsible for establishing and maintaining internal financial controls based on the internal control over financial reporting criteria established by the Company considering the essential components of internal control stated in the Guidance Note on Audit of Internal Financial Controls Over Financial Reporting issued by the Institute of Chartered Accountants of India (“the ICAI”). These responsibilities include the design, implementation and maintenance of adequate internal financial controls that were operating effectively for ensuring the orderly and efficient conduct of its business, including adherence to company’s policies, the safeguarding of its assets, the prevention and detection of frauds and errors, the accuracy and completeness of the accounting records, and the timely preparation of reliable financial information, as required under the Act.
Auditor’s ResponsibilityOur responsibility is to express an opinion on the Company's internal financial controls over financial reporting of the Company based on our audit. We conducted our audit in accordance with the Guidance Note on Audit of Internal Financial Controls Over Financial Reporting (the “Guidance Note”) issued by the ICAI and the Standards on Auditing prescribed under Section 143(10) of the Companies Act, 2013, to the extent applicable to an audit of internal financial controls. Those Standards and the Guidance Note require that we comply with ethical requirements and plan and perform the audit to obtain reasonable assurance about whether adequate internal financial controls over financial reporting was established and maintained and if such controls operated effectively in all material respects.
Our audit involves performing procedures to obtain audit evidence about the adequacy of the internal financial controls system over financial reporting and their operating effectiveness. Our audit of internal financial controls over financial reporting included obtaining an understanding of
internal financial controls over financial reporting, assessing the risk that a material weakness exists, and testing and evaluating the design and operating effectiveness of internal control based on the assessed risk. The procedures selected depend on the auditor’s judgement, including the assessment of the risks of material misstatement of the financial statements, whether due to fraud or error.
We believe that the audit evidence we have obtained, is sufficient and appropriate to provide a basis for our audit opinion on the Company’s internal financial controls system over financial reporting.
Meaning of Internal Financial Controls over Financial Reporting
A company’s internal financial control over financial reporting is a process designed to provide reasonable assurance regarding the reliability of financial reporting and the preparation of financial statements for external purposes in accordance with generally accepted accounting principles. A company's internal financial control over financial reporting includes those policies and procedures that (1) pertain to the maintenance of records that, in reasonable detail, accurately and fairly reflect the transactions and dispositions of the assets of the company; (2) provide reasonable assurance that transactions are recorded as necessary to permit preparation of financial statements in accordance with generally accepted accounting principles, and that receipts and expenditures of the company are being made only in accordance with authorisations of management and directors of the company; and (3) provide reasonable assurance regarding prevention or timely detection of unauthorised acquisition, use, or disposition of the company's assets that could have a material effect on the financial statements.
Inherent Limitations of Internal Financial Controls over Financial Reporting
Because of the inherent limitations of internal financial controls over financial reporting, including the possibility of collusion or improper management override of controls, material misstatements due to error or fraud may occur and not be detected. Also, projections of any evaluation of the internal financial controls over financial reporting to future periods are subject to the risk that the internal financial control over financial reporting may become inadequate because of changes in conditions, or that the degree of compliance with the policies or procedures may deteriorate.
OpinionIn our opinion, to the best of our information and according to the explanations given to us, the Company has, in
Annexure “A” to the Independent Auditor’s Report
Standalone Financial Statement under Ind AS
148

all material respects, an adequate internal financial controls system over financial reporting and such internal financial controls over financial reporting were operating effectively as at March 31, 2021, based on, the criteria for internal control over financial reporting established by the Company considering the essential components of internal control stated in the Guidance Note on Audit of Internal Financial Controls Over Financial Reporting issued by the ICAI.
For DELOITTE HASKINS & SELLS LLPChartered AccountantsFirm Registration Number: 117366W/W-100018
Vikas BagariaPartnerMembership number: 60408
BengaluruJune 9, 2021
Annexure “B” to the Independent Auditor’s Report
(Referred to in paragraph 2 under ‘Report on Other Legal and Regulatory Requirements’ section of our report to the Members of Wipro Limited of even date)
(i) In respect of the Company’s fixed assets:
(a) The Company has maintained proper records showing full particulars, including quantitative details and situation of fixed assets.
(b) The Company has a program of verification to cover all the items of fixed assets in a phased manner over a period of 3 years which, in our opinion, is reasonable having regard to the size of the Company and the nature of its assets. Pursuant to the program, certain fixed assets were physically verified by the management during the year. According to the information and explanations given to us, no material discrepancies were noticed on such verification.
(c) According to the information and explanations given to us, the records examined by us and based on the examination of the conveyance deeds/registered sale deeds provided to us, we report that, the title deeds, comprising all the immovable properties of land and buildings which are freehold, are held in the name of the Company as at the balance sheet date except for a freehold land with a carrying amount of ` 404 million, for which the title deed has not been executed in the name of the Company pending fulfilment of certain conditions.
(ii) As explained to us, the inventories were physically verified during the year by the management at reasonable intervals. There were no material discrepancies noticed on physical verification during the year.
(iii) According to the information and explanations given to us, the Company has granted unsecured loans to one body corporate, covered in the register maintained under section 189 of the Companies Act, 2013, in respect of which:
(a) The terms and conditions of the grant of such loans are, in our opinion, prima facie, not prejudicial to the Company’s interest.
(b) The schedule of repayment of principal and payment of interest has been stipulated and repayments or receipts of principal amounts and interest have been regular as per stipulations.
(c) There is no overdue amount remaining outstanding as at the year-end.
(iv) In our opinion and according to the information and explanations given to us, the Company has complied with the provisions of Sections 185 and 186 of the Act in respect of grant of loans, making investments and providing guarantees and securities, as applicable. There were no loans granted during the year under Section 185 of the Act.
(v) According to the information and explanations given to us the Company has not accepted any deposit during the year and does not have any unclaimed deposits as at March 31, 2021 and therefore, the provisions of the clause 3 (v) of the Order are not applicable to the Company.
(vi) Maintenance of cost records has not been specified by the Central Government under section 148(1) of the Act, for the business activities carried out by the Company. Thus reporting under Clause 3(vi) of the Order is not applicable to the Company.
Integrated Annual Report 2020-21Wipro LimitedStandalone Financial Statement under Ind AS
149

(vii) According to the information and explanations given to us, in respect of statutory dues:
(a) The Company has generally been regular in depositing undisputed statutory dues, including Provident Fund, Employees’ State Insurance, Income Tax, Sales Tax, Service Tax, Goods and Services Tax, Value Added Tax, Customs Duty, Excise Duty, Cess and other material statutory dues applicable to it with the appropriate authorities.
(b) There were no undisputed amounts payable in respect of Provident Fund, Employees’ State
Insurance, Income Tax, Sales Tax, Service Tax, Value Added Tax, Goods and Services Tax, Customs Duty, Excise Duty, Cess and other material statutory dues in arrears as at March 31, 2021 for a period of more than six months from the date they became payable.
(c) Details of dues of Income Tax, Sales Tax, Service Tax, Customs Duty, Excise Duty, Value Added Tax and Goods and Services Tax, which have not been deposited as at March 31, 2021 on account of dispute are given below:
` in millions
Name of Statute Nature of duesForum where dispute is
pendingPeriod to which the
amount relatesAmount Involved
Amount not deposited as at March 31, 2021
The Central Excise Act, 1944 Excise Duty Assistant Commissioner 1990-91 to 2014-15 57 52
The Central Excise Act, 1944 Excise Duty Commissioner 2004-05 to 2014-15 10 10
The Central Excise Act, 1944 Excise Duty Commissioner (Appeals) 1994-95 to 2012-13 13 13
The Central Excise Act, 1944 Excise Duty CESTAT 1990-2000 to 2012-13 37 25
The Central Excise Act, 1944 Excise Duty High Court 2007-08, 2008-09 1 1
The Customs Act, 1962 Customs Duty Assistant Commissioner of Customs
1994-95 to 2010-11 49 45
The Customs Act, 1962 Customs Duty CESTAT 1991-92 to 2011-12 11 4
The Customs Act, 1962 Customs Duty Commissioner 2005-06 94 90
The Customs Act, 1962 Customs Duty Commissioner (Appeals) 1997-98 to 2009-10 343 308
The Customs Act, 1962 Customs Duty Deputy Commissioner - Air Customs – Chennai
2009-10 5 5
The Customs Act, 1962 Customs Duty Madras High Court 2009-10 4 4
The Customs Act, 1962 Customs Duty-Penalty Karnataka High Court 2001-02 to 2005-06 2,711 2,631
Finance Act, 1994 Service Tax Assistant Commissioner 2003-04 to 2015-16 370 369
Finance Act, 1994 Service Tax Commissioner 2013-14 to 2017-18 613 613
Finance Act, 1994 Service Tax Commissioner (Appeals) 2005-06 to 2009-10 376 30
Finance Act, 1994 Service Tax CESTAT 2002-03 to 2011-12 2,807 2,393
Finance Act, 1994 Service Tax-Penalty Commissioner (Appeals) 2005-06 to 2009-10 29 29
Finance Act, 1994 Service Tax-Penalty Assistant Commissioner 2008-09, 2009-10 1 1
Finance Act, 1994 Service Tax- Penalty CESTAT 2002-03 to 2011-12 642 642
Sales Tax / VAT Sales Tax / VAT Assistant Commissioner/ Deputy Commissioner
1986-87 to 2017-18 4,548 4,381
Sales Tax / VAT Sales Tax / VAT Commissioner (Appeals) 1988-89 to 2017-18 1,705 1,523
Sales Tax / VAT Sales Tax / VAT Appellate Authorities 1986-87 to 2016-17 1,439 1,334
Sales Tax / VAT Sales Tax / VAT High Court 2002-03 to 2012-13 30 26
Sales Tax/ VAT Sales Tax/ VAT Supreme Court 2001-02 12 12
Goods and Services Tax Goods and Services Tax
Commissioner (Appeals) 2017-18 58 58
The Income Tax Act, 1961 Income Tax - TDS CIT(A) - TDS 2003-04, 2011-12 35 35
Annexure “B” to the Independent Auditor’s Report
Standalone Financial Statement under Ind AS
150

Name of Statute Nature of duesForum where dispute is
pendingPeriod to which the
amount relatesAmount Involved
Amount not deposited as at March 31, 2021
The Income Tax Act, 1961 Income Tax - TDS Income Tax Appellate Tribunal
2009-10 13 3
The Income Tax Act, 1961 Income Tax - TDS High Court 2010-11 61 61
The Income Tax Act, 1961 Income Tax Assessing Officer 2007-08 97 42
The Income Tax Act, 1961 Income Tax Commissioner of Income tax (Appeals)
2012-13 16 16
The Income Tax Act, 1961 Income Tax Income Tax Appellate Tribunal
2006-07, 2007-08 2009-10, 2010-11, 2014-15
2,027 1,212
The Income Tax Act, 1961 Income Tax High Court 2012-13, 2013-14 4,380 317
(viii) In our opinion and according to the information and explanations given to us, the Company has not defaulted in the repayment of loans or borrowings to financial institutions, and banks. The Company has not availed any loans or borrowings from Government. The Company has not issued any debentures.
(ix) The Company has not raised moneys by way of initial public offer or further public offer (including debt instruments) or term loans during the year, hence reporting under Clause 3(ix) of the Order is not applicable to the company.
(x) To the best of our knowledge and according to the information and explanations given to us, no fraud by the Company or no material fraud on the Company by its officers or employees has been noticed or reported during the year.
(xi) In our opinion and according to the information and explanations given to us, the Company has paid/provided managerial remuneration in accordance with the requisite approvals mandated by the provisions of section 197 read with Schedule V to the Act.
(xii) The Company is not a Nidhi Company and hence reporting under clause 3 (xii) of the Order is not applicable to the Company.
(xiii) In our opinion and according to the information and explanations given to us, the Company is in compliance with Section 177 and 188 of the Act, where applicable, for all transactions with the related parties and the details of related party transactions
have been disclosed in the Standalone Financial Statements as required by the applicable accounting standards.
(xiv) During the year, the Company has not made any preferential allotment or private placement of shares or fully or partly paid convertible debentures and hence, reporting under clause 3 (xiv) of the Order is not applicable to the Company.
(xv) In our opinion and according to the information and explanations given to us, during the year the Company has not entered into any non-cash transactions with its Directors or persons connected to its directors and hence provisions of section 192 of the Act, are not applicable to the Company.
(xvi) The Company is not required to be registered under Section 45-IA of the Reserve Bank of India Act, 1934.
For DELOITTE HASKINS & SELLS LLP
Chartered Accountants
Firm Registration Number: 117366W/W-100018
Vikas Bagaria
Partner
Membership Number: 60408
Bengaluru
June 9, 2021
Integrated Annual Report 2020-21Wipro LimitedStandalone Financial Statement under Ind AS
151

(` in millions, except share and per share data, unless otherwise stated)
Balance Sheet
NotesAs at
March 31, 2021As at
March 31, 2020
ASSETS
Non-current assets
Property, plant and equipment 4 56,758 50,473
Right-of-Use Assets 5 9,029 8,160
Capital work-in-progress 18,480 18,735
Goodwill 6 4,571 4,571
Other intangible assets 6 2,523 3,190
Financial assets
Investments 8 82,067 77,350
Derivative assets 20 16 -
Trade receivables 9 3,079 4,462
Other financial assets 11 4,469 4,416
Deferred tax assets (net) 21 474 4,333
Non-current tax assets (net) 13,829 11,103
Other non-current assets 13 8,273 9,138
Total non-current assets 203,568 195,931
Current assets
Inventories 12 910 1,741
Financial assets
Investments 8 174,952 189,635
Trade receivables 9 80,462 92,570
Cash and cash equivalents 10 97,832 104,440
Derivative assets 20 4,049 2,964
Unbilled receivables 15,823 17,964
Loans to subsidiaries 42,015 9,472
Other financial assets 11 5,187 6,807
Current tax assets (net) 973 839
Contract assets 10,809 12,432
Other current assets 13 20,783 18,269
Total current assets 453,795 457,133
TOTAL ASSETS 657,363 653,064
EQUITY AND LIABILITIES
EQUITY
Equity Share Capital 14 10,958 11,427
Other equity 441,458 453,110
TOTAL EQUITY 452,416 464,537
LIABILITIES
Non-current liabilities
Financial liabilities
Borrowings 15 141 251
Derivative liabilities 20 - 138
Other financial liabilities 17 130 146
Lease Liabilities 15 7,073 5,997
Standalone Financial Statement under Ind AS
152
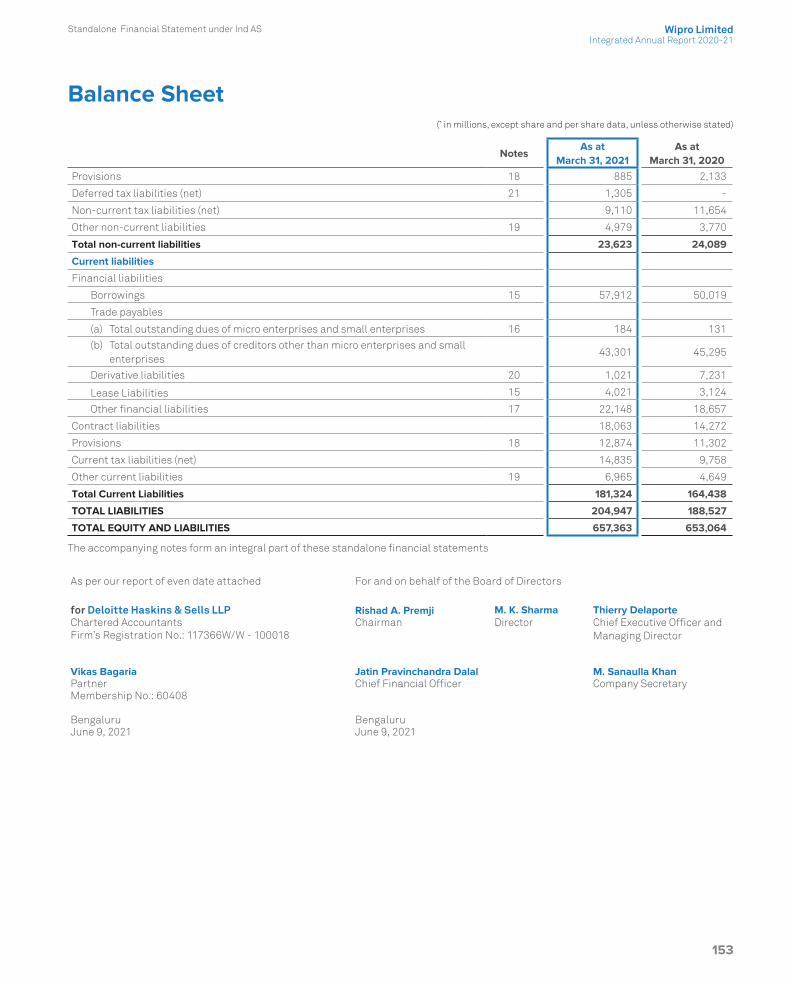
(` in millions, except share and per share data, unless otherwise stated)
Balance Sheet
NotesAs at
March 31, 2021As at
March 31, 2020
Provisions 18 885 2,133
Deferred tax liabilities (net) 21 1,305 -
Non-current tax liabilities (net) 9,110 11,654
Other non-current liabilities 19 4,979 3,770
Total non-current liabilities 23,623 24,089
Current liabilities
Financial liabilities
Borrowings 15 57,912 50,019
Trade payables
(a) Total outstanding dues of micro enterprises and small enterprises 16 184 131
(b) Total outstanding dues of creditors other than micro enterprises and small enterprises
43,301 45,295
Derivative liabilities 20 1,021 7,231
Lease Liabilities 15 4,021 3,124
Other financial liabilities 17 22,148 18,657
Contract liabilities 18,063 14,272
Provisions 18 12,874 11,302
Current tax liabilities (net) 14,835 9,758
Other current liabilities 19 6,965 4,649
Total Current Liabilities 181,324 164,438
TOTAL LIABILITIES 204,947 188,527
TOTAL EQUITY AND LIABILITIES 657,363 653,064
The accompanying notes form an integral part of these standalone financial statements
As per our report of even date attached For and on behalf of the Board of Directors
for Deloitte Haskins & Sells LLP Rishad A. Premji M. K. Sharma Thierry DelaporteChartered Accountants Chairman Director Chief Executive Officer and
Managing DirectorFirm’s Registration No.: 117366W/W - 100018
Vikas Bagaria Jatin Pravinchandra Dalal M. Sanaulla KhanPartner Chief Financial Officer Company SecretaryMembership No.: 60408
Bengaluru BengaluruJune 9, 2021 June 9, 2021
Integrated Annual Report 2020-21Wipro LimitedStandalone Financial Statement under Ind AS
153

(` in millions, except share and per share data, unless otherwise stated)
Statement of Profit and Loss
NotesYear ended
March 31, 2021Year ended
March 31, 2020
INCOME
Revenue from operations 22 502,994 503,877
Other operating income - 193
Other income 23 23,829 24,766
Total Income 526,823 528,836
EXPENSES
Purchases of stock-in-trade 5,879 7,983
Changes in inventories of finished goods and stock-in-trade 24 345 1,599
Employee benefits expense 25 264,673 261,718
Finance costs 26 4,026 5,352
Depreciation, amortisation and impairment expense 13,493 11,411
Sub-contracting / technical fees / third party application 80,352 87,918
Travel 4,358 15,373
Facility expenses 14,318 13,925
Communication 4,189 3,784
Legal and professional charges 3,537 2,784
Marketing and brand building 839 2,227
Other expenses 27 3,966 4,685
Total expenses 399,975 418,759
Profit before tax 126,848 110,077
Tax expense
Current tax 21 22,430 22,067
Deferred tax 21 3,809 1,203
Total tax expense 26,239 23,270
Profit for the year 100,609 86,807
Other comprehensive income (OCI)
Items that will not be reclassified to profit or loss:
Remeasurements of the defined benefit plans, net 25 562 (869)
Net change in fair value of investment in equity instruments measured at fair value through OCI
(8) (91)
Income tax relating to items that will not be reclassified to profit or loss 21 (113) 193
Standalone Financial Statement under Ind AS
154

(` in millions, except share and per share data, unless otherwise stated)
Statement of Profit and Loss
NotesYear ended
March 31, 2021Year ended
March 31, 2020
Items that will be reclassified to profit or loss:
Net change in time value of option contracts designated as cash flow hedges 66 (649)
Net change in intrinsic value of option contracts designated as cash flow hedges 1,193 (1,941)
Net change in fair value of forward contracts designated as cash flow hedges 3,799 (3,309)
Net change in fair value of investment in debt instruments measured at fair value through OCI
2,079 1,015
Income tax relating to items that will be reclassified to profit or loss 21 (1,241) 1,367
Total other comprehensive income / (loss) for the year, net of taxes 6,337 (4,284)
Total comprehensive income for the year 106,946 82,523
Earnings per equity share: (Equity shares of par value ` 2 each) 28
Basic 17.81 14.88
Diluted 17.77 14.84
Weighted average number of equity shares used in computing earnings per equity share
Basic 5,649,265,885 5,833,384,018
Diluted 5,661,657,822 5,847,823,239
The accompanying notes form an integral part of these standalone financial statements
As per our report of even date attached For and on behalf of the Board of Directors
for Deloitte Haskins & Sells LLP Rishad A. Premji M. K. Sharma Thierry DelaporteChartered Accountants Chairman Director Chief Executive Officer and
Managing DirectorFirm’s Registration No.: 117366W/W - 100018
Vikas Bagaria Jatin Pravinchandra Dalal M. Sanaulla KhanPartner Chief Financial Officer Company SecretaryMembership No.: 60408
Bengaluru BengaluruJune 9, 2021 June 9, 2021
Integrated Annual Report 2020-21Wipro LimitedStandalone Financial Statement under Ind AS
155
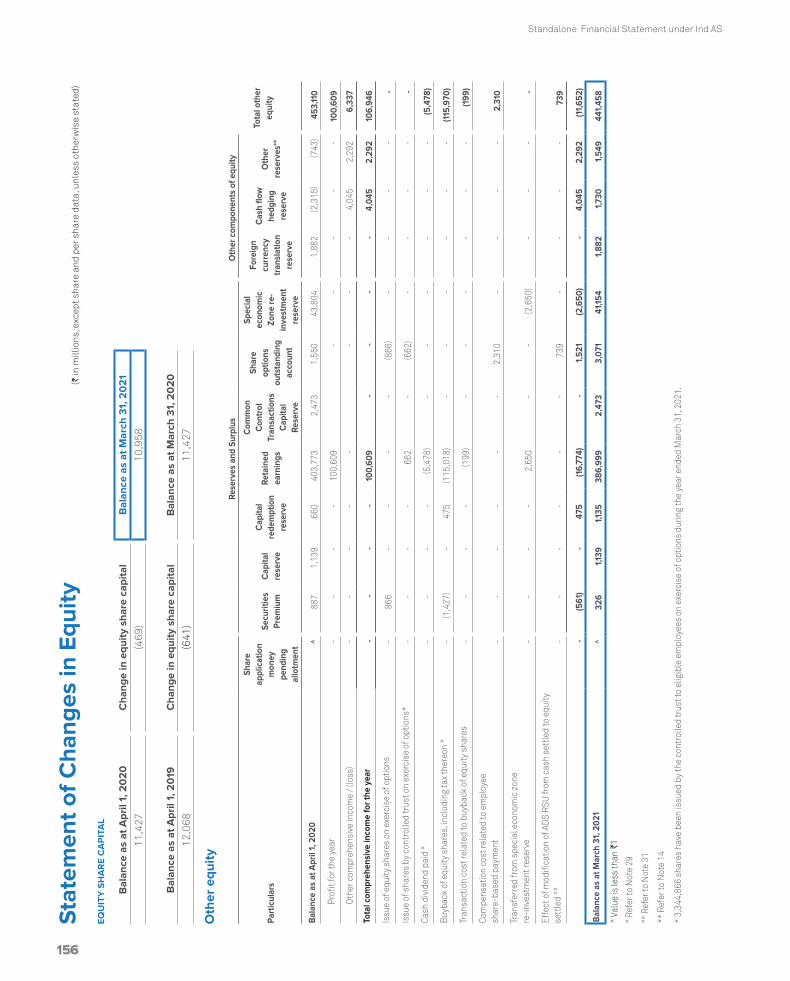
EQU
ITY
SH
AR
E C
AP
ITA
L
Bal
ance
as
at A
pril
1, 2
02
0C
hang
e in
equ
ity s
hare
cap
ital
Bal
ance
as
at M
arch
31,
20
21
11,4
27(4
69)
10,9
58
Bal
ance
as
at A
pril
1, 2
019
Cha
nge
in e
quity
sha
re c
apita
lB
alan
ce a
s at
Mar
ch 3
1, 2
02
012
,068
(6
41)
11,4
27
Oth
er e
quity
Rese
rves
and
Sur
plus
Oth
er c
ompo
nent
s of
equ
ity
Tota
l oth
er
equi
tyPa
rtic
ular
s
Shar
e ap
plic
atio
n m
oney
pe
ndin
g al
lotm
ent
Secu
ritie
s Pr
emiu
mC
apita
l re
serv
e
Cap
ital
rede
mpt
ion
rese
rve
Reta
ined
ea
rnin
gs
Com
mon
C
ontr
ol
Tran
sact
ions
C
apita
l Re
serv
e
Shar
e op
tions
ou
tsta
ndin
g ac
coun
t
Spec
ial
econ
omic
Zo
ne re
-in
vest
men
t re
serv
e
Fore
ign
curr
ency
tr
ansl
atio
n re
serv
e
Cas
h flo
w
hedg
ing
rese
rve
Oth
er
rese
rves
**
Bala
nce
as a
t Apr
il 1,
202
0^
887
1,13
966
040
3,77
32,
473
1,55
043
,804
1,88
2(2
,315
)(7
43)
453,
110
Profi
t for
the
year
--
--
100,
609
--
--
-10
0,60
9
Othe
r com
preh
ensi
ve in
com
e / (
loss
)-
--
--
--
-4,
045
2,29
26,
337
Tota
l com
preh
ensi
ve in
com
e fo
r the
yea
r-
--
-10
0,60
9-
--
-4,
045
2,29
210
6,94
6
Issu
e of
equ
ity s
hare
s on
exe
rcis
e of
opt
ions
-86
6-
--
-(8
66)
--
--
-
Issu
e of
sha
res
by c
ontr
olle
d tr
ust o
n ex
erci
se o
f opt
ions
*-
--
-66
2-
(662
)-
--
--
Cash
div
iden
d pa
id #
--
--
(5,4
78)
--
--
--
(5,4
78)
Buyb
ack
of e
quity
sha
res,
incl
udin
g ta
x th
ereo
n #
-(1
,427
)-
475
(115
,018
)-
--
--
-(1
15,9
70)
Tran
sact
ion
cost
rela
ted
to b
uyba
ck o
f equ
ity s
hare
s-
--
-(1
99)
--
--
--
(199
)
Com
pens
atio
n co
st re
late
d to
em
ploy
ee
shar
e-ba
sed
paym
ent
--
--
--
2,31
0-
--
-2,
310
Tran
sfer
red
from
spe
cial
eco
nom
ic z
one
re
-inv
estm
ent r
eser
ve-
--
-2,
650
--
(2,6
50)
--
--
Effe
ct o
f mod
ifica
tion
of A
DS
RSU
from
cas
h se
ttle
d to
equ
ity
sett
led
##
--
--
--
739
--
--
739
-(5
61)
-47
5(1
6,77
4)-
1,52
1(2
,650
)-
4,04
52,
292
(11,6
52)
Bala
nce
as a
t Mar
ch 3
1, 2
021
^32
61,1
391,1
3538
6,99
92,
473
3,07
141
,154
1,88
21,7
301,
549
441,
458
^ Va
lue
is le
ss th
an `
1#
Ref
er to
Not
e 29
##
Ref
er to
Not
e 31
** R
efer
to N
ote
14
* 3,
344,
866
shar
es h
ave
been
issu
ed b
y th
e co
ntro
lled
trus
t to
elig
ible
em
ploy
ees
on e
xerc
ise
of o
ptio
ns d
urin
g th
e ye
ar e
nded
Mar
ch 3
1, 2
021.
(` in
mill
ions
, exc
ept s
hare
and
per
sha
re d
ata,
unl
ess
othe
rwis
e st
ated
)St
atem
ent o
f Cha
nges
in E
quity
Standalone Financial Statement under Ind AS
156156

Rese
rves
and
Sur
plus
Oth
er c
ompo
nent
s of
equ
ity
Tota
l oth
er
equi
tyPa
rtic
ular
s
Shar
e ap
plic
atio
n m
oney
pe
ndin
g al
lotm
ent
Secu
ritie
s Pr
emiu
mC
apita
l re
serv
e
Cap
ital
rede
mpt
ion
rese
rve
Reta
ined
ea
rnin
gs
Com
mon
C
ontr
ol
Tran
sact
ions
C
apita
l Re
serv
e
Shar
e op
tions
ou
tsta
ndin
g ac
coun
t
Spec
ial
econ
omic
Zo
ne re
-in
vest
men
t re
serv
e
Fore
ign
curr
ency
tr
ansl
atio
n re
serv
e
Cas
h flo
w
hedg
ing
rese
rve
Oth
er
rese
rves
**
Bala
nce
as a
t Apr
il 1,
201
9^
145
1,139
1444
3,79
12
,473
2,6
172
8,5
65
1,8
82
2,4
24
(1,19
8)
481,
85
2
Adju
stm
ent o
n ad
optio
n of
Ind
AS 1
16#
##
--
--
(414
)-
--
--
-(4
14)
Adj
uste
d ba
lanc
e as
at A
pril
1, 2
019
^14
51,1
3914
443,
377
2,4
732
,617
28
,56
51,
88
22
,42
4(1
,198
)48
1,43
8
Profi
t for
the
year
--
--
86,8
07-
--
--
-8
6,8
07
Othe
r com
preh
ensi
ve in
com
e / (
loss
)-
--
--
--
--
(4,7
39)
455
(4,2
84)
Tota
l com
preh
ensi
ve in
com
e fo
r the
yea
r-
--
-8
6,8
07
--
--
(4,7
39)
455
82
,52
3
Issu
e of
equ
ity s
hare
s on
exe
rcis
e of
opt
ions
-74
2-
--
-(7
42)
--
--
-
Issu
e of
sha
res
by c
ontr
olle
d tr
ust o
n ex
erci
se o
f opt
ions
*-
--
-1,
026
-(1
,026
)-
--
--
Cash
div
iden
d pa
id (i
nclu
ding
div
iden
d ta
x th
ereo
n)#
--
--
(6,8
87)
--
--
--
(6,8
87)
Buyb
ack
of e
quity
sha
res#
--
-64
6(1
05,0
00)
--
--
--
(10
4,35
4)
Tran
sact
ion
cost
rela
ted
to b
uyba
ck o
f equ
ity s
hare
s-
--
-(3
11)
--
--
--
(311
)Co
mpe
nsat
ion
cost
rela
ted
to e
mpl
oyee
sh
are-
base
d pa
ymen
t-
--
--
-1,
262
--
--
1,2
62
Tran
sfer
red
to s
peci
al e
cono
mic
zon
e
re-i
nves
tmen
t res
erve
--
--
(15,
239)
--
15,2
39-
--
-Ef
fect
of m
odifi
catio
n of
AD
S RS
U fr
om e
quity
set
tled
to
cash
set
tled
##
--
--
--
(561
)-
--
-(5
61)
-74
2-
646
(39,
60
4)-
(1,0
67)
15,2
39-
(4,7
39)
455
(28
,32
8)
Bala
nce
as a
t Mar
ch 3
1, 2
020
^8
87
1,139
66
040
3,77
32
,473
1,5
50
43,8
04
1,8
82
(2,3
15)
(743
)45
3,11
0
^ Va
lue
is le
ss th
an `
1#
Ref
er to
Not
e 29
##
Ref
er to
Not
e 31
##
# Re
fer t
o N
ote
3
** R
efer
to N
ote
14
*4,6
07,7
72 s
hare
s ha
ve b
een
issu
ed b
y th
e co
ntro
lled
trus
t to
elig
ible
em
ploy
ees
on e
xerc
ise
of o
ptio
ns d
urin
g th
e ye
ar e
nded
Mar
ch 3
1, 2
020.
The
acco
mpa
nyin
g no
tes
form
an
inte
gral
par
t of t
hese
sta
ndal
one
fina
ncia
l sta
tem
ents
As
per
our
rep
ort o
f eve
n da
te a
ttac
hed
For
and
on b
ehal
f of t
he B
oard
of D
irec
tors
for
Del
oitt
e H
aski
ns &
Sel
ls L
LP
Ris
had
A. P
rem
jiM
. K. S
harm
aTh
ierr
y D
elap
orte
Cha
rter
ed A
ccou
ntan
tsC
hair
man
Dir
ecto
rC
hief
Exe
cuti
ve O
ffice
r an
d M
anag
ing
Dir
ecto
rF
irm
’s R
egis
trat
ion
No.
: 117
366W
/W -
100
018
Vik
as B
agar
ia
Ja
tin P
ravi
ncha
ndra
Dal
alM
. San
aulla
Kha
nP
artn
erC
hief
Fin
anci
al O
ffice
rC
ompa
ny S
ecre
tary
Mem
ber
ship
No.
: 604
08
Ben
galu
ruB
enga
luru
June
9, 2
021
June
9, 2
021
(` in
mill
ions
, exc
ept s
hare
and
per
sha
re d
ata,
unl
ess
othe
rwis
e st
ated
)St
atem
ent o
f Cha
nges
in E
quity
Integrated Annual Report 2020-21Wipro LimitedStandalone Financial Statement under Ind AS
157157

(` in millions, except share and per share data, unless otherwise stated)
Statement of Cash Flows
For the year endedMarch 31, 2021
For the year ended March 31, 2020
Cash flows from operating activities:
Profit for the year 100,609 86,807
Adjustments to reconcile profit for the year to net cash generated from operating activities:
(Gain)/loss on sale of property, plant and equipment, net (344) 10
Depreciation, amortisation and impairment expense 13,493 11,411
Unrealised exchange (gain)/loss, net and exchange (gain)/ loss on borrowings (2,311) 6,602
Share-based compensation expense 2,310 1,262
Income tax expense 26,239 23,270
Finance and other income, net of finance expenses (17,208) (20,460)
Gain from sale of business - (193)
Reversal of provision for diminution in the value of non-current investments (2,875) -
Changes in operating assets and liabilities, net of effects from acquisitions
Trade receivables 13,491 (2,058)
Unbilled receivables and contract assets 3,764 (3,295)
Inventories 831 1,663
Other assets 2,276 (503)
Trade payables, other liabilities and provisions 5,970 (7,341)
Contract liabilities 3,791 (590)
Cash generated from operating activities before taxes 150,036 96,585
Income taxes (paid)/refund, net (22,759) (5,904)
Net cash generated from operating activities 127,277 90,681
Cash flows from investing activities:
Purchase of property, plant and equipment (16,164) (18,326)
Proceeds from sale of property, plant and equipment 666 490
Purchase of investments (1,168,308) (1,176,999)
Proceeds from sale of investments 1,186,059 1,209,778
Investment in subsidiaries (1,546) -
Payment for business acquisitions, including deposits and escrow, net of cash acquired - (3,230)
Proceeds from redemption of preference shares in subsidiaries - 5,055
Loans to subsidiaries (32,630) (9,472)
Proceeds from sale of business - 923
Interest received 19,128 22,707
Dividend received 45 1,101
Net cash generated from/(used in) investing activities (12,750) 32,027
Standalone Financial Statement under Ind AS
158

(` in millions, except share and per share data, unless otherwise stated)
Statement of Cash Flows
For the year endedMarch 31, 2021
For the year ended March 31, 2020
Cash flows from financing activities:
Proceeds from issuance of equity shares and shares pending allotment 6 5
Repayment of borrowings (93,990) (106,833)
Proceeds from borrowings 101,865 102,509
Payment for buyback of equity shares, including transaction cost (95,199) (105,311)
Payment of tax on buyback of equity shares (21,445) -
Repayment of lease liabilities (4,559) (3,255)
Interest paid (2,257) (2,558)
Payment of cash dividend (5,478) (5,713)
Payment of tax on cash dividend - (1,174)
Net cash used in financing activities (121,057) (122,330)
Net increase/ (decrease) in cash and cash equivalents during the year (6,530) 378
Effect of exchange rate changes on cash and cash equivalents (78) 163
Cash and cash equivalents at the beginning of the year 104,440 103,899
Cash and cash equivalents at the end of the year (Note 10) 97,832 104,440
Refer to Note 15 for supplementary information on statement of cash flows.
^ Value is less than ` 1
The accompanying notes form an integral part of these standalone financial statements
As per our report of even date attached For and on behalf of the Board of Directors
for Deloitte Haskins & Sells LLP Rishad A. Premji M. K. Sharma Thierry DelaporteChartered Accountants Chairman Director Chief Executive Officer and
Managing DirectorFirm’s Registration No.: 117366W/W - 100018
Vikas Bagaria Jatin Pravinchandra Dalal M. Sanaulla KhanPartner Chief Financial Officer Company SecretaryMembership No.: 60408
Bengaluru BengaluruJune 9, 2021 June 9, 2021
Integrated Annual Report 2020-21Wipro LimitedStandalone Financial Statement under Ind AS
159

Notes to the Standalone Financial Statements
Standalone Financial Statement under Ind AS
160
1. The Company Overview Wipro Limited (“Wipro” or the “Company” or “we” or “our” or “us”), is a global information technology (“IT”), consulting and business process services (“BPS”) company.
Wipro is a public limited company incorporated and domiciled in India. The address of its registered office is Wipro Limited, Doddakannelli, Sarjapur Road, Bengaluru – 560 035, Karnataka, India. Wipro has its primary listing with BSE Ltd. and National Stock Exchange of India Ltd. The Company’s American Depository Shares (“ADS”) representing equity shares are also listed on the New York Stock Exchange.
These standalone financial statements were authorised for issue by the Company’s Board of Directors on June 9, 2021.
2. Basis of Preparation of Standalone Financial Statements
(i) Statement of compliance and basis of preparation
The standalone financial statements have been prepared in accordance with Indian Accounting Standards (“Ind AS”), the provisions of the Companies Act, 2013 (“the Companies Act”), as applicable and guidelines issued by the Securities and Exchange Board of India (“SEBI”). The Ind AS are prescribed under Section 133 of the Companies Act, 2013 read with Rule 3 of the Companies (Indian Accounting Standards) Rules, 2015 and amendments issued thereafter.
Accounting policies have been applied consistently to all periods presented in these standalone financial statements, except for new accounting standards adopted by the Company.
The standalone financial statements correspond to the classification provisions contained in Ind AS 1, “Presentation of Financial Statements”. For clarity, various items are aggregated in the statement of profit and loss and balance sheet. These items are disaggregated separately in the notes to the standalone financial statements, where applicable.
All amounts included in the standalone financial statements are reported in millions of Indian rupees (` in millions) except share and per share data, unless otherwise stated. Due to rounding off, the numbers presented throughout the document may not add up precisely to the totals and percentages may not precisely reflect the absolute figures. Previous year figures have been regrouped/re-arranged, wherever necessary.
(ii) Basis of measurement
The standalone financial statements have been prepared on a historical cost convention and on an accrual basis, except for the following material items, which have been measured at fair value as required by relevant Ind AS:
a) Derivative financial instruments,
b) Financial instruments classified as fair value through other comprehensive income or fair value through profit or loss,
c) The defined benefit liability/(asset) is recognised as the present value of defined benefit obligation less fair value of plan assets, and
d) Contingent consideration
(iii) Use of estimates and judgment
The preparation of the standalone financial statements in conformity with Ind AS requires management to make judgments, estimates and assumptions that affect the application of accounting policies and the reported amounts of assets, liabilities, income and expenses. Actual results may differ from those estimates.
Estimates and underlying assumptions are reviewed on an ongoing basis. Revisions to accounting estimates are recognised in the period in which the estimates are revised and in any future periods affected. In particular, information about significant areas of estimation, uncertainty and critical judgments in applying accounting policies that have the most significant effect on the amounts recognised in the standalone financial statements are included in the following notes:
a) Revenue recognition: The Company applies judgement to determine whether each product or service promised to a customer is capable of being distinct, and is distinct in the context of the contract, if not, the promised products or services are combined and accounted as a single performance obligation. The Company allocates the arrangement consideration to separately identifiable performance obligation deliverables based on their relative stand-alone selling price. In cases where the Company is unable to determine the stand-alone selling price the Company uses expected cost-plus margin approach in estimating the stand-alone selling price. The Company uses the percentage of completion method using the input (cost expended) method to measure progress towards completion in respect of fixed price contracts. Percentage of completion method
(` in millions, except share and per share data, unless otherwise stated)

Notes to the Standalone Financial Statements
Integrated Annual Report 2020-21Wipro LimitedStandalone Financial Statement under Ind AS
161
accounting relies on estimates of total expected contract revenue and costs. This method is followed when reasonably dependable estimates of the revenues and costs applicable to various elements of the contract can be made. Key factors that are reviewed in estimating the future costs to complete include estimates of future labor costs and productivity efficiencies. Because the financial reporting of these contracts depends on estimates that are assessed continually during the term of these contracts, revenue recognised, profit and timing of revenue for remaining performance obligations are subject to revisions as the contract progresses to completion. When estimates indicate that a loss will be incurred, the loss is provided for in the period in which the loss becomes probable. Volume discounts are recorded as a reduction of revenue. When the amount of discount varies with the levels of revenue, volume discount is recorded based on estimate of future revenue from the customer.
b) Impairment testing: Investments in subsidiaries, goodwill and intangible assets with indefinite useful life recognised on business combination are tested for impairment at least annually and when events occur or changes in circumstances indicate that the recoverable amount of an asset or a cash generating unit to which an asset pertains, is less than the carrying value. The Company assesses acquired intangible assets with finite useful life for impairment whenever events or changes in circumstances indicate that the carrying amount may not be recoverable. The recoverable amount of an asset or a cash generating unit is higher of value in use and fair value less cost of disposal. The calculation of value in use of an asset or a cash generating unit involves use of significant estimates and assumptions which include turnover, growth rates and net margins used to calculate projected future cash flows, risk-adjusted discount rate, future economic and market conditions.
c) Income taxes: The major tax jurisdictions for the Company are India and the United States of America. Significant judgments are involved in determining the provision for income taxes including judgment on whether tax positions are probable of being sustained in tax assessments. A tax assessment can involve complex issues, which can only be resolved over extended time periods.
d) Deferred taxes: Deferred tax is recorded on temporary differences between the tax bases of assets and liabilities and their carrying amounts, at
the rates that have been enacted or substantively enacted at the reporting date. The ultimate realisation of deferred tax assets is dependent upon the generation of future taxable profits during the periods in which those temporary differences and tax loss carry-forwards become deductible. The Company considers expected reversal of deferred tax liabilities and projected future taxable income in making this assessment. The amount of deferred tax assets considered realisable, however, could reduce in the near term if estimates of future taxable income during the carry-forward period are reduced.
e) Business combinations: In accounting for business combinations, judgment is required in identifying whether an identifiable intangible asset is to be recorded separately from goodwill. Additionally, estimating the acquisition date fair value of the identifiable assets acquired (including useful life estimates) and liabilities assumed, and contingent consideration assumed involves management judgment. These measurements are based on information available at the acquisition date and are based on expectations and assumptions that have been deemed reasonable by management. Changes in these judgments, estimates, and assumptions can materially affect the results of operations.
f) Defined benefit plans and compensated absences: The cost of the defined benefit plans, compensated absences and the present value of the defined benefit obligations are based on actuarial valuation using the projected unit credit method. An actuarial valuation involves making various assumptions that may differ from actual developments in the future. These include the determination of the discount rate, future salary increases and mortality rates. Due to the complexities involved in the valuation and its long-term nature, a defined benefit obligation is highly sensitive to changes in these assumptions. All assumptions are reviewed at each reporting date.
g) Expected credit losses on financial assets: The impairment provisions of financial assets are based on assumptions about risk of default and expected timing of collection. The Company uses judgment in making these assumptions and selecting the inputs to the expected credit loss calculation based on the Company’s history of collections, customer’s creditworthiness, existing market conditions as well as forward looking estimates at the end of each reporting period.

Notes to the Standalone Financial Statements
Standalone Financial Statement under Ind AS
162
h) Measurement of fair value of non-marketable equity investments: These instruments are initially recorded at cost and subsequently measured at fair value. Fair value of investments is determined using the market and income approaches. The market approach includes the use of financial metrics and ratios of comparable companies, such as revenue, earnings, comparable performance multiples, recent financial rounds and the level of marketability of the investments. The selection of comparable companies requires management judgment and is based on a number of factors, including comparable company sizes, growth rates and development stages. The income approach includes the use of discounted cash flow model, which requires significant estimates regarding the investees’ revenue, costs, and discount rates based on the risk profile of comparable companies. Estimates of revenue and costs are developed using available historical and forecast data.
i) Useful lives of property, plant and equipment: The Company depreciates property, plant and equipment on a straight-line basis over estimated useful lives of the assets. The charge in respect of periodic depreciation is derived based on an estimate of an asset’s expected useful life and the expected residual value at the end of its life. The lives are based on historical experience with similar assets as well as anticipation of future events, which may impact their life, such as changes in technology. The estimated useful life is reviewed at least annually.
j) Useful lives of intangible assets: The Company amortises intangible assets on a straight-line basis over estimated useful lives of the assets. The useful life is estimated based on a number of factors including the effects of obsolescence, demand, competition and other economic factors such as the stability of the industry and known technological advances and the level of maintenance expenditures required to obtain the expected future cash flows from the assets. The estimated useful life is reviewed at least annually.
k) Leases: Ind AS 116 defines a lease term as the non-cancellable period for which the lessee has the right to use an underlying asset including optional periods, when an entity is reasonably certain to exercise an option to extend (or not to terminate) a lease. The Company considers all relevant facts and circumstances that create an economic incentive for the lessee to exercise the option when determining the lease term. The option
to extend the lease is included in the lease term, if it is reasonably certain that the lessee would exercise the option. The Company reassesses the option upon occurrence of either a significant event or change in circumstances that are within the control of the lessee.
l) Provisions and contingent liabilities: The Company estimates the provisions that have present obligations as a result of past events and it is probable that outflow of resources will be required to settle the obligations. These provisions are reviewed at the end of each reporting date and are adjusted to reflect the current best estimates.
The Company uses significant judgement to disclose contingent liabilities. Contingent liabilities are disclosed when there is a possible obligation arising from past events, the existence of which will be confirmed only by the occurrence or non-occurrence of one or more uncertain future events not wholly within the control of the Company or a present obligation that arises from past events where it is either not probable that an outflow of resources will be required to settle the obligation or a reliable estimate of the amount cannot be made. Contingent assets are neither recognised nor disclosed in the standalone financial statements.
m) Other estimates: The share-based compensation expense is determined based on the Company’s estimate of equity instruments that will eventually vest. Fair valuation of derivative hedging instruments designated as cash flow hedges involves significant estimates relating to the occurrence of forecasted transactions.
n) Uncertainty relating to the global health pandemic on COVID-19: In assessing the recoverability of receivables including unbilled receivables, contract assets and contract costs, goodwill, intangible assets, and certain investments, the Company has considered internal and external information up to the date of approval of these standalone financial statements including credit reports and economic forecasts. The Company has performed sensitivity analysis on the assumptions used herein. Based on the current indicators of future economic conditions, the Company expects to recover the carrying amount of these assets.
The Company bases its assessment on the belief that the probability of occurrence of forecasted transactions is not impacted by COVID-19. The Company has considered the effect of changes, if any, in both counterparty credit risk and its own

Notes to the Standalone Financial Statements
Integrated Annual Report 2020-21Wipro LimitedStandalone Financial Statement under Ind AS
163
credit risk while assessing hedge effectiveness and measuring hedge ineffectiveness and continues to believe that COVID-19 has no impact on effectiveness of its hedges.
The impact of COVID-19 remains uncertain and may be different from what we have estimated as of the date of approval of these standalone financial statements and the Company will continue to closely monitor any material changes to future economic conditions.
3. Significant Accounting Policies
(i) Functional and presentation currency
These standalone financial statements are presented in Indian rupees, which is the functional currency of the Company.
(ii) Foreign currency transactions and translation
Transactions in foreign currency are translated into the functional currency using the exchange rates prevailing at the date of the transaction. Foreign exchange gains and losses resulting from the settlement of such transactions and from translation at the exchange rates prevailing at the reporting date of monetary assets and liabilities denominated in foreign currencies are recognised in the statement of profit and loss and reported within foreign exchange gains/(losses), net, within results of operating activities except when deferred in other comprehensive income as qualifying cash flow hedges and qualifying net investment hedges. Gains/(losses), net, relating to translation or settlement of borrowings denominated in foreign currency are reported within finance costs. Non-monetary assets and liabilities denominated in foreign currency and measured at historical cost are translated at the exchange rate prevalent at the date of transaction. Translation differences on non-monetary financial assets measured at fair value at the reporting date, such as equities classified as financial instruments measured at fair value through other comprehensive income are included in other comprehensive income, net of taxes.
(iii) Financial instruments
a) Non-derivative financial instruments:
Non-derivative financial instruments consist of:
• financial assets, which include cash and cash equivalents, trade receivables, unbilled receivables, finance lease receivables, employee and other advances, investments in equity and debt securities and eligible
current and non-current assets; Financial assets are derecognised when substantial risks and rewards of ownership of the financial asset have been transferred. In cases where substantial risks and rewards of ownership of the financial assets are neither transferred nor retained, financial assets are derecognised only when the Company has not retained control over the financial asset.
• financial liabilities, which include long and short-term loans and borrowings, bank overdrafts, trade payables, lease liabilities,and eligible current and non-current liabilities.
Non-derivative financial instruments are recognised initially at fair value. Subsequent to initial recognition, non-derivative financial instruments are measured as described below:
A. Cash and cash equivalents
The Company’s cash and cash equivalents consist of cash on hand and in banks and demand deposits with banks, which can be withdrawn at any time, without prior notice or penalty on the principal.
For the purposes of the statement of cash flows, cash and cash equivalents include cash on hand, in banks and demand deposits with banks, net of outstanding bank overdrafts that are repayable on demand and are considered part of the Company’s cash management system. In the balance sheet, bank overdrafts are presented under borrowings within current liabilities.
B. Investments
Financial instruments measured at amortised cost:
Debt instruments that meet the following criteria are measured at amortised cost (except for debt instruments that are designated at fair value through Profit or Loss (FVTPL) on initial recognition):
• the asset is held within a business model whose objective is to hold assets in order to collect contractual cash flows; and
• the contractual terms of the instrument give rise on specified dates to cash flows that are solely payment of principal and interest on the principal amount outstanding.

Notes to the Standalone Financial Statements
Standalone Financial Statement under Ind AS
164
Financial instruments measured at fair value through other comprehensive income (FVTOCI):
Debt instruments that meet the following criteria are measured at fair value through other comprehensive income (FVTOCI) (except for debt instruments that are designated at fair value through Profit or Loss (FVTPL) on initial recognition)
• the asset is held within a business model whose objective is achieved both by collecting contractual cash flows and selling the financial asset; and
• the contractual terms of the instrument give rise on specified dates to cash flows that are solely payment of principal and interest on the principal amount outstanding.
Interest income is recognised in statement of profit and loss for FVTOCI debt instruments. Other changes in fair value of FVTOCI financial assets are recognised in other comprehensive income. When the investment is disposed of, the cumulative gain or loss previously accumulated in reserves is transferred to statement of profit and loss.
Financial instruments measured at fair value through profit or loss (FVTPL):
Instruments that do not meet the amortised cost or FVTOCI criteria are measured at FVTPL. Financial assets at FVTPL are measured at fair value at the end of each reporting period, with any gains or losses arising on re-measurement recognised in statement of profit and loss. The gain or loss on disposal is recognised in statement of profit and loss.
Interest income is recognised in statement of profit and loss for FVTPL debt instruments. Dividend on financial assets at FVTPL is recognised when the Company’s right to receive dividend is established.
Investments in equity instruments:
The Company carries certain equity instruments which are not held for trading. At initial recognition, the Company may make an irrevocable election to present subsequent changes in the fair value of an investment in an equity instrument in other comprehensive income (FVTOCI) or through statement of profit and loss (FVTPL). For investments designated
to be classified as FVTOCI, movements in fair value of investments are recognised in other comprehensive income and the gain or loss is not transferred to statement of profit and loss on disposal of investments. For investments designated to be classified as FVTPL, both movements in fair value of investments and gain or loss on disposal of investments are recognised in the statement of profit and loss.
Dividends from these investments are recognised in the statement of profit and loss when the Company’s right to receive dividends is established.
Investments in subsidiaries:
Investment in subsidiaries are measured at cost less impairment.
C. Other financial assets:
Other financial assets are non-derivative financial assets with fixed or determinable payments that are not quoted in an active market. They are presented as current assets, except for those maturing later than 12 months after the reporting date which are presented as non-current assets. These are initially recognised at fair value and subsequently measured at amortised cost using the effective interest method, less any impairment losses. These comprise trade receivables, unbilled receivables, finance lease receivables, employee and other advances and other eligible current and non-current assets.
D. Trade payables and other liabilities
Trade payables and other liabilities are initially recognised at fair value, and subsequently carried at amortised cost using the effective interest method. For these financial instruments, the carrying amounts approximate fair value due to the short-term maturity of these instruments. Contingent consideration recognised in the business combination is subsequently measured at fair value through profit or loss.
b) Derivative financial instruments
The Company is exposed to foreign currency fluctuations on foreign currency assets, liabilities, net investment in foreign operations and forecasted cash flows denominated in foreign currency.

Notes to the Standalone Financial Statements
Integrated Annual Report 2020-21Wipro LimitedStandalone Financial Statement under Ind AS
165
The Company limits the effect of foreign exchange rate fluctuations by following established risk management policies including the use of derivatives. The Company enters into derivative financial instruments where the counterparty is primarily a bank.
Derivatives are recognised and measured at fair value. Attributable transaction costs are recognised in statement of profit and loss as cost.
Subsequent to initial recognition, derivative financial instruments are measured as described below:
A. Cash flow hedges
Changes in the fair value of the derivative hedging instruments designated as a cash flow hedge are recognised in other comprehensive income and held in cash flow hedging reserve, net of taxes, a component of equity, to the extent that the hedge is effective. To the extent that the hedge is ineffective, changes in fair value are recognised in the statement of profit and loss and reported within foreign exchange gains/(losses), net, within results from operating activities. If the hedging instrument no longer meets the criteria for hedge accounting, then hedge accounting is discontinued prospectively. If the hedging instrument expires or is sold, terminated or exercised, the cumulative gain or loss on the hedging instrument recognised in cash flow hedging reserve till the period the hedge was effective remains in cash flow hedging reserve until the forecasted transaction occurs. The cumulative gain or loss previously recognised in the cash flow hedging reserve is transferred to the statement of profit and loss upon the occurrence of the related forecasted transaction. If the forecasted transaction is no longer expected to occur, such cumulative balance is immediately recognised in the statement of profit and loss.
B. Others
Changes in fair value of foreign currency derivative instruments not designated as cash flow hedges are recognised in the statement of profit and loss and reported within foreign exchange gains/(losses), net, within results from operating activities.
Changes in fair value and gains/(losses), net, on settlement of foreign currency derivative instruments relating to borrowings, which have not been designated as hedges are recorded in finance costs.
c) Derecognition of financial instruments
The Company derecognises a financial asset when the contractual rights to the cash flows from the financial asset expire or it transfers the financial asset and the transfer qualifies for derecognition under Ind AS 109. If the Company retains substantially all the risks and rewards of a transferred financial asset, the Company continues to recognise the financial asset and recognises a borrowing for the proceeds received. A financial liability (or a part of a financial liability) is derecognised from the Company’s balance sheet when the obligation specified in the contract is discharged or cancelled or expires.
(iv) Equity and share capital
a) Share capital and securities premium
The authorised share capital of the Company as at March 31, 2021 is ` 25,274 divided into 12,504,500,000 equity shares of ` 2 each, 25,000,000 preference shares of ` 10 each and 150,000, 10% optionally convertible cumulative preference shares of ` 100 each. Par value of the equity shares is recorded as share capital and the amount received in excess of par value is classified as securities premium.
Every holder of the equity shares, as reflected in the records of the Company as at the date of the shareholder meeting shall have one vote in respect of each share held for all matters submitted to vote in the shareholder meeting.
b) Capital Reserve
Capital reserve amounting to ` 1,139 (March 31, 2020: ` 1,139) is not freely available for distribution.
c) Capital Redemption Reserve
As per the Companies Act, 2013, Capital redemption reserve is created when a company purchases its own shares out of free reserves or securities premium. A sum equal to the nominal value of the shares so purchased is transferred to capital redemption reserve. The reserve can be utilised in accordance with the provisions of section 69 of the Companies Act, 2013. Capital redemption reserve amounting to ` 1,135 (March 31, 2020: `660) is not freely available for distribution.

Notes to the Standalone Financial Statements
Standalone Financial Statement under Ind AS
166
d) Retained earnings
Retained earnings comprises of the Company’s undistributed earnings after taxes.
e) Common Control Transactions Capital Reserve
The Common Control Transactions Capital Reserve is on account of merger as explained in footnotes to Note 32. This reserve amounting to ` 2,473(March 31, 2020: `2,473) is not freely available for distribution.
f) Share options outstanding account
The share options outstanding account is used to record the value of equity-settled share-based payment transactions with employees. The amounts recorded in share options outstanding account are transferred to securities premium upon exercise of stock options and restricted stock unit options by employees.
g) Special Economic Zone Re-Investment reserve
The Special Economic Zone Re-Investment Reserve has been created out of profit of eligible SEZ units as per provisions of section 10AA (1)(ii) of the Income–tax Act, 1961 for acquiring new plant and machinery. The reserve should be utilised by the Company for acquiring plant and machinery as per the terms of section 10AA(2) of the Income-tax Act, 1961. This reserve is not freely available for distribution.
h) Other reserves
Changes in the fair value of financial instruments measured at fair value through other comprehensive income and actuarial gains and losses on remeasurements of the defined benefit plans are recognised in other comprehensive income, net of taxes, and presented within equity in other reserves.
i) Cash flow hedging reserve
Changes in fair value of derivative hedging instruments designated and effective as a cash flow hedge are recognised in other comprehensive income, net of taxes, and presented within equity as cash flow hedging reserve.
j) Foreign currency translation reserve (FCTR)
The exchange differences arising from the translation of financial statements of foreign operations with functional currency other than Indian rupees is recognised in other comprehensive income, net of taxes and is presented within equity in the FCTR.
k) Dividend
A final dividend, including tax thereon, on equity shares is recorded as a liability on the date of approval by the shareholders. An interim dividend, including tax thereon, is recorded as a liability on the date of declaration by the Board of directors.
l) Buyback of equity shares
The buyback of equity shares and related transaction costs are recorded as a reduction of free reserves. Further, capital redemption reserve is created as an apportionment from retained earnings.
m) Bonus Issue
For the purpose of bonus issue, the amount is transferred from capital redemption reserves, securities premium and retained earnings to the share capital.
(v) Property, plant and equipment
a) Recognition and measurement
Property, plant and equipment are measured at cost less accumulated depreciation and impairment losses, if any. Cost includes expenditures directly attributable to the acquisition of the asset. General and specific borrowing costs directly attributable to the construction of a qualifying asset are capitalised as part of the cost.
Capital work-in-progress are measured at cost less accumulated impairment losses, if any.
b) Depreciation
The Company depreciates property, plant and equipment over the estimated useful life on a straight-line basis from the date the assets are available for use. Leasehold improvements are amortised over the shorter of estimated useful life of the asset or the related lease term. Term licenses are amortised over their respective contract term. Freehold land is not depreciated. The estimated useful life of assets is reviewed and where appropriate are adjusted, annually. The estimated useful lives of assets are as follows:
Category Useful life
Buildings 28 to 40 years
Plant and equipment 5 to 21 years
Computer equipment and software 2 to 7 years
Furniture, fixtures and equipment 3 to 10 years
Vehicles 4 to 5 years

Notes to the Standalone Financial Statements
Integrated Annual Report 2020-21Wipro LimitedStandalone Financial Statement under Ind AS
167
When parts of an item of property, plant and equipment have different useful lives, they are accounted for as separate items (major components) of property, plant and equipment. Subsequent expenditure relating to property, plant and equipment is capitalised only when it is probable that future economic benefits associated with these will flow to the Company and the cost of the item can be measured reliably.
The cost of property, plant and equipment not available for use before such date are disclosed under capital work-in-progress.
(vi) Business combinations, Goodwill and Intangible assets
a) Business combinations
Business combinations are accounted for using the purchase (acquisition) method. The cost of an acquisition is measured as the fair value of the assets transferred, liabilities incurred or assumed, and equity instruments issued at the date of exchange by the Company. Identifiable assets acquired and liabilities and contingent liabilities assumed in a business combination are measured initially at fair value at the date of acquisition. Transaction costs incurred in connection with a business acquisition are expensed as incurred.
The cost of an acquisition also includes the fair value of any contingent consideration measured as at the date of acquisition. Any subsequent changes to the fair value of contingent consideration classified as liabilities, other than measurement period adjustments, are recognised in the statement of profit and loss.
Common Control business combinations
The Company accounts for business combinations involving entities or businesses under common control using the pooling of interests method. The assets and liabilities of the combining entities are reflected at their carrying amounts. The identity of the reserves shall be preserved and shall appear in the financial statements of the transferee in the same form in which they appeared in the financial statements of the transferor. The difference, if any, between the amount recorded as share capital issued plus any additional consideration in the form of cash or other assets and the amount of share capital of the transferor shall be transferred to capital reserve and should be presented separately as Common Control Transactions Capital reserve.
b) Goodwill
The excess of the cost of an acquisition over the Company’s share in the fair value of the acquiree’s identifiable assets and liabilities is recognised as goodwill. If the excess is negative, a bargain purchase gain is recognised in equity as capital reserve. Goodwill is measured at cost less accumulated impairment (if any).
Goodwill associated with disposal of an operation that is part of cash-generating unit is measured based on the relative values of the operation disposed of and the portion of the cash-generating unit retained, unless some other method better reflects the goodwill associated with the operation disposed of.
c) Intangible assets
Intangible assets acquired separately are measured at cost of acquisition. Intangible assets acquired in a business combination are measured at fair value as at the date of acquisition. Following initial recognition, intangible assets are carried at cost less accumulated amortisation and impairment losses, if any.
The amortisation of an intangible asset with a finite useful life reflects the manner in which the economic benefit is expected to be generated.
The estimated useful life of amortisable intangibles is reviewed and where appropriate is adjusted, annually. The estimated useful lives of the amortisable intangible assets for the current and comparative periods are as follows:
Category Useful lifeCustomer-related intangibles 5 to 10 years
Marketing-related intangibles 7 years
(vii) Leases
On April 1, 2019, the Company adopted Ind AS 116, Leases, which applied to all lease contracts outstanding as at April 1, 2019, using modified retrospective method by recording the cumulative effect of initial application as an adjustment to opening retained earnings.
The Company has made use of the following practical expedients available in its transition to Ind AS 116 –
(a) The Company will not reassess whether a contract is or contains a lease. Accordingly, the definition of lease in accordance with Ind AS 17 will continue to be applied to lease contracts entered by the

Notes to the Standalone Financial Statements
Standalone Financial Statement under Ind AS
168
Company or modified by the Company before April 1, 2019.
(b) The Company has applied a single discount rate to a portfolio of leases of similar assets in similar economic environment. Consequently, the Company has recorded its lease liability using the present value of remaining lease payments, discounted using the incremental borrowing rate at the date of initial application and the Right-of-Use (“RoU”) asset at its carrying amount as if the standard had been applied since the commencement date of the lease but discounted using the incremental borrowing rate at the date of initial application.
(c) The Company excluded the initial direct costs from measurement of the RoU asset;
(d) The Company does not recognise RoU assets and lease liabilities for leases with less than twelve months of lease term and low-value assets on the date of initial application.
The weighted average rate of discount applied to lease liabilities as at April 1, 2019 is 5.6%.
On adoption of Ind AS 116,
a) the Company had recognised right-of-use assets ` 6,835 and corresponding lease liabilities ` 7,618.
b) the net carrying value of assets procured under the finance lease ` 143 (gross carrying and accumulated depreciation value of ` 263 and 120, respectively) have been reclassified from property, plant and equipment to RoU assets.
c) the obligations under finance leases of ` 596 (non-current and current obligation under finance leases ` 152 and ` 444 respectively) have been reclassified to lease liabilities.
d) prepaid rent on leasehold land and other assets, which were earlier classified under “Other Assets” have been reclassified to RoU assets by ` 2,202.
The adoption of the new standard has resulted in a reduction of ` 414 in retained earnings, net of deferred tax asset of ` 115.
The Company evaluates each contract or arrangement, whether it qualifies as lease as defined under Ind AS 116.
The Company as a lessee
The Company enters into an arrangement for lease of land, buildings, plant and equipment including computer equipment and vehicles. Such arrangements are generally for a fixed period but may have extension or termination options. The Company assesses, whether the contract is, or contains, a lease, at its inception. A contract is, or contains, a lease if the contract conveys the right to:
a) control use of an identified asset,
b) obtain substantially all the economic benefits from use of the identified asset, and
c) direct the use of the identified asset
The Company determines the lease term as the non-cancellable period of a lease, together with periods covered by an option to extend the lease, where the Company is reasonably certain to exercise that option.
The Company at the commencement of the lease contract recognises an RoU asset at cost and corresponding lease liability, except for leases with term of less than twelve months (short-term leases) and low-value assets. For these short-term and low value leases, the Company recognises the lease payments as an operating expense on a straight-line basis over the lease term.
The cost of the RoU asset comprises the amount of the initial measurement of the lease liability, any lease payments made at or before the inception date of the lease, plus any initial direct costs, less any lease incentives received. Subsequently, the RoU assets are measured at cost less any accumulated depreciation and accumulated impairment losses, if any. The RoU assets are depreciated using the straight-line method from the commencement date over the shorter of lease term or useful life of RoU assets. The estimated useful lives of RoU assets are determined on the same basis as those of property, plant and equipment.
The Company applies Ind AS 36 to determine whether an RoU asset is impaired and accounts for any identified impairment loss as described in the impairment of non-financial assets below.

Notes to the Standalone Financial Statements
Integrated Annual Report 2020-21Wipro LimitedStandalone Financial Statement under Ind AS
169
For lease liabilities at the commencement of the lease, the Company measures the lease liability at the present value of the lease payments that are not paid at that date. The lease payments are discounted using the interest rate implicit in the lease, if that rate is readily determined, if that rate is not readily determined, the lease payments are discounted using the incremental borrowing rate that the Company would have to pay to borrow funds, including the consideration of factors such as the nature of the asset and location, collateral, market terms and conditions, as applicable in a similar economic environment.
After the commencement date, the amount of lease liabilities is increased to reflect the accretion of interest and reduced for the lease payments made.
The Company recognises the amount of the re-measurement of lease liability as an adjustment to the RoU assets. Where the carrying amount of the RoU asset is reduced to zero and there is a further reduction in the measurement of the lease liability, the Company recognises any remaining amount of the re-measurement in statement of profit and loss.
Lease liability payments are classified as cash used in financing activities in the statement of cash flows.
The Company as a lessor
Leases under which the Company is a lessor are classified as a finance or operating lease. Lease contracts where all the risks and rewards are substantially transferred to the lessee are classified as a finance lease. All other leases are classified as operating leases.
For leases under which the Company is an intermediate lessor, the Company accounts for the head-lease and the sub-lease as two separate contracts. The sub-lease is further classified either as a finance lease or an operating lease by reference to the RoU asset arising from the head-lease.
(viii) Inventories
Inventories are valued at lower of cost and net realisable value, including necessary provision for obsolescence. Cost is determined using the weighted average method.
(ix) Impairment
A) Financial assets
The Company applies the expected credit loss model for recognising impairment loss on financial assets measured at amortised cost, debt instruments classified as FVTOCI, trade receivables, unbilled receivables, contract assets, finance lease receivables and other financial assets. Expected credit loss is the difference between the contractual cash flows and the cash flows that the entity expects to receive discounted using the effective interest rate.
Loss allowances for trade receivables, unbilled receivables, contract assets and finance lease receivables are measured at an amount equal to lifetime expected credit losses. Lifetime expected credit loss are the expected credit losses that result from all possible default events over the expected life of a financial instrument. Lifetime expected credit loss is computed based on a provision matrix which takes in to account,risk profiling of customers and historical credit loss experience adjusted for forward looking information. For other financial assets, expected credit loss is measured at the amount equal to twelve months expected credit loss unless there has been a significant increase in credit risk from initial recognition, in which case those are measured at lifetime expected credit loss.
B) Impairment of Investment in subsidiaries
The Company assesses investments in subsidiaries for impairment whenever events or changes in circumstances indicate that the carrying amount of the investment may not be recoverable. If any such indication exists, the Company estimates the recoverable amount of the investment in subsidiary. The recoverable amount of such investment is the higher of its fair value less cost of disposal (“FVLCD”) and its value-in-use (“VIU”). The VIU of the investment is calculated using projected future cash flows. If the recoverable amount of the investment is less than its carrying amount, the carrying amount is reduced to its recoverable amount. The reduction is treated as an impairment loss and is recognised in the statement of profit and loss.
C) Non-financial assets
The Company assesses long-lived assets such as property, plant and equipment, RoU assets

Notes to the Standalone Financial Statements
Standalone Financial Statement under Ind AS
170
and acquired intangible assets for impairment whenever events or changes in circumstances indicate that the carrying amount of an asset or group of assets may not be recoverable. If any such indication exists, the Company estimates the recoverable amount of the asset or group of assets.
Goodwill is tested for impairment at least annually at the same time and when events occur or changes in circumstances indicate that the recoverable amount of the cash generating unit is less than its carrying value. The goodwill impairment test is performed at the level of cash-generating unit or groups of cash-generating units which represent the lowest level at which goodwill is monitored for internal management purposes.
The recoverable amount of an asset or cash generating unit is the higher of its fair value less cost of disposal (“FVLCD”) and its value-in-use (“VIU”). The VIU of long-lived assets is calculated using projected future cash flows. FVLCD of a cash generating unit is computed using turnover and earnings multiples. If the recoverable amount of the asset or the recoverable amount of the cash generating unit to which the asset belongs is less than its carrying amount, the carrying amount is reduced to its recoverable amount. The reduction is treated as an impairment loss and is recognised in the statement of profit and loss. If at the reporting date, there is an indication that a previously assessed impairment loss no longer exists, the recoverable amount is reassessed and the impairment losses previously recognised are reversed such that the asset is recognised at its recoverable amount but not exceeding written down value which would have been reported if the impairment losses had not been recognised initially. An impairment in respect of goodwill is not reversed.
(x) Employee benefits
a) Post-employment and pension plans
The Company participates in various employee benefit plans. Pensions and other post-employment benefits are classified as either defined contribution plans or defined benefit plans. Under a defined contribution plan, the Company’s only obligation is to pay a fixed amount with no obligation to pay further contributions if the fund does not hold sufficient assets to pay all employee benefits. The related actuarial and investment risks are borne by the employee. The expenditure for defined contribution plans is recognised as
an expense during the period when the employee provides service. Under a defined benefit plan, it is the Company’s obligation to provide agreed benefits to the employees. The related actuarial and investment risks are borne by the Company. The present value of the defined benefit obligations is calculated by an independent actuary using the projected unit credit method.
Remeasurements of the defined benefit plans, comprising actuarial gains or losses, and the return on plan assets (excluding interest)are immediately recognised in other comprehensive income, net of taxes and not reclassified to profit or loss in subsequent period.
Net interest recognised in profit or loss is calculated by applying the discount rate used to measure the defined benefit obligation to the net defined benefit liability or asset. The actual return on the plan assets above or below the discount rate is recognised as part of remeasurements of the defined benefit plans through other comprehensive income, net of taxes.
The Company has the following employee benefit plans:
A. Provident fund
Employees receive benefits from a provident fund, which is a defined benefit plan. The employer and employees each make periodic contributions to the plan. A portion of the contribution is made to the approved provident fund trust managed by the Company while the remainder of the contribution is made to the government administered pension fund. The contributions to the trust managed by the Company is accounted for as a defined benefit plan as the Company is liable for any shortfall in the fund assets based on the government specified minimum rates of return.
B. Superannuation
Superannuation plan, a defined contribution scheme is administered by third party fund managers. The Company makes annual contributions based on a specified percentage of each eligible employee’s salary.
C. Gratuity and Pension
In accordance with the Payment of Gratuity Act, 1972, applicable for Indian companies, the Company provides for a lump sum payment to eligible employees, at retirement

Notes to the Standalone Financial Statements
Integrated Annual Report 2020-21Wipro LimitedStandalone Financial Statement under Ind AS
171
or termination of employment based on the last drawn salary and years of employment with the Company. The gratuity fund is managed by the third-party fund managers.
The Company also maintains pension and similar plans for employees outside India, based on country specific regulations. These plans are partially funded, and the funds are managed by third party fund managers. The plans provide for monthly payout after retirement as per salary drawn and service period or for a lumpsum payment as set out in rules of each fund.
The Company’s obligations in respect of the above plans, which are defined benefit plans, are provided for based on actuarial valuation using the projected unit credit method. The Company recognises remeasurement gains and losses of the net defined benefit liability /(asset) in other comprehensive income, net of taxes.
b) Termination benefits
Termination benefits are expensed when the Company can no longer withdraw the offer of those benefits.
c) Short-term benefits
Short-term employee benefit obligations are measured on an undiscounted basis and are recorded as expense as the related service is provided. A liability is recognised for the amount expected to be paid under short-term cash bonus or profit-sharing plans, if the Company has a present legal or constructive obligation to pay this amount as a result of past service provided by the employee and the obligation can be estimated reliably.
d) Compensated absences
The employees of the Company are entitled to compensated absences. The employees can carry forward a portion of the unutilised accumulating compensated absences and utilise it in future periods or receive cash at retirement or termination of employment. The Company records an obligation for compensated absences in the period in which the employee renders the services that increases this entitlement. The Company measures the expected cost of compensated absences as the additional amount that the Company expects to pay as a result of the unused entitlement that has accumulated at the end of the reporting period. The
Company recognises accumulated compensated absences based on actuarial valuation using the projected unit credit method. Non-accumulating compensated absences are recognised in the period in which the absences occur.
(xi) Share-based payment transactions
Selected employees of the Company receive remuneration in the form of equity settled instruments or cash settled instruments, for rendering services over a defined vesting period and for Company’s performance-based stock options over the defined period. Equity instruments granted are measured by reference to the fair value of the instrument at the date of grant. In cases, where equity instruments are granted at a nominal exercise price, the intrinsic value on the date of grant approximates the fair value. The expense is recognised in the statement of profit and loss with a corresponding increase to the share options outstanding account, a component of equity.
The equity instruments or cash settled instruments generally vest in a graded manner over the vesting period. The fair value determined at the grant date is expensed over the vesting period of the respective tranches of such grants (accelerated amortisation). The stock compensation expense is determined based on the Company’s estimate of equity instruments or cash settled instruments that will eventually vest.
Cash Settled instruments granted are re-measured by reference to the fair value at the end of each reporting period and at the time of vesting. The expense is recognised in the statement of profit and loss with a corresponding increase to the financial liability.
(xii) Provisions
Provisions are recognised when the Company has a present obligation (legal or constructive), as a result of a past event, it is probable that an outflow of economic benefits will be required to settle the obligation and a reliable estimate can be made of the amount of the obligation.
The amount recognised as a provision is the best estimate of the consideration required to settle the present obligation at the end of the reporting period, considering the risks and uncertainties surrounding the obligation.
When some or all of the economic benefits required to settle a provision are expected to be recovered from a third party, the receivable is recognised as an asset, if it is virtually certain that reimbursement will be received and the amount of the receivable can be measured reliably.

Notes to the Standalone Financial Statements
Standalone Financial Statement under Ind AS
172
Provisions for onerous contracts are recognised when the expected benefits to be derived by the Company from a contract are lower than the unavoidable costs of meeting the future obligations under the contract. Provisions for onerous contracts are measured at the present value of lower of the expected net cost of fulfilling the contract and the expected cost of terminating the contract.
(xiii) Revenue
The Company derives revenue primarily from software development, maintenance of software/hardware and related services, business process services, sale of IT and other products.
Revenues from customer contracts are considered for recognition and measurement when the contract has been approved by the parties to the contract, the parties to contract are committed to perform their respective obligations under the contract, and the contract is legally enforceable. Revenue is recognised upon transfer of control of promised products or services to customers in an amount that reflects the consideration the Company expects to receive in exchange for those products or services. To recognise revenues, the Company applies the following five step approach: (1) identify the contract with a customer, (2) identify the performance obligations in the contract, (3) determine the transaction price, (4) allocate the transaction price to the performance obligations in the contract, and (5) recognise revenues when a performance obligation is satisfied. When there is uncertainty as to collectability, revenue recognition is postponed until such uncertainty is resolved.
At contract inception, the Company assesses its promise to transfer products or services to a customer to identify separate performance obligations. The Company applies judgement to determine whether each product or service promised to a customer is capable of being distinct, and are distinct in the context of the contract, if not, the promised products or services are combined and accounted as a single performance obligation. The Company allocates the arrangement consideration to separately identifiable performance obligations based on their relative stand-alone selling price or residual method. Stand-alone selling prices are determined based on sale prices for the components when it is regularly sold separately, in cases where the Company is unable to determine the stand-alone selling price the Company uses third-party prices for similar deliverables or the Company uses expected cost-plus margin approach in estimating the stand-alone selling price.
For performance obligations where control is transferred over time, revenues are recognised by measuring progress towards completion of the performance obligation. The selection of the method to measure progress towards completion requires judgment and is based on the nature of the promised products or services to be provided.
The method for recognising revenues and costs depends on the nature of the services rendered:
A. Time and materials contracts
Revenues and costs relating to time and materials contracts are recognised as the related services are rendered.
B. Fixed-price contracts
i) Fixed-price development contracts
Revenues from fixed-price development contracts, including software development, and integration contracts, where the performance obligations are satisfied over time, are recognised using the “percentage-of-completion” method. The performance obligations are satisfied as and when the services are rendered since the customer generally obtains control of the work as it progresses. Percentage of completion is determined based on project costs incurred to date as a percentage of total estimated project costs required to complete the project. The cost expended (or input) method has been used to measure progress towards completion as there is a direct relationship between input and productivity. If the Company is not able to reasonably measure the progress of completion, revenue is recognised only to the extent of costs incurred for which recoverability is probable. When total cost estimates exceed revenues in an arrangement, the estimated losses are recognised in the statement of profit and loss in the period in which such losses become probable based on the current contract estimates as an onerous contract provision.
A contract asset is a right to consideration that is conditional upon factors other than the passage of time. Contract assets primarily relate to unbilled amounts on fixed-price development contracts and are classified as non-financial asset as the contractual right to consideration is dependent on completion of contractual milestones.

Notes to the Standalone Financial Statements
Integrated Annual Report 2020-21Wipro LimitedStandalone Financial Statement under Ind AS
173
A contract liability is an entity’s obligation to transfer goods or services to a customer for which the entity has received consideration (or the amount is due) from the customer.
Unbilled receivables on other than fixed price development contracts are classified as a financial asset where the right to consideration is unconditional and only the passage of time is required before the payment is due.
ii) Maintenance contracts
Revenues related to fixed-price maintenance contracts are recognised on a straight-line basis when services are performed through an indefinite number of repetitive acts over a specified period or ratably using percentage of completion method when the pattern of benefits from the services rendered to the customers and the cost to fulfil the contract is not even through the period of contract because the services are generally discrete in nature and not repetitive.
Revenue for contracts in which the invoicing is representative of the value being delivered is recognised based on our right to invoice. If our invoicing is not consistent with value delivered, revenues are recognised as the service is performed using the percentage of completion method.
In certain projects, a fixed quantum of service or output units is agreed at a fixed price for a fixed term. In such contracts, revenue is recognised with respect to the actual output achieved till date as a percentage of total contractual output. Any residual service unutilised by the customer is recognised as revenue on completion of the term.
iii) Element or Volume based contracts
Revenues and costs are recognised as the related services are rendered.
C. Products
Revenue on product sales are recognised when the customer obtains control of the specified product.
D. Others
Any change in scope or price is considered as a contract modification. The Company accounts for modifications to existing contracts by assessing whether the services added are
distinct and whether the pricing is at the stand-alone selling price. Services added that are not distinct are accounted for on a cumulative catch up basis, while those that are distinct are accounted for prospectively, either as a separate contract if the additional services are priced at the stand-alone selling price, or as a termination of the existing contract and creation of a new contract if not priced at the stand-alone selling price.
The Company accounts for variable considerations like, volume discounts, rebates,pricing incentives to customers and penalties as reduction of revenue on a systematic and rational basis over the period of the contract. The Company estimates an amount of such variable consideration using expected value method or the single most likely amount in a range of possible consideration depending on which method better predicts the amount of consideration to which the Company may be entitled and when it is probable that a significant reversal of cumulative revenue recognised will not occur when the uncertainty associated with the variable consideration is resolved.
Revenues are shown net of allowances/ returns, sales tax, value added tax, goods and services tax and applicable discounts and allowances.
The Company accrues the estimated cost of warranties at the time when the revenue is recognised. The accruals are based on the Company’s historical experience of material usage and service delivery costs.
Incremental costs that relate directly to a contract and incurred in securing a contract with a customer are recognised as an asset when the Company expects to recover these costs and amortised over the contract term.
The Company recognises contract fulfilment cost as an asset if those costs specifically relate to a contract or to an anticipated contract, the costs generate or enhance resources that will be used in satisfying performance obligations in future; and the costs are expected to be recovered. The asset so recognised is amortised on a systematic basis consistent with the transfer of goods or services to customer to which the asset relates.

Notes to the Standalone Financial Statements
Standalone Financial Statement under Ind AS
174
The Company assesses the timing of the transfer of goods or services to the customer as compared to the timing of payments to determine whether a significant financing component exists. As a practical expedient, the Company does not assess the existence of a significant financing component when the difference between payment and transfer of deliverables is a year or less. If the difference in timing arises for reasons other than the provision of finance to either the customer or us, no financing component is deemed to exist.
The Company may enter into arrangements with third party suppliers to resell products or services. In such cases, the Company evaluates whether the Company is the principal (i.e. report revenues on a gross basis) or agent (i.e. report revenues on a net basis). In doing so, the Company first evaluates whether the Company controls the good or service before it is transferred to the customer. If Company controls the good or service before it is transferred to the customer, Company is the principal; if not, the Company is the agent.
Estimates of transaction price and total costs or efforts are continuously monitored over the term of the contract and are recognised in net profit in the period when these estimates change or when the estimates are revised. Revenues and the estimated total costs or efforts are subject to revision as the contract progresses.
(xiv) Finance costs
Finance costs comprise interest cost on borrowings, lease liabilities and net defined benefit liability,gains or losses arising on re-measurement of financial assets measured at FVTPL, gains/ (losses), net, on translation or settlement of foreign currency borrowings and changes in fair value and gains/ (losses) on settlement of related derivative instruments. Borrowing costs that are not directly attributable to a qualifying asset are recognised in the statement of profit and loss using the effective interest method.
(xv) Finance and other income
Finance and other income comprises interest income on deposits, dividend income and gains / (losses) on disposal of investments. Interest income is recognised using the effective interest method. Dividend income is recognised when the right to receive payment is established.
(xvi) Income tax
Income tax comprises current and deferred tax. Income tax expense is recognised in the statement of profit and loss except to the extent it relates to a business combination, or items directly recognised in equity or in other comprehensive income.
a) Current income tax
Current income tax for the current and prior periods are measured at the amount expected to be recovered from or paid to the taxation authorities based on the taxable income for the period. The tax rates and tax laws used to compute the current tax amounts are those that are enacted or substantively enacted as at the reporting date and applicable for the period. While determining the tax provisions, the Company assesses whether each uncertain tax position is to be considered separately or together with one or more uncertain tax positions depending upon the nature and circumstances of each uncertain tax position. The Company offsets current tax assets and current tax liabilities, where it has a legally enforceable right to set off the recognised amounts and where it intends either to settle on a net basis, or to realise the asset and liability simultaneously.
b) Deferred income tax
Deferred income tax is recognised using the balance sheet approach. Deferred income tax assets and liabilities are recognised for deductible and taxable temporary differences arising between the tax base of assets and liabilities and their carrying amount in these standalone financial statements, except when the deferred income tax arises from the initial recognition of goodwill or an asset or liability in a transaction that is not a business combination and affects neither accounting nor taxable profits or loss at the time of the transaction.
Deferred income tax assets are recognised to the extent it is probable that taxable profit will be available against which the deductible temporary differences and the carry forward of unused tax credits and unused tax losses can be utilised.
Deferred income tax liabilities are recognised for all taxable temporary differences except in respect of taxable temporary differences that is expected to reverse within the tax holiday period, taxable temporary differences associated with investments in subsidiaries, associates and foreign branches where the timing of the reversal of the temporary difference can be controlled and

Notes to the Standalone Financial Statements
Integrated Annual Report 2020-21Wipro LimitedStandalone Financial Statement under Ind AS
175
it is probable that the temporary difference will not reverse in the foreseeable future.
The carrying amount of deferred income tax assets is reviewed at each reporting date and reduced to the extent that it is no longer probable that sufficient taxable profit will be available to allow all or part of the deferred income tax asset to be utilised.
Deferred income tax assets and liabilities are measured at the tax rates that are expected to apply in the period when the asset is realised or the liability is settled, based on tax rates (and tax laws) that have been enacted or substantively enacted at the reporting date.
The Company offsets deferred income tax assets and liabilities, where it has a legally enforceable right to offset current tax assets against current tax liabilities, and they relate to taxes levied by the same taxation authority on either the same taxable entity, or on different taxable entities where there is a right and an intention to settle the current tax liabilities and assets on a net basis or their tax assets and liabilities will be realised simultaneously.
(xvii) Earnings per share
Basic earnings per share is computed using the weighted average number of equity shares outstanding during the period adjusted for treasury shares held. Diluted earnings per share is computed using the weighted-average number of equity and dilutive equivalent shares outstanding during the period, using the treasury stock method for options, except where the results would be anti-dilutive.
The number of equity shares and potentially dilutive equity shares are adjusted retrospectively for all periods presented for any splits and bonus shares issues including for change effected prior to the approval of the standalone financial statements by the Board of Directors.
(xviii) Statement of Cashflows
Cash flows are reported using the indirect method, whereby profit for the period is adjusted for the effects of transactions of a non-cash nature, any deferrals or accruals of past or future operating cash receipts or payments and item of income or expenses associated with investing or financing cash flows. The cash from operating, investing and financing activities of the Company are segregated.
(xix) Assets held for sale
Sale of business is classified as held for sale, if their carrying amount is intended to be recovered principally
through sale rather than through continuing use. The condition for classification as held for sale is met when disposal business is available for immediate sale and the same is highly probable of being completed within one year from the date of classification as held for sale.
(xx) Discontinued operations
A discontinued operation is a component of the Company’s business that represents a separate line of business that has been disposed of or is held for sale, or is a subsidiary acquired exclusively with a view to resale. Classification as a discontinued operation occurs upon the earlier of disposal or when the operation meets the criteria to be classified as held for sale.
(xxi) Non-current assets and disposal groups held for sale
Assets and liabilities of disposal groups that are available for immediate sale and where the sale is highly probable of being completed within one year from the date of classification are considered and classified as assets held for sale and liabilities associated with assets held for sale. Non-current assets and disposal groups held for sale are measured at the lower of carrying amount and fair value less costs to sell.
(xxii) Disposal of assets
The gain or loss arising on disposal or retirement of assets is recognised in the standalone statement of profit and loss.
New Accounting standards, amendments and interpretations adopted by the Company effective from April 1, 2020:
Amendment to Ind AS 103- Business combinations
The Ministry of Corporate Affairs (“MCA”) has issued amendments to Ind AS 103, “Business Combinations”, in connection with clarification of business definition, which help in determining whether an acquisition made is of a business or a group of assets. The amendment added a test that makes it easier to conclude that a Company has acquired a group of assets, rather than a business, if the value of the assets acquired is substantially all concentrated in a single asset or group of similar assets. The adoption of amendment to Ind AS 103 is applicable to new acquisition on a prospective basis and did not have any impact on the standalone financial statements of the Company.
Amendment to Ind AS 109 and Ind AS 107 – Interest Rate Benchmark Reform
The MCA amended some of its requirements for hedge accounting. The amendments provide relief from

Notes to the Standalone Financial Statements
Standalone Financial Statement under Ind AS
176
potential effects of the uncertainty caused by the IBOR reform. In addition, the amendments require companies to provide additional information to investors about their hedging relationships that are directly affected by these uncertainties. The adoption of amendment to Ind AS 109 and Ind AS 107 did not have any significant material impact on the standalone financial statements of the Company.
Amendment to Ind AS 1 and Ind AS 8 – Definition of Material
The MCA issued Amendment to Ind AS 1 “Presentation of Financial Statements” and Ind AS 8 “Accounting Policies, Changes in Accounting Estimates and Errors” to update a new definition of material in Ind AS 1. The amendments clarify the definition of “material” and how it should be applied by including in the definition guidance that until now has featured elsewhere in Ind AS Standards. The new definition clarifies that, information is considered material if omitting, misstating, or obscuring such information, could reasonably be expected to influence the decisions that the primary users of general-purpose financial statements make based on those financial statements. The definition of material in Ind AS 8 has been replaced by a reference to the definition of material in Ind AS 1. In addition, the MCA amended other Standards that contain a definition of material or refer to the term ‘material’ to ensure consistency. The adoption of the amendment to Ind AS 1 and Ind AS 8 did not have any material impact on its evaluation of materiality in relation to the standalone financial statements.
Amendment to Ind AS 116 – Leases
The MCA issued amendments to Ind AS 116, “Leases”, provide lessees with an exemption from assessing whether a COVID-19-related rent concession is a lease modification. The amendments allowed the expedient to be applied to COVID-19-related rent concessions to payments originally due on or before June 30, 2021 and also require disclosure of the amount recognised in profit or loss to reflect changes in lease payments that arise from COVID-19-related rent concessions. The reporting period in which a lessee first applies the amendment, it is not required to disclose certain quantitative information required under Ind AS 8. Accordingly, the Company recognised ` 44 as reversal of lease liability in the statement of profit and loss for the year ended March 31, 2021.
New Accounting Standards not yet adopted by the Company
MCA notifies new standard or amendments to the existing standards. There is no such notification which would have been applicable from April 1, 2021.
New Amendments not yet adopted by the Company
On March 24, 2021, the MCA through a notification, amended Schedule III of the Companies Act, 2013. Key amendments relating to Division II which relate to companies whose financial statements are required to comply with Companies (Indian Accounting Standards) Rules 2015 are:
• Lease liabilities should be separately disclosed under the head ‘financial liabilities’, duly distinguished as current or non-current.
• Current maturities of long-term borrowings should be disclosed separately within borrowings instead of earlier disclosure requirement under Other Financial Liabilities.
• Certain additional disclosures in the statement of changes in equity due to prior period errors and restated balances at the beginning of the current reporting period.
• Specified format for disclosure of shareholding of promoters.
• Specified format for ageing schedule of trade receivables, trade payables, capital work-in-progress and intangible asset under development.
• Additional disclosures relating to Corporate Social Responsibility, undisclosed income and crypto or virtual currency.
• Disclosure of specified ratios along with explanation for items included in numerator and denominator and explanation for change in any ratio is excess of 25% compared to preceding year.
• If a company has not used funds for the specific purpose for which it was borrowed from banks and financial institutions, then disclosure of details of where it has been used.
• Specific disclosure under ‘additional regulatory requirement’ such as compliance with approved schemes of arrangements, compliance with number of layers of companies, title deeds of immovable property not held in name of company, loans and advances to promoters, directors, key managerial personnel and related parties and details of benami property held.
These amendments are applicable from April 1, 2021. The Company is currently evaluating the impact of these amendment on the standalone financial statements.

4. Property, Plant and Equipment
Land BuildingsPlant and
equipment *
Furniture and
fixtures
Office equipment
Vehicles Total
Gross carrying value:
As at April 1, 2020 ` 3,610 ` 33,620 ` 74,548 ` 11,175 ` 5,477 ` 758 ` 129,188
Additions 107 3,317 11,298 1,493 348 4 16,567
Disposals (58) (691) (2,326) (464) (115) (384) (4,038)
As at March 31, 2021 ` 3,659 ` 36,246 ` 83,520 ` 12,204 ` 5,710 ` 378 ` 141,717
Accumulated depreciation/ impairment:
As at April 1, 2020 ` - ` 6,872 ` 59,055 ` 8,097 ` 3,999 ` 692 ` 78,715
Depreciation and impairment** - 1,051 7,223 874 586 57 9,791
Disposals - (655) (2,045) (364) (103) (380) (3,547)
As at March 31, 2021 ` - ` 7,268 ` 64,233 ` 8,607 ` 4,482 ` 369 ` 84,959
Net carrying value as at March 31, 2021 ` 3,659 ` 28,978 ` 19,287 ` 3,597 ` 1,228 ` 9 ` 56,758
Gross carrying value:
As at April 1, 2019 ` 3,555 ` 25,237 ` 68,156 ` 9,539 ` 4,583 ` 874 ` 111,944
Reclassified on adoption of Ind AS 116 - - (263) - - - (263)
Adjusted balance as at April 1, 2019 ` 3,555 ` 25,237 ` 67,893 ` 9,539 ` 4,583 ` 874 ` 111,681
Additions 55 8,418 9,265 1,729 994 - 20,461
Additions through business combina-tion
- - 18 1 1 - 20
Disposals - (35) (2,628) (94) (101) (116) (2,974)
As at March 31, 2020 ` 3,610 ` 33,620 ` 74,548 ` 11,175 ` 5,477 ` 758 ` 129,188
Accumulated depreciation/ impairment:
As at April 1, 2019 ` - ` 5,982 ` 55,673 ` 7,354 ` 3,561 ` 632 ` 73,202
Reclassified on adoption of Ind AS 116 - - (120) - - - (120)
Adjusted balance as at April 1, 2019 ` - ` 5,982 ` 55,553 ` 7,354 ` 3,561 ` 632 ` 73,082
Depreciation - 904 5,788 786 449 162 8,089
Disposals - (14) (2,286) (43) (11) (102) (2,456)
As at March 31, 2020 ` - ` 6,872 ` 59,055 ` 8,097 ` 3,999 ` 692 ` 78,715
Net carrying value as at March 31, 2020 ` 3,610 ` 26,748 ` 15,493 ` 3,078 ` 1,478 ` 66 ` 50,473
* Including net carrying value of computer equipment and software amounting to ` 12.364. and ` 9,959 as at March 31, 2021 and 2020, respectively.
** Includes impairment charge on certain software platforms amounting to ` 44 for the year ended March 31, 2021.
Notes to the Standalone Financial Statements
Integrated Annual Report 2020-21Wipro LimitedStandalone Financial Statement under Ind AS
177

5. Right-of-use AssetsCategory of RoU asset
Land Buildings Plant and equipment*
Vehicles Total
Gross carrying value:
As at April 1, 2020 ` 2,003 ` 6,685 ` 1,778 ` 472 ` 10,938
Additions 79 3,600 350 - 4,029
Disposals - (1,171) (778) (54) (2,003)
As at March 31, 2021 ` 2,082 ` 9,114 ` 1,350 ` 418 ` 12,964
Accumulated depreciation
As at April 1, 2020 ` 27 ` 1,832 ` 790 ` 129 ` 2,778
Depreciation 28 2,002 625 126 2,781
Disposals - (906) (696) (22) (1,624)
As at March 31, 2021 ` 55 ` 2,928 ` 719 ` 233 ` 3,935
Net carrying value as at March 31, 2021 ` 2,027 ` 6,186 ` 631 ` 185 ` 9,029
Gross carrying value:
As at April 1, 2019 ` 2,003 ` 5,564 ` 1,235 ` 378 ` 9,180
Additions - 1,022 543 138 1,703
Additions through business combination - 126 - - 126
Disposals - (27) - (44) (71)
As at March 31, 2020 ` 2,003 ` 6,685 ` 1,778 ` 472 ` 10,938
Accumulated depreciationDepreciation ` 27 ` 1,850 ` 790 ` 133 ` 2,800
Disposals - (18) - (4) (22)
As at March 31, 2020 ` 27 ` 1,832 ` 790 ` 129 ` 2,778
Net carrying value as at March 31, 2020 ` 1,976 ` 4,853 ` 988 ` 343 ` 8,160
* Includes computer equipment.
The Company recognised the following expenses in the statement of profit and loss:
Year ended March 31, 2021
Year ended March 31, 2020
Interest expenses on lease liabilities ` 361 ` 426
Rent expense pertaining to leases of low-value assets recognised under facility expenses 25 17
Rent expense pertaining to leases with less than twelve months of lease term recognised under facility expenses
1,757 1,812
` 2,143 ` 2,255
Income from subleasing ROU assets to subsidiaries for the year ended March 31, 2021 and 2020 amounting to ` 211 and ` 209, respectively.
As of March 31, 2021 and 2020, the Company is committed to certain leases amounting to ` 1,324 and ` 1,399, respectively, which have not yet commenced. The term of such leases ranges from 2 to 10 years.
Payments toward leases of low-value assets and leases with less than twelve months of lease term, are disclosed under operating activities in the statement of cash flows. All other lease payments during the period are disclosed under financing activities in the statement of cash flows.
Refer to Note 20 for remaining contractual maturities of lease liabilities.
Notes to the Standalone Financial Statements
Standalone Financial Statement under Ind AS
178

6. Goodwill and other intangible assets
The movement in goodwill balance is given below: Year ended
March 31, 2021 Year ended
March 31, 2020Balance at the beginning of the year ` 4,571 ` 3,882
Acquisition through business combination (Refer to Note 7) - 689
Balance at the end of the year ` 4,571 ` 4,571
The Company is organised by three operating segments: IT Services, IT Products and India State Run Enterprises services. Goodwill as at March 31, 2021 and 2020 has been allocated to the IT Services operating segment. Goodwill recognised on business combinations is allocated to Cash Generating Units (CGUs), within the IT Services operating segment, which are expected to benefit from the synergies of the acquisitions.
During the year ended March 31, 2021, the Company re-organised its IT Services segment from seven industry verticals to four Strategic Market Units. Accordingly, goodwill has been re-allocated to the CGUs, using a relative value approach as at March 31, 2021 and 2020 as follows:
As at March 31, 2021
As at March 31, 2020
CGUs
Americas 2 ` 3,782 ` 3,782
Asia Pacific Middle East Africa 789 789
Total ` 4,571 ` 4,571
For impairment testing, goodwill is allocated to a CGU representing the lowest level within the Company at which goodwill is monitored for internal management purposes, and which is not higher than the Company’s operating segment. Goodwill is tested for impairment at least annually in accordance with the Company’s procedure for determining the recoverable value of each CGU.
The recoverable amount of the CGU is determined based on FVLCD. The FVLCD of the CGU is determined based on the market capitalisation approach, using the turnover and earnings multiples derived from observable market data. The fair value measurement is categorised as a level 2 fair value based on the inputs in the valuation techniques used.
Based on the above testing, no impairment was identified as at March 31, 2021 and 2020 as the recoverable value of the CGUs exceeded the carrying value. An analysis of the calculation’s sensitivity to a change in the key parameters (turnover and earnings multiples), did not identify any probable scenarios where the CGU’s recoverable amount would fall below its carrying amount.
Movement in other intangible assets is given below:
Other intangible assets
Customer-related Marketing-related Total
Gross carrying value:
As at April 1, 2020 ` 5,207 ` 517 ` 5,724
Deductions/Adjustments (208) (485) (693)
As at March 31, 2021 ` 4,999 ` 32 ` 5,031
Accumulated amortisation/ impairment:
As at April 1, 2020 ` 2,047 ` 487 ` 2,534
Amortisation 663 4 667
Deductions/Adjustments (208) (485) (693)
Notes to the Standalone Financial Statements
Integrated Annual Report 2020-21Wipro LimitedStandalone Financial Statement under Ind AS
179

Other intangible assets
Customer-related Marketing-related Total
As at March 31, 2021 ` 2,502 ` 6 ` 2,508
Net carrying value as at March 31, 2021 ` 2,497 ` 26 ` 2,523
Gross carrying value:
As at April 1, 2019 ` 2,913 ` 485 ` 3,398
Additions through business combination (Refer to Note 7) 2,294 32 2,326
As at March 31, 2020 ` 5,207 ` 517 ` 5,724
Accumulated amortisation/ impairment:
As at April 1, 2019 ` 1,527 ` 485 ` 2,012
Amortisation 520 2 522
As at March 31, 2020 ` 2,047 ` 487 ` 2,534
Net carrying value as at March 31, 2020 ` 3,160 ` 30 ` 3,190
As at March 31, 2021, the net carrying value and estimated remaining amortisation period for intangible assets acquired on acquisition are as follows:
Acquisition Net carrying value Estimated remaining amortisation period
Vara Infotech Private Limited ` 1,888 5.50 - 8.50 years
Other entities 635 0.25 – 2 years
Total 2,523
7. Business Combinations
Summary of material acquisitions during the year ended March 31, 2020 is given below:
On September 30, 2019, the Company acquired the customer contracts, leased facilities, assets and employees of Vara Infotech Private Limited, through a Business Transfer Agreement for a cash consideration of ` 3,289. This transaction pertains to our service offerings in BFSI sector.
The following table presents the final purchase price allocation:
Description Purchase price allocated
Net assets ` 274
Customer-related intangibles 2,294
Marketing-related intangibles 32
Total ` 2,600
Goodwill 689
Total purchase price ` 3,289
The goodwill of ` 689 comprises value of acquired workforce and expected synergies arising from the business combi-nation. The goodwill was allocated to IT Services segment and is deductible for income tax purposes in India.
The pro-forma effects of this business combination on the Company’s results were not material.
Notes to the Standalone Financial Statements
Standalone Financial Statement under Ind AS
180

8. InvestmentsNon-current
As at March 31, 2021
As at March 31, 2020
Financial instruments measured at FVTOCI
Equity instruments -unquoted (Refer to Note 8.1) `143 `152
Financial instruments at amortised cost
Inter corporate and term deposits-unquoted * 2 -
` 145 ` 152
Investment in Subsidiaries- unquoted (Refer to Note 8.4) 81,922 77,198
` 82,067 ` 77,350
Aggregate amount of unquoted investments 82,067 77,350
Aggregate amount of impairment in value of investments in subsidiaries (4,481) (7,356)
Current
As at March 31, 2021
As at March 31, 2020
Financial instruments measured at FVTPL
Investments in liquid and short-term mutual funds -unquoted (Refer to Note 8.5) ` 22,750 ` 14,795
Financial instruments measured at FVTOCI
Commercial paper, Certificate of deposits and bonds -unquoted (Refer to Note 8.2) - 20,126 Non-convertible debentures, government securities and commercial papers - quoted (Refer to Note 8.3) 131,382 135,461 Financial instruments at amortised cost
Inter corporate and term deposits -unquoted * 20,820 19,253 ` 174,952 ` 189,635
Aggregate amount of quoted investments and aggregate market value thereof 131,382 135,461 Aggregate amount of unquoted investments 43,570 54,174 * These deposits earn a fixed rate of interest.
* Term deposits include deposits in lien with banks primarily on account of term deposits held as margin money deposits against guarantees amounting to ` 614 (March 31, 2020: ` 796).
Details of investments:
8.1 Details of investments in equity instruments-other than subsidiaries (fully paid-up) - classified as FVTOCI
Number of Shares Carrying value
ParticularsAs at
March 31, 2021As at
March 31, 2020As at
March 31, 2021As at
March 31, 2020
Non-Current
Wep Peripherals Limited 306,000 306,000 60 68
Wep Solutions Limited 1,836,000 1,836,000 26 27
Drivestream India Private Limited 267,600 267,600 19 19
Altizon Systems Private Limited 23,758 23,758 38 38
Total ` 143 ` 152
Notes to the Standalone Financial Statements
Integrated Annual Report 2020-21Wipro LimitedStandalone Financial Statement under Ind AS
181

8.2 Investment in certificate of deposits/ commercial papers and bonds (unquoted) – classified as FVTOCI
Particulars of issuerAs at
March 31, 2021As at
March 31, 2020
Current
Axis Bank ` - ` 9,139
National Bank for Agriculture and Rural Development - 8,833
Small Industries Development Bank of India - 1,197
ICICI Bank - 957
Total ` - ` 20,126
8.3 Investment in non-convertible debentures, government securities and commercial papers (quoted) – classified as FVTOCI
Particulars of issuerAs at
March 31, 2021As at
March 31, 2020
Current
Government Securities ` 27,373 ` 12,978
National Highways Authority of India 20,520 18,802
Tata Capital Financial Services Limited 12,639 12,000
HDB Financial Services Limited 12,172 13,633
Kotak Mahindra Prime Limited 9,258 12,090
Rural Electrification Corporation Limited 7,788 14,114
Kotak Mahindra Investments Limited 7,537 8,283
Power Finance Corporation Limited 7,064 12,248
National Bank for Agriculture and Rural Development 4,946 4,574
Indian Railway Finance Corporation Limited 4,398 4,857
NTPC Limited 4,050 1,679
Tata Capital Housing Finance Limited 3,445 1,273
LIC Housing Finance Limited 3,042 -
Housing Development Finance Corporation Limited 2,785 5,692
Aditya Birla Finance Limited 2,005 1,882
Small Industries Development Bank of India 1,504 8,914
Kotak Mahindra Bank 848 -
ANZ Bank 8 5
Axis Bank - 1,823
HDFC Bank Limited - 614
Total ` 131,382 ` 135,461
Notes to the Standalone Financial Statements
Standalone Financial Statement under Ind AS
182

8.4 Details of investment in unquoted equity and preference instruments of subsidiaries (fully paid up)
Name of the subsidiaryCurrency
of Investment
Face Value
Number of Units Balances
As at March 31, 2021
As at March 31, 2020
As at March 31, 2021
As at March 31, 2020
Non-Current
Equity Instrument
Wipro Trademarks Holding Limited INR ` 10 93,250 93,250 ` 22 ` 22
Wipro Travel Services Limited INR ` 10 66,171 66,171 1 1
Wipro, LLC USD Note 1 - - 50,496 50,496
Wipro Japan KK JPY Note 2 650 650 6 6
Wipro Japan KK USD Note 2 16 16 640 640
Wipro Shanghai Limited INR Note 3 - - 9 9
Wipro IT Services UK Societas EUR EUR 1 163,617 163,617 18,903 18,903
Wipro Networks Pte Limited SGD SGD 1 28,126,108 28,126,108 1,339 1,339
Wipro Chengdu Limited USD Note 3 - - 24 24
Wipro Overseas IT Services Pvt. Ltd. INR ` 10 50,000 50,000 ^ ^
Wipro Holdings (UK) Limited USD USD 1 130,151,974 130,151,974 4,480 4,480
Wipro IT Services Bangladesh Limited BDT BDT 10 42,499,990 42,499,990 359 359
Wipro HR Services India Private Limited INR ` 10 70,10,000 70,10,000 8,275 8,275
Encore Theme Technologies Private Limited * INR ` 10 190,924 - 841 -
Eximius Design India Private Limited INR ` 10 74,977 - 1,008 -
Total investment in unquoted equity and preference instruments of subsidiaries ` 86,403 ` 84,554
Less: Impairment in value of investments in subsidiaries (Note 4 below) (4,481) (7,356)
Net investment in unquoted equity and preference instruments of subsidiaries ` 81,922 ` 77,198
* The Company holds 83.4% of the equity securities of Encore Theme Technologies Private Limited, remaining 16.6% equity securities of Encore Theme Technologies Private Limited will be acquired subject to and after receipt of certain regulatory approvals/confirmations.
Note 1 - As per the local laws of USA, there is no requirement of number of shares and face value thereof for a Limited Liability Company (LLC). Hence the investment by the Company is considered as equity contribution.
Note 2 - As per the local laws of Japan, the shares do not have face value.
Note 3 - As per the local laws of People’s Republic of China, there is no requirement of number of shares and face value thereof. Hence the investment by the Company is considered as equity contribution.
Note 4 - The impairment as of March 31, 2021 and 2020, are primarily on account of diminution in the value of a step subsidiary of Wipro Holdings (UK) Limited and Wipro, LLC, respectively.
8.5 Details of Investments in liquid and short-term mutual funds (unquoted) – classified as FVTPL
Particulars Number of Shares Carrying Value
As at March 31, 2021
As at March 31, 2020
As at March 31, 2021
As at March 31, 2020
UTI Arbitrage Fund-Growth Plan 107,117,931 36,445,590 ` 3,048 ` 996
Kotak Equity Arbitrage - Direct - Fortnight Dividend 84,544,140 - 2,560 -
HDFC Arbitrage Fund - Wholesale Plan - Growth 141,089,753 141,089,753 2,177 2,100
SBI Overnight Fund Direct Plan Growth 579,846 496,725 1,945 1,616
Notes to the Standalone Financial Statements
Integrated Annual Report 2020-21Wipro LimitedStandalone Financial Statement under Ind AS
183

Particulars Number of Shares Carrying Value
As at March 31, 2021
As at March 31, 2020
As at March 31, 2021
As at March 31, 2020
ICICI Prudential Equity Arbitrage Fund - Direct Plan - Growth 61,667,716 45,551,909 1,730 1,229
IDFC Arbitrage Fund - Growth - Direct Plan 48,133,290 48,133,290 1,288 1,241
HDFC Overnight Fund Direct Plan Growth 364,207 145,665 1,114 432
Kotak Overnight Fund 994,788 62,144 1,092 66
Axis Overnight Fund 983,593 590,406 1,070 623
ICICI Prudential Overnight Fund Direct Growth 9,521,944 4,526,064 1,057 488
Aditya Birla Sun Life Arbitrage Fund 46,133,795 - 1,005 -
DSP Floater Fund 99,995,000 - 1,005 -
IDFC Arbitrage Fund – Monthly Dividend- Direct Plan 74,705,539 - 1,004 -
Baroda Overnight Fund 635,996 - 687 -
LIC MF Overnight Fund Direct Plan Growth 629,140 - 671 -
DSP Overnight Fund Direct Plan Growth 501,432 488,697 553 522
Invesco India Overnight Fund 188,072 495,317 196 500
L&T Overnight Fund 77,647 - 125 -
Tata Overnight Fund 106,323 107,199 115 113
ABSL Overnight Fund Direct Plan Growth 71,397 231,342 79 250
UTI Overnight Fund Direct Plan Growth 22,524 407,120 63 1,113
HSBC Overnight Fund 55,197 479,479 59 500
Mirae Asset Overnight Fund 51,808 - 55 -
IDFC Overnight Fund 47,793 67,569 52 72
Kotak Equity Arbitrage Fund - Direct Plan - Growth - 67,906,978 - 1,974
L&T Cash Fund Direct Plan Growth - 460,742 - 718
Sundaram Overnight Fund - 228,041 - 242
Total Investments in liquid and short-term mutual funds -unquoted
` 22,750 ` 14,795
^ Value of investment is less than `1
9. Trade receivables
As at March 31, 2021
As at March 31, 2020
Unsecured
Considered good ` 83,541 ` 97,032
Considered doubtful 8,454 10,581
` 91,995 ` 107,613
Less: Allowance for lifetime expected credit loss (8,454) (10,581)
` 83,541 ` 97,032
Included in the balance sheet as follows:
Non-current 3,079 4,462
Current 80,462 92,570
Notes to the Standalone Financial Statements
Standalone Financial Statement under Ind AS
184

The activity in the allowance for lifetime expected credit loss is given below:As at
March 31, 2021As at
March 31, 2020
Balance at the beginning of the year ` 10,581 ` 11,631
Additions during the year, net 1,149 857
Charged against allowance (3,232) (1,989)
Translation adjustment (44) 82
Balance at the end of the year ` 8,454 ` 10,581
10. Cash and Cash Equivalents
Cash and cash equivalents as at March 31, 2021 and 2020 consist of the following:
As at March 31, 2021
As at March 31, 2020
Balances with banks
Current accounts ` 13,972 ` 13,233
Unclaimed dividend 74 85
Demand deposits * 83,784 90,970
Cheques, drafts on hand 2 152
` 97,832 ` 104,440
* These deposits can be withdrawn by the Company at any time without prior notice and without any penalty on the principal.
11. Other Financial AssetsAs at
March 31, 2021As at
March 31, 2020
Non-current
Security deposits ` 1,087 ` 1,266
Others 306 253
Interest receivable 1,139 1,139
Finance lease receivables 1,937 1,758
` 4,469 ` 4,416
Current
Dues from officers and employees ` 210 ` 792
Finance lease receivables 2,387 2,030
Interest receivable 1,501 2,444
Security Deposits 911 886
Others 178 655
Considered doubtful 665 887
` 5,852 ` 7,694
Less: Provision for doubtful advances (665) (887)
` 5,187 ` 6,807
Total ` 9,656 ` 11,223
Notes to the Standalone Financial Statements
Integrated Annual Report 2020-21Wipro LimitedStandalone Financial Statement under Ind AS
185

Finance lease receivables
Finance lease receivables consist of assets that are leased to customers for contract terms ranging from 2 to 5 years, with lease payments due in monthly or quarterly installments. Details of finance lease receivables is given below:
Minimum lease payments
Present value of minimum lease payments
As at March 31, 2021
As at March 31, 2020
As at March 31, 2021
As at March 31, 2020
Not later than one year ` 2,508 ` 2,169 ` 2,387 ` 2,030
Later than one year but not later than five years 2,026 1,846 1,937 1,758
Gross investment in lease 4,534 4,015 4,324 3,788 Less: Unearned finance income (210) (227) - -
Present value of minimum lease payment receivables ` 4,324 ` 3,788 ` 4,324 ` 3,788
Included in the balance sheet as follows:
- Non-current 1,937 1,758
- Current 2,387 2,030
12. InventoriesAs at
March 31, 2021As at
March 31, 2020Finished goods [including goods in transit - `2] ( `2 for March 31, 2020) ` 3 ` 3
Stock-in-trade 780 1,125
Stores and spares 127 613
` 910 ` 1,741
13. Other assetsAs at
March 31, 2021As at
March 31, 2020
Non-currentCapital advances ` 777 ` 1,537
Prepaid expenses 2,793 3,976
Costs to obtain contract* 416 579
Others 4,287 3,046
` 8,273 ` 9,138
CurrentPrepaid expenses ` 9,818 ` 7,754
Dues from officers and employees 206 428
Advances to suppliers 2,794 2,534
Costs to obtain contract* 265 684
Balance with GST and other authorities 6,986 6,869
Others 714 -
` 20,783 ` 18,269
Total ` 29,056 ` 27,407
* Amortisation during the year ended March 31, 2021 and 2020 amounting to ` 755 and ` 713, respectively.
Notes to the Standalone Financial Statements
Standalone Financial Statement under Ind AS
186
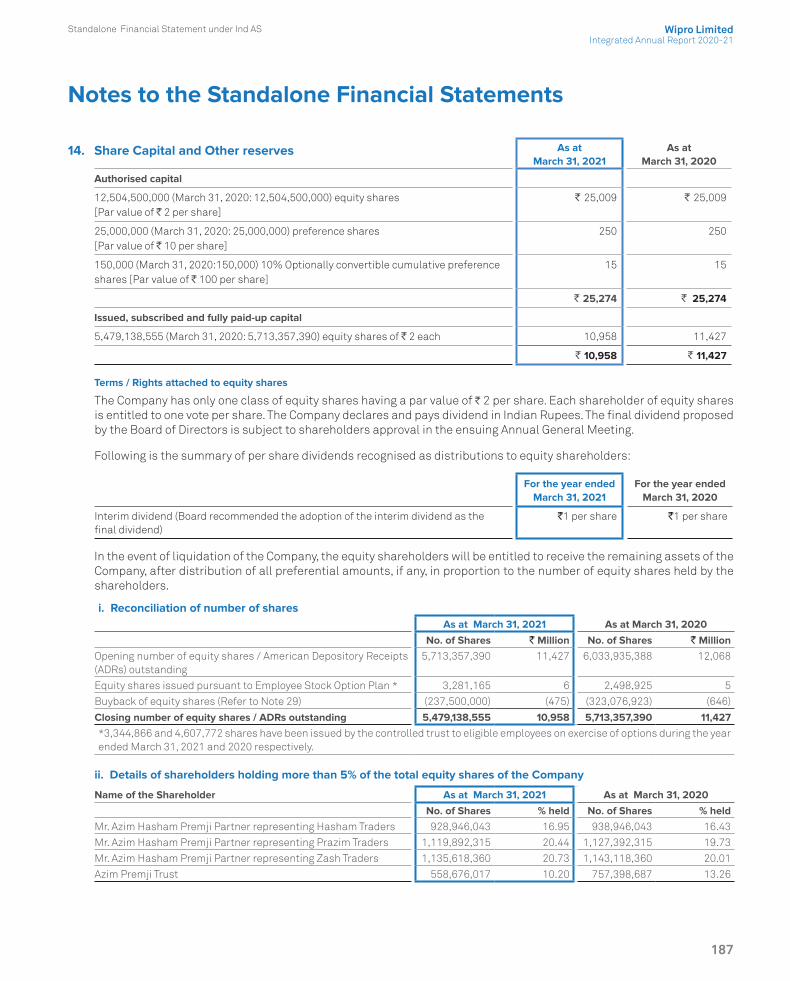
14. Share Capital and Other reserves As at March 31, 2021
As at March 31, 2020
Authorised capital
12,504,500,000 (March 31, 2020: 12,504,500,000) equity shares [Par value of ` 2 per share]
` 25,009 ` 25,009
25,000,000 (March 31, 2020: 25,000,000) preference shares [Par value of ` 10 per share]
250 250
150,000 (March 31, 2020:150,000) 10% Optionally convertible cumulative preference shares [Par value of ` 100 per share]
15 15
` 25,274 ` 25,274
Issued, subscribed and fully paid-up capital
5,479,138,555 (March 31, 2020: 5,713,357,390) equity shares of ` 2 each 10,958 11,427
` 10,958 ` 11,427
Terms / Rights attached to equity shares
The Company has only one class of equity shares having a par value of ` 2 per share. Each shareholder of equity shares is entitled to one vote per share. The Company declares and pays dividend in Indian Rupees. The final dividend proposed by the Board of Directors is subject to shareholders approval in the ensuing Annual General Meeting.
Following is the summary of per share dividends recognised as distributions to equity shareholders:
For the year ended March 31, 2021
For the year ended March 31, 2020
Interim dividend (Board recommended the adoption of the interim dividend as the final dividend)
`1 per share `1 per share
In the event of liquidation of the Company, the equity shareholders will be entitled to receive the remaining assets of the Company, after distribution of all preferential amounts, if any, in proportion to the number of equity shares held by the shareholders.
i. Reconciliation of number of sharesAs at March 31, 2021 As at March 31, 2020
No. of Shares ` Million No. of Shares ` MillionOpening number of equity shares / American Depository Receipts (ADRs) outstanding
5,713,357,390 11,427 6,033,935,388 12,068
Equity shares issued pursuant to Employee Stock Option Plan * 3,281,165 6 2,498,925 5
Buyback of equity shares (Refer to Note 29) (237,500,000) (475) (323,076,923) (646)
Closing number of equity shares / ADRs outstanding 5,479,138,555 10,958 5,713,357,390 11,427*3,344,866 and 4,607,772 shares have been issued by the controlled trust to eligible employees on exercise of options during the year ended March 31, 2021 and 2020 respectively.
ii. Details of shareholders holding more than 5% of the total equity shares of the Company
Name of the Shareholder As at March 31, 2021 As at March 31, 2020
No. of Shares % held No. of Shares % heldMr. Azim Hasham Premji Partner representing Hasham Traders 928,946,043 16.95 938,946,043 16.43
Mr. Azim Hasham Premji Partner representing Prazim Traders 1,119,892,315 20.44 1,127,392,315 19.73
Mr. Azim Hasham Premji Partner representing Zash Traders 1,135,618,360 20.73 1,143,118,360 20.01
Azim Premji Trust 558,676,017 10.20 757,398,687 13.26
Notes to the Standalone Financial Statements
Integrated Annual Report 2020-21Wipro LimitedStandalone Financial Statement under Ind AS
187

iii. Other details of equity shares for a period of five years immediately preceding March 31, 2021
a) 237,500,000, 323,076,923, 343,750,000 and 40,000,000 equity shares were bought back by the Company during the years ended March 31, 2021, 2020, 2018 and 2017, respectively. Refer to Note 29
b) 1,508,469,180 bonus shares and 2,433,074,327 bonus shares were issued during the years ended March 31, 2019 and 2018, respectively.
iv. Shares reserved for issue under option For details of shares reserved for issue under the employee stock option plan of the Company, refer to Note 31.
v. The movement in other reserves is summarised below:
Other Reserves
ParticularsRemeasurements of the defined benefit
plans
Investment in debt instruments
measured at fair value through OCI
Investment in equity instruments
measured at fair value through OCI
As at April 1, 2019 (271) 1,164 (2,091)Other comprehensive income (700) 1,222 (67)
As at March 31, 2020 (971) 2,386 (2,158)
As at April 1, 2020 (971) 2,386 (2,158)Other comprehensive income 447 1,851 (6)
As at March 31, 2021 (524) 4,237 (2,164)
15. BorrowingsAs at
March 31, 2021As at
March 31, 2020
Non-current
UnsecuredLoans from institutions other than banks * ` 141 ` 251
` 141 ` 251
Current
UnsecuredBorrowings from banks ` 57,912 `50,019
` 57,912 ` 50,019
Total ` 58,053 ` 50,270
* Current obligations under Loans from institutions other than banks amounting to ` 99 (March 31, 2020: ` 189) are classified under “Other current financial liabilities”.
Short-term borrowings
As at March 31, 2021
As at March 31, 2020
Indian Rupee Interest rate Interest rate Indian Rupee
Unsecured borrowings from banks 57,912 MIBOR/T-Bill + Spread 3.46% - 4.51% 50,019
` 57,912 ` 50,019
The principal source of Short-term borrowings from banks as at March 31, 2021 primarily consists of lines of credit of approximately ` 66,523 (2020: ` 17,960) and U.S.Dollar (U.S.$) 541 Million (2020: U.S.$ 909 Million) from bankers for working capital requirements and other short-term needs. As at March 31, 2021, the Company has unutilised lines of
Notes to the Standalone Financial Statements
Standalone Financial Statement under Ind AS
188

credit aggregating ` 8,610 (2020: ` 4,260) and U.S.$ 541Million (2020: U.S.$ 429Million). To utilise these unused lines of credit, the Company requires consent of the lender and compliance with certain financial covenants. Significant portion of these lines of credit are revolving credit facilities and floating rate foreign currency loans, renewable on a periodic basis.
The Company has non-fund based revolving credit facilities in INR amounting to ` 46,660 and ` 30,726 as at March 31, 2021 and 2020, respectively, towards operational requirements that can be used for the issuance of letters of credit and bank guarantees. As at March 31, 2021 and 2020, an amount of ` 33,627 and ` 17,215, respectively, was unutilised out of these non-fund based facilities.
Long-term borrowings
A summary of long- term borrowings is as follows:
As at March 31, 2021
As at March 31, 2020
CurrencyForeign currency
in millionsIndian Rupee Interest rate Final maturity
Foreign currency in millions
Indian Rupee
Unsecured loans
Indian Rupee NA ` 240 8.29% - 9.35% March 2024 NA ` 440
` 240 ` 440
The terms of the other secured and unsecured loans and borrowings also contain certain restrictive covenants primarily requiring the Company to maintain certain financial ratios. As at March 31, 2021 and 2020 the Company has met all the covenants under these arrangements.
Cash and non-cash changes in liabilities arising from financing activities:Non-Cash Changes
April 1, 2020 Cash flowAdditions to
lease liabilities
Foreign exchange
movementsMarch 31, 2021
Borrowings* ` 50,459 ` 7,875 `- ` (182) ` 58,152
Lease Liabilities 9,121 (4,559) 6,395 137 11,094
Total ` 59,580 ` 3,316 ` 6,395 ` (45) ` 69,246
Non-Cash Changes
April 1, 2019 Cash flowInd AS 116 Adoption
Additions to lease liabilities
Foreign exchange
movementsMarch 31, 2020
Borrowings ` 50,680 ` (4,324) `- `- ` 4,103 ` 50,459
Bank overdrafts 3 (3) - - - -
Obligations under finance leases*
596 - (596) - - -
Lease Liabilities - (3,255) 8,214 3,772 390 9,121
Total ` 51,279 ` (7,582) ` 7,618 ` 3,772 ` 4,493 ` 59,580
* Includes current obligations under borrowings classified under “Other current financial liabilities”
Significant portion of loans, borrowings and bank overdrafts bear floating rates of interest, referenced to country specif-ic official benchmark interest rates and a spread, determined based on market conditions.
The terms of the other secured and unsecured loans and borrowings also contain certain restrictive covenants primarily requiring the Company to maintain certain financial ratios. As at March 31, 2021 and 2020, the Company has met all the covenants under these arrangements.
Interest expense on borrowings was ` 1,453 and ` 1,721 for the year ended March 31, 2021 and 2020, respectively.
Notes to the Standalone Financial Statements
Integrated Annual Report 2020-21Wipro LimitedStandalone Financial Statement under Ind AS
189
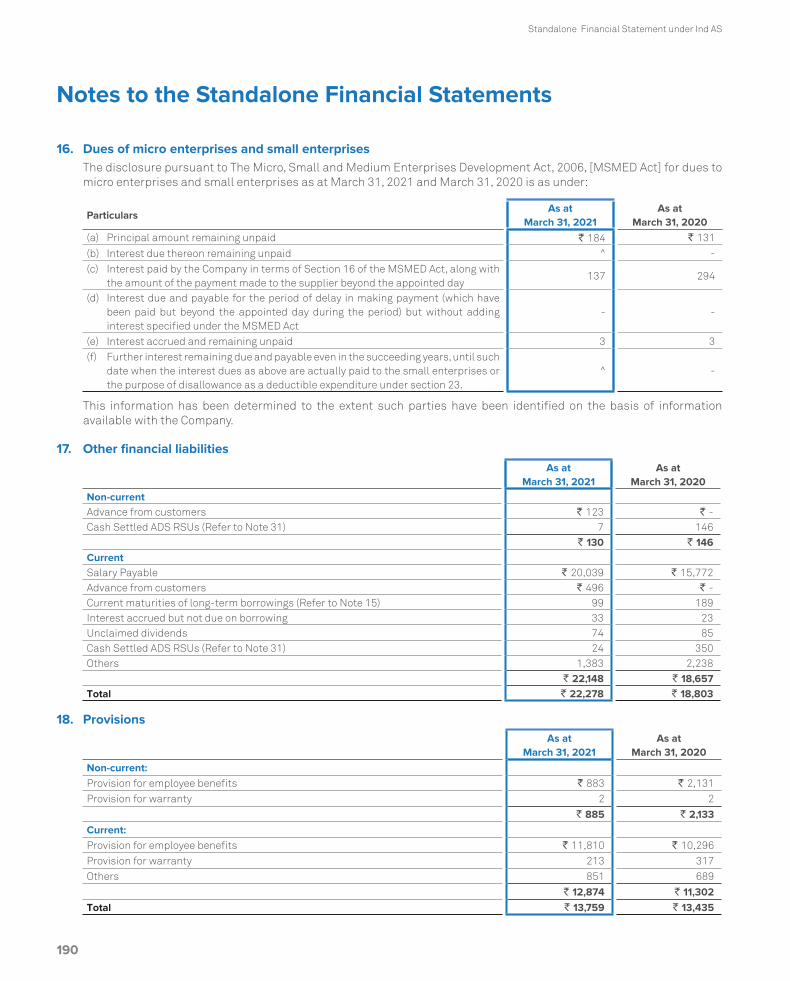
Notes to the Standalone Financial Statements
Standalone Financial Statement under Ind AS
190
16. Dues of micro enterprises and small enterprisesThe disclosure pursuant to The Micro, Small and Medium Enterprises Development Act, 2006, [MSMED Act] for dues to micro enterprises and small enterprises as at March 31, 2021 and March 31, 2020 is as under:
ParticularsAs at
March 31, 2021As at
March 31, 2020(a) Principal amount remaining unpaid ` 184 ` 131
(b) Interest due thereon remaining unpaid ^ -(c) Interest paid by the Company in terms of Section 16 of the MSMED Act, along with
the amount of the payment made to the supplier beyond the appointed day137 294
(d) Interest due and payable for the period of delay in making payment (which have been paid but beyond the appointed day during the period) but without adding interest specified under the MSMED Act
- -
(e) Interest accrued and remaining unpaid 3 3(f) Further interest remaining due and payable even in the succeeding years, until such
date when the interest dues as above are actually paid to the small enterprises or the purpose of disallowance as a deductible expenditure under section 23.
^ -
This information has been determined to the extent such parties have been identified on the basis of information available with the Company.
17. Other financial liabilitiesAs at
March 31, 2021As at
March 31, 2020Non-currentAdvance from customers ` 123 ` -Cash Settled ADS RSUs (Refer to Note 31) 7 146
` 130 ` 146CurrentSalary Payable ` 20,039 ` 15,772Advance from customers ` 496 ` -Current maturities of long-term borrowings (Refer to Note 15) 99 189Interest accrued but not due on borrowing 33 23Unclaimed dividends 74 85Cash Settled ADS RSUs (Refer to Note 31) 24 350Others 1,383 2,238
` 22,148 ` 18,657Total ` 22,278 ` 18,803
18. ProvisionsAs at
March 31, 2021As at
March 31, 2020Non-current:Provision for employee benefits ` 883 ` 2,131Provision for warranty 2 2
` 885 ` 2,133Current:Provision for employee benefits ` 11,810 ` 10,296Provision for warranty 213 317Others 851 689
` 12,874 ` 11,302Total ` 13,759 ` 13,435

Notes to the Standalone Financial Statements
Integrated Annual Report 2020-21Wipro LimitedStandalone Financial Statement under Ind AS
191
Provision for warranty represents cost associated with providing sales support services which are accrued at the time of recognition of revenues and are expected to be utilised over a period of 1 to 2 years. Other provisions primarily include provisions for compliance related contingencies. The timing of cash outflows in respect of such provision cannot be reasonably determined.
A summary of activity in provision for warranty and other provisions is as follows:
ParticularsYear ended March 31, 2021 Year ended March 31, 2020
Provision for warranty
Others TotalProvision
for warrantyOthers Total
Provision at the beginning of the year ` 319 ` 689 ` 1,008 ` 276 ` 716 ` 992
Additions during the year, net 245 270 515 359 139 498
Utilised/written-back during the year (349) (108) (457) (316) (166) (482)
Provision at the end of the year ` 215 ` 851 ` 1,066 ` 319 ` 689 ` 1,008Included in the balance sheet as follows:
Non-current portion ` 2 ` - ` 2 ` 2 ` - ` 2
Current portion ` 213 ` 851 ` 1,064 ` 317 ` 689 ` 1,006
19. Other liabilities
As at March 31, 2021
As at March 31, 2020
Non-currentOthers ` 4,979 ` 3,770
` 4,979 ` 3,770
CurrentStatutory and other liabilities ` 6,489 ` 3,207
Advance from customers 350 1,316
Others 126 126
` 6,965 ` 4,649
Total ` 11,944 ` 8,419
20. Financial instrumentsFinancial assets and liabilities (carrying value / fair value)
As at March 31, 2021
As at March 31, 2020
AssetsCash and cash equivalents ` 97,832 ` 104,440
Investments
Financial instruments at FVTPL 22,750 14,795
Financial instruments at FVTOCI 131,525 155,739
Financial instruments at amortised cost 20,822 19,253
Investment in Subsidiaries 81,922 77,198
Loans to Subsidiaries 42,015 9,472
Other financial assets
Trade receivables 83,541 97,032
Unbilled receivables 15,823 17,964
Other assets 9,656 11,223
Derivative assets 4,065 2,964
` 509,951 ` 510,080

Notes to the Standalone Financial Statements
Standalone Financial Statement under Ind AS
192
As at March 31, 2021
As at March 31, 2020
LiabilitiesTrade payables and other payables
Trade payables ` 43,485 ` 45,426
Other financial liabilities 22,179 18,614
Borrowings* 58,152 50,459
Derivative liabilities 1,021 7,369
` 124,837 ` 121,868
* Includes current obligation under borrowings classified under 'other current financial liabilities'.
Offsetting financial assets and liabilities
The following table contains information on other financial assets and trade payables and other payables subject to offsetting:
As at March 31, 2021
As at March 31, 2020
Financial Assets:Gross amounts of recognised other financial assets ` 115,361 ` 132,343
Gross amounts of recognised financial liabilities set off in the balance sheet (6,341) (6,124)
Net amounts of recognised other financial assets presented in the balance sheet ` 109,020 ` 126,219
Financial liabilitiesGross amounts of recognised trade payables and other payables ` 72,005 ` 70,164
Gross amounts of recognised financial liabilities set off in the balance sheet (6,341) (6,124)
Net amounts of recognised trade payables and other payables presented in the balance sheet ` 65,664 ` 64,040
For the financial assets and liabilities subject to offsetting or similar arrangements, each agreement between the Company and the counterparty allows for net settlement of the relevant financial assets and liabilities when both elect to settle on a net basis. In the absence of such an election, financial assets and liabilities will be settled on a gross basis and hence are not offset.
Fair value
Financial assets and liabilities include cash and cash equivalents, trade receivables, unbilled receivables, finance lease receivables, employee and other advances, eligible current and non-current assets,borrowings, trade payables,and eligible current liabilities and non-current liabilities.
The fair value of cash and cash equivalents, trade receivables, unbilled receivables, borrowings,trade payables,other current financial assets and liabilities approximate their carrying amount largely due to the short-term nature of these instruments. The Company’s long-term debt has been contracted at market rates of interest. Accordingly, the carrying value of such long-term debt approximates fair value.Further, finance lease receivables are periodically evaluated based on individual credit worthiness of customers. Based on this evaluation, the Company records allowance for estimated losses on these receivables. As at March 31, 2021, and 2020 the carrying value of such receivables, net of allowances approximates the fair value.
Investments in liquid and short-term mutual funds, which are classified as FVTPL are measured using net asset values at the reporting date multiplied by the quantity held. Fair value of investments in certificate of deposits, commercial papers and bonds classified as FVTOCI is determined based on the indicative quotes of price and yields prevailing in the market at the reporting date. Fair value of investments in equity instruments classified as FVTOCI is determined using market and income approaches.

Notes to the Standalone Financial Statements
Integrated Annual Report 2020-21Wipro LimitedStandalone Financial Statement under Ind AS
193
The fair value of derivative financial instruments is determined based on observable market inputs including currency spot and forward rates, yield curves, currency volatility etc.
Fair value hierarchy
The table below analyses financial instruments carried at fair value, by valuation method. The different levels have been defined as follows:
Level 1 – Quoted prices (unadjusted) in active markets for identical assets or liabilities.
Level 2 – Inputs other than quoted prices included within Level 1 that are observable for the asset or liability, either directly (i.e. as prices) or indirectly (i.e. derived from prices).
Level 3 – Inputs for the assets or liabilities that are not based on observable market data (unobservable inputs).
The following table presents fair value hierarchy of assets and liabilities measured at fair value on a recurring basis:
Particular
As at March 31, 2021 As at March 31, 2020
Fair value measurements at reporting date Fair value measurements at reporting date
Total Level 1 Level 2 Level 3 Total Level 1 Level 2 Level 3
Assets
Derivative instruments:
Cash flow hedges ` 2,998 `- ` 2,998 ` - ` 1,382 - ` 1,382 -
Others ` 1,067 `- ` 1,067 ` - ` 1,582 - ` 1,582 -
Investments:
Investment in liquid and short-term mutual funds
` 22,750 ` 22,750 ` - ` - ` 14,795 ` 14,795 - -
Investment in equity instruments-other than subsidiaries
` 143 ` 26 ` - ` 117 ` 152 - - ` 152
Commercial paper, Certificate of deposits and bonds
` 131,832 ` 2,217 ` 129,615 ` - ` 155,587 ` 12,983 ` 142,604 -
Liabilities
Derivative instruments:
Cash flow hedges ` (816) ` - ` (816) ` - ` (4,057) - ` (4,057) -
Others ` (205) ` - ` (205) ` - ` (3,312) - ` (3,312) -
The following methods and assumptions were used to estimate the fair value of the level 2 financial instruments included in the above table.
Derivative instruments (assets and liabilities): The Company enters derivative financial instruments with various counterparties, primarily banks with investment grade credit ratings. Derivatives valued using valuation techniques with market observable inputs are mainly interest rate swaps, foreign exchange forward contracts and foreign exchange option contracts. The most frequently applied valuation techniques include forward pricing, swap models and Black Scholes models (for option valuation), using present value calculations. The models incorporate various inputs including the credit quality of counterparties, foreign exchange spot and forward rates, interest rate curves and forward rate curves of the underlying. As at March 31, 2021, the changes in counterparty credit risk had no material effect on the hedge effectiveness assessment for derivatives designated in hedge relationships and other financial instruments recognised at fair value.
Investment in commercial papers, certificate of deposits and bonds: Fair value of these instruments is derived based on the indicative quotes of price and yields prevailing in the market as at reporting date.

Notes to the Standalone Financial Statements
Standalone Financial Statement under Ind AS
194
The following methods and assumptions were used to estimate the fair value of the level 3 financial instruments included in the above table.
Investment in equity instruments: Fair value of these instruments is determined using market and income approaches.
Details of assets and liabilities considered under Level 3 classification
Investment in equity instrumentsAs at
March 31, 2021As at
March 31, 2020Balance at the beginning of the year ` 152 ` 249
Disposals - (6)
Transfer out of Level 3 (27) -
Loss recognised in other comprehensive income (8) (91)
Balance at the end of the year ` 117 ` 152
As at March 31, 2021 and 2020, a one percentage point change in the unobservable inputs used in fair valuation of Level 3 assets does not have a significant impact on its value.
Derivative assets and liabilities:
The Company is exposed to foreign currency fluctuations on foreign currency assets / liabilities and forecasted cash flows denominated in foreign currency and net investment in foreign operations. The Company follows established risk management policies, including the use of derivatives to hedge foreign currency assets / liabilities and foreign currency forecasted cash flows and net investment in foreign operations. The counterparties in these derivative instruments are primarily banks and the Company considers the risks of non-performance by the counterparty as non-material.
The following table presents the aggregate contracted principal amounts of the Company's derivative contracts outstanding:
(in millions)
As at March 31, 2021 As at March 31, 2020
Notional Fair Value Notional Fair Value
Designated derivative instrumentsSell: Forward contracts USD 1,577 ` 2,293 USD 1,011 ` (2,902)
£ 96 ` (254) £ 52 ` 240
€ 109 ` 114 € 121 ` 231
AUD 103 ` (246) AUD 144 ` 741
Range Forward Option contracts USD 138 ` 385 USD 474 ` (1,057)
£ 55 ` (116) £ 98 ` (13)
€ 20 ` 24 € 39 ` 85
AUD 34 ` (18) AUD - ` -
Non-designated derivative instrumentsSell: Forward contracts USD 1,394 ` 514 USD 1,138 ` (3,177)
£ 104 ` 98 £ 81 ` 112
€ 99 ` 202 € 59 ` 34
AUD 29 ` 11 AUD 56 ` 115
SGD 9 ` 5 SGD 7 ` 8
ZAR 22 ` (1) ZAR 17 ` 1
CAD 30 ` 3 CAD 51 ` 153
SAR 137 ` (1) SAR 60 ` (1)
PLN 8 ` 2 PLN 34 ` 13
CHF 10 ` 13 CHF 7 ` 4

Notes to the Standalone Financial Statements
Integrated Annual Report 2020-21Wipro LimitedStandalone Financial Statement under Ind AS
195
As at March 31, 2021 As at March 31, 2020
Notional Fair Value Notional Fair ValueQAR 15 ` (6) QAR 19 ` (8)
TRY 47 ` 42 TRY 30 ` 31
NOK 4 ` ^ NOK 19 ` 16
OMR 2 ` (1) OMR 2 ` 1
SEK 42 ` 10 SEK 13 ` 4
MYR - ` - MYR 20 ` 1
JPY 370 ` 6 JPY 325 ` ^
Buy: Forward contracts USD - ` - USD 480 ` 972
AED 9 ` ^ AED - ` -
SEK 37 ` (15) SEK - ` -
MXN - ` - MXN 11 ` (9)
CHF 2 ` (6) CHF - ` -
RMB 30 ` (2) RMB - ` -
DKK 45 ` (12) DKK 9 ` ^
` 3,044 ` (4,405)
^ Value is less than ` 1.
Hedge effectiveness is determined at the inception of the hedge relationship, and through periodic prospective effectiveness assessments to ensure that an economic relationship exists between the hedged item and hedging instrument, including whether the hedging instrument is expected to offset changes in cash flows of hedged items.
The following table summarises activity in the cash flow hedging reserve within equity related to all derivative instruments classified as cash flow hedges:
As at March 31, 2021
As at March 31, 2020
Balance as at the beginning of the year ` (2,876) ` 3,024
Deferred cancellation gain/ (loss), net - (201)
Changes in fair value of effective portion of derivatives 4,753 (2,322)
Net (gain)/loss reclassified to statement of profit and loss on occurrence of hedged transactions*
305 (3,377)
Gain/(loss) on cash flow hedging derivatives, net ` 5,058 ` (5,900)
Balance as at the end of the year ` 2,182 ` (2,876)Deferred tax thereon (452) 561
Balance as at the end of the year, net of deferred tax ` 1,730 ` (2,315)
* Includes net (gain)/loss reclassified to revenue of ` 58 and (` 4,761) for the year ended March 31, 2021 and 2020, respectively; and net (gain)/ loss reclassified to expense of ` 247 and ` 1,384 for the year ended March 31, 2021 and 2020, respectively.
The related hedge transactions for balance in cash flow hedging reserves as at March 31, 2021 are expected to occur and be reclassified to the statement of profit and loss over a period of two years.
As at March 31, 2021 and 2020, there were no significant gains or losses on derivative transactions or portions thereof that have become ineffective as hedges or associated with an underlying exposure that did not occur.

Notes to the Standalone Financial Statements
Standalone Financial Statement under Ind AS
196
Sale of financial assets
From time to time, in the normal course of business, the Company transfers accounts receivables, unbilled receivables, net investment in finance lease receivables (financial assets) to banks. Under the terms of the arrangements, the Company surrenders control over the financial assets and transfer is without recourse. Accordingly, such transfers are recorded as sale of financial assets. Gains and losses on sale of financial assets without recourse are recorded at the time of sale based on the carrying value of the financial assets and fair value of servicing liability. The incremental impact of such transactions on our cash flow and liquidity for the year ended March 31, 2021 and March 31, 2020 is not material.
In certain cases, transfer of financial assets may be with recourse. Under arrangements with recourse, the Company is obligated to repurchase the uncollected financial assets, subject to limits specified in the agreement with the banks. These are reflected as part of borrowings in the balance sheet.
Financial risk management
Market Risk
Market risk is the risk of loss of future earnings, to fair values or to future cash flows that may result from a change in the price of a financial instrument. The value of a financial instrument may change as a result of changes in the interest rates, foreign currency exchange rates and other market changes that affect market risk sensitive instruments. Market risk is attributable to all market risk sensitive financial instruments including investments, foreign currency receivables, payables and loans and borrowings.
The Company’s exposure to market risk is a function of investment and borrowing activities and revenue generating activities in foreign currency. The objective of market risk management is to avoid excessive exposure of the Company’s earnings and equity to losses.
Risk Management Procedures
The Company manages market risk through a corporate treasury department, which evaluates and exercises independent control over the entire process of market risk management. The corporate treasury department recommends risk management objectives and policies, which are approved by senior management and Audit Committee. The activities of this department include management of cash resources, implementing hedging strategies for foreign currency exposures, borrowing strategies, and ensuring compliance with market risk limits and policies.
Foreign currency risk
The Company operates internationally, and a major portion of its business is transacted in several currencies. Consequently, the Company is exposed to foreign exchange risk through receiving payment for sales and services in the United States and elsewhere and making purchases from overseas suppliers in various foreign currencies. The exchange rate risk primarily arises from foreign exchange revenue, receivables, cash balances, forecasted cash flows, payables and foreign currency loans and borrowings. A significant portion of the Company’s revenue is in the U.S. Dollar, the Pound Sterling, the Euro, the Canadian Dollar and the Australian Dollar, while a large portion of costs are in Indian rupees. The exchange rate between the rupee and these currencies has fluctuated significantly in recent years and may continue to fluctuate in the future. Appreciation of the rupee against these currencies can adversely affect the Company’s results of operations.
The Company evaluates exchange rate exposure arising from these transactions and enters foreign currency derivative instruments to mitigate such exposure. The Company follows established risk management policies, including the use of derivatives like foreign exchange forward/option contracts to hedge forecasted cash flows denominated in foreign currency.
The Company has designated certain derivative instruments as cash flow hedges to mitigate the foreign exchange exposure of forecasted highly probable cash flows.
As at March 31, 2021, a ` 1 increase in the spot exchange rate of the Indian rupee with the U.S. dollar would result in approximately ` 3,095 (statement of profit and loss ` 1,395 and other comprehensive income ` 1,700) decrease in the fair value, and a ` 1 decrease would result in approximately ` 2,844 (statement of profit and loss ` 1,395 and other

Notes to the Standalone Financial Statements
Integrated Annual Report 2020-21Wipro LimitedStandalone Financial Statement under Ind AS
197
comprehensive income ` 1,450) increase in the fair value of foreign currency dollar denominated derivative instruments (forward and option contracts).
The below table presents foreign currency risk from non-derivative financial instruments as of March 31, 2021 and 2020:
Particulars
As at March 31, 2021
US $ EuroPound
SterlingAustralian
DollarCanadian
DollarOther
currencies # Total
Trade receivables ` 36,896 ` 9,071 ` 9,446 ` 4,049 ` 1,922 ` 7,488 ` 68,872
Unbilled receivables 8,405 1,647 1,688 797 283 719 13,539
Contract assets 4,719 1,121 2,755 838 102 460 9,995
Cash and cash equivalents 4,609 1,051 2,041 765 1,877 2,437 12,780
Other assets 1,434 1,174 171 209 93 1,027 4,108
Loans to subsidiaries 42,015 - - - - - 42,015
Lease liabilities (3,018) (1,893) (1,575) (202) (117) (1,547) (8,352)
Trade payables and other financial liabilities
(25,330) (3,746) (4,502) (1,666) (340) (3,261) (38,845)
Net assets/ (liabilities) ` 69,730 ` 8,425 ` 10,024 ` 4,790 ` 3,820 ` 7,323 ` 104,112
Particulars
As at March 31, 2020
US $ EuroPound
SterlingAustralian
DollarCanadian
DollarOther
currencies# Total
Trade receivables ` 47,821 ` 9,839 ` 7,825 ` 3,183 ` 2,339 ` 7,082 ` 78,089
Unbilled receivables 9,955 933 2,165 782 292 994 15,121
Contract assets 5,504 1,491 2,845 654 146 654 11,294
Cash and cash equivalents 6,878 1,475 1,361 586 1,292 1,531 13,123
Other assets 1,713 1,413 168 361 65 896 4,616
Loans to subsidiaries 9,472 - - - - - 9,472
Lease liabilities (2,532) (1,712) (373) (214) (16) (1,328) (6,175)
Borrowings* (36,319) - - - - - (36,319)
Trade payables and other financial liabilities (28,542) (3,433) (3,730) (1,420) (604) (2,701) (40,430)
Net assets/ (liabilities) ` 13,950 ` 10,006 ` 10,261 ` 3,932 ` 3,514 ` 7,128 ` 48,791
# Other currencies reflect currencies such as Japanese Yen, Swedish Krone, Saudi Riyal, UAE Dirham, Swiss Franc etc.* Includes current obligation under borrowings classified under “Other current financial liabilities”
As at March 31, 2021 and 2020, respectively, every 1% increase/decrease in the respective foreign currencies compared to functional currency of the Company would impact results by approximately ` 1,041and ` 488, respectively.
Interest rate risk
Interest rate risk primarily arises from floating rate borrowing, including various revolving and other lines of credit. The Company’s investments are primarily in short-term investments, which do not expose it to significant interest rate risk. The Company manages its net exposure to interest rate risk relating to borrowings by entering into interest rate swap agreements, which allows it to exchange periodic payments based on a notional amount and agreed upon fixed and floating interest rates. Certain borrowings are also transacted at fixed interest rates. If interest rates were to increase by 100 bps as on March 31, 2021, additional net annual interest expense on floating rate borrowing would amount to approximately ` 579.

Notes to the Standalone Financial Statements
Standalone Financial Statement under Ind AS
198
Credit risk
Credit risk arises from the possibility that customers may not be able to settle their obligations as agreed. To manage this, the Company periodically assesses the credit rating and financial reliability of customers, considering the financial condition, current economic trends, forward looking macroeconomic information, analysis of historical bad debts and ageing of accounts receivable. Individual risk limits are set accordingly. No single customer accounted for more than 10% of the accounts receivable as at March 31, 2021 and 2020, and revenues for the year ended March 31, 2021 and 2020. There is no significant concentration of credit risk.
Counterparty risk
Counterparty risk encompasses issuer risk on marketable securities, settlement risk on derivative and money market contracts and credit risk on cash and time deposits. Issuer risk is minimised by only buying securities which are at least AA rated in India based on Indian rating agencies. Settlement and credit risk is reduced by the policy of entering into transactions with counterparties that are usually banks or financial institutions with acceptable credit ratings. Exposure to these risks are closely monitored and maintained within predetermined parameters. There are limits on credit exposure to any financial institution. The limits are regularly assessed and determined based upon credit analysis including financial statements and capital adequacy ratio reviews.
Liquidity risk
Liquidity risk is defined as the risk that the Company will not be able to settle or meet its obligations on time or at a reasonable price. The Company’s corporate treasury department is responsible for liquidity and funding as well as settlement management. In addition, processes and policies related to such risks are overseen by senior management. Management monitors the Company’s net liquidity position through rolling forecasts based on the expected cash flows. As at March 31, 2021, cash and cash equivalents are held with major banks and financial institutions.
The table below provides details regarding the remaining contractual maturities of significant financial liabilities at the reporting date. The amounts include estimated interest payments and exclude the impact of netting agreements, if any.
Contractual cash flowsAs at March 31, 2021
Carrying valueLess than
1 year1-2 years 2-4 years 4-7 years Total
Borrowings(1)(2) ` 58,152 ` 59,627 ` 84 ` 57 ` - ` 59,768
Lease Liabilities(2) 11,094 4,400 3,554 3,119 849 11,922
Trade payables 43,485 43,485 - - - 43,485
Other financial liabilities 22,179 22,172 6 1 - 22,179
Derivative liabilities 1,021 1,021 - - - 1,021
As at March 31, 2020
Contractual cash flows Carrying valueLess than
1 year1-2 years 2-4 years 4-7 years Total
Borrowings(1)(2) ` 50,459 ` 51,156 ` 136 ` 115 ` - ` 51,407
Lease Liabilities(2) ` 9,121 ` 3,490 ` 2,959 ` 2,652 ` 842 9,943
Trade payables ` 45,426 ` 45,426 45,426
Other financial liabilities 18,614 18,468 83 63 - 18,614
Derivative liabilities 7,369 7,369 - - - 7,369
(1) Includes current obligation under borrowings classified under “Other current financial liabilities”
(2) Includes future cash outflow towards estimated interest on borrowings and lease liabilities.

Notes to the Standalone Financial Statements
Integrated Annual Report 2020-21Wipro LimitedStandalone Financial Statement under Ind AS
199
The balanced view of liquidity and financial indebtedness is stated in the table below. This calculation of the net cash position is used by the management for external communication with investors, analysts and rating agencies:
As at March 31, 2021
As at March 31, 2020
Cash and cash equivalents ` 97,832 ` 104,440Investments 174,952 189,635Borrowings* (58,152) (50,459)Loans to subsidiaries 42,015 9,472
` 256,647 ` 253,088
* Includes current obligation under borrowings classified under “Other current financial liabilities”.
21. Income Tax
Income tax expense has been allocated as follows:Year ended
March 31, 2021Year ended
March 31, 2020Income tax expenseCurrent taxes ` 22,430 ` 22,067Deferred taxes 3,809 1,203Income tax included in other comprehensive income on:Unrealised gains/(losses) on investment securities 225 (230)Gains/(losses) on cash flow hedging derivatives 1,013 (1,161)Remeasurements of the defined benefit plans 116 (169)
` 27,593 ` 21,710
Income tax expense consists of the following:Year ended
March 31, 2021Year ended
March 31, 2020Current taxesDomestic ` 19,427 ` 18,038Foreign 3,003 4,029
` 22,430 ` 22,067Deferred taxesDomestic ` 3,904 ` 1,705Foreign (95) (502)
` 3,809 ` 1,203` 26,239 ` 23,270
The reconciliation between the provision of income tax and amounts computed by applying the Indian statutory income tax rate to profit before taxes is as follows:
Year ended March 31, 2021
Year ended March 31, 2020
Profit before tax ` 126,848 ` 110,077Enacted income tax rate in India 34.94% 34.94%Computed expected tax expense ` 44,321 ` 38,461Effect of:Income exempt from tax ` (11,951) ` (12,630)Basis differences that will reverse during a tax holiday period (2,396) 721Income taxed at higher/ (lower) rates 245 (318)Taxes related to income of prior years (4,677) 196Changes in unrecognised deferred tax assets (1,005) (4,633)Expenses disallowed for tax purpose 1,703 1,476Others, net (1) (3)Income taxes expense ` 26,239 ` 23,270Effective income tax rate 20.69% 21.14%

Notes to the Standalone Financial Statements
Standalone Financial Statement under Ind AS
200
The components of deferred tax assets and liabilities are as follows:
As at March 31, 2021
As at March 31, 2020
Carry-forward losses ` 548 ` 201
Trade payables and other liabilities 4,380 3,667
Allowances for lifetime expected credit losses 2,890 3,647
Minimum alternate tax - 3,425
Property, plant and equipment - 155
Cash flow hedges - 561
Others 58 33
` 7,876 ` 11,689Property, plant and equipment ` (25) ` -
Amortisable goodwill (128) (99)
Interest income and fair value movement of investments (1,608) (643)
Cash flow hedges (452) -
SEZ Re-investment Reserve (6,494) (6,614)
` (8,707) ` (7,356)
Net deferred tax assets / (liabilities) ` (831) ` 4,333Amounts presented in the balance sheet
Deferred tax assets ` 474 ` 4,333
Deferred tax liabilities ` 1,305 ` -
Movement in deferred tax assets and liabilities
Movement during the year ended March 31, 2021
ParticularsAs at
April 1, 2020
Credit/ (charge) in the statement of profit and loss
Credit/ (charge) in other
comprehensive income
As at March 31, 2021
Carry-forward losses ` 201 ` 347 ` - ` 548
Trade payables and other liabilities 3,667 829 (116) 4,380
Allowances for lifetime expected credit losses 3,647 (757) - 2,890
Cash flow hedges 561 - (1,013) (452)
Property, plant and equipment 155 (180) - (25)
Amortisable goodwill (99) (29) - (128)
Interest income and fair value movement of investments (643) (740) (225) (1,608)
Minimum alternate tax 3,425 (3,425) - -
SEZ Re-investment reserve (6,614) 120 - (6,494)
Others 33 26 (1) 58
Total ` 4,333 ` (3,809) ` (1,355) ` (831)

Notes to the Standalone Financial Statements
Integrated Annual Report 2020-21Wipro LimitedStandalone Financial Statement under Ind AS
201
Movement during the year ended March 31, 2020
Particulars As at April 1, 2019Credit/ (charge) in the statement of profit and loss
Credit/ (charge) in other
comprehensive income
As at March 31, 2020
Carry-forward losses ` 100 ` 101 ` - ` 201Trade payables and other liabilities 2,743 783 141 3,667Allowances for lifetime expected credit losses 4,366 (719) - 3,647Cash flow hedges (600) (4) 1,165 561Property, plant and equipment (333) 364 124 155Amortisable goodwill (77) (22) - (99)Interest income and fair value movement of investments (1,463) 590 230 (643)Minimum alternate tax - 3,425 - 3,425SEZ Re-investment reserve (1,132) (5,482) - (6,614)Others 202 (239) 70 33Total ` 3,806 ` (1,203) ` 1,730 ` 4,333
Deferred taxes on unrealised foreign exchange gain / loss relating to cash flow hedges, fair value movements in investments and remeasurements of the defined benefit plans are recognised in other comprehensive income and presented within equity. Other than these, the change in deferred tax assets and liabilities is primarily recorded in the statement of profit and loss.
In assessing the realisability of deferred tax assets, the Company considers the extent to which it is probable that the deferred tax asset will be realised. The ultimate realisation of deferred tax assets is dependent upon the generation of future taxable profits during the periods in which those temporary differences and tax loss carry-forwards become deductible. The Company considers the expected reversal of deferred tax liabilities, projected future taxable income and tax planning strategies in making this assessment. Based on this, the Company believes that it is probable that the Company will realise the benefits of these deductible differences. The amount of deferred tax asset considered realisable, however, could be reduced in the near term if the estimates of future taxable income during the carry-forward period are reduced.
The Company has recognised deferred tax assets of ` 548 and ` 201 as at March 31, 2021 and 2020 primarily in respect of capital loss incurred on account of liquidation of an investment. Management’s projections of future taxable capital gain support the assumption that it is probable that sufficient taxable income will be available to utilise this deferred tax asset.
The Company calculates its tax liability for domestic taxes after considering MAT. The excess tax paid under MAT provisions over and above normal tax liability can be carried forward and set-off against future tax liabilities computed under normal tax provisions. The Company is carrying deferred tax asset of ` Nil as at March 31, 2021 relating to MAT.
A substantial portion of the profits of the Company’s India operations are exempt from Indian income taxes being profits attributable to export operations and profits from units established under Special Economic Zone Act, 2005 scheme. Units in designated special economic zones providing service on or after April 1, 2005 will be eligible for a deduction of 100 percent of profits or gains derived from the export of services for the first five years from commencement of provision of services and 50 percent of such profits and gains for a further five years. Certain tax benefits are also available for a further five years subject to the unit meeting defined conditions. Profits from certain other undertakings are also eligible for preferential tax treatment. The tax holiday period being currently available to the Company expires in various years through fiscal 2034-35.The impact of tax holidays has resulted in a decrease of current tax expense of ` 11,458 and ` 11,963 for the years ended March 31, 2021 and 2020, respectively, compared to the effective tax amounts that we estimate we would have been required to pay if these incentives had not been available. The per share effect of these tax incentives for the years ended March 31, 2021 and 2020 was ` 2.03 and ` 2.05, respectively.
Deferred income tax liabilities are recognised for all taxable temporary differences except in respect of taxable temporary differences associated with US branch profit tax where the timing of the reversal of the temporary difference can be controlled and it is probable that the temporary difference will not reverse in the foreseeable future. Accordingly, deferred income tax liabilities on branch profit tax @ 15% of the US branch profits have not been recognised. Further, it is not practicable to estimate the amount of the unrecognised deferred tax liabilities for these undistributed earnings.

Notes to the Standalone Financial Statements
Standalone Financial Statement under Ind AS
202
22. Revenue from Operations A. Contract Assets and Liabilities
TheCompanyclassifiesitsrighttoconsiderationinexchangefordeliverablesaseitherareceivableoracontractasset.
A receivable isa right toconsideration that isunconditional.A right toconsideration isunconditional ifonly thepassageoftimeisrequiredbeforepaymentofthatconsiderationisdue.Forexample,theCompanyrecognisesareceivableforrevenuesrelatedtotimeandmaterialscontractsorvolume-basedcontracts.TheCompanypresentssuch receivables as part of unbilled receivables at their net estimated realisable value. The same is tested forimpairmentaspertheguidanceinIndAS109usingexpectedcreditlossmethod.
Contract assets:DuringtheyearsendedMarch31,2021and2020, 11,451and 9,654ofcontractassetspertainingtofixed-pricedevelopmentcontractshavebeenreclassifiedtoreceivablesoncompletionofmilestones.
Contract liabilities:DuringtheyearsendedMarch31,2021and2020,theCompanyrecognisedrevenueof` 11,978and` 12,964arisingfromcontractliabilitiesasatMarch31,2020and2019respectively.
Contractassetsand liabilitiesare reported inanetpositiononacontract-by-contractbasisat theendofeachreportingperiod.
B. Remaining Performance Obligations
Revenue allocated to remaining performance obligations represents contracted revenue that has not yet beenrecognised,whichincludescontractliabilitiesandamountsthatwillbeinvoicedandrecognisedasrevenueinfutureperiods.Applyingthepracticalexpedient,theCompanyhasnotdiscloseditsrighttoconsiderationfromcustomersinanamountthatcorrespondsdirectlywiththevaluetothecustomeroftheCompany’sperformancecompletedtodate,whicharecontractsinvoicedontimeandmaterialbasisandvolumebased.
AsatMarch31,2021and2020, theaggregateamountof transactionpriceallocated to remainingperformanceobligations,otherthanthosemeetingtheexclusioncriteriaabove,were` 224,746and` 221,618,respectivelyofwhichapproximately71%and74%,respectivelyisexpectedtoberecognisedasrevenueswithintwoyears,andtheremainderthereafter.Thisincludescontracts,withasubstantiveenforceableterminationpenaltyifthecontractisterminatedwithoutcausebythecustomer,basedonanoverallassessmentofthecontractcarriedoutatthetimeofinception.Historically,customershavenotterminatedcontractswithoutcause.
C. Disaggregation of Revenue
The tablesbelowpresent disaggregated revenue fromcontractswith customersbybusiness segment and typeof contract. The Company believes that the below disaggregation best depicts the nature, amount, timing anduncertaintyofrevenueandcashflowsfromeconomicfactors
Revenue by business segment
Year endedMarch 31, 2021
Year endedMarch 31, 2020
SaleofServices ` 496,434 ` 494,471
SalesofProducts 6,560 9,406
` 502,994 ` 503,877
Revenue by type of contract
Fixedpriceandvolumebased ` 301,694 ` 301,352
TimeandMaterials 194,740 193,119
Products 6,560 9,406
` 502,994 ` 503,877

Notes to the Standalone Financial Statements
Integrated Annual Report 2020-21Wipro LimitedStandalone Financial Statement under Ind AS
203
23. Other Income
Year endedMarch 31, 2021
Year endedMarch 31, 2020
Interestincome ` 17,935 ` 20,599 Dividendincome 45 1,101 NetGainfrominvestmentsclassifiedasFVTPL 1,475 1,277 NetGainfrominvestmentsclassifiedasFVTOCI 988 675 Finance and other income 20,443 23,652 Foreignexchangegain/(loss),netonfinancialinstrumentsmeasuredatFVTPL 3,594 (2,767)Otherforeignexchangedifferences,net (208) 3,881 Foreign exchange gain/(loss), net 3,386 1,114
` 23,829 ` 24,766
24. Changes in inventories of finished goods and stock-in-trade
Year endedMarch 31, 2021
Year endedMarch 31, 2020
Opening stockFinishedgoods ` 3 ` 3
Stock-in-trade 1,125 2,724
` 1,128 ` 2,727
Less: Closing StockFinishedgoods ` 3 ` 3
Stock-in-trade 780 1,125 ` 783 ` 1,128
Decrease/(Increase) ` 345 ` 1,599
25. Employee benefits
a) Employee costs includesYear ended
March 31, 2021Year ended
March 31, 2020
Salariesandbonus ` 253,424 ` 253,014
Employeebenefitsplans
Gratuityandotherdefinedbenefitplans 1,713 1,433
Definedcontributionplans 6,722 6,047
Share-basedcompensation* 2,814 1,224
` 264,673 ` 261,718
*Includes` 587fortheyearendedMarch31,2021,towardscashsettledADSRSUs.
Remeasurementsofthedefinedbenefitplans,netrecognisedinothercomprehensiveincomeinclude:
Year endedMarch 31, 2021
Year endedMarch 31, 2020
Remeasurementsofthedefinedbenefitplans,net
Returnonplanassetsexcludinginterestincome-(gain)/loss ` (573) ` 20
Actuarial(gains)/lossarisingfromfinancialassumptions 249 435
Actuarial(gains)/lossarisingfromdemographicassumptions 91 202
Actuarial(gains)/lossarisingfromexperienceadjustments (329) 212
` (562) ` 869

Notes to the Standalone Financial Statements
Standalone Financial Statement under Ind AS
204
b) Defined benefit plans:
Amountrecognisedinthestatementofprofitandlossinrespectofdefinedbenefitplansisasfollows:
Year endedMarch 31, 2021
Year endedMarch 31, 2020
Currentservicecost ` 1,713 ` 1,437 Netinterestonnetdefinedbenefitliability/(asset) 66 (4)
` 1,779 ` 1,433
Actualreturnonplanassets ` 1,096 ` 539
Definedbenefitplans include gratuity for employeesdrawing salary in Indian rupeesand certainbenefitsplans inforeignjurisdictions.Changeinpresentvalueofdefinedbenefitobligationissummarisedbelow:
As atMarch 31, 2021
As atMarch 31, 2020
Defined benefit obligation at the beginning of the year ` 10,341 ` 8,249 Transferin - 78 Currentservicecost 1,713 1,437 Interestonobligation 589 555 Benefitspaid (910) (915)Remeasurement(gains)/lossActuarial(gains)/lossarisingfromfinancialassumptions 249 435 Actuarial(gains)/lossarisingfromdemographicassumptions 91 202 Actuarial(gains)/lossarisingfromexperienceadjustments (329) 212
Translationadjustment 3 88 Defined benefit obligation at the end of the year ` 11,747 ` 10,341
Changeinplanassetsissummarisedbelow:
As atMarch 31, 2021
As atMarch 31, 2020
Fairvalueofplanassetsatthebeginningoftheyear ` 9,092 ` 8,274 Transferin - 33 Expectedreturnonplanassets 523 559 Employercontributions 1,832 171 Benefitspaid (5) - Remeasurementgains/(loss)Returnonplanassetsexcludinginterestincome-gain/(loss) 573 (20)
Translationadjustment 6 75 Fairvalueofplanassetsattheendoftheyear ` 12,021 ` 9,092 Presentvalueofunfundedobligation 274 (1,249)Recognisedasset/(liability) ` 274 ` (1,249)
AsatMarch31,2021and2020,planassetswereprimarilyinvestedininsurermanagedfunds.
TheCompanyhasestablishedanincometaxapprovedirrevocabletrustfundtowhichitregularlycontributestofinancethe liabilities of the gratuity plan. The fund’s investments aremanaged by certain insurance companies as per theselectionmadebythetrusteesamongthefundplanavailable.

Notes to the Standalone Financial Statements
Integrated Annual Report 2020-21Wipro LimitedStandalone Financial Statement under Ind AS
205
Theprincipalassumptionsusedforthepurposeofactuarialvaluationofthesedefinedbenefitplansareasfollows:
As atMarch 31, 2021
As atMarch 31, 2020
Discountrate 5.31% 5.69%Expectedreturnonplanassets 5.31% 5.69%Expectedrateofsalaryincrease 7.41% 7.40%Durationofdefinedbenefitobligations 7years 7yearsThe expected return on plan assets is based on expectation of the average long-term rate of return expected oninvestmentsofthefundduringtheestimatedtermoftheobligations.
ThediscountrateisprimarilybasedontheprevailingmarketyieldsofIndiangovernmentsecuritiesfortheestimatedtermoftheobligations.Theestimatesoffuturesalaryincreaseconsideredtakesintoaccounttheinflation,seniority,promotionandotherrelevantfactors.Attritionrateconsideredisthemanagement’sestimate,basedonpreviousyears’employeeturnoveroftheCompany.
The expected future contribution and estimated future benefit payments from the fund are as follows:
ExpectedcontributiontothefundduringtheyearendingMarch31,2022 ` 1,735
EstimatedbenefitpaymentsfromthefundfortheyearendingMarch31:
2022 ` 1,454
2023 1,275
2024 1,277
2025 1,266
2026 1,251
Thereafter 11,070
Total ` 17,593
TheexpectedbenefitsarebasedonthesameassumptionsusedtomeasuretheCompany’sbenefitobligationsasatMarch31,2021.
Sensitivity for significant actuarial assumptions is computed to show the movement in defined benefit obligation by1percentage.
AsatMarch31,2021,every1percentagepointincrease/(decrease)indiscountratewillresultin(decrease)/increaseofgratuitybenefitobligationbyapproximately` (890)and`790,respectively.
AsatMarch31,2021every1percentagepointincrease/(decrease)inexpectedrateofsalarywillresultinincrease/(decrease)ofgratuitybenefitobligationbyapproximately` 738and` (686),respectively.
c) Provident fund:
Thedetailsoffundandplanassetsaregivenbelow:
As atMarch 31, 2021
As atMarch 31, 2020
Fairvalueofplanassets ` 71,196 ` 61,397
Presentvalueofdefinedbenefitobligation 71,196 61,397
Net (shortfall)/excess ` - ` -
TheplanassetshavebeeninvestedaspertheregulationsofEmployees’ProvidentFundOrganisation(EPFO).

Notes to the Standalone Financial Statements
Standalone Financial Statement under Ind AS
206
Theprincipalassumptionsusedindeterminingthepresentvalueobligationofinterestguaranteeunderthedetermin-isticapproachareasfollows:
As atMarch 31, 2021
As atMarch 31, 2020
Discountrateforthetermoftheobligation 5.80% 6.05%
Averageremainingtenureofinvestmentportfolio 6years 7years
Guaranteedrateofreturn 8.50% 8.50%
AlsorefertoNote31fordetailsofemployeestockoptions.
26. Finance Costs
Year endedMarch 31, 2021
Year endedMarch 31, 2020
Interestexpense ` 3,235 ` 3,192
Exchangefluctuationonforeigncurrencyborrowings,net (totheextentregardedasborrowingcost) 791 2,160
` 4,026 ` 5,352
27. Other ExpensesYear ended
March 31, 2021Year ended
March 31, 2020Rates,taxesandinsurance ` 2,116 ` 1,943 Lifetimeexpectedcreditloss 1,149 857 Provisionfordiminutioninvalueofinvestmentsinsubsidiaries (2,875) - Auditors’remuneration Auditfees 73 67 Fortaxationmatters 1 6 OtherServices 13 16 Outofpocketexpenses 2 6 Miscellaneousexpenses* 3,487 1,790
` 3,966 ` 4,685
*MiscellaneousexpensesfortheyearendedMarch31,2021includeanamountof` 991towardsCOVID-19contributions.
28. Earnings per equity share
Areconciliationofprofitfortheyearandequitysharesusedinthecomputationofbasicanddilutedearningsperequityshareissetoutbelow:
Basic:BasicearningspershareiscalculatedbydividingtheprofitattributabletoequityshareholdersoftheCompanybytheweightedaveragenumberofequitysharesoutstandingduringtheyear,excludingequitysharespurchasedbytheCompanyandheldastreasuryshares.
Year endedMarch 31, 2021
Year endedMarch 31, 2020
ProfitattributabletoequityholdersoftheCompany ` 100,609 ` 86,807 Weightedaveragenumberofequitysharesoutstanding 5,649,265,885 5,833,384,018 Basic earnings per share ` 17.81 ` 14.88
Diluted: Dilutedearningspershareiscalculatedbyadjustingtheweightedaveragenumberofequitysharesoutstandingduring the year for assumed conversion of all dilutive potential equity shares. Employee share options are dilutivepotentialequitysharesfortheCompany.
Thecalculationisperformedinrespectofshareoptionstodeterminethenumberofsharesthatcouldhavebeenacquiredatfairvalue(determinedastheaveragemarketpriceoftheCompany’ssharesduringtheyear).Thenumberofshares

Notes to the Standalone Financial Statements
Integrated Annual Report 2020-21Wipro LimitedStandalone Financial Statement under Ind AS
207
calculatedasaboveiscomparedwiththenumberofsharesthatwouldhavebeenissuedassumingtheexerciseoftheshareoptions.
Year endedMarch 31, 2021
Year endedMarch 31, 2020
ProfitattributabletoequityholdersoftheCompany `100,609 ` 86,807
Weightedaveragenumberofequitysharesoutstanding 5,649,265,885 5,833,384,018
Effectofdilutiveequivalentshareoptions 12,391,937 14,439,221
Weightedaveragenumberofequitysharesfordilutedearningspershare 5,661,657,822 5,847,823,239
Diluted earnings per share ` 17.77 ` 14.84
29. Dividends and Buyback of equity shares TheCompanydeclaresandpaysdividendsinIndianrupees.AccordingtotheCompaniesAct,2013anydividendshould
bedeclaredoutofaccumulateddistributableprofits.ACompanymay,beforethedeclarationofanydividend,transferapercentageofitsprofitsforthatfinancialyearasitmayconsiderappropriatetothereserves.
Thecashdividendspaidperequitysharewere` 1and` 1,duringtheyearendedMarch31,2021and2020,respectively,includinganinterimdividendof` 1and` 1fortheyearendedMarch31,2021and2020,respectively.
DuringtheyearendedMarch31,2021,theCompanyconcludedthebuybackof237,500,000equitysharesasapprovedbytheBoardofDirectorsonOctober13,2020.Thishasresultedinatotalcashoutflowof` 116,445(includingtaxonbuybackof` 21,445). In linewiththerequirementoftheCompaniesAct,2013,anamountof` 1,427and` 115,018hasbeenutilisedfromsecuritiespremiumandretainedearningsrespectively.Further,capitalredemptionreserveof` 475(representingthenominalvalueofthesharesboughtback)hasbeencreatedasanapportionmentfromretainedearnings.Consequenttosuchbuyback,thepaid-upequitysharecapitalhasreducedby` 475.
DuringtheyearendedMarch31,2020,theCompanyconcludedthebuybackof323,076,923equitysharesasapprovedby theBoard of Directors on April 16, 2019.This has resulted in a total cash outflow of` 105,000. In linewith therequirementoftheCompaniesAct,2013,anamountof` 105,000hasbeenutilisedfromtheretainedearnings.Further,capitalredemptionreserveof` 646(representingthenominalvalueofthesharesboughtback)hasbeencreatedasanapportionmentfromretainedearnings.Consequenttosuchbuyback,sharecapitalhasreducedby` 646.
30. Additional Capital Disclosures ThekeyobjectiveoftheCompany’scapitalmanagementistoensurethatitmaintainsastablecapitalstructurewith
thefocusontotalequitytoupholdinvestor,creditor,andcustomerconfidenceandtoensurefuturedevelopmentofitsbusiness.TheCompany’sfocusisonkeepingastrongtotalequitybasetoensureindependence,security,aswellasahighfinancialflexibilityforpotentialfutureborrowings,ifrequiredwithoutimpactingtheriskprofileoftheCompany.
TheCompany’sgoalistocontinuetobeabletoreturnexcessliquiditytoshareholdersbycontinuingtodistributeannualdividendsinfutureperiods.
Theamountoffuturedividends/buybackofequityshareswillbebalancedwitheffortstocontinuetomaintainanadequateliquiditystatus.
ThecapitalstructureasofMarch31,2021and2020wasasfollows:
As atMarch 31, 2021
As atMarch 31, 2020
% Change
Total equity (A) ` 452,416 ` 464,537 (2.61%)Aspercentageoftotalcapital 86.73% 88.63%
Currentborrowings* ` 58,011 ` 50,208 Non-currentborrowings 141 251 LeaseLiabilities 11,094 9,121 Totalborrowingsandleaseliabilities(B) ` 69,246 ` 59,580 16.22% Aspercentageoftotalcapital 13.27% 11.37%
Total capital (A) + (B) ` 521,662 ` 524,117 (0.47%)
*Includescurrentobligationunderborrowingsclassifiedunder“Othercurrentfinancialliabilities”(RefertoNote15)*Includescurrentobligationunderborrowingsclassifiedunder“Othercurrentfinancialliabilities”(RefertoNote15)

Notes to the Standalone Financial Statements
Standalone Financial Statement under Ind AS
208
31. Employee Stock Option The stock compensation expense recognised for employee services received during the year ended year ended
March31,2021andMarch31,2020were` 2,814and`1,224,respectively.
Wipro Equity Reward Trust (“WERT”):In1984,theCompanyestablishedacontrolledtrustcalledtheWiproEquityRewardTrust(“WERT”).Intheearlieryears,WERTpurchasedsharesoftheCompanyoutoffundsborrowedfromtheCompany.TheCompany’sBoardGovernance,NominationandCompensationCommitteerecommendstoWERTcertainofficersandkeyemployees,towhomWERTissuessharesfromitsholdingsatnominalpricesubjecttovestingconditions.
Wipro Employee Stock Option Plans and Restricted Stock Unit Option Plans
Asummaryofthegeneraltermsofgrantsunderstockoptionplansandrestrictedstockunitoptionplansareasfollows:
Name of PlanNumber of options
reserved under the planRange of exercise price
WiproADSRestrictedStockUnitPlan(WARSUP2004plan)* 59,797,979 US$0.03
WiproemployeeRestrictedStockUnitPlan2005(WSRUP2005plan)* 59,797,979 ` 2
WiproemployeeRestrictedStockUnitPlan2007(WSRUP2007plan)* 49,831,651 ` 2
WiproEquityRewardTrustEmployeeStockPurchasePlan,2013** 39,546,197 ` 2
Employees covered under Stock Option Plans and Restricted Stock Unit (“RSU”) Option Plans (collectively “StockOptionPlans”)aregrantedanoptiontopurchasesharesoftheCompanyattherespectiveexerciseprices,subjecttorequirementsofvestingconditions.Theseoptionsgenerallyvestintranchesoveraperiodoftwotofouryearsfromthedateofgrant.Uponvesting,theemployeescanacquireoneequityshareforeveryoption.
*ThemaximumcontractualtermfortheseStockOptionPlansandRSUOptionPlansisperpetualuntiltheoptionsareavailableforgrantundertheplan.
**ThemaximumcontractualtermfortheseStockOptionPlansisuptoMay29,2023untiltheoptionsareavailableforgrantundertheplan.
Theactivityinequity-settledstockoptionplansandrestrictedstockunitoptionplanissummarisedbelow:
Range of exercise price and Weighted
average exercise price
Number of options
Year endedMarch 31, 2021
Year endedMarch 31, 2020
Outstandingatthebeginningoftheyear ` 2 15,594,190 17,607,463
US$0.03 7,854,540 14,446,790
Granted* ` 2 6,275,290 5,662,500
US$0.03 5,033,648 5,341,000
Exercised ` 2 (3,356,199) (4,610,572)
US$0.03 (3,269,832) (2,496,125)
Modification** ` 2 - -
US$0.03 3,453,015 (5,681,966)
Forfeitedandexpired ` 2 (2,681,333) (3,065,201)
US$0.03 (2,248,895) (3,755,159)
Outstandingattheendoftheyear ` 2 15,831,948 15,594,190
US$0.03 10,822,476 7,854,540
Exercisableattheendoftheyear ` 2 2,679,538 1,502,957
US$0.03 465,603 1,212,560

Notes to the Standalone Financial Statements
Integrated Annual Report 2020-21Wipro LimitedStandalone Financial Statement under Ind AS
209
Theactivityincash-settledstockoptionplansandrestrictedstockunitoptionplansissummarisedbelow:
Number of options
Year endedMarch 31, 2021
Year endedMarch 31, 2020
Outstandingatthebeginningoftheyear 4,721,388 -
Modification** (3,453,015) 5,681,966
Exercised (845,066) (429,909)
Forfeitedandexpired (345,108) (530,669)
Outstandingattheendoftheyear 78,199 4,721,388
Exercisableattheendoftheyear 23,999 63,999
Thefollowingtablesummarisesinformationaboutoutstandingstockoptions:
Range of exercise price and Weighted average exercise price
2021 2020
Number of options
Weighted average remaining life (months)
Number of options
Weighted average remaining life (months)
` 2 15,831,948 18 15,594,190 23
US$0.03 10,822,476 19 7,854,540 23
Theweighted-averagegrant-datefairvalueofoptionsgrantedduringtheyearendedMarch31,2021,and2020was ` 354.78and` 260.65foreachoption,respectively.TheweightedaveragesharepriceofoptionsexercisedduringtheyearendedMarch31,2021and2020was` 354.45and` 267.04foreachoption,respectively.
ThecarryingvalueofliabilitytowardsCashSettledADSRSU’soutstandingwas` 31(including` 11towardsexercisableunits)and` 496(including`15towardsexercisableunits)asatMarch31,2021and2020,respectively.
*Includes2,969,860and2,461,500Performancebasedstockoptions(RSU)grantedduringtheyearendedMarch31,2021and2020,respectively.2,376,980and2,524,600Performancebasedstockoptions(ADS)grantedduringtheyearendedMarch31,2021and2020,respectively.Performancebasedstockoptions(RSU)wereissuedunderWiproEmployeeRestrictedStockUnitplan2007(WSRUP2007plan)andPerformancebasedstockoptions(ADS)wereissuedunderWiproADSRestrictedStockUnitPlan(WARSUP2004plan).
**Restricted Stock Units arrangements that were modified during the year ended March 31, 2021 PursuanttotheSEBIclarificationdatedDecember18,2020therestrictionunderSEBI’scirculardatedOctober10,2019“FrameworkofDepositoryReceipts”shallnotapplyincaseofissueofDepositoryReceiptstoNon-residentIndians(“NRIs”),pursuanttosharebasedemployeebenefitschemeswhichareimplementedbyacompanyintermsofSEBI(ShareBasedEmployeeBenefits)Regulations2014,theBoardGovernance,NominationandCompensationCommitteeapprovedinJanuary2021,allotmentofunderlyingequitysharesinrespectofADSstobeissuedandallocatedtoNRIemployeesuponexerciseofvestedADSRSUundertheCompany’sWARSUP2004Plan.Thischangewasaccountedasamodificationandthefairvalueonthedateofmodificationwasdeterminedbasedonprevailingmarketpriceandaccordinglyanamountof` 739hasbeenrecognisedasequitywithacorrespondingadjustmenttofinancialliability.
**Restricted Stock Units arrangements that were modified during the year ended March 31, 2020PursuanttotheSEBIcirculardatedOctober10,2019prohibitingissuanceofdepositoryreceiptsbylistedcompaniestoNRIs,theBoardGovernance,NominationandCompensationCommitteeapprovedinNovember2019,cashpayouttoitsNRIemployeesinlieuofsharesanduponexerciseofvestedADSRSUundertheCompany’sWARSUP2004Plan,basedonprevailingmarketpriceofADSonthedateofexercise.Thischangewasaccountedfor asamodificationandthefairvalueonthedateofmodificationof` 561hasbeenrecognisedasfinancialliabilitywithacorrespondingadjustmenttoequity.
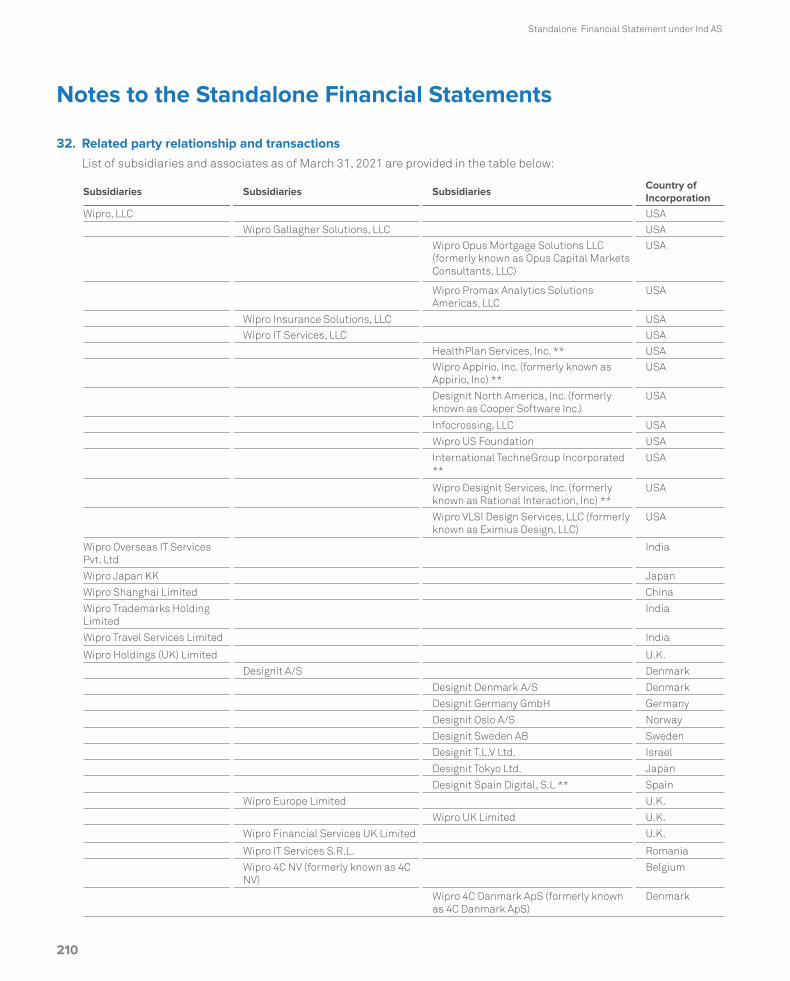
Notes to the Standalone Financial Statements
Standalone Financial Statement under Ind AS
210
32. Related party relationship and transactions ListofsubsidiariesandassociatesasofMarch31,2021areprovidedinthetablebelow:
Subsidiaries Subsidiaries SubsidiariesCountry of Incorporation
Wipro,LLC USA
WiproGallagherSolutions,LLC USA
WiproOpusMortgageSolutionsLLC(formerlyknownasOpusCapitalMarketsConsultants,LLC)
USA
WiproPromaxAnalyticsSolutionsAmericas,LLC
USA
WiproInsuranceSolutions,LLC USA
WiproITServices,LLC USA
HealthPlanServices,Inc.** USA
WiproAppirio,Inc.(formerlyknownasAppirio,Inc)**
USA
DesignitNorthAmerica,Inc.(formerlyknownasCooperSoftwareInc.)
USA
Infocrossing,LLC USA
WiproUSFoundation USA
InternationalTechneGroupIncorporated**
USA
WiproDesignitServices,Inc.(formerlyknownasRationalInteraction,Inc)**
USA
WiproVLSIDesignServices,LLC(formerlyknownasEximiusDesign,LLC)
USA
WiproOverseasITServicesPvt.Ltd
India
WiproJapanKK Japan
WiproShanghaiLimited China
WiproTrademarksHoldingLimited
India
WiproTravelServicesLimited India
WiproHoldings(UK)Limited U.K.
DesignitA/S Denmark
DesignitDenmarkA/S Denmark
DesignitGermanyGmbH Germany
DesignitOsloA/S Norway
DesignitSwedenAB Sweden
DesignitT.L.VLtd. Israel
DesignitTokyoLtd. Japan
DesignitSpainDigital,S.L** Spain
WiproEuropeLimited U.K.
WiproUKLimited U.K.
WiproFinancialServicesUKLimited U.K.
WiproITServicesS.R.L. Romania
Wipro4CNV(formerlyknownas4CNV)
Belgium
Wipro4CDanmarkApS(formerlyknownas4CDanmarkApS)
Denmark

Notes to the Standalone Financial Statements
Integrated Annual Report 2020-21Wipro LimitedStandalone Financial Statement under Ind AS
211
Subsidiaries Subsidiaries SubsidiariesCountry of Incorporation
4CNederlandB.V Netherlands
WiproWeare4CUKLimited(formerlyknownasWeare4CUKLimited)**
U.K.
Wipro4CConsultingFranceSAS(formerlyknownas4CConsultingFrance)
France
WiproITServicesUKSocietas U.K.
WiproDohaLLC# Qatar
WiproTechnologiesSADECV Mexico
WiproPhilippines,Inc. Philippines
WiproHoldingsHungaryKorlátoltFelelősségűTársaság
Hungary
WiproHoldingsInvestment KorlátoltFelelősségűTársaság
Hungary
WiproInformationTechnologyEgyptSAE
Egypt
WiproArabiaCo.Limited* SaudiArabia
Women’sBusinessParkTechnologiesLimited*
SaudiArabia
WiproPolandSPZ.O.O Poland WiproITServicesPolandSPZ.O.O Poland
WiproTechnologiesAustraliaPtyLtd Australia
WiproCorporateTechnologiesGhanaLimited
Ghana
WiproTechnologiesSouthAfrica(Proprietary)Limited
SouthAfrica
WiproTechnologiesNigeriaLimited Nigeria WiproITServiceUkraine,LLC Ukraine
WiproInformationTechnologyNetherlandsBV.
Netherlands
WiproPortugalS.A.** Portugal WiproTechnologiesLimited Russia WiproTechnologyChileSPA Chile WiproSolutionsCanadaLimited Canada WiproInformationTechnology
KazakhstanLLPKazakhstan
WiproTechnologiesW.T.SociedadAnonima
CostaRica
WiproOutsourcingServices(Ireland)Limited
Ireland
WiproTechnologiesVZ,C.A. Venezuela WiproTechnologiesPeruSAC Peru
WiprodoBrasilServicosdeTecnologiaLtda
Brazil
WiprodoBrasilTechnologiaLtda** BrazilWiproTechnologiesSA Argentina
WiproTechnologiesSRL Romania PT.WTIndonesia Indonesia Wipro(Thailand)Co.Limited Thailand

Notes to the Standalone Financial Statements
Standalone Financial Statement under Ind AS
212
Subsidiaries Subsidiaries SubsidiariesCountry of Incorporation
WiproBahrainLimitedCo.W.L.L(formerlyknownasWiproBahrainLimitedCo.S.P.C.)
Bahrain
WiproGulfLLC SultanateofOman
RainbowSoftwareLLC Iraq
WiproNetworksPteLimited Singapore Wipro(Dalian)Limited China WiproTechnologiesSDNBHD MalaysiaWiproChengduLimited ChinaWiproITServicesBangladeshLimited
Bangladesh
WiproHRServicesIndiaPrivateLimited
India
EncoreThemeTechnologiesPrivateLimited*
India
EximiusDesignIndiaPrivateLimited
India
*All theabovedirect subsidiariesare100%heldby theCompanyexcept that theCompanyholds83.4%of theequity securitiesofEncoreThemeTechnologiesPrivateLimited,66.67%of theequitysecuritiesofWiproArabiaCo.Limitedand55%of theequitysecuritiesofWomen’sBusinessParkTechnologiesLimitedareheldbyWiproArabiaCo.Limited.
Theremaining16.6%equitysecuritiesofEncoreThemeTechnologiesPrivateLimitedwillbeacquiredsubjecttoandafterreceiptofcertainregulatoryapprovals/confirmations.#51%ofequitysecuritiesofWiproDohaLLCareheldbyalocalshareholder.However,thebeneficialinterestintheseholdingsiswiththeCompany.
TheCompanycontrols‘TheWiproSABroadBasedOwnershipSchemeTrust’,‘WiproSABroadBasedOwnershipSchemeSPV(RF)(PTY)LTDincorporatedinSouthAfricaandWiproFoundationinIndia.
**StepSubsidiarydetailsofWiproPortugalS.A,WiprodoBrasilTechnologiaLtda,DesignitSpainDigital,S.L,HealthPlanServices,Inc,InternationalTechneGroupIncorporated,WiproAppirio,Inc.(formerlyknownasAppirio,Inc),WiproDesignitServices,Inc(formerlyknownasRationalInteraction,Inc)andWiproWeare4CUKLimited(formerlyknownasWeare4CUKLimited)areasfollows:
Subsidiaries Subsidiaries SubsidiariesCountry of Incorporation
WiproPortugalS.A. Portugal
WiproTechnologiesGmbH Germany
WiproITServicesAustriaGmbH(formerlyknownasCellentGmbH)
Austria
WiprodoBrasilTechnologiaLtda
Brazil
WiproDoBrasilSistemetasDeInformaticaLtd
Brazil
WiprodoBrasilServicosLtda(formerlyknownasIVIAServiçosDeInformáticaltda)
Brazil
DesignitSpainDigital,S.L. Spain
DesignitColombiaSAS Colombia
DesignitPeruSAC Peru
HealthPlanServices,Inc. USA

Notes to the Standalone Financial Statements
Integrated Annual Report 2020-21Wipro LimitedStandalone Financial Statement under Ind AS
213
Subsidiaries Subsidiaries SubsidiariesCountry of Incorporation
HealthPlanServicesInsuranceAgency,LLC
USA
InternationalTechneGroupIncorporated
USA
InternationalTechneGroupLtd. U.K.
ITIProficiencyLtd Israel
InternationalTechneGroupS.R.L. Italy
MechWorksS.R.L. Italy
WiproAppirio,Inc.(formerlyknownasAppirio,Inc)
USA
Appirio,K.K Japan
Topcoder,LLC. USA
WiproAppirio(Ireland)Limited(formerlyknownasAppirioLtd)
Ireland
WiproAppirioUKLimited(formerlyknownasAppirioLtd(UK))
U.K.
WiproDesignitServices,Inc(formerlyknownasRationalInteraction,Inc)
USA
RationalConsultingAustraliaPtyLtd Australia
WiproDesignitServicesLimited(formerlyknownasRationalInteractionLimited)
Ireland
WiproWeare4CUKLimited(formerlyknownasWeare4CUKLimited)
U.K.
CloudSociusDMCC UAE
AsatMarch31,2021,theCompanyheld43.7%interestinDrivestreamInc,33%interestinDenimGroupLimitedand33.3%inDenimGroupManagement,LLC,accountedforusingtheequitymethod.
Thelistofcontrolledtrustsare:
Name of the entity Country of incorporation
WiproEquityRewardTrust India
WiproFoundation India
Theotherrelatedpartiesare:
Name of the related parties: Nature
AzimPremjiFoundation EntitycontrolledbyDirector
AzimPremjiFoundationforDevelopment EntitycontrolledbyDirector
HashamTraders EntitycontrolledbyDirector
PrazimTraders EntitycontrolledbyDirector
ZashTraders EntitycontrolledbyDirector
HashamInvestmentandTradingCo.Pvt.Ltd EntitycontrolledbyDirector
AzimPremjiPhilanthropicInitiativesPvt.Ltd EntitycontrolledbyDirector
AzimPremjiTrust EntitycontrolledbyDirector

Notes to the Standalone Financial Statements
Standalone Financial Statement under Ind AS
214
WiproEnterprises(P)Limited EntitycontrolledbyDirector
WiproGEHealthcarePrivateLimited EntitycontrolledbyDirector
Key management personnel
RishadA.Premji Chairman
ThierryDelaporte ChiefExecutiveOfficerandManagingDirector(i)
AbidaliZ.Neemuchwala ChiefExecutiveOfficerandManagingDirector(ii)
AzimH.Premji Non-ExecutiveNon-IndependentDirector(iii)
WilliamArthurOwens Non-ExecutiveDirector
M.K.Sharma Non-ExecutiveDirector
IreenaVittal Non-ExecutiveDirector
Dr.PatrickJ.Ennis Non-ExecutiveDirector
PatrickDupuis Non-ExecutiveDirector
ArundhatiBhattacharya Non-ExecutiveDirector(iv)
DeepakM.Satwalekar Non-ExecutiveDirector(v)
JatinPravinchandraDalal ChiefFinancialOfficer
M.SanaullaKhan CompanySecretary
(i) Mr.ThierryDelaportewasappointedasChiefExecutiveOfficerandManagingDirectoroftheCompanywitheffectfromJuly6,2020foraperiodoffiveyears.
(ii) Mr.AbidaliZ.NeemuchwalaresignedastheChiefExecutiveOfficerandManagingDirectorof theCompanywitheffectfromtheendofthedayonJune1,2020.
(iii) Mr.AzimH.Premjiistheultimatecontrollingparty.(iv) Ms.ArundhatiBhattacharyaresignedasNon-ExecutiveDirectorwitheffectfromcloseofbusinesshoursonJune
30,2020. (v) Mr.DeepakM.SatwalekarwasappointedasNon-ExecutiveDirectorwitheffectfromJuly1,2020foratermoffive
years.
Relatives of key management personnel:
-YasmeenH.Premji-TariqA.Premji
TheCompanyhasthefollowingrelatedpartytransactionsfortheyearendedMarch31,2021and2020:
Transactions / balancesSubsidiaries/Trusts
Entities controlled by Directors
Key Management Personnel #
2021 2020 2021 2020 2021 2020
Salesofgoodsandservices ` 63,938 ` 65,671 ` 171 ` 43 ` - ` -
Purchaseofservices 25,452 22,449 1 ^ - -
Assetspurchased - - 423 741 - -
Dividendpaid 19 24 3,760 3,987 242 243
Dividendreceived - 734 - - - -
Commissionpaid 1,489 1,023 - - - -
RentPaid 162 130 2 2 7 9
RentalIncome 223 216 50 45 - -
Redemptionofpreferenceshares - 5,055 - - - -
Loansgiventosubsidiaries 32,630 8,934 - - - -
Others 4,165 2,853 44 119 - -

Notes to the Standalone Financial Statements
Integrated Annual Report 2020-21Wipro LimitedStandalone Financial Statement under Ind AS
215
Transactions / balancesSubsidiaries/Trusts
Entities controlled by Directors
Key Management Personnel #
2021 2020 2021 2020 2021 2020
Buybackofshares - - 91,562 69,392 - 4,076
InterestIncome 133 23 - - - -
InterestExpense - - - - - -
Corporateguaranteecommission 165 206 - - - -
Key management personnel *Remunerationandshort-termbenefits
` 761 ` 369
Otherbenefits 231 178
Balance as at the year endReceivables** ` 11,690 ` 16,358 ` 229 ^ ` - ` -
Payables 5,945 3,422 - 56 334 166
*Post-employmentbenefitscomprisingcompensatedabsencesarenotdisclosedas thesearedetermined for theCompanyasawhole.BenefitsincludestheproratedvalueofRSUgrantedtothepersonnel,whichvestoveraperiodoftime.
Otherbenefitsincludeshare-basedcompensationof` 219and` 170fortheyearendedMarch31,2021and2020,respectively.#Includingrelativeofkeymanagementpersonnel.**IncludesthefollowingbalancesbeinginthenatureofloansgiventosubsidiariesoftheCompanyincludinginterestaccrued,whereapplicableandinter-corporatedepositswithsubsidiary.
^Valueislessthan` 1.
Loanoutstandingfromsubsidiaries:
Name of the entityBalance
As at March 31Maximum amount due
during the year
2021 2020 2021 2020Wipro,LLC ` 42,015 ` 9,472 ` 42,015 ` 9,472
ThefollowingarethesignificantrelatedpartytransactionsduringtheyearendedMarch31,2021and2020:
Year endedMarch 31, 2021
Year endedMarch 31, 2020
Sale of servicesWipro,LLC ` 45,355 ` 47,765 WiproSolutionsCanadaLimited 2,785 1,999 WiproTechnologiesGmbh 1,933 1,693 WiproArabiaCo.Limited 1,715 748 WiproGallagherSolutions,LLC 1,474 1,612 WiproNetworksPteLimited 1,703 1,435 WiproJapanKK 1,132 620 WiproHoldings(UK)Limited 1,078 1,336 WiproTechnologiesAustraliaPtyLtd 736 615 HealthPlanServices,Inc. 657 810 WiproITServicesBangladeshLimited 587 413 WiproTechnologiesSADECV 570 654 WiproAppirio,Inc. 507 1,118 WiproTechnologiesSouthAfrica(Proprietary)Limited 501 703 WiproInformationTechnologyNetherlandsBV. 425 1,256
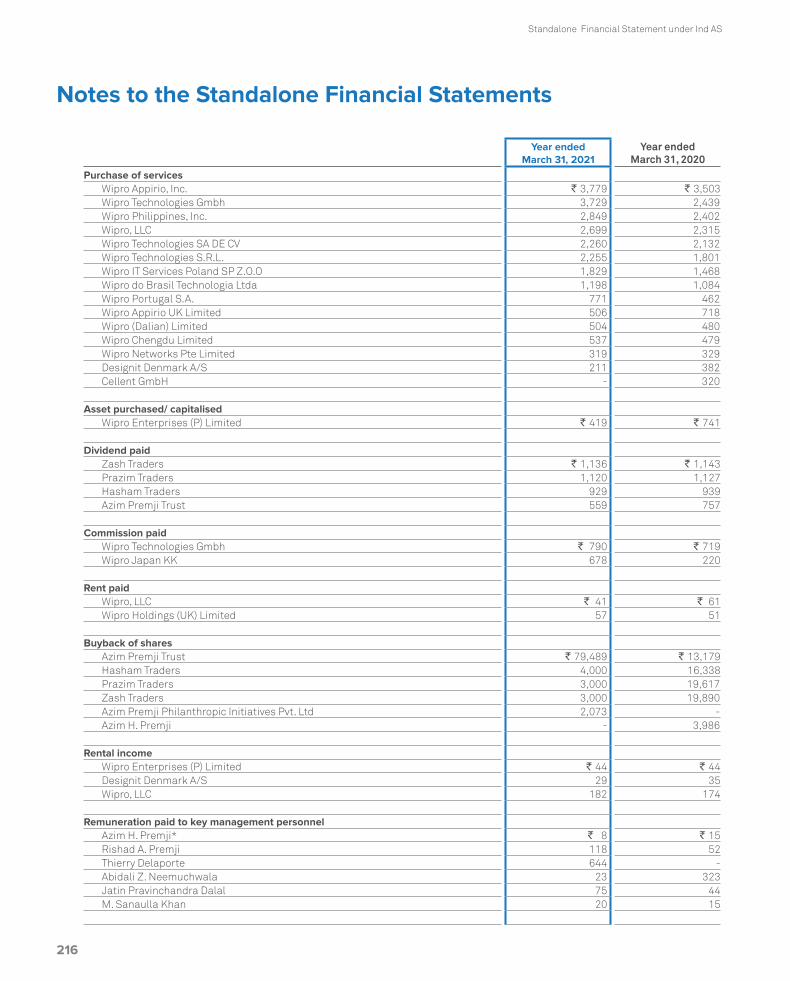
Notes to the Standalone Financial Statements
Standalone Financial Statement under Ind AS
216
Year endedMarch 31, 2021
Year endedMarch 31, 2020
Purchase of servicesWiproAppirio,Inc. ` 3,779 ` 3,503 WiproTechnologiesGmbh 3,729 2,439 WiproPhilippines,Inc. 2,849 2,402 Wipro,LLC 2,699 2,315 WiproTechnologiesSADECV 2,260 2,132 WiproTechnologiesS.R.L. 2,255 1,801 WiproITServicesPolandSPZ.O.O 1,829 1,468 WiprodoBrasilTechnologiaLtda 1,198 1,084 WiproPortugalS.A. 771 462 WiproAppirioUKLimited 506 718 Wipro(Dalian)Limited 504 480 WiproChengduLimited 537 479 WiproNetworksPteLimited 319 329 DesignitDenmarkA/S 211 382 CellentGmbH - 320
Asset purchased/ capitalisedWiproEnterprises(P)Limited ` 419 ` 741
Dividend paidZashTraders ` 1,136 ` 1,143 PrazimTraders 1,120 1,127 HashamTraders 929 939 AzimPremjiTrust 559 757
Commission paidWiproTechnologiesGmbh ` 790 ` 719 WiproJapanKK 678 220
Rent paidWipro,LLC ` 41 ` 61 WiproHoldings(UK)Limited 57 51
Buyback of sharesAzimPremjiTrust ` 79,489 ` 13,179 HashamTraders 4,000 16,338 PrazimTraders 3,000 19,617 ZashTraders 3,000 19,890 AzimPremjiPhilanthropicInitiativesPvt.Ltd 2,073 - AzimH.Premji - 3,986
Rental incomeWiproEnterprises(P)Limited ` 44 ` 44 DesignitDenmarkA/S 29 35 Wipro,LLC 182 174
Remuneration paid to key management personnelAzimH.Premji* ` 8 ` 15 RishadA.Premji 118 52 ThierryDelaporte 644 - AbidaliZ.Neemuchwala 23 323 JatinPravinchandraDalal 75 44 M.SanaullaKhan 20 15

Notes to the Standalone Financial Statements
Integrated Annual Report 2020-21Wipro LimitedStandalone Financial Statement under Ind AS
217
Year endedMarch 31, 2021
Year endedMarch 31, 2020
Corporate guarantee commissionWipro,LLC ` 96 ` 93 WiproGulfLLC - 37 WiproSolutionsCanadaLtd 43 45 WiproTechnologiesGmbH 9 8 WiproArabiaCo.Limited 8 15
*IncludessittingfeesandcommissionpaidasNon-Independent-Non-ExecutiveDirectoreffectiveJuly31,2019.
Allrelatedpartytransactionswereenteredatanarm’slengthbasisandintheordinarycourseofbusiness.TherearenomateriallysignificantrelatedpartytransactionsmadebytheCompanywithPromoters,DirectorsorKeyManagerialPersonnel,whichmayhaveapotentialconflictwiththeinterestsoftheCompanyatlarge.
33. Commitments and contingencies Capital commitments: AsatMarch31,2021andMarch31,2020theCompanyhadcommittedtospendapproximately
` 6,949and` 13,365,respectively,underagreementstopurchase/constructpropertyandequipment.Theseamountsarenetofcapitaladvancespaidinrespectofthesepurchases.
Contingent liabilities to the extent not provided for:
As atMarch 31, 2021
As atMarch 31, 2020
Guarantees given by the banks on behalf of the Company ` 13,032 ` 13,511 Guarantees given by the Company on behalf of subsidiaries 9 59
Contingencies and lawsuits: TheCompanyissubjecttolegalproceedingsandclaims(includingtaxassessmentorders/penaltynotices)whichhave
arisenintheordinarycourseofitsbusiness.Someoftheclaimsinvolvecomplexissuesanditisnotpossibletomakeareasonableestimateoftheexpectedfinancialeffect,ifany,thatwillresultfromultimateresolutionofsuchproceedings.However,theresolutionoftheselegalproceedingsisnotlikelytohaveamaterialandadverseeffectontheresultsofoperationsorthefinancialpositionoftheCompany.
TheCompany’sassessmentsarecompleted for theyearsup toMarch31,2016 in India.TheCompanyhas receiveddemandsonmultipletax issues in India.Theseclaimsareprimarilyarisingoutofdenialofdeductionundersection10AoftheIncomeTaxAct,1961inrespectofprofitsearnedbytheCompany’sundertakinginSoftwareTechnologyParkatBengaluru,theappealsfiledagainstthesaiddemandbeforetheAppellateauthoritieshavebeenallowedinfavoroftheCompanybythesecondappellateauthorityfortheyearsuptoMarch31,2008whicheitherhasbeenormaybecontestedbytheIncometaxauthoritiesbeforetheHon’bleSupremeCourtofIndia.Otherclaimsrelatetodisallowanceof taxbenefitsonprofitsearned fromSoftwareTechnologyParkandSpecialEconomicZoneunits,capitalisationofresearch&developmentexpenses,transferpricingadjustmentsonintercompany/ interunittransactionsandotherissues.
IncometaxclaimsagainsttheCompanyamountingto` 80,032and` 77,873arenotacknowledgedasdebtasatMarch31,2021and2020,respectively.ThesemattersarependingbeforevariousAppellateAuthoritiesandthemanagementexpects its positionwill likely be upheld on ultimate resolution andwill not have amaterial adverse effect on theCompany’sfinancialpositionandresultsofoperations.
The contingent liability in respect of disputed demands for excise duty, custom duty, sales tax and other mattersamountingto 11,413and 8,033asofMarch31,2021and2020,respectively.However,theresolutionofthesedisputeddemandsisnotlikelytohaveamaterialandadverseeffectontheresultsofoperationsorthefinancialpositionoftheCompany.
TheHon’bleSupremeCourt of India, througha ruling in February 2019, provided interpretation on the componentsofSalaryonwhich theCompanyand itsemployeesare tocontribute towardsProvidentFundunder theEmployee’sProvidentFundAct.Basedonthecurrentevaluation,theCompanybelievesitisnotprobablethatcertaincomponentsofSalarypaidbytheCompanywillbesubjecttocontributiontowardsProvidentFundduetotheHon’bleSupremeCourtofIndiaorder.TheCompanywillcontinuetomonitorandevaluateitspositionbasedonfutureeventsanddevelopments.

Notes to the Standalone Financial Statements
Standalone Financial Statement under Ind AS
218
34. Corporate Social Responsibility
a. GrossamountrequiredtobespentbytheCompanyis` 1,656and` 1,669fortheyearendedMarch31,2021andMarch31,2020,respectively
b.Amountspentduringtheyearon:For the year ended March 31, 2021
In CashYet to be paid
in CashTotal
(i)Construction/acquisitionofanyasset ` - ` - ` - (ii)Onpurposesotherthanabove(i)above* 2,435 77 2,512 Totalamountspentduringtheyear ` 2,435 ` 77 ` 2,512
For the year ended March 31, 2020
In CashYet to be paid
in CashTotal
(i)Construction/acquisitionofanyasset ` - ` - ` - (ii)Onpurposesotherthanabove(i)above* 1,778 40 1,818 Totalamountspentduringtheyear ` 1,778 ` 40 ` 1,818
*Includescontributionof` 582and` 143,toWiproFoundationatrustcontrolledbytheCompanyfortheyearendedMarch31,2021and2020,respectively.
35. Segment information The Company publishes these standalone financial statements along with the consolidated financial statements.
In accordance with Ind AS 108, Operating Segments, the Company has disclosed the segment information in theconsolidatedfinancialstatements.
36. The IndianParliamenthasapproved theCodeonSocialSecurity,2020whichwould impact thecontributionsby theCompany towardsProvidentFundandGratuity.TheMinistryofLabourandEmploymenthas releaseddraft rules fortheCodeonSocialSecurity,2020onNovember13,2020,andhas invitedsuggestions fromstakeholderswhichareunderactiveconsiderationbytheMinistry.BasedonaninitialassessmentbytheCompanyanditsIndiansubsidiaries,theadditional impactonProvidentFundcontributionsbytheCompanyandits Indiansubsidiariesisnotexpectedtobematerial,whereas, the likelyadditional impactonGratuity liability /contributionsby theCompanyand its Indiansubsidiariescouldbematerial.TheCompanyanditsIndiansubsidiarieswillcompletetheirevaluationoncethesubjectrulesarenotifiedandwillgiveappropriateimpactinthestandalonefinancialstatementsintheperiodinwhich,theCodebecomeseffectiveandtherelatedrulestodeterminethefinancialimpactarepublished.
37. Events after the reporting perioda) In April 2021, the Company completed its acquisition of Capco Technologies Private Limited for an upfront cash
considerationof` 2,713.
b) InJune2021,theCompany’sBoardhasapprovedtoprovideunconditionalandirrevocablefinancialguaranteeofuptoUS$750million,towardsproposedissuanceofU.S.dollardenominatedNotesbyawhollyownedsubsidiary.
Asperourreportofevendateattached ForandonbehalfoftheBoardofDirectors
for Deloitte Haskins & Sells LLP Rishad A. Premji M. K. Sharma Thierry DelaporteCharteredAccountants Chairman Director ChiefExecutiveOfficerand
ManagingDirectorFirm’sRegistrationNo.:117366W/W-100018
Vikas Bagaria Jatin Pravinchandra Dalal M. Sanaulla KhanPartner ChiefFinancialOfficer CompanySecretaryMembershipNo.:60408
Bengaluru BengaluruJune9,2021 June9,2021

Consolidated financial statements under Ind AS
Independent Auditor’s Report
To The Members of Wipro Limited
Report on the Audit of the Consolidated Financial Statements
OpinionWe have audited the accompanying consolidated financial statements of Wipro Limited (“the Company”) and its subsidiaries, (the Company and its subsidiaries together referred to as “the Group”), which comprise the Consolidated Balance Sheet as at March 31, 2021, and the Consolidated Statement of Profit and Loss (including Other Comprehensive Income), the Consolidated Statement of Changes in Equity and the Consolidated Statement of Cash Flows for the year then ended, and a summary of significant accounting policies and other explanatory information (herein after referred to as “the Consolidated Financial Statements”).
In our opinion and to the best of our information and according to the explanations given to us, the aforesaid Consolidated Financial Statements give the information required by the Companies Act, 2013 (“the Act”) in the manner so required and give a true and fair view in conformity with the Indian Accounting Standards prescribed under section 133 of the Act read with the Companies (Indian Accounting Standards) Rules, 2015, as amended (‘Ind AS’), and other accounting principles generally accepted in India, of the consolidated state of affairs of the Group as at March 31, 2021, and it’s consolidated profit, consolidated total comprehensive income, consolidated changes in equity and consolidated cash flows for the year ended on that date.
Basis for OpinionWe conducted our audit of the Consolidated Financial Statements in accordance with the Standards on Auditing specified under section 143 (10) of the Act (SAs). Our responsibilities under those Standards are further described in the Auditor’s Responsibility for the Audit of the Consolidated Financial Statements section of our report. We are independent of the Group in accordance with the Code of Ethics issued by the Institute of Chartered Accountants of India (ICAI) together with the ethical requirements that are relevant to our audit of the Consolidated Financial Statements under the provisions of the Act and the Rules made thereunder, and we have fulfilled our other ethical responsibilities in accordance with these requirements and the ICAI’s Code of Ethics. We believe that the audit evidence obtained by us is sufficient and appropriate to provide a basis for our audit opinion on the Consolidated Financial Statements.
Key Audit MattersKey audit matters are those matters that, in our professional judgment, were of most significance in our audit of the
Consolidated Financial Statements of the current period. These matters were addressed in the context of our audit of the Consolidated Financial Statements as a whole, and in forming our opinion thereon, and we do not provide a separate opinion on these matters. We have determined the matters described below to be the key audit matters to be communicated in our report.
Fixed price contracts using the percentage of completion method - Refer Notes 2 (iii)(a), 3(xiv)B and 21 to the financial statements.
Key Audit Matter Description
Revenue from fixed-price contracts, including software development, and integration contracts, where the performance obligations are satisfied over time, is recognized using the percentage-of-completion method.
Use of the percentage-of-completion method requires the Company to determine the project costs incurred to date as a percentage of total estimated project costs required to complete the project. The estimation of total project costs involves significant judgement and is assessed throughout the period of the contract to reflect any changes based on the latest available information. In addition, provisions for estimated losses, if any, on uncompleted contracts are recorded in the period in which such losses become probable based on the estimated project costs.
We identified the revenue recognition for fixed price contracts where the percentage-of-completion method is used as a key audit matter because of the significant judgement involved in estimating the efforts to complete such contracts.
This estimate has a high inherent uncertainty and requires consideration of progress of the contract, efforts incurred to-date and estimates of efforts required to complete the remaining contract performance obligations over the lives of the contracts.
This required a high degree of auditor judgment in evaluating the audit evidence supporting the application of the input method used to recognize revenue and a higher extent of audit effort to evaluate the reasonableness of the total estimated amount of revenue recognized on fixed-price contracts.
How the Key Audit Matter Was Addressed in the Audit
Our audit procedures related to estimates of efforts to complete for fixed-price contracts accounted using the percentage-of-completion method included the following, among others:
• We tested the effectiveness of controls relating to (1) recording of efforts incurred and estimation of efforts required to complete the remaining contract performance
219
Integrated Annual Report 2020-21Wipro Limited
219

Consolidated financial statements under Ind AS
Independent Auditor’s Report
obligations, and (2) access and application controls pertaining to time recording and allocation systems, which prevents unauthorised changes to recording of efforts incurred.
• We evaluated management’s ability to reasonably estimate the progress towards satisfying the performance obligation by comparing actual information to estimates for performance obligations that have been fulfilled.
• We selected a sample of fixed price contracts with customers accounted using percentage-of-completion method and performed the following: • Read the contract and based on the terms and
conditions evaluated whether recognizing revenue over time was appropriate, and the contract was included in management’s calculation of revenue over time.
• Evaluated other information that supported the estimates of the progress towards satisfying the performance obligation.
• Evaluated the appropriateness of and consistency in the application of management’s policies and methodologies to estimate progress towards satisfying the performance obligation.
• Compared efforts incurred with Company’s estimate of efforts incurred to date to identify significant variations and evaluate whether those variations have been considered appropriately in estimating the remaining efforts to complete the contract.
• Tested the estimate for consistency with the status of delivery of milestones and customer acceptances to identify possible delays in achieving milestones, which require changes in estimated efforts to complete the remaining performance obligations.
Allowance for credit losses Refer Notes 2(iii)(g), 3(x)(a), and 10 to the financial statements
Key Audit Matter Description
The Company determines the allowance for credit losses based on historical loss experience adjusted to reflect current and estimated future economic conditions. The Company considered current and anticipated future economic conditions on the basis of the credit reports and other related credit information for its customers to estimate the probability of default in future and has taken into account estimates of possible effect from the pandemic relating to COVID-19.
We identified allowance for credit losses as a key audit matter because of the significant judgement involved in calculating the expected credit losses. This required a high degree of auditor judgment and an increased extent of effort when
performing audit procedures to evaluate the reasonableness of management’s estimate of the expected credit losses.
How the Key Audit Matter Was Addressed in the Audit
Our audit procedures related to the allowance for credit losses for trade receivables, unbilled receivables and contract assets included the following, among others:
• We tested the effectiveness of controls over the (1) development of the methodology for the allowance for credit losses, including consideration of the current and estimated future economic conditions, (2) completeness and accuracy of information used in the estimation of probability of default, and (3) computation of the allowance for credit losses.
• For a sample of customers we tested the input data such as credit reports and other credit related information used in estimating the probability of default by comparing them to external and internal sources of information.
• We evaluated the incorporation of the applicable assumptions into the estimate of expected credit losses and tested the mathematical accuracy and computation of the allowances by using the same input data used by the Company.
• We evaluated the qualitative adjustment to the historical loss rates, including assessing the basis for the adjustments and the reasonableness of the significant assumptions.
Information Other than the Financial Statements and Auditor’s Report Thereon• The Company’s Board of Directors is responsible for
the preparation of the other information. The other information comprises the information included in the Management Discussion and Analysis, Board’s report and Corporate Governance Report, but does not include the Consolidated Financial Statements, Standalone Financial Statements and our auditor’s report thereon.
• Our opinion on the Consolidated Financial Statements does not cover the other information and we do not express any form of assurance conclusion thereon.
• In connection with our audit of the Consolidated Financial Statements, our responsibility is to read the other information and, in doing so, consider whether the other information is materially inconsistent with the Consolidated Financial Statements or our knowledge obtained during the course of our audit or otherwise appears to be materially misstated.
• If, based on the work we have performed, we conclude that there is a material misstatement of this other information, we are required to report that fact. We have nothing to report in this regard.
220220

Consolidated financial statements under Ind AS
Management’s Responsibility for the Consolidated Financial StatementsThe Company’s Board of Directors is responsible for the matters stated in section 134(5) of the Act with respect to the preparation and presentation of these Consolidated Financial Statements that give a true and fair view of the consolidated financial position, consolidated financial performance including other comprehensive income, consolidated changes in equity and consolidated cash flows of the Group in accordance with the Ind AS and other accounting principles generally accepted in India. The respective Board of Directors of the companies included in the Group are responsible for maintenance of adequate accounting records in accordance with the provisions of the Act for safeguarding the assets of the Group and for preventing and detecting frauds and other irregularities; selection and application of appropriate accounting policies; making judgments and estimates that are reasonable and prudent; and design, implementation and maintenance of adequate internal financial controls, that were operating effectively for ensuring the accuracy and completeness of the accounting records, relevant to the preparation and presentation of the Consolidated Financial Statements that give a true and fair view and are free from material misstatement, whether due to fraud or error, which have been used for the purpose of preparation of the Consolidated Financial Statements by the Directors of the Company, as aforesaid.
In preparing the Consolidated Financial Statements, the respective Board of Directors of the companies included in the Group are responsible for assessing the ability of the respective entities to continue as a going concern, disclosing, as applicable, matters related to going concern and using the going concern basis of accounting unless the respective Board of Directors either intends to liquidate their respective entities or cease operations, or have no realistic alternative but to do so.
The respective Board of Directors of the companies included in the Group are also responsible for overseeing the financial reporting process of the Group.
Auditor’s Responsibility for the Audit of the
Consolidated Financial Statements
Our objectives are to obtain reasonable assurance about whether the Consolidated Financial Statements as a whole are free from material misstatement, whether due to fraud or error, and to issue an auditor’s report that includes our opinion. Reasonable assurance is a high level of assurance, but is not a guarantee that an audit conducted in accordance with SAs will always detect a material misstatement when it exists. Misstatements can arise from fraud or error and are considered material if, individually or in the aggregate, they could reasonably be expected to influence the economic
decisions of users taken on the basis of these Consolidated Financial Statements.
As part of an audit in accordance with SAs, we exercise professional judgment and maintain professional skepticism throughout the audit. We also:• Identify and assess the risks of material misstatement
of the Consolidated Financial Statements, whether due to fraud or error, design and perform audit procedures responsive to those risks, and obtain audit evidence that is sufficient and appropriate to provide a basis for our opinion. The risk of not detecting a material misstatement resulting from fraud is higher than for one resulting from error, as fraud may involve collusion, forgery, intentional omissions, misrepresentations, or the override of internal control.
• Obtain an understanding of internal financial control relevant to the audit in order to design audit procedures that are appropriate in the circumstances. Under section 143(3)(i) of the Act, we are also responsible for expressing our opinion on whether the Company and its subsidiary companies which are companies incorporated in India, has adequate internal financial controls system in place and the operating effectiveness of such controls.
• Evaluate the appropriateness of accounting policies used and the reasonableness of accounting estimates and related disclosures made by the management.
• Conclude on the appropriateness of management’s use of the going concern basis of accounting and, based on the audit evidence obtained, whether a material uncertainty exists related to events or conditions that may cast significant doubt on the ability of the Group to continue as a going concern. If we conclude that a material uncertainty exists, we are required to draw attention in our auditor’s report to the related disclosures in the Consolidated Financial Statements or, if such disclosures are inadequate, to modify our opinion. Our conclusions are based on the audit evidence obtained up to the date of our auditor’s report. However, future events or conditions may cause the Group to cease to continue as a going concern.
• Evaluate the overall presentation, structure and content of the Consolidated Financial Statements, including the disclosures, and whether the Consolidated Financial Statements represent the underlying transactions and events in a manner that achieves fair presentation.
• Obtain sufficient appropriate audit evidence regarding the financial information of the entities and business activities within the Group to express an opinion on the Consolidated Financial Statements.
Materiality is the magnitude of misstatements in the Consolidated Financial Statements that, individually or in aggregate, makes it probable that the economic decisions
221
Integrated Annual Report 2020-21Wipro Limited
221

Consolidated financial statements under Ind AS
Independent Auditor’s Report
of a reasonably knowledgeable user of the Consolidated Financial Statements may be influenced. We consider quantitative materiality and qualitative factors in (i) planning the scope of our audit work and in evaluating the results of our work; and (ii) to evaluate the effect of any identified misstatements in the Consolidated Financial Statements.
We communicate with those charged with governance of the Company regarding, among other matters, the planned scope and timing of the audit and significant audit findings, including any significant deficiencies in internal control that we identify during our audit.
We also provide those charged with governance with a statement that we have complied with relevant ethical requirements regarding independence, and to communicate with them all relationships and other matters that may reasonably be thought to bear on our independence, and where applicable, related safeguards.
From the matters communicated with those charged with governance, we determine those matters that were of most significance in the audit of the Consolidated Financial Statements of the current period and are therefore the key audit matters. We describe these matters in our auditor’s report unless law or regulation precludes public disclosure about the matter or when, in extremely rare circumstances, we determine that a matter should not be communicated in our report because the adverse consequences of doing so would reasonably be expected to outweigh the public interest benefits of such communication.
Report on Other Legal and Regulatory Requirements1. As required by Section 143(3) of the Act, based on our
audit we report that:
a) We have sought and obtained all the information and explanations which to the best of our knowledge and belief were necessary for the purposes of our audit of the aforesaid Consolidated Financial Statements.
b) In our opinion, proper books of account as required by law relating to preparation of the aforesaid Consolidated Financial Statements have been kept so far as it appears from our examination of those books.
c) The Consolidated Balance Sheet, the Consolidated Statement of Profit and Loss (including Other Comprehensive Income), the Consolidated Statement of Changes in Equity and the Consolidated Statement of Cash Flows dealt with by this Report are in agreement with the relevant books of account maintained for the purpose of preparation of the Consolidated Financial Statements.
d) In our opinion, the aforesaid Consolidated Financial Statements comply with the Ind AS specified under Section 133 of the Act.
e) On the basis of the written representations received from the directors of the Company as on March 31,
2021 taken on record by the Board of Directors of the Company and its subsidiaries incorporated in India, and the reports of the statutory auditors of its subsidiary companies incorporated in India, none of the directors of the Group companies, incorporated in India is disqualified as on March 31, 2021 from being appointed as a director in terms of Section 164(2) of the Act.
f) With respect to the adequacy of the internal financial controls over financial reporting and the operating effectiveness of such controls, refer to our separate Report in “Annexure A” which is based on the auditors’ reports of the company and its subsidiary companies incorporated in India. Our report expresses an unmodified opinion on the adequacy and operating effectiveness of internal financial controls over financial reporting of those companies.
g) With respect to the other matters to be included in the Auditor’s Report in accordance with the requirements of section 197(16) of the Act, as amended, in our opinion and to the best of our information and according to the explanations given to us, the remuneration paid by the Company to its directors during the year is in accordance with the provisions of section 197 of the Act.
h) With respect to the other matters to be included in the Auditor’s Report in accordance with Rule 11 of the Companies (Audit and Auditors) Rules, 2014, as amended in our opinion and to the best of our information and according to the explanations given to us: i) The Consolidated Financial Statements
disclose the impact of pending litigations on the consolidated financial position of the Group,
ii) Provision has been made in the Consolidated Financial Statements, as required under the applicable law or accounting standards, for material foreseeable losses, if any, on long-term contracts including derivative contracts;
iii) There has been no delay in transferring amounts, required to be transferred, to the Investor Education and Protection Fund by the Company and its subsidiary companies incorporated in India.
For DELOITTE HASKINS & SELLS LLPChartered AccountantsFirm Registration Number: 117366W/W-100018
Vikas BagariaPartnerMembership number: 60408
BengaluruJune 9, 2021
222222

Consolidated financial statements under Ind AS
Annexure “A” to the Independent Auditor’s Reportthe audit to obtain reasonable assurance about whether adequate internal financial controls over financial reporting was established and maintained and if such controls operated effectively in all material respects.
Our audit involves performing procedures to obtain audit evidence about the adequacy of the internal financial controls system over financial reporting and their operating effectiveness. Our audit of internal financial controls over financial reporting included obtaining an understanding of internal financial controls over financial reporting, assessing the risk that a material weakness exists, and testing and evaluating the design and operating effectiveness of internal control based on the assessed risk. The procedures selected depend on the auditor’s judgement, including the assessment of the risks of material misstatement of the financial statements, whether due to fraud or error.
We believe that the audit evidence we have obtained, is sufficient and appropriate to provide a basis for our audit opinion on the internal financial controls system over financial reporting of the Company, and its subsidiary companies which are companies incorporated in India.
Meaning of Internal Financial Controls over Financial ReportingA company's internal financial control over financial reporting is a process designed to provide reasonable assurance regarding the reliability of financial reporting and the preparation of financial statements for external purposes in accordance with generally accepted accounting principles. A company's internal financial control over financial reporting includes those policies and procedures that (1) pertain to the maintenance of records that, in reasonable detail, accurately and fairly reflect the transactions and dispositions of the assets of the company; (2) provide reasonable assurance that transactions are recorded as necessary to permit preparation of financial statements in accordance with generally accepted accounting principles, and that receipts and expenditures of the company are being made only in accordance with authorisations of management and directors of the company; and (3) provide reasonable assurance regarding prevention or timely detection of unauthorised acquisition, use, or disposition of the company's assets that could have a material effect on the financial statements.
Inherent Limitations of Internal Financial Controls over Financial ReportingBecause of the inherent limitations of internal financial controls over financial reporting, including the possibility
(Referred to in paragraph 1(f) under ‘Report on Other Legal and Regulatory Requirements’ section of our report to the Members of Wipro Limited of even date)
Report on the Internal Financial Controls Over Financial Reporting under Clause (i) of Sub-section 3 of Section 143 of the Companies Act, 2013 (“the Act”)
In conjunction with our audit of the Consolidated Financial Statements of the Company as of and for the year ended March 31, 2021, we have audited the internal financial controls over financial reporting of Wipro Limited (hereinafter referred to as “the Company”) and its subsidiary companies, which are companies incorporated in India, as of that date.
Management’s Responsibility for Internal Financial Controls
The respective Board of Directors of the company, and its subsidiary companies, which are companies incorporated in India, are responsible for establishing and maintaining internal financial controls based on the internal control over financial reporting criteria established by the respective Companies considering the essential components of internal control stated in the Guidance Note on Audit of Internal Financial Controls Over Financial Reporting issued by the Institute of Chartered Accountants of India (“the ICAI”). These responsibilities include the design, implementation and maintenance of adequate internal financial controls that were operating effectively for ensuring the orderly and efficient conduct of its business, including adherence to the respective company’s policies, the safeguarding of its assets, the prevention and detection of frauds and errors, the accuracy and completeness of the accounting records, and the timely preparation of reliable financial information, as required under the Act.
Auditor’s ResponsibilityOur responsibility is to express an opinion on the internal financial controls over financial reporting of the Company, and its subsidiary companies, which are companies incorporated in India, based on our audit. We conducted our audit in accordance with the Guidance Note on Audit of Internal Financial Controls Over Financial Reporting (the “Guidance Note”) issued by the ICAI and the Standards on Auditing, prescribed under Section 143(10) of the Act, to the extent applicable to an audit of internal financial controls. Those Standards and the Guidance Note require that we comply with ethical requirements and plan and perform
223
Integrated Annual Report 2020-21Wipro Limited
223

Consolidated financial statements under Ind AS
of collusion or improper management override of controls, material misstatements due to error or fraud may occur and not be detected. Also, projections of any evaluation of the internal financial controls over financial reporting to future periods are subject to the risk that the internal financial control over financial reporting may become inadequate because of changes in conditions, or that the degree of compliance with the policies or procedures may deteriorate.
OpinionIn our opinion to the best of our information and according to the explanations given to us, the Company, and its subsidiary companies, which are companies incorporated in India, have, in all material respects, an adequate internal financial controls system over financial reporting and such internal financial controls over financial reporting were operating effectively as at March 31, 2021, based on, the criteria for internal control over financial reporting established by the
respective companies considering the essential components of internal control stated in the Guidance Note on Audit of Internal Financial Controls Over Financial Reporting issued by the ICAI.
For DELOITTE HASKINS & SELLS LLPChartered AccountantsFirm Registration Number: 117366W/W-100018
Vikas BagariaPartnerMembership number: 60408
BengaluruJune 9, 2021
Annexure “A” to the Independent Auditor’s Report
224224

(` in millions, except share and per share data, unless otherwise stated)
Consolidated financial statements under Ind ASIntegrated Annual Report 2020-21
Wipro Limited
225
Consolidated Balance Sheet
NotesAs at
March 31, 2021As at
March 31, 2020
ASSETS
Non-current assets
Property, plant and equipment 4 65,751 60,617
Right-of-Use Assets 5 16,420 16,748
Capital work-in-progress 18,532 18,811
Goodwill 6 135,147 126,894
Other Intangible assets 6 13,085 16,362
Investments accounted for using the equity method 8 1,464 1,383
Financial assets
Derivative assets 9 16 -
Investments 8 10,576 9,302
Trade receivables 10 4,358 6,049
Other financial assets 11 6,088 5,881
Deferred tax assets (net) 28 1,664 6,005
Non-current tax assets (net) 14,323 11,414
Other non-current assets 12 16,712 13,472
Total non-current assets 304,136 292,938
Current assets
Inventories 13 1,064 1,865
Financial assets
Investments 8 175,707 189,635
Trade receivables 10 94,298 104,474
Cash and cash equivalents 14 169,793 144,499
Derivative assets 9 4,064 3,025
Unbilled receivables 27,124 25,209
Other financial assets 11 7,245 8,614
Current tax assets (net) 2,461 2,882
Contract assets 16,507 17,143
Other current assets 12 24,923 22,505
Total current assets 523,186 519,851
TOTAL ASSETS 827,322 812,789
EQUITY AND LIABILITIES
EQUITY
Equity Share Capital 15 10,958 11,427
Other Equity 538,052 541,790
Equity attributable to the equity holders of the Company 549,010 553,217
Non-controlling interest 1,498 1,875
TOTAL EQUITY 550,508 555,092
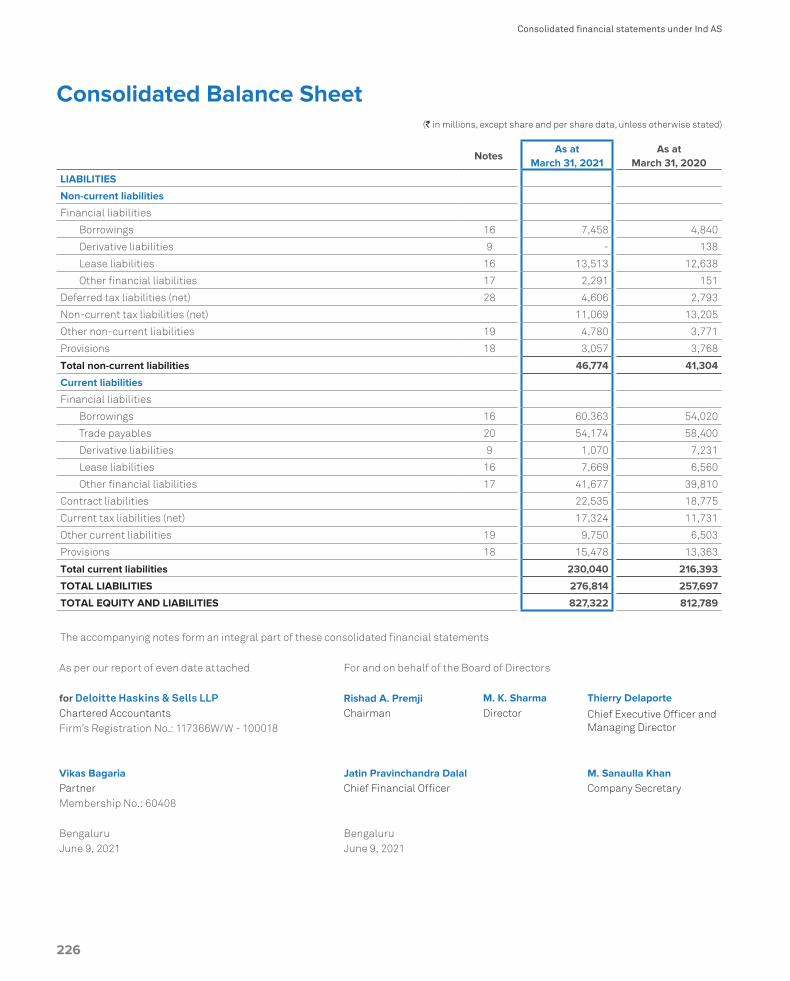
(` in millions, except share and per share data, unless otherwise stated)
Consolidated financial statements under Ind AS
226
Consolidated Balance Sheet
As per our report of even date attached For and on behalf of the Board of Directors
for Deloitte Haskins & Sells LLP Rishad A. Premji M. K. Sharma Thierry DelaporteChartered Accountants Chairman Director Chief Executive Officer and
Managing DirectorFirm’s Registration No.: 117366W/W - 100018
Vikas Bagaria Jatin Pravinchandra Dalal M. Sanaulla KhanPartner Chief Financial Officer Company SecretaryMembership No.: 60408
Bengaluru BengaluruJune 9, 2021 June 9, 2021
NotesAs at
March 31, 2021As at
March 31, 2020
LIABILITIES
Non-current liabilities
Financial liabilities
Borrowings 16 7,458 4,840
Derivative liabilities 9 - 138
Lease liabilities 16 13,513 12,638
Other financial liabilities 17 2,291 151
Deferred tax liabilities (net) 28 4,606 2,793
Non-current tax liabilities (net) 11,069 13,205
Other non-current liabilities 19 4,780 3,771
Provisions 18 3,057 3,768
Total non-current liabilities 46,774 41,304
Current liabilities
Financial liabilities
Borrowings 16 60,363 54,020
Trade payables 20 54,174 58,400
Derivative liabilities 9 1,070 7,231
Lease liabilities 16 7,669 6,560
Other financial liabilities 17 41,677 39,810
Contract liabilities 22,535 18,775
Current tax liabilities (net) 17,324 11,731
Other current liabilities 19 9,750 6,503
Provisions 18 15,478 13,363
Total current liabilities 230,040 216,393
TOTAL LIABILITIES 276,814 257,697
TOTAL EQUITY AND LIABILITIES 827,322 812,789
The accompanying notes form an integral part of these consolidated financial statements

(` in millions, except share and per share data, unless otherwise stated)
Consolidated financial statements under Ind ASIntegrated Annual Report 2020-21
Wipro Limited
227
Consolidated Statement of Profit and Loss
NotesYear ended
March 31, 2021Year ended
March 31, 2020
INCOME
Revenue from operations 21 619,430 610,232
Other operating income 22 (81) 1,144
Other income 23 23,907 27,250
Total Income 643,256 638,626
EXPENSES
Purchases of stock-in-trade 6,957 9,360
Changes in inventories of finished goods and stock-in-trade 24 315 2,022
Employee benefits expense 25 332,371 326,571
Finance costs 26 5,088 7,328
Depreciation, amortisation and impairment expense 27,634 20,855
Sub-contracting / technical fees / third party application 83,609 90,521
Facility expenses 20,255 19,733
Travel 5,258 18,169
Communication 6,069 4,812
Marketing and brand building 1,011 2,532
Legal and Professional charges 5,561 4,733
Lifetime expected credit loss 1,506 1,043
Other expenses 27 8,723 8,457
Total expenses 504,357 516,136
Share of net profit /(loss) of associates accounted for using the equity method 130 29
Profit before tax 139,029 122,519
Tax expense
Current tax 28 26,065 24,324
Deferred tax 28 4,284 477
Total tax expense 30,349 24,801
Profit for the year 108,680 97,718
Other Comprehensive Income (OCI)
Items that will not be reclassified subsequently to profit or loss:
Remeasurements of the defined benefit plans, net 25 334 (1,246)
Net change in fair value of investment in equity instruments measured at fair value through OCI
1,214 700
Income tax relating to items that will not be reclassified to profit or loss 28 (109) 220

(` in millions, except share and per share data, unless otherwise stated)
Consolidated financial statements under Ind AS
228
Consolidated Statement of Profit and Loss
NotesYear ended
March 31, 2021Year ended
March 31, 2020
Items that will be reclassified to profit or loss:
Foreign currency translation differences relating to foreign operations (518) 8,091
Net change in time value of option contracts designated as cash flow hedges 66 (648)
Net change in intrinsic value of option contracts designated as cash flow hedges 1,193 (1,941)Net change in fair value of forward contracts designated as cash flow hedges 3,799 (3,305)
Net change in fair value of investment in debt instruments measured at fair value through OCI
2,0791,015
Income tax relating to items that will be reclassified to profit or loss 28 (1,241) 1,371
Total other comprehensive (loss)/income for the year, net of taxes 6,817 4,257
Total comprehensive income for the year 115,497 101,975
Profit for the year attributable to:
Equity holders of the Company 107,964 97,223
Non-controlling interest 716 495
108,680 97,718
Total comprehensive income for the year attributable to:
Equity holders of the Company 114,834 101,322
Non-controlling interest 663 653
115,497 101,975
Earnings per equity share: (Equity shares of par value ` 2 each) 30
Basic 19.11 16.67
Diluted 19.07 16.63
Weighted average number of equity shares
used in computing earnings per equity share
Basic 5,649,265,885 5,833,384,018
Diluted 5,661,657,822 5,847,823,239
As per our report of even date attached For and on behalf of the Board of Directors
for Deloitte Haskins & Sells LLP Rishad A. Premji M. K. Sharma Thierry Delaporte
Chartered Accountants Chairman Director Chief Executive Officer and Managing DirectorFirm’s Registration No.: 117366W/W - 100018
Vikas Bagaria Jatin Pravinchandra Dalal M. Sanaulla KhanPartner Chief Financial Officer Company SecretaryMembership No.: 60408
Bengaluru BengaluruJune 9, 2021 June 9, 2021

Consolidated financial statements under Ind ASIntegrated Annual Report 2020-21
Wipro Limited
229
Equi
ty s
hare
cap
ital
Bal
ance
as
at A
pril
1, 2
02
0C
hang
e in
equ
ity s
hare
cap
ital
Bal
ance
as
at M
arch
31,
20
21
11,4
27(4
69)
10,9
58
Bal
ance
as
at A
pril
1, 2
019
Cha
nge
in e
quity
sha
re c
apita
lB
alan
ce a
s at
Mar
ch 3
1, 2
02
012
,068
(6
41)
11,4
27
Oth
er e
quity
Parti
cula
rs
Rese
rves
and
Sur
plus
Oth
er c
ompo
nent
s of
equ
ityTo
tal
attri
buta
ble
to e
quity
ho
lder
s of
the
Com
pany
Non
-co
ntro
lling
in
tere
stTo
tal
Shar
e ap
plic
atio
n m
oney
pe
ndin
g al
lotm
ent
Secu
ritie
s pr
emiu
mCa
pita
l re
serv
e
Capi
tal
rede
mpt
ion
rese
rve
Reta
ined
ea
rnin
gs
Shar
e O
ptio
ns
Out
stan
ding
Ac
coun
t
Spec
ial
econ
omic
Zo
ne re
-in
vest
men
t re
serv
e
Fore
ign
curr
ency
tra
nsla
tion
rese
rve
Cash
flo
w
hedg
ing
rese
rve
Oth
er
rese
rves
(3
)
Bala
nce
as a
t Apr
il 1,
202
0^
1,34
61,1
3966
047
2,19
61,
550
43,8
0421
,981
(2,3
15)
1,42
954
1,790
1,87
554
3,66
5
Profi
t for
the
year
--
--
107,
964
--
--
-10
7,96
471
610
8,68
0
Othe
r com
preh
ensi
ve in
com
e-
--
--
--
(465
)4,
045
3,29
06,
870
(53)
6,81
7
Tota
l com
preh
ensi
ve in
com
e fo
r the
yea
r-
--
-10
7,96
4-
-(4
65)
4,04
53,
290
114,
834
663
115,
497
Issu
e of
equ
ity s
hare
s on
exe
rcis
e of
opt
ions
-86
6-
--
(866
)-
--
--
--
Buyb
ack
of e
quity
sha
res,
incl
udin
g ta
x th
ereo
n(1)
-(1
,427
)-
475
(115
,018
)-
--
--
(115
,970
)-
(115
,970
)
Tran
sact
ion
cost
rela
ted
to b
uyba
ck o
f equ
ity
shar
es-
--
-(1
99)
--
--
-(1
99)
-(1
99)
Issu
e of
sha
res
by c
ontr
olle
d tr
ust o
n ex
erci
se
of o
ptio
ns*
--
--
662
(662
)-
--
--
--
Effe
ct o
f mod
ifica
tion
of A
DS
RSU
s fr
om c
ash
sett
led
to e
quity
set
tled(2
)-
--
--
739
--
--
739
-73
9
Com
pens
atio
n co
st re
late
d to
em
ploy
ee s
hare
-ba
sed
paym
ent
--
--
72,
310
--
--
2,31
7-
2,31
7
Tran
sfer
red
from
spe
cial
eco
nom
ic z
one
re-
inve
stm
ent r
eser
ve-
--
-2,
650
-(2
,650
)-
--
--
-
Cash
div
iden
d pa
id-
--
-(5
,459
)-
--
--
(5,4
59)
(960
)(6
,419
)
Othe
rs-
--
--
--
--
--
(80)
(80)
Bala
nce
as a
t Mar
ch 3
1, 2
021
^78
51,1
391,1
3546
2,80
33,
071
41,15
421
,516
1,730
4,71
953
8,05
21,
498
539,
550
* In
clud
es 1
9,40
1,21
5 tr
easu
ry s
hare
s he
ld a
s at
Mar
ch 3
1, 2
021
by a
con
trol
led
trus
t. 3,
344,
866
shar
es h
ave
been
tran
sfer
red
by th
e co
ntro
lled
trus
t to
elig
ible
em
ploy
ees
on e
xerc
ise
of o
ptio
ns d
urin
g th
e ye
ar e
nded
Mar
ch
31, 2
021.
^ Va
lue
less
than₹1
(1) Re
fer t
o N
ote
33(2
) Refe
r to
Not
e 31
(3) Re
fer t
o N
ote
29
(` in
mill
ions
, exc
ept s
hare
and
per
sha
re d
ata,
unl
ess
othe
rwis
e st
ated
)
Con
solid
ated
Sta
tem
ent o
f Cha
nges
in E
quity

Consolidated financial statements under Ind AS
230
The
acco
mp
anyi
ng n
otes
form
an
inte
gral
par
t of
the
se c
onso
lidat
ed fi
nanc
ial s
tate
men
tsA
s p
er o
ur r
epor
t of e
ven
date
att
ach
edFo
r an
d on
beh
alf o
f th
e B
oard
of D
irec
tors
for D
eloi
tte
Has
kins
& S
ells
LLP
R
isha
d A
. Pre
mji
M. K
. Sha
rma
Thie
rry
Del
apor
teC
hart
ered
Acc
ount
ants
Cha
irm
anD
irec
tor
Chi
ef E
xecu
tive
Offi
cer
and
Man
agin
g D
irec
tor
Fir
m’s
Reg
istr
atio
n N
o.: 1
1736
6W/W
- 1
0001
8V
ikas
Bag
aria
Jatin
Pra
vinc
hand
ra D
alal
M. S
anau
lla K
han
Par
tner
Chi
ef F
inan
cial
Offi
cer
Com
pany
Sec
reta
ryM
emb
ersh
ip N
o.: 6
0408
Ben
galu
ruB
enga
luru
Jun
e 9,
202
1Ju
ne
9, 2
021
(` in
mill
ions
, exc
ept s
hare
and
per
sha
re d
ata,
unl
ess
othe
rwis
e st
ated
)
Con
solid
ated
Sta
tem
ent o
f Cha
nges
in E
quity
Parti
cula
rs
Rese
rves
and
Sur
plus
Oth
er c
ompo
nent
s of
equ
ityTo
tal
attri
buta
ble
to e
quity
ho
lder
s of
the
Com
pany
Non
-co
ntro
lling
in
tere
stTo
tal
Shar
e ap
plic
atio
n m
oney
pe
ndin
g al
lotm
ent
Secu
ritie
s pr
emiu
mCa
pita
l re
serv
e
Capi
tal
rede
mpt
ion
rese
rve
Reta
ined
ea
rnin
gs
Shar
e O
ptio
ns
Out
stan
ding
Ac
coun
t
Spec
ial
econ
omic
Zo
ne re
-in
vest
men
t re
serv
e
Fore
ign
curr
ency
tra
nsla
tion
rese
rve
Cash
flo
w
hedg
ing
rese
rve
Oth
er
rese
rves
(3
)
Bala
nce
as a
t Apr
il 1,
201
9^
604
1,139
1450
2,22
32,
617
28,5
6514
,048
2,41
553
355
2,15
82,
637
554,
795
Adju
stm
ent o
n ad
optio
n of
Ind
AS 1
16(4
)-
--
-(8
72)
--
--
-(8
72)
-(8
72)
Adj
uste
d ba
lanc
es a
s at
Apr
il 1,
201
9^
604
1,139
1450
1,35
12,
617
28,5
6514
,048
2,41
553
355
1,28
62,
637
553,
923
Profi
t for
the
year
--
--
97,2
23-
--
--
97,2
2349
597
,718
Othe
r com
preh
ensi
ve in
com
e-
--
--
--
7,93
3(4
,730
)89
64,
099
158
4,25
7
Tota
l com
preh
ensi
ve in
com
e fo
r the
yea
r-
--
-97
,223
--
7,93
3(4
,730
)89
610
1,32
265
310
1,97
5
Issu
e of
equ
ity s
hare
s on
exe
rcis
e of
opt
ions
-74
2-
--
(742
)-
--
--
--
Buyb
ack
of e
quity
sha
res(1
)-
--
646
(105
,000
)-
--
--
(104
,354
)-
(104
,354
)
Tran
sact
ion
cost
rela
ted
to b
uyba
ck o
f equ
ity
shar
es-
--
-(3
11)
--
--
-(3
11)
-(3
11)
Issu
e of
sha
res
by c
ontr
olle
d tr
ust o
n ex
erci
se
of o
ptio
ns*
--
--
1,02
6(1
,026
)-
--
--
--
Com
pens
atio
n co
st re
late
d to
em
ploy
ee s
hare
-ba
sed
paym
ent
--
--
91,
262
--
--
1,27
1-
1,27
1
Effe
ct o
f mod
ifica
tion
of A
DS
RSU
s fr
om e
quity
se
ttle
d to
cas
h se
ttle
d(2)
--
--
-(5
61)
--
--
(561
)-
(561
)
Tran
sfer
red
to s
peci
al e
cono
mic
zon
e re
-in
vest
men
t res
erve
--
--
(15,
239)
-15
,239
--
--
--
Cash
div
iden
d pa
id (i
nclu
ding
div
iden
d ta
x th
ereo
n)(2
)-
--
-(6
,863
)-
--
--
(6,8
63)
-(6
,863
)
Cash
div
iden
d pa
id to
Non
-con
trol
ling
inte
rest
--
--
--
--
--
-(1
,415
)(1
,415
)
Bala
nce
as a
t Mar
ch 3
1, 2
020
^1,
346
1,139
660
472,
196
1,55
043
,804
21,9
81(2
,315
)1,
429
541,7
901,
875
543,
665
* In
clud
es 2
2,74
6,08
1 tr
easu
ry s
hare
s he
ld a
s at
Mar
ch 3
1, 2
020
by a
con
trol
led
trus
t. 4
,607
,772
sha
res
have
bee
n tr
ansf
erre
d by
the
cont
rolle
d tr
ust t
o el
igib
le e
mpl
oyee
s on
exe
rcis
e of
opt
ions
du
ring
the
year
end
ed M
arch
31,
202
0.^
Valu
e is
less
than
`1
(1) R
efer
to N
ote
33
(2) R
efer
to N
ote
31(3
) Ref
er to
Not
e 29
(4) R
efer
to N
ote
3
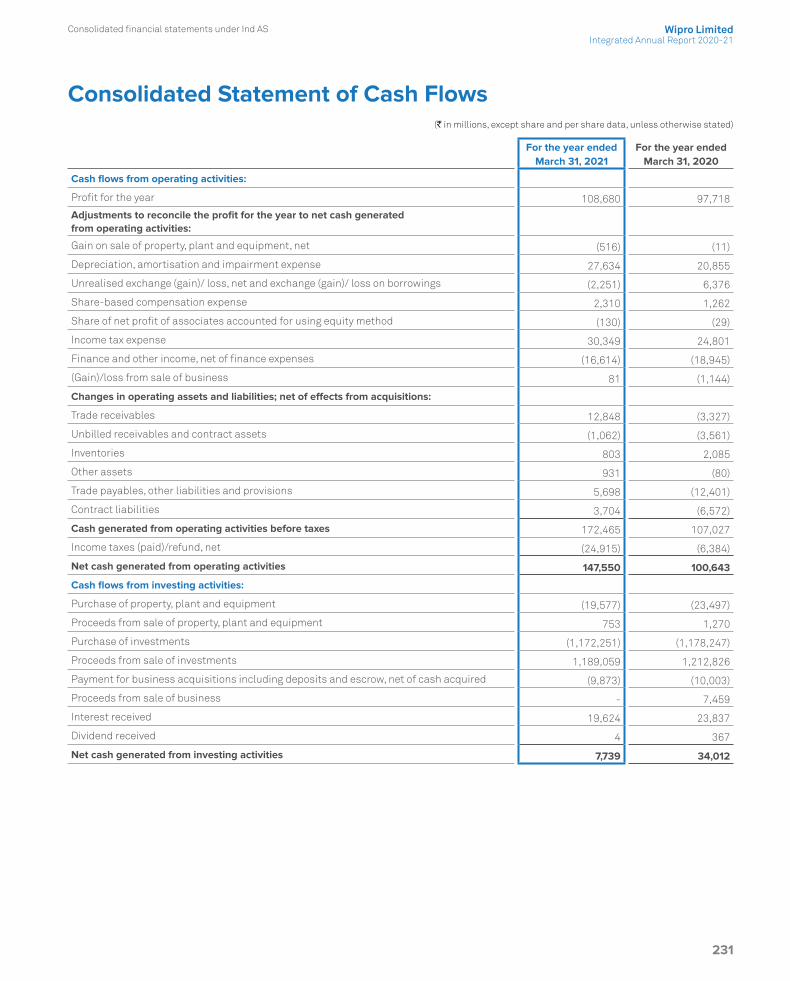
(` in millions, except share and per share data, unless otherwise stated)
Consolidated financial statements under Ind ASIntegrated Annual Report 2020-21
Wipro Limited
231
Consolidated Statement of Cash Flows
For the year endedMarch 31, 2021
For the year ended March 31, 2020
Cash flows from operating activities:
Profit for the year 108,680 97,718
Adjustments to reconcile the profit for the year to net cash generated from operating activities:
Gain on sale of property, plant and equipment, net (516) (11)
Depreciation, amortisation and impairment expense 27,634 20,855
Unrealised exchange (gain)/ loss, net and exchange (gain)/ loss on borrowings (2,251) 6,376
Share-based compensation expense 2,310 1,262
Share of net profit of associates accounted for using equity method (130) (29)
Income tax expense 30,349 24,801
Finance and other income, net of finance expenses (16,614) (18,945)
(Gain)/loss from sale of business 81 (1,144)
Changes in operating assets and liabilities; net of effects from acquisitions:
Trade receivables 12,848 (3,327)
Unbilled receivables and contract assets (1,062) (3,561)
Inventories 803 2,085
Other assets 931 (80)
Trade payables, other liabilities and provisions 5,698 (12,401)
Contract liabilities 3,704 (6,572)
Cash generated from operating activities before taxes 172,465 107,027
Income taxes (paid)/refund, net (24,915) (6,384)
Net cash generated from operating activities 147,550 100,643
Cash flows from investing activities:
Purchase of property, plant and equipment (19,577) (23,497)
Proceeds from sale of property, plant and equipment 753 1,270
Purchase of investments (1,172,251) (1,178,247)
Proceeds from sale of investments 1,189,059 1,212,826
Payment for business acquisitions including deposits and escrow, net of cash acquired (9,873) (10,003)
Proceeds from sale of business - 7,459
Interest received 19,624 23,837
Dividend received 4 367
Net cash generated from investing activities 7,739 34,012

(` in millions, except share and per share data, unless otherwise stated)
Consolidated financial statements under Ind AS
232
Consolidated Statement of Cash Flows
For the year endedMarch 31, 2021
For the year ended March 31, 2020
Cash flows from financing activities:
Proceeds from issuance of equity shares and shares pending allotment 6 14
Repayment of borrowings (97,206) (132,380)
Proceeds from borrowings 103,418 106,342
Repayment of lease liabilities (8,660) (6,784)
Payment for buyback of equity shares, including transaction cost (95,199) (105,311)
Payment of tax on buyback of equity shares (21,445) -
Interest paid (3,335) (4,601)
Payment of cash dividend (5,459) (5,689)
Payment of tax on cash dividend - (1,174)
Payment of cash dividend to Non-controlling interests holder (960) (1,415)
Net cash used in financing activities (128,840) (150,998)
Net increase in cash and cash equivalents during the year 26,449 (16,343)
Effect of exchange rate changes on cash and cash equivalents (890) 1,922
Cash and cash equivalents at the beginning of the year 144,104 158,525
Cash and cash equivalents at the end of the year (Note 14) 169,663 144,104Refer to Note 16 for supplementary information on consolidated statement of cash flows
The accompanying notes form an integral part of these consolidated financial statements
As per our report of even date attached For and on behalf of the Board of Directors
for Deloitte Haskins & Sells LLP Rishad A. Premji M. K. Sharma Thierry DelaporteChartered Accountants Chairman Director Chief Executive Officer and
Managing DirectorFirm’s Registration No.: 117366W/W - 100018
Vikas Bagaria Jatin Pravinchandra Dalal M. Sanaulla KhanPartner Chief Financial Officer Company SecretaryMembership No.: 60408
Bengaluru BengaluruJune 9, 2021 June 9, 2021

Notes to the Consolidated Financial Statements
Consolidated financial statements under Ind ASIntegrated Annual Report 2020-21
Wipro Limited
233
1. The Company Overview Wipro Limited (“Wipro” or the “Parent Company”), together with its subsidiaries and controlled trusts (collectively, “we”, “us”, “our”, “the Company” or the “Group”) is a global information technology (“IT”), consulting and business process services (“BPS”) company.
Wipro is a public limited company incorporated and domiciled in India. The address of its registered office is Wipro Limited, Doddakannelli, Sarjapur Road, Bengaluru – 560 035, Karnataka, India. The Company has its primary listing with BSE Ltd. and National Stock Exchange of India Ltd. The Company’s American Depository Shares (“ADS”) representing equity shares are also listed on the New York Stock Exchange.
The Company’s Board of Directors authorised these consolidated financial statements for issue on June 9, 2021.
2. Basis of Preparation of Consolidated Financial Statements
(i) Statement of compliance and basis of preparation
The consolidated financial statements have been prepared in compliance with Indian Accounting Standards (“Ind AS”), the provisions of the Companies Act, 2013 (“the Companies Act”), as applicable and guidelines issued by the Securities and Exchange Board of India (“SEBI”). The Ind AS are prescribed under Section 133 of the Companies Act read with Rule 3 of the Companies (Indian Accounting Standards) Rules, 2015 and amendments issued thereafter.
Accounting policies have been applied consistently to all periods presented in these consolidated financial statements except for new accounting standards adopted by the Company.
These consolidated financial statements correspond to the classification provisions contained in Ind AS 1, “Presentation of Financial Statements”. For clarity, various items are aggregated in the consolidated statement of profit and loss and consolidated balance sheet. These items are disaggregated separately in the notes to the consolidated financial statements, where applicable.
All amounts included in these consolidated financial statements are reported in millions of Indian rupees (` in millions) except share and per share data, unless otherwise stated. Due to rounding off, the numbers presented throughout the document may not add up precisely to the totals and percentages may not precisely reflect the absolute figures. Previous year
figures have been regrouped/re-arranged, wherever necessary.
(ii) Basis of measurement
The consolidated financial statements have been prepared on a historical cost convention and on an accrual basis, except for the following material items which have been measured at fair value as required by relevant Ind AS:
a. Derivative financial instruments;
b. Financial instruments classified as fair value through other comprehensive income or fair value through profit or loss;
c. The defined benefit liability/(asset) is recognised as the present value of defined benefit obligation less fair value of plan assets; and
d. Contingent consideration.
(iii) Use of estimates and judgment
The preparation of these consolidated financial statements in conformity with Ind AS requires the management to make judgments, estimates and assumptions that affect the application of accounting policies and the reported amounts of assets, liabilities, income and expenses. Actual results may differ from those estimates.
Estimates and underlying assumptions are reviewed on an ongoing basis. Revision to accounting estimates are recognised in the period in which the estimates are revised and in any future periods affected. In particular, information about significant areas of estimation, uncertainty and critical judgments in applying accounting policies that have the most significant effect on the amounts recognised in the consolidated financial statements are included in the following notes:
a) Revenue recognition: The Company applies judgement to determine whether each product or service promised to a customer is capable of being distinct, and is distinct in the context of the contract, if not, the promised products or services are combined and accounted as a single performance obligation. The Company allocates the arrangement consideration to separately identifiable performance obligation deliverables based on their relative stand-alone selling price. In cases where the Company is unable to determine the stand-alone selling price the Company uses expected cost-plus margin approach in estimating the stand-alone selling price. The Company uses the percentage of completion method using the input (cost expended) method to measure
(` in millions, except share and per share data, unless otherwise stated)

Notes to the Consolidated Financial Statements
Consolidated financial statements under Ind AS
234
progress towards completion in respect of fixed price contracts. Percentage of completion method accounting relies on estimates of total expected contract revenue and costs. This method is followed when reasonably dependable estimates of the revenues and costs applicable to various elements of the contract can be made. Key factors that are reviewed in estimating the future costs to complete include estimates of future labor costs and productivity efficiencies. Because the financial reporting of these contracts depends on estimates that are assessed continually during the term of these contracts, revenue recognised, profit and timing of revenue for remaining performance obligations are subject to revisions as the contract progresses to completion. When estimates indicate that a loss will be incurred, the loss is provided for in the period in which the loss becomes probable. Volume discounts are recorded as a reduction of revenue. When the amount of discount varies with the levels of revenue, volume discount is recorded based on estimate of future revenue from the customer.
b) Impairment testing: Goodwill and intangible assets with indefinite useful life recognised on business combination are tested for impairment at least annually and when events occur or changes in circumstances indicate that the recoverable amount of an asset or a cash generating unit to which an asset pertains, is less than the carrying value. The Company assesses acquired intangible assets with finite useful life for impairment whenever events or changes in circumstances indicate that the carrying amount may not be recoverable. The recoverable amount of an asset or a cash generating unit is higher of value-in-use and fair value less cost of disposal. The calculation of value-in-use of an asset or a cash generating unit involves use of significant estimates and assumptions which include turnover, growth rates and net margins used to calculate projected future cash flows, risk-adjusted discount rate, future economic and market conditions.
c) Income taxes: The major tax jurisdictions for the Company are India and the United States of America. Significant judgments are involved in determining the provision for income taxes including judgment on whether tax positions are probable of being sustained in tax assessments. A tax assessment can involve complex issues, which can only be resolved over extended time periods.
d) Deferred taxes: Deferred tax is recorded on temporary differences between the tax bases of assets and liabilities and their carrying amounts, at the rates that have been enacted or substantively enacted at the reporting date. The ultimate realisation of deferred tax assets is dependent upon the generation of future taxable profits during the periods in which those temporary differences and tax loss carry-forwards become deductible. The Company considers expected reversal of deferred tax liabilities and projected future taxable income in making this assessment. The amount of deferred tax assets considered realisable, however, could reduce in the near term if estimates of future taxable income during the carry-forward period are reduced.
e) Business combinations: In accounting for business combinations, judgment is required in identifying whether an identifiable intangible asset is to be recorded separately from goodwill. Additionally, estimating the acquisition date fair value of the identifiable assets acquired (including useful life estimates), liabilities assumed, and contingent consideration assumed involves management judgment. These measurements are based on information available at the acquisition date and are based on expectations and assumptions that have been deemed reasonable by management. Changes in these judgments, estimates, and assumptions can materially affect the results of operations.
f) Defined benefit plans and compensated absences: The cost of the defined benefit plans, compensated absences and the present value of the defined benefit obligations are based on actuarial valuation using the projected unit credit method. An actuarial valuation involves making various assumptions that may differ from actual developments in the future. These include the determination of the discount rate, future salary increases and mortality rates. Due to the complexities involved in the valuation and its long-term nature, a defined benefit obligation is highly sensitive to changes in these assumptions. All assumptions are reviewed at each reporting date.
g) Expected credit losses on financial assets: The impairment provisions of financial assets are based on assumptions about risk of default and expected timing of collection. The Company uses judgment in making these assumptions and

Notes to the Consolidated Financial Statements
Consolidated financial statements under Ind ASIntegrated Annual Report 2020-21
Wipro Limited
235
selecting the inputs to the expected credit loss calculation based on the Company’s history of collections, customer’s creditworthiness, existing market conditions as well as forward looking estimates at the end of each reporting period.
h) Measurement of fair value of non-marketable equity investments: These instruments are initially recorded at cost and subsequently measured at fair value. Fair value of investments is determined using the market and income approaches. The market approach includes the use of financial metrics and ratios of comparable companies, such as revenue, earnings, comparable performance multiples, recent financial rounds and the level of marketability of the investments. The selection of comparable companies requires management judgment and is based on a number of factors, including comparable company sizes, growth rates, and development stages. The income approach includes the use of discounted cash flow model, which requires significant estimates regarding the investees’ revenue, costs, and discount rates based on the risk profile of comparable companies. Estimates of revenue and costs are developed using available historical and forecast data.
i) Useful lives of property, plant and equipment: The Company depreciates property, plant and equipment on a straight-line basis over estimated useful lives of the assets. The charge in respect of periodic depreciation is derived based on an estimate of an asset’s expected useful life and the expected residual value at the end of its life. The lives are based on historical experience with similar assets as well as anticipation of future events, which may impact their life, such as changes in technology. The estimated useful life is reviewed at least annually.
j) Useful lives of intangible assets: The Company amortises intangible assets on a straight-line basis over estimated useful lives of the assets. The useful life is estimated based on a number of factors including the effects of obsolescence, demand, competition and other economic factors such as the stability of the industry and known technological advances and the level of maintenance expenditures required to obtain the expected future cash flows from the assets. The estimated useful life is reviewed at least annually.
k) Leases: Ind AS 116 defines a lease term as the non-cancellable period for which the lessee has the right to use an underlying asset including optional periods, when an entity is reasonably
certain to exercise an option to extend (or not to terminate) a lease. The Company considers all relevant facts and circumstances that create an economic incentive for the lessee to exercise the option when determining the lease term. The option to extend lease is included in the lease term, if it is reasonably certain that the lessee would exercise the option. The Company reassesses the option upon occurrence of either a significant event or change in circumstances that are within the control of the lessee.
l) Provisions and contingent liabilities: The Company estimates the provisions that have present obligations as a result of past events, and it is probable that outflow of resources will be required to settle the obligations. These provisions are reviewed at the end of each reporting date and are adjusted to reflect the current best estimates.
The Company uses significant judgement to disclose contingent liabilities. Contingent liabilities are disclosed when there is a possible obligation arising from past events, the existence of which will be confirmed only by the occurrence or non-occurrence of one or more uncertain future events not wholly within the control of the Company or a present obligation that arises from past events where it is either not probable that an outflow of resources will be required to settle the obligation or a reliable estimate of the amount cannot be made. Contingent assets are neither recognised nor disclosed in the financial statements.
m) Other estimates: The share-based compensation expense is determined based on the Company’s estimate of equity instruments that will eventually vest. Fair valuation of derivative hedging instruments designated as cash flow hedges involves significant estimates relating to the occurrence of forecasted transactions.
n) Uncertainty relating to the global health pandemic on COVID-19: In assessing the recoverability of receivables including unbilled receivables, contract assets and contract costs, goodwill, intangible assets, and certain investments, the Company has considered internal and external information up to the date of approval of these consolidated financial statements including credit reports and economic forecasts. The Company has performed sensitivity analysis on the assumptions used herein. Based on the current indicators of future economic conditions, the Company expects to recover the carrying amount of these assets.

Notes to the Consolidated Financial Statements
Consolidated financial statements under Ind AS
236
The Company bases its assessment on the belief that the probability of the occurrence of forecasted transactions is not impacted by COVID-19. The Company has considered the effect of changes, if any, in both counterparty credit risk and its own credit risk while assessing hedge effectiveness and measuring hedge ineffectiveness and continues to believe that COVID-19 has no impact on effectiveness of its hedges.
The impact of COVID-19 remains uncertain and may be different from what we have estimated as of the date of approval of these consolidated financial statements and the Company will continue to closely monitor any material changes to future economic conditions.
3. Significant Accounting Policies
(i) Basis of consolidation
Subsidiaries and controlled trusts
The Company determines the basis of control in line with the requirements of Ind AS 110, Consolidated Financial Statements. Subsidiaries and controlled trusts are entities controlled by the Group. The Group controls an entity when the parent has power over the entity, it is exposed to, or has rights to, variable returns from its involvement with the entity and has the ability to affect those returns through its power over the entity. The financial statements of subsidiaries and controlled trusts are included in the consolidated financial statements from the date on which control commences until the date on which control ceases.
All intra-Group balances, transactions, income and expenses are eliminated in full on consolidation.
Non-controlling interest
Non-controlling interests in the net assets (excluding goodwill) of consolidated subsidiaries are identified separately from the Company’s equity. The interest of non-controlling shareholders may be initially measured either at fair value or at the non-controlling interest’s proportionate share of the fair value of the acquiree’s identifiable net assets. The choice of measurement basis is made on an acquisition to acquisition basis. Subsequent to acquisition, the carrying amount of non-controlling interest is the amount of those interests at initial recognition plus the non-controlling interest’s share of subsequent changes in equity. Total comprehensive income is attributed to non-controlling interests even if it results in the non-controlling interest having a deficit balance.
Investments accounted for using the equity method
Investments accounted for using the equity method are entities in respect of which, the Company has significant influence, but not control, over the financial and operating policies. Generally, a Company has a significant influence if it holds between 20 and 50 percent of the voting power of another entity. Investments in such entities are accounted for using the equity method and are initially recognised at cost. The carrying amount of investment is increased/ decreased to recognise investors share of profit or loss of the investee after the acquisition date.
Non-current assets and disposal groups held for sale
Assets and liabilities of disposal groups that are available for immediate sale and where the sale is highly probable of being completed within one year from the date of classification are considered and classified as assets held for sale and liabilities associated with assets held for sale. Non-current assets and disposal groups held for sale are measured at the lower of carrying amount and fair value less costs to sell.
(ii) Functional and presentation currency
Items included in the financial statements of each of the Company’s entities are measured using the currency of the primary economic environment in which these entities operate (i.e. the “functional currency”). These consolidated financial statements are presented in Indian rupees, which is the functional currency of the Parent Company.
(iii) Foreign currency transactions and translation
a) Transactions and balances
Transactions in foreign currency are translated into the respective functional currencies using the exchange rates prevailing at the date of the transaction. Foreign exchange gains and losses resulting from the settlement of such transactions and from translation at the exchange rates prevailing at the reporting date of monetary assets and liabilities denominated in foreign currencies are recognised in the consolidated statement of profit and loss and reported within foreign exchange gains/(losses), net, within results of operating activities except when deferred in other comprehensive income as qualifying cash flow hedges and qualifying net investment hedges. Gains/(losses), net, relating to translation or settlement of borrowings denominated in foreign currency are reported within finance costs. Non-monetary assets and liabilities denominated in

Notes to the Consolidated Financial Statements
Consolidated financial statements under Ind ASIntegrated Annual Report 2020-21
Wipro Limited
237
foreign currency and measured at historical cost are translated at the exchange rate prevalent at the date of transaction. Translation differences on non-monetary financial assets measured at fair value at the reporting date, such as equities classified as financial instruments measured at fair value through other comprehensive income are included in other comprehensive income, net of taxes.
b) Foreign operations
For the purpose of presenting consolidated financial statements, the assets and liabilities of the Company’s foreign operations that have a functional currency other than Indian rupees are translated into Indian rupees using exchange rates prevailing at the reporting date. Income and expense items are translated at the average exchange rates for the period. Exchange differences arising, if any, are recognised in other comprehensive income and held in foreign currency translation reserve (FCTR), a component of equity, except to the extent that the translation difference is allocated to non-controlling interest. When a foreign operation is disposed of, the relevant amount recognised in FCTR is transferred to the consolidated statement of profit and loss as part of the profit or loss on disposal. Goodwill and fair value adjustments arising on the acquisition of a foreign operation are treated as assets and liabilities of the foreign operation and translated at the exchange rate prevailing at the reporting date.
c) Others
Foreign currency differences arising on the translation or settlement of a financial liability designated as a hedge of a net investment in a foreign operation are recognised in other comprehensive income and presented within equity in the FCTR to the extent the hedge is effective. To the extent the hedge is ineffective, such differences are recognised in the consolidated statement of profit and loss.
When the hedged part of a net investment is disposed of, the relevant amount recognised in FCTR is transferred to the consolidated statement of profit and loss as part of the profit or loss on disposal. Foreign currency differences arising from translation of intercompany receivables or payables relating to foreign operations, the settlement of which is neither planned nor likely in the foreseeable future, are considered to form part of net investment in foreign operation and are recognised in FCTR.
(iv) Financial instruments
A) Non-derivative financial instruments:
Non-derivative financial instruments consist of:
• financial assets, which include cash and cash equivalents, trade receivables, unbilled receivables, finance lease receivables, employee and other advances, investments in equity and debt securities and eligible current and non-current assets; Financial assets are derecognised when substantial risks and rewards of ownership of the financial asset have been transferred. In cases where substantial risks and rewards of ownership of the financial assets are neither transferred nor retained, financial assets are derecognised only when the Company has not retained control over the financial asset.
• financial liabilities, which include long and short-term loans and borrowings, bank overdrafts, trade payables, lease liabilities and eligible current and non-current liabilities.
Non-derivative financial instruments are recognised initially at fair value. Subsequent to initial recognition, non-derivative financial instruments are measured as described below:
a. Cash and cash equivalents
The Company’s cash and cash equivalents consist of cash on hand and in banks and demand deposits with banks, which can be withdrawn at any time, without prior notice or penalty on the principal.
For the purposes of the statement of cash flows, cash and cash equivalents include cash on hand, in banks and demand deposits with banks, net of outstanding bank overdrafts that are repayable on demand and are considered part of the Company’s cash management system. In the consolidated balance sheet, bank overdrafts are presented under borrowings within current liabilities.
b. Investments
Financial instruments measured at amortised cost:
Debt instruments that meet the following criteria are measured at amortised cost (except for debt instruments that are designated at fair value through Profit or Loss (FVTPL) on initial recognition):

Notes to the Consolidated Financial Statements
Consolidated financial statements under Ind AS
238
• the asset is held within a business model whose objective is to hold assets in order to collect contractual cash flows; and
• the contractual terms of the instrument give rise on specified dates to cash flows that are solely payment of principal and interest on the principal amount outstanding.
Financial instruments measured at fair value through other comprehensive income (FVTOCI):
Debt instruments that meet the following criteria are measured at fair value through other comprehensive income (FVTOCI) (except for debt instruments that are designated at fair value through Profit or Loss (FVTPL) on initial recognition):
• the asset is held within a business model whose objective is achieved both by collecting contractual cash flows and selling the financial asset; and
• the contractual terms of the instrument give rise on specified dates to cash flows that are solely payment of principal and interest on the principal amount outstanding.
Interest income is recognised in the consolidated statement of profit and loss for FVTOCI debt instruments. Other changes in fair value of FVTOCI financial assets are recognised in other comprehensive income. When the investment is disposed of, the cumulative gain or loss previously accumulated in reserves is transferred to the consolidated statement of profit and loss.
Financial instruments measured at fair value through profit or loss (FVTPL):
Instruments that do not meet the amortised cost or FVTOCI criteria are measured at FVTPL. Financial assets at FVTPL are measured at fair value at the end of each reporting period, with any gains or losses arising on re-measurement recognised in consolidated statement of profit and loss. The gain or loss on disposal is recognised in the consolidated statement of profit and loss.
Interest income is recognised in the consolidated statement of profit and loss for FVTPL debt instruments. Dividend on
financial assets at FVTPL is recognised when the Group’s right to receive dividend is established.
Investments in equity instruments:
The Company carries certain equity instruments which are not held for trading. At initial recognition, the Company may make an irrevocable election to present subsequent changes in the fair value of an investment in an equity instrument in other comprehensive income (FVTOCI) or through statement of profit and loss (FVTPL). For investments designated to be classified as FVTOCI, movements in fair value of investments are recognised in other comprehensive income and the gain or loss is not transferred to consolidated statement of profit and loss on disposal of investments. For investments designated to be classified as FVTPL, both movements in fair value of investments and gain or loss on disposal of investments are recognised in the consolidated statement of profit and loss.
Dividends from these investments are recognised in the consolidated statement of profit and loss when the Company’s right to receive dividends is established.
c. Other financial assets:
Other financial assets are non-derivative financial assets with fixed or determinable payments that are not quoted in an active market. They are presented as current assets, except for those maturing later than 12 months after the reporting date which are presented as non-current assets. These are initially recognised at fair value and subsequently measured at amortised cost using the effective interest method, less any impairment losses. These comprise trade receivables, unbilled receivables, finance lease receivables, employee and other advances and eligible current and non-current assets.
d. Trade payables and other payables:
Trade payables and other payables are initially recognised at fair value, and subsequently carried at amortised cost using the effective interest method. For these financial instruments, the carrying amounts approximate fair value due to the short-term maturity of these instruments. Contingent

Notes to the Consolidated Financial Statements
Consolidated financial statements under Ind ASIntegrated Annual Report 2020-21
Wipro Limited
239
consideration recognised in the business combination is subsequently measured at fair value through profit or loss.
B) Derivative financial instruments
The Company is exposed to foreign currency fluctuations on foreign currency assets, liabilities, net investment in foreign operations and forecasted cash flows denominated in foreign currency.
The Company limits the effect of foreign exchange rate fluctuations by following established risk management policies including the use of derivatives. The Company enters into derivative financial instruments where the counterparty is primarily a bank.
Derivatives are recognised and measured at fair value. Attributable transaction costs are recognised in consolidated statement of profit and loss as cost.
Subsequent to initial recognition, derivative financial instruments are measured as described below:
a. Cash flow hedges
Changes in the fair value of the derivative hedging instruments designated as a cash flow hedge are recognised in other comprehensive income and held in cash flow hedging reserve, net of taxes, a component of equity, to the extent that the hedge is effective. To the extent that the hedge is ineffective, changes in fair value are recognised in the consolidated statement of profit and loss and reported within foreign exchange gains/(losses), net within results from operating activities. If the hedging instrument no longer meets the criteria for hedge accounting, then hedge accounting is discontinued prospectively. If the hedging instrument expires or is sold, terminated or exercised, the cumulative gain or loss on the hedging instrument recognised in cash flow hedging reserve till the period the hedge was effective remains in cash flow hedging reserve until the forecasted transaction occurs. The cumulative gain or loss previously recognised in the cash flow hedging reserve is transferred to the consolidated statement of profit and loss upon the occurrence of the related forecasted transaction. If the forecasted transaction is no longer expected to occur, such cumulative
balance is immediately recognised in the consolidated statement of profit and loss.
b. Hedges of net investment in foreign operations
The Company designates derivative financial instruments as hedges of net investments in foreign operations. The Company designates foreign currency denominated borrowing as a hedge of net investment in foreign operations. Changes in the fair value of the derivative hedging instruments and gains/losses on translation or settlement of foreign currency denominated borrowings designated as a hedge of net investment in foreign operations are recognised in other comprehensive income and presented within equity in the FCTR to the extent that the hedge is effective. To the extent that the hedge is ineffective, changes in fair value are recognised in the consolidated statement of profit and loss and reported within foreign exchange gains/(losses), net within results from operating activities.
c. Others
Changes in fair value of foreign currency derivative instruments neither designated as cash flow hedges nor hedges of net investment in foreign operations are recognised in the consolidated statement of profit and loss and reported within foreign exchange gains/(losses), net within results from operating activities. Changes in fair value and gains/(losses), net, on settlement of foreign currency derivative instruments relating to borrowings, which have not been designated as hedges are recorded in finance costs.
C) Derecognition of financial instruments
The Company derecognises a financial asset when the contractual rights to the cash flows from the financial asset expire or it transfers the financial asset and the transfer qualifies for derecognition under Ind AS 109. If the Company retains substantially all the risks and rewards of a transferred financial asset, the Company continues to recognise the financial asset and recognises a borrowing for the proceeds received. A financial liability (or a part of a financial liability) is derecognised from the group’s balance sheet when the obligation specified in the contract is discharged or cancelled or expires.

Notes to the Consolidated Financial Statements
Consolidated financial statements under Ind AS
240
(v) Equity and share capital
a) Share capital and Securities premium
The authorised share capital of the Company as at March 31, 2021 is `25,274 divided into 12,504,500,000 equity shares of `2 each, 25,000,000 preference shares of `10 each and 150,000 10% optionally convertible cumulative preference shares of `100 each. Par value of the equity shares is recorded as share capital and the amount received in excess of par value is classified as Securities premium.
Every holder of the equity shares, as reflected in the records of the Company as at the date of the shareholder meeting shall have one vote in respect of each share held for all matters submitted to vote in the shareholder meeting.
b) Shares held by controlled trust (Treasury shares)
The Company’s equity shares held by the controlled trust, which is consolidated as a part of the Group are classified as Treasury shares. The Company has 19,401,215 and 22,746,081treasury shares as at March 31, 2021 and 2020, respectively. Treasury shares are recorded at acquisition cost.
c) Retained earnings
Retained earnings comprises of the Company’s undistributed earnings after taxes.
d) Capital Reserve
Capital Reserve amounting to ` 1,139 (March 31, 2020: 1,139) is not freely available for distribution.
e) Capital Redemption Reserve
As per the Companies Act, 2013, Capital redemption reserve is created when a company purchases its own shares out of free reserves or securities premium. A sum equal to the nominal value of the shares so purchased is transferred to capital redemption reserve. The reserve can be utilised in accordance with the provisions of section 69 of the Companies Act, 2013. Capital redemption reserve amounting to ` 1,135 (March 31, 2020: `660) is not freely available for distribution.
f) Share options outstanding account
The Share options outstanding account is used to record the value of equity-settled share-based payment transactions with employees. The amounts recorded in share options outstanding account are transferred to securities premium
upon exercise of stock options and restricted stock unit options by employees.
g) Foreign currency translation reserve (FCTR)
The exchange differences arising from the translation of financial statements of foreign subsidiaries, differences arising from translation of long-term inter-company receivables or payables relating to foreign operations, settlement of which is neither planned nor likely in the foreseeable future, changes in fair value of the derivative hedging instruments and gains/losses on translation or settlement of foreign currency denominated borrowings designated as hedge of net investment in foreign operations are recognised in other comprehensive income, net of taxes and presented within equity in the FCTR.
h) Cash flow hedging reserve
Changes in fair value of derivative hedging instruments designated and effective as a cash flow hedge are recognised in other comprehensive income, net of taxes, and presented within equity as cash flow hedging reserve.
i) Special Economic Zone re-investment reserve
The SEZ Re-Investment Reserve has been created out of profit of eligible SEZ units as per provisions of section 10AA(1)(ii) of the Income–tax Act, 1961 for acquiring new plant and machinery. The said reserve should be utilised by the Company for acquiring plant and machinery as per the terms of Section 10AA(2) of the Income-tax Act, 1961. This reserve is not freely available for distribution.
j) Other reserves
Changes in the fair value of financial instruments measured at fair value through other comprehensive income and actuarial gains and losses on remeasurements of the defined benefit plans are recognised in other comprehensive income, net of taxes and presented within equity in other reserves.
k) Dividend
A final dividend, including tax thereon, on equity shares is recorded as a liability on the date of approval by the shareholders. An interim dividend, including tax thereon, is recorded as a liability on the date of declaration by the board of directors.

Notes to the Consolidated Financial Statements
Consolidated financial statements under Ind ASIntegrated Annual Report 2020-21
Wipro Limited
241
l) Buyback of equity shares
The buyback of equity shares and related transaction costs are recorded as a reduction of free reserves. Further, capital redemption reserve is created as an apportionment from retained earnings.
m) Bonus issue
For the purpose of bonus issue, the amount is transferred from capital redemption reserves, securities premium and retained earnings to the share capital.
(vi) Property, plant and equipment
a) Recognition and measurement
Property, plant and equipment are measured at cost less accumulated depreciation and impairment losses, if any. Cost includes expenditures directly attributable to the acquisition of the asset. General and specific borrowing costs directly attributable to the construction of a qualifying asset are capitalised as part of the cost.
Capital work-in-progress are measured at cost less accumulated impairment losses, if any.
b) Depreciation
The Company depreciates property, plant and equipment over the estimated useful life on a straight-line basis from the date the assets are available for use. Leasehold improvements are amortised over the shorter of estimated useful life of the asset or the related lease term. Term licenses are amortised over their respective contract term. Freehold land is not depreciated. The estimated useful life of assets is reviewed and where appropriate are adjusted, annually. The estimated useful lives of assets are as follows:
Category Useful life
Buildings 28 to 40 years
Plant and equipment 5 to 21 years
Computer equipment and software 2 to 7 years
Furniture, fixtures and equipment 3 to 10 years
Vehicles 4 to 5 years
When parts of an item of property, plant and equipment have different useful lives, they are accounted for as separate items (major components) of property, plant and equipment. Subsequent expenditure relating to
property, plant and equipment is capitalised only when it is probable that future economic benefits associated with these will flow to the Company and the cost of the item can be measured reliably.
The cost of property, plant and equipment not available for use before such date are disclosed under capital work-in-progress.
(vii) Business combinations, Goodwill and Intangible assets
a) Business combinations
Business combinations are accounted for using the purchase (acquisition) method. The cost of an acquisition is measured as the fair value of the assets transferred, liabilities incurred or assumed, and equity instruments issued at the date of exchange by the Company. Identifiable assets acquired and liabilities and contingent liabilities assumed in a business combination are measured initially at fair value at the date of acquisition. Transaction costs incurred in connection with a business acquisition are expensed as incurred.
The cost of an acquisition also includes the fair value of any contingent consideration measured as at the date of acquisition. Any subsequent changes to the fair value of contingent consideration classified as liabilities, other than measurement period adjustments, are recognised in the consolidated statement of profit and loss.
b) Goodwill
The excess of the cost of an acquisition over the Company’s share in the fair value of the acquiree’s identifiable assets and liabilities is recognised as goodwill. If the excess is negative, a bargain purchase gain is recognised in equity as capital reserve. Goodwill is measured at cost less accumulated impairment (if any).
Goodwill associated with disposal of an operation that is part of cash-generating unit is measured based on the relative values of the operation disposed of and the portion of the cash-generating unit retained, unless some other method better reflects the goodwill associated with the operation disposed of.
c) Intangible assets
Intangible assets acquired separately are measured at cost of acquisition. Intangible assets acquired in a business combination are measured at fair value as at the date of acquisition. Following

Notes to the Consolidated Financial Statements
Consolidated financial statements under Ind AS
242
initial recognition, intangible assets are carried at cost less accumulated amortisation and impairment losses, if any.
The amortisation of an intangible asset with a finite useful life reflects the manner in which the economic benefit is expected to be generated.
The estimated useful life of amortisable intangibles is reviewed and where appropriate is adjusted, annually. The estimated useful lives of the amortisable intangible assets for the current and comparative periods are as follows:
Category Useful lifeCustomer-related intangibles 0.75 to 15 years
Marketing-related intangibles 3 to 10 years
(viii) Leases
On April 1, 2019, the Company adopted Ind AS 116 “Leases”, which applied to all lease contracts outstanding as at April 1, 2019, using modified retrospective method by recording the cumulative effect of initial application as an adjustment to opening retained earnings.
The Company has made use of the following practical expedients available in its transition to Ind AS 116: -
a) The Company will not reassess whether a contract is or contains a lease. Accordingly, the definition of lease in accordance with Ind AS 17 will continue to be applied to lease contracts entered by the Company or modified by the Company before April 1, 2019,
b) The Company has applied a single discount rate to a portfolio of leases of similar assets in similar economic environment. Consequently, the Company has recorded its lease liability using the present value of remaining lease payments, discounted using the incremental borrowing rate at the date of initial application and the Right-of-Use(“RoU”) asset at its carrying amount as if the standard had been applied since the commencement date of the lease, but discounted using the incremental borrowing rate at the date of initial application,
c) The Company excluded the initial direct costs from measurement of the RoU asset,
d) The Company does not recognize RoU assets and lease liabilities for leases with less than twelve months of lease term and low-value assets on the date of initial application.
The weighted average of discount rates applied to lease liabilities as at April 1, 2019 is 5.7%.
On adoption of Ind AS 116,
a) the Company has recognised RoU assets of ` 13,630 and corresponding lease liability of `15,379,
b) the net carrying value of assets procured under the finance lease of ` 1,243 (gross carrying value and accumulated depreciation of ` 3,420 and ` 2,177, respectively) have been reclassified from property, plant and equipment to RoU assets,
c) the obligations under finance leases of ` 2,002 (non-current and current obligation under finance leases ` 496 and ` 1,506, respectively) have been reclassified to lease liabilities,
d) prepaid rent on leasehold land and other assets, which were earlier classified under “Other Assets” have been reclassified to RoU assets by ` 2,222.
The adoption of the new standard has resulted in a reduction of ` 872 in retained earnings, net of deferred tax asset of ` 138.
The Company evaluates each contract or arrangement, whether it qualifies as lease as defined under Ind AS 116.
The Company as a lessee
The Company enters into an arrangement for lease of land, buildings, plant and equipment including computer equipment and vehicles. Such arrangements are generally for a fixed period but may have extension or termination options. The Company assesses, whether the contract is, or contains, a lease, at its inception. A contract is, or contains, a lease if the contract conveys the right to –
(a) control use of an identified asset,
(b) obtain substantially all the economic benefits from use of the identified asset, and
(c) direct the use of the identified asset.
The Company determines the lease term as the non-cancellable period of a lease, together with periods covered by an option to extend the lease, where the Company is reasonably certain to exercise that option.
The Company at the commencement of the lease contract recognises a RoU asset at cost and corresponding lease liability, except for leases with term of less than twelve months (short-term leases) and low-value assets. For these short-term and low-value leases, the Company

Notes to the Consolidated Financial Statements
Consolidated financial statements under Ind ASIntegrated Annual Report 2020-21
Wipro Limited
243
recognises the lease payments as an operating expense on a straight-line basis over the lease term.
The cost of the RoU assets comprises the amount of the initial measurement of the lease liability, any lease payments made at or before the inception date of the lease plus any initial direct costs, less any lease incentives received. Subsequently, the RoU assets are measured at cost less any accumulated depreciation and accumulated impairment losses, if any. The RoU assets are depreciated using the straight-line method from the commencement date over the shorter of lease term or useful life of RoU assets. The estimated useful lives of RoU assets are determined on the same basis as those of property, plant and equipment.
The Company applies Ind AS 36 to determine whether a RoU asset is impaired and accounts for any identified impairment loss as described in the impairment of non-financial assets below.
For lease liabilities at the commencement of the lease, the Company measures the lease liability at the present value of the lease payments that are not paid at that date. The lease payments are discounted using the interest rate implicit in the lease, if that rate is readily determined, if that rate is not readily determined, the lease payments are discounted using the incremental borrowing rate that the Company would have to pay to borrow funds, including the consideration of factors such as the nature of the asset and location, collateral, market terms and conditions, as applicable in a similar economic environment.
After the commencement date, the amount of lease liabilities is increased to reflect the accretion of interest and reduced for the lease payments made.
The Company recognises the amount of the re-measurement of lease liability as an adjustment to the RoU assets. Where the carrying amount of the RoU asset is reduced to zero and there is a further reduction in the measurement of the lease liability, the Company recognises any remaining amount of the re-measurement in consolidated statement of profit and loss.
Lease liability payments are classified as cash used in financing activities in the consolidated statement of cash flows.
The Company as a lessor
Leases under which the Company is a lessor are classified as a finance or operating lease. Lease contracts where all the risks and rewards are substantially transferred to the lessee, are classified as a finance lease. All other leases are classified as operating lease.
For leases under which the Company is an intermediate lessor, the Company accounts for the head-lease and the sub-lease as two separate contracts. The sub-lease is further classified either as a finance lease or an operating lease by reference to the RoU asset arising from the head-lease.
(ix) Inventories
Inventories are valued at lower of cost and net realisable value, including necessary provision for obsolescence. Cost is determined using the weighted average method.
(x) Impairment
a) Financial assets
The Company applies the expected credit loss model for recognizing impairment loss on financial assets measured at amortised cost, debt instruments classified as FVTOCI, trade receivables, unbilled receivables, contract assets, finance lease receivables, and other financial assets. Expected credit loss is the difference between the contractual cash flows and the cash flows that the entity expects to receive, discounted using the effective interest rate.
Loss allowances for trade receivables, unbilled receivables, contract assets and finance lease receivables are measured at an amount equal to lifetime expected credit loss. Lifetime expected credit losses are the expected credit losses that result from all possible default events over the expected life of a financial instrument. Lifetime expected credit loss is computed based on a provision matrix which takes in to account, risk profiling of customers and historical credit loss experience adjusted for forward looking information. For other financial assets, expected credit loss is measured at the amount equal to twelve months expected credit loss unless there has been a significant increase in credit risk from initial recognition, in which case those are measured at lifetime expected credit loss.
b) Non-financial assets
The Company assesses long-lived assets such as property, plant and equipment, RoU assets and acquired intangible assets for impairment whenever events or changes in circumstances indicate that the carrying amount of an asset or group of assets may not be recoverable. If any such indication exists, the Company estimates the recoverable amount of the asset or group of assets.

Notes to the Consolidated Financial Statements
Consolidated financial statements under Ind AS
244
Goodwill is tested for impairment at least annually at the same time and when events occur or changes in circumstances indicate that the recoverable amount of the cash generating unit is less than its carrying value. The goodwill impairment test is performed at the level of cash-generating unit or groups of cash -generating units which represents the lowest level at which goodwill is monitored for internal management purposes.
The recoverable amount of an asset or cash generating unit is the higher of its fair value less cost of disposal (“FVLCD”) and its value-in-use (“VIU”). The VIU of long-lived assets is calculated using projected future cash flows. FVLCD of a cash generating unit is computed using turnover and earnings multiples. If the recoverable amount of the asset or the recoverable amount of the cash generating unit to which the asset belongs is less than its carrying amount, the carrying amount is reduced to its recoverable amount. The reduction is treated as an impairment loss and is recognised in the consolidated statement of profit and loss. If at the reporting date, there is an indication that a previously assessed impairment loss no longer exists, the recoverable amount is reassessed and the impairment losses previously recognised are reversed such that the asset is recognised at its recoverable amount but not exceeding written down value which would have been reported if the impairment losses had not been recognised initially. An impairment in respect of goodwill is not reversed.
(xi) Employee benefits
Post-employment and pension plans
The Group participates in various employee benefit plans. Pensions and other post-employment benefits are classified as either defined contribution plans or defined benefit plans. Under a defined contribution plan, the Company’s only obligation is to pay a fixed amount with no obligation to pay further contributions if the fund does not hold sufficient assets to pay all employee benefits. The related actuarial and investment risks are borne by the employee. The expenditure for defined contribution plans is recognised as an expense during the period when the employee provides service. Under a defined benefit plan, it is the Company’s obligation to provide agreed benefits to the employees. The related actuarial and investment risks are borne by the Company. The present value of the defined benefit obligations is calculated by an independent actuary using the projected unit credit method.
Remeasurements of the defined benefit plans, comprising actuarial gains or losses,and the return on plan assets (excluding interest) are immediately recognised in other comprehensive income, net of taxes and not reclassified to profit or loss in subsequent period.
Net interest recognised in profit or loss is calculated by applying the discount rate used to measure the defined benefit obligation to the net defined benefit liability or asset. The actual return on the plan assets above or below the discount rate, is recognised as part of remeasurements of the defined benefit plans through other comprehensive income, net of taxes.
The Company has the following employee benefit plans:
a. Provident fund
Employees receive benefits from a provident fund, which is a defined benefit plan. The employer and employees each make periodic contributions to the plan. A portion of the contribution is made to the approved provident fund trust managed by the Company while the remainder of the contribution is made to the government administered pension fund. The contributions to the trust managed by the Company is accounted for as a defined benefit plan as the Company is liable for any shortfall in the fund assets based on the government specified minimum rates of return.
b. Superannuation
Superannuation plan, a defined contribution scheme is administered by third party fund managers. The Company makes annual contributions based on a specified percentage of each eligible employee’s salary.
c. Gratuity and Pension
In accordance with the Payment of Gratuity Act, 1972, applicable for Indian companies, the Company provides for a lump sum payment to eligible employees, at retirement or termination of employment based on the last drawn salary and years of employment with the Company. The gratuity fund is managed by third party fund managers.
The Company also maintains pension and similar plans for employees outside India, based on country specific regulations. These plans are partially funded, and the funds are managed by third party fund managers. The plans provide for monthly payout after retirement as per salary drawn and service period or for a lumpsum payment as set out in rules of each fund.

Notes to the Consolidated Financial Statements
Consolidated financial statements under Ind ASIntegrated Annual Report 2020-21
Wipro Limited
245
The Company’s obligations in respect of the above plans, which are defined benefit plans, are provided for based on actuarial valuation using the projected unit credit method. The Company recognises remeasurement gains and losses of the net defined benefit liability/(asset) in other comprehensive income, net of taxes.
d. Termination benefits
Termination benefits are expensed when the Company can no longer withdraw the offer of those benefits.
e. Short-term benefits
Short-term employee benefit obligations are measured on an undiscounted basis and are recorded as expense as the related service is provided. A liability is recognised for the amount expected to be paid under short-term cash bonus or profit-sharing plans, if the Company has a present legal or constructive obligation to pay this amount as a result of past service provided by the employee and the obligation can be estimated reliably.
f. Compensated absences
The employees of the Company are entitled to compensated absences. The employees can carry forward a portion of the unutilised accumulating compensated absences and utilise it in future periods or receive cash at retirement or termination of employment. The Company records an obligation for compensated absences in the period in which the employee renders the services that increases this entitlement. The Company measures the expected cost of compensated absences as the additional amount that the Company expects to pay as a result of the unused entitlement that has accumulated at the end of the reporting period. The Company recognises accumulated compensated absences based on actuarial valuation using the projected unit credit method. Non-accumulating compensated absences are recognised in the period in which the absences occur.
(xii) Share-based payment transactions
Selected employees of the Company receive remuneration in the form of equity settled instruments or cash settled instruments, for rendering services over a defined vesting period and for Company’s performance-based stock options over the defined period. Equity instruments granted are measured by reference to the fair value of the instrument at the date of grant. In cases, where equity instruments are granted
at a nominal exercise price, the intrinsic value on the date of grant approximates the fair value. The expense is recognised in the consolidated statement of profit and loss with a corresponding increase to the share options outstanding account, a component of equity.
The equity instruments or cash settled instruments generally vest in a graded manner over the vesting period. The fair value determined at the grant date is expensed over the vesting period of the respective tranches of such grants (accelerated amortisation). The stock compensation expense is determined based on the Company’s estimate of equity instruments or cash settled instruments that will eventually vest.
Cash Settled instruments granted are re-measured by reference to the fair value at the end of each reporting period and at the time of vesting. The expense is recognised in the consolidated statement of profit and loss with a corresponding increase to financial liability.
(xiii) Provisions
Provisions are recognised when the Company has a present obligation (legal or constructive), as a result of a past event, it is probable that an outflow of economic benefits will be required to settle the obligation and a reliable estimate can be made of the amount of the obligation.
The amount recognised as a provision is the best estimate of the consideration required to settle the present obligation at the end of the reporting period, considering the risks and uncertainties surrounding the obligation.
When some or all of the economic benefits required to settle a provision are expected to be recovered from a third party, the receivable is recognised as an asset, if it is virtually certain that reimbursement will be received and the amount of the receivable can be measured reliably.
Provisions for onerous contracts are recognised when the expected benefits to be derived by the Company from a contract are lower than the unavoidable costs of meeting the future obligations under the contract. Provisions for onerous contracts are measured at the present value of lower of the expected net cost of fulfilling the contract and the expected cost of terminating the contract.
(xiv) Revenue
The Company derives revenue primarily from software development, maintenance of software/hardware and related services, business process services, sale of IT and other products.

Notes to the Consolidated Financial Statements
Consolidated financial statements under Ind AS
246
Revenues from customer contracts are considered for recognition and measurement when the contract has been approved by the parties to the contract, the parties to contract are committed to perform their respective obligations under the contract, and the contract is legally enforceable. Revenue is recognised upon transfer of control of promised products or services to customers in an amount that reflects the consideration the Company expects to receive in exchange for those products or services. To recognise revenues, the Company applies the following five step approach: (1) identify the contract with a customer, (2) identify the performance obligations in the contract, (3) determine the transaction price, (4) allocate the transaction price to the performance obligations in the contract, and (5) recognise revenues when a performance obligation is satisfied. When there is uncertainty as to collectability, revenue recognition is postponed until such uncertainty is resolved.
At contract inception, the Company assesses its promise to transfer products or services to a customer to identify separate performance obligations. The Company applies judgement to determine whether each product or service promised to a customer is capable of being distinct, and is distinct in the context of the contract, if not, the promised product or service is combined and accounted as a single performance obligation. The Company allocates the arrangement consideration to separately identifiable performance obligation based on their relative stand-alone selling price or residual method. Stand-alone selling prices are determined based on sale prices for the components when it is regularly sold separately, in cases where the Company is unable to determine the stand-alone selling price the Company uses third-party prices for similar deliverables or the Company uses expected cost-plus margin approach in estimating the stand-alone selling price.
For performance obligations where control is transferred over time, revenues are recognised by measuring progress towards completion of the performance obligation. The selection of the method to measure progress towards completion requires judgment and is based on the nature of the promised products or services to be provided.
The method for recognizing revenues and costs depends on the nature of the services rendered:
A. Time and materials contracts Revenues and costs relating to time and material
contractsare recognised as the related services are rendered.
B. Fixed-price contracts
i. Fixed-price development contracts
Revenues from fixed-price development contracts, including software development, and integration contracts, where the performance obligations are satisfied over time, are recognised using the “percentage-of-completion” method. The performance obligations are satisfied as and when the services are rendered since the customer generally obtains control of the work as it progresses. Percentage of completion is determined based on project costs incurred to date as a percentage of total estimated project costs required to complete the project. The cost expended (or input) method has been used to measure progress towards completion as there is a direct relationship between input and productivity. If the Company is not able to reasonably measure the progress of completion, revenue is recognised only to the extent of costs incurred for which recoverability is probable. When total cost estimates exceed revenues in an arrangement, the estimated losses are recognised in the consolidated statement of profit and loss in the period in which such losses become probable based on the current contract estimates as an onerous contract provision.
A contract asset is a right to consideration that is conditional upon factors other than the passage of time. Contract assets primarily relate to unbilled amounts on fixed-price development contracts and are classified as non-financial asset as the contractual right to consideration is dependent on completion of contractual milestones.
A contract liability is an entity’s obligation to transfer goods or services to a customer for which the entity has received consideration (or the amount is due) from the customer.
Unbilled receivables on other than fixed-price development contracts are classified as a financial asset where the right to consideration is unconditional and only the passage of time is required before the payment is due.

Notes to the Consolidated Financial Statements
Consolidated financial statements under Ind ASIntegrated Annual Report 2020-21
Wipro Limited
247
ii. Maintenance contracts
Revenues related to fixed-price maintenance contracts are recognised on a straight-line basis when services are performed through an indefinite number of repetitive acts over a specified period or ratably using percentage of completion method when the pattern of benefits from the services rendered to the customers and the cost to fulfil the contract is not even through the period of contract because the services are generally discrete in nature and not repetitive.
Revenue for contracts in which the invoicing is representative of the value being delivered is recognised based on our right to invoice. If our invoicing is not consistent with value delivered, revenues are recognised as the service is performed using the percentage of completion method.
In certain projects, a fixed quantum of service or output units is agreed at a fixed price for a fixed term. In such contracts, revenue is recognised with respect to the actual output achieved till date as a percentage of total contractual output. Any residual service unutilised by the customer is recognised as revenue on completion of the term.
iii. Element or Volume based contracts
Revenues and costs are recognised as the related services are rendered.
C. Products
Revenue on product sales are recognised when the customer obtains control of the specified product.
D. Others
• Any change in scope or price is considered as a contract modification. The Company accounts for modifications to existing contracts by assessing whether the services added are distinct and whether the pricing is at the stand-alone selling price. Services added that are not distinct are accounted for on a cumulative catch up basis, while those that are distinct are accounted for prospectively, either as a separate contract if the additional services are priced at the stand-alone selling price, or as a termination of the existing contract and creation of a new contract if not priced at the stand-alone selling price.
• The Company accounts for variable considerations like, volume discounts, rebates and pricing incentives to customers and penalties as reduction of revenue on a systematic and rational basis over the period of the contract. The Company estimates an amount of such variable consideration using expected value method or the single most likely amount in a range of possible consideration depending on which method better predicts the amount of consideration to which the Company may be entitled and when it is probable that a significant reversal of cumulative revenue recognised will not occur when the uncertainty associated with the variable consideration is resolved.
• Revenues are shown net of allowances/ returns, sales tax, value added tax, goods and services tax and applicable discounts and allowances.
• The Company accrues the estimated cost of warranties at the time when the revenue is recognised. The accruals are based on the Company’s historical experience of material usage and service delivery costs.
• Incremental costs that relate directly to a contract and incurred in securing a contract with a customer are recognised as an asset when the Company expects to recover these costs and amortised over the contract term.
• The Company recognises contract fulfilment cost as an asset if those costs specifically relate to a contract or to an anticipated contract, the costs generate or enhance resources that will be used in satisfying performance obligations in future; and the costs are expected to be recovered. The asset so recognised is amortised on a systematic basis consistent with the transfer of goods or services to customer to which the asset relates.
• The Company assesses the timing of the transfer of goods or services to the customer as compared to the timing of payments to determine whether a significant financing component exists. As a practical expedient, the Company does not assess the existence of a significant financing component when the difference between payment and transfer of deliverables is a year or less. If the difference in timing arises for reasons other than the provision of finance to either the customer

Notes to the Consolidated Financial Statements
Consolidated financial statements under Ind AS
248
or us, no financing component is deemed to exist.
• The Company may enter into arrangements with third party suppliers to resell products or services. In such cases, the Company evaluates whether the Company is the principal (i.e. report revenues on a gross basis) or agent (i.e. report revenues on a net basis). In doing so, the Company first evaluates whether the Company controls the good or service before it is transferred to the customer. If Company controls the good or service before it is transferred to the customer, Company is the principal; if not, the Company is the agent.
• Estimates of transaction price and total costs or efforts are continuously monitored over the term of the contract and are recognised in net profit in the period when these estimates change or when the estimates are revised. Revenues and the estimated total costs or efforts are subject to revision as the contract progresses.
(xv) Finance costs
Finance costs comprises interest cost on borrowings, lease liabilities and net defined benefit liability, gains or losses arising on re-measurement of financial assets measured at FVTPL, gains/(losses) on translation or settlement of foreign currency borrowings and changes in fair value and gains/ (losses) on settlement of related derivative instruments. Borrowing costs that are not directly attributable to a qualifying asset are recognised in the consolidated statement of profit and loss using the effective interest method.
(xvi) Finance and other income
Finance and other income comprises interest income on deposits, dividend income and gains/(losses) on disposal of investments. Interest income is recognised using the effective interest method. Dividend income is recognised when the right to receive payment is established.
(xvii) Income tax
Income tax comprises current and deferred tax. Income tax expense is recognised in the consolidated statement of profit and loss except to the extent it relates to a business combination, or items directly recognised in equity or in other comprehensive income.
a) Current income tax
Current income tax for the current and prior periods are measured at the amount expected to be recovered from or paid to the taxation authorities based on the taxable income for the period. The tax rates and tax laws used to compute the current tax amounts are those that are enacted or substantively enacted as at the reporting date and applicable for the period. While determining the tax provisions, the Company assesses whether each uncertain tax position is to be considered separately or together with one or more uncertain tax positions depending upon the nature and circumstances of each uncertain tax position. The Company offsets current tax assets and current tax liabilities, where it has a legally enforceable right to set off the recognised amounts and where it intends either to settle on a net basis, or to realize the asset and liability simultaneously.
b) Deferred income tax
Deferred income tax is recognised using the balance sheet approach. Deferred income tax assets and liabilities are recognised for deductible and taxable temporary differences arising between the tax base of assets and liabilities and their carrying amount in these consolidated financial statements, except when the deferred income tax arises from the initial recognition of goodwill or an asset or liability in a transaction that is not a business combination and affects neither accounting nor taxable profits or loss at the time of the transaction.
Deferred income tax assets are recognised to the extent it is probable that taxable profit will be available against which the deductible temporary differences and the carry forward of unused tax credits and unused tax losses can be utilised.
Deferred income tax liabilities are recognised for all taxable temporary differences except in respect of taxable temporary differences that is expected to reverse within the tax holiday period, taxable temporary differences associated with investments in subsidiaries, associates and foreign branches where the timing of the reversal of the temporary difference can be controlled and it is probable that the temporary difference will not reverse in the foreseeable future.

Notes to the Consolidated Financial Statements
Consolidated financial statements under Ind ASIntegrated Annual Report 2020-21
Wipro Limited
249
The carrying amount of deferred income tax assets is reviewed at each reporting date and reduced to the extent that it is no longer probable that sufficient taxable profit will be available to allow all or part of the deferred income tax asset to be utilised.
Deferred income tax assets and liabilities are measured at the tax rates that are expected to apply in the period when the asset is realised or the liability is settled, based on tax rates (and tax laws) that have been enacted or substantively enacted at the reporting date.
The Company offsets deferred income tax assets and liabilities, where it has a legally enforceable right to offset current tax assets against current tax liabilities, and they relate to taxes levied by the same taxation authority on either the same taxable entity, or on different taxable entities where there is a right and an intention to settle the current tax liabilities and assets on anet basis or their tax assets and liabilities will be realised simultaneously.
(xviii) Earnings per share
Basic earnings per share is computed using the weighted average number of equity shares outstanding during the period adjusted for treasury shares held. Diluted earnings per share is computed using the weighted average number of equity and dilutive equivalent shares outstanding during the period, using the treasury stock method for options, except where the results would be anti-dilutive.
The number of equity shares and potentially dilutive equity shares are adjusted retrospectively for all periods presented for any splits and bonus shares issues including for change effected prior to the approval of the consolidated financial statements by the Board of Directors.
(xix) Statement of cash flows
Cash flows are reported using the indirect method, whereby profit for the period is adjusted for the effects of transactions of a non-cash nature, any deferrals or accruals of past or future operating cash receipts or payments and item of income or expenses associated with investing or financing cash flows. The cash from operating, investing and financing activities of the Company are segregated.
(xx) Assets held for sale
Sale of business is classified as held for sale, if their
carrying amount is intended to be recovered principally through sale rather than through continuing use. The condition for classification as held for sale is met when disposal business is available for immediate sale and the same is highly probable of being completed within one year from the date of classification as held for sale.
(xxi) Discontinued operations
A discontinued operation is a component of the Company’s business that represents a separate line of business that has been disposed of or is held for sale, or is a subsidiary acquired exclusively with a view to resale. Classification as a discontinued operation occurs upon the earlier of disposal or when the operation meets the criteria to be classified as held for sale.
(xxii) Disposal of assets
The gain or loss arising on disposal or retirement of assets is recognised in the consolidated statement of profit and loss.
New Accounting standards, amendments and interpretations adopted by the Company effective from April 1, 2020:
Amendment to Ind AS 103- Business combinations
The Ministry of Corporate Affairs (“MCA”) has issued amendments to Ind AS 103, ‘Business Combinations’, in connection with clarification of business definition, which help in determining whether an acquisition made is of a business or a group of assets. The amendment added a test that makes it easier to conclude that a Company has acquired a group of assets, rather than a business, if the value of the assets acquired is substantially all concentrated in a single asset or group of similar assets. The adoption of amendment to Ind AS 103 is applicable to new acquisition on a prospective basis and did not have any impact on the consolidated financial statements of the Company.
Amendment to Ind AS 109 and Ind AS 107 – Interest Rate Benchmark Reform
The MCA amended some of its requirements for hedge accounting. The amendments provide relief from potential effects of the uncertainty caused by the IBOR reform. In addition, the amendments require companies to provide additional information to investors about their hedging relationships that are directly affected by these uncertainties. The adoption of amendment to Ind AS 109 and Ind AS 107 did not have any significant material impact on the consolidated financial statements of the Company.

Notes to the Consolidated Financial Statements
Consolidated financial statements under Ind AS
250
Amendment to Ind AS 1 and Ind AS 8 – Definition of Material
The MCA issued Amendment to Ind AS 1 ‘Presentation of Financial Statements’ and Ind AS 8 ‘Accounting Policies, Changes in Accounting Estimates and Errors’ to update a new definition of material in Ind AS 1. The amendments clarify the definition of “material” and how it should be applied by including in the definition guidance that until now has featured elsewhere in Ind AS Standards. The new definition clarifies that, information is considered material if omitting, misstating, or obscuring such information, could reasonably be expected to influence the decisions that the primary users of general-purpose financial statements make based on those financial statements. The definition of material in Ind AS 8 has been replaced by a reference to the definition of material in Ind AS 1. In addition, the MCA amended other Standards that contain a definition of material or refer to the term ‘material’ to ensure consistency. The adoption of the amendment to Ind AS 1 and Ind AS 8 did not have any material impact on its evaluation of materiality in relation to the consolidated financial statements.
Amendment to Ind AS 116 – Leases
The MCA issued amendments to Ind AS 116, ‘Leases’, provide lessees with an exemption from assessing whether a COVID-19-related rent concession is a lease modification. The amendments allowed the expedient to be applied to COVID-19-related rent concessions to payments originally due on or before June 30, 2021 and also require disclosure of the amount recognised in profit or loss to reflect changes in lease payments that arise from COVID-19-related rent concessions. The reporting period in which a lessee first applies the amendment, it is not required to disclose certain quantitative information required under Ind AS 8. Accordingly, the Company recognised ` 61 as reversal of lease liability in the consolidated statement of profit and loss for the year ended March 31, 2021 respectively.
New Accounting standards not yet adopted by the Company:
MCA notifies new standard or amendments to the existing standards. There is no such notification which would have been applicable from April 1, 2021.
New Amendments not yet adopted by the Company
On March 24, 2021, MCA through a notification, amended Schedule III of the Companies Act, 2013.
Key amendments relating to Division II which relate to companies whose financial statements are required to comply with Companies (Indian Accounting Standards) Rules 2015 are:
• Lease liabilities should be separately disclosed under the head ‘financial liabilities’, duly distinguished as current or non-current.
• Current maturities of long-term borrowings should be disclosed separately within borrowings instead of earlier disclosure requirement under Other Financial Liabilities.
• Certain additional disclosures in the statement of changes in equity due to prior period errors and restated balances at the beginning of the current reporting period.
• Specified format for disclosure of shareholding of promoters.
• Specified format for ageing schedule of trade receivables, trade payables, capital work-in-progress and intangible asset under development.
• Additional disclosures relating to Corporate Social Responsibility, undisclosed income and crypto or virtual currency.
• Disclosure of specified ratios along with explanation for items included in numerator and denominator and explanation for change in any ratio is excess of 25% compared to preceding year.
• If a company has not used funds for the specific purpose for which it was borrowed from banks and financial institutions, then disclosure of details of where it has been used.
• Specific disclosure under ‘additional regulatory requirement’ such as compliance with approved schemes of arrangements, compliance with number of layers of companies, title deeds of immovable property not held in name of company, loans and advances to promoters, directors, key managerial personnel and related parties and details of benami property held.
These amendments are applicable from April 1, 2021. The Company is currently evaluating the impact of these amendment on the consolidated financial statements.

4. Property, Plant and Equipment
Land BuildingsPlant and
equipment *
Furniture and
fixtures
Office equipment
Vehicles Total
Gross carrying value:
As at April 1, 2020 ` 3,761 ` 36,314 ` 100,615 ` 12,901 ` 6,872 ` 808 ` 161,271
Translation adjustment 5 100 303 5 20 (1) 432
Additions 107 3,569 14,362 1,615 343 9 20,005
Additions through business combinations - - 27 55 2 - 84
Disposals (58) (765) (4,532) (844) (374) (398) (6,971)
As at March 31, 2021 ` 3,815 ` 39,218 ` 110,775 ` 13,732 ` 6,863 ` 418 ` 174,821
Accumulated depreciation/ impairment:
As at April 1, 2020 ` - ` 7,888 ` 77,993 ` 9,117 ` 4,929 ` 727 ` 100,654
Translation adjustment - 32 172 (1) 12 - 215
Depreciation and impairment** - 1,481 11,122 1,211 632 61 14,507
Disposals - (695) (4,312) (615) (293) (391) (6,306)
As at March 31, 2021 ` - ` 8,706 ` 84,975 ` 9,712 ` 5,280 ` 397 ` 109,070
Net carrying value as at March 31, 2021 ` 3,815 ` 30,512 ` 25,800 ` 4,020 ` 1,583 ` 21 ` 65,751
Gross carrying value:
As at April 1, 2019 ` 3,697 ` 27,294 ` 92,286 ` 10,500 ` 5,908 ` 948 ` 140,633
Reclassified on adoption of Ind AS 116 - - (3,420) - - - (3,420)
Adjusted balance as at April 1, 2019 ` 3,697 ` 27,294 ` 88,866 ` 10,500 ` 5,908 ` 948 ` 137,213
Translation adjustment 9 84 1,437 64 65 (5) 1,654
Additions 55 9,130 13,571 2,435 1,052 11 26,254
Additions through business combination - 5 417 6 1 - 429
Disposals - (199) (3,676) (104) (154) (146) (4,279)
As at March 31, 2020 ` 3,761 ` 36,314 ` 100,615 ` 12,901 ` 6,872 ` 808 ` 161,271
Accumulated depreciation/impairment:
As at April 1, 2019 ` - ` 6,659 ` 73,129 ` 8,163 ` 4,335 ` 682 ` 92,968
Reclassified on adoption of Ind AS 116 - - (2,177) - - - (2,177)
Adjusted balance as at April 1, 2019 ` - ` 6,659 ` 70,952 ` 8,163 ` 4,335 ` 682 ` 90,791
Translation adjustment - 32 1,066 46 45 (2) 1,187
Depreciation and impairment** - 1,315 8,624 992 564 175 11,670
Disposals - (118) (2,649) (84) (15) (128) (2,994)
As at March 31, 2020 ` - ` 7,888 ` 77,993 ` 9,117 ` 4,929 ` 727 ` 100,654
Net carrying value as at March 31, 2020 ` 3,761 ` 28,426 ` 22,622 ` 3,784 ` 1,943 ` 81 ` 60,617
* Including net carrying value of computer equipment and software amounting to ` 18,508 and ` 16,844 as at March 31, 2021 and 2020, respectively.
** Includes impairment charge on certain software platforms, amounting to 285 and Nil for the year ended March 31, 2021 and 2020, respectively.
Notes to the Consolidated Financial Statements
Consolidated financial statements under Ind ASIntegrated Annual Report 2020-21
Wipro Limited
251

5. Right-of-use AssetsCategory of RoU asset
Land BuildingsPlant and
equipment*Vehicles Total
Gross carrying value:
As at April 1, 2020 ` 2,003 ` 15,624 ` 4,236 ` 826 ` 22,689
Additions 79 5,323 770 162 6,334
Disposals - (2,503) (1,103) (154) (3,760)
Additions through Business combinations - 352 - 84 436
Translation adjustment - 48 15 8 71
As at March 31, 2021 ` 2,082 ` 18,844 ` 3,918 ` 926 ` 25,770
Accumulated depreciation:
As at April 1, 2020 ` 27 ` 3,928 ` 1,721 ` 265 ` 5,941
Depreciation 28 4,487 1,465 285 6,265
Disposals - (1,703) (1,023) (119) (2,845)
Translation adjustment - (9) (6) 4 (11)
As at March 31, 2021 ` 55 ` 6,703 ` 2,157 ` 435 ` 9,350
Net carrying value as at March 31, 2021 ` 16,420
Gross carrying value:
As at April 1, 2019 ` 2,003 ` 11,502 ` 2,941 ` 649 ` 17,095
Additions - 3,520 1,210 219 4,949
Additions through Business combinations - 364 - - 364
Disposals - (41) (47) (59) (147)
Translation adjustment - 279 132 17 428
As at March 31, 2020 ` 2,003 ` 15,624 ` 4,236 ` 826 ` 22,689
Accumulated depreciation:
Depreciation ` 27 ` 3,884 ` 1,731 ` 269 ` 5,911
Disposals - (18) (47) (10) (75)
Translation adjustment - 62 37 6 105
As at March 31, 2020 ` 27 ` 3,928 ` 1,721 ` 265 ` 5,941
Net carrying value as at March 31, 2020 ` 16,748
* includes computer equipment
The Company recognised the following expenses in the statement of profit and loss:
Year ended March 31, 2021
Year ended March 31, 2020
Interest expenses on lease liabilities ` 798 ` 914
Rent expense pertaining to leases of low-value assets recognised under facility expenses 53 44
Rent expense pertaining to leases with less than twelve months of lease term recognised under facility expenses
1,876 2,085
` 2,727 ` 3,043
Payments toward leases of low-value assets and leases with less than twelve months of lease term, are disclosed under operating activities in the consolidated statement of cash flows. All other lease payments during the period are disclosed under financing activities in the consolidated statement of cash flows.
Income from subleasing RoU assets is not material.
As of March 31, 2021 and 2020, the Company is committed to certain leases amounting to 2,468 and 1,399, respectively, which have not yet commenced. The term of such leases ranges from 2 to 10 years.
Refer to Note 9 for remaining contractual maturities of lease liabilities.
Notes to the Consolidated Financial Statements
Consolidated financial statements under Ind AS
252

6. Goodwill and other intangible Assets
The movement in goodwill balance is given below: Year ended
March 31, 2021 Year ended
March 31, 2020Balance at the beginning of the year ` 126,894 ` 113,220
Translation adjustment (1,219) 8,841
Acquisition through business combinations* (Refer to Note 7) 9,472 4,833
Balance at the end of the year ` 135,147 ` 126,894
* Acquisition through business combinations for the year ended March 31, 2021 is net of ` (72) towards changes in the purchase price allocation of acquisitions made during the year ended March 31, 2020.
The Company is organised by three operating segments: IT Services, IT Products and India State Run Enterprise Services. Goodwill as at March 31, 2021 and 2020 has been allocated to the IT Services operating segment.
Goodwill recognised on business combinations is allocated to Cash Generating Units (CGUs), within the IT Services operating segment, which are expected to benefit from the synergies of the acquisitions.
During the year ended March 31, 2021, the Company re-organised its IT Services segment from seven industry verticals to four Strategic Market Units (Refer to Note 36). Accordingly, goodwill has been re-allocated to the CGUs, using a relative value approach as at March 31, 2021 and 2020 as follows:
Year ended March 31, 2021
Year ended March 31, 2020
CGUs
Americas 1 ` 64,469 ` 63,323
Americas 2 32,172 30,463
Europe 24,953 20,404
Asia Pacific Middle East Africa (APMEA) 13,553 12,704
` 135,147 ` 126,894
For impairment testing, goodwill is allocated to a CGU representing the lowest level within the Group at which goodwill is monitored for internal management purposes, and which is not higher than the Company’s operating segment. Goodwill is tested for impairment at least annually in accordance with the Company’s procedure for determining the recoverable value of each CGU.
The recoverable amount of the CGU is determined based on FVLCD. The FVLCD of the CGU is determined based on the market capitalisation approach, using the turnover and earnings multiples derived from observable market data. The fair value measurement is categorised as a level 2 fair value based on the inputs in the valuation techniques used.
Based on the above testing, no impairment was identified as at March 31, 2021 and 2020 as the recoverable value of the CGUs exceeded the carrying value. An analysis of the calculation’s sensitivity to a change in the key parameters (turnover and earnings multiples), did not identify any probable scenarios where the CGU’s recoverable amount would fall below its carrying amount.
The movement in other intangible assets is given below:
Other intangible assets
Customer-related Marketing-related Total
Gross carrying value:
As at April 1, 2020 ` 32,490 ` 6,698 ` 39,188
Translation adjustment (56) (159) (215)
Acquisition through business combinations (Refer to Note 7) 2,460 828 3,288
Deductions/Adjustments (8,568) (5,756) (14,324)
As at March 31, 2021 ` 26,326 ` 1,611 ` 27,937
Notes to the Consolidated Financial Statements
Consolidated financial statements under Ind ASIntegrated Annual Report 2020-21
Wipro Limited
253

Other intangible assets
Customer-related Marketing-related Total
Accumulated amortisation/ impairment:
As at April 1, 2020 ` 17,898 ` 4,928 ` 22,826
Translation adjustment (142) (116) (258)
Amortisation and impairment* 5,060 1,548 6,608
Deductions/Adjustments (8,568) (5,756) (14,324)
As at March 31, 2021 ` 14,248 ` 604 ` 14,852
Net carrying value as at March 31, 2021 ` 12,078 ` 1,007 ` 13,085
Gross carrying value:
As at April 1, 2019 ` 26,924 ` 5,945 ` 32,869
Translation adjustment 1,031 382 1,413
Acquisition through business combinations (Refer to Note 7) 4,535 371 4,906
As at March 31, 2020 ` 32,490 ` 6,698 ` 39,188
Accumulated amortisation/ impairment:
As at April 1, 2019 `15,345 ` 3,762 ` 19,107
Translation adjustment 220 226 446
Amortisation and impairment 2,333 940 3,273
As at March 31, 2020 ` 17,898 ` 4,928 ` 22,826
Net carrying value as at March 31, 2020 ` 14,592 ` 1,770 ` 16,362
* includes impairment charge on certain intangible assets recognized on acquisitions, amounting to ` 1,879 and ` Nil for the year ended March 31, 2021 and 2020, respectively.
* During the year ended March 31, 2021, change in business strategy of a customer led to a significant decline in the revenue and earnings estimates, resulting in revision of recoverable value of customer-relationship intangible assets recognised on business combination. Further, the Company integrated certain brands acquired as part of a business combination, resulting in discontinuance of the acquired brands. Consequently, the Company has recognised impairment charge ` 1,879 for the year ended March 31, 2021 respectively, as part of amortisation and impairment.
* Due to change in our estimate of useful life of customer-related intangibles in an earlier business combination, the Company has recognised additional amortisation charge of ` 795 and ` Nil for the year ended March 31, 2021 and 2020, respectively, as part of amortisation and impairment.
As at March 31, 2021, the net carrying value and the estimated remaining amortisation period for intangible assets acquired on acquisition are as follows:
Acquisition Net carrying valueEstimated remaining amortisation period
ATCO I-Tek ` 1,920 0.33 years
Vara Infotech Private Limited 1,888 5.5 - 8.5 years
Rational Interaction, Inc. 1,799 1.92 - 5.92 years
Eximius Design, LLC 1,701 0.75 - 6.42 years
4C NV 770 0.83 - 4.42 years
IVIA Serviços de Informática Ltda 343 4.42 years
Appirio Inc. 302 0.67 years
Cellent AG 289 1.75 years
International TechneGroup Incorporated 287 3.5 years
Encore Theme Technologies Private Limited 161 2.75 - 4.75 years
Others 3,625 0.25 - 11.25 years
Total 13,085
Notes to the Consolidated Financial Statements
Consolidated financial statements under Ind AS
254

7. Business Combinations
Summary of acquisitions during the year ended March 31, 2021 is given below:
During the year ended March 31, 2021, the Company has completed four business combinations (which individually are not material) for a total consideration (upfront cash payout to acquire control and contingent consideration) of 13,724. These include:
a) ` 1,643 towards acquisition of IVIA Serviços de Informática Ltda. (“IVIA”) on August 14, 2020, a specialised IT services provider to financial services, retail and manufacturing sectors in Brazil
b) ` 5,268 towards acquisition of 4C NV and its subsidiaries (“4C”) on August 11, 2020, a Salesforce multi-cloud partner in Europe, U.K. and the Middle East
c) ` 841 towards acquisition of Encore Theme Technologies Private Limited (“ETT”), a Finastra trade finance solutions partner across the Middle East, Africa, India and Asia Pacific on December 15, 2020, and
d) ` 5,972 towards acquisition of Eximius Design, LLC and Eximius Design India Private Limited (“Eximius”) on February 25, 2021, a leading engineering services company with expertise in semiconductor, software and systems design.
The following table presents the provisional purchase price allocation:
Description Purchase price
allocated
Net assets ` 1,324
Customer-related intangibles 2,460
Marketing-related intangibles 828
Deferred tax liabilities on intangible assets (432)
Total ` 4,180
Goodwill 9,544
Total purchase price ` 13,724
The total consideration for IVIA includes a contingent consideration linked to achievement of revenues and earnings over a period of 3 years ending September 30, 2023, and range of contingent consideration payable is between ` Nil and ` 746. The fair value of the contingent consideration is estimated by applying the discounted cash-flow approach considering discount rate of 5.7% and probability adjusted revenue and earnings estimates. The undiscounted fair value of contingent consideration is ` 525 as of the date of acquisition. The fair value of discounted contingent consideration of ` 460 is recorded as part of provisional purchase price allocation.
The total consideration for ETT includes a contingent consideration linked to achievement of revenues and earnings over a period of 18 months ending March 31, 2022, and range of contingent consideration payable is between ` Nil and ` 305. The fair value of the contingent consideration is estimated by applying the discounted cash-flow approach considering discount rate of 7.4% and probability adjusted revenue and earnings estimates. The undiscounted fair value of contingent consideration is ` 215 as of the date of acquisition. The fair value of discounted contingent consideration of ` 196 is recorded as part of provisional purchase price allocation.
The total consideration for Eximius includes a contingent consideration linked to achievement of revenues and earnings over a period of 2 years ending March 31, 2023, and range of contingent consideration payable is between ` Nil and ` 1,738. The fair value of the contingent consideration is estimated by applying the discounted cash-flow approach considering discount rate of 2.3% and probability adjusted revenue and earnings estimates. The undiscounted fair value of contingent consideration is 1,695 as of the date of acquisition. The fair value of discounted contingent consideration of ` 1,637 is recorded as part of provisional purchase price allocation.
Net assets acquired include ` 1,000 of cash and cash equivalents and trade receivables valued at ` 1,157.
The goodwill of ` 9,544 comprises value of acquired workforce and expected synergies arising from the business combinations. Goodwill is allocated to IT Services segment and is not deductible for income tax purposes except for Eximius Design, LLC in the United States.
Notes to the Consolidated Financial Statements
Consolidated financial statements under Ind ASIntegrated Annual Report 2020-21
Wipro Limited
255

The transaction costs of ` 175 related to the above acquisitions have been included in the consolidated statement of profit and loss.
The pro-forma effects of these business combinations on the Company’s results were not material.
Summary of acquisitions during the year ended March 31, 2020 is given below:
During the year ended March 31, 2020, the Company has completed three business combinations (which both individually and in aggregate are not material) for a total consideration (upfront cash payout to acquire control) of ` 10,403. These include:
a) ` 3,289 towards taking over customer contracts, leased facilities, assets and employees of Vara Infotech Private Limited on September 30, 2019.
b) ` 3,283 towards acquisition of International TechneGroup Incorporated, on October 01, 2019, a global digital engineering and manufacturing solutions company.
c) ` 3,831 towards acquisition of Rational Interaction, Inc, on February 21, 2020, a digital customer experience management company.
The following table presents the final purchase price allocation:
Description Purchase price
allocated Net assets ` 949
Customer-related intangibles 4,535
Marketing-related intangibles 371
Deferred tax liabilities on intangible assets (213)
Total ` 5,642
Goodwill 4,761
Total purchase price ` 10,403
Net assets acquired include ` 324 of cash and cash equivalents and trade receivable valued at ` 809.
The goodwill of ` 4,761 comprises value of acquired workforce and expected synergies arising from the business combinations. The goodwill was allocated to IT Services segment and is partially deductible for income tax purpose in India and United States.
The pro-forma effects of these business combinations on the Company’s results were not material.
Acquisition consummated after March 31, 2021
On March 4, 2021, the Company entered into a definitive agreement to acquire 100% equity interest in Capco, a global management and technology consultancy providing digital, consulting and technology services to financial institutions in the Americas, Europe and Asia Pacific, and its subsidiaries, for a total cash consideration of ` 108,760. The acquisition was consummated on April 29, 2021. The following table presents the provisional purchase price allocation:
Description Purchase price
allocated Net assets ` 4,398
Customer-related intangibles 24,284
Marketing-related intangibles 8,048
Deferred tax liabilities on intangible assets (9,376)
Total ` 27,354
Goodwill 81,406
Total purchase price ` 108,760
The goodwill of ` 81,406 comprises value of acquired workforce and expected synergies arising from the business combinations. This acquisition will make the Company one of the largest end-to-end global consulting, technology
Notes to the Consolidated Financial Statements
Consolidated financial statements under Ind AS
256

and transformation service providers to the banking and financial services industry. By combining our capabilities in strategic design, digital transformation, cloud, cybersecurity, IT and operations services with Capco’s domain and consulting strength, clients will gain access to a partner who can deliver integrated, bespoke solutions to help fuel growth and achieve their transformation objectives.
Goodwill is allocated to IT Services segment and is not deductible for income tax purposes.
8. InvestmentsNon-current
As at March 31, 2021
As at March 31, 2020
Financial instruments measured at FVTOCI
Equity instruments -unquoted (Refer to Note 8.1) ` 10,572 ` 9,297
Financial instruments at amortised cost
Inter corporate and term deposits-unquoted * 4 5
` 10,576 ` 9,302
Aggregate amount of unquoted investments ` 10,576 ` 9,302
Current
As at March 31, 2021
As at March 31, 2020
Financial instruments measured at FVTOCI
Commercial papers, Certificate of deposits and bonds - unquoted (Refer to Note 8.3) ` - ` 20,126
Non-convertible debentures, government securities and commercial papers - quoted (Refer to Note 8.4) 131,382 135,461
Financial instruments at amortised cost
Inter corporate and term deposits -unquoted * 20,823 19,253
Financial instruments measured at FVTPL
Investments in liquid and short-term mutual funds - unquoted (Refer to Note 8.2) 23,502 14,795
` 175,707 ` 189,635
Aggregate amount of quoted investments and aggregate market value thereof ` 131,382 ` 135,461
Aggregate amount of unquoted investments ` 44,325 ` 54,174
* These deposits earn a fixed rate of interest. Term deposits include non-current and current deposits in lien with banks primarily on account of term deposits held as margin money deposits against guarantees amounting to ` 4 and ` 615, respectively (March 31, 2020: Term deposits non-current of ` 5 and Term deposits current of ` 796).
Investments accounted for using the equity method
The Company has no material associates as at March 31, 2021. The aggregate summarised financial information in respect of the Company’s immaterial associates that are accounted for using the equity method is set forth below:
As at March 31, 2021
As at March 31, 2020
Carrying amount of the Company’s interest in associates accounted for using the equity method ` 1464 ` 1,383
For the year ended March 31, 2021
For the year ended March 31, 2020
Company’s share of net profit/(loss) of associates accounted for using the equity method in consolidated statement of profit and loss ` 130 ` 29
Notes to the Consolidated Financial Statements
Consolidated financial statements under Ind ASIntegrated Annual Report 2020-21
Wipro Limited
257

Details of investments:
8.1 Details of investments in equity instruments- classified as FVTOCI
Number of Shares Carrying value
ParticularsAs at
March 31, 2021As at
March 31, 2020As at
March 31, 2021As at
March 31, 2020
Non-Current
Ensono Holdings, LLC 13,024,920 13,024,920 ` 2,665 ` 2,733
TLV Partners 804 567
Immuta, Inc. 1,126,394 - 714 -
Tricentis Corporation 4,933,051 4,933,051 674 588
IntSights Cyber Intelligence Limited 2,192,838 2,191,903 620 641
Vectra Networks, Inc 1,826,920 1,811,807 562 582
Incorta Inc, Ltd. 1,458,272 1,458,272 512 529
YugaByte, Inc. 1,443,530 - 494 -
Tradeshift Inc. 384,615 384,615 367 510
Harte Hanks Inc. 9,926 9,926 319 119
Vicarious FPC, Inc. 173,575 42,392 309 244
TLV Partners II, L.P. 295 190
Avaamo Inc. 1,887,193 1,887,193 252 260
B Capital Fund II, L.P. 220 118
Vulcan Cyber Ltd. 601,253 - 219 -
CyCognito 1,422,816 122,075 216 99
Moogsoft (Herd) Inc. 2,918,933 1,230,182 179 227
Work-Bench Ventures II-A, LP 170 118
Boldstart Ventures IV, L.P. 156 49
Sealights Technologies Ltd 1,343,635 1,343,635 146 151
CloudKnox Security Inc. 2,389,486 2,389,486 146 151
Headspin Inc 633,076 230,733 140 849
Glilot Capital Partners III L.P. 87 28
Boldstart Opportunities II, L.P. 79 -
TLV Partners III, L,P. 73 14
Wep Peripherals Ltd. 306,000 306,000 60 68
Altizon Systems Private Limited 23,758 23,758 38 38
Wep Solutions Limited 1,836,000 1,836,000 26 27
Drivestream India Private Limited 267,600 267,600 19 19
Work-Bench Ventures III-A, LP 11 -
CloudGenix - 1,946,131 - 378
Total ` 10,572 ` 9,297
Notes to the Consolidated Financial Statements
Consolidated financial statements under Ind AS
258

8.2 Investments in liquid and short-term mutual funds (unquoted) – classified as FVTPL
Number of Units Carrying value
ParticularsAs at
March 31, 2021As at
March 31, 2020As at
March 31, 2021As at
March 31, 2020
Current
UTI Arbitrage Fund-Growth Plan 107,117,931 36,445,590 3,048 996
Kotak Equity Arbitrage Fund-Direct Plan-Growth 84,544,140 - 2,560 -
HDFC Arbitrage Fund - Wholesale Plan - Growth 141,089,753 141,089,753 2,177 2,100
SBI Overnight Fund Direct Plan Growth 579,846 496,725 1,945 1,616
ICICI Prudential Overnight Fund Direct Growth 16,299,450 4,526,064 1,809 488
ICICI Prudential Equity Arbitrage Fund - Direct Plan - Growth 61,667,716 45,551,909 1,730 1,229
IDFC Arbitrage Fund - Growth - Direct Plan 48,133,290 48,133,290 1,288 1,241
HDFC Overnight Fund Direct Plan Growth 364,207 145,665 1,114 432
Kotak Overnight Fund 994,788 62,144 1,092 66
Axis Overnight Fund 983,593 590,406 1,070 623
Aditya Birla Sun Life Arbitrage Fund 46,133,795 - 1,005 -
DSP Floater Fund 99,995,000 - 1,005 -
IDFC Arbitrage Fund – Monthly Dividend- Direct Plan 74,705,539 - 1,004 -
Baroda Overnight Fund 635,996 - 687 -
LIC MF Overnight Fund Direct Plan Growth 629,140 - 671 -
DSP Overnight Fund Direct Plan Growth 501,432 488,697 553 522
Invesco India Overnight Fund 188,072 495,317 196 500
L&T Overnight Fund 77,647 - 125 -
Tata Overnight Fund 106,323 107,199 115 113
Aditya Birla Sun Life Overnight Fund Direct Plan Growth 71,397 231,342 79 250
UTI Overnight Fund Direct Plan Growth 22,524 407,120 63 1,113
HSBC Overnight Fund 55,197 479,479 59 500
Mirae Asset Overnight Fund 51,808 - 55 -
IDFC Overnight Fund 47,793 67,569 52 72
Kotak Equity Arbitrage Fund - Direct Plan - Growth - 67,906,978 - 1,974
L&T Cash Fund Direct Plan Growth - 460,742 - 718
Sundaram Overnight Fund - 228,041 - 242
` 23,502 ` 14,795
Notes to the Consolidated Financial Statements
Consolidated financial statements under Ind ASIntegrated Annual Report 2020-21
Wipro Limited
259

8.3 Investment in certificate of deposits/ commercial papers and bonds (unquoted)– classified as FVTOCI
Particulars of issuerAs at
March 31, 2021As at
March 31, 2020
Current
Axis Bank ` - ` 9,139
National Bank for Agriculture and Rural Development - 8,833
Small Industries Development Bank of India - 1,197
ICICI Bank - 957
Total ` - ` 20,126
8.4 Investment in non-convertible debentures, government securities and commercial papers (quoted) – classified as FVTOCI
Particulars of issuerAs at
March 31, 2021As at
March 31, 2020
Current
Government Securities ` 27,374 ` 12,978
National Highways Authority of India 20,520 18,802
Tata Capital Financial Services Limited 12,639 12,000
HDB Financial Services Limited 12,172 13,633
Kotak Mahindra Prime Limited 9,258 12,090
Rural Electrification Corporation Limited 7,788 14,114
Kotak Mahindra Investments Limited 7,537 8,283
Power Finance Corporation Limited 7,064 12,248
National Bank for Agriculture and Rural Development 4,946 4,574
Indian Railway Finance Corporation Limited 4,398 4,857
NTPC Limited 4,050 1,679
Tata Capital Housing Finance Limited 3,445 1,273
LIC Housing Finance Limited 3,042 -
Housing Development Finance Corporation Limited 2,785 5,692
Aditya Birla Finance Limited 2,005 1,882
Small Industries Development Bank of India 1,504 8,914
Kotak Mahindra Bank 848 -
ANZ Bank 7 5
Axis Bank - 1,823
HDFC Bank Limited - 614
Total ` 131,382 ` 135,461
Notes to the Consolidated Financial Statements
Consolidated financial statements under Ind AS
260

9. Financial Instruments
Financial assets and liabilities (carrying value / fair value)As at
March 31, 2021As at
March 31, 2020
Assets:
Cash and cash equivalents ` 169,793 ` 144,499
Investments
Financial instruments at FVTPL 23,502 14,795
Financial instruments at FVTOCI 141,954 164,884
Financial instruments at Amortised cost 20,827 19,258
Other financial assets
Trade receivables 98,656 110,523
Unbilled receivables 27,124 25,209
Other assets 13,333 14,495
Derivative assets 4,080 3,025
` 499,269 ` 496,688 Liabilities:
Trade payables and other payables
Trade payables ` 54,174 ` 58,400
Lease liabilities 21,182 19,198
Other financial liabilities 28,457 20,779
Borrowings * 83,332 78,042
Derivative liabilities 1,070 7,369
` 188,215 ` 183,788 * Includes current obligation under borrowings classified under “Other current financial liabilities”
Offsetting financial assets and liabilitiesThe following table contains information on other financial assets and trade payables and other payables, subject to offsetting:
As at March 31, 2021
As at March 31, 2020
Financial Assets:
Gross amount of recognised other financial assets ` 146,709 ` 157,304
Gross amount of recognised financial liabilities set off in the consolidated balance sheet (7,596) (7,077)
Net amount of recognised other financial assets presented in the consolidated balance sheet ` 139,113 ` 150,227
Financial liabilities
Gross amount recognised as Trade payables and other payables ` 90,227 ` 86,256
Gross amount of recognised financial liabilities set off in the consolidated balance sheet (7,596) (7,077)
Net amounts of recognised Trade payables and other payables presented in the consolidated balance sheet ` 82,631 ` 79,179
For the financial assets and liabilities subject to offsetting or similar arrangements, each agreement between the Company and the counterparty allows for net settlement of the relevant financial assets and liabilities when both elect to settle on a net basis. In the absence of such an election, financial assets and liabilities will be settled on a gross basis and hence are not offset.
Notes to the Consolidated Financial Statements
Consolidated financial statements under Ind ASIntegrated Annual Report 2020-21
Wipro Limited
261

Fair value
Financial assets and liabilities include cash and cash equivalents, trade receivables, unbilled receivables, finance lease receivables, employee and other advances, eligible current and non-current assets, borrowings, trade payables, eligible current liabilities and non-current liabilities.
The fair value of cash and cash equivalents, trade receivables, unbilled receivables, borrowings, trade payables, other current financial assets and liabilities approximate their carrying amount largely due to the short-term nature of these instruments. The Company’s long-term debt has been contracted at market rates of interest. Accordingly, the carrying value of such long-term debt approximates fair value. Further, finance lease receivables are periodically evaluated based on individual credit worthiness of customers. Based on this evaluation, the Company records allowance for estimated losses on these receivables. As at March 31, 2021 and 2020, the carrying value of such receivables, net of allowances approximates the fair value.
Investments in liquid and short-term mutual funds, which are classified as FVTPL are measured using net asset values at the reporting date multiplied by the quantity held. Fair value of investments in commercial papers, certificate of deposits and bonds classified as FVTOCI is determined based on the indicative quotes of price and yields prevailing in the market at the reporting date. Fair value of investments in equity instruments classified as FVTOCI is determined using market and income approaches.
The fair value of derivative financial instruments is determined based on observable market inputs including currency spot and forward rates, yield curves, currency volatility etc.
Fair value hierarchy
The table below analyses financial instruments carried at fair value, by valuation method. The different levels have been defined as follows:
Level 1 – Quoted prices (unadjusted) in active markets for identical assets or liabilities.
Level 2 – Inputs other than quoted prices included within Level 1 that are observable for the asset or liability, either directly (i.e. as prices) or indirectly (i.e. derived from prices).
Level 3 – Inputs for the assets or liabilities that are not based on observable market data (unobservable inputs).
The following table presents fair value hierarchy of assets and liabilities measured at fair value on a recurring basis:
Particulars
As at March 31, 2021 As at March 31, 2020
Fair value measurements at reporting date Fair value measurements at reporting date
Total Level 1 Level 2 Level 3 Total Level 1 Level 2 Level 3
Assets
Derivative instruments:
Cash flow hedges ` 2,998 ` - ` 2,998 - ` 1,382 - ` 1,382 ` -
Others 1,082 - 1,082 - 1,643 - 1,643 -
Investments:
Investment in liquid and short-term mutual funds
23,502 23,502 - - 14,795 14,795 - -
Investment in equity instruments 10,572 26 319 10,227 9,297 - 119 9,178
Commercial paper, Certificate of deposits and bonds
131,382 2,217 129,165 - 155,587 12,983 142,604 -
Liabilities
Derivative instruments:
Cash flow hedges ` (816) ` - ` (816) - ` (4,057) ` - ` (4,057) -
Others (254) - (254) - (3,312) - (3,312) -
Contingent consideration (Refer to Note 7)
(2,293) - - (2,293) - - - -
The following methods and assumptions were used to estimate the fair value of the level 2 financial instruments included in the above table.
Notes to the Consolidated Financial Statements
Consolidated financial statements under Ind AS
262

Derivative instruments (assets and liabilities): The Company enters into derivative financial instruments with various counterparties, primarily banks with investment grade credit ratings. Derivatives valued using valuation techniques with market observable inputs are mainly interest rate swaps, foreign exchange forward contracts and foreign exchange option contracts. The most frequently applied valuation techniques include forward pricing, swap models and Black Scholes models (for option valuation), using present value calculations. The models incorporate various inputs including the credit quality of counterparties, foreign exchange spot and forward rates, interest rate curves and forward rate curves of the underlying. As at March 31, 2021, the changes in counterparty credit risk had no material effect on the hedge effectiveness assessment for derivatives designated in hedge relationships and other financial instruments recognised at fair value.
Investment in commercial papers, certificate of deposits and bonds: Fair value of these instruments is derived based on the indicative quotes of price and yields prevailing in the market as at reporting date.
The following methods and assumptions were used to estimate the fair value of the level 3 financial instruments included in the above table.
Investment in equity instruments: Fair value of these instruments is determined using market and income approaches.
Details of assets and liabilities considered under Level 3 classification
As atMarch 31, 2021
As atMarch 31, 2020Investment in equity instruments
Balance at the beginning of the year ` 9,178 ` 6,668
Additions 1,575 2,124
Disposals (1,256) (1,327)
Transfers out of level 3 (27) -
Gain/(loss) recognized in foreign currency translation reserve (252) 855
Gain recognized in other comprehensive income 1,009 858
Balance at the end of the year ` 10,227 ` 9,178
During the year ended March 31, 2021, as a result of M&A transactions, the Company sold its shares in CloudGenix and Emailage Corp at a fair value of ` 1,256 and recognised a cumulative gain of ` 884 in other comprehensive income.
As at March 31, 2021
As at March 31, 2020
Contingent considerationBalance at the beginning of the year ` - ` -
Additions (Refer to Note 7) (2,293) -
Finance expense recognised in statement of profit and loss (25) -
Gain/(loss) recognised in foreign currency translation reserve 25 -
Balance at the end of the year ` (2,293) -
During the year ended March 31, 2021, as a result of M&A transactions, the Company sold its shares in CloudGenix and Emailage Corp at a fair value of ` 1,256 and recognised a cumulative gain of ` 884 in other comprehensive income.
Description of significant unobservable inputs to valuation:
As at March 31, 2021
Items Valuation technique Significant unobservable Input Movement Increase Decrease
input by (`) (`)Unquoted equity Discounted Long term growth rate 3.0% 0.5% 304 (295)
investments cash flow model Discount rate 10.9% 0.5% (393) 395
As at March 31, 2020
Items Valuation technique Significant unobservable Input Movement Increase Decrease
input by (`) (`)Unquoted equity Discounted Long term growth rate 3.0% 0.5% 298 (273)
investments cash flow model Discount rate 11.6% 0.5% (388) 404
As at March 31, 2021 and 2020, 0.5 percentage point increase/(decrease) in the unobservable inputs used in fair valuation of other Level 3 assets does not have a significant impact in its value.
Notes to the Consolidated Financial Statements
Consolidated financial statements under Ind ASIntegrated Annual Report 2020-21
Wipro Limited
263

Derivative assets and liabilities:
The Company is exposed to foreign currency fluctuations on foreign currency assets / liabilities, forecasted cash flows denominated in foreign currency and net investment in foreign operations. The Company follows established risk management policies, including the use of derivatives to hedge foreign currency assets / liabilities, foreign currency forecasted cash flows and net investment in foreign operations. The counter parties in these derivative instruments are primarily banks and the Company considers the risks of non-performance by the counterparty as non-material.
The following table presents the aggregate contracted principal amounts of the Company’s derivative contracts outstanding:
(in million)
As at March 31, 2021 As at March 31, 2020
Notional Fair value Notional Fair valueDesignated derivative instrumentsSell: Forward contracts USD 1,577 ` 2,293 USD 1,011 ` (2,902)
€ 109 ` 114 € 121 ` 231 £ 96 ` (254) £ 52 ` 240
AUD 103 ` (246) AUD 144 ` 741
Range forward option contracts USD 138 ` 385 USD 474 ` (1,057)€ 20 ` 24 € 39 ` 85 £ 55 ` (116) £ 98 ` (13)
AUD 34 ` (18) AUD - ` -
Non-designated derivative instrumentsSell: Forward contracts* USD 1,638 ` 480 USD 1,314 ` (3,116)
€ 99 ` 202 € 59 ` 34 £ 104 ` 98 £ 81 ` 112
AUD 29 ` 11 AUD 56 ` 115 SGD 9 ` 5 SGD 7 ` 8 ZAR 22 ` (1) ZAR 17 ` 1 CAD 30 ` 3 CAD 51 ` 153 SAR 137 ` (1) SAR 60 ` (1)PLN 8 ` 2 PLN 34 ` 13 CHF 10 ` 13 CHF 7 ` 4 QAR 15 ` (6) QAR 19 ` (8)TRY 47 ` 42 TRY 30 ` 31
NOK 4 ` ^ NOK 19 ` 16 OMR 2 ` (1) OMR 2 ` 1 SEK 42 ` 10 SEK 13 ` 4 MYR - ` - MYR 20 ` 1
JPY 370 ` 6 JPY 325 ` ^
Buy: Forward contracts USD - ` - USD 480 ` 972 MXN - ` - MXN 11 ` (9)SEK 37 ` (15) SEK - ` - DKK 45 ` (12) DKK 9 ` ^CHF 2 ` (6) CHF - ` -
RMB 30 ` (2) RMB - ` - AED 9 ` ^ AED - ` -
` 3,010 ` (4,344)
* USD 1638 and USD 1,314 includes USD/PHP sell forward of USD 244 and USD 176 as at March 31, 2021 and 2020, respectively.
^ Value is less than ` 1
Hedge effectiveness is determined at the inception of the hedge relationship, and through periodic prospective effectiveness assessments to ensure that an economic relationship exists between the hedged item and hedging instrument, including whether the hedging instrument is expected to offset changes in cash flows of hedged items.
Notes to the Consolidated Financial Statements
Consolidated financial statements under Ind AS
264

The following table summarises activity in the cash flow hedging reserve within equity related to all derivative instruments classified as cash flow hedges:
As atMarch 31, 2021
As atMarch 31, 2020
Balance as at the beginning of the year ` (2,876) ` 3,019
Deferred cancellation gain/(loss), net - (201)
Changes in fair value of effective portion of derivatives 4,753 (2,312)
Net (gain)/loss reclassified to consolidated statement of profit and loss on occurrence of hedged transactions* 305 (3,382)
Gain/(loss) on cash flow hedging derivatives, net ` 5,058 ` (5,895)
Balance as at the end of the year ` 2,182 ` (2,876) Deferred tax thereon (452) 561
Balance as at the end of the year, net of deferred tax ` 1,730 ` (2,315)
*Includes net gain/(loss) reclassified to revenue (March 31, 2021: 58, March 31, 2020: (4,761)) and expense (March 31, 2021: `247, March 31, 2020: `1,379).
The related hedge transactions for balance in cash flow hedging reserves as at March 31, 2021are expected to occur and be reclassified to the consolidated statement of profit and loss over a period of two years.
As at March 31, 2021and 2020, there were no significant gains or losses on derivative transactions or portions thereof that have become ineffective as hedges or associated with an underlying exposure that did not occur.
Sale of financial assets
From time to time, in the normal course of business, the Company transfers accounts receivables, unbilled receivables, net investment in finance lease receivables (financial assets) to banks. Under the terms of the arrangements, the Company surrenders control over the financial assets and transfer is without recourse. Accordingly, such transfers are recorded as sale of financial assets. Gains and losses on sale of financial assets without recourse are recorded at the time of sale based on the carrying value of the financial assets and fair value of servicing liability. The incremental impact of such transactions on our cash flow and liquidity for the year ended March 31, 2021and 2020 is not material.
In certain cases, transfer of financial assets may be with recourse. Under arrangements with recourse, the Company is obligated to repurchase the uncollected financial assets, subject to limits specified in the agreement with the banks. These are reflected as part of borrowings in the consolidated balance sheet.
Financial risk management
Market Risk
Market risk is the risk of loss of future earnings, to fair values or to future cash flows that may result from a change in the price of a financial instrument. The value of a financial instrument may change as a result of changes in the interest rates, foreign currency exchange rates and other market changes that affect market risk sensitive instruments. Market risk is attributable to all market risk sensitive financial instruments including investments, foreign currency receivables, payables and borrowings.
The Company’s exposure to market risk is a function of investment and borrowing activities and revenue generating activities in foreign currency. The objective of market risk management is to avoid excessive exposure of the Company’s earnings and equity to losses.
Risk Management Procedures
The Company manages market risk through a corporate treasury department, which evaluates and exercises independent control over the entire process of market risk management. The corporate treasury department recommends risk management objectives and policies, which are approved by senior management and Audit Committee. The activities of this department include management of cash resources, implementing hedging strategies for foreign currency exposures, borrowing strategies, and ensuring compliance with market risk limits and policies.
Notes to the Consolidated Financial Statements
Consolidated financial statements under Ind ASIntegrated Annual Report 2020-21
Wipro Limited
265

Foreign currency risk
The Company operates internationally, and a major portion of its business is transacted in several currencies. Consequently, the Company is exposed to foreign exchange risk through receiving payment for sales and services in the United States and elsewhere and making purchases from overseas suppliers in various foreign currencies. The exchange rate risk primarily arises from foreign exchange revenue, receivables, cash balances, forecasted cash flows, payables and foreign currency loans and borrowings. A significant portion of the Company’s revenue is in the U.S. Dollar, the Pound Sterling, the Euro, the Canadian Dollar and the Australian Dollar, while a large portion of costs are in Indian rupees. The exchange rate between the rupee and these currencies has fluctuated significantly in recent years and may continue to fluctuate in the future. Appreciation of the rupee against these currencies can adversely affect the Company’s results of operations.
The Company evaluates exchange rate exposure arising from these transactions and enters into foreign currency derivative instruments to mitigate such exposure. The Company follows established risk management policies, including the use of derivatives like foreign exchange forward/option contracts to hedge forecasted cash flows denominated in foreign currency.
The Company has designated certain derivative instruments as cash flow hedges to mitigate the foreign exchange exposure of forecasted highly probable cash flows. The Company also designates foreign currency borrowings as hedge against respective net investments in foreign operations.
As at March 31, 2021, a ` 1 increase in the spot exchange rate of the Indian rupee with the U.S. dollar would result in approximately ` 3,095 (consolidated statement of profit and loss ` 1,395 and other comprehensive income ` 1,700) decrease in the fair value, and a 1 decrease would result in approximately 2,845 (consolidated statement of profit and loss ` 1,395 and other comprehensive income ` 1,450) increase in the fair value of foreign currency dollar denominated derivative instruments (forward and option contracts).
The below table presents foreign currency risk from non-derivative financial instruments as at March 31, 2021 and 2020:
As at March 31, 2021
Particulars US $ Euro Pound Sterling
Australian Dollar
Canadian Dollar
Other currencies# Total
Trade receivables ` 33,421 ` 9,094 ` 9,334 ` 4,101 ` 1,436 ` 4,196 ` 61,582
Unbilled receivables 9,255 1,681 1,740 803 283 821 14,583
Contract assets 5,111 1,121 2,755 838 102 536 10,463
Cash and cash equivalents 11,838 1,385 2,052 765 1,876 2,728 20,644
Other assets 73,212 3,981 9,116 2 891 3,479 90,681
Lease Liabilities (3,800) (2,684) (1,575) (202) (117) (1,548) (9,926)
Trade payables and other financial liabilities (23,187) (3,569) (4,370) (1,415) (350) (2,622) (35,513)
Net assets/ (liabilities) ` 105,850 ` 11,009 ` 19,052 ` 4,892 ` 4,121 ` 7,590 ` 152,514
As at March 31, 2020
Particulars US $ Euro Pound Sterling
Australian Dollar
Canadian Dollar
Other currencies # Total
Trade receivables ` 42,329 ` 8,860 ` 7,735 ` 3,044 `1,388 ` 4,522 ` 67,878
Unbilled receivables 11,127 1,030 2,221 784 291 1,126 16,579
Contract assets 5,517 1,559 2,850 654 146 790 11,516
Cash and cash equivalents 13,481 3,978 1,697 586 1,292 1,733 22,767
Other assets 49,835 4,314 3,283 413 1,447 1,805 61,097
Borrowings* (36,578) - - - - - (36,578)
Lease Liabilities (3,393) (2,606) (373) (214) (16) (1,412) (8,014)
Trade payables and other financial liabilities (27,457) (3,419) (3,718) (1,228) (605) (3,087) (39,514)
Net assets/ (liabilities) ` 54,861 ` 13,716 ` 13,695 ` 4,039 ` 3,943 ` 5,477 ` 95,731
# Other currencies reflect currencies such as Japanese Yen, Swiss Franc, Saudi Riyal etc.
* Includes current obligation under borrowings classified under “Other current financial liabilities”
As at March 31, 2021and 2020, respectively, every 1% increase/decrease in the respective foreign currencies compared to functional currency of the Company would impact results by approximately ` 1,525 and ` 957, respectively.
Notes to the Consolidated Financial Statements
Consolidated financial statements under Ind AS
266

Interest rate risk
Interest rate risk primarily arises from floating rate borrowing, including various revolving and other lines of credit. The Company’s investments are primarily in short-term investments, which do not expose it to significant interest rate risk. The Company manages its net exposure to interest rate risk relating to borrowings by entering into interest rate swap agreements, which allows it to exchange periodic payments based on a notional amount and agreed upon fixed and floating interest rates. Certain borrowings are also transacted at fixed interest rates. If interest rates were to increase by 100 bps as onMarch 31, 2021, additional net annual interest expense on floating rate borrowing would amount to approximately `829.
Credit risk
Credit risk arises from the possibility that customers may not be able to settle their obligations as agreed. To manage this, the Company periodically assesses the credit rating and financial reliability of customers, considering the financial condition, current economic trends, forward looking macroeconomic information, analysis of historical bad debts and ageing of accounts receivable. Individual risk limits are set accordingly. No single customer accounted for more than 10% of the accounts receivable as of March 31, 2021 and 2020, and revenues for the year ended March 31, 2021 and 2020. There is no significant concentration of credit risk.
Counterparty risk
Counterparty risk encompasses issuer risk on marketable securities, settlement risk on derivative and money market contracts and credit risk on cash and time deposits. Issuer risk is minimised by only buying securities which are at least AA rated in India based on Indian rating agencies. Settlement and credit risk is reduced by the policy of entering into transactions with counterparties that are usually banks or financial institutions with acceptable credit ratings. Exposure to these risks are closely monitored and maintained within predetermined parameters. There are limits on credit exposure to any financial institution. The limits are regularly assessed and determined based upon credit analysis including financial statements and capital adequacy ratio reviews.
Liquidity risk
Liquidity risk is defined as the risk that the Company will not be able to settle or meet its obligations on time or at a reasonable price. The Company’s corporate treasury department is responsible for liquidity and funding as well as settlement management. In addition, processes and policies related to such risks are overseen by senior management. Management monitors the Company’s net liquidity position through rolling forecasts based on the expected cash flows. As of March 31, 2021, cash and cash equivalents are held with major banks and financial institutions.
The table below provides details regarding the remaining contractual maturities of significant financial liabilities at the reporting date. The amounts include estimated interest payments and exclude the impact of netting agreements, if any.
As at March 31, 2021
Contractual cash flowsCarrying
valueLess than 1
year1-2 years 2-4years
Beyond 4 years
Total
Borrowings (1) (2) ` 83,332 ` 77,609 ` 166 ` 7,441 ` - ` 85,216
Lease Liabilities (2) 21,182 8,398 6,317 6,017 2,091 22,823
Trade payables and other financial liabilities 82,631 80,343 1,330 1,077 - 82,750
Derivative liabilities 1,070 1,070 - - - 1,070
Notes to the Consolidated Financial Statements
Consolidated financial statements under Ind ASIntegrated Annual Report 2020-21
Wipro Limited
267

As at March 31, 2020
Contractual cash flowsCarrying
valueLess than 1
year1-2 years 2-4years
Beyond 4 years
Total
Borrowings (1) (2) ` 78,042 ` 74,663 ` 4,761 ` 119 ` - ` 79,543
Lease Liabilities (2) 19,198 7,322 6,128 5,425 2,192 21,067
Trade payables and other financial liabilities 79,179 79,028 88 63 - 79,179
Derivative liabilities 7,369 7,231 90 48 - 7,369
The balanced view of liquidity and financial indebtedness is stated in the table below. This calculation of the net cash position is used by the management for external communication with investors, analysts and rating agencies:
As at March 31, 2021
As at March 31, 2020
Cash and cash equivalents ` 169,793 ` 144,499
Investments 175,707 189,635
Borrowings (1) (83,332) (78,042)
` 262,168 ` 256,092
(1) Includes current obligation under borrowings classified under “Other current financial liabilities”(2) Includes future cash outflow towards estimated interest on borrowings and lease liabilities.
10. Trade receivables
As at March 31, 2021
As at March 31, 2020
Unsecured
Considered good ` 98,656 `110,523
Considered doubtful 11,077 13,937
` 109,733 ` 124,460
Less: Allowance for lifetime expected credit loss (11,077) (13,937)
` 98,656 ` 110,523
Included in the consolidated balance sheet as follows:
Non-current ` 4,358 ` 6,049
Current ` 94,298 `104,474
The activity in the allowance for lifetime expected credit loss is given below:As at
March 31, 2021As at
March 31, 2020
Balance at the beginning of the year ` 13,937 ` 14,824
Additions during the year, net 1,506 1,043
Charged against allowance (4,381) (2,139)
Translation adjustment 15 209
Balance at the end of the year ` 11,077 ` 13,937
Notes to the Consolidated Financial Statements
Consolidated financial statements under Ind AS
268

11. Other Financial Assets
As at March 31, 2021
As at March 31, 2020
Non-current
Security deposits ` 1,477 ` 1,581
Interest receivables 1,139 1,139
Finance lease receivables 3,144 2,359
Others 328 802
` 6,088 ` 5,881
Current
Security deposits ` 1,149 ` 1,127
Dues from officers and employees 411 1,040
Interest receivables 1,628 2,581
Finance lease receivables 3,438 2,811
Others 619 1,055
` 7,245 ` 8,614
Total ` 13,333 ` 14,495
12. Other Assets
As at March 31, 2021
As at March 31, 2020
Non-current
Prepaid expenses ` 3,417 ` 4,535
Costs to obtain contract* 3,413 4,030
Costs to fulfil contract 337 305
Capital advances 777 1,537
Others (Refer to Note 39) 8,768 3,065
` 16,712 ` 13,472
Current
Prepaid expenses `12,121 ` 9,876
Dues from officers and employees 105 310
Advances to suppliers 3,199 3,121
Balance with GST and other authorities 7,903 7,805
Cost to obtain contract* 759 1,258
Cost to fulfil contract 53 -
Others 783 135
` 24,923 ` 22,505
Total ` 41,635 ` 35,977
* Amortisation during the year ended March 31, 2021 and 2020 amounting to ` 1,257and ` 1,237, respectively.
Notes to the Consolidated Financial Statements
Consolidated financial statements under Ind ASIntegrated Annual Report 2020-21
Wipro Limited
269
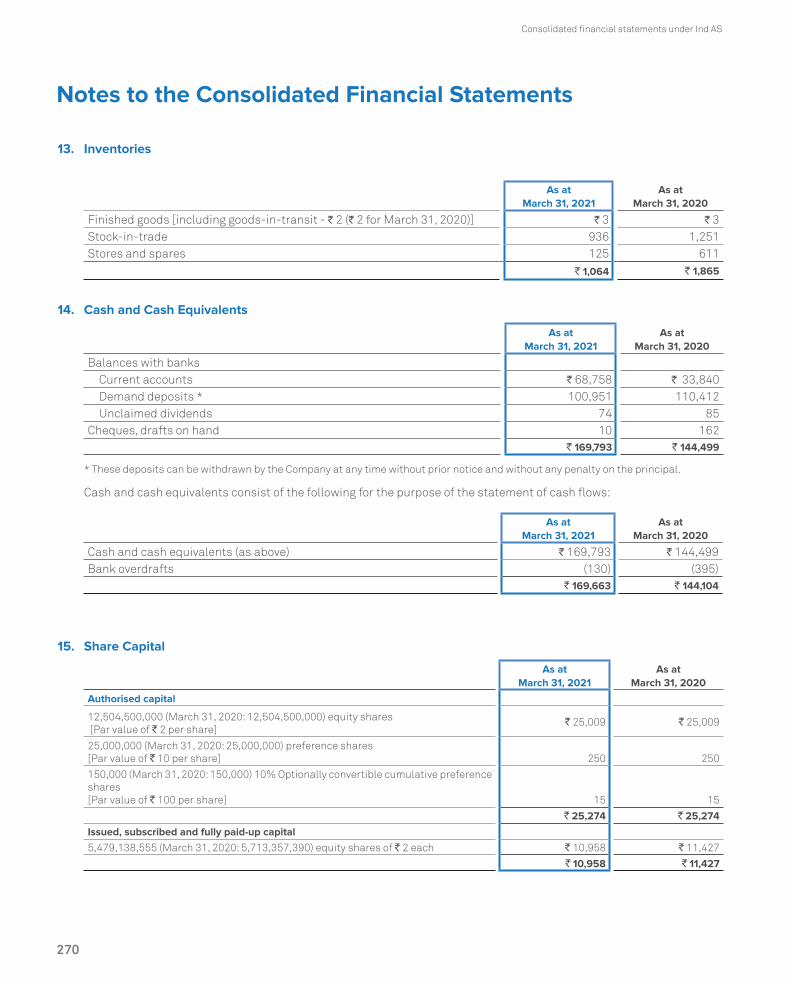
13. Inventories
As at March 31, 2021
As at March 31, 2020
Finished goods [including goods-in-transit - ` 2 (` 2 for March 31, 2020)] ` 3 ` 3 Stock-in-trade 936 1,251 Stores and spares 125 611
` 1,064 ` 1,865
14. Cash and Cash Equivalents
As at March 31, 2021
As at March 31, 2020
Balances with banksCurrent accounts ` 68,758 ` 33,840 Demand deposits * 100,951 110,412 Unclaimed dividends 74 85
Cheques, drafts on hand 10 162 ` 169,793 ` 144,499
* These deposits can be withdrawn by the Company at any time without prior notice and without any penalty on the principal.
Cash and cash equivalents consist of the following for the purpose of the statement of cash flows:
As at March 31, 2021
As at March 31, 2020
Cash and cash equivalents (as above) ` 169,793 ` 144,499 Bank overdrafts (130) (395)
` 169,663 ` 144,104
15. Share Capital
As at March 31, 2021
As at March 31, 2020
Authorised capital
12,504,500,000 (March 31, 2020: 12,504,500,000) equity shares [Par value of ` 2 per share]
` 25,009 ` 25,009
25,000,000 (March 31, 2020: 25,000,000) preference shares [Par value of ` 10 per share] 250 250
150,000 (March 31, 2020: 150,000) 10% Optionally convertible cumulative preference shares [Par value of ` 100 per share] 15 15
` 25,274 ` 25,274
Issued, subscribed and fully paid-up capital5,479,138,555 (March 31, 2020: 5,713,357,390) equity shares of ` 2 each ` 10,958 ` 11,427
` 10,958 ` 11,427
Notes to the Consolidated Financial Statements
Consolidated financial statements under Ind AS
270
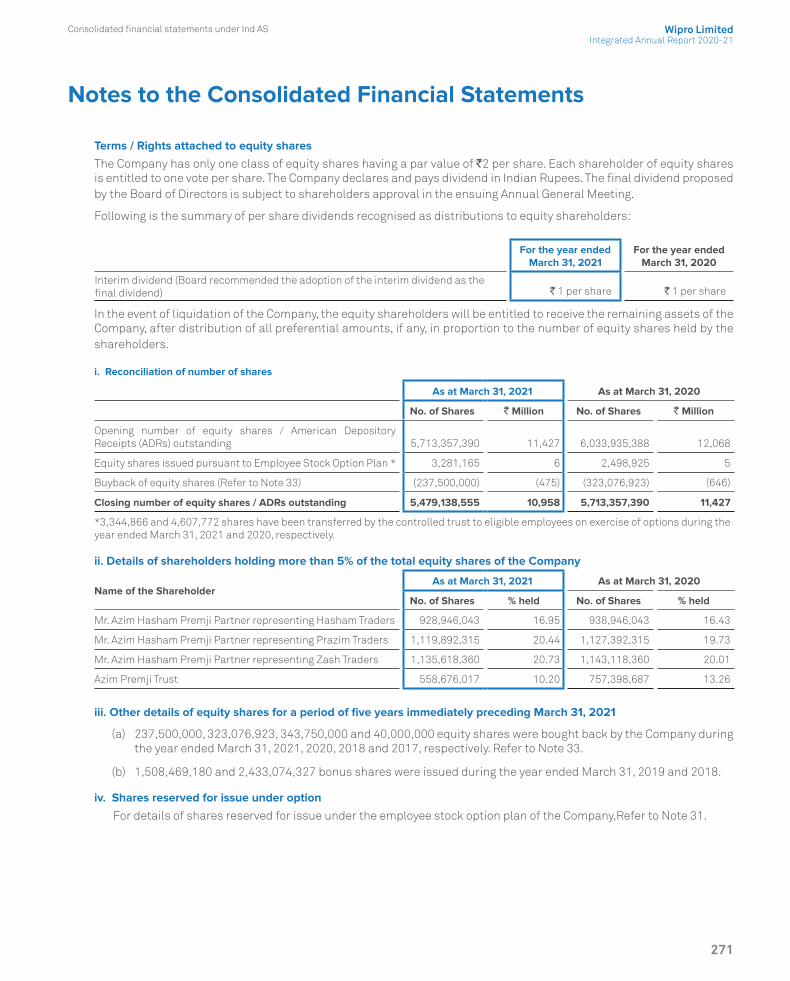
Terms / Rights attached to equity shares
The Company has only one class of equity shares having a par value of `2 per share. Each shareholder of equity shares is entitled to one vote per share. The Company declares and pays dividend in Indian Rupees. The final dividend proposed by the Board of Directors is subject to shareholders approval in the ensuing Annual General Meeting.
Following is the summary of per share dividends recognised as distributions to equity shareholders:
For the year endedMarch 31, 2021
For the year endedMarch 31, 2020
Interim dividend (Board recommended the adoption of the interim dividend as the final dividend) ` 1 per share ` 1 per share
In the event of liquidation of the Company, the equity shareholders will be entitled to receive the remaining assets of the Company, after distribution of all preferential amounts, if any, in proportion to the number of equity shares held by the shareholders.
i. Reconciliation of number of shares
As at March 31, 2021 As at March 31, 2020
No. of Shares ` Million No. of Shares ` Million
Opening number of equity shares / American Depository Receipts (ADRs) outstanding 5,713,357,390 11,427 6,033,935,388 12,068
Equity shares issued pursuant to Employee Stock Option Plan * 3,281,165 6 2,498,925 5
Buyback of equity shares (Refer to Note 33) (237,500,000) (475) (323,076,923) (646)
Closing number of equity shares / ADRs outstanding 5,479,138,555 10,958 5,713,357,390 11,427
*3,344,866 and 4,607,772 shares have been transferred by the controlled trust to eligible employees on exercise of options during the year ended March 31, 2021 and 2020, respectively.
ii. Details of shareholders holding more than 5% of the total equity shares of the Company
Name of the ShareholderAs at March 31, 2021 As at March 31, 2020
No. of Shares % held No. of Shares % held
Mr. Azim Hasham Premji Partner representing Hasham Traders 928,946,043 16.95 938,946,043 16.43
Mr. Azim Hasham Premji Partner representing Prazim Traders 1,119,892,315 20.44 1,127,392,315 19.73
Mr. Azim Hasham Premji Partner representing Zash Traders 1,135,618,360 20.73 1,143,118,360 20.01
Azim Premji Trust 558,676,017 10.20 757,398,687 13.26
iii. Other details of equity shares for a period of five years immediately preceding March 31, 2021
(a) 237,500,000, 323,076,923, 343,750,000 and 40,000,000 equity shares were bought back by the Company during the year ended March 31, 2021, 2020, 2018 and 2017, respectively. Refer to Note 33.
(b) 1,508,469,180 and 2,433,074,327 bonus shares were issued during the year ended March 31, 2019 and 2018.
iv. Shares reserved for issue under option
For details of shares reserved for issue under the employee stock option plan of the Company,Refer to Note 31.
Notes to the Consolidated Financial Statements
Consolidated financial statements under Ind ASIntegrated Annual Report 2020-21
Wipro Limited
271

Notes to the Consolidated Financial Statements
Consolidated financial statements under Ind AS
272
16. Borrowings
As at March 31, 2021
As at March 31, 2020
Non-current
Unsecured
Term loans:
Borrowings from banks ` 7,310 ` 4,535
Loans from institutions other than banks 148 305
Total Non-current ` 7,458 ` 4,840
Current
Unsecured
Bank overdrafts ` 130 ` 395
Borrowings from Banks * 60,233 53,624
Loans from institutions other than banks ** - 1
Total Current ` 60,363 ` 54,020
Total Borrowings ` 67,821 ` 58,860
* Current obligations under borrowings from banks amounting to ` 15,352 (March 31, 2020: ` 18,898) are classified under “Other current financial liabilities”.
** Current maturities of loans from institutions other than bank amounting to ` 159 (March 31, 2020: ` 284) are classified under “Other current financial liabilities”.
Short-term borrowings
The Company had loans, borrowings and bank overdrafts amounting to ` 60,363 and ` 54,020, as at March 31, 2021 and 2020, respectively. The principal source of borrowings from banks as at March 31, 2021 primarily consists of lines of credit of approximately ` 66,533, U.S. Dollar (U.S.$) 593 million, Canadian Dollar (CAD) 73 million, Saudi Riyal (SAR) 20 million, Euro (EUR) 33 million, Pound Sterling (GBP) 6 million, Qatari Riyal (QAR) 10 million, Brazilian Real (BRL) 13 million, Australian Dollar (AUD $) 150 million, Bahraini Dinar (BHD) 1 million and Indonesian Rupiah (IDR) 13,000 million from bankers for working capital requirements and other short-term needs.
As at March 31, 2021, the Company has unutilised lines of credit aggregating ` 8,620, U.S.$ 593 million, CAD 33 million, SAR 20 million, EUR 33 million, GBP 6 million, QAR 10 million, BRL 3 million, AUD $ 150 million, BHD 1 million, and IDR 13,000 million. To utilize these unused lines of credit, the Company requires consent of the lender and compliance with certain financial covenants. Significant portion of these lines of credit are revolving credit facilities and floating rate foreign currency loans, renewable on a periodic basis.
The Company has non-fund based revolving credit facilities in various currencies equivalent to 56,421and 41,597 as of March 31, 2021 and 2020, respectively, towards operational requirements that can be used for the issuance of letters of credit and bank guarantees. As of March 31, 2021 and 2020, an amount of ` 39,293 and ` 22,790,respectively, was unutilised out of these non-fund based facilities.
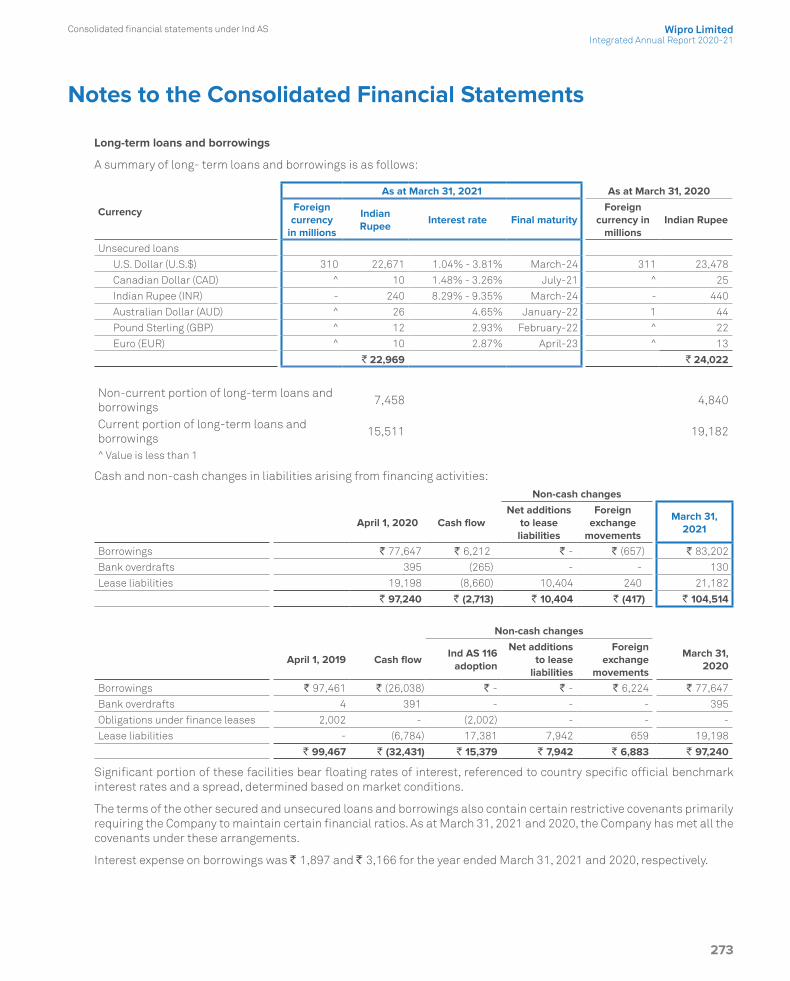
Notes to the Consolidated Financial Statements
Consolidated financial statements under Ind ASIntegrated Annual Report 2020-21
Wipro Limited
273
Long-term loans and borrowings
A summary of long- term loans and borrowings is as follows:
Currency
As at March 31, 2021 As at March 31, 2020
Foreign currency
in millions
Indian Rupee
Interest rate Final maturityForeign
currency in millions
Indian Rupee
Unsecured loans
U.S. Dollar (U.S.$) 310 22,671 1.04% - 3.81% March-24 311 23,478
Canadian Dollar (CAD) ^ 10 1.48% - 3.26% July-21 ^ 25
Indian Rupee (INR) - 240 8.29% - 9.35% March-24 - 440
Australian Dollar (AUD) ^ 26 4.65% January-22 1 44
Pound Sterling (GBP) ^ 12 2.93% February-22 ^ 22
Euro (EUR) ^ 10 2.87% April-23 ^ 13
` 22,969 ` 24,022
Non-current portion of long-term loans and borrowings
7,458 4,840
Current portion of long-term loans and borrowings
15,511 19,182
^ Value is less than 1
Cash and non-cash changes in liabilities arising from financing activities:Non-cash changes
April 1, 2020 Cash flowNet additions
to lease liabilities
Foreign exchange
movements
March 31, 2021
Borrowings ` 77,647 ` 6,212 ` - ` (657) ` 83,202
Bank overdrafts 395 (265) - - 130
Lease liabilities 19,198 (8,660) 10,404 240 21,182
` 97,240 ` (2,713) ` 10,404 ` (417) ` 104,514
Non-cash changes
April 1, 2019 Cash flowInd AS 116
adoption
Net additions to lease
liabilities
Foreign exchange
movements
March 31, 2020
Borrowings ` 97,461 ` (26,038) ` - ` - ` 6,224 ` 77,647
Bank overdrafts 4 391 - - - 395
Obligations under finance leases 2,002 - (2,002) - - -
Lease liabilities - (6,784) 17,381 7,942 659 19,198
` 99,467 ` (32,431) ` 15,379 ` 7,942 ` 6,883 ` 97,240
Significant portion of these facilities bear floating rates of interest, referenced to country specific official benchmark interest rates and a spread, determined based on market conditions.
The terms of the other secured and unsecured loans and borrowings also contain certain restrictive covenants primarily requiring the Company to maintain certain financial ratios. As at March 31, 2021 and 2020, the Company has met all the covenants under these arrangements.
Interest expense on borrowings was ` 1,897 and ` 3,166 for the year ended March 31, 2021 and 2020, respectively.

Notes to the Consolidated Financial Statements
Consolidated financial statements under Ind AS
274
17. Other financial liabilities
As at March 31, 2021
As at March 31, 2020
Non-currentCash Settled ADS RSUs (Refer to Note 31) ` 7 ` 146Contingent consideration (Refer to Note 7) 2,158 -Advance from customers 123 -Deposits and others 3 5
` 2,291 ` 151CurrentSalary payable ` 24,696 ` 19,729Current maturities of long-term borrowings * 15,511 19,182Interest accrued but not due on borrowing 47 55Unclaimed dividends 74 85Cash Settled ADS RSUs (Refer to Note 31) 24 350Contingent consideration (Refer to Note 7) 135 -Advance from customers 496 -Deposits and others 694 409
` 41,677 ` 39,810Total ` 43,968 ` 39,961* For rate of interest and other term and conditions, refer to Note 16.
18. Provisions
As at March 31, 2021
As at March 31, 2020
Non-current:Provision for employee benefits ` 3,055 ` 3,766Provision for warranty 2 2
` 3,057 ` 3,768Current:Provision for employee benefits ` 14,401 ` 12,358Provision for warranty 213 316Others 864 689
` 15,478 ` 13,363Total ` 18,535 ` 17,131
Provision for warranty represents cost associated with providing sales support services which are accrued at the time of recognition of revenues and are expected to be utilised over a period of 1 to 2 years. Other provisions primarily include provisions for compliance related contingencies. The timing of cash outflows in respect of such provision cannot be reasonably determined.
A summary of activity in provision for warranty and other provisions is as follows:
ParticularsYear ended March 31, 2021 Year ended March 31, 2020
Provision for warranty
Others TotalProvision
for warrantyOthers Total
Provision at the beginning of the year ` 318 ` 689 ` 1,007 ` 277 ` 717 ` 994
Additions during the year, net 246 284 530 359 138 497
Utilised/written-back during the year (349) (109) (458) (318) (166) (484)
Provision at the end of the year ` 215 ` 864 ` 1,079 ` 318 ` 689 ` 1,007
Included in the consolidated balance sheet as follows:
Non-current portion ` 2 ` - ` 2 ` 2 ` - ` 2
Current portion ` 213 ` 864 ` 1,077 ` 316 ` 689 ` 1,005
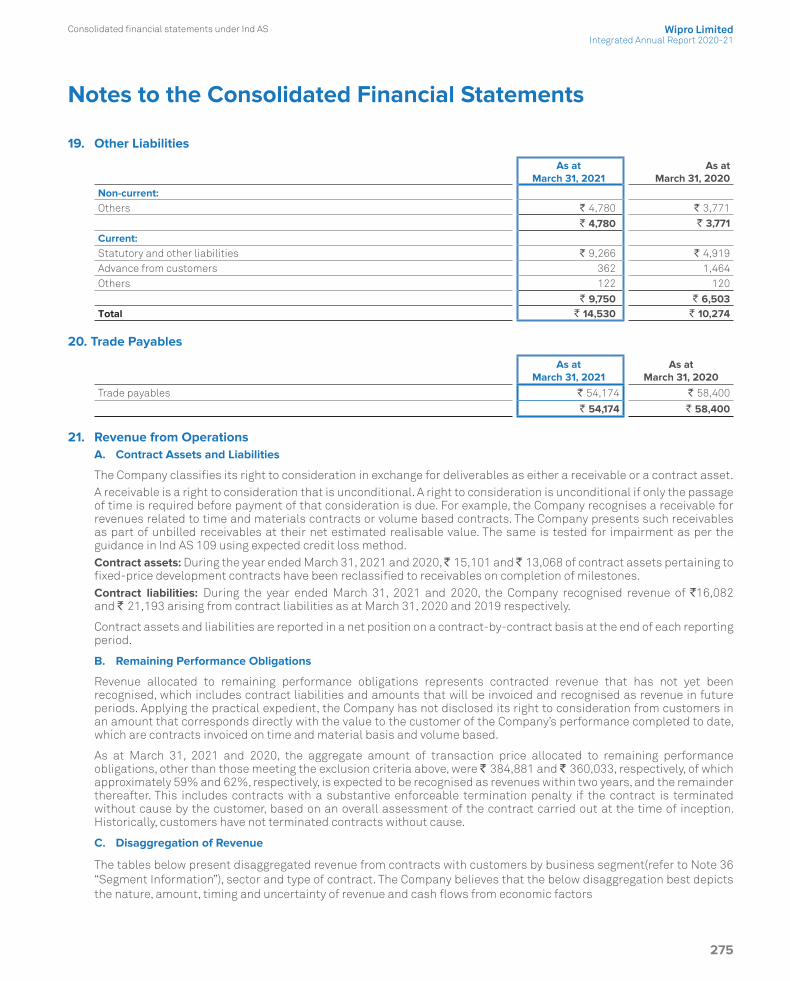
Notes to the Consolidated Financial Statements
Consolidated financial statements under Ind ASIntegrated Annual Report 2020-21
Wipro Limited
275
19. Other Liabilities
As at March 31, 2021
As at March 31, 2020
Non-current:Others ` 4,780 ` 3,771
` 4,780 ` 3,771Current:Statutory and other liabilities ` 9,266 ` 4,919Advance from customers 362 1,464Others 122 120
` 9,750 ` 6,503Total ` 14,530 ` 10,274
20. Trade Payables
As at March 31, 2021
As at March 31, 2020
Trade payables ` 54,174 ` 58,400
` 54,174 ` 58,400
21. Revenue from OperationsA. Contract Assets and Liabilities
The Company classifies its right to consideration in exchange for deliverables as either a receivable or a contract asset. A receivable is a right to consideration that is unconditional. A right to consideration is unconditional if only the passage of time is required before payment of that consideration is due. For example, the Company recognises a receivable for revenues related to time and materials contracts or volume based contracts. The Company presents such receivables as part of unbilled receivables at their net estimated realisable value. The same is tested for impairment as per the guidance in Ind AS 109 using expected credit loss method.Contract assets: During the year ended March 31, 2021 and 2020, ` 15,101 and ` 13,068 of contract assets pertaining to fixed-price development contracts have been reclassified to receivables on completion of milestones.Contract liabilities: During the year ended March 31, 2021 and 2020, the Company recognised revenue of `16,082 and ` 21,193 arising from contract liabilities as at March 31, 2020 and 2019 respectively.
Contract assets and liabilities are reported in a net position on a contract-by-contract basis at the end of each reporting period.
B. Remaining Performance Obligations
Revenue allocated to remaining performance obligations represents contracted revenue that has not yet been recognised, which includes contract liabilities and amounts that will be invoiced and recognised as revenue in future periods. Applying the practical expedient, the Company has not disclosed its right to consideration from customers in an amount that corresponds directly with the value to the customer of the Company’s performance completed to date, which are contracts invoiced on time and material basis and volume based.
As at March 31, 2021 and 2020, the aggregate amount of transaction price allocated to remaining performance obligations, other than those meeting the exclusion criteria above, were ` 384,881 and ` 360,033, respectively, of which approximately 59% and 62%, respectively, is expected to be recognised as revenues within two years, and the remainder thereafter. This includes contracts with a substantive enforceable termination penalty if the contract is terminated without cause by the customer, based on an overall assessment of the contract carried out at the time of inception. Historically, customers have not terminated contracts without cause.
C. Disaggregation of Revenue
The tables below present disaggregated revenue from contracts with customers by business segment(refer to Note 36 “Segment Information”), sector and type of contract. The Company believes that the below disaggregation best depicts the nature, amount, timing and uncertainty of revenue and cash flows from economic factors
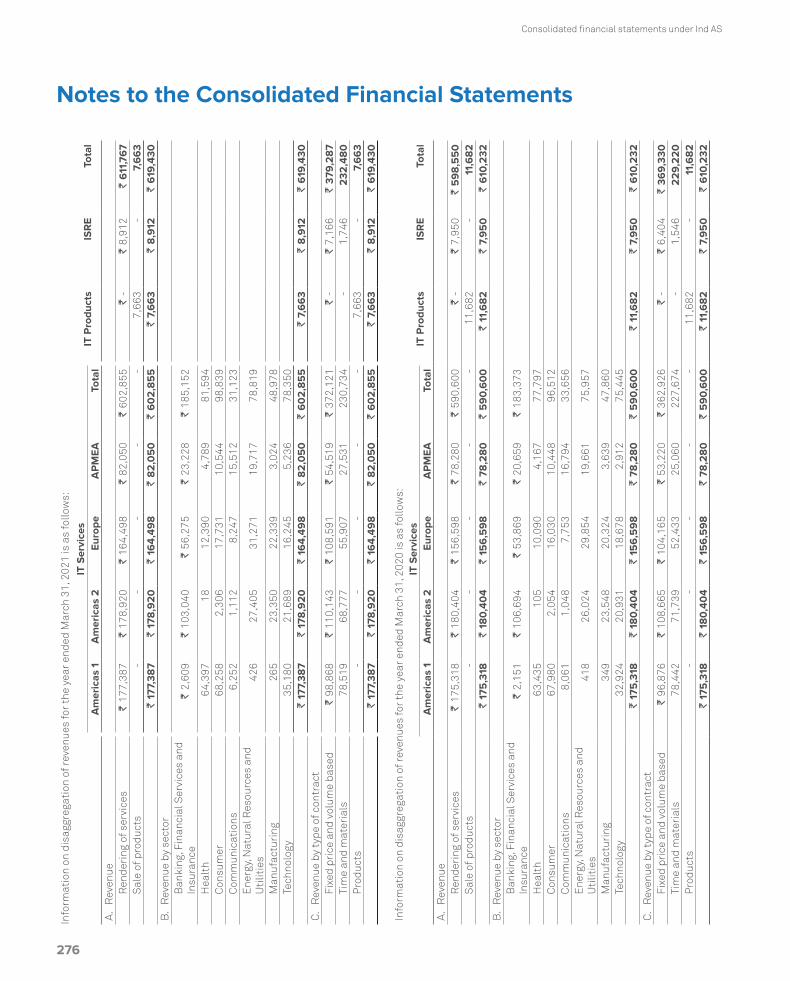
Notes to the Consolidated Financial Statements
Consolidated financial statements under Ind AS
276
Info
rmat
ion
on d
isag
greg
atio
n of
reve
nues
for
the
year
end
ed M
arch
31,
202
1 is
as
follo
ws:
IT S
ervi
ces
IT P
rodu
cts
ISR
ETo
tal
Am
eric
as 1
Am
eric
as 2
Euro
peA
PM
EATo
tal
A.
Rev
enue
Ren
deri
ng o
f ser
vice
s`
177,
387
` 17
8,92
0`
164,
498
` 82
,050
` 60
2,85
5`
-`
8,91
2`
611
,76
7 S
ale
of p
rodu
cts
--
--
-7,
663
-7,
66
3`
177,
387
` 17
8,9
20
` 16
4,49
8`
82
,05
0`
60
2,8
55
` 7,
66
3`
8,9
12`
619
,430
B.
Rev
enue
by
sect
or B
anki
ng, F
inan
cial
Ser
vice
s an
d In
sura
nce
` 2,
609
` 10
3,04
0`
56,2
75`
23,2
28`
185,
152
Hea
lth
64,3
9718
12,3
904,
789
81,5
94 C
onsu
mer
68,2
582,
306
17,7
3110
,544
98,8
39 C
omm
unic
atio
ns6,
252
1,11
28,
247
15,5
1231
,123
Ene
rgy,
Nat
ural
Res
ourc
es a
nd
Uti
litie
s42
627
,405
31,2
7119
,717
78,8
19
Man
ufac
turi
ng26
523
,350
22,3
393,
024
48,9
78 T
echn
olog
y35
,180
21,6
8916
,245
5,23
678
,350
` 17
7,38
7`
178
,92
0`
164,
498
` 8
2,0
50
` 6
02
,85
5`
7,6
63
` 8
,912
` 6
19,4
30C
. R
even
ue b
y ty
pe o
f con
trac
t F
ixed
pri
ce a
nd v
olum
e ba
sed
` 98
,868
` 11
0,14
3`
108,
591
` 54
,519
` 37
2,12
1`
-`
7,16
6`
379,
28
7 T
ime
and
mat
eria
ls78
,519
68,7
7755
,907
27,5
3123
0,73
4-
1,74
62
32,4
80
Pro
duct
s-
--
--
7,66
3-
7,6
63
` 17
7,38
7`
178
,92
0`
164,
498
` 8
2,0
50
` 6
02
,85
5`
7,6
63
` 8
,912
` 6
19,4
30
Info
rmat
ion
on d
isag
greg
atio
n of
reve
nues
for
the
year
end
ed M
arch
31,
202
0 is
as
follo
ws:
IT S
ervi
ces
IT P
rodu
cts
ISR
ETo
tal
Am
eric
as 1
Am
eric
as 2
Euro
peA
PM
EATo
tal
A.
Rev
enue
Ren
deri
ng o
f ser
vice
s`
175,
318
` 18
0,40
4`
156,
598
` 78
,280
` 59
0,60
0`
-`
7,95
0`
59
8,5
50
Sal
e of
pro
duct
s-
--
--
11,6
82-
11,6
82
` 17
5,3
18`
180
,40
4`
156
,59
8`
78,2
80
` 5
90
,60
0`
11,6
82
` 7,
95
0`
610
,232
B.
Rev
enue
by
sect
or B
anki
ng, F
inan
cial
Ser
vice
s an
d In
sura
nce
` 2,
151
` 10
6,69
4`
53,8
69`
20,6
59`
183,
373
Hea
lth
63,4
3510
510
,090
4,16
777
,797
Con
sum
er67
,980
2,05
416
,030
10,4
4896
,512
Com
mun
icat
ions
8,06
11,
048
7,75
316
,794
33,6
56 E
nerg
y, N
atur
al R
esou
rces
and
U
tilit
ies
418
26,0
2429
,854
19,6
6175
,957
Man
ufac
turi
ng34
923
,548
20,3
243,
639
47,8
60 T
echn
olog
y32
,924
20,9
3118
,678
2,91
275
,445
` 17
5,3
18`
180
,40
4`
156
,59
8`
78,2
80
` 5
90
,60
0`
11,6
82
` 7,
95
0`
610
,232
C.
Rev
enue
by
type
of c
ontr
act
Fix
ed p
rice
and
vol
ume
base
d`
96,8
76`
108,
665
` 10
4,16
5`
53,2
20`
362,
926
` -
` 6,
404
` 36
9,33
0 T
ime
and
mat
eria
ls78
,442
71,7
3952
,433
25,0
6022
7,67
4-
1,54
62
29,
22
0 P
rodu
cts
--
--
-11
,682
-11
,68
2`
175
,318
` 18
0,4
04
` 15
6,5
98
` 78
,28
0`
59
0,6
00
` 11
,68
2`
7,9
50
` 6
10,2
32
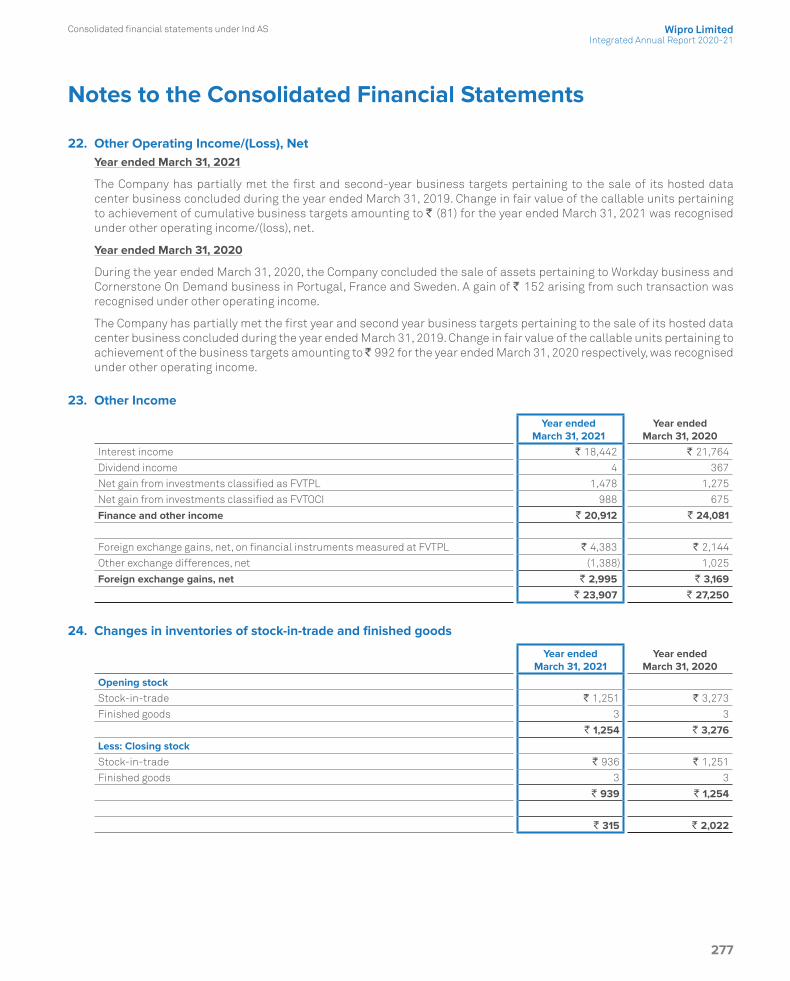
Notes to the Consolidated Financial Statements
Consolidated financial statements under Ind ASIntegrated Annual Report 2020-21
Wipro Limited
277
22. Other Operating Income/(Loss), NetYear ended March 31, 2021
The Company has partially met the first and second-year business targets pertaining to the sale of its hosted data center business concluded during the year ended March 31, 2019. Change in fair value of the callable units pertaining to achievement of cumulative business targets amounting to ` (81) for the year ended March 31, 2021 was recognised under other operating income/(loss), net.
Year ended March 31, 2020
During the year ended March 31, 2020, the Company concluded the sale of assets pertaining to Workday business and Cornerstone On Demand business in Portugal, France and Sweden. A gain of ` 152 arising from such transaction was recognised under other operating income.
The Company has partially met the first year and second year business targets pertaining to the sale of its hosted data center business concluded during the year ended March 31, 2019. Change in fair value of the callable units pertaining to achievement of the business targets amounting to ` 992 for the year ended March 31, 2020 respectively, was recognised under other operating income.
23. Other Income
Year ended March 31, 2021
Year ended March 31, 2020
Interest income ` 18,442 ` 21,764
Dividend income 4 367
Net gain from investments classified as FVTPL 1,478 1,275
Net gain from investments classified as FVTOCI 988 675
Finance and other income ` 20,912 ` 24,081
Foreign exchange gains, net, on financial instruments measured at FVTPL ` 4,383 ` 2,144
Other exchange differences, net (1,388) 1,025
Foreign exchange gains, net ` 2,995 ` 3,169
` 23,907 ` 27,250
24. Changes in inventories of stock-in-trade and finished goods
Year ended March 31, 2021
Year ended March 31, 2020
Opening stockStock-in-trade ` 1,251 ` 3,273
Finished goods 3 3
` 1,254 ` 3,276
Less: Closing stockStock-in-trade ` 936 ` 1,251
Finished goods 3 3
` 939 ` 1,254
` 315 ` 2,022

Notes to the Consolidated Financial Statements
Consolidated financial statements under Ind AS
278
25. Employee benefits
a) Employee costs includesYear ended
March 31, 2021Year ended
March 31, 2020Salaries and bonus ` 318,043 ` 315,036Employee benefits plans
Gratuity and other defined benefit plans 2,085 1,845Defined contribution plans 9,346 8,428
Share-based compensation* 2,897 1,262` 332,371 ` 326,571
* Includes ` 587 for the year ended March 31, 2021, towards cash settled ADS RSUs.
Remeasurements of the defined benefit plans, net recognised in other comprehensive income include:Year ended
March 31, 2021Year ended
March 31, 2020Remeasurements of the defined benefit plans, net
Return on plan assets excluding interest income - (gain)/loss ` (578) ` 76
Actuarial (gain)/loss arising from financial assumptions 423 749
Actuarial (gain)/loss arising from demographic assumptions 155 227
Actuarial (gain)/loss arising from experience adjustments (334) 194
` (334) ` 1,246
b) Defined benefit plans
Defined benefit plans include gratuity for employees drawing salary in Indian rupees and certain benefits plans in foreign jurisdictions
Amount recognised in the consolidated statement of profit and loss in respect of defined benefit plans is as follows:
Year ended March 31, 2021
Year ended March 31, 2020
Current service cost ` 2,085 ` 1,782Net interest on net defined benefit liability/(asset) 131 63
` 2,216 ` 1,845
Actual return on plan assets ` 1,127 ` 513
Change in present value of defined benefit obligation is summarised below:
As at March 31, 2021
As at March 31, 2020
Defined benefit obligation at the beginning of the year ` 13,465 ` 10,485Acquisitions 7 229Current service cost 2,085 1,782Interest on obligation 681 652Benefits paid (1,069) (1,123)Remeasurement (gain)/loss
Actuarial (gain)/loss arising from financial assumptions 423 749Actuarial (gain)/loss arising from demographic assumptions 155 227Actuarial (gain)/loss arising from experience adjustments (334) 194
Translation adjustment 62 270Defined benefit obligation at the end of the year ` 15,475 ` 13,465

Notes to the Consolidated Financial Statements
Consolidated financial statements under Ind ASIntegrated Annual Report 2020-21
Wipro Limited
279
Change in plan assets is summarised below:As at
March 31, 2021As at
March 31, 2020Fair value of plan assets at the beginning of the year ` 10,535 ` 9,443
Acquisitions - 58
Expected return on plan assets 550 589
Employer contributions 1,993 383
Benefits paid (76) (95)
Remeasurement (loss)/gain
Return on plan assets excluding interest income - (loss)/gain 578 (76)
Translation adjustment 57 233
Fair value of plan assets at the end of the year ` 13,637 ` 10,535Present value of unfunded obligation ` (1,838) ` (2,930)
Recognised liability ` (1,838) ` (2,930)
As at March 31, 2021 and 2020, plan assets were primarily invested in insurer managed funds.
The Company has established an income tax approved irrevocable trust fund to which it regularly contributes to finance the liabilities of the gratuity plan. The fund’s investments are managed by certain insurance companies as per the selection made by the trustees among the fund plan available.
The principal assumptions used for the purpose of actuarial valuation of these defined benefit plans are as follows:
As at March 31, 2021
As at March 31, 2020
Discount rate 4.69% 5.05%
Expected return on plan assets 4.69% 5.05%
Expected rate of salary increase 6.57% 6.60%
Duration of defined benefit obligations 9 years 9 years
The expected return on plan assets is based on expectation of the average long-term rate of return expected on investments of the fund during the estimated term of the obligations.
The discount rate is primarily based on the prevailing market yields of government securities for the estimated term of the obligations. The estimates of future salary increase considered takes into account the inflation, seniority, promotion and other relevant factors. Attrition rate considered is the management’s estimate, based on previous years’ employee turnover of the Company.
The expected future contribution and estimated future benefit payments from the fund are as follows:
Expected contribution to the fund during the year ending March 31, 2022 ` 1,787Estimated benefit payments from the fund for the year ending March 31:
2022 ` 1,8022023 1,4172024 1,4062025 1,3852026 1,361
Thereafter 15,915Total ` 23,286
The expected benefits are based on the same assumptions used to measure the Company’s benefit obligations as of March 31, 2021.
Sensitivity for significant actuarial assumptions is computed to show the movement in defined benefit obligation by 1 percentage.

Notes to the Consolidated Financial Statements
Consolidated financial statements under Ind AS
280
As of March 31, 2021, every 1 percentage point increase/ (decrease) in discount rate will result in (decrease)/increase of defined benefit obligation by approximately ` (1,508) and ` 1,440 respectively (March 31, 2020: ` (1,252) and ` 1,168 respectively).
As of March 31, 2021, every 1 percentage point increase/ (decrease) in expected rate of salary will result in increase/ (decrease) of defined benefit obligation by approximately ` 864 and ` (798) respectively (March 31, 2020: ` 706 and ` (658) respectively).
c) Provident fund:The details of fund and plan assets are given below:
As at March 31, 2021
As at March 31, 2020
Fair value of plan assets ` 71,196 ` 61,397Present value of defined benefit obligation (71,196) (61,397)Net (shortfall)/ excess ` - ` -The plan assets have been invested as per the regulations of Employees' Provident Fund Organisation (EPFO).
The principal assumptions used in determining the present value obligation of interest guarantee under the deterministic approach are as follows:
As at March 31, 2021
As at March 31, 2020
Discount rate for the term of the obligation 5.80% 6.05%Average remaining tenure of investment portfolio 6 years 7 yearsGuaranteed rate of return 8.50% 8.50%Refer to Note 31 for details of employee stock options.
26. Finance Costs
Year ended March 31, 2021
Year ended March 31, 2020
Interest expense ` 4,298 ` 5,136
Exchange fluctuation on foreign currency borrowings, net (to the extent regarded as borrowing cost)
790 2,192
` 5,088 ` 7,328
27. Other Expenses
Year ended March 31, 2021
Year ended March 31, 2020
Rates, taxes and insurance ` 3,475 ` 3,004
Miscellaneous expenses 5,248 5,453
` 8,723 ` 8,457
28. Income Tax
Income tax expense has been allocated as follows:
Year ended March 31, 2021
Year ended March 31, 2020
Income tax expense as per the consolidated statement of profit and loss ` 30,349 ` 24,801
Income tax included in other comprehensive income on:
Unrealised gains/(losses) on investment securities 226 (230)
Gains/(losses) on cash flow hedging derivatives 1,013 (1,165)
Remeasurements of the defined benefit plans 111 (196)
` 31,699 ` 23,210

Notes to the Consolidated Financial Statements
Consolidated financial statements under Ind ASIntegrated Annual Report 2020-21
Wipro Limited
281
Income tax expenses consist of the following:
Year ended March 31, 2021
Year ended March 31, 2020
Current taxes
Domestic ` 19,773 ` 18,437
Foreign 6,292 5,887
` 26,065 ` 24,324
Deferred taxes
Domestic ` 3,986 ` 1,626
Foreign 298 (1,149)
` 4,284 ` 477
` 30,349 ` 24,801
The reconciliation between the provision of income tax and amounts computed by applying the Indian statutory income tax rate to profit before tax is as follows:
Year ended March 31, 2021
Year ended March 31, 2020
Profit before tax ` 139,029 ` 122,519
Enacted income tax rate in India 34.94% 34.94%
Computed expected tax expense 48,577 42,808
Effect of:
Income exempt from tax (12,697) (12,930)
Basis differences that will reverse during a tax holiday period (2,268) 480
Income taxed at higher/ (lower) rates (2,381) (3,122)
Taxes related to income of prior years (3,861) (116)
Changes in unrecognised deferred tax assets 1,096 (3,898)
Expenses disallowed for tax purpose 1,879 1,785
Others, net 4 (206)
Income tax expense ` 30,349 ` 24,801
Effective tax rate 21.83% 20.24%
The components of deferred tax assets and liabilities are as follows:
As at March 31, 2021
As at March 31, 2020
Carry-forward losses * ` 1,637 ` 2,044
Trade payables and other liabilities 5,115 4,994
Allowance for lifetime expected credit losses 3,208 3,921
Minimum alternate tax - 3,425
Cash flow hedges - 561
Contract asset 91 -
Others 90 -
10,141 14,945

Notes to the Consolidated Financial Statements
Consolidated financial statements under Ind AS
282
As at March 31, 2021
As at March 31, 2020
Property, plant and equipment (1,241) (654)
Amortisable goodwill (2,065) (2,166)
Intangible assets (1,249) (1,541)
Interest Income and fair value movement of investment (1,582) (626)
Cash flow hedges (452) -
Contract liabilities - (11)
SEZ re-investment reserve (6,494) (6,614)
Others - (121)
` (13,083) ` (11,733)
Net deferred tax assets ` (2,942) ` 3,212
Amounts presented in the consolidated balance sheet
Deferred tax assets ` 1,664 ` 6,005
Deferred tax liabilities ` (4,606) ` (2,793)
* Includes deferred tax asset recognised on carry-forward losses pertaining to business combinations.
Movement in deferred tax assets and liabilities
Movement during the year ended March 31, 2021As at
April 1, 2020
Credit/ (charge) in the consolidated
statement of profit and loss
Credit/ (charge) in other
comprehensive income*
OthersAs at
March 31, 2021
Carry-forward losses ` 2,044 ` (230) ` (22) ` (155) ` 1,637
Trade payables and other liabilities 4,994 279 (171) 13 5,115
Allowance for lifetime expected credit losses 3,921 (734) 21 - 3,208
Minimum alternate tax 3,425 (3,425) - - -
Property, plant and equipment (654) (653) 65 1 (1,241)
Amortisable goodwill (2,166) 34 67 - (2,065)
Intangible assets (1,541) 759 (55) (412) (1,249)
Interest Income and fair value movement of investment (626) (730) (226) - (1,582)
Cash flow hedges 561 - (1,013) - (452)
Contract asset / (Contract liabilities) (11) 101 4 (3) 91
SEZ re-investment reserve (6,614) 120 - - (6,494)
Others (121) 195 16 - 90
Total ` 3,212 ` (4,284) ` (1,314) ` (556) ` (2,942)

Notes to the Consolidated Financial Statements
Consolidated financial statements under Ind ASIntegrated Annual Report 2020-21
Wipro Limited
283
Movement during the year ended March 31, 2020As at April
1, 2019
Credit/ (charge) in the consolidated
statement of profit and loss
Credit/ (charge) in other
comprehensive income*
On account of business combination
As at March 31,
2020
Carry-forward losses ` 3,149 ` (1,287) ` 182 ` - ` 2,044
Trade payables and other liabilities 3,713 1,033 248 - 4,994
Allowance for lifetime expected credit losses 4,521 (591) (9) - 3,921
Minimum alternate tax - 3,425 - - 3,425
Property, plant and equipment (1,807) 1,148 5 - (654)
Amortisable goodwill (1,899) (92) (175) - (2,166)
Intangible assets (2,295) 1,021 (90) (177) (1,541)
Interest Income and fair value movement of investment (1,455) 599 230 - (626)
Cash flow hedges (604) - 1,165 - 561
Contract liabilities (289) 285 (7) - (11)
SEZ re-investment reserve (1,132) (5,482) - - (6,614)
Others 318 (536) 97 - (121)
Total ` 2,220 ` (477) ` 1,646 ` (177) ` 3,212
*Includes impact of foreign currency translation.
Deferred taxes on unrealised foreign exchange gain / loss relating to cash flow hedges, fair value movements in investments and remeasurements of the defined benefit plans are recognised in other comprehensive income. Deferred tax liability on the intangible assets identified and carry forward losses on acquisitions is recorded by an adjustment to goodwill. Other than these, the change in deferred tax assets and liabilities is primarily recorded in the consolidated statement of profit and loss.
In assessing the realizability of deferred tax assets, the Company considers the extent to which it is probable that the deferred tax asset will be realised. The ultimate realisation of deferred tax assets is dependent upon the generation of future taxable profits during the periods in which those temporary differences and tax loss carry-forwards become deductible. The Company considers the expected reversal of deferred tax liabilities, projected future taxable income and tax planning strategies in making this assessment. Based on this, the Company believes that it is probable that the Company will realize the benefits of these deductible differences. The amount of deferred tax asset considered realisable, however, could be reduced in the near term if the estimates of future taxable income during the carry-forward period are reduced.
Deferred tax asset amounting to ` 8,676 and ` 8,124 as at March 31, 2021and 2020, respectively in respect of unused tax losses have not been recognised by the Company. The tax loss carry-forwards of ` 31,993 and ` 29,736 as at March 31, 2021 and 2020, respectively, on which deferred tax asset has not been recognized by the Company, because it is probable that future taxable profits will not be available against which the unused tax losses can be utilized in the foreseeable future. Approximately, ` 17,691 and ` 14,429 as at March 31, 2021 and 2020, respectively, of these tax loss carry-forwards is not currently subject to expiration dates. The remaining tax loss carry-forwards of approximately ` 14,302 and ` 15,307 as at March 31, 2021 and 2020, respectively, expires in various years through fiscal 2038.
The Company has recognised deferred tax assets of ` 1,637 and ` 2,044 primarily in respect of carry forward losses including certain subsidiaries as at March 31, 2021 and 2020, respectively. Management’s projections of future taxable income and tax planning strategies support the assumption that it is probable that sufficient taxable income will be available to utilise these deferred tax assets.
The Company calculates its tax liability for domestic taxes after considering MAT. The excess tax paid under MAT provisions over and above normal tax liability can be carried forward and set-off against future tax liabilities computed under normal tax provisions. Deferred tax asset relating to MAT payment of ` Nil and ` 3,425 has been recognised in the statement of consolidated financial position as at March 31, 2021 and 2020, respectively.
A substantial portion of the profits of the Company’s India operations are exempt from Indian income taxes being profits attributable to export operations and profits from units established under the Special Economic Zone Act, 2005 scheme.

Notes to the Consolidated Financial Statements
Consolidated financial statements under Ind AS
284
Units in designated special economic zones providing service on or after April 1, 2005 will be eligible for a deduction of 100 percent of profits or gains derived from the export of services for the first five years from commencement of provision of services and 50 percent of such profits and gains for a further five years. Certain tax benefits are also available for a further five years subject to the unit meeting defined conditions. Profits from certain other undertakings are also eligible for preferential tax treatment. The tax holiday period being currently available to the Company expires in various years through fiscal 2034-35. The impact of tax holidays has resulted in a decrease of current tax expense of ` 11,458 and ` 11,963 for the years ended March 31, 2021 and 2020, respectively, compared to the effective tax amounts that we estimate the Company would have been required to pay if these incentives had not been available. The per share effect of these tax incentives for the years ended March 31, 2021 and 2020 was ` 2.03 and ` 2.05, respectively.
Deferred income tax liabilities are recognised for all taxable temporary differences except in respect of taxable temporary differences associated with investments in subsidiaries where the timing of the reversal of the temporary difference can be controlled and it is probable that the temporary difference will not reverse in the foreseeable future. Accordingly, deferred income tax liabilities on cumulative earnings of subsidiaries amounting to ` 59,793 and ` 56,391 as at March 31, 2021and 2020, respectively and branch profit tax @ 15% of the US branch profit have not been recognised. Further, it is not practicable to estimate the amount of the unrecognised deferred tax liabilities for these undistributed earnings.
29. Foreign Currency Translation Reserve and Other ReservesThe movement in foreign currency translation reserve attributable to equity holders of the Company is summarised below:
As at March 31, 2021
As at March 31, 2020
Balance at the beginning of the year ` 21,981 ` 14,048
Translation difference related to foreign operations, net (465) 7,933
Balance at the end of the year ` 21,516 ` 21,981
The movement in other reserves is summarised below:
Particulars
Other reserves
Remeasurements of the defined benefit
plans
Investment in debt instruments
measured at fair value through OCI
Investment in equity instruments
measured at fair value through OCI
As at April 1, 2019 ` (70) ` 1,164 ` (561)Other comprehensive income (1,050) 1,222 724
As at March 31, 2020 ` (1,120) ` 2,386 ` 163
As at April 1, 2020 ` (1,120) ` 2,386 ` 163Other comprehensive income 223 1,851 1,216
As at March 31, 2021 ` (897) ` 4,237 ` 1,379
30. Earnings per Equity ShareA reconciliation of profit for the year and equity shares used in the computation of basic and diluted earnings per equity share is set out below:
Basic: Basic earnings per share is calculated by dividing the profit attributable to equity shareholders of the Company by the weighted average number of equity shares outstanding during the year, excluding equity shares purchased by the Company and held as treasury shares.
Year ended March 31, 2021
Year ended March 31, 2020
Profit attributable to equity holders of the Company ` 107,964 ` 97,223
Weighted average number of equity shares outstanding 5,649,265,885 5,833,384,018
Basic earnings per share ` 19.11 ` 16.67

Notes to the Consolidated Financial Statements
Consolidated financial statements under Ind ASIntegrated Annual Report 2020-21
Wipro Limited
285
Diluted: Diluted earnings per share is calculated by adjusting the weighted average number of equity shares outstanding during the year for assumed conversion of all dilutive potential equity shares. Employee share options are dilutive potential equity shares for the Company.
The calculation is performed in respect of share options to determine the number of shares that could have been acquired at fair value (determined as the average market price of the Company’s shares during the year). The number of shares calculated as above is compared with the number of shares that would have been issued assuming the exercise of the share options.
Year ended March 31, 2021
Year ended March 31, 2020
Profit attributable to equity holders of the Company ` 107,964 ` 97,223
Weighted average number of equity shares outstanding 5,649,265,885 5,833,384,018
Effect of dilutive equivalent share options 12,391,937 14,439,221
Weighted average number of equity shares for diluted earnings per share 5,661,657,822 5,847,823,239
Diluted earnings per share ` 19.07 ` 16.63
31. Employee Stock OptionThe stock compensation expense recognised for employee services received during the Year ended March 31, 2021 and 2020 were ` 2,897 and ` 1,262, respectively.
Wipro Equity Reward Trust ("WERT")
In 1984, the Company established a controlled trust called the Wipro Equity Reward Trust (“WERT”). In the earlier years, WERT purchased shares of the Company out of funds borrowed from the Company. The Company’s Board Governance, Nomination and Compensation Committee recommends to WERT certain officers and key employees, to whom WERT issues shares from its holdings at nominal price subject to vesting conditions. WERT held 19,401,215 and 22,746,081 treasury shares as at March 31, 2021 and 2020, respectively.
Wipro Employee Stock Option Plans and Restricted Stock Unit Option Plans
A summary of the general terms of grants under stock option plans and restricted stock unit option plans are as follows:
Name of PlanNumber of options reserved under the
plan
Range of exercise price
Wipro ADS Restricted Stock Unit Plan (WARSUP 2004 plan) * 59,797,979 US $ 0.03
Wipro Employee Restricted Stock Unit Plan 2005 (WSRUP 2005 plan) * 59,797,979 ` 2
Wipro Employee Restricted Stock Unit Plan 2007 (WSRUP 2007 plan) * 49,831,651 ` 2
Wipro Equity Reward Trust Employee Stock Purchase Plan, 2013 ** 39,546,197 ` 2
Employees covered under Stock Option Plans and Restricted Stock Unit (RSU) Option Plans (collectively “Stock Option Plans”) are granted an option to purchase shares of the Company at the respective exercise prices, subject to requirements of vesting conditions. These options generally vest in tranches over a period of two to four years from the date of grant. Upon vesting, the employees can acquire one equity share for every option.
* The maximum contractual term for these Stock Option Plans and RSU Option Plans isperpetual until the options are available for grant under the plan.
** The maximum contractual term for these Stock Option Plans isup to May 29, 2023, until the options are available for grant under the plan.

Notes to the Consolidated Financial Statements
Consolidated financial statements under Ind AS
286
The activity in equity-settled stock option plans and restricted stock unit option plan is summarised below:
Range of exercise price and Weighted
average exercise price
Number of options
Year ended March 31, 2021
Year ended March 31, 2020
Outstanding at the beginning of the year` 2 15,594,190 17,607,463
US $0.03 7,854,540 14,446,790
Granted*` 2 6,275,290 5,662,500
US $0.03 5,033,648 5,341,000
Exercised` 2 (3,356,199) (4,610,572)
US $0.03 (3,269,832) (2,496,125)
Modification **` 2 - -
US $0.03 3,453,015 (5,681,966)
Forfeited and expired` 2 (2,681,333) (3,065,201)
US $0.03 (2,248,895) (3,755,159)
Outstanding at the end of the year` 2 15,831,948 15,594,190
US $0.03 10,822,476 7,854,540
Exercisable at the end of the year` 2 2,679,538 1,502,957
US $0.03 465,603 1,212,560
* Includes 2,969,860 and 2,461,500 Performance based stock options (RSU) during the year ended March 31, 2021 and 2020, respectively. 2,376,980 and 2,524,600 Performance based stock options (ADS) during the year ended March 31, 2021 and 2020, respectively. Performance based stock options (RSU) were issued under Wipro Employee Restricted Stock Unit plan 2007 (WSRUP 2007 plan) and Performance based stock options (ADS) were issued under Wipro ADS Restricted Stock Unit Plan (WARSUP 2004 plan).
The activity in cash-settled stock option plans and restricted stock unit option plans is summarised below:
Number of options
Year ended March 31, 2021
Year ended March 31, 2020
Outstanding at the beginning of the year 4,721,388 -
Modification ** (3,453,015) 5,681,966
Exercised (845,066) (429,909)
Forfeited and lapsed (345,108) (530,669)
Outstanding at the end of the year 78,199 4,721,388
Exercisable at the end of the year 23,999 63,999
The carrying value of liability towards Cash Settled ADS RSU’s outstanding was ` 31 (including ` 11 towards exercisable units) and ` 496 (including ` 15 towards exercisable units) as at March 31, 2021 and 2020, respectively.
** Restricted Stock Units arrangements that were modified during the year ended March 31, 2021
Pursuant to the SEBI clarification dated December 18, 2020, the restriction under SEBI circular dated October 10, 2019, “Framework of Depository Receipts” shall not apply in case of issue of Depository Receipts to Non-Resident Indians (“NRIs”), pursuant to share based employee benefit schemes which are implemented by a company in terms of SEBI (Share Based Employee Benefits) Regulations 2014, the Board Governance, Nomination and Compensation Committee approved in January 2021 allotment of underlying equity shares in respect of ADSs to be issued and allocated to NRI employees upon exercise of vested ADS RSU under the Company’s WARSUP 2004 Plan. This change was accounted as a modification and the fair value on the date of modification was determined based on prevailing market price and accordingly an amount of ` 739 has been recognised as equity with a corresponding adjustment to financial liability.
** Restricted Stock Units arrangements that were modified during the year ended March 31, 2020
Pursuant to the SEBI circular dated October 10, 2019, prohibiting issuance of depository receipts by listed companies to

Notes to the Consolidated Financial Statements
Consolidated financial statements under Ind ASIntegrated Annual Report 2020-21
Wipro Limited
287
NRIs, the Board Governance, Nomination and Compensation Committee approved in November 2019 cash pay out to its NRI employees in lieu of shares and upon exercise of vested ADS RSU under the Company’s WARSUP 2004 Plan, based on prevailing market price of ADS on the date of exercise. This change was accounted as a modification and the fair value on the date of modification of ` 561 has been recognised as financial liability with a corresponding adjustment to equity.
The following table summarises information about outstanding stock options and restricted stock unit option plan:
Year ended March 31, 2021 Year ended March 31, 2020
Range of exercise price and Weighted average exercise price
Number of optionsWeighted average
remaining life (months)
Number of options
Weighted average remaining life
(months)
` 2 15,831,948 18 15,594,190 23
US $0.03 10,822,476 19 7,854,540 23
The weighted average grant date fair value of options granted during the year ended March 31, 2021 and 2020 was ` 354.78 and ` 260.65 for each option, respectively. The weighted average share price of options exercised during the year ended March 31, 2021 and 2020 was ` 354.45 and ` 267.04 for each option, respectively.
32. Finance Lease Receivables
Finance lease receivables consist of assets that are leased to customers for a contract term ranging from 1 to 5 years, with lease payments due in monthly or quarterly installments. Details of finance lease receivables are given below:
Minimum lease paymentsPresent value of minimum
lease payments
As at March 31, 2021
As at March 31, 2020
As at March 31, 2021
As at March 31, 2020
Not later than one year ` 3,636 ` 2,986 ` 3,438 ` 2,811
Later than one year but not later than five years 3,264 2,473 3,144 2,359
Gross investment in lease ` 6,900 ` 5,459 ` 6,582 ` 5,170Less: Unearned finance income (318) (289) - -
Present value of minimum lease payment receivables ` 6,582 ` 5,170 ` 6,582 ` 5,170
Included in the consolidated balance sheet as follows:
Non-current ` 3,144 ` 2,359
Current ` 3,438 ` 2,811
33. Dividends and Buyback of Equity SharesThe Company declares and pays dividends in Indian rupees. According to the Companies Act, 2013 any dividend should be declared out of accumulated distributable profits. A Company may, before the declaration of any dividend, transfer a percentage of its profits for that financial year as it may consider appropriate to the reserves.
The cash dividends paid per equity share were ` 1 and ` 1, during the year ended March 31, 2021 and 2020, respectively, including an interim dividend of ` 1and ` 1 for the year ended March 31, 2021 and 2020, respectively.
During the year ended March 31, 2021, the Company concluded the buyback of 237,500,000 equity shares as approved by the Board of Directors on October 13, 2020. This has resulted in a total cash outflow of ` 116,445 (including tax on buyback of ` 21,445). In line with the requirement of the Companies Act, 2013, an amount of ` 1,427 and ` 115,018 has been utilised from share premium and retained earnings. Further, capital redemption reserve (included in other reserves) of ` 475 (representing the nominal value of the shares bought back) has been created as an apportionment from retained earnings. Consequent to such buyback, the paid-up equity share capital has reduced by ` 475.
During the year ended March 31, 2020, the Company concluded the buyback of 323,076,923 equity shares as approved by the Board of Directors on April 16, 2019. This has resulted in a total cash outflow of ` 105,000. In line with the requirement of the Companies Act, 2013, an amount of ` 105,000 has been utilised from retained earnings respectively.

Notes to the Consolidated Financial Statements
Consolidated financial statements under Ind AS
288
Further, capital redemption reserve (included in other reserves) of ` 646 (representing the nominal value of the shares bought back) has been created as an apportionment from retained earnings. Consequent to such buyback, share capital has reduced by ` 646.
34. Additional Capital DisclosuresThe key objective of the Company’s capital management is to ensure that it maintains a stable capital structure with the focus on total equity to uphold investor, creditor, and customer confidence and to ensure future development of its business. The Company’s focus is on keeping a strong total equity base to ensure independence, security, as well as a high financial flexibility for potential future borrowings, if required without impacting the risk profile of the Company.
The Company’s goal is to continue to be able to return excess liquidity to shareholders by continuing to distribute annual dividends in future periods.
The amount of future dividends/ buyback of equity shares will be balanced with efforts to continue to maintain an adequate liquidity status.
The capital structure as of March 31, 2021 and 2020 was as follows:
As at March 31, 2021
As at March 31, 2020
% Change
Equity attributable to the equity shareholders of the Company (A) ` 549,010 ` 553,217 (0.76)%
As percentage of total capital 84% 85%
Current borrowings* 75,874 73,202
Non-current borrowings 7,458 4,840
Lease liabilities 21,182 19,198
Total borrowings and lease liabilities (B) ` 104,514 ` 97,240 7.48%
As percentage of total capital 16% 15%
Total capital (A) + (B) ` 653,524 ` 650,457 0.47%
* Includes current obligations under borrowings classified under "Other current financial liabilities"
Borrowings represents 16% and 15% of total capital as of March 31, 2021 and 2020, respectively. The Company is not subjected to any externally imposed capital requirements.
35. Commitments and ContingenciesCapital commitments: As at March 31, 2021 and 2020 the Company had committed to spend approximately ` 7,490 and ` 14,011 respectively, under agreements to purchase/construct property and equipment. These amounts are net of capital advances paid in respect of these purchases.
Guarantees: As at March 31, 2021and 2020, guarantees provided by banks on behalf of the Company to the Indian Government, customers and certain other agencies amount to approximately ` 17,128 and ` 18,655 respectively, as part of the bank line of credit.
Contingencies and lawsuits: The Company is subject to legal proceedings and claims (including tax assessment orders/ penalty notices) which have arisen in the ordinary course of its business. Some of the claims involve complex issues and it is not possible to make a reasonable estimate of the expected financial effect, if any, that will result from ultimate resolution of such proceedings. However, the resolution of these legal proceedings is not likely to have a material and adverse effect on the results of operations or the financial position of the Company.
The Company’s assessments are completed for the years up to March 31, 2016 in India. The Company has received demands on multiple tax issues in India. These claims are primarily arising out of denial of deduction under section 10A of the Income Tax Act, 1961 in respect of profit earned by the Company’s undertaking in Software Technology Park at Bengaluru, the appeals filed against the said demand before the Appellate authorities have been allowed in favor

Notes to the Consolidated Financial Statements
Consolidated financial statements under Ind ASIntegrated Annual Report 2020-21
Wipro Limited
289
of the Company by the second appellate authority for the years up to March 31, 2008 which either has been or maybe contested by the Income tax authorities before the Hon’ble Supreme Court of India. Other claims relate to disallowance of tax benefits on profits earned from Software Technology Park and Special Economic Zone units, capitalisation of research & development expenses, transfer pricing adjustments on intercompany / inter unit transactions and other issues.
Income tax claims against the Company amounting to ` 80,032 and ` 77,873 are not acknowledged as debt as at March 31, 2021 and 2020, respectively. These matters are pending before various Appellate Authorities and the management expects its position will likely be upheld on ultimate resolution and will not have a material adverse effect on the Company’s financial position and results of operations.
The contingent liability in respect of disputed demands for excise duty, custom duty, sales tax and other matters amounting to 11,413 and 8,033 as of March 31, 2021 and 2020, respectively. However, the resolution of these disputed demands is not likely to have a material and adverse effect on the results of operations or the financial position of the Company.
The Hon’ble Supreme Court of India, through a ruling in February 2019, provided interpretation on the components of Salary on which the Company and its employees are to contribute towards Provident Fund under the Employee’s Provident Fund Act. Based on the current evaluation, the Company believes it is not probable that certain components of Salary paid by the Company will be subject to contribution towards Provident Fund due to the Hon’ble Supreme Court of India order. The Company will continue to monitor and evaluate its position based on future events and developments.
36. Segment InformationThe Company is organised into the following operating segments: IT Services, IT Products and India State Run Enterprise segment (“ISRE”).
IT Services: During the year ended March 31, 2021, in order to broad base our growth, the Company re-organised IT Services segment to four Strategic Market Units (“SMUs”) - Americas 1, Americas 2, Europe and Asia Pacific Middle East Africa (“APMEA”).
Americas 1 and Americas 2 are primarily organised by industry sector, while Europe and APMEA are organised by countries.
Americas 1 includes the entire business of Latin America (“LATAM") and the following industry sectors in the United States of America: healthcare and medical devices, consumer goods and life sciences, retail, transportation and services, communications, media and information services, technology products and platforms. Americas 2 includes the entire business in Canada and the following industry sectors in the United States of America: banking, financial services and insurance, manufacturing, hi-tech, energy and utilities. Europe consists of the United Kingdom and Ireland, Switzerland, Germany, Benelux, the Nordics and Southern Europe. APMEA consists of Australia and New Zealand, India, Middle East, South East Asia, Japan and Africa.
The corresponding information for the year ended March 31, 2020 has been re-stated to give effect to the above changes.
Revenue from each customer is attributed to the respective SMUs based on the location of the customer’s primary buying center of such services. With respect to certain strategic global customers, revenue may be generated from multiple countries based on such customer’s buying centers, but the total revenue related to these strategic global customers are attributed to a single SMU based on the geographical location of key decision makers.
Prior to the Company’s re-organisation of its IT services segment, the IT services segment was organised by seven industry verticals: Banking, Financial Services and Insurance (“BFSI”), Health Business unit (“Health BU”), Consumer Business unit (“CBU”), Energy, Natural Resources & Utilities (“ENU”), Manufacturing (“MFG”), Technology (“TECH”) and Communications (“COMM”).
Our IT Services segment provides a range of IT and IT enabled services which include digital strategy advisory, customer centric design, technology consulting, IT consulting, custom application design, development, re-engineering and maintenance, systems integration, package implementation, cloud and infrastructure services, business process services, cloud, mobility and analytics services, research and development and hardware and software design.

Notes to the Consolidated Financial Statements
Consolidated financial statements under Ind AS
290
IT Products: The Company is a value-added reseller of security, packaged and SaaS software for leading international brands. In certain total outsourcing contracts of the IT Services segment, the Company delivers hardware, software products and other related deliverables. Revenue relating to these items is reported as revenue from the sale of IT Products.
ISRE: This segment consists of IT Services offerings to entities and/or departments owned or controlled by Government of India and/or any State Governments.
The Chairman of the Company has been identified as the Chief Operating Decision Maker (“CODM”) as defined by Ind AS 108, “Operating Segments”. The Chairman of the Company evaluates the segments based on their revenue growth and operating income.
Assets and liabilities used in the Company’s business are not identified to any of the operating segments, as these are used interchangeably between segments. Management believes that it is currently not practicable to provide segment disclosures relating to total assets and liabilities since a meaningful segregation of the available data is onerous.
Information on reportable segments for the year ended March 31, 2021 is as follows:IT Services IT
ProductsISRE
Reconciling Items
TotalAmericas 1 Americas 2 Europe APMEA Total
Revenue ` 178,091 ` 179,821 ` 165,441 ` 82,462 ` 605,815 ` 7,685 ` 8,912 ` 13 ` 622,425Other operating income/(loss), net
- - - - (81) - - - (81)
Segment Result 33,040 41,589 31,673 11,476 117,778 45 1,061 (881) 118,003Unallocated 5,153 - - - 5,153Segment Result Total ` 122,850 ` 45 ` 1,061 ` (881) ` 123,075Finance costs (5,088)Finance and other income 20,912Share of net profit /(loss) of associates accounted for using the equity method
130
Profit before tax ` 139,029Income tax expense (30,349)Profit for the year ` 108,680Depreciation, amortisation and impairment
` 27,634
Information on reportable segments for the year ended March 31, 2020 is as follows:
IT Services IT Products
ISREReconciling
ItemsTotal
Americas 1 Americas 2 Europe APMEA TotalRevenue ` 176,115 ` 181,481 ` 157,526 ` 78,676 ` 593,798 ` 11,657 ` 7,950 ` (4) ` 613,401
Other operating income/(loss), net
- - - - 1,144 - - - 1,144
Segment Result 27,289 34,341 27,617 9,550 98,797 (323) (1,849) 236 96,861
Unallocated 7,732 - - - 7,732
Segment Result Total ` 107,673 ` (323) ` (1,849) ` 236 ` 105,737Finance costs (7,328)
Finance and other income 24,081
Share of net profit /(loss) of associates accounted for using the equity method
29
Profit before tax ` 122,519Income tax expense (24,801)
Profit for the year ` 97,718Depreciation, amortisation and impairment
` 20,855

Notes to the Consolidated Financial Statements
Consolidated financial statements under Ind ASIntegrated Annual Report 2020-21
Wipro Limited
291
Revenues from India, being Company’s country of domicile, is ` 27,156 and ` 29,374 for year ended March 31, 2021 and 2020, respectively.
Revenues from United States of America and United Kingdom contributed more than 10% of Company’s total revenues as per table below:
Year ended March 31, 2021
Year ended March 31, 2020
United States of America ` 336,009 ` 338,490
United Kingdom 67,852 65,258
Total ` 403,861 ` 403,748
No customer individually accounted for more than 10% of the revenues during the year ended March 31, 2021 and 2020.
Management believes that it is currently not practicable to provide disclosure of geographical location wise assets, since the meaningful segregation of the available information is onerous.
Notes:
a) Effective beginning of fiscal year ended March 31, 2021, revenue from sale of traded cloud-based licenses is no longer reported in IT Services revenue and finance income on deferred consideration earned under total outsourcing contracts is not included in segment revenue. Further, for evaluating performance of the individual operating segments, stock compensation expense is allocated based on the accelerated amortisation as per Ind AS 102. Segment information for the year ended March 31, 2020 has been re-stated to give effect to these changes.
b) “Reconciling items” includes elimination of inter-segment transactions and other corporate activities.
c) Revenue from sale of Company owned Intellectual Properties is reported as a part of IT Services revenues.
d) For the purpose of segment reporting, the Company has included the impact of “Foreign exchange gains, net” of ` 2,995 and ` 3,169 for the year ended March 31, 2021 and 2020, respectively, in revenues (which is reported as a part of ‘Other income’ in the consolidated statement of profit and loss).
e) During the year ended March 31, 2021, the Company has contributed ` 991 towards COVID-19 and is reported in Reconciling items.
f) Other operating income/(loss) of ` (81) and ` 1,144 is included as part of IT Services segment results for the year ended March 31, 2021 and 2020 respectively. Refer to Note 22.
g) Segment results for the year ended March 31, 2021, are after considering the impact of impairment charge of ` 1,250 in Americas 1 and 192 in Europe. Further, an impairment charge of 674 for the year ended March 31, 2021 towards certain marketing-related intangible assets and software platform recognised on acquisitions, is allocated to all IT Services SMUs. The remaining impairment charge of ` 302 for the year ended March 31, 2021 is included under unallocated. Refer to Note 4 and 6.
h) Segment results for the year ended March 31, 2021, are after considering additional amortisation of ` 795 in Americas 2 due to change in estimate of useful life of the customer-related intangibles in an earlier business combination. Refer to Note 6.
i) Segment results of IT Services segment are after recognition of share-based compensation expense ` 2,897 and ` 1,262 for the year ended March 31, 2021 and 2020, respectively.

Notes to the Consolidated Financial Statements
Consolidated financial statements under Ind AS
292
37. Related Party Relationship and TransactionsList of subsidiaries and associates as of March 31, 2021 are provided in the table below:
Subsidiaries Subsidiaries SubsidiariesCountry of
IncorporationWipro, LLC USA
Wipro Gallagher Solutions, LLC USA
Wipro Opus Mortgage Solutions LLC (formerly known as Opus Capital Markets Consultants, LLC)
USA
Wipro Promax Analytics Solutions Americas, LLC
USA
Wipro Insurance Solutions, LLC USA
Wipro IT Services, LLC USA
HealthPlan Services, Inc. ** USA
Wipro Appirio, Inc. (formerly known as Appirio, Inc) **
USA
Designit North America, Inc. (formerly known as Cooper Software Inc.)
USA
Infocrossing, LLC USA
Wipro US Foundation USA
International TechneGroup Incorporated **
USA
Wipro Designit Services, Inc. (formerly known as Rational Interaction, Inc) **
USA
Wipro VLSI Design Services, LLC (formerly known as Eximius Design, LLC)
USA
Wipro Overseas IT Services Pvt. Ltd
India
Wipro Japan KK Japan
Wipro Shanghai Limited China
Wipro Trademarks Holding Limited
India
Wipro Travel Services Limited India
Wipro Holdings (UK) Limited U.K.
Designit A/S Denmark
Designit Denmark A/S Denmark
Designit Germany GmbH Germany
Designit Oslo A/S Norway
Designit Sweden AB Sweden
Designit T.L.V Ltd. Israel
Designit Tokyo Ltd. Japan
Designit Spain Digital, S.L. ** Spain
Wipro Europe Limited U.K.
Wipro UK Limited U.K.
Wipro Financial Services UK Limited U.K.
Wipro IT Services S.R.L. Romania
Wipro 4C NV (formerly known as 4C NV)
Belgium

Notes to the Consolidated Financial Statements
Consolidated financial statements under Ind ASIntegrated Annual Report 2020-21
Wipro Limited
293
Subsidiaries Subsidiaries SubsidiariesCountry of
Incorporation
Wipro 4C Danmark ApS (formerly known as 4C Danmark ApS)
Denmark
4C Nederland B.V Netherlands
Wipro Weare4C UK Limited (formerly known as Weare4C UK Limited) **
U.K.
Wipro 4C Consulting France SAS (formerly known as 4C Consulting France)
France
Wipro IT Services UK Societas U.K.
Wipro Doha LLC # Qatar
Wipro Technologies SA DE CV Mexico
Wipro Philippines, Inc. Philippines
Wipro Holdings Hungary Korlátolt Felelősségű Társaság
Hungary
Wipro Holdings Investment Korlátolt Felelősségű Társaság
Hungary
Wipro Information Technology Egypt SAE
Egypt
Wipro Arabia Co. Limited * Saudi Arabia
Women's Business Park Technologies Limited *
Saudi Arabia
Wipro Poland SP Z.O.O Poland
Wipro IT Services Poland SP Z.O.O Poland
Wipro Technologies Australia Pty Ltd Australia
Wipro Corporate Technologies Ghana Limited
Ghana
Wipro Technologies South Africa (Proprietary) Limited
South Africa
Wipro Technologies Nigeria Limited Nigeria
Wipro IT Service Ukraine, LLC Ukraine
Wipro Information Technology Netherlands BV.
Netherlands
Wipro Portugal S.A. ** Portugal
Wipro Technologies Limited Russia
Wipro Technology Chile SPA Chile
Wipro Solutions Canada Limited Canada
Wipro Information Technology Kazakhstan LLP
Kazakhstan
Wipro Technologies W.T. Sociedad Anonima
Costa Rica
Wipro Outsourcing Services (Ireland) Limited
Ireland
Wipro Technologies VZ, C.A. Venezuela
Wipro Technologies Peru SAC Peru
Wipro do Brasil Servicos de Tecnologia Ltda
Brazil
Wipro do Brasil Technologia Ltda ** Brazil
Wipro Technologies SA Argentina

Notes to the Consolidated Financial Statements
Consolidated financial statements under Ind AS
294
Subsidiaries Subsidiaries SubsidiariesCountry of
Incorporation
Wipro Technologies SRL Romania
PT. WT Indonesia Indonesia
Wipro (Thailand) Co. Limited Thailand
Wipro Bahrain Limited Co. W.L.L (formerly known as Wipro Bahrain Limited Co. S.P.C.)
Bahrain
Wipro Gulf LLC Sultanate of Oman
Rainbow Software LLC Iraq
Wipro Networks Pte Limited Singapore
Wipro (Dalian) Limited China
Wipro Technologies SDN BHD Malaysia
Wipro Chengdu Limited China
Wipro IT Services Bangladesh Limited
Bangladesh
Wipro HR Services India Private Limited
India
Encore Theme Technologies Private Limited *
India
Eximius Design India Private Limited
India
* All the above direct subsidiaries are 100% held by the Company except that the Company holds 83.4% of the equity securities of Encore Theme Technologies Private Limited, 66.67% of the equity securities of Wipro Arabia Co. Limited and 55% of the equity securities of Women’s Business Park Technologies Limited are held by Wipro Arabia Co. Limited.
The remaining 16.6% equity securities of Encore Theme Technologies Private Limited will be acquired subject to and after receipt of certain regulatory approvals/confirmations.
# 51% of equity securities of Wipro Doha LLC are held by a local shareholder. However, the beneficial interest in these holdings is with the Company.
The Company controls ‘The Wipro SA Broad Based Ownership Scheme Trust’, ‘Wipro SA Broad Based Ownership Scheme SPV (RF) (PTY) LTD’ incorporated in South Africa and Wipro Foundation in India.
** Step Subsidiary details of Wipro Portugal S.A, Wipro do Brasil Technologia Ltda, Designit Spain Digital, S.L, HealthPlan Services, Inc, International TechneGroup Incorporated, Wipro Appirio, Inc. (formerly known as Appirio, Inc), Wipro Designit Services, Inc (formerly known as Rational Interaction, Inc) and Wipro Weare4C UK Limited (formerly known as Weare4C UK Limited) are as follows:
Subsidiaries Subsidiaries SubsidiariesCountry of
IncorporationWipro Portugal S.A. Portugal
Wipro Technologies GmbH Germany
Wipro IT Services Austria GmbH (formerly known as Cellent GmbH)
Austria
Wipro do Brasil Technologia Ltda Brazil
Wipro Do Brasil Sistemetas De Informatica Ltd
Brazil
Wipro do Brasil Servicos Ltda (formerly known as IVIA Serviços De Informática ltda)
Brazil
Designit Spain Digital, S.L. Spain
Designit Colombia S A S Colombia
Designit Peru SAC Peru
HealthPlan Services, Inc. USA

Notes to the Consolidated Financial Statements
Consolidated financial statements under Ind ASIntegrated Annual Report 2020-21
Wipro Limited
295
Subsidiaries Subsidiaries SubsidiariesCountry of
Incorporation
HealthPlan Services Insurance Agency, LLC
USA
International TechneGroup Incorporated
USA
International TechneGroup Ltd. U.K.
ITI Proficiency Ltd Israel
International TechneGroup S.R.L. Italy
MechWorks S.R.L. Italy
Wipro Appirio, Inc. (formerly known as Appirio, Inc)
USA
Appirio, K.K Japan
Topcoder, LLC. USA
Wipro Appirio (Ireland) Limited (formerly known as Appirio Ltd)
Ireland
Wipro Appirio UK Limited (formerly known as Appirio Ltd (UK))
U.K.
Wipro Designit Services, Inc (formerly known as Rational Interaction, Inc)
USA
Rational Consulting Australia Pty Ltd Australia
Wipro Designit Services Limited (formerly known as Rational Interaction Limited)
Ireland
Wipro Weare4C UK Limited (formerly known as Weare4C UK Limited)
U.K.
CloudSocius DMCC UAEAs at March 31, 2021 the Company held 43.7% interest in Drivestream Inc, 33% interest in Denim Group Limited and 33.3% in Denim Group Management, LLC, accounted for using the equity method.
The list of controlled trusts are:
Name of the entity Country of incorporationWipro Equity Reward Trust IndiaWipro Foundation India
The other related parties are:Name of the related parties: NatureAzim Premji Foundation Entity controlled by DirectorAzim Premji Foundation for Development Entity controlled by DirectorHasham Traders Entity controlled by DirectorPrazim Traders Entity controlled by DirectorZash Traders Entity controlled by DirectorHasham Investment and Trading Co. Pvt. Ltd Entity controlled by DirectorAzim Premji Philanthropic Initiatives Pvt. Ltd Entity controlled by DirectorAzim Premji Trust Entity controlled by DirectorWipro Enterprises (P) Limited Entity controlled by DirectorWipro GE Healthcare Private Limited Entity controlled by Director
Key management personnelRishad A. Premji Chairman
Thierry Delaporte Chief Executive Officer and Managing Director (i)
Abidali Z. Neemuchwala Chief Executive Officer and Managing Director (ii)

Notes to the Consolidated Financial Statements
Consolidated financial statements under Ind AS
296
Azim H. Premji Non-Executive Non-Independent Director (iii)
William Arthur Owens Non-Executive Director
M.K. Sharma Non-Executive Director
Ireena Vittal Non-Executive Director
Dr. Patrick J. Ennis Non-Executive Director
Patrick Dupuis Non-Executive Director
Arundhati Bhattacharya Non-Executive Director (iv)
Deepak M. Satwalekar Non-Executive Director (v)
Jatin Pravinchandra Dalal Chief Financial Officer
M. Sanaulla Khan Company Secretary(i) Mr. Thierry Delaporte was appointed as Chief Executive Officer and Managing Director of the Company with effect from July 6, 2020 for a
period of five years.
(ii) Mr. Abidali Z. Neemuchwala resigned as the Chief Executive Officer and Managing Director of the Company with effect from the end of the day on June 1, 2020.
(iii) Mr Azim H. Premji is the ultimate controlling party.
(iv) Ms. Arundhati Bhattacharya resigned as Non- Executive Director with effect from close of business hours on June 30, 2020.
(v) Mr. Deepak M. Satwalekar was appointed as Non- Executive Director with effect from July 1, 2020 for a term of five years.
Relatives of key management personnel:- Yasmeen A. Premji
- Tariq A. Premji
The Company has the following related party transactions:
Transactions / balances
Entities controlled by Directors Key Management Personnel
March 31, 2021 March 31, 2020 March 31, 2021 March 31, 2020
Sale of goods and services ` 171 ` 43 ` - ` -
Assets purchased 423 741 - -
Dividend 3,760 3,987 242 243
Buyback of shares 91,562 69,392 - 4,076
Rental Income 50 45 - -
Rent Paid 2 2 7 9
Others 44 119 - -
Key management personnel *Remuneration and short-term benefits ` - ` - ` 761 ` 369
Other benefits - - 231 178
Balance as at the year endReceivables ` 241 ` 94 ` - ` -
Payables - 23 334 167
* Post employment benefit comprising compensated absences is not disclosed as this are determined for the Company as a whole. Benefits includes the prorated value of RSU granted to the personnel, which vest over a period of time. Other benefits include share-based compensation ` 219 and ` 170 for the year ended March 31, 2021 and 2020, respectively.
The following are the significant related party transactions during the year ended March 31, 2021 and 2020:
Year ended March 31, 2021
Year ended March 31, 2020
Asset purchased/ capitalisedWipro Enterprises (P) Limited ` 419 ` 741
Sale of goods and servicesWipro Enterprises (P) Limited ` 164 ` 43

Notes to the Consolidated Financial Statements
Consolidated financial statements under Ind ASIntegrated Annual Report 2020-21
Wipro Limited
297
Year ended March 31, 2021
Year ended March 31, 2020
Dividend paidHasham Traders ` 929 ` 939
Prazim Traders 1,120 1,127
Zash Traders 1,136 1,143
Azim Premji Trust 559 757
Azim H. Premji 237 237
Buyback of sharesHasham Traders ` 4,000 `
16,338
Prazim Traders 3,000 19,617
Zash Traders 3,000 19,890
Azim Premji Trust 79,489 13,179
Azim Premji Philanthropic Initiatives Pvt Ltd 2,073 -
Azim H. Premji - 3,986
Rental incomeWipro Enterprises (P) Limited ` 44 ` 45
Remuneration paid to key management personnelAzim H. Premji* ` 8 ` 15
Thierry Delaporte 644 -
Abidali Z. Neemuchwala 23 323
Rishad A. Premji 118 52
Jatin Pravinchandra Dalal 75 44
M. Sanaulla Khan 20 15* This includes sitting fees and commission paid as non-independent and non-executive director effective July 31, 2019.
All related party transactions were entered at an arm’s length basis and in the ordinary course of business. There are no materially significant related party transactions made by the Company with Promoters, Directors or Key Managerial Personnel, which may have a potential conflict with the interests of the Company at large.
38 Additional information pursuant to para 2 of general instructions for the preparation of consolidated financial statements
Name of the Subsidiary
Net Asset Share in Profit or LossShare in Other comprehensive
income
Share in total comprehensive
income
As % of total
Amount in `
As % of total
Amount in `
As % of total
Amount in `
As % of total
Amount in `
ParentWipro Limited 69.6% `453,418 89.9% `100,608 70.4% `6,336 88.4% `106,944
Indian SubsidiariesEximius Design India Private Limited 0.0% 209 0.0% 26 - - 0.0% 26
Encore Theme Technologies Private Limited 0.0% 89 0.0% 8 - - 0.0% 8
Wipro Trademarks Holding Limited 0.0% 48 0.0% 2 - - 0.0% 2
Wipro Travel Services Limited 0.0% 123 (0.0)% (22) - - (0.0)% (22)
Wipro HR Services India Private Limited 0.9% 6,040 0.6% 726 0.1% 11 0.6% 737

Notes to the Consolidated Financial Statements
Consolidated financial statements under Ind AS
298
Name of the Subsidiary
Net Asset Share in Profit or LossShare in Other comprehensive
income
Share in total comprehensive
income
As % of total
Amount in `
As % of total
Amount in `
As % of total
Amount in `
As % of total
Amount in `
Foreign Subsidiaries4C Nederland B.V 0.0% 36 0.0% 20 (0.0)% (1) 0.0% 19
Appirio, K.K (0.0)% (190) 0.0% 25 0.1% 10 0.0% 35
Cloudsocius DMCC (0.0)% (75) (0.0)% (20) 0.0% 2 (0.0)% (18)
Designit A/S 0.1% 817 (0.2)% (205) (0.1)% (13) (0.2)% (218)
Designit Colombia S A S (0.0)% (89) (0.1)% (61) - - (0.1)% (61)
Designit Denmark A/S 0.1% 477 (0.0)% (24) 0.1% 11 (0.0)% (13)
Designit Germany GmbH (0.1)% (447) (0.1)% (141) (0.2)% (15) (0.1)% (156)
Designit North America, Inc. (formerly known as Cooper Software Inc.)
(0.2)% (1,194) (0.2)% (268) 0.4% 36 (0.2)% (232)
Designit Oslo A/S 0.0% 119 0.0% 46 0.2% 14 0.0% 60
Designit Peru SAC (0.0)% (83) (0.0)% (47) 0.1% 8 (0.0)% (39)
Designit Spain Digital, S.L. 0.0% 90 (0.1)% (95) (0.0)% (4) (0.1)% (99)
Designit Sweden AB (0.0)% (267) (0.2)% (206) (0.3)% (27) (0.2)% (233)
Designit T.L.V Ltd. 0.0% 133 (0.0)% (34) 0.1% 5 (0.0)% (29)
Designit Tokyo Ltd. (0.0)% (102) (0.0)% (47) 0.1% 6 (0.0)% (41)
HealthPlan Services Insurance Agency, LLC 0.0% 276 0.1% 101 (0.1)% (8) 0.1% 93
HealthPlan Services, Inc. 0.2% 1,067 (1.5)% (1,694) 1.7% 149 (1.3)% (1,545)
Infocrossing, LLC (0.7)% (4,387) 1.7% 1,854 (0.6)% (58) 1.5% 1,796
International TechneGroup Incorporated 0.1% 579 (0.1)% (96) (0.1)% (11) (0.1)% (107)
International TechneGroup Ltd. 0.0% 44 (0.0)% (49) 0.0% 4 (0.0)% (45)
International TechneGroup S.R.L. 0.1% 345 0.1% 117 (0.1)% (6) 0.1% 111
ITI Proficiency Ltd (0.0)% (83) (0.1)% (58) (0.2)% (18) (0.1)% (76)
MechWorks S.R.L. 0.0% 60 0.1% 87 0.0% 2 0.1% 89
PT. WT Indonesia 0.2% 1,194 0.0% 43 1.0% 91 0.1% 134
Rainbow Software LLC (0.0)% (6) (0.0)% (2) 0.0% 2 - -
Rational Consulting Australia Pty Ltd (0.0)% (18) 0.0% 1 (0.0)% (3) (0.0)% (2)
Topcoder, LLC. (0.0)% (89) (0.1)% (99) 0.2% 19 (0.1)% (80)
Wipro (Dalian) Limited 0.1% 804 0.1% 161 0.4% 38 0.2% 199
Wipro (Thailand) Co. Limited 0.1% 511 0.0% 1 0.1% 7 0.0% 8
Wipro 4C Consulting France SAS (formerly known as 4C Consulting France)
0.0% 115 (0.1)% (69) (0.0)% (4) (0.1)% (73)
Wipro 4C Danmark ApS (formerly known as 4C Danmark ApS)
(0.0)% (65) (0.0)% (1) 0.0% 2 0.0% 1
Wipro 4C NV (formerly known as 4C NV) 0.1% 813 (0.1)% (158) (0.1)% (6) (0.1)% (164)
Wipro Appirio (Ireland) Limited (formerly known as Appirio Ltd)
0.0% 192 0.1% 147 - - 0.1% 147
Wipro Appirio UK Limited (formerly known as Appirio Ltd (UK))
(0.1)% (637) (0.0)% (49) (0.5)% (45) (0.1)% (94)
Wipro Appirio, Inc. (formerly known as Appirio, Inc)
0.7% 4,801 (0.0)% (43) (1.0)% (93) (0.1)% (136)
Wipro Arabia Co. Limited 0.7% 4,703 1.2% 1,376 (2.1)% (191) 1.0% 1,185
Wipro Bahrain Limited Co. W.L.L (formerly known as Wipro Bahrain Limited Co. S.P.C.)
0.1% 520 (0.0)% (28) (0.2)% (17) (0.0)% (45)
Wipro Chengdu Limited 0.2% 1,504 0.4% 480 0.8% 71 0.5% 551

Notes to the Consolidated Financial Statements
Consolidated financial statements under Ind ASIntegrated Annual Report 2020-21
Wipro Limited
299
Name of the Subsidiary
Net Asset Share in Profit or LossShare in Other comprehensive
income
Share in total comprehensive
income
As % of total
Amount in `
As % of total
Amount in `
As % of total
Amount in `
As % of total
Amount in `
Wipro Corporate Technologies Ghana Limited
0.0% 30 (0.0)% (2) (0.0)% (1) (0.0)% (3)
Wipro Designit Services Limited (formerly known as Rational Interaction Limited)
0.0% 27 0.0% 7 - - 0.0% 7
Wipro Designit Services, Inc. (Formerly known as Rational Interaction, Inc)
0.0% 127 0.1% 74 (0.0)% (3) 0.1% 71
Wipro do Brasil Servicos de Tecnologia Ltda 0.0% 310 0.0% 5 (0.5)% (46) (0.0)% (41)
Wipro do Brasil Servicos Ltda (formerly known as IVIA Serviços De Informática ltda)
0.0% 181 0.1% 59 (0.2)% (16) 0.0% 43
Wipro Do Brasil Sistemetas De Informatica Ltd
0.0% 15 0.0% 15 (0.0)% (1) 0.0% 14
Wipro do Brasil Technologia Ltda 0.5% 3,292 0.3% 310 (3.0)% (272) 0.0% 38
Wipro Doha LLC 0.0% 207 (0.1)% (60) (0.5)% (43) (0.1)% (103)
Wipro Europe Limited 0.0% 63 0.0% 4 - - 0.0% 4
Wipro Financial Services UK Limited 0.0% 1 0.0% 51 (0.0)% (2) 0.0% 49
Wipro Gallagher Solutions, LLC 0.2% 1,508 (2.7)% (3,058) 4.9% 438 (2.2)% (2,620)
Wipro Gulf LLC 0.3% 1,670 0.3% 330 (0.1)% (11) 0.3% 319
Wipro Holdings (UK) Limited (0.2)% (1,282) (2.9)% (3,265) 3.2% 285 (2.5)% (2,980)
Wipro Holdings Hungary Korlátolt Felelősségű Társaság
5.8% 38,080 0.5% 549 - - 0.5% 549
Wipro Holdings Investment Korlátolt Felelősségű Társaság
4.0% 26,378 (0.3)% (295) - - (0.2)% (295)
Wipro Information Technology Egypt SAE (0.0)% (131) - - 0.0% 4 0.0% 4
Wipro Information Technology Kazakhstan LLP
(0.0)% (19) (0.0)% (6) - - (0.0)% (6)
Wipro Information Technology Netherlands BV.
1.4% 9,370 (0.1)% (122) (0.2)% (18) (0.1)% (140)
Wipro Insurance Solutions, LLC 0.0% 164 (0.0)% (7) (0.1)% (6) (0.0)% (13)
Wipro IT Service Ukraine, LLC - - (0.0)% (1) - - (0.0)% (1)
Wipro IT Services Austria GmbH (formerly known as Cellent GmbH)
0.1% 663 0.1% 64 0.2% 20 0.1% 84
Wipro IT Services Bangladesh Limited 0.1% 440 (0.1)% (152) (0.2)% (18) (0.1)% (170)
Wipro IT Services Poland SP Z.O.O 0.2% 1,554 0.6% 672 (0.2)% (19) 0.5% 653
Wipro IT Services S.R.L. 0.0% 89 0.1% 69 (0.0)% (1) 0.1% 68
Wipro IT Services UK Societas 4.0% 25,735 2.2% 2,421 0.0% 3 2.0% 2,424
Wipro IT Services, LLC 2.1% 13,722 (1.4)% (1,598) 12.6% 1,133 (0.4)% (465)
Wipro Japan KK 0.2% 996 0.3% 352 (0.6)% (56) 0.2% 296
Wipro Networks Pte Limited 0.4% 2,326 0.5% 612 (0.4)% (39) 0.5% 573
Wipro Opus Mortgage Solutions LLC (formerly known as Opus Capital Markets Consultants, LLC)
0.0% 96 (0.1)% (111) (0.1)% (5) (0.1)% (116)
Wipro Outsourcing Services (Ireland) Limited 0.0% 225 (0.0)% (35) 0.1% 10 (0.0)% (25)
Wipro Philippines, Inc. 2.8% 18,190 3.3% 3,648 1.2% 107 3.1% 3,755
Wipro Poland SP Z.O.O 0.0% 34 (0.0)% (18) 0.3% 23 0.0% 5
Wipro Portugal S.A. 1.2% 7,733 0.0% 26 0.5% 42 0.1% 68

Notes to the Consolidated Financial Statements
Consolidated financial statements under Ind AS
300
Name of the Subsidiary
Net Asset Share in Profit or LossShare in Other comprehensive
income
Share in total comprehensive
income
As % of total
Amount in `
As % of total
Amount in `
As % of total
Amount in `
As % of total
Amount in `
Wipro Promax Analytics Solutions Americas, LLC
(0.0)% (5) 0.4% 416 0.1% 8 0.4% 424
Wipro SA Broad Based Ownership Scheme SPV (RF) (PTY) Ltd
0.1% 775 - - - - - -
Wipro SA Broad Based Ownership Scheme Trust
0.0% 192 0.1% 75 (1.0)% (89) (0.0)% (14)
Wipro Shanghai Limited 0.1% 453 0.0% 3 0.2% 21 0.0% 24
Wipro Solutions Canada Limited (0.3)% (1,780) 1.9% 2,161 (3.0)% (273) 1.6% 1,888
Wipro Technologies Australia Pty Ltd (0.0)% (156) 0.1% 128 (0.5)% (44) 0.1% 84
Wipro Technologies GmbH 1.1% 7,226 (0.1)% (65) 2.9% 261 0.2% 196
Wipro Technologies Limited 0.0% 217 0.0% 6 0.0% 1 0.0% 7
Wipro Technologies Nigeria Limited (0.0)% (51) (0.2)% (173) (0.0)% (1) (0.1)% (174)
Wipro Technologies Peru SAC 0.0% 143 0.0% 2 (0.2)% (19) (0.0)% (17)
Wipro Technologies SA 0.0% 151 0.0% 9 (0.8)% (70) (0.1)% (61)
Wipro Technologies SA DE CV 0.1% 736 0.6% 710 0.3% 24 0.6% 734
Wipro Technologies SDN BHD 0.0% 4 (0.0)% (1) - - (0.0)% (1)
Wipro Technologies South Africa (Proprietary) Limited
0.1% 764 0.1% 127 1.1% 99 0.2% 226
Wipro Technologies SRL 0.1% 381 (0.2)% (232) 0.2% 16 (0.2)% (216)
Wipro Technologies VZ, C.A. (0.0)% (3) (0.0)% (15) 0.2% 14 (0.0)% (1)
Wipro Technologies W.T. Sociedad Anonima (0.1)% (599) (0.1)% (145) 0.5% 49 (0.1)% (96)
Wipro Technology Chile SPA (0.0)% (5) (0.0)% (16) 0.0% 1 (0.0)% (15)
Wipro UK Limited 0.0% 137 (0.0)% (22) - - (0.0)% (22)
Wipro VLSI Design Services, LLC (formerly known as Eximius Design, LLC)
0.1% 590 0.0% 5 0.1% 5 0.0% 10
Wipro Weare4C UK Limited (formerly known as Weare4C UK Limited)
0.0% 9 (0.1)% (96) (0.0)% (1) (0.1)% (97)
Wipro, LLC 2.7% 17,462 5.3% 5,918 13.2% 1,189 5.9% 7,107
Women's Business Park Technologies Limited
0.0% 142 0.2% 178 (0.0)% (3) 0.1% 175
TrustsWipro Equity Reward Trust 0.2% `1,359 0.1% `66 - `- 0.1% `66
Wipro Foundation 0.0% 52 0.0% 55 0.0% 2 0.0% 57
Total 100% ` 651,383 100% ` 111,945 100% `9,002 100% ` 120,947Non-controlling interest `(1,498) `(716) `53 `(663)
Adjustment arising out of consolidation (100,875) (3,265) (2,185) (5,450)
Grand Total ` 549,010 ` 107,964 `6,870 ` 114,834
39. On December 22, 2020, as part of strategic partnership, the Company entered into a definitive agreement to acquire the IT units of Metro AG in Germany and Romania. Based on the terms and conditions of the agreement, the Company has assessed that the transaction does not meet the definition of business under Ind AS 103 “Business Combinations”. As at March 31, 2021, the Company paid an advance of 4,463 (EUR 52 million) towards purchase of net assets and classified as other non-current assets.
40. The Indian Parliament has approved the Code on Social Security, 2020 which would impact the contributions by the Company towards Provident Fund and Gratuity. The Ministry of Labour and Employment has released draft rules for

Notes to the Consolidated Financial Statements
Consolidated financial statements under Ind ASIntegrated Annual Report 2020-21
Wipro Limited
301
the Code on Social Security, 2020 on November 13, 2020, and has invited suggestions from stake holders which are under active consideration by the Ministry. Based on an initial assessment by the Company and its Indian subsidiaries, the additional impact on Provident Fund contributions by the Company and its Indian subsidiaries is not expected to be material, whereas, the likely additional impact on Gratuity liability / contributions by the Company and its Indian subsidiaries could be material. The Company and its Indian subsidiaries will complete their evaluation once the subject rules are notified and will give appropriate impact in the financial statements in the period in which, the Code becomes effective and the related rules to determine the financial impact are published.
41. Events after the Reporting Period
a) On April 1, 2021, the Company entered into a definitive agreement to acquire Ampion, an Australia-based provider of cyber security, DevOps and quality engineering services for a total consideration of AUD 150 million. The acquisition is subject to customary closing conditions and regulatory approvals and is expected to be concluded in the quarter ending June 30, 2021.
b) In April 2021, the Company completed its acquisition of Capco, a global management and technology consultancy providing digital, consulting and technology services to financial institutions in the Americas, Europe and the Asia Pacific, and its subsidiaries, for an upfront cash consideration of `108,760 (Refer to Note 7).
c) In May 2021, the Company sold its entire investment in Ensono Holdings, LLC for a consideration of US$ 76.24 million.
d) In June 2021, the Company sold its entire investment in Denim Group, Ltd. and Denim Group Management, LLC (“Denim Group”) for a consideration of US$ 22.42 million.
e) In June 2021, the Company’s Board has approved a proposal for issuance of U.S. dollar denominated Notes up to US$ 750 million.
As per our report of even date attached For and on behalf of the Board of Directors
for Deloitte Haskins & Sells LLP Rishad A. Premji M. K. Sharma Thierry DelaporteChartered Accountants Chairman Director Chief Executive Officer and
Managing DirectorFirm’s Registration No.: 117366W/W - 100018
Vikas Bagaria Jatin Pravinchandra Dalal M. Sanaulla KhanPartner Chief Financial Officer Company SecretaryMembership No.: 60408
Bengaluru BengaluruJune 9, 2021 June 9, 2021

Pur
suan
t to
first
pro
viso
to s
ub-s
ectio
n (3
) of S
ectio
n 12
9 o
f Com
pani
es A
ct, 2
013
, rea
d w
ith R
ule
5 o
f Com
pani
es (A
ccou
nts)
Rul
es,2
014
- A
OC
-1,
the
Com
pany
is p
rese
ntin
g su
mm
aris
ed fi
nanc
ial i
nfor
mat
ion
abou
t ind
ivid
ual s
ubsi
diar
ies
as a
t Mar
ch 3
1, 2
02
1/Ja
nuar
y 31
, 20
21/
Dec
embe
r 31
, 20
20
Info
rmat
ion
rela
ting
to S
ubsi
diar
ies
as a
t M
arch
31,
202
1/Ja
nuar
y 31
, 202
1/D
ecem
ber 3
1, 2
020
Par
t -A
- Sub
sidi
arie
s
Sl.
No.
Nam
e of
the
Subs
idia
ry
Date
of b
e-co
min
g th
e su
bsid
iary
/ac
quis
ition
Repo
rtin
g pe
riod
Repo
rtin
g Cu
rren
cy
Exc
hang
e ra
te
as o
n
Mar
31,
202
1/Ja
n 31
, 202
1/
Dec 3
1, 2
020
Sh
are
capi
tal
(n)
Re
serv
es &
Su
rplu
s (n)
To
tal
Asse
ts
(n)
Tota
l Li
abili
ties
excl
udin
g (6
) & (7
) (n
)
Inve
st-
men
ts
(m) &
(n)
% o
f Ho
ldin
g
Tu
rnov
er
(n)
Pro
fit
befo
re
taxa
tion
(n)
Pro
visi
on
for t
axat
ion
(n)
Pro
fit
afte
r ta
xatio
n (n
)
Pro
pose
d Di
vide
nd (i
ncl.
divi
dend
tax)
(n
)
(1)
(2)
(3)
(4)
(5)
(6)
(7)
(8)
(9)
(10)
(11)
(12)
(13)
(14)
(15)
(16)
1 W
ipro
, LLC
7-Ju
l-98
31-M
ar-2
1U
SD
73
66,
010
(46,
109)
102
,991
8
3,09
0 9
,817
10
0% 7
7,91
6 6
,329
5
04
5,8
25
-
2 W
ipro
Tec
hnol
ogie
s G
mbH
30-J
un-0
631
-Mar
-21
EU
R86
2
,789
1
,126
1
2,10
2 8
,187
-
10
0% 1
3,34
5 (2
,754
) 3
3 (2
,720
) -
3 W
ipro
Ara
bia
Co.
Lim
ited
19-J
un-0
731
-Dec
-20
SA
R19
5
84
4,1
21
10,
470
5,7
65
-
67%
12,
151
2,2
32
328
1
,904
2
,926
4 H
ealt
hpla
n S
ervi
ces,
Inc
29-F
eb-1
631
-Dec
-20
US
D73
7
,745
(6
,095
) 5
,003
3
,353
-
10
0% 1
0,47
0 (1
,796
) -
(1,
796)
-
5 W
ipro
Sol
utio
ns C
anad
a Li
mit
ed16
-Aug
-14
31-M
ar-2
1C
AD
58
1,8
57
(3,6
37)
4,8
28
6,6
08
-
100%
10,
063
2,9
19
685
2
,234
-
6 W
ipro
Phi
lippi
nes,
Inc.
16-O
ct-0
731
-Mar
-21
PH
P2
284
1
7,90
6 1
9,97
9 1
,789
-
10
0% 9
,977
3
,792
1
67
3,6
25
-
7 W
ipro
HR
Ser
vice
s In
dia
Pri
vate
Lim
ited
31-A
ug-1
831
-Mar
-21
INR
1 7
0 5
,970
8
,764
2
,724
7
54
100%
9,7
20
1,0
97
259
8
38
-
8 In
focr
ossi
ng, L
LC20
-Sep
-07
31-M
ar-2
1U
SD
73
*
1,8
31
3,5
53
1,72
2 -
10
0% 7
,646
2
,255
4
31
1,8
24
-
9 W
ipro
App
irio
, Inc
. (f
orm
erly
kno
wn
as
App
irio
, Inc
)
23-N
ov-1
631
-Mar
-21
US
D73
*
2
,970
5
,239
2
,269
-
10
0% 6
,778
3
30
260
7
0 -
10 W
ipro
Tec
hnol
ogie
s S
A
DE
C V
13-J
un-0
731
-Mar
-21
MXN
4 7
14
21
3,4
01
2,6
66
-
100%
5,7
17
1,0
18
284
7
33
-
11 W
ipro
do
Bra
sil
Tech
nolo
gia
Ltda
29-M
ay-0
131
-Dec
-20
BR
L14
1
,859
1
,520
4
,789
1
,410
-
10
0% 4
,246
4
80
146
3
34
-
12 W
ipro
Gal
lagh
er S
olut
ions
, LL
C1-
Jul-
0831
-Mar
-21
US
D73
3
,608
(1
,952
)2,
635
978
-
10
0% 3
,621
(2
,385
) 6
25 (
3,01
0) -
13 W
ipro
Des
igni
t Ser
vice
s In
c. (f
orm
erly
kno
wn
as
Rat
iona
l Int
erac
tion
, Inc
.)
21-F
eb-2
031
-Mar
-21
US
D73
*
1
27
971
8
44
-
100%
3,4
05
111
3
8 7
3 -
14 W
ipro
Tec
hnol
ogie
s S
.R.L
17-A
ug-0
631
-Mar
-21
RO
N17
1
88
193
1
,847
1
,466
-
10
0% 3
,339
(1
79)
46
(226
) -
15 W
ipro
IT S
ervi
ces
Pol
and
SP
Z.O
.O6-
Apr
-12
31-M
ar-2
1P
LN18
-
1
,552
2
,707
1
,155
-
10
0% 3
,319
8
15
172
6
42
-
16 W
ipro
Net
wor
ks P
te
Lim
ited
15-D
ec-9
931
-Mar
-21
US
D73
1
,636
2
76
3,0
08
1,0
96
-
100%
2,6
12
701
8
7 6
14
-
17 W
ipro
IT S
ervi
ces
UK
S
ocie
tas
27-A
pr-0
631
-Mar
-21
INR
1 1
0 2
5,90
8 3
8,48
8 1
2,57
0 -
10
0% 2
,454
2
,484
6
3 2
,421
-
18 W
ipro
Gul
f LLC
1-Ju
n-11
31-M
ar-2
1O
MR
190
28
1,6
77
2,0
44
339
-
10
0% 2
,382
3
56
-
356
-
Consolidated financial statements under Ind AS
302
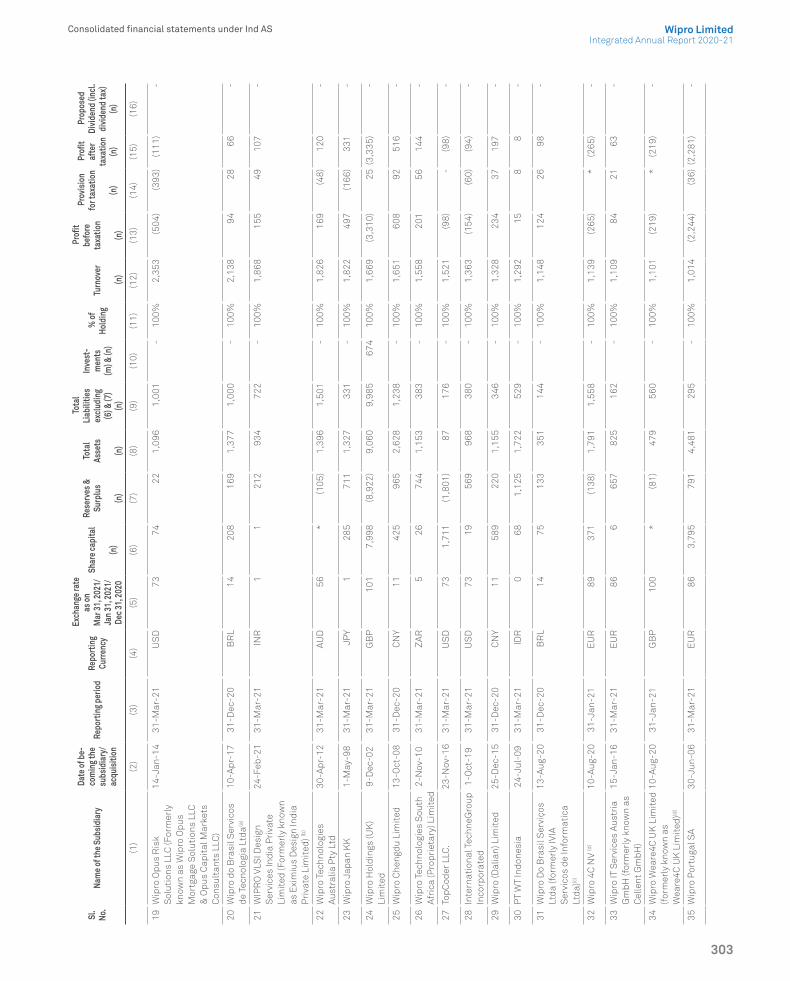
Sl.
No.
Nam
e of
the
Subs
idia
ry
Date
of b
e-co
min
g th
e su
bsid
iary
/ac
quis
ition
Repo
rtin
g pe
riod
Repo
rtin
g Cu
rren
cy
Exc
hang
e ra
te
as o
n
Mar
31,
202
1/Ja
n 31
, 202
1/
Dec 3
1, 2
020
Sh
are
capi
tal
(n)
Re
serv
es &
Su
rplu
s (n)
To
tal
Asse
ts
(n)
Tota
l Li
abili
ties
excl
udin
g (6
) & (7
) (n
)
Inve
st-
men
ts
(m) &
(n)
% o
f Ho
ldin
g
Tu
rnov
er
(n)
Pro
fit
befo
re
taxa
tion
(n)
Pro
visi
on
for t
axat
ion
(n)
Pro
fit
afte
r ta
xatio
n (n
)
Pro
pose
d Di
vide
nd (i
ncl.
divi
dend
tax)
(n
)
(1)
(2)
(3)
(4)
(5)
(6)
(7)
(8)
(9)
(10)
(11)
(12)
(13)
(14)
(15)
(16)
19 W
ipro
Opu
s R
isk
Sol
utio
ns L
LC (F
orm
erly
kn
own
as W
ipro
Opu
s M
ortg
age
Sol
utio
ns L
LC
& O
pus
Cap
ital
Mar
kets
C
onsu
ltan
ts L
LC)
14-J
an-1
431
-Mar
-21
US
D73
7
4 2
2 1
,096
1
,001
-
10
0% 2
,353
(5
04)
(393
) (1
11)
-
20 W
ipro
do
Bra
sil S
ervi
cos
de T
ecno
logi
a Lt
da(a
)
10-A
pr-1
731
-Dec
-20
BR
L14
2
08
169
1
,377
1
,000
-
10
0% 2
,138
9
4 2
8 6
6 -
21 W
IPR
O V
LSI D
esig
n S
ervi
ces
Indi
a P
riva
te
Lim
ited
(For
mer
ly k
now
n as
Exi
miu
s D
esig
n In
dia
Pri
vate
Lim
ited
) (b)
24-F
eb-2
131
-Mar
-21
INR
1 1
2
12
934
7
22
-
100%
1,8
68
155
4
9 1
07
-
22 W
ipro
Tec
hnol
ogie
s A
ustr
alia
Pty
Ltd
30-A
pr-1
231
-Mar
-21
AUD
56
*
(105
) 1
,396
1
,501
-
10
0% 1
,826
1
69
(48)
120
-
23 W
ipro
Jap
an K
K1-
May
-98
31-M
ar-2
1JP
Y1
285
7
11
1,3
27
331
-
10
0% 1
,822
4
97
(166
) 3
31
-
24 W
ipro
Hol
ding
s (U
K)
Lim
ited
9-D
ec-0
231
-Mar
-21
GB
P10
1 7
,998
(8
,922
) 9
,060
9
,985
6
74
100%
1,6
69
(3,3
10)
25
(3,3
35)
-
25 W
ipro
Che
ngdu
Lim
ited
13-O
ct-0
831
-Dec
-20
CN
Y11
4
25
965
2
,628
1
,238
-
10
0% 1
,651
6
08
92
516
-
26 W
ipro
Tec
hnol
ogie
s S
outh
A
fric
a (P
ropr
ieta
ry) L
imit
ed2-
Nov
-10
31-M
ar-2
1Z
AR
5 2
6 7
44
1,1
53
383
-
100%
1,5
58
201
5
6 1
44
-
27 T
opC
oder
LLC
. 23
-Nov
-16
31-M
ar-2
1U
SD
73
1,7
11
(1,8
01)
87
176
-
10
0% 1
,521
(9
8) -
(9
8) -
28 I
nter
nati
onal
Tec
hneG
roup
In
corp
orat
ed1-
Oct
-19
31-M
ar-2
1U
SD
73
19
569
9
68
380
-
10
0% 1
,363
(1
54)
(60)
(94)
-
29 W
ipro
(Dal
ian)
Lim
ited
25-D
ec-1
531
-Dec
-20
CN
Y11
5
89
220
1
,155
3
46
-
100%
1,3
28
234
3
7 1
97
-
30 P
T W
T In
done
sia
24-J
ul-0
931
-Mar
-21
IDR
0 6
8 1
,125
1,
722
529
-
100%
1,2
92
15
8
8
-
31 W
ipro
Do
Bra
sil S
ervi
ços
Ltda
(for
mer
ly IV
IA
Ser
vico
s de
Info
rmat
ica
Ltda
)(c)
13-A
ug-2
031
-Dec
-20
BR
L14
7
5 1
33
351
1
44
-
100%
1,1
48
124
2
6 9
8 -
32 W
ipro
4C
NV
(d)
10-A
ug-2
031
-Jan
-21
EU
R89
3
71
(138
) 1
,791
1
,558
-
10
0% 1
,139
(2
65)
*
(265
) -
33 W
ipro
IT S
ervi
ces
Aus
tria
G
mbH
(for
mer
ly k
now
n as
C
elle
nt G
mbH
)
15-J
an-1
631
-Mar
-21
EU
R86
6
6
57
825
1
62
-
100%
1,1
09
84
21
63
-
34 W
ipro
Wea
re4C
UK
Lim
ited
(f
orm
erly
kno
wn
as
Wea
re4C
UK
Lim
ited
)(d)
10-A
ug-2
031
-Jan
-21
GB
P10
0 *
(8
1) 4
79
560
-
100%
1,1
01
(219
)*
(219
) -
35 W
ipro
Por
tuga
l SA
30-J
un-0
631
-Mar
-21
EU
R86
3
,795
79
14,
481
295
-
10
0% 1
,014
(2
,244
) (3
6)(2
,281
) -
Consolidated financial statements under Ind ASIntegrated Annual Report 2020-21
Wipro Limited
303

Sl.
No.
Nam
e of
the
Subs
idia
ry
Date
of b
e-co
min
g th
e su
bsid
iary
/ac
quis
ition
Repo
rtin
g pe
riod
Repo
rtin
g Cu
rren
cy
Exc
hang
e ra
te
as o
n
Mar
31,
202
1/Ja
n 31
, 202
1/
Dec 3
1, 2
020
Sh
are
capi
tal
(n)
Re
serv
es &
Su
rplu
s (n)
To
tal
Asse
ts
(n)
Tota
l Li
abili
ties
excl
udin
g (6
) & (7
) (n
)
Inve
st-
men
ts
(m) &
(n)
% o
f Ho
ldin
g
Tu
rnov
er
(n)
Pro
fit
befo
re
taxa
tion
(n)
Pro
visi
on
for t
axat
ion
(n)
Pro
fit
afte
r ta
xatio
n (n
)
Pro
pose
d Di
vide
nd (i
ncl.
divi
dend
tax)
(n
)
(1)
(2)
(3)
(4)
(5)
(6)
(7)
(8)
(9)
(10)
(11)
(12)
(13)
(14)
(15)
(16)
36 W
ipro
App
irio
UK
Lim
ited
(f
orm
erly
kno
wn
as A
ppir
io
Ltd)
23-N
ov-1
631
-Mar
-21
GB
P10
1 *
(6
37)
273
9
10
-
100%
923
(5
4) (3
) (5
1) -
37 W
omen
’s B
usin
ess
Par
k Te
chno
logi
es L
td.
26-O
ct-1
731
-Mar
-21
SA
R19
7
3 7
3 7
71
625
-
37
% 8
23
183
2
0 1
63
-
38 W
ipro
IT S
ervi
ces
Ban
glad
esh
Lim
ited
9-Ja
n-18
31-M
ar-2
1B
DT
1 3
66
75
1,4
23
983
-
10
0% 7
83
(139
) 9
(1
49)
-
39 W
ipro
Doh
a LL
C26
-Feb
-14
31-M
ar-2
1Q
AR
20
4
203
459
252
-
49
% 7
58
(58)
(6)
(64)
-
40 D
esig
nit D
enm
ark
A/S
13-S
ep-9
031
-Mar
-21
DK
K12
1
4 7
51
921
1
56
-
100%
593
(6
5) (2
4) (4
2) -
41 D
esig
nit N
orth
Am
eric
a,
Inc.
(for
mer
ly k
now
n as
C
oope
r S
oftw
are
Inc.
)
23-O
ct-1
731
-Mar
-21
US
D73
1
5 (1
,209
) 2
60
1,4
54
-
100%
574
(2
25)
38
(264
) -
42 D
esig
nit O
slo
A/S
1-D
ec-0
631
-Mar
-21
NO
K9
1
120
2
19
97
-
100%
532
6
5 1
4 5
2 -
43 W
ipro
4C
Con
sult
ing
Fran
ce S
AS
(for
mer
ly
know
n as
4C
Con
sult
ing
Fran
ce)(d
)
10-A
ug-2
031
-Jan
-21
EU
R89
7
4 (4
7) 3
76
348
-
100%
525
(8
4) -
(8
4) -
44 W
ipro
Info
rmat
ion
Tech
nolo
gy N
ethe
rlan
ds
BV
30-J
un-0
631
-Mar
-21
EU
R86
3
,238
2
,334
1
2,56
6 6
,995
-
10
0% 5
07
(104
) (1
7) (1
21)
-
45 E
ncor
e Th
eme
Tech
nolo
gies
Pri
vate
Li
mit
ed (e
)
15-D
ec-2
031
-Mar
-21
INR
1 2
1
15
286
1
69
3
100%
472
(7
0) (3
0) (4
0) -
46 W
ipro
App
irio
, K.K
(for
mer
ly
know
n as
App
irio
, K.K
)23
-Nov
-16
31-M
ar-2
1JP
Y1
6
(198
) 2
88
480
-
10
0% 4
68
(4)
(14)
10
-
47 D
esig
nit A
/S31
-May
-13
31-M
ar-2
1D
KK
12
115
1
12
2,1
49
1,9
21
-
100%
456
(2
,035
) 3
(2,
038)
-
48 W
ipro
App
irio
UK
Lim
ited
(f
orm
erly
kno
wn
as
App
irio
Ltd
)
23-N
ov-1
631
-Mar
-21
EU
R86
8
7 10
5 2
64
71
-
100%
442
1
52
12
140
-
49 W
ipro
Out
sour
cing
S
ervi
ces
(Irel
and)
Lim
ited
14-M
ay-1
231
-Mar
-21
EU
R86
*
2
25
403
1
78
-
100%
426
(3
7) *
(3
8) -
50 W
ipro
4C
Dan
mar
k A
pS
(for
mer
ly k
now
n as
4C
D
anm
ark
ApS
) (d)
10-A
ug-2
031
-Jan
-21
DK
K12
1
(1
18)
106
2
22
-
100%
364
(6
8) -
(6
8) -
51 W
ipro
Tec
hnol
ogy
Chi
le
SPA
19-D
ec-1
131
-Mar
-21
CLP
0 2
85
(290
) 3
01
306
-
10
0% 3
61
(13)
3
(16)
-
52 D
esig
nit S
pain
Dig
ital
SL
4-N
ov-1
031
-Mar
-21
EU
R86
*
3
9 1
05
66
-
100%
342
(1
86)
44
(230
) -
53 H
ealt
hpla
n S
ervi
ces
Insu
ranc
e A
genc
y, L
LC29
-Feb
-16
31-D
ec-2
0U
SD
73
*
253
2
54
*
-
100%
306
9
0 -
9
0 -
Consolidated financial statements under Ind AS
304

Sl.
No.
Nam
e of
the
Subs
idia
ry
Date
of b
e-co
min
g th
e su
bsid
iary
/ac
quis
ition
Repo
rtin
g pe
riod
Repo
rtin
g Cu
rren
cy
Exc
hang
e ra
te
as o
n
Mar
31,
202
1/Ja
n 31
, 202
1/
Dec 3
1, 2
020
Sh
are
capi
tal
(n)
Re
serv
es &
Su
rplu
s (n)
To
tal
Asse
ts
(n)
Tota
l Li
abili
ties
excl
udin
g (6
) & (7
) (n
)
Inve
st-
men
ts
(m) &
(n)
% o
f Ho
ldin
g
Tu
rnov
er
(n)
Pro
fit
befo
re
taxa
tion
(n)
Pro
visi
on
for t
axat
ion
(n)
Pro
fit
afte
r ta
xatio
n (n
)
Pro
pose
d Di
vide
nd (i
ncl.
divi
dend
tax)
(n
)
(1)
(2)
(3)
(4)
(5)
(6)
(7)
(8)
(9)
(10)
(11)
(12)
(13)
(14)
(15)
(16)
54 W
ipro
(Tha
iland
) Co,
Li
mit
ed30
-Jul
-07
31-M
ar-2
1TH
B2
241
26
9 5
26
16
-
100%
269
9
9
* -
55 W
ipro
Bah
rain
Lim
ited
Co.
W
.L.L
(for
mer
ly k
now
n as
W
ipro
Bah
rain
Lim
ited
Co.
S
.P.C
.)
28-O
ct-0
931
-Mar
-21
BH
D19
4 1
0 5
11
591
7
0 -
10
0% 2
61
(28)
-
(28)
-
56 D
esig
nit T
.L.V
Ltd
.1-
Mar
-05
31-M
ar-2
1IL
S22
*
1
31
171
4
0 -
10
0% 2
58
(31)
-
(31)
-
57 W
ipro
Tec
hnol
ogie
s N
iger
ia
Lim
ited
15-A
ug-1
231
-Mar
-21
NG
N0
3
143
62
2 47
7 -
10
0% 2
50
53
19
34
-
58 W
ipro
IT S
ervi
ces
S.R
.L1-
Nov
-18
31-M
ar-2
1R
ON
17
1
88
156
6
8 -
10
0% 2
35
82
15
67
-
59 W
ipro
Tec
hnol
ogie
s W
T S
ocie
dad
Ano
nim
a15
-Oct
-10
31-M
ar-2
1C
RC
0 *
(5
99)
279
8
78
-
100%
234
(1
39)
*
(139
) -
60 M
echW
orks
S.R
.L.
1-O
ct-1
931
-Mar
-21
EU
R86
1
5
9 1
73
113
-
10
0% 2
32
132
4
6 8
6 -
61 W
ipro
Tec
hnol
ogie
s S
A22
-Apr
-08
31-D
ec-2
0A
RS
1 1
50
7
323
1
65
-
100%
217
(6
3) (1
2) (5
1) -
62 I
nter
nati
onal
Tec
hneG
roup
Lt
d.1-
Oct
-19
31-M
ar-2
1G
BP
101
*
44
176
1
32
-
100%
202
(5
8) (6
) (5
1) -
63 C
loud
soci
us D
MC
C (d
)10
-Aug
-20
31-J
an-2
1A
ED
20
1
(83)
101
1
84
-
100%
181
(5
8) -
(5
8) -
64 D
esig
nit S
wed
en A
B11
-Jun
-07
31-M
ar-2
1S
EK
8 1
4
2
3 1
9 -
10
0% 1
74
(203
) 4
(2
07)
-
65 W
ipro
VLS
I Des
ign
Ser
vice
s LL
C (F
orm
erly
kno
wn
as
Exi
miu
s D
esig
n LL
C) (b
)
25-F
eb-2
131
-Mar
-21
US
D73
-
5
87
967
38
0 -
10
0% 1
68
5
2
2
-
66 W
ipro
Tec
hnol
ogie
s P
eru
SAC
15-A
ug-1
231
-Mar
-21
PE
N19
3
6 1
07
231
8
8 -
10
0% 1
63
(3)
(5)
2
-
67 W
ipro
Do
Bra
sil
Sis
tem
etas
De
Info
rmat
ica
Ltd
22-A
ug-1
431
-Dec
-20
BR
L14
2
0 2
3
41
320
-
10
0% 1
55
32
1
31
-
68 D
esig
nit T
okyo
Ltd
6-M
ay-1
331
-Mar
-21
JPY
1 1
1 (1
16)
84
189
-
10
0% 1
53
(43)
11
(54)
-
69 W
ipro
4C
Ned
erla
nd B
.V.
10-A
ug-2
031
-Mar
-21
EU
R86
2
2
6 1
06
78
-
100%
112
2
0 4
1
6 -
70 W
ipro
Des
igni
t Ser
vice
s Li
mit
ed (f
orm
erly
kno
wn
as R
atio
nal I
nter
acti
on
Lim
ited
)
21-F
eb-2
031
-Mar
-21
EU
R86
*
2
9 3
0 1
-
10
0% 1
09
8
1
7
-
71 W
ipro
Insu
ranc
e S
olut
ions
, LL
C30
-Nov
-12
31-M
ar-2
1U
SD
73
29
134
2
03
39
-
100%
107
(1
5) (8
) (7
) -
72 D
esig
nit G
erm
any
Gm
bH7-
Nov
-07
31-M
ar-2
1E
UR
86
2
(464
) 1
18
580
-
10
0% 1
03
(133
) -
(1
33)
-
Consolidated financial statements under Ind ASIntegrated Annual Report 2020-21
Wipro Limited
305

Sl.
No.
Nam
e of
the
Subs
idia
ry
Date
of b
e-co
min
g th
e su
bsid
iary
/ac
quis
ition
Repo
rtin
g pe
riod
Repo
rtin
g Cu
rren
cy
Exc
hang
e ra
te
as o
n
Mar
31,
202
1/Ja
n 31
, 202
1/
Dec 3
1, 2
020
Sh
are
capi
tal
(n)
Re
serv
es &
Su
rplu
s (n)
To
tal
Asse
ts
(n)
Tota
l Li
abili
ties
excl
udin
g (6
) & (7
) (n
)
Inve
st-
men
ts
(m) &
(n)
% o
f Ho
ldin
g
Tu
rnov
er
(n)
Pro
fit
befo
re
taxa
tion
(n)
Pro
visi
on
for t
axat
ion
(n)
Pro
fit
afte
r ta
xatio
n (n
)
Pro
pose
d Di
vide
nd (i
ncl.
divi
dend
tax)
(n
)
(1)
(2)
(3)
(4)
(5)
(6)
(7)
(8)
(9)
(10)
(11)
(12)
(13)
(14)
(15)
(16)
73 W
ipro
Tec
hnol
ogie
s Li
mit
ed8-
Feb-
0831
-Mar
-202
1R
UB
1 1
0 2
07
233
1
7 -
10
0% 7
1 6
*
6
-
74 W
ipro
Sha
ngha
i Lim
ited
27-A
pr-0
431
-Dec
-20
CN
Y11
1
20
329
5
24
75
-
100%
58
7
-
7
-
75 D
esig
nit C
olom
bia
S A
S21
-Dec
-15
31-D
ec-2
0C
OP
0 5
6 (9
4) 2
6 6
4 -
10
0% 4
6 (4
0) 2
(4
1) -
76 I
TI P
rofi
cien
cy L
td1-
Oct
-19
31-M
ar-2
1IL
S22
*
(8
3) 2
0 1
03
-
100%
45
(57)
-
(57)
-
77 W
ipro
Pro
max
Ana
lyti
cs
Sol
utio
ns A
mer
icas
, LLC
30-A
pr-1
231
-Mar
-21
US
D73
2
(7
)58
62
-
10
0% 4
0 6
06
197
4
10
-
78 W
ipro
Info
rmat
ion
Tech
nolo
gy K
azak
hsta
n LL
P
27-S
ep-0
631
-Mar
-21
KZ
T0
5
(18)
140
1
53
-
100%
38
17
(17)
*
-
79 W
ipro
Tra
vel S
ervi
ces
Lim
ited
10-J
un-9
631
-Mar
-21
INR
1 1
12
2 3
56
234
-
10
0% 2
1 (1
9)*
(20)
-
80 R
atio
nal C
onsu
ltin
g A
ustr
alia
Pty
Ltd
(f)
21-F
eb-2
031
-Mar
-21
AUD
56
*
(18)
-
18
-
100%
12
1
^
1
-
81 W
ipro
Tec
hnol
ogie
s S
DN
B
HD
16-N
ov-0
631
-Mar
-21
MYR
18
*
5
7
2
-
100%
4
(1)
-
(1)
-
82 D
esig
nit P
eru
S.A
.C1-
Sep
-16
31-M
ar-2
1P
EN
19
2
(85)
-
83
-
100%
2
(25)
18
(43)
-
83 W
ipro
IT S
ervi
ces,
LLC
6-A
pr-1
531
-Mar
-21
US
D73
7
3,89
5 (5
1,53
7)47
,990
2
5,63
3 -
10
0% -
(1
,573
) -
(1,
573)
-
84 W
ipro
Pol
and
Sp
Z.o
.o.
1-Ju
l-08
31-M
ar-2
1P
LN18
1
3
4 4
8 1
4 -
10
0% -
(4
) 1
3 (1
7) -
85 W
ipro
Hol
ding
s In
vest
men
t K
orlá
tolt
Fel
elős
ségű
Tá
rsas
ág
23-M
ar-1
731
-Dec
-20
US
D73
1
2
7,03
9 2
7,04
3 2
-
10
0% -
6
30
57
573
-
86 W
ipro
Hol
ding
s H
unga
ry
Kor
láto
lt F
elel
őssé
gű
Társ
aság
17-S
ep-0
731
-Dec
-20
US
D73
2
,010
3
9,12
8 4
2,13
1 9
93
-
100%
-
633
6
7 5
66
-
87 W
ipro
Info
rmat
ion
Tech
nolo
gy E
gypt
SA
E (g
)
22-M
ay-0
831
-Mar
-21
EG
P5
4
(135
) 2
7 1
58
-
100%
-
*
-
*
-
88 W
ipro
Tra
dem
arks
Hol
ding
Li
mit
ed30
-Oct
-82
31-M
ar-2
1IN
R1
1
47
49
*
-
100%
-
3
1
2
-
89 W
ipro
Tec
hnol
ogie
s VZ
, C
.A.
13-J
un-1
331
-Dec
-20
VEF
0 *
(3
) -
3
-
10
0% -
(3
) -
(3
) -
90 W
ipro
Fin
anci
als
serv
ices
U
K L
td.
30-A
pr-1
231
-Mar
-21
GB
P10
1 *
1
2
2
-
10
0% -
5
3 *
5
3 -
91 W
ipro
UK
Lim
ited
1-Ju
n-11
31-M
ar-2
1G
BP
101
71
86
223
66
-
10
0% -
(3
) *
(3)
-
92 W
ipro
SA
Bro
ad B
ased
O
wne
rshi
p S
chem
e S
PV
(Rf)
(Pty
) Ltd
17-J
an-1
431
-Mar
-21
ZA
R5
679
1
6
80
*
-
100%
-
*
-
(0)
-
Consolidated financial statements under Ind AS
306
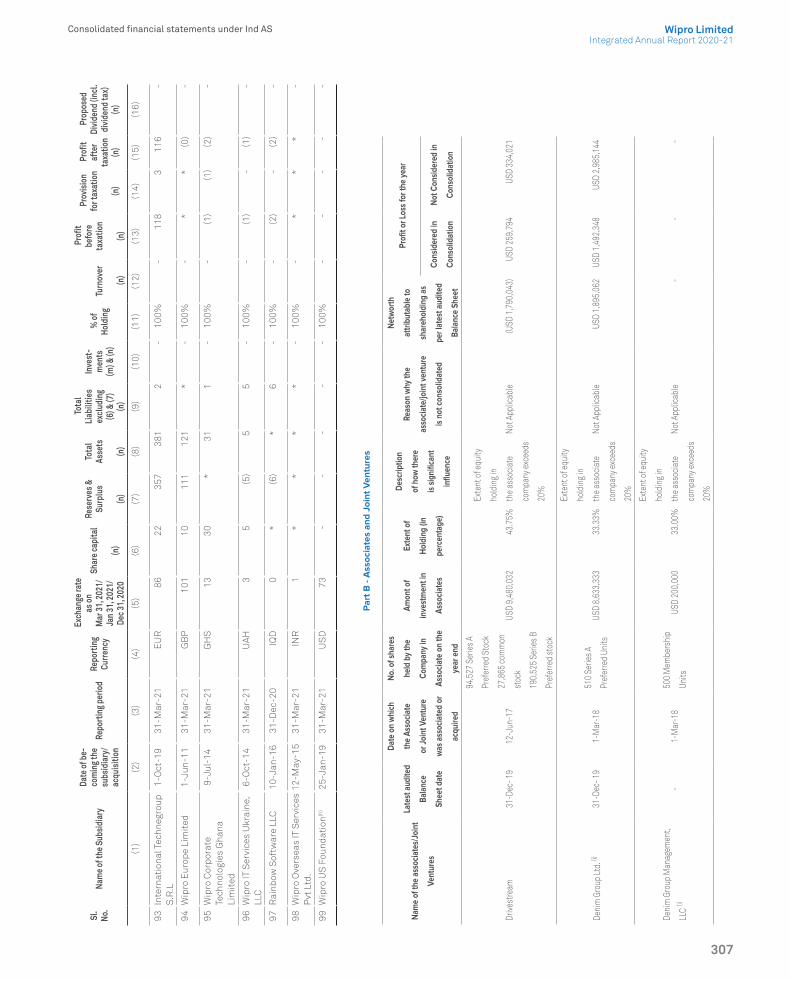
Sl.
No.
Nam
e of
the
Subs
idia
ry
Date
of b
e-co
min
g th
e su
bsid
iary
/ac
quis
ition
Repo
rtin
g pe
riod
Repo
rtin
g Cu
rren
cy
Exc
hang
e ra
te
as o
n
Mar
31,
202
1/Ja
n 31
, 202
1/
Dec 3
1, 2
020
Sh
are
capi
tal
(n)
Re
serv
es &
Su
rplu
s (n)
To
tal
Asse
ts
(n)
Tota
l Li
abili
ties
excl
udin
g (6
) & (7
) (n
)
Inve
st-
men
ts
(m) &
(n)
% o
f Ho
ldin
g
Tu
rnov
er
(n)
Pro
fit
befo
re
taxa
tion
(n)
Pro
visi
on
for t
axat
ion
(n)
Pro
fit
afte
r ta
xatio
n (n
)
Pro
pose
d Di
vide
nd (i
ncl.
divi
dend
tax)
(n
)
(1)
(2)
(3)
(4)
(5)
(6)
(7)
(8)
(9)
(10)
(11)
(12)
(13)
(14)
(15)
(16)
93 I
nter
nati
onal
Tec
hneg
roup
S
.R.L
1-O
ct-1
931
-Mar
-21
EU
R86
2
2 3
57
381
2
-
10
0% -
1
18
3
116
-
94 W
ipro
Eur
ope
Lim
ited
1-
Jun-
1131
-Mar
-21
GB
P10
1 1
0 1
11
121
*
-
10
0% -
*
*
(0
) -
95 W
ipro
Cor
pora
te
Tech
nolo
gies
Gha
na
Lim
ited
9-Ju
l-14
31-M
ar-2
1G
HS
13
30
*
31
1
-
100%
-
(1)
(1)
(2)
-
96 W
ipro
IT S
ervi
ces
Ukr
aine
, LL
C6-
Oct
-14
31-M
ar-2
1U
AH
3 5
(5
) 5
5
-
10
0% -
(1
) -
(1
) -
97 R
ainb
ow S
oftw
are
LLC
10-J
an-1
631
-Dec
-20
IQD
0 *
(6
) *
6
-
10
0% -
(2
) -
(2
) -
98 W
ipro
Ove
rsea
s IT
Ser
vice
s P
vt L
td.
12-M
ay-1
531
-Mar
-21
INR
1 *
*
*
*
-
10
0% -
*
*
*
-
99 W
ipro
US
Fou
ndat
ion(h
)25
-Jan
-19
31-M
ar-2
1U
SD
73
-
-
-
-
-
100%
-
-
-
-
-
Par
t B -
Ass
ocia
tes
and
Join
t Ven
ture
s
Nam
e of
the
asso
ciat
es/J
oint
Vent
ures
Late
st a
udite
d
Bala
nce
Shee
t dat
e
Date
on
whi
ch
the
Asso
ciat
e
or Jo
int V
entu
re
was
ass
ocia
ted
or
acqu
ired
No. o
f sha
res
held
by
the
Com
pany
in
Asso
ciat
e on
the
year
end
Amon
t of
inve
stm
ent i
n
Asso
ciat
es
Exte
nt o
f
Hold
ing
(in
perc
enta
ge)
Desc
riptio
n
of h
ow th
ere
is sig
nific
ant
influ
ence
Reas
on w
hy th
e
asso
ciat
e/jo
int v
entu
re
is no
t con
solid
ated
Netw
orth
attri
buta
ble
to
shar
ehol
ding
as
per l
ates
t aud
ited
Bala
nce
Shee
t
Profi
t or L
oss f
or th
e ye
ar
Cons
ider
ed in
Cons
olid
atio
n
Not C
onsid
ered
in
Cons
olid
atio
n
Drive
stre
am31
-Dec
- 19
12-J
un-1
7
94,5
27 S
erie
s A
Pref
erre
d St
ock
27,8
65 co
mm
on
stoc
k
190,
525
Serie
s B
Pref
erre
d st
ock
USD
9,48
0,03
2 43
.75%
Exte
nt o
f equ
ity
hold
ing
in
the
asso
ciat
e
com
pany
exc
eeds
20%
Not A
pplic
able
(USD
1,7
90,0
43)
USD
259,
794
USD
334,
021
Deni
m G
roup
Ltd.
(i)31
-Dec
- 19
1-M
ar-1
851
0 Se
ries A
Pref
erre
d Un
itsUS
D 8,
633,
333
33.3
3%
Exte
nt o
f equ
ity
hold
ing
in
the
asso
ciat
e
com
pany
exc
eeds
20%
Not A
pplic
able
USD
1,89
5,06
2 US
D 1,
492,
348
USD
2,98
5,14
4
Deni
m G
roup
Man
agem
ent,
LLC (i)
-1-
Mar
-18
500
Mem
bers
hip
Units
USD
200,
000
33.0
0%
Exte
nt o
f equ
ity
hold
ing
in
the
asso
ciat
e
com
pany
exc
eeds
20%
Not A
pplic
able
- -
-
Consolidated financial statements under Ind ASIntegrated Annual Report 2020-21
Wipro Limited
307

Ris
had
A. P
rem
jiM
. K. S
harm
a
Cha
irm
anD
irec
tor
Thie
rry
Del
apor
teJa
tin
P D
alal
M. S
anau
lla K
han
Chi
ef E
xecu
tive
Offi
cer
and
Man
agin
g D
irec
tor
Chi
ef F
inan
cial
Offi
cer
Com
pany
Sec
reta
ry
Ben
galu
ru
Jun
e 9,
202
1
Not
e:(a
) W
ipro
do
Bra
sil S
ervi
cos
de T
ecno
logi
a S
.A w
as m
erge
d w
ith
and
into
Wip
ro D
o B
rasi
l Tec
hnol
ogia
Ltd
a, e
ffec
tive
Apr
il 1,
202
1.(b
) W
ipro
VLS
I Des
ign
Ser
vice
s In
dia
Pri
vate
Lim
ited
(For
mer
ly k
now
n as
Exi
miu
s D
esig
n In
dia
Pri
vate
Lim
ited
), an
d W
ipro
VLS
I Des
ign
Ser
vice
s LL
C (F
orm
erly
kno
wn
as E
xim
ius
Des
ign
LLC
) w
ere
acqu
ired
on
Febr
uary
24
and
25, 2
021,
resp
ecti
vely
. (c
) W
ipro
Do
Bra
sil S
ervi
ços
Ltda
(for
mer
ly IV
IA S
ervi
cos
de In
form
atic
a Lt
da) w
as a
cqui
red
on A
ugus
t 14,
202
0.
(d)
Wip
ro 4
C N
V, W
ipro
Wea
re4C
UK
Lim
ited
, Wip
ro 4
C C
onsu
ltin
g Fr
ance
SA
S, W
ipro
4C
Dan
mar
k A
pS, C
loud
soci
us D
MC
C, a
nd W
ipro
4C
Ned
erla
nd B
.V.,
wer
e ac
quir
ed o
n A
ugus
t 10,
202
0.(e
) 83
.4%
sta
ke in
Enc
ore
Them
e Te
chno
logi
es P
riva
te L
imit
ed w
as a
cqui
red
on D
ecem
ber
15, 2
020.
The
rem
aini
ng 1
6.6%
equ
ity
stak
e w
ill b
e ac
quir
ed s
ubje
ct to
and
aft
er re
ceip
t of
cert
ain
regu
lato
ry a
ppro
vals
/con
firm
atio
ns.
(f)
Rat
iona
l Con
sult
ing
Aus
tral
ia P
ty L
td. W
as d
ereg
iste
red
effe
ctiv
e M
ay 3
0, 2
021
(g)
Wip
ro In
form
atio
n Te
chno
logy
Egy
pt S
AE
has
bee
n pu
t int
o liq
uida
tion
wit
h ef
fect
from
Sep
tem
ber
30, 2
016.
(h)
Wip
ro U
S F
ound
atio
n is
yet
to s
tart
ope
rati
ons.
(i)
Ent
ire
stak
e in
Den
im G
roup
Ltd
. and
Den
im G
roup
Man
agem
ent,
LLC
was
sol
d on
Jun
e 1,
202
1 fo
r a
cons
ider
atio
n of
US
$ 22
.42
mill
ion.
(j)
Cap
co g
roup
was
acq
uire
d by
the
Com
pany
on
Apr
il 29
, 202
1.(k
) IT
uni
ts o
f Met
ro A
G, n
amel
y M
ETR
O-N
OM
GM
BH
and
ME
TRO
Sys
tem
s R
oman
ia S
.R.L
. wer
e ta
ken
over
eff
ecti
ve A
pril
1, 2
021.
(l)
Cel
lent
Gm
bH, G
erm
any
was
mer
ged
wit
h an
d in
to W
ipro
Tec
hnol
ogie
s G
mbH
, Ger
man
y ef
fect
ive
Nov
embe
r 3,
202
0.(m
) In
vest
men
ts e
xclu
des
inve
stm
ents
in s
ubsi
diar
ies
and
asso
ciat
es(n
) I
ndia
n ru
pee
equi
vale
nts
of th
e fi
gure
s in
fore
ign
curr
enci
es o
f acc
ount
s of
the
subs
idia
ry e
ntit
ies
are
base
d on
the
exch
ange
rate
s as
of t
he re
spec
tive
repo
rtin
g pe
riod
end
dat
es(*
) Va
lue
is le
ss th
an O
ne M
illio
n R
upee
s
Consolidated financial statements under Ind AS
308

Report of Independent Registered Public Accounting Firm
To the shareholders and the Board of Directors of Wipro Limited
Opinion on the Financial Statements We have audited the accompanying consolidated statements of financial position of Wipro Limited and subsidiaries (the “Company”) as of March 31, 2021 and 2020, the related consolidated statements of income, comprehensive income, shareholders’ equity, and cash flows, for each of the three years in the period ended March 31, 2021, and the related notes (collectively referred to as the “financial statements”). In our opinion, the financial statements present fairly, in all material respects, the financial position of the Company as of March 31, 2021 and 2020, and the results of its operations and its cash flows for each of the three years in the period ended March 31, 2021, in conformity with the International Financial Reporting Standards as issued by the International Accounting Standards Board.
We have also audited, in accordance with the standards of the Public Company Accounting Oversight Board (United States) (PCAOB), the Company’s internal control over financial reporting as of March 31, 2021, based on criteria established in Internal Control — Integrated Framework (2013) issued by the Committee of Sponsoring Organizations of the Treadway Commission and our report dated June 9, 2021, expressed an unqualified opinion on the Company’s internal control over financial reporting.
Change in Accounting PrincipleAs discussed in Note 3 and 3(viii) to the financial statements, the Company has changed its method of accounting for leases in fiscal year 2020 due to adoption of International Financial Reporting Standard 16, Leases.
Basis for Opinion These financial statements are the responsibility of the Company’s management. Our responsibility is to express an opinion on the Company’s financial statements based on our audits. We are a public accounting firm registered with the PCAOB and are required to be independent with respect to the Company in accordance with the U.S. federal securities laws and the applicable rules and regulations of the Securities and Exchange Commission and the PCAOB.
We conducted our audits in accordance with the standards of the PCAOB. Those standards require that we plan and perform the audit to obtain reasonable assurance about whether the financial statements are free of material misstatement, whether due to error or fraud. Our audits included performing procedures to assess the risks of material misstatement of the financial statements, whether due to error or fraud, and performing procedures that respond to those risks. Such procedures included examining, on a test basis, evidence regarding the amounts and disclosures in the financial statements. Our audits also included evaluating
the accounting principles used and significant estimates made by management, as well as evaluating the overall presentation of the financial statements. We believe that our audits provide a reasonable basis for our opinion.
Critical Audit Matters
The critical audit matters communicated below are matters arising from the current-period audit of the financial statements that were communicated or required to be communicated to the audit committee and that (1) relate to accounts or disclosures that are material to the financial statements and (2) involved our especially challenging, subjective, or complex judgments. The communication of critical audit matters does not alter in any way our opinion on the financial statements, taken as a whole, and we are not, by communicating the critical audit matters below, providing separate opinions on the critical audit matters or on the accounts or disclosures to which they relate.
Fixed price contracts using the percentage of completion method - Refer Notes 2 (iv)(a), 3(xiv)B and 24 to the financial statements.
Critical Audit Matter Description
Revenue from fixed-price contracts, including software development, and integration contracts, where the performance obligations are satisfied over time, is recognized using the percentage-of-completion method.
Use of the percentage-of-completion method requires the Company to determine the project costs incurred to date as a percentage of total estimated project costs required to complete the project. The estimation of total project costs involves significant judgment and is assessed throughout the period of the contract to reflect any changes based on the latest available information. In addition, provisions for estimated losses, if any, on uncompleted contracts are recorded in the period in which such losses become probable based on the estimated project costs.
We identified the revenue recognition for fixed price contracts where the percentage-of-completion method is used as a critical audit matter because of the significant judgment involved in estimating the efforts to complete such contracts.
This estimate has a high inherent uncertainty and requires consideration of progress of the contract, efforts incurred to-date and estimates of efforts required to complete the remaining contract performance obligations over the lives of the contracts.
This required a high degree of auditor judgment in evaluating the audit evidence supporting the application of the input method used to recognize revenue and a higher extent of audit effort to evaluate the reasonableness of the total estimated amount of revenue recognized on fixed-price contracts.
Consolidated financial statements under IFRSIntegrated Annual Report 2020-21
Wipro Limited
309

Report of Independent Registered Public Accounting Firm
How the Critical Audit Matter Was Addressed in the Audit
Our audit procedures related to estimates of efforts to complete for fixed-price contracts accounted using the percentage-of-completion method included the following, among others:
• We tested the effectiveness of controls relating to (1) recording of efforts incurred and estimation of efforts required to complete the remaining contract performance obligations, and (2) access and application controls pertaining to time recording and allocation systems, which prevents unauthorised changes to recording of efforts incurred.
• We evaluated management’s ability to reasonably estimate the progress towards satisfying the performance obligation by comparing actual information to estimates for performance obligations that have been fulfilled.
• We selected a sample of fixed price contracts with customers accounted using percentage-of-completion method and performed the following:
o Read the contract and based on the terms and conditions evaluated whether recognizing revenue over time was appropriate, and the contract was included in management’s calculation of revenue over time.
o Evaluated other information that supported the estimates of the progress towards satisfying the performance obligation.
o Evaluated the appropriateness of and consistency in the application of management’s policies and methodologies to estimate progress towards satisfying the performance obligation.
o Compared efforts incurred with Company’s estimate of efforts incurred to date to identify significant variations and evaluate whether those variations have been considered appropriately in estimating the remaining efforts to complete the contract.
o Tested the estimate for consistency with the status of delivery of milestones and customer acceptances to identify possible delays in achieving milestones, which require changes in estimated efforts to complete the remaining performance obligations.
Allowance for credit losses Refer Notes 2(iv)(g), 3(x)(A), 9 and 25 to the financial statements
Critical Audit Matter Description
The Company determines the allowance for credit losses based on historical loss experience adjusted to reflect
current and estimated future economic conditions. The Company considered current and anticipated future economic conditions on the basis of the credit reports and other related credit information for its customers to estimate the probability of default in future and has taken into account estimates of possible effect from the pandemic relating to COVID-19.
We identified allowance for credit losses as a critical audit matter because of the significant judgment involved in calculating the expected credit losses. This required a high degree of auditor judgment and an increased extent of effort when performing audit procedures to evaluate the reasonableness of management’s estimate of the expected credit losses.
How the Critical Audit Matter Was Addressed in the Audit
Our audit procedures related to the allowance for credit losses for trade receivables, unbilled receivables and contract assets included the following, among others:
• We tested the effectiveness of controls over the (1) development of the methodology for the allowance for credit losses, including consideration of the current and estimated future economic conditions, (2) completeness and accuracy of information used in the estimation of probability of default, and (3) computation of the allowance for credit losses.
• For a sample of customers we tested the input data such as credit reports and other credit related information used in estimating the probability of default by comparing them to external and internal sources of information.
• We evaluated the incorporation of the applicable assumptions into the estimate of expected credit losses and tested the mathematical accuracy and computation of the allowances by using the same input data used by the Company.
• We evaluated the qualitative adjustment to the historical loss rates, including assessing the basis for the adjustments and the reasonableness of the significant assumptions.
/s/ Deloitte Haskins & Sells LLP
Bengaluru, IndiaJune 9, 2021
We have served as the Company’s auditor since fiscal 2018.
Consolidated financial statements under IFRS
310

NotesAs at
March 31, 2020As at
March 31, 2021As at
March 31, 2021
Convenience translation into US dollar in millions (unaudited) Refer
to Note 2(iii)
ASSETSGoodwill 6 131,012 139,127 1,902
Intangible assets 6 16,362 13,085 179
Property, plant and equipment 4 81,120 85,192 1,165
Right-of-Use assets 5 16,748 16,420 225
Financial assets
Derivative assets 19 - 16 ^
Investments 8 9,302 10,576 145
Trade receivables 9 6,049 4,358 60
Other financial assets 12 5,881 6,088 83
Investments accounted for using the equity method 8 1,383 1,464 20
Deferred tax assets 21 6,005 1,664 23
Non-current tax assets 11,414 14,323 196
Other non-current assets 13 11,935 15,935 217
Total non-current assets 297,211 308,248 4,215 Inventories 10 1,865 1,064 15
Financial assets
Derivative assets 19 3,025 4,064 56
Investments 8 189,635 175,707 2,402
Cash and cash equivalents 11 144,499 169,793 2,321
Trade receivables 9 104,474 94,298 1,289
Unbilled receivables 25,209 27,124 371
Other financial assets 12 8,614 7,245 99
Contract assets 17,143 16,507 226
Current tax assets 2,882 2,461 34
Other current assets 13 22,505 24,923 340
Total current assets 519,851 523,186 7,153
TOTAL ASSETS 817,062 831,434 11,368
EQUITYShare capital 11,427 10,958 150
Share premium 1,275 714 10
Retained earnings 476,103 466,692 6,381
Share-based payment reserve 1,550 3,071 42
SEZ Re-investment reserve 43,804 41,154 563
Other components of equity 23,299 30,506 418
Equity attributable to the equity holders of the Company 557,458 553,095 7,564 Non-controlling interest 1,875 1,498 20
TOTAL EQUITY 559,333 554,593 7,584
Consolidated Statement of Financial Position(` in millions, except share and per share data, unless otherwise stated)
Consolidated financial statements under IFRSIntegrated Annual Report 2020-21
Wipro Limited
311

NotesAs at
March 31, 2020As at
March 31, 2021As at
March 31, 2021
Convenience translation into US dollar in millions (unaudited) Refer
to Note 2(iii)
LIABILITIESFinancial liabilities
Loans and borrowings 14 4,840 7,458 102
Derivative liabilities 19 138 - -
Lease liabilities 14 12,638 13,513 185
Other financial liabilities 16 151 2,291 31
Deferred tax liabilities 21 2,825 4,633 63
Non-current tax liabilities 13,205 11,069 151
Other non-current liabilities 17 7,537 7,835 107
Provisions 18 2 2 ^
Total non-current liabilities 41,336 46,801 639 Financial liabilities
Loans, borrowings and bank overdrafts 14 73,202 75,874 1,037
Derivative liabilities 19 7,231 1,070 15
Trade payables and accrued expenses 15 78,129 78,870 1,078
Lease liabilities 14 6,560 7,669 105
Other financial liabilities 16 899 1,470 20
Contract liabilities 18,775 22,535 308
Current tax liabilities 11,731 17,324 237
Other current liabilities 17 19,254 24,552 336
Provisions 18 612 676 9
Total current liabilities 216,393 230,040 3,145
TOTAL LIABILITIES 257,729 276,841 3,784
TOTAL EQUITY AND LIABILITIES 817,062 831,434 11,368 ^ Value is less than 1
The accompanying notes form an integral part of these consolidated financial statements.
Consolidated Statement of Financial Position(` in millions, except share and per share data, unless otherwise stated)
Consolidated financial statements under IFRS
312

NotesYear ended
March 31, 2019Year ended
March 31, 2020Year ended
March 31, 2021Year ended
March 31, 2021
Convenience translation
into US dollar in millions
(unaudited) Refer to Note
2(iii)Revenues 24 585,845 610,232 619,430 8,469
Cost of revenues 25 (413,033) (436,085) (423,205) (5,786)
Gross profit 172,812 174,147 196,225 2,683 Selling and marketing expenses 25 (44,510) (42,907) (41,400) (566)
General and administrative expenses 25 (35,951) (29,823) (34,686) (474)
Foreign exchange gains/(losses), net 28 3,215 3,169 2,995 41
Other operating income/(loss), net 26 4,344 1,144 (81) (1)(229) (326) 1,436 29
Results from operating activities 99,910 105,730 123,053 1,683 Finance expenses 27 (7,375) (7,328) (5,088) (70)
Finance and other income 28 22,923 24,081 20,912 286
Share of net profit /(loss) of associates accounted for using the equity method
8 (43) 29 130 2
Profit before tax 115,415 122,512 139,007 1,901 Income tax expense 21 (25,242) (24,799) (30,345) (415)
Profit for the year 90,173 97,713 108,662 1,486
Profit attributable to:Equity holders of the Company 90,031 97,218 107,946 1,476
Non-controlling interest 142 495 716 10
Profit for the year 90,173 97,713 108,662 1,486
Earnings per equity share: 29
Attributable to equity holders of the CompanyBasic 14.99 16.67 19.11 0.26
Diluted 14.95 16.62 19.07 0.26
Weighted average number of equity shares
used in computing earnings per equity shareBasic 6,007,376,837 5,833,384,018 5,649,265,885 5,649,265,885
Diluted 6,022,304,367 5,847,823,239 5,661,657,822 5,661,657,822
^ Value is less than 1
The accompanying notes form an integral part of these consolidated financial statements.
Consolidated Statement of Income(` in millions, except share and per share data, unless otherwise stated)
Consolidated financial statements under IFRSIntegrated Annual Report 2020-21
Wipro Limited
313

Year ended March 31, 2019
Year ended March 31, 2020
Year ended March 31, 2021
Year ended March 31, 2021
Convenience translation
into US dollar in millions
(unaudited) Refer to Note
2(iii)
Profit for the year 90,173 97,713 108,662 1,486
Other comprehensive income (OCI)
Items that will not be reclassified to profit or loss in subsequent periodsRemeasurements of the defined benefit plans, net 235 (1,050) 223 3
Net change in fair value of investment in equity instruments measured at fair value through OCI
(464) 724 1,216 17
(229) (326) 1,439 20Items that may be reclassified to profit or loss in subsequent periodsForeign currency translation differences
Translation difference relating to foreign operations 3,238 8,447 (656) (9)
Net change in fair value of hedges of net investment in foreign operations
(287) - - -
Reclassification of foreign currency translation differences to profit and loss on sale of hosted data center services, Workday business and Cornerstone OnDemand business
(4,210) - - -
Net change in time value of option contracts designated as cash flow hedges
463 (520) 52 1
Net change in intrinsic value of option contracts designated as cash flow hedges
811 (1,558) 958 13
Net change in fair value of forward contracts designated as cash flow hedges
1,255 (2,652) 3,035 41
Net change in fair value of investment in debt instruments measured at fair value through OCI
(18) 1,222 1,851 25
1,252 4,939 5,240 71 Total other comprehensive income, net of taxes 1,023 4,613 6,679 91
Total comprehensive income for the year 91,196 102,326 115,341 1,577
Total comprehensive income attributable to:Equity holders of the Company 90,945 101,673 114,678 1,568
Non-controlling interest 251 653 663 9
91,196 102,326 115,341 1,577 The accompanying notes form an integral part of these consolidated financial statements.
Consolidated Statement of Comprehensive Income(` in millions, except share and per share data, unless otherwise stated)
Consolidated financial statements under IFRS
314

Oth
er c
ompo
nent
s of
equ
ity
Equi
ty
attri
buta
ble
to th
e eq
uity
ho
lder
s of
th
e Co
mpa
ny
Non
-co
ntro
lling
in
tere
stTo
tal
equi
tyPa
rticu
lars
Num
ber o
f Sha
res*
Shar
e ca
pita
l, fu
lly
paid
-up
Shar
e pr
emiu
mRe
tain
ed
earn
ings
Shar
e-ba
sed
paym
ent
rese
rve
SEZ
Re-
inve
stm
ent
rese
rve
Fore
ign
curr
ency
tra
nsla
tion
rese
rve
Cash
flo
w
hedg
ing
rese
rve
Oth
er
rese
rves
**
As a
t Apr
il 1,
2018
4,5
23,7
84,4
91
9,0
48
800
45
3,26
5 1,
772
-16
,618
(
114)
1,54
7 4
82,9
36
2,41
0 48
5,34
6
Adju
stm
ent o
n ad
optio
n of
IFRS
15
##
- -
- (
2,27
9) -
--
- -
(2,
279)
- (
2,27
9)
Adju
sted
bal
ance
as
at A
pril
1, 2
018
4,5
23,7
84,4
91
9,0
48
800
45
0,98
6 1,
772
-16
,618
(
114)
1,54
7 4
80,6
57
2,41
0 48
3,06
7
Com
preh
ensi
ve in
com
e fo
r the
yea
r
Profi
t for
the
year
-
- -
90,
031
--
- -
- 9
0,03
1 14
2 9
0,17
3
Othe
r com
preh
ensi
ve in
com
e
- -
- -
--
(1,3
68)
2,5
29
(24
7) 9
14
109
1,023
Tota
l com
preh
ensi
ve in
com
e fo
r the
yea
r -
- -
90,
031
--
(1,3
68)
2,5
29
(24
7) 9
0,94
5 25
1 9
1,196
Tran
sact
ion
with
ow
ners
of t
he C
ompa
ny, r
ecog
nize
d di
rect
ly in
equ
ity
Issu
e of
equ
ity s
hare
s on
exe
rcis
e of
opt
ions
1,6
81,7
17
4
528
-
(52
8)-
- -
- 4
-
4
Issu
e of
sha
res
by c
ontr
olle
d tr
ust o
n ex
erci
se o
f op
tions
- -
- 5
65
(56
5)-
- -
--
- -
Tran
sfer
red
to s
peci
al e
cono
mic
zone
re-in
vest
men
t re
serv
e -
- -
(28,
565)
-28
,565
-
- -
--
-
Cash
div
iden
d pa
id (i
nclu
ding
div
iden
d ta
x the
reon
) # -
- -
(5,
434)
--
- -
- (
5,43
4)-
(5,
434)
Bonu
s is
sue
of e
quity
sha
res
# 1
,508
,469
,180
3
,016
(7
95)
(1,
454)
--
- -
(76
7)-
- -
Loss
of c
ontr
ol in
sub
sidi
ary
- -
- -
--
- -
--
(52)
(52
)
Infu
sion
of c
apita
l -
- -
- -
--
- -
- 2
8 28
Com
pens
atio
n co
st re
late
d to
em
ploy
ee s
hare
-bas
ed
paym
ent
- -
- 6
1
,938
-
- -
-1,9
44
-1,9
44
Tota
l tra
nsac
tions
with
ow
ners
of t
he C
ompa
ny 1,
510,
150,
897
3,0
20
(267
) (3
4,88
2)84
5 28
,565
-
- (
767)
(3,
486)
(24)
(3,
510)
As a
t Mar
ch 3
1, 20
19
6,0
33,9
35,3
88
12,
068
533
50
6,13
5 2
,617
28
,565
15
,250
2
,415
53
3 5
68,11
6 2,
637
570,
753
The
acco
mpa
nyin
g no
tes
form
an
inte
gral
par
t of t
hese
con
solid
ated
fina
ncia
l sta
tem
ents
.
Con
solid
ated
Sta
tem
ent o
f Cha
nges
In E
quity
(` in
mill
ions
, exc
ept s
hare
and
per
sha
re d
ata,
unl
ess
othe
rwis
e st
ated
)
Consolidated financial statements under IFRSIntegrated Annual Report 2020-21
Wipro Limited
315

Con
solid
ated
Sta
tem
ent o
f Cha
nges
In E
quity
(` in
mill
ions
, exc
ept s
hare
and
per
sha
re d
ata,
unl
ess
othe
rwis
e st
ated
)O
ther
com
pone
nts
of e
quity
Equi
ty
attri
buta
ble
to th
e eq
uity
ho
lder
s of
th
e Co
mpa
ny
Non
-co
ntro
lling
in
tere
stTo
tal
equi
tyPa
rticu
lars
Num
ber o
f Sh
ares
*
Shar
e ca
pita
l, fu
lly
paid
-up
Shar
e pr
emiu
mRe
tain
ed
earn
ings
Shar
e-ba
sed
paym
ent
rese
rve
SEZ
Re-
inve
stm
ent
rese
rve
Fore
ign
curr
ency
tra
nsla
tion
rese
rve
Cash
flo
w
hedg
ing
rese
rve
Oth
er
rese
rves
**
As a
t Apr
il 1,
2019
6
,033
,935
,388
1
2,06
8 5
33
506,
135
2,6
17
28,5
65
15,2
50
2,4
15
533
568
,116
2,63
7 57
0,75
3
Adju
stm
ent o
n ad
optio
n of
IFRS
16
##
- -
-(8
72)
--
- -
- (8
72)
-(8
72)
Adju
sted
bal
ance
as
at A
pril
1, 2
019
6,0
33,9
35,3
88
12,
068
533
50
5,26
3 2
,617
28
,565
15
,250
2
,415
53
3 5
67,2
44
2,63
7 56
9,88
1
Com
preh
ensi
ve in
com
e fo
r the
yea
r
Profi
t for
the
year
-
- -
97,
218
--
- -
- 9
7,21
8 49
5 9
7,713
Othe
r com
preh
ensi
ve in
com
e
- -
- -
--
8,28
9 (4
,730
)89
6 4,
455
158
4,61
3
Tota
l com
preh
ensi
ve in
com
e fo
r the
yea
r -
- -
97,
218
--
8,28
9 (4
,730
)89
6 10
1,673
65
3 10
2,32
6
Tran
sact
ion
with
ow
ners
of t
he C
ompa
ny, r
ecog
nize
d di
rect
ly
in e
quity
Issu
e of
equ
ity s
hare
s on
exe
rcis
e of
opt
ions
2,4
98,9
25
5
742
-
(74
2)-
- -
- 5
-
5
Buyb
ack
of e
quity
sha
res
#(3
23,0
76,9
23)
(64
6) -
(10
5,00
0) -
--
-64
6 (1
05,0
00)
- (
105,
000)
Tran
sact
ion
cost
rela
ted
to b
uyba
ck o
f equ
ity s
hare
s -
- -
(311
) -
--
- -
(311
)-
(311
)
Issu
e of
sha
res
by c
ontr
olle
d tr
ust o
n ex
erci
se o
f opt
ions
- -
-1,
026
(1,0
26)
--
- -
--
-
Com
pens
atio
n co
st re
late
d to
em
ploy
ee s
hare
-bas
ed
paym
ent
- -
- 9
1
,262
-
- -
-1,2
71
-1,2
71
Effe
ct o
f mod
ifica
tion
of A
DS R
SUs
from
equ
ity s
ettle
d to
ca
sh s
ettle
d #
##
- -
- -
(56
1)-
- -
- (5
61)
-(5
61)
Tran
sfer
red
to s
peci
al e
cono
mic
zone
re-in
vest
men
t res
erve
- -
- (1
5,23
9) -
15,2
39
- -
--
- -
Cash
div
iden
d pa
id (i
nclu
ding
div
iden
d ta
x the
reon
) # -
- -
(6,
863)
--
- -
- (
6,86
3)-
(6,
863)
Cash
div
iden
d pa
id to
Non
-con
trol
ling
inte
rest
hol
ders
- -
- -
--
- -
--
(1,4
15)
(1,4
15)
Tota
l tra
nsac
tions
with
ow
ners
of t
he C
ompa
ny(3
20,5
77,9
98)
(64
1) 7
42
(12
6,37
8)(1
,067
)15
,239
-
-64
6 (1
11,4
59)
(1,4
15)
(11
2,87
4)
As a
t Mar
ch 3
1, 20
20
5,7
13,3
57,3
90
11,4
27
1,275
47
6,10
3 1,
550
43,8
04
23,5
39
(2,3
15)
2,0
75
557
,458
1,8
75
559,
333
The
acco
mpa
nyin
g no
tes
form
an
inte
gral
par
t of t
hese
con
solid
ated
fina
ncia
l sta
tem
ents
.
Consolidated financial statements under IFRS
316

Oth
er c
ompo
nent
s of
equ
ity
Equi
ty
attri
buta
ble
to th
e eq
uity
ho
lder
s of
th
e Co
mpa
ny
Non
-co
ntro
lling
in
tere
stTo
tal
equi
tyPa
rticu
lars
Num
ber o
f Sh
ares
*
Shar
e ca
pita
l, fu
lly
paid
-up
Shar
e pr
emiu
mRe
tain
ed
earn
ings
Shar
e-ba
sed
paym
ent
rese
rve
SEZ
Re-
inve
stm
ent
rese
rve
Fore
ign
curr
ency
tra
nsla
tion
rese
rve
Cash
flo
w
hedg
ing
rese
rve
Oth
er
rese
rves
**
As a
t Apr
il 1,
2020
5
,713
,357
,390
1
1,427
1,2
75
476,
103
1,55
0 43
,804
23
,539
(2
,315
) 2
,075
5
57,4
58
1,875
55
9,33
3
Com
preh
ensi
ve in
com
e fo
r the
yea
r
Profi
t for
the
year
-
- -
107,
946
--
- -
- 10
7,94
6 71
6 10
8,66
2
Othe
r com
preh
ensi
ve in
com
e
- -
- -
--
(60
3) 4
,045
3
,290
6,
732
(53)
6,67
9
Tota
l com
preh
ensi
ve in
com
e fo
r the
yea
r -
- -
107,
946
--
(60
3) 4
,045
3
,290
11
4,67
8 66
3 11
5,34
1
Tran
sact
ion
with
ow
ners
of t
he C
ompa
ny, r
ecog
nize
d di
rect
ly
in e
quity
Issu
e of
equ
ity s
hare
s on
exe
rcis
e of
opt
ions
3,2
81,1
65
6
866
-
(86
6)-
- -
- 6
-
6
Buyb
ack
of e
quity
sha
res,
incl
udin
g ta
x the
reon
#(2
37,5
00,0
00)
(47
5) (
1,42
7) (
115,
018)
--
- -
475
(116
,445
)-
(11
6,44
5)
Tran
sact
ion
cost
rela
ted
to b
uyba
ck o
f equ
ity s
hare
s -
- -
(199
) -
--
- -
(199
)-
(199
)
Issu
e of
sha
res
by c
ontr
olle
d tr
ust o
n ex
erci
se o
f opt
ions
* -
- -
662
(
662)
--
- -
--
-
Effe
ct o
f mod
ifica
tion
of A
DS R
SUs
from
cas
h se
ttle
d to
equ
ity
sett
led #
##
- -
- -
739
--
- -
739
-
739
Com
pens
atio
n co
st re
late
d to
em
ploy
ee s
hare
-bas
ed p
aym
ent
- -
- 7
2
,310
-
- -
-2,
317
-2,
317
Tran
sfer
red
from
spe
cial
eco
nom
ic zo
ne re
-inve
stm
ent
rese
rve
- -
-2,
650
- (2
,650
)-
- -
--
-
Cash
div
iden
d pa
id -
- -
(5,
459)
--
- -
- (
5,45
9) (
960)
(6,
419)
Othe
rs -
- -
- -
--
- -
-(8
0) (
80)
Tota
l tra
nsac
tions
with
ow
ners
of t
he C
ompa
ny(2
34,2
18,8
35)
(46
9)(5
61)
(11
7,35
7) 1,
521
(2,6
50)
- -
475
(119
,041
) (1
,040
) (
120,
081)
As a
t Mar
ch 3
1, 20
21
5,4
79,13
8,55
5 1
0,95
8 7
14
466,
692
3,0
71
41,15
4 22
,936
1,
730
5,8
40
553
,095
1,4
98
554,
593
Conv
enie
nce
trans
latio
n in
to U
S do
llar i
n m
illio
ns (u
naud
ited)
Ref
er to
Not
e 2(
iii)
150
10
6,38
1 42
56
3 31
4 24
80
7,
564
20
7,58
4
* In
clud
es 2
7,35
3,85
3, 2
2,74
6,08
1 an
d 19
,401
,215
trea
sury
sha
res
held
as
at M
arch
31,
201
9, 2
020
and
2021
, res
pect
ivel
y by a
con
trol
led
trus
t.2,
599,
183,
4,6
07,7
72 a
nd 3
,344
,866
sha
res
have
bee
n tr
ansf
erre
d by
the
cont
rolle
d tr
ust t
o el
igib
le e
mpl
oyee
s on
exe
rcis
e of
opt
ions
dur
ing
the
year
end
ed M
arch
31,
201
9, 2
020
and
2021
, res
pect
ivel
y.**
Ref
er to
Not
e 20
# R
efer
to N
ote
22#
# R
efer
to N
ote
3#
##
Ref
er to
Not
e 30
The
acco
mpa
nyin
g no
tes
form
an
inte
gral
par
t of t
hese
con
solid
ated
fina
ncia
l sta
tem
ents
. C
onso
lidat
ed S
tate
men
t of C
hang
es In
Equ
ity(`
in m
illio
ns, e
xcep
t sha
re a
nd p
er s
hare
dat
a, u
nles
s ot
herw
ise
stat
ed)
Consolidated financial statements under IFRSIntegrated Annual Report 2020-21
Wipro Limited
317

Year ended March 31, 2019
Year ended March 31, 2020
Year ended March 31, 2021
Year ended March 31, 2021
Convenience translation
into US dollar in millions
(unaudited) Refer to Note
2(iii)
Cash flows from operating activities:
Profit for the year 90,173 97,713 108,662 1,486
Adjustments to reconcile profit for the year to net cash generated from operating activities:
Gain on sale of property, plant and equipment, net (309) (11) (516) (7)
Depreciation, amortization and impairment expense 19,474 20,862 27,656 378
Unrealized exchange (gain)/ loss, net and exchange (gain)/ loss on borrowings
(546) 6,376 (2,251) (31)
Share-based compensation expense 1,938 1,262 2,310 32
Share of net (profit) /loss of associates accounted for using the equity method
43 (29) (130) (2)
Income tax expense 25,242 24,799 30,345 415
Finance and other income, net of finance expense (17,371) (18,945) (16,614) (227)
(Gain)/loss from sale of business and loss of control in subsidiary, net
(4,344) (1,144) 81 1
Changes in operating assets and liabilities; net of effects from acquisitions:
Trade receivables 1,392 (3,327) 12,848 176
Unbilled receivables and Contract assets 4,580 (3,561) (1,062) (15)
Inventories (566) 2,085 803 11
Other assets (6,909) (80) 931 13
Trade payables, accrued expenses, other liabilities and provisions
20,844 (12,401) 5,698 78
Contract liabilities 7,824 (6,572) 3,704 51
Cash generated from operating activities before taxes 141,465 107,027 172,465 2,359 Income taxes paid, net (25,149) (6,384) (24,915) (341)
Net cash generated from operating activities 116,316 100,643 147,550 2,018
Cash flows from investing activities:
Purchase of property, plant and equipment (22,781) (23,497) (19,577) (268)
Proceeds from sale of property, plant and equipment 1,940 1,270 753 10
Purchase of investments (930,614) (1,178,247) (1,172,251) (16,027)
Proceeds from sale of investments 954,954 1,212,826 1,189,059 16,257
Proceeds from sale of hosted data center services business and loss of control in subsidiary, net of related expenses and cash
26,103 - - -
Payment for business acquisitions including deposits and escrow, net of cash acquired
- (10,003) (9,873) (135)
Proceeds from sale of business - 7,459 - -
Interest received 20,163 23,837 19,624 268
Dividend received 361 367 4 ^
Net cash generated from investing activities 50,126 34,012 7,739 105
Consolidated Statement of Cash Flows(` in millions, except share and per share data, unless otherwise stated)
Consolidated financial statements under IFRS
318

Year ended March 31, 2019
Year ended March 31, 2020
Year ended March 31, 2021
Year ended March 31, 2021
Convenience translation
into US dollar in millions
(unaudited) Refer to Note
2(iii)Cash flows from financing activities:
Proceeds from issuance of equity shares/shares pending allotment
4 14 6 ^
Repayment of loans and borrowings (104,039) (132,380) (97,206) (1,329)
Proceeds from loans and borrowings 65,161 106,342 103,418 1,414
Repayment of lease liabilities - (6,784) (8,660) (118)
Payment for deferred contingent consideration in respect of business combination
(265) - - -
Payment for buyback of equity shares, including transaction cost
- (105,311) (95,199) (1,302)
Payment of tax on buyback of equity shares - - (21,445) (293)
Interest paid (4,796) (4,601) (3,335) (46)
Payment of cash dividend (4,504) (5,689) (5,459) (75)
Payment of tax on cash dividend (930) (1,174) - -
Payment of cash dividend to Non-controlling interest holders - (1,415) (960) (13)
Net cash used in financing activities (49,369) (150,998) (128,840) (1,762)
Net increase/ (decrease) in cash and cash equivalents during the year
117,073 (16,343) 26,449 361
Effect of exchange rate changes on cash and cash equivalents 526 1,922 (890) (12)
Cash and cash equivalents at the beginning of the year 40,926 158,525 144,104 1,970
Cash and cash equivalents at the end of the year (Note 11) 158,525 144,104 169,663 2,319 Refer to Note 14 for supplementary information on the consolidated statement of cash flows.^ Value is less than 1
The accompanying notes form an integral part of these consolidated financial statements.
Consolidated Statement of Cash Flows(` in millions, except share and per share data, unless otherwise stated)
Consolidated financial statements under IFRSIntegrated Annual Report 2020-21
Wipro Limited
319

1. The Company overview
Wipro Limited (“Wipro” or the “Parent Company”), together with its subsidiaries and controlled trusts (collectively, “we”, “us”, “our”, “the Company” or the “Group”) is a global information technology (“IT”), consulting and business process services (“BPS”) company.
Wipro is a public limited company incorporated and domiciled in India. The address of its registered office is Wipro Limited, Doddakannelli, Sarjapur Road, Bengaluru – 560 035, Karnataka, India. The Company has its primary listing with BSE Ltd. and National Stock Exchange of India Ltd. The Company’s American Depository Shares (“ADS”) representing equity shares are also listed on the New York Stock Exchange.
The Company’s Board of Directors authorized these consolidated financial statements for issue on June 9, 2021.
2. Basis of preparation of consolidated financial statements
(i) Statement of compliance and basis of preparation
The consolidated financial statements have been prepared in compliance with International Financial Reporting Standards and its interpretations (“IFRS”), as issued by the International Accounting Standards Board (“IASB”). All accounting policies have been applied consistently to all periods presented in these consolidated financial statements, except for new accounting standards adopted by the Company.
The consolidated financial statements correspond to the classification provisions contained in IAS 1(revised), “Presentation of Financial Statements”. For clarity, various items are aggregated in the consolidated statement of income, consolidated statement of comprehensive income and consolidated statement of financial position. These items are disaggregated separately in the notes to the consolidated financial statements, where applicable.
All amounts included in the consolidated financial statements are reported in millions of Indian rupees (` in millions) except share and per share data, unless otherwise stated. Due to rounding off, the numbers presented throughout the document may not add up precisely to the totals and percentages may not precisely reflect the absolute figures.
(ii) Basis of measurement
The consolidated financial statements have been prepared on a historical cost convention and on an accrual basis, except for the following material items
which have been measured at fair value as required by relevant IFRS:
a. Derivative financial instruments,
b. Financial instruments classified as fair value through other comprehensive income or fair value through profit or loss,
c. The defined benefit liability/(asset) is recognized as the present value of defined benefit obligation less fair value of plan assets; and
d. Contingent consideration.
(iii) Convenience translation (unaudited)
The accompanying consolidated financial statements have been prepared and reported in Indian rupees, the functional currency of the Parent Company. Solely for the convenience of the readers, the consolidated financial statements as at and for the year ended March 31, 2021, have been translated into United States dollars at the certified foreign exchange rate of $1 = ` 73.14 as published by Federal Reserve Board of Governors on March 31, 2021. No representation is made that the Indian rupee amounts have been, could have been or could be converted into United States dollars at such a rate or any other rate. Due to rounding off, the translated numbers presented throughout the document may not add up precisely to the totals.
(iv) Use of estimates and judgment
The preparation of the consolidated financial statements in conformity with IFRS requires the management to make judgments, estimates and assumptions that affect the application of accounting policies and the reported amounts of assets, liabilities, income, and expenses. Actual results may differ from those estimates.
Estimates and underlying assumptions are reviewed on an ongoing basis. Revision to accounting estimates are recognized in the period in which the estimates are revised and in any future periods affected. In particular, information about significant areas of estimation, uncertainty and critical judgments in applying accounting policies that have the most significant effect on the amounts recognized in the consolidated financial statements are included in the following notes:
a) Revenue recognition: The Company applies judgement to determine whether each product or service promised to a customer is capable of being distinct, and is distinct in the context of the contract, if not, the promised product or service is combined and accounted as a single performance obligation. The Company allocates the arrangement consideration
Notes to the Consolidated Financial Statements
Consolidated financial statements under IFRS
320
(` in millions, except share and per share data, unless otherwise stated)
to separately identifiable performance obligation deliverables based on their relative stand-alone selling price. In cases where the Company is unable to determine the stand-alone selling price the Company uses expected cost-plus margin approach in estimating the stand-alone selling price. The Company uses the percentage of completion of method using the input (cost expended) method to measure progress towards completion in respect of fixed price contracts. Percentage of completion method of accounting relies on estimates of total expected contract revenue and costs. This method is followed when reasonably dependable estimates of the revenues and costs applicable to various elements of the contract can be made. Key factors that are reviewed in estimating the future costs to complete include estimates of future labor costs and productivity efficiencies. Because the financial reporting of these contracts depends on estimates that are assessed continually during the term of these contracts, revenue recognized, profit and timing of revenue for remaining performance obligations are subject to revisions as the contract progresses to completion. When estimates indicate that a loss will be incurred, the loss is provided for in the period in which the loss becomes probable. Volume discounts are recorded as a reduction of revenue. When the amount of discount varies with the levels of revenue, volume discount is recorded based on estimate of future revenue from the customer.
b) Impairment testing: Goodwill and intangible assets with indefinite useful life recognized on business combination are tested for impairment at least annually and when events occur or changes in circumstances indicate that the recoverable amount of an asset or a cash generating unit to which an asset pertain is less than the carrying value. The Company assesses acquired intangible assets with finite useful life for impairment whenever events or changes in circumstances indicate that the carrying amount may not be recoverable. The recoverable amount of an asset or a cash generating unit is higher of value-in-use and fair value less cost of disposal. The calculation of value in use of an asset or a cash generating unit involves use of significant estimates and assumptions which include turnover, growth rates and net margins used to calculate projected future cash flows, risk-adjusted discount rate, future economic and market conditions.
c) Income taxes: The major tax jurisdictions for the Company are India and the United States of America. Significant judgments are involved in determining
the provision for income taxes including judgment on whether tax positions are probable of being sustained in tax assessments. A tax assessment can involve complex issues, which can only be resolved over extended time periods.
d) Deferred taxes: Deferred tax is recorded on temporary differences between the tax bases of assets and liabilities and their carrying amounts, at the rates that have been enacted or substantively enacted at the reporting date. The ultimate realization of deferred tax assets is dependent upon the generation of future taxable profits during the periods in which those temporary differences and tax loss carry-forwards become deductible. The Company considers expected reversal of deferred tax liabilities and projected future taxable income in making this assessment. The amount of deferred tax assets considered realizable, however, could reduce in the near term if estimates of future taxable income during the carry-forward period are reduced.
e) Business combinations: In accounting for business combinations, judgment is required in identifying whether an identifiable intangible asset is to be recorded separately from goodwill. Additionally, estimating the acquisition date fair value of the identifiable assets acquired (including useful life estimates), liabilities assumed, and contingent consideration assumed involves management judgment. These measurements are based on information available at the acquisition date and are based on expectations and assumptions that have been deemed reasonable by management. Changes in these judgments, estimates, and assumptions can materially affect the results of operations.
f) Defined benefit plans and compensated absences: The cost of the defined benefit plans, compensated absences and the present value of the defined benefit obligations are based on actuarial valuation using the projected unit credit method. An actuarial valuation involves making various assumptions that may differ from actual developments in the future. These include the determination of the discount rate, future salary increases and mortality rates. Due to the complexities involved in the valuation and its long-term nature, a defined benefit obligation is highly sensitive to changes in these assumptions. All assumptions are reviewed at each reporting date.
g) Expected credit losses on financial assets: The impairment provisions of financial assets are based on assumptions about risk of default and expected timing of collection. The Company uses judgment in making these assumptions and selecting the
Notes to the Consolidated Financial Statements
Consolidated financial statements under IFRSIntegrated Annual Report 2020-21
Wipro Limited
321

inputs to the expected credit loss calculation based on the Company’s history of collections, customer’s creditworthiness, existing market conditions as well as forward looking estimates at the end of each reporting period.
h) Measurement of fair value of non-marketable equity investments: These instruments are initially recorded at cost and subsequently measured at fair value. Fair value of investments is determined using the market and income approaches. The market approach includes the use of financial metrics and ratios of comparable companies, such as revenue, earnings, comparable performance multiples, recent financial rounds and the level of marketability of the investments. The selection of comparable companies requires management judgment and is based on number of factors, including comparable company sizes, growth rates, and development stages. The income approach includes the use of discounted cash flow model, which requires significant estimates regarding the investees’ revenue, costs, and discount rates based on the risk profile of comparable companies. Estimates of revenue and costs are developed using available historical and forecast data.
i) Useful lives of property, plant and equipment: The Company depreciates property, plant and equipment on a straight-line basis over estimated useful lives of the assets. The charge in respect of periodic depreciation is derived based on an estimate of an asset’s expected useful life and the expected residual value at the end of its life. The lives are based on historical experience with similar assets as well as anticipation of future events, which may impact their life, such as changes in technology. The estimated useful life is reviewed at least annually.
j) Useful lives of intangible assets: The Company amortizes intangible assets on a straight-line basis over estimated useful lives of the assets. The useful life is estimated based on a number of factors including the effects of obsolescence, demand, competition and other economic factors such as the stability of the industry and known technological advances and the level of maintenance expenditures required to obtain the expected future cash flows from the assets. The estimated useful life is reviewed at least annually.
k) Leases: IFRS 16 defines a lease term as the non-cancellable period for which the lessee has the right to use an underlying asset including optional periods, when an entity is reasonably certain to exercise an option to extend (or not to terminate) a
lease. The Company considers all relevant facts and circumstances that create an economic incentive for the lessee to exercise the option when determining the lease term. The option to extend lease is included in the lease term, if it is reasonably certain that the lessee would exercise the option. The Company reassesses the option upon occurrence of either a significant event or change in circumstances that are within the control of the lessee.
l) Provisions and contingent liabilities: The Company estimates the provisions that have present obligations as a result of past events and it is probable that outflow of resources will be required to settle the obligations. These provisions are reviewed at the end of each reporting date and are adjusted to reflect the current best estimates.
The Company uses significant judgement to disclose contingent liabilities. Contingent liabilities are disclosed when there is a possible obligation arising from past events, the existence of which will be confirmed only by the occurrence or non-occurrence of one or more uncertain future events not wholly within the control of the Company or a present obligation that arises from past events where it is either not probable that an outflow of resources will be required to settle the obligation or a reliable estimate of the amount cannot be made. Contingent assets are neither recognized nor disclosed in the financial statements.
m) Other estimates: The share-based compensation expense is determined based on the Company’s estimate of equity instruments that will eventually vest. Fair valuation of derivative hedging instruments designated as cash flow hedges involves significant estimates relating to the occurrence of forecasted transactions.
n) Uncertainty relating to the global health pandemic on COVID-19: In assessing the recoverability of receivables including unbilled receivables, contract assets and contract costs, goodwill, intangible assets, and certain investments, the Company has considered internal and external information up to the date of approval of these consolidated financial statements including credit reports and economic forecasts. The Company has performed sensitivity analysis on the assumptions used herein. Based on the current indicators of future economic conditions, the Company expects to recover the carrying amount of these assets.
The Company bases its assessment on the belief that the probability of occurrence of forecasted
Notes to the Consolidated Financial Statements
Consolidated financial statements under IFRS
322

transactions is not impacted by COVID-19. The Company has considered the effect of changes, if any, in both counterparty credit risk and its own credit risk while assessing hedge effectiveness and measuring hedge ineffectiveness and continues to believe that COVID-19 has no impact on effectiveness of its hedges.
The impact of COVID-19 remains uncertain and may be different from what we have estimated as of the date of approval of these consolidated financial statements and the Company will continue to closely monitor any material changes to future economic conditions.
3. Significant accounting policies
(i) Basis of consolidation
Subsidiaries and controlled trusts
The Company determines the basis of control in line with the requirements of IFRS 10, Consolidated Financial Statements. Subsidiaries and controlled trusts are entities controlled by the Group. The Group controls an entity when the parent has power over the entity, it is exposed to, or has rights to, variable returns from its involvement with the entity and has the ability to affect those returns through its power over the entity. The financial statements of subsidiaries and controlled trusts are included in the consolidated financial statements from the date on which control commences until the date on which control ceases.
All intra-Group balances, transactions, income and expenses are eliminated in full on consolidation.
Non-controlling interest
Non-controlling interests in the net assets (excluding goodwill) of consolidated subsidiaries are identified separately from the Company’s equity. The interest of non-controlling shareholders may be initially measured either at fair value or at the non-controlling interest’s proportionate share of the fair value of the acquiree’s identifiable net assets. The choice of measurement basis is made on an acquisition to acquisition basis. Subsequent to acquisition, the carrying amount of non-controlling interest is the amount of those interests at initial recognition plus the non-controlling interest’s share of subsequent changes in equity. Total comprehensive income is attributed to non-controlling interests even if it results in the non-controlling interest having a deficit balance.
Investments accounted for using the equity method
Investments accounted for using the equity method are entities in respect of which, the Company has
significant influence, but not control, over the financial and operating policies. Generally, a Company has a significant influence if it holds between 20 and 50 percent of the voting power of another entity. Investments in such entities are accounted for using the equity method and are initially recognized at cost. The carrying amount of investment is increased/ decreased to recognize investors share of profit or loss of the investee after the acquisition date.
Non-current assets and disposal groups held for sale
Assets and liabilities of disposal groups that are available for immediate sale and where the sale is highly probable of being completed within one year from the date of classification are considered and classified as assets held for sale and liabilities associated with assets held for sale. Non-current assets and disposal groups held for sale are measured at the lower of carrying amount and fair value less costs to sell.
(ii) Functional and presentation currency
Items included in the financial statements of each of the Company’s entities are measured using the currency of the primary economic environment in which these entities operate (i.e. the “functional currency”). These consolidated financial statements are presented in Indian rupees, which is the functional currency of the Parent Company.
(iii) Foreign currency transactions and translation
a) Transactions and balances
Transactions in foreign currency are translated into the respective functional currencies using the exchange rates prevailing at the date of the transaction. Foreign exchange gains and losses resulting from the settlement of such transactions and from translation at the exchange rates prevailing at the reporting date of monetary assets and liabilities denominated in foreign currencies are recognized in the consolidated statement of income and reported within foreign exchange gains/(losses), net, within results of operating activities except when deferred in other comprehensive income as qualifying cash flow hedges and qualifying net investment hedges. Gains/(losses), net, relating to translation or settlement of borrowings denominated in foreign currency are reported within finance expense. Non-monetary assets and liabilities denominated in foreign currency and measured at historical cost are translated at the exchange rate prevalent at the date of transaction. Translation differences on non-monetary financial assets measured at fair value at the reporting date, such as equities classified as financial instruments
Notes to the Consolidated Financial Statements
Consolidated financial statements under IFRSIntegrated Annual Report 2020-21
Wipro Limited
323

measured at fair value through other comprehensive income are included in other comprehensive income, net of taxes.
b) Foreign operations
For the purpose of presenting consolidated financial statements, the assets and liabilities of the Company’s foreign operations that have a functional currency other than Indian rupees are translated into Indian rupees using exchange rates prevailing at the reporting date. Income and expense items are translated at the average exchange rates for the period. Exchange differences arising, if any, are recognized in other comprehensive income and held in foreign currency translation reserve (FCTR), a component of equity, except to the extent that the translation difference is allocated to non-controlling interest. When a foreign operation is disposed of, the relevant amount recognized in FCTR is transferred to the consolidated statement of income as part of the profit or loss on disposal. Goodwill and fair value adjustments arising on the acquisition of a foreign operation are treated as assets and liabilities of the foreign operation and translated at the exchange rate prevailing at the reporting date.
c) Others
Foreign currency differences arising on the translation or settlement of a financial liability designated as a hedge of a net investment in a foreign operation are recognized in other comprehensive income and presented within equity in the FCTR to the extent the hedge is effective. To the extent the hedge is ineffective, such differences are recognized in the consolidated statement of income.
When the hedged part of a net investment is disposed of, the relevant amount recognized in FCTR is transferred to the consolidated statement of income as part of the profit or loss on disposal. Foreign currency differences arising from translation of intercompany receivables or payables relating to foreign operations, the settlement of which is neither planned nor likely in the foreseeable future, are considered to form part of net investment in foreign operation and are recognized in FCTR.
(iv) Financial instruments
A) Non-derivative financial instruments:
Non-derivative financial instruments consist of:
• financial assets which include cash and cash equivalents, trade receivables, unbilled receivables, finance lease receivables, employee and other
advances, investments in equity and debt securities and eligible current and non-current assets; Financial assets are derecognized when substantial risks and rewards of ownership of the financial asset have been transferred. In cases where substantial risks and rewards of ownership of the financial assets are neither transferred nor retained, financial assets are derecognized only when the Company has not retained control over the financial asset.
• financial liabilities which include long and short-term loans and borrowings, bank overdrafts, trade payables and accrued expenses, lease liabilities and eligible current and non-current liabilities.
Non-derivative financial instruments are recognized initially at fair value. Subsequent to initial recognition, non-derivative financial instruments are measured as described below:
a. Cash and cash equivalents
The Company’s cash and cash equivalents consist of cash on hand and in banks and demand deposits with banks, which can be withdrawn at any time, without prior notice or penalty on the principal.
For the purposes of the statement of cash flows, cash and cash equivalents include cash on hand, in banks and demand deposits with banks, net of outstanding bank overdrafts that are repayable on demand and are considered part of the Company’s cash management system. In the consolidated statement of financial position, bank overdrafts are presented under borrowings within current liabilities.
b. Investments
Financial instruments measured at amortized cost:
Debt instruments that meet the following criteria are measured at amortized cost (except for debt instruments that are designated at fair value through Profit or Loss (FVTPL) on initial recognition):
• the asset is held within a business model whose objective is to hold assets in order to collect contractual cash flows; and
• the contractual terms of the instrument give rise on specified dates to cash flows that are solely payment of principal and interest on the principal amount outstanding.
Financial instruments measured at fair value through other comprehensive income (FVTOCI):
Debt instruments that meet the following criteria are measured at fair value through other
Notes to the Consolidated Financial Statements
Consolidated financial statements under IFRS
324

comprehensive income (FVTOCI) (except for debt instruments that are designated at fair value through Profit or Loss (FVTPL) on initial recognition):
• the asset is held within a business model whose objective is achieved both by collecting contractual cash flows and selling the financial asset; and
• the contractual terms of the instrument give rise on specified dates to cash flows that are solely payment of principal and interest on the principal amount outstanding.
Interest income is recognized in the consolidated statement of income for FVTOCI debt instruments. Other changes in fair value of FVTOCI financial assets are recognized in other comprehensive income. When the investment is disposed of, the cumulative gain or loss previously accumulated in reserves is transferred to the consolidated statement of income.
Financial instruments measured at fair value through profit or loss (FVTPL):
Instruments that do not meet the amortized cost or FVTOCI criteria are measured at FVTPL. Financial assets at FVTPL are measured at fair value at the end of each reporting period, with any gains or losses arising on re-measurement recognized in consolidated statement of income. The gain or loss on disposal is recognized in the consolidated statement of income.
Interest income is recognized in the consolidated statement of income for FVTPL debt instruments. Dividend on financial assets at FVTPL is recognized when the Group’s right to receive dividend is established.
Investments in equity instruments:
The Company carries certain equity instruments which are not held for trading. At initial recognition, the Company may make an irrevocable election to present subsequent changes in the fair value of an investment in an equity instrument in other comprehensive income (FVTOCI) or through statement of income (FVTPL). For investments designated to be classified as FVTOCI, movements in fair value of investments are recognized in other comprehensive income and the gain or loss is not transferred to consolidated statement of income on disposal of investments. For investments designated to be classified as FVTPL, both movements in fair value of investments and gain or
loss on disposal of investments are recognized in the consolidated statement of income.
Dividends from these investments are recognized in the consolidated statement of income when the Company’s right to receive dividends is established.
c. Other financial assets:
Other financial assets are non-derivative financial assets with fixed or determinable payments that are not quoted in an active market. They are presented as current assets, except for those maturing later than 12 months after the reporting date which are presented as non-current assets. These are initially recognized at fair value and subsequently measured at amortized cost using the effective interest method, less any impairment losses. These comprise trade receivables, unbilled receivables, finance lease receivables, employee and other advances and eligible current and non-current assets.
d. Trade payables, accrued expenses, and other liabilities
Trade payables, accrued expenses, and other liabilities are initially recognized at fair value, and subsequently carried at amortized cost using the effective interest method. For these financial instruments, the carrying amounts approximate fair value due to the short-term maturity of these instruments. Contingent consideration recognized in the business combination is subsequently measured at fair value through profit or loss.
B) Derivative financial instruments
The Company is exposed to foreign currency fluctuations on foreign currency assets, liabilities, net investment in foreign operations and forecasted cash flows denominated in foreign currency.
The Company limits the effect of foreign exchange rate fluctuations by following established risk management policies including the use of derivatives. The Company enters into derivative financial instruments where the counterparty is primarily a bank.
Derivatives are recognized and measured at fair value. Attributable transaction costs are recognized in consolidated statement of income as cost.
Subsequent to initial recognition, derivative financial instruments are measured as described below:
a. Cash flow hedges
Changes in the fair value of the derivative hedging instruments designated as a cash flow hedge are
Notes to the Consolidated Financial Statements
Consolidated financial statements under IFRSIntegrated Annual Report 2020-21
Wipro Limited
325

recognized in other comprehensive income and held in cash flow hedging reserve, net of taxes, a component of equity, to the extent that the hedge is effective. To the extent that the hedge is ineffective, changes in fair value are recognized in the consolidated statement of income and reported within foreign exchange gains/(losses), net, within results from operating activities. If the hedging instrument no longer meets the criteria for hedge accounting, then hedge accounting is discontinued prospectively. If the hedging instrument expires or is sold, terminated or exercised, the cumulative gain or loss on the hedging instrument recognized in cash flow hedging reserve till the period the hedge was effective remains in cash flow hedging reserve until the forecasted transaction occurs. The cumulative gain or loss previously recognized in the cash flow hedging reserve is transferred to the consolidated statement of income upon the occurrence of the related forecasted transaction. If the forecasted transaction is no longer expected to occur, such cumulative balance is immediately recognized in the consolidated statement of income.
b. Hedges of net investment in foreign operations
The Company designates derivative financial instruments as hedges of net investments in foreign operations. The Company also designates foreign currency denominated borrowing as a hedge of net investment in foreign operations. Changes in the fair value of the derivative hedging instruments and gains/(losses) on translation or settlement of foreign currency denominated borrowings designated as a hedge of net investment in foreign operations are recognized in other comprehensive income and presented within equity in the FCTR to the extent that the hedge is effective. To the extent that the hedge is ineffective, changes in fair value are recognized in the consolidated statement of income and reported within foreign exchange gains/(losses), net within results from operating activities.
c. Others
Changes in fair value of foreign currency derivative instruments neither designated as cash flow hedges nor hedges of net investment in foreign operations are recognized in the consolidated statement of income and reported within foreign exchange gains/(losses), net within results from operating activities. Changes in fair value and gains/(losses), net, on settlement of foreign currency derivative instruments relating to borrowings, which have not been designated as hedges are recorded in finance expenses.
C) Derecognition of financial instruments
The Company derecognizes a financial asset when the contractual rights to the cash flows from the financial asset expire or it transfers the financial asset and the transfer qualifies for derecognition under IFRS 9. If the Company retains substantially all the risks and rewards of a transferred financial asset, the Company continues to recognize the financial asset and recognizes a borrowing for the proceeds received. A financial liability (or a part of a financial liability) is derecognized from the Company’s statement of financial position when the obligation specified in the contract is discharged or cancelled or expires.
(v) Equity and share capital
a) Share capital and Share premium
The authorized share capital of the Company as at March 31, 2021 is ` 25,274 divided into 12,504,500,000 equity shares of ` 2 each, 25,000,000 preference shares of ` 10 each and 150,000 10% optionally convertible cumulative preference shares of ` 100 each. Par value of the equity shares is recorded as share capital and the amount received in excess of par value is classified as share premium.
Every holder of the equity shares, as reflected in the records of the Company, as at the date of the shareholder meeting shall have one vote in respect of each share held for all matters submitted to vote in the shareholder meeting.
b) Shares held by controlled trust (Treasury shares)
The Company’s equity shares held by the controlled trust, which is consolidated as a part of the Group are classified as Treasury shares. The Company has 27,353,853, 22,746,081 and 19,401,215 treasury shares as at March 31, 2019, 2020 and 2021, respectively. Treasury shares are recorded at acquisition cost.
c) Retained earnings
Retained earnings comprises of the Company’s undistributed earnings after taxes. This includes Capital reserve as at March 31, 2019, 2020 and 2021 amounting to ` 1,139, ` 1,139, and ` 1,139 respectively, which is not freely available for distribution.
d) Special Economic Zone Re-Investment reserve
The SEZ Re-Investment Reserve has been created out of profit of eligible SEZ units as per provisions of section 10AA(1)(ii) of the Income–tax Act, 1961 for acquiring new plant and machinery. The said reserve should be utilized by the Company for acquiring plant and machinery as per the terms of Section 10AA(2) of the Income-tax Act, 1961. This reserve is not freely available for distribution.
Notes to the Consolidated Financial Statements
Consolidated financial statements under IFRS
326

e) Share-based payment reserve
The share-based payment reserve is used to record the value of equity-settled share-based payment transactions with employees. The amounts recorded in share-based payment reserve are transferred to share premium upon exercise of stock options and restricted stock unit options by employees.
f) Foreign currency translation reserve (FCTR)
The exchange differences arising from the translation of financial statements of foreign subsidiaries, differences arising from translation of long-term inter-company receivables or payables relating to foreign operations, settlement of which is neither planned nor likely in the foreseeable future, changes in fair value of the derivative hedging instruments and gains/losses on translation or settlement of foreign currency denominated borrowings designated as hedge of net investment in foreign operations are recognized in other comprehensive income, net of taxes and presented within equity in the FCTR.
g) Cash flow hedging reserve
Changes in fair value of derivative hedging instruments designated and effective as a cash flow hedge are recognized in other comprehensive income, net of taxes and presented within equity as cash flow hedging reserve.
h) Other reserves
Changes in the fair value of financial instruments measured at fair value through other comprehensive income and actuarial gains and losses on remeasurements of the defined benefit plans are recognized in other comprehensive income, net of taxes and presented within equity in other reserves.
Other reserves also include Capital redemption reserve, which is not freely available for distribution. As per the Companies Act, 2013, Capital redemption reserve is created when a company purchases its own shares out of free reserves or securities premium. A sum equal to the nominal value of the shares so purchased is transferred to capital redemption reserve. The reserve can be utilized in accordance with the provisions of section 69 of the Companies Act, 2013. Capital redemption reserve amounting to ` 1,122 (March 31, 2020: ` 647) is not freely available for distribution.
i) Dividend
A final dividend, including tax thereon, on common stock is recorded as a liability on the date of approval by the shareholders. An interim dividend, including tax thereon, is recorded as a liability on the date of declaration by the board of directors.
j) Buyback of equity shares
The buyback of equity shares and related transaction costs are recorded as a reduction of free reserves. Further, capital redemption reserve is created as an apportionment from retained earnings.
k) Bonus issue
For the purpose of bonus issue, the amount is transferred from capital redemption reserves, securities premium and retained earnings to the share capital.
(vi) Property, plant and equipment
a) Recognition and measurement
Property, plant and equipment are measured at cost less accumulated depreciation and impairment losses, if any. Cost includes expenditures directly attributable to the acquisition of the asset. General and specific borrowing costs directly attributable to the construction of a qualifying asset are capitalized as part of the cost.
Capital work-in-progress are measured at cost less accumulated impairment losses, if any.
b) Depreciation
The Company depreciates property, plant and equipment over the estimated useful life on a straight-line basis from the date the assets are available for use. Leasehold improvements are amortized over the shorter of estimated useful life of the asset or the related lease term. Term licenses are amortized over their respective contract term. Freehold land is not depreciated. The estimated useful life of assets is reviewed and where appropriate are adjusted, annually. The estimated useful lives of assets are as follows:
Category Useful life
Buildings 28 to 40 years
Plant and equipment 5 to 21 years
Computer equipment and software 2 to 7 years
Furniture, fixtures and equipment 3 to 10 years
Vehicles 4 to 5 years
When parts of an item of property, plant and equipment have different useful lives, they are accounted for as separate items (major components) of property, plant and equipment. Subsequent expenditure relating to property, plant and equipment is capitalized only when it is probable that future economic benefits associated with these will flow to the Company and the cost of the item can be measured reliably.
Deposits and advances paid towards the acquisition of property, plant and equipment outstanding as at
Notes to the Consolidated Financial Statements
Consolidated financial statements under IFRSIntegrated Annual Report 2020-21
Wipro Limited
327

each reporting date and the cost of property, plant and equipment not available for use before such date are disclosed under capital work-in-progress.
(vii) Business combinations, Goodwill, and Intangible assets
a) Business combinations
Business combinations are accounted for using the purchase (acquisition) method. The cost of an acquisition is measured as the fair value of the assets transferred, liabilities incurred or assumed, and equity instruments issued at the date of exchange by the Company. Identifiable assets acquired, and liabilities and contingent liabilities assumed in a business combination are measured initially at fair value at the date of acquisition. Transaction costs incurred in connection with a business acquisition are expensed as incurred.
The cost of an acquisition also includes the fair value of any contingent consideration measured as at the date of acquisition. Any subsequent changes to the fair value of contingent consideration classified as liabilities, other than measurement period adjustments, are recognized in the consolidated statement of income.
b) Goodwill
The excess of the cost of an acquisition over the Company’s share in the fair value of the acquiree’s identifiable assets and liabilities is recognized as goodwill. If the excess is negative, a bargain purchase gain is recognized immediately in the consolidated statement of income. Goodwill is measured at cost less accumulated impairment (if any).
Goodwill associated with disposal of an operation that is part of cash-generating unit is measured based on the relative values of the operation disposed of and the portion of the cash-generating unit retained, unless some other method better reflects the goodwill associated with the operation disposed of.
c) Intangible assets
Intangible assets acquired separately are measured at cost of acquisition. Intangible assets acquired in a business combination are measured at fair value as at the date of acquisition. Following initial recognition, intangible assets are carried at cost less accumulated amortization and impairment losses, if any.
The amortization of an intangible asset with a finite useful life reflects the manner in which the economic benefit is expected to be generated and is included in selling and marketing expenses in the consolidated statement of income.
The estimated useful life of amortizable intangibles is reviewed and where appropriate is adjusted, annually. The estimated useful lives of the amortizable intangible assets for the current and comparative periods are as follows:
Category Useful life
Customer-related intangibles 0.75 to 15 years
Marketing-related intangibles 3 to 10 years
(viii) Leases
On April 1, 2019, the Company adopted IFRS 16 “Leases”, which applied to all lease contracts outstanding as at April 1, 2019, using modified retrospective method by recording the cumulative effect of initial application as an adjustment to opening retained earnings.
The Company has made use of the following practical expedients available in its transition to IFRS 16: -
a) The Company will not reassess whether a contract is or contains a lease. Accordingly, the definition of lease in accordance with IAS 17 and IFRIC-4 will continue to be applied to lease contracts entered by the Company or modified by the Company before April 1, 2019,
b) The Company has applied a single discount rate to a portfolio of leases of similar assets in similar economic environment. Consequently, the Company has recorded its lease liability using the present value of remaining lease payments, discounted using the incremental borrowing rate at the date of initial application and the Right-of-use (“RoU”) asset at its carrying amount as if the standard had been applied since the commencement date of the lease, but discounted using the incremental borrowing rate at the date of initial application,
c) The Company excluded the initial direct costs from measurement of the RoU asset,
d) The Company does not recognize RoU assets and lease liabilities for leases with less than twelve months of lease term and low-value assets on the date of initial application.
The weighted average of discount rates applied to lease liabilities as at April 1, 2019 is 5.7%.
On adoption of IFRS 16,
a) the Company has recognized RoU assets of ` 13,630 and corresponding lease liability of ` 15,379,
b) the net carrying value of assets procured under the finance lease of ` 1,243 (gross carrying value and
Notes to the Consolidated Financial Statements
Consolidated financial statements under IFRS
328

accumulated depreciation of ` 3,420 and ` 2,177, respectively) have been reclassified from property, plant and equipment to RoU assets,
c) the obligations under finance leases of 2,002 (non-current and current obligation under finance leases | ` 496 and ` 1,506, respectively) have been reclassified to lease liabilities,
d) prepaid rent on leasehold land and other assets, which were earlier classified under “Other Assets” have been reclassified to RoU assets by ` 2,222.
The adoption of the new standard has resulted in a reduction of ` 872 in retained earnings, net of deferred tax asset of ` 138.
The Company evaluates each contract or arrangement, whether it qualifies as lease as defined under IFRS 16.
The Company as a lessee
The Company enters into an arrangement for lease of land, buildings, plant and equipment including computer equipment and vehicles. Such arrangements are generally for a fixed period but may have extension or termination options. The Company assesses, whether the contract is, or contains, a lease, at its inception. A contract is, or contains, a lease if the contract conveys the right to –
(a) control use of an identified asset,
(b) obtain substantially all the economic benefits from use of the identified asset, and
(c) direct the use of the identified asset.
The Company determines the lease term as the non-cancellable period of a lease, together with periods covered by an option to extend the lease, where the Company is reasonably certain to exercise that option.
The Company at the commencement of the lease contract recognizes a RoU asset at cost and corresponding lease liability, except for leases with term of less than twelve months (short-term leases) and low-value assets. For these short-term and low-value leases, the Company recognizes the lease payments as an operating expense on a straight-line basis over the lease term.
The cost of the RoU assets comprises the amount of the initial measurement of the lease liability, any lease payments made at or before the inception date of the lease plus any initial direct costs, less any lease incentives received. Subsequently, the RoU assets are measured at cost less any accumulated depreciation and accumulated impairment losses, if any. The RoU assets are depreciated using the straight-line method
from the commencement date over the shorter of lease term or useful life of RoU assets. The estimated useful lives of RoU assets are determined on the same basis as those of property, plant and equipment.
The Company applies IAS 36 to determine whether a RoU asset is impaired and accounts for any identified impairment loss as described in the impairment of non-financial assets below.
For lease liabilities at the commencement of the lease, the Company measures the lease liability at the present value of the lease payments that are not paid at that date. The lease payments are discounted using the interest rate implicit in the lease, if that rate is readily determined, if that rate is not readily determined, the lease payments are discounted using the incremental borrowing rate that the Company would have to pay to borrow funds, including the consideration of factors such as the nature of the asset and location, collateral, market terms and conditions, as applicable in a similar economic environment.
After the commencement date, the amount of lease liabilities is increased to reflect the accretion of interest and reduced for the lease payments made.
The Company recognizes the amount of the re-measurement of lease liability as an adjustment to the RoU assets. Where the carrying amount of the RoU asset is reduced to zero and there is a further reduction in the measurement of the lease liability, the Company recognizes any remaining amount of the re-measurement in consolidated statement of income.
Lease liability payments are classified as cash used in financing activities in the consolidated statement of cash flows.
The Company as a lessor
Leases under which the Company is a lessor are classified as a finance or operating lease. Lease contracts where all the risks and rewards are substantially transferred to the lessee are classified as a finance lease. All other leases are classified as operating lease.
For leases under which the Company is an intermediate lessor, the Company accounts for the head-lease and the sub-lease as two separate contracts. The sub-lease is further classified either as a finance lease or an operating lease by reference to the RoU asset arising from the head-lease.
(ix) Inventories
Inventories are valued at lower of cost and net realizable value, including necessary provision for obsolescence. Cost is determined using the weighted average method.
Notes to the Consolidated Financial Statements
Consolidated financial statements under IFRSIntegrated Annual Report 2020-21
Wipro Limited
329

(x) Impairment
a) Financial assets
The Company applies the expected credit loss model for recognizing impairment loss on financial assets measured at amortized cost, debt instruments classified as FVTOCI, trade receivables, unbilled receivables, contract assets, finance lease receivables, and other financial assets. Expected credit loss is the difference between the contractual cash flows and the cash flows that the entity expects to receive, discounted using the effective interest rate.
Loss allowances for trade receivables, unbilled receivables, contract assets and finance lease receivables are measured at an amount equal to lifetime expected credit loss. Lifetime expected credit losses are the expected credit losses that result from all possible default events over the expected life of a financial instrument. Lifetime expected credit loss is computed based on a provision matrix which takes in to account, risk profiling of customers and historical credit loss experience adjusted for forward looking information. For other financial assets, expected credit loss is measured at the amount equal to twelve months expected credit loss unless there has been a significant increase in credit risk from initial recognition, in which case those are measured at lifetime expected credit loss.
b) Non-financial assets
The Company assesses long-lived assets such as property, plant and equipment, RoU assets and acquired intangible assets for impairment whenever events or changes in circumstances indicate that the carrying amount of an asset or group of assets may not be recoverable. If any such indication exists, the Company estimates the recoverable amount of the asset or group of assets.
Goodwill is tested for impairment at least annually at the same time and when events occur or changes in circumstances indicate that the recoverable amount of the cash generating unit is less than its carrying value. The goodwill impairment test is performed at the level of cash-generating unit or groups of cash -generating units which represents the lowest level at which goodwill is monitored for internal management purposes.
The recoverable amount of an asset or cash generating unit is the higher of its fair value less cost of disposal (“FVLCD”) and its value-in-use (“VIU”). The VIU of long-lived assets is calculated using projected future cash
flows. FVLCD of a cash generating unit is computed using turnover and earnings multiples. If the recoverable amount of the asset or the recoverable amount of the cash generating unit to which the asset belongs is less than its carrying amount, the carrying amount is reduced to its recoverable amount. The reduction is treated as an impairment loss and is recognized in the consolidated statement of income. If at the reporting date, there is an indication that a previously assessed impairment loss no longer exists, the recoverable amount is reassessed and the impairment losses previously recognized are reversed such that the asset is recognized at its recoverable amount but not exceeding written down value which would have been reported if the impairment losses had not been recognized initially. An impairment in respect of goodwill is not reversed.
(xi) Employee benefits
Post-employment and pension plans
The Group participates in various employee benefit plans. Pensions and other post-employment benefits are classified as either defined contribution plans or defined benefit plans. Under a defined contribution plan, the Company’s only obligation is to pay a fixed amount with no obligation to pay further contributions if the fund does not hold sufficient assets to pay all employee benefits. The related actuarial and investment risks are borne by the employee. The expenditure for defined contribution plans is recognized as an expense during the period when the employee provides service. Under a defined benefit plan, it is the Company’s obligation to provide agreed benefits to the employees. The related actuarial and investment risks are borne by the Company. The present value of the defined benefit obligations is calculated by an independent actuary using the projected unit credit method.
Remeasurements of the defined benefit plans, comprising actuarial gains or losses, and the return on plan assets (excluding interest) are immediately recognized in other comprehensive income, net of taxes and not reclassified to profit or loss in subsequent period.
Net interest recognized in profit or loss is calculated by applying the discount rate used to measure the defined benefit obligation to the net defined benefit liability or asset. The actual return on the plan assets above or below the discount rate, is recognized as part of remeasurements of the defined benefit plans through other comprehensive income, net of taxes.
Notes to the Consolidated Financial Statements
Consolidated financial statements under IFRS
330

The Company has the following employee benefit plans:
a. Provident fund
Employees receive benefits from a provident fund, which is a defined benefit plan. The employer and employees each make periodic contributions to the plan. A portion of the contribution is made to the approved provident fund trust managed by the Company while the remainder of the contribution is made to the government administered pension fund. The contributions to the trust managed by the Company is accounted for as a defined benefit plan as the Company is liable for any shortfall in the fund assets based on the government specified minimum rates of return.
b. Superannuation
Superannuation plan, a defined contribution scheme is administered by third party fund managers. The Company makes annual contributions based on a specified percentage of each eligible employee’s salary.
c. Gratuity and Pension
In accordance with the Payment of Gratuity Act, 1972, applicable for Indian companies, the Company provides for a lump sum payment to eligible employees, at retirement or termination of employment based on the last drawn salary and years of employment with the Company. The gratuity fund is managed by third party fund managers.
The Company also maintains pension and similar plans for employees outside India, based on country specific regulations. These plans are partially funded, and the funds are managed by third party fund managers. The plans provide for monthly payout after retirement as per salary drawn and service period or for a lumpsum payment as set out in rules of each fund.
The Company’s obligations in respect of the above plans, which are defined benefit plans, are provided for based on actuarial valuation using the projected unit credit method. The Company recognizes remeasurement gains and losses of the net defined benefit liability / (asset) in other comprehensive income, net of taxes.
d. Termination benefits
Termination benefits are expensed when the Company can no longer withdraw the offer of those benefits.
e. Short-term benefits
Short-term employee benefit obligations are
measured on an undiscounted basis and are recorded as expense as the related service is provided. A liability is recognized for the amount expected to be paid under short-term cash bonus or profit-sharing plans, if the Company has a present legal or constructive obligation to pay this amount as a result of past service provided by the employee and the obligation can be estimated reliably.
f. Compensated absences
The employees of the Company are entitled to compensated absences. The employees can carry forward a portion of the unutilized accumulating compensated absences and utilize it in future periods or receive cash at retirement or termination of employment. The Company records an obligation for compensated absences in the period in which the employee renders the services that increases this entitlement. The Company measures the expected cost of compensated absences as the additional amount that the Company expects to pay as a result of the unused entitlement that has accumulated at the end of the reporting period. The Company recognizes accumulated compensated absences based on actuarial valuation using the projected unit credit method. Non-accumulating compensated absences are recognized in the period in which the absences occur.
(xii) Share-based payment transactions
Selected employees of the Company receive remuneration in the form of equity settled instruments or cash settled instruments, for rendering services over a defined vesting period and for Company’s performance-based stock options over the defined period. Equity instruments granted are measured by reference to the fair value of the instrument at the date of grant. In cases, where equity instruments are granted at a nominal exercise price, the intrinsic value on the date of grant approximates the fair value. The expense is recognized in the consolidated statement of income with a corresponding increase to the share-based payment reserve, a component of equity.
The equity instruments or cash settled instruments generally vest in a graded manner over the vesting period. The fair value determined at the grant date is expensed over the vesting period of the respective tranches of such grants (accelerated amortization). The stock compensation expense is determined based on the Company’s estimate of equity instruments or cash settled instruments that will eventually vest.
Cash Settled instruments granted are re-measured by reference to the fair value at the end of each reporting
Notes to the Consolidated Financial Statements
Consolidated financial statements under IFRSIntegrated Annual Report 2020-21
Wipro Limited
331

period and at the time of vesting. The expense is recognized in the consolidated statement of income with a corresponding increase to financial liability.
(xiii) Provisions
Provisions are recognized when the Company has a present obligation (legal or constructive), as a result of a past event, it is probable that an outflow of economic benefits will be required to settle the obligation and a reliable estimate can be made of the amount of the obligation.
The amount recognized as a provision is the best estimate of the consideration required to settle the present obligation at the end of the reporting period, considering the risks and uncertainties surrounding the obligation.
When some or all of the economic benefits required to settle a provision are expected to be recovered from a third party, the receivable is recognized as an asset, if it is virtually certain that reimbursement will be received, and the amount of the receivable can be measured reliably.
Provisions for onerous contracts are recognized when the expected benefits to be derived by the Company from a contract are lower than the unavoidable costs of meeting the future obligations under the contract. Provisions for onerous contracts are measured at the present value of lower of the expected net cost of fulfilling the contract and the expected cost of terminating the contract.
(xiv) Revenue
The Company derives revenue primarily from software development, maintenance of software/hardware and related services, business process services, sale of IT and other products.
Effective April 1, 2018, the Company adopted IFRS 15 “Revenue from Contracts with Customers” using the cumulative catch-up transition method, applied to contracts that were not completed as of April 1, 2018. The adoption of the new standard has resulted in a reduction of ₹ 2,279 in opening retained earnings, primarily relating to certain contract costs because these do not meet the criteria for recognition as costs to fulfil a contract.
Revenues from customer contracts are considered for recognition and measurement when the contract has been approved by the parties to the contract, the parties to contract are committed to perform their respective obligations under the contract, and the contract is legally enforceable. Revenue is recognized upon
transfer of control of promised products or services to customers in an amount that reflects the consideration the Company expects to receive in exchange for those products or services. To recognize revenues, the Company applies the following five step approach: (1) identify the contract with a customer, (2) identify the performance obligations in the contract, (3) determine the transaction price, (4) allocate the transaction price to the performance obligations in the contract, and (5) recognize revenues when a performance obligation is satisfied. When there is uncertainty as to collectability, revenue recognition is postponed until such uncertainty is resolved.
At contract inception, the Company assesses its promise to transfer products or services to a customer to identify separate performance obligations. The Company applies judgement to determine whether each product or service promised to a customer is capable of being distinct, and are distinct in the context of the contract, if not, the promised products or services are combined and accounted as a single performance obligation. The Company allocates the arrangement consideration to separately identifiable performance obligation based on their relative stand-alone selling price or residual method. Stand-alone selling prices are determined based on sale prices for the components when it is regularly sold separately, in cases where the Company is unable to determine the stand-alone selling price the Company uses third-party prices for similar deliverables or the Company uses expected cost-plus margin approach in estimating the stand-alone selling price.
For performance obligations where control is transferred over time, revenues are recognized by measuring progress towards completion of the performance obligation. The selection of the method to measure progress towards completion requires judgment and is based on the nature of the promised products or services to be provided.
The method for recognizing revenues and costs depends on the nature of the services rendered:
A. Time and materials contracts
Revenues and costs relating to time and materials contracts are recognized as the related services are rendered.
B. Fixed-price contracts
i. Fixed-price development contracts
Revenues from fixed-price development contracts, including software development, and integration contracts, where the performance obligations
Notes to the Consolidated Financial Statements
Consolidated financial statements under IFRS
332

are satisfied over time, are recognized using the “percentage-of-completion” method. The performance obligations are satisfied as and when the services are rendered since the customer generally obtains control of the work as it progresses. Percentage of completion is determined based on project costs incurred to date as a percentage of total estimated project costs required to complete the project. The cost expended (or input) method has been used to measure progress towards completion as there is a direct relationship between input and productivity. If the Company is not able to reasonably measure the progress of completion, revenue is recognized only to the extent of costs incurred, for which recoverability is probable. When total cost estimates exceed revenues in an arrangement, the estimated losses are recognized in the consolidated statement of income in the period in which such losses become probable based on the current contract estimates as an onerous contract provision.
A contract asset is a right to consideration that is conditional upon factors other than the passage of time. Contract assets primarily relate to unbilled amounts on fixed-price development contracts and are classified as non-financial asset as the contractual right to consideration is dependent on completion of contractual milestones.
A contract liability is an entity’s obligation to transfer goods or services to a customer for which the entity has received consideration (or the amount is due) from the customer.
Unbilled receivables on other than fixed-price development contracts are classified as a financial asset where the right to consideration is unconditional and only the passage of time is required before the payment is due.
ii. Maintenance contracts
Revenues related to fixed-price maintenance contracts are recognized on a straight-line basis when services are performed through an indefinite number of repetitive acts over a specified period or ratably using percentage of completion method when the pattern of benefits from the services rendered to the customers and the cost to fulfil the contract is not even through the period of contract because the services are generally discrete in nature and not repetitive.
Revenue for contracts in which the invoicing is representative of the value being delivered is recognized based on our right to invoice. If our invoicing is not consistent with value delivered,
revenues are recognized as the service is performed using the percentage of completion method.
In certain projects, a fixed quantum of service or output units is agreed at a fixed price for a fixed term. In such contracts, revenue is recognized with respect to the actual output achieved till date as a percentage of total contractual output. Any residual service unutilized by the customer is recognized as revenue on completion of the term.
iii. Element or Volume based contracts
Revenues and costs are recognized as the related services are rendered.
C. Products
Revenue on product sales are recognized when the customer obtains control of the specified product.
D. Others
• Any change in scope or price is considered as a contract modification. The Company accounts for modifications to existing contracts by assessing whether the services added are distinct and whether the pricing is at the stand-alone selling price. Services added that are not distinct are accounted for on a cumulative catch up basis, while those that are distinct are accounted for prospectively, either as a separate contract if the additional services are priced at the stand-alone selling price, or as a termination of the existing contract and creation of a new contract if not priced at the stand-alone selling price.
• The Company accounts for variable considerations like, volume discounts, rebates and pricing incentives to customers and penalties as reduction of revenue on a systematic and rational basis over the period of the contract. The Company estimates an amount of such variable consideration using expected value method or the single most likely amount in a range of possible consideration depending on which method better predicts the amount of consideration to which the Company may be entitled and when it is probable that a significant reversal of cumulative revenue recognized will not occur when the uncertainty associated with the variable consideration is resolved.
• Revenues are shown net of allowances/ returns, sales tax, value added tax, goods and services tax and applicable discounts and allowances.
• The Company accrues the estimated cost of warranties at the time when the revenue is recognized. The accruals are based on the Company’s historical experience of material usage and service delivery costs.
Notes to the Consolidated Financial Statements
Consolidated financial statements under IFRSIntegrated Annual Report 2020-21
Wipro Limited
333

• Incremental costs that relate directly to a contract and incurred in securing a contract with a customer are recognized as an asset when the Company expects to recover these costs and amortized over the contract term.
• The Company recognizes contract fulfilment cost as an asset if those costs specifically relate to a contract or to an anticipated contract, the costs generate or enhance resources that will be used in satisfying performance obligations in future; and the costs are expected to be recovered. The asset so recognized is amortized on a systematic basis consistent with the transfer of goods or services to customer to which the asset relates.
• The Company assesses the timing of the transfer of goods or services to the customer as compared to the timing of payments to determine whether a significant financing component exists. As a practical expedient, the Company does not assess the existence of a significant financing component when the difference between payment and transfer of deliverables is a year or less. If the difference in timing arises for reasons other than the provision of finance to either the customer or us, no financing component is deemed to exist.
• The Company may enter into arrangements with third party suppliers to resell products or services. In such cases, the Company evaluates whether the Company is the principal (i.e. report revenues on a gross basis) or agent (i.e. report revenues on a net basis). In doing so, the Company first evaluates whether the Company controls the good or service before it is transferred to the customer. If Company controls the good or service before it is transferred to the customer, Company is the principal; if not, the Company is the agent.
• Estimates of transaction price and total costs or efforts are continuously monitored over the term of the contract and are recognized in net profit in the period when these estimates change or when the estimates are revised. Revenues and the estimated total costs or efforts are subject to revision as the contract progresses.
(xv) Finance expenses
Finance expenses comprises interest cost on borrowings, lease liabilities and net defined benefit liability, gains or losses arising on re-measurement of financial assets measured at FVTPL, gains/(losses) on translation or settlement of foreign currency borrowings and changes in fair value and gains/ (losses) on settlement of related derivative instruments. Borrowing
costs that are not directly attributable to a qualifying asset are recognized in the consolidated statement of income using the effective interest method.
(xvi) Finance and other income
Finance and other income comprise interest income on deposits, dividend income and gains / (losses) on disposal of investments. Interest income is recognized using the effective interest method. Dividend income is recognized when the right to receive payment is established.
(xvii) Income tax
Income tax comprises current and deferred tax. Income tax expense is recognized in the consolidated statement of income except to the extent it relates to a business combination, or items directly recognized in equity or in other comprehensive income.
a) Current income tax
Current income tax for the current and prior periods are measured at the amount expected to be recovered from or paid to the taxation authorities based on the taxable income for the period. The tax rates and tax laws used to compute the current tax amounts are those that are enacted or substantively enacted as at the reporting date and applicable for the period. While determining the tax provisions, the Company assesses whether each uncertain tax position is to be considered separately or together with one or more uncertain tax positions depending upon the nature and circumstances of each uncertain tax position. The Company offsets current tax assets and current tax liabilities, where it has a legally enforceable right to set off the recognized amounts and where it intends either to settle on a net basis, or to realize the asset and liability simultaneously.
b) Deferred income tax
Deferred income tax is recognized using the balance sheet approach. Deferred income tax assets and liabilities are recognized for deductible and taxable temporary differences arising between the tax base of assets and liabilities and their carrying amount in financial statements, except when the deferred income tax arises from the initial recognition of goodwill or an asset or liability in a transaction that is not a business combination and affects neither accounting nor taxable profits or loss at the time of the transaction.
Deferred income tax assets are recognized to the extent it is probable that taxable profit will be available against which the deductible temporary differences and the carry forward of unused tax credits and unused tax losses can be utilized.
Notes to the Consolidated Financial Statements
Consolidated financial statements under IFRS
334

Deferred income tax liabilities are recognized for all taxable temporary differences except in respect of taxable temporary differences that is expected to reverse within the tax holiday period, taxable temporary differences associated with investments in subsidiaries, associates and foreign branches where the timing of the reversal of the temporary difference can be controlled and it is probable that the temporary difference will not reverse in the foreseeable future.
The carrying amount of deferred income tax assets is reviewed at each reporting date and reduced to the extent that it is no longer probable that sufficient taxable profit will be available to allow all or part of the deferred income tax asset to be utilized.
Deferred income tax assets and liabilities are measured at the tax rates that are expected to apply in the period when the asset is realized, or the liability is settled, based on tax rates (and tax laws) that have been enacted or substantively enacted at the reporting date.
The Company offsets deferred income tax assets and liabilities, where it has a legally enforceable right to offset current tax assets against current tax liabilities, and they relate to taxes levied by the same taxation authority on either the same taxable entity, or on different taxable entities where there is a right and an intention to settle the current tax liabilities and assets on a net basis or their tax assets and liabilities will be realized simultaneously.
(xviii) Earnings per share
Basic earnings per share is computed using the weighted average number of equity shares outstanding during the period adjusted for treasury shares held. Diluted earnings per share is computed using the weighted average number of equity and dilutive equivalent shares outstanding during the period, using the treasury stock method for options, except where the results would be anti-dilutive.
The number of equity shares and potentially dilutive equity shares are adjusted retrospectively for all periods presented for any splits and bonus shares issues including for change effected prior to the approval of the consolidated financial statements by the Board of Directors.
(xix) Statement of cash flows
Cash flows are reported using the indirect method, whereby profit for the period is adjusted for the effects of transactions of a non-cash nature, any deferrals or accruals of past or future operating cash receipts or payments and item of income or expenses associated
with investing or financing cash flows. The cash from operating, investing and financing activities of the Company are segregated.
(xx) Assets held for sale
Sale of business is classified as held for sale, if their carrying amount is intended to be recovered principally through sale rather than through continuing use. The condition for classification as held for sale is met when disposal business is available for immediate sale and the same is highly probable of being completed within one year from the date of classification as held for sale.
(xxi) Discontinued operations
A discontinued operation is a component of the Company’s business that represents a separate line of business that has been disposed of or is held for sale, or is a subsidiary acquired exclusively with a view to resale. Classification as a discontinued operation occurs upon the earlier of disposal or when the operation meets the criteria to be classified as held for sale.
(xxii) Disposal of assets
The gain or loss arising on disposal or retirement of assets is recognized in the consolidated statement of income.
New Accounting standards, amendments and interpretations adopted by the Company effective from April 1, 2020:
Amendment to IFRS 3 - Business combinations
The International Accounting Standard Board has issued amendments to IFRS 3, ‘Business Combinations’, in connection with clarification of business definition, which help in determining whether an acquisition made is of a business or a group of assets. The amendment added a test that makes it easier to conclude that a Company has acquired a group of assets, rather than a business, if the value of the assets acquired is substantially all concentrated in a single asset or group of similar assets. The adoption of amendment to IFRS 3 is applicable to new acquisition on a prospective basis and did not have any impact on the consolidated financial statements of the Company.
Amendment to IFRS 9, IAS 39 and IFRS 7 – Interest Rate Benchmark Reform
The IASB amended some of its requirements for hedge accounting. The amendments provide relief from potential effects of the uncertainty caused by the IBOR reform. In addition, the amendments require companies to provide additional information to investors about their hedging relationships that are directly affected by these
Notes to the Consolidated Financial Statements
Consolidated financial statements under IFRSIntegrated Annual Report 2020-21
Wipro Limited
335

uncertainties. The adoption of amendment to IFRS 9, IAS 39 and IFRS 7 did not have any significant material impact on the consolidated financial statements of the Company.
Amendment to IAS 1 and IAS 8 – Definition of Material
The IASB issued Amendment to IAS 1 Presentation of Financial Statements and IAS 8 Accounting Policies, Changes in Accounting Estimates and Errors to update a new definition of material in IAS 1. The amendments clarify the definition of “material” and how it should be applied by including in the definition guidance that until now has featured elsewhere in IFRS Standards. The new definition clarifies that, information is considered material if omitting, misstating, or obscuring such information, could reasonably be expected to influence the decisions that the primary users of general-purpose financial statements make based on those financial statements. The definition of material in IAS 8 has been replaced by a reference to the definition of material in IAS 1. In addition, the IASB amended other Standards and the Conceptual Framework that contain a definition of material or refer to the term ‘material’ to ensure consistency. The adoption of the amendment to IAS 1 and IAS 8 did not have any material impact on its evaluation of materiality in relation to the consolidated financial statements.
Amendment to IFRS 16 – Leases
The IASB issued amendments to IFRS 16, “Leases”, provide lessees with an exemption from assessing whether a COVID-19-related rent concession is a lease modification. The amendments allowed the expedient to be applied to COVID-19-related rent concessions to payments originally due on or before June 30, 2021 and also require disclosure of the amount recognized in profit or loss to reflect changes in lease payments that arise from COVID-19-related rent concessions. The reporting period in which a lessee first applies the amendment, it is not required to disclose certain quantitative information required under IAS 8. Accordingly, the Company recognized ` 61 as reversal of lease liability in the consolidated statement of income for the year ended March 31, 2021.On March 31, 2021, the IASB has extended the relief by one year to cover rent concessions that reduce only lease payments due on or before 30 June 2022. The amendment is effective for annual reporting periods beginning on or after 1 April 2021.
New amendments not yet adopted:
Certain new standards, amendments to standards and interpretations are not yet effective for annual periods beginning after April 1, 2020 and have not been applied
in preparing these consolidated financial statements. New standards, amendments to standards and interpretations that could have potential impact on the consolidated financial statements of the Company are:
Amendment to IAS 1 – Presentation of Financial Statements
On January 23, 2020, the IASB issued “Classification of liabilities as Current or Non-Current (Amendments to IAS 1)” providing a more general approach to the classification of liabilities under IAS 1 based on the contractual arrangement in place at the reporting date. The amendments aim to promote consistency in applying the requirements by helping companies to determine whether, in the statement of financial position, debt and other liabilities with an uncertain settlement date should be classified as current (due or potentially due to be settled within one year) or non-current. The amendments also clarified the classification requirements for debt a company might settle by converting it into equity. These amendments are effective for annual reporting periods beginning on or after January 1, 2023 and are to be applied retrospectively, with earlier application permitted. The adoption of amendments to IAS 1 is not expected to have any material impact on the consolidated financial statements.
Amendment to IAS 37 – Onerous Contracts – Cost of Fulfilling a Contract
On May 14, 2020, the IASB issued “Onerous Contracts — Cost of Fulfilling a Contract (Amendments to IAS 37)”, amending the standard regarding costs a company should include as the cost of fulfilling a contract when assessing whether a contract is onerous. The amendment specifies that the “cost of fulfilling” a contract comprises the “costs that relate directly to the contract”. Costs that relate directly to a contract can either be incremental costs of fulfilling that contract or an allocation of other costs that relate directly to fulfilling contracts. These amendments are effective for annual reporting periods beginning on or after January 1, 2022, with earlier application permitted. The Company is currently evaluating the impact of amendment to IAS 37 on the consolidated financial statements.
IFRS 9 – Annual Improvements to IFRS Standards - 2018-2020
On May 14, 2020, IASB amended IFRS 9 as part of its Annual Improvements to IFRS Standards 2018-2020. The amendment clarifies which fees an entity includes when it applies the ‘10 percent’ test in paragraph B3.3.6 of IFRS 9 in assessing whether to derecognize a financial liability. This amendment is effective for annual
Notes to the Consolidated Financial Statements
Consolidated financial statements under IFRS
336
reporting periods beginning on or after January 1, 2022, with earlier application permitted. The Company is currently evaluating the impact of amendment to IFRS 9 on the consolidated financial statements.
Amendments to IFRS 9, IAS 39, IFRS 7, IFRS 4 and IFRS 16 – Interest Rate Benchmark Reform (Phase 2)
In August 2020, the IASB issued Interest Rate Benchmark Reform (Phase 2), which amends IFRS 9, IAS 39, IFRS 7, IFRS 4 and IFRS 16. The amendments complement those issued in 2019 and focus on the effects on financial statements when a company replaces the old interest rate benchmark with an alternative benchmark rate as a result of the reform. The amendments in this final phase relate to the modification of financial assets, financial liabilities and lease liabilities, specific hedge accounting requirements, and disclosure requirements applying IFRS 7 to accompany the amendments regarding modifications and hedge accounting. These amendments are effective for annual reporting periods beginning on or after January 1, 2021 and are to be applied retrospectively, with earlier application permitted. The Company is currently evaluating the impact of the amendment on the consolidated financial statements.
Amendment to IAS 1 – Presentation of Financial Statements
On February 12, 2021, the IASB amended IAS 1 “Presentation of Financial Statements” and IFRS Practice Statement 2 “Making Materiality Judgements”. The amendments require companies to disclose their material accounting policy information rather than their significant accounting policies. The amendments clarify that accounting policy information may be material because of its nature, even if the related amounts are immaterial. The amendments also clarified that accounting policy information is material if users of an entity’s financial statements would need it to understand other material information in the financial statements; and the amendments clarify that if an entity discloses immaterial accounting policy information, such information shall not obscure material accounting
policy information. These amendments are effective for annual reporting periods beginning on or after January 1, 2023 and are to be applied retrospectively, with earlier application permitted. The Company is currently evaluating the impact of amendment to IAS 1 on the consolidated financial statements.
Amendment to IAS 8 – Accounting Policies, Changes in Accounting Estimates and Errors
On February 12, 2021, the IASB amended IAS 8 “Accounting Policies, Changes in Accounting Estimates and Errors”. The amendments provided ‘Definition of Accounting Estimates (Amendments to IAS 8)’ to help entities to distinguish between accounting policies and accounting estimates. This distinction is important because changes in accounting estimates are applied prospectively, but changes in accounting policies are applied retrospectively. These amendments are effective for annual reporting periods beginning on or after January 1, 2023 and are to be applied retrospectively, with earlier application permitted. The Company is currently evaluating the impact of amendment to IAS 8 on the consolidated financial statements.
Amendments to IAS 12 – “Income Taxes”
On May 7, 2021, the IASB amended IAS 12 “Income Taxes” and published ‘Deferred Tax related to Assets and Liabilities arising from a Single Transaction (Amendments to IAS 12)’ that clarify how companies account for deferred tax on transactions such as leases and decommissioning obligations. In specified circumstances, companies are exempt from recognizing deferred tax when they recognize assets or liabilities for the first time. The amendments clarify that this exemption does not apply to transactions such as leases and decommissioning obligations and companies are required to recognize deferred tax on such transactions. These amendments are effective for annual reporting periods beginning on or after January 1, 2023 and are to be applied retrospectively, with earlier application permitted. The Company is currently evaluating the impact of amendment to IAS 12 on the consolidated financial statements.
Notes to the Consolidated Financial Statements
Consolidated financial statements under IFRSIntegrated Annual Report 2020-21
Wipro Limited
337

4. Property, plant and equipment
Land BuildingsPlant and equipment *
Furniture fixtures and equipment Vehicles Total
Gross carrying value:
As at April 1, 2019 ` 3,697 ` 27,490 ` 92,366 ` 16,505 ` 948 ` 141,006
Reclassified on adoption of IFRS 16 - - (3,420) - - (3,420)
Adjusted balance as at April 1, 2019 ` 3,697 ` 27,490 ` 88,946 ` 16,505 ` 948 ` 137,586 Translation adjustment 9 84 1,437 129 (5) 1,654
Additions 55 9,130 13,571 3,487 11 26,254
Additions through Business combinations - 5 417 7 - 429
Disposals - (199) (3,676) (258) (146) (4,279)
As at March 31, 2020 ` 3,761 ` 36,510 ` 100,695 ` 19,870 ` 808 ` 161,644
Accumulated depreciation/ impairment:
As at April 1, 2019 ` - ` 6,715 ` 73,188 ` 12,593 ` 682 ` 93,178
Reclassified on adoption of IFRS 16 - - (2,177) - - (2,177)
Adjusted balance as at April 1, 2019 ` - ` 6,715 ` 71,011 ` 12,593 ` 682 ` 91,001 Translation adjustment - 32 1,066 91 (2) 1,187
Depreciation and impairment ** - 1,319 8,628 1,556 175 11,678
Disposals - (118) (2,649) (99) (128) (2,994)
As at March 31, 2020 ` - ` 7,948 ` 78,056 ` 14,141 ` 727 ` 100,872 Capital work-in-progress ` 20,348
Net carrying value including Capital work-in-progress as at March 31, 2020
` 81,120
Gross carrying value:
As at April 1, 2020 ` 3,761 ` 36,510 ` 100,695 ` 19,870 ` 808 ` 161,644
Translation adjustment 5 100 303 25 (1) 432
Additions 107 3,569 14,362 1,958 9 20,005
Additions through Business combinations - - 27 57 - 84
Disposals (58) (765) (4,532) (1,218) (398) (6,971)
As at March 31, 2021 ` 3,815 ` 39,414 ` 110,855 ` 20,692 ` 418 ` 175,194
Accumulated depreciation/ impairment:
As at April 1, 2020 ` - ` 7,948 ` 78,056 ` 14,141 ` 727 ` 100,872
Translation adjustment - 32 174 11 - 217
Depreciation and impairment ** - 1,500 11,123 1,845 61 14,529
Disposals - (695) (4,313) (908) (391) (6,307)
As at March 31, 2021 ` - ` 8,785 ` 85,040 ` 15,089 ` 397 ` 109,311 Capital work-in-progress ` 19,309
Net carrying value including Capital work-in-progress as at March 31, 2021
` 85,192
* Including net carrying value of computer equipment and software amounting to ` 16,844 and ` 18,508, as at March 31, 2020 and 2021, respectively.
** Includes impairment charge on certain software platforms amounting to ` 1,480, Nil and ` 285 for the year ended March 31, 2019, 2020 and 2021, respectively.
Notes to the Consolidated Financial Statements
Consolidated financial statements under IFRS
338

5. Right-of-Use assets
Category of RoU asset
Land BuildingsPlant and
equipment * Vehicles Total
Gross carrying value:
As at April 1, 2019 ` 2,003 ` 11,502 ` 2,941 ` 649 ` 17,095
Additions - 3,520 1,210 219 4,949
Additions through Business combinations - 364 - - 364
Disposals - (41) (47) (59) (147)
Translation adjustment - 279 132 17 428
As at March 31, 2020 ` 2,003 ` 15,624 ` 4,236 ` 826 ` 22,689
Accumulated depreciation:Depreciation ` 27 ` 3,884 ` 1,731 ` 269 ` 5,911
Disposals - (18) (47) (10) (75)
Translation adjustment - 62 37 6 105
As at March 31, 2020 ` 27 ` 3,928 ` 1,721 ` 265 ` 5,941
Net carrying value as at March 31, 2020 ` 16,748
Gross carrying value:
As at April 1, 2020 ` 2,003 ` 15,624 ` 4,236 ` 826 ` 22,689
Additions 79 5,323 770 162 6,334
Additions through Business combinations - 352 - 84 436
Disposals - (2,503) (1,103) (154) (3,760)
Translation adjustment - 48 15 8 71
As at March 31, 2021 ` 2,082 ` 18,844 ` 3,918 ` 926 ` 25,770
Accumulated depreciation:
As at April 1, 2020 ` 27 ` 3,928 ` 1,721 ` 265 ` 5,941
Depreciation 28 4,487 1,465 285 6,265
Disposals - (1,703) (1,023) (119) (2,845)
Translation adjustment - (9) (6) 4 (11)
As at March 31, 2021 ` 55 ` 6,703 ` 2,157 ` 435 ` 9,350
Net carrying value as at March 31, 2021 ` 16,420
* Includes computer equipment.
The Company recognized the following expenses in the consolidated statement of income:
Year ended March 31, 2020
Year ended March 31, 2021
Interest expenses on lease liabilities ` 914 ` 798
Rent expense pertaining to leases of low-value assets recognized under facility expenses
44 53
Rent expense pertaining to leases with less than twelve months of lease term recognized under facility expenses
2,085 1,876
` 3,043 ` 2,727
Payments toward leases of low-value assets and leases with less than twelve months of lease term, are disclosed under operating activities in the consolidated statement of cash flows. All other lease payments during the period are disclosed under financing activities in the consolidated statement of cash flows.
Income from subleasing RoU assets is not material.
As of March 31, 2020 and 2021, the Company is committed to certain leases amounting to 1,399 and 2,468, respectively, which have not yet commenced. The term of such leases ranges from 2 to 10 years.
Refer to Note 19 for remaining contractual maturities of lease liabilities.
Notes to the Consolidated Financial Statements
Consolidated financial statements under IFRSIntegrated Annual Report 2020-21
Wipro Limited
339

6. Goodwill and intangible assets The movement in goodwill balance is given below:
Year ended March 31, 2020
Year ended March 31, 2021
Balance at the beginning of the year ` 116,980 `131,012
Translation adjustment 9,199 (1,357)
Acquisition through business combinations* (Refer to Note 7) 4,833 9,472
Balance at the end of the year `131,012 `139,127
* Acquisition through business combinations for the year ended March 31, 2021 is net of (72) towards changes in the purchase price allocation of acquisitions made during the year ended March 31, 2020.
The Company is organized by three operating segments: IT Services, IT Products and India State Run Enterprise Services. Goodwill as at March 31, 2020 and 2021 has been allocated to the IT Services operating segment.
Goodwill recognized on business combinations is allocated to Cash Generating Units (CGUs), within the IT Services operating segment, which are expected to benefit from the synergies of the acquisitions.
During the year ended March 31, 2021, the Company re-organized its IT Services segment from seven industry verticals to four Strategic Market Units (Refer to Note 34). Accordingly, goodwill has been re-allocated to the CGUs, using a relative value approach as at March 31, 2020 and 2021 as follows:
CGUsYear ended
March 31, 2020Year ended
March 31, 2021Americas 1 `63,432 `64,573
Americas 2 32,392 34,038
Europe 22,149 26,641
Asia Pacific Middle East Africa 13,039 13,875
`131,012 ` 139,127
For impairment testing, goodwill is allocated to a CGU representing the lowest level within the Group at which goodwill is monitored for internal management purposes, and which is not higher than the Company’s operating segment. Goodwill is tested for impairment at least annually in accordance with the Company’s procedure for determining the recoverable value of each CGU.
The recoverable amount of the CGU is determined based on FVLCD. The FVLCD of the CGU is determined based on the market capitalization approach, using the turnover and earnings multiples derived from observable market data. The fair value measurement is categorized as a level 2 fair value based on the inputs in the valuation techniques used.
Based on the above testing, no impairment was identified as at March 31, 2020 and 2021, as the recoverable value of the CGUs exceeded the carrying value. An analysis of the calculation’s sensitivity to a change in the key parameters (turnover and earnings multiples), did not identify any probable scenarios where the CGU’s recoverable amount would fall below its carrying amount.
The movement in intangible assets is given below:Intangible assets
Customer-related Marketing-related TotalGross carrying value:As at April 1, 2019 `26,924 ` 5,945 ` 32,869 Translation adjustment 1,031 382 1,413 Acquisition through business combinations (Refer to Note 7) 4,535 371 4,906 As at March 31, 2020 ` 32,490 ` 6,698 `39,188
Accumulated amortization/ impairment:
As at April 1, 2019 `15,345 ` 3,762 `19,107 Translation adjustment 220 226 446 Amortization and impairment * 2,333 940 3,273 As at March 31, 2020 ` 17,898 ` 4,928 ` 22,826 Net carrying value as at March 31, 2020 ` 14,592 ` 1,770 ` 16,362
Notes to the Consolidated Financial Statements
Consolidated financial statements under IFRS
340

Intangible assets
Customer-related Marketing-related Total
Gross carrying value:
As at April 1, 2020 ` 32,490 ` 6,698 ` 39,188
Translation adjustment (56) (159) (215)
Acquisition through business combinations (Refer to Note 7) 2,460 828 3,288
Deductions/Adjustments (8,568) (5,756) (14,324)
As at March 31, 2021 ` 26,326 ` 1,611 ` 27,937
Accumulated amortization/ impairment:
As at April 1, 2020 `17,898 ` 4,928 `22,826
Translation adjustment (142) (116) (258)
Amortization and impairment * 5,060 1,548 6,608
Deductions/Adjustments (8,568) (5,756) (14,324)
As at March 31, 2021 ` 14,248 ` 604 ` 14,852
Net carrying value as at March 31, 2021 ` 12,078 ` 1,007 ` 13,085
* includes impairment charge on certain intangible assets recognized on acquisitions, amounting to ` 838, ` Nil and ` 1,879 for the year ended March 31, 2019, 2020 and 2021, respectively.
* During the year ended March 31, 2021, change in business strategy of a customer led to a significant decline in the revenue and earnings estimates, resulting in revision of recoverable value of customer-relationship intangible assets recognized on business combination. Further, the Company integrated certain brands acquired as part of a business combination, resulting in discontinuance of the acquired brands. Consequently, the Company has recognized impairment charge 1,879 for the year ended March 31, 2021 respectively, as part of amortization and impairment.
* Due to change in our estimate of useful life of customer-related intangibles in an earlier business combination, the Company has recognized additional amortization charge of ` Nil, ` Nil and ` 795 for the year ended March 31, 2019, 2020 and 2021, respectively, as part of amortization and impairment.
Amortization expense on intangible assets is included in selling and marketing expenses in the consolidated statement of income.
As at March 31, 2021, the net carrying value and the estimated remaining amortization period for intangible assets acquired on acquisition are as follows:
Acquisition Net carrying valueEstimated remaining amortization period
ATCO I-Tek ` 1,920 0.33 years
Vara Infotech Private Limited 1,888 5.5 - 8.5 years
Rational Interaction, Inc. 1,799 1.92 - 5.92 years
Eximius Design, LLC 1,701 0.75 - 6.42 years
4C NV 770 0.83 - 4.42 years
IVIA Serviços de Informática Ltda 343 4.42 years
Appirio Inc. 302 0.67 years
Cellent AG 289 1.75 years
International TechneGroup Incorporated 287 3.5 years
Encore Theme Technologies Private Limited 161 2.75 - 4.75 years
Others 3,625 0.25 - 11.25 years
Total 13,085
Notes to the Consolidated Financial Statements
Consolidated financial statements under IFRSIntegrated Annual Report 2020-21
Wipro Limited
341
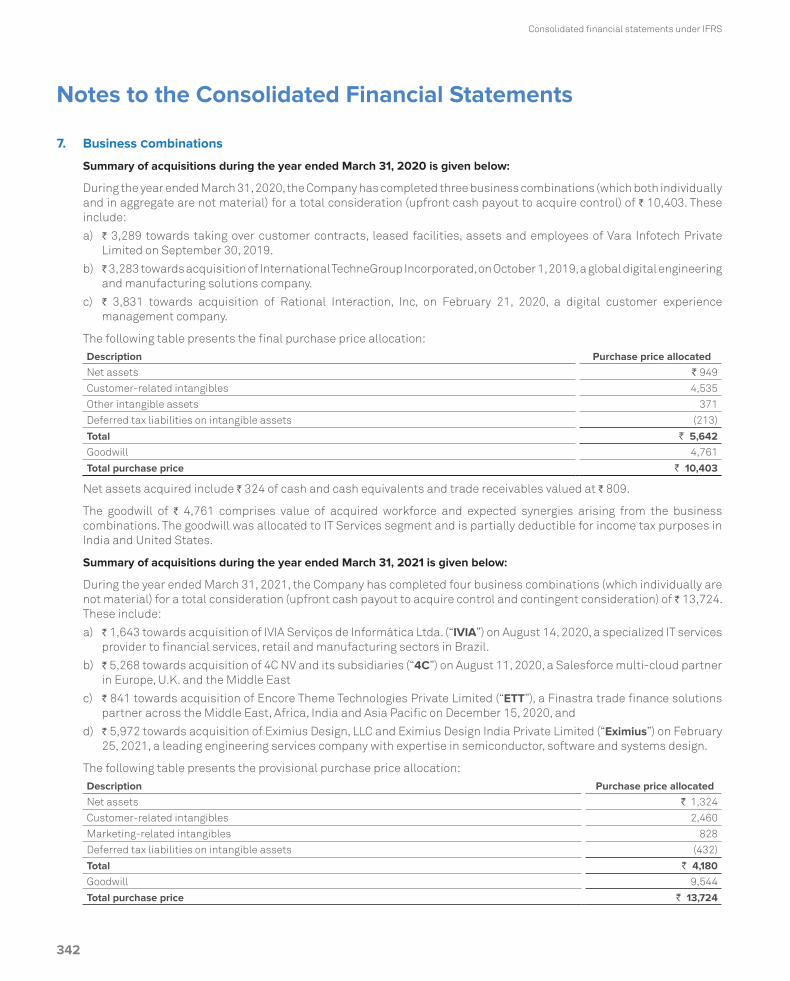
7. Business Combinations
Summary of acquisitions during the year ended March 31, 2020 is given below:
During the year ended March 31, 2020, the Company has completed three business combinations (which both individually and in aggregate are not material) for a total consideration (upfront cash payout to acquire control) of ` 10,403. These include:
a) ` 3,289 towards taking over customer contracts, leased facilities, assets and employees of Vara Infotech Private Limited on September 30, 2019.
b) ` 3,283 towards acquisition of International TechneGroup Incorporated, on October 1, 2019, a global digital engineering and manufacturing solutions company.
c) ` 3,831 towards acquisition of Rational Interaction, Inc, on February 21, 2020, a digital customer experience management company.
The following table presents the final purchase price allocation:Description Purchase price allocated Net assets ` 949
Customer-related intangibles 4,535
Other intangible assets 371
Deferred tax liabilities on intangible assets (213)
Total ` 5,642Goodwill 4,761
Total purchase price ` 10,403
Net assets acquired include ` 324 of cash and cash equivalents and trade receivables valued at ` 809.
The goodwill of ` 4,761 comprises value of acquired workforce and expected synergies arising from the business combinations. The goodwill was allocated to IT Services segment and is partially deductible for income tax purposes in India and United States.
Summary of acquisitions during the year ended March 31, 2021 is given below:
During the year ended March 31, 2021, the Company has completed four business combinations (which individually are not material) for a total consideration (upfront cash payout to acquire control and contingent consideration) of ` 13,724. These include:
a) ` 1,643 towards acquisition of IVIA Serviços de Informática Ltda. (“IVIA”) on August 14, 2020, a specialized IT services provider to financial services, retail and manufacturing sectors in Brazil.
b) ` 5,268 towards acquisition of 4C NV and its subsidiaries (“4C”) on August 11, 2020, a Salesforce multi-cloud partner in Europe, U.K. and the Middle East
c) ` 841 towards acquisition of Encore Theme Technologies Private Limited (“ETT”), a Finastra trade finance solutions partner across the Middle East, Africa, India and Asia Pacific on December 15, 2020, and
d) ` 5,972 towards acquisition of Eximius Design, LLC and Eximius Design India Private Limited (“Eximius”) on February 25, 2021, a leading engineering services company with expertise in semiconductor, software and systems design.
The following table presents the provisional purchase price allocation:Description Purchase price allocated Net assets ` 1,324
Customer-related intangibles 2,460
Marketing-related intangibles 828
Deferred tax liabilities on intangible assets (432)
Total ` 4,180Goodwill 9,544
Total purchase price ` 13,724
Notes to the Consolidated Financial Statements
Consolidated financial statements under IFRS
342

The total consideration for IVIA includes a contingent consideration linked to achievement of revenues and earnings over a period of 3 years ending September 30, 2023, and range of contingent consideration payable is between ` Nil and ` 746. The fair value of the contingent consideration is estimated by applying the discounted cash-flow approach considering discount rate of 5.7% and probability adjusted revenue and earnings estimates. The undiscounted fair value of contingent consideration is ` 525 as of the date of acquisition. The fair value of discounted contingent consideration of ` 460 is recorded as part of provisional purchase price allocation.
The total consideration for ETT includes a contingent consideration linked to achievement of revenues and earnings over a period of 18 months ending March 31, 2022, and range of contingent consideration payable is between ` Nil and ` 305. The fair value of the contingent consideration is estimated by applying the discounted cash-flow approach considering discount rate of 7.4% and probability adjusted revenue and earnings estimates. The undiscounted fair value of contingent consideration is ` 215 as of the date of acquisition. The fair value of discounted contingent consideration of ` 196 is recorded as part of provisional purchase price allocation.
The total consideration for Eximius includes a contingent consideration linked to achievement of revenues and earnings over a period of 2 years ending March 31, 2023, and range of contingent consideration payable is between ` Nil and ` 1,738. The fair value of the contingent consideration is estimated by applying the discounted cash-flow approach considering discount rate of 2.3% and probability adjusted revenue and earnings estimates. The undiscounted fair value of contingent consideration is ` 1,695 as of the date of acquisition. The fair value of discounted contingent consideration of ` 1,637 is recorded as part of provisional purchase price allocation.
Net assets acquired include ` 1,000 of cash and cash equivalents and trade receivables valued at ` 1,157.
The goodwill of ` 9,544 comprises value of acquired workforce and expected synergies arising from the business combinations. Goodwill is allocated to IT Services segment and is not deductible for income tax purposes except for Eximius Design, LLC in the United States.
The transaction costs of ` 175 related to the above acquisitions have been included in general and administrative expenses in the consolidated statement of income.
The pro-forma effects of these business combinations on the Company’s results were not material.
Acquisition consummated after March 31, 2021
On March 4, 2021, the Company entered into a definitive agreement to acquire 100% equity interest in Capco, a global management and technology consultancy providing digital, consulting and technology services to financial institutions in the Americas, Europe and Asia Pacific, and its subsidiaries, for a total cash consideration of ` 108,760. The acquisition was consummated on April 29, 2021. The following table presents the provisional purchase price allocation:
Description Purchase price allocated Net assets ` 4,398
Customer-related intangibles 24,284
Marketing-related intangibles 8,048
Deferred tax liabilities on intangible assets (9,376)
Total ` 27,354Goodwill 81,406
Total purchase price ` 108,760
The goodwill of ` 81,406 comprises value of acquired workforce and expected synergies arising from the business combinations. This acquisition will make the Company one of the largest end-to-end global consulting, technology and transformation service providers to the banking and financial services industry. By combining our capabilities in strategic design, digital transformation, cloud, cybersecurity, IT and operations services with Capco’s domain and consulting strength, clients will gain access to a partner who can deliver integrated, bespoke solutions to help fuel growth and achieve their transformation objectives.
Goodwill is allocated to IT Services segment and is not deductible for income tax purposes.
Notes to the Consolidated Financial Statements
Consolidated financial statements under IFRSIntegrated Annual Report 2020-21
Wipro Limited
343

8. Investments
As at March 31, 2020
As at March 31, 2021
Non-currentFinancial instruments at FVTOCI
Equity instruments ` 9,297 ` 10,572
Financial instruments at amortized cost
Inter corporate and term deposits * 5 4
` 9,302 ` 10,576
CurrentFinancial instruments at FVTPL
Investments in liquid and short-term mutual funds ` 14,795 ` 23,502
Financial instruments at FVTOCI
Commercial paper, Certificate of deposits and bonds 155,587 131,382
Financial instruments at amortized cost
Inter corporate and term deposits* 19,253 20,823
` 189,635 ` 175,707
Total ` 198,937 ` 186,283
* These deposits earn a fixed rate of interest. Term deposits include non-current and current deposits in lien with banks primarily on account of term deposits held as margin money deposits against guarantees amounting to ` 4 and ` 615, respectively (March 31, 2020: Term deposits non-current of ` 5 and Term deposits current of ` 796).
Investments accounted for using the equity method
The Company has no material associates as at March 31, 2020 and 2021. The aggregate summarized financial information in respect of the Company’s immaterial associates that are accounted for using the equity method is set forth below:
As at March 31, 2020 As at March 31, 2021Carrying amount of the Company’s interest in associates accounted for using the equity method
` 1,383 ` 1,464
For the year ended March 31, 2019
For the year ended March 31, 2020
For the year ended March 31, 2021
Company’s share of net profit /(loss) of associates accounted for using the equity method in consolidated statement of income
` (43) ` 29 ` 130
Details of investments in equity instruments- classified as FVTOCI
Carrying value
ParticularsAs at March 31,
2020As at
March 31, 2021
Non-currentEnsono Holdings, LLC ` 2,733 ` 2,665
TLV Partners 567 804
Immuta, Inc. - 714
Tricentis Corporation 588 674
IntSights Cyber Intelligence Limited 641 620
Vectra Networks, Inc 582 562
Incorta Inc, Ltd. 529 512
YugaByte, Inc. - 494
Tradeshift Inc. 510 367
Harte Hanks Inc. 119 319
Vicarious FPC, Inc. 244 309
Notes to the Consolidated Financial Statements
Consolidated financial statements under IFRS
344

Carrying value
ParticularsAs at March 31,
2020As at
March 31, 2021
TLV Partners II, L.P. 190 295
Avaamo Inc. 260 252
B Capital Fund II, L.P. 118 220
Vulcan Cyber Ltd. - 219
CyCognito 99 216
Moogsoft (Herd) Inc. 227 179
Work-Bench Ventures II-A, LP 118 170
Boldstart Ventures IV, L.P. 49 156
Sealights Technologies Ltd 151 146
CloudKnox Security Inc. 151 146
Headspin Inc 849 140
Glilot Capital Partners III L.P. 28 87
Boldstart Opportunities II, L.P. - 79
TLV Partners III, L,P. 14 73
Wep Peripherals Ltd. 68 60
Altizon Systems Private Limited 38 38
Wep Solutions Limited 27 26
Drivestream India Private Limited 19 19
Work-Bench Ventures III-A, LP - 11
CloudGenix 378 -
Total ` 9,297 ` 10,572
9. Trade receivablesAs at
March 31, 2020As at
March 31, 2021Trade receivables ` 124,460 ` 109,733
Allowance for lifetime expected credit loss (13,937) (11,077)
`110,523 ` 98,656
Non-current 6,049 4,358
Current 104,474 94,298
The activity in the allowance for lifetime expected credit loss is given below:
As atMarch 31, 2020
As atMarch 31, 2021
Balance at the beginning of the year ` 14,824 ` 13,937
Additions during the year, net (Refer to Note 25) 1,043 1,506
Charged against allowance (2,139) (4,381)
Translation adjustment 209 15
Balance at the end of the year ` 13,937 ` 11,077
10. InventoriesAs at
March 31, 2020As at
March 31, 2021Stores and spare parts ` 613 ` 127
Finished and traded goods 1,252 937
` 1,865 ` 1,064
Notes to the Consolidated Financial Statements
Consolidated financial statements under IFRSIntegrated Annual Report 2020-21
Wipro Limited
345

11. Cash and cash equivalents
As atMarch 31, 2019
As atMarch 31, 2020
As atMarch 31, 2021
Cash and bank balances ` 41,966 ` 34,087 ` 68,842
Demand deposits with banks * 116,563 110,412 100,951
` 158,529 ` 144,499 ` 169,793
* These deposits can be withdrawn by the Company at any time without prior notice and without any penalty on the principal.
Cash and cash equivalents consist of the following for the purpose of the statement of cash flows:
As at March 31, 2019
As at March 31, 2020
As at March 31, 2021
Cash and cash equivalents (as above) ` 158,529 ` 144,499 ` 169,793
Bank overdrafts (4) (395) (130)
`158,525 ` 144,104 ` 169,663
12. Other financial assets
As atMarch 31, 2020
As atMarch 31, 2021
Non-currentSecurity deposits ` 1,581 ` 1,477
Interest receivables 1,139 1,139
Finance lease receivables 2,359 3,144
Others 802 328
`5,881 `6,088
CurrentSecurity deposits ` 1,127 ` 1,149
Dues from officers and employees 1,040 411
Interest receivables 2,581 1,628
Finance lease receivables 2,811 3,438
Others 1,055 619
` 8,614 ` 7,245
` 14,495 ` 13,333
Finance lease receivablesFinance lease receivables consist of assets that are leased to customers for a contract term normally ranging 1 to 5 years, with lease payments due in monthly or quarterly installments. Details of finance lease receivables are given below:
Minimum lease payments
Present value of minimum lease payments
As atMarch 31, 2020
As at March 31, 2021
As at March 31, 2020
As at March 31, 2021
Not later than one year ` 2,986 ` 3,636 ` 2,811 ` 3,438
Later than one year but not later than five years 2,473 3,264 2,359 3,144
Gross investment in lease 5,459 6,900 5,170 6,582 Less: Unearned finance income (289) (318) - -
Present value of minimum lease payment receivables ` 5,170 ` 6,582 ` 5,170 ` 6,582
Non-current finance lease receivables 2,359 3,144
Current finance lease receivables 2,811 3,438
Notes to the Consolidated Financial Statements
Consolidated financial statements under IFRS
346

13. Other assets
As at March 31, 2020
As at March 31, 2021
Non-currentPrepaid expenses ` 4,535 ` 3,417
Costs to obtain contract* 4,030 3,413
Costs to fulfil contract 305 337
Others (Refer to Note 35) 3,065 8,768
` 11,935 ` 15,935
CurrentPrepaid expenses ` 9,876 ` 12,121
Dues from officers and employees 310 105
Advance to suppliers 3,121 3,199
Balance with GST and other authorities 7,805 7,903
Costs to obtain contract* 1,258 759
Costs to fulfil contract - 53
Others 135 783
` 22,505 ` 24,923
` 34,440 ` 40,858
* Amortization during the year ended March 31, 2020 and 2021 amounting to ` 1,237 and ` 1,257 respectively.
14. Loans, borrowings and bank overdrafts
Short-term loans, borrowings and bank overdrafts
The Company had loans, borrowings and bank overdrafts amounting to ` 54,020 and ` 60,363, as at March 31, 2020 and 2021, respectively. The principal source of borrowings from banks as at March 31, 2021 primarily consists of lines of credit of approximately ` 66,533, U.S. Dollar (U.S.$) 593 million, Canadian Dollar (CAD) 73 million, Saudi Riyal (SAR) 20 million, Euro (EUR) 33 million, Pound Sterling (GBP) 6 million, Qatari Riyal (QAR) 10 million, Brazilian Real (BRL) 13 million, Australian Dollar (AUD $) 150 million, Bahraini Dinar (BHD) 1 million and Indonesian Rupiah (IDR) 13,000 million from bankers for working capital requirements and other short-term needs.
As at March 31, 2021, the Company has unutilized lines of credit aggregating ` 8,620, U.S.$ 593 million, CAD 33 million, SAR 20 million, EUR 33 million, GBP 6 million, QAR 10 million, BRL 3 million, AUD $ 150 million, BHD 1 million, and IDR 13,000 million. To utilize these unused lines of credit, the Company requires consent of the lender and compliance with certain financial covenants. Significant portion of these lines of credit are revolving credit facilities and floating rate foreign currency loans, renewable on a periodic basis.
The Company has non-fund based revolving credit facilities in various currencies equivalent to ` 41,597 and ` 56,421, as at March 31, 2020 and 2021, respectively, towards operational requirements that can be used for the issuance of letters of credit and bank guarantees. As at March 31, 2020, and 2021, an amount of 22,790, and 39,293, respectively, was unutilized out of these non-fund based facilities.
Long-term loans and borrowings
As at March 31, 2020 As at March 31, 2021
Currency
Foreign currency in
millionsIndian Rupee
Foreign currency in
millionsIndian Rupee Interest rate
Final maturity
Unsecured loans
U.S. Dollar (U.S.$) 311 23,478 310 22,671 1.04% - 3.81% March-24
Canadian Dollar (CAD) ^ 25 ^ 10 1.48% - 3.26% July-21
Indian Rupee (INR) - 440 - 240 8.29% - 9.35% March-24
Australian Dollar (AUD) 1 44 ^ 26 4.65% January-22
Notes to the Consolidated Financial Statements
Consolidated financial statements under IFRSIntegrated Annual Report 2020-21
Wipro Limited
347

As at March 31, 2020 As at March 31, 2021
Currency
Foreign currency in
millionsIndian Rupee
Foreign currency in
millionsIndian Rupee Interest rate
Final maturity
Pound Sterling (GBP) ^ 22 ^ 12 2.93% February-22
Euro (EUR) ^ 13 ^ 10 2.87% April-23
` 24,022 ` 22,969 Non-current portion of long-term loans and borrowings 4,840 7,458
Current portion of long-term loans and borrowings 19,182 15,511
^ Value is less than 1
Cash and non-cash changes in liabilities arising from financing activities:
Non-cash changes
April 1, 2019 Cash flowIFRS 16
adoption
Net additions to lease liabilities
Foreign exchange
movementsMarch 31,
2020
Borrowings 97,461 (26,038) - - 6,224 77,647
Bank overdrafts 4 391 - - - 395
Obligations under finance leases 2,002 - (2,002) - - -
Lease Liabilities - (6,784) 17,381 7,942 659 19,198
` 99,467 ` (32,431) ` 15,379 `7,942 `6,883 `97,240
Non-cash changes
April 1, 2020 Cash flow
Net additions to lease liabilities
Foreign exchange
movementsMarch 31,
2021
Borrowings ` 77,647 ` 6,212 ` - ` (657) ` 83,202
Bank overdrafts 395 (265) - - 130
Lease Liabilities 19,198 (8,660) 10,404 240 21,182
` 97,240 ` (2,713) ` 10,404 ` (417) ` 104,514
Significant portion of loans, borrowings and bank overdrafts bear floating rates of interest, referenced to country specific official benchmark interest rates and a spread, determined based on market conditions.
The terms of the other secured and unsecured loans and borrowings also contain certain restrictive covenants primarily requiring the Company to maintain certain financial ratios. As at March 31, 2020 and 2021, the Company has met all the covenants under these arrangements.
Interest expense on loans, borrowings and bank overdrafts was ` 4,058, ` 3,166, and ` 1,897 for the year ended March 31, 2019, 2020 and 2021, respectively.
Notes to the Consolidated Financial Statements
Consolidated financial statements under IFRS
348

15. Trade payables and accrued expensesAs at
March 31, 2020As at
March 31, 2021
Trade payables ` 27,053 ` 23,232
Accrued expenses 51,076 55,638
` 78,129 ` 78,870
16. Other financial liabilitiesAs at
March 31, 2020As at
March 31, 2021
Non-current
Cash Settled ADS RSUs (Refer to Note 30) ` 146 ` 7
Contingent consideration (Refer to Note 7) - 2,158
Advance from customers - 123
Deposits and others 5 3
` 151 ` 2,291
Current
Cash Settled ADS RSUs (Refer to Note 30) ` 350 ` 24
Contingent consideration (Refer to Note 7) - 135
Advance from customers - 496
Deposits and others 549 815
` 899 ` 1,470
` 1,050 ` 3,761
17. Other liabilitiesAs at
March 31, 2020As at
March 31, 2021
Non-current
Employee benefits obligations ` 3,767 ` 3,055
Others 3,770 4,780
` 7,537 ` 7,835
Current
Statutory and other liabilities ` 4,919 ` 9,266
Employee benefits obligations 12,356 14,401
Advance from customers 1,464 362
Others 515 523
` 19,254 ` 24,552
` 26,791 ` 32,387
Notes to the Consolidated Financial Statements
Consolidated financial statements under IFRSIntegrated Annual Report 2020-21
Wipro Limited
349

18. ProvisionsAs at
March 31, 2020As at
March 31, 2021
Non-current
Provision for warranty ` 2 ` 2
` 2 ` 2
Current
Provision for warranty ` 317 ` 213
Others 295 463
` 612 ` 676
` 614 ` 678
A summary of activity in provision for warranty and other provisions is as follows:
Year ended March 31, 2020
Year ended March 31, 2021
Provision for warranty
Others TotalProvision for
warrantyOthers Total
Balance at the beginning of the year ` 277 ` 363 ` 640 ` 319 ` 295 ` 614
Additional provision during the year 360 98 458 245 270 515
Utilized/written-back during the year (318) (166) (484) (349) (102) (451)
Balance at the end of the year ` 319 ` 295 ` 614 ` 215 ` 463 ` 678
Provision for warranty represents cost associated with providing sales support services, which are accrued at the time of recognition of revenues and are expected to be utilized over a period of 1 to 2 years. Other provisions primarily include provisions for compliance related contingencies. The timing of cash outflows in respect of such provision cannot be reasonably determined.
19. Financial instruments
Financial assets and liabilities (carrying value / fair value)
As at March 31, 2020
As at March 31, 2021
Assets:Cash and cash equivalents ` 144,499 ` 169,793
Investments
Financial instruments at FVTPL 14,795 23,502
Financial instruments at FVTOCI 164,884 141,954
Financial instruments at Amortized cost 19,258 20,827
Other financial assets
Trade receivables 110,523 98,656
Unbilled receivables 25,209 27,124
Other assets 14,495 13,333
Derivative assets 3,025 4,080
` 496,688 ` 499,269
Notes to the Consolidated Financial Statements
Consolidated financial statements under IFRS
350
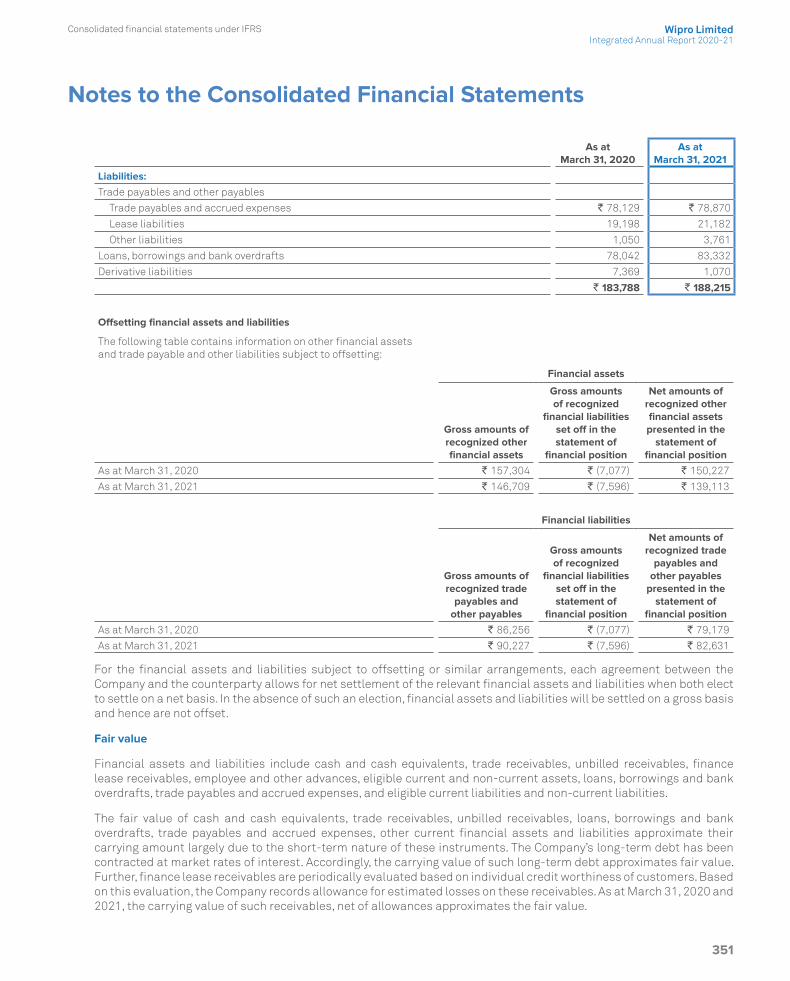
As at March 31, 2020
As at March 31, 2021
Liabilities:Trade payables and other payables
Trade payables and accrued expenses ` 78,129 ` 78,870
Lease liabilities 19,198 21,182
Other liabilities 1,050 3,761
Loans, borrowings and bank overdrafts 78,042 83,332
Derivative liabilities 7,369 1,070
` 183,788 ` 188,215
Offsetting financial assets and liabilities
The following table contains information on other financial assets and trade payable and other liabilities subject to offsetting:
Financial assets
Gross amounts of recognized other financial assets
Gross amounts of recognized
financial liabilities set off in the statement of
financial position
Net amounts of recognized other financial assets presented in the
statement of financial position
As at March 31, 2020 ` 157,304 ` (7,077) ` 150,227
As at March 31, 2021 ` 146,709 ` (7,596) ` 139,113
Financial liabilities
Gross amounts of recognized trade
payables and other payables
Gross amounts of recognized
financial liabilities set off in the statement of
financial position
Net amounts of recognized trade
payables and other payables
presented in the statement of
financial positionAs at March 31, 2020 ` 86,256 ` (7,077) ` 79,179
As at March 31, 2021 ` 90,227 ` (7,596) ` 82,631
For the financial assets and liabilities subject to offsetting or similar arrangements, each agreement between the Company and the counterparty allows for net settlement of the relevant financial assets and liabilities when both elect to settle on a net basis. In the absence of such an election, financial assets and liabilities will be settled on a gross basis and hence are not offset.
Fair value
Financial assets and liabilities include cash and cash equivalents, trade receivables, unbilled receivables, finance lease receivables, employee and other advances, eligible current and non-current assets, loans, borrowings and bank overdrafts, trade payables and accrued expenses, and eligible current liabilities and non-current liabilities.
The fair value of cash and cash equivalents, trade receivables, unbilled receivables, loans, borrowings and bank overdrafts, trade payables and accrued expenses, other current financial assets and liabilities approximate their carrying amount largely due to the short-term nature of these instruments. The Company’s long-term debt has been contracted at market rates of interest. Accordingly, the carrying value of such long-term debt approximates fair value. Further, finance lease receivables are periodically evaluated based on individual credit worthiness of customers. Based on this evaluation, the Company records allowance for estimated losses on these receivables. As at March 31, 2020 and 2021, the carrying value of such receivables, net of allowances approximates the fair value.
Notes to the Consolidated Financial Statements
Consolidated financial statements under IFRSIntegrated Annual Report 2020-21
Wipro Limited
351

Investments in liquid and short-term mutual funds, which are classified as FVTPL are measured using net asset values at the reporting date multiplied by the quantity held. Fair value of investments in commercial papers, certificate of deposits and bonds classified as FVTOCI is determined based on the indicative quotes of price and yields prevailing in the market at the reporting date. Fair value of investments in equity instruments classified as FVTOCI is determined using market and income approaches.
The fair value of derivative financial instruments is determined based on observable market inputs including currency spot and forward rates, yield curves, currency volatility etc.
Fair value hierarchy
The table below analyses financial instruments carried at fair value, by valuation method. The different levels have been defined as follows:
Level 1 – Quoted prices (unadjusted) in active markets for identical assets or liabilities.
Level 2 – Inputs other than quoted prices included within Level 1 that are observable for the asset or liability, either directly (i.e. as prices) or indirectly (i.e. derived from prices).
Level 3 – Inputs for the assets or liabilities that are not based on observable market data (unobservable inputs).
The following table presents fair value hierarchy of assets and liabilities measured at fair value on a recurring basis:
Particular
As at March 31, 2020 As at March 31, 2021
Fair value measurements at reporting date Fair value measurements at reporting date
Total Level 1 Level 2 Level 3 Total Level 1 Level 2 Level 3
Assets
Derivative instruments:
Cash flow hedges ` 1,382 ` - ` 1,382 ` - ` 2,998 ` - ` 2,998 ` -
Others 1,643 - 1,643 - 1,082 - 1,082 -
Investments:
Investment in liquid and short-term mutual funds 14,795 14,795 - - 23,502 23,502 - -
Investment in equity instruments 9,297 - 119 9,178 10,572 26 319 10,227
Commercial paper, Certificate of deposits and bonds 155,587 12,983 142,604 - 131,382 2,217 129,165 -
Liabilities
Derivative instruments:
Cash flow hedges ` (4,057) ` - ` (4,057) ` - ` (816) ` - ` (816) ` -
Others (3,312) - (3,312) - (254) - (254) -
Contingent consideration (Refer to Note 7) - - - - (2,293) - - (2,293)
The following methods and assumptions were used to estimate the fair value of the level 2 financial instruments included in the above table.
Derivative instruments (assets and liabilities): The Company enters derivative financial instruments with various counterparties, primarily banks with investment grade credit ratings. Derivatives valued using valuation techniques with market observable inputs are mainly interest rate swaps, foreign exchange forward contracts and foreign exchange option contracts. The most frequently applied valuation techniques include forward pricing, swap models and Black Scholes models (for option valuation), using present value calculations. The models incorporate various inputs including the credit quality of counterparties, foreign exchange spot and forward rates, interest rate curves and forward rate curves of the underlying. As at March 31, 2021, the changes in counterparty credit risk had no material effect on the hedge effectiveness assessment for derivatives designated in hedge relationships and other financial instruments recognized at fair value.
Investment in commercial papers, certificate of deposits and bonds: Fair value of these instruments is derived based on the indicative quotes of price and yields prevailing in the market as at reporting date.
Notes to the Consolidated Financial Statements
Consolidated financial statements under IFRS
352

The following methods and assumptions were used to estimate the fair value of the level 3 financial instruments included in the above table.
Investment in equity instruments: Fair value of these instruments is determined using market and income approaches.
Details of assets and liabilities considered under Level 3 classification
Investment in equity instruments As at March 31, 2020
As at March 31, 2021
Balance at the beginning of the year ` 6,668 ` 9,178
Additions 2,124 1,575
Disposals (1,327) (1,256)
Transfers out of level 3 - (27)
Gain/(loss) recognized in foreign currency translation reserve 855 (252)
Gain recognized in other comprehensive income 858 1,009
Balance at the end of the year ` 9,178 ` 10,227
As at March 31, 2020
As at March 31, 2021
Contingent considerationBalance at the beginning of the year ` - ` -
Additions (Refer to Note 7) - (2,293)
Finance expense recognized in statement of income - (25)
Gain/(loss) recognized in foreign currency translation reserve - 25
Balance at the end of the year ` - ` (2,293)
During the year ended March 31, 2021, as a result of M&A transactions, the Company sold its shares in CloudGenix and Emailage Corp at a fair value of ` 1,256 and recognized a cumulative gain of ` 884 in other comprehensive income.
Description of significant unobservable inputs to valuation:
As at March 31, 2020
Items Valuation technique Significant unobservable Input Movement Increase Decrease
input by (`) (`)Unquoted equity Discounted Long term growth rate 3.0% 0.5% 298 (273)
investments cash flow model Discount rate 11.6% 0.5% (388) 404
As at March 31, 2021
Items Valuation technique Significant unobservable Input Movement Increase Decrease
input by (`) (`)Unquoted equity Discounted Long term growth rate 3.0% 0.5% 304 (295)
investments cash flow model Discount rate 10.9% 0.5% (393) 395
As at March 31, 2020 and 2021, 0.5 percentage point increase/(decrease) in the unobservable inputs used in fair valuation of other Level 3 assets does not have a significant impact in its value.
Derivative assets and liabilities:
The Company is exposed to foreign currency fluctuations on foreign currency assets / liabilities, forecasted cash flows denominated in foreign currency and net investment in foreign operations. The Company follows established risk management policies, including the use of derivatives to hedge foreign currency assets / liabilities, foreign currency forecasted cash flows and net investment in foreign operations. The counter parties in these derivative instruments are primarily banks and the Company considers the risks of non-performance by the counterparty as non-material.
Notes to the Consolidated Financial Statements
Consolidated financial statements under IFRSIntegrated Annual Report 2020-21
Wipro Limited
353

The following table presents the aggregate contracted principal amounts of the Company’s derivative contracts outstanding:
(in million)
As at March 31, 2020 As at March 31, 2021
Notional Fair value Notional Fair value
Designated derivative instrumentsSell: Forward contracts USD 1,011 ` (2,902) USD 1,577 ` 2,293
€ 121 ` 231 € 109 ` 114
£ 52 ` 240 £ 96 ` (254)
AUD 144 ` 741 AUD 103 ` (246)
Range forward option contracts USD 474 ` (1,057) USD 138 ` 385
€ 39 ` 85 € 20 ` 24
£ 98 ` (13) £ 55 ` (116)
AUD - ` - AUD 34 ` (18)
Non-designated derivative instrumentsSell: Forward contracts * USD 1,314 ` (3,116) USD 1,638 ` 480
€ 59 ` 34 € 99 ` 202
£ 81 ` 112 £ 104 ` 98
AUD 56 ` 115 AUD 29 ` 11
SGD 7 ` 8 SGD 9 ` 5
ZAR 17 ` 1 ZAR 22 ` (1)
CAD 51 ` 153 CAD 30 ` 3
SAR 60 ` (1) SAR 137 ` (1)
PLN 34 ` 13 PLN 8 ` 2
CHF 7 ` 4 CHF 10 ` 13
QAR 19 ` (8) QAR 15 ` (6)
TRY 30 ` 31 TRY 47 ` 42
NOK 19 ` 16 NOK 4 ` ^OMR 2 ` 1 OMR 2 ` (1)
SEK 13 ` 4 SEK 42 ` 10
MYR 20 ` 1 MYR - ` - JPY 325 ` ^ JPY 370 ` 6
Buy: Forward contracts USD 480 ` 972 USD - ` - MXN 11 ` (9) MXN - ` - SEK - ` - SEK 37 ` (15)
DKK 9 ` ^ DKK 45 ` (12)
CHF - ` - CHF 2 ` (6)
RMB - ` - RMB 30 ` (2)
AED - ` - AED 9 ` ^
` (4,344) ` 3,010 * USD 1,314 and USD 1,638 includes USD/PHP sell forward of USD 176 and USD 244 as at March 31, 2020 and 2021, respectively.
^ Value is less than ` 1
Hedge effectiveness is determined at the inception of the hedge relationship, and through periodic prospective effectiveness assessments to ensure that an economic relationship exists between the hedged item and hedging instrument, including whether the hedging instrument is expected to offset changes in cash flows of hedged items.
Notes to the Consolidated Financial Statements
Consolidated financial statements under IFRS
354

The following table summarizes activity in the cash flow hedging reserve within equity related to all derivative instruments classified as cash flow hedges:
As at March 31, 2020
As at March 31, 2021
Balance as at the beginning of the year ` 3,019 ` (2,876)
Deferred cancellation gain/ (loss), net (201) - Changes in fair value of effective portion of derivatives (2,312) 4,753
Net (gain)/loss reclassified to consolidated statement of income on occurrence of hedged transactions *
(3,382) 305
Gain/(loss) on cash flow hedging derivatives, net ` (5,895) ` 5,058
Balance as at the end of the year (2,876) 2,182 Deferred tax thereon 561 (452)
Balance as at the end of the year, net of deferred tax ` (2,315) ` 1,730
*Includes net (gain)/loss reclassified to revenue of ` (4,761) and ` 58 for the year ended March 31, 2020 and 2021, respectively and net (gain)/loss reclassified to cost of revenues of ` 1,379 and ` 247 for the year ended March 31, 2020 and 2021, respectively.
The related hedge transactions for balance in cash flow hedging reserves as at March 31, 2021are expected to occur and be reclassified to the consolidated statement of income over a period of two years.
As at March 31, 2020 and 2021 there were no significant gains or losses on derivative transactions or portions thereof that have become ineffective as hedges or associated with an underlying exposure that did not occur.
Sale of financial assets
From time to time, in the normal course of business, the Company transfers accounts receivables, unbilled receivables, net investment in finance lease receivables (financial assets) to banks. Under the terms of the arrangements, the Company surrenders control over the financial assets and transfer is without recourse. Accordingly, such transfers are recorded as sale of financial assets. Gains and losses on sale of financial assets without recourse are recorded at the time of sale based on the carrying value of the financial assets and fair value of servicing liability. The incremental impact of such transactions on our cash flow and liquidity for the year ended March 31, 2019, 2020 and 2021 is not material.
In certain cases, transfer of financial assets may be with recourse. Under arrangements with recourse, the Company is obligated to repurchase the uncollected financial assets, subject to limits specified in the agreement with the banks. These are reflected as part of loans and borrowings in the consolidated statement of financial position.
Financial risk management
Market Risk
Market risk is the risk of loss of future earnings, to fair values or to future cash flows that may result from a change in the price of a financial instrument. The value of a financial instrument may change as a result of changes in the interest rates, foreign currency exchange rates and other market changes that affect market risk sensitive instruments. Market risk is attributable to all market risk sensitive financial instruments including investments, foreign currency receivables, payables and loans and borrowings.
The Company’s exposure to market risk is a function of investment and borrowing activities and revenue generating activities in foreign currency. The objective of market risk management is to avoid excessive exposure of the Company’s earnings and equity to losses.
Notes to the Consolidated Financial Statements
Consolidated financial statements under IFRSIntegrated Annual Report 2020-21
Wipro Limited
355
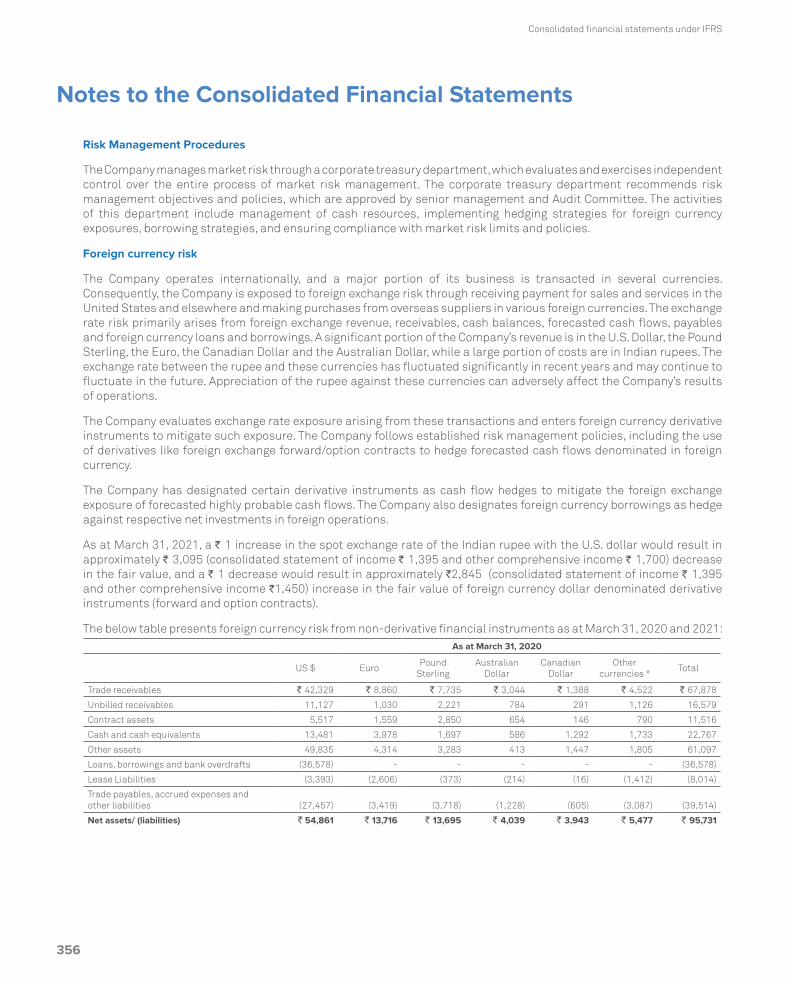
Risk Management Procedures
The Company manages market risk through a corporate treasury department, which evaluates and exercises independent control over the entire process of market risk management. The corporate treasury department recommends risk management objectives and policies, which are approved by senior management and Audit Committee. The activities of this department include management of cash resources, implementing hedging strategies for foreign currency exposures, borrowing strategies, and ensuring compliance with market risk limits and policies.
Foreign currency risk
The Company operates internationally, and a major portion of its business is transacted in several currencies. Consequently, the Company is exposed to foreign exchange risk through receiving payment for sales and services in the United States and elsewhere and making purchases from overseas suppliers in various foreign currencies. The exchange rate risk primarily arises from foreign exchange revenue, receivables, cash balances, forecasted cash flows, payables and foreign currency loans and borrowings. A significant portion of the Company’s revenue is in the U.S. Dollar, the Pound Sterling, the Euro, the Canadian Dollar and the Australian Dollar, while a large portion of costs are in Indian rupees. The exchange rate between the rupee and these currencies has fluctuated significantly in recent years and may continue to fluctuate in the future. Appreciation of the rupee against these currencies can adversely affect the Company’s results of operations.
The Company evaluates exchange rate exposure arising from these transactions and enters foreign currency derivative instruments to mitigate such exposure. The Company follows established risk management policies, including the use of derivatives like foreign exchange forward/option contracts to hedge forecasted cash flows denominated in foreign currency.
The Company has designated certain derivative instruments as cash flow hedges to mitigate the foreign exchange exposure of forecasted highly probable cash flows. The Company also designates foreign currency borrowings as hedge against respective net investments in foreign operations.
As at March 31, 2021, a ` 1 increase in the spot exchange rate of the Indian rupee with the U.S. dollar would result in approximately ` 3,095 (consolidated statement of income ` 1,395 and other comprehensive income ` 1,700) decrease in the fair value, and a ` 1 decrease would result in approximately `2,845 (consolidated statement of income ` 1,395 and other comprehensive income `1,450) increase in the fair value of foreign currency dollar denominated derivative instruments (forward and option contracts).
The below table presents foreign currency risk from non-derivative financial instruments as at March 31, 2020 and 2021:As at March 31, 2020
US $ EuroPound
SterlingAustralian
DollarCanadian
DollarOther
currencies # Total
Trade receivables ` 42,329 ` 8,860 ` 7,735 ` 3,044 ` 1,388 ` 4,522 ` 67,878
Unbilled receivables 11,127 1,030 2,221 784 291 1,126 16,579
Contract assets 5,517 1,559 2,850 654 146 790 11,516
Cash and cash equivalents 13,481 3,978 1,697 586 1,292 1,733 22,767
Other assets 49,835 4,314 3,283 413 1,447 1,805 61,097
Loans, borrowings and bank overdrafts (36,578) - - - - - (36,578)
Lease Liabilities (3,393) (2,606) (373) (214) (16) (1,412) (8,014)
Trade payables, accrued expenses and other liabilities (27,457) (3,419) (3,718) (1,228) (605) (3,087) (39,514)
Net assets/ (liabilities) ` 54,861 ` 13,716 ` 13,695 ` 4,039 ` 3,943 ` 5,477 ` 95,731
Notes to the Consolidated Financial Statements
Consolidated financial statements under IFRS
356

As at March 31, 2021
US $ EuroPound
SterlingAustralian
DollarCanadian
DollarOther
currencies # Total
Trade receivables ` 33,421 ` 9,094 ` 9,334 ` 4,101 ` 1,436 ` 4,196 ` 61,582
Unbilled receivables 9,255 1,681 1,740 803 283 821 14,583
Contract assets 5,111 1,121 2,755 838 102 536 10,463
Cash and cash equivalents 11,838 1,385 2,052 765 1,876 2,728 20,644
Other assets 73,212 3,981 9,116 2 891 3,479 90,681
Lease Liabilities (3,800) (2,684) (1,575) (202) (117) (1,548) (9,926)
Trade payables, accrued expenses and other liabilities (23,187) (3,569) (4,370) (1,415) (350) (2,622) (35,513)
Net assets/ (liabilities) ` 105,850 ` 11,009 ` 19,052 ` 4,892 ` 4,121 ` 7,590 ` 152,514
# Other currencies reflect currencies such as Japanese Yen, Swiss Franc, Saudi Riyal etc.
As at March 31, 2020 and 2021, respectively, every 1% increase/decrease inthe respective foreign currencies compared to functional currency of the Company would impact results by approximately `957and `1,525, respectively.
Interest rate risk
Interest rate risk primarily arises from floating rate borrowing, including various revolving and other lines of credit. The Company’s investments are primarily in short-term investments, which do not expose it to significant interest rate risk. From time to time, the Company manages its net exposure to interest rate risk relating to borrowings by entering into interest rate swap agreements, which allows it to exchange periodic payments based on a notional amount and agreed upon fixed and floating interest rates. Certain borrowings are also transacted at fixed interest rates. If interest rates were to increase by 100 bps as on March 31, 2021, additional net annual interest expense on floating rate borrowing would amount to approximately `829.
Credit risk
Credit risk arises from the possibility that customers may not be able to settle their obligations as agreed. To manage this, the Company periodically assesses the credit rating and financial reliability of customers, considering the financial condition, current economic trends, forward looking macroeconomic information, analysis of historical bad debts and ageing of accounts receivable. Individual risk limits are set accordingly. No single customer accounted for more than 10% of the accounts receivable as at March 31, 2020 and 2021, or revenues for the year ended March 31, 2019, 2020 and 2021. There is no significant concentration of credit risk.
Counterparty risk
Counterparty risk encompasses issuer risk on marketable securities, settlement risk on derivative and money market contracts and credit risk on cash and time deposits. Issuer risk is minimized by only buying securities which are at least AA rated in India based on Indian rating agencies. Settlement and credit risk is reduced by the policy of entering into transactions with counterparties that are usually banks or financial institutions with acceptable credit ratings. Exposure to these risks are closely monitored and maintained within predetermined parameters. There are limits on credit exposure to any financial institution. The limits are regularly assessed and determined based upon credit analysis including financial statements and capital adequacy ratio reviews.
Liquidity risk
Liquidity risk is defined as the risk that the Company will not be able to settle or meet its obligations on time or at a reasonable price. The Company’s corporate treasury department is responsible for liquidity and funding as well as settlement management. In addition, processes and policies related to such risks are overseen by senior management. Management monitors the Company’s net liquidity position through rolling forecasts based on the expected cash flows. As at March 31, 2021, cash and cash equivalents are held with major banks and financial institutions.
Notes to the Consolidated Financial Statements
Consolidated financial statements under IFRSIntegrated Annual Report 2020-21
Wipro Limited
357

The table below provides details regarding the remaining contractual maturities of significant financial liabilities at the reporting date. The amounts include estimated interest payments and exclude the impact of netting agreements, if any.
As at March 31, 2020
Carrying valueLess than 1
year1-2 years 2-4 years
Beyond 4 years
Total
Loans, borrowings and bank overdrafts * ` 78,042 ` 74,663 ` 4,761 ` 119 ` - ` 79,543
Lease Liabilities * 19,198 7,322 6,128 5,425 2,192 21,067
Trade payables and accrued expenses 78,129 78,129 - - - 78,129
Derivative liabilities 7,369 7,231 90 48 - 7,369
Other liabilities 1,050 899 88 63 - 1,050
As at March 31, 2021
Carrying valueLess than 1
year1-2 years 2-4 years
Beyond 4 years
Total
Loans, borrowings and bank overdrafts * ` 83,332 ` 77,609 ` 166 ` 7,441 ` - ` 85,216
Lease Liabilities * 21,182 8,398 6,317 6,017 2,091 22,823
Trade payables and accrued expenses 78,870 78,870 - - - 78,870
Derivative liabilities 1,070 1,070 - - - 1,070
Other liabilities 3,761 1,473 1,330 1,077 - 3,880
* Includes future cash outflow towards estimated interest on borrowings and lease liabilities.
The balanced view of liquidity and financial indebtedness is stated in the table below. The management for external communication with investors, analysts and rating agencies uses this calculation of the net cash position:
As at March 31, 2020
As at March 31, 2021
Cash and cash equivalents ` 144,499 ` 169,793
Investments 189,635 175,707
Loans, borrowings and bank overdrafts (78,042) (83,332)
` 256,092 ` 262,168
20. Foreign currency translation reserve and Other reserves
The movement in foreign currency translation reserve attributable to equity holders of the Company is summarized below:
As at March 31, 2020
As at March 31, 2021
Balance at the beginning of the year ` 15,250 ` 23,539
Translation difference related to foreign operations, net 8,289 (603)
Balance at the end of the year ` 23,539 ` 22,936
Notes to the Consolidated Financial Statements
Consolidated financial statements under IFRS
358

The movement in other reserve is summarized below:Other Reserves
ParticularsRemeasurements
of the defined benefit plans
Investment in debt
instruments measured at fair
value through OCI
Investment in equity
instruments measured at fair
value through OCI
Capital Redemption
Reserve
As at April 1, 2018 ` (305) ` 1,182 ` (98) ` 768 Other comprehensive income 235 (18) (464) - Bonus issue of equity shares - - - (767)As at March 31, 2019 ` (70) ` 1,164 ` (562) ` 1
As at April 1, 2019 ` (70) ` 1,164 ` (562) ` 1 Other comprehensive income (1,050) 1,222 724 - Buyback of equity shares - - - 646 As at March 31, 2020 ` (1,120) ` 2,386 ` 162 ` 647
As at April 1, 2020 ` (1,120) ` 2,386 ` 162 ` 647 Other comprehensive income 223 1,851 1,216 - Buyback of equity shares - - - 475 As at March 31, 2021 ` (897) ` 4,237 ` 1,378 ` 1,122
21. Income taxes
Year ended March 31, 2019
Year ended March 31, 2020
Year ended March 31, 2021
Income tax expense as per the consolidated statement of income ` 25,242 ` 24,799 ` 30,345 Income tax included in other comprehensive income on:
Unrealized gains/(losses) on investment securities (65) (230) 226 Gains/(losses) on cash flow hedging derivatives 633 (1,165) 1,013 Remeasurements of the defined benefit plans 47 (196) 111
` 25,857 ` 23,208 ` 31,695
Income tax expense consist of the following:Year ended
March 31, 2019Year ended
March 31, 2020Year ended
March 31, 2021Current taxesDomestic ` 17,987 ` 18,437 ` 19,773 Foreign 5,663 5,887 6,292
23,650 24,324 26,065 Deferred taxesDomestic (180) 1,624 3,982 Foreign 1,772 (1,149) 298
1,592 475 4,280
` 25,242 ` 24,799 ` 30,345
The reconciliation between the provision of income tax and amounts computed by applying the Indian statutory income tax rate to profit before taxes is as follows:
Year ended March 31, 2019
Year ended March 31, 2020
Year ended March 31, 2021
Profit before taxes ` 115,415 ` 122,512 ` 139,007
Enacted income tax rate in India 34.94% 34.94% 34.94%
Computed expected tax expense 40,326 42,806 48,569
Effect of:
Income exempt from tax (18,469) (12,930) (12,697)
Notes to the Consolidated Financial Statements
Consolidated financial statements under IFRSIntegrated Annual Report 2020-21
Wipro Limited
359

Year ended March 31, 2019
Year ended March 31, 2020
Year ended March 31, 2021
Basis differences that will reverse during a tax holiday period (796) 480 (2,268)
Income taxed at higher/ (lower) rates (1,002) (3,122) (2,381)
Taxes related to income of prior years (2,267) (116) (3,861)
Changes in unrecognized deferred tax assets 3,972 (3,898) 1,096
Expenses disallowed for tax purpose 3,503 1,785 1,879
Others, net (25) (206) 8
Income tax expense ` 25,242 ` 24,799 ` 30,345 Effective income tax rate 21.87% 20.24% 21.83%
The components of deferred tax assets and liabilities are as follows:
As at March 31, 2020
As at March 31, 2021
Carry forward losses * ` 2,044 ` 1,637
Trade payables, accrued expenses and other liabilities 4,994 5,115
Allowances for lifetime expected credit loss 3,921 3,208
Minimum alternate tax 3,425 -
Cash flow hedges 561 -
Contract asset - 91
Others - 90
14,945 10,141
Property, plant and equipment (686) (1,268)
Amortizable goodwill (2,166) (2,065)
Intangible assets (1,541) (1,249)
Interest income and fair value movement of investments (626) (1,582)
Cash flow hedges - (452)
Contract liabilities (11) -
SEZ Re-investment Reserve (6,614) (6,494)
Others (121) -
(11,765) (13,110)
Net deferred tax assets ` 3,180 ` (2,969)
Amounts presented in consolidated statement of financial position:
Deferred tax assets ` 6,005 ` 1,664
Deferred tax liabilities ` (2,825) ` (4,633)
* Includes deferred tax asset recognized on carry forward losses pertaining to business combinations.
Movement in deferred tax assets and liabilities
Movement during the year ended March 31, 2019
As at April 1, 2018
Credit/ (charge) in the consolidated statement of
income
Credit/ (charge) in other
comprehensive income *
OthersAs at
March 31, 2019
Carry forward losses ` 5,694 ` (2,879) ` 334 ` - ` 3,149
Trade payables, accrued expenses and other liabilities
3,107 295 (22) 333 3,713
Allowances for lifetime expected credit loss 4,499 9 2 11 4,521
Notes to the Consolidated Financial Statements
Consolidated financial statements under IFRS
360

Movement during the year ended March 31, 2019
As at April 1, 2018
Credit/ (charge) in the consolidated statement of
income
Credit/ (charge) in other
comprehensive income *
OthersAs at
March 31, 2019
Minimum alternate tax 74 (74) - - -
Property, plant and equipment (2,166) 219 (94) 201 (1,840)
Amortizable goodwill (1,810) 16 (105) - (1,899)
Intangible assets (3,190) 1,076 (181) - (2,295)
Interest income and fair value movement of investments
(1,712) 186 71 - (1,455)
Cash flow hedges 29 - (633) - (604)
Contract liabilities (273) (1) (15) - (289)
SEZ Re-investment Reserve - (1,132) - - (1,132)
Others (403) 693 27 1 318
Total ` 3,849 ` (1,592) ` (616) ` 546 ` 2,187
Movement during the year ended March 31, 2020
As at April 1, 2019
Credit/ (charge) in the consolidated statement of
income
Credit/ (charge) in other
comprehensive income *
On account of business combination
As at March 31,
2020
Carry forward losses ` 3,149 ` (1,287) ` 182 ` - ` 2,044
Trade payables, accrued expenses and other liabilities
3,713 1,033 248 - 4,994
Allowances for lifetime expected credit loss
4,521 (591) (9) - 3,921
Minimum alternate tax - 3,425 - - 3,425
Property, plant and equipment (1,840) 1,150 4 - (686)
Amortizable goodwill (1,899) (92) (175) - (2,166)
Intangible assets (2,295) 1,021 (90) (177) (1,541)
Interest income and fair value movement of investments
(1,455) 599 230 - (626)
Cash flow hedges (604) - 1,165 - 561
Contract liabilities (289) 285 (7) - (11)
SEZ Re-investment Reserve (1,132) (5,482) - - (6,614)
Others 318 (536) 97 - (121)
Total ` 2,187 ` (475) ` 1,645 ` (177) ` 3,180
Movement during the year ended March 31, 2021
As at April 1, 2020
Credit/ (charge) in the consolidated statement of
income
Credit/ (charge) in other
comprehensive income *
OthersAs at
March 31, 2021
Carry forward losses ` 2,044 ` (230) ` (22) ` (155) ` 1,637
Trade payables, accrued expenses and other liabilities
4,994 279 (171) 13 5,115
Allowances for lifetime expected credit loss 3,921 (734) 21 - 3,208
Minimum alternate tax 3,425 (3,425) - - -
Property, plant and equipment (686) (649) 66 1 (1,268)
Amortizable goodwill (2,166) 34 67 - (2,065)
Intangible assets (1,541) 759 (55) (412) (1,249)
Notes to the Consolidated Financial Statements
Consolidated financial statements under IFRSIntegrated Annual Report 2020-21
Wipro Limited
361
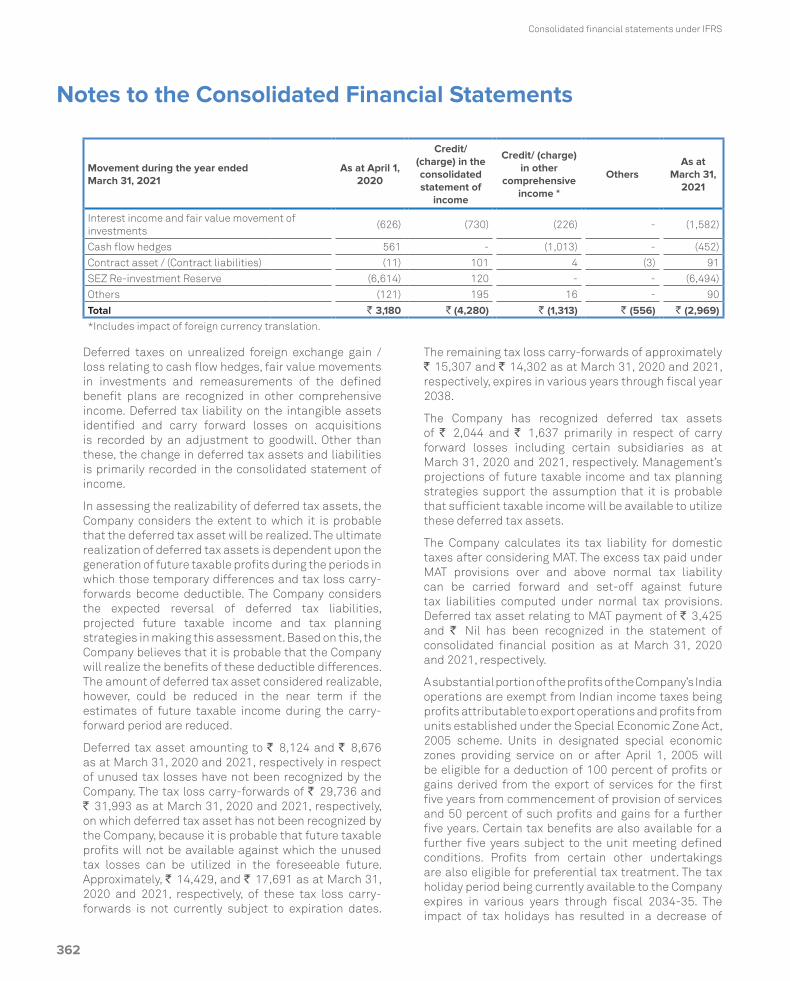
Movement during the year ended March 31, 2021
As at April 1, 2020
Credit/ (charge) in the consolidated statement of
income
Credit/ (charge) in other
comprehensive income *
OthersAs at
March 31, 2021
Interest income and fair value movement of investments
(626) (730) (226) - (1,582)
Cash flow hedges 561 - (1,013) - (452)
Contract asset / (Contract liabilities) (11) 101 4 (3) 91
SEZ Re-investment Reserve (6,614) 120 - - (6,494)
Others (121) 195 16 - 90
Total ` 3,180 ` (4,280) ` (1,313) ` (556) ` (2,969)*Includes impact of foreign currency translation.
Deferred taxes on unrealized foreign exchange gain / loss relating to cash flow hedges, fair value movements in investments and remeasurements of the defined benefit plans are recognized in other comprehensive income. Deferred tax liability on the intangible assets identified and carry forward losses on acquisitions is recorded by an adjustment to goodwill. Other than these, the change in deferred tax assets and liabilities is primarily recorded in the consolidated statement of income.
In assessing the realizability of deferred tax assets, the Company considers the extent to which it is probable that the deferred tax asset will be realized. The ultimate realization of deferred tax assets is dependent upon the generation of future taxable profits during the periods in which those temporary differences and tax loss carry-forwards become deductible. The Company considers the expected reversal of deferred tax liabilities, projected future taxable income and tax planning strategies in making this assessment. Based on this, the Company believes that it is probable that the Company will realize the benefits of these deductible differences. The amount of deferred tax asset considered realizable, however, could be reduced in the near term if the estimates of future taxable income during the carry-forward period are reduced.
Deferred tax asset amounting to ` 8,124 and ` 8,676 as at March 31, 2020 and 2021, respectively in respect of unused tax losses have not been recognized by the Company. The tax loss carry-forwards of ` 29,736 and ` 31,993 as at March 31, 2020 and 2021, respectively, on which deferred tax asset has not been recognized by the Company, because it is probable that future taxable profits will not be available against which the unused tax losses can be utilized in the foreseeable future. Approximately, ` 14,429, and ` 17,691 as at March 31, 2020 and 2021, respectively, of these tax loss carry-forwards is not currently subject to expiration dates.
The remaining tax loss carry-forwards of approximately ` 15,307 and ` 14,302 as at March 31, 2020 and 2021, respectively, expires in various years through fiscal year 2038.
The Company has recognized deferred tax assets of ` 2,044 and ` 1,637 primarily in respect of carry forward losses including certain subsidiaries as at March 31, 2020 and 2021, respectively. Management’s projections of future taxable income and tax planning strategies support the assumption that it is probable that sufficient taxable income will be available to utilize these deferred tax assets.
The Company calculates its tax liability for domestic taxes after considering MAT. The excess tax paid under MAT provisions over and above normal tax liability can be carried forward and set-off against future tax liabilities computed under normal tax provisions. Deferred tax asset relating to MAT payment of ` 3,425 and ` Nil has been recognized in the statement of consolidated financial position as at March 31, 2020 and 2021, respectively.
A substantial portion of the profits of the Company’s India operations are exempt from Indian income taxes being profits attributable to export operations and profits from units established under the Special Economic Zone Act, 2005 scheme. Units in designated special economic zones providing service on or after April 1, 2005 will be eligible for a deduction of 100 percent of profits or gains derived from the export of services for the first five years from commencement of provision of services and 50 percent of such profits and gains for a further five years. Certain tax benefits are also available for a further five years subject to the unit meeting defined conditions. Profits from certain other undertakings are also eligible for preferential tax treatment. The tax holiday period being currently available to the Company expires in various years through fiscal 2034-35. The impact of tax holidays has resulted in a decrease of
Notes to the Consolidated Financial Statements
Consolidated financial statements under IFRS
362
current tax expense of ` 15,390, ` 11,963 and ` 11,458 for the years ended March 31, 2019, 2020 and 2021, respectively, compared to the effective tax amounts that we estimate the Company would have been required to pay if these incentives had not been available. The per share effect of these tax incentives for the years ended March 31, 2019, 2020 and 2021 was ` 2.56, ` 2.05, and ` 2.03, respectively.
Deferred income tax liabilities are recognized for all taxable temporary differences except in respect of taxable temporary differences associated with investments in subsidiaries where the timing of the reversal of the temporary difference can be controlled and it is probable that the temporary difference will not reverse in the foreseeable future. Accordingly, deferred income tax liabilities on cumulative earnings of subsidiaries amounting to `56,391 and `59,793 as at March 31, 2020 and 2021, respectively and branch profit tax @ 15% of the US branch profit have not been recognized. Further, it is not practicable to estimate the amount of the unrecognized deferred tax liabilities for these undistributed earnings.
22. Dividends, Bonus and Buyback of equity shares
The Company declares and pays dividends in Indian rupees. According to the Companies Act, 2013 any dividend should be declared out of accumulated distributable profits. A Company may, before the declaration of any dividend, transfer a percentage of its profits for that financial year as it may consider appropriate to the reserves.
The cash dividends paid per equity share were ` 1, ` 1 and ` 1, during the years ended March 31, 2019, 2020 and 2021, respectively, including an interim dividend of ` 1, ` 1 and ` 1 for the year ended March 31, 2019, 2020 and 2021, respectively.
During the year ended March 31, 2019, the bonus issue in the proportion of 1:3 i.e.1 (One) bonus equity share of `2 each for every 3 (three) fully paid-up equity shares held (including ADS holders) was approved by the shareholders of the Company on February 22, 2019, through Postal Ballot /e-voting. Subsequently, on March 8, 2019, the Company allotted 1,508,469,180 equity shares to shareholders who held equity shares as on the record date of March 7, 2019 and ` 3,016 (representing
par value of ` 2 per share) was transferred from capital redemption reserve, share premium and retained earnings to the share capital.
During the year ended March 31, 2020, the Company concluded the buyback of 323,076,923 equity shares as approved by the Board of Directors on April 16, 2019. This has resulted in a total cash outflow of ` 105,000. In line with the requirement of the Companies Act, 2013, an amount of ` 105,000 has been utilized from retained earnings. Further, capital redemption reserve (included in other reserves) of ` 646 (representing the nominal value of the shares bought back) has been created as an apportionment from retained earnings. Consequent to such buyback, the paid-up equity share capital has reduced by ` 646.
During the year ended March 31, 2021, the Company concluded the buyback of 237,500,000 equity shares as approved by the Board of Directors on October 13, 2020. This has resulted in a total cash outflow of ` 116,445 (including tax on buyback of ` 21,445). In line with the requirement of the Companies Act, 2013, an amount of ` 1,427 and `115,018 has been utilized from share premium and retained earnings respectively. Further, capital redemption reserve (included in other reserves) of ` 475 (representing the nominal value of the shares bought back) has been created as an apportionment from retained earnings. Consequent to such buyback, the paid-up equity share capital has reduced by ` 475.
23. Additional capital disclosures
The key objective of the Company’s capital management is to ensure that it maintains a stable capital structure with the focus on total equity to uphold investor, creditor, and customer confidence and to ensure future development of its business. The Company’s focus is to keep strong total equity base to ensure independence, security, as well as a high financial flexibility for potential future borrowings, if required without impacting the risk profile of the Company.
The Company’s goal is to continue to be able to return excess liquidity to shareholders by continuing to distribute annual dividends in future periods. The amount of future dividends/ buyback of equity shares will be balanced with efforts to continue to maintain an adequate liquidity status.
Notes to the Consolidated Financial Statements
Consolidated financial statements under IFRSIntegrated Annual Report 2020-21
Wipro Limited
363

The capital structure as at March 31, 2020 and 2021 was as follows:
As at March 31,
2020 2021 % ChangeEquity attributable to the equity shareholders of the Company ` 557,458 ` 553,095 -0.78%
As percentage of total capital 85% 84%
Current loans, borrowings and bank overdrafts 73,202 75,874
Non-current long-term loans and borrowings 4,840 7,458
Lease liabilities 19,198 21,182
Total loans, borrowings and bank overdrafts and lease liabilities ` 97,240 ` 104,514 7.48%
As percentage of total capital 15% 16%
Total capital ` 654,698 ` 657,609 0.44%
Loans and borrowings represent 15% and 16% of total capital as at March 31, 2020 and 2021, respectively. The Company is not subjected to any externally imposed capital requirements.
24. Revenue
A. Contract Assets and Liabilities
The Company classifies its right to consideration in exchange for deliverables as either a receivable or a contract asset.
A receivable is a right to consideration that is unconditional. A right to consideration is unconditional if only the passage of time is required before payment of that consideration is due. For example, the Company recognizes a receivable for revenues related to time and materials contracts or volume based contracts. The Company presents such receivables as part of unbilled receivables at their net estimated realizable value. The same is tested for impairment as per the guidance in IFRS 9 using expected credit loss method.
Contract liabilities: During the year ended March 31, 2020 and March 31, 2021, the Company recognized revenue of ` 21,193 and ` 16,082 arising from contract liabilities as at March 31, 2019 and March 31, 2020 respectively.
Contract assets: During the year ended March 31, 2020 and March 31, 2021, ` 13,068 and ` 15,101 of contract assets pertaining to fixed-price development contracts have been reclassified to receivables on completion of milestones.
Contract assets and liabilities are reported in a net position on a contract-by-contract basis at the end of each reporting period.
B. Remaining Performance Obligations
Revenue allocated to remaining performance obligations represents contracted revenue that has not yet been recognized, which includes contract liabilities and amounts that will be invoiced and recognized as revenue in future periods. Applying the practical expedient, the Company has not disclosed its right to consideration from customers in an amount that corresponds directly with the value to the customer of the Company’s performance completed to date, which are contracts invoiced on time and material basis and volume based.
As at March 31, 2019, 2020 and 2021, the aggregate amount of transaction price allocated to remaining performance obligations, other than those meeting the exclusion criteria above, were 373,879, 360,033 and 384,881, respectively of which approximately 59%, 62% and 59% respectively is expected to be recognized as revenues within two years, and the remainder thereafter. This includes contracts with asubstantive enforceable termination penalty if the contract is terminated without cause by the customer, based on an overall assessment of the contract carried out at the time of inception. Historically, customers have not terminated contracts without cause.
C. Disaggregation of Revenue
The tables below present disaggregated revenue from contracts with customers by business segment (refer to Note 34 “Segment Information”), sector and contract-type. The Company believes that the below disaggregation best depicts the nature, amount, timing and uncertainty of revenue and cash flows from economic factors.
Notes to the Consolidated Financial Statements
Consolidated financial statements under IFRS
364

Information on disaggregation of revenues for the year ended March 31, 2019 is as follows:
IT Services IT Products ISRE Total
Americas 1 Americas 2 Europe APMEA Total
A. RevenueRendering of services ` 163,562 ` 167,192 ` 156,172 ` 76,507 ` 563,433 ` - ` 7,932 ` 571,365 Sale of products - - - - - 14,480 - 14,480
` 163,562 ` 167,192 ` 156,172 ` 76,507 ` 563,433 ` 14,480 ` 7,932 ` 585,845
B. Revenue by sectorBanking, Financial Services and Insurance
` 1,874 ` 98,130 ` 55,180 ` 18,332 ` 173,516
Health 60,162 88 9,968 3,786 74,004
Consumer 59,991 1,686 15,878 11,244 88,799
Communications 6,995 612 7,619 17,272 32,498
Energy, Natural Resources and Utilities
601 24,234 28,521 18,996 72,352
Manufacturing 387 21,980 19,869 3,920 46,156
Technology 33,552 20,462 19,137 2,957 76,108
` 163,562 ` 167,192 ` 156,172 ` 76,507 ` 563,433 ` 14,480 ` 7,932 ` 585,845
C. Revenue by nature of contractFixed price and volume based
` 94,787 ` 98,496 ` 100,023 ` 50,600 ` 343,906 ` - ` 6,142 ` 350,048
Time and materials 68,775 68,696 56,149 25,907 219,527 - 1,790 221,317 Products - - - - - 14,480 - 14,480
` 163,562 ` 167,192 ` 156,172 ` 76,507 ` 563,433 ` 14,480 ` 7,932 ` 585,845
Information on disaggregation of revenues for the year ended March 31, 2020 is as follows:
IT Services IT Products ISRE Total
Americas 1 Americas 2 Europe APMEA Total
A. Revenue
Rendering of services ` 175,318 ` 180,404 ` 156,598 ` 78,280 ` 590,600 ` - ` 7,950 ` 598,550
Sale of products - - - - - 11,682 - 11,682
` 175,318 ` 180,404 ` 156,598 ` 78,280 ` 590,600 ` 11,682 ` 7,950 ` 610,232
B. Revenue by sectorBanking, Financial Services and Insurance
` 2,151 ` 106,694 ` 53,869 ` 20,659 ` 183,373
Health 63,435 105 10,090 4,167 77,797
Consumer 67,980 2,054 16,030 10,448 96,512
Communications 8,061 1,048 7,753 16,794 33,656
Energy, Natural Resources and Utilities
418 26,024 29,854 19,661 75,957
Manufacturing 349 23,548 20,324 3,639 47,860
Technology 32,924 20,931 18,678 2,912 75,445
` 175,318 ` 180,404 ` 156,598 ` 78,280 ` 590,600 ` 11,682 ` 7,950 ` 610,232
C. Revenue by nature of contract
Fixed price and volume based ` 96,876 ` 108,665 ` 104,165 ` 53,220 ` 362,926 ` - ` 6,404 ` 369,330
Time and materials 78,442 71,739 52,433 25,060 227,674 - 1,546 229,220
Products - - - - - 11,682 - 11,682
` 175,318 ` 180,404 ` 156,598 ` 78,280 ` 590,600 ` 11,682 ` 7,950 ` 610,232
Notes to the Consolidated Financial Statements
Consolidated financial statements under IFRSIntegrated Annual Report 2020-21
Wipro Limited
365
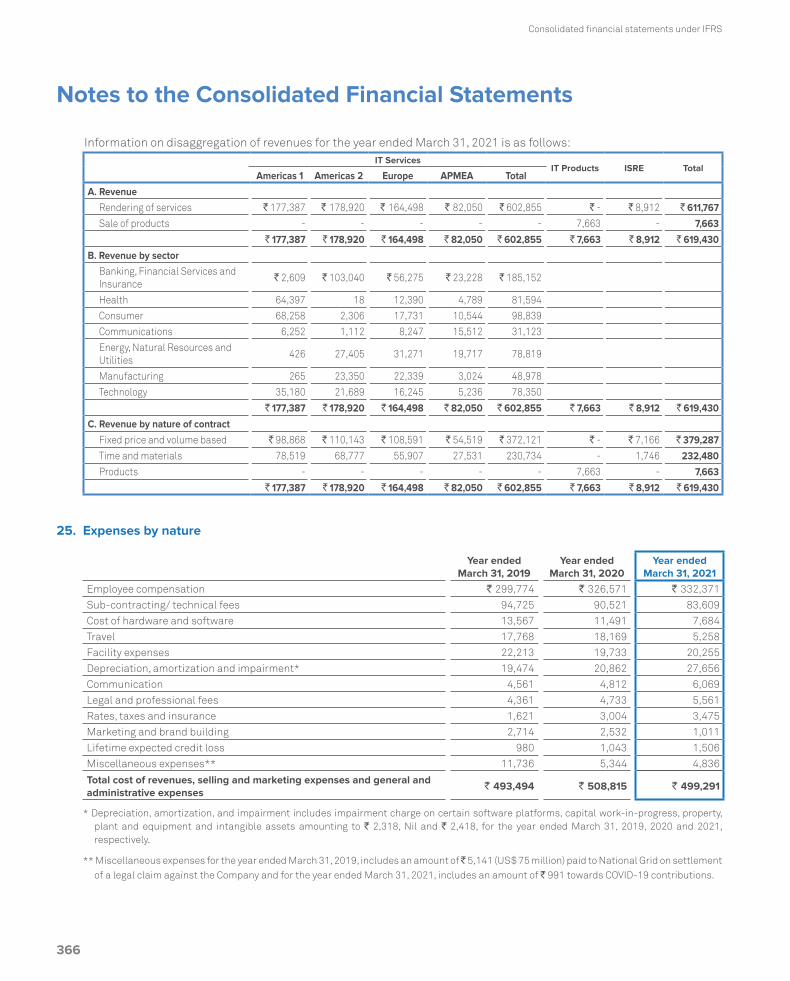
Information on disaggregation of revenues for the year ended March 31, 2021 is as follows:IT Services
IT Products ISRE TotalAmericas 1 Americas 2 Europe APMEA Total
A. Revenue
Rendering of services ` 177,387 ` 178,920 ` 164,498 ` 82,050 ` 602,855 ` - ` 8,912 ` 611,767
Sale of products - - - - - 7,663 - 7,663
` 177,387 ` 178,920 ` 164,498 ` 82,050 ` 602,855 ` 7,663 ` 8,912 ` 619,430
B. Revenue by sectorBanking, Financial Services and Insurance
` 2,609 ` 103,040 ` 56,275 ` 23,228 ` 185,152
Health 64,397 18 12,390 4,789 81,594
Consumer 68,258 2,306 17,731 10,544 98,839
Communications 6,252 1,112 8,247 15,512 31,123
Energy, Natural Resources and Utilities
426 27,405 31,271 19,717 78,819
Manufacturing 265 23,350 22,339 3,024 48,978
Technology 35,180 21,689 16,245 5,236 78,350
` 177,387 ` 178,920 ` 164,498 ` 82,050 ` 602,855 ` 7,663 ` 8,912 ` 619,430
C. Revenue by nature of contract
Fixed price and volume based ` 98,868 ` 110,143 ` 108,591 ` 54,519 ` 372,121 ` - ` 7,166 ` 379,287
Time and materials 78,519 68,777 55,907 27,531 230,734 - 1,746 232,480 Products - - - - - 7,663 - 7,663
` 177,387 ` 178,920 ` 164,498 ` 82,050 ` 602,855 ` 7,663 ` 8,912 ` 619,430
25. Expenses by nature
Year ended March 31, 2019
Year ended March 31, 2020
Year ended March 31, 2021
Employee compensation ` 299,774 ` 326,571 ` 332,371
Sub-contracting/ technical fees 94,725 90,521 83,609
Cost of hardware and software 13,567 11,491 7,684
Travel 17,768 18,169 5,258
Facility expenses 22,213 19,733 20,255
Depreciation, amortization and impairment* 19,474 20,862 27,656
Communication 4,561 4,812 6,069
Legal and professional fees 4,361 4,733 5,561
Rates, taxes and insurance 1,621 3,004 3,475
Marketing and brand building 2,714 2,532 1,011
Lifetime expected credit loss 980 1,043 1,506
Miscellaneous expenses** 11,736 5,344 4,836
Total cost of revenues, selling and marketing expenses and general and administrative expenses
` 493,494 ` 508,815 ` 499,291
* Depreciation, amortization, and impairment includes impairment charge on certain software platforms, capital work-in-progress, property, plant and equipment and intangible assets amounting to ` 2,318, Nil and ` 2,418, for the year ended March 31, 2019, 2020 and 2021, respectively.
** Miscellaneous expenses for the year ended March 31, 2019, includes an amount of 5,141 (US$ 75 million) paid to National Grid on settlement of a legal claim against the Company and for the year ended March 31, 2021, includes an amount of ` 991 towards COVID-19 contributions.
Notes to the Consolidated Financial Statements
Consolidated financial statements under IFRS
366

26. Other operating income/(loss), net Year ended March 31,2019
Sale of hosted data center services business: During the year ended March 31, 2019, the Company concluded the divestment of its hosted data center services business.
The calculation of the gain on sale is shown below:
Particulars Total
Cash consideration (net of disposal costs of ` 660) ` 25,432
Less: Carrying amount of net assets disposed (including goodwill of ` 13,009) (26,455)
Add: Reclassification of exchange difference on foreign currency translation 4,131
Gain on sale ` 3,108
In accordance with the sale agreement, total cash consideration was ` 28,124 and the Company paid ` 3,766 to sub-scribe for units issued by the buyer. Units amounting to ` 2,032 are callable by the buyer if certain business targets committed by the Company are not met over a period of three years. The fair value of these callable units is estimated to be insignificant as at reporting date. Consequently, the sale consideration comprises cash consideration of `24,358 and units issued by the buyer amounting to ` 1,734.
Loss of control in subsidiary: During the year ended March 31, 2019, the Company has reduced its equity holding from 74% to 11% in Wipro Airport IT Services Limited. The loss/ gain on this transaction is insignificant.
Sale of Workday business and Cornerstone OnDemand business: During the year ended March 31, 2019, the Company has concluded the Sale of Workday business and Cornerstone OnDemand business except in Portugal, France and Sweden.
The calculation of the gain is as shown below:
Particulars Total
Cash consideration ` 6,645
Less: Carrying amount of net assets disposed (includes goodwill of ` 4,893 and intangible assets of ` 740) (5,475)
Add: Reclassification of exchange difference on foreign currency translation 79
Gain on sale `1,249
Assets pertaining to Portugal, France, and Sweden were concluded during the year ended March 31, 2020.
These disposal groups do not constitute a major component of the Company and hence were not classified as discontinued operations.
Year ended March 31, 2020
During the year ended March 31, 2020, the Company concluded the sale of assets pertaining to Workday business and Cornerstone OnDemand business in Portugal, France, and Sweden. A gain of ` 152 arising from such transaction was recognized under other operating income/(loss), net.
The Company has partially met the first year and second year business targets pertaining to the sale of its hosted data center business concluded during the year ended March 31, 2019. Change in fair value of the callable units pertaining to achievement of the business targets amounting to ` 992 for the year ended March 31, 2020, was recognized under other operating income/(loss), net.
Year ended March 31, 2021
The Company has partially met the first and second-year business targets pertaining to the sale of its hosted data center business concluded during the year ended March 31, 2019. Change in fair value of the callable units pertaining to achievement of cumulative business targets amounting to ` (81) for the year ended March 31, 2021, was recognized under other operating income/(loss), net.
Notes to the Consolidated Financial Statements
Consolidated financial statements under IFRSIntegrated Annual Report 2020-21
Wipro Limited
367

27. Finance expensesYear ended
March 31, 2019Year ended
March 31, 2020Year ended
March 31, 2021
Interest expense ` 5,616 ` 5,136 ` 4,298
Exchange fluctuation on foreign currency borrowings, net 1,759 2,192 790
` 7,375 ` 7,328 ` 5,088
28. Finance and other income and Foreign exchange gains/(losses), netYear ended
March 31, 2019Year ended
March 31, 2020Year ended
March 31, 2021
Interest income ` 20,261 ` 21,764 ` 18,442
Dividend income 361 367 4
Net gain from investments classified as FVTPL 1,990 1,275 1,478
Net gain from investments classified as FVTOCI 311 675 988
Finance and other income ` 22,923 ` 24,081 ` 20,912
Foreign exchange gains/(losses), net, on financial instruments measured at FVTPL
1,251 2,144 4,383
Other foreign exchange gains/(losses), net 1,964 1,025 (1,388)
Foreign exchange gains/(losses), net ` 3,215 ` 3,169 ` 2,995
` 26,138 ` 27,250 ` 23,907
29. Earnings per equity share A reconciliation of profit for the year and equity shares used in the computation of basic and diluted earnings per equity
share is set out below:
Basic: Basic earnings per share is calculated by dividing the profit attributable to equity shareholders of the Company by the weighted average number of equity shares outstanding during the period, excluding equity shares purchased by the Company and held as treasury shares.
Year ended March 31, 2019
Year ended March 31, 2020
Year ended March 31, 2021
Profit attributable to equity holders of the Company ` 90,031 ` 97,218 ` 107,946
Weighted average number of equity shares outstanding 6,007,376,837 5,833,384,018 5,649,265,885
Basic earnings per share ` 14.99 ` 16.67 ` 19.11
Diluted: Diluted earnings per share is calculated by adjusting the weighted average number of equity shares outstand-ing during the year for assumed conversion of all dilutive potential equity shares. Employee share options are dilutive potential equity shares for the Company.
The calculation is performed in respect of share options to determine the number of shares that could have been ac-quired at fair value (determined as the average market price of the Company’s shares during the year). The number of shares calculated as above is compared with the number of shares that would have been issued assuming the exercise of the share options.
Year ended March 31, 2019
Year ended March 31, 2020
Year ended March 31, 2021
Profit attributable to equity holders of the Company ` 90,031 ` 97,218 ` 107,946
Weighted average number of equity shares outstanding 6,007,376,837 5,833,384,018 5,649,265,885
Effect of dilutive equivalent share options 14,927,530 14,439,221 12,391,937
Weighted average number of equity shares for diluted earnings per share 6,022,304,367 5,847,823,239 5,661,657,822
Diluted earnings per share ` 14.95 ` 16.62 ` 19.07
Notes to the Consolidated Financial Statements
Consolidated financial statements under IFRS
368

30. Employee stock incentive plans
The stock compensation expense recognized for employee services received during the year ended March 31, 2019, 2020 and 2021, were ` 1,938, ` 1,262, and ` 2,897, respectively.
Wipro Equity Reward Trust (“WERT”)
In 1984, the Company established a controlled trust called the Wipro Equity Reward Trust (“WERT”). In the earlier years, WERT purchased shares of the Company out of funds borrowed from the Company. The Company’s Board Governance, Nomination and Compensation Committee recommends to WERT certain officers and key employees, to whom WERT issues shares from its holdings at nominal price subject to vesting conditions. WERT held 27,353,853, 22,746,081 and 19,401,215 treasury shares as at March 31, 2019, 2020 and 2021, respectively.
Wipro Employee Stock Option Plans and Restricted Stock Unit Option Plans
A summary of the general terms of grants under stock option plans and restricted stock unit option plans are as follows:
Name of PlanNumber of options
reserved under the planRange of
exercise price
Wipro ADS Restricted Stock Unit Plan (WARSUP 2004 plan) * 59,797,979 US $ 0.03
Wipro Employee Restricted Stock Unit Plan 2005 (WSRUP 2005 plan) * 59,797,979 ` 2
Wipro Employee Restricted Stock Unit Plan 2007 (WSRUP 2007 plan) * 49,831,651 ` 2
Wipro Equity Reward Trust Employee Stock Purchase Plan, 2013 ** 39,546,197 ` 2
Employees covered under Stock Option Plans and Restricted Stock Unit (“RSU”) Option Plans (collectively “Stock Option Plans”) are granted an option to purchase shares of the Company at the respective exercise prices, subject to requirements of vesting conditions. These options generally vest in tranches over a period of one to four years from the date of grant. Upon vesting, the employees can acquire one equity share for every option.
* The maximum contractual term for these Stock Option Plans and RSU Option Plans is perpetual until the options are available for grant under the plan.
** The maximum contractual term for these Stock Option Plans is up to May 29, 2023 until the options are available for grant under the plan.
The activity in equity-settled stock option plans and restricted stock unit option plan is summarized below:
Numbers of options
Range of exercise price and Weighted average exercise price
Year ended March 31, 2019
Year ended March 31, 2020
Year ended March 31, 2021
Outstanding at the beginning of the year ` 2 13,543,997 17,607,463 15,594,190
US $ 0.03 10,199,054 14,446,790 7,854,540
Bonus on outstanding (Refer to Note 22) ` 2 4,773,755 - -
US $ 0.03 3,957,434 - -
Granted * ` 2 4,607,000 5,662,500 6,275,290
US $ 0.03 4,849,000 5,341,000 5,033,648
Exercised ` 2 (2,739,097) (4,610,572) (3,356,199)
US $ 0.03 (1,541,803) (2,496,125) (3,269,832)
Modification ** ` 2 - - -
US $ 0.03 - (5,681,966) 3,453,015
Notes to the Consolidated Financial Statements
Consolidated financial statements under IFRSIntegrated Annual Report 2020-21
Wipro Limited
369

Numbers of options
Range of exercise price and Weighted average exercise price
Year ended March 31, 2019
Year ended March 31, 2020
Year ended March 31, 2021
Forfeited and expired ` 2 (2,578,192) (3,065,201) (2,681,333)
US $ 0.03 (3,016,895) (3,755,159) (2,248,895)
Outstanding at the end of the year ` 2 17,607,463 15,594,190 15,831,948
US $ 0.03 14,446,790 7,854,540 10,822,476
Exercisable at the end of the year ` 2 1,300,781 1,502,957 2,679,538
US $ 0.03 948,877 1,212,560 465,603
* Includes 1,567,000, 2,461,500 and 2,969,860 Performance based stock options (RSU) during the year ended March 31, 2019, 2020 and 2021, respectively. 1,673,000, 2,524,600 and 2,376,980 Performance based stock options (ADS) during the year ended March 31, 2019, 2020 and 2021, respectively. Performance based stock options(RSU) were issued under Wipro Employee Restricted Stock Unit plan 2007 (WSRUP 2007 plan) and Performance based stock options (ADS) were issued under Wipro ADS Restricted Stock Unit Plan (WARSUP 2004 plan).
The activity in cash-settled stock option plans and restricted stock unit option plan is summarized below:Number of options
Year ended March 31, 2020
Year ended March 31, 2021
Outstanding at the beginning of the year - 4,721,388
Modification ** 5,681,966 (3,453,015)
Exercised (429,909) (845,066)
Forfeited and lapsed (530,669) (345,108)
Outstanding at the end of the year 4,721,388 78,199
Exercisable at the end of the year 63,999 23,999
The carrying value of liability towards Cash Settled ADS RSU’s outstanding was ` 496 (including `15 towards exercisable units) and ` 31 (including ` 11 towards exercisable units) as at March 31, 2020 and 2021, respectively.
** Restricted Stock Units arrangements that were modified during the year ended March 31, 2020
Pursuant to the Securities Exchange Board of India (“SEBI”) circular dated October 10, 2019, prohibiting issuance of depository receipts by listed companies to Non-Resident Indians (“NRIs”), the Board Governance, Nomination and Compensation Committee approved in November 2019, cash pay out to its NRI employees in lieu of shares and upon exercise of vested ADS RSU under the Company’s WARSUP 2004 Plan, based on prevailing market price of ADS on the date of exercise. This change was accounted as a modification and the fair value on the date of modification of ` 561 has been recognized as financial liability with a corresponding adjustment to equity.
** Restricted Stock Units arrangements that were modified during the year ended March 31, 2021
Pursuant to the SEBI clarification dated December 18, 2020, the restriction under SEBI circular dated October 10, 2019, “Framework of Depository Receipts” shall not apply in case of issue of Depository Receipts to NRIs, pursuant to share based employee benefit schemes which are implemented by a company in terms of SEBI (Share Based Employee Benefits) Regulations 2014, the Board Governance, Nomination and Compensation Committee approved in January 2021, allotment of underlying equity shares in respect of ADSs to be issued and allocated to NRI employees upon exercise of vested ADS RSU under the Company’s WARSUP 2004 Plan. This change was accounted as a modification and the fair value on the date of modification was determined based on prevailing market price and accordingly an amount of ` 739 has been recognized as equity with a corresponding adjustment to financial liability.
Notes to the Consolidated Financial Statements
Consolidated financial statements under IFRS
370

The following table summarizes information about outstanding stock options and restricted stock unit option plan:Year ended
March 31, 2019Year ended
March 31, 2020Year ended
March 31, 2021
Range of exercise price and
Weighted averageexercise price
Number of options
Weighted Average
Remaining life (months)
Number of options
Weighted Average
Remaining life (months)
Number of options
Weighted Average
Remaining life (months)
` 2 17,607,463 24 15,594,190 23 15,831,948 18
US $ 0.03 14,446,790 26 7,854,540 23 10,822,476 19
The weighted average grant date fair value of options granted during the year ended March 31, 2019, 2020 and 2021 was ` 349.81, ` 260.65, and ` 354.78 for each option, respectively. The weighted average share price of options exercised during the year ended March 31, 2019, 2020 and 2021 was ` 325.85, ` 267.04, and ` 354.45 for each option, respectively.
31. Employee benefits
a) Employee costs includesYear ended
March 31, 2019Year ended
March 31, 2020Year ended
March 31, 2021Salaries and bonus ` 289,005 ` 315,036 ` 318,043
Employee benefits plans
Gratuity and other defined benefit plans 1,459 1,845 2,085
Defined contribution plans 7,372 8,428 9,346
Share-based compensation* 1,938 1,262 2,897
` 299,774 ` 326,571 ` 332,371* Includes ` 587 for the year ended March 31, 2021, towards cash settled ADS RSUs.
The employee benefit cost is recognized in the following line items in the consolidated statement of income:
Year ended March 31, 2019
Year ended March 31, 2020
Year ended March 31, 2021
Cost of revenues ` 251,818 ` 279,356 ` 282,983
Selling and marketing expenses 30,972 30,763 31,236
General and administrative expenses 16,984 16,452 18,152
` 299,774 ` 326,571 ` 332,371
Defined benefit plan actuarial (gains)/losses recognized in other comprehensive income include:
Year ended March 31, 2019
Year ended March 31, 2020
Year ended March 31, 2021
Re-measurement of net defined benefit liability/(asset)
Return on plan assets excluding interest income - loss/(gain) ` (49) ` 76 ` (578)
Actuarial loss/(gain) arising from financial assumptions 73 749 423
Actuarial loss/(gain) arising from demographic assumptions (40) 227 155
Actuarial loss/(gain) arising from experience adjustments (266) 194 (334)
` (282) ` 1,246 ` (334)
Notes to the Consolidated Financial Statements
Consolidated financial statements under IFRSIntegrated Annual Report 2020-21
Wipro Limited
371

b) Defined benefit plans
Defined benefit plans include gratuity for employees drawing salary in Indian rupees and certain benefit plans in foreign jurisdictions. Amount recognized in the consolidated statement of income in respect of defined benefit plans is as follows:
Year ended March 31, 2019
Year ended March 31, 2020
Year ended March 31, 2021
Current service cost ` 1,434 ` 1,782 ` 2,085
Net interest on net defined benefit liability/(asset) 25 63 131
Net charge to statement of income ` 1,459 ` 1,845 ` 2,216Actual return on plan assets ` 607 ` 513 ` 1,127
Change in present value of defined benefit obligation is summarized below:
As at March 31, 2020
As at March 31, 2021
Defined benefit obligation at the beginning of the year ` 10,485 ` 13,465
Acquisitions 229 7
Current service cost 1,782 2,085
Interest on obligation 652 681
Benefits paid (1,123) (1,069)
Remeasurement loss/(gain)
Actuarial loss/(gain) arising from financial assumptions 749 423
Actuarial loss/(gain) arising from demographic assumptions 227 155
Actuarial loss/(gain) arising from experience adjustments 194 (334)
Translation adjustment 270 62
Defined benefit obligation at the end of the year ` 13,465 ` 15,475
Change in plan assets is summarized below:
As at March 31, 2020
As at March 31, 2021
Fair value of plan assets at the beginning of the year ` 9,443 ` 10,535
Acquisitions 58 -
Expected return on plan assets 589 550
Employer contributions 383 1,993
Benefits paid (95) (76)
Remeasurement (loss)/gain
Return on plan assets excluding interest income - (loss)/gain (76) 578
Translation adjustment 233 57
Fair value of plan assets at the end of the year ` 10,535 ` 13,637Present value of unfunded obligation ` (2,930) ` (1,838)
Recognized asset/(liability) ` (2,930) ` (1,838)
As at March 31, 2020 and 2021, plan assets were primarily invested in insurer managed funds.
The Company has established an income tax approved irrevocable trust fund to which it regularly contributes to finance the liabilities of the gratuity plan. The fund’s investments are managed by certain insurance companies as per the selec-tion made by the trustees among the fund plan available.
Notes to the Consolidated Financial Statements
Consolidated financial statements under IFRS
372

The principal assumptions used for the purpose of actuarial valuation of these defined benefit plans are as follows:
As at March 31, 2020
As at March 31, 2021
Discount rate 5.05% 4.69%
Expected return on plan assets 5.05% 4.69%
Expected rate of salary increase 6.60% 6.57%
Duration of defined benefit obligations 9 years 9 years
The expected return on plan assets is based on expectation of the average long-term rate of return expected on invest-ments of the fund during the estimated term of the obligations.
The discount rate is primarily based on the prevailing market yields of government securities for the estimated term of the obligations. The estimates of future salary increase considered takes into account the inflation, seniority, promotion and other relevant factors. Attrition rate considered is the management’s estimate, based on previous years’ employee turnover of the Company.
The expected future contribution and estimated future benefit payments from the fund are as follows:
Expected contribution to the fund during the year ending March 31, 2022 ` 1,787
Estimated benefit payments from the fund for the year ending March 31:
2022 ` 1,802
2023 1,417
2024 1,406
2025 1,385
2026 1,361
Thereafter 15,915
Total ` 23,286
The expected benefits are based on the same assumptions used to measure the Company’s benefit obligations as at March 31, 2021.
Sensitivity for significant actuarial assumptions is computed to show the movement in defined benefit obligation by 1 percentage.
As of March 31, 2021, every 1 percentage point increase/ (decrease) in discount rate will result in (decrease)/increase of defined benefit obligation by approximately ` (1,508) and ` 1,440 respectively (March 31, 2020: ` (1,252) and ` 1,168 respectively).
As of March 31, 2021, every 1 percentage point increase/ (decrease) in expected rate of salary will result in increase/ (decrease) of defined benefit obligation by approximately ` 864 and ` (798) respectively (March 31, 2020: ` 706 and ` (658) respectively).
c) Provident fund:
The details of fund and plan assets are given below:
As at March 31, 2020
As at March 31, 2021
Fair value of plan assets ` 61,397 ` 71,196
Present value of defined benefit obligation (61,397) (71,196)
Net (shortfall)/ excess ` - ` -
Notes to the Consolidated Financial Statements
Consolidated financial statements under IFRSIntegrated Annual Report 2020-21
Wipro Limited
373

The plan assets have been invested as per the regulations of Employees' Provident Fund Organization (EPFO).
The principal assumptions used in determining the present value obligation of interest guarantee under the determin-istic approach are as follows:
As at March 31, 2020
As at March 31, 2021
Discount rate for the term of the obligation 6.05% 5.80%
Average remaining tenure of investment portfolio 7 years 6 years
Guaranteed rate of return 8.50% 8.50%
32. Related party relationship and transactionsList of subsidiaries and associates as at March 31, 2021, are provided in the table below:
Subsidiaries Subsidiaries SubsidiariesCountry of
IncorporationWipro, LLC USA
Wipro Gallagher Solutions, LLC USA
Wipro Opus Mortgage Solutions LLC (formerly known as Opus Capital Markets Consultants, LLC)
USA
Wipro Promax Analytics Solutions Americas, LLC USA
Wipro Insurance Solutions, LLC
USA
Wipro IT Services, LLC USA
HealthPlan Services, Inc. ** USA
Wipro Appirio, Inc. (formerly known as Appirio, Inc)**
USA
Designit North America, Inc. (formerly known as Cooper Software Inc.)
USA
Infocrossing, LLC USA
Wipro US Foundation USA
International TechneGroup Incorporated ** USA
Wipro Designit Services, Inc. (formerly known as Rational Interaction, Inc) **
USA
Wipro VLSI Design Services, LLC (formerly known as Eximius Design, LLC)
USA
Wipro Overseas IT Services Pvt. Ltd
India
Wipro Japan KK Japan
Wipro Shanghai Limited China
Wipro Trademarks Holding Limited
India
Wipro Travel Services Limited
India
Wipro Holdings (UK) Limited U.K.
Designit A/S Denmark
Designit Denmark A/S Denmark
Designit Germany GmbH Germany
Designit Oslo A/S Norway
Designit Sweden AB Sweden
Designit T.L.V Ltd. Israel
Designit Tokyo Ltd. Japan
Notes to the Consolidated Financial Statements
Consolidated financial statements under IFRS
374

Subsidiaries Subsidiaries SubsidiariesCountry of
IncorporationDesignit Spain Digital, S.L. ** Spain
Wipro Europe Limited U.K.
Wipro UK Limited U.K.
Wipro Financial Services UK Limited
U.K.
Wipro IT Services S.R.L. Romania
Wipro 4C NV (formerly known as 4C NV)
Belgium
Wipro 4C Danmark ApS (formerly known as 4C Danmark ApS)
Denmark
4C Nederland B.V Netherlands
Wipro Weare4C UK Limited (formerly known as Weare4C UK Limited) **
U.K.
Wipro 4C Consulting France SAS (formerly known as 4C Consulting France)
France
Wipro IT Services UK Societas
U.K.
Wipro Doha LLC # Qatar
Wipro Technologies SA DE CV Mexico
Wipro Philippines, Inc. Philippines
Wipro Holdings Hungary Ko-rlátolt Felelősségű Társaság
Hungary
Wipro Holdings Investment Korlátolt Felelősségű Társaság
Hungary
Wipro Information Technology Egypt SAE
Egypt
Wipro Arabia Co. Limited * Saudi Arabia
Women's Business Park Technologies Limited * Saudi Arabia
Wipro Poland SP Z.O.O Poland
Wipro IT Services Poland SP Z.O.O
Poland
Wipro Technologies Australia Pty Ltd
Australia
Wipro Corporate Technologies Ghana Limited
Ghana
Wipro Technologies South Africa (Proprietary) Limited
South Africa
Wipro Technologies Nigeria Limited Nigeria
Wipro IT Service Ukraine, LLC Ukraine
Wipro Information Technology Netherlands BV.
Netherlands
Wipro Portugal S.A. ** Portugal
Wipro Technologies Limited Russia
Wipro Technology Chile SPA Chile
Wipro Solutions Canada Limited Canada
Wipro Information Technology Kazakhstan LLP Kazakhstan
Wipro Technologies W.T. Sociedad Anonima Costa Rica
Notes to the Consolidated Financial Statements
Consolidated financial statements under IFRSIntegrated Annual Report 2020-21
Wipro Limited
375
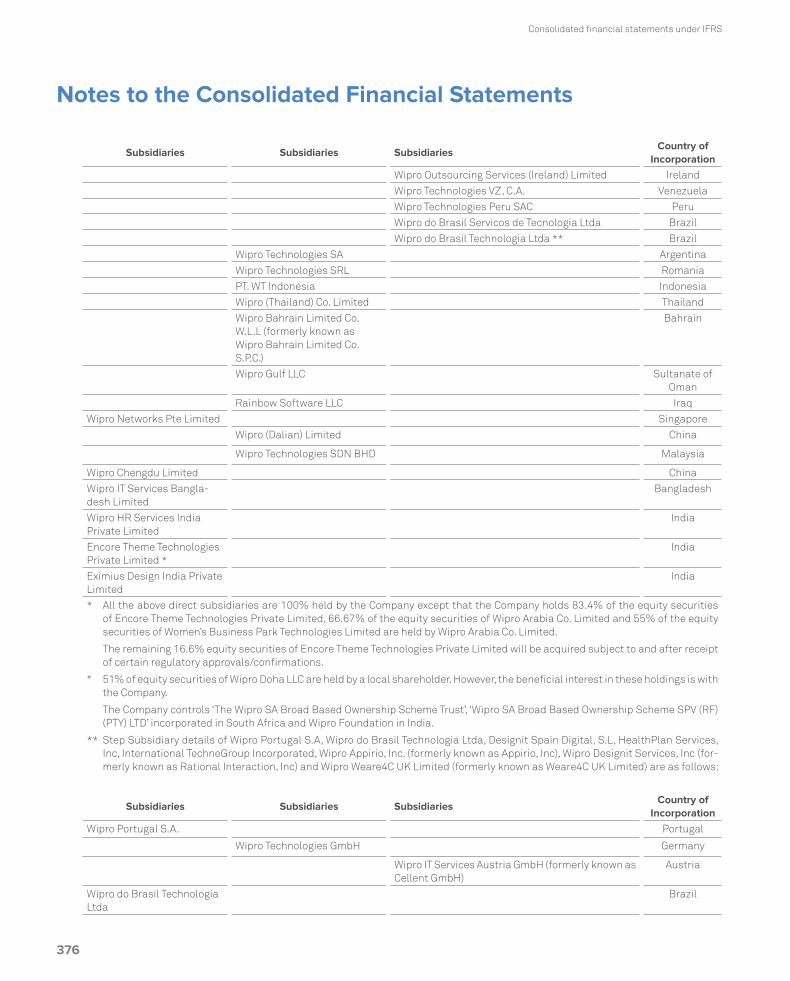
Subsidiaries Subsidiaries SubsidiariesCountry of
IncorporationWipro Outsourcing Services (Ireland) Limited Ireland
Wipro Technologies VZ, C.A. Venezuela
Wipro Technologies Peru SAC Peru
Wipro do Brasil Servicos de Tecnologia Ltda Brazil
Wipro do Brasil Technologia Ltda ** Brazil
Wipro Technologies SA Argentina
Wipro Technologies SRL Romania
PT. WT Indonesia Indonesia
Wipro (Thailand) Co. Limited Thailand
Wipro Bahrain Limited Co. W.L.L (formerly known as Wipro Bahrain Limited Co. S.P.C.)
Bahrain
Wipro Gulf LLC Sultanate of Oman
Rainbow Software LLC Iraq
Wipro Networks Pte Limited Singapore
Wipro (Dalian) Limited China
Wipro Technologies SDN BHD Malaysia
Wipro Chengdu Limited China
Wipro IT Services Bangla-desh Limited
Bangladesh
Wipro HR Services India Private Limited
India
Encore Theme Technologies Private Limited *
India
Eximius Design India Private Limited
India
* All the above direct subsidiaries are 100% held by the Company except that the Company holds 83.4% of the equity securities of Encore Theme Technologies Private Limited, 66.67% of the equity securities of Wipro Arabia Co. Limited and 55% of the equity securities of Women’s Business Park Technologies Limited are held by Wipro Arabia Co. Limited.
The remaining 16.6% equity securities of Encore Theme Technologies Private Limited will be acquired subject to and after receipt of certain regulatory approvals/confirmations.
# 51% of equity securities of Wipro Doha LLC are held by a local shareholder. However, the beneficial interest in these holdings is with the Company.
The Company controls ‘The Wipro SA Broad Based Ownership Scheme Trust’, ‘Wipro SA Broad Based Ownership Scheme SPV (RF) (PTY) LTD’ incorporated in South Africa and Wipro Foundation in India.
** Step Subsidiary details of Wipro Portugal S.A, Wipro do Brasil Technologia Ltda, Designit Spain Digital, S.L, HealthPlan Services, Inc, International TechneGroup Incorporated, Wipro Appirio, Inc. (formerly known as Appirio, Inc), Wipro Designit Services, Inc (for-merly known as Rational Interaction, Inc) and Wipro Weare4C UK Limited (formerly known as Weare4C UK Limited) are as follows:
Subsidiaries Subsidiaries SubsidiariesCountry of
IncorporationWipro Portugal S.A. Portugal
Wipro Technologies GmbH Germany
Wipro IT Services Austria GmbH (formerly known as Cellent GmbH)
Austria
Wipro do Brasil Technologia Ltda
Brazil
Notes to the Consolidated Financial Statements
Consolidated financial statements under IFRS
376

Subsidiaries Subsidiaries SubsidiariesCountry of
IncorporationWipro Do Brasil Sistemetas De Informatica Ltd
Brazil
Wipro do Brasil Servicos Ltda (formerly known as IVIA Serviços De Informática ltda)
Brazil
Designit Spain Digital, S.L. Spain
Designit Colombia S A S Colombia
Designit Peru SAC Peru
HealthPlan Services, Inc. USA
HealthPlan Services Insurance Agency, LLC
USA
International TechneGroup Incorporated
USA
International TechneGroup Ltd.
U.K.
ITI Proficiency Ltd Israel
International TechneGroup S.R.L.
Italy
MechWorks S.R.L. Italy
Wipro Appirio, Inc. (formerly known as Appirio, Inc)
USA
Appirio, K.K Japan
Topcoder, LLC. USA
Wipro Appirio (Ireland) Limited (formerly known as Appirio Ltd)
Ireland
Wipro Appirio UK Limited (formerly known as Appirio Ltd (UK))
U.K.
Wipro Designit Services, Inc (formerly known as Rational Interaction, Inc)
USA
Rational Consulting Australia Pty Ltd
Australia
Wipro Designit Services Limited (formerly known as Rational Interaction Limited)
Ireland
Wipro Weare4C UK Limited (formerly known as Weare4C UK Limited)
U.K.
CloudSocius DMCC UAE
As at March 31, 2021 the Company held 43.7% interest in Drivestream Inc, 33% interest in Denim Group Limited and 33.3% in Denim Group Management, LLC, accounted for using the equity method.
Notes to the Consolidated Financial Statements
Consolidated financial statements under IFRSIntegrated Annual Report 2020-21
Wipro Limited
377
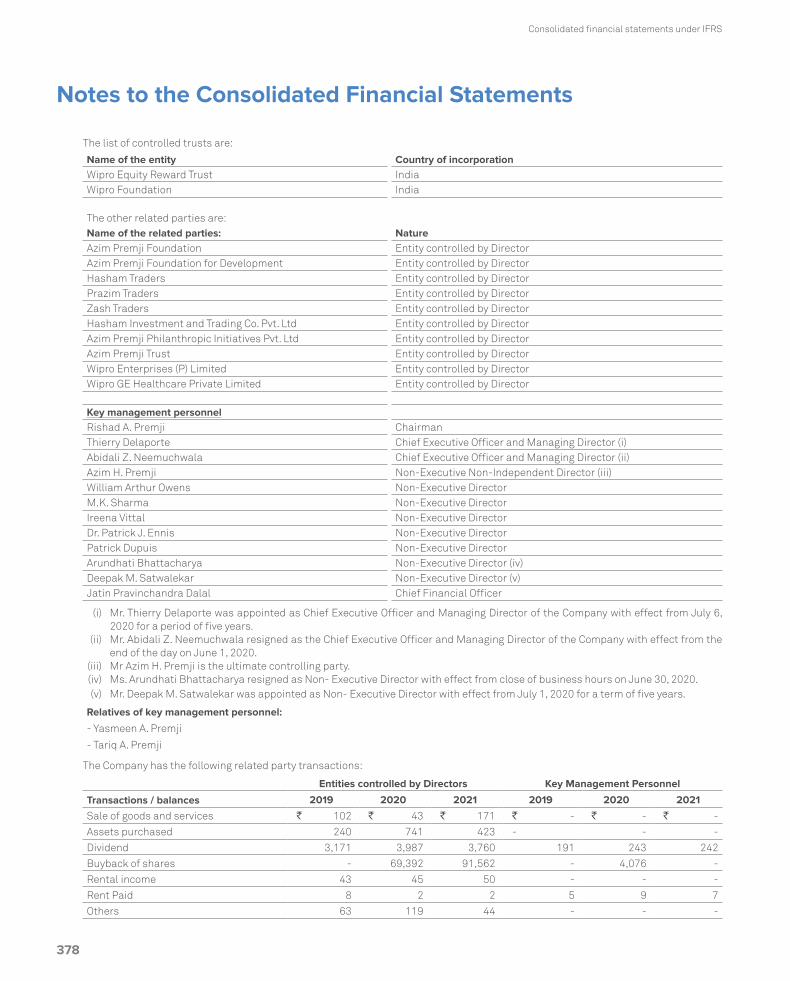
The list of controlled trusts are:
Name of the entity Country of incorporationWipro Equity Reward Trust IndiaWipro Foundation India
The other related parties are:Name of the related parties: NatureAzim Premji Foundation Entity controlled by DirectorAzim Premji Foundation for Development Entity controlled by DirectorHasham Traders Entity controlled by DirectorPrazim Traders Entity controlled by DirectorZash Traders Entity controlled by DirectorHasham Investment and Trading Co. Pvt. Ltd Entity controlled by DirectorAzim Premji Philanthropic Initiatives Pvt. Ltd Entity controlled by DirectorAzim Premji Trust Entity controlled by DirectorWipro Enterprises (P) Limited Entity controlled by DirectorWipro GE Healthcare Private Limited Entity controlled by Director
Key management personnelRishad A. Premji ChairmanThierry Delaporte Chief Executive Officer and Managing Director (i)Abidali Z. Neemuchwala Chief Executive Officer and Managing Director (ii)Azim H. Premji Non-Executive Non-Independent Director (iii)William Arthur Owens Non-Executive DirectorM.K. Sharma Non-Executive DirectorIreena Vittal Non-Executive DirectorDr. Patrick J. Ennis Non-Executive DirectorPatrick Dupuis Non-Executive DirectorArundhati Bhattacharya Non-Executive Director (iv)Deepak M. Satwalekar Non-Executive Director (v)Jatin Pravinchandra Dalal Chief Financial Officer
(i) Mr. Thierry Delaporte was appointed as Chief Executive Officer and Managing Director of the Company with effect from July 6, 2020 for a period of five years.
(ii) Mr. Abidali Z. Neemuchwala resigned as the Chief Executive Officer and Managing Director of the Company with effect from the end of the day on June 1, 2020.
(iii) Mr Azim H. Premji is the ultimate controlling party. (iv) Ms. Arundhati Bhattacharya resigned as Non- Executive Director with effect from close of business hours on June 30, 2020. (v) Mr. Deepak M. Satwalekar was appointed as Non- Executive Director with effect from July 1, 2020 for a term of five years.
Relatives of key management personnel:
- Yasmeen A. Premji
- Tariq A. Premji
The Company has the following related party transactions:
Entities controlled by Directors Key Management Personnel
Transactions / balances 2019 2020 2021 2019 2020 2021
Sale of goods and services ` 102 ` 43 ` 171 ` - ` - ` -
Assets purchased 240 741 423 - - -
Dividend 3,171 3,987 3,760 191 243 242
Buyback of shares - 69,392 91,562 - 4,076 -
Rental income 43 45 50 - - -
Rent Paid 8 2 2 5 9 7
Others 63 119 44 - - -
Notes to the Consolidated Financial Statements
Consolidated financial statements under IFRS
378
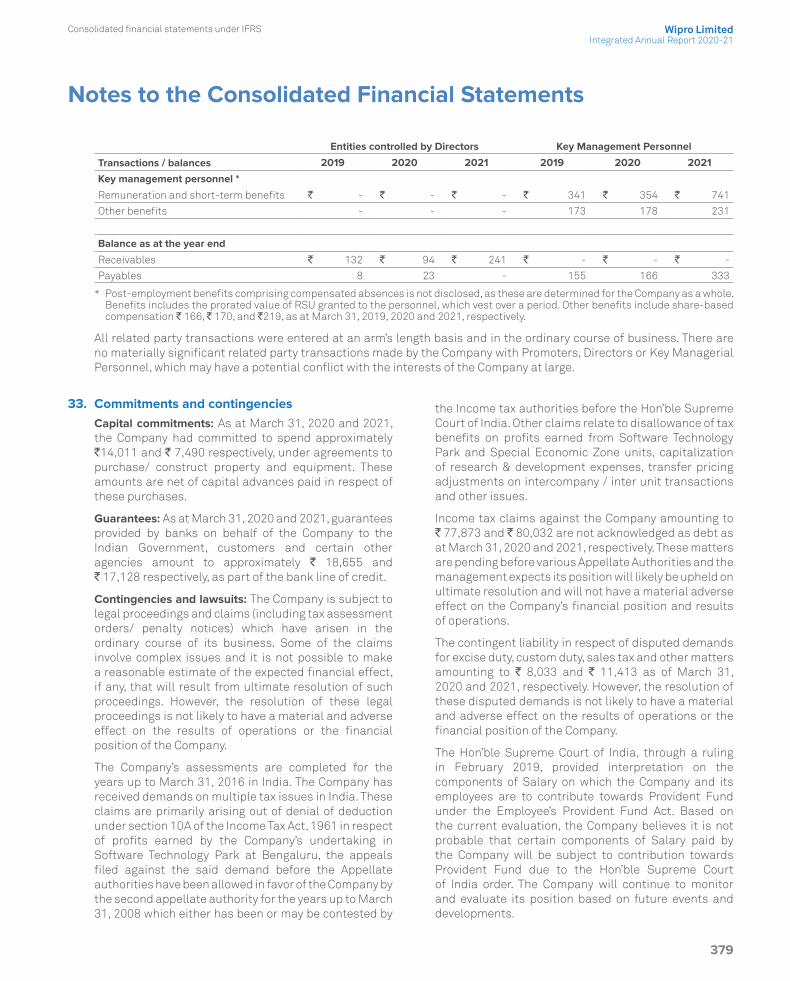
Entities controlled by Directors Key Management Personnel
Transactions / balances 2019 2020 2021 2019 2020 2021
Key management personnel *
Remuneration and short-term benefits ` - ` - ` - ` 341 ` 354 ` 741
Other benefits - - - 173 178 231
Balance as at the year end
Receivables ` 132 ` 94 ` 241 ` - ` - ` -
Payables 8 23 - 155 166 333
* Post-employment benefits comprising compensated absences is not disclosed, as these are determined for the Company as a whole. Benefits includes the prorated value of RSU granted to the personnel, which vest over a period. Other benefits include share-based compensation ` 166, ` 170, and `219, as at March 31, 2019, 2020 and 2021, respectively.
All related party transactions were entered at an arm’s length basis and in the ordinary course of business. There are no materially significant related party transactions made by the Company with Promoters, Directors or Key Managerial Personnel, which may have a potential conflict with the interests of the Company at large.
33. Commitments and contingenciesCapital commitments: As at March 31, 2020 and 2021, the Company had committed to spend approximately `14,011 and ` 7,490 respectively, under agreements to purchase/ construct property and equipment. These amounts are net of capital advances paid in respect of these purchases.
Guarantees: As at March 31, 2020 and 2021, guarantees provided by banks on behalf of the Company to the Indian Government, customers and certain other agencies amount to approximately ` 18,655 and ` 17,128 respectively, as part of the bank line of credit.
Contingencies and lawsuits: The Company is subject to legal proceedings and claims (including tax assessment orders/ penalty notices) which have arisen in the ordinary course of its business. Some of the claims involve complex issues and it is not possible to make a reasonable estimate of the expected financial effect, if any, that will result from ultimate resolution of such proceedings. However, the resolution of these legal proceedings is not likely to have a material and adverse effect on the results of operations or the financial position of the Company.
The Company’s assessments are completed for the years up to March 31, 2016 in India. The Company has received demands on multiple tax issues in India. These claims are primarily arising out of denial of deduction under section 10A of the Income Tax Act, 1961 in respect of profits earned by the Company’s undertaking in Software Technology Park at Bengaluru, the appeals filed against the said demand before the Appellate authorities have been allowed in favor of the Company by the second appellate authority for the years up to March 31, 2008 which either has been or may be contested by
the Income tax authorities before the Hon’ble Supreme Court of India. Other claims relate to disallowance of tax benefits on profits earned from Software Technology Park and Special Economic Zone units, capitalization of research & development expenses, transfer pricing adjustments on intercompany / inter unit transactions and other issues.
Income tax claims against the Company amounting to ` 77,873 and ` 80,032 are not acknowledged as debt as at March 31, 2020 and 2021, respectively. These matters are pending before various Appellate Authorities and the management expects its position will likely be upheld on ultimate resolution and will not have a material adverse effect on the Company’s financial position and results of operations.
The contingent liability in respect of disputed demands for excise duty, custom duty, sales tax and other matters amounting to ` 8,033 and ` 11,413 as of March 31, 2020 and 2021, respectively. However, the resolution of these disputed demands is not likely to have a material and adverse effect on the results of operations or the financial position of the Company.
The Hon’ble Supreme Court of India, through a ruling in February 2019, provided interpretation on the components of Salary on which the Company and its employees are to contribute towards Provident Fund under the Employee’s Provident Fund Act. Based on the current evaluation, the Company believes it is not probable that certain components of Salary paid by the Company will be subject to contribution towards Provident Fund due to the Hon’ble Supreme Court of India order. The Company will continue to monitor and evaluate its position based on future events and developments.
Notes to the Consolidated Financial Statements
Consolidated financial statements under IFRSIntegrated Annual Report 2020-21
Wipro Limited
379

34. Segment informationThe Company is organized into the following operating segments: IT Services, IT Products and India State Run Enterprise segment (“ISRE”).
IT Services: During the year ended March 31,2021, in order to broad base our growth, the Company re-organized IT Services segment to four Strategic Market Units (“SMUs”) - Americas 1, Americas 2, Europe and Asia Pacific Middle East Africa (“APMEA”).
Americas 1 and Americas 2 are primarily organized by industry sector, while Europe and APMEA are organized by countries.
Americas 1 includes the entire business of Latin America (“LATAM”) and the following industry sectors in the United States of America: healthcare and medical devices, consumer goods and life sciences, retail, transportation and services, communications, media and information services, technology products and platforms. Americas 2 includes the entire business in Canada and the following industry sectors in the United States of America: banking, financial services and insurance, manufacturing, hi-tech, energy and utilities. Europe consists of the United Kingdom and Ireland, Switzerland, Germany, Benelux, the Nordics and Southern Europe. APMEA consists of Australia and New Zealand, India, Middle East, South East Asia, Japan and Africa.
The corresponding information for the year ended March 31, 2019 and 2020 have been re-stated to give effect to the above changes.
Revenue from each customer is attributed to the respective SMUs based on the location of the customer’s primary buying center of such services. With respect to certain strategic global customers, revenue may be generated from multiple countries based on such customer’s buying centers, but the total revenue related to these strategic global customers are attributed to a single SMU based on the geographical location of key decision makers.
Prior to the Company’s re-organization of its IT services segment, the IT services segment was organized by seven industry verticals: Banking, Financial Services and Insurance (“BFSI”), Health Business unit (“Health BU”), Consumer Business unit (“CBU”), Energy, Natural Resources & Utilities (“ENU”), Manufacturing (“MFG”), Technology (“TECH”) and Communications (“COMM”).
Our IT Services segment provides a range of IT and IT enabled services which include digital strategy advisory, customer centric design, technology consulting, IT consulting, custom application design, development, re-engineering and maintenance, systems integration, package implementation, cloud and infrastructure services, business process services, cloud, mobility and analytics services, research and development and hardware and software design.
IT Products: The Company is a value-added reseller of security, packaged and SaaS software for leading international brands. In certain total outsourcing contracts of the IT Services segment, the Company delivers hardware, software products and other related deliverables. Revenue relating to these items is reported as revenue from the sale of IT Products.
ISRE: This segmentconsists of IT Services offerings to entities and/or departments owned or controlled by Government of India and/or any State Governments.
The Chairman of the Company has been identified as the Chief Operating Decision Maker (“CODM”) as defined by IFRS 8, “Operating Segments”. The Chairman of the Company evaluates the segments based on their revenue growth and operating income.
Assets and liabilities used in the Company’s business are not identified to any of the operating segments, as these are used interchangeably between segments. Management believes that it is currently not practicable to provide segment disclosures relating to total assets and liabilities since a meaningful segregation of the available data is onerous.
Information on reportable segments for the year ended March 31, 2019 is as follows:
IT ServicesIT
Products ISRE Reconciling Items TotalAmericas
1Americas
2 Europe APMEA Total
Revenue ` 164,321 ` 168,264 ` 157,165 ` 76,907 ` 566,657 ` 14,480 ` 7,932 ` (9) ` 589,060
Other operating income/(loss), net - - - - 4,344 - - - 4,344
Segment Result 23,020 29,612 31,550 9,421 93,603 (1,038) (1,892) 418 91,091
Unallocated 4,475 - - - 4,475
Segment Result Total ` 102,422 ` (1,038) ` (1,892) ` 418 ` 99,910
Finance expense (7,375)
Finance and other income 22,923
Notes to the Consolidated Financial Statements
Consolidated financial statements under IFRS
380

IT ServicesIT
Products ISRE Reconciling Items TotalAmericas
1Americas
2 Europe APMEA Total
Share of net profit/(loss) of associates accounted for using the equity method (43)
Profit before tax ` 115,415
Income tax expense (25,242)
Profit for the year ` 90,173Depreciation, amortization and impairment `19,474
Information on reportable segments for the year ended March 31, 2020 is as follows:
IT ServicesIT
Products ISRE Reconciling Items TotalAmericas
1Americas
2 Europe APMEA Total
Revenue ` 176,115 ` 181,481 ` 157,526 `78,676 ` 593,798 `11,657 `7,950 `(4) ` 613,401
Other operating income/(loss), net - - - - 1,144 - - - 1,144
Segment Result 27,289 34,341 27,617 9,550 98,797 (323) (1,849) 229 96,854
Unallocated 7,732 - - - 7,732
Segment Result Total ` 107,673 ` (323) ` (1,849) ` 229 ` 105,730Finance expense (7,328)
Finance and other income 24,081
Share of net profit/(loss) of associates accounted for using the equity method 29
Profit before tax ` 122,512Income tax expense (24,799)
Profit for the year ` 97,713Depreciation, amortization and impairment `20,862
Information on reportable segments for the year ended March 31, 2021 is as follows:
IT ServicesIT
Products ISRE Reconciling Items TotalAmericas
1Americas
2 Europe APMEA Total
Revenue ` 178,091 ` 179,821 ` 165,441 `82,462 ` 605,815 `7,685 `8,912 `13 ` 622,425
Other operating income/(loss), net - - - - (81) - - - (81)
Segment Result 33,040 41,589 31,673 11,476 117,778 45 1,061 (903) 117,981
Unallocated 5,153 - - - 5,153
Segment Result Total ` 122,850 ` 45 ` 1,061 ` (903) ` 123,053Finance expense (5,088)
Finance and other income 20,912
Share of net profit/(loss) of associates accounted for using the equity method 130
Profit before tax ` 139,007Income tax expense (30,345)
Profit for the year ` 108,662Depreciation, amortization and impairment `27,656
Notes to the Consolidated Financial Statements
Consolidated financial statements under IFRSIntegrated Annual Report 2020-21
Wipro Limited
381

Revenues from India, being Company’s country of domicile, is ` 30,566, ` 29,374 and ` 27,156 for year ended March 31, 2019, 2020 and 2021 respectively.
Revenues from United States of America and United Kingdom contributed more than 10% of Company’s total revenues as per table below:
Year ended March 31, 2019
Year ended March 31, 2020
Year ended March 31, 2021
United States of America ` 315,301 ` 338,490 ` 336,009
United Kingdom 59,568 65,258 67,852
` 374,869 ` 403,748 ` 403,861
No customer individually accounted for more than 10% of the revenues during the year ended March 31, 2019, 2020 and 2021.
Management believes that it is currently not practicable to provide disclosure of geographical location wise assets, since the meaningful segregation of the available information is onerous.
Notes:a) Effective beginning of fiscal year ended March 31, 2021, revenue from sale of traded cloud-based licenses is no
longer reported in IT Services revenue and finance income on deferred consideration earned under total outsourcing contracts is not included in segment revenue. Further, for evaluating performance of the individual operating segments, stock compensation expense is allocated based on the accelerated amortization as per IFRS 2. Segment information for the year ended March 31, 2019 and 2020 has been re-stated to give effect to these changes.
b) “Reconciling items” includes elimination of inter-segment transactions and other corporate activities.
c) Revenue from sale of Company owned intellectual properties is reported as part of IT Services revenues.
d) For the purpose of segment reporting, the Company has included the impact of “foreign exchange gains / (losses), net” in revenues (which is reported as a part of operating profit in the consolidated statement of income).
e) During the year ended March 31, 2021, the Company has contributed ` 991 towards COVID-19 and is reported in Reconciling items.
f) Other operating income/(loss) of ` 4,344, ` 1,144 and ` (81) is included as part of IT Services segment result for the year ended March 31, 2019, 2020 and 2021, respectively. Refer to Note 26.
g) Segment results for the year ended March 31, 2021, are after considering the impact of impairment charge of ` 1,250 in Americas 1 and ` 192 in Europe. Further, an impairment charge of ` 674 for the year ended March 31, 2021 towards certain marketing-related intangible assets and software platform recognized on acquisitions, is allocated to all IT Services SMUs. The remaining impairment charge of ` 302 for the year ended March 31, 2021 is included under unallocated. Refer to Note 4, 6 and 25.
h) Segment results for Americas 1 for the year ended March 31, 2019, are after considering the impact of impairment charges on certain software platform and intangible assets recognized on acquisitions. Refer to Note 25.
i) Segment results for year ended March 31, 2021, are after considering additional amortization of ` 795 in Americas 2 due to change in estimate of useful life of the customer-related intangibles in an earlier business combination. Refer to Note 6.
j) Segment results for Americas 2 for the year ended March 31, 2019, are after considering the impact of `5,141 (US$ 75 million) paid to National Grid on settlement of a legal claim against the Company. Refer to Note 25.
k) Segment results of IT Services segment are after recognition of share-based compensation expense ` 1,938, ` 1,262, and ` 2,897 for the year ended March 31, 2019, 2020 and 2021, respectively.
35. On December 22, 2020, as part of strategic partnership, the Company entered into a definitive agreement to acquire the IT units of Metro AG in Germany and Romania. Based on the terms and conditions of the agreement, the Company has assessed that the transaction does not meet the definition of business under IFRS 3 “Business Combinations”. As at March 31, 2021, the Company paid an advance of `4,463 (EUR 52 million) towards purchase of net assets and classified asother non-current assets.
Notes to the Consolidated Financial Statements
Consolidated financial statements under IFRS
382

36. The Indian Parliament has approved the Code on Social Security, 2020 which would impact the contributions by the Company towards Provident Fund and Gratuity. The Ministry of Labour and Employment has released draft rules for the Code on Social Security, 2020 on November 13, 2020, and has invited suggestions from stake holders which are under active consideration by the Ministry. Based on an initial assessment by the Company and its Indian subsidiaries, the additional impact on Provident Fund contributions by the Company and its Indian subsidiaries is not expected to be material, whereas, the likely additional impact on Gratuity liability / contributions by the Company and its Indian subsidiaries could be material. The Company and its Indian subsidiaries will complete their evaluation once the subject rules are notified and will give appropriate impact in the financial statements in the period in which, the Code becomes effective and the related rules to determine the financial impact are published.
37. Events after the reporting period
a) On April 1, 2021, the Company entered into a definitive agreement to acquire Ampion, an Australia-based provider of cyber security, DevOps and quality engineering services for a total consideration of AUD 150 million. The acquisition is subject to customary closing conditions and regulatory approvals and is expected to be concluded in the quarter ending June 30, 2021.
b) In April 2021, the Company completed its acquisition of Capco, a global management and technology consultancy providing digital, consulting and technology services to financial institutions in the Americas, Europe and the Asia Pacific, and its subsidiaries, for an upfront cash consideration of `108,760 (Refer to Note 7).
c) In May 2021, the Company sold its entire investment in Ensono Holdings, LLC for a consideration of US$ 76.24 million.
d) In June 2021, the Company sold its entire investment in Denim Group, Ltd. and Denim Group Management, LLC (“Denim Group”) for a consideration of US$ 22.42 million.
e) In June 2021, the Company’s Board has approved a proposal for issuance of U.S. dollar denominated Notes up to US$ 750 million.
The accompanying notes form an integral part of these consolidated financial statements
Notes to the Consolidated Financial Statements
Consolidated financial statements under IFRSIntegrated Annual Report 2020-21
Wipro Limited
383

Business Responsibility Report (BRR)
384
Ministry of Corporate Affairs (MCA) revised National Voluntary Guidelines (NVG) 2011 on Social, Environmental and Economic Responsibilities of Business and aligned it with the national and international developments in sustainability space. This resulted in formulation of National Guidelines on Responsible Business Conduct (NGRBC) in 2019.
At Wipro, the NVG’s Principles and Core elements are deeply integrated into practices and processes. During the reporting year, we assessed our position with the new NGRBC guidelines, a brief of which is given below:
• As early adopters of GRI (Global Reporting Initiative) and IR (Integrated Reporting), our policies and processes cover most elements of the NGRBC– which include identification and engagement with key stakeholders, materiality determination and adopting a comprehensive approach that makes responsible business conduct an integral part of our strategy.
• Our policies like the Ecological Sustainability Policy, Health and Safety Policy, Human Right Policy, Code of Business Conduct, Supplier Code of Conduct, Data Privacy and CSR policy are implemented by specific operational guidelines and procedures under a cross functional charter which includes the Risk function, Legal and Compliance, Human Resources, Information Security, Operations, Procurement and Ombuds, among others. The tenets of Protect-Respect-Remedy are also integrated in implementation. We ensure appropriate due diligence of these programs through process and performance audits–both internal and external–through frameworks like ISO 14001, ISO 45001 and GRI among others.
• The details of governance by sub-committees of the Board are provided as part of our Corporate Governance Report from page no. 128 of this Annual Report.
• Communications– transparent disclosure is made through various public forums like CDP, Annual reporting, and through investor led frameworks like DJSI, FTSE, MSCI, Vigeo, among other. In addition, leadership actively evangelizes these values-based approaches through regular forums.
We have robust internal processes to track performance of different elements in NGRBC at multiple levels of detail and coverage – many of which are covered in our public disclosures. We plan to report as per the new Business Responsibility and Sustainability Report (BRSR) format next year (FY22).
Section A: General Information about the Company
1. Corporate Identity Number (CIN) of the CompanyL32102KA1945PLC020800.
2. Name of the CompanyWipro Limited.
3. Registered addressDoddakannelli, Sarjapur Road, Bengaluru-560035, Karnataka, India.
4. Websitehttps://www.wipro.com.
5. E-mail [email protected].
6. Financial Year reportedApril 1, 2020 to March 31, 2021 (FY 2020-21).
7. Sector(s) that the Company is engaged in (industrial activity code-wise)IT Software, Services and related activities. NIC Code-62013, 62020.
8. List three key products/services that the Company manufactures/provides (as in balance sheet)Please refer page nos. 34 to 37 of this Annual Report.
9. Total number of locations where business activity is undertaken by the Company
i. Number of international locations (Provide details of major 5)
139 office locations and 2 data centers please refer complete list of locations available on the Company’s website at https://www.wipro.com.
ii. Number of national locations 36 locations (including 3 data centers). Please refer
complete list of locations available on the Company’s website at https://www.wipro.com.
10. Markets served by the Company – Local/State/ National/InternationalPlease refer page no. 382 of this Annual Report.
Section B: Financial Details of the Company1. Paid up Capital
As at March 31, 2021, the paid up equity share capital of the Company stood at ` 10,958,277,110 consisting of 5,479,138,555 equity shares of ` 2 each.

Integrated Annual Report 2020-21Wipro Limited
385
2. Total Turnover
For the financial year 2020-21, the total turnover of the Company on a consolidated basis was 619,430 million.
3. Total profit after taxes
For the financial year 2020-21, the net profit of the Company on a consolidated basis was 108,680 million.
4. Total spending on Corporate Social Responsibility (CSR) as percentage of profit after tax
Please refer to the Corporate Social Responsibility Report for the year from page nos. 114 to 118 of this Annual Report.
5. List of activities in which expenditure in 4 above has been incurred:-
Please refer to the Corporate Social Responsibility Report for the year from page nos. 114 to 118 of this Annual Report.
Section C: Other Details
1. Does the Company have any Subsidiary Company/ Companies?
The Company has subsidiaries as on March 31, 2021. Please refer the complete list from page nos. 292 to 295 of this Annual Report.
2. Do the Subsidiary Company/Companies participate in the BR Initiatives of the parent company? If yes, then indicate the number of such subsidiary company(s).
As the BR Initiatives of the Company are run at global level, the subsidiaries do participate in the BR Initiatives.
3. Do any other entity/entities (e. g. suppliers, distributors etc.) that the Company does business with, participate in the BR initiatives of the Company? If yes, then indicate the percentage of such entity/entities? [Less than 30%, 30-60%, More than 60%]
Yes, less than 30%.
Section D: BR Information
1. Details of Director responsible for BR
a) Details of the Director responsible for implementation of the BR policy/policies
The Board Governance, Nomination and Compensation Committee is responsible for the implementation of the CSR policy. Please refer page no. 129 of this Annual Report.
b) Details of the BR headDIN (if applicable) Not applicable
Name Anurag Behar
Designation Chief Sustainability Officer
Telephone No. 080 28440011
Email id [email protected]
2. Principle-wise (as per NVGs) BR Policy/policies (Reply in Y/N)
a) Do you have a policy /policies for:
• Principle 1: Yes. Wipro has a policy on Ethics, Transparency and Accountability. Our Code of Business Conduct (COBC) is applicable to our customers, suppliers, partners, competitors, employees and other stakeholders, which is available at
https://www.wipro.com/content/dam/nexus/en/investor/corporate-governance/policies-and-guidelines/ethical-guidelines/code-of-business-conduct-and-ethics.pdf.
• Principle 2: Yes. Our Policy on Ecological Sustainability is available at https://www.wipro.com/content/dam/nexus/en/sustainability/pdf/ecological-sustainability-policy.pdf.
• Principle 3: Yes. Wipro’s COBC and policy on Health and Safety is available at https://www.wipro.com/content/dam/nexus/en/sustainability/pdf/health-and-safety-policy.pdf.
• Principle 4: Yes. Policy on Corporate Social Responsibility is available at https://www.wipro.com/content/dam/nexus/en/investor/c o r p o r a t e - g o v e r n a n c e / p o l i c i e s - a n d -guidelines/ethical-guidelines/12773-policy-on-corporate-social-responsibility.pdf.
• Principle 5: Yes. Wipro’s COBC addresses principles of Human Rights as per the principles of the UN Global Compact and is available at
https://www.wipro.com/content/dam/nexus/en/sustainability/pdf/Human-Rights-Policy.pdf.
• Principle 6: Yes. Our Policy on Ecological Sustainability.

386
• Principle 7: There is no distinct policy on public advocacy. However, refer to human capital (page nos. 80 to 86), natural capital (page nos. 70 to 79) and social & relationship capital (page nos. 59 to 69) for our engagements through various organizations on material issues.
• Principle 8: Wipro does not have a separate policy. However, these aspects are covered in the COBC, the Ecological Sustainability Commitment and policy on Corporate Social Responsibility.
• Principle 9: Yes. Wipro’s COBC covers this.
b) Has the policy being formulated in consultation with the relevant stakeholders?
Yes, for all principles.
c) Does the policy conform to any national/ international standards? If yes, specify? (50 words)
• Principle 1: Yes. Wipro’s COBC subscribes to the Foreign Corrupt Practices Act of USA. Our financial reporting, internal controls and procedures and disclosures are in compliance with Generally Accepted Accounting Principles (GAAP) and International Financial Reporting Standards (IFRS).
• Principle 2: Yes. Wipro has been following the ISO 14001 Standard and Guidelines for our Environmental Management System. For designing our Green Buildings, we have adhered to the international Leadership in Energy and Environmental Design (LEED) standard.
• Principle 3: Yes. We are certified against ISO 45001 Standard across our key locations.
• Principle 4: Yes. We carry out assurance against Global Reporting Initiative (GRI), IIRC and TCFD recommendations which have a key stakeholder engagement requirement.
• Principle 5: The Human Rights policy is guided by UN Global Compact, UNDHR and the ILO Declaration. Wipro also supports the UN guiding principles on Business and Human Rights.
• Principle 6: Yes. Our Environmental Management System is based on the ISO 14001 Standard and the Green Buildings complies with the international LEED standard.
• Principle 7: Not Applicable
• Principle 8: Yes. We subscribe to the UN Global Compact principles. We also disclose details of our programs and key outcomes as part of UNGC Communication on Progress.
• Principle 9: Yes. We subscribe to the UN Global Compact principles with respect to this principle.
d) Is the policy being approved by the Board? If yes, has it been signed by MD/owner/CEO/ appropriate Board Director?
• Principle 1: Yes. The COBC is approved by our Board of Directors and endorsed by our Chairman.
• Principle 2: Yes. The Policy on Ecological Sustainability is approved by the Board of Directors and has been signed by the Chief Executive Officer and Managing Director.
• Principle 3: Yes. The COBC is approved by the Board of Directors. Wipro Global Statement on Health and Safety has been signed by the President & Chief Human Resources Officer.
• Principle 4: Yes. The COBC is approved by our Board of Directors and endorsed by our Chairman. The Policy on Corporate Social Responsibility is approved by the Board of Directors.
• Principle 5: Yes. The COBC is approved by our Board of Directors and endorsed by our Chairman. The Human rights policy is endorsed by the Board.
• Principle 6: Yes. The COBC is approved by our Board of Directors and endorsed by our Chairman. The Policy on Ecological Sustainability has been signed by the Chief Executive Officer and Managing Director.
• Principle 7: Not Applicable.
• Principle 8: Yes. The Policy on Corporate Social Responsibility (CSR) is approved by the Board of Directors. The COBC is approved by our Board of Directors and endorsed by our Chairman. The Policy on Ecological Sustainability is approved by the Board and has been signed by the Chief Executive Officer and Managing Director.
Business Responsibility Report (BRR)

Integrated Annual Report 2020-21Wipro Limited
387
• Principle 9: Yes. The COBC is approved by our Board of Directors and endorsed by our Chairman. The Policy on Ecological Sustainability is approved by the Board of Directors and has been signed by the Chief Executive Officer and Managing Director.
e) Does the Company have a specified committee of the Board/Director/Official to oversee the implementation of the policy?
The Board Governance, Nomination and Compensation Committee oversees the implementation of policies and initiatives related to CSR. The CSR policy is available at https://www.wipro.com/content/dam/nexus/en/investor/corporate-governance/policies-and-guidelines/ethical-guidelines/12773-policy-on-corporate-social-responsibility.pdf.
f) Indicate the link for the policy to be viewed online.
COBC-
https://www.wipro.com/content/dam/nexus/en/investor/corporate-governance/policies-and-guidelines/ethical-guidelines/code-of-business-conduct-and-ethics.pdf.
Policy on Health and Safety-
https://www.wipro.com/content/dam/nexus/en/sustainability/pdf/health-and-safety-policy.pdf.
Policy on Ecological Sustainability-
https://www.wipro.com/content/dam/nexus/en/sustainability/pdf/ecological-sustainability-policy.pdf.
Policy on Corporate Social Responsibility-
https://www.wipro.com/content/dam/nexus/en/investor/corporate-governance/policies-and-guidelines/ethical-guidelines/12773-policy-on-corporate-social-responsibility.pdf.
Policy on Human Rights-
https://www.wipro.com/content/dam/nexus/en/sustainability/pdf/Human-Rights-Policy.pdf.
GRI Report FY 2019-20
https://www.wipro.com/content/dam/nexus/en/sustainability/sustainability_reports/wipro-sustainability-report-2019-20.pdf.
g) Has the policy been formally communicated to all relevant internal and external stakeholders?
Yes, the policies have been formally communicated
to internal and external stakeholders. They are available online for all stakeholders to refer to in the links mentioned earlier.
h) Does the Company have in-house structure to implement the policy/policies?
Yes, for all principles, although Wipro does not have a policy on public policy and advocacy. The sustainability organization and government relations group oversees the public policy initiatives.
i) Does the Company have a grievance redressal mechanism related to the policy/policies to address stakeholders’ grievances related to the policy/ policies?
Yes, for all principles.
Dedicated email address ([email protected]) has been created to facilitate receipt of complaints and for ease of reporting. All employees and stakeholders can also register their concerns through web-based portal at https://www.wipro.com/investors/corporate-governance/#WiprosOmbudsProcess.
Analyst and Investors provide regular feedback through media, interviews and ratings. Employees have multiple channels for grievance redressal.
Suppliers can provide feedback either through the ombuds process, helpline, helpdesk or forums like the annual supplier meet.
Customers have multiple channels for raising grievances– account managers, client engagement managers, the customer advocacy group and through independently administered satisfaction surveys. There are ongoing, project based and annual feedbacks from our Customers.
j) Has the Company carried out independent audit/ evaluation of the working of this policy by an internal or external agency
We have a program which covers verification against frameworks like ISO 14001, ISO 45001, ISO 27001 and corporate reporting frameworks like GRI, IIRC, TCFD throughout the year.
Internal Audit Function: The internal audit function carries out an audit of processes and practices across functions of the organization using the COBC as the guideline.
388
3. Governance related to BR
Indicate the frequency with which the Board of Directors, Committee of the Board or CEO assess the BR performance of the Company. Within 3 months, 3-6 months, Annually, More than 1 year.
Quarterly.
Does the Company publish a BR or a Sustainability Report? What is the hyperlink for viewing this report? How frequently it is published?
Wipro’s Annual Report includes an articulation of the 9 NVG 2011 principles. We also publish an annual Sustainability Report which is available at https://www.wipro.com/sustainability-archive/.
Section E: Principle-wise performance
Principle 1
1.1 Does the policy relating to ethics, bribery and corruption cover only the Company? COBC extends to the Group/ Joint Ventures/ Suppliers/Contractors/NGOs/Others?
Yes, COBC extends to all.
1.2 How many stakeholder complaints have been received in the past financial year and what percentage was satisfactorily resolved by the management? If so, provide the details thereof, in about 50 words or so.
Please refer page no. 93 of this Annual Report.
Principle 2
2.1 List up to 3 of your products or services whose design has incorporated social or environmental concerns, risks and/or opportunities.
Our work in the space of IT services and consulting includes cloud based services, managed services, internet of things, infrastructure services and digital offerings, all of which fundamentally are premised on improving resource efficiency and reducing environmental footprint. We work in the domains of health care and life sciences, government services, banking, transportation, energy and natural resources, helping enhance provisioning of services across all sections of the society.
2.2 For each such product, provide the following details in respect of resource use (energy, water, raw material etc.) per unit of product (optional): Reduction during sourcing/production/distribution achieved since the previous year throughout the value chain, Reduction during usage by consumers (energy, water) that has been achieved since the previous year?1) Wipro offers a range of IT services and solutions like
cloud based services, managed services, internet of things, digital offerings which significantly help improve process efficiency and business outcomes for our customers. All these solutions directly or indirectly also improve the environmental impacts for our customers. However, due to the nature of our services, it is difficult to quantify.
2) The natural capital valuation study (refer page no. 79) and the green initiatives in ICT hardware procurement cover initiatives across the value chain.
2.3 Does the Company have procedures in place for sustainable sourcing (including transportation)? If yes, what percentage of your inputs was sourced sustainably? Also, provide the details thereof, in about 50 words or so.
Green Procurement program for ICT Hardware and Electronic End of Life as part of which we sourced more than 108,400 Electronic Product Environmental Assessment Tool (EPEAT) registered electronic products in calendar year 2019.
Please refer page no. 63 of this Annual Report.
2.4 Has the Company taken any steps to procure goods and services from local & small producers, including communities surrounding their place of work? If yes, what steps have been taken to improve their capacity and capability of local and small vendors?
Local Procurement: Wipro encourages sourcing from the local economy. Local sourcing reduces costs, provides local employment benefits and reduced environmental footprint in sourcing.
Please refer page no. 62 of this Annual Report.
2.5 Does the Company have a mechanism to recycle products and waste? If yes, what is the percentage of recycling of products and waste (separately as <5%, 5-10%, >10%). Also, provide the details thereof, in about 50 words or so.
Please refer page nos. 76 to 78 of this Annual Report.
Principle 3
3.1 Please indicate the total number of employees.
Please refer page no. 15 of this Annual Report.
3.2 Please indicate the total number of employees hired on temporary/contractual/casual basis.
Please refer page no. 15 of this Annual Report.
Business Responsibility Report (BRR)

Integrated Annual Report 2020-21Wipro Limited
389
3.3 Please indicate the number of permanent women employees.
Please refer page no. 15 of this Annual Report.
3.4 Please indicate the number of permanent employees with disabilities
Please refer page no. 15 of this Annual Report.
3.5 Do you have an employee association that is recognized by management?
Please refer page no. 85 of this Annual Report.
3.6 What percentage of your permanent employees are members of this recognized employee association?
Please refer to page no. 85 of this Annual report.
3.7 Please indicate the number of complaints relating to child labor, forced labor, involuntary labor, sexual harassment, in the last financial year, and those that are pending, as on the end of the financial year.
Please refer page no. 93 of this Annual Report.
3.8 What percentage of your under mentioned employees were given safety & skill up-gradation training in the last year?
1. Permanent Employees
2. Permanent Women Employees
3. Casual/Temporary/Contract employees
4. Employees with disability
Safety training is provided to 100% of the employees.
For information on skill up-gradation training, please refer page nos. 82 to 83 of this Annual Report.
Principle 4
4.1 Has the Company mapped its internal and external stakeholders?
Yes.
4.2 Out of the above, has the Company identified the disadvantaged, vulnerable & marginalized stakeholders?
Please refer page nos. 63 to 64 of this report.
4.3 Are there any special initiatives undertaken by the Company to engage with the disadvantaged, vulnerable and marginalized stakeholders? If so, provide the details thereof, in about 50 words or so.
Please refer page nos. 63 to 64 of this Annual Report.
Principle 5
5.1 Does the policy of the Company on human rights cover only the Company or extend to the Group/Joint Ventures/Suppliers/Contractors/ NGOs/Others?
Human Rights policy extends to the Group/Joint Ventures/Suppliers/Contractors/NGOs/others.
5.2 How many stakeholder complaints have been received in the past financial year, and what percentage was satisfactorily resolved by the management?
Please refer page no. 93 of this Annual Report.
Principle 6
6.1 Does the policy related to Principle 6 cover only the Company or extends to the Group/Joint Ventures/ Suppliers/Contractors/NGOs/others.
Yes, it extends to all.
6.2 Does the Company have strategies/initiatives to address global environmental issues such as climate change, global warming, etc.? Yes/No. If yes, please give hyperlink for the webpage, etc.
Yes. Please refer page nos. 70 to 79 of this report. https://www.wipro.com/investors/annual-reports/.
6.3 Does the Company identify and assess potential environmental risks?
Yes. Please see page nos. 70 and 79 in Natural Capital section of this report.
6.4 Does the Company have any project related to Clean Development Mechanism? If so, provide the details thereof, in about 50 words or so. Also, if yes, whether any environmental compliance report has been filed?
No.
6.5 Has the Company undertaken any other initiatives on–clean technology, energy efficiency, renewable energy, etc.? Yes/No. If yes, please give hyperlink for the web page, etc.
Yes. Please refer page nos. 70 to 79 of this report. https://www.wipro.com/investors/annual-reports/.
6.6 Are the emissions/waste generated by the Company within the permissible limits given by CPCB/SPCB for the financial year being reported?
Yes.
6.7 Number of show cause/legal notices received from CPCB/SPCB which are pending (i.e., not resolved to satisfaction) as on end of Financial Year.
None.

390
Principle 7
7.1 Is your Company a member of any trade and chamber or association? If yes, name only those major ones that your business deals with.
We are members of industry and business forums in countries where we have significant operations. Business Round Table (BRT), U.S. Chamber of Commerce (USCC) and Global Business Alliance (GBA) are the top three by financial contribution. The total contribution made to BRT, USCC, GBA is $287,500 during FY20-21.
7.2 Have you advocated/lobbied through the above associations for the advancement or improvement of public good? Yes/No. If yes, specify the broad areas (Governance and Administration, Economic Reforms, Inclusive Development Policies, Energy Security, Water, Food Security, Sustainable Business Principles, Others).
Yes. Through Industry forums and networks in India, we work on a range of issues related to sustainability and community aspects- including energy, water, green buildings, biodiversity, waste management among others. We also support flexibility in movement of labor.
Principle 8
8.1 Does the Company have specified programs/ initiatives/ projects in pursuit of the policy related to Principle 8? If yes, provide the details thereof.
Yes. Please refer page nos. 63 to 64 of this Annual Report.
8.2 Are the programs/projects undertaken through an in-house team/own foundation/external NGO/ government structures/any other organization?
Wipro partners with non-governmental organizations working on the areas of our focus.
8.3 Have you done any impact assessment of your initiative?
We do extensive due diligence of our partners and monitor and evaluate progress/outcomes during the course of the program, and on a quarterly basis with the Chairman.
8.4 What is your Company’s direct contribution to community development projects- Amount in INR and the details of the projects undertaken.
Please refer page nos. 14 to 15 and 63 to 64 of this Annual Report.
8.5 Have you taken steps to ensure that this community development initiative is successfully adopted by the community? Please explain in 50 words or so.
The nature of the programs supported by Wipro ensures successful adoption by communities. Also, Wipro works with organizations which has a good connect and presence in the local communities.
For more details, please refer page nos. 63 to 64 of this Annual Report.
Principle 9
9.1 What percentage of customer complaints/ consumer cases are pending as on the end of financial year?
We do not have any complaint relating to violation of this principle. However, we would have some customer related commercial disputes and litigations in the normal course of business.
9.2 Does the Company display product information on the product label, over and above what is mandated as per local laws? Yes/No/N.A./remarks (additional information).
Not Applicable.
9.3 Is there any case filed by any stakeholder against the Company regarding unfair trade practices, irresponsible advertising and/or anti-competitive behavior during the last five years and pending as on end of financial year? If so, provide the details thereof, in about 50 words or so.
Not Applicable.
9.4 Did your Company carry out any consumer survey/ consumer satisfaction trends?
Please refer page nos. 14 and 60 to 63 of this Annual Report.
Business Responsibility Report (BRR)

Integrated Annual Report 2020-21Wipro Limited
391
GLOSSARY
Sl. No
Abbreviation Expansion
1 AAS As A Service
2 ABAC Anti- Corruption program
3 ADR American Depositary Receipt
4 ADS American Depositary Share
5 AEM Application Engineering and Modernization
6 AGM Annual General Meeting
7 AHU Air Handling Units
8 AI Artificial Intelligence
9 AI/ML Artificial Intelligence/Machine Learning
10 ANZ Australia and New Zealand
11 APAC Asia Pacific
12 APMEA Asia Pacific, Middle East and Africa
13 AR Augmented Reality
14 ATD Association for Talent Development
15 B2B Business to Business
16 BCMS Business Continuity Management System
17 BCP Business Continuity Plan
18 BCWI Best Companies for Women in India
19 BFSI Banking, Financial Services & Insurance
20 BI Business Intelligence
21 BPS Basis point
22 BRR Business Responsibility Report
23 BSE BSE Limited
24 BSF Bengaluru Sustainability Forum
25 BU Business Unit
26 C&D Construction and Demolition
27 CAD Computer Aided Design
28 CAGR Compounded Annual Growth Rate
29 CBCMT Corporate Business Continuity Team
30 CBU Consumer Business Unit
31 CC Constant Currency
32 CGU Cash Generated Units
33 CDP Carbon Disclosure Project
34 CDSB Climate Disclosures Standards Board
35 CEO Chief Executive Officer
36 CEP Continuous Engagement Program
37 CFO Chief Financial Officer
Sl. No
Abbreviation Expansion
38 CII Confederation of Indian Industry
39 CIN Corporate Identification Number
40 CIS Cloud and Infrastructure Services
41 COBC Code of Business Conduct
42 COMM Communications
43 COSO Company of Sponsoring Trade way Organisation
44 CRS Cybersecurity and Risk Services
45 CSAT Customer Satisfaction
46 CSR Corporate Social Responsibility
47 CTO Chief Technology Officer
48 CX Customer Experience
49 D&I Diversity & Inclusion
50 DAAI Data Analytics and Artificial Intelligence
51 DDT Dividend Distribution Tax
52 DIN Director Identification Number
53 DJSI Dow Jones Sustainability Index
54 DO&P Digital Operations and Platforms
55 DPA Data process agreements
56 DSO Day Sales Outstanding
57 DTA Data Transfer agreements
58 DX Digital Experience
59 EBITDA Earnings Before Interest, Tax, Depreciations and Amortization
60 EES Employee Experience Survey
61 EMEA Europe, Middle East and Africa
62 EMS Environmental Management System
63 ENU Energy, Natural Resources and Utilities
64 EPEATElectronic Product Environmental Assessment Tool
65 EPI Energy Performance Index
66 EPS Earnings Per Share
67 ER&D Engineering, Research and Development
68 ERM Enterprise Risk Management
69 ESG Environmental, Social and Governance
70 ESOP Employee Stock Option
71 ESS Employee Satisfaction Survey
72 EV Electric Vehicles
73 FCTR Foreign Currency Translation Reserve

392
Sl. No
Abbreviation Expansion
74 FSSAI Food Safety Standards Authority of India
75 FTSE Russell ESG
Financial Times Stock Exchange Russell Environmental Social and Governance
76 GAAP Generally Accepted Accounting Principles
77 GBL Global Business Units
78 GCCMC Global Coalition for COVID-19 Medical Care
79 GDP Gross Domestic Product
80 GDPR General Data Protection Regulation
81 GDS Global Depository Share
82 GEI Gender-Equality Index
83 GHG Green House Gases
84 GoI Government of India
85 GRI Global Reporting Initiative
86 GSSB Global Sustainability Standard Board
87 H2 Second Half
88 HPS Health Plan Services
89 HUF Hindu Undivided Family
90 I&D Inclusion and Diversity
91 IAAS Infrastructure as a Service
92 IAS International Accounting Standard
93 IASB International Accounting Standards Board
94 IBBI Biodiversity Initiative
95 iCORE Cloud Infrastructure, Digital Operations, Risk and Enterprise Cyber Security Services
96 iDEAS Integrated Digital, Engineering and Application Services
97 IFRIC IFRS Interpretations Committee
98 IFRS International Financial Reporting Standards
99 IIRC International Integrated Reporting Council
100 IISc Indian Institute of Science
101 IIT Indian Institute of Technology
102 ILO International Labour Organization
103 Ind AS Indian Accounting Standards
104 IoT Internet of Things
105 IP Intellectual Property
106 ISG Information Services Group
107 ISIN International Securities Identification Number
108 ISO International Standards Organisation
109 ISRE India State Run Enterprises
110 IT Information Technology
111 ITI International TechneGroup Incorporated
Sl. No
Abbreviation Expansion
112 IVRS Interactive Voice Response System
113 IWEI India Workplace Equality Index
114 JAC Joint Audit Consortium
115 KMP Key Managerial Personnel
116 KPI Key Performance Indicator
117 KRA Key Result Area
118 LAN Local Area Network
119 LATAM Latin America
120 LEEDLeadership in Energy and Environmental Designs
121 LIBOR London Inter Bank Offered Rate
122 LODRListing Obligations and Disclosure Requirements
123 LOS Loan Origination System
124 LTI Long Term Incentive
125 M&A Mergers and Acquisitions
126 MAS Modern Application Services
127 MAT Minimum Alternate Tax
128 MCA Ministry of Corporate Affairs
129 MD Managing Director
130 MD&A Management Discussion and Analysis
131 MFG Manufacturing
132 MICI Most Inclusive Companies Index
133 ML Machine Learning
134 MOU Memorandum of Understanding
135 MPS Managed Print Services
136 MRE Median Remuneration of Employees
137 MSCI ESG Morgan Stanley Capital International Environmental Social and Governance
138 NASSCOM National Association of Software and Services Companies
139 NLP Natural Language Processing
140 NPS Net Promoter Score
141 NSE National Stock Exchange of India Limited
142 NYSE New York Stock Exchange
143 OEM Original Equipment Manufacturer
144 OHSAS Occupational Health and Safety Assessment Series
145 OM Operating Margin
146 OSDU Open Subsurface Data Universe
147 POS Launchpad Point of Sale
148 PPA Power Purchase Agreements
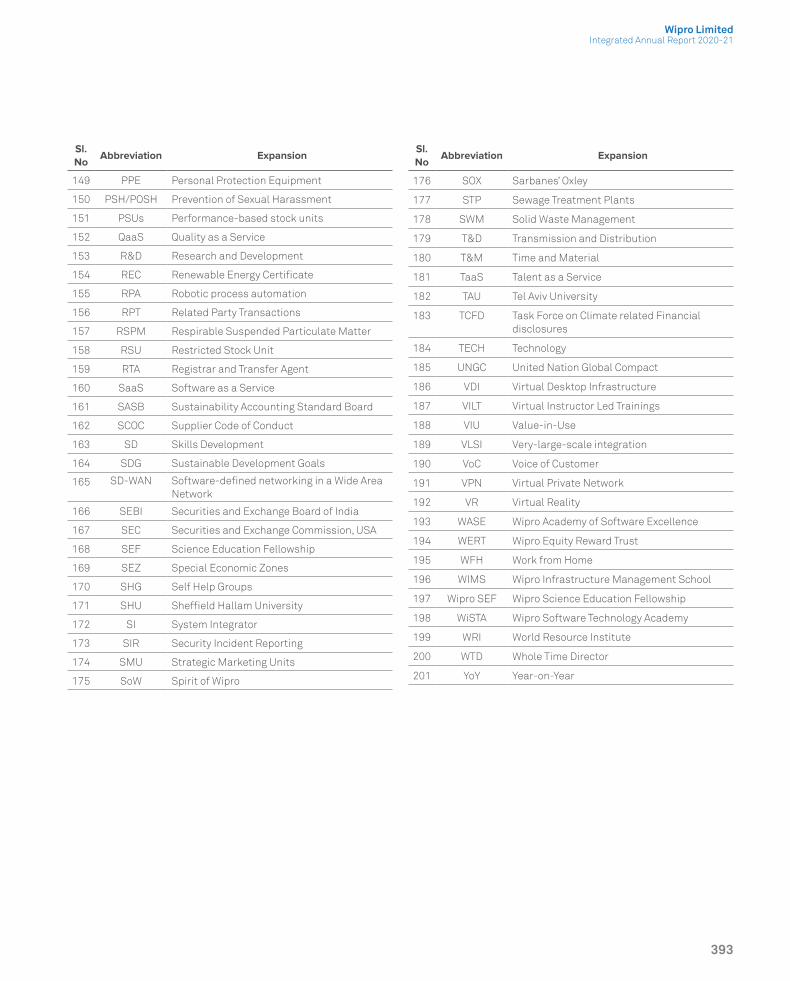
Integrated Annual Report 2020-21Wipro Limited
393
Sl. No
Abbreviation Expansion
149 PPE Personal Protection Equipment
150 PSH/POSH Prevention of Sexual Harassment
151 PSUs Performance-based stock units
152 QaaS Quality as a Service
153 R&D Research and Development
154 REC Renewable Energy Certificate
155 RPA Robotic process automation
156 RPT Related Party Transactions
157 RSPM Respirable Suspended Particulate Matter
158 RSU Restricted Stock Unit
159 RTA Registrar and Transfer Agent
160 SaaS Software as a Service
161 SASB Sustainability Accounting Standard Board
162 SCOC Supplier Code of Conduct
163 SD Skills Development
164 SDG Sustainable Development Goals
165 SD-WAN Software-defined networking in a Wide Area Network
166 SEBI Securities and Exchange Board of India
167 SEC Securities and Exchange Commission, USA
168 SEF Science Education Fellowship
169 SEZ Special Economic Zones
170 SHG Self Help Groups
171 SHU Sheffield Hallam University
172 SI System Integrator
173 SIR Security Incident Reporting
174 SMU Strategic Marketing Units
175 SoW Spirit of Wipro
Sl. No
Abbreviation Expansion
176 SOX Sarbanes’ Oxley
177 STP Sewage Treatment Plants
178 SWM Solid Waste Management
179 T&D Transmission and Distribution
180 T&M Time and Material
181 TaaS Talent as a Service
182 TAU Tel Aviv University
183 TCFD Task Force on Climate related Financial disclosures
184 TECH Technology
185 UNGC United Nation Global Compact
186 VDI Virtual Desktop Infrastructure
187 VILT Virtual Instructor Led Trainings
188 VIU Value-in-Use
189 VLSI Very-large-scale integration
190 VoC Voice of Customer
191 VPN Virtual Private Network
192 VR Virtual Reality
193 WASE Wipro Academy of Software Excellence
194 WERT Wipro Equity Reward Trust
195 WFH Work from Home
196 WIMS Wipro Infrastructure Management School
197 Wipro SEF Wipro Science Education Fellowship
198 WiSTA Wipro Software Technology Academy
199 WRI World Resource Institute
200 WTD Whole Time Director
201 YoY Year-on-Year

394
NOTES

Integrated Annual Report 2020-21Wipro Limited
395
NOTES

396
NOTES

Corporate InformationBoard of DirectorsRishad A. Premji Chairman
Azim H. PremjiFounder Chairman
Thierry DelaporteChief Executive Officer and Managing Director
Ireena Vittal
William Arthur Owens
Deepak M. Satwalekar
Dr. Patrick J. Ennis
Patrick Dupuis
M.K. Sharma
Tulsi Naidu(w.e.f. July 1, 2021)
Chief Financial OfficerJatin Pravinchandra Dalal
Statutory AuditorsDeloitte Haskins & Sells LLP
Auditors- IFRSDeloitte Haskins & Sells LLP
Company SecretaryM Sanaulla Khan
Depository for American Depository SharesJ.P. Morgan Chase Bank N.A.
Registrar and Share Transfer AgentsKFin Technologies Private Limited
Registered & Corporate OfficeWipro LimitedDoddakannelli, Sarjapur Road Bengaluru – 560 035, India Ph: +91 (80) 28440011 Fax: +91 (80) 28440054 Website: www.wipro.com
Cautionary Statement Regarding Forward-Looking Statement
Certain statements in this annual report concerning our future growth prospects are forward-looking statements, which involve a number of risks, and uncertainties that could cause actual results to differ materially from those in such forward-looking statements. The risks and uncertainties relating to these statements include, but are not limited to, risks and uncertainties regarding fluctuations in our earnings, revenue and profits, our ability to generate and manage growth, intense competition in IT Services, our ability to maintain our cost advantage, wage increases in India, our ability to attract and retain highly skilled professionals, time and cost overruns on fixed-price, fixed-time frame contracts, client concentration, restrictions on immigration, our ability to manage our international operations, reduced demand for technology in our key focus areas, disruptions in telecommunication networks, our ability to successfully complete and integrate potential acquisitions, liability for damages on our service contracts, the success of the companies in which we make strategic investments, withdrawal of fiscal governmental incentives, political instability, war, legal restrictions on raising capital or acquiring companies outside India, unauthorized use of our intellectual property, and general economic conditions affecting our business and industry. Additional risks that could affect our future operating results are more fully described in our filings with the United States Securities and Exchange Commission. These filings are available at www.sec.gov. We may, from time to time, make additional written and oral forward-looking statements, including statements contained in the company’s filings with the Securities and Exchange Commission and our reports to shareholders. We do not undertake to update any forward-looking statement that may be made from time to time by us or on our behalf.

Wipro LimitedDoddakannelli, Sarjapur Road, Bengaluru - 560035, IndiaCIN: L32102KA1945PLC020800Email: [email protected]